0000713676us-gaap:ServicingContractsMemberpnc:CommercialMortgagesMemberus-gaap:FairValueInputsLevel3Memberus-gaap:FairValueMeasurementsRecurringMember2022-03-31FairValueInputsLevel3Memberpnc:SpreadOverTheBenchmarkCurveMembersrt:WeightedAverageMemberus-gaap:ValuationTechniqueDiscountedCashFlowMemberpnc:LoansHeldForSaleMember2024-03-31
UNITED STATES
SECURITIES AND EXCHANGE COMMISSION
Washington, DC 20549
FORM 10-Q
| | | | | |
| ☒ | QUARTERLY REPORT PURSUANT TO SECTION 13 OR 15(d) OF THE SECURITIES EXCHANGE ACT OF 1934 |
For the quarterly period ended June 30, 2023March 31, 2024
or
| | | | | |
| ☐ | TRANSITION REPORT PURSUANT TO SECTION 13 OR 15(d) OF THE SECURITIES EXCHANGE ACT OF 1934 |
For the transition period from to
Commission file number 001-09718
The PNC Financial Services Group, Inc.
(Exact name of registrant as specified in its charter)
| | | | | | | | |
| Pennsylvania | | 25-1435979 |
(State or other jurisdiction of
incorporation or organization) | | (I.R.S. Employer
Identification No.) |
The Tower at PNC Plaza, 300 Fifth Avenue, Pittsburgh, Pennsylvania 15222-2401
(Address of principal executive offices, including zip code)
(888) 762-2265
(Registrant’s telephone number including area code)
(Former name, former address and former fiscal year, if changed since last report)
Securities registered pursuant to Section 12(b) of the Act:
| | | | | | | | |
| Title of Each Class | Trading Symbol(s) | Name of Each Exchange on Which Registered |
| Common Stock, par value $5.00 | PNC | New York Stock Exchange |
Indicate by check mark whether the registrant: (1) has filed all reports required to be filed by Section 13 or 15(d) of the Securities Exchange Act of 1934 during the preceding 12 months (or for such shorter period that the registrant was required to file such reports), and (2) has been subject to such filing requirements for the past 90 days. Yes ☒ No ☐
Indicate by check mark whether the registrant has submitted electronically every Interactive Data File required to be submitted pursuant to Rule 405 of Regulation S-T (§232.405 of this chapter) during the preceding 12 months (or for such shorter period that the registrant was required to submit such files). Yes ☒ No ☐
Indicate by check mark whether the registrant is a large accelerated filer, an accelerated filer, a non-accelerated filer, a smaller reporting company, or an emerging growth company. See the definitions of “large accelerated filer”, “accelerated filer”, “smaller reporting company”, and “emerging growth company” in Rule 12b-2 of the Exchange Act.
| | | | | | | | | | | | | | | | | | | | |
| Large accelerated filer | | ☒ | | Accelerated filer | | ☐ |
| Non-accelerated filer | | ☐ | | Smaller reporting company | | ☐ |
| | | | Emerging growth company | | ☐ |
If an emerging growth company, indicate by check mark if the registrant has elected not to use the extended transition period for complying with any new or revised financial accounting standards provided pursuant to Section 13(a) of the Exchange Act. ☐
Indicate by check mark whether the registrant is a shell company (as defined in Rule 12b-2 of the Exchange Act).
Yes ☐ No ☒
As of July 17, 2023,April 15, 2024, there were 398,254,594397,907,180 shares of the registrant’s common stock ($5 par value) outstanding.
THE PNC FINANCIAL SERVICES GROUP, INC.
Cross-Reference Index to SecondFirst Quarter 20232024 Form 10-Q
| | | | | |
| | Pages |
| PART I – FINANCIAL INFORMATION | |
| Item 1. Financial Statements (Unaudited). | |
| |
| |
| |
| |
|
| |
| |
| |
| |
| |
| |
| |
| |
| |
| |
| |
| |
| |
| |
| |
| |
| |
| |
| |
| |
| |
| |
| |
| |
| |
| Item 2. Management’s Discussion and Analysis of Financial Condition and Results of Operations (MD&A). | |
| |
| |
| |
| |
| |
| |
| |
| |
| |
| |
| Item 3. Quantitative and Qualitative Disclosures about Market Risk. | 21-38, 49-50,
83-89 |
| Item 4. Controls and Procedures. | |
| |
| |
| |
| |
| |
| |
| |
| |
| |
| | MD&A TABLE REFERENCE | MD&A TABLE REFERENCE | |
| Table | |
| Table | |
| Table | Table | Description | Page | Description | Page |
| 1 | 1 | | | 1 | | |
| 2 | 2 | | | 2 | | |
| 3 | 3 | | | 3 | | |
| 4 | 4 | | | 4 | | |
| 5 | 5 | | | 5 | | |
| 6 | 6 | | | 6 | | |
| 7 | 7 | | | 7 | | |
| 8 | 8 | | | 8 | | |
| 9 | 9 | | | 9 | | |
| 10 | 10 | | | 10 | | |
| 11 | 11 | | | 11 | | |
| 12 | 12 | | | 12 | | |
| 13 | 13 | | | 13 | | |
| 14 | 14 | | | 14 | | |
| 15 | 15 | | | 15 | | |
| 16 | 16 | | | 16 | | |
| 17 | 17 | | | 17 | | |
| 18 | 18 | | | 18 | | |
| 19 | 19 | | | 19 | | |
| 20 | 20 | | | 20 | | |
| 21 | 21 | | | 21 | | |
| 22 | 22 | | | 22 | | |
| 23 | 23 | | | 23 | | |
| 24 | 24 | | | 24 | | |
| 25 | 25 | | | 25 | | |
| 26 | 26 | | | 26 | | |
| 27 | 27 | | | 27 | | |
| 28 | 28 | | | 28 | | |
| 29 | 29 | | | 29 | | |
| 30 | 30 | | | 30 | | |
| 31 | 31 | | | 31 | | |
| 32 | 32 | | | 32 | | |
| 33 | 33 | | | 33 | | |
| 34 | 34 | | | 34 | | |
| 35 | | |
| | NOTES TO CONSOLIDATED FINANCIAL STATEMENTS TABLE REFERENCE | NOTES TO CONSOLIDATED FINANCIAL STATEMENTS TABLE REFERENCE | |
| Table | Table | Description | Page |
| Table | |
| Table | | Description | Page |
| 35 | | 35 | | |
| 36 | 36 | | | 36 | | |
| | 37 | |
| 37 | |
| 37 | 37 | | | | |
| 38 | 38 | | | 38 | | |
| 39 | 39 | | | 39 | | |
| 40 | 40 | | | 40 | | |
| 41 | 41 | | | 41 | | |
| 42 | 42 | | | 42 | | |
| 43 | 43 | | | 43 | | |
| 44 | 44 | | | 44 | | |
| 45 | 45 | | | 45 | | |
| 46 | 46 | | | 46 | | |
| 47 | 47 | | | 47 | | |
| 48 | 48 | | | 48 | | |
| 49 | 49 | | | 49 | | |
| 50 | 50 | | | 50 | | |
| 51 | 51 | | | 51 | | |
| 52 | 52 | | | 52 | | |
| 53 | 53 | | | 53 | | |
| 54 | 54 | | | 54 | | |
| 55 | 55 | | | 55 | | |
| 56 | 56 | | | 56 | | |
| 57 | 57 | | | 57 | | |
| 58 | 58 | | | 58 | | |
| 59 | 59 | | | 59 | | |
| 60 | 60 | | | 60 | | |
| 61 | 61 | | | 61 | | |
| 62 | 62 | | | 62 | | |
| 63 | 63 | | | 63 | | |
| 64 | 64 | | | 64 | | |
| 65 | 65 | | | 65 | | |
| 66 | 66 | | | 66 | | |
| 67 | 67 | | | 67 | | |
| 68 | 68 | | | 68 | | |
| 69 | 69 | | | 69 | | |
| 70 | 70 | | | 70 | | |
| 71 | 71 | | | 71 | | |
| 72 | 72 | | | 72 | | |
| 73 | 73 | | | 73 | | |
| 74 | 74 | | | 74 | | |
| 75 | 75 | | | 75 | | |
| 76 | 76 | | | 76 | | |
| 77 | 77 | | | 77 | | |
| 78 | 78 | | | 78 | | |
| 79 | | |
| 80 | | |
FINANCIAL REVIEW
THE PNC FINANCIAL SERVICES GROUP, INC.
This Financial Review, including the Consolidated Financial Highlights, should be read together with our unaudited Consolidated Financial Statements and unaudited Statistical Information included elsewhere in this Quarterly Report on Form 10-Q (the “Report” or “Form 10-Q”) and with Items 6, 7, 8 and 9A of our 20222023 Annual Report on Form 10-K (our “2022“2023 Form 10-K”). For information regarding certain business, regulatory and legal risks, see the following: the Risk Management section of this Financial Review and of Item 7 in our 20222023 Form 10-K; Item 1A Risk Factors included in our first quarter 2023 Form 10-Q and our 2022 Form 10-K; and the Commitments and Legal Proceedings Notes included in this Report and Item 8 of our 20222023 Form 10-K. Also, see the Cautionary Statement Regarding Forward-Looking Information section in this Financial Review and the Critical Accounting Estimates and Judgments section in this Financial Review and in our 20222023 Form 10-K for certain other factors that could cause actual results or future events to differ, perhaps materially, from historical performance and from those anticipated in the forward-looking statements included in this Report. See Note 14 Segment Reporting for a reconciliation of total business segment earnings to total PNC consolidated net income as reported on a GAAP basis. In this Report, “PNC,” “we” or “us” refers to The PNC Financial Services Group, Inc. and its subsidiaries on a consolidated basis (except when referring to PNC as a public company, its common stock or other securities issued by PNC, which just refer to The PNC Financial Services Group, Inc.). References to The PNC Financial Services Group, Inc. or to any of its subsidiaries are specifically made where applicable.
See page 10790 for a glossary of certain terms and acronyms used in this Report.
EXECUTIVE SUMMARY
Headquartered in Pittsburgh, Pennsylvania, we are one of the largest diversified financial institutions in the U.S. We have businesses engaged in retail banking, including residential mortgage, corporate and institutional banking and asset management, providing many of our products and services nationally. Our retail branch network is located coast-to-coast. We also have strategic international offices in four countries outside the U.S.
Key Strategic Goals
At PNC we manage our company for the long term. We are focused on the fundamentals of growing customers, loans, deposits and revenue and improving profitability, while investing for the future and managing risk, expenses and capital. We continue to invest in our products, markets and brand, and embrace our commitments to our customers, shareholders, employees and the communities where we do business.
We strive to serve our customers and expand and deepen relationships by offering a broad range of deposit, credit and fee-based products and services. We are focused on delivering those products and services to our customers with the goal of addressing their financial objectives and needs. Our business model is built on customer loyalty and engagement, understanding our customers’ financial goals and offering our diverse products and services to help them achieve financial well-being. Our approach is concentrated on organically growing and deepening client relationships across our businesses that meet our risk/return measures.
We are focused on our strategic priorities, which are designed to enhance value over the long term, and consist of:
•Expanding our leading banking franchise to new markets and digital platforms,
•Deepening customer relationships by delivering a superior banking experience and financial solutions, and
•Leveraging technology to create efficiencies that help us better serve customers.
Our capital and liquidity priorities are to support customers, fund business investments and return excess capital to shareholders, while maintaining appropriate capital and liquidity in light of economic conditions, the Basel III framework and other regulatory expectations. For more detail, see the Capital Highlights portion of this Executive Summary, the Liquidity and Capital Management portion of the Risk Management section of this Financial Review and the Supervision and Regulation section in Item 1 Business of our 20222023 Form 10-K.
PresentationSignature Bank Portfolio Acquisition
On October 2, 2023, PNC acquired a portfolio of Noninterest Incomecapital commitments facilities from Signature Bridge Bank, N.A. through an agreement with the FDIC as receiver of the former Signature Bank, New York. The acquired portfolio represented approximately $16.0 billion in total commitments, including approximately $9.0 billion of funded loans, at the time of acquisition.
Workforce Reduction
During the fourth quarter of 2023, PNC implemented a workforce reduction that is expected to reduce 2024 personnel expense by approximately $325 million, on a pre-tax basis. PNC incurred expenses of $150 million in the fourth quarter of 2023 in connection with this workforce reduction.
1 The PNC Financial Services Group, Inc. – Form 10-Q
FDIC Special Assessment
In November 2023, the FDIC approved a final rule to implement a special assessment to recover the loss to the Deposit Insurance Fund associated with protecting uninsured depositors following the closures of Silicon Valley Bank and Signature Bank. In the first quarter of 2024, PNC incurred an additional pre-tax expense of $130 million related to the increase in the FDIC’s expected losses. PNC incurred a pre-tax expense of $515 million during the fourth quarter of 2022, PNC updated the name of the noninterest income line item “Capital markets related” to “Capital markets and advisory.” This update did not impact the components of the category. All periods presented herein reflect these changes. For a description of each updated noninterest income revenue stream, see Note 1 Accounting Policies in our 2022 Form 10-K.2023.
Selected Financial Data
The following tables include selected financial data, which should be reviewed in conjunction with the Consolidated Financial Statements and Notes included in Item 1 of this Report as well as the other disclosures in this Report concerning our historical financial performance, our future prospects and the risks associated with our business and financial performance.
1 The PNC Financial Services Group, Inc. – Form 10-Q
Table 1: Summary of Operations, Per Common Share Data and Performance Ratios
| Dollars in millions, except per share data
Unaudited | Dollars in millions, except per share data
Unaudited | Three months ended | Six months ended | |
| June 30 | March 31 | June 30 | June 30 | June 30 | |
| 2023 | 2023 | 2022 | 2023 | 2022 | |
| March 31 | |
| March 31 | |
| March 31 | |
| 2024 | |
| 2024 | |
| 2024 | |
| Summary of Operations (a) | |
| Summary of Operations (a) | |
| Summary of Operations (a) | Summary of Operations (a) | | | | |
| | Net interest income | Net interest income | $ | 3,510 | | $ | 3,585 | | $ | 3,051 | | $ | 7,095 | | $ | 5,855 | | |
| | Net interest income | |
| | Net interest income | |
| Noninterest income | |
| Noninterest income | |
| Noninterest income | Noninterest income | 1,783 | | 2,018 | | 2,065 | | 3,801 | | 3,953 | | |
| Total revenue | Total revenue | 5,293 | | 5,603 | | 5,116 | | 10,896 | | 9,808 | | |
| Provision for (recapture of) credit losses | 146 | | 235 | | 36 | | 381 | | (172) | | |
| Total revenue | |
| Total revenue | |
| Provision for credit losses | |
| Provision for credit losses | |
| Provision for credit losses | |
| Noninterest expense | |
| Noninterest expense | |
| Noninterest expense | Noninterest expense | 3,372 | | 3,321 | | 3,244 | | 6,693 | | 6,416 | | |
Income before income taxes and noncontrolling interests
| Income before income taxes and noncontrolling interests
| $ | 1,775 | | $ | 2,047 | | $ | 1,836 | | $ | 3,822 | | $ | 3,564 | | |
Income before income taxes and noncontrolling interests
| |
Income before income taxes and noncontrolling interests
| |
Income taxes
| |
Income taxes
| |
Income taxes
| Income taxes
| 275 | | 353 | | 340 | | 628 | | 639 | | |
| | Net income | Net income | $ | 1,500 | | $ | 1,694 | | $ | 1,496 | | $ | 3,194 | | $ | 2,925 | | |
| | Net income | |
| | Net income | |
| | Net income attributable to common shareholders | |
| | Net income attributable to common shareholders | |
| | Net income attributable to common shareholders | Net income attributable to common shareholders | $ | 1,354 | | $ | 1,607 | | $ | 1,409 | | $ | 2,961 | | $ | 2,770 | | |
Per Common Share
| Per Common Share
| | | | |
Per Common Share
| |
Per Common Share
| |
| Basic | Basic | $ | 3.36 | | $ | 3.98 | | $ | 3.39 | | $ | 7.35 | | $ | 6.62 | | |
| Basic | |
| Basic | |
| | Diluted | |
| | Diluted | |
| | Diluted | Diluted | $ | 3.36 | | $ | 3.98 | | $ | 3.39 | | $ | 7.34 | | $ | 6.61 | | |
| | Book value per common share | Book value per common share | $ | 105.67 | | $ | 104.76 | | $ | 101.39 | | | | |
| | Book value per common share | |
| | Book value per common share | |
| Performance Ratios | |
| Performance Ratios | |
| Performance Ratios | Performance Ratios | | | | |
| Net interest margin (b) | Net interest margin (b) | 2.79 | % | 2.84 | % | 2.50 | % | 2.81 | % | 2.39 | % | |
| Net interest margin (b) | |
| Net interest margin (b) | |
| Noninterest income to total revenue | |
| Noninterest income to total revenue | |
| Noninterest income to total revenue | Noninterest income to total revenue | 34 | % | 36 | % | 40 | % | 35 | % | 40 | % | |
| Efficiency | Efficiency | 64 | % | 59 | % | 63 | % | 61 | % | 65 | % | |
| Efficiency | |
| Efficiency | |
| Return on: | |
| Return on: | |
| Return on: | Return on: | | | | |
| Average common shareholders’ equity | Average common shareholders’ equity | 13.01 | % | 16.11 | % | 13.52 | % | 14.53 | % | 12.53 | % | |
| Average common shareholders’ equity | |
| Average common shareholders’ equity | |
| Average assets | Average assets | 1.08 | % | 1.22 | % | 1.10 | % | 1.15 | % | 1.07 | % | |
| Average assets | |
| Average assets | |
(a)The Executive Summary and Consolidated Income Statement Review portions of this Financial Review section provide information regarding items impacting the comparability of the periods presented.
(b)See explanation and reconciliation of this non-GAAP measure in the Average Consolidated Balance Sheet and Net Interest Analysis and Reconciliation of Taxable-Equivalent Net Interest Income (non-GAAP) in the Statistical Information (Unaudited) section in Item 1 of this Report.
2 The PNC Financial Services Group, Inc. – Form 10-Q
Table 2: Balance Sheet Highlights and Other Selected Ratios
| Dollars in millions, except as noted
Unaudited | Dollars in millions, except as noted
Unaudited | June 30
2023 | December 31
2022 | June 30
2022 | |
| Balance Sheet Highlights (a) | Balance Sheet Highlights (a) | | |
| Balance Sheet Highlights (a) | |
| Balance Sheet Highlights (a) | |
| Assets | |
| Assets | |
| Assets | Assets | $ | 558,207 | | $ | 557,263 | | $ | 540,786 | | |
| Loans | Loans | $ | 321,761 | | $ | 326,025 | | $ | 310,800 | | |
| Loans | |
| Loans | |
Allowance for loan and lease losses
| |
Allowance for loan and lease losses
| |
Allowance for loan and lease losses
| Allowance for loan and lease losses
| $ | 4,737 | | $ | 4,741 | | $ | 4,462 | | |
| Interest-earning deposits with banks | Interest-earning deposits with banks | $ | 38,259 | | $ | 27,320 | | $ | 28,404 | | |
| Interest-earning deposits with banks | |
| Interest-earning deposits with banks | |
| Investment securities | |
| Investment securities | |
| Investment securities | Investment securities | $ | 135,661 | | $ | 139,334 | | $ | 132,732 | | |
| | Total deposits | Total deposits | $ | 427,489 | | $ | 436,282 | | $ | 440,811 | | |
| | Total deposits | |
| | Total deposits | |
| Borrowed funds | |
| Borrowed funds | |
| Borrowed funds | Borrowed funds | $ | 65,384 | | $ | 58,713 | | $ | 35,984 | | |
| | Total shareholders’ equity | Total shareholders’ equity | $ | 49,320 | | $ | 45,774 | | $ | 47,652 | | |
| | Total shareholders’ equity | |
| | Total shareholders’ equity | |
| Common shareholders’ equity | |
| Common shareholders’ equity | |
| Common shareholders’ equity | Common shareholders’ equity | $ | 42,083 | | $ | 40,028 | | $ | 41,648 | | |
| | Other Selected Ratios | Other Selected Ratios | | |
| | Other Selected Ratios | |
| | Other Selected Ratios | |
| Common equity Tier 1 | |
| Common equity Tier 1 | |
| Common equity Tier 1 | Common equity Tier 1 | 9.5 | % | 9.1 | % | 9.6 | % | |
| | Loans to deposits | Loans to deposits | 75 | % | 75 | % | 71 | % | |
| | Loans to deposits | |
| | Loans to deposits | |
| Common shareholders’ equity to total assets | |
| Common shareholders’ equity to total assets | |
| Common shareholders’ equity to total assets | Common shareholders’ equity to total assets | 7.5 | % | 7.2 | % | 7.7 | % | |
|
(a)The Executive Summary and Consolidated Balance Sheet Review portions of this Financial Review provide information regarding items impacting the comparability of the periods presented.
Income Statement Highlights
Net income of $1.5$1.3 billion, or $3.36$3.10 per diluted common share, for the secondfirst quarter of 2024 increased $461 million, or 52%, compared to $0.9 billion, or $1.85 per diluted common share, for the fourth quarter of 2023, due to lower noninterest expense and a lower provision for credit losses, partially offset by lower net interest and noninterest income.
•For the three months ended March 31, 2024 compared to the three months ended December 31, 2023:
•Total revenue decreased $194$216 million, or 11%4%, to $5.1 billion.
•Net interest income of $3.3 billion decreased $139 million, or 4%, primarily due to increased funding costs, lower loan balances and one fewer day in the quarter.
•Net interest margin declined 9 basis points to 2.57%, primarily as a result of higher funding costs.
•Noninterest income decreased $77 million, or 4%, primarily due to lower capital markets and advisory activity and seasonal declines in card and cash management fees. The first quarter also included negative Visa Class B-1 derivative fair value adjustments of $7 million. Visa Class B-1 derivative fair value adjustments were negative $100 million in the fourth quarter of 2023.
•Provision for credit losses of $155 million in the first quarter of 2024 reflected portfolio activity and improved macroeconomic factors. The fourth quarter of 2023 included a provision for credit losses of $232 million.
•Noninterest expense decreased $740 million, or 18%, to $3.3 billion, driven by lower or stable expenses across all categories, reflecting a continued focus on expense management. The first quarter of 2024 included an additional pre-tax expense of $130 million related to the increase in the FDIC’s expected losses. The fourth quarter of 2023 included $515 million pertaining to the FDIC special assessment as well as $150 million of workforce reduction charges.
Net income decreased $350 million, or 21%, compared to $1.7 billion, or $3.98 per diluted common share, for the first quarter of 2023 primarily due todriven by lower noninterest income, net interest income and increased expenses,noninterest income, partially offset by a lower provision for credit losses.
•For the three months ended June 30, 2023March 31, 2024 compared to the three months ended March 31, 2023:
•Total revenue decreased $310$458 million, or 6%8%, to $5.3$5.1 billion.
•Net interest income of $3.5 billion decreased $75$321 million, or 2%9%, as the benefit of higher interest-earning asset yields on interest-earning assets werewas more than offset by increased funding costs as well as lower loan and securities balances.costs.
2 The PNC Financial Services Group, Inc. – Form 10-Q
•Net interest margin decreased 527 basis points, to 2.79%primarily as the change in yields on interest-earning assets was more than offset by the change in rates ona result of higher funding costs.
•Noninterest income decreased $235$137 million, or 12%7%, due to lowerand included a decline in private equity revenue a decrease inand residential and commercial mortgage servicing rights valuation, net of economic hedge and lower revenue, from market sensitive businesses, partially offset by seasonally higher consumer transaction volumesgrowth in card and increased treasurycash management product revenue. The decrease also included negativeand asset management and brokerage fees. Visa Class BB-1 derivative fair value adjustments of $83were negative $45 million related to litigation escrow funding and other valuation changes. Thein the first quarter of 2023 included negative Visa Class B derivative fair value adjustments of $45 million.2023.
•Provision for credit losses of $146$155 million infor the second quarterfirst three months of 20232024 reflected portfolio activity and changes inimproved macroeconomic variables.factors. The first quarterthree months of 2023 included a provision for credit losses of $235 million.
•Noninterest expense increased $51 million, or 2%, to $3.4 billion, primarily due to seasonally higher marketing spend and the full quarter impact of annual employee merit increases.
Net income of $3.2 billion, or $7.34 per diluted common share, for the first six months of 2023 increased $269 million, or 9%, compared to $2.9 billion, or $6.61 per diluted common share, for the six months ended 2022, primarily as a result of higher net interest income, partially offset by a higher provision for credit losses and increased expenses.
•For the six months ended June 30, 2023was stable compared to the six months ended June 30, 2022:
•Total revenue increased $1.1 billion, or 11%, to $10.9 billion.
•Net interest income increased $1.2 billion, or 21%, as a result of higher interest-earning asset yields and balances, partially offset by higher funding costs.
•Net interest margin increased 42 basis points reflecting the benefit of higher yields on interest-earning assets.
•Noninterest income decreased $152 million, or 4%, and included lower merger and acquisition advisory activity.
•Provision for credit losses of $381 million for the first sixthree months of 2023 included the impact of our updated economic outlook and changes in portfolio composition and quality.2023. The first six monthsquarter of 20222024 included a recapturean additional pre-tax expense of credit losses of $172 million.
•Noninterest expense increased $277$130 million or 4%, duerelated to higher personnel costs, an increased FDIC assessment rate and higher marketing and technology costs to support business growth.the increase in the FDIC’s expected losses.
For additional detail, see the Consolidated Income Statement Review section of this Financial Review.
The PNC Financial Services Group, Inc. – Form 10-Q 3
Balance Sheet Highlights
Our balance sheet was strong and well positioned at June 30, 2023.March 31, 2024. In comparison to December 31, 2022:2023:
•Total assets of $558.2$566.2 billion were stable.increased modestly primarily due to higher balances held with the Federal Reserve Bank, partially offset by lower securities and loan balances.
•Total loans decreased $4.3$1.7 billion, or 1%, to $321.8$319.8 billion.
•Total commercial loans decreased $5.1$0.7 billion, or 2%, to $220.0$218.8 billion, driven by apaydowns outpacing new production and lower utilization of loan commitments in addition to paydowns outpacing new production.commitments.
•Total consumer loans increased $828 milliondeclined $1.0 billion to $101.8$100.9 billion, as growth in residential mortgages, automobile, home equity and credit card loans were partially offset by declines in the remaining portfolios as paydowns outpaced new originations.originations and draws on existing accounts.
•Investment securities decreased $3.7$2.1 billion, or 3%2%, to $135.7$130.5 billion, primarily due to prepayments and maturities outpacing purchases.
•Interest-earning deposits with banks, primarily with the Federal Reserve Bank, increased $10.9$9.8 billion, or 40%22%, to $38.3$53.6 billion, primarily due to higher borrowed fundsan increase in deposits and a decrease in securities and loans partially offset by lower deposits.balances.
•Total deposits decreased $8.8increased $4.2 billion, or 2%, to $427.5$425.6 billion, as a result of lowerreflecting higher commercial and consumer and commercial deposits, reflecting seasonal declines and the impact of quantitative tightening by the Federal Reserve. In addition, noninterest-bearingdeposits. Noninterest-bearing deposit balances decreased due to the continued shift intodriven by a decline in commercial noninterest-bearing balances. Interest-bearing deposits increased reflecting higher commercial and consumer interest-bearing deposit products as interest rates have risen.balances.
•Borrowed funds increased $6.7were largely stable at $72.7 billion, or 11%, to $65.4 billion due toas parent company senior debt issuances and higherwere offset by lower FHLB borrowings.
For additional detail, see the Consolidated Balance Sheet Review section of this Financial Review.
The PNC Financial Services Group, Inc. – Form 10-Q 3
Credit Quality Highlights
The secondfirst quarter of 20232024 reflected strongstable credit quality performance.
•At June 30, 2023March 31, 2024 compared to December 31, 2022:
•Nonperforming assets decreased $70 million, or 3%, to $1.9 billion.2023:
•Overall loan delinquencies of $1.2$1.3 billion decreased $278$109 million, or 19%8%, driven by lower consumer and commercial loan delinquencies.
•The ACL related to loans, which consists of the ALLL and the allowance for unfunded lending related commitments, totaled $5.4 billion and $5.5 billion at both June 30, 2023March 31, 2024 and December 31, 2022.2023, respectively. During the sixthree months ended June 30, 2023, reserves reflected our updated economic outlook and changes inMarch 31, 2024, this reserve was driven by improved macroeconomic factors as well as portfolio composition and quality.activity. ACL to total loans was 1.68% and 1.67%1.70% at June 30, 2023March 31, 2024 and December 31, 2022,2023, respectively.
•Nonperforming assets increased $199 million, or 9%, to $2.4 billion, primarily due to higher commercial real estate nonperforming loans.
•Net charge-offs of $194$243 million, or 0.24%0.30% of average loans, in the secondfirst quarter of 2024 increased $43 million compared to the fourth quarter of 2023 were stable comparedprimarily due to the first quarter of 2023.higher commercial net loan charge-offs.
For additional detail see the Credit Risk Management portion of the Risk Management section of this Financial Review.
Capital and Liquidity Highlights
We maintained our strong capital and liquidity positions.
•Common shareholders’ equity of $42.1$45.1 billion at June 30, 2023,March 31, 2024, increased $2.1$0.2 billion, or 5%, compared to December 31, 2022, increased2023 due to the benefit of net income, and an improvement in AOCI, partially offset by common dividends paid, a decline in AOCI and common share repurchases.
•In the secondfirst quarter of 2023,2024, PNC returned $0.7$0.8 billion of capital to shareholders, as a result ofreflecting more than $0.6 billion of dividends on common shares and more than $0.1 billion of common share repurchases, representing 1.10.9 million shares.
•Consistent with the SCB framework, which allows for capital return in amounts in excess of the SCB minimum levels, our Board of Directors has authorized a repurchase framework under the previously approved repurchase program of up to 100 million common shares, of which approximately 46%44% were still available for repurchase at June 30, 2023. PNC’s SCB through September 30, 2023 is 2.9%. Based on the resultsMarch 31, 2024. In light of the Federal Reserve’s 2023 annual stress test,banking agencies proposed rules to adjust the Basel III capital framework, second quarter 2024 share repurchase activity is expected to approximate recent quarterly average share repurchase levels. PNC continues to evaluate the potential impact of the proposed rules and may adjust share repurchase activity depending on market and economic conditions, as well as other factors. PNC’s SCB for the four-quarter period beginning October 1, 2023 will improve tois the regulatory minimum of 2.5%.
•On JulyApril 3, 2023,2024, the PNC Board of Directors raised thedeclared a quarterly cash dividend on common stock toof $1.55 per share an increaseto be paid on May 6, 2024 to shareholders of 5 cents per share. The dividend, with a payment daterecord at the close of August 5, 2023, will be payable the next business day.April 15, 2024.
•Our CET1 ratio increased to 9.5%10.1% at June 30, 2023March 31, 2024 from 9.1%9.9% at December 31, 2022.2023.
•PNC elected a five-year transition provision effective March 31, 2020 to delay untilthrough December 31, 2021 the full impact of the CECL standard on regulatory capital, followed by a three-year transition period. Effective for the first quarter of 2022, PNC is now in the three-year transition period, and the full impact of the CECL standard is being
4 The PNC Financial Services Group, Inc. – Form 10-Q
phased-in to regulatory capital through December 31, 2024. The fully implemented ratios reflect the full impact of CECL and exclude the benefits of this transition provision. The estimated CET1 fully implemented ratio was 9.4%10.0% at June 30, 2023March 31, 2024 compared to 8.9%9.8% at December 31, 2022.
•PNC’s average LCR for the three months ended June 30, 2023 was 109% and exceeded the regulatory minimum requirement throughout the quarter.2023.
See the Liquidity and Capital Management portion of the Risk Management section of this Financial Review for more detail on our 2023 liquidity and capital actions as well as our capital ratios.
PNC’s ability to take certain capital actions, including returning capital to shareholders, is subject to PNC meeting or exceeding an SCB established by the Federal Reserve Board in connection with the Federal Reserve Board’s CCAR process. For additional information, see Capital Management in the Risk Management section in this Financial Review and the Supervision and Regulation section in our 20222023 Form 10-K.
Business Outlook
Statements regarding our business outlook are forward-looking within the meaning of the Private Securities Litigation Reform Act of 1995. Our forward-looking financial statements are subject to the risk that economic and financial market conditions will be substantially different than those we are currently expecting and do not take into account the potential impact of legal and regulatory contingencies.expecting. These statements are based on our views that:
•The economy continued to expand in the first half of 2023, butPNC’s baseline forecast is for slower economic growth in 2024 as consumer spending growth slows and higher interest rates remain a drag on the economy. The ongoing strength of the labor market will continue to support consumer spending. The FOMC is slowing in responseindicating that it will start to cut the ongoing Federal Reserve monetary policy tightening to slow inflation. This has led to large increases in both short- and long-term interest rates. The housing market stabilized in the first half of 2023 as the Federal Reserve signaled a potential end to its federal funds rate hiking cycle. However, givenlater this year, with rate cuts supporting economic growth toward the upward trajectory in mortgage rates and declining affordability, PNC continues to expect slower activity in the housing market in the second halfend of 2023 with a recovery in early 2024 as the2024.
4 The PNC Financial Services Group, Inc. – Form 10-Q
Federal Reserve starts cutting the federal funds rate.
•PNC’s baseline outlook is for a mild recession starting in late 2023 or early 2024, with a smaller contraction in realReal GDP growth this year will be close to its trend of less than 1%, lasting into mid-2024. The2% and the unemployment rate will increase inmodestly to just above 4% by the second halfend of this year, ending 2023 at above 4%, and then peak slightly above 5% in early 2025.2024. Inflation will continue to slow with weaker demand,as wage pressures abate, moving back to the Federal Reserve’s 2% long-term objective by this time next year.the end of 2025.
•PNC expects the federal funds rate to remain unchanged between 5.25% and 5.50% through Marchat least the first half of 2024, when it is expected thatwith federal funds rate cuts starting in the Federal Reserve will cut ratesthird quarter as inflationary pressures ease further. PNC expects two federal funds rate cuts in response to2024, with the recession.rate ending this year in a range between 4.75% and 5.00%.
For the thirdsecond quarter of 2023,2024, compared to the secondfirst quarter of 2024, we expect:
•Average loans to be stable,
•Net interest income to be down approximately 1%,
•Fee income to be up 1% to 2%,
•Other noninterest income to be $150 million to $200 million,
•Revenue to be stable,
•Core noninterest expense to be up 2% to 4%, and
•Net loan charge-offs to be $225 million to $275 million.
For the full year 2024, compared to the full year of 2023, we expect:
•Average loans to be downup approximately 1%,
•Net interest income to be down 3%4% to 4%5%,
•Noninterest income excluding net securities gains and Visa activity, to be up 10%4% to 11%6%,
•Revenue to be up approximately 1%stable to down 2%,
•NoninterestCore noninterest expense excluding the proposed FDIC special assessment, to be stable, and
•Net loan charge-offs to be $200 million to $250 million.
For the full year 2023, compared to the full year of 2022, we expect:
•Period-end loans to be stable,
•Average loans to be up 5% to 6%,
•Net interest income to be up 5% to 6%,
•Noninterest income, excluding net securities gains and Visa activity, to be down 2% to 4%,
•Revenue to be up 2% to 2.5%,
•Noninterest expense, excluding the proposed FDIC special assessment, to be up approximately 2%, and
•The effective tax rate to be approximately 18%18.5%.
Core noninterest expense guidance excludes an additional pre-tax expense of $130 million related to the increase in the FDIC’s expected losses in the first quarter of 2024, and $515 million pertaining to the FDIC special assessment as well as $150 million of workforce reduction charges incurred in the fourth quarter of 2023. See the Statistical Information (Unaudited) – Reconciliation of Core Noninterest Expense (non-GAAP) section of this Report. Other noninterest income, noninterest income and revenue guidance excludes net securities gains and Visa activity.
We cannotare unable to provide without unreasonable effort, a meaningful or accurate reconciliation of forward-looking non-GAAP measures, without unreasonable effort, to their most directly comparable GAAP financial measures. This is due to the inherent difficulty of forecasting the timing and amounts necessary for the reconciliation when such amounts are subject to events that cannot be reasonably predicted, as noted in our Cautionary Statement. Accordingly, we cannot address the probable significance of unavailable information.
See the Cautionary Statement Regarding Forward-Looking Information section in this Financial Review and Item 1A Risk Factors included in our first quarter 2023 Form 10-Q and 2022 Form 10-K for other factors that could cause future events to differ, perhaps materially, from those anticipated in these forward-looking statements.
The PNC Financial Services Group, Inc. – Form 10-Q 5
CONSOLIDATED INCOME STATEMENT REVIEW
Our Consolidated Income Statement is presented in Item 1 of this Report.
Net income of $1.5$1.3 billion, or $3.36$3.10 per diluted common share, for the secondfirst quarter of 2024 increased $461 million, or 52%, compared to $0.9 billion, or $1.85 per diluted common share, for the fourth quarter of 2023, due to lower noninterest expense and a lower provision for credit losses, partially offset by lower net interest and noninterest income. Net income decreased $194$350 million, or 11%21%, compared to $1.7 billion, or $3.98 per diluted common share for the first quarter ofsame period in 2023, primarily due todriven by lower noninterest income, net interest income and increased expenses,noninterest income, partially offset by a lower provision for credit losses. Net income of $3.2 billion, or $7.34 per diluted common share for the first six months of 2023 increased $269 million, or 9%, compared to $2.9 billion, or $6.61 per diluted common share for the same period in 2022, primarily as a result of higher net interest income, partially offset by a higher provision for credit losses and increased expenses.
The PNC Financial Services Group, Inc. – Form 10-Q 5
Net Interest Income
Table 3: Summarized Average Balances and Net Interest Income (a)
| | | | | | | | | | | | | | | | | | | | | | | | | | | | | | | | | | | | | | | | | | | | |
| | | June 30, 2023 | | March 31, 2023 | | |
Three months ended
Dollars in millions | | Average
Balances | | Average
Yields/
Rates | | Interest
Income/
Expense | | Average
Balances | | | Average
Yields/
Rates | | | Interest
Income/
Expense | | |
| Assets | | | | | | | | | | | | | | | | |
| Interest-earning assets | | | | | | | | | | | | | | | | |
| Investment securities | | $ | 141,038 | | | 2.52 | % | | $ | 889 | | | $ | 143,391 | | | | 2.49 | % | | | $ | 891 | | | |
| Loans | | 324,534 | | | 5.57 | % | | 4,554 | | | 325,526 | | | | 5.29 | % | | | 4,290 | | | |
| Interest-earning deposits with banks | | 31,433 | | | 5.10 | % | | 400 | | | 34,054 | | | | 4.58 | % | | | 390 | | | |
| Other | | 9,215 | | | 5.96 | % | | 138 | | | 8,806 | | | | 5.75 | % | | | 126 | | | |
| Total interest-earning assets/interest income | | $ | 506,220 | | | 4.70 | % | | 5,981 | | | $ | 511,777 | | | | 4.46 | % | | | 5,697 | | | |
| Liabilities | | | | | | | | | | | | | | | | |
| Interest-bearing liabilities | | | | | | | | | | | | | | | | |
| Interest-bearing deposits | | $ | 312,559 | | | 1.96 | % | | 1,531 | | | $ | 315,056 | | | | 1.66 | % | | | 1,291 | | | |
| Borrowed funds | | 65,692 | | | 5.44 | % | | 903 | | | 62,968 | | | | 4.98 | % | | | 783 | | | |
| Total interest-bearing liabilities/interest expense | | $ | 378,251 | | | 2.56 | % | | 2,434 | | | $ | 378,024 | | | | 2.20 | % | | | 2,074 | | | |
| Net interest margin/income (non-GAAP) | | | | 2.79 | % | | 3,547 | | | | | | 2.84 | % | | | 3,623 | | | |
| Taxable-equivalent adjustments | | | | | | (37) | | | | | | | | | (38) | | | |
| Net interest income (GAAP) | | | | | | $ | 3,510 | | | | | | | | | $ | 3,585 | | | |
| | | | | June 30, 2023 | | June 30, 2022 | |
Six months ended
Dollars in millions | | Average
Balances | | Average
Yields/
Rates | | Interest
Income/
Expense | | Average
Balances | | Average
Yields/
Rates | | Interest
Income/
Expense | |
Three months ended
Dollars in millions | |
Three months ended
Dollars in millions | |
Three months ended
Dollars in millions | |
| Assets | |
| Assets | |
| Assets | Assets | | |
| Interest-earning assets | Interest-earning assets | | |
| Interest-earning assets | |
| Interest-earning assets | |
| Investment securities | |
| Investment securities | |
| Investment securities | Investment securities | | $ | 142,208 | | | 2.50 | % | | $ | 1,780 | | | $ | 134,313 | | | 1.76 | % | | $ | 1,184 | | |
| Loans | Loans | | 325,027 | | | 5.43 | % | | 8,844 | | | 297,785 | | | 3.24 | % | | 4,835 | | |
| Interest-earning deposits with banks | | 32,736 | | | 4.83 | % | | 790 | | | 51,120 | | | 0.42 | % | | 107 | | |
| Loans | |
| Loans | |
| Interest-earning deposits with banks (b) | |
| Interest-earning deposits with banks (b) | |
| Interest-earning deposits with banks (b) | |
| Other | |
| Other | |
| Other | Other | | 9,012 | | | 5.86 | % | | 264 | | | 9,677 | | | 2.42 | % | | 116 | | |
| Total interest-earning assets/interest income | Total interest-earning assets/interest income | | $ | 508,983 | | | 4.58 | % | | 11,678 | | | $ | 492,895 | | | 2.53 | % | | 6,242 | | |
| Total interest-earning assets/interest income | |
| Total interest-earning assets/interest income | |
| Liabilities | |
| Liabilities | |
| Liabilities | Liabilities | | | | | | | | |
| Interest-bearing liabilities | Interest-bearing liabilities | | |
| Interest-bearing liabilities | |
| Interest-bearing liabilities | |
| Interest-bearing deposits | |
| Interest-bearing deposits | |
| Interest-bearing deposits | Interest-bearing deposits | | $ | 313,801 | | | 1.81 | % | | 2,822 | | | $ | 298,313 | | | 0.08 | % | | 115 | | |
| Borrowed funds | Borrowed funds | | 64,337 | | | 5.22 | % | | 1,686 | | | 32,998 | | | 1.36 | % | | 225 | | |
| Borrowed funds | |
| Borrowed funds | |
| Total interest-bearing liabilities/interest expense | |
| Total interest-bearing liabilities/interest expense | |
| Total interest-bearing liabilities/interest expense | Total interest-bearing liabilities/interest expense | | $ | 378,138 | | | 2.38 | % | | 4,508 | | | $ | 331,311 | | | 0.20 | % | | 340 | | |
| Net interest margin/income (non-GAAP) | Net interest margin/income (non-GAAP) | | | 2.81 | % | | 7,170 | | | | | 2.39 | % | | 5,902 | | |
| Net interest margin/income (non-GAAP) | |
| Net interest margin/income (non-GAAP) | |
| Taxable-equivalent adjustments | |
| Taxable-equivalent adjustments | |
| Taxable-equivalent adjustments | Taxable-equivalent adjustments | | (75) | | | (47) | | |
| Net interest income (GAAP) | Net interest income (GAAP) | | | | | | $ | 7,095 | | | | | | | $ | 5,855 | | |
| Net interest income (GAAP) | |
| Net interest income (GAAP) | |
(a)Interest income calculated as taxable-equivalent interest income. To provide more meaningful comparisons of interest income and yields for all interest-earning assets, as well as net interest margins, we use interest income on a taxable-equivalent basis in calculating average yields and net interest margins by increasing the interest income earned on tax-exempt assets to make it fully equivalent to interest income earned on taxable investments. This adjustment is not permitted under GAAP on the Consolidated Income Statement. For more information, see Reconciliation of Taxable-Equivalent Net Interest Income (non-GAAP) in the Statistical Information (Unaudited) section in Item 1 of this Report.
(b)Interest income from Interest-earning deposits with banks primarily includes interest earned on our balances held with the Federal Reserve Bank and is reported as Other interest income on our Consolidated Income Statement.
Changes in net interest income and margin result from the interaction of the volume and composition of interest-earning assets and related yields, interest-bearing liabilities and related rates paid, and noninterest-bearing sources of funding. See the Statistical Information (Unaudited) – Average Consolidated Balance Sheet And Net Interest Analysis section of this Report for additional information.
Net interest income decreased $75$139 million, or 2%4%, for the second quarter of 2023 compared to the first quarter of 2024 compared to the fourth quarter of 2023, primarily due to increased funding costs, lower loan balances and one fewer day in the quarter. Net interest income decreased $321 million, or 9%, for the first three months of 2024 compared to the same period in 2023, as the benefit of higher interest-earning asset yields on interest-earning assets werewas more than offset by increased funding costs as well as lower loan and securities balances. Net interest income increased $1.2 billion, or 21%, for the first six months of 2023 compared to the same period in 2022, as a result of higher interest-earning asset yields and balances, partially offset by higher funding costs. Net interest margin decreased 5declined 9 basis points compared to the fourth quarter of 2023 and 27 basis points compared to the first quarter of 2023, primarily as a result of higher funding costs.
Average investment securities of $135.4 billion in the change in yields on interest-earning assetsfirst quarter of 2024 declined $2.0 billion, or 1%, and $8.0 billion, or 6%, from the fourth quarter of 2023 and the first quarter of 2023, respectively. In both comparisons, limited purchase activity was more than offset by portfolio paydowns and maturities. Average investment securities represented 26% of average interest-earning assets for the change in rates on funding costs. Net interest margin increased 42 basis points infirst quarter of 2024 compared to 27% for the year-to-date comparison reflectingfourth quarter of 2023, and 28% for the benefitfirst quarter of higher yields on interest-earning assets.2023.
Average loans for the first quarter of 2024 decreased $4.0 billion, compared to the fourth quarter of 2023, due to lower commercial and consumer loans. Compared to the first quarter of 2023, average loans decreased $4.9 billion, or 2%, primarily due to lower commercial loans. Average loans represented 63% of average interest-earning assets for both the first quarter of 2024 and the fourth quarter of 2023, compared to 64% for the first quarter of 2023.
6 The PNC Financial Services Group, Inc. – Form 10-Q
Average investment securities for the second quarter of 2023 decreased $2.4 billion, or 2% compared to the first quarter of 2023 primarily due to prepayments and maturities outpacing purchases. Average investment securities increased $7.9 billion, or 6% in the year-to-date comparison, due to net securities purchases, primarily of agency residential mortgage-backed securities. Average investment securities represented 28% of average interest-earning assets for both the second and first quarters of 2023, and 28% for the first six months of 2023 compared to 27% for the first six months of 2022.
Average loans for the second quarter of 2023 were stable compared to the first quarter of 2023. Average loans increased $27.2 billion, or 9% in the year-to-date comparison, reflecting growth in both commercial and consumer loans. Average loans represented 64% of average interest-earning assets for both the second and first quarters of 2023, and 64% for the first six months of 2023 compared to 60% for the first six months of 2022.
Average interest-earning deposits with banks for the secondfirst quarter of 2024 increased $5.6 billion, or 13%, compared to the fourth quarter of 2023 decreased $2.6driven by lower loan balances and higher borrowed funds, partially offset by lower deposits. Compared to the first quarter of 2023, average interest-earning deposits with banks increased $14.2 billion, or 8%42%, primarily due to higher borrowed funds and lower securities and loan balances, partially offset by lower deposits.
Average interest-bearing deposits increased $1.9 billion and $6.2 billion, compared to the fourth quarter of 2023 and the first quarter of 2023, respectively. The increase in both comparisons reflected the impact of the higher interest rate environment. In total, average interest-bearing deposits represented 81% of average interest-bearing liabilities for both the first quarter of 2024 and the fourth quarter of 2023, compared to 83% for the first quarter of 2023.
Average borrowed funds of $75.6 billion in the first quarter of 2024 increased $2.7, billion, or 4%, compared to the fourth quarter of 2023 and $12.6 billion, or 20%, compared to the first quarter of 2023, reflecting lower deposit balances.2023. In the year-to-date comparison, average interest-earning deposits with banks decreased $18.4 billion, or 36%, primarily due to higher loan balances and lower deposits, partially offset by higher borrowed funds.
Average interest-bearing deposits for the second quarter of 2023 decreased $2.5 billion, or 1%, compared to the first quarter of 2023, reflecting increased consumer spending, the impact of quantitative tightening by the Federal Reserve and consumer tax payments. Average interest-bearing deposits increased $15.5 billion, or 5%, in the year-to-date comparison, reflecting the continued shift from noninterest-bearing to interest-bearing as deposit rates have risen. In total, average interest-bearing deposits represented 83% of average interest-bearing liabilities for both the second and first quarters of 2023 and 83% for the first six months of 2023 compared to 90%, for the first six months of 2022.
Average borrowed funds increased $2.7 billion, or 4%, and $31.3 billion, or 95% in the quarterly and year-to-date comparisons, respectively. The increase in both comparisons, the increase was due to higher FHLB borrowings anddriven primarily by parent company senior debt issuances.
Further details regarding average loans and deposits are included in the Business Segments Review section of this Financial Review.
Noninterest Income
Table 4: Noninterest Income
| | | |
| | |
| | |
| | | | | Three months ended | | | | Six months ended | | | |
| | | | June 30 | | March 31 | | Change | | June 30 | | June 30 | | Change |
| Dollars in millions | Dollars in millions | | 2023 | | 2023 | | $ | | % | | 2023 | | 2022 | | $ | | % |
| Dollars in millions | |
| Dollars in millions | |
| Noninterest income | |
| Noninterest income | |
| Noninterest income | Noninterest income | | | | | |
| Asset management and brokerage | Asset management and brokerage | | $ | 348 | | | $ | 356 | | | $ | (8) | | | (2) | % | | $ | 704 | | | $ | 742 | | | $ | (38) | | | (5) | % |
| Asset management and brokerage | |
| Asset management and brokerage | |
| Capital markets and advisory | |
| Capital markets and advisory | |
| Capital markets and advisory | Capital markets and advisory | | 213 | | | 262 | | | (49) | | | (19) | % | | 475 | | | 661 | | | (186) | | | (28) | % |
| Card and cash management | Card and cash management | | 697 | | | 659 | | | 38 | | | 6 | % | | 1,356 | | | 1,291 | | | 65 | | | 5 | % |
| Card and cash management | |
| Card and cash management | |
| Lending and deposit services | |
| Lending and deposit services | |
| Lending and deposit services | Lending and deposit services | | 298 | | | 306 | | | (8) | | | (3) | % | | 604 | | | 551 | | | 53 | | | 10 | % |
| Residential and commercial mortgage | Residential and commercial mortgage | | 98 | | | 177 | | | (79) | | | (45) | % | | 275 | | | 320 | | | (45) | | | (14) | % |
| Residential and commercial mortgage | |
| Residential and commercial mortgage | |
| Other | |
| Other | |
| Other | Other | | 129 | | | 258 | | | (129) | | | (50) | % | | 387 | | | 388 | | | (1) | | | — | |
| Total noninterest income | Total noninterest income | | $ | 1,783 | | | $ | 2,018 | | | $ | (235) | | | (12) | % | | $ | 3,801 | | | $ | 3,953 | | | $ | (152) | | | (4) | % |
| Total noninterest income | |
| Total noninterest income | |
Noninterest income as a percentage of total revenue was 34%37% for both the secondfirst quarter of 2024 and the fourth quarter of 2023, compared to 36% for the first quarter of 2023, and 35% for the first six months of 2023 compared to 40% for the same period in 2022.2023.
Asset management and brokerage fees decreasedincreased compared to the fourth quarter of 2023 and the first quarter of 2023, and included lower annuity sales. The decrease in the year-to-date comparison reflectedprimarily driven by the impact of lowerhigher average equity markets and annuity sales. PNC’s discretionary client assets under management of $176 billion at June 30, 2023 decreased from $177 billion at March 31, 2023, and included the impact of client activity, partially offset by higher spot equity markets. PNC’s discretionary client assets under management increased from $167$6 billion at June 30, 2022,and $18 billion compared to December 31, 2023 and March 31, 2023, respectively. In both comparisons, the increase was primarily driven by higher spot equity markets, partially offset by client activity.markets.
Capital markets and advisory fees decreaseddeclined compared to the firstfourth quarter of 2023, driven by lower merger and acquisition advisory fees and a decline in loan syndication revenue.activity, partially offset by higher underwriting fees. The decrease incompared to the year-to-date comparisonfirst quarter of 2023 was primarily due to lower merger and acquisition advisorytrading revenue, partially offset by higher underwriting fees.
Card and cash management revenue increaseddecreased compared to the firstfourth quarter of 2023, reflectingas seasonally higherlower consumer transaction volumes and increasedwere partially offset by higher treasury management product revenue.fees. The increase compared to the first sixthree months of 20222023 was primarily due to increasedhigher treasury management product revenue and higher customer transaction volumes.revenue.
Lending and deposit services decreased compared to the fourth quarter of 2023, reflecting the reduction of certain checking product fees. Lending and deposit services were stable compared to the first quarter of 2023.
Residential and commercial mortgage decreased compared to the fourth quarter of 2023, and included lower residential mortgage activity. The decrease compared to the first quarter of 2023 was driven by lower revenue from commercial mortgage loans held for sale.
Other noninterest income decreased compared to the fourth quarter of 2023, and increased in the year-to-date comparison, reflecting client-related activity. In comparisonincluded lower gains on sales. The decrease compared to the first six monthsquarter of 2022, the increase2023 was alsoprimarily driven by growtha decline in loan commitment fees.private equity revenue. In both comparisons, the decrease was offset by lower negative Visa Class B-1 derivative fair value adjustments. Visa Class B-1 fair value adjustments were negative $7 million for the first quarter of 2024 compared to negative $100 million for the fourth quarter of 2023 and negative $45 million for the first quarter of 2023.
The PNC Financial Services Group, Inc. – Form 10-Q 7
Residential and commercial mortgage decreased compared to the first quarter of 2023 primarily due to a $58 million decrease in mortgage servicing rights valuation, net of economic hedge. The decrease compared to the first six months of 2022 was driven by lower commercial mortgage banking activities.
Other noninterest income decreased in the quarterly comparison and was stable in the year-to-date comparison. Both comparisons included lower private equity revenue and the impact of negative Visa Class B derivative fair value adjustments related to litigation escrow funding and other valuation changes. Negative Visa Class B fair value adjustments were $83 million for the second quarter of 2023 compared to $45 million for the first quarter of 2023, and $128 million for the first six months of 2023 compared to $12 million for the same period in 2022.
Noninterest Expense
Table 5: Noninterest Expense
| | | |
| | | | | Three months ended | | | | Six months ended | | | |
| | | | June 30 | | March 31 | | Change | | June 30 | | June 30 | | Change | |
| Dollars in millions | Dollars in millions | | 2023 | | 2023 | | $ | | % | | 2023 | | 2022 | | $ | | % | |
| Dollars in millions | |
| Dollars in millions | |
| Noninterest expense | |
| Noninterest expense | |
| Noninterest expense | Noninterest expense | | | | |
| Personnel | Personnel | | $ | 1,846 | | | $ | 1,826 | | | $ | 20 | | | 1 | % | | $ | 3,672 | | | $ | 3,496 | | | $ | 176 | | | 5 | % | |
| Personnel | |
| Personnel | |
| Occupancy | |
| Occupancy | |
| Occupancy | Occupancy | | 244 | | | 251 | | | (7) | | | (3) | % | | 495 | | | 504 | | | (9) | | | (2) | % | |
| Equipment | Equipment | | 349 | | | 350 | | | (1) | | | — | | | 699 | | | 682 | | | 17 | | | 2 | % | |
| Equipment | |
| Equipment | |
| Marketing | |
| Marketing | |
| Marketing | Marketing | | 109 | | | 74 | | | 35 | | | 47 | % | | 183 | | | 156 | | | 27 | | | 17 | % | |
| Other | Other | | 824 | | | 820 | | | 4 | | | — | | | 1,644 | | | 1,578 | | | 66 | | | 4 | % | |
| Other | |
| Other | |
| Total noninterest expense | Total noninterest expense | | $ | 3,372 | | | $ | 3,321 | | | $ | 51 | | | 2 | % | | $ | 6,693 | | | $ | 6,416 | | | $ | 277 | | | 4 | % | |
| Total noninterest expense | |
| Total noninterest expense | |
Noninterest expense increaseddecreased compared to the fourth quarter of 2023, driven by lower or stable expenses across all categories, reflecting a continued focus on expense management. Noninterest expense was stable compared to the first three months of 2023. The first quarter of 2024 included an additional pre-tax expense of $130 million related to the increase in the FDIC’s expected losses. The fourth quarter of 2023 primarily due to seasonally higher marketing spend and the full quarter impact of annual employee merit increases. The increase comparedincluded $515 million pertaining to the first six monthsFDIC special assessment as well as $150 million of 2022 was due to higher personnel costs, an increased FDIC assessment rate and higher marketing and technology costs to support business growth.workforce reduction charges.
In July 2023, we raised our continuous improvement program savings goal from $400 million to $450 million for 2023.
We expect the FDIC will enact a special deposit insurance assessment in the second half of 2023 that will significantly increase our FDIC deposit insurance costs. Based on the current proposal, PNC estimates our total cost to be approximately $468 million pre-tax, or $370 million after-tax, which would be incurred in the quarter the FDIC finalizes the rule. The total cost and timing is subject to change pending the assessment’s finalization. See the Recent Regulatory Developments section in this Financial Review and Note 16 Regulatory Matters for additional details on this FDIC special deposit insurance assessment.
Effective Income Tax Rate
The effective income tax rate was 15.5%18.8% in the secondfirst quarter of 2024, 16.3% in the fourth quarter of 2023 compared toand 17.2% in the first quarter of 2023, and 16.4%2023. The effective income tax rate in the first six months of 2023 compared to 17.9% for the same period in 2022. The secondfourth quarter of 2023 included the favorable impact ofreflected certain tax matters.credit benefits.
Provision For (Recapture of) Credit Losses
Table 6: Provision for (Recapture of) Credit Losses | | | | | Three months ended | | | Six months ended | | | |
| | June 30 | | March 31 | | Change | | June 30 | Change | | |
| | |
| | March 31 | |
| | March 31 | |
| | March 31 | |
| Dollars in millions | |
| Dollars in millions | |
| Dollars in millions | Dollars in millions | | 2023 | | 2023 | | $ | | 2023 | 2022 | $ | | |
| Provision for (recapture of) credit losses | Provision for (recapture of) credit losses | | | | | |
| Provision for (recapture of) credit losses | |
| Provision for (recapture of) credit losses | |
| Loans and leases | |
| Loans and leases | |
| Loans and leases | Loans and leases | | $ | 189 | | | $ | 229 | | | $ | (40) | | | $ | 418 | | $ | (182) | | $ | 600 | | | |
| Unfunded lending related commitments | Unfunded lending related commitments | | (9) | | | (22) | | | 13 | | | (31) | | 19 | | (50) | | | |
| Unfunded lending related commitments | |
| Unfunded lending related commitments | |
| Investment securities | |
| Investment securities | |
| Investment securities | Investment securities | | (1) | | | 1 | | | (1) | | 4 | | (5) | | | |
| Other financial assets | Other financial assets | | (34) | | | 29 | | | (63) | | | (5) | | (13) | | 8 | | | |
| Total provision for (recapture of) credit losses | | $ | 146 | | | $ | 235 | | | $ | (89) | | | $ | 381 | | $ | (172) | | $ | 553 | | | |
| Other financial assets | |
| Other financial assets | |
| Total provision for credit losses | |
| Total provision for credit losses | |
| Total provision for credit losses | |
Provision for credit losses of $146$155 million in the secondfirst quarter of 20232024 reflected portfolio activity and changes inimproved macroeconomic variables. The first quarter of 2023 included a provision for credit losses of $235 million. Provision for credit losses of $381 million for the first six months of 2023 included the impact of our updated economic outlook and changes in portfolio composition and quality. The first six months of 2022 included a recapture of credit losses of $172 million.
8 The PNC Financial Services Group, Inc. – Form 10-Q
CONSOLIDATED BALANCE SHEET REVIEW
The summarized balance sheet data in Table 7 is based upon our Consolidated Balance Sheet in Item 1 of this Report.
Table 7: Summarized Balance Sheet Data
| | | | June 30 | | December 31 | | Change | |
| Dollars in millions | Dollars in millions | 2023 | | 2022 | | $ | % | |
| Dollars in millions | |
| Dollars in millions | |
| Assets | |
| Assets | |
| Assets | Assets | | | | | | |
| Interest-earning deposits with banks | Interest-earning deposits with banks | $ | 38,259 | | | $ | 27,320 | | | $ | 10,939 | | 40 | % | |
| Interest-earning deposits with banks | |
| Interest-earning deposits with banks | |
| Loans held for sale | |
| Loans held for sale | |
| Loans held for sale | Loans held for sale | 835 | | | 1,010 | | | (175) | | (17) | % | |
| Investment securities | Investment securities | 135,661 | | | 139,334 | | | (3,673) | | (3) | % | |
| Investment securities | |
| Investment securities | |
| Loans | |
| Loans | |
| Loans | Loans | 321,761 | | | 326,025 | | | (4,264) | | (1) | % | |
| Allowance for loan and lease losses | Allowance for loan and lease losses | (4,737) | | | (4,741) | | | 4 | | — | | |
| Allowance for loan and lease losses | |
| Allowance for loan and lease losses | |
| Mortgage servicing rights | |
| Mortgage servicing rights | |
| Mortgage servicing rights | Mortgage servicing rights | 3,455 | | | 3,423 | | | 32 | | 1 | % | |
| Goodwill | Goodwill | 10,987 | | | 10,987 | | | | | — | | |
| Goodwill | |
| Goodwill | |
| Other | |
| Other | |
| Other | Other | 51,986 | | | 53,905 | | | (1,919) | | (4) | % | |
| Total assets | Total assets | $ | 558,207 | | | $ | 557,263 | | | $ | 944 | | — | | |
| Total assets | |
| Total assets | |
| Liabilities | |
| Liabilities | |
| Liabilities | Liabilities | | |
| Deposits | Deposits | $ | 427,489 | | | $ | 436,282 | | | $ | (8,793) | | (2) | % | |
| Deposits | |
| Deposits | |
| Borrowed funds | |
| Borrowed funds | |
| Borrowed funds | Borrowed funds | 65,384 | | | 58,713 | | | 6,671 | | 11 | % | |
| Allowance for unfunded lending related commitments | Allowance for unfunded lending related commitments | 663 | | | 694 | | | (31) | | (4) | % | |
| Allowance for unfunded lending related commitments | |
| Allowance for unfunded lending related commitments | |
| Other | |
| Other | |
| Other | Other | 15,325 | | | 15,762 | | | (437) | | (3) | % | |
| Total liabilities | Total liabilities | 508,861 | | | 511,451 | | | (2,590) | | (1) | % | |
| Total liabilities | |
| Total liabilities | |
| Equity | |
| Equity | |
| Equity | Equity | | |
| Total shareholders’ equity | Total shareholders’ equity | 49,320 | | | 45,774 | | | 3,546 | | 8 | % | |
| Total shareholders’ equity | |
| Total shareholders’ equity | |
| Noncontrolling interests | |
| Noncontrolling interests | |
| Noncontrolling interests | Noncontrolling interests | 26 | | | 38 | | | (12) | | (32) | % | |
| Total equity | Total equity | 49,346 | | | 45,812 | | | 3,534 | | 8 | % | |
| Total equity | |
| Total equity | |
| Total liabilities and equity | Total liabilities and equity | $ | 558,207 | | | $ | 557,263 | | | $ | 944 | | — | | |
| Total liabilities and equity | |
| Total liabilities and equity | |
Our balance sheet was strong and well positioned at June 30, 2023.March 31, 2024. In comparison to December 31, 2022:2023:
•Total assets were stable.increased modestly due to higher balances held with the Federal Reserve Bank, partially offset by lower securities and loan balances.
•Total liabilities decreasedincreased modestly primarily due to lower deposits, partially offset by increased borrowed funds.higher deposits.
•Total equity increased due to the benefit of net income, a preferred stock issuance and an improvement in AOCI, partially offset by dividends paid, a decline in AOCI and common share repurchases.
The ACL related to loans totaled $5.4 billion and $5.5 billion at both June 30, 2023March 31, 2024 and December 31, 2022.2023, respectively. During the sixthree months ended June 30, 2023, reserves reflected our updated economic outlook and changes inMarch 31, 2024, this reserve was driven by improved macroeconomic factors as well as portfolio composition and quality.activity. See the following for additional information regarding our ACL related to loans:
•Allowance for Credit Losses in the Credit Risk Management section of this Financial Review,
•Critical Accounting Estimates and Judgments section of this Financial Review, and
•Note 3 Loans and Related Allowance for Credit Losses.
The following discussion provides additional information about the major components of our balance sheet. Information regarding our capital and regulatory compliance is included in the Liquidity and Capital Management portion of the Risk Management section in this Financial Review and in Note 2019 Regulatory Matters in our 20222023 Form 10-K.
The PNC Financial Services Group, Inc. – Form 10-Q 9
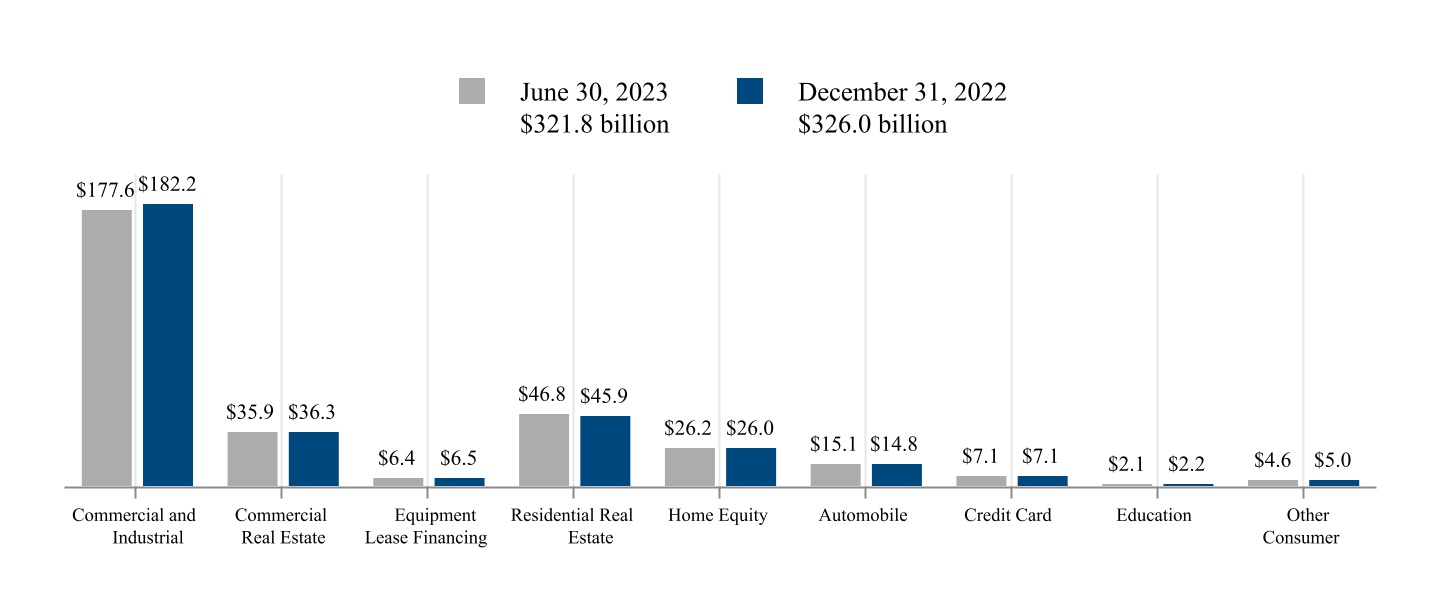
Loans
Table 8: Loans
| | | | June 30 | | December 31 | | Change | |
| Dollars in millions | Dollars in millions | 2023 | | 2022 | | $ | % | |
| Dollars in millions | |
| Dollars in millions | |
| Commercial | |
| Commercial | |
| Commercial | Commercial | | | | | | |
| Commercial and industrial | Commercial and industrial | $ | 177,629 | | | $ | 182,219 | | | $ | (4,590) | | (3) | % | |
| Commercial and industrial | |
| Commercial and industrial | |
| Commercial real estate | |
| Commercial real estate | |
| Commercial real estate | Commercial real estate | 35,928 | | | 36,316 | | (388) | | (1) | % | |
| Equipment lease financing | Equipment lease financing | 6,400 | | | 6,514 | | (114) | | (2) | % | |
| Equipment lease financing | |
| Equipment lease financing | |
| Total commercial | |
| Total commercial | |
| Total commercial | Total commercial | 219,957 | | | 225,049 | | | (5,092) | | (2) | % | |
| Consumer | Consumer | | | | | |
| Consumer | |
| Consumer | |
| Residential real estate | |
| Residential real estate | |
| Residential real estate | Residential real estate | 46,834 | | | 45,889 | | | 945 | | 2 | % | |
| Home equity | Home equity | 26,200 | | | 25,983 | | | 217 | | 1 | % | |
| Home equity | |
| Home equity | |
| Automobile | |
| Automobile | |
| Automobile | Automobile | 15,065 | | | 14,836 | | | 229 | | 2 | % | |
| Credit card | Credit card | 7,092 | | | 7,069 | | | 23 | | — | | |
| Credit card | |
| Credit card | |
| Education | |
| Education | |
| Education | Education | 2,058 | | | 2,173 | | | (115) | | (5) | % | |
| Other consumer | Other consumer | 4,555 | | | 5,026 | | | (471) | | (9) | % | |
| Other consumer | |
| Other consumer | |
| Total consumer | |
| Total consumer | |
| Total consumer | Total consumer | 101,804 | | | 100,976 | | | 828 | | 1 | % | |
| Total loans | Total loans | $ | 321,761 | | | $ | 326,025 | | | $ | (4,264) | | (1) | % | |
| Total loans | |
| Total loans | |
Commercial and consumer loans decreased driven by a lower utilization of loan commitments in addition to paydowns outpacing new production.
Consumer loans increased as growth in residential mortgages, automobile, home equity and credit card loans were partially offset by declines in the remaining portfoliosdeclined as paydowns outpaced new originations.originations and utilization.
For additional information regarding our loan portfolio see the Credit Risk Management portion of the Risk Management section in this Financial Review and Note 3 Loans and Related Allowance for Credit Losses.
10 The PNC Financial Services Group, Inc. – Form 10-Q
Investment Securities
Investment securities of $135.7$130.5 billion at June 30, 2023March 31, 2024 decreased $3.7$2.1 billion, or 3%2%, compared to December 31, 2022,2023, primarily due to prepayments and maturities outpacing purchases.
The level and composition of the investment securities portfolio fluctuates over time based on many factors, including market conditions, loan and deposit growth and balance sheet management activities. We manage our investment securities portfolio to optimize returns, while providing a reliable source of liquidity for our banking and other activities, considering the LCR, NSFR and other internal and external guidelines and constraints.
Table 9: Investment Securities (a)
| | | |
| | | | June 30, 2023 | | December 31, 2022 | |
| Dollars in millions | Dollars in millions | Amortized
Cost (b) | | Fair
Value | | Amortized
Cost (b) | | Fair
Value | |
| Dollars in millions | |
| Dollars in millions | |
| U.S. Treasury and government agencies | |
| U.S. Treasury and government agencies | |
| U.S. Treasury and government agencies | U.S. Treasury and government agencies | $ | 44,848 | | | $ | 42,403 | | | $ | 45,767 | | | $ | 43,330 | | |
| Agency residential mortgage-backed | Agency residential mortgage-backed | 75,145 | | | 68,874 | | | 77,385 | | | 71,073 | | |
| Agency residential mortgage-backed | |
| Agency residential mortgage-backed | |
| Non-agency residential mortgage-backed | |
| Non-agency residential mortgage-backed | |
| Non-agency residential mortgage-backed | Non-agency residential mortgage-backed | 911 | | | 1,015 | | | 973 | | | 1,074 | | |
| Agency commercial mortgage-backed | Agency commercial mortgage-backed | 2,598 | | | 2,405 | | | 2,693 | | | 2,501 | | |
| Agency commercial mortgage-backed | |
| Agency commercial mortgage-backed | |
| Non-agency commercial mortgage-backed (c) | |
| Non-agency commercial mortgage-backed (c) | |
| Non-agency commercial mortgage-backed (c) | Non-agency commercial mortgage-backed (c) | 2,563 | | | 2,458 | | | 2,992 | | | 2,883 | | |
| Asset-backed (d) | Asset-backed (d) | 7,555 | | | 7,472 | | | 7,291 | | | 7,183 | | |
| Asset-backed (d) | |
| Asset-backed (d) | |
| Other (e) | |
| Other (e) | |
| Other (e) | Other (e) | 6,271 | | | 6,056 | | | 6,642 | | | 6,394 | | |
| Total investment securities (f) | Total investment securities (f) | $ | 139,891 | | | $ | 130,683 | | | $ | 143,743 | | | $ | 134,438 | | |
| Total investment securities (f) | |
| Total investment securities (f) | |
(a)Of our total securities portfolio, 97% were rated AAA/AA at both June 30, 2023March 31, 2024 and December 31, 2022.2023.
(b)Amortized cost is presented net of the allowance for investment securities, which totaled $148$93 million at June 30, 2023March 31, 2024 and primarily related to non-agency commercial mortgage-backed securities. The comparable amount at December 31, 20222023 was $149$92 million.
(c)Collateralized primarily by multifamily housing, office buildings, multifamily housing, retail properties, lodging properties and industrial properties.
(d)Collateralized primarily by consumer credit products, corporate debt and government guaranteed education loans and other consumer credit products.loans.
(e)Includes state and municipal securities.securities and corporate bonds.
(f)Includes available for sale and held to maturity securities, which are recorded on our balance sheet at fair value and amortized cost, respectively.
Table 9 presents our investment securities portfolio by amortized cost and fair value. The relationship of fair value to amortized cost at June 30, 2023March 31, 2024 was comparable to December 31, 2022 due2023 and primarily toreflected the impact of higher interest rates on the valuation of fixed-rate securities offset by the passage of time.securities. We continually monitor the credit risk in our portfolio and maintain the allowance for investment securities at an appropriate level to absorb expected credit losses on our investment securities portfolio for the remaining contractual term of the securities adjusted for expected prepayments. See Note 2 Investment Securities for additional details regarding the allowance for investment securities.
10 The PNC Financial Services Group, Inc. – Form 10-Q
The duration of investment securities was 4.34.1 years and 4.54.2 years at June 30, 2023March 31, 2024 and December 31, 2022,2023, respectively. We estimate that at June 30, 2023March 31, 2024 the effective duration of investment securities was 4.34.0 years for an immediate 50 basis points parallel increase in interest rates and 4.34.1 years for an immediate 50 basis points parallel decrease in interest rates. Comparable amounts at December 31, 20222023 for the effective duration of investment securities were 4.44.1 years and 4.54.2 years, respectively.
Based on expected prepayment speeds, the weighted-average expected maturity of the investment securities portfolio was 5.75.2 years at June 30, 2023March 31, 2024 compared to 6.05.5 years at December 31, 2022.2023.
Table 10: Weighted-Average Expected Maturities of Mortgage and Asset-Backed Debt Securities
| | | | | | | | |
June 30, 2023March 31, 2024 | Years | |
| Agency residential mortgage-backed | 7.77.0 | | |
| Non-agency residential mortgage-backed | 9.99.8 | | |
| Agency commercial mortgage-backed | 5.24.9 | | |
| Non-agency commercial mortgage-backed | 1.31.0 | | |
| Asset-backed | 2.3 | | |
Additional information regarding our investment securities portfolio is included in Note 2 Investment Securities and Note 11 Fair Value.
The PNC Financial Services Group, Inc. – Form 10-Q 11
Funding Sources
Table 11: Details of Funding Sources | | June 30 | | December 31 | | Change | |
| March 31 | |
| Dollars in millions | |
| Dollars in millions | |
| Dollars in millions | Dollars in millions | 2023 | | 2022 | | $ | % | |
| Deposits | Deposits | | | | | | |
| Deposits | |
| Deposits | |
| Noninterest-bearing | |
| Noninterest-bearing | |
| Noninterest-bearing | Noninterest-bearing | $ | 110,527 | | | $ | 124,486 | | | $ | (13,959) | | (11) | % | |
| Interest-bearing | Interest-bearing | | |
| Interest-bearing | |
| Interest-bearing | |
| Money market | |
| Money market | |
| Money market | Money market | 63,607 | | | 64,150 | | | (543) | | (1) | % | |
| Demand | Demand | 128,942 | | | 126,143 | | | 2,799 | | 2 | % | |
| Demand | |
| Demand | |
| Savings | |
| Savings | |
| Savings | Savings | 101,549 | | | 103,033 | | | (1,484) | | (1) | % | |
| Time deposits | Time deposits | 22,864 | | | 18,470 | | | 4,394 | | 24 | % | |
| Time deposits | |
| Time deposits | |
| Total interest-bearing deposits | |
| Total interest-bearing deposits | |
| Total interest-bearing deposits | Total interest-bearing deposits | 316,962 | | | 311,796 | | | 5,166 | | 2 | % | |
| Total deposits | Total deposits | 427,489 | | | 436,282 | | | (8,793) | | (2) | % | |
| Total deposits | |
| Total deposits | |
| Borrowed funds | |
| Borrowed funds | |
| Borrowed funds | Borrowed funds | | | | | |
| Federal Home Loan Bank borrowings | Federal Home Loan Bank borrowings | 34,000 | | | 32,075 | | | 1,925 | | 6 | % | |
| Federal Home Loan Bank borrowings | |
| Federal Home Loan Bank borrowings | |
| Senior debt | |
| Senior debt | |
| Senior debt | Senior debt | 22,005 | | | 16,657 | | | 5,348 | | 32 | % | |
| Subordinated debt | Subordinated debt | 5,548 | | | 6,307 | | | (759) | | (12) | % | |
| Subordinated debt | |
| Subordinated debt | |
| Other | |
| Other | |
| Other | Other | 3,831 | | | 3,674 | | | 157 | | 4 | % | |
| Total borrowed funds | Total borrowed funds | 65,384 | | | 58,713 | | | 6,671 | | 11 | % | |
| Total borrowed funds | |
| Total borrowed funds | |
| Total funding sources | Total funding sources | $ | 492,873 | | | $ | 494,995 | | | $ | (2,122) | | — | | |
| Total funding sources | |
| Total funding sources | |
Deposits are considered an attractive source of funding due to their stability and relatively low cost to fund. Compared to December 31, 2023, our funding source composition included higher deposit balances and relatively stable borrowed funds.
Total deposits decreased as a result of lowerincreased reflecting higher commercial and consumer and commercial deposits, reflecting seasonal declines and the impact of quantitative tightening by the Federal Reserve. In addition, noninterest-bearingdeposits. Noninterest-bearing deposit balances decreased duedriven by a decline in commercial noninterest-bearing balances. Interest-bearing deposits increased reflecting higher commercial and consumer interest-bearing balances. This shift in deposit composition, as well as higher deposit rates, contributed to an increase in funding costs compared to the continued shift into interest-bearingfourth quarter of 2023. Our total brokered deposit products as interest rates have risen.balances of $10.6 billion at March 31, 2024 decreased compared to $11.0 billion at December 31, 2023, and were significantly below both our internal and regulatory guidelines and limits.
Borrowed funds increased due towere largely stable as parent company senior debt issuances and higherwere offset by lower FHLB borrowings.
The level and composition of borrowed funds fluctuates over time based on many factors, including market conditions, capital considerations, and funding needs, which are primarily driven by changes in loan, deposit and investment securities andbalances. While our largest source of liquidity on a consolidated basis is the customer deposit growth and capital considerations. Webase generated by our banking businesses, we also manage our borrowed funds to provide a reliable source of liquidity for our banking and other activities, considering our LCR and NSFR requirements and other internal and external guidelines and constraints. See the Liquidity and Capital Management portion of the Risk Management section in this Financial Review for additional information regarding our liquidity and capital activities. See Note 7 Borrowed Funds in this Report and Note 109 Borrowed Funds in our 20222023 Form 10-K for additional information related to our
The PNC Financial Services Group, Inc. – Form 10-Q 11
borrowings.See Average Consolidated Balance Sheet and Net Interest Analysis in the Statistical Information section of this Report for additional information on volume and related funding cost changes.
Shareholders’ Equity
Total shareholders’ equity was $49.3$51.3 billion at June 30, 2023,March 31, 2024, an increase of $3.5$0.2 billion compared to December 31, 2022,2023, as increases related to net income of $3.2 billion, a preferred stock issuance of $1.5 billion and an improvement in AOCI of $0.6$1.3 billion were partially offset by dividends paid of $1.4$0.7 billion, a decline in AOCI of $0.3 billion and more than $0.1 billion of common share repurchases of $0.5 billion.repurchases.
12 The PNC Financial Services Group, Inc. – Form 10-Q
BUSINESS SEGMENTS REVIEW
We have three reportable business segments:
•Retail Banking
•Corporate & Institutional Banking
•Asset Management Group
Business segment results and a description of each business are included in Note 14 Segment Reporting. Certain amounts included in this Business Segments Review differ from those amounts shown in Note 14, primarily due to the presentation in this Financial Review of business net interest income on a taxable-equivalent basis.
Net interest income in business segment results reflects our internal funds transfer pricing methodology. Assets receive a funding charge and liabilities and capital receive a funding credit based on a transfer pricing methodology that incorporates product repricing characteristics, tenor and other factors.
Total business segment financial results differ from total consolidated net income. The impact of these differences is reflected in the “Other” categoryOther, as shown in Table 7977 in Note 14 Segment Reporting. “Other”Other includes residual activities that do not meet the criteria for disclosure as a separate reportable business, such as asset and liability management activities including net securities gains or losses, ACL for investment securities, certain trading activities, certain runoff consumer loan portfolios, private equity investments, intercompany eliminations, certain corporate overhead net of allocations, tax adjustments that are not allocated to business segments, exited businesses and differences between business segment performance reporting and financial statement reporting (GAAP).the residual impact from funds transfer pricing operations.
12The PNC Financial Services Group, Inc. – Form 10-Q
13
Retail Banking
Retail Banking’s core strategy is to build lifelong, primary relationships by creating a sense of financial well-being and ease for our clients. Over time, we seek to deepen those relationships by meeting the broad range of our clients’ financial needs across savings, liquidity, lending, payments, investment and retirement solutions. We work to deliver these solutions in the most seamless and efficient way possible, meeting our customers where they want to be met –- whether in a branch, through digital channels, at an ATM or through our phone-based customer contact centers –- while continuously optimizing the cost to sell and service. We believe that, over time, we can grow our customer base, enhance the breadth and depth of our client relationships and improve our efficiency through differentiated products and leading digital channels.
Table 12: Retail Banking Table | | (Unaudited) | (Unaudited) | | |
| Six months ended June 30 | | | | | Change | |
| Three months ended March 31 | |
| Three months ended March 31 | |
| Three months ended March 31 | |
| Dollars in millions, except as noted | |
| Dollars in millions, except as noted | |
| Dollars in millions, except as noted | Dollars in millions, except as noted | 2023 | | 2022 | | $ | % | |
| Income Statement | Income Statement | | |
| Income Statement | |
| Income Statement | |
| Net interest income | |
| Net interest income | |
| Net interest income | Net interest income | $ | 4,729 | | | $ | 3,193 | | | $ | 1,536 | | 48 | % | |
| Noninterest income | Noninterest income | 1,445 | | | 1,493 | | | (48) | | (3) | % | |
| Noninterest income | |
| Noninterest income | |
| Total revenue | Total revenue | 6,174 | | | 4,686 | | | 1,488 | | 32 | % | |
| Provision for (recapture of) credit losses | 224 | | | (26) | | | 250 | | * | |
| Total revenue | |
| Total revenue | |
| Provision for credit losses | |
| Provision for credit losses | |
| Provision for credit losses | |
| Noninterest expense | |
| Noninterest expense | |
| Noninterest expense | Noninterest expense | 3,831 | | | 3,805 | | | 26 | | 1 | % | |
| Pretax earnings | Pretax earnings | 2,119 | | | 907 | | | 1,212 | | 134 | % | |
| Pretax earnings | |
| Pretax earnings | |
| Income taxes | |
| Income taxes | |
| Income taxes | Income taxes | 497 | | | 214 | | | 283 | | 132 | % | |
| Noncontrolling interests | Noncontrolling interests | 21 | | | 31 | | | (10) | | (32) | % | |
| Noncontrolling interests | |
| Noncontrolling interests | |
| Earnings | |
| Earnings | |
| Earnings | Earnings | $ | 1,601 | | | $ | 662 | | | $ | 939 | | 142 | % | |
| Average Balance Sheet | Average Balance Sheet | | |
| Average Balance Sheet | |
| Average Balance Sheet | |
| Loans held for sale | |
| Loans held for sale | |
| Loans held for sale | Loans held for sale | $ | 578 | | | $ | 1,070 | | | $ | (492) | | (46) | % | |
| Loans | Loans | | |
| Loans | |
| Loans | |
| Consumer | |
| Consumer | |
| Consumer | Consumer | | |
| Residential real estate | Residential real estate | $ | 35,285 | | | $ | 32,389 | | | $ | 2,896 | | 9 | % | |
| Residential real estate | |
| Residential real estate | |
| Home equity | |
| Home equity | |
| Home equity | Home equity | 24,617 | | | 22,673 | | | 1,944 | | 9 | % | |
| Automobile | Automobile | 14,962 | | | 15,918 | | | (956) | | (6) | % | |
| Automobile | |
| Automobile | |
| Credit card | |
| Credit card | |
| Credit card | Credit card | 6,960 | | | 6,455 | | | 505 | | 8 | % | |
| Education | Education | 2,151 | | | 2,470 | | | (319) | | (13) | % | |
| Education | |
| Education | |
| Other consumer | |
| Other consumer | |
| Other consumer | Other consumer | 1,959 | | | 2,261 | | | (302) | | (13) | % | |
| Total consumer | Total consumer | 85,934 | | | 82,166 | | | 3,768 | | 5 | % | |
| Total consumer | |
| Total consumer | |
| Commercial | |
| Commercial | |
| Commercial | Commercial | 11,574 | | | 11,325 | | | 249 | | 2 | % | |
| Total loans | Total loans | $ | 97,508 | | | $ | 93,491 | | | $ | 4,017 | | 4 | % | |
| Total loans | |
| Total loans | |
| Total assets | |
| Total assets | |
| Total assets | Total assets | $ | 115,103 | | | $ | 112,415 | | | $ | 2,688 | | 2 | % | |
| Deposits | Deposits | | | | | |
| Deposits | |
| Deposits | |
| Noninterest-bearing | |
| Noninterest-bearing | |
| Noninterest-bearing | Noninterest-bearing | $ | 60,129 | | | $ | 64,833 | | | $ | (4,704) | | (7) | % | |
| Interest-bearing | Interest-bearing | 199,776 | | | 201,916 | | | (2,140) | | (1) | % | |
| Interest-bearing | |
| Interest-bearing | |
| Total deposits | |
| Total deposits | |
| Total deposits | Total deposits | $ | 259,905 | | | $ | 266,749 | | | $ | (6,844) | | (3) | % | |
| Performance Ratios | Performance Ratios | | |
| Performance Ratios | |
| Performance Ratios | |
| Return on average assets | |
| Return on average assets | |
| Return on average assets | Return on average assets | 2.80 | % | | 1.19 | % | | |
| Noninterest income to total revenue | Noninterest income to total revenue | 23 | % | | 32 | % | | |
| Noninterest income to total revenue | |
| Noninterest income to total revenue | |
| Efficiency | Efficiency | 62 | % | | 81 | % | | | |
| Efficiency | |
| Efficiency | |
| Supplemental Noninterest Income Information | |
| Supplemental Noninterest Income Information | |
| Supplemental Noninterest Income Information | |
| Asset management and brokerage | |
| Asset management and brokerage | |
| Asset management and brokerage | |
| Card and cash management | |
| Card and cash management | |
| Card and cash management | |
| Lending and deposit services | |
| Lending and deposit services | |
| Lending and deposit services | |
| Residential and commercial mortgage | |
| Residential and commercial mortgage | |
| Residential and commercial mortgage | |
14The PNC Financial Services Group, Inc. – Form 10-Q
| | | | | | | | | | | | | | | | | | | | | | | |
| At or for six months ended June 30 | | | | | Change | |
| Dollars in millions, except as noted | 2023 | | 2022 | | $ | % | |
| Supplemental Noninterest Income Information | | | | | | | |
| Asset management and brokerage | $ | 254 | | | $ | 269 | | | $ | (15) | | (6) | % | |
| Card and cash management | $ | 668 | | | $ | 659 | | | $ | 9 | | 1 | % | |
| Lending and deposit services | $ | 357 | | | $ | 331 | | | $ | 26 | | 8 | % | |
| Residential and commercial mortgage | $ | 179 | | | $ | 170 | | | $ | 9 | | 5 | % | |
| Residential Mortgage Information | | | | | | | |
| Residential mortgage servicing statistics (in billions, except as noted) (a) | | | | | | | |
| Serviced portfolio balance (b) | $ | 191 | | | $ | 145 | | | $ | 46 | | 32 | % | |
| Serviced portfolio acquisitions | $ | 9 | | | $ | 21 | | | $ | (12) | | (57) | % | |
| MSR asset value (b) | $ | 2.3 | | | $ | 1.6 | | | $ | 0.7 | | 44 | % | |
| MSR capitalization value (in basis points) (b) | 123 | | | 112 | | | 11 | | 10 | % | |
| Servicing income: (in millions) | | | | | | | |
| Servicing fees, net (c) | $ | 145 | | | $ | 69 | | | $ | 76 | | 110 | % | |
| Mortgage servicing rights valuation, net of economic hedge | $ | 5 | | | $ | 15 | | | $ | (10) | | (67) | % | |
| Residential mortgage loan statistics | | | | | | | |
| Loan origination volume (in billions) | $ | 3.8 | | | $ | 9.9 | | | $ | (6.1) | | (62) | % | |
| Loan sale margin percentage | 2.24 | % | | 2.18 | % | | | | |
| Percentage of originations represented by: | | | | | | | |
| Purchase volume (d) | 88 | % | | 57 | % | | | | |
| Refinance volume | 12 | % | | 43 | % | | | | |
| Other Information (b) | | | | | | | |
| Customer-related statistics (average) | | | | | | | |
| Non-teller deposit transactions (e) | 65 | % | | 64 | % | | | | |
| Digital consumer customers (f) | 74 | % | | 78 | % | | | | |
| Credit-related statistics | | | | | | | |
| Nonperforming assets | $ | 981 | | | $ | 1,088 | | | $ | (107) | | (10) | % | |
| Net charge-offs - loans and leases | $ | 221 | | | $ | 229 | | | $ | (8) | | (3) | % | |
| Other statistics | | | | | | | |
| ATMs | 8,566 | | | 9,301 | | | (735) | | (8) | % | |
| Branches (g) | 2,361 | | | 2,535 | | | (174) | | (7) | % | |
| Brokerage account client assets (in billions) (h) | $ | 75 | | | $ | 68 | | | $ | 7 | | 10 | % | |
| | | | | | | | | | | | | | | | | | | | | | | |
| At or for three months ended March 31 | | | | | Change | |
| Dollars in millions, except as noted | 2024 | | 2023 | | $ | % | |
| Residential Mortgage Information | | | | | | | |
| Residential mortgage servicing statistics (in billions, except as noted) (a) | | | | | | | |
| Serviced portfolio balance (b) | $ | 207 | | | $ | 188 | | | $ | 19 | | 10 | % | |
| MSR asset value (b) | $ | 2.7 | | | $ | 2.2 | | | $ | 0.5 | | 23 | % | |
| Servicing income: (in millions) | | | | | | | |
| Servicing fees, net (c) | $ | 82 | | | $ | 78 | | | $ | 4 | | 5 | % | |
| Mortgage servicing rights valuation, net of economic hedge | $ | (6) | | | $ | 14 | | | $ | (20) | | * | |
| Residential mortgage loan statistics | | | | | | | |
| Loan origination volume (in billions) | $ | 1.3 | | | $ | 1.4 | | | $ | (0.1) | | (7) | % | |
| Loan sale margin percentage | 2.53 | % | | 2.26 | % | | | | |
| Other Information | | | | | | | |
| Credit-related statistics | | | | | | | |
| Nonperforming assets (b) | $ | 841 | | | $ | 1,009 | | | $ | (168) | | (17) | % | |
| Net charge-offs - loans and leases | $ | 139 | | | $ | 112 | | | $ | 27 | | 24 | % | |
| Other statistics | | | | | | | |
| Branches (b) (d) | 2,271 | | | 2,450 | | | (179) | | (7) | % | |
| Brokerage account client assets (in billions) (b) (e) | $ | 81 | | | $ | 73 | | | $ | 8 | | 11 | % | |
*- Not Meaningful
(a) Represents mortgage loan servicing balances for third parties and the related income.
(b)Presented asAs of period end, except for average customer-related statistics and net charge-offs, which are both shown for the six months ended.March 31.
(c)Servicing fees net of impact of decrease in MSR value due to passage of time, including the impact from regularly scheduled loan principal payments, prepayments and loans paid off during the period.
(d)Mortgages with borrowers as part of residential real estate purchase transactions.
(e)Percentage of total consumer and business banking deposit transactions processed at an ATM or through our mobile banking application.
(f)Represents consumer checking relationships that process the majority of their transactions through non-teller channels.
(g)Reflects all branches and solution centers excluding standalone mortgage offices and satellite offices (e.g., drive-ups, electronic branches and retirement centers) that provide limited products and/or services.
(h)(e)Includes cash and money market balances.
Retail Banking earnings for the first sixthree months of 20232024 increased $939 million$0.4 billion compared to the same period in 20222023 primarily due to increased net interest income, partially offset by an increasedhigher revenue and a lower provision for credit losses, andas well as lower noninterest income.expense.
Net interest income increased in the comparison primarily due to wider interest rate spreads on the value of deposits, partially offset by narrower interest rate spreads on the value of loans.declines in average deposit balances.
Noninterest income decreased primarily due toincreased in the impact of highercomparison, reflecting lower negative Visa Class BB-1 derivative fair value adjustments, compared to the same period in 2022.partially offset by lower card and cash management fees.
Provision for credit losses includedreflected the impact of our updated economic outlookportfolio activity and changes in portfolio composition and quality.improved macroeconomic factors.
Noninterest expense increased,decreased in the comparison, and included increased technology costs and higher marketing spend, partially offset by lower non-credit losses and personnel.personnel expense.
Retail Banking average total loans increasedremained stable in the first sixthree months of 20232024 compared to the same period in 2022.2023. Average consumer loans increased 5%decreased driven by higherlower residential real estate and home equity loans as a result of paydowns outpacing new volume, and draws on existing
The PNC Financial Services Group, Inc. – Form 10-Q 15
accounts outpacing liquidations, as well as growthcontinued declines in credit cardeducation loans due to new account production and purchase volume increases. The increase was partially offset by a declinefrom runoff in automobile, education and other consumer loans as paydowns outpaced new originations.the government guaranteed portfolio. Average commercial loans increased due to growth in automobile dealer segment balances, partially offset by forgiveness of PPP loans.balances.
Our focus on growing primary customer relationships is at the core of our deposit strategy in Retail, which is based on attracting and retaining stable, low-cost deposits as a key funding source for PNC. We have taken a disciplined approach to pricing, focused on retaining relationship-based balances and executing on targeted deposit growth and retention strategies aimed at more rate sensitiverate-sensitive customers. Our goal with regard to deposits is to optimize balances, economics and long-term customer growth. In the first sixthree months of 2023,2024, average total deposits decreased compared to the same period in 2022,2023, reflecting the impact of increased consumer spending and quantitative tightening by the Federal Reserve.
As part of our strategic focus on growing customersReserve and meeting their financial needs, we have established a coast-to-coast network of retail branches, solution centers and ATMs that operate alongside PNC’s suite of digital capabilities.competitive pricing dynamics.
Retail Banking continues to enhance the customer experience with refinements to product and service offerings that drive value for consumers and small businesses.
1614 The PNC Financial Services Group, Inc. – Form 10-Q
Corporate & Institutional Banking
Corporate & Institutional Banking’s strategy is to be the leading relationship-based provider of traditional banking products and services to its customers through the economic cycles. We aim to grow our market share and drive higher returns by delivering value-added solutions that help our clients better run their organizations, all while maintaining prudent risk and expense management. We continue to focus on building client relationships where the risk-return profile is attractive. We are a coast-to-coast franchise and our full suite of commercial products and services are offered nationally.
Table 13: Corporate & Institutional Banking Table | | (Unaudited) | (Unaudited) | | |
| Six months ended June 30 | | | | | Change | |
| Three months ended March 31 | |
| Three months ended March 31 | |
| Three months ended March 31 | |
| Dollars in millions, except as noted | |
| Dollars in millions, except as noted | |
| Dollars in millions, except as noted | Dollars in millions, except as noted | 2023 | | 2022 | | $ | % | |
| Income Statement | Income Statement | | |
| Income Statement | |
| Income Statement | |
| Net interest income | |
| Net interest income | |
| Net interest income | Net interest income | $ | 2,795 | | | $ | 2,413 | | | $ | 382 | | 16 | % | |
| Noninterest income | Noninterest income | 1,707 | | | 1,772 | | | (65) | | (4) | % | |
| Noninterest income | |
| Noninterest income | |
| Total revenue | |
| Total revenue | |
| Total revenue | Total revenue | 4,502 | | | 4,185 | | | 317 | | 8 | % | |
| Provision for (recapture of) credit losses | Provision for (recapture of) credit losses | 181 | | | (135) | | | 316 | | * | |
| Provision for (recapture of) credit losses | |
| Provision for (recapture of) credit losses | |
| Noninterest expense | |
| Noninterest expense | |
| Noninterest expense | Noninterest expense | 1,860 | | | 1,771 | | | 89 | | 5 | % | |
| Pretax earnings | Pretax earnings | 2,461 | | | 2,549 | | | (88) | | (3) | % | |
| Pretax earnings | |
| Pretax earnings | |
| Income taxes | |
| Income taxes | |
| Income taxes | Income taxes | 575 | | | 583 | | | (8) | | (1) | % | |
| Noncontrolling interests | Noncontrolling interests | 10 | | | 7 | | | 3 | | 43 | % | |
| Noncontrolling interests | |
| Noncontrolling interests | |
| Earnings | |
| Earnings | |
| Earnings | Earnings | $ | 1,876 | | | $ | 1,959 | | | $ | (83) | | (4) | % | |
| Average Balance Sheet | Average Balance Sheet | | |
| Average Balance Sheet | |
| Average Balance Sheet | |
| Loans held for sale | |
| Loans held for sale | |
| Loans held for sale | Loans held for sale | $ | 448 | | | $ | 559 | | | $ | (111) | | (20) | % | |
| Loans | Loans | | |
| Loans | |
| Loans | |
| Commercial | |
| Commercial | |
| Commercial | Commercial | | |
| Commercial and industrial | Commercial and industrial | $ | 168,110 | | | $ | 147,819 | | | $ | 20,291 | | 14 | % | |
| Commercial and industrial | |
| Commercial and industrial | |
| Commercial real estate | |
| Commercial real estate | |
| Commercial real estate | Commercial real estate | 34,507 | | | 32,640 | | | 1,867 | | 6 | % | |
| Equipment lease financing | Equipment lease financing | 6,408 | | | 6,150 | | | 258 | | 4 | % | |
| Equipment lease financing | |
| Equipment lease financing | |
| Total commercial | |
| Total commercial | |
| Total commercial | Total commercial | 209,025 | | | 186,609 | | | 22,416 | | 12 | % | |
| Consumer | Consumer | 7 | | | 11 | | | (4) | | (36) | % | |
| Consumer | |
| Consumer | |
| Total loans | |
| Total loans | |
| Total loans | Total loans | $ | 209,032 | | | $ | 186,620 | | | $ | 22,412 | | 12 | % | |
| Total assets | Total assets | $ | 234,354 | | | $ | 210,171 | | | $ | 24,183 | | 12 | % | |
| Total assets | |
| Total assets | |
| Deposits | |
| Deposits | |
| Deposits | Deposits | | | | | |
| Noninterest-bearing | Noninterest-bearing | $ | 55,221 | | | $ | 83,589 | | | $ | (28,368) | | (34) | % | |
| Noninterest-bearing | |
| Noninterest-bearing | |
| Interest-bearing | |
| Interest-bearing | |
| Interest-bearing | Interest-bearing | 87,956 | | | 66,780 | | | 21,176 | | 32 | % | |
| Total deposits | Total deposits | $ | 143,177 | | | $ | 150,369 | | | $ | (7,192) | | (5) | % | |
| Total deposits | |
| Total deposits | |
| Performance Ratios | |
| Performance Ratios | |
| Performance Ratios | Performance Ratios | | |
| Return on average assets | Return on average assets | 1.61 | % | | 1.88 | % | | |
| Return on average assets | |
| Return on average assets | |
| Noninterest income to total revenue | |
| Noninterest income to total revenue | |
| Noninterest income to total revenue | Noninterest income to total revenue | 38 | % | | 42 | % | | |
| Efficiency | Efficiency | 41 | % | | 42 | % | | | |
| Efficiency | |
| Efficiency | |
| Other Information | |
| Other Information | |
| Other Information | Other Information | | |
| Consolidated revenue from: (a) | Consolidated revenue from: (a) | | |
| Consolidated revenue from: (a) | |
| Consolidated revenue from: (a) | |
| Treasury Management (b) | |
| Treasury Management (b) | |
| Treasury Management (b) | Treasury Management (b) | $ | 1,563 | | | $ | 1,205 | | | $ | 358 | | 30 | % | |
| Commercial mortgage banking activities: | Commercial mortgage banking activities: | | |
| Commercial mortgage banking activities: | |
| Commercial mortgage banking activities: | |
| Commercial mortgage loans held for sale (c) | |
| Commercial mortgage loans held for sale (c) | |
| Commercial mortgage loans held for sale (c) | Commercial mortgage loans held for sale (c) | $ | 40 | | | $ | 36 | | | $ | 4 | | 11 | % | |
| Commercial mortgage loan servicing income (d) | Commercial mortgage loan servicing income (d) | 83 | | | 138 | | | (55) | | (40) | % | |
| Commercial mortgage loan servicing income (d) | |
| Commercial mortgage loan servicing income (d) | |
| Commercial mortgage servicing rights valuation, net of economic hedge | |
| Commercial mortgage servicing rights valuation, net of economic hedge | |
| Commercial mortgage servicing rights valuation, net of economic hedge | Commercial mortgage servicing rights valuation, net of economic hedge | 45 | | | 46 | | | (1) | | (2) | % | |
| Total | Total | $ | 168 | | | $ | 220 | | | $ | (52) | | (24) | % | |
| Total | |
| Total | |
| Commercial mortgage servicing statistics | Commercial mortgage servicing statistics | | |
| Serviced portfolio balance (in billions) (e) | $ | 280 | | | $ | 282 | | | $ | (2) | | (1) | % | |
| Commercial mortgage servicing statistics | |
| Commercial mortgage servicing statistics | |
| Serviced portfolio balance (in billions) (e) (f) | |
| Serviced portfolio balance (in billions) (e) (f) | |
| Serviced portfolio balance (in billions) (e) (f) | |
| MSR asset value (e) | MSR asset value (e) | $ | 1,106 | | | $ | 988 | | | $ | 118 | | 12 | % | |
| Average loans by C&IB business (f) | | |
| MSR asset value (e) | |
| MSR asset value (e) | |
| Average loans by C&IB business (g) | |
| Average loans by C&IB business (g) | |
| Average loans by C&IB business (g) | |
| Corporate Banking | |
| Corporate Banking | |
| Corporate Banking | Corporate Banking | $ | 118,424 | | | $ | 99,187 | | | $ | 19,237 | | 19 | % | |
| Real Estate | Real Estate | 47,495 | | | 43,710 | | | 3,785 | | 9 | % | |
| Real Estate | |
| Real Estate | |
| Business Credit | |
| Business Credit | |
| Business Credit | Business Credit | 30,398 | | | 27,395 | | | 3,003 | | 11 | % | |
| Commercial Banking | Commercial Banking | 8,327 | | | 9,751 | | | (1,424) | | (15) | % | |
| Commercial Banking | |
| Commercial Banking | |
| Other | |
| Other | |
| Other | Other | 4,388 | | | 6,577 | | | (2,189) | | (33) | % | |
| Total average loans | Total average loans | $ | 209,032 | | | $ | 186,620 | | | $ | 22,412 | | 12 | % | |
| Total average loans | |
| Total average loans | |
| Credit-related statistics | |
| Credit-related statistics | |
| Credit-related statistics | Credit-related statistics | | |
| Nonperforming assets (e) | Nonperforming assets (e) | $ | 738 | | | $ | 674 | | | $ | 64 | | 9 | % | |
| Nonperforming assets (e) | |
| Nonperforming assets (e) | |
| Net charge-offs - loans and leases | Net charge-offs - loans and leases | $ | 178 | | | $ | 10 | | | $ | 168 | | * | |
| Net charge-offs - loans and leases | |
| Net charge-offs - loans and leases | |
*- Not Meaningful
The PNC Financial Services Group, Inc. – Form 10-Q 15
(a)See the additional revenue discussion regarding treasury management and commercial mortgage banking activities in the Product Revenue section of this Corporate & Institutional Banking section.
The PNC Financial Services Group, Inc. – Form 10-Q 17
(b)Amounts are reported in net interest income and noninterest income.
(c)Represents commercial mortgage banking income for valuations on commercial mortgage loans held for sale and related commitments, derivative valuations, origination fees, gains on sale of loans held for sale and net interest income on loans held for sale.
(d)Represents net interest income and noninterest income from loan servicing, net of reduction in commercial mortgage servicing rights due to amortization expensetime and payoffs. Commercial mortgage servicing rights valuation, net of economic hedge is shown separately.
(e)As of June 30.March 31.
(f)Represents balances related to capitalized servicing.
(g)As the result of a business realignment within C&IB during the second quarter of 2023, certain loans were reclassified from Other to Corporate Banking in the prior periodsperiod to conform to the current period presentation.
Corporate & Institutional Banking earnings in the first sixthree months of 2023 decreased $832024 increased $62 million compared to the same period in 20222023 driven by higher net interest income and a decline in noninterest expense, partially offset by a higher provision for credit losses, increased noninterest expense and lower noninterest income, partially offset by higher net interest income.losses.
Net interest income increased in the comparison primarily due to wider interest rate spreads on the value of deposits, and higher average loan balances, partially offset by narrower interest rate spreads on the value of loans and lower average loan and deposit balances.
Noninterest income decreased in the comparison drivenremained stable, as higher treasury management product revenue was largely offset by lower capital markets and advisory fees and lower commercial mortgage banking activities, partially offset by growth in treasury management product revenue.activities.
Provision for credit losses included thereflected portfolio activity and improved macroeconomic factors. impact of our updated economic outlook and changes in portfolio composition and quality.
Noninterest expense increaseddecreased in the comparison, due toreflecting a continued investments to support business growth and the impact of a higher FDIC assessment rate.focus on expense management.
Average loans increaseddecreased compared with the sixthree months ended June 30, 2022 due to increases in Corporate Banking, Real Estate and Business Credit, partially offset by a decrease in Commercial Banking:March 31, 2023:
•Corporate Banking provides lending, equipment finance, treasury management and capital markets products and services to
mid-sized and large corporations, and government and not-for-profit entities. Average loans for this business increaseddecreased driven by strong new production throughout 2022 and higherlower average utilization of loan commitments.commitments and paydowns outpacing new production, partially offset by the acquisition of capital commitment facilities from Signature Bridge Bank in the fourth quarter of 2023.
•Real Estate provides banking, financing and servicing solutions for commercial real estate clients across the country. Average loans for this business increaseddeclined largely due to paydowns outpacing new production, throughout 2022, partially offset by a lowerhigher average utilization of loan commitments.
•Business Credit provides asset-based lending and equipment financing solutions. The loan and lease portfolio is relatively high yielding, with acceptable risk as the loans are mainly secured by business assets. Average loans for this business increaseddeclined primarily driven by new production, partially offset bya lower average utilization of loan commitments.
•Commercial Banking provides lending, treasury management and capital markets related products and services to smaller corporations and businesses. Average loans for this business declined primarily driven by PPP loan forgivenesspaydowns outpacing new production and a lower average utilization of loan commitments.
The deposit strategy of Corporate & Institutional Banking is to remain disciplined on pricing and focused on growing and retaining relationship-based balances over time, executing on customer and segment-specific deposit growth strategies and continuing to provide funding and liquidity to PNC. Average total deposits decreased compared to the sixthree months ended June 30, 2022,March 31, 2023, reflecting the impact of quantitative tightening by the Federal Reserve.Reserve and competitive pricing dynamics. We continue to actively monitor the interest rate environment and make adjustments to our deposit strategy in response to evolving market conditions, bank funding needs and client relationship dynamics.
Following the BBVA acquisition in 2021 and our de novo expansion efforts, we are now a coast-to-coast franchise and have a presence in the largest 30 U.S. metropolitan statistical areas. These expanded locations complement Corporate & Institutional Banking’s existing national businesses with a significant presence in these cities, and our full suite of commercial products and services are offered nationally.
Product Revenue
In addition to credit and deposit products for commercial customers, Corporate & Institutional Banking offers other services, including treasury management, capital markets and advisory products and services and commercial mortgage banking activities, for customers of all business segments. On a consolidated basis, the revenue from these other services is included in net interest income and noninterest income, as appropriate. From a business perspective, the majority of the revenue and expense related to these services is reflected in the Corporate & Institutional Banking segment results, and the remainder is reflected in the results of other businesses where the customer relationship exists.relationships exist. The Other Information section in Table 13 includes the consolidated revenue to PNC for treasury management and commercial mortgage banking services. A discussion of the consolidated revenue from these services follows.
The Treasury Management business provides corporations with cash and investment management services, receivables and disbursement management services, funds transfer services international payment services and access to online/mobile information management and reporting services. Treasury management revenue is reported in noninterest income and net interest income. Noninterest income includes treasury management product revenue less earnings credits provided to customers on compensating
18 The PNC Financial Services Group, Inc. – Form 10-Q
deposit balances used to pay for products and services. Net interest income includes funding credit from all treasury management customer deposit balances. Compared to the first sixthree months of 2022,2023, treasury management revenue increased due to wider interest rate spreads on the value of deposits and higher product revenue.
16 The PNC Financial Services Group, Inc. – Form 10-Q
Commercial mortgage banking activities include revenue derived from commercial mortgage servicing (both net interest income and
noninterest income), revenue derived from commercial mortgage loans held for sale and hedges related to those activities. Total
revenue from commercial mortgage banking activities decreasedincreased in the comparison primarily due to lowerhigher commercial mortgage
servicing income.income, partially offset by lower revenue from commercial mortgage loans held for sale.
Capital markets and advisory includes services and activities primarily related to merger and acquisition advisory, equity capital markets advisory, asset-backed financing, loan syndication, securities underwriting and customer-related trading. The decreaseincrease in capital markets and advisory fees in the comparison was mostly driven by lowerhigher underwriting fees and merger and acquisition advisory fees, partially offset by higherlower customer-related trading revenue for derivatives, foreign exchange and fixed income.derivatives.
The PNC Financial Services Group, Inc. – Form 10-Q 1917
Asset Management Group
The Asset Management Group strives to be thea leading relationship-based provider of investment, planning, credit and cash management solutions and fiduciary services to affluent individuals and institutions by endeavoring to proactively deliver value-added ideas and solutions, and exceptional service. The Asset Management Group’s priorities are to serve our clients’ financial objectives, grow and deepen customer relationships and deliver solid financial performance with prudent risk and expense management.
Table 14: Asset Management Group Table
| | (Unaudited) | (Unaudited) | | |
| Six months ended June 30 | | | | | Change | |
| Three months ended March 31 | |
| Three months ended March 31 | |
| Three months ended March 31 | |
| Dollars in millions, except as noted | |
| Dollars in millions, except as noted | |
| Dollars in millions, except as noted | Dollars in millions, except as noted | 2023 | | 2022 | | $ | % | |
| Income Statement | Income Statement | | |
| Income Statement | |
| Income Statement | |
| Net interest income | |
| Net interest income | |
| Net interest income | Net interest income | $ | 252 | | | $ | 291 | | | $ | (39) | | (13) | % | |
| Noninterest income | Noninterest income | 458 | | | 482 | | | (24) | | (5) | % | |
| Noninterest income | |
| Noninterest income | |
| Total revenue | |
| Total revenue | |
| Total revenue | Total revenue | 710 | | | 773 | | | (63) | | (8) | % | |
| Provision for (recapture of) credit losses | Provision for (recapture of) credit losses | (1) | | | 7 | | | (8) | | * | |
| Provision for (recapture of) credit losses | |
| Provision for (recapture of) credit losses | |
| Noninterest expense | |
| Noninterest expense | |
| Noninterest expense | Noninterest expense | 560 | | | 521 | | | 39 | | 7 | % | |
| Pretax earnings | Pretax earnings | 151 | | | 245 | | | (94) | | (38) | % | |
| Pretax earnings | |
| Pretax earnings | |
| Income taxes | |
| Income taxes | |
| Income taxes | Income taxes | 36 | | | 57 | | | (21) | | (37) | % | |
| Earnings | Earnings | $ | 115 | | | $ | 188 | | | $ | (73) | | (39) | % | |
| Earnings | |
| Earnings | |
| Average Balance Sheet | |
| Average Balance Sheet | |
| Average Balance Sheet | Average Balance Sheet | | |
| Loans | Loans | | |
| Loans | |
| Loans | |
| Consumer | |
| Consumer | |
| Consumer | Consumer | | |
| Residential real estate | Residential real estate | $ | 9,517 | | | $ | 7,414 | | | $ | 2,103 | | 28 | % | |
| Residential real estate | |
| Residential real estate | |
| Other consumer | |
| Other consumer | |
| Other consumer | Other consumer | 4,110 | | | 4,587 | | | (477) | | (10) | % | |
| Total consumer | Total consumer | 13,627 | | | 12,001 | | | 1,626 | | 14 | % | |
| Total consumer | |
| Total consumer | |
| Commercial | |
| Commercial | |
| Commercial | Commercial | 1,237 | | | 1,704 | | | (467) | | (27) | % | |
| Total loans | Total loans | $ | 14,864 | | | $ | 13,705 | | | $ | 1,159 | | 8 | % | |
| Total loans | |
| Total loans | |
| Total assets | |
| Total assets | |
| Total assets | Total assets | $ | 15,282 | | | $ | 14,126 | | | $ | 1,156 | | 8 | % | |
| Deposits | Deposits | | | | | |
| Deposits | |
| Deposits | |
| Noninterest-bearing | |
| Noninterest-bearing | |
| Noninterest-bearing | Noninterest-bearing | $ | 1,817 | | | $ | 3,140 | | | $ | (1,323) | | (42) | % | |
| Interest-bearing | Interest-bearing | 25,907 | | | 29,331 | | | (3,424) | | (12) | % | |
| Interest-bearing | |
| Interest-bearing | |
| Total deposits | |
| Total deposits | |
| Total deposits | Total deposits | $ | 27,724 | | | $ | 32,471 | | | $ | (4,747) | | (15) | % | |
| Performance Ratios | Performance Ratios | | |
| Performance Ratios | |
| Performance Ratios | |
| Return on average assets | |
| Return on average assets | |
| Return on average assets | Return on average assets | 1.52 | % | | 2.68 | % | | |
| Noninterest income to total revenue | Noninterest income to total revenue | 65 | % | | 62 | % | | |
| Noninterest income to total revenue | |
| Noninterest income to total revenue | |
| Efficiency | |
| Efficiency | |
| Efficiency | Efficiency | 79 | % | | 67 | % | | | |
| Supplemental Noninterest Income Information | Supplemental Noninterest Income Information | | |
| Supplemental Noninterest Income Information | |
| Supplemental Noninterest Income Information | |
| Asset management fees | |
| Asset management fees | |
| Asset management fees | Asset management fees | $ | 446 | | | $ | 469 | | | $ | (23) | | (5) | % | |
| Brokerage fees | Brokerage fees | 4 | | | 4 | | | — | | |
| Brokerage fees | |
| Brokerage fees | |
| Total | Total | $ | 450 | | | $ | 473 | | | $ | (23) | | (5) | % | |
| Other Information | | |
| Nonperforming assets (a) | $ | 41 | | | $ | 114 | | | $ | (73) | | (64) | % | |
| Net charge-offs - loans and leases | $ | (2) | | | $ | 1 | | | $ | (3) | | * | |
| Brokerage account client assets (in billions) (a) | $ | 5 | | | $ | 4 | | | $ | 1 | | 25 | % | |
Client Assets Under Administration (in billions) (a) (b) | | |
| Total | |
| Total | |
Other Information (a) (b) | |
Other Information (a) (b) | |
Other Information (a) (b) | |
| Nonperforming assets | |
| Nonperforming assets | |
| Nonperforming assets | |
| Client Assets Under Administration (in billions) (b) (c) | |
| Client Assets Under Administration (in billions) (b) (c) | |
| Client Assets Under Administration (in billions) (b) (c) | |
| Discretionary client assets under management | Discretionary client assets under management | $ | 176 | | | $ | 167 | | | $ | 9 | | 5 | % | |
| Discretionary client assets under management | |
| Discretionary client assets under management | |
| PNC Private Bank | |
| PNC Private Bank | |
| PNC Private Bank | |
| Institutional Asset Management | |
| Institutional Asset Management | |
| Institutional Asset Management | |
| Total discretionary clients assets under management | |
| Total discretionary clients assets under management | |
| Total discretionary clients assets under management | |
| Nondiscretionary client assets under administration | |
| Nondiscretionary client assets under administration | |
| Nondiscretionary client assets under administration | Nondiscretionary client assets under administration | 168 | | | 153 | | | 15 | | 10 | % | |
| Total | Total | $ | 344 | | | $ | 320 | | | $ | 24 | | 8 | % | |
| Discretionary client assets under management | | | |
| PNC Private Bank | $ | 111 | | | $ | 103 | | | $ | 8 | | 8 | % | |
| Institutional Asset Management | 65 | | | 64 | | | 1 | | 2 | % | |
| Total | Total | $ | 176 | | | $ | 167 | | | $ | 9 | | 5 | % | |
| Total | |
*- Not Meaningful
(a)As of June 30.Net charge-offs - loans and leases were less than $0.5 million for the periods presented.
(b)As of March 31.
(c)Excludes brokerage account client assets.
The Asset Management Group consists of two primary businesses: PNC Private Bank and Institutional Asset Management.
The PNC Private Bank is focused on being a premier private bank in each of the markets it serves. This business seeks to deliver high quality banking, trust and investment management services to our emerging affluent, high net worth and ultra highultra-high net worth clients through a broad array of products and services.
20 The PNC Financial Services Group, Inc. – Form 10-Q
Institutional Asset Management provides outsourced chief investment officer, custody, cash and fixed income client solutions, and retirement plan fiduciary investment services to institutional clients, including corporations, healthcare systems, insurance companies, municipalities and non-profits.
18 The PNC Financial Services Group, Inc. – Form 10-Q
Asset Management Group earnings in the first sixthree months of 2023 decreased $732024 increased $45 million compared to the same period in 2022,2023, primarily driven by higher noninterest expense, lower net interest income, a decline in noninterest expense and a decrease in noninterest income.provision recapture.
Net interest income decreasedincreased in the comparison primarily due to a declinewider interest rate spreads on the value of deposits and an increase in average deposits as well asloan and deposit balances, partially offset by narrower interest rate spreads on the value of loans.
Noninterest income decreasedwas stable as increases in the comparison and is primarily attributable to the asset management fee impactnoninterest income from loweradvances in the average equity markets andwere offset by the impact of client activity.
Noninterest expense decreased in the comparison, reflecting a continued focus on expense management.
Average loans increased compared with the three months ended March 31, 2023, primarily driven by growth in residential mortgage loans.
Average deposits increased in the comparison reflecting continued investmentsgrowth in CD and deposit sweep balances, partially offset by the impact of quantitative tightening by the Federal Reserve and redeployment of funds to support business growth.assets under management.
Discretionary client assets under management increased in comparison to the prior year, primarily due to higher equity markets as of June 30, 2023.March 31, 2024.
RISK MANAGEMENT
The Risk Management section included in Item 7 of our 20222023 Form 10-K describes our enterprise risk management framework, including risk culture, enterprise strategy, risk governance and oversight framework, risk identification, risk assessments, risk controls and monitoring, and risk aggregation and reporting. Additionally, our 20222023 Form 10-K provides an analysis of the firm’s Capital Management and our key areas of risk, which include, but are not limited to, Credit, Market, Liquidity and Operational (including Compliance and Information Security).
Credit Risk Management
Credit risk, including our credit risk management processes, is described in further detail in the Credit Risk Management section of our 20222023 Form 10-K. The following provides additional information around our loan portfolio, which is our most significant concentration of credit risk.
Loan Portfolio Characteristics and Analysis
Table 15: Details of Loans
In billions
We use several credit quality indicators, as further detailed in Note 3 Loans and Related Allowance for Credit Losses, to monitor and measure our exposure to credit risk within our loan portfolio. The following provides additional information about the significant loan classes that comprise our Commercial and Consumer portfolio segments.
The PNC Financial Services Group, Inc. – Form 10-Q 2119
Commercial
Commercial and Industrial
Commercial and industrial loans comprised 55% and 56% of our total loan portfolio at June 30, 2023both March 31, 2024 and December 31, 2022, respectively.2023. The majority of our commercial and industrial loans are secured by collateral that provides a secondary source of repayment for a loan should a borrower experience cash generation difficulties. Examples of this collateral include short-term assets, such as accounts receivable, inventory and securities, and long-lived assets, such as equipment, owner-occupied real estate and other business assets.
We actively manage our commercial and industrial loans to assess any changes (both positive and negative) in the level of credit risk at both the borrower and portfolio level. To evaluate the level of credit risk, we assign internal risk ratings reflecting our estimates of the borrower’s PD and LGD for each related credit facility. This two-dimensional credit risk rating methodology provides granularity in the risk monitoring process and is updated on an ongoing basis through our credit risk management processes. In addition to monitoring the level of credit risk, we also monitor concentrations of credit risk pertaining to both specific industries and geographies that may exist in our portfolio. Our commercial and industrial portfolio is well-diversified across industries as shown in the following table (based on the North American Industry Classification System).
Table 16: Commercial and Industrial Loans by Industry
| | June 30, 2023 | | | December 31, 2022 | |
| March 31, 2024 | |
| Dollars in millions | |
| Dollars in millions | |
| Dollars in millions | Dollars in millions | Amount | | % of Total | | | Amount | | % of Total | |
| Commercial and industrial | Commercial and industrial | | | | |
| Commercial and industrial | |
| Commercial and industrial | |
| Manufacturing | |
| Manufacturing | |
| Manufacturing | Manufacturing | $ | 30,586 | | | 17 | % | | | $ | 30,845 | | | 17 | % | |
| Retail/wholesale trade | Retail/wholesale trade | 28,751 | | | 16 | | | | 29,176 | | | 16 | | |
| Retail/wholesale trade | |
| Retail/wholesale trade | |
| Financial services | |
| Financial services | |
| Financial services | |
| Service providers | Service providers | 22,277 | | | 13 | | | | 23,548 | | | 13 | | |
| Financial services | 21,823 | | | 12 | | | | 21,320 | | | 12 | | |
| Service providers | |
| Service providers | |
| Real estate related (a) | Real estate related (a) | 17,200 | | | 10 | | | | 17,780 | | | 10 | | |
| Real estate related (a) | |
| Real estate related (a) | |
| Health care | |
| Health care | |
| Health care | |
| Technology, media & telecommunications | Technology, media & telecommunications | 11,158 | | | 6 | | | | 11,845 | | | 7 | | |
| Health care | 10,186 | | | 6 | | | | 10,649 | | | 6 | | |
| Technology, media & telecommunications | |
| Technology, media & telecommunications | |
| Transportation and warehousing | |
| Transportation and warehousing | |
| Transportation and warehousing | Transportation and warehousing | 8,048 | | | 5 | | | | 7,858 | | | 4 | | |
| Other industries | Other industries | 27,600 | | | 15 | | | | 29,198 | | | 15 | | |
| Other industries | |
| Other industries | |
| Total commercial and industrial loans | Total commercial and industrial loans | $ | 177,629 | | | 100 | % | | | $ | 182,219 | | | 100 | % | |
| Total commercial and industrial loans | |
| Total commercial and industrial loans | |
(a) Represents loans to customers in the real estate and construction industries.
Owner occupied commercial real estate loans totaled $9.5 billion at March 31, 2024 and are included in commercial and industrial loans as the credit decisioning for servicing these loans is based on the financial conditions of the owner; not the ability of the collateral to generate income. Owner occupied commercial real estate loans are well-diversified across industries. The comparable amount of owner occupied commercial real estate loans at December 31, 2023 was $9.6 billion.
Commercial Real Estate
Commercial real estate loans comprised $22.1$20.8 billion related to commercial mortgages on income-producing properties, $7.2$8.5 billion of intermediate-term financing loans, and $6.3 billion of real estate construction project loans and $6.6 billion of intermediate-term financing loans as of June 30, 2023.March 31, 2024. Comparable amounts as of December 31, 20222023 were $22.3$21.0 billion, $8.0 billion, and $6.4 billion, and $7.6 billion, respectively. Commercial real estate primarily consists of an investment in land and/or buildings held to generate income, that income serves as the primary source for the repayment of the loan. However, for all commercial real estate assets, the disposition of the assigned collateral serves as a secondary source of repayment for the loan should the borrower experience cash generation difficulties.
We monitor credit risk associated with our commercial real estate loans similar to commercial and industrial loans by analyzing PD and LGD. Additionally, risks associated with commercial real estate loans tend to be correlated to the loan structure, collateral location and quality, project progress and business environment. These attributes are also monitored and utilized in assessing credit risk. The portfolio is geographically diverse due to the nature of our business involving clients throughout the U.S.
2220 The PNC Financial Services Group, Inc. – Form 10-Q
The following table presents our commercial real estate loans by geography and property type:
Table 17: Commercial Real Estate Loans by Geography and Property Type
| | June 30, 2023 | | | December 31, 2022 | |
| March 31, 2024 | |
| Dollars in millions | |
| Dollars in millions | |
| Dollars in millions | Dollars in millions | Amount | | % of Total | | | Amount | | % of Total | |
| Geography (a) | Geography (a) | | | | |
| Geography (a) | |
| Geography (a) | |
| California | |
| California | |
| California | California | $ | 6,190 | | | 17 | % | | | $ | 6,224 | | | 17 | % | |
| Texas | Texas | 3,686 | | | 10 | | | | 3,871 | | | 11 | | |
| Texas | |
| Texas | |
| Florida | Florida | 3,584 | | | 10 | | | | 3,275 | | | 9 | | |
| Florida | |
| Florida | |
| Virginia | |
| Virginia | |
| Virginia | |
| Pennsylvania | Pennsylvania | 1,648 | | | 5 | | | | 1,638 | | | 5 | | |
| Virginia | 1,550 | | | 4 | | | | 1,638 | | | 5 | | |
| Pennsylvania | |
| Pennsylvania | |
| Maryland | Maryland | 1,416 | | | 4 | | | | 1,496 | | | 4 | | |
| Maryland | |
| Maryland | |
| Arizona | |
| Arizona | |
| Arizona | |
| Illinois | Illinois | 1,267 | | | 4 | | | | 1,321 | | | 4 | | |
| Colorado | 1,218 | | | 3 | | | | 1,336 | | | 4 | | |
| Illinois | |
| Illinois | |
| North Carolina | |
| North Carolina | |
| North Carolina | |
| Ohio | Ohio | 1,172 | | | 3 | | | | 1,236 | | | 3 | | |
| North Carolina | 1,146 | | | 3 | | | | 1,150 | | | 3 | | |
| Ohio | |
| Ohio | |
| Other | |
| Other | |
| Other | Other | 13,051 | | | 37 | | | | 13,131 | | | 35 | | |
| Total commercial real estate loans | Total commercial real estate loans | $ | 35,928 | | | 100 | % | | | $ | 36,316 | | | 100 | % | |
| Total commercial real estate loans | |
| Total commercial real estate loans | |
| Property Type (a) | |
| Property Type (a) | |
| Property Type (a) | Property Type (a) | | | | |
| Multifamily | Multifamily | $ | 14,835 | | | 41 | % | | | $ | 13,738 | | | 38 | % | |
| Multifamily | |
| Multifamily | |
| Office | |
| Office | |
| Office | Office | 8,685 | | | 24 | | | | 9,123 | | | 25 | | |
| Industrial/warehouse | Industrial/warehouse | 3,907 | | | 11 | | | | 4,035 | | | 11 | | |
| Industrial/warehouse | |
| Industrial/warehouse | |
| Retail | |
| Retail | |
| Retail | Retail | 2,807 | | | 8 | | | | 2,855 | | | 8 | | |
| Seniors housing | Seniors housing | 1,835 | | | 5 | | | | 2,228 | | | 6 | | |
| Seniors housing | |
| Seniors housing | |
| Hotel/motel | |
| Hotel/motel | |
| Hotel/motel | Hotel/motel | 1,768 | | | 5 | | | | 1,896 | | | 5 | | |
| Mixed use | Mixed use | 266 | | | 1 | | | | 701 | | | 2 | | |
| Mixed use | |
| Mixed use | |
| Other | |
| Other | |
| Other | Other | 1,825 | | | 5 | | | | 1,740 | | | 5 | | |
| Total commercial real estate loans | Total commercial real estate loans | $ | 35,928 | | | 100 | % | | | $ | 36,316 | | | 100 | % | |
| Total commercial real estate loans | |
| Total commercial real estate loans | |
(a) Presented in descending order based on loan balances at June 30, 2023.March 31, 2024.
AsCommercial Real Estate: Office Portfolio
Given the foundational change in office demand driven by the acceptance of remote work, continues to be a feasible alternative and notable portions of leased space remain unoccupied, real estate performance related to the office sector iscontinues to be an area of continuing uncertainty. We continue to closely monitor and manage our office portfolio for elevated levels of credit risk given the ongoing shift in office demand.
At June 30, 2023,March 31, 2024, our outstanding loan balances in the office portfolio totaled $8.7$7.8 billion, or 2.7%2.4% of total loans, while additional unfunded loan commitments totaled $0.4$0.3 billion. Nonperforming loans totaled 3.3% of total office loans outstanding at June 30, 2023, while criticized loans totaled 22.5% of this portfolio. At June 30, 2023, there were no office loans outstanding that were 30 or more days delinquent. We have established reserves against these loans that we believe appropriately reflectAlso, the expected credit losses in the portfolio as of June 30, 2023.
Our office portfolio is well diversified geographically across our coast-to-coast franchise. FromWithin the office portfolio at March 31, 2024, criticized loans totaled 26.4% and nonperforming loans totaled 10.5%, while delinquencies were zero. As measured at origination, the weighted average LTV for the office portfolio was 58%; however, updated appraisals have increased the weighted average LTV to 69% as of March 31, 2024. While LTV is one consideration, our risk assessment considers a tenancy category perspective,number of factors in assessing the changing conditions affecting the portfolio. As of March 31, 2024, we have established reserves of 9.7% against office loans.
The greatest stress in our office portfolio is observed in multi-tenant office loans, which represents 57% of the portfolio at March 31, 2024. Within the multi-tenant classification, criticized levels were 45.1% while nonperforming loans totaled 18.1%, accounting for almost all of the nonperforming office population. The weighted average LTV for multi-tenant is 75% at March 31, 2024. Additionally, commercial real estate charge-offs since the beginning of 2023 have primarily been multi-tenant office loans. Given the higher level of stress, this portfolio represents multi-tenant properties at June 30, 2023, which is an area where we have noted increased stress.segment has a proportionally higher reserve rate of 14.4%. The remaining 43% of the office portfolio is primarily comprised of single-tenant, medical and government tenant properties. This subset of the portfolio is performing considerably better, with approximately 1% of the book in the criticized and medicalnonperforming loan categories. As of March 31, 2024, the weighted average LTV of this book is 59%.
Portfolio management efforts have escalated for the office tenant.portfolio, with internal risk ratings completed for each asset quarterly, accelerated reappraisal requirements and elevated approval levels for any credit action. Refreshed appraisals have updated valuations on nearly all of the criticized office exposure since the beginning of 2023. Additionally, active management efforts include ongoing performance assessments as well as the review of property, lending and capital markets. Portfolio updates are distributed to senior management weekly.
Given the ongoing change in this area, we expect additional stress in the office sector, and a portion of this stress will bear itself out as we work through maturities that will approximate 42% over the next twelve months. Upon maturity, and where the balance is not paid in full, an extension may be granted because contractual extension terms are met; alternatively, an extension may be granted based on
The PNC Financial Services Group, Inc. – Form 10-Q 21
negotiated terms, and a portion of these extensions may involve the curtailment or charge off of principal. We continue to actively manage the portfolio, and we believe reserve levels adequately reflect the expected credit losses in the portfolio.
Commercial Real Estate: Multifamily Portfolio
As of March 31, 2024, our outstanding loan balances in the multifamily portfolio totaled $16.1 billion, or 5.0% of total loans, while additional unfunded loan commitments totaled $3.8 billion. Although inflationary pressures and higher interest rates have impacted internal risk assessments and regulatory classification in this portfolio, we have not seen a notable change in loan performance at this time with regards to nonperformance, delinquency or charge-offs. We continue to closely monitor our exposure in this sector.
Consumer
Residential Real Estate
Residential real estate loans primarily consisted of residential mortgage loans at both June 30, 2023March 31, 2024 and December 31, 2022.2023.
We obtain loan attributes at origination, including FICO scores and LTVs, and we update these and other credit metrics at least quarterly. We track borrower performance monthly. We also segment the mortgage portfolio into pools based on product type (e.g., nonconforming or conforming). This information is used for internal reporting and risk management. As part of our overall risk analysis and monitoring, we also segment the portfolio based upon loan delinquency, nonperforming status, modification and bankruptcy status, FICO scores, LTV and geographic concentrations.
The PNC Financial Services Group, Inc. – Form 10-Q 23
The following table presents certain key statistics related to our residential real estate portfolio:
Table 18: Residential Real Estate Loan Statistics
| | June 30, 2023 | | | December 31, 2022 | |
| March 31, 2024 | |
| Dollars in millions | |
| Dollars in millions | |
| Dollars in millions | Dollars in millions | Amount | | % of Total | | | Amount | | % of Total | |
| Geography (a) | Geography (a) | | | | |
| Geography (a) | |
| Geography (a) | |
| California | |
| California | |
| California | California | $ | 19,281 | | | 41 | % | | | $ | 18,609 | | | 41 | % | |
| Texas | Texas | 4,112 | | | 9 | | | | 4,194 | | | 9 | | |
| Texas | |
| Texas | |
| Washington | |
| Washington | |
| Washington | |
| Florida | Florida | 3,376 | | | 7 | | | | 3,360 | | | 7 | | |
| Washington | 3,246 | | | 7 | | | | 3,009 | | | 7 | | |
| Florida | |
| Florida | |
| New Jersey | |
| New Jersey | |
| New Jersey | New Jersey | 1,905 | | | 4 | | | | 1,925 | | | 4 | | |
| New York | New York | 1,557 | | | 3 | | | | 1,558 | | | 3 | | |
| New York | |
| New York | |
| Arizona | |
| Arizona | |
| Arizona | Arizona | 1,449 | | | 3 | | | | 1,436 | | | 3 | | |
| Pennsylvania | Pennsylvania | 1,197 | | | 3 | | | | 1,188 | | | 3 | | |
| Pennsylvania | |
| Pennsylvania | |
| Colorado | |
| Colorado | |
| Colorado | Colorado | 1,193 | | | 3 | | | | 1,192 | | | 3 | | |
| North Carolina | North Carolina | 974 | | | 2 | | | | 965 | | | 2 | | |
| North Carolina | |
| North Carolina | |
| Other | |
| Other | |
| Other | Other | 8,544 | | | 18 | | | | 8,453 | | | 18 | | |
| Total residential real estate loans | Total residential real estate loans | $ | 46,834 | | | 100 | % | | | $ | 45,889 | | | 100 | % | |
| June 30, 2023 | | | December 31, 2022 | |
| Total residential real estate loans | |
| Total residential real estate loans | |
| March 31, 2024 | |
| March 31, 2024 | |
| March 31, 2024 | |
| Weighted-average loan origination statistics (b) | |
| Weighted-average loan origination statistics (b) | |
| Weighted-average loan origination statistics (b) | Weighted-average loan origination statistics (b) | | | | |
| Loan origination FICO score | Loan origination FICO score | | 771 | | | | 770 | |
| Loan origination FICO score | |
| Loan origination FICO score | |
| LTV of loan originations | LTV of loan originations | | 73 | % | | | | 71 | % | |
| LTV of loan originations | |
| LTV of loan originations | |
(a)Presented in descending order based on loan balances at June 30, 2023.March 31, 2024.
(b)Weighted-averages calculated for the twelve months ended June 30, 2023March 31, 2024 and December 31, 2022,2023, respectively.
We originate residential mortgage loans nationwide through our national mortgage business as well as within our branch network. Residential mortgage loans underwritten to agency standards, including conforming loan amount limits, are typically sold with servicing retained by us. We also originate nonconforming residential mortgage loans that do not meet agency standards, which we retain on our balance sheet. Our portfolio of originated nonconforming residential mortgage loans totaled $41.6$42.4 billion at June 30, 2023March 31, 2024, with 45%46% located in California. Comparable amounts at December 31, 20222023 were $40.6$42.4 billion and 44%45%, respectively.
Home Equity
Home equity loans comprised $20.2$20.6 billion of home equity lines of credit and $6.0$5.3 billion of closed-end home equity installment loans at June 30, 2023.March 31, 2024. Comparable amounts were $19.5$20.6 billion and $6.5$5.6 billion as of December 31, 2022,2023, respectively. Home equity lines of credit are a variable interest rate product with fixed rate conversion options available to certain borrowers.
Similar to residential real estate loans, we track borrower performance of this portfolio on a monthly basis. We also segment the population into pools based on product type (e.g., home equity loans, legacy brokered home equity loans, home equity lines of credit or legacy brokered home equity lines of credit) and track the historical performance of any related mortgage loans regardless of
22 The PNC Financial Services Group, Inc. – Form 10-Q
whether we hold such liens. This information is used for internal reporting and risk management. As part of our overall risk analysis and monitoring, we also segment the portfolio based upon loan delinquency, nonperforming status, modification and bankruptcy status, FICO scores, LTV, lien position and geographic concentration.
The credit performance of the majority of the home equity portfolio where we hold the first lien position is superior to the portion of the portfolio where we hold the second lien position but do not hold the first lien. Lien position information is generally determined at the time of origination and monitored on an ongoing basis for risk management purposes. We use a third-party service provider to obtain updated loan information, including lien and collateral data that is aggregated from public and private sources.
24 The PNC Financial Services Group, Inc. – Form 10-Q
The following table presents certain key statistics related to our home equity portfolio:
Table 19: Home Equity Loan Statistics
| | June 30, 2023 | | | December 31, 2022 | |
| March 31, 2024 | |
| Dollars in millions | |
| Dollars in millions | |
| Dollars in millions | Dollars in millions | Amount | | % of Total | | | Amount | | % of Total | |
| Geography (a) | Geography (a) | | | | |
| Geography (a) | |
| Geography (a) | |
| Pennsylvania | |
| Pennsylvania | |
| Pennsylvania | Pennsylvania | $ | 4,876 | | | 19 | % | | | $ | 5,051 | | | 19 | % | |
| New Jersey | New Jersey | 3,237 | | | 12 | | | | 3,266 | | | 13 | | |
| New Jersey | |
| New Jersey | |
| Florida | |
| Florida | |
| Florida | |
| Ohio | Ohio | 2,302 | | | 9 | | | | 2,352 | | | 9 | | |
| Florida | 2,178 | | | 8 | | | | 2,082 | | | 8 | | |
| Ohio | |
| Ohio | |
| California | California | 1,450 | | | 6 | | | | 1,247 | | | 5 | | |
| California | |
| California | |
| Texas | |
| Texas | |
| Texas | |
| Maryland | |
| Maryland | |
| Maryland | Maryland | 1,243 | | | 5 | | | | 1,254 | | | 5 | | |
| Michigan | Michigan | 1,238 | | | 5 | | | | 1,263 | | | 5 | | |
| Texas | 1,195 | | | 5 | | | | 1,144 | | | 4 | | |
| Michigan | |
| Michigan | |
| Illinois | |
| Illinois | |
| Illinois | Illinois | 1,095 | | | 4 | | | | 1,126 | | | 4 | | |
| North Carolina | North Carolina | 1,010 | | | 4 | | | | 995 | | | 4 | | |
| North Carolina | |
| North Carolina | |
| Other | |
| Other | |
| Other | Other | 6,376 | | | 23 | | | | 6,203 | | | 24 | | |
| Total home equity loans | Total home equity loans | $ | 26,200 | | | 100 | % | | | $ | 25,983 | | | 100 | % | |
| Total home equity loans | |
| Total home equity loans | |
| Lien type | |
| Lien type | |
| Lien type | Lien type | | | | |
| 1st lien | 1st lien | | 55 | % | | | | 58 | % | |
| 1st lien | |
| 1st lien | |
| 2nd lien | |
| 2nd lien | |
| 2nd lien | 2nd lien | | 45 | | | | | 42 | | |
| Total | Total | | | 100 | % | | | | | 100 | % | |
| Total | |
| Total | |
| March 31, 2024 | |
| March 31, 2024 | |
| March 31, 2024 | |
| Weighted-average loan origination statistics (b) | |
| Weighted-average loan origination statistics (b) | |
| Weighted-average loan origination statistics (b) | Weighted-average loan origination statistics (b) | June 30, 2023 | | | December 31, 2022 | |
| Loan origination FICO score | Loan origination FICO score | | 772 | | | | 774 | |
| Loan origination FICO score | |
| Loan origination FICO score | |
| LTV of loan originations | LTV of loan originations | | 66 | % | | | | 67 | % | |
| LTV of loan originations | |
| LTV of loan originations | |
(a)Presented in descending order based on loan balances at June 30, 2023.March 31, 2024.
(b)Weighted-averages calculated for the twelve months ended June 30, 2023March 31, 2024 and December 31, 2022,2023, respectively.
Automobile
Auto loans comprised $14.0$13.8 billion in the indirect auto portfolio and $1.1$1.0 billion in the direct auto portfolio as of June 30, 2023.March 31, 2024. Comparable amounts as of December 31, 20222023 were $13.7$13.8 billion and $1.1 billion, respectively. The indirect auto portfolio consists of loans originated primarily through independent franchised dealers, including from expansion intodealers located in our newer markets. This business is strategically aligned with our core retail banking business.
The following table presents certain key statistics related to our indirect and direct auto portfolios:
Table 20: Auto Loan Statistics
| | June 30, 2023 | December 31, 2022 |
| March 31, 2024 | | | March 31, 2024 | December 31, 2023 |
| Weighted-average loan origination FICO score (a) (b) | Weighted-average loan origination FICO score (a) (b) | | |
| Indirect auto | |
| Indirect auto | |
| Indirect auto | Indirect auto | 781 | 784 | 788 | 788 |
| Direct auto | Direct auto | 779 | 776 | Direct auto | 787 | 787 |
| Weighted-average term of loan originations - in months (a) | Weighted-average term of loan originations - in months (a) | | |
| Indirect auto | Indirect auto | 73 | 73 |
| Indirect auto | |
| Indirect auto | | 73 | 73 |
| Direct auto | Direct auto | 63 | 63 | Direct auto | 65 | 65 |
(a)Weighted-averages calculated for the twelve months ended June 30, 2023March 31, 2024 and December 31, 2022,2023, respectively.
(b)Calculated using the auto enhanced FICO scale.
The PNC Financial Services Group, Inc. – Form 10-Q 23
We continue to focus on borrowers with strong credit profiles as evidenced by the weighted-average loan origination FICO scores noted in Table 20. We offer both new and used auto financing to customers through our various channels. At June 30, 2023,March 31, 2024, the portfolio balance was composed of 48%43% new vehicle loans and 52%57% used vehicle loans. Comparable amounts at December 31, 20222023 were 50%45% and 50%55%, respectively.
The auto loan portfolio’s performance is measured monthly, including both updated collateral values that are obtained monthly and updated FICO scores that are obtained at least quarterly. For internal reporting and risk management, we analyze the portfolio by product channel and product type and regularly evaluate default and delinquency experience. As part of our overall risk analysis and monitoring, we segment the portfolio by geography, channel, collateral attributes and credit metrics which include FICO score, LTV and term.
The PNC Financial Services Group, Inc. – Form 10-Q 25
Nonperforming Assets and Loan Delinquencies
Nonperforming Assets
Nonperforming assets include nonperforming loans and leases, OREO and foreclosed assets. Nonperforming loans are those loans accounted for which ultimate collectability ofat amortized cost whose credit quality has deteriorated to the extent full amountcollection of contractual principal and interest is not probable and include nonperforming loans whose terms were modified as a result of a borrower’s financial difficulty and PCD loans, OREO and foreclosed assets.probable. Loans held for sale, certain government insured or guaranteed loans and loans accounted for under the fair value option are excluded from nonperforming loans. See Note 1 Accounting Policies of this Reportin our 2023 Form 10-K for details on our nonaccrual policies.
The following table presents a summary of nonperforming assets by major category:
Table 21: Nonperforming Assets by Type | | | | June 30, 2023 | December 31, 2022 | | Change | | March 31, 2024 | December 31, 2023 | | Change |
| Dollars in millions | Dollars in millions | $ | | % | Dollars in millions | $ | | % |
| Nonperforming loans (a) | | | | | |
| Nonperforming loans | | Nonperforming loans | | | | | |
| Commercial | Commercial | $ | 827 | | $ | 858 | | | $ | (31) | | | (4) | % | Commercial | $ | 1,514 | | $ | 1,307 | | | $ | | $ | 207 | | | 16 | | 16 | % |
| Consumer (b) | 1,086 | | 1,127 | | | (41) | | | (4) | % |
| Consumer (a) | | Consumer (a) | 866 | | 873 | | | (7) | | | (1) | % |
| Total nonperforming loans | Total nonperforming loans | 1,913 | | 1,985 | | | (72) | | | (4) | % | Total nonperforming loans | 2,380 | | 2,180 | 2,180 | | | 200 | | 200 | | | 9 | | 9 | % |
| OREO and foreclosed assets | OREO and foreclosed assets | 36 | | 34 | | | 2 | | | 6 | % | OREO and foreclosed assets | 35 | | 36 | 36 | | | (1) | | (1) | | | (3) | | (3) | % |
| Total nonperforming assets | Total nonperforming assets | $ | 1,949 | | $ | 2,019 | | | $ | (70) | | | (3) | % | Total nonperforming assets | $ | 2,415 | | $ | 2,216 | | | $ | | $ | 199 | | | 9 | | 9 | % |
| Nonperforming loans to total loans | Nonperforming loans to total loans | 0.59 | % | 0.61 | % | | |
| Nonperforming assets to total loans, OREO and foreclosed assets | Nonperforming assets to total loans, OREO and foreclosed assets | 0.61 | % | 0.62 | % | | |
| Nonperforming assets to total loans, OREO and foreclosed assets | |
| Nonperforming assets to total loans, OREO and foreclosed assets | |
| Nonperforming assets to total assets | |
| Nonperforming assets to total assets | |
| Nonperforming assets to total assets | Nonperforming assets to total assets | 0.35 | % | 0.36 | % | | |
| Allowance for loan and lease losses to nonperforming loans | Allowance for loan and lease losses to nonperforming loans | 248 | % | 239 | % | | | | |
| Allowance for credit losses to nonperforming loans (c) | 282 | % | 274 | % | | |
| Allowance for loan and lease losses to nonperforming loans | |
| Allowance for loan and lease losses to nonperforming loans | | 197 | % | 220 | % | | | | |
| Allowance for credit losses to nonperforming loans (b) | |
(a)In connection with the adoption of ASU 2022-02 Financial Instruments - Credit Losses (Topic 326): Troubled Debt Restructurings and Vintage Disclosures, nonperforming loans as of June 30, 2023 include certain loans where terms were modified as a result of a borrower’s financial difficulty. Prior period amounts included nonperforming TDRs, for which accounting guidance was eliminated effective January 1, 2023. See Note 1 Accounting Policies and the Loan Modifications to Borrowers Experiencing Financial Difficulty section of Note 3 Loans and Related Allowance for more information on our adoption of this ASU.
(b)Excludes most unsecured consumer loans and lines of credit, which are charged off after 120 to 180 days past due and are not placed on nonperforming status.
(c)(b)Calculated excluding allowances for investment securities and other financial assets.
Increases in nonperforming assets from December 31, 2023 were primarily driven by higher commercial real estate nonperforming loans.
The following table provides details on the change in nonperforming assets for the sixthree months ended June 30, 2023March 31, 2024 and 2022:2023:
Table 22: Change in Nonperforming Assets
| | In millions | In millions | | 2023 | | 2022 | |
| January 1 | January 1 | | $ | 2,019 | | | $ | 2,506 | | |
| January 1 | |
| January 1 | |
| | New nonperforming assets | |
| | New nonperforming assets | |
| | New nonperforming assets | New nonperforming assets | | 862 | | | 739 | | |
| Charge-offs and valuation adjustments | Charge-offs and valuation adjustments | | (257) | | | (117) | | |
| Charge-offs and valuation adjustments | |
| Charge-offs and valuation adjustments | |
| Principal activity, including paydowns and payoffs | |
| Principal activity, including paydowns and payoffs | |
| Principal activity, including paydowns and payoffs | Principal activity, including paydowns and payoffs | | (469) | | | (547) | | |
| Asset sales and transfers to loans held for sale | Asset sales and transfers to loans held for sale | | (58) | | | (27) | | |
| Asset sales and transfers to loans held for sale | |
| Asset sales and transfers to loans held for sale | |
| Returned to performing status | Returned to performing status | | (148) | | | (479) | | |
| June 30 | | $ | 1,949 | | | $ | 2,075 | | |
| Returned to performing status | |
| Returned to performing status | |
| March 31 | |
| March 31 | |
| March 31 | |
As of June 30, 2023,March 31, 2024, approximately 98%97% of total nonperforming loans were secured by collateral, which lessened reserve requirements and is expected to reduce credit losses.collateral.
24 The PNC Financial Services Group, Inc. – Form 10-Q
Loan Delinquencies
We regularly monitor the level of loan delinquencies and believe these levels are a key indicator of credit quality in our loan portfolio. Measurement of delinquency status is based on the contractual terms of each loan. Loans that are 30 days or more past due in terms of payment are considered delinquent. Loan delinquencies include government insured or guaranteed loans, loans accounted for under the fair value option and PCD loans. Amounts exclude loans held for sale.
We manage credit risk based on the risk profile of the borrower, repayment sources, underlying collateral, and other support given current events, economic conditions and expectations. We refine our practices to meet the changing environment, resulting from elevatedsuch as inflation levels, labor-related supply chain pressures, higherindustry specific risks, interest ratesrate levels, the level of consumer savings and deposit balances, and structural and secular changes fostered by the pandemic. To mitigate losses and enhance customer support, we offer loan modifications and collection programs to assist our
26 The PNC Financial Services Group, Inc. – Form 10-Q
customers. Under the CARES Act credit reporting rules, certain loans modified due to pandemic related hardships are not being reported as past due as of June 30, 2023 and December 31, 2022 based on the contractual terms of the loan, even where borrowers may not be making payments on their loans during the modification period. The CARES Act credit reporting rules expire in the third quarter of 2023.
The following table presents a summary of accruing loans past due by delinquency status:
Table 23: Accruing Loans Past Due (a)
| | | |
| | | | | Amount | | | | % of Total Loans Outstanding | |
| | | | June 30
2023 | | December 31
2022 | | Change | | June 30
2023 | | December 31
2022 | |
| Dollars in millions | Dollars in millions | | $ | | % | | |
| Dollars in millions | |
| Dollars in millions | |
| Early stage loan delinquencies | |
| Early stage loan delinquencies | |
| Early stage loan delinquencies | Early stage loan delinquencies | | | | | | | | | | | | | |
| Accruing loans past due 30 to 59 days | Accruing loans past due 30 to 59 days | | $ | 555 | | | $ | 747 | | | $ | (192) | | | (26) | % | | 0.17 | % | | 0.23 | % | |
| Accruing loans past due 30 to 59 days | |
| Accruing loans past due 30 to 59 days | |
| Accruing loans past due 60 to 89 days | |
| Accruing loans past due 60 to 89 days | |
| Accruing loans past due 60 to 89 days | Accruing loans past due 60 to 89 days | | 238 | | | 261 | | | (23) | | | (9) | % | | 0.07 | % | | 0.08 | % | |
| Total early stage loan delinquencies | Total early stage loan delinquencies | | 793 | | | 1,008 | | | (215) | | | (21) | % | | 0.25 | % | | 0.31 | % | |
| Total early stage loan delinquencies | |
| Total early stage loan delinquencies | |
| Late stage loan delinquencies | |
| Late stage loan delinquencies | |
| Late stage loan delinquencies | Late stage loan delinquencies | | |
| Accruing loans past due 90 days or more | Accruing loans past due 90 days or more | | 419 | | | 482 | | | (63) | | | (13) | % | | 0.13 | % | | 0.15 | % | |
| Accruing loans past due 90 days or more | |
| Accruing loans past due 90 days or more | |
| Total accruing loans past due | Total accruing loans past due | | $ | 1,212 | | | $ | 1,490 | | | $ | (278) | | | (19) | % | | 0.38 | % | | 0.46 | % | |
| Total accruing loans past due | |
| Total accruing loans past due | |
(a)Past due loan amounts include government insured or guaranteed loans of $0.4 billion at both June 30, 2023March 31, 2024 and December 31, 2022.2023.
The decrease in accruing loans past due from December 31, 2022 was the result of lower delinquencies in both the consumer and commercial portfolios.
Accruing loans past due 90 days or more continue to accrue interest because they are (i) well secured by collateral and are in the process of collection, (ii) managed in homogeneous portfolios with specified charge-off timeframes adhering to regulatory guidelines, or (iii) certain government insured or guaranteed loans. As such, they are excluded from nonperforming loans.
Loan Modifications
We provide relief to our customers experiencing financial hardships through a variety of solutions. Commercial loan and lease modifications are based on each individual borrower’s situation, while consumer loan modifications are evaluated under our hardship relief programs.
On January 1, 2023, we adopted ASU 2022-02 Financial Instruments - Credit Losses (Topic 326): Troubled Debt Restructurings and Vintage Disclosures, which eliminates the accounting guidance for TDRs and enhances the disclosure requirements for certain loan modifications when a borrower is experiencing financial difficulty. Refer to Note 1 Accounting Policies andSee Note 3 Loans and Related Allowance for Credit Losses for additional information on our adoption of this ASU.loan modifications to borrowers experiencing financial difficulty.
Allowance for Credit Losses
Our determination of the ACL is based on historical loss and performance experience, current economic conditions, the reasonable and supportable forecasts of future economic conditions and other relevant factors, including current borrower and/or transaction characteristics.characteristics and assessments of the remaining estimated contractual term as of the balance sheet date. We maintain the ACL at an appropriate level for expected losses on our existing investment securities, loans, equipment finance leases, other financial assets and unfunded lending related commitments and determine this allowance based on assessments of the remaining estimated contractual term as of the balance sheet date.commitments.
See Note 1 Accounting Policies and the Credit Risk Management section in our 2023 Form 10-K for additional discussion of our ACL, including details of our methodologies. Also seeSee also the Critical Accounting Estimates and Judgments section of this Report for further discussion of the assumptions used in the determination of the ACL as of June 30, 2023.March 31, 2024.
The PNC Financial Services Group, Inc. – Form 10-Q 2725
The following table summarizes our ACL related to loans:
Table 24: Allowance for Credit Losses by Loan Class (a)
| | June 30, 2023 | | December 31, 2022 | |
| | March 31, 2024 | |
Dollars in millions | |
Dollars in millions | |
Dollars in millions |
Dollars in millions | | Allowance Amount | Total Loans | % of Total Loans | | Allowance Amount | Total Loans | % of Total Loans | |
| Allowance for loans and lease losses | Allowance for loans and lease losses | | |
| Allowance for loans and lease losses | |
| Allowance for loans and lease losses | |
| Commercial | |
| Commercial | |
| Commercial | Commercial | | |
| Commercial and industrial | Commercial and industrial | | $ | 1,836 | | $ | 177,629 | | 1.03 | % | | $ | 1,957 | | $ | 182,219 | | 1.07 | % | |
| Commercial and industrial | |
| Commercial and industrial | |
| Commercial real estate | |
| Commercial real estate | |
| Commercial real estate | Commercial real estate | | 1,206 | | 35,928 | | 3.36 | % | | 1,047 | | 36,316 | | 2.88 | % | |
| Equipment lease financing | Equipment lease financing | | 100 | | 6,400 | | 1.56 | % | | 110 | | 6,514 | | 1.69 | % | |
| Equipment lease financing | |
| Equipment lease financing | |
| Total commercial | |
| Total commercial | |
| Total commercial | Total commercial | | 3,142 | | 219,957 | | 1.43 | % | | 3,114 | | 225,049 | | 1.38 | % | |
| Consumer | Consumer | | | | | |
| Consumer | |
| Consumer | |
| Residential real estate | |
| Residential real estate | |
| Residential real estate | Residential real estate | | 72 | | 46,834 | | 0.15 | % | | 92 | | 45,889 | | 0.20 | % | |
| Home equity | Home equity | | 294 | | 26,200 | | 1.12 | % | | 274 | | 25,983 | | 1.05 | % | |
| Home equity | |
| Home equity | |
| Automobile | |
| Automobile | |
| Automobile | Automobile | | 188 | | 15,065 | | 1.25 | % | | 226 | | 14,836 | | 1.52 | % | |
| Credit card | Credit card | | 765 | | 7,092 | | 10.79 | % | | 748 | | 7,069 | | 10.58 | % | |
| Credit card | |
| Credit card | |
| Education | |
| Education | |
| Education | Education | | 61 | | 2,058 | | 2.96 | % | | 63 | | 2,173 | | 2.90 | % | |
| Other consumer | Other consumer | | 215 | | 4,555 | | 4.72 | % | | 224 | | 5,026 | | 4.46 | % | |
| Other consumer | |
| Other consumer | |
| Total consumer | |
| Total consumer | |
| Total consumer | Total consumer | | 1,595 | | 101,804 | | 1.57 | % | | 1,627 | | 100,976 | | 1.61 | % | |
| Total | Total | | 4,737 | | $ | 321,761 | | 1.47 | % | | 4,741 | | $ | 326,025 | | 1.45 | % | |
| Total | |
| Total | |
| Allowance for unfunded lending related commitments | |
| Allowance for unfunded lending related commitments | |
| Allowance for unfunded lending related commitments | Allowance for unfunded lending related commitments | | 663 | | | 694 | | | |
| Allowance for credit losses | Allowance for credit losses | | $ | 5,400 | | | $ | 5,435 | | | |
| Allowance for credit losses | |
| Allowance for credit losses | |
| Allowance for credit losses to total loans | |
| Allowance for credit losses to total loans | |
| Allowance for credit losses to total loans | Allowance for credit losses to total loans | | 1.68 | % | | 1.67 | % | |
| Commercial | Commercial | | 1.68 | % | | 1.66 | % | |
| Commercial | |
| Commercial | |
| Consumer | Consumer | | 1.67 | % | | 1.69 | % | |
| Consumer | |
| Consumer | |
(a) Excludes allowances for investment securities and other financial assets, which together totaled $171$117 million and $176$120 million at June 30, 2023March 31, 2024 and December 31, 2022,2023, respectively.
2826 The PNC Financial Services Group, Inc. – Form 10-Q
The following table summarizes our loan charge-offs and recoveries:
Table 25: Loan Charge-Offs and Recoveries
| | Six months ended June 30 | | Gross
Charge-offs | | Recoveries | | Net Charge-offs /
(Recoveries) | | % of Average
Loans (Annualized) | |
| Three months ended March 31 | |
| Dollars in millions | Dollars in millions | | Gross
Charge-offs | | Recoveries | | Net Charge-offs /
(Recoveries) | | % of Average
Loans (Annualized) | |
| Dollars in millions | |
| Dollars in millions | |
| 2024 | |
| Commercial | |
| Commercial | |
| Commercial | |
| Commercial and industrial | |
| Commercial and industrial | |
| Commercial and industrial | |
| Commercial real estate | |
| Commercial real estate | |
| Commercial real estate | |
| Equipment lease financing | |
| Equipment lease financing | |
| Equipment lease financing | |
| Total commercial | |
| Total commercial | |
| Total commercial | |
| Consumer | |
| Consumer | |
| Consumer | |
| Residential real estate | |
| Residential real estate | |
| Residential real estate | |
| Home equity | |
| Home equity | |
| Home equity | |
| Automobile | |
| Automobile | |
| Automobile | |
| Credit card | |
| Credit card | |
| Credit card | |
| Education | |
| Education | |
| Education | |
| Other consumer | |
| Other consumer | |
| Other consumer | |
| Total consumer | |
| Total consumer | |
| Total consumer | |
| Total | |
| Total | |
| Total | |
| 2023 | |
| 2023 | |
| 2023 | 2023 | | |
| Commercial | Commercial | | |
| Commercial | |
| Commercial | |
| Commercial and industrial | |
| Commercial and industrial | |
| Commercial and industrial | Commercial and industrial | | $ | 149 | | | $ | 53 | | | $ | 96 | | | 0.11 | % | |
| Commercial real estate | Commercial real estate | | 99 | | | 2 | | | 97 | | | 0.54 | % | |
| Commercial real estate | |
| Commercial real estate | |
| Equipment lease financing | |
| Equipment lease financing | |
| Equipment lease financing | Equipment lease financing | | 7 | | | 6 | | | 1 | | | 0.03 | % | |
| Total commercial | Total commercial | | 255 | | | 61 | | | 194 | | | 0.17 | % | |
| Total commercial | |
| Total commercial | |
| Consumer | |
| Consumer | |
| Consumer | Consumer | | | |
| Residential real estate | Residential real estate | | 5 | | | 7 | | | (2) | | | (0.01) | % | |
| Residential real estate | |
| Residential real estate | |
| Home equity | |
| Home equity | |
| Home equity | Home equity | | 11 | | | 24 | | | (13) | | | (0.10) | % | |
| Automobile | Automobile | | 61 | | | 51 | | | 10 | | | 0.13 | % | |
| Automobile | |
| Automobile | |
| Credit card | |
| Credit card | |
| Credit card | Credit card | | 154 | | | 22 | | | 132 | | | 3.82 | % | |
| Education | Education | | 9 | | | 4 | | | 5 | | | 0.47 | % | |
| Education | |
| Education | |
| Other consumer | |
| Other consumer | |
| Other consumer | Other consumer | | 80 | | | 17 | | | 63 | | | 2.65 | % | |
| Total consumer | Total consumer | | 320 | | | 125 | | | 195 | | | 0.39 | % | |
| Total | | $ | 575 | | | $ | 186 | | | $ | 389 | | | 0.24 | % | |
| 2022 | | |
| Commercial | | |
| Commercial and industrial | | $ | 71 | | | $ | 45 | | | $ | 26 | | | 0.03 | % | |
| Commercial real estate | | 15 | | | 2 | | | 13 | | | 0.08 | % | |
| Equipment lease financing | | 3 | | | 6 | | | (3) | | | (0.10) | % | |
| Total commercial | | 89 | | | 53 | | | 36 | | | 0.04 | % | |
| Consumer | | | |
| Residential real estate | | 7 | | | 11 | | | (4) | | | (0.02) | % | |
| Home equity | | 6 | | | 39 | | | (33) | | | (0.27) | % | |
| Automobile | | 86 | | | 70 | | | 16 | | | 0.20 | % | |
| Credit card | | 135 | | | 31 | | | 104 | | | 3.24 | % | |
| Education | | 8 | | | 3 | | | 5 | | | 0.41 | % | |
| Other consumer | | 115 | | | 19 | | | 96 | | | 3.45 | % | |
| Total consumer | |
| Total consumer | Total consumer | | 357 | | | 173 | | | 184 | | | 0.39 | % | |
| Total | Total | | $ | 446 | | | $ | 226 | | | $ | 220 | | | 0.15 | % | |
| Total | |
| Total | |
Total net charge-offs increased $169$48 million, or 77%25%, for the first sixthree months of 20232024 compared to the same period in 2022.2023. The increase in the comparison was primarily attributable to higher commercial real estate net charge-offs in our commercial portfolio.charge-offs.
See Note 1 Accounting Policies in our 20222023 Form 10-K and Note 3 Loans and Related Allowance for Credit Losses of this Report for additional information.
Liquidity and Capital Management
LiquidityOur liquidity risk including our liquidityframework and related monitoring measures and tools, isincluding internal liquidity stress testing as well as compliance with internal and regulatory limits and guidelines, are described in further detail in the Liquidity and Capital Management section of our 20222023 Form 10-K.
One of the ways we monitor our liquidity is by reference to the LCR, a regulatory minimum liquidity requirement designed to ensure that covered banking organizations maintain an adequate level of liquidity to meet net liquidity needs over the course of a hypothetical 30-day stress scenario. PNC and PNC Bank calculate the LCR daily and are required to maintain a regulatory minimum of 100%. The LCR for each ofboth PNC and PNC Bank exceeded the regulatory minimum requirement throughout the secondfirst quarter of 2023.2024. Fluctuations in our average LCR result from changes to the components of the calculation, including high-quality liquid assets and net cash outflows, as a result of ongoing business activity.
The NSFR is designed to measure the stability of the maturity structure of assets and liabilities of banking organizations over a one-year time horizon. PNC and PNC Bank calculate the NSFR on an ongoing basisdaily and are required to maintain a regulatory minimum of 100%. The NSFR for each ofboth PNC and PNC Bank exceeded the regulatory minimum requirement throughout the secondfirst quarter of 2023.2024.
The PNC Financial Services Group, Inc. – Form 10-Q 2927
We provide additional information regarding regulatory liquidity requirements and their potential impact on us in the Supervision and Regulation section of Item 1 Business and Item 1A Risk Factors of our 20222023 Form 10-K.
Sources of Liquidity
Our largest source of liquidity on a consolidated basis is the customer deposit base generated by our banking businesses. These deposits provide relatively stable and low-cost funding. Total deposits decreasedincreased to $427.5$425.6 billion at June 30, 2023March 31, 2024 from $436.3$421.4 billion at December 31, 2022,2023. Noninterest-bearing deposit balances decreased driven by a decline in commercial noninterest-bearing balances. Interest-bearing deposits increased reflecting higher commercial and included a continued shift from noninterest-bearing toconsumer interest-bearing deposit products, as interest rates have risen.balances. As of June 30, 2023,March 31, 2024, uninsured deposits represented approximately 46%43% of our total deposit base.base, which is estimated based on the regulatory instructions in the Consolidated Reports of Condition and Income - FFIEC 031. The majority of our uninsured deposits are related to commercial operating and relationship accounts, which we define as commercial deposit customers who utilize two or more PNC products. See the Funding Sources portion of the Consolidated Balance Sheet Review and Business Segments Review sections of this Financial Review for additional information on our deposits and related strategies.
We may also obtain liquidity through various forms of funding, including long-term debt (senior notes, subordinated debt and FHLB borrowings) and short-term borrowings (securities sold under repurchase agreements, commercial paper and other short-term borrowings). See the Funding Sources section of the Consolidated Balance Sheet Review in this Financial Review and Note 7 Borrowed Funds included in this Report and Note 10 Borrowed Funds in our 2022 Form 10-K for additional information related to our borrowings.
Total senior and subordinated debt, on a consolidated basis, increased due to the following activity:
Table 26: Senior and Subordinated Debt
| | | | | | | | | |
| In billions | 20232024 | | |
| January 1 | $ | 23.031.7 | | | |
| Issuances | 6.22.5 | | | |
| Calls and maturities | (1.5)(1.1) | | | |
| Other | (0.1)(0.4) | | | |
| | | |
June 30March 31 | $ | 27.632.7 | | | |
Additionally, certain liquid assets and unused borrowing capacity from a number of sources are also available to manage our liquidity position. PNC has a contingency funding plan designed to ensure that liquidity sources are sufficient to meet ongoing obligations and commitments, particularly in the event of liquidity stress. This plan is designed to examine and quantify the organization’s liquidity under various internal liquidity stress scenarios and is periodically tested to assess the plan’s reliability. Additionally, the plan provides the strategies for addressing liquidity needs and responsive actions we would consider during liquidity stress events, which could include the issuance of incremental debt, preferred stock, or additional deposit actions, including the issuance of brokered CDs. The plan also addresses the governance, frequency of reporting and the responsibilities of key departments in the event of liquidity stress.
PNC defines our primary contingent liquidity sources as cash held at the Federal Reserve Bank, investment securities and unused borrowing capacity at the FHLB and Federal Reserve Bank. The following table summarizes our primary contingent liquidity from on-balance sheetsources at March 31, 2024 and off-balance sheet funding sources:December 31, 2023:
Table 27: Primary Contingent Liquidity Sources
| | Dollars in billions | June 30, 2023 | | December 31, 2022 | |
| In billions | |
| In billions | |
| In billions | |
| Cash balance with Federal Reserve Bank | |
| Cash balance with Federal Reserve Bank | |
| Cash balance with Federal Reserve Bank | Cash balance with Federal Reserve Bank | $ | 37.8 | | | $ | 26.9 | | |
| Available investment securities (a) | Available investment securities (a) | 103.1 | | 109.8 | |
| Unused borrowing capacity from FHLB and Federal Reserve Bank | 86.4 | | 67.2 | |
| Available investment securities (a) | |
| Available investment securities (a) | |
| Unused borrowing capacity from FHLB (b) | |
| Unused borrowing capacity from FHLB (b) | |
| Unused borrowing capacity from FHLB (b) | |
| Unused borrowing capacity from Federal Reserve Bank (c) | |
| Unused borrowing capacity from Federal Reserve Bank (c) | |
| Unused borrowing capacity from Federal Reserve Bank (c) | |
| Total available contingent liquidity | |
| Total available contingent liquidity | |
| Total available contingent liquidity | Total available contingent liquidity | $ | 227.3 | | | $ | 203.9 | | |
|
(a) Available investment securities representsRepresents the fair value of investment securities that are available for sale or that can be used for pledging or to secure other sources of funding.
(b)At March 31, 2024, total FHLB borrowing capacity was $74.4 billion and total FHLB borrowings were $37.0 billion. Comparable amounts at December 31, 2023 were $73.4 billion and $38.0 billion, respectively.
(c)Total borrowing capacity with the Federal Reserve Bank was $83.9 billion at March 31, 2024 and $47.2 billion at December 31, 2023. PNC had no outstanding borrowings with the Federal Reserve Bank at March 31, 2024 and December 31, 2023.
As part of PNC’s contingency planning, we prepositioned a portion of our available held to maturity investment securities at the Federal Reserve Bank’s Discount Window during the first quarter of 2024, supporting our resilience and operational readiness.
28 The PNC Financial Services Group, Inc. – Form 10-Q
Bank Liquidity
UnderIn addition to our primary contingent liquidity sources, under PNC Bank’s 2014 bank note program, as amended, PNC Bank may from time to time offer up to $40.0 billion aggregate
principal amount outstanding at any one time of its unsecured senior and subordinated notes with maturity dates more than nine months (in the case of senior notes) and five years or more (in the case of subordinated notes) from their date of issue. At June 30, 2023,March 31, 2024, PNC Bank had $7.0 billion of notes outstandingBank’s remaining capacity to issue under thisthe program of which $3.9 billion were senior notes and $3.1 billion were subordinated notes.was $33.3 billion.
Under PNC Bank’s 2013 commercial paper program, PNC Bank has the ability to offer up to $10.0 billion of its commercial paper to provide additional liquidity. At June 30, 2023,March 31, 2024, there were no issuances outstanding under this program.
Additionally, PNC Bank may also access funding from the parent company through deposits placed at the bank or through issuing itsintercompany senior unsecured notes.
Parent Company Liquidity
In addition to managing liquidity risk at the bank level, we monitormanage the parent company’s liquidity. The parent company’s contractual obligations consist primarily of debt service related to parent company borrowings and funding non-bank affiliates. Additionally, the parent company maintains liquidity to fund discretionary activities such as paying dividends to our shareholders, share repurchases and acquisitions.
30 The PNC Financial Services Group, Inc. – Form 10-Q
At June 30, 2023,March 31, 2024, available parent company liquidity totaled $17.2$21.7 billion. Parent company liquidity is held in intercompany cash and investments. For investments with longer durations, the related maturities are aligned with scheduled cash needs, such as the maturity of parent company debt obligations.
The principal source of parent company liquidity is the dividends or other capital distributions it receives from PNC Bank, which may be impacted by the following:
•Bank-level capital needs,
•Laws, regulations and the results of supervisory activities,
•Corporate policies,
•Contractual restrictions, and
•Other factors.
There are statutory and regulatory limitations on the ability of a national bank to pay dividends or make other capital distributions or to extend credit to the parent company or its non-bank subsidiaries. The amount available for dividend payments by PNC Bank to the parent company without prior regulatory approval was $5.2$5.7 billion at June 30, 2023.March 31, 2024. See Note 2019 Regulatory Matters in our 20222023 Form 10-K for further discussion of these limitations.
In addition to dividends from PNC Bank, other sources of parent company liquidity include cash and investments, as well as dividends and loan repayments from other subsidiaries and dividends or distributions from equity investments. We can also generate liquidity for the parent company and PNC’s non-bank subsidiaries through the issuance of debt and equity securities, including certain capital instruments, in public or private markets and commercial paper. Under the parent company’s 2014 commercial paper program, the parent company has the ability to offer up to $5.0 billion of commercial paper to provide additional liquidity. At June 30, 2023,March 31, 2024, there were no issuances outstanding under this program.
The following table details Parent Companyparent company note issuances in the secondfirst quarter of 2023:2024:
Table 28: Parent Company Notes Issued
| | | | | | | | |
| Issuance Date | Amount | Description of Issuance |
June 12, 2023January 22, 2024 | $1.0 billion | $1.0 billion of senior fixed-to-floating notes with a maturity date of June 12, 2026.January 21, 2028. Interest is payable semi-annually in arrears at a fixed rate of 5.812%5.300% per annum, on June 12January 21 and December 12July 21 of each year, beginning on December 12, 2023.July 21, 2024. Beginning on June 12, 2025,January 21, 2027, interest is payable quarterly in arrears at a floating rate per annum equal to Compounded SOFR (determined with respect to each quarterly interest period using the SOFR Index as described in the Prospectus Supplement), plus 1.322%1.342%, on September 12, 2025, December 12, 2025, March 12, 2026April 21, 2027, July 21, 2027, October 21, 2027 and at the maturity date. |
June 12, 2023January 22, 2024 | $2.5$1.5 billion | $2.51.5 billion of senior fixed-to-floating notes with a maturity date of June 12, 2029.January 22, 2035. Interest is payable semi-annually in arrears at a fixed rate of 5.582%5.676% per annum, on June 12January 22 and December 12July 22 of each year, beginning on December 12, 2023.July 22, 2024. Beginning on June 12, 2028,January 22, 2034, interest is payable quarterly in arrears at a floating rate per annum equal to Compounded SOFR (determined with respect to each quarterly interest period using the SOFR Index as described in the Prospectus Supplement), plus 1.841%1.902%, on September 12, 2028, December 12, 2028, March 12, 2029April 22, 2034, July 22, 2034, October 22, 2034 and at the maturity date. |
| | |
Parent company senior and subordinated debt outstandingcarrying value totaled $19.2$25.0 billion and $13.1$24.0 billion at June 30, 2023March 31, 2024 and December 31, 2022,2023, respectively.
The PNC Financial Services Group, Inc. – Form 10-Q 29
Contractual Obligations and Commitments
We have contractual obligations representing required future payments on borrowed funds, time deposits, leases, pension and postretirement benefits and purchase obligations. See the Liquidity and Capital Management portion of the Risk Management section of our 20222023 Form 10-K for more information on these future cash outflows. Additionally, in the normal course of business, we have various commitments outstanding, certain of which are not included on our Consolidated Balance Sheet. We provide information on our commitments in Note 8 Commitments.
Credit Ratings
PNC’s credit ratings affect the cost and availability of short and long-term funding, collateral requirements for certain derivative instruments and the ability to offer certain products.
In general, rating agencies base their ratings on many quantitative and qualitative factors, including capital adequacy, liquidity, asset quality, business mix, level and quality of earnings, and the current legislative and regulatory environment, including implied government support. A decrease, or potential decrease, in credit ratings could impact access to the capital markets and/or increase the cost of debt, and thereby adversely affect liquidity and financial condition. For additional information on the potential impacts from a downgrade to our credit ratings, see Item 1A Risk Factors in our 2023 Form 10-K.
The PNC Financial Services Group, Inc. – Form 10-Q 31
The following table presents credit ratings and outlook for PNC and PNC Bank as of June 30, 2023:March 31, 2024:
Table 29: Credit Ratings for PNC and PNC BankOutlook
| | | | | | | | | | | |
| June 30, 2023March 31, 2024 |
| Moody’s | Standard & Poor’s | Fitch |
PNCParent Company | | | |
| Senior debt | A3 | A- | A |
| Subordinated debt | A3 | BBB+ | A- |
| Preferred stock | Baa2 | BBB- | BBB |
| PNC Bank | | | |
| Senior debt | A2 | A | A+ |
| Subordinated debt | A3 | A- | A |
| Long-term deposits | Aa3 | A | AA- |
| Short-term deposits | P-1 | A-1 | F1+ |
| Short-term notes | P-1 | A-1 | F1 |
| PNC | | | |
| Agency rating outlook | Negative | Stable | Stable |
| | | |
| | | |
| | | |
| | | |
| | | |
| | | |
| | | |
| | | |
Capital Management
Detailed information on our capital management processes and activities is included in the Supervision and Regulation section of Item 1 of our 20222023 Form 10-K.
We manage our funding and capital positions by making adjustments to our balance sheet size and composition, issuing or redeeming debt, issuing equity or other capital instruments, executing treasury stock transactions and capital redemptions or repurchases, and managing dividend policies and retaining earnings.
In the secondfirst quarter of 2023,2024, PNC returned $0.7$0.8 billion of capital to shareholders, as a result ofreflecting more than $0.6 billion of dividends on common shares and more than $0.1 billion of common share repurchases, representing 1.10.9 million shares. Consistent with the SCB framework, which allows for capital return in amounts in excess of the SCB minimum levels, (the regulatory minimum (4.5%) plus our SCB), our Board of Directors has authorized a repurchase framework under the previously approved repurchase program of up to 100 million common shares, of which approximately 46%44% were still available for repurchase at June 30, 2023. PNC’s SCB through September 30, 2023 is 2.9%. Based on the resultsMarch 31, 2024. In light of the Federal Reserve’s 2023 annual stress test,banking agencies proposed rules to adjust the Basel III capital framework, second quarter of 2024 share repurchase activity is expected to approximate the recent quarterly average share repurchase levels. PNC continues to evaluate the potential impact of the proposed rules and may adjust share repurchase activity depending on market and economic conditions, as well as other factors. PNC’s SCB for the four-quarter period beginning October 1, 2023 will improve tois the regulatory minimum of 2.5%.
Due to the proposed rules issued by the Federal banking agencies on July 27, 2023 to adjust the Basel III capital framework, share repurchase activity is expected to be reduced in the third quarter of 2023 compared to recent prior quarters. PNC continues to evaluate and may adjust share repurchase activity, as actual amounts and timing are dependent on market and economic conditions, as well as other factors.
On JulyApril 3, 2023,2024 the PNC Board of Directors raised thedeclared a quarterly cash dividend on common stock toof $1.55 per share an increaseto be paid on May 6, 2024 to shareholders of 5 cents per share. The dividend, with a payment daterecord at the close of August 5, 2023, will be payable the next business day.
3230 The PNC Financial Services Group, Inc. – Form 10-Q
The following table summarizes our Basel III Capitalcapital balances and ratios as of June 30, 2023:ratios:
Table 30: Basel III Capital
| | June 30, 2023 |
| March 31, 2024 | | | March 31, 2024 |
| Dollars in millions | Dollars in millions | Basel III (a) | Fully Implemented
(estimated) (b) | Dollars in millions | Basel III (a) | Fully Implemented
(estimated) (b) |
| Common equity Tier 1 capital | Common equity Tier 1 capital | | |
| Common stock plus related surplus, net of treasury stock | Common stock plus related surplus, net of treasury stock | $ | (3,738) | | $ | (3,738) | |
| Common stock plus related surplus, net of treasury stock | |
| Common stock plus related surplus, net of treasury stock | |
| Retained earnings | Retained earnings | 55,829 | | 55,346 | |
| | | Goodwill, net of associated deferred tax liabilities | |
| | Goodwill, net of associated deferred tax liabilities | |
| | Goodwill, net of associated deferred tax liabilities | Goodwill, net of associated deferred tax liabilities | (10,755) | | (10,755) | |
| Other disallowed intangibles, net of deferred tax liabilities | Other disallowed intangibles, net of deferred tax liabilities | (346) | | (346) | |
| Other adjustments/(deductions) | Other adjustments/(deductions) | (89) | | (90) | |
| | Common equity Tier 1 capital (c) | Common equity Tier 1 capital (c) | $ | 40,901 | | $ | 40,417 | |
| | Common equity Tier 1 capital (c) | |
| | Common equity Tier 1 capital (c) | |
| Additional Tier 1 capital | Additional Tier 1 capital | | |
| Preferred stock plus related surplus | |
| Preferred stock plus related surplus | |
| Preferred stock plus related surplus | Preferred stock plus related surplus | 7,237 | | 7,237 | |
| | Tier 1 capital | Tier 1 capital | $ | 48,138 | | $ | 47,654 | |
| Tier 1 capital | |
| Tier 1 capital | |
| Additional Tier 2 capital | Additional Tier 2 capital | | |
| Qualifying subordinated debt | |
| Qualifying subordinated debt | |
| Qualifying subordinated debt | Qualifying subordinated debt | 3,222 | | 3,222 | |
| | Eligible credit reserves includable in Tier 2 capital | Eligible credit reserves includable in Tier 2 capital | 4,764 | | 5,241 | |
| Eligible credit reserves includable in Tier 2 capital | |
| Eligible credit reserves includable in Tier 2 capital | |
| Total Basel III capital | Total Basel III capital | $ | 56,124 | | $ | 56,117 | |
| Risk-weighted assets | Risk-weighted assets | | |
| Basel III standardized approach risk-weighted assets (d) | |
| Basel III standardized approach risk-weighted assets (d) | |
| Basel III standardized approach risk-weighted assets (d) | Basel III standardized approach risk-weighted assets (d) | $ | 429,634 | | $ | 429,826 | |
| Average quarterly adjusted total assets | Average quarterly adjusted total assets | $ | 549,471 | | $ | 548,987 | |
| Supplementary leverage exposure (e) | Supplementary leverage exposure (e) | $ | 651,342 | | $ | 651,341 | |
| Basel III risk-based capital and leverage ratios (f) | Basel III risk-based capital and leverage ratios (f) | | |
| Common equity Tier 1 | Common equity Tier 1 | 9.5 | % | 9.4 | % |
| Common equity Tier 1 | |
| Common equity Tier 1 | | 10.1 | % | 10.0 | % |
| Tier 1 | Tier 1 | 11.2 | % | 11.1 | % | Tier 1 | 11.6 | % | 11.5 | % |
| Total | Total | 13.1 | % | 13.1 | % | Total | 13.4 | % | 13.4 | % |
| Leverage (g) | Leverage (g) | 8.8 | % | 8.7 | % | Leverage (g) | 8.7 | % | 8.7 | % |
| Supplementary leverage ratio (e) | Supplementary leverage ratio (e) | 7.4 | % | 7.3 | % | Supplementary leverage ratio (e) | 7.3 | % | 7.2 | % |
(a)The ratios are calculated to reflect PNC’s election to adopt the CECL five-year transition provisions. Effective for the first quarter 2022, PNC is now in the three-year transition period and the full impact of the CECL standard is being phased-in to regulatory capital through December 31, 2024.
(b)The ratios are calculated to reflect the full impact of CECL and exclude the benefits of the optional five-year transition.
(c)As permitted, PNC and PNC Bank have elected to exclude AOCI related to both available for sale securities and pension and other post-retirement plans from CET1 capital.
(d)Basel III standardized approach risk-weighted assets are based on the Basel III standardized approach rules and include credit and market risk-weighted assets.
(e)The Supplementary leverage ratio is calculated based on Tier 1 capital divided by Supplementary leverage exposure, which takes into account the quarterly average of both on balance sheet assets as well as certain off-balance sheet items, including loan commitments and potential future exposure under derivative contracts.
(f)All ratios are calculated using the regulatory capital methodology applicable to PNC and calculated based on the standardized approach.
(g)Leverage ratio is calculated based on Tier 1 capital divided by Average quarterly adjusted total assets.
PNC’s regulatory risk-based capital ratios are calculated using the standardized approach for determining risk-weighted assets. Under the standardized approach for determining credit risk-weighted assets, exposures are generally assigned a pre-defined risk weight. Exposures to high volatility commercial real estate, nonaccruals, FDMs, past due exposures and equity exposures are generally subject to higher risk weights than other types of exposures.
The regulatory agencies have adopted a rule permitting certain banks, including PNC, to delay the estimated impact on regulatory capital stemming from implementing CECL. CECL’s estimated impact on CET1 capital, as defined by the rule, is the change in retained earnings at adoption plus or minus 25% of the change in CECL ACL at the balance sheet date, excluding the allowance for PCD loans, compared to CECL ACL at adoption. Effective for the first quarter of 2022, PNC is now in the three-year transition period, and the full impact of the CECL standard is being phased-in to regulatory capital through December 31, 2024. See additional discussion of this rule in the Supervision and Regulation section of Item 1 Business and Item 1A Risk Factors of our 20222023 Form 10-K.
At June 30, 2023,March 31, 2024, PNC and PNC Bank were considered “well capitalized” based on applicable U.S. regulatory capital ratio requirements. To qualify as “well capitalized,” PNC must have Basel III capital ratios of at least 6% for Tier 1 risk-based capital and 10% for Total risk-based capital, and PNC Bank must have Basel III capital ratios of at least 6.5% for Common equity Tier 1 risk-based capital, 8% for Tier 1 risk-based capital, 10% for Total risk-based capital and a Leverage ratio of at least 5%. For more information on the interagency proposed expanded risk-based capital rules, see the Recent Regulatory Developments section.
The PNC Financial Services Group, Inc. – Form 10-Q 3331
Federal banking regulators have stated that they expect the largest U.S. BHCs, including PNC, to have a level of regulatory capital well in excess of the regulatory minimum and have required the largest U.S. BHCs, including PNC, to have a capital buffer sufficient to withstand losses and allow them to meet the credit needs of their customers through estimated stress scenarios. We seek to manage our capital consistent with these regulatory principles, and we believe that our June 30, 2023March 31, 2024 capital levels were aligned with them.
We provide additional information regarding regulatory capital requirements and some of their potential impacts, on usincluding the proposed rules to adjust the Basel III framework, in the Supervision and Regulation section of Item 1 Business, Item 1A Risk Factors and Note 2019 Regulatory Matters in the Notes To Consolidated Financial Statements in Item 8 of our 20222023 Form 10-K.
Market Risk Management
See the Market Risk Management portion of the Risk Management Sectionsection in our 20222023 Form 10-K for additional discussion regarding market risk.
Market Risk Management – Interest Rate Risk
Interest rate risk results primarily from our traditional banking activities of gathering deposits and extending loans. Many factors, including economic and financial conditions, movements in interest rates and consumer preferences, affect the difference between the interest that we earn on assets and the interest that we pay on liabilities and the level of our noninterest-bearing funding sources. Due to the repricing term mismatches and embedded options inherent in certain of these products, changes in market interest rates not only affect expected near-term earnings, but also the economic values of these assets and liabilities.
Our Asset and Liability Management group centrally manages interest rate risk as prescribed in our market risk-related risk management policies, which are approved by management’s Asset and Liability CommitteeALCO and the Risk Committee of the Board of Directors.
PNC utilizes sensitivities of NII and EVE to a set of interest rate scenarios to identify and measure its short-term and long-term structural interest rate risks.
NII Sensitivity results and market interest rate benchmarks for the secondfirst quarters of 20232024 and 20222023 follow:
Table 31: Interest Sensitivity Analysis
| | | | | | | | | | | | | | |
| Second Quarter 2023 | | Second Quarter 2022 | |
| Net Interest Income Sensitivity Simulation | | | | |
Effect on net interest income in first year from gradual parallel interest rate change over the
following 12 months of: | | | | |
| 100 basis point increase | 0.0 | % | | 3.2 | % | |
| 100 basis point decrease | 0.0 | % | | (3.4) | % | |
Effect on net interest income in second year from gradual parallel interest rate change over the
preceding 12 months of: | | | | |
| 100 basis point increase | 1.4 | % | | 5.6 | % | |
| 100 basis point decrease | (1.6) | % | | (6.4) | % | |
| | | | |
| | | | |
| | | | |
| | | | |
| | | | |
| | | | |
In addition to measuring the effect on net interest income assuming parallel changes in current interest rates, we routinely simulate the effects of a number of nonparallel interest rate environments. Table 32 reflects the percentage change in net interest income over the next two twelve-month periods, assuming (i) the PNC Economist’s most likely rate forecast, (ii) implied market forward rates, and (iii) yield curve slope flattening (a 100 basis point yield curve slope flattening between one-month and ten-year rates superimposed on current base rates) scenario.
All changes in forecasted net interest income are relative to results in a base rate scenario where current market rates are assumed to remain unchanged over the forecast horizon.
Table 32: Net Interest Income Sensitivity
to Alternative Rate ScenariosAnalysis | | | | | | | | | | | | | | |
| First Quarter 2024 | | First Quarter 2023 | |
| Net Interest Income Sensitivity Simulation (a) | | | | |
| Effect on NII in first year from shocked interest rate: | | | | |
| 200 basis point instantaneous increase | (0.2) | % | | 2.5 | % | |
| 200 basis point instantaneous decrease | (0.2) | % | | (3.3) | % | |
| | | | |
| | | | |
| | | | |
| | | | |
| | | | |
| | | | |
| | | | |
| | | | |
| | | | |
| | | | | | | | | | | | | | |
| June 30, 2023 | |
| PNC
Economist | Market
Forward | Slope
Flattening | |
| First year sensitivity | (0.9) | % | 0.0 | % | (0.5) | % | |
| Second year sensitivity | 0.2 | % | (0.7) | % | (2.4) | % | |
When forecasting net interest income, we make certain key assumptions about interestthat can materially impact the resulting sensitivities, including the following:
Future Balance Sheet Composition: Our balance sheet composition is dynamic and based on our forecasted expectations. As of the first quarter of 2024, the projected balance sheet composition by the end of year one is generally consistent with the spot composition as of the first quarter of 2024.
Deposit Betas: Deposit pricing changes are primarily driven by changes in the Federal Funds rate, with the relationship between deposit rates and Federal Funds rate defined as deposit beta. We define cumulative deposit beta as the shapechange in deposit rate paid on interest-bearing non-maturity deposits divided by the change in the upper level of the yield curve,stated Federal Funds rate range since the volumefirst quarter of 2022, the start of the current rising rate cycle. As of March 31, 2024 PNC’s cumulative deposit beta was 45%, an increase from 35% at March 31, 2023. For interest rate risk modeling, PNC uses dynamic beta models to adjust assumed repricing sensitivity depending on market rate levels as well as other factors. The dynamic beta assumptions reflect historical experience and characteristics of new businessfuture expectations. Our scenario assumes that deposit betas increased slightly from current levels. Actual deposit rates paid may differ from modeled projections due to variables such as competition for deposits and the behavior of existing on-customer behavior.
Asset Prepayments: PNC includes prepayment assumptions for both loan and off-balance sheet positions. These assumptions determineinvestment portfolios. Mortgage and home equity portfolios utilize an industry standard model to drive estimated prepayments that increase in lower rate environments. Commercial and consumer loan portfolios assume static constant prepayment rates that are consistent across rate scenarios, as those portfolios historically do not exhibit significantly different prepayment behaviors based upon the future level of simulated net interest income in the basemarket rates.
Impact of Derivatives: PNC uses interest rate scenarioderivatives to hedge floating rate commercial loans. PNC had $36.5 billion in receive fix / pay float swaps as of March 31, 2024, with a weighted average duration of 2.0 years and the other interestan average fixed rate scenarios presentedof 2.30%. As of March 31, 2024 PNC also had collars in Tables 31place, reflecting $12.5 billion of caps and 32. These simulations assume$12.5 billion of floors, that as assets and liabilities mature, they are replaced or repriced at then-current market rates.used to hedge these
3432 The PNC Financial Services Group, Inc. – Form 10-Q
The following graph presents the SOFR curvescommercial loans. Additionally, PNC utilizes receive fix / pay float swaps as a means of hedging fixed rate debt. See Note 12 Financial Derivatives in this report for additional information on how we use derivatives to hedge commercial loans and fixed rate debt.
EVE sensitivity results for the base rate scenariofirst quarter of 2024 and each of the alternate scenarios one year forward:2023 follow:
Table 33: Alternate Interest Rate Scenarios: One Year Forward32: Economic Value of Equity Sensitivity Analysis
| | | | | | | | | | | |
| First Quarter 2024 | First Quarter 2023 | |
| Economic Value of Equity Sensitivity Simulation | | | |
| 200 basis point instantaneous increase | (5.7) | % | (4.3) | % | |
| 200 basis point instantaneous decrease | (1.6) | % | (4.9) | % | |
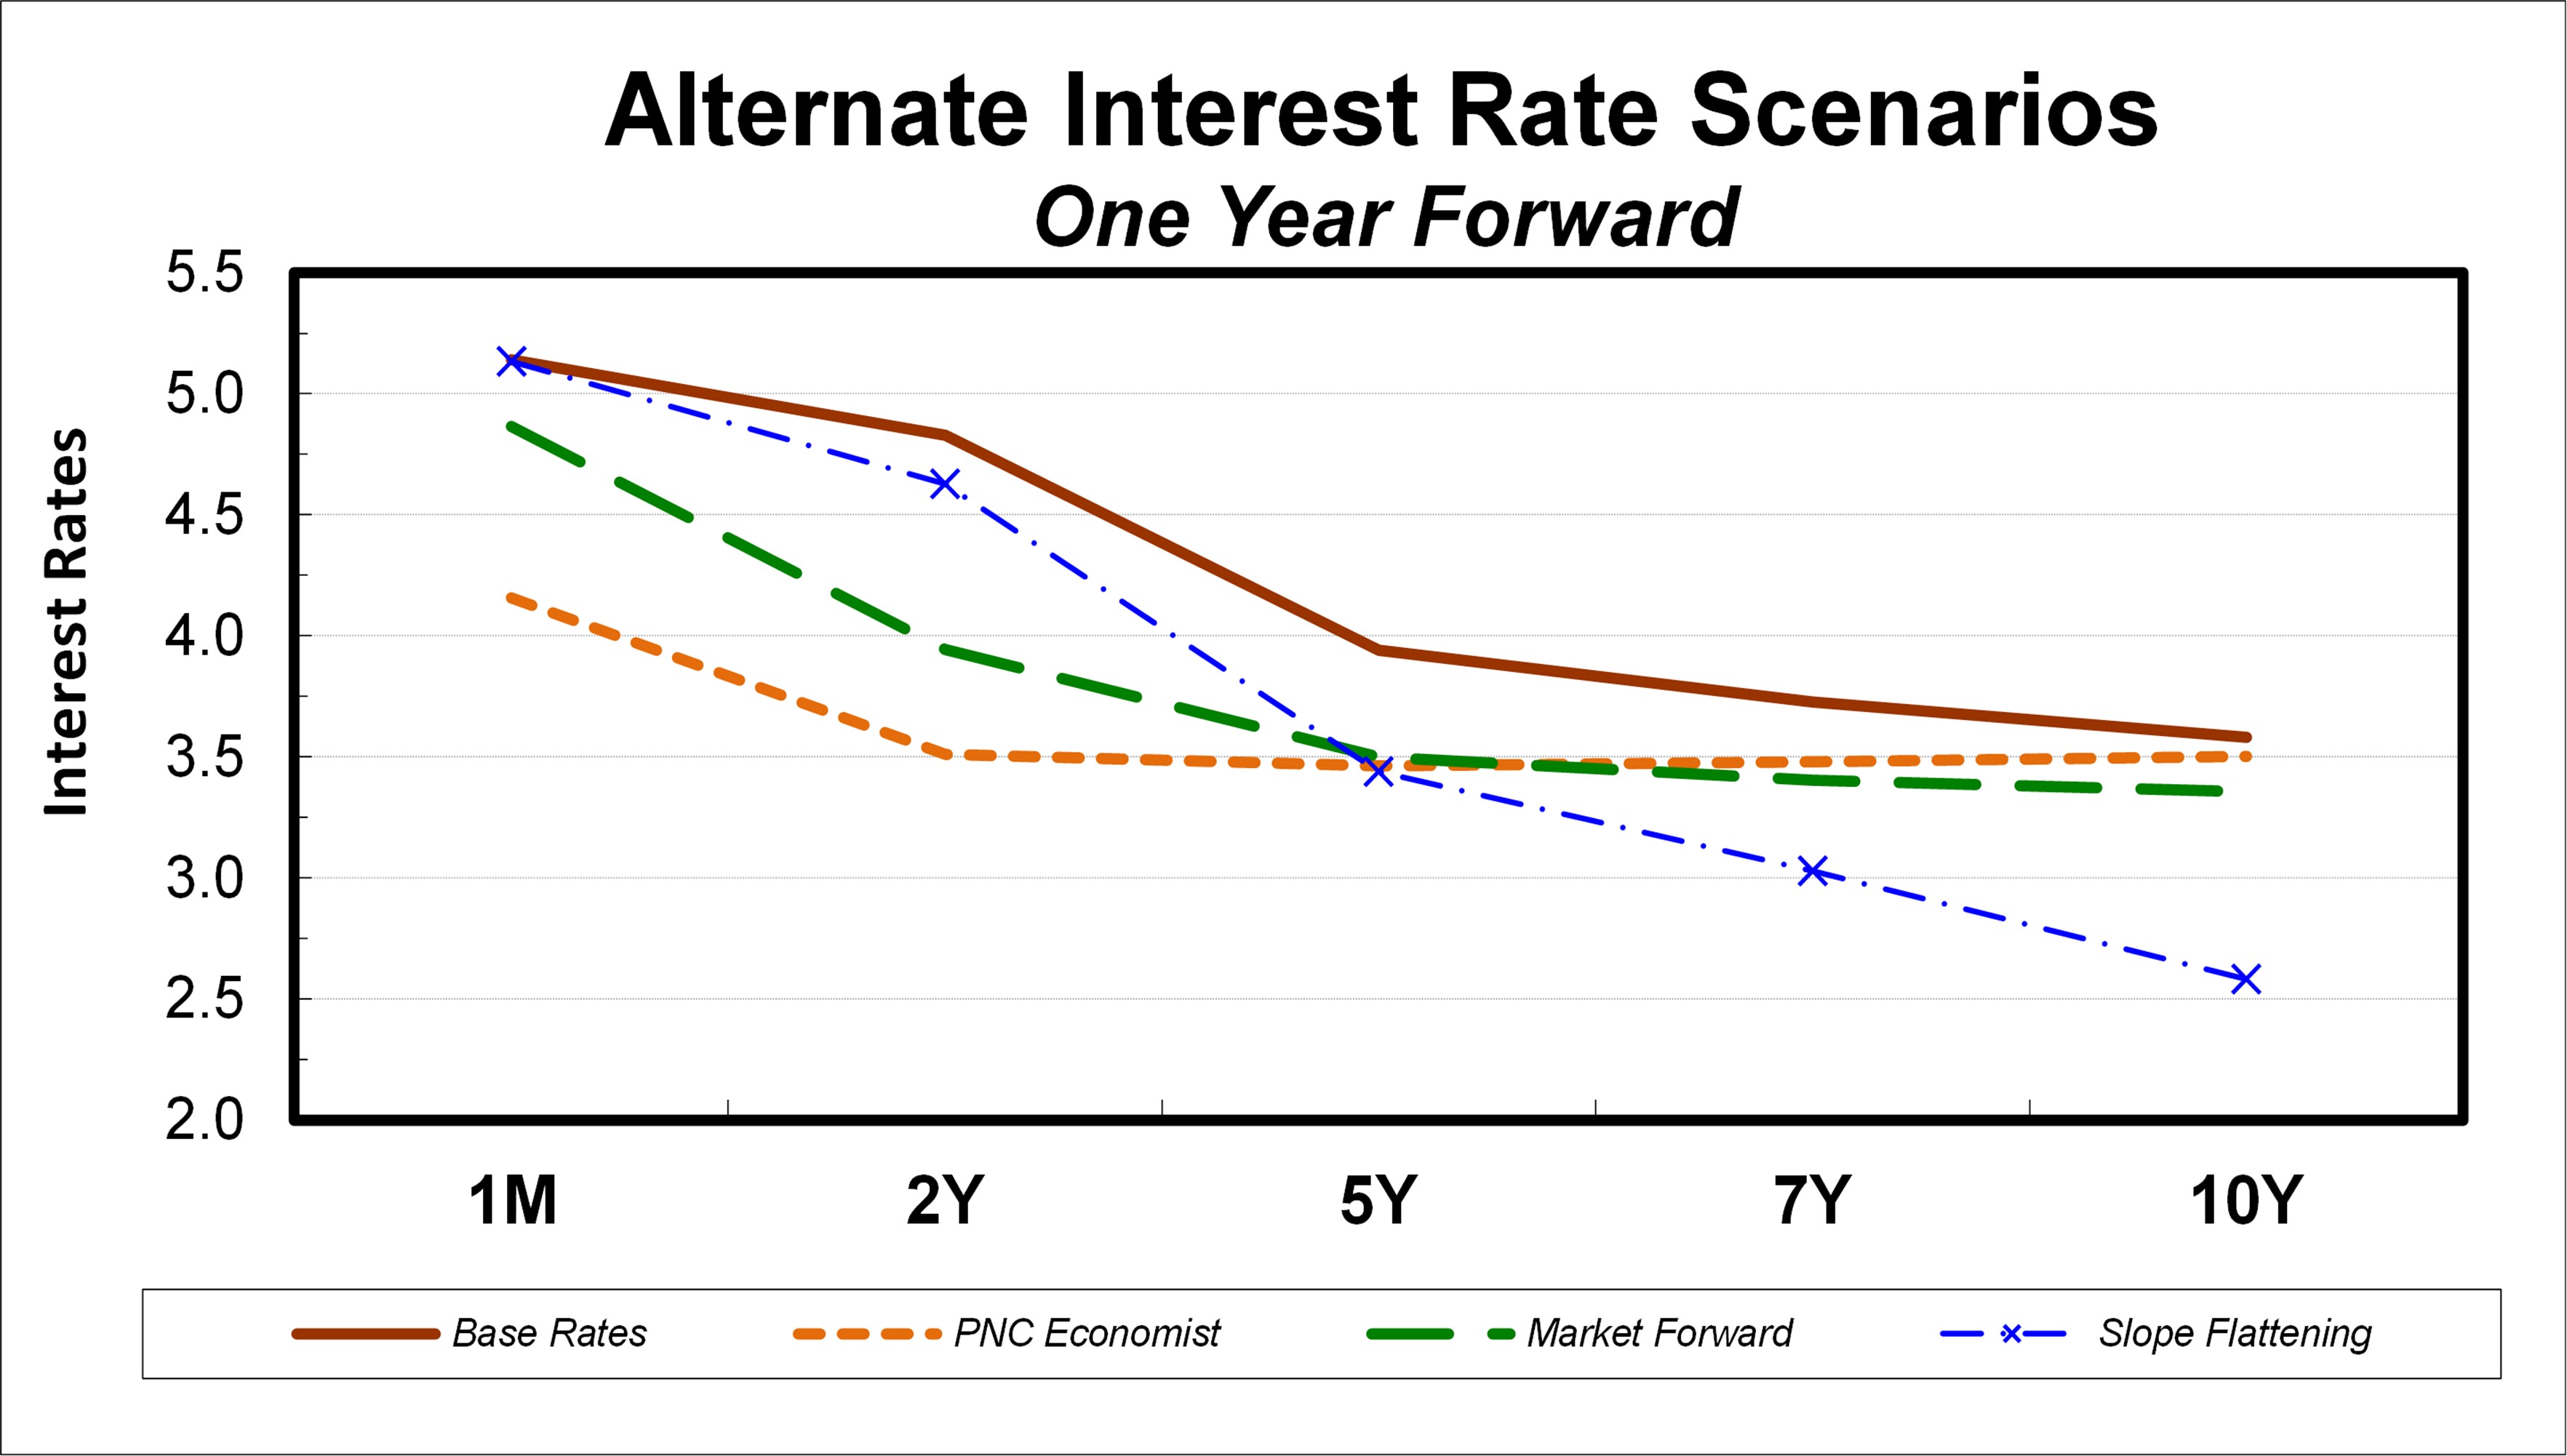
The secondCompared to the first quarter of 2023, interestthere have been no material changes to our NII sensitivity analyses indicateand EVE sensitivity assumptions, including data sources that our Consolidated Balance Sheet is positioned to benefit from an increase in interest rates over the longer term and an upward sloping interest rate yield curve. We believe that we have the deposit funding base and balance sheet flexibility to adjust, where appropriate and permissible, to changing interest rates and market conditions.drive assumptions setting.
Market Risk Management – Customer-Related Trading Risk
We engage in fixed income securities, derivatives and foreign exchange transactions to support our customers’ investing and hedging activities. These transactions, related hedges and the credit valuation adjustment related to our customer derivatives portfolio are marked-to-market daily and reported as customer-related trading activities. We do not engage in proprietary trading of these products.
We use VaR as the primary means to measure and monitor market risk in customer-related trading activities. VaR is used to estimate the probability of portfolio losses based on the statistical analysis of historical market risk factors. VaR is calculated for each of the portfolios that comprise our customer-related trading activities of which the majority are covered positions as defined by the Market Risk Rule. VaR is computed with positions and market risk factors updated daily to ensure each portfolio is operating within its acceptable limits. See the Market Risk Management – Customer-Related Trading Risk section of our 20222023 Form 10-K for more information on our models used to calculate VaR and our backtesting process.
Customer-related trading revenue was $107$16 million for the sixthree months ended June 30, 2023,March 31, 2024, compared to $198$84 million for the sixthree months ended June 30, 2022.March 31, 2023. The decrease was mainlyprimarily due to higher funding costs on the trading positions inventory and lower derivative client sales revenues, partially offset by improved foreign exchangesecurities underwriting client revenues.
Market Risk Management – Equity And Other Investment Risk
Equity investment risk is the risk of potential losses associated with investing in both private and public equity markets. In addition to extending credit, taking deposits, underwriting securities and trading financial instruments, we make and manage direct investments in a variety of transactions, including management buyouts, recapitalizations and growth financings in a variety of industries. We also have investments in affiliated and non-affiliated funds that make similar investments in private equity, consistent with regulatory limitations. The economic and/or book value of these investments and other assets are directly affected by changes in market factors.
Various PNC business units manage our equity and other investment activities. Our businesses are responsible for making investment decisions within the approved policy limits and associated guidelines.
A summary of our equity investments follows:
Table 33: Equity Investments Summary
| | | | | | | | | | | | | | | | | | | | | | | | | | |
| | March 31, 2024 | | December 31, 2023 | | Change | |
| Dollars in millions | | $ | | % | |
| Tax credit investments | $ | 4,233 | | | $ | 4,331 | | | $ | (98) | | | (2) | % | |
| Private equity and other | 4,047 | | | 3,983 | | | 64 | | | 2 | % | |
| Total | $ | 8,280 | | | $ | 8,314 | | | $ | (34) | | | — | | |
The PNC Financial Services Group, Inc. – Form 10-Q 3533
A summary of our equity investments follows:
Table 34: Equity Investments Summary
| | | | | | | | | | | | | | | | | | | | | | | | | | |
| | June 30
2023 | | December 31
2022 | | Change | |
| Dollars in millions | | $ | | % | |
| Tax credit investments | $ | 4,267 | | | $ | 4,308 | | | $ | (41) | | | (1) | % | |
| Private equity and other | 3,748 | | | 4,129 | | | (381) | | | (9) | % | |
| Total | $ | 8,015 | | | $ | 8,437 | | | $ | (422) | | | (5) | % | |
Tax Credit Investments
Included in our equity investments are direct tax credit investments and equity investments held by consolidated entities. These tax credit investment balances included unfunded commitments totaling $2.4$2.2 billion and $2.5 billion at June 30, 2023March 31, 2024 and December 31, 2022,2023, respectively. These unfunded commitments are included in Other liabilities on our Consolidated Balance Sheet.
Note 54 Loan Sale and Servicing Activities and Variable Interest Entities in our 20222023 Form 10-K has further information on tax credit investments.
Private Equity and Other
The largest component of our other equity investments is our private equity portfolio. The private equity portfolio is an illiquid portfolio consisting of mezzanine and equity investments that vary by industry, stage and type of investment. Private equity investments carried at estimated fair value totaled $1.8$2.2 billion at both June 30, 2023March 31, 2024 and December 31, 2022, respectively.2023. As of June 30, 2023, $1.6March 31, 2024, $2.0 billion was invested directly in a variety of companies and $0.2 billion was invested indirectly through various private equity funds.
Included in our other equity investments are Visa Class BB-1 common shares, which are recorded at cost. Visa Class BB-1 common shares that we own are transferable only under limited circumstances until they can be converted into shares of the publicly-traded Class A common shares, which cannot happen until the resolution of the pending interchange litigation.litigation, subject to the exchange offer described in Note 16 Subsequent Events. Based upon the June 30, 2023March 31, 2024 per share closing price of $237.48$279.08 for a Visa Class A common share, the estimated value of our total investment in the Class BB-1 common shares was approximately $1.3$1.6 billion at the current conversion rate of Visa BB-1 shares to Visa A shares, while our cost basis was insignificant. See Note 15 Fair Value and Note 21 Legal Proceedings in our 2022 Form 10-K for additional information regarding our Visa agreements. The estimated value does not represent fair value of the Visa BB-1 common shares given the shares’ limited transferability and the lack of observable transactions in the marketplace. See Note 14 Fair Value and Note 20 Legal Proceedings in our 2023 Form 10-K and Note 13 Legal Proceedings in this Report for additional information regarding our Visa agreements. See Note 16 Subsequent Events for additional details on Visa’s recently announced exchange offer for Visa Class B-1 common stock.
We also have certain other equity investments, the majority of which represent investments in affiliated and non-affiliated funds with both traditional and alternative investment strategies. Net gains (losses) related to these investments were $19$(6) million for the sixthree months ended June 30, 2023March 31, 2024 and $23$21 million for the sixthree months ended June 30, 2022.March 31, 2023.
Financial Derivatives
We use a variety of financial derivatives as part of the overall asset and liability risk management process to help manage exposure to market (primarily interest rate) and credit risk inherent in our business activities. We also enter into derivatives with customers to facilitate their risk management activities.
Financial derivatives involve, to varying degrees, market and credit risk. Derivatives represent contracts between parties that usually require little or no initial net investment and result in one party delivering cash or another type of asset to the other party based on a notional and an underlying as specified in the contract. Therefore, cash requirements and exposure to credit risk are significantly less than the notional amount on these instruments.
Further information on our financial derivatives is presented in Note 1 Accounting Policies, Note 1514 Fair Value and Note 1615 Financial Derivatives in our 20222023 Form 10-K and in Note 11 Fair Value and Note 12 Financial Derivatives in this Report.
Not all elements of market and credit risk are addressed through the use of financial derivatives, and such instruments may be ineffective for their intended purposes due to unanticipated market changes, among other reasons.
LIBOR Transition
RECENT REGULATORY DEVELOPMENTS
Federal agencies and states, including the federal agencies responsible for the Federal Acquisition Regulations, California, and most recently in March 2024, the SEC, have separately proposed or finalized rules that would require certain companies or government contractors, such as PNC or PNC Bank, to disclose significant amounts of climate-related information. This information includes qualitative and quantitative disclosures of material climate-related risks and their impact, governance and management, targets and goals, and greenhouse gas emissions. The cessation after June 30, 2023greenhouse gas emissions disclosures include the company’s direct emissions from owned or controlled sources (Scope 1) and indirect emissions from the company’s consumption of energy purchased from third parties (Scope 2), and in the case of the requirement that banks submit ratesFederal Acquisition Regulations proposal for a “major contractor” and California laws, disclosures related to indirect emissions from upstream and downstream activities in the calculationcompany’s value chain (Scope 3). If and when all the rules are finalized, PNC and PNC Bank may face potentially differing standards from the agencies or California. Numerous lawsuits have challenged the SEC and California rules, and on April 4, 2024, the SEC voluntarily stayed implementation of LIBOR presents risks toits final rules pending resolution of the financial instruments originated, held or serviced by PNC that use LIBOR as a reference rate. For more discussion regardinglawsuits challenging the transition from LIBOR, see Item 1 Risk Factors and the Risk Management section in Item 7 of our 2022 Form 10-K.SEC rules.
As previously announced, PNC’s Series O, Series R and Series S preferred stock will transition to three-month CME Term SOFR plus a tenor spread adjustment of 0.26161% per annum (“Adjusted three-month CME Term SOFR”) as the replacement reference rate. Adjusted three-month CME Term SOFR will be used with respect to applicable floating-rate dividend periods with dividend
3634 The PNC Financial Services Group, Inc. – Form 10-Q
determination dates occurring after June 30, 2023. The calculation of interest on the junior subordinated debentures issued by The PNC Financial Services Group, Inc. and owned by PNC Capital Trust C, a wholly-owned finance subsidiary of The PNC Financial Services Group, Inc., as well as the calculation of distributions on the trust preferred securities issued by PNC Capital Trust C will transition to a replacement reference rate of Adjusted three-month CME Term SOFR for interest or distribution periods, as applicable, with determination dates occurring after June 30, 2023. Further, two series of debt securities issued by a predecessor banking subsidiary, National City Bank, will also transition the calculation of interest. The National City Bank Notes due April 1, 2043 will use Adjusted three-month CME Term SOFR as the replacement reference rate for interest periods with determination dates occurring after June 30, 2023. The National City Bank Notes due April 1, 2037 will use one-month CME Term SOFR plus a tenor spread adjustment of 0.11448% per annum as the replacement reference rate with respect to interest periods with determination dates occurring after June 30, 2023.
As of June 30, 2023, PNC had approximately $32.1 billion in loans and securities and $347.8 billion notional value in derivatives tied to LIBOR. The vast majority of PNC’s LIBOR exposures have already transitioned or will transition to a non-LIBOR rate on their next reset date. As previously anticipated, a small subset of these exposures will leverage the Adjustable Interest Rate LIBOR Act for its intended purpose to address difficult exposures when necessary or will transition to “synthetic LIBOR,” a substitute version of LIBOR to be published through the end of September 2024 and calculated under an alternative methodology based on CME Term SOFR plus the applicable tenor spread adjustment.
RECENT REGULATORY DEVELOPMENTS
Bank Failures and Resolutions
Following the bank failures in March 2023 of Silicon Valley Bank, Santa Clara, California, and Signature Bank, New York, New York, and after recommendations by the boards of the FDIC and Federal Reserve and a determination by the Secretary of the Treasury in consultation with the President, the FDIC invoked the systemic risk exception to certain resolution-related and Deposit Insurance Fund restrictions in order to fully protect all depositors of both institutions, including uninsured deposits. The FDIC currently estimates the cost of protecting the uninsured depositors to the Deposit Insurance Fund at approximately $15.8 billion. By law, any losses to the Deposit Insurance Fund to support uninsured depositors under the systemic risk exception must be recovered by one or more special assessments on insured depository institutions or depository institution holding companies, or both. In May 2023, the FDIC proposed a rule to implement the special assessment. Under the proposal, the FDIC would collect from PNC, along with other BHCs and insured depository institutions, special assessments at an annual rate of 12.5 basis points of PNC’s uninsured deposits reported as of December 31, 2022 (adjusted to exclude the first $5 billion), over eight quarterly assessment periods, beginning after the first quarter 2024. See Note 16 Regulatory Matters for additional information.
Capital, Capital Planning, and Liquidity
In June 2023, the Federal Reserve announced the results of its supervisory stress tests conducted as part of the 2023 CCAR process. PNC remained well above its risk-based minimum capital requirements in the supervisory stress tests, and PNC’s SCB for the four-quarter period beginning October 1, 2023, will improve to the regulatory minimum of 2.5%. See the Liquidity and Capital Management portion of the Risk Management section in this Financial Review for a discussion of PNC’s capital actions.
Proposed Expanded Risk-Based Capital Rules
On July 27, 2023, the Federal Reserve, OCC, and FDIC proposed for public comment an interagency rule to implement the final components of the Basel III framework that would significantly revise the capital requirements for large banking organizations, including PNC and PNC Bank. In general, the proposed rule would align the regulatory capital elements and required deductions for Category III banking organizations such as PNC and PNC Bank with those currently applicable to Category I and II banking organizations and apply a new expanded risk-based approach which leverages the Basel rules, including the calculation of risk-weighted assets (the “expanded risk-based approach”) in addition to the current U.S. standardized approach. Our review of the proposal is ongoing. Among other impacts, PNC and PNC Bank would be required to recognize most elements of AOCI in regulatory capital and deduct from CET1 capital, among other items, mortgage servicing assets and deferred tax assets that individually exceed 10 percent of CET1 capital or in the aggregate with other threshold items that exceed 15 percent of CET1 capital. The new expanded risk-based approach to calculating risk-weighted assets would apply more granular and standardized risk-weighting methodologies for credit, operational, market, equity and credit valuation adjustment risks. PNC and PNC Bank would be required to calculate their risk-based capital ratios under the existing standardized approach and the expanded risk-based approach and would be subject to the lower of the two resulting ratios for their risk-based capital minimums and buffer requirements, including the SCB. Based on our initial review of the proposal, we expect the proposal, if finalized in its current form, would result in lower pro forma capital ratios for PNC and PNC Bank that would remain above current minimum capital and buffer requirements. The proposal indicates the effective date of the final rule would be July 1, 2025, with certain provisions—including the recognition of AOCI elements in regulatory capital and the increase in risk-weighted assets due to the expanded risk-based approach—having a three-year phase-in period. Comments on the proposal are due by November 30, 2023.
The PNC Financial Services Group, Inc. – Form 10-Q 37
CRITICAL ACCOUNTING ESTIMATES AND JUDGMENTS
Our consolidated financial statements are prepared by applying certain accounting policies. Note 1 Accounting Policies in our 20222023 Form 10-K describes the most significant accounting policies that we use. Certain of these policies require us to make estimates or economic assumptions that may vary under different assumptions or conditions, and such variations may significantly affect our reported results and financial position for the period or in future periods. The policies and judgments related to residential and commercial MSRs and Level 3 fair value measurements are described in Critical Accounting Estimates and Judgments in our 20222023 Form 10-K. The following details the critical estimates and judgments around the ACL.
Allowance for Credit Losses
We maintain the ACL at levels that we believe to be appropriate as of the balance sheet date to absorb expected credit losses on our existing investment securities, loans, equipment finance leases, other financial assets and unfunded lending related commitments, for the remaining estimated contractual term of the assets or exposures, taking into consideration expected prepayments and estimated recoveries. Our determination of the ACL is based on historical loss and performance experience, as well as current borrower and transaction characteristics including collateral type and quality, current economic conditions, reasonable and supportable forecasts of future economic conditions and other relevant factors. We use methods sensitive to changes in economic conditions to interpret these factors and to estimate expected credit losses. We evaluate and, when appropriate, enhance the quality of our data and models and other methods used to estimate the ACL on an ongoing basis. We incorporate qualitative factors in the ACL that reflect our best estimate of expected losses that may not be adequately represented in our quantitative methods or economic assumptions. The major drivers of ACL estimates include, but are not limited to:
•Current economic conditions: Our forecast of expected losses depends on economic conditions as of the estimation date. As current economic conditions evolve, forecasted losses could be materially affected.
•Scenario weights and design: Our loss estimates are sensitive to the shape, direction and rate of change of macroeconomic forecasts and thus vary significantly between upside and downside scenarios. Changes to the probability weights assigned to these scenarios and the timing of peak business cycles reflected by the scenarios could materially affect our loss estimates.
•Current borrower quality: Our forecast of expected losses depends on current borrower and transaction characteristics, including credit metrics and collateral type/quality. As borrower quality evolves, forecasted losses could be materially affected.
•Portfolio volume and mix:composition: Changes to portfolio volume and mix could materially affect our estimates, as CECL reserves
would be recognized upon origination or acquisition and derecognized upon paydown, maturity or sale.
For all assets and unfunded lending related commitments within the scope of the CECL standard, the applicable ACL is composed of one or a combination of the following components: (i) collectively assessed or pooled reserves, (ii) individually assessed reserves, and
(iii) qualitative (judgmental) reserves. Our methodologies and key assumptions for each of these components are discussed in Note 1
Accounting Policies.Policies in our 2023 Form 10-K.
Reasonable and Supportable Economic Forecast
UnderPursuant to the CECL standard, we are required to consider reasonable and supportable forecasts in estimating expected credit losses. For this purpose, we have established a framework that includes a three-year forecast period and the use of four economic scenarios with associated probability weights, which in combination create a forecast of expected economic outcomes. Credit losses estimated in our reasonable and supportable forecast period are sensitive to the shape and severity of the scenarios used and weights assigned to them.
To forecast the distribution of economic outcomes over the reasonable and supportable forecast period, we generate the four economic forecast scenarios we useusing a combination of quantitative macroeconomic models, other measures of economic activity and forward-looking expert judgment to forecast the distribution of economic outcomes over the reasonable and supportable forecast period.judgment. Each scenario is then given an associated probability (weight) to represent our current expectation within that distribution over the forecast period. This process is informed by current economic conditions, expected business cycle evolution and the expert judgment of PNC’s RAC. This approach seeks to provide a reasonable representation of the forecast of expected economic outcomes and is used to estimate expected credit losses across a variety of loans, securities and securities.other financial assets. Each quarter, the scenarios and their respective weights are presented to RAC for approval, and the committee also approves CECL scenarios’ weights for use for the current reporting period.approval.
The scenarios used for the period ended June 30, 2023 reflect a slight increase in downside risk compared to DecemberMarch 31, 2022.The current outlook considers,2024 consider, among other factors, the ongoing inflationary pressures and the corresponding tighteningtightness of monetary policy and credit availability. OurWhile recession risks remain elevated, our most-likely expectation at June 30, 2023March 31, 2024 is that the U.S. economy will be impacted bynarrowly avoids a mild recession starting in late 2023 or early 2024.
We used a number of economic variables in our scenarios, with two of the most significant drivers being real GDP and the U.S. unemployment rate. The following table presents a comparison of these two economic variables based on the weighted-average scenario forecasts used in determining our ACL at June 30, 2023March 31, 2024 and December 31, 2022.2023.
38The PNC Financial Services Group, Inc. – Form 10-Q
Table 35:34: Key Macroeconomic Variables in CECL Weighted-Average Scenarios
| | Assumptions as of June 30, 2023 |
| 2023 | 2024 | 2025 |
| Assumptions as of March 31, 2024 | | | Assumptions as of March 31, 2024 |
| 2024 | | | 2024 | 2025 | 2026 |
| U.S. real GDP (a) | U.S. real GDP (a) | 0.9% | (0.1)% | 1.9% | U.S. real GDP (a) | 0.8% | 1.7% | 2.1% |
| U.S. unemployment rate (b) | U.S. unemployment rate (b) | 4.0% | 4.9% | 4.5% | U.S. unemployment rate (b) | 4.6% | 4.8% | 4.3% |
| Assumptions as of December 31, 2022 |
| 2023 | 2024 | 2025 |
| Assumptions as of December 31, 2023 | | | Assumptions as of December 31, 2023 |
| 2024 | | | 2024 | 2025 | 2026 |
| U.S. real GDP (a) | U.S. real GDP (a) | (0.4)% | 1.4% | 1.9% | U.S. real GDP (a) | 0.1% | 1.5% | 2.0% |
| U.S. unemployment rate (b) | U.S. unemployment rate (b) | 4.9% | 4.4% | U.S. unemployment rate (b) | 4.5% | 4.6% | 4.2% |
(a)Represents year-over-year growth (loss) rates.
(b)Represents quarterly average rate at December 31, 2023, 2024, 2025 and 2025,2026, respectively.
Real GDP growth is expected to end 20232024 at 0.9%0.8% on a weighted average basis, up from the (0.4%)0.1% assumed at December 31, 20222023, primarily due to stronger expected economic activity in 2024 than what was expected at the startend of 2023. Growth then dropsrises to (0.1)%1.7% in 2024,2025, before jumpinggrowing to 1.9%2.1% in 2025. In line with stronger-than-anticipated job growth at the start of 2023, the2026. The weighted-average projection of the unemployment rate is expected to end 20232024 at 4.0%4.6%, downup slightly from the 4.9%4.5% assumed at December 31, 2022. In line with2023. During the slowing in overall economic activity,second half of 2025, the weighted-average unemployment rate is expectedincreases to increase through the enda peak of 2023 and 2024, reaching 4.9% by year-end 2024, and5.0% before gradually improving to 4.5%4.8% by the fourth quarter of 2025. Further improvement is then expected in 2026 with the rate reaching 4.3% by the fourth quarter of 2026.
The current state of the economy reflects an environment with receding pandemic-related risks and labor-related supply chain pressures. However, heightenedcontinues to reflect uncertainty remains due to structural and secular changes fostered by the pandemic for certain sectorsfoundational change in office demand from the acceptance of the economyremote work, combined with inflationinflationary pressures, interest rate movements, and rising interest rates.declining consumer savings and deposit balances. As such, for both our commercial and consumer loan portfolios, PNC identified and performed significant analysisanalyses around segments impacted by such uncertainties to ensure our reserves are adequate, given our current macroeconomic expectations.
We believe the economic scenarios effectively reflect the distribution of potential economic outcomes. Additionally, through in-depth and granular analysis we have addressed reserve requirements for the specific populations most affected in the current environment. Through this approach, we believe the reserve levels appropriately reflect the expected credit losses in the portfolio as of the balance sheet date.
See the following for additional details on the components ofinformation related to our ACL:
•Allowance Forfor Credit Losses in the Credit Risk Management section of this Financial Review, and
•Note 2 Investment Securities, and Note 3 Loans and Related Allowance for Credit Losses in this Report.Report, and
•Note 1 Accounting Policies in our 2023 Form 10-K.
The PNC Financial Services Group, Inc. – Form 10-Q
39
Recently Issued Accounting Standards
| | | | | | | | |
| Accounting Standards Update | Description | Financial Statement Impact |
Accounting for Investments in Tax Credit Structures Using the Proportional Amortization Method–Improvements to Reportable Segment Disclosures - ASU 2023-022023-07
Issued MarchNovember 2023
| • Required with issuance of 2024 Form 10-K; early adoption is permitted. • Requires that a public entity disclose significant segment expenses that are regularly provided to the chief operating decision maker (CODM) and included within each reported measure of segment profit or loss. • Requires that a public entity disclose an amount for other segment items by reportable segment and a description of its composition. • Requires that a public entity provide all annual disclosures about a reportable segment’s profit or loss and assets currently required by ASC 280 in interim periods. • Clarifies that if the CODM uses more than one measure of a segment’s profit or loss in assessing segment performance and deciding how to allocate resources, a public entity may report one or more of those additional measures of segment profit. • Requires that a public entity disclose the title and position of the CODM and an explanation of how the CODM uses the reported measure(s) of segment profit or loss in assessing segment performance and deciding how to allocate resources. • Requires a retrospective transition approach for all prior periods presented in the financial statements. | • We are currently evaluating the disclosure requirements within this ASU and do not plan to early adopt. • This ASU will not impact our Consolidated Income Statement, Consolidated Statement of Comprehensive Income, Consolidated Balance Sheet, Consolidated Statement of Changes in Equity, or Consolidated Statement of Cash Flows. • We expect to provide enhanced disclosures of significant segment level noninterest expenses as a result of this ASU.
|
| Accounting Standards Update | Description | Financial Statement Impact |
Improvements to Income Tax Disclosures - ASU 2023-09
Issued December 2023 | • Required effective date of January 1, 2024;2025; early adoption is permitted. • The amendments in this Update must be applied on either a modified retrospective or a retrospective basis.
• The amendments in this Update permit reportingRequires public business entities to, elect to accounton an annual basis, (1) disclose specific categories in the rate reconciliation and (2) provide additional information for their tax equity investments, regardless of the tax credit program from which the income tax credits are received, using the proportional amortization method if certain conditions are met.reconciling items that meet a quantitative threshold. • A reporting entity makesRequires that all entities disclose, on an accounting policy electionannual basis, (1) the amount of income taxes paid (net of refunds received), disaggregated by federal (national), state and foreign taxes, and (2) the amount of income taxes paid (net of refunds received), disaggregated by individual jurisdictions in which income taxes paid (net of refunds received) is equal to apply the proportional amortization method onor greater than 5 percent of total income taxes paid (net of refunds received). • Requires a tax-credit-program-by-tax-credit-program basis rather than electing to apply the proportional amortization method at the reporting entity level or to individual investments.prospective transition approach, with an optional retrospective transition approach. | • We are currently evaluating the disclosure requirements within this ASU. • This ASU will not impact our Consolidated Income Statement, Consolidated Statement of Comprehensive Income, Consolidated Balance Sheet, Consolidated Statement of Changes in Equity, or Consolidated Statement of Cash Flows. • We expect to provide additional disaggregated income tax disclosures in accordance with this ASU. • We are evaluating when to adopt the amendments in ASU 2023-02 and the impact of the ASU on our consolidated results of operations and our consolidated financial position.this ASU. |
Recently Adopted Accounting Pronouncements
See Note 1 Accounting Policies regarding the impact ofin our 2023 Form 10-K for recently adopted accounting standards. We did not adopt any new accounting pronouncementsstandards during the first quarter of 2024 that we have adopted.impacted our financial statements.
INTERNAL CONTROLS AND DISCLOSURE CONTROLS AND PROCEDURES
As of June 30, 2023,March 31, 2024, we performed an evaluation under the supervision of and with the participation of our management, including the Chairman President and Chief Executive Officer and the Executive Vice President and Chief Financial Officer, of the effectiveness of the design and operation of our disclosure controls and procedures and of changes in our internal control over financial reporting.
Based on that evaluation, our Chairman President and Chief Executive Officer and our Executive Vice President and Chief Financial Officer concluded that our disclosure controls and procedures (as defined in Rule 13a-15(e) under the Securities Exchange Act of 1934) were effective as of June 30, 2023,March 31, 2024, and that there has been no change in PNC’s internal control over financial reporting that occurred
The PNC Financial Services Group, Inc. – Form 10-Q 37
during the secondfirst quarter of 20232024 that has materially affected, or is reasonably likely to materially affect, our internal control over financial reporting.
CAUTIONARY STATEMENT REGARDING FORWARD-LOOKING INFORMATION
We make statements in this Report, and we may from time to time make other statements, regarding our outlook for financial performance, such as earnings, revenues, expenses, tax rates, capital and liquidity levels and ratios, asset levels, asset quality, financial position, and other matters regarding or affecting us and our future business and operations, including our sustainability strategy, that are forward-looking statements within the meaning of the Private Securities Litigation Reform Act. Forward-looking statements are typically identified by words such as “believe,” “plan,” “expect,” “anticipate,” “see,” “look,” “intend,” “outlook,” “project,” “forecast,” “estimate,” “goal,” “will,” “should” and other similar words and expressions.
Forward-looking statements are necessarily subject to numerous assumptions, risks and uncertainties, which change over time. Future events or circumstances may change our outlook and may also affect the nature of the assumptions, risks and uncertainties to which our forward-looking statements are subject. Forward-looking statements speak only as of the date made. We do not assume any duty and do not undertake any obligation to update forward-looking statements. Actual results or future events could differ, possibly materially, from those anticipated in forward-looking statements, as well as from historical performance. As a result, we caution against placing undue reliance on any forward-looking statements.
Our forward-looking statements are subject to the following principal risks and uncertainties.
•Our businesses, financial results and balance sheet values are affected by business and economic conditions, including:
–Changes in interest rates and valuations in debt, equity and other financial markets,
40 The PNC Financial Services Group, Inc. – Form 10-Q
–Disruptions in the U.S. and global financial markets,
–Actions by the Federal Reserve Board, U.S. Treasury and other government agencies, including those that impact money supply, market interest rates and inflation,
–Changes in customer behavior due to changing business and economic conditions or legislative or regulatory initiatives,
–Changes in customers’, suppliers’ and other counterparties’ performance and creditworthiness,
–Impacts of sanctions, tariffs and other trade policies of the U.S. and its global trading partners,
–A continuation of turmoil in the banking industry, responsive measures to mitigate and manage it and related supervisory and regulatory actions and costs,
–Impacts of changes in federal, state and local governmental policy, including on the regulatory landscape, capital markets, taxes, infrastructure spending and social programs,
–PNC’sOur ability to attract, recruit and retain skilled employees, and
–Commodity price volatility.
•Our forward-looking financial statements are subject to the risk that economic and financial market conditions will be substantially different than those we are currently expecting and do not take into account the potential impact of legal and regulatory contingencies.expecting. These statements are based on our views that:
–The economy continued to expand in the first half of 2023, butPNC’s baseline forecast is for slower economic growth in 2024 as consumer spending growth slows and higher interest rates remain a drag on the economy. The ongoing strength of the labor market will continue to support consumer spending. The FOMC is slowing in responseindicating that it will start to cut the ongoing Federal Reserve monetary policy tightening to slow inflation. This has led to large increases in both short- and long-term interest rates. The housing market stabilized in the first half of 2023 as the Federal Reserve signaled a potential end to its federal funds rate hiking cycle. However, givenlater this year, with rate cuts supporting economic growth toward the upward trajectory in mortgage rates and declining affordability, PNC continues to expect slower activity in the housing market in the second halfend of 2023 with a recovery in early 2024 as the Federal Reserve starts cutting the federal funds rate.2024.
–PNC’s baseline outlook is for a mild recession starting in late 2023 or early 2024, with a smaller contraction in realReal GDP growth this year will be close to its trend of less than 1%, lasting into mid-2024. The2% and the unemployment rate will increase inmodestly to just above 4% by the second halfend of this year, ending 2023 at above 4%, and then peak slightly above 5% in early 2025.2024. Inflation will continue to slow with weaker demand,as wage pressures abate, moving back to the Federal Reserve’s 2% long-term objective by this time next year.the end of 2025.
–PNC expects the federal funds rate to remain unchanged between 5.25% and 5.50% through Marchat least the first half of 2024, when it is expected thatwith federal funds rate cuts starting in the Federal Reserve will cut ratesthird quarter as inflationary pressures ease further. PNC expects two federal funds rate cuts in response to2024, with the recession.rate ending this year in a range between 4.75% and 5.00%.
•PNC’s ability to take certain capital actions, including returning capital to shareholders, is subject to PNC meeting or exceeding minimum capital levels, including an SCBa stress capital buffer established by the Federal Reserve Board in connection with the Federal Reserve Board’s CCAR process.
•PNC’s regulatory capital ratios in the future will depend on, among other things, the company’sPNC’s financial performance, the scope and terms of final capital regulations then in effect and management actions affecting the composition of PNC’s balance sheet. In addition, PNC’s ability to determine, evaluate and forecast regulatory capital ratios, and to take actions (such as capital distributions) based on actual or forecasted capital ratios, will be dependent at least in part on the development, validation and regulatory review of related models and the reliability of and risks resulting from extensive use of such models.
•Legal and regulatory developments could have an impact on our ability to operate our businesses, financial condition, results of operations, competitive position, reputation, or pursuit of attractive acquisition opportunities. Reputational impacts could affect matters such as business generation and retention, liquidity, funding and ability to attract and retain employees. These developments could include:
–Changes to laws and regulations, including changes affecting oversight of the financial services industry, changes in the enforcement and interpretation of such laws and regulations and changes in accounting and reporting standards.
38 The PNC Financial Services Group, Inc. – Form 10-Q
–Unfavorable resolution of legal proceedings or other claims and regulatory and other governmental investigations or other inquiries resulting in monetary losses, costs, or alterations in our business practices and potentially causing reputational harm to PNC.
–Results of the regulatory examination and supervision process, including our failure to satisfy requirements of agreements with governmental agencies.
–Costs associated with obtaining rights in intellectual property claimed by others and of adequacy of our intellectual property protection in general.
•Business and operating results are affected by our ability to identify and effectively manage risks inherent in our businesses, including, where appropriate, through effective use of systems and controls, third-party insurance, derivatives, and capital management techniques and to meet evolving regulatory capital and liquidity standards.
•Our reputation and business and operating results may be affected by our ability to appropriately meet or address environmental, social or governance targets, goals, commitments or concerns that may arise.
•We grow our business in part through acquisitions and new strategic initiatives. Risks and uncertainties include those presented by the nature of the business acquired andor strategic initiative, including in some cases those associated with our entry into new businesses or new geographic or other markets and risks resulting from our inexperience in those new areas, as well as risks and uncertainties related to the acquisition transactions themselves, regulatory issues, the integration of the acquired businesses into PNC after closing or any failure to execute strategic or operational plans.
The PNC Financial Services Group, Inc. – Form 10-Q 41
•Competition can have an impact on customer acquisition, growth and retention and on credit spreads and product pricing, which can affect market share, deposits and revenues. Our ability to anticipate and respond to technological changes can also impact our ability to respond to customer needs and meet competitive demands.
•Business and operating results can also be affected by widespread manmade, natural and other disasters (including severe weather events), health emergencies, dislocations, geopolitical instabilities or events, terrorist activities, system failures or disruptions, security breaches, cyberattacks, international hostilities, or other extraordinary events beyond PNC’s control through impacts on the economy and financial markets generally or on us or our counterparties, customers or third-party vendors and service providers specifically.
We provide greater detail regarding these as well as other factors in our 20222023 Form 10-K and subsequent Form 10-Qs and elsewhere in this Report, including in the Risk Factors and Risk Management sections and the Legal Proceedings and Commitments Notes of the Notes To Consolidated Financial Statements in these reports. Our forward-looking statements may also be subject to other risks and uncertainties, including those discussed elsewhere in this Report or in our other filings with the SEC.
42The PNC Financial Services Group, Inc. – Form 10-Q
CONSOLIDATED INCOME STATEMENT
THE PNC FINANCIAL SERVICES GROUP, INC.
| | | | | | | | | | | | | | | | | | | | | | | |
| Unaudited | Three months ended
June 30 | | Six months ended
June 30 |
| In millions, except per share data | 2023 | | 2022 | | 2023 | | 2022 |
| Interest Income | | | | | | | |
| Loans | $ | 4,523 | | | $ | 2,504 | | | $ | 8,781 | | | $ | 4,797 | |
| Investment securities | 883 | | | 631 | | | 1,768 | | | 1,175 | |
| Other | 538 | | | 146 | | | 1,054 | | | 223 | |
| Total interest income | 5,944 | | | 3,281 | | | 11,603 | | | 6,195 | |
| Interest Expense | | | | | | | |
| Deposits | 1,531 | | | 88 | | | 2,822 | | | 115 | |
| Borrowed funds | 903 | | | 142 | | | 1,686 | | | 225 | |
| Total interest expense | 2,434 | | | 230 | | | 4,508 | | | 340 | |
| Net interest income | 3,510 | | | 3,051 | | | 7,095 | | | 5,855 | |
| Noninterest Income | | | | | | | |
| Asset management and brokerage | 348 | | | 365 | | | 704 | | | 742 | |
| Capital markets and advisory | 213 | | | 409 | | | 475 | | | 661 | |
| Card and cash management | 697 | | | 671 | | | 1,356 | | | 1,291 | |
| Lending and deposit services | 298 | | | 282 | | | 604 | | | 551 | |
| Residential and commercial mortgage | 98 | | | 161 | | | 275 | | | 320 | |
| Other | 129 | | | 177 | | | 387 | | | 388 | |
| Total noninterest income | 1,783 | | | 2,065 | | | 3,801 | | | 3,953 | |
| Total revenue | 5,293 | | | 5,116 | | | 10,896 | | | 9,808 | |
| Provision For (Recapture of) Credit Losses | 146 | | | 36 | | | 381 | | | (172) | |
| Noninterest Expense | | | | | | | |
| Personnel | 1,846 | | | 1,779 | | | 3,672 | | | 3,496 | |
| Occupancy | 244 | | | 246 | | | 495 | | | 504 | |
| Equipment | 349 | | | 351 | | | 699 | | | 682 | |
| Marketing | 109 | | | 95 | | | 183 | | | 156 | |
| Other | 824 | | | 773 | | | 1,644 | | | 1,578 | |
| Total noninterest expense | 3,372 | | | 3,244 | | | 6,693 | | | 6,416 | |
| Income before income taxes and noncontrolling interests | 1,775 | | | 1,836 | | | 3,822 | | | 3,564 | |
| Income taxes | 275 | | | 340 | | | 628 | | | 639 | |
| | | | | | | |
| | | | | | | |
| | | | | | | |
| | | | | | | |
| Net income | 1,500 | | | 1,496 | | | 3,194 | | | 2,925 | |
| Less: Net income attributable to noncontrolling interests | 17 | | | 15 | | | 34 | | | 36 | |
| Preferred stock dividends | 127 | | | 71 | | | 195 | | | 116 | |
| Preferred stock discount accretion and redemptions | 2 | | | 1 | | | 4 | | | 3 | |
| Net income attributable to common shareholders | $ | 1,354 | | | $ | 1,409 | | | $ | 2,961 | | | $ | 2,770 | |
| Earnings Per Common Share | | | | | | | |
| Basic | $ | 3.36 | | | $ | 3.39 | | | $ | 7.35 | | | $ | 6.62 | |
| | | | | | | |
| | | | | | | |
| Diluted | $ | 3.36 | | | $ | 3.39 | | | $ | 7.34 | | | $ | 6.61 | |
| | | | | | | |
| | | | | | | |
| Average Common Shares Outstanding | | | | | | | |
| Basic | 401 | | | 414 | | | 401 | | | 417 | |
| Diluted | 401 | | | 414 | | | 401 | | | 417 | |
See accompanying Notes To Consolidated Financial Statements.
The PNC Financial Services Group, Inc. – Form 10-Q 43
CONSOLIDATED STATEMENT OF COMPREHENSIVE INCOME
THE PNC FINANCIAL SERVICES GROUP, INC.
| | | | | | | | | | | | | | | | | | | | | | | |
Unaudited
In millions | | Three months ended
June 30 | | Six Months Ended
June 30 | |
| 2023 | 2022 | | 2023 | 2022 | |
| Net income | | $ | 1,500 | | $ | 1,496 | | | $ | 3,194 | | $ | 2,925 | | |
| Other comprehensive income (loss), before tax and net of reclassifications into Net income | | | | | | | |
| Net change in debt securities | | (241) | | (2,715) | | | 628 | | (9,030) | | |
| Net change in cash flow hedge derivatives | | (316) | | (701) | | | 211 | | (2,459) | | |
| Pension and other postretirement benefit plan adjustments | | 6 | | 8 | | | (4) | | 62 | | |
| Net change in Other | | 3 | | (4) | | | 7 | | (7) | | |
| Other comprehensive income (loss), before tax and net of reclassifications into Net income | | (548) | | (3,412) | | | 842 | | (11,434) | | |
| Income tax benefit (expense) related to items of other comprehensive income | | 131 | | 785 | | | (195) | | 2,667 | | |
| Other comprehensive income (loss), after tax and net of reclassifications into Net income | | (417) | | (2,627) | | | 647 | | (8,767) | | |
| | | | | | | |
| | | | | | | |
| | | | | | | |
| | | | | | | |
| | | | | | | |
| Comprehensive income (loss) | | 1,083 | | (1,131) | | | 3,841 | | (5,842) | | |
| Less: Comprehensive income attributable to noncontrolling interests | | 17 | 15 | | 34 | | 36 | | |
| Comprehensive income (loss) attributable to PNC | | $ | 1,066 | | $ | (1,146) | | | $ | 3,807 | | $ | (5,878) | | |
| | | | | | | | | | | | | | | | | |
| Unaudited | Three months ended March 31 | | |
| In millions, except per share data | 2024 | | 2023 | | | | |
| Interest Income | | | | | | | |
| Loans | $ | 4,819 | | | $ | 4,258 | | | | | |
| Investment securities | 883 | | | 885 | | | | | |
| Other | 798 | | | 516 | | | | | |
| Total interest income | 6,500 | | | 5,659 | | | | | |
| Interest Expense | | | | | | | |
| Deposits | 2,077 | | | 1,291 | | | | | |
| Borrowed funds | 1,159 | | | 783 | | | | | |
| Total interest expense | 3,236 | | | 2,074 | | | | | |
| Net interest income | 3,264 | | | 3,585 | | | | | |
| Noninterest Income | | | | | | | |
| Asset management and brokerage | 364 | | | 356 | | | | | |
| Capital markets and advisory | 259 | | | 262 | | | | | |
| Card and cash management | 671 | | | 659 | | | | | |
| Lending and deposit services | 305 | | | 306 | | | | | |
| Residential and commercial mortgage | 147 | | | 177 | | | | | |
| Other | 135 | | | 258 | | | | | |
| Total noninterest income | 1,881 | | | 2,018 | | | | | |
| Total revenue | 5,145 | | | 5,603 | | | | | |
| Provision For Credit Losses | 155 | | | 235 | | | | | |
| Noninterest Expense | | | | | | | |
| Personnel | 1,794 | | | 1,826 | | | | | |
| Occupancy | 244 | | | 251 | | | | | |
| Equipment | 341 | | | 350 | | | | | |
| Marketing | 64 | | | 74 | | | | | |
| Other | 891 | | | 820 | | | | | |
| Total noninterest expense | 3,334 | | | 3,321 | | | | | |
| Income before income taxes and noncontrolling interests | 1,656 | | | 2,047 | | | | | |
| Income taxes | 312 | | | 353 | | | | | |
| Net income | 1,344 | | | 1,694 | | | | | |
| Less: Net income attributable to noncontrolling interests | 14 | | | 17 | | | | | |
| Preferred stock dividends | 81 | | | 68 | | | | | |
| Preferred stock discount accretion and redemptions | 2 | | | 2 | | | | | |
| Net income attributable to common shareholders | $ | 1,247 | | | $ | 1,607 | | | | | |
| Earnings Per Common Share | | | | | | | |
| Basic | $ | 3.10 | | | $ | 3.98 | | | | | |
| Diluted | $ | 3.10 | | | $ | 3.98 | | | | | |
| Average Common Shares Outstanding | | | | | | | |
| Basic | 400 | | | 401 | | | | | |
| Diluted | 400 | | | 402 | | | | | |
See accompanying Notes To Consolidated Financial Statements.
4440 The PNC Financial Services Group, Inc. – Form 10-Q
CONSOLIDATED STATEMENT OF COMPREHENSIVE INCOME
THE PNC FINANCIAL SERVICES GROUP, INC.
| | | | | | | | | | | | | | |
Unaudited
In millions | | Three months ended March 31 | |
| 2024 | 2023 | | | |
| Net income | | $ | 1,344 | | $ | 1,694 | | | | |
| Other comprehensive income (loss), before tax and net of reclassifications into Net income | | | | | | |
| Net change in debt securities | | (179) | | 869 | | | | |
| Net change in cash flow hedge derivatives | | (250) | | 527 | | | | |
| Pension and other postretirement benefit plan adjustments | | (2) | | (10) | | | | |
| Net change in Other | | (2) | | 4 | | | | |
| Other comprehensive income (loss), before tax and net of reclassifications into Net income | | (433) | | 1,390 | | | | |
| Income tax benefit (expense) related to items of other comprehensive income | | 103 | | (326) | | | | |
| Other comprehensive income (loss), after tax and net of reclassifications into Net income | | (330) | | 1,064 | | | | |
| | | | | | |
| | | | | | |
| | | | | | |
| | | | | | |
| | | | | | |
| Comprehensive income | | 1,014 | | 2,758 | | | | |
| Less: Comprehensive income attributable to noncontrolling interests | | 14 | 17 | | | |
| Comprehensive income attributable to PNC | | $ | 1,000 | | $ | 2,741 | | | | |
See accompanying Notes To Consolidated Financial Statements.
The PNC Financial Services Group, Inc. – Form 10-Q 41
CONSOLIDATED BALANCE SHEET
THE PNC FINANCIAL SERVICES GROUP, INC.
| | Unaudited | Unaudited | June 30
2023 | | December 31
2022 | Unaudited | March 31
2024 | | December 31
2023 |
| In millions, except par value | In millions, except par value | In millions, except par value |
| Assets | Assets | |
| Cash and due from banks | |
| Cash and due from banks | |
| Cash and due from banks | Cash and due from banks | $ | 6,191 | | | $ | 7,043 | |
| Interest-earning deposits with banks | Interest-earning deposits with banks | 38,259 | | | 27,320 | |
| Loans held for sale (a) | Loans held for sale (a) | 835 | | | 1,010 | |
| Investment securities – available for sale | Investment securities – available for sale | 41,787 | | | 44,159 | |
| Investment securities – held to maturity | Investment securities – held to maturity | 93,874 | | | 95,175 | |
| Loans (a) | Loans (a) | 321,761 | | | 326,025 | |
| Allowance for loan and lease losses | Allowance for loan and lease losses | (4,737) | | | (4,741) | |
| Net loans | Net loans | 317,024 | | | 321,284 | |
| Equity investments | Equity investments | 8,015 | | | 8,437 | |
| Mortgage servicing rights | Mortgage servicing rights | 3,455 | | | 3,423 | |
| Goodwill | Goodwill | 10,987 | | | 10,987 | |
| Other (a) | Other (a) | 37,780 | | | 38,425 | |
| Total assets | Total assets | $ | 558,207 | | | $ | 557,263 | |
| Liabilities | Liabilities | |
| Deposits | Deposits | |
| Deposits | |
| Deposits | |
| Noninterest-bearing | |
| Noninterest-bearing | |
| Noninterest-bearing | Noninterest-bearing | $ | 110,527 | | | $ | 124,486 | |
| Interest-bearing | Interest-bearing | 316,962 | | | 311,796 | |
| Total deposits | Total deposits | 427,489 | | | 436,282 | |
| Borrowed funds | Borrowed funds | |
| Federal Home Loan Bank borrowings | |
| Federal Home Loan Bank borrowings | |
| Federal Home Loan Bank borrowings | Federal Home Loan Bank borrowings | 34,000 | | | 32,075 | |
| Senior debt | Senior debt | 22,005 | | | 16,657 | |
| Subordinated debt | Subordinated debt | 5,548 | | | 6,307 | |
| Other (b) | Other (b) | 3,831 | | | 3,674 | |
| Total borrowed funds | Total borrowed funds | 65,384 | | | 58,713 | |
| Allowance for unfunded lending related commitments | Allowance for unfunded lending related commitments | 663 | | | 694 | |
| Accrued expenses and other liabilities (b) | Accrued expenses and other liabilities (b) | 15,325 | | | 15,762 | |
| Total liabilities | Total liabilities | 508,861 | | | 511,451 | |
| Equity | Equity | |
| Preferred stock (c) | Preferred stock (c) | |
| Common stock ($5 par value, Authorized 800 shares, issued 543 shares) | 2,715 | | | 2,714 | |
| Preferred stock (c) | |
| Preferred stock (c) | | | | |
| Common stock ($5 par value, Authorized 800,000,000 shares, issued 543,116,260 and 543,116,271 shares) | |
| Capital surplus | Capital surplus | 19,934 | | | 18,376 | |
| Retained earnings | Retained earnings | 55,346 | | | 53,572 | |
| Accumulated other comprehensive income (loss) | Accumulated other comprehensive income (loss) | (9,525) | | | (10,172) | |
| Common stock held in treasury at cost: 145 and 142 shares | (19,150) | | | (18,716) | |
| Common stock held in treasury at cost: 145,068,954 and 145,087,054 shares | |
| Total shareholders’ equity | Total shareholders’ equity | 49,320 | | | 45,774 | |
| Noncontrolling interests | Noncontrolling interests | 26 | | | 38 | |
| Total equity | Total equity | 49,346 | | | 45,812 | |
| Total liabilities and equity | Total liabilities and equity | $ | 558,207 | | | $ | 557,263 | |
(a)Our consolidated assets included the following for which we have elected the fair value option: Loans held for sale of $0.8$0.7 billion, Loans held for investment of $1.3$1.2 billion and Other assets of $0.1 billion at June 30, 2023.March 31, 2024. Comparable amounts at December 31, 20222023 were $0.9$0.7 billion, $1.3$1.2 billion and $0.1 billion, respectively.
(b)Our consolidated liabilities included the following for which we have elected the fair value option: Other borrowed funds of less than $0.1 billion and Other liabilities of $0.1 billion at June 30, 2023.March 31, 2024. Comparable amounts at December 31, 20222023 were less than $0.1 billion and $0.2$0.1 billion, respectively.
(c)Par value less than $0.5 million at each date.
See accompanying Notes To Consolidated Financial Statements.
42The PNC Financial Services Group, Inc. – Form 10-Q
45
CONSOLIDATED STATEMENT OF CASH FLOWS
THE PNC FINANCIAL SERVICES GROUP, INC.
| Unaudited
In millions | Unaudited
In millions | | Six months ended June 30 | |
| 2023 | | 2022 | |
| 2024 | |
| 2024 | |
| Operating Activities | |
| Operating Activities | |
| Operating Activities | Operating Activities | |
| Net income | Net income | | $ | 3,194 | | | $ | 2,925 | | |
| Net income | |
| Net income | |
| Adjustments to reconcile net income to net cash provided (used) by operating activities | Adjustments to reconcile net income to net cash provided (used) by operating activities | |
| Provision for (recapture of) credit losses | | 381 | | | (172) | | |
| Adjustments to reconcile net income to net cash provided (used) by operating activities | |
| Adjustments to reconcile net income to net cash provided (used) by operating activities | |
| Provision for credit losses | |
| Provision for credit losses | |
| Provision for credit losses | |
| Depreciation, amortization and accretion | |
| Depreciation, amortization and accretion | |
| Depreciation, amortization and accretion | Depreciation, amortization and accretion | | 125 | | | 529 | | |
| Deferred income taxes (benefit) | Deferred income taxes (benefit) | | (75) | | | 203 | | |
| Net losses on sales of securities | | 2 | | | 4 | | |
| Deferred income taxes (benefit) | |
| Deferred income taxes (benefit) | |
| | Changes in fair value of mortgage servicing rights | |
| | Changes in fair value of mortgage servicing rights | |
| | Changes in fair value of mortgage servicing rights | Changes in fair value of mortgage servicing rights | | 136 | | | (435) | | |
| | Net change in | Net change in | |
| | Net change in | |
| | Net change in | |
| Trading securities and other short-term investments | |
| Trading securities and other short-term investments | |
| Trading securities and other short-term investments | Trading securities and other short-term investments | | (601) | | | (1,325) | | |
| Loans held for sale and related securitization activity | Loans held for sale and related securitization activity | | 522 | | | 997 | | |
| Loans held for sale and related securitization activity | |
| Loans held for sale and related securitization activity | |
| Other assets | |
| Other assets | |
| Other assets | Other assets | | 1,410 | | | (2,989) | | |
| Accrued expenses and other liabilities | Accrued expenses and other liabilities | | (494) | | | 1,491 | | |
| Other | | 532 | | | 415 | | |
| Accrued expenses and other liabilities | |
| Accrued expenses and other liabilities | |
| Other operating activities, net | |
| Other operating activities, net | |
| Other operating activities, net | |
| Net cash provided (used) by operating activities | |
| Net cash provided (used) by operating activities | |
| Net cash provided (used) by operating activities | Net cash provided (used) by operating activities | | $ | 5,132 | | | $ | 1,643 | | |
| Investing Activities | Investing Activities | |
| Investing Activities | |
| Investing Activities | |
| Sales | Sales | |
| Sales | |
| Sales | |
| Securities available for sale | |
| Securities available for sale | |
| Securities available for sale | Securities available for sale | | $ | (70) | | | $ | 2,575 | | |
| | Loans | Loans | | 605 | | | 525 | | |
| | Loans | |
| | Loans | |
| Repayments/maturities | |
| Repayments/maturities | |
| Repayments/maturities | Repayments/maturities | |
| Securities available for sale | Securities available for sale | | 4,038 | | | 9,403 | | |
| Securities available for sale | |
| Securities available for sale | |
| Securities held to maturity | |
| Securities held to maturity | |
| Securities held to maturity | Securities held to maturity | | 3,076 | | | 1,395 | | |
| Purchases | Purchases | |
| Purchases | |
| Purchases | |
| Securities available for sale | |
| Securities available for sale | |
| Securities available for sale | Securities available for sale | | (1,272) | | | (22,145) | | |
| Securities held to maturity | Securities held to maturity | | (1,513) | | | (1,289) | | |
| Securities held to maturity | |
| Securities held to maturity | |
| Loans | |
| Loans | |
| Loans | Loans | | (416) | | | (1,298) | | |
| Net change in | Net change in | |
| Net change in | |
| Net change in | |
| Federal funds sold and resale agreements | |
| Federal funds sold and resale agreements | |
| Federal funds sold and resale agreements | Federal funds sold and resale agreements | | 229 | | | (919) | | |
| Interest-earning deposits with banks | Interest-earning deposits with banks | | (10,794) | | | 45,846 | | |
| Interest-earning deposits with banks | |
| Interest-earning deposits with banks | |
| Loans | |
| Loans | |
| Loans | Loans | | 3,305 | | | (21,929) | | |
| | Other | | (590) | | | (1,147) | | |
| Other investing activities, net | |
| | Other investing activities, net | |
| | Other investing activities, net | |
| Net cash provided (used) by investing activities | Net cash provided (used) by investing activities | | $ | (3,402) | | | $ | 11,017 | | |
| Net cash provided (used) by investing activities | |
| Net cash provided (used) by investing activities | |
46The PNC Financial Services Group, Inc. – Form 10-Q
CONSOLIDATED STATEMENT OF CASH FLOWS
THE PNC FINANCIAL SERVICES GROUP, INC.
| | (Continued from previous page) | (Continued from previous page) | |
Unaudited
In millions | Unaudited
In millions | | Six months ended June 30 | |
| 2023 | | 2022 | |
Unaudited
In millions | |
| | 2024 | |
| 2024 | |
| Financing Activities | |
| Financing Activities | |
| Financing Activities | Financing Activities | |
| Net change in | Net change in | |
| Net change in | |
| Net change in | |
| Noninterest-bearing deposits | |
| Noninterest-bearing deposits | |
| Noninterest-bearing deposits | Noninterest-bearing deposits | | $ | (13,982) | | | $ | (8,717) | | |
| Interest-bearing deposits | Interest-bearing deposits | | 5,166 | | | (7,730) | | |
| Interest-bearing deposits | |
| Interest-bearing deposits | |
| Federal funds purchased and repurchase agreements | Federal funds purchased and repurchase agreements | | 94 | | | (5) | | |
| Federal funds purchased and repurchase agreements | |
| Federal funds purchased and repurchase agreements | |
| Short-term Federal Home Loan Bank borrowings | |
| Short-term Federal Home Loan Bank borrowings | |
| Short-term Federal Home Loan Bank borrowings | |
| | Other borrowed funds | |
| | Other borrowed funds | |
| | Other borrowed funds | Other borrowed funds | | (35) | | | 1,098 | | |
| Sales/issuances | Sales/issuances | |
| Sales/issuances | |
| Sales/issuances | |
| | Senior debt | |
| | Senior debt | |
| | Senior debt | |
| | Other borrowed funds | |
| | Other borrowed funds | |
| | Other borrowed funds | |
| Preferred stock | |
| Preferred stock | |
| Preferred stock | |
| Common and treasury stock | |
| Common and treasury stock | |
| Common and treasury stock | |
| Repayments/maturities | |
| Repayments/maturities | |
| Repayments/maturities | |
| Federal Home Loan Bank borrowings | |
| Federal Home Loan Bank borrowings | |
| Federal Home Loan Bank borrowings | Federal Home Loan Bank borrowings | | 2,000 | | | 10,000 | | |
| Senior debt | Senior debt | | 6,235 | | | | | |
| Senior debt | |
| Senior debt | |
| Subordinated debt | |
| Subordinated debt | |
| Subordinated debt | Subordinated debt | | | | | 847 | | |
| Other borrowed funds | Other borrowed funds | | 486 | | | 435 | | |
| Preferred stock | | 1,484 | | | 990 | | |
| Common and treasury stock | | 36 | | | 34 | | |
| Repayments/maturities | |
| Federal Home Loan Bank borrowings | | (75) | | | | | |
| Senior debt | | (750) | | | (5,250) | | |
| Subordinated debt | | (750) | | |
| Other borrowed funds | |
| Other borrowed funds | Other borrowed funds | | (495) | | | (435) | | |
| | Acquisition of treasury stock | Acquisition of treasury stock | | (588) | | | (2,076) | | |
| | Acquisition of treasury stock | |
| | Acquisition of treasury stock | |
| Preferred stock cash dividends paid | Preferred stock cash dividends paid | | (195) | | | (116) | | |
| Preferred stock cash dividends paid | |
| Preferred stock cash dividends paid | |
| Common stock cash dividends paid | |
| Common stock cash dividends paid | |
| Common stock cash dividends paid | Common stock cash dividends paid | | (1,213) | | | (1,157) | | |
| | Net cash provided (used) by financing activities | Net cash provided (used) by financing activities | | $ | (2,582) | | | $ | (12,082) | | |
| | Net cash provided (used) by financing activities | |
| | Net cash provided (used) by financing activities | |
| Net Increase (Decrease) In Cash And Due From Banks And Restricted Cash | |
| Net Increase (Decrease) In Cash And Due From Banks And Restricted Cash | |
| Net Increase (Decrease) In Cash And Due From Banks And Restricted Cash | Net Increase (Decrease) In Cash And Due From Banks And Restricted Cash | | $ | (852) | | | $ | 578 | | |
| | Cash and due from banks and restricted cash at beginning of period | Cash and due from banks and restricted cash at beginning of period | | 7,043 | | | 8,004 | | |
| | Cash and due from banks and restricted cash at beginning of period | |
| | Cash and due from banks and restricted cash at beginning of period | |
| Cash and due from banks and restricted cash at end of period | |
| Cash and due from banks and restricted cash at end of period | |
| Cash and due from banks and restricted cash at end of period | Cash and due from banks and restricted cash at end of period | | $ | 6,191 | | | $ | 8,582 | | |
| | Cash And Due From Banks And Restricted Cash | Cash And Due From Banks And Restricted Cash | |
| | Cash And Due From Banks And Restricted Cash | |
| | Cash And Due From Banks And Restricted Cash | |
| Cash and due from banks at end of period (unrestricted cash) | |
| Cash and due from banks at end of period (unrestricted cash) | |
| Cash and due from banks at end of period (unrestricted cash) | Cash and due from banks at end of period (unrestricted cash) | | $ | 5,604 | | | $ | 7,950 | | |
| Restricted cash | Restricted cash | | 587 | | 632 | |
| Restricted cash | |
| Restricted cash | |
| Cash and due from banks and restricted cash at end of period | |
| Cash and due from banks and restricted cash at end of period | |
| Cash and due from banks and restricted cash at end of period | Cash and due from banks and restricted cash at end of period | | $ | 6,191 | | | $ | 8,582 | | |
| Supplemental Disclosures | Supplemental Disclosures | |
| Supplemental Disclosures | |
| Supplemental Disclosures | |
| Interest paid | |
| Interest paid | |
| Interest paid | Interest paid | | $ | 2,586 | | | $ | 420 | | |
| Income taxes paid | Income taxes paid | | $ | 719 | | | $ | 62 | | |
| Income taxes paid | |
| Income taxes paid | |
| Income taxes refunded | Income taxes refunded | | $ | 824 | | | $ | 8 | | |
| Income taxes refunded | |
| Income taxes refunded | |
| Leased assets obtained in exchange for new operating lease liabilities | |
| Leased assets obtained in exchange for new operating lease liabilities | |
| Leased assets obtained in exchange for new operating lease liabilities | Leased assets obtained in exchange for new operating lease liabilities | | $ | 113 | | | $ | 103 | | |
| | Non-cash Investing And Financing Items | Non-cash Investing And Financing Items | |
| Transfer from securities available for sale to securities held to maturity | | $ | 83,419 | | |
| | Non-cash Investing And Financing Items | |
| | Non-cash Investing And Financing Items | |
| | Transfer from loans to loans held for sale, net | |
| | Transfer from loans to loans held for sale, net | |
| | Transfer from loans to loans held for sale, net | Transfer from loans to loans held for sale, net | | $ | 712 | | | $ | 330 | | |
| | Transfer from loans to foreclosed assets | Transfer from loans to foreclosed assets | | $ | 32 | | | $ | 25 | | |
| | Transfer from loans to foreclosed assets | |
| | Transfer from loans to foreclosed assets | |
|
See accompanying Notes To Consolidated Financial Statements.
44The PNC Financial Services Group, Inc. – Form 10-Q
47
NOTES TO CONSOLIDATED FINANCIAL STATEMENTSAllowance for Credit Losses
Our determination of the ACL is based on historical loss and performance experience, current economic conditions, the reasonable and supportable forecasts of future economic conditions and other relevant factors, including current borrower and/or transaction characteristics and assessments of the remaining estimated contractual term as of the balance sheet date. We maintain the ACL at an appropriate level for expected losses on our existing investment securities, loans, equipment finance leases, other financial assets and unfunded lending related commitments.
THE PNC FINANCIAL SERVICES GROUP, INC.
UnauditedSee Note 1 Accounting Policies and the Credit Risk Management section in our 2023 Form 10-K for additional discussion of our ACL, including details of our methodologies. See also the Critical Accounting Estimates and Judgments section of this Report for further discussion of the assumptions used in the determination of the ACL as of March 31, 2024.
The PNC Financial Services Group, Inc. – Form 10-Q 25
The following table summarizes our ACL related to loans:
Table 24: Allowance for a glossary of certain termsCredit Losses by Loan Class (a)
| | | | | | | | | | | | | | | | | | | | | | | | | | | | | |
| | March 31, 2024 | | December 31, 2023 | |
Dollars in millions | | Allowance Amount | Total Loans | % of Total Loans | | Allowance Amount | Total Loans | % of Total Loans | |
| Allowance for loans and lease losses | | | | | | | | | |
| Commercial | | | | | | | | | |
| Commercial and industrial | | $ | 1,673 | | $ | 176,792 | | 0.95 | % | | $ | 1,806 | | $ | 177,580 | | 1.02 | % | |
| Commercial real estate | | 1,468 | | 35,591 | | 4.12 | % | | 1,371 | | 35,436 | | 3.87 | % | |
| Equipment lease financing | | 76 | | 6,462 | | 1.18 | % | | 82 | | 6,542 | | 1.25 | % | |
| Total commercial | | 3,217 | | 218,845 | | 1.47 | % | | 3,259 | | 219,558 | | 1.48 | % | |
| Consumer | | | | | | | | | |
| Residential real estate | | 39 | | 47,386 | | 0.08 | % | | 61 | | 47,544 | | 0.13 | % | |
| Home equity | | 272 | | 25,896 | | 1.05 | % | | 276 | | 26,150 | | 1.06 | % | |
| Automobile | | 173 | | 14,788 | | 1.17 | % | | 173 | | 14,860 | | 1.16 | % | |
| Credit card | | 749 | | 6,887 | | 10.88 | % | | 766 | | 7,180 | | 10.67 | % | |
| Education | | 56 | | 1,859 | | 3.01 | % | | 56 | | 1,945 | | 2.88 | % | |
| Other consumer | | 187 | | 4,120 | | 4.54 | % | | 200 | | 4,271 | | 4.68 | % | |
| Total consumer | | 1,476 | | 100,936 | | 1.46 | % | | 1,532 | | 101,950 | | 1.50 | % | |
| Total | | 4,693 | | $ | 319,781 | | 1.47 | % | | 4,791 | | $ | 321,508 | | 1.49 | % | |
| Allowance for unfunded lending related commitments | | 672 | | | | | 663 | | | | |
| Allowance for credit losses | | $ | 5,365 | | | | | $ | 5,454 | | | | |
| Allowance for credit losses to total loans | | | | 1.68 | % | | | | 1.70 | % | |
| Commercial | | | | 1.71 | % | | | | 1.73 | % | |
| Consumer | | | | 1.60 | % | | | | 1.62 | % | |
(a) Excludes allowances for investment securities and acronyms used in this Report.other financial assets, which together totaled $117 million and $120 million at March 31, 2024 and December 31, 2023, respectively.
26 The PNC Financial Services Group, Inc. – Form 10-Q
The following table summarizes our loan charge-offs and recoveries:
Table 25: Loan Charge-Offs and Recoveries
| | | | | | | | | | | | | | | | | | | | | | | | | | | | | |
| Three months ended March 31 | | Gross
Charge-offs | | Recoveries | | Net Charge-offs /
(Recoveries) | | % of Average
Loans (Annualized) | |
| Dollars in millions |
| 2024 | | | | | | | | | |
| Commercial | | | | | | | | | |
| Commercial and industrial | | $ | 84 | | | $ | 19 | | | $ | 65 | | | 0.15 | % | |
| Commercial real estate | | 56 | | | 2 | | | 54 | | | 0.61 | % | |
| Equipment lease financing | | 8 | | | 2 | | | 6 | | | 0.37 | % | |
| Total commercial | | 148 | | | 23 | | | 125 | | | 0.23 | % | |
| Consumer | | | | | | | | | |
| Residential real estate | | 1 | | | 3 | | | (2) | | | (0.02) | % | |
| Home equity | | 10 | | | 9 | | | 1 | | | 0.02 | % | |
| Automobile | | 32 | | | 25 | | | 7 | | | 0.19 | % | |
| Credit card | | 92 | | | 15 | | | 77 | | | 4.46 | % | |
| Education | | 4 | | | 2 | | | 2 | | | 0.42 | % | |
| Other consumer | | 43 | | | 10 | | | 33 | | | 3.16 | % | |
| Total consumer | | 182 | | | 64 | | | 118 | | | 0.47 | % | |
| Total | | $ | 330 | | | $ | 87 | | | $ | 243 | | | 0.30 | % | |
| 2023 | | | | | | | | | |
| Commercial | | | | | | | | | |
| Commercial and industrial | | $ | 104 | | | $ | 20 | | | $ | 84 | | | 0.19 | % | |
| Commercial real estate | | 12 | | | 2 | | | 10 | | | 0.11 | % | |
| Equipment lease financing | | 4 | | | 3 | | | 1 | | | 0.06 | % | |
| Total commercial | | 120 | | | 25 | | | 95 | | | 0.17 | % | |
| Consumer | | | | | | | | | |
| Residential real estate | | 3 | | | 3 | | | | | | | | |
| Home equity | | 6 | | | 11 | | | (5) | | | (0.08) | % | |
| Automobile | | 33 | | | 24 | | | 9 | | | 0.24 | % | |
| Credit card | | 74 | | | 11 | | | 63 | | | 3.70 | % | |
| Education | | 4 | | | 2 | | | 2 | | | 0.37 | % | |
| Other consumer | | 42 | | | 11 | | | 31 | | | 2.57 | % | |
| Total consumer | | 162 | | | 62 | | | 100 | | | 0.40 | % | |
| Total | | $ | 282 | | | $ | 87 | | | $ | 195 | | | 0.24 | % | |
PNC is oneTotal net charge-offs increased $48 million, or 25%, for the first three months of 2024 compared to the largest diversified financial services companiessame period in 2023. The increase in the U.S. and is headquartered in Pittsburgh, Pennsylvania.comparison was primarily attributable to higher commercial real estate net charge-offs.
We have businesses engaged in retail banking, including residential mortgage, corporate and institutional banking and asset management, providing many of our products and services nationally. Our retail branch network is located coast-to-coast. We also have strategic international offices in four countries outside the U.S.
NOTE 1 ACCOUNTING POLICIES
Basis of Financial Statement Presentation
Our consolidated financial statements include the accounts of the parent company and its subsidiaries, most of which are wholly-owned, certain partnership interests and VIEs.
We prepared these consolidated financial statements in accordance with GAAP. We have eliminated intercompany accounts and transactions.
In our opinion, the unaudited interim consolidated financial statements reflect all normal, recurring adjustments needed to state fairly our results for the interim periods. The results of operations for interim periods are not necessarily indicative of the results that may be expected for the full year or any other interim period.
We have also considered the impact of subsequent events on these consolidated financial statements.
When preparing these unaudited interim consolidated financial statements, we have assumed that you have read the audited consolidated financial statements included in our 2022 Form 10-K. These interim consolidated financial statements serve to update our 2022 Form 10-K and may not include all information and Notes necessary to constitute a complete set of financial statements. There have been changes to certain of our accounting policies as disclosed in our 2022 Form 10-K due to the adoption of ASU 2022-02 Financial Instruments - Credit Losses (Topic 326): Troubled Debt Restructurings and Vintage Disclosures (ASU 2022-02) in the first quarter of 2023. The updated policies impacted by this adoption are included in this Note 1. Reference is made toSee Note 1 Accounting Policies in our 20222023 Form 10-K and Note 3 Loans and Related Allowance for Credit Losses of this Report for additional information.
Liquidity and Capital Management
Our liquidity risk framework and related monitoring measures and tools, including internal liquidity stress testing as well as compliance with internal and regulatory limits and guidelines, are described in further detail in the Liquidity and Capital Management section of our 2023 Form 10-K.
One of the ways we monitor our liquidity is by reference to the LCR, a detailed descriptionregulatory minimum liquidity requirement designed to ensure that covered banking organizations maintain an adequate level of allliquidity to meet net liquidity needs over the course of a hypothetical 30-day stress scenario. PNC and PNC Bank calculate the LCR daily and are required to maintain a regulatory minimum of 100%. The LCR for both PNC and PNC Bank exceeded the regulatory minimum requirement throughout the first quarter of 2024. Fluctuations in our average LCR result from changes to the components of the calculation, including high-quality liquid assets and net cash outflows, as a result of ongoing business activity.
The NSFR is designed to measure the stability of the maturity structure of assets and liabilities of banking organizations over a one-year time horizon. PNC and PNC Bank calculate the NSFR daily and are required to maintain a regulatory minimum of 100%. The NSFR for both PNC and PNC Bank exceeded the regulatory minimum requirement throughout the first quarter of 2024.
The PNC Financial Services Group, Inc. – Form 10-Q 27
We provide additional information regarding regulatory liquidity requirements and their potential impact on us in the Supervision and Regulation section of Item 1 Business and Item 1A Risk Factors of our 2023 Form 10-K.
Sources of Liquidity
Our largest source of liquidity on a consolidated basis is the customer deposit base generated by our banking businesses. These deposits provide relatively stable and low-cost funding. Total deposits increased to $425.6 billion at March 31, 2024 from $421.4 billion at December 31, 2023. Noninterest-bearing deposit balances decreased driven by a decline in commercial noninterest-bearing balances. Interest-bearing deposits increased reflecting higher commercial and consumer interest-bearing balances. As of March 31, 2024, uninsured deposits represented approximately 43% of our total deposit base, which is estimated based on the regulatory instructions in the Consolidated Reports of Condition and Income - FFIEC 031. The majority of our uninsured deposits are related to commercial operating and relationship accounts, which we define as commercial deposit customers who utilize two or more PNC products. See the Funding Sources portion of the Consolidated Balance Sheet Review and Business Segments Review sections of this Financial Review for additional information on our deposits and related strategies.
We may also obtain liquidity through various forms of funding, including long-term debt (senior notes, subordinated debt and FHLB borrowings) and short-term borrowings (securities sold under repurchase agreements, commercial paper and other significant accounting policies.short-term borrowings). See the Funding Sources section of the Consolidated Balance Sheet Review in this Financial Review and Note 7 Borrowed Funds in this Report for additional information related to our borrowings.
Total senior and subordinated debt, on a consolidated basis, increased due to the following activity:
Table 26: Senior and Subordinated Debt
| | | | | | | | | |
| In billions | 2024 | | |
| January 1 | $ | 31.7 | | | |
| Issuances | 2.5 | | | |
| Calls and maturities | (1.1) | | | |
| Other | (0.4) | | | |
| | | |
| March 31 | $ | 32.7 | | | |
Additionally, certain liquid assets and unused borrowing capacity from a number of sources are also available to manage our liquidity position. PNC has a contingency funding plan designed to ensure that liquidity sources are sufficient to meet ongoing obligations and commitments, particularly in the event of liquidity stress. This plan is designed to examine and quantify the organization’s liquidity under various internal liquidity stress scenarios and is periodically tested to assess the plan’s reliability. Additionally, the plan provides the strategies for addressing liquidity needs and responsive actions we would consider during liquidity stress events, which could include the issuance of incremental debt, preferred stock, or additional deposit actions, including the issuance of brokered CDs. The plan also addresses the governance, frequency of reporting and the responsibilities of key departments in the event of liquidity stress.
PNC defines our primary contingent liquidity sources as cash held at the Federal Reserve Bank, investment securities and unused borrowing capacity at the FHLB and Federal Reserve Bank. The following table summarizes our primary contingent liquidity sources at March 31, 2024 and December 31, 2023:
Table 27: Primary Contingent Liquidity Sources
| | | | | | | | | | | | | |
| In billions | March 31, 2024 | | December 31, 2023 | | |
| Cash balance with Federal Reserve Bank | $ | 53.2 | | | $ | 43.3 | | | |
| Available investment securities (a) | 56.7 | | 98.5 | | |
| Unused borrowing capacity from FHLB (b) | 37.4 | | 35.4 | | |
| Unused borrowing capacity from Federal Reserve Bank (c) | 83.9 | | 47.2 | | |
| Total available contingent liquidity | $ | 231.2 | | | $ | 224.4 | | | |
| | | | | |
| | | | | |
| | | | | |
| | | | | |
| | | | | |
(a)Represents the fair value of investment securities that can be used for pledging or to secure other sources of funding.
(b)At March 31, 2024, total FHLB borrowing capacity was $74.4 billion and total FHLB borrowings were $37.0 billion. Comparable amounts at December 31, 2023 were $73.4 billion and $38.0 billion, respectively.
(c)Total borrowing capacity with the Federal Reserve Bank was $83.9 billion at March 31, 2024 and $47.2 billion at December 31, 2023. PNC had no outstanding borrowings with the Federal Reserve Bank at March 31, 2024 and December 31, 2023.
UseAs part of EstimatesPNC’s contingency planning, we prepositioned a portion of our available held to maturity investment securities at the Federal Reserve Bank’s Discount Window during the first quarter of 2024, supporting our resilience and operational readiness.
We prepared these consolidated financial statements using financial information available at the time of preparation, which requires us to make estimates and assumptions that affect the amounts reported. Our most significant estimates pertain to the ACL and our fair value measurements. Actual results may differ from the estimates and the differences may be material to the consolidated financial statements.
Loans
Loans are classified as held for investment when management has both the intent and ability to hold the loan for the foreseeable future, or until maturity or payoff. Management’s intent and view of the foreseeable future may change based on changes in business strategies, the economic environment, market conditions and the availability of government programs.
Measurement of delinquency status is based on the contractual terms of each loan. Loans that are 30 days or more past due in terms of payment are considered delinquent. Under the CARES Act credit reporting rules, certain loans modified due to pandemic related hardships are not being reported as past due based on the contractual terms of the loan, even where borrowers may not be making payments on their loans during the modification period. The CARES Act credit reporting rules expire in the third quarter of 2023.
Loans held for investment, excluding PCD loans, are recorded at amortized cost basis unless we elect to measure these under the fair value option. Amortized cost basis represents principal amounts outstanding, net of unearned income, unamortized deferred fees and costs on originated loans, premiums or discounts on purchased loans and charge-offs. Amortized cost basis does not include accrued interest, as we include accrued interest in Other assets on our Consolidated Balance Sheet. Interest on performing loans is accrued
4828 The PNC Financial Services Group, Inc. – Form 10-Q
based on theBank Liquidity
In addition to our primary contingent liquidity sources, under PNC Bank’s 2014 bank note program, as amended, PNC Bank may from time to time offer up to $40.0 billion aggregate principal amount outstanding at any one time of its unsecured senior and recorded in Interest income as earned usingsubordinated notes with maturity dates more than nine months (in the constant effective yield method overcase of senior notes) and five years or more (in the contractual life. Loan origination fees, direct loan origination costs, and loan premiums and discounts are deferred and accreted or amortized into Net interest income using the constant effective yield method, over the contractual lifecase of the loan. The processing fee received for loans originated through PPP lendingsubordinated notes) from their date of issue. At March 31, 2024, PNC Bank’s remaining capacity to issue under the CARES Act is deferred and accreted into Net interest income using the effective yield method, over the contractual life of the loan. Loans under the fair value option are reported at their fair value, with any changes to fair value reported as Noninterest income on the Consolidated Income Statement, and are excluded from the measurement of ALLL.program was $33.3 billion.
Under PNC Bank’s 2013 commercial paper program, PNC Bank has the ability to offer up to $10.0 billion of its commercial paper to provide additional liquidity. At March 31, 2024, there were no issuances outstanding under this program.
Additionally, PNC Bank may also access funding from the parent company through deposits placed at the bank or issuing intercompany senior unsecured notes.
Parent Company Liquidity
In addition to originating loans, we also acquire loans through the secondary loan market, portfolio purchases or acquisitions of other financial services companies. Certain acquired loans that have experienced a more-than-insignificant deterioration of credit quality since origination (i.e., PCD) are recognized at an amortized cost basis equal to their purchase price plus an ALLL measuredmanaging liquidity risk at the acquisition date.bank level, we manage the parent company’s liquidity. The parent company’s contractual obligations consist primarily of debt service related to parent company borrowings and funding non-bank affiliates. Additionally, the parent company maintains liquidity to fund discretionary activities such as paying dividends to our shareholders, share repurchases and acquisitions.
At March 31, 2024, available parent company liquidity totaled $21.7 billion. Parent company liquidity is held in intercompany cash and investments. For investments with longer durations, the related maturities are aligned with scheduled cash needs, such as the maturity of parent company debt obligations.
The principal source of parent company liquidity is the dividends or other capital distributions it receives from PNC considers a varietyBank, which may be impacted by the following:
•Bank-level capital needs,
•Laws, regulations and the results of factors in connection with the identification of more-than-insignificant deterioration in credit quality, including but not limited to nonperforming status, delinquency, risk ratingssupervisory activities,
•Corporate policies,
•Contractual restrictions, and other qualitative factors that indicate deterioration in credit quality since origination. Subsequent decreases in expected cash flows that are attributable, at least in part, to credit quality are recognized through a charge to the provision for credit losses resulting in an increase in the ALLL. Subsequent increases in expected cash flows are recognized as a provision recapture of previously recorded ALLL
•.Other factors.
We considerThere are statutory and regulatory limitations on the ability of a loannational bank to be collateral dependent when we determine that substantially allpay dividends or make other capital distributions or to extend credit to the parent company or its non-bank subsidiaries. The amount available for dividend payments by PNC Bank to the parent company without prior regulatory approval was $5.7 billion at March 31, 2024. See Note 19 Regulatory Matters in our 2023 Form 10-K for further discussion of the expected cash flows will be generated
from the operation or sale of the collateral underlying the loan, or when the borrower is experiencing financial difficulty and we have elected to measure the loan at the estimated fair value of collateral (less costs to sell if sale or foreclosure of the property is expected).
Additionally, we consider a loan to be collateral dependent when foreclosure or liquidation of the underlying collateral is probable.these limitations.
On January 1, 2023, we adopted ASU 2022-02, which eliminatesIn addition to dividends from PNC Bank, other sources of parent company liquidity include cash and investments, as well as dividends and loan repayments from other subsidiaries and dividends or distributions from equity investments. We can also generate liquidity for the accounting guidance for TDRs. See Note 1 Accounting Policiesparent company and PNC’s non-bank subsidiaries through the issuance of debt and equity securities, including certain capital instruments, in our 2022 Form 10-K for a descriptionpublic or private markets and commercial paper. Under the parent company’s 2014 commercial paper program, the parent company has the ability to offer up to $5.0 billion of our accounting policies for TDRs thatcommercial paper to provide additional liquidity. At March 31, 2024, there were no issuances outstanding under this program.
The following table details parent company note issuances in effect prior to adoption.the first quarter of 2024:
Loan modifications to borrowers experiencing financial difficulty, or FDMs, result from our loss mitigation activities and include principal forgiveness, interest rate reductions, term extensions, payment delays, repayment plans or combinations thereof. FDMs continue to be subject to our existing nonaccrual policies. Expected losses or recoveries on FDMs have been factored into the ALLL estimates for each loan class under the methodologies described in this Note. Refer to Note 3 Loans and Related Allowance for Credit Losses for more information on FDMs.Table 28: Parent Company Notes Issued
| | | | | | | | |
| Issuance Date | Amount | Description of Issuance |
| January 22, 2024 | $1.0 billion | $1.0 billion of senior fixed-to-floating notes with a maturity date of January 21, 2028. Interest is payable semi-annually in arrears at a fixed rate of 5.300% per annum, on January 21 and July 21 of each year, beginning on July 21, 2024. Beginning on January 21, 2027, interest is payable quarterly in arrears at a floating rate per annum equal to Compounded SOFR (determined with respect to each quarterly interest period using the SOFR Index as described in the Prospectus Supplement), plus 1.342%, on April 21, 2027, July 21, 2027, October 21, 2027 and at the maturity date. |
| January 22, 2024 | $1.5 billion | $1.5 billion of senior fixed-to-floating notes with a maturity date of January 22, 2035. Interest is payable semi-annually in arrears at a fixed rate of 5.676% per annum, on January 22 and July 22 of each year, beginning on July 22, 2024. Beginning on January 22, 2034, interest is payable quarterly in arrears at a floating rate per annum equal to Compounded SOFR (determined with respect to each quarterly interest period using the SOFR Index as described in the Prospectus Supplement), plus 1.902%, on April 22, 2034, July 22, 2034, October 22, 2034 and at the maturity date. |
| | |
See the following for additional information related to loans, including further discussion regarding our policies, the methodologiesParent company senior and significant inputs used to determine the ALLLsubordinated debt carrying value totaled $25.0 billion and additional details on the composition of our loan portfolio:
•Nonperforming Loans$24.0 billion at March 31, 2024 and Leases section of this Note 1,
•Allowance for Credit Losses section of this Note 1,
•Note 3 Loans and Related Allowance for Credit Losses in this Report, and
•Note 4 Loans and Related Allowance for Credit Losses in our 2022 Form 10-K.December 31, 2023, respectively.
Nonperforming Loans and Leases
The matrix that follows summarizes our policies for classifying certain loans as nonperforming loans and/or discontinuing the accrual of loan interest income.
| | | | | |
Commercial |
Loans classified as nonperforming and accounted for as nonaccrual | • Loans accounted for at amortized cost where:
–The loan is 90 days or more past due.
–The loan is rated substandard or worse due to the determination that full collection of principal and interest is not probable as demonstrated by the following conditions:
•The collection of principal or interest is 90 days or more past due,
•Reasonable doubt exists as to the certainty of the borrower’s future debt service ability, according to the terms of the credit arrangement, regardless of whether 90 days have passed or not,
•The borrower has filed, or will likely file for bankruptcy, and it is not probable the borrower will be able to repay contractual payments due under the loan,
•The bank advances additional funds to cover principal or interest,
•We are in the process of liquidating a commercial borrower, or
•We are pursuing remedies under a guarantee.
|
Loans excluded from nonperforming classification but accounted for as nonaccrual | • Loans accounted for under the fair value option and full collection of principal and interest is not probable.
• Loans accounted for at the lower of cost or market less costs to sell (held for sale) and full collection of
principal and interest is not probable.
|
Loans excluded from nonperforming classification and nonaccrual accounting | • Loans that are well secured and in the process of collection.
• Certain government insured or guaranteed loans where substantially all principal and interest is insured.
• Commercial purchasing card assets that do not accrue interest.
|
The PNC Financial Services Group, Inc. – Form 10-Q 4929
Contractual Obligations and Commitments
We have contractual obligations representing required future payments on borrowed funds, time deposits, leases, pension and postretirement benefits and purchase obligations. See the Liquidity and Capital Management portion of the Risk Management section of our 2023 Form 10-K for more information on these future cash outflows. Additionally, in the normal course of business, we have various commitments outstanding, certain of which are not included on our Consolidated Balance Sheet. We provide information on our commitments in Note 8 Commitments.
Credit Ratings
PNC’s credit ratings affect the cost and availability of short and long-term funding, collateral requirements for certain derivative instruments and the ability to offer certain products.
In general, rating agencies base their ratings on many quantitative and qualitative factors, including capital adequacy, liquidity, asset quality, business mix, level and quality of earnings, and the current legislative and regulatory environment, including implied government support. A decrease, or potential decrease, in credit ratings could impact access to the capital markets and/or increase the cost of debt, and thereby adversely affect liquidity and financial condition. For additional information on the potential impacts from a downgrade to our credit ratings, see Item 1A Risk Factors in our 2023 Form 10-K.
The following table presents credit ratings and outlook for PNC as of March 31, 2024:
Table 29: Credit Ratings and Outlook
| | | | | | | | | | | |
| March 31, 2024 |
Consumer
| Moody’s | Standard & Poor’s | Fitch |
| Parent Company | | | |
| Senior debt | A3 | A- | A |
Loans classified as nonperforming and accounted for as nonaccrualSubordinated debt | • Loans accounted for at amortized cost where full collection of contractual principal and interest is not
deemed probable as demonstrated in the policies below:
– The loan is 90 days past due for home equity and installment loans, and 180 days past due for well
secured residential real estate loans,
– The loan has been modified due to a borrower experiencing financial difficulty and is not government
insured or guaranteed,
– The loan has been modified to defer prior payments in forbearance to the end of the loan term,
– Notification of bankruptcy has been received,
– The bank holds a subordinate lien position in the loan and the first lien mortgage loan is seriously
stressed (A3
| i.e.BBB+ | , 90 days or more past due),A-– Other loans within the same borrower relationship have been placed on nonaccrual or charge-offs have
been taken on them,
– The bank has ordered the repossession of non-real estate collateral securing the loan, or
– The bank has charged-off the loan to the value of the collateral.
|
Loans excluded from nonperforming classification but accounted for as nonaccrualPreferred stock | • Loans accounted for under the fair value option and full collection of principal and interest is not probable.
• Loans accounted for at the lower of cost or market less costs to sell (held for sale) and full collection of
principal and interest is not probable.
Baa2 | BBB- | BBB |
Loans excluded from nonperforming classification and nonaccrual accountingPNC Bank | | | |
•Senior debt | Certain government insured or guaranteed loans where substantially all principal and interest is insured.A2• Residential real estate loans that are well secured and in the process of collection.
• Consumer loans and lines of credit, not secured by residential real estate or automobiles, as permitted by
regulatory guidance.
| A | A+ |
| Subordinated debt | A3 | A- | A |
| Long-term deposits | Aa3 | A | AA- |
| Short-term deposits | P-1 | A-1 | F1+ |
| Short-term notes | P-1 | A-1 | F1 |
| PNC | | | |
| Agency rating outlook | Negative | Stable | Stable |
| | | |
| | | |
| | | |
| | | |
| | | |
| | | |
| | | |
| | | |
CommercialCapital Management
We generally charge-off commercial (commercialDetailed information on our capital management processes and industrial, commercial real estateactivities is included in the Supervision and equipment lease financing) nonperforming loans when we determine that a specific loan, or portion thereof, is uncollectible. This determination is based on the specific facts and circumstancesRegulation section of the individual loans. In making this determination, we consider the viabilityItem 1 of the business or project as a going concern, the past due status when the asset is not well-secured, the expected cash flows to repay the loan, the value of the collateral and the ability and willingness of any guarantors to perform. For commercial loans and leases less than a defined dollar threshold, balances are generally charged-off in full after 180 days for loans and 120 days for leases.our 2023 Form 10-K.
Consumer
We generally charge-off secured consumer (homemanage our funding and capital positions by making adjustments to our balance sheet size and composition, issuing or redeeming debt, issuing equity residential real estateor other capital instruments, executing treasury stock transactions and automobile) nonperforming loans to the fair
value of collateral less costs to sell if the fair value is lower than the amortized cost basis of the loan outstandingcapital redemptions or repurchases, and the delinquency of the loan, combined with other risk factors such as bankruptcy or lien position, indicates that the loan (or a portion thereof) is uncollectible as per our historical experience. These nonperforming loans would also be charged-off when the collateral has been repossessed. We charge-off secured consumer loans no later than 180 days past due. Most consumer loansmanaging dividend policies and lines of credit, not secured by automobiles or residential real estate, are charged-off once they have reached 120-180 days past due.retaining earnings.
For secured collateral dependent loans, collateral values are updatedIn the first quarter of 2024, PNC returned $0.8 billion of capital to shareholders, reflecting more than $0.6 billion of dividends on common shares and more than $0.1 billion of common share repurchases, representing 0.9 million shares. Consistent with the SCB framework, which allows for capital return in amounts in excess of the SCB minimum levels, our Board of Directors has authorized a repurchase framework under the previously approved repurchase program of up to 100 million common shares, of which approximately 44% were still available for repurchase at least annuallyMarch 31, 2024. In light of the Federal banking agencies proposed rules to adjust the Basel III capital framework, second quarter of 2024 share repurchase activity is expected to approximate the recent quarterly average share repurchase levels. PNC continues to evaluate the potential impact of the proposed rules and subsequent declines in collateral values are charged-off resulting in incremental provisionmay adjust share repurchase activity depending on market and economic conditions, as well as other factors. PNC’s SCB for credit loss. Subsequent increases in collateral values may be reflected as an adjustment to the ALLL to reflectfour-quarter period beginning October 1, 2023 is the expectationregulatory minimum of recoveries in an amount greater than previously expected, limited to amounts previously charged-off.2.5%.
Accounting for Nonperforming Assets and Leases and Other Nonaccrual Loans
For nonaccrual loans, interest income accrual and deferred fee/cost recognition is discontinued. Additionally, dependingOn April 3, 2024 the PNC Board of Directors declared a quarterly cash dividend on whether the accrued interest has been incorporated into the ACL estimates, as discussed in the Accrued Interest sectioncommon stock of this Note 1, the accrued and uncollected interest is either reversed through Net interest income (if a CECL reserve is not maintained for accrued interest) or charged-off against the allowance (if a CECL reserve is maintained for accrued interest), except for credit cards, where we reverse any accrued interest through Net interest income$1.55 per share to be paid on May 6, 2024 to shareholders of record at the timeclose of charge-off, as per industry standard practice. Nonaccrual loans that are also collateral dependent may be charged-off to reduce the basis to the fair value of collateral less costs to sell.business April 15, 2024.
If payment is received on a nonaccrual loan, generally the payment is first applied to the remaining principal balance. Payments are then applied to recover any charged-off amounts related to the loan. Finally, if both principal balance and any charge-offs have been recovered, then the payment will be recorded as fee and interest income. For certain consumer loans, the receipt of interest payments is recognized as interest income on a cash basis. Cash basis income recognition is applied if a loan’s amortized cost basis is deemed fully collectible and the loan has performed for at least six months. For loans modified due to a borrower experiencing financial difficulty, payments are applied based upon their contractual terms unless the related loan is deemed nonperforming. Loans modified due to a borrower experiencing financial difficulty are generally included in nonperforming and nonaccrual loans if they are not government insured or guaranteed. However, after a reasonable period of time, generally six months, in which the loan performs under modified terms and meets other performance indicators, it is returned to performing/accruing status. This return to performing/accruing status demonstrates that the bank expects to collect all of the loan’s remaining contractual principal and interest. Loan modifications granted
5030 The PNC Financial Services Group, Inc. – Form 10-Q
The following table summarizes our Basel III capital balances and ratios:
Table 30: Basel III Capital
| | | | | | | | |
| March 31, 2024 |
| Dollars in millions | Basel III (a) | Fully Implemented
(estimated) (b) |
| Common equity Tier 1 capital | | |
| Common stock plus related surplus, net of treasury stock | $ | (3,774) | | $ | (3,774) | |
| Retained earnings | 57,154 | | 56,913 | |
| | |
| | |
| Goodwill, net of associated deferred tax liabilities | (10,700) | | (10,700) | |
| Other disallowed intangibles, net of deferred tax liabilities | (282) | | (282) | |
| Other adjustments/(deductions) | (88) | | (90) | |
| | |
| | |
| Common equity Tier 1 capital (c) | $ | 42,310 | | $ | 42,067 | |
| Additional Tier 1 capital | | |
| Preferred stock plus related surplus | 6,242 | | 6,242 | |
| | |
| Tier 1 capital | $ | 48,552 | | $ | 48,309 | |
| Additional Tier 2 capital | | |
| Qualifying subordinated debt | 2,874 | | 2,874 | |
| | |
| Eligible credit reserves includable in Tier 2 capital | 5,018 | | 5,220 | |
| Total Basel III capital | $ | 56,444 | | $ | 56,403 | |
| Risk-weighted assets | | |
| Basel III standardized approach risk-weighted assets (d) | $ | 420,342 | | $ | 420,397 | |
| Average quarterly adjusted total assets | $ | 556,568 | | $ | 556,326 | |
| Supplementary leverage exposure (e) | $ | 667,048 | | $ | 667,047 | |
| Basel III risk-based capital and leverage ratios (f) | | |
| Common equity Tier 1 | 10.1 | % | 10.0 | % |
| Tier 1 | 11.6 | % | 11.5 | % |
| Total | 13.4 | % | 13.4 | % |
| Leverage (g) | 8.7 | % | 8.7 | % |
| Supplementary leverage ratio (e) | 7.3 | % | 7.2 | % |
(a)The ratios are calculated to reflect PNC’s election to adopt the CECL five-year transition provisions. Effective for the first quarter 2022, PNC is now in the three-year transition period and the full impact of the CECL standard is being phased-in to regulatory capital through December 31, 2024.
(b)The ratios are calculated to reflect the full impact of CECL and exclude the benefits of the optional five-year transition.
(c)As permitted, PNC and PNC Bank have elected to exclude AOCI related to both available for sale securities and pension and other post-retirement plans from CET1 capital.
(d)Basel III standardized approach risk-weighted assets are based on the Basel III standardized approach rules and include credit and market risk-weighted assets.
(e)The Supplementary leverage ratio is calculated based on Tier 1 capital divided by Supplementary leverage exposure, which takes into account the quarterly average of both on balance sheet assets as well as certain off-balance sheet items, including loan commitments and potential future exposure under derivative contracts.
(f)All ratios are calculated using the regulatory capital methodology applicable to PNC and calculated based on the standardized approach.
(g)Leverage ratio is calculated based on Tier 1 capital divided by Average quarterly adjusted total assets.
PNC’s regulatory risk-based capital ratios are calculated using the standardized approach for determining risk-weighted assets. Under the standardized approach for determining credit risk-weighted assets, exposures are generally assigned a pre-defined risk weight. Exposures to high volatility commercial real estate, nonaccruals, FDMs, past due exposures and equity exposures are generally subject to higher risk weights than other types of exposures.
The regulatory agencies have adopted a rule permitting certain banks, including PNC, to delay the estimated impact on regulatory capital stemming from implementing CECL. CECL’s estimated impact on CET1 capital, as defined by the rule, is the change in retained earnings at adoption plus or minus 25% of the change in CECL ACL at the balance sheet date, excluding the allowance for PCD loans, compared to CECL ACL at adoption. Effective for the first quarter of 2022, PNC is now in the three-year transition period, and the full impact of the CECL standard is being phased-in to regulatory capital through December 31, 2024. See additional discussion of this rule in the Supervision and Regulation section of Item 1 Business and Item 1A Risk Factors of our 2023 Form 10-K.
At March 31, 2024, PNC and PNC Bank were considered “well capitalized” based on applicable U.S. regulatory capital ratio requirements. To qualify as “well capitalized,” PNC must have Basel III capital ratios of at least 6% for Tier 1 risk-based capital and 10% for Total risk-based capital, and PNC Bank must have Basel III capital ratios of at least 6.5% for Common equity Tier 1 risk-based capital, 8% for Tier 1 risk-based capital, 10% for Total risk-based capital and a Leverage ratio of at least 5%.
The PNC Financial Services Group, Inc. – Form 10-Q 31
Federal banking regulators have stated that they expect the largest U.S. BHCs, including PNC, to have a level of regulatory capital well in excess of the regulatory minimum and have required the largest U.S. BHCs, including PNC, to have a capital buffer sufficient to withstand losses and allow them to meet the credit needs of their customers through estimated stress scenarios. We seek to manage our capital consistent with these regulatory principles, and we believe that our March 31, 2024 capital levels were aligned with them.
We provide additional information regarding regulatory capital requirements and some of their potential impacts, including the proposed rules to adjust the Basel III framework, in the Supervision and Regulation section of Item 1 Business, Item 1A Risk Factors and Note 19 Regulatory Matters in our 2023 Form 10-K.
Market Risk Management
See the Market Risk Management portion of the Risk Management section in our 2023 Form 10-K for additional discussion regarding market risk.
Market Risk Management – Interest Rate Risk
Interest rate risk results primarily from our traditional banking activities of gathering deposits and extending loans. Many factors, including economic and financial conditions, movements in interest rates and consumer preferences, affect the difference between the interest that we earn on assets and the interest that we pay on liabilities and the level of our noninterest-bearing funding sources. Due to the repricing term mismatches and embedded options inherent in certain of these products, changes in market interest rates not only affect expected near-term earnings, but also the economic values of these assets and liabilities.
Our Asset and Liability Management group centrally manages interest rate risk as prescribed in our market risk-related risk management policies, which are approved by management’s ALCO and the Risk Committee of the Board of Directors.
PNC utilizes sensitivities of NII and EVE to a set of interest rate scenarios to identify and measure its short-term and long-term structural interest rate risks.
NII Sensitivity results for the first quarters of 2024 and 2023 follow:
Table 31: Net Interest Income Sensitivity Analysis | | | | | | | | | | | | | | |
| First Quarter 2024 | | First Quarter 2023 | |
| Net Interest Income Sensitivity Simulation (a) | | | | |
| Effect on NII in first year from shocked interest rate: | | | | |
| 200 basis point instantaneous increase | (0.2) | % | | 2.5 | % | |
| 200 basis point instantaneous decrease | (0.2) | % | | (3.3) | % | |
| | | | |
| | | | |
| | | | |
| | | | |
| | | | |
| | | | |
| | | | |
| | | | |
| | | | |
(a) The effect on NII in the first year from a 100 basis point instantaneous increase or decrease is not materially different from the 200 basis point scenarios as disclosed above.
When forecasting net interest income, we make certain key assumptions that can materially impact the resulting sensitivities, including the following:
Future Balance Sheet Composition: Our balance sheet composition is dynamic and based on our forecasted expectations. As of the first quarter of 2024, the projected balance sheet composition by the end of year one is generally consistent with the spot composition as of the first quarter of 2024.
Deposit Betas: Deposit pricing changes are primarily driven by changes in the Federal Funds rate, with the relationship between deposit rates and Federal Funds rate defined as deposit beta. We define cumulative deposit beta as the change in deposit rate paid on interest-bearing non-maturity deposits divided by the change in the upper level of the stated Federal Funds rate range since the first quarter of 2022, the start of the current rising rate cycle. As of March 31, 2024 PNC’s cumulative deposit beta was 45%, an increase from 35% at March 31, 2023. For interest rate risk modeling, PNC uses dynamic beta models to adjust assumed repricing sensitivity depending on market rate levels as well as other factors. The dynamic beta assumptions reflect historical experience and future expectations. Our scenario assumes that deposit betas increased slightly from current levels. Actual deposit rates paid may differ from modeled projections due to variables such as competition for deposits and customer behavior.
Asset Prepayments: PNC includes prepayment assumptions for both loan and investment portfolios. Mortgage and home equity portfolios utilize an industry standard model to drive estimated prepayments that increase in lower rate environments. Commercial and consumer loan portfolios assume static constant prepayment rates that are consistent across rate scenarios, as those portfolios historically do not exhibit significantly different prepayment behaviors based upon the level of market rates.
Impact of Derivatives: PNC uses interest rate derivatives to hedge floating rate commercial loans. PNC had $36.5 billion in receive fix / pay float swaps as of March 31, 2024, with a weighted average duration of 2.0 years and an average fixed rate of 2.30%. As of March 31, 2024 PNC also had collars in place, reflecting $12.5 billion of caps and $12.5 billion of floors, that are used to hedge these
32 The PNC Financial Services Group, Inc. – Form 10-Q
commercial loans. Additionally, PNC utilizes receive fix / pay float swaps as a means of hedging fixed rate debt. See Note 12 Financial Derivatives in this report for additional information on how we use derivatives to borrowers experiencing financial difficulty resulting from (i) borrowers thathedge commercial loans and fixed rate debt.
EVE sensitivity results for the first quarter of 2024 and 2023 follow:
Table 32: Economic Value of Equity Sensitivity Analysis
| | | | | | | | | | | |
| First Quarter 2024 | First Quarter 2023 | |
| Economic Value of Equity Sensitivity Simulation | | | |
| 200 basis point instantaneous increase | (5.7) | % | (4.3) | % | |
| 200 basis point instantaneous decrease | (1.6) | % | (4.9) | % | |
EVE measures the present value of all projected future cash flows associated with a point-in-time balance sheet and does not include projected new volume. EVE sensitivity to interest rate changes is a complementary metric to NII sensitivity analysis and represents an estimation of long-term interest rate risk. PNC calculates its EVE sensitivity by measuring the changes in the economic value of assets, liabilities and off-balance sheet instruments in response to an instantaneous +/-200 bps parallel shift in interest rates. Similar to the NII sensitivity analysis, we incorporate dynamic deposit repricing and loan prepayment assumptions. These methodologies are largely consistent between the EVE and NII sensitivity analyses. Additionally, deposit attrition is a significant contributor to EVE sensitivity. Deposit attrition is projected based on a dynamic model developed using long-term historical deposit behavior in addition to management assumptions including accelerated attrition for pandemic related excess deposits. PNC performs various sensitivity analyses to understand the impact of faster and slower deposit attrition on our risk metrics, with the results reported to ALCO.
Compared to the first quarter of 2023, there have been discharged from personal liability through Chapter 7 bankruptcyno material changes to our NII sensitivity and EVE sensitivity assumptions, including data sources that drive assumptions setting.
Market Risk Management – Customer-Related Trading Risk
We engage in fixed income securities, derivatives and foreign exchange transactions to support our customers’ investing and hedging activities. These transactions, related hedges and the credit valuation adjustment related to our customer derivatives portfolio are marked-to-market daily and reported as customer-related trading activities. We do not engage in proprietary trading of these products.
We use VaR as the primary means to measure and monitor market risk in customer-related trading activities. VaR is used to estimate the probability of portfolio losses based on the statistical analysis of historical market risk factors. VaR is calculated for each of the portfolios that comprise our customer-related trading activities of which the majority are covered positions as defined by the Market Risk Rule. VaR is computed with positions and market risk factors updated daily to ensure each portfolio is operating within its acceptable limits. See the Market Risk Management – Customer-Related Trading Risk section of our 2023 Form 10-K for more information on our models used to calculate VaR and our backtesting process.
Customer-related trading revenue was $16 million for the three months ended March 31, 2024, compared to $84 million for the three months ended March 31, 2023. The decrease was primarily due to lower derivative client sales revenues, partially offset by securities underwriting client revenues.
Market Risk Management – Equity And Other Investment Risk
Equity investment risk is the risk of potential losses associated with investing in both private and public equity markets. In addition to extending credit, taking deposits, underwriting securities and trading financial instruments, we make and manage direct investments in a variety of transactions, including management buyouts, recapitalizations and growth financings in a variety of industries. We also have not formally reaffirmed their loan obligations to us,investments in affiliated and (ii) borrowersnon-affiliated funds that are not currently obligated to make both principal and interest payments under the modified terms are not returned to accrual status.
Other nonaccrual loans are generally not returned to accrual status until the borrower has performedsimilar investments in accordanceprivate equity, consistent with the contractual termsregulatory limitations. The economic and/or book value of these investments and other performance indicatorsassets are directly affected by changes in market factors.
Various PNC business units manage our equity and other investment activities. Our businesses are responsible for making investment decisions within the approved policy limits and associated guidelines.
A summary of our equity investments follows:
Table 33: Equity Investments Summary
| | | | | | | | | | | | | | | | | | | | | | | | | | |
| | March 31, 2024 | | December 31, 2023 | | Change | |
| Dollars in millions | | $ | | % | |
| Tax credit investments | $ | 4,233 | | | $ | 4,331 | | | $ | (98) | | | (2) | % | |
| Private equity and other | 4,047 | | | 3,983 | | | 64 | | | 2 | % | |
| Total | $ | 8,280 | | | $ | 8,314 | | | $ | (34) | | | — | | |
The PNC Financial Services Group, Inc. – Form 10-Q 33
Tax Credit Investments
Included in our equity investments are direct tax credit investments and equity investments held by consolidated entities. These tax credit investment balances included unfunded commitments totaling $2.2 billion and $2.5 billion at least six months, the period of time which was determined to demonstrate the expected collection of the loan’s remaining contractual principalMarch 31, 2024 and interest. Nonaccrual loans with partially charged-off principalDecember 31, 2023, respectively. These unfunded commitments are not returned to accrual. When a nonperforming loan is returned to accrual status, it is then considered a performing loan.
Foreclosed assets consist of any asset seized or property acquired through a foreclosure proceeding or acceptance of a deed-in-lieu of foreclosure. OREO comprises principally residential and commercial real estate properties obtained in partial or total satisfaction of loan obligations. After obtaining a foreclosure judgment, or in some jurisdictions the initiation of proceedings under a power of sale in the loan instruments, the property will be sold. When we are awarded title or completion of deed-in-lieu of foreclosure, we transfer the loan to foreclosed assets included in Other assetsliabilities on our Consolidated Balance Sheet. Property obtained
Note 4 Loan Sale and Servicing Activities and Variable Interest Entities in satisfactionour 2023 Form 10-K has further information on tax credit investments.
Private Equity and Other
The largest component of a loanour other equity investments is initially recordedour private equity portfolio. The private equity portfolio is an illiquid portfolio consisting of mezzanine and equity investments that vary by industry, stage and type of investment. Private equity investments carried at estimated fair value less costtotaled $2.2 billion at both March 31, 2024 and December 31, 2023. As of March 31, 2024, $2.0 billion was invested directly in a variety of companies and $0.2 billion was invested indirectly through various private equity funds.
Included in our other equity investments are Visa Class B-1 common shares, which are recorded at cost. Visa Class B-1 common shares that we own are transferable only under limited circumstances until they can be converted into shares of the publicly-traded Class A common shares, which cannot happen until the resolution of the pending interchange litigation, subject to sell.the exchange offer described in Note 16 Subsequent Events. Based upon the March 31, 2024 per share closing price of $279.08for a Visa Class A common share, the estimated value of our total investment in the Class B-1 common shares was approximately $1.6 billion at the current conversion rate of Visa B-1 shares to Visa A shares, while our cost basis was insignificant. The estimated value does not represent fair value less cost to sell, the amortized cost basis of the loan is adjustedVisa B-1 common shares given the shares’ limited transferability and the lack of observable transactions in the marketplace. See Note 14 Fair Value and Note 20 Legal Proceedings in our 2023 Form 10-K and Note 13 Legal Proceedings in this Report for additional information regarding our Visa agreements. See Note 16 Subsequent Events for additional details on Visa’s recently announced exchange offer for Visa Class B-1 common stock.
We also have certain other equity investments, the majority of which represent investments in affiliated and non-affiliated funds with both traditional and alternative investment strategies. Net gains (losses) related to these investments were $(6) million for the three months ended March 31, 2024 and $21 million for the three months ended March 31, 2023.
Financial Derivatives
We use a charge-off/recovery is recognizedvariety of financial derivatives as part of the overall asset and liability risk management process to help manage exposure to market (primarily interest rate) and credit risk inherent in our business activities. We also enter into derivatives with customers to facilitate their risk management activities.
Financial derivatives involve, to varying degrees, market and credit risk. Derivatives represent contracts between parties that usually require little or no initial net investment and result in one party delivering cash or another type of asset to the ALLL. We estimate fair values primarilyother party based on appraisals,a notional and an underlying as specified in the contract. Therefore, cash requirements and exposure to credit risk are significantly less than the notional amount on these instruments.
Further information on our financial derivatives is presented in Note 1 Accounting Policies, Note 14 Fair Value and Note 15 Financial Derivatives in our 2023 Form 10-K and in Note 11 Fair Value and Note 12 Financial Derivatives in this Report.
Not all elements of market and credit risk are addressed through the use of financial derivatives, and such instruments may be ineffective for their intended purposes due to unanticipated market changes, among other reasons.
RECENT REGULATORY DEVELOPMENTS
Federal agencies and states, including the federal agencies responsible for the Federal Acquisition Regulations, California, and most recently in March 2024, the SEC, have separately proposed or sales agreements withfinalized rules that would require certain companies or government contractors, such as PNC or PNC Bank, to disclose significant amounts of climate-related information. This information includes qualitative and quantitative disclosures of material climate-related risks and their impact, governance and management, targets and goals, and greenhouse gas emissions. The greenhouse gas emissions disclosures include the company’s direct emissions from owned or controlled sources (Scope 1) and indirect emissions from the company’s consumption of energy purchased from third parties. Subsequently, foreclosed assets are valued atparties (Scope 2), and in the lowercase of the amount recorded at acquisition dateFederal Acquisition Regulations proposal for a “major contractor” and California laws, disclosures related to indirect emissions from upstream and downstream activities in the company’s value chain (Scope 3). If and when all the rules are finalized, PNC and PNC Bank may face potentially differing standards from the agencies or estimatedCalifornia. Numerous lawsuits have challenged the SEC and California rules, and on April 4, 2024, the SEC voluntarily stayed implementation of its final rules pending resolution of the lawsuits challenging the SEC rules.
34 The PNC Financial Services Group, Inc. – Form 10-Q
CRITICAL ACCOUNTING ESTIMATESAND JUDGMENTS
Our consolidated financial statements are prepared by applying certain accounting policies. Note 1 Accounting Policies in our 2023 Form 10-K describes the most significant accounting policies that we use. Certain of these policies require us to make estimates or economic assumptions that may vary under different assumptions or conditions, and such variations may significantly affect our reported results and financial position for the period or in future periods. The policies and judgments related to residential and commercial MSRs and Level 3 fair value less costmeasurements are described in Critical Accounting Estimates and Judgments in our 2023 Form 10-K. The following details the critical estimates and judgments around the ACL.
Allowance for Credit Losses
We maintain the ACL at levels that we believe to sell. Valuation adjustmentsbe appropriate as of the balance sheet date to absorb expected credit losses on theseour existing investment securities, loans, equipment finance leases, other financial assets and gainsunfunded lending related commitments, for the remaining estimated contractual term of the assets or exposures, taking into consideration expected prepayments and estimated recoveries. Our determination of the ACL is based on historical loss and performance experience, as well as current borrower and transaction characteristics including collateral type and quality, current economic conditions, reasonable and supportable forecasts of future economic conditions and other relevant factors. We use methods sensitive to changes in economic conditions to interpret these factors and to estimate expected credit losses. We evaluate and, when appropriate, enhance the quality of our data and models and other methods used to estimate the ACL on an ongoing basis. We incorporate qualitative factors in the ACL that reflect our best estimate of expected losses realized from dispositionthat may not be adequately represented in our quantitative methods or economic assumptions. The major drivers of such propertyACL estimates include, but are not limited to:
•Current economic conditions: Our forecast of expected losses depends on economic conditions as of the estimation date. As current economic conditions evolve, forecasted losses could be materially affected.
•Scenario weights and design: Our loss estimates are sensitive to the shape, direction and rate of change of macroeconomic forecasts and thus vary significantly between upside and downside scenarios. Changes to the probability weights assigned to these scenarios and the timing of peak business cycles reflected in Other noninterest expense.by the scenarios could materially affect our loss estimates.
•Current borrower quality: Our forecast of expected losses depends on current borrower and transaction characteristics, including credit metrics and collateral type/quality. As borrower quality evolves, forecasted losses could be materially affected.
•Portfolio composition: Changes to portfolio volume and mix could materially affect our estimates, as CECL reserves
would be recognized upon origination or acquisition and derecognized upon paydown, maturity or sale.
For certain mortgageall assets and unfunded lending related commitments within the scope of the CECL standard, the applicable ACL is composed of one or a combination of the following components: (i) collectively assessed or pooled reserves, (ii) individually assessed reserves, and
(iii) qualitative (judgmental) reserves. Our methodologies and key assumptions for each of these components are discussed in Note 1
Accounting Policies in our 2023 Form 10-K.
Reasonable and Supportable Economic Forecast
Pursuant to the CECL standard, we are required to consider reasonable and supportable forecasts in estimating expected credit losses. For this purpose, we have established a framework that includes a three-year forecast period and the use of four economic scenarios with associated probability weights, which in combination create a forecast of expected economic outcomes. Credit losses estimated in our reasonable and supportable forecast period are sensitive to the shape and severity of the scenarios used and weights assigned to them.
To forecast the distribution of economic outcomes over the reasonable and supportable forecast period, we generate four economic forecast scenarios using a combination of quantitative macroeconomic models, other measures of economic activity and forward-looking expert judgment. Each scenario is then given an associated probability (weight) to represent our current expectation within that distribution over the forecast period. This process is informed by current economic conditions, expected business cycle evolution and the expert judgment of PNC’s RAC. This approach seeks to provide a reasonable representation of the forecast of expected economic outcomes and is used to estimate expected credit losses across a variety of loans, securities and other financial assets. Each quarter, the scenarios and their respective weights are presented to RAC for approval.
The scenarios used for the period ended March 31, 2024 consider, among other factors, ongoing inflationary pressures and the corresponding tightness of monetary policy and credit availability. While recession risks remain elevated, our most-likely expectation at March 31, 2024 is that havethe U.S. economy narrowly avoids a government guarantee, we establishrecession in 2024.
We used a separate other receivable upon foreclosure.number of economic variables in our scenarios, with two of the most significant drivers being real GDP and the U.S. unemployment rate. The receivable is measuredfollowing table presents a comparison of these two economic variables based on the loan balance (inclusive of principalweighted-average scenario forecasts used in determining our ACL at March 31, 2024 and interest) thatDecember 31, 2023.
The PNC Financial Services Group, Inc. – Form 10-Q 35
Table 34: Key Macroeconomic Variables in CECL Weighted-Average Scenarios
| | | | | | | | | | | |
| Assumptions as of March 31, 2024 |
| 2024 | 2025 | 2026 |
| U.S. real GDP (a) | 0.8% | 1.7% | 2.1% |
| U.S. unemployment rate (b) | 4.6% | 4.8% | 4.3% |
| Assumptions as of December 31, 2023 |
| 2024 | 2025 | 2026 |
| U.S. real GDP (a) | 0.1% | 1.5% | 2.0% |
| U.S. unemployment rate (b) | 4.5% | 4.6% | 4.2% |
(a)Represents year-over-year growth (loss) rates.
(b)Represents quarterly average rate at December 31, 2024, 2025 and 2026, respectively.
Real GDP growth is expected to be recoveredend 2024 at 0.8% on a weighted average basis, up from the guarantor.0.1% assumed at December 31, 2023, primarily due to stronger expected economic activity in 2024 than what was expected at the end of 2023. Growth then rises to 1.7% in 2025, before growing to 2.1% in 2026. The weighted-average unemployment rate is expected to end 2024 at 4.6%, up slightly from the 4.5% assumed at December 31, 2023. During the second half of 2025, the weighted-average unemployment increases to a peak of 5.0% before gradually improving to 4.8% by the fourth quarter of 2025. Further improvement is then expected in 2026 with the rate reaching 4.3% by the fourth quarter of 2026.
The current state of the economy continues to reflect uncertainty due to the foundational change in office demand from the acceptance of remote work, combined with inflationary pressures, interest rate movements, and declining consumer savings and deposit balances. As such, for both our commercial and consumer loan portfolios, PNC identified and performed significant analyses around segments impacted by such uncertainties to ensure our reserves are adequate, given our current macroeconomic expectations.
We believe the economic scenarios effectively reflect the distribution of potential economic outcomes. Additionally, through in-depth and granular analysis we have addressed reserve requirements for the specific populations most affected in the current environment. Through this approach, we believe the reserve levels appropriately reflect the expected credit losses in the portfolio as of the balance sheet date.
See the following for additional information related to our ACL:
•Allowance for Credit Losses in the Credit Risk Management section of this Financial Review,
•Note 2 Investment Securities, and Note 3 Loans and Related Allowance for Credit Losses in this Report, and
•Note 1 Accounting Policies in our 2023 Form 10-K.
36 The PNC Financial Services Group, Inc. – Form 10-Q
Recently Issued Accounting Standards
| | | | | | | | |
| Accounting Standards Update | Description | Financial Statement Impact |
Improvements to Reportable Segment Disclosures - ASU 2023-07
Issued November 2023
| • Required with issuance of 2024 Form 10-K; early adoption is permitted. • Requires that a public entity disclose significant segment expenses that are regularly provided to the chief operating decision maker (CODM) and included within each reported measure of segment profit or loss. • Requires that a public entity disclose an amount for other segment items by reportable segment and a description of its composition. • Requires that a public entity provide all annual disclosures about a reportable segment’s profit or loss and assets currently required by ASC 280 in interim periods. • Clarifies that if the CODM uses more than one measure of a segment’s profit or loss in assessing segment performance and deciding how to allocate resources, a public entity may report one or more of those additional measures of segment profit. • Requires that a public entity disclose the title and position of the CODM and an explanation of how the CODM uses the reported measure(s) of segment profit or loss in assessing segment performance and deciding how to allocate resources. • Requires a retrospective transition approach for all prior periods presented in the financial statements. | • We are currently evaluating the disclosure requirements within this ASU and do not plan to early adopt. • This ASU will not impact our Consolidated Income Statement, Consolidated Statement of Comprehensive Income, Consolidated Balance Sheet, Consolidated Statement of Changes in Equity, or Consolidated Statement of Cash Flows. • We expect to provide enhanced disclosures of significant segment level noninterest expenses as a result of this ASU.
|
| Accounting Standards Update | Description | Financial Statement Impact |
Improvements to Income Tax Disclosures - ASU 2023-09
Issued December 2023 | • Required effective date of January 1, 2025; early adoption is permitted. • Requires public business entities to, on an annual basis, (1) disclose specific categories in the rate reconciliation and (2) provide additional information for reconciling items that meet a quantitative threshold. • Requires that all entities disclose, on an annual basis, (1) the amount of income taxes paid (net of refunds received), disaggregated by federal (national), state and foreign taxes, and (2) the amount of income taxes paid (net of refunds received), disaggregated by individual jurisdictions in which income taxes paid (net of refunds received) is equal to or greater than 5 percent of total income taxes paid (net of refunds received). • Requires a prospective transition approach, with an optional retrospective transition approach. | • We are currently evaluating the disclosure requirements within this ASU. • This ASU will not impact our Consolidated Income Statement, Consolidated Statement of Comprehensive Income, Consolidated Balance Sheet, Consolidated Statement of Changes in Equity, or Consolidated Statement of Cash Flows. • We expect to provide additional disaggregated income tax disclosures in accordance with this ASU. • We are evaluating when to adopt the amendments of this ASU. |
Recently Adopted Accounting Pronouncements
See Note 1 Accounting Policies in our 2023 Form 10-K for additional informationrecently adopted accounting standards. We did not adopt any new accounting standards during the first quarter of 2024 that impacted our financial statements.
INTERNAL CONTROLS AND DISCLOSURE CONTROLS AND PROCEDURES
As of March 31, 2024, we performed an evaluation under the supervision of and with the participation of our management, including the Chairman and Chief Executive Officer and the Executive Vice President and Chief Financial Officer, of the effectiveness of the design and operation of our disclosure controls and procedures and of changes in our internal control over financial reporting.
Based on FDMs, nonperforming assetsthat evaluation, our Chairman and creditChief Executive Officer and our Executive Vice President and Chief Financial Officer concluded that our disclosure controls and procedures (as defined in Rule 13a-15(e) under the Securities Exchange Act of 1934) were effective as of March 31, 2024, and that there has been no change in PNC’s internal control over financial reporting that occurred
The PNC Financial Services Group, Inc. – Form 10-Q 37
during the first quarter of 2024 that has materially affected, or is reasonably likely to materially affect, our internal control over financial reporting.
CAUTIONARY STATEMENT REGARDING FORWARD-LOOKING INFORMATION
We make statements in this Report, and we may from time to time make other statements, regarding our outlook for financial performance, such as earnings, revenues, expenses, tax rates, capital and liquidity levels and ratios, asset levels, asset quality, indicatorsfinancial position, and other matters regarding or affecting us and our future business and operations, including our sustainability strategy, that are forward-looking statements within the meaning of the Private Securities Litigation Reform Act. Forward-looking statements are typically identified by words such as “believe,” “plan,” “expect,” “anticipate,” “see,” “look,” “intend,” “outlook,” “project,” “forecast,” “estimate,” “goal,” “will,” “should” and other similar words and expressions.
Forward-looking statements are necessarily subject to numerous assumptions, risks and uncertainties, which change over time. Future events or circumstances may change our outlook and may also affect the nature of the assumptions, risks and uncertainties to which our forward-looking statements are subject. Forward-looking statements speak only as of the date made. We do not assume any duty and do not undertake any obligation to update forward-looking statements. Actual results or future events could differ, possibly materially, from those anticipated in forward-looking statements, as well as from historical performance. As a result, we caution against placing undue reliance on any forward-looking statements.
Our forward-looking statements are subject to the following principal risks and uncertainties.
•Our businesses, financial results and balance sheet values are affected by business and economic conditions, including:
–Changes in interest rates and valuations in debt, equity and other financial markets,
–Disruptions in the U.S. and global financial markets,
–Actions by the Federal Reserve Board, U.S. Treasury and other government agencies, including those that impact money supply, market interest rates and inflation,
–Changes in customer behavior due to changing business and economic conditions or legislative or regulatory initiatives,
–Changes in customers’, suppliers’ and other counterparties’ performance and creditworthiness,
–Impacts of sanctions, tariffs and other trade policies of the U.S. and its global trading partners,
–Impacts of changes in federal, state and local governmental policy, including on the regulatory landscape, capital markets, taxes, infrastructure spending and social programs,
–Our ability to attract, recruit and retain skilled employees, and
–Commodity price volatility.
•Our forward-looking financial statements are subject to the risk that economic and financial market conditions will be substantially different than those we are currently expecting. These statements are based on our views that:
–PNC’s baseline forecast is for slower economic growth in 2024 as consumer spending growth slows and higher interest rates remain a drag on the economy. The ongoing strength of the labor market will continue to support consumer spending. The FOMC is indicating that it will start to cut the federal funds rate later this year, with rate cuts supporting economic growth toward the end of 2024.
–Real GDP growth this year will be close to its trend of 2% and the unemployment rate will increase modestly to just above 4% by the end of 2024. Inflation will continue to slow as wage pressures abate, moving back to the Federal Reserve’s 2% long-term objective by the end of 2025.
–PNC expects the federal funds rate to remain unchanged between 5.25% and 5.50% through at least the first half of 2024, with federal funds rate cuts starting in the third quarter as inflationary pressures ease further. PNC expects two federal funds rate cuts in 2024, with the rate ending this year in a range between 4.75% and 5.00%.
•PNC’s ability to take certain capital actions, including returning capital to shareholders, is subject to PNC meeting or exceeding minimum capital levels, including a stress capital buffer established by the Federal Reserve Board in connection with the Federal Reserve Board’s CCAR process.
•PNC’s regulatory capital ratios in the future will depend on, among other things, PNC’s financial performance, the scope and terms of final capital regulations then in effect and management actions affecting the composition of PNC’s balance sheet. In addition, PNC’s ability to determine, evaluate and forecast regulatory capital ratios, and to take actions (such as capital distributions) based on actual or forecasted capital ratios, will be dependent at least in part on the development, validation and regulatory review of related models and the reliability of and risks resulting from extensive use of such models.
•Legal and regulatory developments could have an impact on our ability to operate our businesses, financial condition, results of operations, competitive position, reputation, or pursuit of attractive acquisition opportunities. Reputational impacts could affect matters such as business generation and retention, liquidity, funding and ability to attract and retain employees. These developments could include:
–Changes to laws and regulations, including changes affecting oversight of the financial services industry, changes in the enforcement and interpretation of such laws and regulations and changes in accounting and reporting standards.
38 The PNC Financial Services Group, Inc. – Form 10-Q
–Unfavorable resolution of legal proceedings or other claims and regulatory and other governmental investigations or other inquiries resulting in monetary losses, costs, or alterations in our business practices and potentially causing reputational harm to PNC.
–Results of the regulatory examination and supervision process, including our failure to satisfy requirements of agreements with governmental agencies.
–Costs associated with obtaining rights in intellectual property claimed by others and of adequacy of our intellectual property protection in general.
•Business and operating results are affected by our ability to identify and effectively manage risks inherent in our businesses, including, where appropriate, through effective use of systems and controls, third-party insurance, derivatives, and capital management techniques and to meet evolving regulatory capital and liquidity standards.
•Our reputation and business and operating results may be affected by our ability to appropriately meet or address environmental, social or governance targets, goals, commitments or concerns that may arise.
•We grow our business in part through acquisitions and new strategic initiatives. Risks and uncertainties include those presented by the nature of the business acquired or strategic initiative, including in some cases those associated with our entry into new businesses or new geographic or other markets and risks resulting from our inexperience in those new areas, as well as risks and uncertainties related to the acquisition transactions themselves, regulatory issues, the integration of the acquired businesses into PNC after closing or any failure to execute strategic or operational plans.
•Competition can have an impact on customer acquisition, growth and retention and on credit spreads and product pricing, which can affect market share, deposits and revenues. Our ability to anticipate and respond to technological changes can also impact our loan portfolio.ability to respond to customer needs and meet competitive demands.
•Business and operating results can also be affected by widespread manmade, natural and other disasters (including severe weather events), health emergencies, dislocations, geopolitical instabilities or events, terrorist activities, system failures or disruptions, security breaches, cyberattacks, international hostilities, or other extraordinary events beyond PNC’s control through impacts on the economy and financial markets generally or on us or our counterparties, customers or third-party vendors and service providers specifically.
We provide greater detail regarding these as well as other factors in our 2023 Form 10-K and elsewhere in this Report, including in the Risk Factors and Risk Management sections and the Legal Proceedings and Commitments Notes of the Notes To Consolidated Financial Statements in these reports. Our forward-looking statements may also be subject to other risks and uncertainties, including those discussed elsewhere in this Report or in our other filings with the SEC.
The PNC Financial Services Group, Inc. – Form 10-Q 39
CONSOLIDATED INCOME STATEMENT
THE PNC FINANCIAL SERVICES GROUP, INC.
| | | | | | | | | | | | | | | | | |
| Unaudited | Three months ended March 31 | | |
| In millions, except per share data | 2024 | | 2023 | | | | |
| Interest Income | | | | | | | |
| Loans | $ | 4,819 | | | $ | 4,258 | | | | | |
| Investment securities | 883 | | | 885 | | | | | |
| Other | 798 | | | 516 | | | | | |
| Total interest income | 6,500 | | | 5,659 | | | | | |
| Interest Expense | | | | | | | |
| Deposits | 2,077 | | | 1,291 | | | | | |
| Borrowed funds | 1,159 | | | 783 | | | | | |
| Total interest expense | 3,236 | | | 2,074 | | | | | |
| Net interest income | 3,264 | | | 3,585 | | | | | |
| Noninterest Income | | | | | | | |
| Asset management and brokerage | 364 | | | 356 | | | | | |
| Capital markets and advisory | 259 | | | 262 | | | | | |
| Card and cash management | 671 | | | 659 | | | | | |
| Lending and deposit services | 305 | | | 306 | | | | | |
| Residential and commercial mortgage | 147 | | | 177 | | | | | |
| Other | 135 | | | 258 | | | | | |
| Total noninterest income | 1,881 | | | 2,018 | | | | | |
| Total revenue | 5,145 | | | 5,603 | | | | | |
| Provision For Credit Losses | 155 | | | 235 | | | | | |
| Noninterest Expense | | | | | | | |
| Personnel | 1,794 | | | 1,826 | | | | | |
| Occupancy | 244 | | | 251 | | | | | |
| Equipment | 341 | | | 350 | | | | | |
| Marketing | 64 | | | 74 | | | | | |
| Other | 891 | | | 820 | | | | | |
| Total noninterest expense | 3,334 | | | 3,321 | | | | | |
| Income before income taxes and noncontrolling interests | 1,656 | | | 2,047 | | | | | |
| Income taxes | 312 | | | 353 | | | | | |
| Net income | 1,344 | | | 1,694 | | | | | |
| Less: Net income attributable to noncontrolling interests | 14 | | | 17 | | | | | |
| Preferred stock dividends | 81 | | | 68 | | | | | |
| Preferred stock discount accretion and redemptions | 2 | | | 2 | | | | | |
| Net income attributable to common shareholders | $ | 1,247 | | | $ | 1,607 | | | | | |
| Earnings Per Common Share | | | | | | | |
| Basic | $ | 3.10 | | | $ | 3.98 | | | | | |
| Diluted | $ | 3.10 | | | $ | 3.98 | | | | | |
| Average Common Shares Outstanding | | | | | | | |
| Basic | 400 | | | 401 | | | | | |
| Diluted | 400 | | | 402 | | | | | |
See accompanying Notes To Consolidated Financial Statements.
40 The PNC Financial Services Group, Inc. – Form 10-Q
CONSOLIDATED STATEMENT OF COMPREHENSIVE INCOME
THE PNC FINANCIAL SERVICES GROUP, INC.
| | | | | | | | | | | | | | |
Unaudited
In millions | | Three months ended March 31 | |
| 2024 | 2023 | | | |
| Net income | | $ | 1,344 | | $ | 1,694 | | | | |
| Other comprehensive income (loss), before tax and net of reclassifications into Net income | | | | | | |
| Net change in debt securities | | (179) | | 869 | | | | |
| Net change in cash flow hedge derivatives | | (250) | | 527 | | | | |
| Pension and other postretirement benefit plan adjustments | | (2) | | (10) | | | | |
| Net change in Other | | (2) | | 4 | | | | |
| Other comprehensive income (loss), before tax and net of reclassifications into Net income | | (433) | | 1,390 | | | | |
| Income tax benefit (expense) related to items of other comprehensive income | | 103 | | (326) | | | | |
| Other comprehensive income (loss), after tax and net of reclassifications into Net income | | (330) | | 1,064 | | | | |
| | | | | | |
| | | | | | |
| | | | | | |
| | | | | | |
| | | | | | |
| Comprehensive income | | 1,014 | | 2,758 | | | | |
| Less: Comprehensive income attributable to noncontrolling interests | | 14 | 17 | | | |
| Comprehensive income attributable to PNC | | $ | 1,000 | | $ | 2,741 | | | | |
See accompanying Notes To Consolidated Financial Statements.
The PNC Financial Services Group, Inc. – Form 10-Q 41
CONSOLIDATED BALANCE SHEET
THE PNC FINANCIAL SERVICES GROUP, INC.
| | | | | | | | | | | |
| Unaudited | March 31
2024 | | December 31
2023 |
| In millions, except par value |
| Assets | | | |
| Cash and due from banks | $ | 5,933 | | | $ | 6,921 | |
| Interest-earning deposits with banks | 53,612 | | | 43,804 | |
| Loans held for sale (a) | 743 | | | 734 | |
| Investment securities – available for sale | 42,280 | | | 41,785 | |
| Investment securities – held to maturity | 88,180 | | | 90,784 | |
| Loans (a) | 319,781 | | | 321,508 | |
| Allowance for loan and lease losses | (4,693) | | | (4,791) | |
| Net loans | 315,088 | | | 316,717 | |
| Equity investments | 8,280 | | | 8,314 | |
| Mortgage servicing rights | 3,762 | | | 3,686 | |
| Goodwill | 10,932 | | | 10,932 | |
| Other (a) | 37,352 | | | 37,903 | |
| Total assets | $ | 566,162 | | | $ | 561,580 | |
| Liabilities | | | |
| Deposits | | | |
| Noninterest-bearing | $ | 98,061 | | | $ | 101,285 | |
| Interest-bearing | 327,563 | | | 320,133 | |
| Total deposits | 425,624 | | | 421,418 | |
| Borrowed funds | | | |
| Federal Home Loan Bank borrowings | 37,000 | | | 38,000 | |
| Senior debt | 27,907 | | | 26,836 | |
| Subordinated debt | 4,827 | | | 4,875 | |
| Other (b) | 2,973 | | | 3,026 | |
| Total borrowed funds | 72,707 | | | 72,737 | |
| Allowance for unfunded lending related commitments | 672 | | | 663 | |
| Accrued expenses and other liabilities (b) | 15,785 | | | 15,621 | |
| Total liabilities | 514,788 | | | 510,439 | |
| Equity | | | |
| Preferred stock (c) | | | |
| Common stock ($5 par value, Authorized 800,000,000 shares, issued 543,116,260 and 543,116,271 shares) | 2,716 | | | 2,716 | |
| Capital surplus | 19,032 | | | 19,020 | |
| Retained earnings | 56,913 | | | 56,290 | |
| Accumulated other comprehensive income (loss) | (8,042) | | | (7,712) | |
| Common stock held in treasury at cost: 145,068,954 and 145,087,054 shares | (19,279) | | | (19,209) | |
| Total shareholders’ equity | 51,340 | | | 51,105 | |
| Noncontrolling interests | 34 | | | 36 | |
| Total equity | 51,374 | | | 51,141 | |
| Total liabilities and equity | $ | 566,162 | | | $ | 561,580 | |
(a)Our consolidated assets included the following for which we have elected the fair value option: Loans held for sale of $0.7 billion, Loans held for investment of $1.2 billion and Other assets of $0.1 billion at March 31, 2024. Comparable amounts at December 31, 2023 were $0.7 billion, $1.2 billion and $0.1 billion, respectively.
(b)Our consolidated liabilities included the following for which we have elected the fair value option: Other borrowed funds of less than $0.1 billion and Other liabilities of $0.1 billion at March 31, 2024. Comparable amounts at December 31, 2023 were less than $0.1 billion and $0.1 billion, respectively.
(c)Par value less than $0.5 million at each date.
See accompanying Notes To Consolidated Financial Statements.
42 The PNC Financial Services Group, Inc. – Form 10-Q
CONSOLIDATED STATEMENT OF CASH FLOWS
THE PNC FINANCIAL SERVICES GROUP, INC.
| | | | | | | | | | | | | | | | | |
Unaudited
In millions | | Three months ended March 31 | |
| 2024 | | 2023 | |
| Operating Activities | | | | | |
| Net income | | $ | 1,344 | | | $ | 1,694 | | |
| Adjustments to reconcile net income to net cash provided (used) by operating activities | | | | | |
| Provision for credit losses | | 155 | | | 235 | | |
| Depreciation, amortization and accretion | | 37 | | | 65 | | |
| Deferred income taxes (benefit) | | (44) | | | (30) | | |
| | | | | |
| Changes in fair value of mortgage servicing rights | | (43) | | | 174 | | |
| | | | | |
| | | | | |
| | | | | |
| Net change in | | | | | |
| Trading securities and other short-term investments | | 434 | | | (385) | | |
| Loans held for sale and related securitization activity | | 11 | | | (11) | | |
| Other assets | | (300) | | | 1,108 | | |
| Accrued expenses and other liabilities | | (263) | | | (1,142) | | |
| Other operating activities, net | | 427 | | | 168 | | |
| Net cash provided (used) by operating activities | | $ | 1,758 | | | $ | 1,876 | | |
| Investing Activities | | | | | |
| Sales | | | | | |
| Securities available for sale | | $ | (63) | | | $ | (73) | | |
| | | | | |
| Loans | | 96 | | | 215 | | |
| Repayments/maturities | | | | | |
| Securities available for sale | | 1,056 | | | 2,293 | | |
| Securities held to maturity | | 2,883 | | | 1,502 | | |
| Purchases | | | | | |
| Securities available for sale | | (1,766) | | | (612) | | |
| Securities held to maturity | | (56) | | | (1,324) | | |
| Loans | | (279) | | | (261) | | |
| Net change in | | | | | |
| Federal funds sold and resale agreements | | (4) | | | 32 | | |
| Interest-earning deposits with banks | | (9,808) | | | (6,580) | | |
| Loans | | 1,667 | | | (587) | | |
| | | | | |
| Other investing activities, net | | (91) | | | (317) | | |
| Net cash provided (used) by investing activities | | $ | (6,365) | | | $ | (5,712) | | |
The PNC Financial Services Group, Inc. – Form 10-Q 43
CONSOLIDATED STATEMENT OF CASH FLOWS
THE PNC FINANCIAL SERVICES GROUP, INC.
| | | | | | | | | | | | | | | | | |
| (Continued from previous page) | | | | | |
Unaudited
In millions | | Three months ended March 31 | |
| 2024 | | 2023 | |
| Financing Activities | | | | | |
| Net change in | | | | | |
| Noninterest-bearing deposits | | $ | (3,260) | | | $ | (6,462) | | |
| Interest-bearing deposits | | 7,430 | | | 7,023 | | |
| Federal funds purchased and repurchase agreements | | (167) | | | (94) | | |
| Short-term Federal Home Loan Bank borrowings | | | | | (50) | | |
| | | | | |
| Other borrowed funds | | 95 | | | (74) | | |
| Sales/issuances | | | | | |
| | | | | |
| Senior debt | | 2,490 | | | 2,743 | | |
| | | | | |
| Other borrowed funds | | 181 | | | 167 | | |
| Preferred stock | | | | | 1,484 | | |
| Common and treasury stock | | 24 | | | 26 | | |
| Repayments/maturities | | | | | |
| Federal Home Loan Bank borrowings | | (1,000) | | | (5) | | |
| Senior debt | | (1,050) | | | | | |
| Subordinated debt | | | | | (750) | | |
| Other borrowed funds | | (196) | | | (141) | | |
| | | | | |
| | | | | |
| Acquisition of treasury stock | | (223) | | | (459) | | |
| Preferred stock cash dividends paid | | (81) | | | (68) | | |
| Common stock cash dividends paid | | (624) | | | (607) | | |
| | | | | |
| Net cash provided (used) by financing activities | | $ | 3,619 | | | $ | 2,733 | | |
| Net Increase (Decrease) In Cash And Due From Banks And Restricted Cash | | $ | (988) | | | $ | (1,103) | | |
| | | | | |
| | | | | |
| Cash and due from banks and restricted cash at beginning of period | | 6,921 | | | 7,043 | | |
| Cash and due from banks and restricted cash at end of period | | $ | 5,933 | | | $ | 5,940 | | |
| | | | | |
| Cash And Due From Banks And Restricted Cash | | | | | |
| Cash and due from banks at end of period (unrestricted cash) | | $ | 4,999 | | | $ | 5,335 | | |
| Restricted cash | | 934 | | 605 | |
| Cash and due from banks and restricted cash at end of period | | $ | 5,933 | | | $ | 5,940 | | |
| Supplemental Disclosures | | | | | |
| Interest paid | | $ | 2,861 | | | $ | 1,691 | | |
| Income taxes paid | | $ | 35 | | | $ | 56 | | |
| Income taxes refunded | | $ | 6 | | | $ | 3 | | |
| Leased assets obtained in exchange for new operating lease liabilities | | $ | 75 | | | $ | 45 | | |
| | | | | |
| Non-cash Investing And Financing Items | | | | | |
| | | | | |
| Transfer from loans to loans held for sale, net | | $ | 8 | | | $ | 106 | | |
| | | | | |
| Transfer from loans to foreclosed assets | | $ | 13 | | | $ | 16 | | |
| | | | | |
See accompanying Notes To Consolidated Financial Statements.
44 The PNC Financial Services Group, Inc. – Form 10-Q
Allowance for Credit Losses
Our determination of the ACL is based on historical loss and performance experience, current borrower risk characteristics, current economic conditions, the reasonable and supportable forecasts of future economic conditions and other relevant factors.factors, including current borrower and/or transaction characteristics and assessments of the remaining estimated contractual term as of the balance sheet date. We maintain the ACL at an appropriate level for expected losses on our existing investment securities, loans, equipment finance leases, other financial assets and unfunded lending related commitments,commitments.
See Note 1 Accounting Policies and the Credit Risk Management section in our 2023 Form 10-K for additional discussion of our ACL, including details of our methodologies. See also the Critical Accounting Estimates and Judgments section of this Report for further discussion of the assumptions used in the determination of the ACL as of March 31, 2024.
The PNC Financial Services Group, Inc. – Form 10-Q 25
The following table summarizes our ACL related to loans:
Table 24: Allowance for Credit Losses by Loan Class (a)
| | | | | | | | | | | | | | | | | | | | | | | | | | | | | |
| | March 31, 2024 | | December 31, 2023 | |
Dollars in millions | | Allowance Amount | Total Loans | % of Total Loans | | Allowance Amount | Total Loans | % of Total Loans | |
| Allowance for loans and lease losses | | | | | | | | | |
| Commercial | | | | | | | | | |
| Commercial and industrial | | $ | 1,673 | | $ | 176,792 | | 0.95 | % | | $ | 1,806 | | $ | 177,580 | | 1.02 | % | |
| Commercial real estate | | 1,468 | | 35,591 | | 4.12 | % | | 1,371 | | 35,436 | | 3.87 | % | |
| Equipment lease financing | | 76 | | 6,462 | | 1.18 | % | | 82 | | 6,542 | | 1.25 | % | |
| Total commercial | | 3,217 | | 218,845 | | 1.47 | % | | 3,259 | | 219,558 | | 1.48 | % | |
| Consumer | | | | | | | | | |
| Residential real estate | | 39 | | 47,386 | | 0.08 | % | | 61 | | 47,544 | | 0.13 | % | |
| Home equity | | 272 | | 25,896 | | 1.05 | % | | 276 | | 26,150 | | 1.06 | % | |
| Automobile | | 173 | | 14,788 | | 1.17 | % | | 173 | | 14,860 | | 1.16 | % | |
| Credit card | | 749 | | 6,887 | | 10.88 | % | | 766 | | 7,180 | | 10.67 | % | |
| Education | | 56 | | 1,859 | | 3.01 | % | | 56 | | 1,945 | | 2.88 | % | |
| Other consumer | | 187 | | 4,120 | | 4.54 | % | | 200 | | 4,271 | | 4.68 | % | |
| Total consumer | | 1,476 | | 100,936 | | 1.46 | % | | 1,532 | | 101,950 | | 1.50 | % | |
| Total | | 4,693 | | $ | 319,781 | | 1.47 | % | | 4,791 | | $ | 321,508 | | 1.49 | % | |
| Allowance for unfunded lending related commitments | | 672 | | | | | 663 | | | | |
| Allowance for credit losses | | $ | 5,365 | | | | | $ | 5,454 | | | | |
| Allowance for credit losses to total loans | | | | 1.68 | % | | | | 1.70 | % | |
| Commercial | | | | 1.71 | % | | | | 1.73 | % | |
| Consumer | | | | 1.60 | % | | | | 1.62 | % | |
(a) Excludes allowances for investment securities and other financial assets, which together totaled $117 million and $120 million at March 31, 2024 and December 31, 2023, respectively.
26 The PNC Financial Services Group, Inc. – Form 10-Q
The following table summarizes our loan charge-offs and recoveries:
Table 25: Loan Charge-Offs and Recoveries
| | | | | | | | | | | | | | | | | | | | | | | | | | | | | |
| Three months ended March 31 | | Gross
Charge-offs | | Recoveries | | Net Charge-offs /
(Recoveries) | | % of Average
Loans (Annualized) | |
| Dollars in millions |
| 2024 | | | | | | | | | |
| Commercial | | | | | | | | | |
| Commercial and industrial | | $ | 84 | | | $ | 19 | | | $ | 65 | | | 0.15 | % | |
| Commercial real estate | | 56 | | | 2 | | | 54 | | | 0.61 | % | |
| Equipment lease financing | | 8 | | | 2 | | | 6 | | | 0.37 | % | |
| Total commercial | | 148 | | | 23 | | | 125 | | | 0.23 | % | |
| Consumer | | | | | | | | | |
| Residential real estate | | 1 | | | 3 | | | (2) | | | (0.02) | % | |
| Home equity | | 10 | | | 9 | | | 1 | | | 0.02 | % | |
| Automobile | | 32 | | | 25 | | | 7 | | | 0.19 | % | |
| Credit card | | 92 | | | 15 | | | 77 | | | 4.46 | % | |
| Education | | 4 | | | 2 | | | 2 | | | 0.42 | % | |
| Other consumer | | 43 | | | 10 | | | 33 | | | 3.16 | % | |
| Total consumer | | 182 | | | 64 | | | 118 | | | 0.47 | % | |
| Total | | $ | 330 | | | $ | 87 | | | $ | 243 | | | 0.30 | % | |
| 2023 | | | | | | | | | |
| Commercial | | | | | | | | | |
| Commercial and industrial | | $ | 104 | | | $ | 20 | | | $ | 84 | | | 0.19 | % | |
| Commercial real estate | | 12 | | | 2 | | | 10 | | | 0.11 | % | |
| Equipment lease financing | | 4 | | | 3 | | | 1 | | | 0.06 | % | |
| Total commercial | | 120 | | | 25 | | | 95 | | | 0.17 | % | |
| Consumer | | | | | | | | | |
| Residential real estate | | 3 | | | 3 | | | | | | | | |
| Home equity | | 6 | | | 11 | | | (5) | | | (0.08) | % | |
| Automobile | | 33 | | | 24 | | | 9 | | | 0.24 | % | |
| Credit card | | 74 | | | 11 | | | 63 | | | 3.70 | % | |
| Education | | 4 | | | 2 | | | 2 | | | 0.37 | % | |
| Other consumer | | 42 | | | 11 | | | 31 | | | 2.57 | % | |
| Total consumer | | 162 | | | 62 | | | 100 | | | 0.40 | % | |
| Total | | $ | 282 | | | $ | 87 | | | $ | 195 | | | 0.24 | % | |
Total net charge-offs increased $48 million, or 25%, for the estimated contractual termfirst three months of 2024 compared to the same period in 2023. The increase in the comparison was primarily attributable to higher commercial real estate net charge-offs.
See Note 1 Accounting Policies in our 2023 Form 10-K and Note 3 Loans and Related Allowance for Credit Losses of this Report for additional information.
Liquidity and Capital Management
Our liquidity risk framework and related monitoring measures and tools, including internal liquidity stress testing as well as compliance with internal and regulatory limits and guidelines, are described in further detail in the Liquidity and Capital Management section of our 2023 Form 10-K.
One of the ways we monitor our liquidity is by reference to the LCR, a regulatory minimum liquidity requirement designed to ensure that covered banking organizations maintain an adequate level of liquidity to meet net liquidity needs over the course of a hypothetical 30-day stress scenario. PNC and PNC Bank calculate the LCR daily and are required to maintain a regulatory minimum of 100%. The LCR for both PNC and PNC Bank exceeded the regulatory minimum requirement throughout the first quarter of 2024. Fluctuations in our average LCR result from changes to the components of the calculation, including high-quality liquid assets and net cash outflows, as a result of ongoing business activity.
The NSFR is designed to measure the stability of the maturity structure of assets and liabilities of banking organizations over a one-year time horizon. PNC and PNC Bank calculate the NSFR daily and are required to maintain a regulatory minimum of 100%. The NSFR for both PNC and PNC Bank exceeded the regulatory minimum requirement throughout the first quarter of 2024.
The PNC Financial Services Group, Inc. – Form 10-Q 27
We provide additional information regarding regulatory liquidity requirements and their potential impact on us in the Supervision and Regulation section of Item 1 Business and Item 1A Risk Factors of our 2023 Form 10-K.
Sources of Liquidity
Our largest source of liquidity on a consolidated basis is the customer deposit base generated by our banking businesses. These deposits provide relatively stable and low-cost funding. Total deposits increased to $425.6 billion at March 31, 2024 from $421.4 billion at December 31, 2023. Noninterest-bearing deposit balances decreased driven by a decline in commercial noninterest-bearing balances. Interest-bearing deposits increased reflecting higher commercial and consumer interest-bearing balances. As of March 31, 2024, uninsured deposits represented approximately 43% of our total deposit base, which is estimated based on the regulatory instructions in the Consolidated Reports of Condition and Income - FFIEC 031. The majority of our uninsured deposits are related to commercial operating and relationship accounts, which we define as commercial deposit customers who utilize two or exposuresmore PNC products. See the Funding Sources portion of the Consolidated Balance Sheet Review and Business Segments Review sections of this Financial Review for additional information on our deposits and related strategies.
We may also obtain liquidity through various forms of funding, including long-term debt (senior notes, subordinated debt and FHLB borrowings) and short-term borrowings (securities sold under repurchase agreements, commercial paper and other short-term borrowings). See the Funding Sources section of the Consolidated Balance Sheet Review in this Financial Review and Note 7 Borrowed Funds in this Report for additional information related to our borrowings.
Total senior and subordinated debt, on a consolidated basis, increased due to the following activity:
Table 26: Senior and Subordinated Debt
| | | | | | | | | |
| In billions | 2024 | | |
| January 1 | $ | 31.7 | | | |
| Issuances | 2.5 | | | |
| Calls and maturities | (1.1) | | | |
| Other | (0.4) | | | |
| | | |
| March 31 | $ | 32.7 | | | |
Additionally, certain liquid assets and unused borrowing capacity from a number of sources are also available to manage our liquidity position. PNC has a contingency funding plan designed to ensure that liquidity sources are sufficient to meet ongoing obligations and commitments, particularly in the event of liquidity stress. This plan is designed to examine and quantify the organization’s liquidity under various internal liquidity stress scenarios and is periodically tested to assess the plan’s reliability. Additionally, the plan provides the strategies for addressing liquidity needs and responsive actions we would consider during liquidity stress events, which could include the issuance of incremental debt, preferred stock, or additional deposit actions, including the issuance of brokered CDs. The plan also addresses the governance, frequency of reporting and the responsibilities of key departments in the event of liquidity stress.
PNC defines our primary contingent liquidity sources as cash held at the Federal Reserve Bank, investment securities and unused borrowing capacity at the FHLB and Federal Reserve Bank. The following table summarizes our primary contingent liquidity sources at March 31, 2024 and December 31, 2023:
Table 27: Primary Contingent Liquidity Sources
| | | | | | | | | | | | | |
| In billions | March 31, 2024 | | December 31, 2023 | | |
| Cash balance with Federal Reserve Bank | $ | 53.2 | | | $ | 43.3 | | | |
| Available investment securities (a) | 56.7 | | 98.5 | | |
| Unused borrowing capacity from FHLB (b) | 37.4 | | 35.4 | | |
| Unused borrowing capacity from Federal Reserve Bank (c) | 83.9 | | 47.2 | | |
| Total available contingent liquidity | $ | 231.2 | | | $ | 224.4 | | | |
| | | | | |
| | | | | |
| | | | | |
| | | | | |
| | | | | |
(a)Represents the fair value of investment securities that can be used for pledging or to secure other sources of funding.
(b)At March 31, 2024, total FHLB borrowing capacity was $74.4 billion and total FHLB borrowings were $37.0 billion. Comparable amounts at December 31, 2023 were $73.4 billion and $38.0 billion, respectively.
(c)Total borrowing capacity with the Federal Reserve Bank was $83.9 billion at March 31, 2024 and $47.2 billion at December 31, 2023. PNC had no outstanding borrowings with the Federal Reserve Bank at March 31, 2024 and December 31, 2023.
As part of PNC’s contingency planning, we prepositioned a portion of our available held to maturity investment securities at the Federal Reserve Bank’s Discount Window during the first quarter of 2024, supporting our resilience and operational readiness.
28 The PNC Financial Services Group, Inc. – Form 10-Q
Bank Liquidity
In addition to our primary contingent liquidity sources, under PNC Bank’s 2014 bank note program, as amended, PNC Bank may from time to time offer up to $40.0 billion aggregate principal amount outstanding at any one time of its unsecured senior and subordinated notes with maturity dates more than nine months (in the case of senior notes) and five years or more (in the case of subordinated notes) from their date of issue. At March 31, 2024, PNC Bank’s remaining capacity to issue under the program was $33.3 billion.
Under PNC Bank’s 2013 commercial paper program, PNC Bank has the ability to offer up to $10.0 billion of its commercial paper to provide additional liquidity. At March 31, 2024, there were no issuances outstanding under this program.
Additionally, PNC Bank may also access funding from the parent company through deposits placed at the bank or issuing intercompany senior unsecured notes.
Parent Company Liquidity
In addition to managing liquidity risk at the bank level, we manage the parent company’s liquidity. The parent company’s contractual obligations consist primarily of debt service related to parent company borrowings and funding non-bank affiliates. Additionally, the parent company maintains liquidity to fund discretionary activities such as paying dividends to our shareholders, share repurchases and acquisitions.
At March 31, 2024, available parent company liquidity totaled $21.7 billion. Parent company liquidity is held in intercompany cash and investments. For investments with longer durations, the related maturities are aligned with scheduled cash needs, such as the maturity of parent company debt obligations.
The principal source of parent company liquidity is the dividends or other capital distributions it receives from PNC Bank, which may be impacted by the following:
•Bank-level capital needs,
•Laws, regulations and the results of supervisory activities,
•Corporate policies,
•Contractual restrictions, and
•Other factors.
There are statutory and regulatory limitations on the ability of a national bank to pay dividends or make other capital distributions or to extend credit to the parent company or its non-bank subsidiaries. The amount available for dividend payments by PNC Bank to the parent company without prior regulatory approval was $5.7 billion at March 31, 2024. See Note 19 Regulatory Matters in our 2023 Form 10-K for further discussion of these limitations.
In addition to dividends from PNC Bank, other sources of parent company liquidity include cash and investments, as well as dividends and loan repayments from other subsidiaries and dividends or distributions from equity investments. We can also generate liquidity for the parent company and PNC’s non-bank subsidiaries through the issuance of debt and equity securities, including certain capital instruments, in public or private markets and commercial paper. Under the parent company’s 2014 commercial paper program, the parent company has the ability to offer up to $5.0 billion of commercial paper to provide additional liquidity. At March 31, 2024, there were no issuances outstanding under this program.
The following table details parent company note issuances in the first quarter of 2024:
Table 28: Parent Company Notes Issued
| | | | | | | | |
| Issuance Date | Amount | Description of Issuance |
| January 22, 2024 | $1.0 billion | $1.0 billion of senior fixed-to-floating notes with a maturity date of January 21, 2028. Interest is payable semi-annually in arrears at a fixed rate of 5.300% per annum, on January 21 and July 21 of each year, beginning on July 21, 2024. Beginning on January 21, 2027, interest is payable quarterly in arrears at a floating rate per annum equal to Compounded SOFR (determined with respect to each quarterly interest period using the SOFR Index as described in the Prospectus Supplement), plus 1.342%, on April 21, 2027, July 21, 2027, October 21, 2027 and at the maturity date. |
| January 22, 2024 | $1.5 billion | $1.5 billion of senior fixed-to-floating notes with a maturity date of January 22, 2035. Interest is payable semi-annually in arrears at a fixed rate of 5.676% per annum, on January 22 and July 22 of each year, beginning on July 22, 2024. Beginning on January 22, 2034, interest is payable quarterly in arrears at a floating rate per annum equal to Compounded SOFR (determined with respect to each quarterly interest period using the SOFR Index as described in the Prospectus Supplement), plus 1.902%, on April 22, 2034, July 22, 2034, October 22, 2034 and at the maturity date. |
| | |
Parent company senior and subordinated debt carrying value totaled $25.0 billion and $24.0 billion at March 31, 2024 and December 31, 2023, respectively.
The PNC Financial Services Group, Inc. – Form 10-Q 29
Contractual Obligations and Commitments
We have contractual obligations representing required future payments on borrowed funds, time deposits, leases, pension and postretirement benefits and purchase obligations. See the Liquidity and Capital Management portion of the Risk Management section of our 2023 Form 10-K for more information on these future cash outflows. Additionally, in the normal course of business, we have various commitments outstanding, certain of which are not included on our Consolidated Balance Sheet. We provide information on our commitments in Note 8 Commitments.
Credit Ratings
PNC’s credit ratings affect the cost and availability of short and long-term funding, collateral requirements for certain derivative instruments and the ability to offer certain products.
In general, rating agencies base their ratings on many quantitative and qualitative factors, including capital adequacy, liquidity, asset quality, business mix, level and quality of earnings, and the current legislative and regulatory environment, including implied government support. A decrease, or potential decrease, in credit ratings could impact access to the capital markets and/or increase the cost of debt, and thereby adversely affect liquidity and financial condition. For additional information on the potential impacts from a downgrade to our credit ratings, see Item 1A Risk Factors in our 2023 Form 10-K.
The following table presents credit ratings and outlook for PNC as of March 31, 2024:
Table 29: Credit Ratings and Outlook
| | | | | | | | | | | |
| March 31, 2024 |
| Moody’s | Standard & Poor’s | Fitch |
| Parent Company | | | |
| Senior debt | A3 | A- | A |
| Subordinated debt | A3 | BBB+ | A- |
| Preferred stock | Baa2 | BBB- | BBB |
| PNC Bank | | | |
| Senior debt | A2 | A | A+ |
| Subordinated debt | A3 | A- | A |
| Long-term deposits | Aa3 | A | AA- |
| Short-term deposits | P-1 | A-1 | F1+ |
| Short-term notes | P-1 | A-1 | F1 |
| PNC | | | |
| Agency rating outlook | Negative | Stable | Stable |
| | | |
| | | |
| | | |
| | | |
| | | |
| | | |
| | | |
| | | |
Capital Management
Detailed information on our capital management processes and activities is included in the balance sheet date. The remaining contractual termSupervision and Regulation section of assets in scopeItem 1 of CECL is estimated considering contractual maturity dates, prepayment expectations, utilization or draw expectations and any contractually embedded extension options that do not allow us to unilaterally cancel the extension options. For products without a fixed contractual maturity date (e.g., credit cards), we rely on historical payment behavior to determine the length of the paydown or default time period.our 2023 Form 10-K.
We estimatemanage our funding and capital positions by making adjustments to our balance sheet size and composition, issuing or redeeming debt, issuing equity or other capital instruments, executing treasury stock transactions and capital redemptions or repurchases, and managing dividend policies and retaining earnings.
In the first quarter of 2024, PNC returned $0.8 billion of capital to shareholders, reflecting more than $0.6 billion of dividends on common shares and more than $0.1 billion of common share repurchases, representing 0.9 million shares. Consistent with the SCB framework, which allows for capital return in amounts in excess of the SCB minimum levels, our Board of Directors has authorized a repurchase framework under the previously approved repurchase program of up to 100 million common shares, of which approximately 44% were still available for repurchase at March 31, 2024. In light of the Federal banking agencies proposed rules to adjust the Basel III capital framework, second quarter of 2024 share repurchase activity is expected to approximate the recent quarterly average share repurchase levels. PNC continues to evaluate the potential impact of the proposed rules and may adjust share repurchase activity depending on market and economic conditions, as well as other factors. PNC’s SCB for the four-quarter period beginning October 1, 2023 is the regulatory minimum of 2.5%.
On April 3, 2024 the PNC Board of Directors declared a quarterly cash dividend on common stock of $1.55 per share to be paid on May 6, 2024 to shareholders of record at the close of business April 15, 2024.
30 The PNC Financial Services Group, Inc. – Form 10-Q
The following table summarizes our Basel III capital balances and ratios:
Table 30: Basel III Capital
| | | | | | | | |
| March 31, 2024 |
| Dollars in millions | Basel III (a) | Fully Implemented
(estimated) (b) |
| Common equity Tier 1 capital | | |
| Common stock plus related surplus, net of treasury stock | $ | (3,774) | | $ | (3,774) | |
| Retained earnings | 57,154 | | 56,913 | |
| | |
| | |
| Goodwill, net of associated deferred tax liabilities | (10,700) | | (10,700) | |
| Other disallowed intangibles, net of deferred tax liabilities | (282) | | (282) | |
| Other adjustments/(deductions) | (88) | | (90) | |
| | |
| | |
| Common equity Tier 1 capital (c) | $ | 42,310 | | $ | 42,067 | |
| Additional Tier 1 capital | | |
| Preferred stock plus related surplus | 6,242 | | 6,242 | |
| | |
| Tier 1 capital | $ | 48,552 | | $ | 48,309 | |
| Additional Tier 2 capital | | |
| Qualifying subordinated debt | 2,874 | | 2,874 | |
| | |
| Eligible credit reserves includable in Tier 2 capital | 5,018 | | 5,220 | |
| Total Basel III capital | $ | 56,444 | | $ | 56,403 | |
| Risk-weighted assets | | |
| Basel III standardized approach risk-weighted assets (d) | $ | 420,342 | | $ | 420,397 | |
| Average quarterly adjusted total assets | $ | 556,568 | | $ | 556,326 | |
| Supplementary leverage exposure (e) | $ | 667,048 | | $ | 667,047 | |
| Basel III risk-based capital and leverage ratios (f) | | |
| Common equity Tier 1 | 10.1 | % | 10.0 | % |
| Tier 1 | 11.6 | % | 11.5 | % |
| Total | 13.4 | % | 13.4 | % |
| Leverage (g) | 8.7 | % | 8.7 | % |
| Supplementary leverage ratio (e) | 7.3 | % | 7.2 | % |
(a)The ratios are calculated to reflect PNC’s election to adopt the CECL five-year transition provisions. Effective for the first quarter 2022, PNC is now in the three-year transition period and the full impact of the CECL standard is being phased-in to regulatory capital through December 31, 2024.
(b)The ratios are calculated to reflect the full impact of CECL and exclude the benefits of the optional five-year transition.
(c)As permitted, PNC and PNC Bank have elected to exclude AOCI related to both available for sale securities and pension and other post-retirement plans from CET1 capital.
(d)Basel III standardized approach risk-weighted assets are based on the Basel III standardized approach rules and include credit and market risk-weighted assets.
(e)The Supplementary leverage ratio is calculated based on Tier 1 capital divided by Supplementary leverage exposure, which takes into account the quarterly average of both on balance sheet assets as well as certain off-balance sheet items, including loan commitments and potential future exposure under derivative contracts.
(f)All ratios are calculated using the regulatory capital methodology applicable to PNC and calculated based on the standardized approach.
(g)Leverage ratio is calculated based on Tier 1 capital divided by Average quarterly adjusted total assets.
PNC’s regulatory risk-based capital ratios are calculated using the standardized approach for determining risk-weighted assets. Under the standardized approach for determining credit risk-weighted assets, exposures are generally assigned a pre-defined risk weight. Exposures to high volatility commercial real estate, nonaccruals, FDMs, past due exposures and equity exposures are generally subject to higher risk weights than other types of exposures.
The regulatory agencies have adopted a rule permitting certain banks, including PNC, to delay the estimated impact on regulatory capital stemming from implementing CECL. CECL’s estimated impact on CET1 capital, as defined by the rule, is the change in retained earnings at adoption plus or minus 25% of the change in CECL ACL at the balance sheet date, excluding the allowance for PCD loans, compared to CECL ACL at adoption. Effective for the first quarter of 2022, PNC is now in the three-year transition period, and the full impact of the CECL standard is being phased-in to regulatory capital through December 31, 2024. See additional discussion of this rule in the Supervision and Regulation section of Item 1 Business and Item 1A Risk Factors of our 2023 Form 10-K.
At March 31, 2024, PNC and PNC Bank were considered “well capitalized” based on applicable U.S. regulatory capital ratio requirements. To qualify as “well capitalized,” PNC must have Basel III capital ratios of at least 6% for Tier 1 risk-based capital and 10% for Total risk-based capital, and PNC Bank must have Basel III capital ratios of at least 6.5% for Common equity Tier 1 risk-based capital, 8% for Tier 1 risk-based capital, 10% for Total risk-based capital and a Leverage ratio of at least 5%.
The PNC Financial Services Group, Inc. – Form 10-Q 31
Federal banking regulators have stated that they expect the largest U.S. BHCs, including PNC, to have a level of regulatory capital well in excess of the regulatory minimum and have required the largest U.S. BHCs, including PNC, to have a capital buffer sufficient to withstand losses and allow them to meet the credit needs of their customers through estimated stress scenarios. We seek to manage our capital consistent with these regulatory principles, and we believe that our March 31, 2024 capital levels were aligned with them.
We provide additional information regarding regulatory capital requirements and some of their potential impacts, including the proposed rules to adjust the Basel III framework, in the Supervision and Regulation section of Item 1 Business, Item 1A Risk Factors and Note 19 Regulatory Matters in our 2023 Form 10-K.
Market Risk Management
See the Market Risk Management portion of the Risk Management section in our 2023 Form 10-K for additional discussion regarding market risk.
Market Risk Management – Interest Rate Risk
Interest rate risk results primarily from our traditional banking activities of gathering deposits and extending loans. Many factors, including economic and financial conditions, movements in interest rates and consumer preferences, affect the difference between the interest that we earn on assets and the interest that we pay on liabilities and the level of our noninterest-bearing funding sources. Due to the repricing term mismatches and embedded options inherent in certain of these products, changes in market interest rates not only affect expected near-term earnings, but also the economic values of these assets and liabilities.
Our Asset and Liability Management group centrally manages interest rate risk as prescribed in our market risk-related risk management policies, which are approved by management’s ALCO and the Risk Committee of the Board of Directors.
PNC utilizes sensitivities of NII and EVE to a set of interest rate scenarios to identify and measure its short-term and long-term structural interest rate risks.
NII Sensitivity results for the first quarters of 2024 and 2023 follow:
Table 31: Net Interest Income Sensitivity Analysis | | | | | | | | | | | | | | |
| First Quarter 2024 | | First Quarter 2023 | |
| Net Interest Income Sensitivity Simulation (a) | | | | |
| Effect on NII in first year from shocked interest rate: | | | | |
| 200 basis point instantaneous increase | (0.2) | % | | 2.5 | % | |
| 200 basis point instantaneous decrease | (0.2) | % | | (3.3) | % | |
| | | | |
| | | | |
| | | | |
| | | | |
| | | | |
| | | | |
| | | | |
| | | | |
| | | | |
(a) The effect on NII in the first year from a 100 basis point instantaneous increase or decrease is not materially different from the 200 basis point scenarios as disclosed above.
When forecasting net interest income, we make certain key assumptions that can materially impact the resulting sensitivities, including the following:
Future Balance Sheet Composition: Our balance sheet composition is dynamic and based on our forecasted expectations. As of the first quarter of 2024, the projected balance sheet composition by the end of year one is generally consistent with the spot composition as of the first quarter of 2024.
Deposit Betas: Deposit pricing changes are primarily driven by changes in the Federal Funds rate, with the relationship between deposit rates and Federal Funds rate defined as deposit beta. We define cumulative deposit beta as the change in deposit rate paid on interest-bearing non-maturity deposits divided by the change in the upper level of the stated Federal Funds rate range since the first quarter of 2022, the start of the current rising rate cycle. As of March 31, 2024 PNC’s cumulative deposit beta was 45%, an increase from 35% at March 31, 2023. For interest rate risk modeling, PNC uses dynamic beta models to adjust assumed repricing sensitivity depending on market rate levels as well as other factors. The dynamic beta assumptions reflect historical experience and future expectations. Our scenario assumes that deposit betas increased slightly from current levels. Actual deposit rates paid may differ from modeled projections due to variables such as competition for deposits and customer behavior.
Asset Prepayments: PNC includes prepayment assumptions for both loan and investment portfolios. Mortgage and home equity portfolios utilize an industry standard model to drive estimated prepayments that increase in lower rate environments. Commercial and consumer loan portfolios assume static constant prepayment rates that are consistent across rate scenarios, as those portfolios historically do not exhibit significantly different prepayment behaviors based upon the level of market rates.
Impact of Derivatives: PNC uses interest rate derivatives to hedge floating rate commercial loans. PNC had $36.5 billion in receive fix / pay float swaps as of March 31, 2024, with a weighted average duration of 2.0 years and an average fixed rate of 2.30%. As of March 31, 2024 PNC also had collars in place, reflecting $12.5 billion of caps and $12.5 billion of floors, that are used to hedge these
32 The PNC Financial Services Group, Inc. – Form 10-Q
commercial loans. Additionally, PNC utilizes receive fix / pay float swaps as a means of hedging fixed rate debt. See Note 12 Financial Derivatives in this report for additional information on how we use derivatives to hedge commercial loans and fixed rate debt.
EVE sensitivity results for the first quarter of 2024 and 2023 follow:
Table 32: Economic Value of Equity Sensitivity Analysis
| | | | | | | | | | | |
| First Quarter 2024 | First Quarter 2023 | |
| Economic Value of Equity Sensitivity Simulation | | | |
| 200 basis point instantaneous increase | (5.7) | % | (4.3) | % | |
| 200 basis point instantaneous decrease | (1.6) | % | (4.9) | % | |
EVE measures the present value of all projected future cash flows associated with a point-in-time balance sheet and does not include projected new volume. EVE sensitivity to interest rate changes is a complementary metric to NII sensitivity analysis and represents an estimation of long-term interest rate risk. PNC calculates its EVE sensitivity by measuring the changes in the economic value of assets, liabilities and off-balance sheet instruments in response to an instantaneous +/-200 bps parallel shift in interest rates. Similar to the NII sensitivity analysis, we incorporate dynamic deposit repricing and loan prepayment assumptions. These methodologies are largely consistent between the EVE and NII sensitivity analyses. Additionally, deposit attrition is a significant contributor to EVE sensitivity. Deposit attrition is projected based on a pooled basisdynamic model developed using a combinationlong-term historical deposit behavior in addition to management assumptions including accelerated attrition for pandemic related excess deposits. PNC performs various sensitivity analyses to understand the impact of (i)faster and slower deposit attrition on our risk metrics, with the expected losses over a reasonableresults reported to ALCO.
Compared to the first quarter of 2023, there have been no material changes to our NII sensitivity and supportable forecast period, (ii) a periodEVE sensitivity assumptions, including data sources that drive assumptions setting.
Market Risk Management – Customer-Related Trading Risk
We engage in fixed income securities, derivatives and foreign exchange transactions to support our customers’ investing and hedging activities. These transactions, related hedges and the credit valuation adjustment related to our customer derivatives portfolio are marked-to-market daily and reported as customer-related trading activities. We do not engage in proprietary trading of reversion to long-run average expected losses, where applicable and (iii) the long-run average expected losses for the remaining estimated contractual term. For all assets and unfunded lending related commitments in the scope of CECL, the ACL also includes individually assessed reserves and qualitative reserves, as applicable.these products.
We use forward-lookingVaR as the primary means to measure and monitor market risk in customer-related trading activities. VaR is used to estimate the probability of portfolio losses based on the statistical analysis of historical market risk factors. VaR is calculated for each of the portfolios that comprise our customer-related trading activities of which the majority are covered positions as defined by the Market Risk Rule. VaR is computed with positions and market risk factors updated daily to ensure each portfolio is operating within its acceptable limits. See the Market Risk Management – Customer-Related Trading Risk section of our 2023 Form 10-K for more information in estimating expected credit losses foron our reasonablemodels used to calculate VaR and supportable forecast period. For this purpose, we use forecasted scenarios produced by PNC’s Economics Team, which are designed to reflect business cycles and their related estimated probabilities. The forecast length that we have currently determined to be reasonable and supportable is three years. As noted in the methodology discussions that follow, forward-looking information is incorporated into the expected credit loss estimates. Such forward looking information includes forecasted relevant macroeconomic variables, which are estimated using quantitative macroeconomic models, analysis from PNC economists and management judgment.our backtesting process.
The reversion period is used to bridge our three-year reasonable and supportable forecast period and the long-run average expected credit losses. We consider a number of factors in determining the duration of the reversion period, such as contractual maturity of the asset, observed historical patterns and the estimated credit loss rates at the end of the forecast period relative to the beginning of the long-run average period. The reversion period is typically one to three years, if not immediate.
The long-run average expected credit losses are derived from long-run historical credit loss information adjustedCustomer-related trading revenue was $16 million for the three months ended March 31, 2024, compared to $84 million for the three months ended March 31, 2023. The decrease was primarily due to lower derivative client sales revenues, partially offset by securities underwriting client revenues.
Market Risk Management – Equity And Other Investment Risk
Equity investment risk is the risk of potential losses associated with investing in both private and public equity markets. In addition to extending credit, qualitytaking deposits, underwriting securities and trading financial instruments, we make and manage direct investments in a variety of transactions, including management buyouts, recapitalizations and growth financings in a variety of industries. We also have investments in affiliated and non-affiliated funds that make similar investments in private equity, consistent with regulatory limitations. The economic and/or book value of these investments and other assets are directly affected by changes in market factors.
Various PNC business units manage our equity and other investment activities. Our businesses are responsible for making investment decisions within the current portfolioapproved policy limits and therefore, do not consider current and forecasted economic conditions.associated guidelines.
A summary of our equity investments follows:
Table 33: Equity Investments Summary
| | | | | | | | | | | | | | | | | | | | | | | | | | |
| | March 31, 2024 | | December 31, 2023 | | Change | |
| Dollars in millions | | $ | | % | |
| Tax credit investments | $ | 4,233 | | | $ | 4,331 | | | $ | (98) | | | (2) | % | |
| Private equity and other | 4,047 | | | 3,983 | | | 64 | | | 2 | % | |
| Total | $ | 8,280 | | | $ | 8,314 | | | $ | (34) | | | — | | |
The PNC Financial Services Group, Inc. – Form 10-Q 5133
Tax Credit Investments
Included in our equity investments are direct tax credit investments and equity investments held by consolidated entities. These tax credit investment balances included unfunded commitments totaling $2.2 billion and $2.5 billion at March 31, 2024 and December 31, 2023, respectively. These unfunded commitments are included in Other liabilities on our Consolidated Balance Sheet.
Note 4 Loan Sale and Servicing Activities and Variable Interest Entities in our 2023 Form 10-K has further information on tax credit investments.
Private Equity and Other
The largest component of our other equity investments is our private equity portfolio. The private equity portfolio is an illiquid portfolio consisting of mezzanine and equity investments that vary by industry, stage and type of investment. Private equity investments carried at estimated fair value totaled $2.2 billion at both March 31, 2024 and December 31, 2023. As of March 31, 2024, $2.0 billion was invested directly in a variety of companies and $0.2 billion was invested indirectly through various private equity funds.
Included in our other equity investments are Visa Class B-1 common shares, which are recorded at cost. Visa Class B-1 common shares that we own are transferable only under limited circumstances until they can be converted into shares of the publicly-traded Class A common shares, which cannot happen until the resolution of the pending interchange litigation, subject to the exchange offer described in Note 16 Subsequent Events. Based upon the March 31, 2024 per share closing price of $279.08for a Visa Class A common share, the estimated value of our total investment in the Class B-1 common shares was approximately $1.6 billion at the current conversion rate of Visa B-1 shares to Visa A shares, while our cost basis was insignificant. The estimated value does not represent fair value of the Visa B-1 common shares given the shares’ limited transferability and the lack of observable transactions in the marketplace. See Note 14 Fair Value and Note 20 Legal Proceedings in our 2023 Form 10-K and Note 13 Legal Proceedings in this Report for additional information regarding our Visa agreements. See Note 16 Subsequent Events for additional details on Visa’s recently announced exchange offer for Visa Class B-1 common stock.
We also have certain other equity investments, the following sectionsmajority of which represent investments in affiliated and non-affiliated funds with both traditional and alternative investment strategies. Net gains (losses) related to these investments were $(6) million for the three months ended March 31, 2024 and $21 million for the three months ended March 31, 2023.
Financial Derivatives
We use a variety of financial derivatives as part of the overall asset and liability risk management process to help manage exposure to market (primarily interest rate) and credit risk inherent in our business activities. We also enter into derivatives with customers to facilitate their risk management activities.
Financial derivatives involve, to varying degrees, market and credit risk. Derivatives represent contracts between parties that usually require little or no initial net investment and result in one party delivering cash or another type of asset to the other party based on a notional and an underlying as specified in the contract. Therefore, cash requirements and exposure to credit risk are significantly less than the notional amount on these instruments.
Further information on our financial derivatives is presented in Note 1 Accounting Policies, Note 14 Fair Value and Note 15 Financial Derivatives in our 2023 Form 10-K and in Note 11 Fair Value and Note 12 Financial Derivatives in this Report.
Not all elements of market and credit risk are addressed through the use of financial derivatives, and such instruments may be ineffective for their intended purposes due to unanticipated market changes, among other reasons.
RECENT REGULATORY DEVELOPMENTS
Federal agencies and states, including the federal agencies responsible for the Federal Acquisition Regulations, California, and most recently in March 2024, the SEC, have separately proposed or finalized rules that would require certain companies or government contractors, such as PNC or PNC Bank, to disclose significant amounts of climate-related information. This information includes qualitative and quantitative disclosures of material climate-related risks and their impact, governance and management, targets and goals, and greenhouse gas emissions. The greenhouse gas emissions disclosures include the company’s direct emissions from owned or controlled sources (Scope 1) and indirect emissions from the company’s consumption of energy purchased from third parties (Scope 2), and in the case of the Federal Acquisition Regulations proposal for a “major contractor” and California laws, disclosures related to indirect emissions from upstream and downstream activities in the company’s value chain (Scope 3). If and when all the rules are finalized, PNC and PNC Bank may face potentially differing standards from the agencies or California. Numerous lawsuits have challenged the SEC and California rules, and on April 4, 2024, the SEC voluntarily stayed implementation of its final rules pending resolution of the lawsuits challenging the SEC rules.
34 The PNC Financial Services Group, Inc. – Form 10-Q
CRITICAL ACCOUNTING ESTIMATESAND JUDGMENTS
Our consolidated financial statements are prepared by applying certain accounting policies. Note 1 Accounting Policies in our 2023 Form 10-K describes the most significant accounting policies that we use. Certain of these policies require us to make estimates or economic assumptions that may vary under different assumptions or conditions, and such variations may significantly affect our reported results and financial position for the period or in future periods. The policies and judgments related to residential and commercial MSRs and Level 3 fair value measurements are described in Critical Accounting Estimates and Judgments in our 2023 Form 10-K. The following details the critical estimates and judgments around the ACL.
Allowance for Credit Losses
We maintain the ACL at levels that we believe to be appropriate as of the balance sheet date to absorb expected credit losses on our existing investment securities, loans, equipment finance leases, other financial assets and unfunded lending related commitments, for details about specific methodologies.the remaining estimated contractual term of the assets or exposures, taking into consideration expected prepayments and estimated recoveries. Our determination of the ACL is based on historical loss and performance experience, as well as current borrower and transaction characteristics including collateral type and quality, current economic conditions, reasonable and supportable forecasts of future economic conditions and other relevant factors. We use methods sensitive to changes in economic conditions to interpret these factors and to estimate expected credit losses. We evaluate and, when appropriate, enhance the quality of our data and models and other methods used to estimate the ACL on an ongoing basis. We incorporate qualitative factors in the ACL that reflect our best estimate of expected losses that may not be adequately represented in our quantitative methods or economic assumptions. The major drivers of ACL estimates include, but are not limited to:
•Current economic conditions: Our forecast of expected losses depends on economic conditions as of the estimation date. As current economic conditions evolve, forecasted losses could be materially affected.
•Scenario weights and design: Our loss estimates are sensitive to the shape, direction and rate of change of macroeconomic forecasts and thus vary significantly between upside and downside scenarios. Changes to the probability weights assigned to these scenarios and the timing of peak business cycles reflected by the scenarios could materially affect our loss estimates.
•Current borrower quality: Our forecast of expected losses depends on current borrower and transaction characteristics, including credit metrics and collateral type/quality. As borrower quality evolves, forecasted losses could be materially affected.
•Portfolio composition: Changes to portfolio volume and mix could materially affect our estimates, as CECL reserves
would be recognized upon origination or acquisition and derecognized upon paydown, maturity or sale.
AllowanceFor all assets and unfunded lending related commitments within the scope of the CECL standard, the applicable ACL is composed of one or a combination of the following components: (i) collectively assessed or pooled reserves, (ii) individually assessed reserves, and
(iii) qualitative (judgmental) reserves. Our methodologies and key assumptions for Loan and Lease Losseseach of these components are discussed in Note 1
Our pooled expected loss methodology is based upon the quantification of risk parameters, such as PD, LGD and EAD for a loan, loan segment or lease. We also consider the impact of prepayments and amortization on contractual maturityAccounting Policies in our 2023 Form 10-K.
Reasonable and Supportable Economic Forecast
Pursuant to the CECL standard, we are required to consider reasonable and supportable forecasts in estimating expected loss estimates. Wecredit losses. For this purpose, we have established a framework that includes a three-year forecast period and the use historical credit loss information, current borrower risk characteristicsof four economic scenarios with associated probability weights, which in combination create a forecast of expected economic outcomes. Credit losses estimated in our reasonable and forecastedsupportable forecast period are sensitive to the shape and severity of the scenarios used and weights assigned to them.
To forecast the distribution of economic variables foroutcomes over the reasonable and supportable forecast period, coupled with analytical methods,we generate four economic forecast scenarios using a combination of quantitative macroeconomic models, other measures of economic activity and forward-looking expert judgment. Each scenario is then given an associated probability (weight) to represent our current expectation within that distribution over the forecast period. This process is informed by current economic conditions, expected business cycle evolution and the expert judgment of PNC’s RAC. This approach seeks to provide a reasonable representation of the forecast of expected economic outcomes and is used to estimate these risk parameters by loan, loan segment or lease. PD, LGDexpected credit losses across a variety of loans, securities and EAD parametersother financial assets. Each quarter, the scenarios and their respective weights are calculatedpresented to RAC for each forecasted scenarioapproval.
The scenarios used for the period ended March 31, 2024 consider, among other factors, ongoing inflationary pressures and the long-run average period,corresponding tightness of monetary policy and combined to generate expected loss estimates by scenario.credit availability. While recession risks remain elevated, our most-likely expectation at March 31, 2024 is that the U.S. economy narrowly avoids a recession in 2024.
We used a number of economic variables in our scenarios, with two of the most significant drivers being real GDP and the U.S. unemployment rate. The following matrix provides keytable presents a comparison of these two economic variables based on the weighted-average scenario forecasts used in determining our ACL at March 31, 2024 and December 31, 2023.
The PNC Financial Services Group, Inc. – Form 10-Q 35
Table 34: Key Macroeconomic Variables in CECL Weighted-Average Scenarios
| | | | | | | | | | | |
| Assumptions as of March 31, 2024 |
| 2024 | 2025 | 2026 |
| U.S. real GDP (a) | 0.8% | 1.7% | 2.1% |
| U.S. unemployment rate (b) | 4.6% | 4.8% | 4.3% |
| Assumptions as of December 31, 2023 |
| 2024 | 2025 | 2026 |
| U.S. real GDP (a) | 0.1% | 1.5% | 2.0% |
| U.S. unemployment rate (b) | 4.5% | 4.6% | 4.2% |
(a)Represents year-over-year growth (loss) rates.
(b)Represents quarterly average rate at December 31, 2024, 2025 and 2026, respectively.
Real GDP growth is expected to end 2024 at 0.8% on a weighted average basis, up from the 0.1% assumed at December 31, 2023, primarily due to stronger expected economic activity in 2024 than what was expected at the end of 2023. Growth then rises to 1.7% in 2025, before growing to 2.1% in 2026. The weighted-average unemployment rate is expected to end 2024 at 4.6%, up slightly from the 4.5% assumed at December 31, 2023. During the second half of 2025, the weighted-average unemployment increases to a peak of 5.0% before gradually improving to 4.8% by the fourth quarter of 2025. Further improvement is then expected in 2026 with the rate reaching 4.3% by the fourth quarter of 2026.
The current state of the economy continues to reflect uncertainty due to the foundational change in office demand from the acceptance of remote work, combined with inflationary pressures, interest rate movements, and declining consumer savings and deposit balances. As such, for both our commercial and consumer loan portfolios, PNC identified and performed significant analyses around segments impacted by such uncertainties to ensure our reserves are adequate, given our current macroeconomic expectations.
We believe the economic scenarios effectively reflect the distribution of potential economic outcomes. Additionally, through in-depth and granular analysis we have addressed reserve requirements for the specific populations most affected in the current environment. Through this approach, we believe the reserve levels appropriately reflect the expected credit risk characteristics that we uselosses in the portfolio as of the balance sheet date.
See the following for additional information related to estimate these risk parameters.our ACL:
•Allowance for Credit Losses in the Credit Risk Management section of this Financial Review,
•Note 2 Investment Securities, and Note 3 Loans and Related Allowance for Credit Losses in this Report, and
•Note 1 Accounting Policies in our 2023 Form 10-K.
36 The PNC Financial Services Group, Inc. – Form 10-Q
Recently Issued Accounting Standards
| | | | | | | | | | | | |
Loan Class | | Probability of DefaultAccounting Standards Update | Loss Given DefaultDescription | Exposure at DefaultFinancial Statement Impact |
Commercial |
Commercial and industrial / Equipment lease financing | | •For wholesale obligors: internal risk ratings based on borrower characteristics and industry
•For retail small balance obligors: credit score, delinquency status, and product typeImprovements to Reportable Segment Disclosures - ASU 2023-07
Issued November 2023
| •Collateral type, LTV, industry, size Required with issuance of 2024 Form 10-K; early adoption is permitted. • Requires that a public entity disclose significant segment expenses that are regularly provided to the chief operating decision maker (CODM) and outstanding exposureincluded within each reported measure of segment profit or loss. • Requires that a public entity disclose an amount for secured loansother segment items by reportable segment and a description of its composition. •Capital structure, industry Requires that a public entity provide all annual disclosures about a reportable segment’s profit or loss and sizeassets currently required by ASC 280 in interim periods. • Clarifies that if the CODM uses more than one measure of a segment’s profit or loss in assessing segment performance and deciding how to allocate resources, a public entity may report one or more of those additional measures of segment profit. • Requires that a public entity disclose the title and position of the CODM and an explanation of how the CODM uses the reported measure(s) of segment profit or loss in assessing segment performance and deciding how to allocate resources. • Requires a retrospective transition approach for unsecured loans •For retail small balance obligors, product type and credit scores
| •Outstanding balances, commitment, contractual maturities We are currently evaluating the disclosure requirements within this ASU and historical prepayment experience for loansdo not plan to early adopt. •Current utilization and historical pre-default draw experience for lines This ASU will not impact our Consolidated Income Statement, Consolidated Statement of Comprehensive Income, Consolidated Balance Sheet, Consolidated Statement of Changes in Equity, or Consolidated Statement of Cash Flows.
|
Commercial real estate (CRE)Accounting Standards Update | Description | Financial Statement Impact |
•Property performance metrics, property type, market and risk pool for the forecast period
•For the long-run average period, internal risk ratings based on borrower characteristicsImprovements to Income Tax Disclosures - ASU 2023-09
| •Property type, LTV and costs to sellIssued December 2023
| •Outstanding balances, commitment, contractual maturities Required effective date of January 1, 2025; early adoption is permitted. • Requires public business entities to, on an annual basis, (1) disclose specific categories in the rate reconciliation and historical prepayment experience(2) provide additional information for loansreconciling items that meet a quantitative threshold. |
Consumer |
Home equity / Residential real estate | | •Borrower credit scores, delinquency status, origination vintage, LTV Requires that all entities disclose, on an annual basis, (1) the amount of income taxes paid (net of refunds received), disaggregated by federal (national), state and contractual maturityforeign taxes, and (2) the amount of income taxes paid (net of refunds received), disaggregated by individual jurisdictions in which income taxes paid (net of refunds received) is equal to or greater than 5 percent of total income taxes paid (net of refunds received). • Requires a prospective transition approach, with an optional retrospective transition approach. | •Collateral characteristics, LTV and costs We are currently evaluating the disclosure requirements within this ASU. • This ASU will not impact our Consolidated Income Statement, Consolidated Statement of Comprehensive Income, Consolidated Balance Sheet, Consolidated Statement of Changes in Equity, or Consolidated Statement of Cash Flows. • We expect to sell | •Outstanding balances, contractual maturities and historical prepayment experience for loansprovide additional disaggregated income tax disclosures in accordance with this ASU.
•Current utilization and historical pre-default draw experience for lines |
Automobile | | •Borrower credit scores, delinquency status, borrower income, LTV and contractual maturity
| •New vs. used, LTV and borrower credit scores
| •Outstanding balances, contractual maturities and historical prepayment experience
|
Credit card | | •Borrower credit scores, delinquency status, utilization, payment behavior and months on book
| •Borrower credit scores and credit line amount
| •Pay-down curves We are developed using a pro-rata method and estimated using borrower behavior segments, payment ratios and borrower credit scores
|
Education / Other consumer | | •Modeled using either discrete risk parameters or net charge-off and pay-down ratesevaluating when to adopt the amendments of this ASU.
|
Recently Adopted Accounting Pronouncements
See Note 1 Accounting Policies in our 2023 Form 10-K for recently adopted accounting standards. We did not adopt any new accounting standards during the first quarter of 2024 that impacted our financial statements.
INTERNAL CONTROLS AND DISCLOSURE CONTROLS AND PROCEDURES
As of March 31, 2024, we performed an evaluation under the supervision of and with the participation of our management, including the Chairman and Chief Executive Officer and the Executive Vice President and Chief Financial Officer, of the effectiveness of the design and operation of our disclosure controls and procedures and of changes in our internal control over financial reporting.
Based on that evaluation, our Chairman and Chief Executive Officer and our Executive Vice President and Chief Financial Officer concluded that our disclosure controls and procedures (as defined in Rule 13a-15(e) under the Securities Exchange Act of 1934) were effective as of March 31, 2024, and that there has been no change in PNC’s internal control over financial reporting that occurred
The PNC Financial Services Group, Inc. – Form 10-Q 37
during the first quarter of 2024 that has materially affected, or is reasonably likely to materially affect, our internal control over financial reporting.
CAUTIONARY STATEMENT REGARDING FORWARD-LOOKING INFORMATION
We make statements in this Report, and we may from time to time make other statements, regarding our outlook for financial performance, such as earnings, revenues, expenses, tax rates, capital and liquidity levels and ratios, asset levels, asset quality, financial position, and other matters regarding or affecting us and our future business and operations, including our sustainability strategy, that are forward-looking statements within the meaning of the Private Securities Litigation Reform Act. Forward-looking statements are typically identified by words such as “believe,” “plan,” “expect,” “anticipate,” “see,” “look,” “intend,” “outlook,” “project,” “forecast,” “estimate,” “goal,” “will,” “should” and other similar words and expressions.
Forward-looking statements are necessarily subject to numerous assumptions, risks and uncertainties, which change over time. Future events or circumstances may change our outlook and may also affect the nature of the assumptions, risks and uncertainties to which our forward-looking statements are subject. Forward-looking statements speak only as of the date made. We do not assume any duty and do not undertake any obligation to update forward-looking statements. Actual results or future events could differ, possibly materially, from those anticipated in forward-looking statements, as well as from historical performance. As a result, we caution against placing undue reliance on any forward-looking statements.
Our forward-looking statements are subject to the following principal risks and uncertainties.
•Our businesses, financial results and balance sheet values are affected by business and economic conditions, including:
–Changes in interest rates and valuations in debt, equity and other financial markets,
–Disruptions in the U.S. and global financial markets,
–Actions by the Federal Reserve Board, U.S. Treasury and other government agencies, including those that impact money supply, market interest rates and inflation,
–Changes in customer behavior due to changing business and economic conditions or legislative or regulatory initiatives,
–Changes in customers’, suppliers’ and other counterparties’ performance and creditworthiness,
–Impacts of sanctions, tariffs and other trade policies of the U.S. and its global trading partners,
–Impacts of changes in federal, state and local governmental policy, including on the regulatory landscape, capital markets, taxes, infrastructure spending and social programs,
–Our ability to attract, recruit and retain skilled employees, and
–Commodity price volatility.
•Our forward-looking financial statements are subject to the risk that economic and financial market conditions will be substantially different than those we are currently expecting. These statements are based on our views that:
–PNC’s baseline forecast is for slower economic growth in 2024 as consumer spending growth slows and higher interest rates remain a drag on the economy. The ongoing strength of the labor market will continue to support consumer spending. The FOMC is indicating that it will start to cut the federal funds rate later this year, with rate cuts supporting economic growth toward the end of 2024.
–Real GDP growth this year will be close to its trend of 2% and the unemployment rate will increase modestly to just above 4% by the end of 2024. Inflation will continue to slow as wage pressures abate, moving back to the Federal Reserve’s 2% long-term objective by the end of 2025.
–PNC expects the federal funds rate to remain unchanged between 5.25% and 5.50% through at least the first half of 2024, with federal funds rate cuts starting in the third quarter as inflationary pressures ease further. PNC expects two federal funds rate cuts in 2024, with the rate ending this year in a range between 4.75% and 5.00%.
•PNC’s ability to take certain capital actions, including returning capital to shareholders, is subject to PNC meeting or exceeding minimum capital levels, including a stress capital buffer established by the Federal Reserve Board in connection with the Federal Reserve Board’s CCAR process.
•PNC’s regulatory capital ratios in the future will depend on, among other things, PNC’s financial performance, the scope and terms of final capital regulations then in effect and management actions affecting the composition of PNC’s balance sheet. In addition, PNC’s ability to determine, evaluate and forecast regulatory capital ratios, and to take actions (such as capital distributions) based on actual or forecasted capital ratios, will be dependent at least in part on the development, validation and regulatory review of related models and the reliability of and risks resulting from extensive use of such models.
•Legal and regulatory developments could have an impact on our ability to operate our businesses, financial condition, results of operations, competitive position, reputation, or pursuit of attractive acquisition opportunities. Reputational impacts could affect matters such as business generation and retention, liquidity, funding and ability to attract and retain employees. These developments could include:
–Changes to laws and regulations, including changes affecting oversight of the financial services industry, changes in the enforcement and interpretation of such laws and regulations and changes in accounting and reporting standards.
38 The PNC Financial Services Group, Inc. – Form 10-Q
–Unfavorable resolution of legal proceedings or other claims and regulatory and other governmental investigations or other inquiries resulting in monetary losses, costs, or alterations in our business practices and potentially causing reputational harm to PNC.
–Results of the regulatory examination and supervision process, including our failure to satisfy requirements of agreements with governmental agencies.
–Costs associated with obtaining rights in intellectual property claimed by others and of adequacy of our intellectual property protection in general.
•Business and operating results are affected by our ability to identify and effectively manage risks inherent in our businesses, including, where appropriate, through effective use of systems and controls, third-party insurance, derivatives, and capital management techniques and to meet evolving regulatory capital and liquidity standards.
•Our reputation and business and operating results may be affected by our ability to appropriately meet or address environmental, social or governance targets, goals, commitments or concerns that may arise.
•We grow our business in part through acquisitions and new strategic initiatives. Risks and uncertainties include those presented by the nature of the business acquired or strategic initiative, including in some cases those associated with our entry into new businesses or new geographic or other markets and risks resulting from our inexperience in those new areas, as well as risks and uncertainties related to the acquisition transactions themselves, regulatory issues, the integration of the acquired businesses into PNC after closing or any failure to execute strategic or operational plans.
•Competition can have an impact on customer acquisition, growth and retention and on credit spreads and product pricing, which can affect market share, deposits and revenues. Our ability to anticipate and respond to technological changes can also impact our ability to respond to customer needs and meet competitive demands.
•Business and operating results can also be affected by widespread manmade, natural and other disasters (including severe weather events), health emergencies, dislocations, geopolitical instabilities or events, terrorist activities, system failures or disruptions, security breaches, cyberattacks, international hostilities, or other extraordinary events beyond PNC’s control through impacts on the economy and financial markets generally or on us or our counterparties, customers or third-party vendors and service providers specifically.
We provide greater detail regarding these as well as other factors in our 2023 Form 10-K and elsewhere in this Report, including in the Risk Factors and Risk Management sections and the Legal Proceedings and Commitments Notes of the Notes To Consolidated Financial Statements in these reports. Our forward-looking statements may also be subject to other risks and uncertainties, including those discussed elsewhere in this Report or in our other filings with the SEC.
The PNC Financial Services Group, Inc. – Form 10-Q 39
CONSOLIDATED INCOME STATEMENT
THE PNC FINANCIAL SERVICES GROUP, INC.
| | | | | | | | | | | | | | | | | |
| Unaudited | Three months ended March 31 | | |
| In millions, except per share data | 2024 | | 2023 | | | | |
| Interest Income | | | | | | | |
| Loans | $ | 4,819 | | | $ | 4,258 | | | | | |
| Investment securities | 883 | | | 885 | | | | | |
| Other | 798 | | | 516 | | | | | |
| Total interest income | 6,500 | | | 5,659 | | | | | |
| Interest Expense | | | | | | | |
| Deposits | 2,077 | | | 1,291 | | | | | |
| Borrowed funds | 1,159 | | | 783 | | | | | |
| Total interest expense | 3,236 | | | 2,074 | | | | | |
| Net interest income | 3,264 | | | 3,585 | | | | | |
| Noninterest Income | | | | | | | |
| Asset management and brokerage | 364 | | | 356 | | | | | |
| Capital markets and advisory | 259 | | | 262 | | | | | |
| Card and cash management | 671 | | | 659 | | | | | |
| Lending and deposit services | 305 | | | 306 | | | | | |
| Residential and commercial mortgage | 147 | | | 177 | | | | | |
| Other | 135 | | | 258 | | | | | |
| Total noninterest income | 1,881 | | | 2,018 | | | | | |
| Total revenue | 5,145 | | | 5,603 | | | | | |
| Provision For Credit Losses | 155 | | | 235 | | | | | |
| Noninterest Expense | | | | | | | |
| Personnel | 1,794 | | | 1,826 | | | | | |
| Occupancy | 244 | | | 251 | | | | | |
| Equipment | 341 | | | 350 | | | | | |
| Marketing | 64 | | | 74 | | | | | |
| Other | 891 | | | 820 | | | | | |
| Total noninterest expense | 3,334 | | | 3,321 | | | | | |
| Income before income taxes and noncontrolling interests | 1,656 | | | 2,047 | | | | | |
| Income taxes | 312 | | | 353 | | | | | |
| Net income | 1,344 | | | 1,694 | | | | | |
| Less: Net income attributable to noncontrolling interests | 14 | | | 17 | | | | | |
| Preferred stock dividends | 81 | | | 68 | | | | | |
| Preferred stock discount accretion and redemptions | 2 | | | 2 | | | | | |
| Net income attributable to common shareholders | $ | 1,247 | | | $ | 1,607 | | | | | |
| Earnings Per Common Share | | | | | | | |
| Basic | $ | 3.10 | | | $ | 3.98 | | | | | |
| Diluted | $ | 3.10 | | | $ | 3.98 | | | | | |
| Average Common Shares Outstanding | | | | | | | |
| Basic | 400 | | | 401 | | | | | |
| Diluted | 400 | | | 402 | | | | | |
See accompanying Notes To Consolidated Financial Statements.
40 The PNC Financial Services Group, Inc. – Form 10-Q
CONSOLIDATED STATEMENT OF COMPREHENSIVE INCOME
THE PNC FINANCIAL SERVICES GROUP, INC.
| | | | | | | | | | | | | | |
Unaudited
In millions | | Three months ended March 31 | |
| 2024 | 2023 | | | |
| Net income | | $ | 1,344 | | $ | 1,694 | | | | |
| Other comprehensive income (loss), before tax and net of reclassifications into Net income | | | | | | |
| Net change in debt securities | | (179) | | 869 | | | | |
| Net change in cash flow hedge derivatives | | (250) | | 527 | | | | |
| Pension and other postretirement benefit plan adjustments | | (2) | | (10) | | | | |
| Net change in Other | | (2) | | 4 | | | | |
| Other comprehensive income (loss), before tax and net of reclassifications into Net income | | (433) | | 1,390 | | | | |
| Income tax benefit (expense) related to items of other comprehensive income | | 103 | | (326) | | | | |
| Other comprehensive income (loss), after tax and net of reclassifications into Net income | | (330) | | 1,064 | | | | |
| | | | | | |
| | | | | | |
| | | | | | |
| | | | | | |
| | | | | | |
| Comprehensive income | | 1,014 | | 2,758 | | | | |
| Less: Comprehensive income attributable to noncontrolling interests | | 14 | 17 | | | |
| Comprehensive income attributable to PNC | | $ | 1,000 | | $ | 2,741 | | | | |
See accompanying Notes To Consolidated Financial Statements.
The PNC Financial Services Group, Inc. – Form 10-Q 41
CONSOLIDATED BALANCE SHEET
THE PNC FINANCIAL SERVICES GROUP, INC.
| | | | | | | | | | | |
| Unaudited | March 31
2024 | | December 31
2023 |
| In millions, except par value |
| Assets | | | |
| Cash and due from banks | $ | 5,933 | | | $ | 6,921 | |
| Interest-earning deposits with banks | 53,612 | | | 43,804 | |
| Loans held for sale (a) | 743 | | | 734 | |
| Investment securities – available for sale | 42,280 | | | 41,785 | |
| Investment securities – held to maturity | 88,180 | | | 90,784 | |
| Loans (a) | 319,781 | | | 321,508 | |
| Allowance for loan and lease losses | (4,693) | | | (4,791) | |
| Net loans | 315,088 | | | 316,717 | |
| Equity investments | 8,280 | | | 8,314 | |
| Mortgage servicing rights | 3,762 | | | 3,686 | |
| Goodwill | 10,932 | | | 10,932 | |
| Other (a) | 37,352 | | | 37,903 | |
| Total assets | $ | 566,162 | | | $ | 561,580 | |
| Liabilities | | | |
| Deposits | | | |
| Noninterest-bearing | $ | 98,061 | | | $ | 101,285 | |
| Interest-bearing | 327,563 | | | 320,133 | |
| Total deposits | 425,624 | | | 421,418 | |
| Borrowed funds | | | |
| Federal Home Loan Bank borrowings | 37,000 | | | 38,000 | |
| Senior debt | 27,907 | | | 26,836 | |
| Subordinated debt | 4,827 | | | 4,875 | |
| Other (b) | 2,973 | | | 3,026 | |
| Total borrowed funds | 72,707 | | | 72,737 | |
| Allowance for unfunded lending related commitments | 672 | | | 663 | |
| Accrued expenses and other liabilities (b) | 15,785 | | | 15,621 | |
| Total liabilities | 514,788 | | | 510,439 | |
| Equity | | | |
| Preferred stock (c) | | | |
| Common stock ($5 par value, Authorized 800,000,000 shares, issued 543,116,260 and 543,116,271 shares) | 2,716 | | | 2,716 | |
| Capital surplus | 19,032 | | | 19,020 | |
| Retained earnings | 56,913 | | | 56,290 | |
| Accumulated other comprehensive income (loss) | (8,042) | | | (7,712) | |
| Common stock held in treasury at cost: 145,068,954 and 145,087,054 shares | (19,279) | | | (19,209) | |
| Total shareholders’ equity | 51,340 | | | 51,105 | |
| Noncontrolling interests | 34 | | | 36 | |
| Total equity | 51,374 | | | 51,141 | |
| Total liabilities and equity | $ | 566,162 | | | $ | 561,580 | |
(a)Our consolidated assets included the following for which we have elected the fair value option: Loans held for sale of $0.7 billion, Loans held for investment of $1.2 billion and Other assets of $0.1 billion at March 31, 2024. Comparable amounts at December 31, 2023 were $0.7 billion, $1.2 billion and $0.1 billion, respectively.
(b)Our consolidated liabilities included the following for which we have elected the fair value option: Other borrowed funds of less than $0.1 billion and Other liabilities of $0.1 billion at March 31, 2024. Comparable amounts at December 31, 2023 were less than $0.1 billion and $0.1 billion, respectively.
(c)Par value less than $0.5 million at each date.
See accompanying Notes To Consolidated Financial Statements.
42 The PNC Financial Services Group, Inc. – Form 10-Q
CONSOLIDATED STATEMENT OF CASH FLOWS
THE PNC FINANCIAL SERVICES GROUP, INC.
| | | | | | | | | | | | | | | | | |
Unaudited
In millions | | Three months ended March 31 | |
| 2024 | | 2023 | |
| Operating Activities | | | | | |
| Net income | | $ | 1,344 | | | $ | 1,694 | | |
| Adjustments to reconcile net income to net cash provided (used) by operating activities | | | | | |
| Provision for credit losses | | 155 | | | 235 | | |
| Depreciation, amortization and accretion | | 37 | | | 65 | | |
| Deferred income taxes (benefit) | | (44) | | | (30) | | |
| | | | | |
| Changes in fair value of mortgage servicing rights | | (43) | | | 174 | | |
| | | | | |
| | | | | |
| | | | | |
| Net change in | | | | | |
| Trading securities and other short-term investments | | 434 | | | (385) | | |
| Loans held for sale and related securitization activity | | 11 | | | (11) | | |
| Other assets | | (300) | | | 1,108 | | |
| Accrued expenses and other liabilities | | (263) | | | (1,142) | | |
| Other operating activities, net | | 427 | | | 168 | | |
| Net cash provided (used) by operating activities | | $ | 1,758 | | | $ | 1,876 | | |
| Investing Activities | | | | | |
| Sales | | | | | |
| Securities available for sale | | $ | (63) | | | $ | (73) | | |
| | | | | |
| Loans | | 96 | | | 215 | | |
| Repayments/maturities | | | | | |
| Securities available for sale | | 1,056 | | | 2,293 | | |
| Securities held to maturity | | 2,883 | | | 1,502 | | |
| Purchases | | | | | |
| Securities available for sale | | (1,766) | | | (612) | | |
| Securities held to maturity | | (56) | | | (1,324) | | |
| Loans | | (279) | | | (261) | | |
| Net change in | | | | | |
| Federal funds sold and resale agreements | | (4) | | | 32 | | |
| Interest-earning deposits with banks | | (9,808) | | | (6,580) | | |
| Loans | | 1,667 | | | (587) | | |
| | | | | |
| Other investing activities, net | | (91) | | | (317) | | |
| Net cash provided (used) by investing activities | | $ | (6,365) | | | $ | (5,712) | | |
The PNC Financial Services Group, Inc. – Form 10-Q 43
CONSOLIDATED STATEMENT OF CASH FLOWS
THE PNC FINANCIAL SERVICES GROUP, INC.
| | | | | | | | | | | | | | | | | |
| (Continued from previous page) | | | | | |
Unaudited
In millions | | Three months ended March 31 | |
| 2024 | | 2023 | |
| Financing Activities | | | | | |
| Net change in | | | | | |
| Noninterest-bearing deposits | | $ | (3,260) | | | $ | (6,462) | | |
| Interest-bearing deposits | | 7,430 | | | 7,023 | | |
| Federal funds purchased and repurchase agreements | | (167) | | | (94) | | |
| Short-term Federal Home Loan Bank borrowings | | | | | (50) | | |
| | | | | |
| Other borrowed funds | | 95 | | | (74) | | |
| Sales/issuances | | | | | |
| | | | | |
| Senior debt | | 2,490 | | | 2,743 | | |
| | | | | |
| Other borrowed funds | | 181 | | | 167 | | |
| Preferred stock | | | | | 1,484 | | |
| Common and treasury stock | | 24 | | | 26 | | |
| Repayments/maturities | | | | | |
| Federal Home Loan Bank borrowings | | (1,000) | | | (5) | | |
| Senior debt | | (1,050) | | | | | |
| Subordinated debt | | | | | (750) | | |
| Other borrowed funds | | (196) | | | (141) | | |
| | | | | |
| | | | | |
| Acquisition of treasury stock | | (223) | | | (459) | | |
| Preferred stock cash dividends paid | | (81) | | | (68) | | |
| Common stock cash dividends paid | | (624) | | | (607) | | |
| | | | | |
| Net cash provided (used) by financing activities | | $ | 3,619 | | | $ | 2,733 | | |
| Net Increase (Decrease) In Cash And Due From Banks And Restricted Cash | | $ | (988) | | | $ | (1,103) | | |
| | | | | |
| | | | | |
| Cash and due from banks and restricted cash at beginning of period | | 6,921 | | | 7,043 | | |
| Cash and due from banks and restricted cash at end of period | | $ | 5,933 | | | $ | 5,940 | | |
| | | | | |
| Cash And Due From Banks And Restricted Cash | | | | | |
| Cash and due from banks at end of period (unrestricted cash) | | $ | 4,999 | | | $ | 5,335 | | |
| Restricted cash | | 934 | | 605 | |
| Cash and due from banks and restricted cash at end of period | | $ | 5,933 | | | $ | 5,940 | | |
| Supplemental Disclosures | | | | | |
| Interest paid | | $ | 2,861 | | | $ | 1,691 | | |
| Income taxes paid | | $ | 35 | | | $ | 56 | | |
| Income taxes refunded | | $ | 6 | | | $ | 3 | | |
| Leased assets obtained in exchange for new operating lease liabilities | | $ | 75 | | | $ | 45 | | |
| | | | | |
| Non-cash Investing And Financing Items | | | | | |
| | | | | |
| Transfer from loans to loans held for sale, net | | $ | 8 | | | $ | 106 | | |
| | | | | |
| Transfer from loans to foreclosed assets | | $ | 13 | | | $ | 16 | | |
| | | | | |
See accompanying Notes To Consolidated Financial Statements.
5244 The PNC Financial Services Group, Inc. – Form 10-Q
The following matrix describes the key economic variables that are consumed during our forecast period by loan class, as well as other assumptions that are used for our reversion and long-run average approaches.
| | | | | | | | | | | |
Loan Class | Forecast Period - Key Economic Variables | Reversion Method | Long-Run Average |
Commercial |
Commercial and industrial / Equipment lease financing | •GDP and Gross Domestic Investment measures, employment related variables and personal income and consumption measures
| •Immediate reversion
| •Average parameters determined based on internal and external historical data
•Modeled parameters using long-run economic conditions for retail small balance obligors
|
Commercial real estate (CRE) | • CRE Price Index, unemployment rates, GDP, corporate bond yield and interest rates | • Immediate reversion | • Average parameters determined based on internal and external historical data |
Consumer |
Home equity / Residential real estate | •Unemployment rates, HPI and interest rates
| •Straight-line over 3 years
| •Modeled parameters using long-run economic conditions
|
Automobile | •Unemployment rates, HPI, personal consumption expenditure and Manheim used car index
| •Straight-line over 1 year
| •Average parameters determined based on internal and external historical data
|
Credit card | •Unemployment rates, personal consumption expenditure and HPI
| •Straight-line over 2 years
| •Modeled parameters using long-run economic conditions
|
Education / Other consumer | •Modeled using either discrete risk parameters or net charge-off and pay-down rates
|
NOTES TO CONSOLIDATED FINANCIAL STATEMENTS
After the forecast period, we revert to the long-run average over the reversion period noted above, which is the period between the end of the forecast period and when losses are estimated to have completely reverted to the long-run average.Unaudited
OnceSee page 90 for a glossary of certain terms and acronyms used in this Report.
BUSINESS
PNC is one of the largest diversified financial services companies in the U.S. and is headquartered in Pittsburgh, Pennsylvania.
We have businesses engaged in retail banking, including residential mortgage, corporate and institutional banking and asset management, providing many of our products and services nationally. Our retail branch network is located coast-to-coast. We also have strategic international offices in four countries outside the U.S.
NOTE 1 ACCOUNTING POLICIES
Basis of Financial Statement Presentation
Our consolidated financial statements include the accounts of the parent company and its subsidiaries, most of which are wholly-owned, certain partnership interests and VIEs.
We prepared these consolidated financial statements in accordance with GAAP. We have eliminated intercompany accounts and transactions. We have also reclassified certain prior-year amounts to conform to the current period presentation, which did not have a
material impact on our consolidated financial condition or results of operations.
In our opinion, the unaudited interim consolidated financial statements reflect all normal, recurring adjustments needed to state fairly our results for the interim periods. The results of operations for interim periods are not necessarily indicative of the results that may be expected for the full year or any other interim period.
We have also considered the impact of subsequent events on these consolidated financial statements.
When preparing these unaudited interim consolidated financial statements, we have developed a combined estimate of credit losses (i.e., forassumed that you have read the forecast period, reversion period and long-run average) under each of the forecasted scenarios, we produce a probability-weighted credit loss estimate by loan class. We then add or deduct any qualitative components and other adjustments, such as individually assessed loans,audited consolidated financial statements included in our 2023 Form 10-K. Reference is made to produce the ALLL. See the Individually Assessed Component and Qualitative Component discussions that follow in this Note 1 for additional information about those adjustments.
Discounted Cash Flow
Prior to January 1, 2023, we used a discounted cash flow methodology for our home equity and residential real estate loan classes. Effective January 1, 2023, we discontinued our use of a discounted cash flow methodology, and we now use a pooled expected loss methodology based upon the quantification of risk parameters, such as PD, LGD and EAD for a loan or loan segment. See Note 1 Accounting Policies in our 20222023 Form 10-K for a detailed description of significant accounting policies. These interim consolidated financial statements serve to update our use2023 Form 10-K and may not include all information and Notes necessary to constitute a complete set of a discounted cash flow methodology priorfinancial statements. There have been no significant changes to January 1, 2023.
Individually Assessed Component
Loans and leases that do not share similar risk characteristics with a pool of loans are individually assessedour accounting policies as follows:
•For commercial nonperforming loans greater than or equal to a defined dollar threshold, reserves are based on an analysis of the present value of the loan’s expected future cash flows or the fair value of the collateral, if appropriate underdisclosed in our policy for collateral dependent loans. Nonperforming commercial loans below the defined threshold are reserved for under a pooled basis.
•For consumer nonperforming loans classified as collateral dependent, charge-off and ALLL related to recovery of amounts previously charged-off are evaluated through an analysis of the fair value of the collateral less costs to sell.2023 Form 10-K.
Qualitative Component
While our reserve methodologies strive to reflect all relevant credit risk factors, there continues to be uncertainty associated with, but not limited to, potential imprecision in the estimation process due to the inherent time lagUse of obtaining information and normal variations between expected and actual outcomes. We may hold additional reserves that are designed to provide coverage for losses
The PNC Financial Services Group, Inc. – Form 10-Q 53
attributable to such risks. The ACL also takes into account factors that may not be directly measured in the determination of individually assessed or pooled reserves. Such qualitative factors may include, but are not limited to:
•Industry concentrations and conditions,
•Changes in market conditions, including regulatory and legal requirements,
•Changes in the nature and volume of our portfolio,
•Recent credit quality trends,
•Recent loss experience in particular portfolios, including specific and unique events,
•Recent macroeconomic factors that may not be reflected in the forecast information,
•Limitations of available input data, including historical loss information and recent data such as collateral values,
•Model imprecision and limitations,
•Changes in lending policies and procedures, including changes in loss recognition and mitigation policies and procedures, and
•Timing of available information.Estimates
See Note 3 Loans and Related Allowance for Credit Losses for additionalWe prepared these consolidated financial statements using financial information about our loan portfolio and the related allowance.
Accrued Interest
When accrued interest is reversed or charged-off in a timely manner, the CECL standard provides a practical expedient to exclude
accrued interest from ACL measurement. We consider our nonaccrual and charge-off policies to be timely for all of our investment
securities, loans and leases, with the exception of consumer credit cards, education loans and certain unsecured consumer lines of credit. We consider the length of time before nonaccrual/charge-off and the use of appropriate other triggering events for nonaccrual and charge-offs in making this determination. Pursuant to these policy elections, we calculate reserves for accrued interest on credit cards, education loans and certain unsecured consumer lines of credit, which are then included within the ALLL. See the Debt Securities section of Note 1 Accounting Policies in our 2022 Form 10-K and the Nonperforming Loans and Leases section of this Note 1 for additional information on our nonaccrual and charge-off policies.
See Note 1 Accounting Policies in our 2022 Form 10-K for a description of the accounting policies related to the applicable reserves on accrued interest for our home equity and residential real estate loan classes prior to January 1, 2023.
Purchased Credit Deteriorated Loans or Securities
The allowance for PCD loans or securities is determinedavailable at the time of acquisition, aspreparation, which requires us to make estimates and assumptions that affect the estimated expected credit loss of the outstanding balance or par value,based on the methodologies described previously for loans and securities. In accordance with CECL, the allowance recognized at acquisition is addedamounts reported. Our most significant estimates pertain to the acquisition date purchase price to determineACL and our fair value measurements. Actual results may differ from the asset’s amortized cost basis.
Allowance for Unfunded Lending Related Commitments
We maintainestimates and the allowance for unfunded lending related commitments on off-balance sheet credit exposures that are not unconditionally cancelable (e.g., unfunded loan commitments, letters of credit and certain financial guarantees), at a level we believe is appropriate as of the balance sheet date to absorb expected credit losses on these exposures. Other than the estimation of the probability of funding, this reserve is estimated in a manner similardifferences may be material to the methodology used for determining reserves for loans and leases. See the Allowance for Loan and Lease Losses section of this Note 1 for the key credit risk characteristics for unfunded lending related commitments. The allowance for unfunded lending related commitments is recorded as a liability on the Consolidated Balance Sheet. Net adjustments to this reserve are included in the provision for credit losses.consolidated financial statements.
See Note 3 Loans and Related Allowance for Credit Losses for additional information about this allowance.
54 The PNC Financial Services Group, Inc. – Form 10-Q
Recently Adopted Accounting Standards
| | | | | | | | |
Accounting Standards Update | Description | Financial Statement Impact |
Reference Rate Reform - ASU 2020-04
Issued March 2020
Reference Rate Reform Scope - ASU 2021-01
Issued January 2021
Reference Rate Reform Deferral of Sunset Date – ASU 2022-06
Issued December 2022
| • Provides optional expedients and exceptions for applying generally accepted accounting principles to contracts, hedging relationships and other transactions that reference LIBOR or another reference rate expected to be discontinued because of reference rate reform (codified in ASC 848).
• Includes optional expedients related to contract modifications that allow an entity to account for modifications (if certain criteria are met) as if the modifications were only minor (assets within the scope of ASC 310, Receivables), were not substantial (assets within the scope of ASC 470, Debt) and/or did not result in remeasurements or reclassifications (assets within the scope of ASC 842, Leases, and other Topics) of the existing contract.
• Includes optional expedients related to hedging relationships within the scope of ASC 815, Derivatives & Hedging, whereby changes to the critical terms of a hedging relationship do not require dedesignation if certain criteria are met. In addition, potential sources of ineffectiveness as a result of reference rate reform may be disregarded when performing some effectiveness assessments.
• Includes optional expedients and exceptions for contract modifications and hedge accounting that apply to derivative instruments impacted by the market-wide discounting transition.
• Guidance in these ASUs is effective as of March 12, 2020 through December 31, 2024.
| • ASU 2020-04 was adopted March 12, 2020. ASU 2021-01 was retrospectively adopted October 1, 2020. ASU 2022-06 was adopted upon issuance.
• Refer to Note 1 Accounting Policies in our 2022 Form 10-K for more information on elections of optional expedients that occurred in 2020, 2021 and 2022. We applied these optional expedients consistently to all eligible LIBOR cessation-related contract modifications and hedging relationships since election.
• During the second quarter of 2023, we elected and applied certain optional expedients for contract modifications and hedging relationships impacted by the central clearing counterparties conversion processes for LIBOR-indexed derivative instruments. These optional expedients remove the requirement to remeasure contract modifications or dedesignate hedging relationships due to reference rate reform. The elections made apply only to derivatives instruments impacted by the central clearinghouse conversion process.
• During the second quarter of 2023, we applied certain optional expedients for investment security, debt and preferred stock instrument contract modifications impacted by LIBOR cessation. These optional expedients remove the requirement to remeasure contract modifications.
• We may elect additional optional expedients for contract modifications and hedge relationships affected by reference rate reform through the effective date of this guidance.
|
Accounting Standards Update | Description | Financial Statement Impact |
Troubled Debt Restructurings and Vintage Disclosures - ASU 2022-02
Issued March 2022
| • Eliminates the accounting guidance for TDRs and requires an entity to apply the loan refinancing and restructuring guidance to determine whether a modification results in a new loan or a continuation of an existing loan.
• Eliminates the requirement to use a discounted cash flow approach to measure the allowance for credit losses for TDRs.
• Enhances disclosure requirements for certain loan refinancings and restructurings by creditors when a borrower is experiencing financial difficulty.
• Requires disclosure of current-period gross charge-offs by year of origination for financing receivables and net investments in leases within the scope of CECL.
• Requires a prospective transition approach to all amendments except those related to the recognition and measurement of TDRs (which allow the option to apply a modified retrospective transition approach through a cumulative-effect adjustment to retained earnings in the period of adoption).
| • Adopted January 1, 2023 using a modified retrospective transition approach for the amendments related to the recognition and measurement of TDRs.
• The impact of adoption resulted in a decrease to the beginning period ALLL of $35 million, resulting in an increase to Retained Earnings of $26 million, net of tax, as of January 1, 2023.
• The presentation of our loan modification disclosures have been updated to reflect information on loan modifications given to borrowers experiencing financial difficulty and can be found within Note 3 Loans and Related Allowance for Credit Losses. TDR disclosures are presented for comparative periods only and are not required to be updated in current periods. Additionally, our vintage disclosure has been updated to reflect gross charge-offs by year of origination.
|
The PNC Financial Services Group, Inc. – Form 10-Q 5545
NOTE 2 INVESTMENT SECURITIES
The following table summarizes our available for sale and held to maturity portfolios by major security type:
Table 36:35: Investment Securities Summary (a)(b)
| | June 30, 2023 | | | December 31, 2022 |
| | March 31, 2024 | | | | March 31, 2024 | | | December 31, 2023 |
| In millions | In millions | | Amortized
Cost (c) | | Unrealized | | Fair
Value | | | Amortized
Cost (c) | | Unrealized | | Fair
Value | In millions | | Amortized
Cost (c) | | Unrealized | | Fair
Value | | | Amortized
Cost (c) | | Unrealized | | Fair
Value |
| Gains | | Losses | | | Gains | | Losses | |
| Securities Available for Sale | Securities Available for Sale | | | | | |
| Securities Available for Sale | |
| Securities Available for Sale | |
| U.S. Treasury and government agencies | |
| U.S. Treasury and government agencies | |
| U.S. Treasury and government agencies | U.S. Treasury and government agencies | | $ | 7,863 | | | $ | 7 | | | $ | (760) | | | $ | 7,110 | | | | $ | 9,196 | | | $ | 10 | | | $ | (836) | | | $ | 8,370 | |
| Residential mortgage-backed | Residential mortgage-backed | | | | |
| Agency | Agency | | 30,867 | | | 6 | | | (3,218) | | | 27,655 | | | | 32,114 | | | 13 | | | (3,304) | | | 28,823 | |
| Agency | |
| Agency | |
| Non-agency | Non-agency | | 642 | | | 133 | | | (7) | | | 768 | | | | 697 | | | 131 | | | (9) | | | 819 | |
| Commercial mortgage-backed | Commercial mortgage-backed | | | | |
| Agency | |
| Agency | |
| Agency | Agency | | 1,759 | | | 1 | | | (167) | | | 1,593 | | | | 1,845 | | | (170) | | | 1,675 | |
| Non-agency | Non-agency | | 1,014 | | | | | | (67) | | | 947 | | | | 1,325 | | | (69) | | | 1,256 | |
| Asset-backed | Asset-backed | | 910 | | | 28 | | | (4) | | | 934 | | | | 103 | | | 27 | | | (1) | | | 129 | |
| Other | Other | | 2,962 | | | 39 | | | (221) | | | 2,780 | | | | 3,288 | | | 44 | | | (245) | | | 3,087 | |
| Total securities available for sale | Total securities available for sale | | $ | 46,017 | | | $ | 214 | | | $ | (4,444) | | | $ | 41,787 | | | | $ | 48,568 | | | $ | 225 | | | $ | (4,634) | | | $ | 44,159 | |
| Securities Held to Maturity | Securities Held to Maturity | | | | |
| U.S. Treasury and government agencies | U.S. Treasury and government agencies | | $ | 36,985 | | | $ | 3 | | | $ | (1,695) | | | $ | 35,293 | | | | $ | 36,571 | | | $ | 6 | | | $ | (1,617) | | | $ | 34,960 | |
| U.S. Treasury and government agencies | |
| U.S. Treasury and government agencies | |
| Residential mortgage-backed | Residential mortgage-backed | | | | |
| Agency | |
| Agency | |
| Agency | Agency | | 44,278 | | | 60 | | | (3,119) | | | 41,219 | | | | 45,271 | | | 74 | | | (3,095) | | | 42,250 | |
| Non-agency | Non-agency | | 269 | | | (22) | | | 247 | | | | 276 | | | (21) | | | 255 | |
| Commercial mortgage-backed | Commercial mortgage-backed | | | | |
| Agency | |
| Agency | |
| Agency | Agency | | 839 | | | 3 | | | (30) | | | 812 | | | | 848 | | | 4 | | | (26) | | | 826 | |
| Non-agency | Non-agency | | 1,549 | | | | | | (38) | | | 1,511 | | | | 1,667 | | | (40) | | | 1,627 | |
| Asset-backed | Asset-backed | | 6,645 | | | 5 | | | (112) | | | 6,538 | | | | 7,188 | | | 6 | | | (140) | | | 7,054 | |
| Other | Other | | 3,309 | | | 27 | | | (60) | | | 3,276 | | | | 3,354 | | | 25 | | | (72) | | | 3,307 | |
| Total securities held to maturity (d) | Total securities held to maturity (d) | | $ | 93,874 | | | $ | 98 | | | $ | (5,076) | | | $ | 88,896 | | | | $ | 95,175 | | | $ | 115 | | | $ | (5,011) | | | $ | 90,279 | |
|
(a) At June 30, 2023,March 31, 2024, the accrued interest associated with our held to maturity and available for sale portfolios totaled $288$244 million and $143$140 million, respectively. The comparable amounts at December 31, 20222023 were $282$281 million and $144 million, respectively. These amounts are included in Other assets on the Consolidated Balance Sheet.
(b) Credit ratings represent a primary credit quality indicator used to monitor and manage credit risk. Of our total securities portfolio, 97% were rated AAA/AA at both June 30, 2023March 31, 2024 and December 31, 2022.2023.
(c) Amortized cost is presented net of allowance of $141$87 million for securities available for sale, primarily related to non-agency commercial mortgage-backed securities, and $7$6 million for securities held to maturity at June 30, 2023.March 31, 2024. The comparable amounts at December 31, 20222023 were $142$86 million and $7$6 million, respectively.
(d) Held to maturity securities transferred from available for sale are included in held to maturity at fair value at the time of the transfer. The amortized cost of held to maturity securities included net unrealized losses of $4.7$4.0 billion at June 30, 2023March 31, 2024 related to securities transferred, which are offset in AOCI, net of tax. The comparable amount at December 31, 2023 was $4.2 billion.
The fair value of investment securities is impacted by interest rates, credit spreads, market volatility and liquidity conditions. Securities available for sale are carried at fair value with net unrealized gains and losses included in Total shareholders’ equity as AOCI, unless credit-related. Net unrealized gains and losses are determined by taking the difference between the fair value of a security and its amortized cost, net of any allowance. Securities held to maturity are carried at amortized cost, net of any allowance. Investment securities at June 30, 2023March 31, 2024 included $0.2 billion$262 million of net unsettled purchases that represent non-cash investing activity, and accordingly, are not reflected on the Consolidated Statement of Cash Flows. The comparable amount for June 30, 2022March 31, 2023 was $0.4 billion$30 million of net unsettled purchases.sales.
We maintain the allowance for investment securities at levels that we believe to be appropriate as of the balance sheet date to absorb expected credit losses on our portfolio. At June 30, 2023,March 31, 2024, the allowance for investment securities was $148$93 million and primarily related to non-agency commercial mortgage-backed securities in the available for sale portfolio. The comparable amount at December 31, 20222023 was $149$92 million. See Note 1 Accounting Policies in our 20222023 Form 10-K for a discussion of the methodologies used to determine the allowance for investment securities.
At June 30, 2023,March 31, 2024, AOCI included pretax losses of $301$289 million from derivatives that hedged the purchase of investment securities classified as held to maturity. The losses will be accreted to interest income as an adjustment of yield on the securities.
Table 3736 presents the gross unrealized losses and fair value of securities available for sale that do not have an associated allowance for investment securities at June 30, 2023March 31, 2024 and December 31, 2022.2023. These securities are segregated between investments that had been in a continuous unrealized loss position for less than twelve months and twelve months or more, based on the point in time that the fair
46 The PNC Financial Services Group, Inc. – Form 10-Q
value declined below the amortized cost basis. All securities included in the table have been evaluated to determine if a credit loss
56 The PNC Financial Services Group, Inc. – Form 10-Q
exists. As part of that assessment, as of June 30, 2023,March 31, 2024, we concluded that we do not intend to sell and believe we will not be required to sell these securities prior to recovery of the amortized cost basis.
Table 37:36: Gross Unrealized Loss and Fair Value of Securities Available for Sale Without an Allowance for Credit Losses
| | | Unrealized loss position
less than 12 months | | | | Unrealized loss position
less than 12 months | | Unrealized loss position
12 months or more | | Total |
| In millions | | In millions | | Unrealized
Loss | | Fair
Value | | Unrealized
Loss | | Fair
Value | | Unrealized
Loss | | Fair
Value |
| March 31, 2024 | |
| | | Unrealized loss position
less than 12 months | | Unrealized loss position
12 months or more | | Total |
| In millions | | Unrealized
Loss | | Fair
Value | | Unrealized
Loss | | Fair
Value | | Unrealized
Loss | | Fair
Value |
| June 30, 2023 | | |
| U.S. Treasury and government agencies | |
| | U.S. Treasury and government agencies | |
| | U.S. Treasury and government agencies | U.S. Treasury and government agencies | | $ | (9) | | | $ | 898 | | | $ | (751) | | | $ | 5,983 | | | $ | (760) | | | $ | 6,881 | |
| Residential mortgage-backed | Residential mortgage-backed | | |
| Agency | Agency | | (51) | | | 2,309 | | | (3,167) | | | 24,700 | | | (3,218) | | | 27,009 | |
| Agency | |
| Agency | |
| Non-agency | Non-agency | | (1) | | | 46 | | | (6) | | | 67 | | | (7) | | | 113 | |
| Commercial mortgage-backed | Commercial mortgage-backed | | |
| Agency | |
| Agency | |
| Agency | Agency | | (2) | | | 89 | | | (165) | | | 1,485 | | | (167) | | | 1,574 | |
| Non-agency | Non-agency | | (57) | | | 808 | | | (57) | | | 808 | |
| Asset-backed | Asset-backed | | (3) | | | 502 | | | (1) | | | 12 | | | (4) | | | 514 | |
| Other | Other | | (6) | | | 243 | | | (180) | | | 2,022 | | | (186) | | | 2,265 | |
| Total securities available for sale | Total securities available for sale | | $ | (72) | | | $ | 4,087 | | | $ | (4,327) | | | $ | 35,077 | | | $ | (4,399) | | | $ | 39,164 | |
| December 31, 2022 | | |
| December 31, 2023 | |
| U.S. Treasury and government agencies | |
| U.S. Treasury and government agencies | |
| U.S. Treasury and government agencies | U.S. Treasury and government agencies | | $ | (601) | | | $ | 5,868 | | | $ | (235) | | | $ | 2,208 | | | $ | (836) | | | $ | 8,076 | |
| Residential mortgage-backed | Residential mortgage-backed | | |
| Agency | Agency | | (1,744) | | | 19,036 | | | (1,560) | | | 8,971 | | | (3,304) | | | 28,007 | |
| Agency | |
| Agency | |
| Non-agency | Non-agency | | (6) | | | 112 | | | (2) | | | 17 | | | (8) | | | 129 | |
| Commercial mortgage-backed | Commercial mortgage-backed | | |
| Agency | |
| Agency | |
| Agency | Agency | | (125) | | | 1,283 | | | (45) | | | 372 | | | (170) | | | 1,655 | |
| Non-agency | Non-agency | | (44) | | | 750 | | | (18) | | | 394 | | | (62) | | | 1,144 | |
| Asset-backed | Asset-backed | | (1) | | | 5 | | | (1) | | | 5 | |
| Other | Other | | (96) | | | 1,418 | | | (112) | | | 1,144 | | | (208) | | | 2,562 | |
| | Total securities available for sale | Total securities available for sale | | $ | (2,616) | | | $ | 28,467 | | | $ | (1,973) | | | $ | 13,111 | | | $ | (4,589) | | | $ | 41,578 | |
| Total securities available for sale | |
| Total securities available for sale | |
Information related to gross realized securities gains and losses from the sales of securities is set forth in the following table:
Table 38:Gross Gains (Losses) on Sales of Securities Available for Sale
| | | | | | | | | | | | | | | | | | |
Six months ended June 30
In millions | | Gross Gains | Gross Losses | Net Gains (Losses) | Tax Expense (Benefit) | |
| 2023 | | | | $ | (2) | | $ | (2) | | | | |
| 2022 | | $ | 11 | | $ | (15) | | $ | (4) | | $ | (1) | | |
The PNC Financial Services Group, Inc. – Form 10-Q 5747
The following table presents, by remaining contractual maturity, the amortized cost, fair value and weighted-average yield of debt securities at June 30, 2023:March 31, 2024:
Table 39:37: Contractual Maturity of Debt Securities
| June 30, 2023
Dollars in millions | | 1 Year or Less | | After 1 Year
through 5 Years | | After 5 Years
through 10 Years | | After 10
Years | | Total | |
March 31, 2024
Dollars in millions | |
| Securities Available for Sale | |
| Securities Available for Sale | |
| Securities Available for Sale | Securities Available for Sale | | |
| U.S. Treasury and government agencies | U.S. Treasury and government agencies | | $ | 1,230 | | | $ | 2,918 | | | $ | 1,724 | | | $ | 1,991 | | | $ | 7,863 | | |
| U.S. Treasury and government agencies | |
| U.S. Treasury and government agencies | |
| Residential mortgage-backed | |
| Residential mortgage-backed | |
| Residential mortgage-backed | Residential mortgage-backed | | |
| Agency | Agency | | 1 | | | 134 | | | 3,675 | | | 27,057 | | | 30,867 | | |
| Agency | |
| Agency | |
| Non-agency | |
| Non-agency | |
| Non-agency | Non-agency | | 8 | | | 634 | | | 642 | | |
| Commercial mortgage-backed | Commercial mortgage-backed | | |
| Commercial mortgage-backed | |
| Commercial mortgage-backed | |
| Agency | |
| Agency | |
| Agency | Agency | | 49 | | | 409 | | | 905 | | | 396 | | | 1,759 | | |
| Non-agency | Non-agency | | 119 | | | 100 | | | 795 | | | 1,014 | | |
| Non-agency | |
| Non-agency | |
| Asset-backed | |
| Asset-backed | |
| Asset-backed | Asset-backed | | 249 | | | 106 | | | 555 | | | 910 | | |
| Other | Other | | 307 | | | 2,008 | | | 495 | | | 152 | | | 2,962 | | |
| Other | |
| Other | |
| Total securities available for sale at amortized cost | |
| Total securities available for sale at amortized cost | |
| Total securities available for sale at amortized cost | Total securities available for sale at amortized cost | | $ | 1,587 | | | $ | 5,837 | | | $ | 7,013 | | | $ | 31,580 | | | $ | 46,017 | | |
| Fair value | Fair value | | $ | 1,550 | | | $ | 5,460 | | | $ | 6,385 | | | $ | 28,392 | | | $ | 41,787 | | |
| Fair value | |
| Fair value | |
| Weighted-average yield, GAAP basis (a) | |
| Weighted-average yield, GAAP basis (a) | |
| Weighted-average yield, GAAP basis (a) | Weighted-average yield, GAAP basis (a) | | 2.01 | % | | 2.17 | % | | 2.39 | % | | 2.98 | % | | 2.75 | % | |
| Securities Held to Maturity | Securities Held to Maturity | | |
| Securities Held to Maturity | |
| Securities Held to Maturity | |
| U.S. Treasury and government agencies | |
| U.S. Treasury and government agencies | |
| U.S. Treasury and government agencies | U.S. Treasury and government agencies | | $ | 2,075 | | | $ | 31,522 | | | $ | 2,477 | | | $ | 911 | | | $ | 36,985 | | |
| Residential mortgage-backed | Residential mortgage-backed | | |
| Residential mortgage-backed | |
| Residential mortgage-backed | |
| Agency | |
| Agency | |
| Agency | Agency | | 7 | | | 333 | | | 43,938 | | | 44,278 | | |
| Non-agency | Non-agency | | 269 | | | 269 | | |
| Non-agency | |
| Non-agency | |
| Commercial mortgage-backed | |
| Commercial mortgage-backed | |
| Commercial mortgage-backed | Commercial mortgage-backed | | |
| Agency | Agency | | 133 | | | 430 | | | 276 | | | 839 | | |
| Agency | |
| Agency | |
| Non-agency | |
| Non-agency | |
| Non-agency | Non-agency | | 43 | | | 49 | | | | | | 1,457 | | | 1,549 | | |
| Asset-backed | Asset-backed | | 11 | | | 2,103 | | | 1,949 | | | 2,582 | | | 6,645 | | |
| Asset-backed | |
| Asset-backed | |
| Other | |
| Other | |
| Other | Other | | 230 | | | 1,116 | | | 603 | | | 1,360 | | | 3,309 | | |
| Total securities held to maturity at amortized cost | Total securities held to maturity at amortized cost | | $ | 2,359 | | | $ | 34,930 | | | $ | 5,792 | | | $ | 50,793 | | | $ | 93,874 | | |
| Total securities held to maturity at amortized cost | |
| Total securities held to maturity at amortized cost | |
| Fair value | |
| Fair value | |
| Fair value | Fair value | | $ | 2,330 | | | $ | 33,471 | | | $ | 5,526 | | | $ | 47,569 | | | $ | 88,896 | | |
| Weighted-average yield, GAAP basis (a) | Weighted-average yield, GAAP basis (a) | | 1.30 | % | | 1.39 | % | | 3.65 | % | | 2.93 | % | | 2.36 | % | |
| Weighted-average yield, GAAP basis (a) | |
| Weighted-average yield, GAAP basis (a) | |
(a)Weighted-average yields are based on amortized cost with effective yields weighted for the contractual maturity of each security. Actual maturities and yields may differ as certain securities may be prepaid.
At June 30, 2023,March 31, 2024, there were no securities of a single issuer, other than FNMA and FHLMC, that exceeded 10% of Totaltotal shareholders’ equity. The FNMA and FHLMC investments had a total amortized cost of $38.5$36.6 billion and $32.4$31.7 billion and fair value of $35.3$33.3 billion and $30.0$29.1 billion, respectively.
The following table presents the fair value of securities that have been either pledged to or accepted from others to collateralize outstanding borrowings:
Table 40:38: Fair Value of Securities Pledged and Accepted as Collateral
| | In millions | In millions | June 30, 2023 | December 31, 2022 | In millions | March 31, 2024 | December 31, 2023 |
| Pledged to others | Pledged to others | $ | 27,347 | | $ | 24,708 | |
| Accepted from others: | Accepted from others: | | |
| Permitted by contract or custom to sell or repledge | Permitted by contract or custom to sell or repledge | $ | 1,160 | | $ | 1,266 | |
| Permitted by contract or custom to sell or repledge | |
| Permitted by contract or custom to sell or repledge | |
| Permitted amount repledged to others | Permitted amount repledged to others | $ | 1,160 | | $ | 1,266 | |
The securities pledged to others include positions held in our portfolio of investment securities, trading securities and securities accepted as collateral from others that we are permitted by contract or custom to sell or repledge, and were used to secure public and trust deposits, repurchase agreements and for other purposes. See Note 12 Financial Derivatives for information related to securities pledged and accepted as collateral for derivatives.
5848 The PNC Financial Services Group, Inc. – Form 10-Q
NOTE 3 LOANS AND RELATED ALLOWANCE FOR CREDIT LOSSES
Loan Portfolio
Our loan portfolio consists of two portfolio segments – Commercial and Consumer. Each of these segments comprises multiple loan classes. Classes are characterized by similarities in risk attributes and the manner in which we monitor and assess credit risk.
| | | | | | | | |
| Commercial | | Consumer |
|
• Commercial and industrial | | • Residential real estate |
• Commercial real estate | | • Home equity |
• Equipment lease financing | | • Automobile |
| | • Credit card |
| | • Education |
| | • Other consumer |
| | |
See Note 1 Accounting Policies in our 2023 Form 10-K for additional information on our loan related policies.
Credit Quality
We closely monitor economic conditions and loan performance trends to manage and evaluate our exposure to credit risk within the loan portfolio based on our defined loan classes. In doing so, we use several credit quality indicators, including, but not limited to, trends in delinquency rates, nonperforming status, analysisanalyses of PD and LGD ratings, updated credit scores and originated and updated LTV ratios.
We manage credit risk based on the risk profile of the borrower, repayment sources, underlying collateral and other support given current events, economic conditions and expectations. We refine our practices to meet the changing environment resulting from elevatedsuch as inflation levels, labor-related supply chain pressures, higherindustry specific risks, interest rates,rate levels, the level of consumer savings and deposit balances, and structural and secular changes fostered by the pandemic. To mitigate losses and enhance customer support, we offer loan modifications and collection programs to assist our customers.
Table 4139 presents the composition and delinquency status of our loan portfolio at June 30, 2023March 31, 2024 and December 31, 2022.2023. Loan delinquencies include government insured or guaranteed loans and loans accounted for under the fair value option.
The PNC Financial Services Group, Inc. – Form 10-Q 5949
Table 41:39: Analysis of Loan Portfolio (a) (b) (c) | | | |
| | | | Accruing | | | | | |
| Dollars in millions | Dollars in millions | Current or Less
Than 30 Days
Past Due | 30-59
Days
Past Due | 60-89
Days
Past Due | 90 Days
or More
Past Due | Total
Past
Due (d) | | Nonperforming
Loans | Fair Value
Option
Nonaccrual
Loans (e) | Total Loans
(f)(g) | | |
| June 30, 2023 | | | | | | | |
| Dollars in millions | |
| Dollars in millions | |
| March 31, 2024 | |
| March 31, 2024 | |
| March 31, 2024 | |
| Commercial | |
| Commercial | |
| Commercial | Commercial | | | | | | | |
| Commercial and industrial | Commercial and industrial | $ | 176,936 | | $ | 64 | | $ | 47 | | $ | 112 | | $ | 223 | | | $ | 470 | | | $ | 177,629 | | | |
| Commercial and industrial | |
| Commercial and industrial | |
| Commercial real estate | |
| Commercial real estate | |
| Commercial real estate | Commercial real estate | 35,568 | | 10 | | | | | | 10 | | | 350 | | | 35,928 | | | |
| Equipment lease financing | Equipment lease financing | 6,374 | | 14 | | 5 | | | 19 | | | 7 | | | 6,400 | | | |
| Equipment lease financing | |
| Equipment lease financing | |
| Total commercial | |
| Total commercial | |
| Total commercial | Total commercial | 218,878 | | 88 | | 52 | | 112 | | 252 | | | 827 | | | 219,957 | | | |
| Consumer | Consumer | | | | | | | |
| Consumer | |
| Consumer | |
| Residential real estate | |
| Residential real estate | |
| Residential real estate | Residential real estate | 45,374 | | 228 | | 86 | | 174 | | 488 | | (d) | 429 | | $ | 543 | | 46,834 | | | |
| Home equity | Home equity | 25,546 | | 56 | | 18 | | | 74 | | | 506 | | 74 | | 26,200 | | | |
| Home equity | |
| Home equity | |
| Automobile | |
| Automobile | |
| Automobile | Automobile | 14,823 | | 84 | | 20 | | 5 | | 109 | | | 133 | | | 15,065 | | | |
| Credit card | Credit card | 6,926 | | 49 | | 36 | | 71 | | 156 | | | 10 | | | 7,092 | | | |
| Credit card | |
| Credit card | |
| Education | |
| Education | |
| Education | Education | 1,960 | | 33 | | 17 | | 48 | | 98 | | (d) | | | 2,058 | | | |
| Other consumer | Other consumer | 4,512 | | 17 | | 9 | | 9 | | 35 | | | 8 | | | 4,555 | | | |
| Other consumer | |
| Other consumer | |
| Total consumer | |
| Total consumer | |
| Total consumer | Total consumer | 99,141 | | 467 | | 186 | | 307 | | 960 | | | 1,086 | | 617 | | 101,804 | | | |
| Total | Total | $ | 318,019 | | $ | 555 | | $ | 238 | | $ | 419 | | $ | 1,212 | | | $ | 1,913 | | $ | 617 | | $ | 321,761 | | | |
| Total | |
| Total | |
| Percentage of total loans | Percentage of total loans | 98.84 | % | 0.17 | % | 0.07 | % | 0.13 | % | 0.38 | % | | 0.59 | % | 0.19 | % | 100.00 | % | | |
| December 31, 2022 | | | | | | | |
| Percentage of total loans | |
| Percentage of total loans | |
| December 31, 2023 | |
| December 31, 2023 | |
| December 31, 2023 | |
| Commercial | |
| Commercial | |
| Commercial | Commercial | | | | | | | |
| Commercial and industrial | Commercial and industrial | $ | 181,223 | | $ | 169 | | $ | 27 | | $ | 137 | | $ | 333 | | | $ | 663 | | | $ | 182,219 | | | |
| Commercial and industrial | |
| Commercial and industrial | |
| Commercial real estate | |
| Commercial real estate | |
| Commercial real estate | Commercial real estate | 36,104 | | 19 | | 4 | | | 23 | | | 189 | | | 36,316 | | | |
| Equipment lease financing | Equipment lease financing | 6,484 | | 20 | | 4 | | | 24 | | | 6 | | | 6,514 | | | |
| Equipment lease financing | |
| Equipment lease financing | |
| Total commercial | |
| Total commercial | |
| Total commercial | Total commercial | 223,811 | | 208 | | 35 | | 137 | | 380 | | | 858 | | | 225,049 | | | |
| Consumer | Consumer | | | | | | | |
| Consumer | |
| Consumer | |
| Residential real estate | |
| Residential real estate | |
| Residential real estate | Residential real estate | 44,306 | | 281 | | 112 | | 199 | | 592 | | (d) | 424 | | $ | 567 | | 45,889 | | | |
| Home equity | Home equity | 25,305 | | 53 | | 20 | | | 73 | | | 526 | | 79 | | 25,983 | | | |
| Home equity | |
| Home equity | |
| Automobile | |
| Automobile | |
| Automobile | Automobile | 14,543 | | 106 | | 25 | | 7 | | 138 | | | 155 | | | 14,836 | | | |
| Credit card | Credit card | 6,906 | | 50 | | 35 | | 70 | | 155 | | | 8 | | | 7,069 | | | |
| Credit card | |
| Credit card | |
| Education | |
| Education | |
| Education | Education | 2,058 | | 34 | | 22 | | 59 | | 115 | | (d) | | | 2,173 | | | |
| Other consumer | Other consumer | 4,975 | | 15 | | 12 | | 10 | | 37 | | | 14 | | | 5,026 | | | |
| Other consumer | |
| Other consumer | |
| Total consumer | |
| Total consumer | |
| Total consumer | Total consumer | 98,093 | | 539 | | 226 | | 345 | | 1,110 | | | 1,127 | | 646 | | 100,976 | | | |
| Total | Total | $ | 321,904 | | $ | 747 | | $ | 261 | | $ | 482 | | $ | 1,490 | | | $ | 1,985 | | $ | 646 | | $ | 326,025 | | | |
| Total | |
| Total | |
| Percentage of total loans | Percentage of total loans | 98.73 | % | 0.23 | % | 0.08 | % | 0.15 | % | 0.46 | % | | 0.61 | % | 0.20 | % | 100.00 | % | | |
| Percentage of total loans | |
| Percentage of total loans | |
(a)Amounts in table represent loans held for investment and do not include any associated ALLL.
(b)Under the CARES Act credit reporting rules, certain loans modified due to pandemic related hardships are not being reported as past due as of June 30, 2023 and December 31, 2022 based on the contractual terms of the loan, even where borrowers may not be making payments on their loans during the modification period. The CARES Act credit reporting rules expire in the third quarter of 2023.
(c)The accrued interest associated with our loan portfolio totaled $1.3 billion and $1.2$1.5 billion at June 30, 2023both March 31, 2024 and December 31, 2022, respectively.2023. These amounts are included in Other assets on the Consolidated Balance Sheet.
(d)(c)Past due loan amounts include government insured or guaranteed Residentialresidential real estate loans and Educationeducation loans totaling $0.3 billion and $0.1 billion at both June 30, 2023March 31, 2024 and December 31, 2022.2023.
(e)(d)Consumer loans accounted for under the fair value option for which we do not expect to collect substantially all principal and interest are subject to nonaccrual accounting and classification upon meeting any of our nonaccrual policy criteria. Given that these loans are not accounted for at amortized cost, they have been excluded from the nonperforming loan population.
(f)(e)Includes unearned income, unamortized deferred fees and costs on originated loans and premiums or discounts on purchased loans totaling $0.8$0.9 billion and $0.9$1.0 billion at June 30, 2023March 31, 2024 and December 31, 2022,2023, respectively.
(g)(f)Collateral dependent loans totaled $1.2 billion and $1.3$1.4 billion at June 30, 2023both March 31, 2024 and December 31, 2022,2023, respectively.
At June 30, 2023,March 31, 2024, we pledged $48.3$50.8 billion of commercial and other loans to the Federal Reserve Bank and $92.5$90.9 billion of residential real estate and other loans to the FHLB as collateral for the ability to borrow, if necessary. The comparable amounts at December 31, 20222023 were $28.1$51.3 billion and $90.4$89.5 billion, respectively. Amounts pledged reflect the unpaid principal balances.
60 The PNC Financial Services Group, Inc. – Form 10-Q
Nonperforming Assets
Nonperforming assets include nonperforming loans and leases, OREO and foreclosed assets. Nonperforming loans are those loans accounted for at amortized cost whose credit quality has deteriorated to the extent that full collection of contractual principal and interest is not probable. Interest income is not recognized on these loans. Loans accounted for under the fair value option are reported as performing loans; however, when nonaccrual criteria is met, interest income is not recognized on these loans. Additionally, certain government insured or guaranteed loans for which we expect to collect substantially all principal and interest are not reported as nonperforming loans and continue to accrue interest. See Note 1 Accounting Policies in our 2023 Form 10-K for additional information on our nonperforming loan and lease policies.
50 The PNC Financial Services Group, Inc. – Form 10-Q
The following table presents our nonperforming assets as of June 30, 2023March 31, 2024 and December 31, 2022, respectively:2023:
Table 42:40: Nonperforming Assets
| | Dollars in millions | Dollars in millions | | June 30, 2023 | | December 31, 2022 | |
| Nonperforming loans (a) | | |
| Nonperforming loans | |
| Nonperforming loans | |
| Nonperforming loans | |
| Commercial | Commercial | | $ | 827 | | | $ | 858 | | |
| Consumer (b) | | 1,086 | | | 1,127 | | |
| Total nonperforming loans (c) | | 1,913 | | | 1,985 | | |
| Commercial | |
| Commercial | |
| Consumer (a) | |
| Consumer (a) | |
| Consumer (a) | |
| Total nonperforming loans (b) | |
| Total nonperforming loans (b) | |
| Total nonperforming loans (b) | |
| OREO and foreclosed assets | |
| OREO and foreclosed assets | |
| OREO and foreclosed assets | OREO and foreclosed assets | | 36 | | | 34 | | |
| Total nonperforming assets | Total nonperforming assets | | $ | 1,949 | | | $ | 2,019 | | |
| Total nonperforming assets | |
| Total nonperforming assets | |
| Nonperforming loans to total loans | |
| Nonperforming loans to total loans | |
| Nonperforming loans to total loans | Nonperforming loans to total loans | | 0.59 | % | | 0.61 | % | |
| Nonperforming assets to total loans, OREO and foreclosed assets | Nonperforming assets to total loans, OREO and foreclosed assets | | 0.61 | % | | 0.62 | % | |
| Nonperforming assets to total loans, OREO and foreclosed assets | |
| Nonperforming assets to total loans, OREO and foreclosed assets | |
| Nonperforming assets to total assets | Nonperforming assets to total assets | | 0.35 | % | | 0.36 | % | |
| Nonperforming assets to total assets | |
| Nonperforming assets to total assets | |
(a)In connection with the adoption of ASU 2022-02, nonperforming loans as of June 30, 2023 include certain loans where terms were modified as a result of a borrower’s financial difficulty. Prior period amounts included nonperforming TDRs, for which accounting guidance was eliminated effective January 1, 2023. See Note 1 Accounting Policies and the Loan Modifications to Borrowers Experiencing Financial Difficulty section of this Note 3 for more information on our adoption of this ASU.
(b)Excludes most unsecured consumer loans and lines of credit, which are charged off after 120 to 180 days past due and are not placed on nonperforming status.
(c)(b)Nonperforming loans for which there is no related ALLL totaled $0.8$0.5 billion at June 30, 2023both March 31, 2024 and December 31, 2023. This primarily includeincludes loans with a fair value of collateral that exceeds the amortized cost basis. The comparable amount at December 31, 2022 was $0.7 billion.
Additional Credit Quality Indicators by Loan Class
Commercial Loan Classes
See Note 43 Loans and Related Allowance for Credit Losses in our 20222023 Form 10-K for additional information related to these loan classes, including discussion around the credit quality indicators that we use to monitor and manage the credit risk associated with each loan class.
The PNC Financial Services Group, Inc. – Form 10-Q 6151
The following table presents credit quality indicators for our commercial loan classes:
Table 43:41: Commercial Credit Quality Indicators (a) (b) | | | | Term Loans by Origination Year | | | | | Term Loans by Origination Year | | | |
June 30, 2023 In millions | 2023 | | 2022 | 2021 | 2020 | 2019 | Prior | Revolving Loans | Revolving Loans Converted to Term | Total |
March 31, 2024 In millions | | March 31, 2024 In millions | 2024 | | 2023 | 2022 | 2021 | 2020 | Prior | Revolving Loans | Revolving Loans Converted to Term | Total |
| Commercial and industrial | Commercial and industrial | | |
| Pass Rated | |
| Pass Rated | |
| Pass Rated | Pass Rated | $ | 15,699 | | | $ | 32,220 | | $ | 8,328 | | $ | 6,279 | | $ | 4,694 | | $ | 14,114 | | $ | 88,198 | | $ | 61 | | $ | 169,593 | |
| Criticized | Criticized | 102 | | | 1,820 | | 556 | | 344 | | 268 | | 819 | | 4,092 | | 35 | | 8,036 | |
| Total commercial and industrial loans | Total commercial and industrial loans | $ | 15,801 | | | $ | 34,040 | | $ | 8,884 | | $ | 6,623 | | $ | 4,962 | | $ | 14,933 | | $ | 92,290 | | $ | 96 | | $ | 177,629 | |
| Gross charge-offs | $ | 10 | | (c) | $ | 9 | | $ | 27 | | $ | 6 | | $ | 1 | | $ | 14 | | $ | 74 | | $ | 8 | | $ | 149 | |
| Gross charge-offs (b) | |
| Commercial real estate | Commercial real estate | | |
| Pass Rated | |
| Pass Rated | |
| Pass Rated | Pass Rated | $ | 2,589 | | | $ | 9,428 | | $ | 3,773 | | $ | 2,513 | | $ | 5,139 | | $ | 8,571 | | $ | 339 | | | $ | 32,352 | |
| Criticized | Criticized | 59 | | | 294 | | 253 | | 321 | | 668 | | 1,963 | | 18 | | | 3,576 | |
| Total commercial real estate loans | Total commercial real estate loans | $ | 2,648 | | | $ | 9,722 | | $ | 4,026 | | $ | 2,834 | | $ | 5,807 | | $ | 10,534 | | $ | 357 | | | $ | 35,928 | |
| Gross charge-offs | | | | | | | | | | $ | 12 | | $ | 87 | | | | | | $ | 99 | |
| Gross charge-offs (b) | |
| Equipment lease financing | Equipment lease financing | | |
| Pass Rated | |
| Pass Rated | |
| Pass Rated | Pass Rated | $ | 658 | | | $ | 1,673 | | $ | 845 | | $ | 819 | | $ | 559 | | $ | 1,567 | | | $ | 6,121 | |
| Criticized | Criticized | 30 | | | 64 | | 50 | | 53 | | 37 | | 45 | | | 279 | |
| Total equipment lease financing loans | Total equipment lease financing loans | $ | 688 | | | $ | 1,737 | | $ | 895 | | $ | 872 | | $ | 596 | | $ | 1,612 | | | $ | 6,400 | |
| Gross charge-offs | | | | $ | 1 | | $ | 1 | | $ | 3 | | $ | 1 | | $ | 1 | | | | | | $ | 7 | |
| Gross charge-offs (b) | |
| Total commercial loans | Total commercial loans | $ | 19,137 | | | $ | 45,499 | | $ | 13,805 | | $ | 10,329 | | $ | 11,365 | | $ | 27,079 | | $ | 92,647 | | $ | 96 | | $ | 219,957 | |
| Total commercial gross charge-offs | Total commercial gross charge-offs | $ | 10 | | | $ | 10 | | $ | 28 | | $ | 9 | | $ | 14 | | $ | 102 | | $ | 74 | | $ | 8 | | $ | 255 | |
| | | | Term Loans by Origination Year | | | | | Term Loans by Origination Year | | | |
December 31, 2022 In millions | 2022 | 2021 | 2020 | 2019 | 2018 | Prior | Revolving Loans | Revolving Loans Converted to Term | Total
Loans |
December 31, 2023 In millions | | December 31, 2023 In millions | 2023 | | 2022 | 2021 | 2020 | 2019 | Prior | Revolving Loans | Revolving Loans Converted to Term | Total |
| Commercial and industrial | Commercial and industrial | | |
| Pass Rated | Pass Rated | $ | 41,685 | | $ | 12,493 | | $ | 8,134 | | $ | 6,261 | | $ | 4,209 | | $ | 13,165 | | $ | 89,384 | | $ | 69 | | $ | 175,400 | |
| Pass Rated | |
| Pass Rated | |
| Criticized | Criticized | 1,259 | | 423 | | 277 | | 299 | | 297 | | 551 | | 3,682 | | 31 | | 6,819 | |
| Total commercial and industrial | 42,944 | | 12,916 | | 8,411 | | 6,560 | | 4,506 | | 13,716 | | 93,066 | | 100 | | 182,219 | |
| Total commercial and industrial loans | |
| Gross charge-offs (b) | |
| Commercial real estate | Commercial real estate | | |
| Pass Rated | Pass Rated | 8,835 | | 4,153 | | 3,266 | | 5,511 | | 3,005 | | 7,454 | | 450 | | | 32,674 | |
| Pass Rated | |
| Pass Rated | |
| Criticized | Criticized | 348 | | 37 | | 322 | | 758 | | 807 | | 1,367 | | 3 | | | 3,642 | |
| Total commercial real estate | 9,183 | | 4,190 | | 3,588 | | 6,269 | | 3,812 | | 8,821 | | 453 | | | 36,316 | |
| Total commercial real estate loans | |
| Gross charge-offs (b) | |
| Equipment lease financing | Equipment lease financing | | |
| Pass Rated | Pass Rated | 1,797 | | 962 | | 942 | | 670 | | 410 | | 1,495 | | | 6,276 | |
| Pass Rated | |
| Pass Rated | |
| Criticized | Criticized | 60 | | 55 | | 56 | | 39 | | 17 | | 11 | | | 238 | |
| Total equipment lease financing | 1,857 | | 1,017 | | 998 | | 709 | | 427 | | 1,506 | | | 6,514 | |
| Total commercial | $ | 53,984 | | $ | 18,123 | | $ | 12,997 | | $ | 13,538 | | $ | 8,745 | | $ | 24,043 | | $ | 93,519 | | $ | 100 | | $ | 225,049 | |
| Total equipment lease financing loans | |
| Gross charge-offs (b) | |
| Total commercial loans | |
| Total commercial gross charge-offs | |
(a)Loans in our commercial portfolio are classified as Pass Rated or Criticized based on the regulatory definitions, which are driven by the PD and LGD ratings that we assign. The Criticized classification includes loans that were rated special mention, substandard or doubtful as of June 30, 2023March 31, 2024 and December 31, 2022.2023.
(b)Gross charge-offs are presented on a year-to-date basis, as of the reportingperiod end date.
(c)Includes charge-offs of deposit overdrafts.
Consumer Loan Classes
See Note 43 Loans and Related Allowance for Credit Losses in our 20222023 Form 10-K for additional information related to these loan classes, including discussion around the credit quality indicators that we use to monitor and manage the credit risk
associated with each loan class.
6252 The PNC Financial Services Group, Inc. – Form 10-Q
Residential Real Estate and Home Equity
The following table presents credit quality indicators for our residential real estate and home equity loan classes:
Table 44:42: Credit Quality Indicators for Residential Real Estate and Home Equity Loan Classes (a) | | Term Loans by Origination Year | | |
June 30, 2023 In millions | 2023 | 2022 | 2021 | 2020 | 2019 | Prior | Revolving Loans | Revolving Loans Converted to Term | Total |
| Term Loans by Origination Year | |
March 31, 2024 In millions | |
March 31, 2024 In millions | |
March 31, 2024 In millions | | 2024 | 2023 | 2022 | 2021 | 2020 | Prior | Revolving Loans | Revolving Loans Converted to Term | Total |
| Residential real estate | Residential real estate | | |
| Current estimated LTV ratios | Current estimated LTV ratios | | |
| Current estimated LTV ratios | |
| Current estimated LTV ratios | |
| Greater than 100% | |
| Greater than 100% | |
| Greater than 100% | Greater than 100% | $ | 22 | | $ | 129 | | $ | 122 | | $ | 40 | | $ | 11 | | $ | 38 | | | $ | 362 | |
| Greater than or equal to 80% to 100% | Greater than or equal to 80% to 100% | 1,191 | | 4,612 | | 1,441 | | 249 | | 79 | | 127 | | | 7,699 | |
| Less than 80% | Less than 80% | 1,804 | | 5,571 | | 14,351 | | 6,715 | | 2,232 | | 7,367 | | | 38,040 | |
| No LTV available | No LTV available | 52 | | | | 13 | | | 5 | | | 70 | |
| Government insured or guaranteed loans | Government insured or guaranteed loans | 4 | | 16 | | 17 | | 69 | | 38 | | 519 | | | 663 | |
| Total residential real estate loans | Total residential real estate loans | $ | 3,073 | | $ | 10,328 | | $ | 15,944 | | $ | 7,073 | | $ | 2,360 | | $ | 8,056 | | | $ | 46,834 | |
| Updated FICO scores | Updated FICO scores | | |
| Greater than or equal to 780 | Greater than or equal to 780 | $ | 1,570 | | $ | 7,692 | | $ | 12,519 | | $ | 5,207 | | $ | 1,565 | | $ | 4,253 | | | $ | 32,806 | |
| Greater than or equal to 780 | |
| Greater than or equal to 780 | |
| 720 to 779 | 720 to 779 | 1,090 | | 2,033 | | 2,508 | | 1,172 | | 446 | | 1,500 | | | 8,749 | |
| 660 to 719 | 660 to 719 | 201 | | 511 | | 691 | | 338 | | 162 | | 786 | | | 2,689 | |
| Less than 660 | Less than 660 | 81 | | 63 | | 114 | | 110 | | 90 | | 710 | | | 1,168 | |
| No FICO score available | No FICO score available | 127 | | 13 | | 95 | | 177 | | 59 | | 288 | | | 759 | |
| Government insured or guaranteed loans | Government insured or guaranteed loans | 4 | | 16 | | 17 | | 69 | | 38 | | 519 | | | 663 | |
| Total residential real estate loans | Total residential real estate loans | $ | 3,073 | | $ | 10,328 | | $ | 15,944 | | $ | 7,073 | | $ | 2,360 | | $ | 8,056 | | | $ | 46,834 | |
| Gross charge-offs | | | $ | 1 | | | | $ | 1 | | | | $ | 3 | | | $ | 5 | |
| Gross charge-offs (a) | |
| Home equity | Home equity | | |
| Current estimated LTV ratios | Current estimated LTV ratios | | |
| Current estimated LTV ratios | |
| Current estimated LTV ratios | |
| Greater than 100% | |
| Greater than 100% | |
| Greater than 100% | Greater than 100% | | $ | 3 | | $ | 15 | | $ | 8 | | $ | 16 | | $ | 325 | | $ | 292 | | $ | 659 | |
| Greater than or equal to 80% to 100% | Greater than or equal to 80% to 100% | | 6 | | 53 | | 26 | | 32 | | 1,315 | | 2,074 | | 3,506 | |
| Less than 80% | Less than 80% | | 163 | | 1,963 | | 895 | | 2,819 | | 6,937 | | 9,258 | | 22,035 | |
| Total home equity loans | Total home equity loans | | $ | 172 | | $ | 2,031 | | $ | 929 | | $ | 2,867 | | $ | 8,577 | | $ | 11,624 | | $ | 26,200 | |
| Updated FICO scores | Updated FICO scores | | |
| Greater than or equal to 780 | Greater than or equal to 780 | | $ | 110 | | $ | 1,319 | | $ | 522 | | $ | 1,770 | | $ | 4,854 | | $ | 6,020 | | $ | 14,595 | |
| Greater than or equal to 780 | |
| Greater than or equal to 780 | |
| 720 to 779 | 720 to 779 | | 39 | | 467 | | 230 | | 554 | | 2,230 | | 3,109 | | 6,629 | |
| 660 to 719 | 660 to 719 | | 18 | | 188 | | 123 | | 295 | | 1,168 | | 1,656 | | 3,448 | |
| Less than 660 | Less than 660 | | 5 | | 55 | | 53 | | 239 | | 313 | | 780 | | 1,445 | |
| No FICO score available | No FICO score available | | | | 2 | | 1 | | 9 | | 12 | | 59 | | 83 | |
| Total home equity loans | Total home equity loans | | $ | 172 | | $ | 2,031 | | $ | 929 | | $ | 2,867 | | $ | 8,577 | | $ | 11,624 | | $ | 26,200 | |
| Gross charge-offs | | | | | | | | | | | $ | 2 | | | | $ | 9 | | $ | 11 | |
| Gross charge-offs (a) | |
The PNC Financial Services Group, Inc. – Form 10-Q 6353
| | (Continued from previous page) | (Continued from previous page) | Term Loans by Origination Year | | |
December 31, 2022 In millions | 2022 | 2021 | 2020 | 2019 | 2018 | Prior | Revolving Loans | Revolving Loans Converted to Term | Total Loans |
December 31, 2023 In millions | |
December 31, 2023 In millions | |
December 31, 2023 In millions | | 2023 | 2022 | 2021 | 2020 | 2019 | Prior | Revolving Loans | Revolving Loans Converted to Term | Total |
| Residential real estate | Residential real estate | | |
| Current estimated LTV ratios | Current estimated LTV ratios | | |
| Current estimated LTV ratios | |
| Current estimated LTV ratios | |
| Greater than 100% | |
| Greater than 100% | |
| Greater than 100% | Greater than 100% | $ | 4 | | $ | 52 | | $ | 20 | | $ | 10 | | $ | 4 | | $ | 41 | | | $ | 131 | |
| Greater than or equal to 80% to 100% | Greater than or equal to 80% to 100% | 1,185 | | 678 | | 232 | | 84 | | 24 | | 92 | | | 2,295 | |
| Less than 80% | Less than 80% | 9,396 | | 15,844 | | 7,074 | | 2,346 | | 822 | | 7,220 | | | 42,702 | |
| No LTV available | No LTV available | | 61 | | | 3 | | | 4 | | | 68 | |
| Government insured or guaranteed loans | Government insured or guaranteed loans | 9 | | 15 | | 66 | | 39 | | 28 | | 536 | | | 693 | |
| Total residential real estate | $ | 10,594 | | $ | 16,650 | | $ | 7,392 | | $ | 2,482 | | $ | 878 | | $ | 7,893 | | | $ | 45,889 | |
| Total residential real estate loans | |
| Updated FICO scores | Updated FICO scores | | |
| Greater than or equal to 780 | |
| Greater than or equal to 780 | |
| Greater than or equal to 780 | Greater than or equal to 780 | $ | 6,825 | | $ | 12,596 | | $ | 5,276 | | $ | 1,623 | | $ | 463 | | $ | 4,027 | | | $ | 30,810 | |
| 720 to 779 | 720 to 779 | 3,172 | | 3,024 | | 1,369 | | 476 | | 180 | | 1,457 | | | 9,678 | |
| 660 to 719 | 660 to 719 | 514 | | 744 | | 378 | | 189 | | 98 | | 796 | | | 2,719 | |
| Less than 660 | Less than 660 | 63 | | 108 | | 110 | | 88 | | 71 | | 740 | | | 1,180 | |
| No FICO score available | No FICO score available | 11 | | 163 | | 193 | | 67 | | 38 | | 337 | | | 809 | |
| Government insured or guaranteed loans | Government insured or guaranteed loans | 9 | | 15 | | 66 | | 39 | | 28 | | 536 | | | 693 | |
| Total residential real estate | $ | 10,594 | | $ | 16,650 | | $ | 7,392 | | $ | 2,482 | | $ | 878 | | $ | 7,893 | | | $ | 45,889 | |
| Total residential real estate loans | |
| Gross charge-offs (a) | |
| Home equity | Home equity | | |
| Current estimated LTV ratios | Current estimated LTV ratios | | |
| Current estimated LTV ratios | |
| Current estimated LTV ratios | |
| Greater than 100% | |
| Greater than 100% | |
| Greater than 100% | Greater than 100% | | $ | 4 | | $ | 14 | | $ | 9 | | $ | 2 | | $ | 15 | | $ | 268 | | $ | 137 | | $ | 449 | |
| Greater than or equal to 80% to 100% | Greater than or equal to 80% to 100% | | 4 | | 51 | | 27 | | 4 | | 31 | | 854 | | 1,149 | | 2,120 | |
| Less than 80% | Less than 80% | | 172 | | 2,078 | | 961 | | 285 | | 2,851 | | 7,780 | | 9,287 | | 23,414 | |
| Total home equity | | $ | 180 | | $ | 2,143 | | $ | 997 | | $ | 291 | | $ | 2,897 | | $ | 8,902 | | $ | 10,573 | | $ | 25,983 | |
| Total home equity loans | |
| Updated FICO scores | Updated FICO scores | | |
| Greater than or equal to 780 | |
| Greater than or equal to 780 | |
| Greater than or equal to 780 | Greater than or equal to 780 | | $ | 110 | | $ | 1,357 | | $ | 554 | | $ | 155 | | $ | 1,791 | | $ | 5,093 | | $ | 5,545 | | $ | 14,605 | |
| 720 to 779 | 720 to 779 | | 47 | | 515 | | 248 | | 64 | | 567 | | 2,305 | | 2,843 | | 6,589 | |
| 660 to 719 | 660 to 719 | | 19 | | 211 | | 140 | | 42 | | 288 | | 1,146 | | 1,449 | | 3,295 | |
| Less than 660 | Less than 660 | | 4 | | 57 | | 54 | | 29 | | 242 | | 342 | | 671 | | 1,399 | |
| No FICO score available | No FICO score available | | 3 | | 1 | | 1 | | 9 | | 16 | | 65 | | 95 | |
| Total home equity | | $ | 180 | | $ | 2,143 | | $ | 997 | | $ | 291 | | $ | 2,897 | | $ | 8,902 | | $ | 10,573 | | $ | 25,983 | |
| Total home equity loans | |
| Gross charge-offs (a) | |
(a)Gross charge-offs are presented on a year-to-date basis, as of the reportingperiod end date.
6454 The PNC Financial Services Group, Inc. – Form 10-Q
Automobile, Credit Card, Education and Other Consumer
The following table presents credit quality indicators for our automobile, credit card, education and other consumer loan classes:
Table 45:43: Credit Quality Indicators for Automobile, Credit Card, Education and Other Consumer Loan Classes (a) | | Term Loans by Origination Year | | |
June 30, 2023 In millions | 2023 | | 2022 | 2021 | 2020 | 2019 | Prior | Revolving Loans | Revolving Loans Converted to Term | Total |
| Term Loans by Origination Year | |
March 31, 2024 In millions | |
March 31, 2024 In millions | |
March 31, 2024 In millions | | 2024 | | 2023 | 2022 | 2021 | 2020 | Prior | Revolving Loans | Revolving Loans Converted to Term | Total |
| Automobile | Automobile | | |
| Updated FICO scores | Updated FICO scores | | |
| Updated FICO scores | |
| Updated FICO scores | |
| Greater than or equal to 780 | |
| Greater than or equal to 780 | |
| Greater than or equal to 780 | Greater than or equal to 780 | $ | 1,706 | | | $ | 1,907 | | $ | 1,846 | | $ | 728 | | $ | 554 | | $ | 180 | | | $ | 6,921 | |
| 720 to 779 | 720 to 779 | 1,066 | | | 1,426 | | 1,005 | | 411 | | 374 | | 160 | | | 4,442 | |
| 660 to 719 | 660 to 719 | 538 | | | 766 | | 510 | | 251 | | 275 | | 137 | | | 2,477 | |
| Less than 660 | Less than 660 | 74 | | | 254 | | 260 | | 185 | | 272 | | 180 | | | 1,225 | |
| | Total automobile loans | Total automobile loans | $ | 3,384 | | | $ | 4,353 | | $ | 3,621 | | $ | 1,575 | | $ | 1,475 | | $ | 657 | | | $ | 15,065 | |
| Gross charge-offs | | | | $ | 10 | | $ | 12 | | $ | 9 | | $ | 17 | | $ | 13 | | | $ | 61 | |
| Total automobile loans | |
| Total automobile loans | |
| Gross charge-offs (a) | |
| Credit card | Credit card | | |
| Updated FICO scores | Updated FICO scores | | |
| Updated FICO scores | |
| Updated FICO scores | |
| Greater than or equal to 780 | |
| Greater than or equal to 780 | |
| Greater than or equal to 780 | Greater than or equal to 780 | | $ | 1,954 | | $ | 1 | | $ | 1,955 | |
| 720 to 779 | 720 to 779 | | 2,022 | | 5 | | 2,027 | |
| 660 to 719 | 660 to 719 | | 1,967 | | 13 | | 1,980 | |
| Less than 660 | Less than 660 | | 983 | | 38 | | 1,021 | |
| No FICO score available or required (b) | No FICO score available or required (b) | | 106 | | 3 | | 109 | |
| Total credit card loans | Total credit card loans | | $ | 7,032 | | $ | 60 | | $ | 7,092 | |
| Gross charge-offs | | | | $ | 141 | | $ | 13 | | $ | 154 | |
| Gross charge-offs (a) | |
| Education | Education | | |
| Updated FICO scores | Updated FICO scores | | |
| Updated FICO scores | |
| Updated FICO scores | |
| Greater than or equal to 780 | |
| Greater than or equal to 780 | |
| Greater than or equal to 780 | Greater than or equal to 780 | $ | 15 | | | $ | 94 | | $ | 50 | | $ | 44 | | $ | 56 | | $ | 373 | | | $ | 632 | |
| 720 to 779 | 720 to 779 | 14 | | | 51 | | 26 | | 22 | | 27 | | 147 | | | 287 | |
| 660 to 719 | 660 to 719 | 6 | | | 16 | | 7 | | 7 | | 8 | | 59 | | | 103 | |
| Less than 660 | Less than 660 | 1 | | | 3 | | 1 | | 1 | | 2 | | 23 | | | 31 | |
| No FICO score available or required (b) | No FICO score available or required (b) | 4 | | | 6 | | 5 | | 5 | | 2 | | 1 | | | 23 | |
| Total loans using FICO credit metric | Total loans using FICO credit metric | 40 | | | 170 | | 89 | | 79 | | 95 | | 603 | | | 1,076 | |
| Other internal credit metrics | Other internal credit metrics | | 982 | | | 982 | |
| Total education loans | Total education loans | $ | 40 | | | $ | 170 | | $ | 89 | | $ | 79 | | $ | 95 | | $ | 1,585 | | | $ | 2,058 | |
| Gross charge-offs | | | | | | | | $ | 1 | | $ | 1 | | $ | 7 | | | $ | 9 | |
| Gross charge-offs (a) | |
| Other consumer | Other consumer | | |
| Updated FICO scores | Updated FICO scores | | |
| Updated FICO scores | |
| Updated FICO scores | |
| Greater than or equal to 780 | |
| Greater than or equal to 780 | |
| Greater than or equal to 780 | Greater than or equal to 780 | $ | 136 | | | $ | 183 | | $ | 69 | | $ | 34 | | $ | 27 | | $ | 19 | | $ | 41 | | $ | 2 | | $ | 511 | |
| 720 to 779 | 720 to 779 | 186 | | | 224 | | 85 | | 41 | | 35 | | 19 | | 82 | | 1 | | 673 | |
| 660 to 719 | 660 to 719 | 70 | | | 166 | | 80 | | 45 | | 39 | | 19 | | 88 | | 2 | | 509 | |
| Less than 660 | Less than 660 | 5 | | | 49 | | 39 | | 26 | | 25 | | 14 | | 42 | | 2 | | 202 | |
| | Total loans using FICO credit metric | Total loans using FICO credit metric | 397 | | | 622 | | 273 | | 146 | | 126 | | 71 | | 253 | | 7 | | 1,895 | |
| Total loans using FICO credit metric | |
| Total loans using FICO credit metric | |
| Other internal credit metrics | Other internal credit metrics | 21 | | | 116 | | 31 | | 19 | | 74 | | 26 | | 2,358 | | 15 | | 2,660 | |
| Total other consumer loans | Total other consumer loans | $ | 418 | | | $ | 738 | | $ | 304 | | $ | 165 | | $ | 200 | | $ | 97 | | $ | 2,611 | | $ | 22 | | $ | 4,555 | |
| Gross charge-offs | $ | 32 | | (c) | $ | 9 | | $ | 10 | | $ | 8 | | $ | 9 | | $ | 5 | | $ | 6 | | $ | 1 | | $ | 80 | |
| Gross charge-offs (a) | |
The PNC Financial Services Group, Inc. – Form 10-Q 6555
| | (Continued from previous page) | (Continued from previous page) | Term Loans by Origination Year | | |
December 31, 2022 In millions | 2022 | 2021 | 2020 | 2019 | 2018 | Prior | Revolving Loans | Revolving Loans Converted to Term | Total Loans |
December 31, 2023 In millions | |
December 31, 2023 In millions | |
December 31, 2023 In millions | | 2023 | | 2022 | 2021 | 2020 | 2019 | Prior | Revolving Loans | Revolving Loans Converted to Term | Total |
| Automobile | |
| Updated FICO Scores | Updated FICO Scores | | |
| Automobile | | |
| Updated FICO Scores | |
| Updated FICO Scores | |
| Greater than or equal to 780 | |
| Greater than or equal to 780 | |
| Greater than or equal to 780 | Greater than or equal to 780 | $ | 2,390 | | $ | 2,162 | | $ | 922 | | $ | 760 | | $ | 241 | | $ | 75 | | | $ | 6,550 | |
| 720 to 779 | 720 to 779 | 1,702 | | 1,312 | | 561 | | 538 | | 222 | | 69 | | | 4,404 | |
| 660 to 719 | 660 to 719 | 854 | | 660 | | 341 | | 401 | | 187 | | 56 | | | 2,499 | |
| Less than 660 | Less than 660 | 193 | | 290 | | 230 | | 368 | | 228 | | 74 | | | 1,383 | |
| Total automobile | $ | 5,139 | | $ | 4,424 | | $ | 2,054 | | $ | 2,067 | | $ | 878 | | $ | 274 | | | $ | 14,836 | |
| Total automobile loans | |
| Gross charge-offs (a) | |
| Credit card | Credit card | | |
| Updated FICO scores | |
| Updated FICO scores | |
| Updated FICO scores | |
| Greater than or equal to 780 | |
| Greater than or equal to 780 | |
| Greater than or equal to 780 | Greater than or equal to 780 | | $ | 1,954 | | $ | 2 | | $ | 1,956 | |
| 720 to 779 | 720 to 779 | | 1,994 | | 6 | | 2,000 | |
| 660 to 719 | 660 to 719 | | 1,957 | | 13 | | 1,970 | |
| Less than 660 | Less than 660 | | 1,001 | | 35 | | 1,036 | |
| No FICO score available or required (b) | No FICO score available or required (b) | | 104 | | 3 | | 107 | |
| Total credit card | | $ | 7,010 | | $ | 59 | | $ | 7,069 | |
| Total credit card loans | |
| Gross charge-offs (a) | |
| Education | Education | | |
| Updated FICO scores | |
| Updated FICO scores | |
| Updated FICO scores | |
| Greater than or equal to 780 | |
| Greater than or equal to 780 | |
| Greater than or equal to 780 | Greater than or equal to 780 | $ | 42 | | $ | 53 | | $ | 48 | | $ | 61 | | $ | 51 | | $ | 357 | | | $ | 612 | |
| 720 to 779 | 720 to 779 | 39 | | 27 | | 24 | | 30 | | 24 | | 143 | | | 287 | |
| 660 to 719 | 660 to 719 | 21 | | 8 | | 8 | | 9 | | 8 | | 59 | | | 113 | |
| Less than 660 | Less than 660 | 4 | | 1 | | 1 | | 2 | | 2 | | 24 | | | 34 | |
| No FICO score available or required (b) | No FICO score available or required (b) | 20 | | 8 | | 7 | | 3 | | | 1 | | | 39 | |
| Education loans using FICO credit metric | 126 | | 97 | | 88 | | 105 | | 85 | | 584 | | | 1,085 | |
| Total loans using FICO credit metric | |
| Other internal credit metrics | Other internal credit metrics | | 1,088 | | | 1,088 | |
| Total education | $ | 126 | | $ | 97 | | $ | 88 | | $ | 105 | | $ | 85 | | $ | 1,672 | | | $ | 2,173 | |
| Total education loans | |
| Gross charge-offs (a) | |
| Other consumer | Other consumer | | |
| Updated FICO scores | |
| Updated FICO scores | |
| Updated FICO scores | |
| Greater than or equal to 780 | |
| Greater than or equal to 780 | |
| Greater than or equal to 780 | Greater than or equal to 780 | $ | 224 | | $ | 97 | | $ | 53 | | $ | 46 | | $ | 14 | | $ | 18 | | $ | 47 | | $ | 2 | | $ | 501 | |
| 720 to 779 | 720 to 779 | 302 | | 122 | | 68 | | 62 | | 20 | | 15 | | 89 | | 2 | | 680 | |
| 660 to 719 | 660 to 719 | 229 | | 110 | | 68 | | 66 | | 28 | | 8 | | 95 | | 2 | | 606 | |
| Less than 660 | Less than 660 | 32 | | 48 | | 37 | | 40 | | 20 | | 6 | | 44 | | 2 | | 229 | |
| Other consumer loans using FICO credit metric | 787 | | 377 | | 226 | | 214 | | 82 | | 47 | | 275 | | 8 | | 2,016 | |
| Total loans using FICO credit metric | |
| Other internal credit metrics | Other internal credit metrics | 125 | | 43 | | 40 | | 34 | | 7 | | 29 | | 2,720 | | 12 | | 3,010 | |
| Total other consumer | $ | 912 | | $ | 420 | | $ | 266 | | $ | 248 | | $ | 89 | | $ | 76 | | $ | 2,995 | | $ | 20 | | $ | 5,026 | |
| Total other consumer loans | |
| Gross charge-offs (a) | |
(a)Gross charge-offs are presented on a year-to-date basis, as of the reportingperiod end date.
(b)Loans with nowhere FICO scorescores are not available or required generally refers to new accounts issued to borrowers with limited credit history, accounts for which we cannot obtain an updated FICO score (e.g., recent profile changes), cards issued with a business name and/or cards secured by collateral. Management proactively assesses the risk and size of this loan category and, when necessary, takes actions to mitigate the credit risk.
(c)Includes charge-offs of deposit overdrafts.
6656 The PNC Financial Services Group, Inc. – Form 10-Q
Loan Modifications to Borrowers Experiencing Financial Difficulty
On January 1, 2023, we adopted ASU 2022-02, which eliminates the accounting guidance for TDRs and enhances the disclosure requirements for certain loanLoan modifications when a borrower isto borrowers experiencing financial difficulty (FDMs).
FDMs occur as a result offrom our loss mitigation activities. A variety of solutions are offered to borrowers, including loan modifications that may result inactivities and include principal forgiveness, interest rate reductions, term extensions, payment delays, repayment plans or combinations thereof:
•Principal forgiveness includes principal and accrued interest forgiveness.
•Interest rate reductions include modifications where the interest rate is reduced and/or interest is deferred.
•Term extensions extend the original contractual maturity date of the loan.
•Payment delays consist of modifications where we expect to collect contractual amounts due, but that result in a delay in the receipt of payments specified under the original loan terms. We generally consider payment delays to be insignificant when the delay is three months or less.
•Repayment plans are offered for some of our credit card and unsecured line of credit products, which provide for a reduced payment and interest rate for a specific period of time.
Additionally, modifications to borrowers experiencing financial difficulty also result from borrowers that have been discharged from personal liability through Chapter 7 bankruptcy and have not formally reaffirmed their obligations to us, and those that enter into trial modifications.
FDMs exclude loans held for sale and loans accounted for under the fair value option. Our disclosed FDM population also excludes government insured or guaranteed education loans as loss mitigation activities for these loans are either required by law or they are considered separate from PNC’s loss mitigation treatments. Commercial loans with an appraised value of collateral that exceeds the loan value, loans with guarantor support, and residential mortgage government insured or guaranteed loans are included in our disclosed population of FDMs when those loan modifications are granted to a borrower experiencing financial difficulty.
Refer tothereof. See Note 1 Accounting Policies in our 2023 Form 10-K for additional information around our adoption of ASU 2022-02.on FDMs.
The PNC Financial Services Group, Inc. – Form 10-Q 67
The following table presents the amortized cost basis, as of June 30, 2023,the period end date, of FDMs granted during the three and six months ended June 30,March 31, 2024 and 2023:
Table 46:44: Loan Modifications Granted to Borrowers Experiencing Financial Difficulty (a) (b)
| Three months ended June 30, 2023 Dollars in millions | Principal Forgiveness | Interest Rate Reduction | Term Extension | Payment Delay | Repayment Plan | Interest Rate Reduction and Term Extension | Other (b) | Total | % of Loan Class | |
Three months ended March 31, 2024 Dollars in millions | |
Three months ended March 31, 2024 Dollars in millions | |
Three months ended March 31, 2024 Dollars in millions | |
| Commercial | |
| Commercial | |
| Commercial | Commercial | | |
| Commercial and industrial | Commercial and industrial | | | | $ | 366 | | $ | 59 | | | $ | 87 | | $ | 512 | | 0.29 | % | |
| Commercial and industrial | |
| Commercial and industrial | |
| Commercial real estate | |
| Commercial real estate | |
| Commercial real estate | Commercial real estate | | 228 | | | 60 | | 288 | | 0.80 | % | |
| | Total commercial | Total commercial | | 594 | 59 | | 147 | 800 | | 0.36 | % | |
| | Total commercial | |
| | Total commercial | |
| Consumer | |
| Consumer | |
| Consumer | Consumer | | | |
| Residential real estate | Residential real estate | | $ | 1 | | | 35 | | | $ | 1 | | 2 | | 39 | | 0.08 | % | |
| Residential real estate | |
| Residential real estate | |
| Home equity | |
| Home equity | |
| Home equity | Home equity | | 3 | | | 2 | | 5 | | 10 | | 0.04 | % | |
| | Credit card | Credit card | | $ | 18 | | | 18 | | 0.25 | % | |
| Education | | 1 | | | 1 | | 0.05 | % | |
| Other consumer | | 1 | | | 1 | | 0.02 | % | |
| Total consumer | | | 1 | | 1 | | 38 | | 19 | | 3 | | 7 | | 69 | | 0.07 | % | |
| Total | | $ | 1 | | $ | 595 | | $ | 97 | | $ | 19 | | $ | 3 | | $ | 154 | | $ | 869 | | 0.27 | % | |
Six months ended June 30, 2023 Dollars in millions | | |
| Commercial | | |
| Commercial and industrial | $ | 1 | | | $ | 432 | | $ | 72 | | | $ | 91 | | $ | 596 | | 0.34 | % | |
| Commercial real estate | | 493 | | | 60 | | 553 | | 1.54 | % | |
| | Total commercial | 1 | | 925 | 72 | | 151 | 1,149 | | 0.52 | % | |
| Consumer | | | |
| Residential real estate | | $ | 1 | | | 72 | | | $ | 2 | | 3 | | 78 | | 0.17 | % | |
| Home equity | | 4 | | | 5 | | 6 | | 15 | | 0.06 | % | |
| Credit card | |
| | Credit card | Credit card | | $ | 30 | | | 30 | | 0.42 | % | |
| Education | Education | | 2 | | | 2 | | 0.10 | % | |
| Other consumer | | 1 | | | 1 | | 0.02 | % | |
| Education | |
| Education | |
| | Total consumer | |
| | Total consumer | |
| | Total consumer | Total consumer | | | 1 | | 2 | | 76 | | 31 | | 7 | | 9 | | 126 | | 0.12 | % | |
| Total | Total | $ | 1 | | $ | 1 | | $ | 927 | | $ | 148 | | $ | 31 | | $ | 7 | | $ | 160 | | $ | 1,275 | | 0.40 | % | |
| Total | |
| Total | |
|
| | | | | | | | | | | | | | | | | | | | | | | | | | | | | | | |
Three months ended March 31, 2023 Dollars in millions | | Principal Forgiveness | Term Extension | Payment Delay | Repayment Plan | Interest Rate Reduction and Term Extension | | Other (c) | Total | % of Loan Class | |
| Commercial | | | | | | | | | | | |
| Commercial and industrial | | $ | 1 | | $ | 198 | | $ | 20 | | | | | $ | 5 | | $ | 224 | | 0.12 | % | |
| Commercial real estate | | | 273 | | | | | | 273 | 0.76 | % | |
| | | | | | | | | | | |
| Total commercial | | 1 | 471 | 20 | | | | 5 | 497 | | 0.22 | % | |
| Consumer | | | | | | | | | | | |
| Residential real estate | | | | 46 | | | $ | 2 | | | 1 | | 49 | | 0.11 | % | |
| Home equity | | | | 1 | | $ | 2 | | | | 2 | | 5 | | 0.02 | % | |
| | | | | | | | | | | |
| Credit card | | | | | 13 | | | | | 13 | | 0.19 | % | |
| Education | | | 1 | | | | | | | 1 | | 0.05 | % | |
| Other consumer | | | | | 1 | | | | | 1 | | 0.02 | % | |
| Total consumer | | | | 1 | | 47 | | 16 | | 2 | | | 3 | | 69 | | 0.07 | % | |
| Total | | $ | 1 | | $ | 472 | | $ | 67 | | $ | 16 | | $ | 2 | | | $ | 8 | | $ | 566 | | 0.17 | % | |
| | | | | | | | | | | |
| | | | | | | | | | | |
| | | | | | | | | | | |
| | | | | | | | | | | |
| | | | | | | | | | | |
| | | | | | | | | | | |
| | | | | | | | | | | |
| | | | | | | | | | | |
| | | | | | | | | | | |
| | | | | | | | | | | |
| | | | | | | | | | | |
| | | | | | | | | | | |
| | | | | | | | | | | |
| | | | | | | | | | | |
| | | | | | | | | | | |
(a)At June 30, 2023, there were $0.1 billion ofThe unfunded lending related commitments associated with FDMs.on FDMs granted during the three months ended March 31, 2024 and 2023 were $0.1 billion at both dates.
(b)IncludesExcludes the amortized cost basis of modified loans that were paid off, charged off or otherwise liquidated as of the period end date.
(c)Represents all other modifications, and includes trial modifications and loans where we have received notification that a borrower has filed for Chapter 7 bankruptcy relief, but specific instructions as to the terms of the relief have not been formally ruled upon by the court. Amounts also include trial modifications.
68The PNC Financial Services Group, Inc. – Form 10-Q57
Table 4745 presents the financial effect of FDMs granted during the three and six months ended June 30, 2023:March 31, 2024 and 2023.
Table 47:45: Financial Effect of FDMs (a)
| Three months ended June 30, 2023 Dollars in millions | | Total Principal Forgiveness | Weighted-Average Interest Rate Reduction | Weighted-Average Term Extension
(in Months) | Weighted-Average Payment Delay
(in Months) |
Three months ended March 31, 2024 Dollars in millions | |
Three months ended March 31, 2024 Dollars in millions | |
Three months ended March 31, 2024 Dollars in millions | | | | Weighted-Average Interest Rate Reduction | Weighted-Average Term Extension
(in Months) | Weighted-Average Payment Delay
(in Months) |
| Commercial | Commercial | | |
| Commercial and industrial | |
| Commercial and industrial | |
| Commercial and industrial | Commercial and industrial | | | | | 9 | 10 | | | 4.06 | % | 11 | 5 |
| Commercial real estate | Commercial real estate | | 20 | | Commercial real estate | | | | | 12 | 12 | 8 |
| | Consumer | Consumer | | |
| Consumer | |
| Consumer | |
| Residential real estate | Residential real estate | | 1.17 | % | 123 | 8 |
| Home equity | | 1.29 | % | 66 | 3 |
| | Education | | 19 | |
Six months ended June 30, 2023 Dollars in millions | | |
| Commercial | | |
| Commercial and industrial | | $ | 2 | | | 10 | 6 |
| Commercial real estate | | 17 | |
| | Consumer | | |
| Residential real estate | |
| Residential real estate | Residential real estate | | 1.34 | % | 111 | 8 | | | | | | 8 | | 8 |
| Home equity | Home equity | | 1.41 | % | 58 | 4 | Home equity | | | | | | 4 | | 4 |
| | Education | Education | | 17 | |
| | Education | |
| | Education | |
|
| | | | | | | | | | | | | | | | | | |
Three Months Ended March 31, 2023 Dollars in millions | | | Total Principal Forgiveness | Weighted-Average Interest Rate Reduction | Weighted-Average Term Extension
(in Months) | Weighted-Average Payment Delay
(in Months) |
| Commercial | | | | | | |
| Commercial and industrial | | | $ | 2 | | 5 | 2 |
| Commercial real estate | | | | | | | 13 | |
| | | | | | |
| Consumer | | | | | | |
| Residential real estate | | | | | 1.71 | % | 145 | 8 |
| Home equity | | | | | | | | 6 |
| | | | | | |
| | | | | | |
| Education | | | | | 12 | |
| | | | | | |
| | | | | | |
| | | | | | |
| | | | | | |
| | | | | | |
| | | | | | |
| | | | | | |
| | | | | | |
| | | | | | |
| | | | | | |
| | | | | | |
| | | | | | |
(a)Excludes the financial effects of modifications for loans that were paid off, charged-offcharged off or otherwise liquidated as of the period end.end date.
Repayment plans are excluded from Table 47.45. The terms of these programs, which are offered for certain creditconsumer products, are as follows:
•Credit card and unsecured linelines of credit products, are as follows:
•Short-term programs are granted for periods of 6 and 12 months. These programs are structurally similar such that the interest rate is reduced to a standard rate of 4.99% and the minimum payment percentage is adjusted to 1.90% of the outstanding balance. At the end of the 6 or 12 months, the borrower is returned to the original contractual interest rate and minimum payment amount specified in the original lending agreement.
•Fully-amortized repayment plans are also granted, the most common of which being a 60-month60 month program. In this program, we convert the borrower’s drawn and unpaid balances into a fully-amortized repayment plan consisting of an interest rate of 4.99% and aan adjusted minimum payment amountpercentage of 1.90%. of the outstanding balance. This fully-amortized program is designed in a manner that allows the drawn and unpaid amounts to be recaptured at the end of the 60 months.
•Home equity loans and lines of credit
•Fixed payment plan programs establish a modified monthly payment that is informed by the borrower’s financial situation and the current market environment at the time of modification, among other factors. As such, we may change the borrower’s interest rate, modify the term of the loan, and/or defer payment to arrive at the modified monthly payment. Each of the aforementioned terms may increase or decrease, and may vary from loan to loan, based on the individual loan and borrower characteristics.
58 The PNC Financial Services Group, Inc. – Form 10-Q
After we modify a loan, we continue to track its performance under its most recent modified terms. The following table presents the performance, as of June 30, 2023,the period end date, of FDMs granted during the sixtwelve months ended June 30,preceding March 31, 2024.
Table 46: Payment Performance of FDMs Modified in the Last 12 Months (a)
| | | | | | | | | | | | | | | | | | | | |
Twelve Months Ended March 31, 2024
Dollars in millions | Current or Less Than 30 Days Past Due | 30-59 Days Past Due | 60-89 Days Past Due | 90 Days
or More
Past Due | Nonperforming
Loans | Total |
| Commercial | | | | | | |
| Commercial and industrial | $ | 1,126 | | $ | 16 | | $ | 2 | | | | $ | 291 | | $ | 1,435 | |
| Commercial real estate | 816 | | | | | | | | 367 | | 1,183 | |
| | | | | | |
| Total commercial | 1,942 | | 16 | | 2 | | | | 658 | | 2,618 | |
| Consumer | | | | | | | |
| Residential real estate | 8 | | | | 1 | | $ | 1 | | 92 | | 102 | |
| Home equity | 2 | | | | | | | | 29 | | 31 | |
| | | | | | |
| Credit card | 44 | | 4 | | 4 | | 7 | | 1 | | 60 | |
| Education | 5 | | | | | | | | | | 5 | |
| Other consumer | | | | | | | | | 1 | | 1 | |
| Total consumer | 59 | | 4 | | 5 | | 8 | | 123 | | 199 | |
| Total | $ | 2,001 | | $ | 20 | | $ | 7 | | $ | 8 | | $ | 781 | | $ | 2,817 | |
(a)Represents amortized cost basis.
The following table presents the performance as of March 31, 2023 for FDMs granted since January 1, 2023:
Table 48: Delinquency Status47: Payment Performance of FDMs (a)
| Six months ended June 30, 2023 Dollars in millions | Current or Less Than 30 Days Past Due | 30-59 Days Past Due | 60-89 Days Past Due | 90 Days
or More
Past Due | Nonperforming
Loans | Total |
Three Months Ended March 31, 2023 Dollars in millions | | Three Months Ended March 31, 2023 Dollars in millions | Current or Less Than 30 Days
Past Due | 30-59 Days
Past Due | 60-89 Days
Past Due | 90 Days
or More
Past Due | Nonperforming
Loans | Total |
| Commercial | Commercial | | |
| Commercial and industrial | |
| Commercial and industrial | |
| Commercial and industrial | Commercial and industrial | $ | 494 | | | | $ | 4 | | $ | 1 | | $ | 97 | | $ | 596 | |
| Commercial real estate | Commercial real estate | 520 | | | | | | | | 33 | | 553 | |
| | Total commercial | |
| Total commercial | |
| Total commercial | Total commercial | 1,014 | | | | 4 | | 1 | | 130 | | 1,149 | |
| Consumer | Consumer | | | |
| Residential real estate | Residential real estate | 1 | | | | | | | | 77 | | 78 | |
| Home equity | Home equity | | | | | | | | | 15 | | 15 | |
| | Credit card | Credit card | 20 | | $ | 3 | | 3 | | 4 | | | | 30 | |
| Credit card | |
| Credit card | |
| Education | Education | 2 | | | | | | | | | | 2 | |
| Other consumer | Other consumer | | | | | | | | | 1 | | 1 | |
| Total consumer | Total consumer | 23 | | 3 | | 3 | | 4 | | 93 | | 126 | |
| Total | Total | $ | 1,037 | | $ | 3 | | $ | 7 | | $ | 5 | | $ | 223 | | $ | 1,275 | |
(a)Represents amortized cost basis.
We generally consider FDMs to have subsequently defaulted when they become 60 days past due after the most recent date the loan was modified. LoansAt March 31, 2024, loans that were both (i) modified due to a financial difficulty during the period, and (ii) subsequently defaulted during the three and six months ended June 30, 2023 were $46 million and $48 million, respectively.
The PNC Financial Services Group, Inc. – Form 10-Q 69
Troubled Debt Restructuring Disclosures Prior to the Adoption of ASU 2022-02
Table 49 quantifies the number of loans that(ii) were classified as TDRs as well asFDMs during the change intwelve months preceding the loans’ balance as a result of becoming a TDRdefault date were $49 million. Subsequently defaulted loans were not material during the three and six months ended June 30, 2022. Additionally, the table provides information about the types of TDR concessions. See Note 1 Accounting Policies and Note 4 Loans and Related Allowance for Credit Losses in our 2022 Form 10-K for additional discussion of TDRs.March 31, 2023.
Table 49: Financial Impact and TDRs by Concession Type (a)
| | | | | | | | | | | | | | | | | | | | | | | | | | | | | | | | | | | | | | | | | |
| | | Pre-TDR
Amortized Cost Basis (b) | | Post-TDR Amortized Cost Basis (c) | |
During the three months ended June 30, 2022 Dollars in millions | Number
of Loans | | Principal
Forgiveness | | Rate
Reduction | | Other | | Total | |
| Commercial | | 15 | | | $ | 35 | | | $ | 9 | | | | | $ | 22 | | | $ | 31 | | |
| Consumer | | 3,025 | | | 50 | | | | | $ | 40 | | | 5 | | | 45 | | |
| Total TDRs | | 3,040 | | | $ | 85 | | | $ | 9 | | | $ | 40 | | | $ | 27 | | | $ | 76 | | |
During the six months ended June 30, 2022 Dollars in millions | | | | | | | | | | | | | |
| Commercial | | 27 | | | $ | 88 | | | $ | 9 | | | | | $ | 68 | | | $ | 77 | | |
| Consumer | | 5,920 | | | 86 | | | | | $ | 66 | | | 12 | | | 78 | | |
| Total TDRs | | 5,947 | | | $ | 174 | | | $ | 9 | | | $ | 66 | | | $ | 80 | | | $ | 155 | | |
(a) Impact of partial charge-offs at TDR date is included in this table.
(b) Represents the amortized cost basis of the loans as of the quarter end prior to TDR designation.
(c) Represents the amortized cost basis of the TDRs as of the end of the quarter in which the TDR occurred.
After a loan was determined to be a TDR, we continued to track its performance under its most recent restructured terms. We considered a TDR to have subsequently defaulted when it became 60 days past due after the most recent date the loan was restructured. Loans that were both (i) classified as TDRs within the last twelve months from the balance sheet date, and (ii) subsequently defaulted during the three and six months ended June 30, 2022 totaled $20 million and $27 million, respectively.
Allowance for Credit Losses
We maintain the ACL related to loans at levels that we believe to be appropriate to absorb expected credit losses in the portfolios as of the balance sheet date. See Note 1 Accounting Policies in our 2023 Form 10-K for a discussion of the methodologies used to determine this allowance. A rollforward of the ACL related to loans follows:
The PNC Financial Services Group, Inc. – Form 10-Q 59
Table 50:48: Rollforward of Allowance for Credit Losses | | Three months ended June 30 | | | Six months ended June 30 |
| 2023 | 2022 | | | 2023 | 2022 |
| Three months ended March 31 | |
| Three months ended March 31 | |
| Three months ended March 31 | |
| 2024 | |
| 2024 | |
| 2024 | |
| In millions | |
| In millions | |
| In millions | In millions | Commercial | Consumer | Total | Commercial | Consumer | Total | | | Commercial | Consumer | Total | Commercial | Consumer | Total |
| Allowance for loan and lease losses | Allowance for loan and lease losses | | | | | | | |
| Allowance for loan and lease losses | |
| Allowance for loan and lease losses | |
| Beginning balance | |
| Beginning balance | |
| Beginning balance | Beginning balance | $ | 3,046 | | $ | 1,695 | | $ | 4,741 | | $ | 3,003 | | $ | 1,555 | | $ | 4,558 | | | | $ | 3,114 | | $ | 1,627 | | $ | 4,741 | | $ | 3,185 | | $ | 1,683 | | $ | 4,868 | |
| Adoption of ASU 2022-02 (a) | Adoption of ASU 2022-02 (a) | | | | | | | | | | | (35) | | (35) | | | | | |
| Adoption of ASU 2022-02 (a) | |
| Adoption of ASU 2022-02 (a) | |
| Beginning balance, adjusted | |
| Beginning balance, adjusted | |
| Beginning balance, adjusted | Beginning balance, adjusted | 3,046 | | 1,695 | | 4,741 | | 3,003 | | 1,555 | | 4,558 | | | | 3,114 | | 1,592 | | 4,706 | | 3,185 | | 1,683 | | 4,868 | |
| Charge-offs | Charge-offs | (135) | | (158) | | (293) | | (37) | | (158) | | (195) | | | | (255) | | (320) | | (575) | | (89) | | (357) | | (446) | |
| Charge-offs | |
| Charge-offs | |
| Recoveries | |
| Recoveries | |
| Recoveries | Recoveries | 36 | | 63 | | 99 | | 19 | | 93 | | 112 | | | | 61 | | 125 | | 186 | | 53 | | 173 | | 226 | |
| Net (charge-offs) | Net (charge-offs) | (99) | | (95) | | (194) | | (18) | | (65) | | (83) | | | | (194) | | (195) | | (389) | | (36) | | (184) | | (220) | |
| Provision for (recapture of) credit losses | 195 | | (6) | | 189 | | (45) | | 35 | | (10) | | | | 220 | | 198 | | 418 | | (208) | | 26 | | (182) | |
| Net (charge-offs) | |
| Net (charge-offs) | |
| Provision for credit losses | |
| Provision for credit losses | |
| Provision for credit losses | |
| Other | |
| Other | |
| Other | Other | | | 1 | | 1 | | (3) | | | (3) | | | | 2 | | | | 2 | | (4) | | | (4) | |
| Ending balance | Ending balance | $ | 3,142 | | $ | 1,595 | | $ | 4,737 | | $ | 2,937 | | $ | 1,525 | | $ | 4,462 | | | | $ | 3,142 | | $ | 1,595 | | $ | 4,737 | | $ | 2,937 | | $ | 1,525 | | $ | 4,462 | |
| Ending balance | |
| Ending balance | |
| Allowance for unfunded lending related commitments (b) | |
| Allowance for unfunded lending related commitments (b) | |
| Allowance for unfunded lending related commitments (b) | Allowance for unfunded lending related commitments (b) | | | | | | | |
| Beginning balance | Beginning balance | $ | 560 | | $ | 112 | | $ | 672 | | $ | 587 | | $ | 52 | | $ | 639 | | | | $ | 613 | | $ | 81 | | $ | 694 | | $ | 564 | | $ | 98 | | $ | 662 | |
| Beginning balance | |
| Beginning balance | |
| Provision for (recapture of) credit losses | |
| Provision for (recapture of) credit losses | |
| Provision for (recapture of) credit losses | Provision for (recapture of) credit losses | (5) | | (4) | | (9) | | 43 | | (1) | | 42 | | | | (58) | | 27 | | (31) | | 66 | | (47) | | 19 | |
| Ending balance | Ending balance | $ | 555 | | $ | 108 | | $ | 663 | | $ | 630 | | $ | 51 | | $ | 681 | | | | $ | 555 | | $ | 108 | | $ | 663 | | $ | 630 | | $ | 51 | | $ | 681 | |
| Allowance for credit losses at June 30 (c) | $ | 3,697 | | $ | 1,703 | | $ | 5,400 | | $ | 3,567 | | $ | 1,576 | | $ | 5,143 | | | | $ | 3,697 | | $ | 1,703 | | $ | 5,400 | | $ | 3,567 | | $ | 1,576 | | $ | 5,143 | |
| Ending balance | |
| Ending balance | |
| Allowance for credit losses at March 31 (c) | |
| Allowance for credit losses at March 31 (c) | |
| Allowance for credit losses at March 31 (c) | |
(a)Represents the impact of adopting ASU 2022-02 Financial Instruments - Credit Losses (Topic 326): Troubled Debt Restructurings and Vintage Disclosures on January 1, 2023. As a result of adoption, we eliminated the accounting guidance for TDRs, including the use of a discounted cash flow approach to measure the allowance for TDRs.
(b)See Note 8 Commitments for additional information about the underlying commitments related to this allowance.
(c)Represents the ALLL plus allowance for unfunded lending related commitments and excludes allowances for investment securities and other financial assets, which together totaled $171$117 million and $163$205 million at June 30,March 31, 2024 and 2023, and 2022, respectively.
70 The PNC Financial Services Group, Inc. – Form 10-Q
The ACL related to loans totaled $5.4 billion at both June 30, 2023March 31, 2024 and $5.5 billion at December 31, 2022.2023. During the sixthree months ended June 30, 2023, reserves reflected our updated economic outlook and changes inMarch 31, 2024, this reserve was driven by improved macroeconomic factors as well as portfolio composition and quality.activity.
NOTE 4 LOAN SALE AND SERVICING ACTIVITIES AND VARIABLE INTEREST ENTITIES
Loan Sale and Servicing Activities
As more fully described in Note 54 Loan Sale and Servicing Activities and Variable Interest Entities in our 20222023 Form 10-K, we have transferred residential and commercial mortgage loans in securitization or sales transactions in which we have continuing involvement. Our continuing involvement in the FNMA, FHLMC and GNMA securitizations, Non-agency securitizations and loan sale transactions generally consists of servicing, repurchasing previously transferred loans under certain conditions and loss share arrangements, and, in limited circumstances, holding of mortgage-backed securities issued by the securitization SPEs.
We earn servicing and other ancillary fees for our role as servicer and, depending on the contractual terms of the servicing arrangement, we can be terminated as servicer with or without cause. At the consummation date of each type of loan transfer where we retain the servicing, we recognize a servicing right at fair value. See Note 8 Commitments and Note 11 Fair Value for information on our servicing rights, including the carrying value of servicing assets.
60 The PNC Financial Services Group, Inc. – Form 10-Q
The following table provides our loan sale and servicing activities:
Table 51:49: Loan Sale and Servicing Activities
| | In millions | In millions | Residential Mortgages | Commercial Mortgages (a) | |
| Cash Flows - Three months ended June 30, 2023 | | | | |
| Cash Flows - Three months ended March 31, 2024 | |
| Cash Flows - Three months ended March 31, 2024 | |
| Cash Flows - Three months ended March 31, 2024 | |
| Sales of loans and related securitization activity (b) | |
| Sales of loans and related securitization activity (b) | |
| Sales of loans and related securitization activity (b) | Sales of loans and related securitization activity (b) | $ | 655 | | | $ | 1,202 | | |
| Repurchases of previously transferred loans (c) | Repurchases of previously transferred loans (c) | $ | 22 | | | | | |
| Repurchases of previously transferred loans (c) | |
| Repurchases of previously transferred loans (c) | |
| Servicing fees (d) | |
| Servicing fees (d) | |
| Servicing fees (d) | Servicing fees (d) | $ | 127 | | | $ | 49 | | |
| Servicing advances recovered/(funded), net | Servicing advances recovered/(funded), net | $ | 11 | | | $ | (15) | | |
| Servicing advances recovered/(funded), net | |
| Servicing advances recovered/(funded), net | |
| Cash flows on mortgage-backed securities held (e) | Cash flows on mortgage-backed securities held (e) | $ | 695 | | | $ | 18 | | |
| Cash Flows - Three months ended June 30, 2022 | | | | |
| Cash flows on mortgage-backed securities held (e) | |
| Cash flows on mortgage-backed securities held (e) | |
| Cash Flows - Three months ended March 31, 2023 | |
| Cash Flows - Three months ended March 31, 2023 | |
| Cash Flows - Three months ended March 31, 2023 | |
| Sales of loans and related securitization activity (b) | |
| Sales of loans and related securitization activity (b) | |
| Sales of loans and related securitization activity (b) | Sales of loans and related securitization activity (b) | $ | 1,454 | | | $ | 929 | | |
| Repurchases of previously transferred loans (c) | Repurchases of previously transferred loans (c) | $ | 57 | | | | | |
| Repurchases of previously transferred loans (c) | |
| Repurchases of previously transferred loans (c) | |
| Servicing fees (d) | |
| Servicing fees (d) | |
| Servicing fees (d) | Servicing fees (d) | $ | 91 | | | $ | 47 | | |
| Servicing advances recovered/(funded), net | Servicing advances recovered/(funded), net | $ | 1 | | | $ | (17) | | |
| Cash flows on mortgage-backed securities held (e) | $ | 1,029 | | | $ | 14 | | |
| Cash Flows - Six months ended June 30, 2023 | | |
| Sales of loans and related securitization activity (b) | $ | 1,171 | | | $ | 2,156 | | |
| Repurchases of previously transferred loans (c) | $ | 51 | | | $ | 9 | | |
| Servicing fees (d) | $ | 255 | | | $ | 95 | | |
| Servicing advances recovered/(funded), net | |
| Servicing advances recovered/(funded), net | Servicing advances recovered/(funded), net | $ | 39 | | | $ | (64) | | |
| Cash flows on mortgage-backed securities held (e) | Cash flows on mortgage-backed securities held (e) | $ | 1,298 | | | $ | 30 | | |
| Cash Flows - Six months ended June 30, 2022 | | |
| Sales of loans and related securitization activity (b) | $ | 3,348 | | | $ | 1,839 | | |
| Repurchases of previously transferred loans (c) | $ | 105 | | | $ | 27 | | |
| Servicing fees (d) | $ | 184 | | | $ | 89 | | |
| Servicing advances recovered/(funded), net | $ | 33 | | | $ | 4 | | |
| Cash flows on mortgage-backed securities held (e) | Cash flows on mortgage-backed securities held (e) | $ | 2,325 | | | $ | 28 | | |
| Cash flows on mortgage-backed securities held (e) | |
|
(a)Represents both commercial mortgage loan transfer and servicing activities.
(b)Gains/losses recognized on sales of loans were insignificant for the periods presented.
(c)Includes both residential and commercial mortgage government insured or guaranteed loans eligible for repurchase through the exercise of our ROAP option, as well as residential mortgage loans repurchased due to alleged breaches of origination covenants or representations and warranties made to purchasers.
(d)Includes contractually specified servicing fees, late charges and ancillary fees.
(e)Represents cash flows on securities where we transferred to and/or service loans for a securitization SPE and we hold securities issued by that SPE. The carrying values of such securities held were $21.2$19.8 billion, $21.4$20.4 billion and $19.1$21.6 billion in residential mortgage-backed securities at March 31, 2024, December 31, 2023 and $0.7 billion, $0.7 billion and $0.8 billion inMarch 31, 2023, respectively. The carrying values of commercial mortgage-backed securities were $0.7 billion at June 30, 2023,each March 31, 2024, December 31, 20222023 and June 30, 2022, respectively.March 31, 2023.
Table 5250 presents information about the principal balances of transferred loans that we service and are not recorded on our Consolidated Balance Sheet. We would only experience a loss on these transferred loans if we were required to repurchase a loan, where the repurchase price exceeded the loan’s fair value, due to a breach in representations and warranties or a loss sharing arrangement associated with our continuing involvement with these loans. The estimate of losses related to breaches in representations and warranties was insignificant at June 30,March 31, 2024 and December 31, 2023.
The PNC Financial Services Group, Inc. – Form 10-Q 71
Table 52:50: Principal Balance, Delinquent Loans and Net Charge-offs Related to Serviced Loans For Others
| | | | | | | | | | | | | | | | | |
| In millions | Residential Mortgages | | | Commercial Mortgages (a) | |
| June 30, 2023 | | | | | |
| Total principal balance | $ | 39,893 | | | | $ | 39,306 | | |
| Delinquent loans (b) | $ | 317 | | | | | | |
| December 31, 2022 | | | | | |
| Total principal balance | $ | 41,031 | | | | $ | 57,974 | | |
| Delinquent loans (b) | $ | 346 | | | | | |
| | | | | |
| | | | | |
| Three months ended June 30, 2022 (c) | | | | | |
| Net charge-offs (d) | $ | 1 | | | | $ | 3 | | |
| | | | | |
| | | | | |
| | | | | |
| | | | | |
| Six months ended June 30, 2023 | | | | | |
| Net charge-offs (d) | $ | 2 | | | | $ | 4 | | |
| Six months ended June 30, 2022 | | | | | |
| Net charge-offs (d) | $ | 2 | | | | $ | 3 | | |
| | | | | | | | | | | | | | | | | |
| In millions | Residential Mortgages | | | Commercial Mortgages (a) | |
| March 31, 2024 | | | | | |
| Total principal balance | $ | 38,540 | | | | $ | 56,409 | | |
| Delinquent loans (b) | $ | 310 | | | | $ | 92 | | |
| December 31, 2023 | | | | | |
| Total principal balance | $ | 39,016 | | | | $ | 57,492 | | |
| Delinquent loans (b) | $ | 329 | | | | $ | 89 | | |
| Three months ended March 31, 2024 | | | | | |
| Net charge-offs (c) | $ | 1 | | | | $ | 61 | | |
| | | | | |
| | | | | |
| | | | | |
| | | | | |
| | | | | |
| | | | | |
| | | | | |
| | | | | |
| Three months ended March 31, 2023 | | | | | |
| Net charge-offs (c) | $ | 2 | | | | $ | 4 | | |
(a)Represents information at the securitization level in which we have sold loans and we are the servicer for the securitization.
(b)Serviced delinquent loans are 90 days or more past due or are in process of foreclosure.
(c)There were no net charge-offs for Residential or Commercial mortgages for the three months ended June 30, 2023.
(d)Net charge-offs for Residential mortgages represent credit losses less recoveries distributed and as reported to investors during the period. Net charge-offs for commercial mortgages represent credit losses less recoveries distributed and as reported by the trustee for commercial mortgage-backed securitizations. Realized losses for Agency securitizations are not reflected as we do not manage the underlying real estate upon foreclosure and, as such, do not have access to loss information.
Variable Interest Entities (VIEs)
As discussed in Note 54 Loan Sale and Servicing Activities and Variable Interest Entities included in our 20222023 Form 10-K, we are involved with various entities in the normal course of business that are deemed to be VIEs.
The following table provides a summary of non-consolidated VIEs with which we have significant continuing involvement but are not the primary beneficiary. We have excluded certain transactions with non-consolidated VIEs from the balances presented in Table 5351 where we have determined that our continuing involvement is insignificant. We do not consider our continuing involvement to be significant when it relates to a VIE where we only invest in securities issued by the VIE and were not involved in the design of the VIE or where no transfers have occurred between us and the VIE. In addition, where we only have lending arrangements in the normal course of business with entities that could be VIEs, we have excluded these transactions with non-consolidated entities from the
The PNC Financial Services Group, Inc. – Form 10-Q 61
balances presented in Table 53.51. These loans are included as part of the credit quality disclosures that we make in Note 3 Loans and Related Allowance for Credit Losses.
Table 53:51: Non-Consolidated VIEs | | In millions | In millions | PNC Risk of Loss (a) | | | Carrying Value of Assets
Owned by PNC | | | | Carrying Value of Liabilities
Owned by PNC | | In millions | PNC Risk of Loss (a) | | | Carrying Value of Assets | Carrying Value of Liabilities |
| June 30, 2023 | | | | | | |
| March 31, 2024 | | March 31, 2024 | | | | | | | |
| Mortgage-backed securitizations (b) | Mortgage-backed securitizations (b) | $ | 22,732 | | | | $ | 22,735 | | (c) | | | $ | 1 | | | Mortgage-backed securitizations (b) | $ | 20,918 | | | | $ | | | $ | 20,922 | | (c) | (c) | | | | |
| Tax credit investments and other | Tax credit investments and other | 4,424 | | | | 4,263 | | (d) | | | 2,047 | | (e) | Tax credit investments and other | 4,763 | | | | 4,683 | | | 4,683 | | (d) (e) | (d) (e) | $ | 1,960 | | (f) (g) | (f) (g) |
| Total | Total | $ | 27,156 | | | | $ | 26,998 | | | | | $ | 2,048 | | | Total | $ | 25,681 | | | | $ | | | $ | 25,605 | | | | $ | 1,960 | | | |
| December 31, 2022 | | | | | | |
| December 31, 2023 | | December 31, 2023 | | | | | | | |
| Mortgage-backed securitizations (b) | Mortgage-backed securitizations (b) | $ | 22,666 | | | | $ | 22,670 | | (c) | | | $ | 1 | | | Mortgage-backed securitizations (b) | $ | 21,451 | | | | $ | | | $ | 21,453 | | (c) | (c) | | | | |
| Tax credit investments and other | Tax credit investments and other | 4,411 | | | | 4,240 | | (d) | | | 2,063 | | (e) | Tax credit investments and other | 4,709 | | | | 4,631 | | | 4,631 | | (d) (e) | (d) (e) | $ | 2,119 | | (f) (g) | (f) (g) |
| Total | Total | $ | 27,077 | | | | $ | 26,910 | | | | | $ | 2,064 | | | Total | $ | 26,160 | | | | $ | | | $ | 26,084 | | | | $ | 2,119 | | | |
(a)Represents loans, investments and other assets related to non-consolidated VIEs, net of collateral (if applicable). The risk of loss excludes any potential tax recapture associated with tax credit investments.
(b)Amounts reflect involvement with securitization SPEs where we transferred to and/or service loans for an SPE and we hold securities issued by that SPE. Values disclosed in the PNC Risk of Loss column represent our maximum exposure to loss for those securities’ holdings.
(c)Included in Investment securities, Mortgage servicing rights and Other assets on our Consolidated Balance Sheet.
(d)Included in Investment securities, Loans, Equity investments and Other assets on our Consolidated Balance Sheet.
(e)Amount includes $3.0 billion of LIHTCs and $0.2 billion of NMTCs at March 31, 2024, which are included in Equity investments on our Consolidated Balance Sheet. Comparable amounts at December 31, 2023 were $3.0 billion and $0.2 billion, respectively.
(f)Included in Deposits and Other liabilities on our Consolidated Balance Sheet.
(g)Amount includes $1.6 billion of LIHTCs and less than $0.1 billion of NMTCs at March 31, 2024, which are included in Other liabilities on our Consolidated Balance Sheet. Comparable amounts at December 31, 2023 were $1.6 billion and $0.2 billion, respectively.
We make certain equity investments in various tax credit limited partnerships or LLCs. The purpose of these investments is to achieve a satisfactory return on capital and to assist us in achieving goals associated with the Community Reinvestment Act. Within Income taxes, during the sixthree months ended June 30, 2023,March 31, 2024, we recognized $0.2$0.1 billion of amortization, $0.2$0.1 billion of tax credits and less than $0.1 billion of other tax benefits associated with qualified investments in LIHTCs.LIHTCs and NMTCs. During the sixthree months ended June 30, 2022,March 31, 2023, we recognized less than $0.1 billion of amortization, tax credits and other tax benefits associated with qualified investments in LIHTCs.
72 The PNC Financial Services Group, Inc. – Form 10-Q
NOTE 5 GOODWILL AND MORTGAGE SERVICING RIGHTS
Goodwill
See Note 65 Goodwill and Mortgage Servicing Rights in our 20222023 Form 10-K for more information regarding our goodwill.
Mortgage Servicing Rights
We recognize the right to service mortgage loans for others as an intangible asset when the benefits of servicing are expected to be more than adequate compensation to a servicer for performing the servicing. MSRs are recognized either when purchased or when originated loans are sold with servicing retained. MSRs totaled $3.5$3.8 billion at June 30, 2023March 31, 2024 and $3.4$3.7 billion at December 31, 2022,2023, and consisted of loan servicing contracts for commercial and residential mortgages which are measured at fair value.
We recognize gains (losses) on changes in the fair value of MSRs. MSRs are subject to changes in value from actual or expected prepayment of the underlying loans and defaults, as well as market driven changes in interest rates. We manage this risk by economically hedging the fair value of MSRs with securities, derivative instruments and resale agreements, which are expected to increase (or decrease) in value when the value of MSRs decreases (or increases).
See the Sensitivity Analysis section of this Note 5 for more detail on our fair value measurement of MSRs. See Note 65 Goodwill and Mortgage Servicing Rights and Note 1514 Fair Value in our 20222023 Form 10-K for more detail on our fair value measurement and our accounting of MSRs.
62 The PNC Financial Services Group, Inc. – Form 10-Q
Changes in the commercial and residential MSRs follow:
Table 54:52: Mortgage Servicing Rights
| | | | Commercial MSRs | | Residential MSRs | |
| In millions | In millions | 2023 | 2022 | | 2023 | 2022 | |
| In millions | |
| In millions | |
| January 1 | January 1 | $ | 1,113 | | $ | 740 | | | $ | 2,310 | | $ | 1,078 | | |
| January 1 | |
| January 1 | |
| Additions: | |
| Additions: | |
| Additions: | Additions: | | | | |
| | From loans sold with servicing retained | From loans sold with servicing retained | 32 | | 35 | | | 10 | | 38 | | |
| | From loans sold with servicing retained | |
| | From loans sold with servicing retained | |
| Purchases | |
| Purchases | |
| Purchases | Purchases | 17 | | 25 | | | 109 | | 257 | | |
| Changes in fair value due to: | Changes in fair value due to: | | | | |
| Changes in fair value due to: | |
| Changes in fair value due to: | |
| Time and payoffs (a) | |
| Time and payoffs (a) | |
| Time and payoffs (a) | Time and payoffs (a) | (164) | | (74) | | | (113) | | (123) | | |
| Other (b) | Other (b) | 108 | | 262 | | | 33 | | 370 | | |
| June 30 | $ | 1,106 | | $ | 988 | | | $ | 2,349 | | $ | 1,620 | | |
| Related unpaid principal balance of loans serviced at June 30 | $ | 280,023 | | $ | 281,671 | | | $ | 191,274 | | $ | 144,533 | | |
| Servicing advances at June 30 | $ | 485 | | $ | 459 | | | $ | 126 | | $ | 143 | | |
| Other (b) | |
| Other (b) | |
| March 31 | |
| March 31 | |
| March 31 | |
| Related unpaid principal balance of loans serviced at March 31 | |
| Related unpaid principal balance of loans serviced at March 31 | |
| Related unpaid principal balance of loans serviced at March 31 | |
| Servicing advances at March 31 | |
| Servicing advances at March 31 | |
| Servicing advances at March 31 | |
(a)Represents decrease in MSR value due to passage of time, including the impact from regularly scheduled loan principal payments, prepayments and loans that were paid off during the period.
(b)RepresentsIncludes MSR value changes resulting primarily from market-driven changes in interest rates.rates and other market-driven conditions.
Sensitivity Analysis
The fair value of commercial and residential MSRs and significant inputs to the valuation models as of June 30, 2023March 31, 2024 and December 31, 20222023 are shown in Tables 5553 and 56.54. The expected and actual rates of mortgage loan prepayments are significant factors driving the fair value. Management uses both internal proprietary models and a third-party model to estimate future commercial mortgage loan prepayments and a third-party model to estimate future residential mortgage loan prepayments. These models have been refined based on current market conditions and management judgment. Future interest rates are another important factor in the valuation of MSRs. Management utilizes market implied forward interest rates to estimate the future direction of mortgage and discount rates. The forward rates utilized are derived from the current yield curve for U.S. dollar interest rate swaps and are consistent with pricing of capital markets instruments. Changes in the shape and slope of the forward curve in future periods may result in volatility in the fair value estimate.
A sensitivity analysis of the hypothetical effect on the fair value of MSRs to adverse changes in key assumptions is presented in Tables 5553 and 56.54. These sensitivities do not include the impact of the related hedging activities. Changes in fair value generally cannot be extrapolated because the relationship of the change in the assumption to the change in fair value may not be linear. Also, the effect of a variation in a particular assumption on the fair value of the MSRs is calculated independently without changing any other assumption. In reality, changesChanges in one factor may result in changes in another (e.g., changes in mortgage interest rates, which drive changes in prepayment rate estimates, could result in changes in the interest rate spread), which could either magnify or counteract the sensitivities.
The PNC Financial Services Group, Inc. – Form 10-Q 73
The following tables set forth the fair value of commercial and residential MSRs and the sensitivity analysis of the hypothetical effect on the fair value of MSRs to immediate adverse changes of 10% and 20% in those assumptions:
Table 55:53: Commercial Mortgage Servicing Rights – Key Valuation Assumptions
| | Dollars in millions | Dollars in millions | June 30, 2023 | | December 31, 2022 | |
| Fair value | Fair value | $ | 1,106 | | | $ | 1,113 | | |
| Fair value | |
| Fair value | |
| Weighted-average life (years) | |
| Weighted-average life (years) | |
| Weighted-average life (years) | Weighted-average life (years) | 3.9 | | 4.0 | |
| Weighted-average constant prepayment rate | Weighted-average constant prepayment rate | 4.38 | % | | 4.28 | % | |
| Weighted-average constant prepayment rate | |
| Weighted-average constant prepayment rate | |
| Decline in fair value from 10% adverse change | |
| Decline in fair value from 10% adverse change | |
| Decline in fair value from 10% adverse change | Decline in fair value from 10% adverse change | $ | 7 | | | $ | 8 | | |
| Decline in fair value from 20% adverse change | Decline in fair value from 20% adverse change | $ | 14 | | | $ | 15 | | |
| Decline in fair value from 20% adverse change | |
| Decline in fair value from 20% adverse change | |
| Effective discount rate | |
| Effective discount rate | |
| Effective discount rate | Effective discount rate | 9.89 | % | | 9.77 | % | |
| Decline in fair value from 10% adverse change | Decline in fair value from 10% adverse change | $ | 33 | | | $ | 34 | | |
| Decline in fair value from 10% adverse change | |
| Decline in fair value from 10% adverse change | |
| Decline in fair value from 20% adverse change | Decline in fair value from 20% adverse change | $ | 65 | | | $ | 68 | | |
| Decline in fair value from 20% adverse change | |
| Decline in fair value from 20% adverse change | |
The PNC Financial Services Group, Inc. – Form 10-Q 63
Table 56:54: Residential Mortgage Servicing Rights – Key Valuation Assumptions
| | Dollars in millions | Dollars in millions | June 30, 2023 | | December 31, 2022 | | Dollars in millions | March 31, 2024 | | December 31, 2023 | |
| Fair value | Fair value | $ | 2,349 | | | $ | 2,310 | | | Fair value | $ | 2,687 | | | $ | | $ | 2,654 | | | |
| Weighted-average life (years) | Weighted-average life (years) | 7.8 | | 8.0 | | Weighted-average life (years) | 8.1 | | 8.1 | |
| Weighted-average constant prepayment rate | Weighted-average constant prepayment rate | 6.91 | % | | 6.72 | % | |
| Decline in fair value from 10% adverse change | Decline in fair value from 10% adverse change | $ | 56 | | | $ | 55 | | |
| Decline in fair value from 10% adverse change | |
| Decline in fair value from 10% adverse change | | $ | 58 | | | $ | 60 | | |
| Decline in fair value from 20% adverse change | Decline in fair value from 20% adverse change | $ | 108 | | | $ | 107 | | | Decline in fair value from 20% adverse change | $ | 113 | | | $ | | $ | 117 | | | |
| Weighted-average option adjusted spread | Weighted-average option adjusted spread | 767 | | bps | 766 | | bps | Weighted-average option adjusted spread | 766 | | bps | bps | 765 | | bps | bps |
| Decline in fair value from 10% adverse change | Decline in fair value from 10% adverse change | $ | 69 | | | $ | 69 | | | Decline in fair value from 10% adverse change | $ | 83 | | | $ | | $ | 83 | | | |
| Decline in fair value from 20% adverse change | Decline in fair value from 20% adverse change | $ | 135 | | | $ | 134 | | | Decline in fair value from 20% adverse change | $ | 162 | | | $ | | $ | 161 | | | |
Fees from mortgage loan servicing, which include contractually specified servicing fees, late fees and ancillary fees were $0.2 billion for both the three months ended June 30, 2023March 31, 2024 and 2022, and $0.4 billion and $0.3 billion for the six months ended June 30, 2023 and 2022, respectively.2023. We also generate servicing fees from fee-based activities provided to others for which we do not have an associated servicing asset. Fees from commercial and residential MSRs are reported within Noninterest income on our Consolidated Income Statement in Residential and commercial mortgage.
NOTE 6 LEASES
PNC’s lessor arrangements primarily consist of direct financing, sales-type and operating leases for equipment. Lease agreements may include options to renew and for the lessee to purchase the leased equipment at the end of the lease term. For more information on lease accounting, see Note 1 Accounting Policies and Note 76 Leases in our 20222023 Form 10-K.
Table 57:55: Lessor Income | | Three months ended
June 30 | Six months ended June 30 |
| Three months ended
March 31 | |
| Three months ended
March 31 | |
| Three months ended
March 31 | |
| In millions | |
| In millions | |
| In millions | In millions | 2023 | 2022 | 2023 | 2022 |
| Sales-type and direct financing leases (a) | Sales-type and direct financing leases (a) | $ | 73 | | $ | 57 | | $ | 143 | | $ | 116 | |
| Sales-type and direct financing leases (a) | |
| Sales-type and direct financing leases (a) | |
| Operating leases (b) | |
| Operating leases (b) | |
| Operating leases (b) | Operating leases (b) | 15 | | 16 | | 31 | | 33 | |
| Lease income | Lease income | $ | 88 | | $ | 73 | | $ | 174 | | $ | 149 | |
| Lease income | |
| Lease income | |
(a)Included in Loans interest income on the Consolidated Income Statement.
(b)Included in Lending and deposit services on the Consolidated Income Statement.
74 The PNC Financial Services Group, Inc. – Form 10-Q
NOTE 7 BORROWED FUNDS
The following table shows the carrying value of total borrowed funds at June 30, 2023March 31, 2024 (including adjustments related to accounting hedges, purchase accounting and unamortized original issuance discounts) by remaining contractual maturity:
Table 58:56: Borrowed Funds
| | | | | |
| In millions |
| Less than 1 year | $ | 7,48727,205 | |
| 1 to 2 years | 26,31915,243 | |
| 2 to 3 years | 11,6116,927 | |
| 3 to 4 years | 3,4924,572 | |
| 4 to 5 years | 1,8052,386 | |
| Over 5 years | 14,67016,374 | |
| Total | $ | 65,38472,707 | |
64 The PNC Financial Services Group, Inc. – Form 10-Q
The following table presents the contractual rates and maturity dates of our FHLB borrowings, senior debt and subordinated debt as of June 30, 2023,March 31, 2024, and the carrying values as of June 30, 2023March 31, 2024 and December 31, 2022.2023.
Table 59:57: FHLB Borrowings, Senior Debt and Subordinated Debt
| | | | Stated Rate | | Maturity | | Carrying Value | |
| Dollars in millions | Dollars in millions | June 30, 2023 | | June 30, 2023 | | June 30, 2023 | | December 31, 2022 | |
| Dollars in millions | |
| Dollars in millions | |
| Parent Company | |
| Parent Company | |
| Parent Company | Parent Company | | |
| Senior debt | Senior debt | 1.15% - 6.04% | | 2024-2034 | | $ | 17,480 | | | $ | 11,374 | | |
| Senior debt | |
| Senior debt | |
| Subordinated debt | |
| Subordinated debt | |
| Subordinated debt | Subordinated debt | 3.90% - 4.63% | | 2024-2033 | | 1,526 | | | 1,524 | | |
| Junior subordinated debt | Junior subordinated debt | 6.07 | % | | 2028 | | 206 | | | 205 | | |
| Junior subordinated debt | |
| Junior subordinated debt | |
| Total Parent Company | |
| Total Parent Company | |
| Total Parent Company | Total Parent Company | | | | | 19,212 | | | 13,103 | | |
| Bank | Bank | | |
| Bank | |
| Bank | |
| Federal Home Loan Bank borrowings (a) | |
| Federal Home Loan Bank borrowings (a) | |
| Federal Home Loan Bank borrowings (a) | Federal Home Loan Bank borrowings (a) | 5.25% - 5.48% | | 2024-2026 | | 34,000 | | | 32,075 | | |
| Senior debt | Senior debt | 2.50% - 5.88% | | 2024-2043 | | 4,525 | | | 5,283 | | |
| Senior debt | |
| Senior debt | |
| Subordinated debt | |
| Subordinated debt | |
| Subordinated debt | Subordinated debt | 2.70% - 5.90% | | 2023-2029 | | 3,816 | | | 4,578 | | |
| Total Bank | Total Bank | | | | | 42,341 | | | 41,936 | | |
| Total Bank | |
| Total Bank | |
| Total | Total | | | | | $ | 61,553 | | | $ | 55,039 | | |
| Total | |
| Total | |
(a)FHLB borrowings are generally collateralized by residential mortgage loans, other mortgage-related loans and investment securities.
In Table 59,57, the carrying values for Parent Companyparent company senior and subordinated debt include basis adjustments of $(869)$(724) million and $(70)$(66) million, respectively, whereas Bank senior and subordinated debt include basis adjustments of $(249)$(173) million and $(229)$(195) million, respectively, related to fair value accounting hedges as of June 30, 2023.March 31, 2024.
Certain borrowings are reported at fair value. Refer to Note 11 Fair Value for more information on those borrowings.
For further information regarding junior subordinated debentures, refer to Note 109 Borrowed Funds in our 20222023 Form 10-K.
The PNC Financial Services Group, Inc. – Form 10-Q 75
NOTE 8 COMMITMENTS
In the normal course of business, we have various commitments outstanding, certain of which are not included on our Consolidated Balance Sheet. The following table presents our outstanding commitments to extend credit along with other commitments as of June 30, 2023March 31, 2024 and December 31, 2022,2023, respectively.
Table 60:58: Commitments to Extend Credit and Other Commitments
| | In millions | In millions | June 30, 2023 | | December 31, 2022 | |
| In millions | |
| In millions | |
| Commitments to extend credit | |
| Commitments to extend credit | |
| Commitments to extend credit | Commitments to extend credit | | | | |
| Commercial | Commercial | $ | 196,185 | | | $ | 198,542 | | |
| Commercial | |
| Commercial | |
| Home equity | |
| Home equity | |
| Home equity | Home equity | 23,939 | | | 22,783 | | |
| Credit card | Credit card | 33,932 | | | 33,066 | | |
| Credit card | |
| Credit card | |
| Other | |
| Other | |
| Other | Other | 7,849 | | | 7,337 | | |
| Total commitments to extend credit | Total commitments to extend credit | 261,905 | | | 261,728 | | |
| Total commitments to extend credit | |
| Total commitments to extend credit | |
| Net outstanding standby letters of credit (a) | |
| Net outstanding standby letters of credit (a) | |
| Net outstanding standby letters of credit (a) | Net outstanding standby letters of credit (a) | 10,157 | | | 10,575 | | |
| Standby bond purchase agreements (b) | Standby bond purchase agreements (b) | 1,184 | | | 1,208 | | |
| Standby bond purchase agreements (b) | |
| Standby bond purchase agreements (b) | |
| Other commitments (c) | |
| Other commitments (c) | |
| Other commitments (c) | Other commitments (c) | 3,322 | | | 3,661 | | |
| Total commitments to extend credit and other commitments | Total commitments to extend credit and other commitments | $ | 276,568 | | | $ | 277,172 | | |
| Total commitments to extend credit and other commitments | |
| Total commitments to extend credit and other commitments | |
(a)Net outstanding standby letters of credit include $3.4$3.5 billion and $3.6$3.9 billion at June 30, 2023March 31, 2024 and December 31, 2022,2023, respectively, which support remarketing programs.
(b)We enter into standby bond purchase agreements to support municipal bond obligations.
(c)Includes $2.1 billion and $2.2 billion related to investments in qualified affordable housing projects at June 30, 2023both March 31, 2024 and December 31, 2022, respectively.2023.
Commitments to Extend Credit
Commitments to extend credit, or net unfunded loan commitments, represent arrangements to lend funds or provide liquidity subject to specified contractual conditions. These commitments generally have fixed expiration dates, may require payment of a fee and generally contain termination clauses in the event the customer’s credit quality deteriorates.
The PNC Financial Services Group, Inc. – Form 10-Q 65
Net Outstanding Standby Letters of Credit
We issue standby letters of credit and share in the risk of standby letters of credit issued by other financial institutions, in each case to support obligations of our customers to third parties, such as insurance requirements and the facilitation of transactions involving capital markets product execution. Approximately 98%97% of our net outstanding standby letters of credit were rated as Pass at June 30, 2023,March 31, 2024, with the remainder rated as Criticized. An internal credit rating of Pass indicates the expected risk of loss is currently low, while a rating of Criticized indicates a higher degree of risk.
If the customer fails to meet its financial or performance obligation to the third party under the terms of the contract or there is a need to support a remarketing program, then upon a draw by a beneficiary, subject to the terms of the letter of credit, we would be obligated to make payment to them. The standby letters of credit outstanding on June 30, 2023March 31, 2024 had terms ranging from less than one year to eightseven years.
As of June 30, 2023,March 31, 2024, assets of $1.2$1.1 billion secured certain specifically identified standby letters of credit. In addition, a portion of the remaining standby letters of credit issued on behalf of specific customers is secured by collateral or guarantees that secure the customers’ other obligations to us. The carrying amount of the liability for our obligations related to standby letters of credit and participations in standby letters of credit was $0.2 billion at June 30, 2023March 31, 2024 and is included in Other liabilities on our Consolidated Balance Sheet.
76 The PNC Financial Services Group, Inc. – Form 10-Q
NOTE 9 TOTAL EQUITY AND OTHER COMPREHENSIVE INCOME
Activity in total equity for the three months ended June 30,March 31, 2024 and 2023 and 2022 is as follows:
Table 61:59: Rollforward of Total Equity
| | | | | | Shareholders’ Equity | | | | |
| In millions | In millions | Shares
Outstanding
Common
Stock | | Common
Stock | Capital
Surplus -
Preferred
Stock | Capital
Surplus -
Common
Stock and
Other | Retained
Earnings | Accumulated
Other
Comprehensive
Income (Loss) | Treasury
Stock | | Non-
controlling
Interests | Total Equity | |
| In millions | |
| In millions | |
| Three months ended | Three months ended | | | | | | |
| Balance at March 31, 2022 (a) | 415 | | | $ | 2,713 | | $ | 5,011 | | $ | 12,476 | | $ | 51,058 | | $ | (5,731) | | $ | (16,346) | | | $ | 35 | | $ | 49,216 | | |
| Three months ended | |
| Three months ended | |
| Balance at December 31, 2022 (a) | |
| Balance at December 31, 2022 (a) | |
| Balance at December 31, 2022 (a) | |
| Cumulative effect of ASU adoptions (b) | |
| Cumulative effect of ASU adoptions (b) | |
| Cumulative effect of ASU adoptions (b) | |
| Balance at January 1, 2023 (a) | |
| Balance at January 1, 2023 (a) | |
| Balance at January 1, 2023 (a) | |
| Net income | Net income | | | | 1,481 | | | 15 | | 1,496 | | |
| Other comprehensive income (loss), net of tax | | | | (2,627) | | | | (2,627) | | |
| Net income | |
| Net income | |
| Other comprehensive income, net of tax | |
| Other comprehensive income, net of tax | |
| Other comprehensive income, net of tax | |
| Cash dividends declared - Common | |
| Cash dividends declared - Common | |
| Cash dividends declared - Common | Cash dividends declared - Common | | | | (626) | | | | (626) | | |
| Cash dividends declared - Preferred | Cash dividends declared - Preferred | | | | (71) | | | | (71) | | |
| Cash dividends declared - Preferred | |
| Cash dividends declared - Preferred | |
| Preferred stock discount accretion | Preferred stock discount accretion | | | 1 | | | (1) | | | | | | |
| Preferred stock issuance (b) | | | 992 | | | | 992 | | |
| Common Stock activity | | 1 | | 14 | | | | 15 | | |
| Preferred stock discount accretion | |
| Preferred stock discount accretion | |
| Preferred stock issuance (c) | |
| Preferred stock issuance (c) | |
| Preferred stock issuance (c) | |
| Treasury stock activity | |
| Treasury stock activity | |
| Treasury stock activity | |
| Other | |
| Other | |
| Other | |
| Balance at March 31, 2023 (a) | |
| Balance at March 31, 2023 (a) | |
| Balance at March 31, 2023 (a) | |
| | Balance at December 31, 2023 (a) | |
| | Balance at December 31, 2023 (a) | |
| | Balance at December 31, 2023 (a) | |
| Net income | |
| Net income | |
| Net income | |
| Other comprehensive loss, net of tax | |
| Other comprehensive loss, net of tax | |
| Other comprehensive loss, net of tax | |
| Cash dividends declared - Common | |
| Cash dividends declared - Common | |
| Cash dividends declared - Common | |
| Cash dividends declared - Preferred | |
| Cash dividends declared - Preferred | |
| Cash dividends declared - Preferred | |
| Preferred stock discount accretion | |
| Preferred stock discount accretion | |
| Preferred stock discount accretion | |
| | Treasury stock activity | Treasury stock activity | (4) | | | | | 5 | | | (730) | | | | (725) | | |
| | Other | | | | 32 | | | (14) | | 18 | | |
| Balance at June 30, 2022 (a) | 411 | | | $ | 2,714 | | $ | 6,004 | | $ | 12,527 | | $ | 51,841 | | $ | (8,358) | | $ | (17,076) | | | $ | 36 | | $ | 47,688 | | |
| | Balance at March 31, 2023 (a) | 399 | | $ | 2,714 | | $ | 7,235 | | $ | 12,629 | | $ | 54,598 | | $ | (9,108) | | $ | (19,024) | | | $ | 30 | | $ | 49,074 | | |
| Net income | | | | 1,483 | | | 17 | | 1,500 | | |
| Other comprehensive income (loss), net of tax | | | | (417) | | | | (417) | | |
| Cash dividends declared - Common | | | | (606) | | | | (606) | | |
| Cash dividends declared - Preferred | | | | (127) | | | | (127) | | |
| Preferred stock discount accretion | | | 2 | | | (2) | | | | | | |
| Treasury stock activity | |
| | Common stock activity | | 1 | | | 16 | | | | 17 | | |
| | | Treasury stock activity | Treasury stock activity | (1) | | | | | 3 | | | (126) | | | | (123) | | |
| | Other | Other | | | | 49 | | | (21) | | 28 | | |
| Balance at June 30, 2023 (a) | 398 | | | $ | 2,715 | | $ | 7,237 | | $ | 12,697 | | $ | 55,346 | | $ | (9,525) | | $ | (19,150) | | | $ | 26 | | $ | 49,346 | | |
| Six months ended | | | | | | |
| | Other | |
| | Other | |
| Balance at March 31, 2024 (a) | |
| Balance at March 31, 2024 (a) | |
| Balance at March 31, 2024 (a) | |
| | Balance at December 31, 2021 (a) | 420 | | | $ | 2,713 | | $ | 5,009 | | $ | 12,448 | | $ | 50,228 | | $ | 409 | | $ | (15,112) | | | $ | 31 | | $ | 55,726 | | |
| Net income | | | | 2,889 | | | 36 | | 2,925 | | |
| Other comprehensive income (loss), net of tax | | | | (8,767) | | | | (8,767) | | |
| Cash dividends declared - Common | | | | (1,157) | | | | (1,157) | | |
| Cash dividends declared - Preferred | | | | (116) | | | | (116) | | |
| Preferred stock discount accretion | | | 3 | | | (3) | | | | | |
| Preferred stock issuance (b) | | | 992 | | | | 992 | | |
| Common stock activity | | 1 | | | 14 | | | | 15 | | |
| Treasury stock activity | (9) | | | | | 50 | | | (1,964) | | | | (1,914) | | |
| | Other | | | | 15 | | | (31) | | (16) | | |
| Balance at June 30, 2022 (a) | 411 | | | $ | 2,714 | | $ | 6,004 | | $ | 12,527 | | $ | 51,841 | | $ | (8,358) | | $ | (17,076) | | | $ | 36 | | $ | 47,688 | | |
| Balance at December 31, 2022 (a) | 401 | | | $ | 2,714 | | $ | 5,746 | | $ | 12,630 | | $ | 53,572 | | $ | (10,172) | | $ | (18,716) | | | $ | 38 | | $ | 45,812 | | |
| Cumulative effect of ASU adoptions (c) | | | | 26 | | | | 26 | | |
| Balance at January 1, 2023 (a) | 401 | | $ | 2,714 | | $ | 5,746 | | $ | 12,630 | | $ | 53,598 | | $ | (10,172) | | $ | (18,716) | | | $ | 38 | | $ | 45,838 | | |
| Net income | | | | 3,160 | | | 34 | | 3,194 | | |
| Other comprehensive income (loss), net of tax | | | | 647 | | | | 647 | | |
| Cash dividends declared - Common | | | | (1,213) | | | | (1,213) | | |
| Cash dividends declared - Preferred | | | | (195) | | | | (195) | | |
| Preferred stock discount accretion | | | 4 | | | (4) | | | | | |
| Preferred stock issuance (d) | | | 1,487 | | | | 1,487 | | |
| Common stock activity | | 1 | | | 16 | | | | 17 | | |
| Treasury stock activity | (3) | | | | | 73 | | | (434) | | | | (361) | | |
| | Other | | | | (22) | | | (46) | | (68) | | |
| Balance at June 30, 2023 (a) | 398 | | | $ | 2,715 | | $ | 7,237 | | $ | 12,697 | | $ | 55,346 | | $ | (9,525) | | $ | (19,150) | | | $ | 26 | | $ | 49,346 | | |
|
(a)The par value of our preferred stock outstanding was less than $0.5 million at each date and, therefore, is excluded from this presentation.
(b)On April 26, 2022, PNC issued 1,000,000 depositary shares each representing 1/100th ownership in a share of 6.000% fixed-rate reset non-cumulative perpetual preferred stock, Series U, with a par value of $1 per share.
(c)Represents the cumulative effect of adopting ASU 2022-02.
(d)(c)On February 7, 2023, PNC issued 1,500,000 depositary shares each representing 1/100th ownership in a share of 6.250% fixed-rate reset non-cumulative perpetual preferred stock, Series W, with a par value of $1 per share.
66The PNC Financial Services Group, Inc. – Form 10-Q
77
Details of other comprehensive income (loss) are as follows:
Table 62:60: Other Comprehensive Income (Loss)
| | | | Three months ended June 30 | | Six months ended June 30 | |
| | 2023 | | 2022 | | 2023 | | 2022 | |
| | |
| 2024 | |
| 2024 | |
| 2024 | |
| In millions | |
| In millions | |
| In millions | In millions | Pre-tax | Tax effect | After-tax | | Pre-tax | Tax effect | After-tax | | Pre-tax | Tax effect | After-tax | | Pre-tax | Tax effect | After-tax | |
| Debt securities | Debt securities | | | | |
| Debt securities | |
| Debt securities | |
| Net unrealized gains (losses) on securities | Net unrealized gains (losses) on securities | $ | (476) | | $ | 112 | | $ | (364) | | | $ | (2,929) | | $ | 690 | | $ | (2,239) | | | $ | 178 | | $ | (42) | | $ | 136 | | | $ | (9,247) | | $ | 2,179 | | $ | (7,068) | | |
Less: Net realized gains (losses) reclassified to
earnings (a)
| (235) | | 55 | | (180) | | | (214) | | 50 | | (164) | | | (450) | | 106 | | (344) | | | (217) | | 51 | | (166) | | |
| Net unrealized gains (losses) on securities | |
| Net unrealized gains (losses) on securities | |
| Less: Net realized (losses) reclassified to earnings (a) | |
| Less: Net realized (losses) reclassified to earnings (a) | |
| Less: Net realized (losses) reclassified to earnings (a) | |
| Net change | |
| Net change | |
| Net change | Net change | (241) | | 57 | | (184) | | | (2,715) | | 640 | | (2,075) | | | 628 | | (148) | | 480 | | | (9,030) | | 2,128 | | (6,902) | | |
| Cash flow hedge derivatives | Cash flow hedge derivatives | | | | |
| Cash flow hedge derivatives | |
| Cash flow hedge derivatives | |
| Net unrealized gains (losses) on cash flow hedge derivatives | Net unrealized gains (losses) on cash flow hedge derivatives | (689) | | 162 | | (527) | | | (676) | | 159 | | (517) | | | (492) | | 116 | | (376) | | | (2,332) | | 549 | | (1,783) | | |
| Less: Net realized gains (losses) reclassified to earnings (a) | (373) | | 88 | | (285) | | | 25 | | (6) | | 19 | | | (703) | | 166 | | (537) | | | 127 | | (30) | | 97 | | |
| Net unrealized gains (losses) on cash flow hedge derivatives | |
| Net unrealized gains (losses) on cash flow hedge derivatives | |
| Less: Net realized (losses) reclassified to earnings (a) | |
| Less: Net realized (losses) reclassified to earnings (a) | |
| Less: Net realized (losses) reclassified to earnings (a) | |
| Net change | |
| Net change | |
| Net change | Net change | (316) | | 74 | | (242) | | | (701) | | 165 | | (536) | | | 211 | | (50) | | 161 | | | (2,459) | | 579 | | (1,880) | | |
| Pension and other postretirement benefit plan adjustments | Pension and other postretirement benefit plan adjustments | | | | |
| Pension and other postretirement benefit plan adjustments | |
| Pension and other postretirement benefit plan adjustments | |
| Net pension and other postretirement benefit plan activity and other reclassified to earnings (b) | |
| Net pension and other postretirement benefit plan activity and other reclassified to earnings (b) | |
| Net pension and other postretirement benefit plan activity and other reclassified to earnings (b) | Net pension and other postretirement benefit plan activity and other reclassified to earnings (b) | 6 | | (1) | | 5 | | | 8 | | (2) | | 6 | | | (4) | | 1 | | (3) | | | 62 | | (15) | | 47 | | |
| Net change | Net change | 6 | | (1) | | 5 | | | 8 | | (2) | | 6 | | | (4) | | 1 | | (3) | | | 62 | | (15) | | 47 | | |
| Net change | |
| Net change | |
| Other | |
| Other | |
| Other | Other | | | | |
| Net unrealized gains (losses) on other transactions | Net unrealized gains (losses) on other transactions | 3 | | 1 | | 4 | | | (4) | | (18) | | (22) | | | 7 | | 2 | | 9 | | | (7) | | (25) | | (32) | | |
| Net unrealized gains (losses) on other transactions | |
| Net unrealized gains (losses) on other transactions | |
| Net change | |
| Net change | |
| Net change | Net change | 3 | | 1 | | 4 | | | (4) | | (18) | | (22) | | | 7 | | 2 | | 9 | | | (7) | | (25) | | (32) | | |
| | Total other comprehensive income (loss) | Total other comprehensive income (loss) | $ | (548) | | $ | 131 | | $ | (417) | | | $ | (3,412) | | $ | 785 | | $ | (2,627) | | | $ | 842 | | $ | (195) | | $ | 647 | | | $ | (11,434) | | $ | 2,667 | | $ | (8,767) | | |
| | Total other comprehensive income (loss) | |
| | Total other comprehensive income (loss) | |
(a)Reclassifications for pre-tax debt securities and cash flow hedges are recorded in Interest income and Noninterest income on the Consolidated Income Statement.
(b)Reclassifications include amortization of actuarial losses (gains) and amortization of prior period servicesservice costs (credits), which are recorded in Noninterest expense on the Consolidated Income Statement.
Table 63:61: Accumulated Other Comprehensive Income (Loss) Components
| | | | | | | | | | | | | | | | | | | | | | | | | | | | | | | | | | | |
| In millions, after-tax | Debt securities | | Cash flow hedge derivatives | | Pension and other postretirement benefit plan adjustments | | Other | | | | | Total | |
| Three months ended | | | | | | | | | | | | | |
| Balance at March 31, 2022 | $ | (4,238) | | | $ | (1,545) | | | $ | 68 | | | $ | (16) | | | | | | $ | (5,731) | | |
| Net activity | (2,075) | | | (536) | | | 6 | | | (22) | | | | | | (2,627) | | |
| Balance at June 30, 2022 (a) | $ | (6,313) | | | $ | (2,081) | | | $ | 74 | | | $ | (38) | | | | | | $ | (8,358) | | |
| Balance at March 31, 2023 | $ | (6,500) | | | $ | (2,302) | | | $ | (259) | | | $ | (47) | | | | | | $ | (9,108) | | |
| Net activity | (184) | | | (242) | | | 5 | | | 4 | | | | | | (417) | | |
| Balance at June 30, 2023 (a) | $ | (6,684) | | | $ | (2,544) | | | $ | (254) | | | $ | (43) | | | | | | $ | (9,525) | | |
| Six months ended | | | | | | | | | | | | | |
| Balance at December 31, 2021 | $ | 589 | | | $ | (201) | | | $ | 27 | | | $ | (6) | | | | | | $ | 409 | | |
| Net activity | (6,902) | | | (1,880) | | | 47 | | | (32) | | | | | | (8,767) | | |
| Balance at June 30, 2022 (a) | $ | (6,313) | | | $ | (2,081) | | | $ | 74 | | | $ | (38) | | | | | | $ | (8,358) | | |
| Balance at December 31, 2022 | $ | (7,164) | | | $ | (2,705) | | | $ | (251) | | | $ | (52) | | | | | | $ | (10,172) | | |
| Net activity | 480 | | | 161 | | | (3) | | | 9 | | | | | | 647 | | |
| Balance at June 30, 2023 (a) | $ | (6,684) | | | $ | (2,544) | | | $ | (254) | | | $ | (43) | | | | | | $ | (9,525) | | |
| | | | | | | | | | | | | | | | | | | | | | | | | | | | | | | | | | | |
| In millions, after-tax | Debt securities | | Cash flow hedge derivatives | | Pension and other postretirement benefit plan adjustments | | Other | | | | | Total | |
| Three months ended | | | | | | | | | | | | | |
| Balance at December 31, 2022 | $ | (7,164) | | | $ | (2,705) | | | $ | (251) | | | $ | (52) | | | | | | $ | (10,172) | | |
| Net activity | 664 | | | 403 | | | (8) | | | 5 | | | | | | 1,064 | | |
| Balance at March 31, 2023 (a) | $ | (6,500) | | | $ | (2,302) | | | $ | (259) | | | $ | (47) | | | | | | $ | (9,108) | | |
| Balance at December 31, 2023 | $ | (5,830) | | | $ | (1,713) | | | $ | (125) | | | $ | (44) | | | | | | $ | (7,712) | | |
| Net activity | (136) | | | (190) | | | (2) | | | (2) | | | | | | (330) | | |
| Balance at March 31, 2024 (a) | $ | (5,966) | | | $ | (1,903) | | | $ | (127) | | | $ | (46) | | | | | | $ | (8,042) | | |
| | | | | | | | | | | | | |
| | | | | | | | | | | | | |
| | | | | | | | | | | | | |
| | | | | | | | | | | | | |
| | | | | | | | | | | | | |
| | | | | | | | | | | | | |
| | | | | | | | | | | | | |
(a)AOCI included pretax losses of $301$289 million and $141$305 million from derivatives that hedged the purchase of investment securities classified as held to maturity at June 30,March 31, 2024 and March 31, 2023, and June 30, 2022, respectively.
78 The PNC Financial Services Group, Inc. – Form 10-Q
The following table provides the dividends per share for PNC’s common and preferred stock:
Table 64:62: Dividends Per Share (a)
| | Three months ended June 30 | Six months ended June 30 |
| 2023 | 2022 | 2023 | 2022 |
| Three months ended March 31 | |
| Three months ended March 31 | |
| Three months ended March 31 | |
| 2024 | |
| 2024 | |
| 2024 | |
| Common Stock | |
| Common Stock | |
| Common Stock | Common Stock | $ | 1.50 | | $ | 1.50 | | $ | 3.00 | | $ | 2.75 | |
| Preferred Stock | Preferred Stock | | | |
| Preferred Stock | |
| Preferred Stock | |
| Series B | |
| Series B | |
| Series B | Series B | $ | 0.45 | | $ | 0.45 | | $ | 0.90 | | $ | 0.90 | |
| Series O | Series O | $ | 2,100 | | $ | 987 | | $ | 4,174 | | $ | 1,961 | |
| Series P | | | $ | 1,532 | | | | $ | 3,063 | |
| Series O | |
| Series O | |
| Series R | Series R | $ | 2,425 | | $ | 2,425 | | $ | 2,425 | | $ | 2,425 | |
| Series S | $ | 2,500 | | $ | 2,500 | | $ | 2,500 | | $ | 2,500 | |
| Series R | |
| Series R | |
| | Series T | |
| | Series T | |
| | Series T | Series T | $ | 850 | | $ | 850 | | $ | 1,700 | | $ | 1,700 | |
| Series U | Series U | $ | 1,500 | | | | $ | 3,000 | | |
| Series U | |
| Series U | |
| Series V | |
| Series V | |
| Series V | Series V | $ | 1,550 | | | | $ | 3,100 | | |
| Series W | Series W | $ | 2,222 | | | $ | 2,222 | | |
| Series W | |
| Series W | |
(a) Dividends are payable quarterly other than Series R and S preferred stock, which are payable semiannually.
On JulyApril 3, 2023,2024, the PNC Board of Directors raised thedeclared a quarterly cash dividend on common stock toof $1.55 per share an increaseto be paid on May 6, 2024 to shareholders of 5 cents per share. The dividend, with a payment daterecord at the close of August 5, 2023, will be payable the next business day.April 15, 2024.
The PNC Financial Services Group, Inc. – Form 10-Q 7967
NOTE 10 EARNINGS PER SHARE
Table 65:63: Basic and Diluted Earnings Per Common Share | | | |
| | | | | Three months ended June 30 | | Six months ended June 30 | |
| In millions, except per share data | In millions, except per share data | | 2023 | 2022 | | 2023 | 2022 | |
| In millions, except per share data | |
| In millions, except per share data | |
| Basic | |
| Basic | |
| Basic | Basic | | | | |
| Net income | Net income | | $ | 1,500 | | $ | 1,496 | | | $ | 3,194 | | $ | 2,925 | | |
| Net income | |
| Net income | |
| Less: | |
| Less: | |
| Less: | Less: | | | | |
| Net income attributable to noncontrolling interests | Net income attributable to noncontrolling interests | | 17 | | 15 | | | 34 | | 36 | | |
| Net income attributable to noncontrolling interests | |
| Net income attributable to noncontrolling interests | |
| Preferred stock dividends | |
| Preferred stock dividends | |
| Preferred stock dividends | Preferred stock dividends | | 127 | | 71 | | | 195 | | 116 | | |
| Preferred stock discount accretion and redemptions | Preferred stock discount accretion and redemptions | | 2 | | 1 | | | 4 | | 3 | | |
| Preferred stock discount accretion and redemptions | |
| Preferred stock discount accretion and redemptions | |
| Net income attributable to common shareholders | |
| Net income attributable to common shareholders | |
| Net income attributable to common shareholders | Net income attributable to common shareholders | | 1,354 | | 1,409 | | | 2,961 | | 2,770 | | |
| Less: Dividends and undistributed earnings allocated to nonvested restricted shares | Less: Dividends and undistributed earnings allocated to nonvested restricted shares | | 7 | | 7 | | | 15 | | 13 | | |
| Less: Dividends and undistributed earnings allocated to nonvested restricted shares | |
| Less: Dividends and undistributed earnings allocated to nonvested restricted shares | |
| Net income attributable to basic common shareholders | |
| Net income attributable to basic common shareholders | |
| Net income attributable to basic common shareholders | Net income attributable to basic common shareholders | | $ | 1,347 | | $ | 1,402 | | | $ | 2,946 | | $ | 2,757 | | |
| | Basic weighted-average common shares outstanding | Basic weighted-average common shares outstanding | | 401 | | 414 | | | 401 | | 417 | | |
| | Basic weighted-average common shares outstanding | |
| | Basic weighted-average common shares outstanding | |
| Basic earnings per common share (a) | |
| Basic earnings per common share (a) | |
| Basic earnings per common share (a) | Basic earnings per common share (a) | | $ | 3.36 | | $ | 3.39 | | | $ | 7.35 | | $ | 6.62 | | |
| | Diluted | Diluted | | | | |
| | Diluted | |
| | Diluted | |
Net income attributable to diluted common shareholders
| |
Net income attributable to diluted common shareholders
| |
Net income attributable to diluted common shareholders
| Net income attributable to diluted common shareholders
| | $ | 1,347 | | $ | 1,402 | | | $ | 2,946 | | $ | 2,757 | | |
| | Basic weighted-average common shares outstanding | Basic weighted-average common shares outstanding | | 401 | | 414 | | 401 | | 417 | |
| | Basic weighted-average common shares outstanding | |
| | Basic weighted-average common shares outstanding | |
| Dilutive potential common shares | |
| Dilutive potential common shares | |
| Dilutive potential common shares | Dilutive potential common shares | | | | | | |
| Diluted weighted-average common shares outstanding | Diluted weighted-average common shares outstanding | | 401 | | 414 | | | 401 | | 417 | | |
| Diluted weighted-average common shares outstanding | |
| Diluted weighted-average common shares outstanding | |
| Diluted earnings per common share (a) | |
| Diluted earnings per common share (a) | |
| Diluted earnings per common share (a) | Diluted earnings per common share (a) | | $ | 3.36 | | $ | 3.39 | | | $ | 7.34 | | $ | 6.61 | | |
|
(a)Basic and diluted earnings per share under the two-class method are determined on net income reported on the income statement less earnings allocated to nonvested restricted shares and restricted share units with nonforfeitable dividends and dividend rights (participating securities).
8068 The PNC Financial Services Group, Inc. – Form 10-Q
NOTE 11 FAIR VALUE
Fair Value Measurement
We measure certain financial assets and liabilities at fair value. Fair value is defined as the price that would be received to sell an asset or the price that would be paid to transfer a liability on the measurement date and is determined using an exit price in the principal or most advantageous market for the asset or liability in an orderly transaction between market participants. The fair value hierarchy established by GAAP requires us to maximize the use of observable inputs when measuring fair value. For more information regarding the fair value hierarchy, see Note 1514 Fair Value in our 20222023 Form 10-K.
Assets and Liabilities Measured at Fair Value on a Recurring Basis
For more information on the valuation methodologies used to measure assets and liabilities at fair value on a recurring basis, see Note 1514 Fair Value in our 20222023 Form 10-K. The following table summarizes our assets and liabilities measured at fair value on a recurring basis, including instruments for which we have elected the fair value option.
Table 66:64: Fair Value Measurements – Recurring Basis Summary
| | | | June 30, 2023 | | | December 31, 2022 | |
| In millions | In millions | Level 1 | | Level 2 | | Level 3 | | Total
Fair Value | | | Level 1 | | Level 2 | | Level 3 | | Total
Fair Value | |
| In millions | |
| In millions | |
| Assets | |
| Assets | |
| Assets | Assets | | | | |
| Residential mortgage loans held for sale | Residential mortgage loans held for sale | | $ | 495 | | | $ | 191 | | | $ | 686 | | | | | $ | 411 | | | $ | 243 | | | $ | 654 | | |
| Residential mortgage loans held for sale | |
| Residential mortgage loans held for sale | |
| Commercial mortgage loans held for sale | |
| Commercial mortgage loans held for sale | |
| Commercial mortgage loans held for sale | Commercial mortgage loans held for sale | | 39 | | | 25 | | | 64 | | | | | 243 | | | 33 | | | 276 | | |
| | Securities available for sale | Securities available for sale | | | | |
| | Securities available for sale | |
| | Securities available for sale | |
| U.S. Treasury and government agencies | |
| U.S. Treasury and government agencies | |
| U.S. Treasury and government agencies | U.S. Treasury and government agencies | $ | 6,874 | | | 236 | | | 7,110 | | | | $ | 8,108 | | | 262 | | | 8,370 | | |
| Residential mortgage-backed | Residential mortgage-backed | | | | |
| Residential mortgage-backed | |
| Residential mortgage-backed | |
| Agency | |
| Agency | |
| Agency | Agency | | 27,655 | | | 27,655 | | | | | 28,823 | | | 28,823 | | |
| Non-agency | Non-agency | | 768 | | | 768 | | | | | | | | 819 | | | 819 | | |
| Non-agency | |
| Non-agency | |
| Commercial mortgage-backed | |
| Commercial mortgage-backed | |
| Commercial mortgage-backed | Commercial mortgage-backed | | | | |
| Agency | Agency | | 1,593 | | | 1,593 | | | | | 1,675 | | | 1,675 | | |
| Agency | |
| Agency | |
| Non-agency | |
| Non-agency | |
| Non-agency | Non-agency | | 944 | | | 3 | | | 947 | | | | | 1,253 | | | 3 | | 1,256 | | |
| Asset-backed | Asset-backed | | 817 | | | 117 | | | 934 | | | | | 5 | | | 124 | | | 129 | | |
| Asset-backed | |
| Asset-backed | |
| Other | |
| Other | |
| Other | Other | | 2,726 | | | 54 | | | 2,780 | | | | | 3,032 | | | 55 | | | 3,087 | | |
| Total securities available for sale | Total securities available for sale | 6,874 | | | 33,971 | | | 942 | | | 41,787 | | | | 8,108 | | | 35,050 | | | 1,001 | | | 44,159 | | |
| Total securities available for sale | |
| Total securities available for sale | |
| Loans | |
| Loans | |
| Loans | Loans | | 514 | | | 745 | | | 1,259 | | | | | 541 | | | 769 | | | 1,310 | | |
| Equity investments (a) | Equity investments (a) | 807 | | | 1,623 | | | 2,610 | | | | 1,173 | | | 1,778 | | | 3,147 | | |
| Equity investments (a) | |
| Equity investments (a) | |
| Residential mortgage servicing rights | |
| Residential mortgage servicing rights | |
| Residential mortgage servicing rights | Residential mortgage servicing rights | | 2,349 | | | 2,349 | | | | | 2,310 | | | 2,310 | | |
| Commercial mortgage servicing rights | Commercial mortgage servicing rights | | 1,106 | | | 1,106 | | | | | 1,113 | | | 1,113 | | |
| Commercial mortgage servicing rights | |
| Commercial mortgage servicing rights | |
| Trading securities (b) | |
| Trading securities (b) | |
| Trading securities (b) | Trading securities (b) | 570 | | | 1,999 | | | 2,569 | | | | 798 | | | 1,168 | | | 1,966 | | |
| Financial derivatives (b) (c) | Financial derivatives (b) (c) | 2 | | | 3,212 | | | 6 | | | 3,220 | | | | 16 | | 3,747 | | | 5 | | | 3,768 | | |
| Financial derivatives (b) (c) | |
| Financial derivatives (b) (c) | |
| Other assets | |
| Other assets | |
| Other assets | Other assets | 387 | | | 65 | | | 452 | | | | 352 | | | 80 | | | 432 | | |
| Total assets (d) | Total assets (d) | $ | 8,640 | | | $ | 40,295 | | | $ | 6,987 | | | $ | 56,102 | | | | $ | 10,447 | | | $ | 41,240 | | | $ | 7,252 | | | $ | 59,135 | | |
| Total assets (d) | |
| Total assets (d) | |
| Liabilities | |
| Liabilities | |
| Liabilities | Liabilities | | | | |
| Other borrowed funds | Other borrowed funds | $ | 1,139 | | | $ | 100 | | | $ | 5 | | | $ | 1,244 | | | | $ | 1,230 | | | $ | 232 | | | $ | 4 | | | $ | 1,466 | | |
| Other borrowed funds | |
| Other borrowed funds | |
| Financial derivatives (c) (e) | |
| Financial derivatives (c) (e) | |
| Financial derivatives (c) (e) | Financial derivatives (c) (e) | 1 | | | 6,862 | | | 140 | | | 7,003 | | | | 4 | | | 7,491 | | | 123 | | | 7,618 | | |
| Other liabilities | Other liabilities | | 239 | | | 239 | | | | | 294 | | | 294 | | |
| Other liabilities | |
| Other liabilities | |
| Total liabilities (f) | Total liabilities (f) | $ | 1,140 | | | $ | 6,962 | | | $ | 384 | | | $ | 8,486 | | | | $ | 1,234 | | | $ | 7,723 | | | $ | 421 | | | $ | 9,378 | | |
| Total liabilities (f) | |
| Total liabilities (f) | |
(a)Certain investments that are measured at fair value using the net asset value per share (or its equivalent) practical expedient have not been classified in the fair value hierarchy.
(b)Included in Other assets on the Consolidated Balance Sheet.
(c)Amounts at June 30, 2023March 31, 2024 and December 31, 20222023 are presented gross and are not reduced by the impact of legally enforceable master netting agreements that allow us to net positive and negative positions and cash collateral held or placed with the same counterparty. See Note 12 Financial Derivatives for additional information related to derivative offsetting.
(d)Total assets at fair value as a percentage of total consolidated assets was 10% and 11% as of June 30, 2023at both March 31, 2024 and December 31, 2022, respectively.2023. Level 3 assets as a percentage of total assets at fair value was 12%13% at both June 30, 2023March 31, 2024 and December 31, 2022.2023. Level 3 assets as a percentage of total consolidated assets was 1% at both June 30, 2023March 31, 2024 and December 31, 2022.2023.
(e)Included in Other liabilities on the Consolidated Balance Sheet.
(f)Total liabilities at fair value as a percentage of total consolidated liabilities was 2%1% at both June 30, 2023March 31, 2024 and December 31, 2022.2023. Level 3 liabilities as a percentage of total liabilities at fair value was 5%4% and 4%6% at June 30, 2023March 31, 2024 and December 31, 2022,2023, respectively. Level 3 liabilities as a percentage of total consolidated liabilities was less than 1% at both June 30, 2023March 31, 2024 and December 31, 2022.2023.
The PNC Financial Services Group, Inc. – Form 10-Q 8169
Reconciliations of assets and liabilities measured at fair value on a recurring basis using Level 3 inputs for the three and six months ended June 30,March 31, 2024 and 2023 and 2022 are as follows:
Table 67:65: Reconciliation of Level 3 Assets and Liabilities
Three Months Ended June 30, 2023March 31, 2024
| | | |
| | | | | Total realized / unrealized
gains or losses for the
period (a) | | | | | | | Unrealized
gains / losses for the period
on assets and
liabilities held on
Consolidated
Balance Sheet at
June 30, 2023 (a) (c) | | Total realized / unrealized
gains or losses for the
period (a) | | | | | | | Unrealized
gains / losses for the period
on assets and
liabilities held on
Consolidated
Balance Sheet at
Mar. 31, 2024 (a) (c) |
Level 3 Instruments Only
In millions | Level 3 Instruments Only
In millions | Fair Value Mar. 31, 2023 | Included in
Earnings | Included
in Other
comprehensive
income (b) | Purchases | Sales | Issuances | Settlements | Transfers
into
Level 3 | | Transfers
out of
Level 3 | | | Fair
Value June 30, 2023 | Level 3 Instruments Only
In millions | Fair Value Dec. 31, 2023 | Included in
Earnings | Included
in Other
comprehensive
income (b) | Purchases | Sales | Issuances | Settlements | Transfers
into
Level 3 | | Transfers
out of
Level 3 | | | Fair
Value Mar. 31, 2024 |
| Assets | Assets | | | | | | | | Assets | | | | | | | | |
Residential mortgage
loans held for sale | Residential mortgage
loans held for sale | $ | 242 | | $ | (4) | | | | | $ | 3 | | $ | (41) | | | | $ | (2) | | | | | $ | (7) | | (e) | | $ | 191 | | $ | (3) | | | Residential mortgage
loans held for sale | $ | 103 | | $ | (1) | | | | | | | $ | 2 | | | | | | | | $ | (2) | | $ | 2 | | | $ | | $ | (6) | | (d) | (d) | | $ | 98 | | $ | (1) | | | |
Commercial mortgage
loans held for sale | Commercial mortgage
loans held for sale | 32 | | 1 | | | | | | | | | | | (8) | | | | | | | | 25 | | | | Commercial mortgage
loans held for sale | 11 | | | | | | | | | | | | | | | | | | | | | | | | | | | | | 11 | | | | | 11 | | | | | |
| | Securities available for sale | Securities available for sale | | | | | | | | | | | | | | | | | | |
| Securities available for sale | |
| Securities available for sale | |
Residential mortgage-
backed non-agency | |
Residential mortgage-
backed non-agency | |
Residential mortgage-
backed non-agency | Residential mortgage-
backed non-agency | 787 | | 4 | | | $ | 14 | | | | | | | | (37) | | | | | | | | 768 | | | | 696 | | 3 | 3 | | | $ | | $ | (6) | | | | | | | | | | | (25) | (25) | | | | | | | | | 668 | | | | | 668 | | | | | |
| Commercial mortgage- backed non-agency | Commercial mortgage- backed non-agency | 3 | | | | | | | | | | | | | | | | | | | | | 3 | | | | Commercial mortgage- backed non-agency | 103 | | | | | | | | | | | | | | | | | | | | | | | | | | | | | 103 | | | | | 103 | | | | | |
| Asset-backed | Asset-backed | 121 | | 1 | | | (1) | | | | | | | | (4) | | | | | | | | 117 | | | | Asset-backed | 102 | | | | | | | | | | | | | | | | | | | (2) | (2) | | | | | | | | | 100 | | | | | 100 | | | | | |
| Other | Other | 53 | | | | | | | 3 | | | | | | (2) | | | | | | | | 54 | | | | Other | 55 | | (2) | (2) | | | 1 | | 1 | | | | | | | | | | | (1) | (1) | | | | | | | | | 53 | | | | | 53 | | (2) | (2) | | | |
Total securities
available for sale | Total securities
available for sale | 964 | | 5 | | | 13 | | 3 | | | (43) | | | | | | | 942 | | | | Total securities
available for sale | 956 | | 1 | 1 | | | (5) | | (5) | | | | | | | (28) | | | (28) | | | | | | | | | 924 | | | | | 924 | | (2) | (2) | | | |
| Loans | Loans | 757 | | 3 | | | | | 11 | | (1) | | | | (28) | | $ | 8 | | | (5) | | (e) | | 745 | | 3 | | |
| Equity investments | Equity investments | 1,835 | | 24 | | | | | 92 | | (328) | | | | | | | | | | | | | 1,623 | | 2 | | |
| Equity investments | |
| Equity investments | | 1,952 | | (5) | | | | | 89 | | $ | (6) | | | | | | | | | | | | | 2,030 | | (5) | | |
Residential mortgage
servicing rights | Residential mortgage
servicing rights | 2,232 | | 81 | | | | | 91 | | | | $ | 5 | | (60) | | | | | | | | 2,349 | | 80 | | |
Commercial mortgage
servicing rights | |
Commercial mortgage
servicing rights | |
Commercial mortgage
servicing rights | Commercial mortgage
servicing rights | 1,061 | | 99 | | | | | 9 | | | | 19 | | (82) | | | | | | | | 1,106 | | 100 | | | 1,032 | | 107 | 107 | | | | | | | 12 | 12 | | | | | 3 | 3 | | (79) | (79) | | | | | | | | | 1,075 | | | | | 1,075 | | 107 | 107 | | | |
| | Financial derivatives | Financial derivatives | 19 | | (10) | | | | | 2 | | | | | | (5) | | | | | | | | 6 | | 4 | | |
| | Financial derivatives | |
| Financial derivatives | | 6 | | 9 | | | | | | | | | | | (6) | | | | | | | | 9 | | 9 | | |
| Other assets | | Other assets | 8 | | | | | | | | | | | | | | | | | 8 | | | |
| Total assets | Total assets | $ | 7,142 | | $ | 199 | | | $ | 13 | | $ | 211 | | $ | (370) | | $ | 24 | | $ | (228) | | $ | 8 | | | $ | (12) | | | | $ | 6,987 | | $ | 186 | | |
| Liabilities | |
| Liabilities | |
| Liabilities | Liabilities | | | | | | | | | | | | | | | | | | | | | | |
| Other borrowed funds | Other borrowed funds | $ | 5 | | | | $ | 3 | | $ | (3) | | | | | | | $ | 5 | | | | Other borrowed funds | $ | 9 | | | | | | | $ | | | | | | $ | 3 | | $ | (3) | | | | | | | $ | | | | | | $ | 9 | | | | | |
| Financial derivatives | Financial derivatives | 97 | | $ | 79 | | | | $ | 1 | | | | (37) | | | | | | | 140 | | $ | 80 | | | Financial derivatives | 152 | | $ | 8 | | | | | | | | | | | | | | (47) | (47) | | | | | | | 113 | | | | | | 113 | | $ | 9 | | | |
| Other liabilities | Other liabilities | 229 | | 31 | | | | | | | | 89 | | (110) | | | | | | | 239 | | 21 | | | Other liabilities | 237 | | (20) | (20) | | | | | | | | | | | | 13 | 13 | | (41) | (41) | | | | | | | 189 | | | | | | 189 | | 2 | 2 | | | |
| Total liabilities | Total liabilities | $ | 331 | | $ | 110 | | | | | $ | 1 | | $ | 92 | | $ | (150) | | | | | | $ | 384 | | $ | 101 | | | Total liabilities | $ | 398 | | $ | (12) | | | | | | | | | | | $ | 16 | | $ | (91) | | | | | | | $ | | | | | | $ | 311 | | $ | 11 | | | |
| Net gains (losses) | Net gains (losses) | | $ | 89 | | (f) | | | | | | | $ | 85 | | (g) | Net gains (losses) | | $ | 199 | | (e) | (e) | | | | | | | $ | 174 | | (f) | (f) |
8270 The PNC Financial Services Group, Inc. – Form 10-Q
(Continued from previous page)
Three Months Ended June 30, 2022March 31, 2023 | | | | | | | | | | | | | | | | | | | | | | | | | | | | | | | | | | | | | | | | | | | | |
| | | Total realized / unrealized
gains or losses for the
period (a) | | | | | | | | | Unrealized gains/losses on assets and liabilities held on Consolidated Balance Sheet at June 30, 2022 (a) (c) |
Level 3 Instruments Only
In millions | Fair Value Mar. 31, 2022 | Included in Earnings | Included in Other comprehensive income (b) | Purchases | Sales | Issuances | Settlements | Transfers into Level 3 | Transfers out of Level 3 | | Fair Value June 30, 2022 |
| Assets | | | | | | | | | | | | | | |
Residential mortgage
loans held for sale | $ | 108 | | $ | (1) | | | | $ | 8 | | $ | (30) | | | $ | (4) | | $ | 9 | | $ | (7) | | (e) | $ | 83 | | $ | (1) | | |
Commercial mortgage
loans held for sale | 45 | | | | | | | | | (7) | | | | | 38 | | | | |
| | | | | | | | | | | | | | |
| Securities available for sale | | | | | | | | | | | | | | |
Residential mortgage-
backed non-agency | 1,019 | | 7 | | | $ | (43) | | | | | (58) | | | | | 925 | | | |
| Commercial mortgage-backed non-agency | 3 | | | | | | | | | | | | | 3 | | | |
| Asset-backed | 152 | | 1 | | | (9) | | | | | (6) | | | | | 138 | | | |
| Other | 66 | | | | (1) | | 2 | | | | | | | | | | 67 | | | |
Total securities
available for sale | 1,240 | | 8 | | | (53) | | 2 | | | | | (64) | | | | | 1,133 | | | |
| Loans | 851 | | 10 | | | | 7 | | (1) | | | (48) | | | (15) | | (e) | 804 | | 9 | | |
| Equity investments | 1,751 | | 92 | | | | 87 | | (63) | | | | | | | 1,867 | | 94 | | |
Residential mortgage
servicing rights | 1,322 | | 163 | | | | 181 | | | $ | 17 | | (63) | | | | | 1,620 | | 163 | | |
Commercial mortgage
servicing rights | 886 | | 111 | | | | 17 | | | 14 | | (40) | | | | | 988 | | 111 | | |
| | | | | | | | | | | | | | |
| Financial derivatives | 10 | | 7 | | | | 2 | | | | (6) | | | | | 13 | | 13 | | |
| | | | | | | | | | | | | | |
| Total assets | $ | 6,213 | | $ | 390 | | | $ | (53) | | $ | 304 | | $ | (94) | | $ | 31 | | $ | (232) | | $ | 9 | | $ | (22) | | | $ | 6,546 | | $ | 389 | | |
| Liabilities | | | | | | | | | | | | | | |
| Other borrowed funds | $ | 3 | | | | | | | $ | 2 | | $ | (2) | | | | | $ | 3 | | | |
| Financial derivatives | 234 | | $ | 18 | | | | | $ | 3 | | | (42) | | | | | 213 | | $ | 19 | | |
| Other liabilities | 158 | | 14 | | | | | | 171 | | (161) | | | | | 182 | | 10 | | |
| Total liabilities | $ | 395 | | $ | 32 | | | | | $ | 3 | | $ | 173 | | $ | (205) | | | | | $ | 398 | | $ | 29 | | |
| Net gains (losses) | | $ | 358 | | (f) | | | | | | | | | | $ | 360 | | (g) |
The PNC Financial Services Group, Inc. – Form 10-Q 83
(Continued from previous page)
Six Months Ended June 30, 2023
| | | | | | | | | | | | | | | | | | | | | | | | | | | | | | | | | | | | | | | | | | | | |
| | | Total realized / unrealized
gains or losses for the
period (a) | | | | | | | | | Unrealized
gains / losses for the period
on assets and
liabilities held on
Consolidated
Balance Sheet at
June 30, 2023 (a) (c) |
Level 3 Instruments Only
In millions | Fair
Value
Dec. 31,
2022 | Included in
Earnings | Included
in Other
comprehensive
income (b) | Purchases | Sales | Issuances | Settlements | Transfers
into
Level 3 | Transfers
out of
Level 3 | | Fair
Value June 30, 2023 |
| Assets | | | | | | | | | | | | | | |
Residential mortgage
loans held for sale | $ | 243 | | | | | | $ | 9 | | $ | (42) | | | $ | (7) | | $ | 3 | | $ | (15) | | (e) | $ | 191 | | $ | 1 | | |
Commercial mortgage
loans held for sale | 33 | | | | | | | | | (8) | | | | | 25 | | | | |
| | | | | | | | | | | | | | |
| Securities available for sale | | | | | | | | | | | | | | |
Residential mortgage-
backed non-agency | 819 | | $ | 8 | | | $ | 4 | | | | | (63) | | | | | 768 | | | |
Commercial mortgage-
backed non-agency | 3 | | | | | | | | | | | | 3 | | | |
| Asset-backed | 124 | | 1 | | | | | | | | (8) | | | | | 117 | | | |
| Other | 55 | | | | (4) | | 3 | | | | (3) | | 3 | | | | 54 | | | |
Total securities
available for sale | 1,001 | | 9 | | | | | 3 | | | | (74) | | 3 | | | | 942 | | | |
| Loans | 769 | | 6 | | | | 20 | | (1) | | | (50) | | 15 | | (14) | | (e) | 745 | | 6 | | |
| Equity investments | 1,778 | | 145 | | | | 232 | | (398) | | | | | (134) | | (d) | 1,623 | | 119 | | |
Residential mortgage
servicing rights | 2,310 | | 33 | | | | 109 | | | $ | 10 | | (113) | | | | | 2,349 | | 33 | | |
Commercial mortgage
servicing rights | 1,113 | | 108 | | | | 17 | | | 32 | | (164) | | | | | 1,106 | | 108 | | |
| | | | | | | | | | | | | | |
| Financial derivatives | 5 | | 7 | | | | 3 | | | | (9) | | | | | 6 | | 10 | | |
| | | | | | | | | | | | | | |
| Total assets | $ | 7,252 | | $ | 308 | | | | | $ | 393 | | $ | (441) | | $ | 42 | | $ | (425) | | $ | 21 | | $ | (163) | | | $ | 6,987 | | $ | 277 | | |
| Liabilities | | | | | | | | | | | | | | |
| Other borrowed funds | $ | 4 | | | | | | | $ | 6 | | $ | (5) | | | | | $ | 5 | | | |
| Financial derivatives | 123 | | $ | 118 | | | | | $ | 3 | | | (104) | | | | | 140 | | $ | 122 | | |
| Other liabilities | 294 | | 55 | | | | | | | 107 | | (217) | | | | | 239 | | 42 | | |
| Total liabilities | $ | 421 | | $ | 173 | | | | | | $ | 3 | | $ | 113 | | $ | (326) | | | | | $ | 384 | | $ | 164 | | |
| Net gains (losses) | | $ | 135 | | (f) | | | | | | | | | | $ | 113 | | (g) |
84 The PNC Financial Services Group, Inc. – Form 10-Q
(Continued from previous page)
Six Months Ended June 30, 2022
| | | | | Total realized / unrealized
gains or losses for the
period (a) | | | | | Unrealized
gains / losses for the period
on assets and
liabilities held on
Consolidated
Balance Sheet at
June 30, 2022
(a) (c) | | | Total realized / unrealized
gains or losses for the
period (a) | | | | Unrealized gains/losses for the period on assets and liabilities held on Consolidated Balance Sheet at Mar. 31, 2023 (a) (c) |
Level 3 Instruments Only
In millions | Level 3 Instruments Only
In millions | Fair
Value
Dec. 31,
2021 | Included in
Earnings | Included
in Other
comprehensive
income (b) | Purchases | Sales | Issuances | Settlements | Transfers
into
Level 3 | Transfers
out of
Level 3 | | | Fair Value June 30, 2022 | Level 3 Instruments Only
In millions | Fair Value Dec. 31, 2022 | Included in Earnings | Included in Other comprehensive income (b) | Purchases | Sales | Issuances | Settlements | Transfers into Level 3 | Transfers out of Level 3 | | Fair Value Mar. 31, 2023 |
| Assets | Assets | | | | | | Assets | | | | | |
Residential mortgage
loans held for sale | Residential mortgage
loans held for sale | $ | 81 | | $ | (2) | | | $ | 45 | | $ | (32) | | | $ | (9) | | $ | 14 | | $ | (14) | | (e) | | $ | 83 | | $ | (2) | | |
Commercial mortgage
loans held for sale | Commercial mortgage
loans held for sale | 49 | | (4) | | | | | | (7) | | | | 38 | | (4) | | |
| Other consumer loans held for sale | | | | | | | |
Commercial mortgage
loans held for sale | |
Commercial mortgage
loans held for sale | |
| | Securities available for sale | |
| | Securities available for sale | |
| | Securities available for sale | Securities available for sale | | | | |
Residential mortgage-
backed non-agency | Residential mortgage-
backed non-agency | 1,097 | | 15 | | | $ | (66) | | | (121) | | | | 925 | | | |
Commercial mortgage-
backed non-agency | 3 | | | | | | | 3 | | | |
Residential mortgage-
backed non-agency | |
Residential mortgage-
backed non-agency | |
| Commercial mortgage-backed non-agency | |
| Commercial mortgage-backed non-agency | |
| Commercial mortgage-backed non-agency | |
| Asset-backed | |
| Asset-backed | |
| Asset-backed | Asset-backed | 163 | | 1 | | | (13) | | | (13) | | | | 138 | | | |
| Other | Other | 69 | | | (2) | | 3 | | | | | (3) | | | | 67 | | | |
| Other | |
| Other | |
Total securities
available for sale | |
Total securities
available for sale | |
Total securities
available for sale | Total securities
available for sale | 1,332 | | 16 | | | (81) | | 3 | | | | | (137) | | | | 1,133 | | | |
| Loans | Loans | 884 | | 21 | | | 20 | | (8) | | | (97) | | | (16) | | (e) | | 804 | | 21 | | |
| Loans | |
| Loans | |
| Equity investments | |
| Equity investments | |
| Equity investments | Equity investments | 1,680 | | 145 | | | 116 | | (74) | | | | 1,867 | | 146 | | |
Residential mortgage
servicing rights | Residential mortgage
servicing rights | 1,078 | | 370 | | | 257 | | | $ | 38 | | (123) | | | | 1,620 | | 371 | | |
Residential mortgage
servicing rights | |
Residential mortgage
servicing rights | |
Commercial mortgage
servicing rights | |
Commercial mortgage
servicing rights | |
Commercial mortgage
servicing rights | Commercial mortgage
servicing rights | 740 | | 262 | | | 25 | | | 35 | | (74) | | | | 988 | | 262 | | |
| | Financial derivatives | Financial derivatives | 38 | | (6) | | | 3 | | | (22) | | | | 13 | | 12 | | |
| | Financial derivatives | |
| | Financial derivatives | |
| | Total assets | |
| | Total assets | |
| | Total assets | Total assets | $ | 5,882 | | $ | 802 | | | $ | (81) | | $ | 469 | | $ | (114) | | $ | 73 | | $ | (469) | | $ | 14 | | $ | (30) | | | | $ | 6,546 | | $ | 806 | | |
| Liabilities | Liabilities | | | | |
| Liabilities | |
| Liabilities | |
| Other borrowed funds | |
| Other borrowed funds | |
| Other borrowed funds | Other borrowed funds | $ | 3 | | | $ | 4 | | $ | (4) | | | | $ | 3 | | | |
| Financial derivatives | Financial derivatives | 285 | | $ | 23 | | | $ | 6 | | | (101) | | | | 213 | | $ | 18 | | |
| Financial derivatives | |
| Financial derivatives | |
| Other liabilities | |
| Other liabilities | |
| Other liabilities | Other liabilities | 175 | | 21 | | | 242 | | (256) | | | | 182 | | 15 | | |
| Total liabilities | Total liabilities | $ | 463 | | $ | 44 | | | $ | 6 | | $ | 246 | | $ | (361) | | | | $ | 398 | | $ | 33 | | |
| Total liabilities | |
| Total liabilities | |
| Net gains (losses) | Net gains (losses) | | $ | 758 | | (f) | | | | $ | 773 | | (g) |
| Net gains (losses) | |
| Net gains (losses) | | | $ | 46 | | (e) | | | | | | | | | | $ | 40 | | (f) |
(a)Losses for assets are bracketed while losses for liabilities are not.
(b)The difference in unrealized gains and losses for the period included in Other comprehensive income and changes in unrealized gains and losses for the period included in Other comprehensive income for securities available for sale held at the end of the reporting period were insignificant.
(c)The amount of the total gains or losses for the period included in earnings that is attributable to the change in unrealized gains or losses related to those assets and liabilities held at the end of the reporting period.
(d)Transfers out of Level 3 during the current period were due to valuation methodology changes for certain private company investments. See Note 1 Accounting Policies in our 2022 Form 10-K for more information on our accounting for private company investments.
(e)Residential mortgage loan transfers out of Level 3 are primarily driven by residential mortgage loans transferring to OREO as well as reclassification of mortgage loans held for sale to held for investment.
(f)(e)Net gains (losses) realized and unrealized included in earnings related to Level 3 assets and liabilities included amortization and accretion. The amortization and accretion amounts were included in Interest income on the Consolidated Income Statement and the remaining net gains (losses) realized and unrealized were included in Noninterest income on the Consolidated Income Statement.
(g)(f)Net unrealized gains (losses) related to assets and liabilities held at the end of the reporting period were included in Noninterest income on the Consolidated Income Statement.
An instrument’s categorization withinTransfers out of Level 3 during the hierarchy is basedprior period were due to valuation methodology changes for certain private company investments. See Note 1 Accounting Policies in our 2023 Form 10-K for more information on the lowest level of input that is significant to the fair value measurement. Changes from one quarter to the next related to the observability of inputs to a fair value measurement may result in a reclassification (transfer) of assets or liabilities between hierarchy levels.
The PNC Financial Services Group, Inc. – Form 10-Q 8571
Quantitative information about the significant unobservable inputs within Level 3 recurring assets and liabilities follows:
Table 68:66: Fair Value Measurements – Recurring Quantitative Information
June 30, 2023March 31, 2024
| | | | | | | | | | | | | | |
Level 3 Instruments Only
Dollars in millions | Fair Value | Valuation Techniques | Unobservable Inputs | Range (Weighted-Average) (a) |
| Commercial mortgage loans held for sale | $ | 2511 | | Discounted cash flow | Spread over the benchmark curve (b) | 590bps580bps - 2,440bps (1,275bps)7,155bps (2,649bps) |
Residential mortgage-backed
non-agency securities | 768668 | | Priced by a third-party vendor using a discounted cash flow pricing model | Constant prepayment rate | 1.0% - 27.9% (4.7%(2.9%) |
| Constant default rate | 0.0% - 12.0% (3.0%(1.9%) |
| Loss severity | 15.0%10.0% - 83.3% (45.5%70.0% (42.3%) |
| Spread over the benchmark curve (b) | 231bps268bps weighted-average |
| Asset-backed securities | 117100 | | Priced by a third-party vendor using a discounted cash flow pricing model | Constant prepayment rate | 1.0% - 40.0% (6.1%28.0% (4.1%) |
| Constant default rate | 0.0% - 7.3% (2.0%8.1% (1.6%) |
| Loss severity | 30.0% - 100.0% (50.6%(49.7%) |
| Spread over the benchmark curve (b) | 285bps227bps weighted-average |
| Loans - Residential real estate - Uninsured | 556539 | | Consensus pricing (c) | Cumulative default rate | 3.6% - 100.0% (61.0%(58.2%) |
| Loss severity | 0.0% - 100.0% (5.7%(5.3%) |
| Discount rate | 5.5% - 7.5% (5.8%) |
| Loans - Residential real estate | 7673 | | Discounted cash flow | Loss severity | 6.0% weighted-average |
| Discount rate | 8.4%8.0% weighted-average |
| Loans - Home equity - First-lien | 2117 | | Consensus pricing (c) | Cumulative default rate | 3.6% -100.0% (68.2%- 100.0% (60.7%) |
| Loss severity | 0.0% - 100.0% (15.9%(13.8%) |
| Discount rate | 5.5% - 7.5% (6.3%(6.1%) |
| Loans - Home equity | 9284 | | Consensus pricing (c) | Credit and liquidity discount | 0.4%0.3% - 100.0% (45.0%(43.7%) |
| Equity investments | 1,6232,030 | | Multiple of adjusted earnings | Multiple of earnings | 4.5x5.5x - 20.0x (9.3x)27.0x (10.4x) |
| Residential mortgage servicing rights | 2,3492,687 | | Discounted cash flow | Constant prepayment rate | 0.0% - 41.9% (6.9%40.1% (6.3%) |
| Spread over the benchmark curve (b) | 254bps337bps - 1,652bps (767bps)1,648bps (766bps) |
| Commercial mortgage servicing rights | 1,1061,075 | | Discounted cash flow | Constant prepayment rate | 4.0%5.0% - 11.1% (4.4%8.6% (5.2%) |
| Discount rate | 6.7%8.0% - 10.3% (9.9%) |
Financial derivatives - Swaps related to
sales of certain Visa Class BB-1
common shares | (131)(106) | | Discounted cash flow | Estimated conversion factor of Visa Class BB-1 shares into Class A shares | 159.0%1.59 weighted-average |
| Estimated annual growth rate of Visa Class A share price | 16.0% |
| Estimated litigation resolution date | Q4 2023Q3 2024 |
Insignificant Level 3 assets, net of
liabilities (d) | 166 | | | | |
| Total Level 3 assets, net of liabilities (e) | $ | 6,6037,244 | | | | |
8672 The PNC Financial Services Group, Inc. – Form 10-Q
(Continued from previous page)
December 31, 20222023
| | | | | | | | | | | | | | |
Level 3 Instruments Only
Dollars in millions | Fair Value | Valuation Techniques | Unobservable Inputs | Range (Weighted-Average) (a) |
| Commercial mortgage loans held for sale | $ | 3311 | | Discounted cash flow | Spread over the benchmark curve (b) | 585bps575bps - 2,465bps (959bps)3,610bps (1,647bps) |
Residential mortgage-backed
non-agency securities | 819696 | | Priced by a third-party vendor using a discounted cash flow pricing model | Constant prepayment rate | 1.0% - 27.9% (9.9%(3.7%) |
| Constant default rate | 0.0% - 13.0% (4.0%12.0% (2.7%) |
| Loss severity | 15.0%10.0% - 80.0% (46.1%69.0% (41.2%) |
| Spread over the benchmark curve (b) | 289bps285bps weighted-average |
| Asset-backed securities | 124102 | | Priced by a third-party vendor using a discounted cash flow pricing model | Constant prepayment rate | 1.0% - 40.0% (7.5%28.0% (5.1%) |
| Constant default rate | 0.0% - 7.3% (2.1%4.3% (1.7%) |
| Loss severity | 20.0% - 100.0% (49.0%(49.5%) |
| Spread over the benchmark curve (b) | 296bps248bps weighted-average |
| Loans - Residential real estate - Uninsured | 570546 | | Consensus pricing (c) | Cumulative default rate | 3.6% - 100.0% (66.2%(59.1%) |
| Loss severity | 0.0% - 100.0% (6.2%(5.4%) |
| Discount rate | 5.5% - 7.5% (5.9%(5.8%) |
| Loans - Residential real estate | 7675 | | Discounted cash flow | Loss severity | 6.0% weighted-average |
| Discount rate | 7.9%7.8% weighted-average |
| Loans - Home equity - First-lien | 2518 | | Consensus pricing (c) | Cumulative default rate | 3.6% - 100.0% (72.5%(60.9%) |
| Loss severity | 0.0% - 100.0% (15.3%(14.4%) |
| Discount rate | 5.5% - 7.5% (6.5%(6.2%) |
| Loans - Home equity | 9887 | | Consensus pricing (c) | Credit and Liquidity discount | 0.4%0.3% - 100.0% (46.2%(43.8%) |
| Equity investments | 1,7781,952 | | Multiple of adjusted earnings | Multiple of earnings | 4.5x - 25.0x (9.1x)26.7x (10.1x) |
| Residential mortgage servicing rights | 2,3102,654 | | Discounted cash flow | Constant prepayment rate | 0.0% - 34.5% (6.7%33.6% (6.4%) |
| Spread over the benchmark curve (b) | 254bps337bps - 1,653bps (766bps)1,668bps (765bps) |
| Commercial mortgage servicing rights | 1,1131,032 | | Discounted cash flow | Constant prepayment rate | 3.9%5.3% - 9.8% (4.3%9.7% (5.5%) |
| Discount rate | 7.8%7.6% - 10.1% (9.8%10.0% (9.6%) |
| | | |
| | | | |
Financial derivatives - Swaps related to
sales of certain Visa Class BB-1
common shares | (107)(145) | | Discounted cash flow | Estimated conversion factor of Visa Class BB-1 shares into Class A shares | 160.6%1.59 weighted-average |
| Estimated annual growth rate of Visa Class A share price | 16.0% |
| Estimated litigation resolution date | Q2 2023Q3 2024 |
Insignificant Level 3 assets, net of
liabilities (d) | (8)22 | | | | |
| Total Level 3 assets, net of liabilities (e) | $ | 6,8317,050 | | | | |
(a)Unobservable inputs were weighted by the relative fair value of the instruments.
(b)The assumed yield spread over the benchmark curve for each instrument is generally intended to incorporate non-interest rate risks, such as credit and liquidity risks.
(c)Consensus pricing refers to fair value estimates that are generally internally developed using information such as dealer quotes or other third-party provided valuations or comparable asset prices.
(d)Represents the aggregate amount of Level 3 assets and liabilities measured at fair value on a recurring basis that are individually and in the aggregate insignificant. The amount includes certain financial derivative assets and liabilities, trading securities, other securities, residential mortgage loans held for sale, other assets, other borrowed funds and other liabilities.
(e)Consisted of total Level 3 assets of $7.0$7.6 billion and total Level 3 liabilities of $0.4$0.3 billion as of June 30, 2023March 31, 2024 and $7.3$7.4 billion and $0.4 billion as of December 31, 2022,2023, respectively.
Financial Assets Accounted for at Fair Value on a Nonrecurring Basis
We may be required to measure certain financial assets at fair value on a nonrecurring basis. These adjustments to fair value usually result from the application of lower of amortized cost or fair value accounting or write-downs of individual assets due to impairment and are included in Table 69.67. For more information regarding the valuation methodologies of our financial assets measured at fair value on a nonrecurring basis, see Note 1514 Fair Value in our 20222023 Form 10-K.
The PNC Financial Services Group, Inc. – Form 10-Q 8773
Assets measured at fair value on a nonrecurring basis follow:
Table 69:67: Fair Value Measurements – Nonrecurring (a) (b) (c)
| | | |
| | | | Fair Value | | Gains (Losses)
Three months ended | | Gains (Losses)
Six months ended | |
| In millions | In millions | June 30
2023 | | December 31
2022 | | June 30
2023 | | June 30
2022 | | June 30
2023 | | June 30
2022 | |
| In millions | |
| In millions | |
| Assets | |
| Assets | |
| Assets | Assets | | | | |
| Nonaccrual loans | Nonaccrual loans | $ | 373 | | | $ | 280 | | | $ | (99) | | | $ | (19) | | | $ | (174) | | | $ | (28) | | |
| Nonaccrual loans | |
| Nonaccrual loans | |
| Equity investments | |
| Equity investments | |
| Equity investments | Equity investments | 87 | | | 135 | | | (5) | | | 1 | | | (8) | | | |
| | OREO and foreclosed assets | OREO and foreclosed assets | 8 | | | 10 | | | (1) | | | |
| | OREO and foreclosed assets | |
| | OREO and foreclosed assets | |
| Long-lived assets | |
| Long-lived assets | |
| Long-lived assets | Long-lived assets | 435 | | | 23 | | | (10) | | | (3) | | | (15) | | | (5) | | |
| Total assets | Total assets | $ | 903 | | | $ | 448 | | | $ | (114) | | | $ | (21) | | | $ | (198) | | | $ | (33) | | |
| Total assets | |
| Total assets | |
(a)All Level 3 for the periods presented, except for $22 million and $42$30 million included in Equity investments which werewas categorized as Level 1 as of June 30, 2023 and December 31, 2022, respectively.2023.
(b)Valuation techniques applied were fair value of property or collateral.
(c)Unobservable inputs used were appraised value/sales price, broker opinions or projected income/required improvement costs. Additional quantitative information was not meaningful for the periods presented.
Financial Instruments Accounted for under Fair Value Option
We elect the fair value option to account for certain financial instruments. For more information on these financial instruments for which the fair value option election has been made, see Note 1514 Fair Value in our 20222023 Form 10-K.
Fair values and aggregate unpaid principal balances of items for which we elected the fair value option are as follows:
Table 70:68: Fair Value Option – Fair Value and Principal Balances
| | March 31, 2024 | |
| In millions | |
| In millions | |
| In millions | |
| Assets | |
| Assets | |
| Assets | |
| Residential mortgage loans held for sale | |
| Residential mortgage loans held for sale | |
| Residential mortgage loans held for sale | |
| Accruing loans less than 90 days past due | |
| Accruing loans less than 90 days past due | |
| Accruing loans less than 90 days past due | |
| Accruing loans 90 days or more past due | |
| Accruing loans 90 days or more past due | |
| Accruing loans 90 days or more past due | |
| Nonaccrual loans | |
| Nonaccrual loans | |
| Nonaccrual loans | |
| Total | |
| Total | |
| Total | |
| Commercial mortgage loans held for sale (a) (b) | |
| Commercial mortgage loans held for sale (a) (b) | |
| Commercial mortgage loans held for sale (a) (b) | |
| Accruing loans less than 90 days past due | |
| Accruing loans less than 90 days past due | |
| Accruing loans less than 90 days past due | |
| | | June 30, 2023 | | December 31, 2022 | |
| In millions | Fair Value | | Aggregate Unpaid
Principal Balance | | Difference | | Fair Value | | Aggregate Unpaid
Principal Balance | | Difference | |
| Assets | | | | |
| Residential mortgage loans held for sale | | | | |
| Loans | |
| | Loans | |
| | Loans | |
| Accruing loans less than 90 days past due | |
| Accruing loans less than 90 days past due | |
| Accruing loans less than 90 days past due | Accruing loans less than 90 days past due | $ | 651 | | | $ | 671 | | | $ | (20) | | | $ | 609 | | | $ | 633 | | | $ | (24) | | |
| Accruing loans 90 days or more past due | Accruing loans 90 days or more past due | 2 | | | 2 | | | 5 | | | 5 | | | |
| Accruing loans 90 days or more past due | |
| Accruing loans 90 days or more past due | |
| Nonaccrual loans | |
| Nonaccrual loans | |
| Nonaccrual loans | Nonaccrual loans | 33 | | | 40 | | | (7) | | | 40 | | | 49 | | | (9) | | |
| Total | Total | $ | 686 | | | $ | 713 | | | $ | (27) | | | $ | 654 | | | $ | 687 | | | $ | (33) | | |
| Commercial mortgage loans held for sale (a) | | | | |
| Accruing loans less than 90 days past due | $ | 49 | | | $ | 51 | | | $ | (2) | | | $ | 261 | | | $ | 256 | | | $ | 5 | | |
| Nonaccrual loans | 15 | | 44 | | (29) | | | 15 | | | 44 | | | (29) | | |
| Total | Total | $ | 64 | | | $ | 95 | | | $ | (31) | | | $ | 276 | | | $ | 300 | | | $ | (24) | | |
| Loans | | | | |
| Accruing loans less than 90 days past due | $ | 510 | | | $ | 523 | | | $ | (13) | | | $ | 509 | | | $ | 521 | | | $ | (12) | | |
| Accruing loans 90 days or more past due | 132 | | | 143 | | | (11) | | | 155 | | | 167 | | | (12) | | |
| Nonaccrual loans | 617 | | | 841 | | | (224) | | | 646 | | | 880 | | | (234) | | |
| Total | Total | $ | 1,259 | | | $ | 1,507 | | | $ | (248) | | | $ | 1,310 | | | $ | 1,568 | | | $ | (258) | | |
| Other assets | Other assets | $ | 64 | | | $ | 65 | | | $ | (1) | | | $ | 80 | | | $ | 80 | | | |
| Other assets | |
| Other assets | |
| Liabilities | |
| Liabilities | |
| Liabilities | Liabilities | | | | |
| Other borrowed funds | Other borrowed funds | $ | 32 | | | $ | 33 | | | $ | (1) | | | $ | 31 | | | $ | 32 | | | $ | (1) | | |
| Other borrowed funds | |
| Other borrowed funds | |
| Other liabilities | Other liabilities | $ | 127 | | | $ | 127 | | | $ | 196 | | | $ | 196 | | |
| Other liabilities | |
| Other liabilities | |
(a)There were no accruing loans 90 days or more past due within this category at June 30, 2023March 31, 2024 or December 31, 2022.2023.
(b)There were no nonaccrual loans within this category at March 31, 2024 or December 31, 2023.
8874 The PNC Financial Services Group, Inc. – Form 10-Q
The changes in fair value for items for which we elected the fair value option are as follows:
Table 71:69: Fair Value Option – Changes in Fair Value (a)
| | Gains (Losses) | |
| Gains (Losses) | |
| Gains (Losses) | |
| | | Gains (Losses) | | Gains (Losses) | |
| | | Three months ended | | Six months ended | |
| June 30 | | June 30 | | June 30 | | June 30 | |
| March 31 | |
| March 31 | |
| March 31 | |
| In millions | |
| In millions | |
| In millions | In millions | 2023 | | 2022 | | 2023 | | 2022 | |
| Assets | Assets | | | | |
| Assets | |
| Assets | |
| Residential mortgage loans held for sale | |
| Residential mortgage loans held for sale | |
| Residential mortgage loans held for sale | Residential mortgage loans held for sale | $ | 2 | | | $ | (23) | | | $ | 17 | | | $ | (63) | | |
| Commercial mortgage loans held for sale | Commercial mortgage loans held for sale | $ | 22 | | | $ | 14 | | | $ | 23 | | | $ | 20 | | |
| Commercial mortgage loans held for sale | |
| Commercial mortgage loans held for sale | |
| Loans | |
| Loans | |
| Loans | Loans | $ | 5 | | | $ | 15 | | | $ | 9 | | | $ | 36 | | |
| Other assets | Other assets | $ | 2 | | | $ | (11) | | | $ | (12) | | | $ | (18) | | |
| Other assets | |
| Other assets | |
| Liabilities | |
| Liabilities | |
| Liabilities | Liabilities | | | | |
| Other liabilities | Other liabilities | $ | (21) | | | $ | (10) | | | $ | (41) | | | $ | (16) | | |
| Other liabilities | |
| Other liabilities | |
(a)The impact on earnings of offsetting hedged items or hedging instruments is not reflected in these amounts.
Additional Fair Value Information Related to Financial Instruments Not Recorded at Fair Value
The following table presents the carrying amounts and estimated fair values, as well as the level within the fair value hierarchy, of all other financial instruments that are not recorded on our Consolidated Balance Sheet at fair value as of June 30, 2023March 31, 2024 and December 31, 2022.2023. For more information regarding the methods and assumptions used to estimate the fair values of financial instruments included in Table 72,70, see Note 1514 Fair Value in our 20222023 Form 10-K.
Table 72:70: Additional Fair Value Information Related to Other Financial Instruments | | | | Carrying | | Fair Value | |
| In millions | In millions | Amount | | Total | | Level 1 | | Level 2 | | Level 3 | |
| June 30, 2023 | | |
| In millions | |
| In millions | |
| March 31, 2024 | |
| March 31, 2024 | |
| March 31, 2024 | |
| Assets | |
| Assets | |
| Assets | Assets | | |
| Cash and due from banks | Cash and due from banks | $ | 6,191 | | | $ | 6,191 | | | $ | 6,191 | | | |
| Cash and due from banks | |
| Cash and due from banks | |
| Interest-earning deposits with banks | |
| Interest-earning deposits with banks | |
| Interest-earning deposits with banks | Interest-earning deposits with banks | 38,259 | | | 38,259 | | | $ | 38,259 | | | |
| Securities held to maturity | Securities held to maturity | 93,879 | | | 88,896 | | | 30,939 | | | 57,808 | | | $ | 149 | | |
| Securities held to maturity | |
| Securities held to maturity | |
| Net loans (excludes leases) | |
| Net loans (excludes leases) | |
| Net loans (excludes leases) | Net loans (excludes leases) | 309,365 | | | 301,597 | | | 301,597 | | |
| Other assets | Other assets | 5,971 | | | 5,971 | | | 5,958 | | | 13 | | |
| Other assets | |
| Other assets | |
| Total assets | |
| Total assets | |
| Total assets | Total assets | $ | 453,665 | | | $ | 440,914 | | | $ | 37,130 | | | $ | 102,025 | | | $ | 301,759 | | |
| Liabilities | Liabilities | | |
| Liabilities | |
| Liabilities | |
| Time deposits | |
| Time deposits | |
| Time deposits | Time deposits | $ | 22,864 | | | $ | 22,696 | | | $ | 22,696 | | | |
| Borrowed funds | Borrowed funds | 64,060 | | | 64,278 | | | 62,441 | | | $ | 1,837 | | |
| Borrowed funds | |
| Borrowed funds | |
| Unfunded lending related commitments | |
| Unfunded lending related commitments | |
| Unfunded lending related commitments | Unfunded lending related commitments | 663 | | | 663 | | | 663 | | |
| Other liabilities | Other liabilities | 948 | | | 948 | | | 948 | | | |
| Other liabilities | |
| Other liabilities | |
| Total liabilities | Total liabilities | $ | 88,535 | | | $ | 88,585 | | | | | $ | 86,085 | | | $ | 2,500 | | |
| December 31, 2022 | | |
| Total liabilities | |
| Total liabilities | |
| December 31, 2023 | |
| December 31, 2023 | |
| December 31, 2023 | |
| Assets | |
| Assets | |
| Assets | Assets | | |
| Cash and due from banks | Cash and due from banks | $ | 7,043 | | | $ | 7,043 | | | $ | 7,043 | | | |
| Cash and due from banks | |
| Cash and due from banks | |
| Interest-earning deposits with banks | |
| Interest-earning deposits with banks | |
| Interest-earning deposits with banks | Interest-earning deposits with banks | 27,320 | | | 27,320 | | | $ | 27,320 | | | |
| Securities held to maturity | Securities held to maturity | 95,183 | | | 90,279 | | | 30,748 | | | 59,377 | | | $ | 154 | | |
| Securities held to maturity | |
| Securities held to maturity | |
| Net loans (excludes leases) | |
| Net loans (excludes leases) | |
| Net loans (excludes leases) | Net loans (excludes leases) | 313,460 | | | 310,864 | | | 310,864 | | |
| Other assets | Other assets | 6,022 | | | 6,022 | | | 6,020 | | | 2 | | |
| Other assets | |
| Other assets | |
| Total assets | |
| Total assets | |
| Total assets | Total assets | $ | 449,028 | | | $ | 441,528 | | | $ | 37,791 | | | $ | 92,717 | | | $ | 311,020 | | |
| Liabilities | Liabilities | | |
| Liabilities | |
| Liabilities | |
| Time deposits | |
| Time deposits | |
| Time deposits | Time deposits | $ | 18,470 | | | $ | 18,298 | | | $ | 18,298 | | | |
| Borrowed funds | Borrowed funds | 57,182 | | | 57,557 | | | 55,922 | | | $ | 1,635 | | |
| Borrowed funds | |
| Borrowed funds | |
| Unfunded lending related commitments | |
| Unfunded lending related commitments | |
| Unfunded lending related commitments | Unfunded lending related commitments | 694 | | | 694 | | | 694 | | |
| Other liabilities | Other liabilities | 660 | | | 660 | | | 660 | | | |
| Other liabilities | |
| Other liabilities | |
| Total liabilities | Total liabilities | $ | 77,006 | | | $ | 77,209 | | | $ | 74,880 | | | $ | 2,329 | | |
| Total liabilities | |
| Total liabilities | |
The PNC Financial Services Group, Inc. – Form 10-Q 8975
The aggregate fair values in Table 7270 represent only a portion of the total market value of our assets and liabilities as, in accordance with the guidance related to fair values about financial instruments, we exclude the following:
•financial instruments recorded at fair value on a recurring basis (as they are disclosed in Table 66)64),
•investments accounted for under the equity method,
•equity securities without a readily determinable fair value that apply for the alternative measurement approach to fair value under ASU 2016-01,
•real and personal property,
•lease financing,
•loan customer relationships,
•deposit customer intangibles,
•MSRs,
•retail branch networks,
•fee-based businesses, such as asset management and brokerage,
•trademarks and brand names,
•trade receivables and payables due in one year or less,
•deposit liabilities with no defined or contractual maturities under ASU 2016-01, and
•insurance contracts.
NOTE 12 FINANCIAL DERIVATIVES
We use a variety of financial derivatives to both mitigate exposure to market (primarily interest rate) and credit risks inherent in our business activities, as well as to facilitate customer risk management activities. We manage these risks as part of our overall asset and liability management process and through our credit policies and procedures. Derivatives represent contracts between parties that usually require little or no initial net investment and result in one party delivering cash or another type of asset to the other party based on a notional amount and an underlying as specified in the contract.
Derivative transactions are often measured in terms of notional amount, but this amount is generally not exchanged and it is not recorded on the balance sheet. The notional amount is the basis to which the underlying is applied to determine required payments under the derivative contract. The underlying is a referenced interest rate, security price, credit spread or other index. Residential and commercial real estate loan commitments associated with loans to be sold also qualify as derivative instruments.
For more information regarding derivatives, see Note 1 Accounting Policies and Note 1615 Financial Derivatives in our 20222023 Form 10-K.
9076 The PNC Financial Services Group, Inc. – Form 10-Q
Table 73
The following tables presents the notional and gross fair value amounts of all derivative assets and liabilities held by us.
During the second quarter, in anticipation of LIBOR’s cessation on June 30, 2023, LIBOR-indexed interest-rate swap contracts with central clearing counterparties were subject to a conversion process whereby an individual LIBOR swap contract was exchanged for a SOFR replacement swap contract, along with one or more overlay swap contracts replicating the final LIBOR cash flows on the original swap contract. The swap contracts exchanged were substantially economically equivalent. Conversion-related valuation differences were settled in cash on the conversion dates and were not material. The SOFR replacement and overlay swaps are considered separate contracts, and the overlay swaps will result in a gross-up of the notional amounts presented until those swaps mature upon settlement of the final LIBOR payment. The majority of overlay swaps will mature in the third quarter of 2023.us:
Table 73:71: Total Gross Derivatives (a)
| | | | June 30, 2023 | December 31, 2022 | | March 31, 2024 | December 31, 2023 |
| In millions | In millions | Notional /
Contract Amount | Asset Fair
Value (b) | Liability Fair
Value (c) | Notional /
Contract Amount | Asset Fair
Value (b) | Liability Fair
Value (c) | In millions | Notional /
Contract Amount | Asset Fair
Value (b) | Liability Fair
Value (c) | Notional /
Contract Amount | Asset Fair
Value (b) | Liability Fair
Value (c) |
| Derivatives used for hedging | Derivatives used for hedging | | | | |
| Interest rate contracts (d): | | | | |
| Fair value hedges (e) | $ | 48,088 | | | $ | 24,231 | | | |
| Cash flow hedges (e) | 86,922 | | | $ | 3 | | 40,310 | | | $ | 1 | |
| Interest rate contracts: | |
| Interest rate contracts: | |
| Interest rate contracts: | |
| Fair value hedges (d) | |
| Fair value hedges (d) | |
| Fair value hedges (d) | |
| Cash flow hedges (d) | |
| Cash flow hedges (d) | |
| Cash flow hedges (d) | | 36,499 | | | | | 33,302 | | | |
| Cash flow hedges - other (e) | |
| Foreign exchange contracts: | Foreign exchange contracts: | | | | |
| Net investment hedges | |
| Net investment hedges | |
| Net investment hedges | Net investment hedges | 1,101 | | | 22 | | 1,120 | | $ | 24 | | | |
| Total derivatives designated for hedging | Total derivatives designated for hedging | $ | 136,111 | | | | $ | 25 | | $ | 65,661 | | $ | 24 | | $ | 1 | |
| Derivatives not used for hedging | Derivatives not used for hedging | | | | |
| Derivatives used for mortgage banking activities (f): | Derivatives used for mortgage banking activities (f): | | | | |
| Derivatives used for mortgage banking activities (f): | |
| Derivatives used for mortgage banking activities (f): | |
| Interest rate contracts: | |
| Interest rate contracts: | |
| Interest rate contracts: | Interest rate contracts: | | | | |
Swaps (g) | Swaps (g) | $ | 73,477 | | | $ | 1 | | $ | 47,908 | | $ | 7 | | $ | 1 | |
Swaps (g) | |
Swaps (g) | |
Futures (h)(g) | Futures (h)(g) | 8,026 | | | 5,537 | | | |
| Mortgage-backed commitments | |
| Mortgage-backed commitments | |
| Mortgage-backed commitments | Mortgage-backed commitments | 5,277 | | $ | 68 | | 63 | | 4,516 | | 85 | | 89 | |
| Other | Other | 12,561 | | 65 | | 12 | | 18,017 | | 90 | | 14 | |
| Total interest rate contracts | Total interest rate contracts | 99,341 | | 133 | | 76 | | 75,978 | | 182 | | 104 | |
| Derivatives used for customer-related activities: | Derivatives used for customer-related activities: | | | | |
| Interest rate contracts: | Interest rate contracts: | | | | |
| Swaps (g) | 811,705 | | 1,798 | | 5,501 | | 354,150 | | 1,597 | | 5,397 | |
| Interest rate contracts: | |
| Interest rate contracts: | |
| Swaps | |
| Swaps | |
| Swaps | |
Futures (h)(g) | Futures (h)(g) | 72 | | | 32 | | | |
| Mortgage-backed commitments | |
| Mortgage-backed commitments | |
| Mortgage-backed commitments | Mortgage-backed commitments | 3,531 | | 11 | | 5 | | 2,799 | | 10 | | 6 | |
| Other | Other | 28,779 | | 314 | | 292 | | 29,071 | | 334 | | 321 | |
| Total interest rate contracts | Total interest rate contracts | 844,087 | | 2,123 | | 5,798 | | 386,052 | | 1,941 | | 5,724 | |
| Commodity contracts: | Commodity contracts: | | | | |
| Swaps | |
| Swaps | |
| Swaps | Swaps | 6,084 | | 525 | | 552 | | 5,792 | | 1,003 | | 1,067 | |
| Other | Other | 3,251 | | 97 | | 97 | | 4,488 | | 205 | | 202 | |
| Total commodity contracts | Total commodity contracts | 9,335 | | 622 | | 649 | | 10,280 | | 1,208 | | 1,269 | |
| Foreign exchange contracts and other | Foreign exchange contracts and other | 30,426 | | 308 | | 256 | | 30,512 | | 366 | | 293 | |
| Total derivatives for customer-related activities | Total derivatives for customer-related activities | 883,848 | | 3,053 | | 6,703 | | 426,844 | | 3,515 | | 7,286 | |
| Derivatives used for other risk management activities: | Derivatives used for other risk management activities: | | | | |
| Foreign exchange contracts and other | Foreign exchange contracts and other | 21,875 | | 34 | | 199 | | 12,785 | | 47 | | 227 | |
| Foreign exchange contracts and other | |
| Foreign exchange contracts and other | |
| Total derivatives not designated for hedging | Total derivatives not designated for hedging | $ | 1,005,064 | | $ | 3,220 | | $ | 6,978 | | $ | 515,607 | | $ | 3,744 | | $ | 7,617 | |
| Total gross derivatives | Total gross derivatives | $ | 1,141,175 | | $ | 3,220 | | $ | 7,003 | | $ | 581,268 | | $ | 3,768 | | $ | 7,618 | |
| Less: Impact of legally enforceable master netting agreements | Less: Impact of legally enforceable master netting agreements | | 1,303 | | 1,303 | | | 1,523 | | 1,523 | |
| Less: Cash collateral received/paid | Less: Cash collateral received/paid | | 1,134 | | 1,135 | | | 714 | | 1,571 | |
| Total derivatives | Total derivatives | | $ | 783 | | $ | 4,565 | | | $ | 1,531 | | $ | 4,524 | |
(a)Centrally cleared derivatives are settled in cash daily and result in no derivative asset or derivative liability being recognized on our Consolidated Balance Sheet.
(b)Included in Other assets on our Consolidated Balance Sheet.
(c)Included in Other liabilities on our Consolidated Balance Sheet.
(d)Represents primarily swaps.
(e)At June 30, 2023, the gross-up of the notional amounts due to overlay swap contracts for fair valueRepresents caps and cash flow hedges were $18.8 billion and $47.0 billion, respectively.floors.
(f)Includes both residential and commercial mortgage banking activities.
(g)At June 30, 2023, the gross-up of the notional amounts due to overlay swap contracts used for mortgage banking and customer-related activities were $26.0 billion and $423.0 billion, respectively.
(h)Futures contracts are settled in cash daily and result in no derivative asset or derivative liability being recognized on our Consolidated Balance Sheet.
The PNC Financial Services Group, Inc. – Form 10-Q 91
All derivatives are carried on our Consolidated Balance Sheet at fair value. Derivative balances are presented on the Consolidated Balance Sheet on a net basis taking into consideration the effects of legally enforceable master netting agreements and, when appropriate, any related cash collateral exchanged with counterparties. Further discussion regarding the offsetting rights associated with these legally enforceable master netting agreements is included in the Offsetting and Counterparty Credit Risk section of this Note 12. Any nonperformance risk, including credit risk, is included in the determination of the estimated net fair value of the derivatives.
The PNC Financial Services Group, Inc. – Form 10-Q 77
Derivatives Designated As Hedging Instruments
Certain derivatives used to manage interest rate and foreign exchange risk as part of our asset and liability risk management activities are designated as accounting hedges. Derivatives hedging the risks associated with changes in the fair value of assets or liabilities are considered fair value hedges, derivatives hedging the variability of expected future cash flows are considered cash flow hedges and derivatives hedging a net investment in a foreign subsidiary are considered net investment hedges. Designating derivatives as accounting hedges allows for gains and losses on those derivatives to be recognized in the same period and in the same income statement line item as the earnings impact of the hedged items.
Fair Value Hedges
We enter into receive-fixed, pay-variable interest rate swaps to hedge changes in the fair value of outstanding fixed-rate debt caused by fluctuations in market interest rates. We also enter into pay-fixed, receive-variable interest rate swaps and zero-coupon swaps to hedge changes in the fair value of fixed rate and zero-coupon investment securities caused by fluctuations in market interest rates. Gains and losses on the interest rate swaps designated in these hedge relationships, along with the offsetting gains and losses on the hedged items attributable to the hedged risk, are recognized in current earnings within the same income statement line item.
Cash Flow Hedges
We enter into receive-fixed, pay-variable interest rate swaps and interest rate caps and floors to modify the interest rate characteristics of designated commercial loans from variable to fixed in order to reduce the impact of changes in future cash flows due to market interest rate changes. We also periodically enter into forward purchase and sale contracts to hedge the variability of the consideration that will be paid or received related to the purchase or sale of investment securities. The forecasted purchase or sale is consummated upon gross settlement of the forward contract itself. For these cash flow hedges, gains and losses on the hedging instruments are recorded in AOCI and are then reclassified into earnings in the same period the hedged cash flows affect earnings and within the same income statement line as the hedged cash flows.
In the 12 months that follow June 30, 2023,March 31, 2024, we expect to reclassify net derivative losses of $1.5$1.2 billion pretax, or $1.2$0.9 billion after-tax, from AOCI to interest income for these cash flow hedge strategies. This reclassified amount could differ from amounts actually recognized due to changes in interest rates, hedge de-designations and the addition of other hedges subsequent to June 30, 2023.March 31, 2024. As of June 30, 2023,March 31, 2024, the maximum length of time over which forecasted transactions are hedged is ten years.
9278 The PNC Financial Services Group, Inc. – Form 10-Q
Further detail regarding gains (losses) related to our fair value and cash flow hedge derivatives is presented in the following table:
Table 74:72: Gains (Losses) Recognized on Fair Value and Cash Flow Hedges in the Consolidated Income Statement (a) (b)
| | | | | Location and Amount of Gains (Losses) Recognized in Income |
| Interest Income | | | Interest Income | Interest Expense | Noninterest Income |
| In millions | | In millions | Loans | Investment Securities | Borrowed Funds | Other |
| For the three months ended March 31, 2024 | |
| Total amounts in the Consolidated Income Statement | |
| Total amounts in the Consolidated Income Statement | |
| Total amounts in the Consolidated Income Statement | |
| Gains (losses) on fair value hedges recognized on: | |
| Hedged items (c) | |
| Hedged items (c) | |
| Hedged items (c) | |
| Derivatives | |
| Derivatives | |
| Derivatives | |
| Amounts related to interest settlements on derivatives | |
| Amounts related to interest settlements on derivatives | |
| Amounts related to interest settlements on derivatives | |
| Gains (losses) on cash flow hedges (d): | |
| Gains (losses) on cash flow hedges (d): | |
| Gains (losses) on cash flow hedges (d): | |
Amount of derivative gains (losses) reclassified from accumulated
other comprehensive income | |
Amount of derivative gains (losses) reclassified from accumulated
other comprehensive income | |
Amount of derivative gains (losses) reclassified from accumulated
other comprehensive income | |
| Other amounts related to interest settlements on derivatives | |
| Other amounts related to interest settlements on derivatives | |
| Other amounts related to interest settlements on derivatives | |
| For the three months ended March 31, 2023 | |
| For the three months ended March 31, 2023 | |
| For the three months ended March 31, 2023 | |
| Total amounts in the Consolidated Income Statement | |
| Total amounts in the Consolidated Income Statement | |
| Total amounts in the Consolidated Income Statement | |
| Gains (losses) on fair value hedges recognized on: | |
| Hedged items (c) | |
| Hedged items (c) | |
| Hedged items (c) | |
| Derivatives | |
| Derivatives | |
| Derivatives | |
| Amounts related to interest settlements on derivatives | |
| Amounts related to interest settlements on derivatives | |
| Amounts related to interest settlements on derivatives | |
| Gains (losses) on cash flow hedges (d): | |
| Gains (losses) on cash flow hedges (d): | |
| Gains (losses) on cash flow hedges (d): | |
Amount of derivative gains (losses) reclassified from accumulated
other comprehensive income | |
Amount of derivative gains (losses) reclassified from accumulated
other comprehensive income | |
Amount of derivative gains (losses) reclassified from accumulated
other comprehensive income | | $ | (325) | | $ | (5) | | | |
| Other amounts related to interest settlements on derivatives | |
| | | | Location and Amount of Gains (Losses) Recognized in Income |
| | Interest Income | Interest Expense | Noninterest Income |
| In millions | Loans | Investment Securities | Borrowed Funds | Other |
| For the three months ended June 30, 2023 | | |
| Total amounts in the Consolidated Income Statement | $ | 4,523 | | $ | 883 | | $ | 903 | | $ | 129 | |
| Gains (losses) on fair value hedges recognized on: | | |
| Hedged items (c) | | $ | (48) | | $ | 432 | | |
| Derivatives | | $ | 50 | | $ | (439) | | |
| Amounts related to interest settlements on derivatives | | $ | 7 | | $ | (147) | | |
| Gains (losses) on cash flow hedges (d): | | |
Amount of derivative gains (losses) reclassified from accumulated
other comprehensive income | $ | (365) | | $ | (8) | | | |
| For the three months ended June 30, 2022 | | |
| Total amounts in the Consolidated Income Statement | $ | 2,504 | | $ | 631 | | $ | 142 | | $ | 177 | |
| Gains (losses) on fair value hedges recognized on: | | |
| Hedged items (c) | | $ | (28) | | $ | 443 | | |
| Derivatives | | $ | 30 | | $ | (451) | | |
| Amounts related to interest settlements on derivatives | | $ | (2) | | $ | 74 | | |
| Gains (losses) on cash flow hedges (d): | | |
Amount of derivative gains (losses) reclassified from accumulated
other comprehensive income | $ | 25 | | | |
| For the six months ended June 30, 2023 | | |
| Total amounts on the Consolidated Income Statement | $ | 8,781 | | $ | 1,768 | | $ | 1,686 | | $ | 387 | |
| Gains (losses) on fair value hedges recognized on: | | |
| Hedged items (c) | | $ | (1) | | $ | 135 | | |
| Derivatives | | $ | 5 | | $ | (148) | | |
| Amounts related to interest settlements on derivatives | | $ | 12 | | $ | (260) | | |
| Gains (losses) on cash flow hedges (d): | | |
Amount of derivative gains (losses) reclassified from accumulated
other comprehensive income | $ | (690) | | $ | (13) | | | |
| For the six months ended June 30, 2022 | | |
| Total amounts on the Consolidated Income Statement | $ | 4,797 | | $ | 1,175 | | $ | 225 | | $ | 388 | |
| Gains (losses) on fair value hedges recognized on: | | |
| Hedged items (c) | | $ | (46) | | $ | 1,377 | | |
| Derivatives | | $ | 49 | | $ | (1,395) | | |
| Amounts related to interest settlements on derivatives | | $ | (3) | | $ | 184 | | |
| Gains (losses) on cash flow hedges (d): | | |
Amount of derivative gains (losses) reclassified from accumulated
other comprehensive income | $ | 117 | | $ | 10 | | | |
|
(a)For all periods presented, there were no components of derivative gains or losses excluded from the assessment of hedge effectiveness for any of the fair value or cash flow hedge strategies.
(b)All cash flow and fair value hedge derivatives were interest rate contracts for the periods presented.
(c)Includes an insignificant amount of fair value hedge adjustments related to discontinued hedge relationships.
(d)For all periods presented, there were no gains or losses from cash flow hedge derivatives reclassified to income because it became probable that the original forecasted transaction would not occur.
The PNC Financial Services Group, Inc. – Form 10-Q 93
Detail regarding the impact of fair value hedge accounting on the carrying value of the hedged items is presented in the following table:
Table 75:73: Hedged Items - Fair Value Hedges
| | | | June 30, 2023 | | December 31, 2022 | | March 31, 2024 | | December 31, 2023 |
| In millions | In millions | Carrying Value of the Hedged Items | | Cumulative Fair
Value Hedge Adjustment
included in the Carrying
Value of Hedged Items (a) | | Carrying Value of the Hedged Items | | Cumulative Fair Value
Hedge Adjustment
included in the Carrying
Value of Hedged Items (a) | |
| Investment securities - available for sale (b) | Investment securities - available for sale (b) | $ | 1,915 | | | $ | (124) | | | $ | 2,376 | | | $ | (121) | | |
| Investment securities - available for sale (b) | |
| Investment securities - available for sale (b) | |
| Borrowed funds | Borrowed funds | $ | 26,360 | | | $ | (1,417) | | | $ | 21,781 | | | $ | (1,283) | | |
| Borrowed funds | |
| Borrowed funds | |
(a)Includes less than $(0.1) billion of fair value hedge adjustments primarily related to discontinued borrowed funds hedge relationships at both June 30, 2023March 31, 2024 and December 31, 2022.2023.
(b)Carrying value shown represents amortized cost.
Net Investment Hedges
We enter into foreign currency forward contracts to hedge non-U.S. dollar net investments in foreign subsidiaries against adverse changes in foreign exchange rates. We assess whether the hedging relationship is highly effective in achieving offsetting changes in the value of the hedge and hedged item by qualitatively verifying that the critical terms of the hedge and hedged item match at the inception of the hedging relationship and on an ongoing basis. Net investment hedge derivatives are classified as foreign exchange contracts. There were no components of derivative gains or losses excluded from the assessment of the hedge effectiveness for the periods presented. Net gains (losses) on net investment hedge derivatives recognized in OCI were $(28) million and $(46) million for the three and six months ended June 30, 2023, respectively, and insignificant for both the three and six months ended June 30, 2022.March 31, 2024 and 2023.
Derivatives Not Designated As Hedging Instruments
For additional information on derivatives not designated as hedging instruments under GAAP, see Note 1615 Financial Derivatives in our 20222023 Form 10-K.
The PNC Financial Services Group, Inc. – Form 10-Q 79
Further detail regarding the gains (losses) on derivatives not designated in hedging relationships is presented in the following table:
Table 76:74: Gains (Losses) on Derivatives Not Designated for Hedging
| | | |
| | | | | Three months ended
June 30 | | Six months ended
June 30 | |
| In millions | In millions | | 2023 | 2022 | | 2023 | 2022 | |
| In millions | |
| In millions | |
| Derivatives used for mortgage banking activities: | |
| Derivatives used for mortgage banking activities: | |
| Derivatives used for mortgage banking activities: | Derivatives used for mortgage banking activities: | | | | | |
| Interest rate contracts (a) | Interest rate contracts (a) | | $ | (184) | | $ | (190) | | | $ | (77) | | $ | (455) | | |
| Interest rate contracts (a) | |
| Interest rate contracts (a) | |
| Derivatives used for customer-related activities: | |
| Derivatives used for customer-related activities: | |
| Derivatives used for customer-related activities: | Derivatives used for customer-related activities: | | | | | |
| Interest rate contracts | Interest rate contracts | | 33 | | 69 | | | 35 | | 166 | | |
| Interest rate contracts | |
| Interest rate contracts | |
| Foreign exchange contracts and other | |
| Foreign exchange contracts and other | |
| Foreign exchange contracts and other | Foreign exchange contracts and other | | 58 | | (20) | | | 114 | | 24 | | |
| Gains from customer-related activities (b) | Gains from customer-related activities (b) | | 91 | | 49 | | | 149 | | 190 | | |
| Gains from customer-related activities (b) | |
| Gains from customer-related activities (b) | |
| Derivatives used for other risk management activities: | |
| Derivatives used for other risk management activities: | |
| Derivatives used for other risk management activities: | Derivatives used for other risk management activities: | | | | | |
| Foreign exchange contracts and other (b) | Foreign exchange contracts and other (b) | | (137) | | 216 | | | (214) | | 263 | | |
| Total gains (losses) from derivatives not designated as hedging instruments | | $ | (230) | | $ | 75 | | | $ | (142) | | $ | (2) | | |
| Foreign exchange contracts and other (b) | |
| Foreign exchange contracts and other (b) | |
| Total gains from derivatives not designated as hedging instruments | |
| Total gains from derivatives not designated as hedging instruments | |
| Total gains from derivatives not designated as hedging instruments | |
(a)Included in Residential and commercial mortgage noninterest income on our Consolidated Income Statement.
(b)Included in Capital markets and advisory and Other noninterest income on our Consolidated Income Statement.
Offsetting and Counterparty Credit Risk
We generally utilize a net presentation on the Consolidated Balance Sheet for those derivative financial instruments entered into with counterparties under legally enforceable master netting agreements. The master netting agreements reduce credit risk by permitting the closeout netting of all outstanding derivative instruments under the master netting agreement with the same counterparty upon the occurrence of an event of default. The master netting agreement also may require the exchange of cash or marketable securities to collateralize either party’s net position. For additional information on derivative offsetting and counterparty credit risk, see Note 1615 Financial Derivatives in our 20222023 Form 10-K.
Table 7775 shows the impact legally enforceable master netting agreements had on our derivative assets and derivative liabilities at June 30, 2023March 31, 2024 and December 31, 2022.2023. The table includes cash collateral held or pledged under legally enforceable master netting agreements. The table also includes the fair value of any securities collateral held or pledged under legally enforceable master netting agreements. Cash and securities collateral amounts are included in the table only to the extent of the related net derivative fair values.
94 The PNC Financial Services Group, Inc. – Form 10-Q
Table 7775 includes OTC derivatives not settled through an exchange (“OTC derivatives”) and OTC derivatives cleared through a central clearing house (“OTC cleared derivatives”). OTC derivatives represent contracts executed bilaterally with counterparties that are not settled through an organized exchange or directly cleared through a central clearing house. The majority of OTC derivatives are governed by the ISDA documentation or other legally enforceable master netting agreements. OTC cleared derivatives represent contracts executed bilaterally with counterparties in the OTC market that are novated to a central clearing house that then becomes our counterparty. OTC cleared derivative instruments are typically settled in cash each day based on the prior day value.
80 The PNC Financial Services Group, Inc. – Form 10-Q
Table 77:75: Derivative Assets and Liabilities Offsetting
| | In millions | In millions | | | | Amounts Offset on the
Consolidated Balance Sheet | | | | | | Securities Collateral Held/Pledged Under Master Netting Agreements | | | |
Gross
Fair Value | | Fair Value
Offset Amount | | Cash
Collateral | | Net
Fair Value | | | | Net Amounts | |
| June 30, 2023 | | |
Gross
Fair Value | |
Gross
Fair Value | |
| March 31, 2024 | |
| March 31, 2024 | |
| March 31, 2024 | |
| Derivative assets | |
| Derivative assets | |
| Derivative assets | Derivative assets | | |
| Interest rate contracts: | Interest rate contracts: | | |
| Interest rate contracts: | |
| Interest rate contracts: | |
| Over-the-counter cleared | |
| Over-the-counter cleared | |
| Over-the-counter cleared | Over-the-counter cleared | | $ | 26 | | | $ | 26 | | | | | $ | 26 | | |
| | Over-the-counter | Over-the-counter | | 2,230 | | | $ | 846 | | | $ | 911 | | | 473 | | | | | $ | 75 | | | 398 | | |
| | Over-the-counter | |
| | Over-the-counter | |
| Commodity contracts | |
| Commodity contracts | |
| Commodity contracts | Commodity contracts | | 622 | | | 337 | | | 104 | | | 181 | | | 181 | | |
| Foreign exchange and other contracts | Foreign exchange and other contracts | | 342 | | | 120 | | | 119 | | | 103 | | | | | 103 | | |
| Foreign exchange and other contracts | |
| Foreign exchange and other contracts | |
| Total derivative assets | |
| Total derivative assets | |
| Total derivative assets | Total derivative assets | | $ | 3,220 | | | $ | 1,303 | | | $ | 1,134 | | | $ | 783 | | | (a) | | $ | 75 | | | $ | 708 | | |
| Derivative liabilities | Derivative liabilities | | |
| Derivative liabilities | |
| Derivative liabilities | |
| Interest rate contracts: | Interest rate contracts: | | |
| Interest rate contracts: | |
| Interest rate contracts: | |
| Over-the-counter cleared | |
| Over-the-counter cleared | |
| Over-the-counter cleared | Over-the-counter cleared | | $ | 19 | | | $ | 19 | | | | | $ | 19 | | |
| | Over-the-counter | Over-the-counter | | 5,858 | | | $ | 633 | | | $ | 1,104 | | | 4,121 | | | | | $ | 75 | | | 4,046 | | |
| | Over-the-counter | |
| | Over-the-counter | |
| Commodity contracts | |
| Commodity contracts | |
| Commodity contracts | Commodity contracts | | 649 | | | 497 | | | 23 | | | 129 | | | 129 | | |
| Foreign exchange and other contracts | Foreign exchange and other contracts | | 477 | | | 173 | | | 8 | | | 296 | | | | | 296 | | |
| Foreign exchange and other contracts | |
| Foreign exchange and other contracts | |
| Total derivative liabilities | Total derivative liabilities | | $ | 7,003 | | | $ | 1,303 | | | $ | 1,135 | | | $ | 4,565 | | | (b) | | $ | 75 | | | $ | 4,490 | | |
| December 31, 2022 | | |
| Total derivative liabilities | |
| Total derivative liabilities | |
| December 31, 2023 | |
| December 31, 2023 | |
| December 31, 2023 | |
| Derivative assets | |
| Derivative assets | |
| Derivative assets | Derivative assets | | |
| Interest rate contracts: | Interest rate contracts: | | |
| Interest rate contracts: | |
| Interest rate contracts: | |
| Over-the-counter cleared | |
| Over-the-counter cleared | |
| Over-the-counter cleared | Over-the-counter cleared | | $ | 23 | | | $ | 23 | | | | | $ | 23 | | |
| | Over-the-counter | Over-the-counter | | 2,100 | | | $ | 974 | | | $ | 630 | | | 496 | | | | | $ | 34 | | | 462 | | |
| | Over-the-counter | |
| | Over-the-counter | |
| Commodity contracts | |
| Commodity contracts | |
| Commodity contracts | Commodity contracts | | 1,208 | | | 335 | | | 2 | | | 871 | | | 871 | | |
| Foreign exchange and other contracts | Foreign exchange and other contracts | | 437 | | | 214 | | | 82 | | | 141 | | | | | 141 | | |
| Foreign exchange and other contracts | |
| Foreign exchange and other contracts | |
| Total derivative assets | |
| Total derivative assets | |
| Total derivative assets | Total derivative assets | | $ | 3,768 | | | $ | 1,523 | | | $ | 714 | | | $ | 1,531 | | | (a) | | $ | 34 | | | $ | 1,497 | | |
| Derivative liabilities | Derivative liabilities | | |
| Derivative liabilities | |
| Derivative liabilities | |
| Interest rate contracts: | Interest rate contracts: | | |
| Interest rate contracts: | |
| Interest rate contracts: | |
| Over-the-counter cleared | |
| Over-the-counter cleared | |
| Over-the-counter cleared | Over-the-counter cleared | | $ | 28 | | | $ | 28 | | | | | $ | 28 | | |
| | Over-the-counter | Over-the-counter | | 5,801 | | | $ | 625 | | | $ | 1,041 | | | 4,135 | | | | | $ | 78 | | | 4,057 | | |
| | Over-the-counter | |
| | Over-the-counter | |
| Commodity contracts | |
| Commodity contracts | |
| Commodity contracts | Commodity contracts | | 1,269 | | | 679 | | | 520 | | | 70 | | | 4 | | | 66 | | |
| Foreign exchange and other contracts | Foreign exchange and other contracts | | 520 | | | 219 | | | 10 | | | 291 | | | | | 291 | | |
| Foreign exchange and other contracts | |
| Foreign exchange and other contracts | |
| Total derivative liabilities | Total derivative liabilities | | $ | 7,618 | | | $ | 1,523 | | | $ | 1,571 | | | $ | 4,524 | | | (b) | | $ | 82 | | | $ | 4,442 | | |
| Total derivative liabilities | |
| Total derivative liabilities | |
(a)Represents the net amount of derivative assets included in Other assets on our Consolidated Balance Sheet.
(b)Represents the net amount of derivative liabilities included in Other liabilities on our Consolidated Balance Sheet.
In addition to using master netting agreements and other collateral agreements to reduce credit risk associated with derivative instruments, we also seek to manage credit risk by evaluating credit ratings of counterparties and by using internal credit analysis, limits and monitoring procedures.
At June 30, 2023,March 31, 2024, cash and debt securities (primarily agency mortgage-backed securities) totaling $2.1$2.7 billion were pledged to us under master netting agreements and other collateral agreements to collateralize net derivative assets due from counterparties and to meet initial margin requirements, and we pledged cash and debt securities (primarily agency mortgage-backed securities) totaling $2.1$2.3 billion under these agreements to collateralize net derivative liabilities owed to counterparties and to meet initial margin requirements. These totals may differ from the amounts presented in the preceding offsetting table because these totals may include collateral
The PNC Financial Services Group, Inc. – Form 10-Q 95
exchanged under an agreement that does not qualify as a master netting agreement or because the total amount of collateral pledged exceeds the net derivative fair values with the counterparty as of the balance sheet date due to timing or other factors, such as initial margin. To the extent not netted against the derivative fair values under a master netting agreement, the receivable for cash pledged is included in Other assets and the obligation for cash held is included in Other liabilities on our Consolidated Balance Sheet. Securities pledged to us by counterparties are not recognized on our balance sheet. Likewise, securities we have pledged to counterparties remain on our balance sheet.
The PNC Financial Services Group, Inc. – Form 10-Q 81
Credit-Risk Contingent Features
Certain derivative agreements contain various credit-risk-related contingent provisions, such as those that require our debt to maintain a specified credit rating from one or more of the major credit rating agencies. If our debt ratings were to fall below such specified ratings, the counterparties to the derivative instruments could request immediate payment or demand immediate and ongoing full collateralization on derivative instruments in net liability positions. The following table presents the aggregate fair value of derivative instruments with credit-risk-related contingent features, the associated collateral posted in the normal course of business and the maximum amount of collateral we would be required to post if the credit-risk-related contingent features underlying these agreements had been triggered on June 30, 2023March 31, 2024 and December 31, 2022.2023.
Table 78:76: Credit-Risk Contingent Features
| | In billions | In billions | June 30, 2023 | | December 31, 2022 | |
| Net derivative liabilities with credit-risk contingent features | Net derivative liabilities with credit-risk contingent features | $ | 5.4 | | | $ | 5.8 | | |
| Collateral posted | 1.2 | | | 1.7 | | |
| Net derivative liabilities with credit-risk contingent features | |
| Net derivative liabilities with credit-risk contingent features | |
| Less: Collateral posted | |
| Less: Collateral posted | |
| Less: Collateral posted | |
| Maximum additional amount of collateral exposure | Maximum additional amount of collateral exposure | $ | 4.2 | | | $ | 4.1 | | |
| Maximum additional amount of collateral exposure | |
| Maximum additional amount of collateral exposure | |
NOTE 13 LEGAL PROCEEDINGS
We establish accruals for legal proceedings, including litigation and regulatory and governmental investigations and inquiries, when information related to the loss contingencies represented by those matters indicates both that a loss is probable and that the amount of loss can be reasonably estimated. Any such accruals are adjusted thereafter as appropriate to reflect changed circumstances. When we are able to do so, we also determine estimates of reasonably possible losses or ranges of reasonably possible losses, whether in excess of any related accrued liability or where there is no accrued liability, for disclosed legal proceedings (“Disclosed Matters,” which are those matters disclosed in this Note 13 as well as those matters disclosed in Note 2120 Legal Proceedings in our 20222023 Form 10-K and in Note 13 Legal Proceedings in our first quarter 2023 Form 10-Q(such(such prior disclosure referred to as “Prior Disclosure”)). For Disclosed Matters where we are able to estimate such possible losses or ranges of possible losses, as of June 30, 2023,March 31, 2024, we estimate that it is reasonably possible that we could incur losses in excess of related accrued liabilities, if any, in an aggregate amount less than $300 million. The estimates included in this amount are based on our analysis of currently available information and are subject to significant judgment and a variety of assumptions and uncertainties. As new information is obtained we may change our estimates. Due to the inherent subjectivity of the assessments and unpredictability of outcomes of legal proceedings, any amounts accrued or included in this aggregate amount may not represent the ultimate loss to us from the legal proceedings in question. Thus, our exposure and ultimate losses may be higher, and possibly significantly so, than the amounts accrued or this aggregate amount.
As a result of the types of factors described in Note 2120 Legal Proceedings in our 20222023 Form 10-K, we are unable, at this time, to estimate the losses that are reasonably possible to be incurred or ranges of such losses with respect to some of the matters disclosed,Disclosed Matters, and the aggregate estimated amount provided above does not include an estimate for every Disclosed Matter. Therefore, as the estimated aggregate amount disclosed above does not include all of the Disclosed Matters, the amount disclosed above does not represent our maximum reasonably possible loss exposure for all of the Disclosed Matters. The estimated aggregate amount also does not reflect any of our exposure to matters not so disclosed, as discussed below under “Other.”
We include in some of the descriptions of individual Disclosed Matters certain quantitative information related to the plaintiff’s claim against us as alleged in the plaintiff’s pleadings or other public filings or otherwise publicly available information. While information of this type may provide insight into the potential magnitude of a matter, it does not necessarily represent our estimate of reasonably possible loss or our judgment as to any currently appropriate accrual.
Some of our exposure in Disclosed Matters may be offset by applicable insurance coverage. We do not consider the possible availability of insurance coverage in determining the amounts of any accruals (although we would record the amount of related insurance recoveries that are deemed probable up to the amount of the accrual) or in determining any estimates of possible losses or ranges of possible losses.
Interchange Litigation
In March 2024, the parties to the class action seeking equitable relief in the proceedings in the U.S. District Court for the Eastern District of New York under the caption In re Payment Card Interchange Fee and Merchant-Discount Antitrust Litigation (Master File No. 1:05-md-1720-MKB-JAM) entered into an agreement for certain rule and rate changes to resolve the matter. The settlement must be preliminarily approved by the district court prior to issuance of notice to the class and proceedings to consider final approval.
See Note 16 Subsequent Events for a discussion of Visa’s recently announced exchange offer for Visa Class B-1 common stock.
9682 The PNC Financial Services Group, Inc. – Form 10-Q
USAA Patent Infringement Litigation
In April 2023, in United Services Automobile Association v. PNC Bank N.A. (Case No. 2:21-cv-246) (the “third Texas case”) and the case for PNC’s patent infringement counterclaims (originally asserted in United Services Automobile Association v. PNC Bank N.A. (Case No. 2:20-cv-319)) (the “first Texas case”) (together, the “second consolidated cases”), USAA noticed a cross-appeal to the U.S. Court of Appeals for the Federal Circuit regarding the final judgment in the second consolidated cases. This appeal was consolidated with PNC’s previously noticed appeal to the U.S. Court of Appeals for the Federal Circuit regarding the final judgment in the second consolidated cases as United Services Automobile Association v. PNC Bank N.A. (Case No. 23-1639).
In May and June 2023, USAA appealed the Final Written Decisions of the Patent Trial and Appeal Board that concluded that the claims in three of the patents originally at issue in United Services Automobile Association v. PNC Bank N.A. (Case No. 2:21-cv-110) and the first Texas case (together, the “first consolidated cases”) and in United Services Automobile Association v. BBVA USA (Case No. 2:21-cv-311) were unpatentable. Because of USAA’s case narrowing in the first consolidated cases, only one of these three patents was presented to the jury in the first consolidated cases.
Also in May 2023, the Patent Trial and Appeal Board entered its Final Written Decision concluding that most of the claims of one of the patents presented to the jury in the third Texas case were unpatentable and other claims were not unpatentable. In June 2023, the Patent Trial and Appeal Board entered its Final Written Decision concluding that all of the claims of the other patent subject to inter partes review, but not ultimately presented to the jury in the third Texas Case, were unpatentable.
Regulatory and Governmental Inquiries
We are the subject of investigations, audits, examinations and other forms of regulatory and governmental inquiry covering a broad
range of issues in our consumer, mortgage, brokerage, securities and other financial services businesses, as well as other aspects of our operations. In some cases, these inquiries are part of reviews of specified activities at multiple industry participants; in others, they are directed at PNC individually. From time to time, these inquiries have involved and may in the future involve or lead to regulatory enforcement actions and other administrative proceedings. These inquiries have also led to and may in the future lead to civil or criminal judicial proceedings. Some of these inquiries result in remedies including fines, penalties, restitution, or alterations in our business practices, and in additional expenses and collateral costs and other consequences. Such remedies and other consequences typically have not been material to us from a financial standpoint, but could be in the future. Even if not financially material, they may result in significant reputational harm or other adverse consequences.
Our practice is to cooperate fully with regulatory and governmental investigations, audits and other inquiries.
Other
In addition to the proceedings or other matters described in Prior Disclosure, PNC and persons to whom we may have indemnification obligations, in the normal course of business, are subject to various other pending and threatened legal proceedings in which claims for monetary damages and other relief are asserted. We do not anticipate, at the present time, that the ultimate aggregate liability, if any, arising out of such other legal proceedings will have a material adverse effect on our financial position. However, we cannot now determine whether or not any claims asserted against us or others to whom we may have indemnification obligations, whether in the proceedings or other matters described above or otherwise, will have a material adverse effect on our results of operations in any future reporting period, which will depend on, among other things, the amount of the loss resulting from the claim and the amount of income otherwise reported for the reporting period.
The PNC Financial Services Group, Inc. – Form 10-Q 97
NOTE 14 SEGMENT REPORTING
We have three reportable business segments: Retail Banking, Corporate & Institutional Banking and Asset Management Group:
•
Retail Banking provides deposit, lending, brokerage, insurance services, investment management and cash management products and services to consumer and small business customers who are serviced through our coast-to-coast branch network, digital channels, ATMs, or through our phone-based customer contact centers. Deposit products include checking, savings and money market accounts and time deposits. Lending products include residential mortgages, home equity loans and lines of credit, auto loans, credit cards, education loans and personal and small business loans and lines of credit. The residential mortgage loans are directly originated within our branch network and nationwide, and are typically underwritten to agency and/or third-party standards, and either sold, servicing retained or held on our balance sheet. Brokerage, investment management and cash management products and services include managed, education, retirement and trust accounts.
•
Corporate & Institutional Bankingprovides lending, treasury management, capital markets and advisory products and services to mid-sized and large corporations and government and not-for-profit entities. Lending products include secured and unsecured loans, letters of credit and equipment leases. The Treasury Management business provides corporations with cash and investment management services, receivables and disbursement management services, funds transfer services and access to online/mobile information management and reporting services. Capital markets and advisory includes services and activities primarily related to merger and acquisitions advisory, equity capital markets advisory, asset-backed financing, loan syndication, securities underwriting and customer-related trading. We also provide commercial loan servicing and technology solutions for the commercial real estate finance industry. Products and services are provided nationally.
Asset Management Groupprovides private banking for high net worth and ultra high net worth clients and institutional asset management. The Asset Management group is composed of two operating units:
•PNC Private Bank provides products and services to emerging affluent, high net worth and ultra high net worth individuals and their families including investment and retirement planning, customized investment management, credit and cash management solutions, trust management and administration. In addition, multi-generational family planning services are also provided to ultra high net worth individuals and their families, which include estate, financial, tax, fiduciary and customized performance reporting through PNC Private Bank Hawthorn.
•Institutional Asset Management provides outsourced chief investment officer, custody, cash and fixed income client solutions and retirement plan fiduciary investment services to institutional clients including corporations, healthcare systems, insurance companies, unions, municipalities and non-profits.
The remaining corporate operations are reflected in Other:
The PNC Financial Services Group, Inc. – Form 10-Q 83
Other includes residual activities that do not meet the criteria for disclosure as a separate reportable business, such as asset and liability management activities including net securities gains or losses, ACL for investment securities, certain trading activities, certain runoff consumer loan portfolios, private equity investments, intercompany eliminations, corporate overhead net of allocations, tax adjustments that are not allocated to business segments, exited businesses and the residual impact from funds transfer pricing operations. The decline in Other earnings for the first three months of 2024 compared to the same period in 2023 was driven by the residual impacts from funds transfer pricing due to the rising interest rate environment, along with the costs for the FDIC special assessment.
Basis of Presentation
Results of individual businesses are presented based on our internal management reporting practices. There is no comprehensive, authoritative body of guidance for management accounting equivalent to GAAP; therefore, the financial results of our individual businesses are not necessarily comparable with similar information for any other company. We periodically refine our internal methodologies as management reporting practices are enhanced. To the extent significant and practicable, retrospective application of new methodologies is made to prior period reportable business segment results and disclosures to create comparability with the current period.
TotalFunds Transfer Pricing
Net interest income in business segment financial results differ from total consolidated net income. These differences are reflected in the “Other” category in Table 79. “Other” includes residual activities that do not meet the criteria for disclosure asreflects our internal funds transfer pricing methodology, which is designed to consider interest rate and liquidity risks. Under our methodology, assets receive a separate reportable business, such as assetfunding charge while liabilities and liability management activities, including net securities gains or losses, ACL for investment securities, certain trading activities, certain runoff consumer loan portfolios, private equity investments, intercompany eliminations, certain corporate overhead, tax adjustments that are not allocated to business segments, exited businessescapital receive a funding credit based on market interest rates, product characteristics and differences between business segment performance reporting and financial statement reporting (GAAP). Assets, revenue and earnings attributable to foreign activities were not material in the periods presented for comparison.other factors.
Our transfer pricing framework considers the application of funding curves and methodologies consistently across the balance sheet. A residual gain or loss from funds transfer pricing operations is retained within Other. This residual gain or loss is reviewed by management quarterly, in accordance with the interagency guidance of the FDIC, Federal Reserve and OCC.
Segment Allocations
Financial results are presented, to the extent practicable, as if each business operated on a standalone basis. Additionally, we have aggregated the resultsbasis, and includes expense allocations for corporate support functions within “Other” for financial reporting purposes.overhead services used by the business segments.
Net interest incomeCertain costs are retained within Other. These costs are not allocated to our business segments because they (i) are transitory or highly irregular in nature, (ii) exist solely to support corporate activities unrelated to business segment results reflectsoperations, or (iii) reflect residual costs for an exited business. During the first quarter of 2024, Other noninterest expense for the Other category included an additional expense related to the increase in the FDIC’s expected losses. This cost was not allocated to our internal funds transfer pricing methodology. Assets receive a funding charge and liabilities and capital receive a funding credit based on a transfer pricing methodology that incorporates product repricing characteristics, tenor and other factors.business segments due to its irregular nature.
We have allocated the ALLL and the allowance for unfunded lending related commitments based on the loan exposures within each business segment’s portfolio. Key reserve assumptions and estimation processes react to and are influenced by observed changes in loan portfolio performance experience, the financial strength of the borrower and economic conditions. Key reserve assumptions are periodically updated.
9884 The PNC Financial Services Group, Inc. – Form 10-Q
Business Segment Results
Table 79:77: Results of Businesses | | | | | | | | | | | | | | | | | | | | | | | | | | | | | | | | |
Three months ended June 30
In millions | | Retail Banking | | Corporate &
Institutional
Banking | | Asset
Management
Group | | Other | | Consolidated (a) |
| 2023 | | | | | | | | | | |
| Income Statement | | | | | | | | | | |
| Net interest income | | $ | 2,448 | | | $ | 1,349 | | | $ | 125 | | | $ | (412) | | | $ | 3,510 | |
| Noninterest income | | 702 | | | 821 | | | 228 | | | 32 | | | 1,783 | |
| Total revenue | | 3,150 | | | 2,170 | | | 353 | | | (380) | | | 5,293 | |
| Provision for (recapture of) credit losses | | (14) | | | 209 | | | (10) | | | (39) | | | 146 | |
| Depreciation and amortization | | 81 | | | 53 | | | 7 | | | 143 | | | 284 | |
| Other noninterest expense | | 1,823 | | | 868 | | | 273 | | | 124 | | | 3,088 | |
| Income (loss) before income taxes (benefit) and noncontrolling interests | | 1,260 | | | 1,040 | | | 83 | | | (608) | | | 1,775 | |
| Income taxes (benefit) | | 295 | | | 218 | | | 20 | | | (258) | | | 275 | |
| Net income (loss) | | 965 | | | 822 | | | 63 | | | (350) | | | 1,500 | |
| Less: Net income attributable to noncontrolling interests | | 11 | | | 5 | | | | | 1 | | | 17 | |
| Net income (loss) excluding noncontrolling interests | | $ | 954 | | | $ | 817 | | | $ | 63 | | | $ | (351) | | | $ | 1,483 | |
| Average Assets | | $ | 114,826 | | | $ | 234,174 | | | $ | 15,562 | | | $ | 190,945 | | | $ | 555,507 | |
| 2022 | | | | | | | | | | |
| Income Statement | | | | | | | | | | |
| Net interest income | | $ | 1,662 | | | $ | 1,232 | | | $ | 153 | | | $ | 4 | | | $ | 3,051 | |
| Noninterest income | | 748 | | | 968 | | | 234 | | | 115 | | | 2,065 | |
| Total revenue | | 2,410 | | | 2,200 | | | 387 | | | 119 | | | 5,116 | |
| Provision for (recapture of) credit losses | | 55 | | | (17) | | | 5 | | | (7) | | | 36 | |
| Depreciation and amortization | | 83 | | | 51 | | | 8 | | | 147 | | | 289 | |
| Other noninterest expense | | 1,830 | | | 883 | | | 262 | | | (20) | | | 2,955 | |
| Income (loss) before income taxes (benefit) and noncontrolling interests | | 442 | | | 1,283 | | | 112 | | | (1) | | | 1,836 | |
| Income taxes (benefit) | | 105 | | | 277 | | | 26 | | | (68) | | | 340 | |
| Net income | | 337 | | | 1,006 | | | 86 | | | 67 | | | 1,496 | |
| Less: Net income (loss) attributable to noncontrolling interests | | 15 | | | 3 | | | | | | (3) | | | 15 | |
| Net income excluding noncontrolling interests | | $ | 322 | | | $ | 1,003 | | | $ | 86 | | | $ | 70 | | | $ | 1,481 | |
| Average Assets | | $ | 113,068 | | | $ | 219,513 | | | $ | 14,449 | | | $ | 199,848 | | | $ | 546,878 | |
| | | | | | | | | | |
The PNC Financial Services Group, Inc. – Form 10-Q 99
| | (Continued from previous page) | |
Six months ended June 30
In millions | | Retail
Banking | | Corporate &
Institutional
Banking | | Asset
Management
Group | | Other | | Consolidated (a) |
| 2023 | | |
Three months ended March 31
In millions | | Three months ended March 31
In millions | | Retail Banking | | Corporate &
Institutional
Banking | | Asset
Management
Group | | Other | | Consolidated (a) |
| 2024 | |
| Income Statement | Income Statement | | |
| Income Statement | |
| Income Statement | |
| Net interest income | |
| Net interest income | |
| Net interest income | Net interest income | | $ | 4,729 | | | $ | 2,732 | | | $ | 252 | | | $ | (618) | | | $ | 7,095 | |
| Noninterest income | Noninterest income | | 1,445 | | | 1,707 | | | 458 | | | 191 | | | 3,801 | |
| Total revenue | Total revenue | | 6,174 | | | 4,439 | | | 710 | | | (427) | | | 10,896 | |
| Provision for (recapture of) credit losses | Provision for (recapture of) credit losses | | 224 | | | 181 | | | (1) | | | (23) | | | 381 | |
| Depreciation and amortization | Depreciation and amortization | | 159 | | | 107 | | | 13 | | | 286 | | | 565 | |
| Other noninterest expense | Other noninterest expense | | 3,672 | | | 1,753 | | | 547 | | | 156 | | | 6,128 | |
| Income (loss) before income taxes (benefit) and noncontrolling interests | Income (loss) before income taxes (benefit) and noncontrolling interests | | 2,119 | | | 2,398 | | | 151 | | | (846) | | | 3,822 | |
| Income taxes (benefit) | Income taxes (benefit) | | 497 | | | 512 | | | 36 | | | (417) | | | 628 | |
| Net income (loss) | Net income (loss) | | 1,622 | | | 1,886 | | | 115 | | | (429) | | | 3,194 | |
| Less: Net income (loss) attributable to noncontrolling interests | | 21 | | | 10 | | | 3 | | | 34 | |
| Less: Net income attributable to noncontrolling interests | |
| Net income (loss) excluding noncontrolling interests | Net income (loss) excluding noncontrolling interests | | $ | 1,601 | | | $ | 1,876 | | | $ | 115 | | | $ | (432) | | | $ | 3,160 | |
| Average Assets | Average Assets | | $ | 115,103 | | | $ | 234,354 | | | $ | 15,282 | | | $ | 194,162 | | | $ | 558,901 | |
| 2022 | | |
| 2023 | |
| Income Statement | Income Statement | | |
| Income Statement | |
| Income Statement | |
| Net interest income | |
| Net interest income | |
| Net interest income | Net interest income | | $ | 3,193 | | | $ | 2,375 | | | $ | 291 | | | $ | (4) | | | $ | 5,855 | |
| Noninterest income | Noninterest income | | 1,493 | | | 1,772 | | | 482 | | | 206 | | | 3,953 | |
| Total revenue | Total revenue | | 4,686 | | | 4,147 | | | 773 | | | 202 | | | 9,808 | |
| Provision for (recapture of) credit losses | Provision for (recapture of) credit losses | | (26) | | | (135) | | | 7 | | | (18) | | | (172) | |
| Depreciation and amortization | Depreciation and amortization | | 157 | | | 103 | | | 14 | | | 292 | | | 566 | |
| Other noninterest expense | Other noninterest expense | | 3,648 | | | 1,668 | | | 507 | | | 27 | | | 5,850 | |
| Income (loss) before income taxes (benefit) and noncontrolling interests | Income (loss) before income taxes (benefit) and noncontrolling interests | | 907 | | | 2,511 | | | 245 | | | (99) | | | 3,564 | |
| Income taxes (benefit) | Income taxes (benefit) | | 214 | | | 545 | | | 57 | | | (177) | | | 639 | |
| Net income | | 693 | | | 1,966 | | | 188 | | | 78 | | | 2,925 | |
| Less: Net income (loss) attributable to noncontrolling interests | | 31 | | | 7 | | | | | | (2) | | | 36 | |
| Net income excluding noncontrolling interests | | $ | 662 | | | $ | 1,959 | | | $ | 188 | | | $ | 80 | | | $ | 2,889 | |
| Net income (loss) | |
| Less: Net income attributable to noncontrolling interests | |
| Net income (loss) excluding noncontrolling interests | |
| Average Assets | Average Assets | | $ | 112,415 | | | $ | 210,171 | | | $ | 14,126 | | | $ | 212,415 | | | $ | 549,127 | |
|
(a)There were no material intersegment revenues for the three and six months ended June 30, 2023March 31, 2024 and 2022.2023.
Business Segment Products and Services
Retail Banking provides deposit, lending, brokerage, insurance services, investment management and cash management products and services to consumer and small business customers who are serviced through our coast-to-coast branch network, digital channels, ATMs, or through our phone-based customer contact centers. Deposit products include checking, savings and money market accounts and time deposits. Lending products include residential mortgages, home equity loans and lines of credit, auto loans, credit cards, education loans and personal and small business loans and lines of credit. The residential mortgage loans are directly originated within our branch network and nationwide, and are typically underwritten to agency and/or third-party standards, and either sold, servicing retained or held on our balance sheet. Brokerage, investment management and cash management products and services include managed, education, retirement and trust accounts.
Corporate & Institutional Banking provides lending, treasury management, capital markets and advisory products and services to mid-sized and large corporations and government and not-for-profit entities. Lending products include secured and unsecured loans, letters of credit and equipment leases. The Treasury Management business provides corporations with cash and investment management services, receivables and disbursement management services, funds transfer services, international payment services and access to online/mobile information management and reporting services. Capital markets and advisory includes services and activities primarily related to merger and acquisitions advisory, equity capital markets advisory, asset-backed financing, loan syndication, securities underwriting and customer-related trading. We also provide commercial loan servicing and technology solutions for the commercial real estate finance industry. Products and services are provided nationally.
Asset Management Groupprovides private banking for high net worth and ultra high net worth clients and institutional asset management. The Asset Management group is composed of two operating units:
•PNC Private Bank provides products and services to emerging affluent, high net worth and ultra high net worth individuals and their families, including investment and retirement planning, customized investment management, credit and cash management solutions, trust management and administration. In addition, multi-generational family planning services are also provided to ultra high net worth individuals and their families, which include estate, financial, tax, fiduciary and customized performance reporting through PNC Private Bank Hawthorn.
100 The PNC Financial Services Group, Inc. – Form 10-Q
•Institutional Asset Management provides outsourced chief investment officer, custody, private real estate, cash and fixed income client solutions, retirement plan fiduciary investment services to institutional clients, including corporations, healthcare systems, insurance companies, unions, municipalities and non-profits.
NOTE 15 FEE-BASED REVENUE FROM CONTRACTS WITH CUSTOMERS
As more fully described in Note 2423 Fee-based Revenue from Contracts with Customers in our 20222023 Form 10-K, a subset of our noninterest income relates to certain fee-based revenue within the scope of ASC Topic 606 - Revenue from Contracts with Customers (Topic 606).
Fee-based revenue within the scope of Topic 606 is recognized within our three reportable business segments: Retail Banking, Corporate & Institutional Banking and Asset Management Group. Interest income, income from lease contracts, fair value gains from financial instruments (including derivatives), income from mortgage servicing rights and guarantee products, letter of credit fees, non-refundable fees associated with acquiring or originating a loan and gains from the sale of financial assets are outside of the scope of Topic 606.
In the fourth quarter of 2022, PNC updated the name of the noninterest income line item “Capital markets related” to “Capital markets and advisory.” This update did not impact the components of the category. All periods presented herein reflect these changes. For a description of each updated noninterest income revenue stream, see Note 1 Accounting Policies.
Table 8078 presents the noninterest income recognized within the scope of Topic 606 for each of our three reportable business segments’ principal products and services, along with the relationship to the noninterest income revenue streams shown on our Consolidated Income Statement. For a description of the fee-based revenue and how it is recognized for each segment’s principal products and services, see Note 2423 Fee-based Revenue from Contracts with Customers in our 20222023 Form 10-K.
The PNC Financial Services Group, Inc. – Form 10-Q 10185
Table 80:78: Noninterest Income by Business Segment and Reconciliation to Consolidated Noninterest Income
| | | | | | | | | | | | | | | | | | | | | | | | | | | | | | | | | | | |
| | Three Months Ended
June 30, 2023 | Three Months Ended
June 30, 2022 |
In millions | | Retail Banking | | Corporate &
Institutional
Banking | | Asset Management Group | Retail Banking | | Corporate &
Institutional
Banking | | Asset Management Group |
| | | | | | | | | | | |
| Asset management and brokerage | | | | | | | | | | | |
| Asset management fees | | | | | | $ | 222 | | | | | | $ | 228 | |
| Brokerage fees | | $ | 124 | | | | | 2 | | $ | 135 | | | | | 2 | |
| Total asset management and brokerage | | 124 | | | | | 224 | | 135 | | | | | 230 | |
| Card and cash management | | | | | | | | | | | |
| Treasury management fees | | 11 | | | $ | 345 | | | | 10 | | | $ | 327 | | | |
| Debit card fees | | 178 | | | | | | 177 | | | | | |
| Net credit card fees (a) | | 61 | | | | | | 63 | | | | | |
| Merchant services | | 45 | | | 19 | | | | 52 | | | 14 | | | |
| Other | | 25 | | | | | | 27 | | | | | |
| Total card and cash management | | 320 | | | 364 | | | | 329 | | | 341 | | | |
| Lending and deposit services | | | | | | | | | | | |
| Deposit account fees | | 151 | | | | | | 145 | | | | | |
| Other | | 18 | | | 8 | | | | 17 | | | 9 | | | |
| Total lending and deposit services | | 169 | | | 8 | | | | 162 | | | 9 | | | |
| Residential and commercial mortgage (b) | | | | 40 | | | | | | 33 | | | |
| Capital markets and advisory | | | | 130 | | | | | | 272 | | | |
| Other | | | | 14 | | | | | | 9 | | | |
| Total in-scope noninterest income | | 613 | | | 556 | | | 224 | | 626 | | | 664 | | | 230 | |
| Out-of-scope noninterest income (c) | | 89 | | | 265 | | | 4 | | 122 | | | 304 | | | 4 | |
| Noninterest income by business segment | | $ | 702 | | | $ | 821 | | | $ | 228 | | $ | 748 | | | $ | 968 | | | $ | 234 | |
| Reconciliation to consolidated noninterest income | | | | | | | |
| Total in-scope business segment noninterest income | | | | | | $ | 1,393 | | | | | | $ | 1,520 | |
| Out-of-scope business segment noninterest income (c) | | | | | | 358 | | | | | | 430 | |
| Noninterest income from other segments | | | | | | 32 | | | | | | 115 | |
| Noninterest income as shown on the Consolidated Income Statement | | | | | | $ | 1,783 | | | | | | $ | 2,065 | |
| | | |
| | | | | | | | | | | | | | | | | | | | | | | | | |
| | | |
Three months ended March 31
In millions | | Retail Banking | | Corporate &
Institutional
Banking | | Asset Management Group | | | | | |
| 2024 | | | | | | | | | | | |
| Asset management and brokerage | | | | | | | | | | | |
| Asset management fees | | | | | | $ | 227 | | | | | | |
| Brokerage fees | | $ | 137 | | | | | | | | | | | |
| Total asset management and brokerage | | 137 | | | | | 227 | | | | | | |
| Card and cash management | | | | | | | | | | | |
| Treasury management fees | | 10 | | | $ | 357 | | | | | | | | |
| Debit card fees | | 167 | | | | | | | | | | | |
| Net credit card fees (a) | | 45 | | | | | | | | | | | |
| Merchant services | | 37 | | | 19 | | | | | | | | |
| Other | | 22 | | | | | | | | | | | |
| Total card and cash management | | 281 | | | 376 | | | | | | | | |
| Lending and deposit services | | | | | | | | | | | |
| Deposit account fees | | 155 | | | | | | | | | | |
| Other | | 16 | | | 9 | | | | | | | | |
| Total lending and deposit services | | 171 | | | 9 | | | | | | | | |
| Residential and commercial mortgage (b) | | | | 30 | | | | | | | | |
| Capital markets and advisory | | | | 190 | | | | | | | | |
| Other | | | | 17 | | | | | | | | |
| Total in-scope noninterest income | | 589 | | | 622 | | | 227 | | | | | | |
| Out-of-scope noninterest income (c) | | 175 | | | 266 | | | 3 | | | | | | |
| Noninterest income by business segment | | $ | 764 | | | $ | 888 | | | $ | 230 | | | | | | |
| Reconciliation to consolidated noninterest income | | For the three months ended March 31, 2024 | | | | | |
| Total in-scope business segment noninterest income | | | | | | $ | 1,438 | | | | | | |
| Out-of-scope business segment noninterest income (c) | | | | | | 444 | | | | | | |
| Noninterest income from other segments | | | | | | (1) | | | | | | |
| Noninterest income as shown on the Consolidated Income Statement | | | | | | $ | 1,881 | | | | | | |
| | | |
10286 The PNC Financial Services Group, Inc. – Form 10-Q
| | | (Continued from previous page) | (Continued from previous page) | | Six Months Ended
June 30, 2023 | Six Months Ended
June 30, 2022 |
In millions | | Retail Banking | | Corporate &
Institutional
Banking | | Asset
Management
Group | Retail Banking | | Corporate &
Institutional
Banking | | Asset
Management
Group |
| | (Continued from previous page) | |
| | (Continued from previous page) | |
Three months ended March 31
In millions | |
Three months ended March 31
In millions | |
Three months ended March 31
In millions | |
| 2023 | |
| 2023 | |
| 2023 | |
| Asset management and brokerage | |
| Asset management and brokerage | |
| Asset management and brokerage | Asset management and brokerage | | | | |
| Asset management fees | Asset management fees | | $ | 446 | | | | $ | 469 | |
| Asset management fees | |
| Asset management fees | |
| Brokerage fees | |
| Brokerage fees | |
| Brokerage fees | Brokerage fees | | $ | 254 | | | 4 | | $ | 269 | | | 4 | |
| Total asset management and brokerage | Total asset management and brokerage | | 254 | | | 450 | | 269 | | | 473 | |
| Total asset management and brokerage | |
| Total asset management and brokerage | |
| Card and cash management | |
| Card and cash management | |
| Card and cash management | Card and cash management | | | | |
| Treasury management fees | Treasury management fees | | 21 | | | $ | 673 | | | 19 | | | $ | 629 | | | |
| Treasury management fees | |
| Treasury management fees | |
| Debit card fees | |
| Debit card fees | |
| Debit card fees | Debit card fees | | 343 | | | | | | 338 | | | |
| Net credit card fees (a) | Net credit card fees (a) | | 119 | | | | | | 118 | | | |
| Net credit card fees (a) | |
| Net credit card fees (a) | |
| Merchant services | |
| Merchant services | |
| Merchant services | Merchant services | | 84 | | | 38 | | | 93 | | | 31 | | | |
| Other | Other | | 49 | | | | | | 50 | | | |
| Other | |
| Other | |
| Total card and cash management | |
| Total card and cash management | |
| Total card and cash management | Total card and cash management | | 616 | | | 711 | | | 618 | | | 660 | | | |
| Lending and deposit services | Lending and deposit services | | | | |
| Lending and deposit services | |
| Lending and deposit services | |
| Deposit account fees | |
| Deposit account fees | |
| Deposit account fees | Deposit account fees | | 306 | | | 287 | | | |
| Other | Other | | 36 | | | 16 | | | 34 | | | 17 | | | |
| Other | |
| Other | |
| Total lending and deposit services | |
| Total lending and deposit services | |
| Total lending and deposit services | Total lending and deposit services | | 342 | | | 16 | | | 321 | | | 17 | | | |
| Residential and commercial mortgage (b) | Residential and commercial mortgage (b) | | 82 | | | | | 64 | | | |
| Residential and commercial mortgage (b) | |
| Residential and commercial mortgage (b) | |
| Capital markets and advisory | |
| Capital markets and advisory | |
| Capital markets and advisory | Capital markets and advisory | | 286 | | | | | 409 | | | |
| Other | Other | | 22 | | | | | 22 | | | |
| Other | |
| Other | |
| Total in-scope noninterest income | |
| Total in-scope noninterest income | |
| Total in-scope noninterest income | Total in-scope noninterest income | | 1,212 | | | 1,117 | | | 450 | | 1,208 | | | 1,172 | | | 473 | |
| Out-of-scope noninterest income (c) | Out-of-scope noninterest income (c) | | 233 | | | 590 | | | 8 | | 285 | | | 600 | | | 9 | |
| Out-of-scope noninterest income (c) | |
| Out-of-scope noninterest income (c) | |
| Noninterest income by business segment | |
| Noninterest income by business segment | |
| Noninterest income by business segment | Noninterest income by business segment | | $ | 1,445 | | | $ | 1,707 | | | $ | 458 | | $ | 1,493 | | | $ | 1,772 | | | $ | 482 | |
| Reconciliation to consolidated noninterest income | Reconciliation to consolidated noninterest income | | | | | |
| Reconciliation to consolidated noninterest income | |
| Reconciliation to consolidated noninterest income | |
| Total in-scope business segment noninterest income | |
| Total in-scope business segment noninterest income | |
| Total in-scope business segment noninterest income | Total in-scope business segment noninterest income | | $ | 2,779 | | | | $ | 2,853 | |
| Out-of-scope business segment noninterest income (c) | Out-of-scope business segment noninterest income (c) | | 831 | | | | 894 | |
| Out-of-scope business segment noninterest income (c) | |
| Out-of-scope business segment noninterest income (c) | |
| Noninterest income from other segments | |
| Noninterest income from other segments | |
| Noninterest income from other segments | Noninterest income from other segments | | 191 | | | | 206 | |
| Noninterest income as shown on the Consolidated Income Statement | Noninterest income as shown on the Consolidated Income Statement | | $ | 3,801 | | | | $ | 3,953 | |
| Noninterest income as shown on the Consolidated Income Statement | |
| Noninterest income as shown on the Consolidated Income Statement | |
(a)Net credit card fees consists of interchange fees of $173$158 million and $172$160 million and credit card reward costs of $112$113 million and $109$102 million for the three months ended June 30,March 31, 2024 and 2023, and 2022, respectively. Net credit card fees consists of interchange fees of $333 million and $320 million and credit card reward costs of $214 million and $202 million for the six months ended June 30, 2023 and 2022, respectively.
(b)Residential mortgage noninterest income falls under the scope of other accounting and disclosure requirements outside of Topic 606 and is included within the out-of-scope noninterest income line for the Retail Banking segment.
(c)Out-of-scope noninterest income includes revenue streams that fall under the scope of other accounting and disclosure requirements outside of Topic 606.
NOTE 16 RSEGULATORYUBSEQUENT MEATTERSVENTS
FDIC Special Assessment PursuantOn April 8, 2024, Visa launched the first of its previously announced exchange offers allowing holders of the currently restricted outstanding shares of Visa Class B-1 common stock to Systemic Risk Determination
Inexchange all or a portion of such shares for equal parts of Visa Class B-2 common stock and Visa Class C common stock, and cash in lieu of any fractional shares. The exchange period is set to close on or about May 2023,3, 2024. Following the FDIC proposed a rule to implement a special assessment, in connection with the systemic risk determination announced in March 2023, to recover the cost associated with protecting uninsured depositors following the closuresclosing of Silicon Valley Bankthis initial exchange offer, and Signature Bank. Under the proposal, the FDIC would collect from PNC, along with other BHCs and insured depository institutions, special assessments at an annual rate of 12.5 basis pointsacceptance by Visa of PNC’s uninsured deposits reported as of December 31, 2022 (adjustedrequest to exclude the first $5 billion), over eight quarterly assessment periods, beginning after the first quarter 2024. We expect the FDIC will enact a special deposit insurance assessmentfully participate in the exchange program, PNC would be able to liquidate 50 percent of its holdings in Visa during the second halfand third quarters of 2023 that will significantly increase our FDIC deposit insurance costs. Based2024 by transferring newly held Visa Class C common stock in certain transactions where such stock would convert into publicly traded Visa Class A common stock, which could then be sold in market transactions, subject to certain timing restrictions. The Visa Class B-2 common stock PNC receives in the initial exchange offer would remain subject to the same restrictions currently imposed on the current proposal, PNC estimates our total cost to be approximately $468 million pre-tax, or $370 million after-tax, which would be incurredVisa Class B-1 common stock. Participation in the quarter the FDIC finalizes the rule. The total cost and timing is subjectexchange requires PNC to change pending the assessment’s finalization.
Proposed Expanded Risk-Based Capital Rules
On July 27, 2023, the Federal Reserve, OCC, and FDIC proposed for public comment an interagency ruleagree to implement the final components of the Basel III frameworka make-whole agreement that would significantly revise the capital requirements for large banking organizations, includingsubjects PNC and PNC Bank. The proposed rule will apply an expanded risk-based approach which leverages the Basel rules, including the calculation of risk-weighted assets, in addition to the current U.S. standardized approach. In addition, this proposal would align the regulatory capital elements and required deductions for Category III banking organizations suchsame indemnity obligations to Visa as are currently present. PNC and PNC Bank with those currently applicablehas tendered its Class B-1 common stock to Category I and II banking organizations. PNC and PNC Bank would be required to recognize most elements of AOCI in regulatory capital and deduct from CET1 capital, among other items, mortgage servicing assets and deferred tax assets that individually exceed 10 percent of CET1 capital orfully participate in the aggregate with other threshold items that exceed 15 percent of CET1 capital. PNC and PNC Bank would be required to calculate their risk-based capital ratios under the existingexchange program.
The PNC Financial Services Group, Inc. – Form 10-Q 103
standardized approach and the expanded risk-based approach and would be subject to the lower of the two resulting ratios for their risk-based capital minimums and buffer requirements, including the SCB. The proposed effective date is July 1, 2025, with certain provisions—including the recognition of AOCI elements in regulatory capital and the increase in risk-weighted assets due to the expanded risk-based approach—having a three-year phase-in period.
104 The PNC Financial Services Group, Inc. – Form 10-Q
STATISTICAL INFORMATION (UNAUDITED)
THE PNC FINANCIAL SERVICES GROUP, INC.
Average Consolidated Balance Sheet And Net Interest Analysis (a) (b) (c)
| | | | | | | | | | | | | | | | | | | | | | | | | | | | | | | | | | | | | | |
| | Six months ended June 30 |
| | 2023 | | 2022 | |
Taxable-equivalent basis
Dollars in millions | Average
Balances | | Interest Income/Expense | | Average Yields/Rates | | Average
Balances | | Interest Income/
Expense | | Average Yields/
Rates | |
| Assets | | | | | | | | | | | | |
| Interest-earning assets: | | | | | | | | | | | | |
| Investment securities | | | | | | | | | | | | |
| Securities available for sale | | | | | | | | | | | | |
| Residential mortgage-backed | | | | | | | | | | | | |
| Agency | $ | 31,513 | | | $ | 421 | | | 2.67 | % | | $ | 52,308 | | | $ | 495 | | | 1.89 | % | |
| Non-agency | 676 | | 30 | | | 8.95 | % | | 954 | | | 36 | | | 7.55 | % | |
| Commercial mortgage-backed | 3,025 | | 41 | | | 2.72 | % | | 4,793 | | | 58 | | | 2.40 | % | |
| Asset-backed | 397 | | 13 | | | 6.67 | % | | 4,296 | | | 32 | | | 1.49 | % | |
| U.S. Treasury and government agencies | 8,657 | | 92 | | | 2.12 | % | | 32,391 | | | 210 | | | 1.29 | % | |
| Other | 3,129 | | 40 | | | 2.51 | % | | 4,536 | | | 60 | | | 2.67 | % | |
| Total securities available for sale | 47,397 | | 637 | | | 2.69 | % | | 99,278 | | | 891 | | | 1.79 | % | |
| Securities held to maturity | | | | | | | | | | | | |
| Residential mortgage-backed | 45,323 | | | 618 | | | 2.73 | % | | 16,687 | | | 164 | | | 1.96 | % | |
| Commercial mortgage-backed | 2,424 | | | 62 | | | 5.15 | % | | 591 | | | 7 | | | 2.29 | % | |
| Asset-backed | 6,868 | | | 138 | | | 4.03 | % | | 2,071 | | | 20 | | | 1.91 | % | |
| U.S. Treasury and government agencies | 36,831 | | | 245 | | | 1.33 | % | | 14,618 | | | 80 | | | 1.09 | % | |
| Other | 3,365 | | 80 | | | 4.63 | % | | 1,068 | | | 22 | | | 4.19 | % | |
| Total securities held to maturity | 94,811 | | 1,143 | | | 2.41 | % | | 35,035 | | | 293 | | | 1.67 | % | |
| Total investment securities | 142,208 | | 1,780 | | | 2.50 | % | | 134,313 | | | 1,184 | | | 1.76 | % | |
| Loans | | | | | | | | | | | | |
| Commercial and industrial | 181,444 | | 5,041 | | | 5.52 | % | | 161,256 | | | 2,297 | | | 2.83 | % | |
| Commercial real estate | 36,023 | | 1,121 | | | 6.19 | % | | 34,237 | | | 518 | | | 3.01 | % | |
| Equipment lease financing | 6,408 | | 141 | | | 4.40 | % | | 6,150 | | | 113 | | | 3.68 | % | |
| Consumer | 55,045 | | 1,762 | | | 6.46 | % | | 54,757 | | | 1,271 | | | 4.68 | % | |
| Residential real estate | 46,107 | | 779 | | | 3.38 | % | | 41,385 | | | 636 | | | 3.07 | % | |
| Total loans | 325,027 | | 8,844 | | | 5.43 | % | | 297,785 | | | 4,835 | | | 3.24 | % | |
| Interest-earning deposits with banks | 32,736 | | 790 | | | 4.83 | % | | 51,120 | | | 107 | | | 0.42 | % | |
| Other interest-earning assets | 9,012 | | 264 | | | 5.86 | % | | 9,677 | | | 116 | | | 2.42 | % | |
| Total interest-earning assets/interest income | 508,983 | | 11,678 | | | 4.58 | % | | 492,895 | | | 6,242 | | | 2.53 | % | |
| Noninterest-earning assets | 49,918 | | | | | | 56,232 | | | | | | |
| Total assets | $ | 558,901 | | | | | | | $ | 549,127 | | | | | | |
| Liabilities and Equity | | | | | | | | | | | | |
| Interest-bearing liabilities: | | | | | | | | | | | | |
| Interest-bearing deposits | | | | | | | | | | | | |
| Money market | $ | 64,716 | | | 832 | | | 2.59 | % | | $ | 60,295 | | | 31 | | | 0.10 | % | |
| Demand | 124,243 | | 1,069 | | | 1.74 | % | | 116,024 | | | 51 | | | 0.09 | % | |
| Savings | 103,406 | | 585 | | | 1.14 | % | | 108,799 | | | 22 | | | 0.04 | % | |
| Time deposits | 21,436 | | 336 | | | 3.14 | % | | 13,195 | | | 11 | | | 0.15 | % | |
| Total interest-bearing deposits | 313,801 | | 2,822 | | | 1.81 | % | | 298,313 | | | 115 | | | 0.08 | % | |
| Borrowed funds | | | | | | | | | | | | |
| Federal Home Loan Bank borrowings | 32,909 | | 835 | | | 5.04 | % | | 3,508 | | | 22 | | | 1.24 | % | |
| Bank notes and senior debt | 20,298 | | 577 | | | 5.66 | % | | 17,089 | | | 112 | | | 1.30 | % | |
| Subordinated debt | 5,974 | | 177 | | | 5.94 | % | | 6,886 | | | 58 | | | 1.68 | % | |
| Other | 5,156 | | 97 | | | 3.74 | % | | 5,515 | | | 33 | | | 1.22 | % | |
| Total borrowed funds | 64,337 | | 1,686 | | | 5.22 | % | | 32,998 | | | 225 | | | 1.36 | % | |
| Total interest-bearing liabilities/interest expense | 378,138 | | 4,508 | | | 2.38 | % | | 331,311 | | | 340 | | | 0.20 | % | |
| Noninterest-bearing liabilities and equity: | | | | | | | | | | | | |
| Noninterest-bearing deposits | 117,155 | | | | | | 151,567 | | | | | | |
| Accrued expenses and other liabilities | 15,536 | | | | | | 16,245 | | | | | | |
| Equity | 48,072 | | | | | | 50,004 | | | | | | |
| Total liabilities and equity | $ | 558,901 | | | | | | | $ | 549,127 | | | | | | |
| Interest rate spread | | | | | 2.20 | % | | | | | | 2.33 | % | |
| Impact of noninterest-bearing sources | | | | | 0.61 | | | | | | | 0.06 | | |
| Net interest income/margin | | | $ | 7,170 | | | 2.81 | % | | | | $ | 5,902 | | | 2.39 | % | |
The PNC Financial Services Group, Inc. – Form 10-Q 10587
STATISTICAL INFORMATION (UNAUDITED)
THE PNC FINANCIAL SERVICES GROUP, INC.
Average Consolidated Balance Sheet And Net Interest Analysis (a) (b) (c)
| | (Continued from previous page) | Three months ended June 30 |
| | | | Three months ended March 31 |
| | | 2023 | | 2022 | |
Taxable-equivalent basis
Dollars in millions | Taxable-equivalent basis
Dollars in millions | Average
Balances | | Interest Income/Expense | | Average Yields/Rates | | Average
Balances | | Interest Income/
Expense | | Average Yields/
Rates | |
Taxable-equivalent basis
Dollars in millions | |
Taxable-equivalent basis
Dollars in millions | |
| Assets | |
| Assets | |
| Assets | Assets | | |
| Interest-earning assets: | Interest-earning assets: | | |
| Interest-earning assets: | |
| Interest-earning assets: | |
| Investment securities | |
| Investment securities | |
| Investment securities | Investment securities | | |
| Securities available for sale | Securities available for sale | | |
| Securities available for sale | |
| Securities available for sale | |
| Residential mortgage-backed | |
| Residential mortgage-backed | |
| Residential mortgage-backed | Residential mortgage-backed | | |
| Agency | Agency | $ | 31,180 | | | $ | 208 | | | 2.67 | % | | $ | 37,285 | | | $ | 202 | | | 2.17 | % | |
| Agency | |
| Agency | |
| Non-agency | |
| Non-agency | |
| Non-agency | Non-agency | 663 | | 15 | | | 9.39 | % | | 902 | | | 17 | | | 7.56 | % | |
| Commercial mortgage-backed | Commercial mortgage-backed | 2,948 | | 21 | | | 2.84 | % | | 4,362 | | | 27 | | | 2.45 | % | |
| Commercial mortgage-backed | |
| Commercial mortgage-backed | |
| Asset-backed | |
| Asset-backed | |
| Asset-backed | Asset-backed | 575 | | 9 | | | 6.56 | % | | 2,388 | | | 11 | | | 1.84 | % | |
| U.S. Treasury and government agencies | U.S. Treasury and government agencies | 8,231 | | 45 | | | 2.20 | % | | 17,480 | | | 70 | | | 1.60 | % | |
| U.S. Treasury and government agencies | |
| U.S. Treasury and government agencies | |
| Other | |
| Other | |
| Other | Other | 2,997 | | 21 | | | 2.55 | % | | 4,200 | | | 28 | | | 2.59 | % | |
| Total securities available for sale | Total securities available for sale | 46,594 | | 319 | | | 2.73 | % | | 66,617 | | | 355 | | | 2.13 | % | |
| Total securities available for sale | |
| Total securities available for sale | |
| Securities held to maturity | |
| Securities held to maturity | |
| Securities held to maturity | Securities held to maturity | | |
| Residential mortgage-backed | Residential mortgage-backed | 45,033 | | | 306 | | | 2.72 | % | | 33,086 | | | 164 | | | 1.98 | % | |
| Residential mortgage-backed | |
| Residential mortgage-backed | |
| Commercial mortgage-backed | |
| Commercial mortgage-backed | |
| Commercial mortgage-backed | Commercial mortgage-backed | 2,396 | | | 32 | | | 5.35 | % | | 1,175 | | | 7 | | | 2.30 | % | |
| Asset-backed | Asset-backed | 6,712 | | | 68 | | | 4.10 | % | | 4,119 | | | 20 | | | 1.92 | % | |
| Asset-backed | |
| Asset-backed | |
| U.S. Treasury and government agencies | |
| U.S. Treasury and government agencies | |
| U.S. Treasury and government agencies | U.S. Treasury and government agencies | 36,912 | | 123 | | | 1.34 | % | | 28,167 | | | 74 | | | 1.05 | % | |
| Other | Other | 3,391 | | 41 | | | 4.65 | % | | 1,560 | | | 16 | | | 4.21 | % | |
| Other | |
| Other | |
| Total securities held to maturity | |
| Total securities held to maturity | |
| Total securities held to maturity | Total securities held to maturity | 94,444 | | 570 | | | 2.41 | % | | 68,107 | | | 281 | | | 1.65 | % | |
| Total investment securities | Total investment securities | 141,038 | | 889 | | | 2.52 | % | | 134,724 | | | 636 | | | 1.89 | % | |
| Total investment securities | |
| Total investment securities | |
| Loans | |
| Loans | |
| Loans | Loans | | |
| Commercial and industrial | Commercial and industrial | 180,878 | | 2,608 | | | 5.70 | % | | 166,968 | | | 1,225 | | | 2.90 | % | |
| Commercial and industrial | |
| Commercial and industrial | |
| Commercial real estate | |
| Commercial real estate | |
| Commercial real estate | Commercial real estate | 35,938 | | 578 | | | 6.37 | % | | 34,467 | | | 276 | | | 3.15 | % | |
| Equipment lease financing | Equipment lease financing | 6,364 | | 72 | | | 4.51 | % | | 6,200 | | | 56 | | | 3.62 | % | |
| Equipment lease financing | |
| Equipment lease financing | |
| Consumer | |
| Consumer | |
| Consumer | Consumer | 55,070 | | 901 | | | 6.57 | % | | 54,551 | | | 637 | | | 4.68 | % | |
| Residential real estate | Residential real estate | 46,284 | | 395 | | | 3.41 | % | | 42,604 | | | 330 | | | 3.11 | % | |
| Residential real estate | |
| Residential real estate | |
| Total loans | |
| Total loans | |
| Total loans | Total loans | 324,534 | | 4,554 | | | 5.57 | % | | 304,790 | | | 2,524 | | | 3.29 | % | |
| Interest-earning deposits with banks | Interest-earning deposits with banks | 31,433 | | 400 | | | 5.10 | % | | 39,689 | | | 78 | | | 0.79 | % | |
| Interest-earning deposits with banks | |
| Interest-earning deposits with banks | |
| Other interest-earning assets | |
| Other interest-earning assets | |
| Other interest-earning assets | Other interest-earning assets | 9,215 | | 138 | | | 5.96 | % | | 9,935 | | | 68 | | | 2.76 | % | |
| Total interest-earning assets/interest income | Total interest-earning assets/interest income | 506,220 | | 5,981 | | | 4.70 | % | | 489,138 | | | 3,306 | | | 2.69 | % | |
| Total interest-earning assets/interest income | |
| Total interest-earning assets/interest income | |
| Noninterest-earning assets | |
| Noninterest-earning assets | |
| Noninterest-earning assets | Noninterest-earning assets | 49,287 | | 57,740 | | | |
| Total assets | Total assets | $ | 555,507 | | | $ | 546,878 | | | |
| Total assets | |
| Total assets | |
| Liabilities and Equity | |
| Liabilities and Equity | |
| Liabilities and Equity | Liabilities and Equity | | | | | |
| Interest-bearing liabilities: | Interest-bearing liabilities: | | |
| Interest-bearing liabilities: | |
| Interest-bearing liabilities: | |
| Interest-bearing deposits | |
| Interest-bearing deposits | |
| Interest-bearing deposits | Interest-bearing deposits | | |
| Money market | Money market | $ | 63,691 | | | $ | 443 | | | 2.79 | % | | $ | 58,019 | | | $ | 27 | | | 0.19 | % | |
| Money market | |
| Money market | |
| Demand | |
| Demand | |
| Demand | Demand | 124,111 | | 584 | | | 1.89 | % | | 119,636 | | | 44 | | | 0.15 | % | |
| Savings | Savings | 102,415 | | 321 | | | 1.26 | % | | 109,063 | | | 12 | | | 0.04 | % | |
| Savings | |
| Savings | |
| Time deposits | |
| Time deposits | |
| Time deposits | Time deposits | 22,342 | | 183 | | | 3.26 | % | | 10,378 | | | 5 | | | 0.18 | % | |
| Total interest-bearing deposits | Total interest-bearing deposits | 312,559 | | 1,531 | | | 1.96 | % | | 297,096 | | | 88 | | | 0.12 | % | |
| Total interest-bearing deposits | |
| Total interest-bearing deposits | |
| Borrowed funds | |
| Borrowed funds | |
| Borrowed funds | Borrowed funds | | |
| Federal Home Loan Bank borrowings | Federal Home Loan Bank borrowings | 33,752 | | 451 | | | 5.28 | % | | 6,978 | | | 22 | | | 1.24 | % | |
| Bank notes and senior debt | 20,910 | | 312 | | | 5.91 | % | | 16,172 | | | 66 | | | 1.61 | % | |
| Federal Home Loan Bank borrowings | |
| Federal Home Loan Bank borrowings | |
| Senior debt | |
| Senior debt | |
| Senior debt | |
| Subordinated debt | |
| Subordinated debt | |
| Subordinated debt | Subordinated debt | 5,850 | | 90 | | | 6.19 | % | | 6,998 | | | 34 | | | 1.94 | % | |
| Other | Other | 5,180 | | 50 | | | 3.79 | % | | 5,508 | | | 20 | | | 1.46 | % | |
| Other | |
| Other | |
| Total borrowed funds | |
| Total borrowed funds | |
| Total borrowed funds | Total borrowed funds | 65,692 | | 903 | | | 5.44 | % | | 35,656 | | | 142 | | | 1.58 | % | |
| Total interest-bearing liabilities/interest expense | Total interest-bearing liabilities/interest expense | 378,251 | | 2,434 | | | 2.56 | % | | 332,752 | | | 230 | | | 0.27 | % | |
| Total interest-bearing liabilities/interest expense | |
| Total interest-bearing liabilities/interest expense | |
| Noninterest-bearing liabilities and equity: | |
| Noninterest-bearing liabilities and equity: | |
| Noninterest-bearing liabilities and equity: | Noninterest-bearing liabilities and equity: | | |
| Noninterest-bearing deposits | Noninterest-bearing deposits | 113,178 | | 149,432 | | | |
| Noninterest-bearing deposits | |
| Noninterest-bearing deposits | |
| Accrued expenses and other liabilities | |
| Accrued expenses and other liabilities | |
| Accrued expenses and other liabilities | Accrued expenses and other liabilities | 15,063 | | 17,116 | | | |
| Equity | Equity | 49,015 | | 47,578 | | | |
| Equity | |
| Equity | |
| Total liabilities and equity | |
| Total liabilities and equity | |
| Total liabilities and equity | Total liabilities and equity | $ | 555,507 | | | | | | | $ | 546,878 | | | | | | |
| Interest rate spread | Interest rate spread | | | 2.14 | % | | | 2.42 | % | |
| Interest rate spread | |
| Interest rate spread | |
| Impact of noninterest-bearing sources | |
| Impact of noninterest-bearing sources | |
| Impact of noninterest-bearing sources | Impact of noninterest-bearing sources | | | | | 0.65 | | | | | | | 0.08 | | |
| Net interest income/margin | Net interest income/margin | | | $ | 3,547 | | | 2.79 | % | | | | $ | 3,076 | | | 2.50 | % | |
| Net interest income/margin | |
| Net interest income/margin | |
(continued on the following page)
88 The PNC Financial Services Group, Inc. – Form 10-Q
Average Consolidated Balance Sheet And Net Interest Analysis (a) (b) (c) (Continued) | | | | | | | | | | | | | | | | | | | | | | | | | | | |
| | Three months ended December 31 | |
| | 2023 | | | | |
Taxable-equivalent basis
Dollars in millions | Average Balances | | Interest Income/
Expense | | Average Yields/
Rates | | | | | | | | |
| Assets | | | | | | | | | | | | | |
| Interest-earning assets: | | | | | | | | | | | | | |
| Investment securities | | | | | | | | | | | | | |
| Securities available for sale | | | | | | | | | | | | | |
| Residential mortgage-backed | | | | | | | | | | | | | |
| Agency | $ | 30,980 | | | $ | 220 | | | 2.83 | % | | | | | | | | |
| Non-agency | 599 | | | 13 | | | 9.15 | % | | | | | | | | |
| Commercial mortgage-backed | 2,727 | | 20 | | | 3.00 | % | | | | | | | | |
| Asset-backed | 1,080 | | 17 | | | 6.41 | % | | | | | | | | |
| U.S. Treasury and government agencies | 7,788 | | 44 | | | 2.22 | % | | | | | | | | |
| Other | 2,899 | | 19 | | | 2.61 | % | | | | | | | | |
| Total securities available for sale | 46,073 | | 333 | | | 2.89 | % | | | | | | | | |
| Securities held to maturity | | | | | | | | | | | | | |
| Residential mortgage-backed | 43,336 | | | 298 | | | 2.75 | % | | | | | | | | |
| Commercial mortgage-backed | 2,318 | | | 32 | | | 5.53 | % | | | | | | | | |
| Asset-backed | 6,040 | | | 69 | | | 4.57 | % | | | | | | | | |
| U.S. Treasury and government agencies | 36,457 | | | 120 | | | 1.32 | % | | | | | | | | |
| Other | 3,164 | | 38 | | | 4.72 | % | | | | | | | | |
| Total securities held to maturity | 91,315 | | 557 | | | 2.44 | % | | | | | | | | |
| Total investment securities | 137,388 | | 890 | | | 2.59 | % | | | | | | | | |
| Loans | | | | | | | | | | | | | |
| Commercial and industrial | 180,566 | | 2,828 | | | 6.13 | % | | | | | | | | |
| Commercial real estate | 35,617 | | 608 | | | 6.68 | % | | | | | | | | |
| Equipment lease financing | 6,430 | | 80 | | | 4.98 | % | | | | | | | | |
| Consumer | 54,512 | | 963 | | | 7.00 | % | | | | | | | | |
| Residential real estate | 47,444 | | 427 | | | 3.60 | % | | | | | | | | |
| Total loans | 324,569 | | 4,906 | | | 5.94 | % | | | | | | | | |
| Interest-earning deposits with banks | 42,627 | | 590 | | | 5.53 | % | | | | | | | | |
| Other interest-earning assets | 8,738 | | 152 | | | 6.96 | % | | | | | | | | |
| Total interest-earning assets/interest income | 513,322 | | 6,538 | | | 5.03 | % | | | | | | | | |
| Noninterest-earning assets | 48,997 | | | | | | | | | | | | |
| Total assets | $ | 562,319 | | | | | | | | | | | | | |
| Liabilities and Equity | | | | | | | | | | | | | |
| Interest-bearing liabilities: | | | | | | | | | | | | | |
| Interest-bearing deposits | | | | | | | | | | | | | |
| Money market | $ | 66,393 | | | 556 | | | 3.32 | % | | | | | | | | |
| Demand | 124,124 | | 705 | | | 2.26 | % | | | | | | | | |
| Savings | 98,490 | | 417 | | | 1.68 | % | | | | | | | | |
| Time deposits | 30,357 | | 317 | | | 4.11 | % | | | | | | | | |
| Total interest-bearing deposits | 319,364 | | 1,995 | | | 2.48 | % | | | | | | | | |
| Borrowed funds | | | | | | | | | | | | | |
| Federal Home Loan Bank borrowings | 37,783 | | 546 | | | 5.66 | % | | | | | | | | |
| Senior debt | 26,634 | | 426 | | | 6.25 | % | | | | | | | | |
| Subordinated debt | 5,091 | | 84 | | | 6.63 | % | | | | | | | | |
| Other | 3,384 | | 48 | | | 5.55 | % | | | | | | | | |
| Total borrowed funds | 72,892 | | 1,104 | | | 5.94 | % | | | | | | | | |
| Total interest-bearing liabilities/interest expense | 392,256 | | 3,099 | | | 3.10 | % | | | | | | | | |
| Noninterest-bearing liabilities and equity: | | | | | | | | | | | | | |
| Noninterest-bearing deposits | 104,567 | | | | | | | | | | | | |
| Accrued expenses and other liabilities | 16,328 | | | | | | | | | | | | |
| Equity | 49,168 | | | | | | | | | | | | |
| Total liabilities and equity | $ | 562,319 | | | | | | | | | | | | | |
| Interest rate spread | | | | | 1.93 | % | | | | | | | | |
| Impact of noninterest-bearing sources | | | | | 0.73 | | | | | | | | | |
| Net interest income/margin | | | $ | 3,439 | | | 2.66 | % | | | | | | | | |
The PNC Financial Services Group, Inc. – Form 10-Q 89
(a)Nonaccrual loans are included in loans, net of unearned income. The impact of financial derivatives used in interest rate risk management is included in the interest income/expense and average yields/rates of the related assets and liabilities. Basis adjustments related to hedged items are included in noninterest-earning assets and noninterest-bearing liabilities. Average balances of securities are based on amortized historical cost (excluding adjustments to fair value, which are included in other assets). Average balances for certain loans and borrowed funds accounted for at fair value are included in noninterest-earning assets and noninterest-bearing liabilities, with changes in fair value recorded in Noninterest income.
(b)Loan fees for the three months ended June 30,March 31, 2024, December 31, 2023 and June 30, 2022March 31, 2023 were $44$47 million, $46 million and $38 million, respectively. Loan fees for the six months ended June 30, 2023 and June 30, 2022 were $90 million and $98$46 million, respectively.
(c)Interest income calculated as taxable-equivalent interest income. To provide more meaningful comparisons of interest income and yields for all interest-earning assets, as well as net interest margins, we use interest income on a taxable-equivalent basis in calculating average yields and net interest margin by increasing the interest income earned on tax-exempt assets to make it fully equivalent to interest income earned on taxable investments. This adjustment is not permitted under GAAP. See Reconciliation of Taxable-Equivalent Net Interest Income in this Statistical Information section for more information.
106 The PNC Financial Services Group, Inc. – Form 10-Q
RECONCILIATION OF TAXABLE-EQUIVALENT NET INTEREST INCOME (non-GAAP)(non-GAAP) (a)
| | | |
| | | | | Six months ended | | Three months ended |
| In millions | In millions | | June 30, 2023 | | | | June 30, 2022 | | June 30, 2023 | June 30, 2022 |
| In millions | |
| In millions | |
| Net interest income (GAAP) | |
| Net interest income (GAAP) | |
| Net interest income (GAAP) | Net interest income (GAAP) | | $ | 7,095 | | | | | $ | 5,855 | | | $ | 3,510 | | $ | 3,051 | |
| Taxable-equivalent adjustments | Taxable-equivalent adjustments | | 75 | | | | | 47 | | | 37 | | 25 | |
| Taxable-equivalent adjustments | |
| Taxable-equivalent adjustments | |
| Net interest income (non-GAAP) | Net interest income (non-GAAP) | | $ | 7,170 | | | | | $ | 5,902 | | | $ | 3,547 | | $ | 3,076 | |
| Net interest income (non-GAAP) | |
| Net interest income (non-GAAP) | |
(a)The interest income earned on certain interest-earning assets is completely or partially exempt from federal income tax. As such, these tax-exempt instruments typically yield lower returns than taxable investments. To provide more meaningful comparisons of net interest income, we use interest income on a taxable-equivalent basis by increasing the interest income earned on tax-exempt assets to make it fully equivalent to interest income earned on taxable investments. This adjustment is not permitted under GAAP.
RECONCILIATION OF CORE NONINTEREST EXPENSE (non-GAAP) (a)
| | | | | | | | | | | | | | | | | | | | | | | |
| | | | Three months ended | | Year ended | | | |
| In millions | | | | March 31, 2024 | | December 31, 2023 | | | |
| Noninterest expense | | | | $ | 3,334 | | | $ | 14,012 | | | | |
| Less non-core noninterest expense adjustments: | | | | | | | | | |
| FDIC special assessment costs | | | | 130 | | | 515 | | | | |
| Workforce reduction charges | | | | | | 150 | | | | |
| Total non-core noninterest expense adjustments | | | | $ | 130 | | | $ | 665 | | | | |
| Core noninterest expense (non-GAAP) | | | | $ | 3,204 | | | $ | 13,347 | | | | |
| | | | | | | | | |
| | | | | | | | | |
| | | | | | | | | |
| | | | | | | | | |
| | | | | | | | | |
| | | | | | | | | |
(a)Core noninterest expense is a non-GAAP measure calculated based on Noninterest expense less costs related to the FDIC’s special assessment and the workforce reduction that were incurred outside of our core business operations. We believe this non-GAAP measure to be a useful tool for comparison of operating expenses incurred during the normal course of business.
GLOSSARY
DEFINED TERMS
For a glossary of terms commonly used in our filings, please see the glossary of terms included in our 20222023 Form 10-K.
90 The PNC Financial Services Group, Inc. – Form 10-Q
ACRONYMS
| | | | | | | | | | | | | | |
| ACL | Allowance for credit losses | | LCRLGD | Liquidity Coverage RatioLoss given default |
| ALCO | PNC’s Asset and Liability Committee | | LIHTC | Low income housing tax credit |
| ALLL | Allowance for loan and lease losses | | LGDLLC | Loss given defaultLimited liability company |
| AOCI | Accumulated other comprehensive income | | LIBORLTV | London Interbank Offered RateLoan-to-value ratio |
| ASC | Accounting Standards Codification | | LIHTC | Low income housing tax credit |
ASU | Accounting Standards Update | | LLC | Limited liability company |
BHC | Bank holding company | | LTV | Loan-to-value ratio |
bps | Basis points | | MD&A | Management’s Discussion and Analysis of Financial Condition and Results of Operations |
BSBYASU | Bloomberg Short-Term Bank Yield IndexAccounting Standards Update | | MSR | Mortgage servicing right |
CARES ActBHC | Coronavirus Aid, Relief and Economic Security ActBank holding company | | NMTC | New market tax credit |
| bps | Basis points | | NSFR | Net Stable Funding Ratio |
| CCAR | Comprehensive Capital Analysis and Review | | OCC | Office of the Comptroller of the Currency |
| CECL | Current expected credit losses | | OREO | Other real estate owned |
| CET1 | Common equity tier 1 | | OTC | Over-the-counter |
CFPB | Consumer Financial Protection Bureau | | PCD | Purchased credit deteriorated |
| FDIC | Federal Deposit Insurance Corporation | | PDPCD | Probability of defaultPurchased credit deteriorated |
| FDM | Financial Difficulty Modification | | PPPPD | Paycheck Protection ProgramProbability of default |
| FHLB | Federal Home Loan Bank | | RAC | PNC’s Reserve Adequacy Committee |
| FHLMC | Federal Home Loan Mortgage Corporation | | ROAP | Removal of account provisions |
| FICO | Fair Isaac Corporation (credit score) | | SCB | Stress capital buffer |
| FNMA | Federal National Mortgage Association | | SEC | Securities and Exchange Commission |
| FOMC | Federal Open Market Committee | | SOFR | Secured Overnight Financing Rate |
| GAAP | Accounting principles generally accepted in the United States of America | | SPE | Special purpose entity |
| GDP | Gross Domestic Product | | TDR | Troubled debt restructuring |
| GNMA | Government National Mortgage Association | | U.S. | United States of America |
GSIB | Globally systemically important bank | | VaR | Value-at-risk |
HPI | Home price index | | VIE | Variable interest entity |
| ISDA | International Swaps and Derivatives Association | | VaR | Value-at-risk |
| LCR | Liquidity Coverage Ratio | | VIE | Variable interest entity |
PART II – OTHER INFORMATION
ITEM 1. LEGAL PROCEEDINGS
See the information set forth in Note 13 Legal Proceedings, which is incorporated by reference in response to this item.
The PNC Financial Services Group, Inc. – Form 10-Q 107
ITEM 1A. RISK FACTORS
There are no material changes from any of the risk factors previously disclosed in our first quarter 2023 Form 10-Q and 2022 Form 10-K in response to Part II, Item 1A and Part I, Item 1A, respectively.1A.
The PNC Financial Services Group, Inc. – Form 10-Q 91
ITEM 2. UNREGISTERED SALES OF EQUITY SECURITIES AND USE OF PROCEEDS
Unregistered Sales of Equity Securities
None.
Equity Security Repurchases
Details of our repurchases of PNC common stock during the secondfirst quarter of 20232024 are included in the following table.table:
| | | | | | | | | | | | | | |
2023 period
In thousands, except per share data | Total shares purchased (a) | Average price paid per share | Total shares purchased as part of publicly announced programs (b) | Maximum number of shares that may yet be purchased under the programs (b) |
| April 1 - 30 | 95 | | $ | 125.31 | | 79 | | 46,524 | |
| May 1 - 31 | 188 | | $ | 117.13 | | 188 | | 46,336 | |
| June 1 - 30 | 836 | | $ | 125.64 | | 836 | | 45,500 | |
| Total | 1,119 | | $ | 124.18 | | 1,103 | | |
| | | | | | | | | | | | | | |
2024 period
In thousands, except per share data | Total shares purchased (a) | Average price paid per share | Total shares purchased as part of publicly announced programs (b) | Maximum number of shares that may yet be purchased under the programs (b) |
| January 1 - 31 | 181 | | $ | 150.17 | | 180 | | 44,805 | |
| February 1 - 29 | 860 | | $ | 147.55 | | 424 | | 44,381 | |
| March 1 - 31 | 302 | | $ | 152.29 | | 302 | | 44,079 | |
| Total | 1,343 | | $ | 148.97 | | 906 | | |
(a)Includes PNC common stock purchased in connection with our various employee benefit plans generally related to forfeitures of unvested restricted stock awards and shares used to cover employee payroll tax withholding requirements. See Note 1716 Employee Benefit Plans and Note 1817 Stock Based Compensation Plans in our 20222023 Form 10-K, which include additional information regarding our employee benefit and equity compensation plans that use PNC common stock.
(b)Consistent with the SCB framework, which allows for capital returnsreturn in amounts in excess of the SCB minimum levels, (the regulatory minimum (4.5%) plus our SCB), our Board of Directors has authorized a repurchase framework under the previously approved repurchase program of up to 100 million common shares, of which approximately 46%44% were still available for repurchase at June 30, 2023. PNC's SCB through September 30, 2023 is 2.9%. Based on the resultsMarch 31, 2024. In light of the Federal Reserve's 2023 annual stress test, PNC'sbanking agencies proposed rules to adjust the Basel III capital framework, second quarter of 2024 share repurchase activity is expected to approximate the recent quarterly average share repurchase levels. PNC continues to evaluate the potential impact of the proposed rules and may adjust share repurchase activity depending on market and economic conditions, as well as other factors. PNC’s SCB for the four-quarter period beginning October 1, 2023 will improve tois the regulatory minimum of 2.5%.
ITEM 5. OTHER INFORMATION
Director or Executive Officer Rule 10b5-1 and Non-Rule 10b5-1 Trading Arrangements
The following provides a description of Rule 10b5-1 trading arrangements (as defined in Item 408 of Regulation S-K under the Securities Exchange Act of 1934) adopted during the three months ended March 31, 2024, by any director or executive officer who is subject to the filing requirements of Section 16 of the Securities Exchange Act of 1934:
•On March 15, 2024, William S. Demchak, Chairman and Chief Executive Officer, adopted a trading arrangement intended to satisfy the affirmative defense of Rule 10b5-1(c). The duration of the arrangement is from March 15, 2024 to June 13, 2025, and the maximum aggregate number of shares to be sold under the arrangement is 64,584 of the approximately 570,000 shares currently held by Mr. Demchak. Sales under the trading arrangement will not commence until completion of the required cooling off period under Rule 10b5-1.
During the three months ended June 30, 2023,March 31, 2024, none of PNC’s directors or executive officers adopted a non-Rule 10b5-1 trading arrangement (as defined in Item 408 of Regulation S-K under the Securities Exchange Act of 1934). Additionally, during the three months ended March 31, 2024, none of PNC’s directors or executive officers terminated or modified a Rule 10b5-1 trading arrangement or non-Rule 10b5-1 trading arrangement.
10892 The PNC Financial Services Group, Inc. – Form 10-Q
ITEM 6. EXHIBITS
The following exhibit index lists Exhibits filed or furnished with this Quarterly Report on Form 10-Q:
| | | | | | | | |
EXHIBIT INDEX |
| | |
10.33 | | |
| | |
10.34 | | |
| | |
10.35 | | |
| | |
10.36 | | |
| | |
| 22 | | |
| | |
| 31.1 | | |
| |
| 31.2 | | |
| |
| 32.1 | | |
| |
| 32.2 | | |
| | |
| 101.INS | | Inline XBRL Instance Document* |
| | |
| 101.SCH | | Inline XBRL Taxonomy Extension Schema Document |
| | |
| 101.CAL | | Inline XBRL Taxonomy Extension Calculation Linkbase Document |
| | |
| 101.LAB | | Inline XBRL Taxonomy Extension Label Linkbase Document |
| | |
| 101.PRE | | Inline XBRL Taxonomy Extension Presentation Linkbase Document |
| | |
| 101.DEF | | Inline XBRL Taxonomy Extension Definition Linkbase Document |
| | |
| 104 | | Cover Page Interactive Data File (formatted as inline XBRL and contained in Exhibit 101) |
| | |
| | |
| | |
*The instance document does not appear in the interactive data file because its XBRL tags are embedded within the inline XBRL.
You can obtain copies of these Exhibits electronically at the SEC’s website at www.sec.gov. The Exhibits are also available as part of this Form 10-Q on PNC’s corporate website at www.pnc.com/secfilings. Shareholders and bondholders may also obtain copies of Exhibits, without charge, by contacting Investor Relations at 800-843-2206 or via e-mail at investor.relations@pnc.com. The Interactive Data File (XBRL) exhibit is only available electronically.
CORPORATE INFORMATION
The PNC Financial Services Group, Inc.
Internet Information
The PNC Financial Services Group, Inc.’s financial reports and information about its products and services are available on the internet at www.pnc.com. We provide information for investors on our corporate website under “About Us – Investor Relations.” We use our account with X, formerly known as Twitter, account, @pncnews, as an additional way of disseminating to the public information that may be relevant to investors.
We generally post the following under “About Us – Investor Relations” shortly before or promptly following its first use or release: financially-related press releases, including earnings releases and supplemental financial information, various SEC filings, including annual, quarterly and current reports and proxy statements, presentation materials associated with earnings and other investor conference calls or events, and access to live and recorded audio from earnings and other investor conference calls or events. In some cases, we may post the presentation materials for other investor conference calls or events several days prior to the call or event. For earnings and other conference calls or events, we generally include in our posted materials a cautionary statement regarding forward-looking and non-GAAP financial information and we provide GAAP reconciliations when we include non-GAAP financial information. Such GAAP reconciliations may be in materials for the applicable presentation, in materials for prior presentations or in our annual, quarterly or current reports.
When warranted, we will also use our website to expedite public access to time-critical information regarding PNC instead of using a press release or a filing with the SEC for first disclosure of the information. In some circumstances, the information may be relevant to investors but directed at customers, in which case it may be accessed directly through the home page rather than “About Us – Investor Relations.”
The PNC Financial Services Group, Inc. – Form 10-Q 109
We are required to provide additional public disclosure regarding estimated income, losses and pro forma regulatory capital ratios under supervisory and PNC-developed hypothetical severely adverse economic scenarios, as well as information concerning our capital stress testing processes, pursuant to the stress testing regulations adopted by the Federal Reserve and the OCC. We are also required to make certain additional regulatory capital-related public disclosures about our capital structure, risk exposures, risk assessment processes, risk-weighted assets and overall capital adequacy, including market risk-related disclosures, under the
The PNC Financial Services Group, Inc. – Form 10-Q 93
regulatory capital rules adopted by the Federal banking agencies. Similarly, the Federal Reserve’s rules require quantitative and qualitative disclosures about our LCR and NSFR. Under these regulations, we may satisfy these requirements through postings on our website, and we have done so and expect to continue to do so without also providing disclosure of this information through filings with the SEC.
Other information posted on our corporate website that may not be available in our filings with the SEC includes information relating to our corporate governance and annual communications from our chairman to shareholders.
Where we have included internet addresses in this Report, such as our internet address and the internet address of the SEC, we have included those internet addresses as inactive textual references only. Except as specifically incorporated by reference into this Report, information on those websites is not part hereof.
Financial Information
We are subject to the informational requirements of the Exchange Act and, in accordance with the Exchange Act, we file annual, quarterly and current reports, proxy statements and other information with the SEC. Our SEC File Number is 001-09718. You can obtain copies of these and other filings, including exhibits, electronically at the SEC’s internet website at www.sec.gov or on our corporate internet website at www.pnc.com/secfilings. Shareholders and bond holders may also obtain copies of these filings without charge by contacting PNC Investor Relations at 800-843-2206, via the information request form at www.pnc.com/investorrelations for copies without exhibits, or via email to investor.relations@pnc.com for copies of exhibits, including financial statements and schedule exhibits where applicable. The interactive date file (XBRL) is only available electronically.
Corporate Governance at PNC
Information about our Board of Directors and its committees and corporate governance, including our PNC Code of Business Conduct and Ethics (as amended from time to time), is available on our website at www.pnc.com/corporategovernance. In addition, any future waivers from a provision of the PNC Code of Business Conduct and Ethics covering any of our directors or executive officers (including our principal executive officer, principal financial officer and principal accounting officer or controller) will be posted at this internet address.
Shareholders who would like to request printed copies of the PNC Code of Business Conduct and Ethics or our Corporate Governance Guidelines or the charters of our Board’s Audit, Nominating and Governance, Human Resources or Risk Committees (all of which are posted on our website at www.pnc.com/corporategovernance) may do so by sending their requests to our Corporate Secretary at The PNC Financial Services Group, Inc. at The Tower at PNC Plaza, 300 Fifth Avenue, Pittsburgh, Pennsylvania 15222-2401. Copies will be provided without charge.
Inquiries
For financial services, call 888-762-2265.
Registered shareholders should contact Shareholder Services at 800-982-7652. Hearing impaired: 800-952-9245.
Analysts and institutional investors should contact Bryan Gill, Executive Vice President, Director of Investor Relations, at 412-768-4143 or via email at investor.relations@pnc.com.
News media representatives should contact PNC Media Relations at 412-762-4550 or via email at media.relations@pnc.com.
Dividend Policy
Holders of PNC common stock are entitled to receive dividends when declared by our Board of Directors out of funds legally available for this purpose. Our Board of Directors may not pay or set apart dividends on the common stock until dividends for all past dividend periods on any series of outstanding preferred stock and certain outstanding capital securities issued by the parent company
have been paid or declared and set apart for payment. The Board of Directors presentlycurrently intends to continue the policy of paying quarterly cash dividends. The amount of any future dividends will depend on economic and market conditions, our financial condition and operating results, and other factors, including contractual restrictions and applicable government regulations and policies (such as those relating to the ability of bank and non-bank subsidiaries to pay dividends to the parent company and regulatory capital limitations). The amount of our dividend is also currently subject to the results of the supervisory assessment of capital adequacy and capital planning processes undertaken by the Federal Reserve as part of the CCAR process, which includes setting PNC’s SCB, as described in the Capital Management portion of the Risk Management section of this Financial Review and in the Supervision and Regulation section in Item 1 of our 2023 Form 10-K.
11094 The PNC Financial Services Group, Inc. – Form 10-Q
described in the Capital Management portion of the Risk Management section of the Financial Review of this Report and in the Supervision and Regulation section in Item 1 of our 2022 Form 10-K.
Dividend Reinvestment and Stock Purchase Plan
The PNC Financial Services Group, Inc. Dividend Reinvestment and Stock Purchase Plan enables holders of our common stock to conveniently purchase additional shares of common stock. Obtain a prospectus and enroll at www.computershare.com/pnc or contact Computershare at 800-982-7652. Registered shareholders may also contact this phone number regarding dividends and other shareholder services.
Stock Transfer Agent and Registrar
Computershare
150 Royall Steet, Suite 101
Canton, MA 02021
800-982-7652
Hearing impaired: 800-952-9245
www.computershare.com/pnc
SIGNATURE
Pursuant to the requirements of the Securities Exchange Act of 1934, the registrant has duly caused this report to be signed on AugustMay 2, 20232024 on its behalf by the undersigned thereunto duly authorized.
| | |
| /s/ Robert Q. Reilly |
| Robert Q. Reilly |
| Executive Vice President and Chief Financial Officer |
| (Principal Financial Officer) |
The PNC Financial Services Group, Inc. – Form 10-Q 11195