UNITED STATES
SECURITIES AND EXCHANGE COMMISSION
Washington, D.C. 20549
FORM 10-Q
(Mark One)
| |
☑ | QUARTERLY REPORT PURSUANT TO SECTION 13 OR 15(D) OF THE SECURITIES EXCHANGE ACT OF 1934 |
For the quarterly period ended: September 30, 20142015
OR
| |
☐ | TRANSITION REPORT PURSUANT TO SECTION 13 OR 15(D) OF THE SECURITIES EXCHANGE ACT OF 1934 |
For the transition period from ___________ to ___________
Commission file number 1-8625

READING INTERNATIONAL, INC.
(Exact name of Registrant as specified in its charter)
| |
NEVADA (State or other jurisdiction of incorporation or organization) | 95-3885184 (IRS Employer Identification No.) |
6100 Center Drive, Suite 900 Los Angeles, CA (Address of principal executive offices) | 90045 (Zip Code) |
Registrant’s telephone number, including area code: (213) 235-2240
Indicate by check mark whether the registrant: (1) has filed all reports required to be filed by Section 13 or 15(d) of the Securities Exchange Act of 1934 during the preceding twelve months (or for such shorter period that the registrant was required to file such reports), and (2) has been subject to such filing requirements for the past 90 days. Yes ☑ No ☐
Indicate by check mark whether the registrant has submitted electronically and posted on its corporate Web site, if any, every Interactive Data File required to be submitted and posted pursuant to Rule 405 of Regulation S-T (§ 232.405 of this chapter) during the preceding 12 months (or for such shorter period that the registrant was required to submit and post such files). Yes ☑ No ☐
Indicate by check mark whether the registrant is a large accelerated filer, an accelerated filer, or a non-accelerated filer. See definition of “accelerated filer and large accelerated filer” in Rule 12b-2 of the Exchange Act. (Check one): Large accelerated filer ☐ Accelerated filer ☑ Non-accelerated filer ☐
Indicate by check mark whether the registrant is a shell company (as defined in Rule 12b-2 of the Exchange Act). Yes ☐ No ☑
Indicate the number of shares outstanding of each of the issuer’s classes of common stock, as of the latest practicable date. As of November 12, 2014,6, 2015, there were 21,885,23821,642,365 shares of Class A Nonvoting Common Stock, $0.01 par value per share and 1,495,4901,680,590 shares of Class B Voting Common Stock, $0.01 par value per share outstanding.
READING INTERNATIONAL, INC. AND SUBSIDIARIES
TABLE OF CONTENTS
PART 1 - FinancialFinancial Information
Item 1 - Financial Statements
Reading International, Inc. and Subsidiaries
Condensed Consolidated Balance Sheets (Unaudited)
(Unaudited; U.S. dollars in thousands)thousands, except share information)
| | | | | | | | |
| | | | | | | | |
| September 30, | December 31, | September 30, | December 31, |
| 2014 | 2013 | 2015 | 2014 |
ASSETS | | | | | | | | |
Current Assets: | | | | | | | | |
Cash and cash equivalents | | $ 40,636 | | $ 37,696 | $ | 62,081 | $ | 50,248 |
Receivables | | 8,405 | | 9,087 | | 8,017 | | 11,348 |
Inventory | | 780 | | 941 | | 818 | | 1,010 |
Investment in marketable securities | | 51 | | 55 | | 43 | | 54 |
Restricted cash | | 782 | | 782 | | 175 | | 1,433 |
Deferred tax asset | | 1,381 | | 3,273 | |
Deferred tax asset, net | | | 2,760 | | 6,300 |
Prepaid and other current assets | | 3,957 | | 3,283 | | 3,273 | | 3,426 |
Land held for sale | | 10,809 | | -- | | 393 | | 10,112 |
Total current assets | | 66,801 | | 55,117 | | 77,560 | | 83,931 |
Operating property, net | | 185,925 | | 191,660 | | 170,259 | | 186,889 |
Land held for sale | | 45,527 | | 11,052 | | 36,580 | | 42,588 |
Investment and development property, net | | 26,203 | | 74,230 | | 21,793 | | 26,124 |
Investment in unconsolidated joint ventures and entities | | 6,542 | | 6,735 | | 5,241 | | 6,169 |
Investment in Reading International Trust I | | 838 | | 838 | | 838 | | 838 |
Goodwill | | 21,538 | | 22,159 | | 19,047 | | 21,281 |
Intangible assets, net | | 11,958 | | 13,440 | | 10,347 | | 11,486 |
Deferred tax asset, net | | 6,273 | | 5,566 | | 17,487 | | 15,967 |
Other assets | | 6,109 | | 6,010 | | 5,271 | | 6,313 |
Total assets | | $ 377,714 | | $ 386,807 | $ | 364,423 | $ | 401,586 |
LIABILITIES AND STOCKHOLDERS' EQUITY | | | | | | | | |
Current Liabilities: | | | | | | | | |
Accounts payable and accrued liabilities | | $ 16,785 | | $ 18,608 | $ | 19,653 | $ | 18,107 |
Film rent payable | | 6,288 | | 6,438 | | 5,381 | | 9,328 |
Notes payable – current | | 31,879 | | 75,538 | | 16,404 | | 38,104 |
Taxes payable - current | | 3,790 | | 8,308 | | 5,528 | | 6,003 |
Deferred current revenue | | 10,561 | | 11,864 | | 12,290 | | 14,239 |
Other current liabilities | | 6,102 | | 6,155 | | 8,501 | | 6,969 |
Total current liabilities | | 75,405 | | 126,911 | | 67,757 | | 92,750 |
Notes payable – long-term | | 99,864 | | 65,009 | | 101,401 | | 98,019 |
Subordinated debt | | 27,913 | | 27,913 | | 27,913 | | 27,913 |
Noncurrent tax liabilities | | 11,826 | | 12,478 | | 7,066 | | 10,029 |
Other liabilities | | 37,525 | | 32,749 | | 39,108 | | 40,577 |
Total liabilities | | 252,533 | | 265,060 | | 243,245 | | 269,288 |
Commitments and contingencies (Note 13) | | | | | |
Commitments and contingencies (Note 12) | | | | | |
Stockholders’ equity: | | | | | | | | |
Class A non-voting common stock, par value $0.01, 100,000,000 shares authorized, | | | | | | | | |
32,520,508 issued and 21,885,238 outstanding at September 30, 2014 and 32,254,199 | | | | | |
issued and 21,890,029 outstanding at December 31, 2013 | | 226 | | 225 | |
32,794,718 issued and 21,617,910 outstanding at September 30, 2015 and 32,254,199 | | | | | |
issued and 21,741,586 outstanding at December 31, 2014 | | | 229 | | 228 |
Class B voting common stock, par value $0.01, 20,000,000 shares authorized and | | | | | | | | |
1,495,490 issued and outstanding at September 30, 2014 and at December 31, 2013 | | 15 | | 15 | |
1,680,590 issued and outstanding at September 30, 2015 and 1,495,490 issued and | | | 17 | | 15 |
outstanding at December 31, 2014 | | | | | |
Nonvoting preferred stock, par value $0.01, 12,000 shares authorized and no issued | | | | | | | | |
or outstanding shares at September 30, 2014 and December 31, 2013 | | -- | | -- | |
or outstanding shares at September 30, 2015 and December 31, 2014 | | | -- | | -- |
Additional paid-in capital | | 138,910 | | 137,849 | | 142,476 | | 140,237 |
Accumulated deficit | | (49,470) | | (57,952) | | (12,755) | | (32,251) |
Treasury shares | | (6,854) | | (4,512) | | (13,524) | | (8,582) |
Accumulated other comprehensive income | | 37,558 | | 41,515 | | 364 | | 28,039 |
Total Reading International, Inc. stockholders’ equity | | 120,385 | | 117,140 | | 116,807 | | 127,686 |
Noncontrolling interests | | 4,796 | | 4,607 | | 4,371 | | 4,612 |
Total stockholders’ equity | | 125,181 | | 121,747 | | 121,178 | | 132,298 |
Total liabilities and stockholders’ equity | | $ 377,714 | | $ 386,807 | $ | 364,423 | $ | 401,586 |
See accompanying notesNotes to consolidated financial statements.Consolidated Financial Statements.
Reading International, Inc. and Subsidiaries
Condensed Consolidated Statements of Income (Unaudited)Operations
(Unaudited; U.S. dollars in thousands, except per share amounts)
| | | | | | | | | | | |
| | | | | | | | | | | | | | | | | | |
| | | | | | | | | | Quarter Ended | | Nine Months Ended |
| Three Months Ended | | Nine Months Ended | | September 30, | | September 30, | | | September 30, | | September 30, |
| September 30, | | September 30, | | 2015 | | 2014 | | | 2015 (1) | | 2014 |
| 2014 | 2013 | | 2014 | 2013 | | | | | | | | | |
Operating revenue | | | | | | | | | | | | | | | | | | |
Cinema | $ | 60,947 | $ | 61,228 | | $ | 180,225 | $ | 180,657 | $ | 54,368 | $ | 60,947 | | $ | 180,223 | $ | 180,225 |
Real estate | | 4,084 | | 4,244 | | | 12,781 | | 14,024 | | 3,420 | | 4,084 | | | 10,951 | | 12,781 |
Total operating revenue | | 65,031 | | 65,472 | | | 193,006 | | 194,681 | | 57,788 | | 65,031 | | | 191,174 | | 193,006 |
Operating expense | | | | | | | | | | | | | | | | | | |
Cinema | | 48,292 | | 48,742 | | | 142,016 | | 145,872 | | (44,463) | | (48,292) | | | (140,825) | | (142,016) |
Real estate | | 2,289 | | 2,716 | | | 7,523 | | 8,115 | | (2,570) | | (2,289) | | | (7,004) | | (7,523) |
Depreciation and amortization | | 3,821 | | 3,602 | | | 11,490 | | 11,243 | | (3,501) | | (3,821) | | | (10,769) | | (11,490) |
General and administrative | | 4,456 | | 4,586 | | | 14,723 | | 13,323 | | (4,134) | | (4,456) | | | (13,736) | | (14,723) |
Total operating expense | | 58,858 | | 59,646 | | | 175,752 | | 178,553 | | (54,668) | | (58,858) | | | (172,334) | | (175,752) |
Operating income | | 6,173 | | 5,826 | | | 17,254 | | 16,128 | | 3,120 | | 6,173 | | | 18,840 | | 17,254 |
Interest income | | 203 | | 96 | | | 429 | | 343 | | 485 | | 203 | | | 1,007 | | 429 |
Interest expense | | (1,614) | | (2,910) | | | (6,966) | | (8,467) | | (2,379) | | (1,614) | | | (7,077) | | (6,966) |
Net gain (loss) on sale of assets | | 25 | | -- | | | 25 | | (7) | |
Other income (expense) | | 242 | | (55) | | | 1,630 | | 72 | |
Net gain on sale of assets | | | -- | | 25 | | | 11,023 | | 25 |
Other (expense) income | | | (577) | | 242 | | | (667) | | 1,630 |
Income before income tax expense and equity earnings of unconsolidated joint ventures and entities | | 5,029 | | 2,957 | | | 12,372 | | 8,069 | | 649 | | 5,029 | | | 23,126 | | 12,372 |
Income tax (expense) | | (1,312) | | (751) | | | (4,747) | | (3,140) | |
Income before equity earnings of unconsolidated joint ventures and entities | | 3,717 | | 2,206 | | | 7,625 | | 4,929 | |
Equity earnings of unconsolidated joint ventures and entities | | 222 | | 225 | | | 833 | | 1,005 | | 195 | | 222 | | | 915 | | 833 |
Net Income | $ | 3,939 | $ | 2,431 | | $ | 8,458 | $ | 5,934 | |
Net (income) loss attributable to noncontrolling interests | | -- | | (38) | | | 23 | | (74) | |
Net income attributable to Reading International, Inc. common shareholders | $ | 3,939 | $ | 2,393 | | $ | 8,481 | $ | 5,860 | |
Basic earnings per share attributable to Reading International, Inc. shareholders | $ | 0.17 | $ | 0.10 | | $ | 0.36 | $ | 0.25 | |
Diluted earnings per share attributable to Reading International, Inc. shareholders | $ | 0.17 | $ | 0.10 | | $ | 0.36 | $ | 0.25 | |
Income before income taxes | | | 844 | | 5,251 | | | 24,041 | | 13,205 |
Income tax expense | | | (517) | | (1,312) | | | (4,605) | | (4,747) |
Net income | | $ | 327 | $ | 3,939 | | $ | 19,436 | $ | 8,458 |
Net loss attributable to noncontrolling interests | | | 54 | | -- | | | 60 | | 23 |
Net income attributable to Reading International, Inc. common stockholders | | $ | 381 | $ | 3,939 | | $ | 19,496 | $ | 8,481 |
Basic earnings per share attributable to Reading International, Inc. stockholders | | $ | 0.02 | $ | 0.17 | | $ | 0.84 | $ | 0.36 |
Diluted earnings per share attributable to Reading International, Inc. stockholders | | $ | 0.02 | $ | 0.17 | | $ | 0.83 | $ | 0.36 |
Weighted average number of shares outstanding–basic | | 23,380,728 | | 23,383,200 | | | 23,457,050 | | 23,333,352 | | 23,287,449 | | 23,380,728 | | | 23,283,405 | | 23,457,050 |
Weighted average number of shares outstanding–diluted | | 23,678,223 | | 23,517,191 | | | 23,754,545 | | 23,467,343 | | 23,482,262 | | 23,678,223 | | | 23,478,218 | | 23,754,545 |
See accompanying notesNotes to consolidated financial statements.Consolidated Financial Statements.
(1)Certain prior period amounts have been reclassified to conform to the current period presentation.
Reading International,International, Inc. and Subsidiaries
Condensed Consolidated Statements of Comprehensive Income (Loss) (Unaudited)
(Unaudited; U.S. dollars in thousands)
| | | | | | | | | | | |
| | | | | |
| | Three Months Ended | | | Nine Months Ended |
| | September 30, | | | September 30, |
| | 2014 | | | 2013 | | | 2014 | | | 2013 |
Net income | $ | 3,939 | | $ | 2,431 | | $ | 8,458 | | $ | 5,934 |
Foreign currency translation gain (loss) | | (14,687) | | | 5,819 | | | (4,627) | | | (13,043) |
Unrealized gain (loss) on available for sale investments | | (1) | | | (2) | | | (2) | | | 2 |
Amortization of pension prior service costs | | 215 | | | 166 | | | 686 | | | 496 |
Comprehensive income (loss) | | (10,534) | | | 8,414 | | | 4,515 | | | (6,611) |
Net (income) loss attributable to noncontrolling interests | | -- | | | (38) | | | 23 | | | (74) |
Comprehensive income attributable to noncontrolling interests | | (42) | | | (15) | | | (14) | | | 57 |
Comprehensive income (loss) attributable to Reading International, Inc. | $ | (10,576) | | $ | 8,361 | | $ | 4,524 | | $ | (6,628) |
| | | | | | | | | | | | |
| | | | | | |
| | Quarter Ended | | | | Nine Months Ended |
| | September 30, | | | September 30, | | | | September 30, | | | September 30, |
| | 2015 | | | 2014 | | | | 2015 | | | 2014 |
Net income | $ | 327 | | $ | 3,939 | | | $ | 19,436 | | $ | 8,458 |
Foreign currency translation loss | | (13,741) | | | (14,687) | | | | (27,769) | | | (4,627) |
Unrealized loss on available for sale investments | | (4) | | | (1) | | | | (3) | | | (2) |
Amortization of actuarial loss | | 51 | | | 215 | | | | 155 | | | 686 |
Comprehensive loss | | (13,367) | | | (10,534) | | | | (8,181) | | | 4,515 |
Net loss attributable to noncontrolling interests | | 54 | | | -- | | | | 60 | | | 23 |
Comprehensive income attributable to noncontrolling interests | | (37) | | | (42) | | | | (59) | | | (14) |
Comprehensive (loss) income attributable to Reading International, Inc. | $ | (13,350) | | $ | (10,576) | | | $ | (8,180) | | $ | 4,524 |
See accompanying notesNotes to consolidated financial statements.Consolidated Financial Statements.
Reading International, Inc. and Subsidiaries
Condensed Consolidated Statements of Cash Flows (Unaudited)
(Unaudited; U.S. dollars in thousands)
| | | | | | | | | | |
| | | | | | | | | | |
| | Nine Months Ended | | Nine Months Ended |
| | September 30, | | September 30, | | | September 30, |
| | 2014 | | | 2013 | | 2015 | | | 2014 |
Operating Activities | | | | | | | | | | |
Net income | $ | 8,458 | | $ | 5,934 | $ | 19,436 | | $ | 8,458 |
Adjustments to reconcile net loss to net cash used in operating activities: | | | | | | |
Gain (loss) recognized on foreign currency transactions | | -- | | | 33 | |
Adjustments to reconcile net income to net cash provided by operating activities: | | | | | | |
Equity earnings of unconsolidated joint ventures and entities | | (833) | | | (1,005) | | (915) | | | (833) |
Distributions of earnings from unconsolidated joint ventures and entities | | 610 | | | 879 | | 901 | | | 610 |
(Gain) loss on sale of assets | | (25) | | | 7 | |
Gain on sale of property | | | (11,023) | | | (25) |
Change in net deferred tax assets | | 1,047 | | | 980 | | 1,405 | | | 2,642 |
Foreign currency translation adj - note | | 1,595 | | | -- | |
Depreciation and amortization | | 11,490 | | | 11,243 | | 10,769 | | | 11,490 |
Amortization of prior service costs | | 686 | | | 495 | |
Amortization of actuarial loss | | | 155 | | | 686 |
Amortization of above and below market leases | | 215 | | | 305 | | 344 | | | 215 |
Amortization of deferred financing costs | | 578 | | | 722 | | 706 | | | 578 |
Amortization of straight-line rent | | 360 | | | 606 | | (370) | | | 360 |
Stock based compensation expense | | 86 | | | 148 | | 222 | | | 86 |
Changes in assets and liabilities: | | | | | | |
Decrease in receivables | | 522 | | | 1,146 | |
(Increase) decrease in prepaid and other assets | | (1,408) | | | 171 | |
Decrease in accounts payable and accrued expenses | | (1,597) | | | (840) | |
Increase (decrease) in film rent payable | | (96) | | | 174 | |
Decrease in taxes payable | | (5,168) | | | (2,371) | |
Increase (decrease) in deferred revenue and other liabilities | | (1,706) | | | (2,381) | |
Net change in: | | | | | | |
Receivables | | | 2,492 | | | 522 |
Prepaid and other assets | | | (85) | | | (1,408) |
Accounts payable and accrued expenses | | | 2,905 | | | (1,597) |
Film rent payable | | | (3,608) | | | (96) |
Taxes payable | | | (314) | | | (5,168) |
Deferred revenue and other liabilities | | | (1,653) | | | (1,706) |
Net cash provided by operating activities | | 14,814 | | | 16,246 | | 21,367 | | | 14,814 |
Investing Activities | | | | | | | | | | |
Purchases of and additions to property and equipment | | (8,669) | | | (12,666) | | (14,411) | | | (8,669) |
Change in restricted cash | | 27 | | | 1,613 | | 1,256 | | | 27 |
Proceeds from notes receivable | | -- | | | 2,000 | |
Distributions of investment in unconsolidated joint ventures and entities | | 212 | | | 155 | | -- | | | 212 |
Deposit from sale of property | | 5,390 | | | -- | |
Proceeds of time deposits | | -- | | | 8,000 | |
Net cash provided by investing activities | | (3,040) | | | (898) | |
Proceeds from sale of property | | | 21,889 | | | 5,390 |
Net cash provided (used) by investing activities | | | 8,734 | | | (3,040) |
Financing Activities | | | | | | | | | | |
Repayment of long-term borrowings | | (6,627) | | | (25,133) | | (7,347) | | | (6,627) |
Proceeds from borrowings | | -- | | | 12,500 | |
Capitalized borrowing costs | | -- | | | (103) | | (191) | | | -- |
Repurchase of Class A Nonvoting Common Stock | | (2,342) | | | -- | | (3,109) | | | (2,342) |
Proceeds from the exercise of stock options | | 975 | | | 249 | | 183 | | | 975 |
Noncontrolling interest contributions | | 327 | | | 263 | | 17 | | | 327 |
Noncontrolling interest distributions | | (101) | | | (2,103) | | (139) | | | (101) |
Net cash (used in) financing activities | | (7,768) | | | (14,327) | |
Effect of exchange rate on cash | | (1,066) | | | (1,705) | |
Increase (decrease) in cash and cash equivalents | | 2,940 | | | (684) | |
Net cash used in financing activities | | | (10,586) | | | (7,768) |
Impact of exchange rate on cash | | | (7,682) | | | (1,066) |
Increase in cash and cash equivalents | | | 11,833 | | | 2,940 |
Cash and cash equivalents at the beginning of the period | | 37,696 | | | 38,531 | | 50,248 | | | 37,696 |
Cash and cash equivalents at the end of the period | $ | 40,636 | | $ | 37,847 | $ | 62,081 | | $ | 40,636 |
Supplemental Disclosures | | | | | | | | | | |
Cash paid during the period for: | | | | | | |
Interest on borrowings | $ | 7,357 | | $ | 8,536 | |
Income taxes | | 5,178 | | | 4,911 | |
Interest paid | | $ | 6,582 | | $ | 7,357 |
Income taxes paid | | | 6,665 | | | 5,178 |
See accompanying notesNotes to consolidated financial statements.
Consolidated Financial Statements.
Reading International, Inc. and SubsidiariesREADING INTERNATIONAL, INC.
Notes to Condensed Consolidated Financial Statements NOTES TO CONDENSED CONSOLIDATED FINANCIAL STATEMENTS (Unaudited)
For the Nine Months Ended September 30, 2014
Note 1 – Basis of Presentation
Reading International, Inc., a Nevada corporation (“RDI” and collectively with our consolidated subsidiaries and corporate predecessors, the “Company,” “Reading” and “we,” “us,” or “our”), was founded in 1983 as a Delaware corporation and reincorporated in 1999 in Nevada. Our businesses consist primarily of:
| · | | the development, ownership, and operation of multiplex cinemas in the United States, Australia, and New Zealand; and |
| · | | the development, ownership, and operation of retail and commercial real estate in Australia, New Zealand, and the United States. |
The accompanying unaudited condensed consolidated financial statements were prepared in accordance with accounting principles generally accepted in the United States of America (“USU.S. GAAP”) for interim reporting and with the instructions to Form 10-Q and Rule 10-01 of Regulation S-X of the Securities and Exchange Commission (“SEC”) for interim reporting.. As such, certainthey do not include all information and disclosures typicallyfootnotes required by USU.S. GAAP for complete financial statementsstatements. We believe that we have been condensed or omitted. The financial information presented in this quarterly report on Form 10-Qincluded all normal recurring adjustments necessary for a fair presentation of the results for the period ended September 30, 2014 (the “September Report”) should be read in conjunction with our Annual Report filed on Form 10-Kinterim period. Operating results for the year ended December 31, 2013 (our “2013 Annual Report”) which contains the latest audited financial statements and related notes. The periods presented in this document are the three (“2014 Quarter”) and nine (“2014 Nine Months”) months ended September 30, 2014 and the three (“2013 Quarter”) and nine (“2013 Nine Months”) months ended September 30, 2013.
In the opinion of management, all adjustments of a normal recurring nature considered necessary to present fairly in all material respects our financial position as of September 30, 2014 and the results of our operations and cash flows for the threequarter and nine months ended September 30, 2014 and 2013 have been made. The results of operations for the three and nine months ended September 30, 20142015 are not necessarily indicative of the results of operations tothat may be expected for the entire year.year ending December 31, 2015.
Out of Period Adjustment
During this quarter, we identified an adjustment of approximately $1.4 millionPlease note that certain prior period amounts have been reclassified to conform to the deferred tax asset that was originated from a transaction we effectuatedcurrent period presentation. These financial statements should be read in Australia in 2013. The adjustment increasedconjunction with the deferred tax asset with a corresponding increase to other comprehensive income. We determined that the adjustment did not have a material impact to our current or prior period consolidated financial statements.
Expiring Debt and Liquidity Requirements
Expiring Long-Term Debt
Our New Zealand Corporate Credit Facility matures on March 31, 2015 and as such the balance of $21.8 million (NZ$28.0 million) has been reclassified as a current liability on the consolidated balance sheet as of September 30, 2014.
Additionally, the term of our Union Square Theatre Term Loan matures on May 1, 2015. Accordingly, the outstanding balance of this debt of $6.5 million has been classified as a current liability on the consolidated balance sheet as of September 30, 2014.
While no assurances can be given that we will be successful, we currently anticipate that these loans will either be extended or replaced prior to their maturities.
Tax Settlement Liability
As indicated in our 2013Company’s 2014 Annual Report in accordance withon Form 10-K.
Recently Issued and Recently Adopted Accounting Pronouncements
Adopted:
On January 1, 2015, the agreement betweenCompany adopted changes issued by the U.S. Internal Revenue Service and our subsidiary, Craig Corporation, it is obligated to pay $290,000 per month, $3.5 million per year, in settlement of its tax liability for the tax year ended June 30, 1997.
Liquidity
For the above mentioned liabilities, we believe that we have the required liquidity to meet these obligations either through the extension or replacement of maturing debt or the generation of cash from our operating activities. Together with our $40.6 million of cash and cash equivalents, we expect to meet our anticipated short-term working capital requirements for the next twelve months.
Receivables
Our receivables balance is comprised primarily of credit card receivables, representing the purchase price of tickets, concessions or coupon books sold at our various businesses. Sales charged on customer credit cards are collected when the credit card transactions are processed. The remaining receivables balance is primarily comprised of goods and services tax (“GST”) refunded receivables from our Australian taxing authorities, management fee receivables from the managed cinemas and business interruption insurance recovery proceeds.
Marketable Securities
We had investments in marketable securities of $51,000 and $55,000 at September 30, 2014 and December 31, 2013, respectively. We account for these investments as available for sale investments. We assess our investment in marketable securities for other-than-temporary impairments in accordance with Financial Accounting Standards Board (“FASB”) Accounting Standards Codification (“ASC”) 320-10 for each applicable(FASB) to reporting period. These investments have a cumulative gain of $7,000 included in accumulated other comprehensive income at September 30, 2014. For the three and nine months ended September 30, 2014, our net unrealized gain (loss) on marketable securities was ($1,000) and ($2,000), respectively. For the three and nine months ended September 30, 2013, our net unrealized gain (loss) on marketable securities was ($2,000) and $2,000, respectively. During the nine months ended September 30, 2014 and 2013, we did not buy or sell any marketable securities.
Deferred Leasing Costs
We amortize direct costs incurred in connection with obtaining tenants for our properties over the respective term of the lease on a straight-line basis.
Deferred Financing Costs
We amortize direct costs incurred in connection with obtaining financing over the term of the loan using the effective interest method, or the straight-line method, if the result is not materially different. In addition, interest on loans with increasing interest rates and scheduled principal pre-payments is also recognized using the effective interest method.
Accounting Pronouncements Adopted During 2014
No new pronouncements were adopted during the nine months ended September 30, 2014.
New Accounting Pronouncements
In April 2014, the FASB issued ASU No. 2014-08, Reporting Discontinued Operations and Disclosures of Disposals of Components of an Entity. The amendments in this update change the criteria for determining which disposals can be presented as discontinued operations and modify related disclosure requirements. disclosures of disposals of components of an entity. These changes require a disposal of a component to meet a higher threshold in order to be reported as a discontinued operation in an entity’s financial statements. The threshold is defined as a strategic shift that has, or will have, a major effect on an entity’s operations and financial results such as a disposal of a major geographical area or a major line of business. In addition, the following two criteria have been removed from consideration of whether a component meets the requirements for discontinued operations presentation: (i) the operations and cash flows of a disposal component have been or will be eliminated from the ongoing operations of an entity as a result of the disposal transaction, and (ii) an entity will not have any significant continuing involvement in the operations of the disposal component after the disposal transaction. Furthermore, equity method investments now may qualify for discontinued operations presentation. The guidance applies prospectively to new disposals and new classifications of disposal groups as held for sale after the effective date, and isdate. The adoption of these changes had no material impact on the Consolidated Financial Statements.
Issued:
In September 2015, the FASB issued Accounting Standards Update ("ASU") 2015-16, Simplifying the Accounting for Measurement-Period Adjustments, effective for the Company on January 1, 2016. Under the ASU, an acquirer in a business combination transaction must recognize adjustments to provisional amounts that are identified during the measurement period in the reporting period in which the adjustment amounts are determined. The effect on earnings of changes in depreciation or amortization, or other income effects, if any, as a result of the change to the provisional amounts, calculated as if the accounting had been completed as of the acquisition date, must be recorded in the reporting period in which the adjustment amounts are determined rather than retrospectively. The ASU also requires that the acquirer present separately on the face of the income statement, or disclose in the notes, the portion of the amount recorded in current-period earnings by line item that would have been recorded in previous reporting periods if the adjustment to the provisional amounts had been recognized as of the acquisition date.
In April 2015, the FASB issued ASU 2015-03, Interest- Imputation of Interest (Subtopic 835-03) - Simplifying the Presentation of Debt Issuance Costs which requires unamortized debt issuance costs to be presented as a reduction of the corresponding debt liability rather than a separate asset. These changes become effective for the Company on January 1, 2015. However, all entities may adopt2016. The adoption of this standard is not expected to have a material impact on the guidance early for new disposals (or new classifications as held for sale) that have not been reported inCompany's financial statements previously issued or available for issuance.statement disclosures.
In May 2014, the Financial Accounting Standards BoardFASB issued a new standard to achieve a consistent application of revenue recognition within the U.S., resulting in a single revenue model to be applied by reporting companies under U.S. generally accepted accounting principles.GAAP. Under the new model, recognition of revenues occurs when a customer obtains control of promised goods or services in an amount that reflects the consideration to which the entity expects to be entitled in exchange for those goods or services. In addition, the new standard requires that reporting companies disclose the nature, amount, timing and uncertainty of revenue and cash flows arising from contracts with customers. The new standard isbecomes effective for us beginning in the first quarter of 2017; earlyCompany on January 1, 2018. Early adoption is prohibited.permitted but cannot be earlier than January 1, 2017. The new standard is required to be applied retrospectively to each prior reporting period presented or retrospectively with the cumulative effect of initially applying it recognized at the date of initial application. We have not yet selected a transition method nor have we determined the impact of the new standard on our consolidated condensed financial statements. While we believe the proposed guidance will not have a material impact on our business because our revenue predominantly comes from movie ticket sales and concession purchases, we plan to complete the analysis to ensure that we are in compliance prior to the effective date.
Note 2 – EquityBusiness Segments
Reported below are the operating segments of the Company for which separate financial information is available and Stock-Based Compensationfor which segment results are evaluated regularly by the Chief Executive Officer. In addition to the cinema exhibition and real estate activities, we have acquired, and continue to hold, raw land in urban and suburban centers in Australia, New Zealand, and the United States, as part of our real estate activities.
Stock-Based Compensation
DuringThe tables below summarize the nine months ended September 30, 2014 and 2013, we issued 125,209 and 217,890, respectively, Class A Nonvoting shares to an executive employee associated withresults of operations for each of our business segments for the vesting of his prior years’ stock grants. During the threequarter and nine months ended September 30, 2015 and 2014, we accrued $300,000 and $900,000, respectively, in compensationrespectively. Operating expense includes costs associated with the vestingday-to-day operations of executive employee stock grants. During the threecinemas and nine months ended September 30, 2013, we accrued $188,000 and $564,000, respectively, in compensation expense associated with the vestingmanagement of executive employee stock grants.rental properties, including our live theater assets.
| | | | | | | | | | | | |
| | Quarter Ended | | Nine Months Ended |
(Dollars in thousands) | | September 30, 2015 | | September 30, 2014 | | September 30, 2015 | | September 30, 2014 |
Revenue: | | | | | | | | | | | | |
Cinema exhibition | | $ | 54,368 | | $ | 60,947 | | $ | 180,223 | | $ | 180,225 |
Real estate | | | 4,968 | | | 6,035 | | | 15,908 | | | 18,396 |
Inter-segment elimination | | | (1,548) | | | (1,951) | | | (4,957) | | | (5,615) |
| | $ | 57,788 | | $ | 65,031 | | $ | 191,174 | | $ | 193,006 |
Segment operating income: | | | | | | | | | | | | |
Cinema exhibition | | $ | 4,838 | | $ | 7,136 | | $ | 23,745 | | $ | 21,313 |
Real estate | | | 1,443 | | | 2,346 | | | 5,952 | | | 7,164 |
| | $ | 6,281 | | $ | 9,482 | | $ | 29,697 | | $ | 28,477 |
A reconciliation of segment operating income to income before income taxes is as follows:
| | | | | | | | | | | | |
| | Quarter Ended | | Nine Months Ended |
(Dollars in thousands) | | September 30, 2015 | | September 30, 2014 | | September 30, 2015 | | September 30, 2014 |
Segment operating income | | $ | 6,281 | | $ | 9,482 | | $ | 29,697 | | $ | 28,477 |
Unallocated corporate expense | | | | | | | | | | | | |
Depreciation and amortization expense | | | (86) | | | (92) | | | (220) | | | (273) |
General and administrative expense | | | (3,075) | | | (3,217) | | | (10,637) | | | (10,950) |
Interest expense, net | | | (1,894) | | | (1,411) | | | (6,070) | | | (6,537) |
Equity earnings of unconsolidated joint ventures and entities | | | 195 | | | 222 | | | 915 | | | 833 |
Gain on sale of assets | | | - | | | 25 | | | 11,023 | | | 25 |
Other income (expense) | | | (577) | | | 242 | | | (667) | | | 1,630 |
Income before income taxes | | $ | 844 | | $ | 5,251 | | $ | 24,041 | | $ | 13,205 |
Employee/Director Stock Option Plan
We have a long-term incentive stock option plan that provides for the grant to eligible employees, directors, and consultants of incentive or nonstatutory options to purchase shares of our Class A Nonvoting Common Stock and Class B Voting Common Stock. Currently we issue options under our 2010 Stock Incentive Plan.
When the Company’s tax deduction from an option exercise exceeds the compensation cost resulting from the option, a tax benefit is created. FASB ASC 718-20 relating to Stock-Based Compensation (“FASB ASC 718-20”), requires that excess tax benefits related to stock option exercises be reflected as financing cash inflows instead of operating cash inflows. For the three and nine months ended September 30, 2014 and 2013, there was no impact to the unaudited condensed consolidated statement of cash flows because there were no recognized tax benefits from stock option exercises during these periods.
FASB ASC 718-20 requires companies to estimate forfeitures. Unusually, during the nine months ended September 30, 2014, we had forfeitures of 64,000 options for the Class A common stock as a result of employee terminations. It is the company’s policy, unless adjusted by the Compensation Committee, to give the terminated employee three months from their termination date to exercise their options. If the options are not exercised within the three month period, they are considered forfeited.
In accordance with FASB ASC 718-20, we estimate the fair value of our options using the Black-Scholes option-pricing model, which takes into account assumptions such as the dividend yield, the risk-free interest rate, the expected stock price volatility, and the expected life of the options. As we intend to retain all earnings, we exclude the dividend yield from the calculation. We expense the estimated grant date fair values of options issued on a straight-line basis over the vesting period.
For the 20,000 and 50,000 options granted during the nine months ended September 30, 2014 and 2013, respectively, we estimated the fair value of these options at the date of grant using a Black-Scholes option-pricing model with the following weighted average assumptions:
| | | | |
| | | | |
| | 2014 | 2013 | |
| Stock option exercise price | $7.40 | $5.89 | |
| Risk-free interest rate | 2.88% | 2.26% | |
| Expected dividend yield | -- | -- | |
| Expected option life in years | 10 | 10 | |
| Expected volatility | 30.65% | 31.89% | |
| Weighted average fair value | $2.46 | $1.89 | |
Based on the above calculation and prior years’ assumptions, and, in accordance with the FASB ASC 718-20, we recorded compensation expense for the total estimated grant date fair value of $ 33,000 and $ 102,000 for the three and nine months ended September 30, 2014, respectively, and $77,000 and $130,000 for the three and nine months ended September 30, 2013, respectively. At September 30, 2014, the total unrecognized estimated compensation cost related to non-vested stock options granted was $385,000, which we expect to recognize over a weighted average vesting period of 1.96 years. 141,100 options were exercised, during the nine months ended September 30, 2014 having an intrinsic value of $285,000 for which we received $890,000 of cash, and 62,500 options were exercised during the nine months ended September 30, 2013 having an intrinsic value of $132,000 for which we received $249,000 of cash. The intrinsic, unrealized value of all options outstanding, vested and expected to vest, at September 30, 2014 was $1.1 million of which 66.2% are currently exercisable.
Pursuant to both our 1999 Stock Option Plan and our 2010 Stock Incentive Plan, all stock options expire no later than ten years from their grant date. The aggregate total number of shares of Class A Nonvoting Common Stock and Class B Voting Common Stock authorized for issuance under our 2010 Stock Incentive Plan is 1,250,000. At the discretion of our Compensation and Stock Options Committee, the vesting period of stock options is usually between zero and four years.
We had the following stock options outstanding and exercisable as of September 30, 2014 and December 31, 2013:
| | | | | | | | | | | | |
| | | Weighted | | | | Weighted Average |
| Common Stock | Average Exercise | Common Stock | | Price of |
| Options | Price of Options | Exercisable | | Exercisable |
| Outstanding | Outstanding | Options | | Options |
| Class A | Class B | Class A | Class B | Class A | Class B | Class A | Class B |
Outstanding - December 31, 2013 | 709,850 | 185,100 | $ | 6.24 | $ | 9.90 | 490,350 | 185,100 | $ | 6.85 | $ | 9.90 |
Granted | 20,000 | -- | $ | -- | $ | -- | -- | -- | | -- | | -- |
Exercised | (500) | -- | $ | -- | $ | -- | -- | -- | | -- | | -- |
Outstanding - March 31, 2014 | 729,350 | 185,100 | $ | 6.60 | $ | 9.90 | 510,350 | 185,100 | $ | 6.87 | $ | 9.90 |
Granted | -- | -- | $ | -- | $ | -- | -- | -- | | -- | | -- |
Exercised | (77,000) | -- | $ | -- | $ | -- | -- | -- | | -- | | -- |
Outstanding - June 30, 2014 | 652,350 | 185,100 | $ | 6.71 | $ | 9.90 | 435,350 | 185,100 | $ | 6.95 | $ | 9.90 |
Granted | -- | -- | $ | -- | $ | -- | -- | -- | | -- | | -- |
Exercised | (63,600) | -- | $ | -- | $ | -- | -- | -- | | -- | | -- |
Forfeited | (64,000) | -- | $ | -- | $ | -- | -- | -- | | -- | | -- |
Outstanding - September 30, 2014 | 524,750 | 185,100 | $ | 6.60 | $ | 9.90 | 347,250 | 185,100 | $ | 6.78 | $ | 9.90 |
The weighted average remaining contractual life of all options outstanding, vested, and expected to vest at September 30, 2014 and December 31, 2013 was approximately 3.51 and 4.70 years, respectively. The weighted average remaining contractual life of the exercisable options outstanding at September 30, 2014 and December 31, 2013 was approximately 3.45 and 3.63 years, respectively.
Note 3 – Business Segments
We organize our operations into two reportable business segments within the meaning of FASB ASC 280-10 - Segment Reporting. Our reportable segments are (1) cinema exhibition and (2) real estate. The cinema exhibition segment is engaged in the development, ownership, and operation of multiplex cinemas. The real estate segment is engaged in the development, ownership, and operation of commercial properties. Incident to our real estate operations, we have acquired, and continue to hold, raw land in urban and suburban centers in Australia, New Zealand, and the United States.
The tables below summarize the results of operations for each of our principal business segments for the three months ended September 30, 2014 and 2013, respectively. Operating expenses include costs associated with the day-to-day operations of the cinemas and the management of rental properties, including our live theater assets (dollars in thousands):
| | | | | | | | |
| | | | | | | | |
Three Months Ended September 30, 2014 | Cinema Exhibition | Real Estate | Intersegment Eliminations | Total |
Revenue | $ | 60,947 | $ | 6,035 | $ | (1,951) | $ | 65,031 |
Operating expense | | 50,243 | | 2,289 | | (1,951) | | 50,581 |
Depreciation and amortization | | 2,765 | | 964 | | -- | | 3,729 |
General and administrative expense | | 803 | | 436 | | -- | | 1,239 |
Segment operating income | $ | 7,136 | $ | 2,346 | $ | -- | $ | 9,482 |
| | | | | | | | |
Three Months Ended September 30, 2013 | Cinema Exhibition | Real Estate | Intersegment Eliminations | Total |
Revenue | $ | 61,228 | $ | 6,157 | $ | (1,913) | $ | 65,472 |
Operating expense | | 50,655 | | 2,716 | | (1,913) | | 51,458 |
Depreciation and amortization | | 2,540 | | 951 | | -- | | 3,491 |
General and administrative expense | | 891 | | 185 | | -- | | 1,076 |
Segment operating income | $ | 7,142 | $ | 2,305 | $ | -- | $ | 9,447 |
| | | | | | | | |
| | | | | | | | |
Reconciliation to net income attributable to Reading International, Inc. shareholders: | | | | | 2014 Quarter | 2013 Quarter |
Total segment operating income | | | | | $ | 9,482 | $ | 9,447 |
Non-segment: | | | | | | | | |
Depreciation and amortization expense | | | | | | 92 | | 111 |
General and administrative expense | | | | | | 3,217 | | 3,510 |
Operating income | | | | | | 6,173 | | 5,826 |
Interest expense, net | | | | | | (1,411) | | (2,814) |
Other income (expense) | | | | | | 242 | | (55) |
Gain on sale of assets | | | | | | 25 | | -- |
Income tax expense | | | | | | (1,312) | | (751) |
Equity earnings of unconsolidated joint ventures and entities | | | | | | 222 | | 225 |
Net income | | | | | $ | 3,939 | $ | 2,431 |
Net (income) attributable to noncontrolling interests | | | | | | -- | | (38) |
Net income attributable to Reading International, Inc. common shareholders | | | | | $ | 3,939 | $ | 2,393 |
The tables below summarize the results of operations for each of our principal business segments for the nine months ended September 30, 2014 and 2013, respectively. Operating expenses include costs associated with the day-to-day operations of the cinemas and the management of rental properties, including our live theater assets (dollars in thousands):
| | | | | | | | |
| | | | | | | | |
Nine Months Ended September 30, 2014 | Cinema Exhibition | Real Estate | Intersegment Eliminations | Total |
Revenue | $ | 180,225 | $ | 18,396 | $ | (5,615) | $ | 193,006 |
Operating expense | | 147,631 | | 7,523 | | (5,615) | | 149,539 |
Depreciation and amortization | | 8,378 | | 2,839 | | -- | | 11,217 |
General and administrative expense | | 2,903 | | 870 | | -- | | 3,773 |
Segment operating income | $ | 21,313 | $ | 7,164 | $ | -- | $ | 28,477 |
| | | | | | | | |
Nine Months Ended September 30, 2013 | Cinema Exhibition | Real Estate | Intersegment Eliminations | Total |
Revenue | $ | 180,657 | $ | 19,764 | $ | (5,740) | $ | 194,681 |
Operating expense | | 151,612 | | 8,115 | | (5,740) | | 153,987 |
Depreciation and amortization | | 7,824 | | 3,086 | | -- | | 10,910 |
General and administrative expense | | 2,463 | | 519 | | -- | | 2,982 |
Segment operating income | $ | 18,758 | $ | 8,044 | $ | -- | $ | 26,802 |
| | | | | | | | |
| | | | | | | | |
Reconciliation to net income attributable | | | | | 2014 Nine | 2013 Nine |
to Reading International, Inc. shareholders: | | | | | Months | Months |
Total segment operating income | | | | | $ | 28,477 | $ | 26,802 |
Non-segment: | | | | | | | | |
Depreciation and amortization expense | | | | | | 273 | | 333 |
General and administrative expense | | | | | | 10,950 | | 10,341 |
Operating income | | | | | | 17,254 | | 16,128 |
Interest expense, net | | | | | | (6,537) | | (8,124) |
Other income | | | | | | 1,630 | | 72 |
Gain (loss) on sale of assets | | | | | | 25 | | (7) |
Income tax expense | | | | | | (4,747) | | (3,140) |
Equity earnings of unconsolidated joint ventures and entities | | | | | | 833 | | 1,005 |
Net income | | | | | $ | 8,458 | $ | 5,934 |
Net (income) loss attributable to noncontrolling interests | | | | | | 23 | | (74) |
Net income attributable to Reading International, Inc. common shareholders | | | | | $ | 8,481 | $ | 5,860 |
Note 4 – Operations in Foreign Currency
We have significant assets in Australia and New Zealand. To the extent possible, we conduct our Australian and New Zealand operations (collectively “foreign operations”) on a self-funding basis. The carrying valuebasis where we use cash flows generated by foreign operations to pay for the expense of ourforeign operations. Our Australian and New Zealand assets and liabilities fluctuate dueare translated from their functional currencies of Australian dollar (A$) and New Zealand dollar (NZ$), respectively to U.S. dollar based on the exchange rate as of September 30, 2015. The carrying value of the assets and liabilities of our foreign operations fluctuates as result of changes in the exchange rates between the U.S. dollarfunctional currencies of the foreign operations and the functionalU.S. dollar. The translation adjustments are accumulated in the Accumulated Other Comprehensive Income in the Consolidated Balance Sheets.
Because we intend to conduct business on a self-funding basis (except for funds used to pay on appropriate share of our domestic corporate overhead), we do not believe the currency of Australia (Australian dollar) and New Zealand (New Zealand dollar). We have nofluctuations present a material risk to the Company. As such, we do not use derivative financial instruments to hedge against the risk of foreign currency exposure.
Presented in the table below are the currency exchange rates for Australia and New Zealand as of September 30, 2014 ,2015, December 31, 20132014 and September 30, 20132014
| | |
| | |
| U.S. Dollar | | | | | |
| September 30, | December 31, | September 30, | Foreign Currency / USD |
| 2014 | 2013 | September 30, 2015 | | December 31, 2014 | | September 30, 2014 |
Australian Dollar | 0.8737 | 0.8929 | 0.9342 | 0.7020 | | 0.8173 | | 0.8737 |
New Zealand Dollar | 0.7788 | 0.8229 | 0.8323 | 0.6390 | | 0.7796 | | 0.7788 |
Note 54 – Earnings (Loss) Per Share
Basic earnings (loss) per share (“EPS”) is computedcalculated by dividing the net income (loss) attributable to Reading International, Inc.the Company’s common shareholdersstockholders by the weighted average number of common shares outstanding during the period. Diluted earnings (loss) per shareEPS is computedcalculated by dividing the net income (loss) attributable to Reading International, Inc.the Company’s common shareholdersstockholders by the weighted average number of common and common equivalent shares outstanding during the period after giving effect to all potentially dilutive common shares that would have been outstanding if the dilutive common shares had been issued. Stock options and non-vested stock awards give rise to potentially dilutive common shares. In accordance with FASB ASC 260-10 - Earnings Per Share, these shares are included in the diluted earnings per share calculation undercalculated using the treasury stock method. method for equity-based compensation awards.
The following istable sets forth the computation of basic and diluted EPS and a calculationreconciliation of earnings (loss) per share (dollars in thousands, except share data):the weighted average number of common and common equivalent shares outstanding.
| | | | | | | | |
| | | | | | | | |
| | Three Months Ended | | Nine Months Ended |
| | September 30, | | September 30, |
| | 2014 | | 2013 | | 2014 | | 2013 |
Net income from continuing operations | $ | 3,939 | $ | 2,393 | $ | 8,481 | $ | 5,860 |
Net income attributable to Reading International, Inc. common shareholders | | 3,939 | | 2,393 | | 8,481 | | 5,860 |
Basic earnings per share attributable to Reading International, Inc. shareholders | $ | 0.17 | $ | 0.10 | $ | 0.36 | $ | 0.25 |
Diluted earnings per share attributable to Reading International, Inc. shareholders | $ | 0.17 | $ | 0.10 | $ | 0.36 | $ | 0.25 |
Weighted average shares of common stock – basic | | 23,380,728 | | 23,383,200 | | 23,457,050 | | 23,333,352 |
Weighted average shares of common stock – diluted | | 23,678,223 | | 23,517,191 | | 23,754,545 | | 23,467,343 |
| | | | | | | | | | | | |
| | Quarter Ended | | Nine Months Ended |
(Dollars in thousands, except share data) | | September 30,
2015 | | September 30,
2014 | | September 30,
2015 | | September 30,
2014 |
Numerator: | | | | | | | | | | | | |
Net income attributable to RDI common stockholders | | $ | 381 | | $ | 3,939 | | $ | 19,496 | | $ | 8,481 |
Denominator: | | | | | | | | | | | | |
Weighted average number of common stock – basic | | 23,287,449 | | 23,380,728 | | 23,283,405 | | 23,457,050 |
Weighted average dilutive impact of stock-based awards | | 194,813 | | 297,495 | | 194,813 | | 297,495 |
Weighted average number of common stock – diluted | | 23,482,262 | | 23,678,223 | | 23,478,218 | | 23,754,545 |
Basic EPS attributable to RDI common stockholders | | $ | 0.02 | | $ | 0.17 | | $ | 0.84�� | | $ | 0.36 |
Diluted EPS attributable to RDI common stockholders | | $ | 0.02 | | $ | 0.17 | | $ | 0.83 | | $ | 0.36 |
| | | | | | | | | | | | |
Awards excluded from diluted EPS | | 100,000 | | 218,750 | | 100,000 | | 248,750 |
For
Note 5 – Property and Equipment
Operating Property, net
As of September 30, 2015 and December 31, 2014, property associated with our operating activities is summarized as follows:
| | | | | | |
| | September 30, | | December 31, |
(Dollars in thousands) | | 2015 | | 2014 |
Land | | $ | 57,365 | | $ | 62,024 |
Building and improvements | | | 104,050 | | | 120,913 |
Leasehold interests | | | 45,675 | | | 46,813 |
Fixtures and equipment | | | 98,249 | | | 107,286 |
Construction-in-progress (including capitalized interest) | | | 12,188 | | | 4,681 |
Total cost | | | 317,527 | | | 341,717 |
Less: accumulated depreciation | | | (147,268) | | | (154,828) |
Operating property, net | | $ | 170,259 | | $ | 186,889 |
Depreciation expense for operating property was $3.3 million and $10.1 million for the threequarter and nine months ended September 30, 2014, the weighted average common stock – diluted included 297,495 of common stock compensation2015 and in-the-money incremental stock options,$3.7 million and $10.7 million for the threequarter and nine months ended September 30, 2014.
Operating Property – Taupo, New Zealand
On April 1, 2015, we entered into two definitive purchase and sale agreements to sell our properties at Taupo, New Zealand for a combined sales price of $2.3 million (NZ$3.4 million). The first agreement relates to a property with a sales price of $1.49 million (NZ$2.2 million) and a book value of $1.3 million (NZ$1.8 million), which closed on April 30, 2015 when we received the sales price in full. The other agreement relates to a property with a sales price of $767,000 (NZ$1.2 million) and a book value of $393,000 (NZ$615,000) with a closing date of March 31, 2016. This property is classified as held for sale as of September 30, 2015. While both transactions were treated as current sales for tax purposes, only the first transaction qualifies as a sale under U.S. GAAP.
Operating Property – Moonee Ponds, Australia
On October 15, 2013, we entered into a definitive purchase and sale agreement to sell this property for a sales price of $17.5 million (A$ 23.0 million) payable in full upon closing of the weighted average common stocktransaction on April 16, 2015. In accordance with the requirements under U.S. GAAP, we recognized a profit of $8.0 million (A$ 10.3 million) in the second quarter of 2015 upon the receipt of sale proceeds on April 16, 2015.
Operating Property – diluted included 133,992Burwood, Australia
On May 12, 2014, we entered into a contract to sell our undeveloped 50.6 acre parcel in Burwood, Victoria, Australia, to an affiliate of common stock compensationAustraland Holdings Limited (now known as Frasers Property Australia) for a purchase price of $47.0 million (A$65.0 million).
We received $5.9 million (A$6.5 million) on May 23, 2014. The remaining purchase price of $41.1 million (A$58.5 million) is due on December 31, 2017. The agreement provides for mandatory pre-payments in the event that any of the land is sold by the buyer, any such prepayment being in an amount equal to the greater of (a) 90% of the net sales price or (b) the balance of the purchase price multiplied by a fraction the numerator of which is the square footage of property being sold by the buyer and in-the-money incremental stock options. In addition, 572,998the denominator of out-of-the-money stock options were excluded fromwhich is the computationoriginal square footage of diluted earnings (loss) per sharethe property being sold to the buyer. The agreement does not provide for the threepayment of interest on the balance owed.
Our book value in the property is $36.6 million (A$52.1 million) and nine months endedwhile the transaction was treated as a current sale for tax purposes in 2014, it does not qualify as a sale under U.S. GAAP until the receipt of the payment of the balance of the purchase price due on December 31, 2017 (or earlier depending upon whether any prepayment obligation is triggered). The asset is classified as long-term land held for sale on the Consolidated Balance Sheet as of September 30, 2014,2015.
Investment and 729,865Development Property
As of out-of-the-money stock options were excluded from the computation of diluted earnings (loss) per share for the three and nine months ended September 30, 2013.2015 and December 31, 2014, our investment and development property is summarized below:
| | | | | | |
| | September 30, | | December 31, |
(Dollars in thousands) | | 2015 | | 2014 |
Land | | $ | 20,329 | | $ | 23,833 |
Construction-in-progress (including capitalized interest) | | | 1,464 | | | 2,291 |
Investment and development property | | $ | 21,793 | | $ | 26,124 |
Note 6 – Property and Equipment
Operating Property, net
As of September 30, 2014 and December 31, 2013, property associated with our operating activities is summarized as follows (dollars in thousands):
| | | | |
| | | | |
| | September 30, | | December 31, |
Operating Property | | 2014 | | 2013 |
Land | $ | 64,485 | $ | 65,578 |
Building and improvements | | 122,409 | | 123,061 |
Leasehold interests | | 46,922 | | 46,330 |
Fixtures and equipment | | 108,090 | | 106,099 |
Total cost | | 341,906 | | 341,068 |
Less: accumulated depreciation | | (155,981) | | (149,408) |
Operating property, net | $ | 185,925 | $ | 191,660 |
Depreciation expense for property and equipment was $3.7 million and $10.7 million for the three and nine months ended September 30, 2014, respectively, and $3.2 million and $10.4 million for the three and nine months ended September 30, 2013, respectively.
Land Held for Sale – Moonee Ponds
On October 15, 2013, we entered into a definitive purchase and sale agreement to sell this property for a sale price of $21.3 million (AUS$23.0 million) payable in full upon closing of that transaction on April 16, 2015. The property has a book value of $10.8 million (AUS $12.4 million), and while the transaction was treated as a current sale for tax purposes, it does not qualify as a sale under US GAAP until the close of the transaction on April 16, 2015. As the scheduled closing date is less than one year away, this asset has been listed as a current asset.
Land Held for Sale – Burwood
On May 12, 2014, we entered into a contract to sell our undeveloped 50.6 acre parcel in Burwood, Victoria, Australia, to an affiliate of Australand Holdings Limited for a purchase price of $54.6 million (AUS$65.0 million).
Reading received $5.9 million (AUS$6.5 million) on the May 23, 2014 closing. The balance of the purchase price is due on December 31, 2017. The agreement provides for mandatory pre-payments in the event that any of the land is sold by the buyer, any such prepayment being in an amount equal to the greater of (a) 90% of the net sale price or (b) the balance of the purchase price multiplied by a fraction the numerator of which is the square footage of property being sold by the buyer and the denominator of which is the original square footage of the property being sold to the buyer. The agreement does not provide for the payment of interest on the balance owed.
Our book basis in the property is $45.5 million (AUS$52.1 million) and while the transaction was treated as a current sale for tax purposes, it does not qualify as a sale under US GAAP until the receipt of the payment of the balance of the purchase price due on December 31, 2017 (or earlier depending upon whether any prepayment obligation is triggered). The asset has been listed as a long term asset.
Investment and Development Property
As of September 30, 2014 and December 31, 2013, our investment and development property is summarized as follows (dollars in thousands):
| | | | |
| | | | |
| | September 30, | | December 31, |
Investment and Development Property | | 2014 | | 2013 |
Land | $ | 22,748 | $ | 59,550 |
Construction-in-progress (including capitalized interest) | | 3,455 | | 14,680 |
Investment and development property | $ | 26,203 | $ | 74,230 |
The decrease of $48.0 million is substantially due to the reclassification of the Burwood property costs from the Investment and Development property category to Land Held for Sale category under non-current assets on the balance sheet.
Note 7 – Investments in Unconsolidated Joint Ventures and Entities
Our investments in unconsolidated joint ventures and entities are accounted for under the equity method of accounting, except for Rialto Distribution, which is accounted for as a cost method investment,investment. The table below summarizes our investments in unconsolidated joint ventures and entities as of September 30, 20142015 and December 31, 2013, included the following (dollars in thousands):2014:
| | | | | | | | | | | | | |
| | | | | | | | | September 30, | | December 31, |
| | | September 30, | | December 31, | |
| Interest | | 2014 | | 2013 | |
(Dollars in thousands) | | | Interest | | 2015 | | 2014 |
Rialto Distribution | 33.3% | $ | -- | $ | -- | | 33.3% | | $ | -- | | $ | -- |
Rialto Cinemas | 50.0% | | 1,679 | | 1,571 | | 50.0% | | | 1,183 | | | 1,564 |
205-209 East 57th Street Associates, LLC | 25.0% | | -- | | -- | |
Mt. Gravatt | 33.3% | | 4,863 | | 5,164 | | 33.3% | | | 4,058 | | | 4,605 |
Total investments | | $ | 6,542 | $ | 6,735 | | | | $ | 5,241 | | $ | 6,169 |
For the threequarter and nine months ended September 30, 20142015 and 2013,2014, we recorded our share of equity earnings from our investments in unconsolidated joint ventures and entities as follows (dollars in thousands):follows:
| | | | | | | | | | | | | | | | | | | | | | |
| | | | | | | | | | | | Quarter Ended | | Nine Months Ended |
| | Three Months Ended | | Nine Months Ended | | | | | September 30, | | | September 30, | | | September 30, | | | September 30, |
| | September 30, | | September 30, | |
| | 2014 | | 2013 | | 2014 | | 2013 | |
(Dollars in thousands) | | (Dollars in thousands) | | | 2015 | | | 2014 | | | 2015 | | | 2014 |
Rialto Distribution | $ | -- | $ | 97 | $ | 13 | $ | 137 | | | | $ | 93 | | $ | -- | | $ | 115 | | $ | 13 |
Rialto Cinemas | | 69 | | 3 | | 424 | | 71 | | | | | (100) | | | 69 | | | 35 | | | 424 |
205-209 East 57th Street Associates, LLC | | -- | | -- | | -- | | (1) | |
Mt. Gravatt | | 153 | | 125 | | 396 | | 798 | | | | | 202 | | | 153 | | | 765 | | | 396 |
Total equity earnings | $ | 222 | $ | 225 | $ | 833 | $ | 1,005 | | | | $ | 195 | | $ | 222 | | $ | 915 | | $ | 833 |
Note 7 – Goodwill and Intangible Assets
The table below summarizes goodwill by business segment as of September 30, 2015 and December 31, 2014.
| | | | | | | | | |
| | | | | | | | | |
(Dollars in thousands) | | Cinema | | Real Estate | | Total |
Goodwill as of December 31, 2014 | | $ | 16,057 | | $ | 5,224 | | $ | 21,281 |
Foreign currency translation adjustment | | | (2,234) | | | -- | | | (2,234) |
Goodwill at September 30, 2015 | | $ | 13,823 | | $ | 5,224 | | $ | 19,047 |
The Company is required to test goodwill and other intangible assets for impairment on an annual basis and, if current events or circumstances require, on an interim basis. Our next annual evaluation of goodwill and other intangible assets is scheduled for the fourth quarter of 2015. To test the impairment of goodwill, the Company compares the fair value of each reporting unit to its carrying amount, including the goodwill, to determine if there is potential goodwill impairment. A reporting unit is generally one level below the operating segment. As of September 30, 2015, we were not aware of any events that made us believe potential impairment of goodwill had occurred.
The tables below summarize intangible assets other than goodwill as of September 30, 2015 and December 31, 2014, respectively.
| | | | | | | | | | | | |
| | As of September 31, 2015 |
(Dollars in thousands) | | Beneficial Leases | | Trade Name | | Other Intangible Assets | | Total |
Gross intangible assets | | $ | 26,738 | | $ | 7,254 | | $ | 692 | | $ | 34,684 |
Less: Accumulated amortization | | | (19,687) | | | (4,207) | | | (443) | | | (24,337) |
Net intangible assets | | $ | 7,051 | | $ | 3,047 | | $ | 249 | | $ | 10,347 |
| | | | | | | | | | | | |
| | As of December 31, 2014 |
(Dollars in thousands) | | Beneficial Leases | | Trade Name | | Other Intangible Assets | | Total |
Gross intangible assets | | $ | 24,150 | | $ | 7,254 | | $ | 423 | | $ | 31,827 |
Less: Accumulated amortization | | | (15,989) | | | (3,929) | | | (423) | | | (20,341) |
Net intangible assets | | $ | 8,161 | | $ | 3,325 | | $ | -- | | $ | 11,486 |
Beneficial leases are amortized over the life of the lease up to 30 years, trade names are amortized based on the accelerated amortization method over its estimated useful life of 45 years, and other intangible assets are amortized over 10 years. The table below summarizes the amortization expense of intangible assets for the quarter and nine months as of September 30, 2014 and September 30, 2015, respectively.
| | | | | | | | | | | | | |
| | Quarter Ended | | Nine Months Ended | |
| | September 30, | | September 30, | | September 30, | | September 30, | |
(Dollars in thousands) | | 2015 | | 2014 | | 2015 | | 2014 | |
Beneficial lease amortization | | $ | 191 | | $ | 187 | | $ | 574 | | $ | 633 | |
Other amortization | | | 207 | | | 158 | | | 649 | | | 767 | |
Total intangible assets amortization | | $ | 398 | | $ | 345 | | $ | 1,223 | | $ | 1,400 | |
Note 8 – Goodwill and Intangible Assets
In accordance with FASB ASC 350-20-35, Goodwill - Subsequent Measurement and Impairment, we perform an annual impairment review in the fourth quarter of our goodwill and other intangible assets on a reporting unit basis, or earlier if changes in circumstances indicate an asset may be impaired. No such circumstances existed during the 2014 Quarter and 2014 Nine Month period. As of September 30, 2014 and December 31, 2013, we had goodwill consisting of the following (dollars in thousands):
| | | | | | |
| | | | | | |
| | Cinema | | Real Estate | | Total |
Balance as of December 31, 2013 | $ | 16,935 | $ | 5,224 | $ | 22,159 |
Foreign currency translation adjustment | | (621) | | -- | | (621) |
Balance at September 30, 2014 | $ | 16,314 | $ | 5,224 | $ | 21,538 |
We have intangible assets other than goodwill that are subject to amortization, which we amortize over various periods. We amortize our beneficial leases over the lease period, the longest of which is 30 years; our trade name using an accelerated amortization method over its estimated useful life of 45 years; and our other intangible assets over 10 years. For the three and nine months ended September 30, 2014, the amortization expense of intangibles totaled $345,000 and $1.4 million, respectively, and, for the three and nine months ended September 30, 2013, the amortization expense of intangibles totaled $620,000 and $1.7 million, respectively. The accumulated amortization of intangibles includes $633,000 and $777,000 of the amortization of acquired leases, which are recorded in operating expense for the nine months ended September 30, 2014 and 2013, respectively.
Intangible assets subject to amortization consist of the following (dollars in thousands):
| | | | | | | | |
| | | | | | | | |
As of September 30, 2014 | | Beneficial Leases | | Trade name | | Other Intangible Assets | | Total |
Gross carrying amount | $ | 24,171 | $ | 7,254 | $ | 453 | $ | 31,878 |
Less: Accumulated amortization | | 15,641 | | 3,826 | | 453 | | 19,920 |
Total, net | $ | 8,530 | $ | 3,428 | $ | -- | $ | 11,958 |
| | | | | | | | |
As of December 31, 2013 | | Beneficial Leases | | Trade name | | Other Intangible Assets | | Total |
Gross carrying amount | $ | 24,223 | $ | 7,254 | $ | 455 | $ | 31,932 |
Less: Accumulated amortization | | 14,520 | | 3,517 | | 455 | | 18,492 |
Total, net | $ | 9,703 | $ | 3,737 | $ | -- | $ | 13,440 |
Note 98 – Prepaid and Other Assets
Prepaid and other assets are summarized as follows (dollars in thousands):follows:
| | | | | | | | | | |
| | | | | | | | | | |
| | September 30, | | December 31, | | September 30, | | December 31, |
| | 2014 | | 2013 | |
(Dollars in thousands) | | | 2015 | | 2014 |
Prepaid and other current assets | | | | | | | | | | |
Prepaid expenses | $ | 1,584 | $ | 1,079 | | $ | 1,311 | | $ | 1,166 |
Prepaid taxes | | 978 | | 623 | | | 688 | | | 855 |
Prepaid rent | | 1,023 | | 1,210 | | | 905 | | | 1,033 |
Deposits | | 369 | | 368 | | | 369 | | | 369 |
Other | | 3 | | 3 | | | -- | | | 3 |
Total prepaid and other current assets | $ | 3,957 | $ | 3,283 | | $ | 3,273 | | $ | 3,426 |
| | | | | | | | | | |
Other non-current assets | | | | | | | | | | |
Other non-cinema and non-rental real estate assets | $ | 1,134 | $ | 1,134 | | $ | 1,134 | | $ | 1,134 |
Long-term deposits | | 114 | | 144 | | | 69 | | | 97 |
Deferred financing costs, net | | 2,074 | | 1,833 | | | 1,967 | | | 2,515 |
Interest rate cap at fair value | | 40 | | 75 | |
Tenant inducement asset | | 471 | | 512 | |
Straight-line rent asset | | 2,276 | | 2,310 | |
Straight-line rent | | | | 2,044 | | | 2,547 |
Other | | -- | | 2 | | | 57 | | | 20 |
Total non-current assets | $ | 6,109 | $ | 6,010 | | $ | 5,271 | | $ | 6,313 |
Note 109 – Income Tax
The provision for income taxes is different from the amount computed by applying U.S. statutory rates to consolidated lossesincome before taxes. The significant reason for these differences is as follows (dollars in thousands):follows:
| | | | | | | | |
| | | | | | | | |
| | Three Months Ended | | Nine Months Ended |
| | September 30, | | September 30, |
| | 2014 | | 2013 | | 2014 | | 2013 |
Expected tax provision | $ | 1,838 | $ | 1,090 | $ | 4,630 | $ | 3,139 |
Increase (decrease) in tax expense resulting from: | | | | | | | | |
Change in valuation allowance, other | | (1,611) | | (1,099) | | (4,019) | | (3,033) |
Foreign tax provision | | 770 | | 88 | | 3,450 | | 1,129 |
Foreign withholding tax provision | | 146 | | 262 | | 435 | | 798 |
Tax effect of foreign tax rates on current income | | (227) | | 9 | | (611) | | (106) |
State and local tax provision | | 2 | | 150 | | 257 | | 387 |
Tax/audit litigation settlement | | 394 | | 251 | | 605 | | 826 |
Actual tax provision | $ | 1,312 | $ | 751 | $ | 4,747 | $ | 3,140 |
| | Quarter Ended | | Nine Months Ended |
| | September 30, | | September 30, | | September 30, | | September 30, |
(Dollars in thousands) | | 2015 | | 2014 | | 2015 | | 2014 |
Expected tax provision | | $ | 315 | | $ | 1,838 | | $ | 8,436 | | $ | 4,630 |
Increase (decrease) in tax expense resulting from: | | | | | | | | | | | | |
Change in valuation allowance, other | | | 810 | | | (1,611) | | | 38 | | | (4,019) |
Foreign tax provision | | | 42 | | | 770 | | | 117 | | | 3,450 |
Foreign withholding tax provision | | | 156 | | | 146 | | | 492 | | | 435 |
Reversal of tax expense on undistributed foreign earnings | | | -- | | | -- | | | (3,394) | | | -- |
Tax effect of foreign tax rates on current income | | | (741) | | | (227) | | | (1,035) | | | (611) |
State and local tax provision | | | (81) | | | 2 | | | 265 | | | 257 |
Tax litigation settlement | | | 180 | | | 394 | | | 540 | | | 605 |
Tax litigation settlement adjustment | | | (164) | | | -- | | | (854) | | | -- |
Actual tax provision | | $ | 517 | | $ | 1,312 | | $ | 4,605 | | $ | 4,747 |
Pursuant to FASB ASC 740-10, – Income Taxes (“FASB ASC 740-10”), a provision should be made for the tax effect of earnings of foreign subsidiaries that are not permanently invested outside the United States. OurDuring the second quarter of 2015, we adjusted our capital allocation strategy to require that earnings available in Australia be reinvested in Australia. The adjustment was primarily supported by increased investment opportunities in Australia. Accordingly, as of June 30, 2015, our intent is that earnings of our foreignAustralian subsidiaries are not permanentlyindefinitely invested outside the United States. Current earnings were available for distribution in the Reading Australia and Reading New Zealand consolidated group of subsidiaries as of September 30, 2014. We have provided $453,000 in withholding tax expense in relation to those earnings. We believe the U.S. tax impact of a dividend from our Australian and New Zealand subsidiaries, net of loss carry forward and potential foreign tax credits, would not have a material effect on the tax provision as of September 30, 2014.
Deferred income taxes reflect the “temporary differences” between the financial statement carrying amounts of assets and liabilities for financial reporting purposes and the amounts used for income tax purposes, adjusted by the relevant tax rate. In accordance with FASB ASC 740-10, we record net deferred tax assets to the extent we believe these assets will more likely than not be realized. In making such determination, we consider all available positive and negative evidence, including scheduled reversals of deferred tax assets and liabilities, projected future taxable income, tax planning strategies, and recent financial performance. FASB ASC 740-10 presumes that a valuation allowance is required when there is substantial negative evidence about realization of deferred tax assets, such as a pattern of losses in recent years, coupled with facts that suggest such losses may continue.
We have accrued $15.6$11.5 million in total income tax liabilities as of September 30, 2014,2015, of which $ 3.8$4.4 million has been classified as taxes payable-currentTaxes Payable – Current and $11.8$7.1 million havehas been classified as taxes payableTaxes Payable – long-term.Long-Term. As part of current tax liabilities, we have accrued $3.5$2.7 million in connection with the settlement of the IRS claims against our subsidiary, Craig Corporation, relating to its 1996 tax year. This is an obligation of Craig Corporation, and not of Reading International, Inc. We believe that the $15.6$11.5 million represents an adequate provision for our income and other tax exposures, including income tax contingencies related to foreign withholding taxes.
In accordance with FASB ASC 740-10-25
Note 10 – Income Taxes - Uncertain Tax Positions (“FASB ASC 740-10-25”), we record interest and penalties related to income tax matters as part of income tax expense. Debt
The following table is a summary of the activity related to unrecognized tax benefits, excluding interest and penalties, for the periods endingCompany’s borrowings at September 30, 2014 December 31, 2013,2015 and December 31, 2012 (dollars in thousands):2014, including the impact of interest rate swaps, are summarized below:
| | | | | | |
| | | | | | |
| | Nine Months Ended September 30, 2014 | | Year Ended December 31, 2013 | | Year Ended December 31, 2012 |
Unrecognized tax benefits – gross beginning balance | $ | 2,160 | $ | 2,171 | $ | 1,974 |
Gross increases – prior period tax provisions | | 171 | | (11) | | 197 |
Unrecognized tax benefits – gross ending balance | $ | 2,331 | $ | 2,160 | $ | 2,171 |
| | | | | | | | | | | | | |
| | | As of September 30, 2015 |
(Dollars in thousands) | | Maturity Date | | Contractual Facility | | Balance | | Stated Interest Rate | | Effective Interest Rate (1) |
Denominated in USD | | | | | | | | | | | | |
| Trust Preferred Securities (USA) | | April 30, 2027 | | $ | 27,913 | | $ | 27,913 | | 4.30% | | 5.20% |
| Bank of America Credit Facility (USA) | | November 28, 2019 | | | 55,000 | | | 29,750 | | 2.69% | | 3.65% |
| Bank of America Line of Credit (USA) | | October 31, 2017 | | | 5,000 | | | -- | | 3.19% | | 3.19% |
| Cinema 1, 2, 3 Term Loan (USA) | | July 1, 2016 | | | 15,000 | | | 15,000 | | 3.75% | | 3.75% |
| Cinema 1, 2, 3 Line of Credit (USA) | | July 1, 2016 | | | 6,000 | | | -- | | 3.75% | | 3.69% |
| Minetta & Orpheum Theatres Loan (USA) | | June 1, 2018 | | | 7,500 | | | 7,500 | | 3.00% | | 3.00% |
| Union Square Line of Credit (USA) | | June 2, 2017 | | | 8,000 | | | 8,000 | | 3.28% | | 3.28% |
Denominated in FC (2) | | | | | | | | | | | | |
| NAB Corporate Term Loan (AU) | | June 30, 2019 | | | 39,663 | | | 39,663 | | 4.45% | | 7.85% |
| NAB Corporate Credit Facility (AU) | | June 30, 2019 | | | 7,020 | | | -- | | 4.45% | | 4.45% |
| Westpac Corporate Credit Facility (NZ) | | March 31, 2018 | | | 31,950 | | | 17,892 | | 4.65% | | 4.65% |
Total | | | | | | | | $ | 145,718 | | | | |
For the nine months ended September 30, 2014, we recorded a change of approximately $171,000 to our gross unrecognized tax benefits. The net tax balance is approximately $2.3(1) million,Effective interest rate includes the impact of which $1.3 million would impactinterest rate derivatives hedging the effectiveinterest rate if recognized.
It is difficult to predict the timingrisk associated with Trust Preferred Securities, Bank of America Credit Facility and resolution of uncertain tax positions. Based upon the Company’s assessment of many factors, including past experience and judgments about future events, we estimateNAB Corporate Term Loan that within the next 12 months the reserve for uncertain tax positions will increase within a range of $500,000 to $1.5 million. The reasons for such changes include but are not limited to tax positions expected to be taken during the next twelve months, reevaluation of current uncertain tax positions, expiring statutes of limitations, and interest related to the “Tax Audit/Litigation” settlement which occurred January 6, 2011.
Our company and subsidiaries are subject to U.S. federal income tax, income tax in U.S. states and possessions, and income tax in Australia and New Zealand. Generally, changes to our U.S. federal and most state income tax returns for the calendar year 2009 and earlier are barred by statutes of limitations. Our income tax returns of Australia filed since inception in 1995 are generally open for examination because of operating losses. The income tax returns filed in New Zealand for calendar year 2009 and afterward generally remain open for examinationwere outstanding as of September 30, 2014.
Note 11 – Notes Payable
Notes payable are summarized as follows (dollars in thousands):
| | | | | | | |
| | | | | | | |
Name of Note Payable or Security | 2014 Interest Rates | 2013 Interest Rates | Maturity Date | | 2014 Balance | | 2013 Balance |
Trust Preferred Securities | 4.23% | 4.24% | April 30, 2027 | $ | 27,913 | $ | 27,914 |
Australian NAB Corporate Term Loan | 5.07% | 5.09% | June 30, 2019 | | 51,111 | | 56,699 |
Australian Shopping Center Loans | -- | -- | November 1, 2014 | | 45 | | 89 |
New Zealand Corporate Credit Facility | 5.50% | 4.80% | March 31, 2015 | | 21,806 | | 23,041 |
US Bank of America Revolver | 2.65% | 2.67% | October 31, 2017 | | 29,750 | | 31,500 |
US Cinema 1, 2, 3 Term Loan | 3.65% | 5.21% | July 1, 2016 | | 15,000 | | 15,000 |
US Minetta & Orpheum Theatres Loan | 2.90% | 2.91% | June 1, 2018 | | 7,500 | | 7,500 |
US Union Square Theatre Term Loan | 5.92% | 5.92% | May 1, 2015 | | 6,531 | | 6,717 |
Total | | | | $ | 159,656 | $ | 168,460 |
Derivative Instruments2015
As indicated in Note 17 – (2)Derivative Instruments, for both our Australian NAB Corporate Credit Facility (“NAB Loan”) The contractual facilities and our U.S. Bank of America Revolver (“BofA Revolver”), we have entered into interest rate swap agreements for all or part of these facilities. The loan agreement together with the swap results in us paying a total fixed interest rate of 7.85% (1.15% swap contract rate plus a 2.35% margin under the loan) for our NAB Loan and a total fixed interest rate of 5.20% (1.20% swap contract rate plus a 4.00% margin under the loan) for our BofA Revolver insteadoutstanding balances of the above indicated 5.07% and 2.65%, respectively, which areFC-denominated borrowings were translated into U.S. dollars based on the obligatorily disclosed loan rates. Additionally, on June 3, 2013, we entered into a new swap agreement for our BofA Revolver that came into effect on December 31, 2013 (see Note 17 – Derivative Instruments).applicable exchange rates as of September 30, 2015.
| | | | | | | | | | | | | |
| | | As of December 31, 2014 |
(Dollars in thousands) | | Maturity Date | | Contractual Facility | | Balance | | Stated Interest Rate | | Effective Interest Rate (1) |
Denominated in USD | | | | | | | | | | | | |
| Trust Preferred Securities (USA) | | April 30, 2027 | | $ | 27,913 | | $ | 27,913 | | 4.23% | | 5.20% |
| Bank of America Credit Facility (USA) | | November 28, 2019 | | | 55,000 | | | 29,750 | | 2.67% | | 3.65% |
| Bank of America Line of Credit (USA) | | October 31, 2017 | | | 5,000 | | | -- | | 3.17% | | 3.17% |
| Cinema 1, 2, 3 Term Loan (USA) | | July 1, 2016 | | | 15,000 | | | 15,000 | | 3.69% | | 3.69% |
| Cinema 1, 2, 3 Line of Credit (USA) | | July 1, 2016 | | | 6,000 | | | -- | | 3.69% | | 3.69% |
| Minetta & Orpheum Theatres Loan (USA) | | June 1, 2018 | | | 7,500 | | | 7,500 | | 2.94% | | 2.94% |
| Union Square Theatre Term Loan (USA) | | May 1, 2015 | | | 7,500 | | | 6,468 | | 5.92% | | 5.92% |
Denominated in FC (2) | | | | | | | | | | | | |
| NAB Corporate Term Loan (AU) | | June 30, 2019 | | | 47,403 | | | 47,403 | | 5.04% | | 7.85% |
| NAB Corporate Credit Facility (AU) | | June 30, 2019 | | | 8,173 | | | 8,173 | | 5.04% | | 5.04% |
| Westpac Corporate Credit Facility (NZ) | | March 31, 2015 | | | 21,829 | | | 21,829 | | 5.80% | | 5.80% |
Total | | | | | | | | $ | 164,036 | | | | |
Notes Payable Refinancing(1) Effective interest rate includes the impact of interest rate derivatives hedging interest rate risk associated with Trust Preferred Securities, Bank of America Credit Facility and Payoff
Australian NAB Corporate Term LoanLoan.
(2) The contractual facilities and Revolveroutstanding balances of the FC-denominated borrowings were translated into U.S. dollar based on the applicable exchange rates as of December 31, 2014.
On June 27, 2014, we refinanced our existing three-tiered credit facility with NAB. It is comprised of (1) the Bank Bill Discount Facility with a facility limit of AUS$61.2 million, an interest rate of 2.35% above the BBSY, and amortization at AUS$2.0 million per year; (2) the Bill Discount Facility – Revolving with a facility limit of AUS$10.0 million and an interest rate of 1.50% above the BBSY on any undrawn portion. Currently we have not drawn any of this revolver; and (3) the Bank Guarantee Facility with a facility limit of AUS$5.0 million. All three have an expiry date of June 30, 2019. The modification of this particular term loan was not considered to be substantial as defined by ASC 740.
New Zealand Corporate Credit Facility
TheOn May 21, 2015, we refinanced our existing New Zealand Corporate Credit Facility with a $32.0 million (NZ$50.0 million) facility with the same bank loan comes due for repayment(Westpac Bank), bearing an interest rate of 1.75% above Bank Bill Bid Rate (“BBBR”) and maturing on March 31, 2015. This loan has been classified as2018. The facility is broken into two tranches, one a short term liability on$22.4 million (NZ$35.0 million) credit facility and the consolidated balance sheet as of June 30, 2014.second tranche for a $9.6 million (NZ$15.0 million) facility to be used for construction funding.
US Bank of America Revolver
On March 25, 2013, Bank of America extended the borrowing limit on our BofA Revolver from $30.0 million to $35.0 million and we borrowed $5.0 million on this revolver. On April 1, 2013, we used $2.3 million of the revolver proceeds to partially repay our US Liberty Theaters Term Loan.
US Bank of AmericaUnion Square Non-Revolving Line of Credit
On June 28, 2013,2, 2015, we repaid the entire $2.0replaced our US Union Square Term Loan with an $8.0 million outstanding balance on our $5.0 million Bank of America"non-revolving" line of credit.
US Cinema 1, 2 & 3 Term Loan
On June 26, 2014, our controlled subsidiary Sutton Hill Properties, LLC, entered into an agreementcredit with SantanderEast West Bank, N.A, refinancing the current loan on the property and providing an additional $6.0 million for the acquisition of rights to add additional density to any redevelopment of the property (“air rights”).We replaced an existing term loan of $15.0 million that was scheduled to mature on the following day. The new loan has a 2-year term, payable interest only, commencing June 27, 2014, all principal and unpaid interest due and payable on maturity. The loan is collateralized by our Cinemas 1,2,3 property (including any air rights that we may acquire).Union Square property. The loan hasline of credit bears an interest rate of 3.50% over2.95% above the 30-day Libor. The modification of this particular term loan was not considered90-day LIBOR and matures on June 2, 2017, with an option to be substantial as defined by ASC 740.
US Minetta and Orpheum Theatres Loan
On May 29, 2013, we refinanced our Liberty Theaters loan with a $7.5 million loan securitized by our Minetta and Orpheum theatres, having a maturity date of June 1, 2018, bearing an interest rate of LIBOR plus a 2.75% margin and having a LIBOR rate cap of 4.00% (plus the 2.75% margin). See Note 16 – Derivative Instruments.
US Union Square Term Loan
The US Union Square Term loan comes dueextend for repayment on May 1, 2015. This loan has been classified as a short-term liability on the consolidated balance sheet as of June 30, 2014.
US Sutton Hill Capital Note – Related Party
On June 18, 2013, we repaid our 8.25% note to Sutton Hill Capital (“SHC”) for $9.0 million. As the debtor on this note was Sutton Hill Properties, LLC, in which we have a 75% interest, the note was, in effect, paid $6.75 million by us and $2.25 million by our co-investor.
one additional year.
Note 11 – Other Liabilities
Other liabilities are summarized as follows:
| | | | | | |
(Dollars in thousands) | | September 30, 2015 | | December 31, 2014(1) |
Current liabilities | | | | | | |
Lease liability | | $ | 5,900 | | $ | 5,900 |
Security deposit payable | | | 202 | | | 202 |
Accrued pension | | | 1,368 | | | 855 |
Interest rate swap | | | 962 | | | - |
Other | | | 69 | | | 12 |
Other current liabilities | | $ | 8,501 | | $ | 6,969 |
Other liabilities | | | | | | |
Straight-line rent liability | | | 10,737 | | | 9,246 |
Foreign withholding taxes | | $ | 7,217 | | $ | 7,016 |
Accrued pension | | | 6,362 | | | 6,740 |
Lease make-good provision | | | 4,201 | | | 4,977 |
Deferred revenue - real estate | | | 4,541 | | | 5,083 |
Environmental reserve | | | 1,656 | | | 1,656 |
Interest rate swap | | | 520 | | | 2,177 |
Acquired leases | | | 959 | | | 1,265 |
Other | | | 2,915 | | | 2,417 |
Other liabilities | | $ | 39,108 | | $ | 40,577 |
(1)Certain prior period amounts have been reclassified to conform to the current period presentation
On August 29, 2014 the Supplemental Executive Retirement Plan (“SERP”) that was effective since March 1, 2007, was ended and replaced with a new pension annuity. As a result of the termination of the SERP program, the accrued pension liability of $7.6 million was reversed and replaced with a new pension annuity liability of $7.5 million. The valuation of the liability is based on the present value of $10.3 million discounted at a rate of 4.25% over a 15- year term, resulting in a monthly payment of $56,944 payable to the estate of Jim Cotter Sr.. The discounted value of $2.8 million (which is the difference between the estimated payout of $10.3 million and the present value of $7.5 million) will be amortized and expensed based on the 15-year term. In addition, the accumulated actuarial loss of $3.1 million recorded, as part of other comprehensive income will also be amortized based on the 15-year term.
As a result of the above, included in our other current and non-current liabilities are accrued pension costs of $7.7 million at September 30, 2015. The benefits of our pension plans are fully vested and therefore no service costs were recognized for the quarter and nine months ended September 30, 2015 and 2014. Our pension plans are unfunded. During the current quarter and nine month period ended September 30, 2015, interest cost totaled $45,007 and $135,020, respectively and amortized actuarial loss totaled $51,000 and $155,000, respectively. During the prior-year quarter and nine-month ended September 30, 2014, interest cost totaled $52,000 and $209,000, respectively and amortized actuarial loss totaled $215,000 and $686,000, respectively.
Note 12 – Other Liabilities
Other liabilities are summarized as follows (dollars in thousands):
| | | | |
| | | | |
| | September 30, | | December 31, |
| | 2014 | | 2013 |
Current liabilities | | | | |
Lease liability | $ | 5,900 | $ | 5,900 |
Security deposit payable | | 202 | | 246 |
Other | | -- | | 9 |
Other current liabilities | $ | 6,102 | $ | 6,155 |
Other liabilities | | | | |
Foreign withholding taxes | $ | 6,949 | $ | 6,748 |
Straight-line rent liability | | 9,274 | | 9,259 |
Environmental reserve | | 1,656 | | 1,656 |
Accrued pension | | 7,550 | | 8,527 |
Interest rate swap | | 2,260 | | 3,288 |
Acquired leases | | 1,376 | | 1,797 |
Other payable | | 751 | | 875 |
Other | | 2,310 | | 599 |
Deferred Revenue - Real Estate | | 5,399 | | -- |
Other liabilities | $ | 37,525 | $ | 32,749 |
Included in our other liabilities are accrued pension costs of $7.5 million at September 30, 2014. The benefits of our pension plans are fully vested, and, as such, no service costs were recognized for the three or nine months ended September 30, 2014 and 2013. Our pension plans are unfunded; therefore, the actuarial assumptions do not include an estimate for any expected return on the plan assets. For the three and nine months ended September 30, 2014, we recognized $52,000 and $209,000, respectively, of interest cost and $215,000 and $686,000, respectively, of amortized prior service cost. For the three and nine months ended September 30, 2013, we recognized $66,000 and $231,000, respectively, of interest cost and $166,000 and $330,000, respectively, of amortized prior service cost.
On August 29, 2014 the Supplemental Executive Retirement Plan “SERP” that was effective since March 1, 2007, was ended and replaced with a new Pension annuity. As a result of the termination of the SERP program the accrued pension liability of $7.6 million was reversed and replaced with a new pension annuity liability of $7.5 million. The valuation of the liability is based on the present value of $10.3 million discounted at a 4.25% over a 15- year term. Monthly payments of $56,944 will be made to the estate of Jim Cotter Sr. commencing October 1, 2014. The discounted value of $2.8 million (which is the difference between the estimated payout of $10.3 million and the present value of $7.5 million) will be amortized and expensed over the 15-year term. In addition, the accumulated prior service costs of $3.1 million recorded as part of other comprehensive income will also be amortized over the 15-
year term.
Note 1312 – Commitments and Contingencies
Unconsolidated Debt
Total debt of unconsolidated joint ventures and entities was $623,000$639,000 (NZ$1.0 million) and $634,000$592,000 (NZ$ 760,000 ) as of September 30, 20142015 and December 31, 2013.2014, respectively. Our share of unconsolidated debt, based on our ownership percentage, was $208,000$213,000 and $211,000$197,000 as of September 30, 20142015 and December 31, 201,2014, respectively. This debt is guaranteed by one of our subsidiaries to the extent of our ownership percentage.
Note 13 – Non-controlling Interests
These are composed of the following enterprises:
| · | | Australia Country Cinemas Pty Ltd. -- 25% noncontrolling interest owned by Panorama Cinemas for the 21st Century Pty Ltd.; |
| · | | Shadow View Land and Farming, LLC -- 50% noncontrolling membership interest owned by the estate of Mr. James J. Cotter, Sr.; and |
| · | | Sutton Hill Properties, LLC -- 25% noncontrolling interest owned by Sutton Hill Capital, LLC. |
The components of noncontrolling interests are as follows:
| | | | | | |
| | September 30, | | December 31, |
(Dollars in thousands) | | 2015 | | 2014 |
Australian Country Cinemas, Pty Ltd | | $ | 344 | | $ | 410 |
Shadow View Land and Farming, LLC | | | 1,952 | | | 2,000 |
Sutton Hill Properties, LLC | | | 2,075 | | | 2,202 |
Noncontrolling interests in consolidated subsidiaries | | $ | 4,371 | | $ | 4,612 |
The components of income (loss) attributable to noncontrolling interests are as follows:
| | | | | | | | | | | | |
| | Quarter Ended | | Nine Months Ended |
| | September 30, | | September 30, | | September 30, | | September 30, |
(Dollars in thousands) | | 2015 | | 2014 | | 2015 | | 2014 |
Australian Country Cinemas, Pty Ltd | | $ | 1 | | $ | 56 | | $ | 131 | | $ | 128 |
Shadow View Land and Farming, LLC | | | (9) | | | (22) | | | (66) | | | (49) |
Sutton Hill Properties, LLC | | | (46) | | | (34) | | | (125) | | | (102) |
Net income (loss) attributable to noncontrolling interest | | $ | (54) | | $ | -- | | $ | (60) | | $ | (23) |
Summary of Controlling and Noncontrolling Stockholders’ Equity
A summary of the changes in controlling and noncontrolling stockholders’ equity is as follows:
| | | | | | | | | |
(Dollars in thousands) | | | Controlling Stockholders’ Equity | | | Noncontrolling Stockholders’ Equity | | | Total Stockholders’ Equity |
Equity at – January 1, 2015 | | $ | 127,686 | | $ | 4,612 | | $ | 132,298 |
Net income (loss) | | | 19,496 | | | (60) | | | 19,436 |
Increase in additional paid in capital | | | 2,242 | | | -- | | | 2,242 |
Treasury stock purchased | | | (4,942) | | | -- | | | (4,942) |
Contributions from noncontrolling stockholders - SHP | | | -- | | | 17 | | | 17 |
Distributions to noncontrolling stockholders | | | -- | | | (139) | | | (139) |
Accumulated other comprehensive loss | | | (27,675) | | | (59) | | | (27,734) |
Equity at – September 30, 2015 | | $ | 116,807 | | $ | 4,371 | | $ | 121,178 |
| | | | | | | | | |
| | | | | | | | | |
(Dollars in thousands) | | | Controlling Stockholders’ Equity | | | Noncontrolling Stockholders’ Equity | | | Total Stockholders’ Equity |
Equity at – January 1, 2014 | | $ | 117,140 | | $ | 4,607 | | $ | 121,747 |
Net income (loss) | | | 8,481 | | | (23) | | | 8,458 |
Increase in additional paid in capital | | | 1,062 | | | -- | | | 1,062 |
Treasury stock purchased | | | (2,342) | | | -- | | | (2,342) |
Contributions from noncontrolling stockholders - SHP | | | -- | | | 327 | | | 327 |
Distributions to noncontrolling stockholders | | | -- | | | (101) | | | (101) |
Accumulated other comprehensive loss | | | (3,957) | | | (14) | | | (3,971) |
Equity at – September 30, 2014 | | $ | 120,385 | | $ | 4,796 | | $ | 125,180 |
Note 14 – Noncontrolling interestsEquity and Stock-Based Compensation
Noncontrolling interests are composedStock-Based Compensation
During the first quarter of 2015 and 2014, we issued 160,643 and 125,209 shares, respectively, of Class A Nonvoting Common Stock to an executive employee associated with the vesting of his prior years’ stock grants. No such grants were made during the second and third quarters of 2015 and 2014.
Employee/Director Stock Option Plan
The Company may grant stock options and other share-based payment awards (“Awards”) of our Class A Nonvoting Common Stock to eligible employees, directors, and consultants under the 2010 Stock Incentive Plan. The aggregate total number of shares of the following enterprises:Class A Nonvoting Common Stock authorized for issuance under our 2010 Stock Incentive Plan is 1,250,000. As of September 30, 2015, we had 663,800 shares remaining for future issuances.
Number of securities remaining available for future issuance under equity compensation plans Stock options are generally granted at exercise prices equal to the grant-date market prices and expire no later than ten years from the grant date. In recent periods, we have typically limitd the exercise period of granted options to five years. At the discretion of our Compensation and Stock Options Committee, the vesting period of stock options ranges from zero to four years. We estimate the grant-date fair value of our options using the Black-Scholes option-valuation model, which takes into account assumptions such as the dividend yield, the risk-free interest rate, the expected stock price volatility, and the expected life of the options. We expense the estimated grant-date fair values of options over the vesting period on a straight-line basis. Based on our historical experience and the relative market price to strike price of the options, we have not hereto estimated any forfeitures of vested or unvested options. | ·
| | Australia Country Cinemas Pty Ltd. (“ACC”) 25% noncontrolling interest owned by Panorama Cinemas for the 21st Century Pty Ltd.;
|
| ·
| | Shadow View Land and Farming, LLC 50% noncontrolling membership interest owned by the estate of Mr. James J. Cotter, Sr.; and
|
| ·
| | Sutton Hill Properties, LLC (“SHP”) 25% noncontrolling interest owned by Sutton Hill Capital, LLC.
|
The components of noncontrolling interests are as follows (dollars in thousands):
| | | | |
| | | | |
| | September 30, | | December 31, |
| | 2014 | | 2013 |
Australian Country Cinemas | $ | 545 | $ | 532 |
Shadow View Land and Farming LLC | | 2,015 | | 1,862 |
Sutton Hill Properties | | 2,236 | | 2,213 |
Noncontrolling interests in consolidated subsidiaries | $ | 4,796 | $ | 4,607 |
The components of income attributable to noncontrolling interests are as follows (dollars in thousands):
| | | | | | | | |
| | | | | | | | |
| | Three Months Ended | | Nine Months Ended |
| | September 30, | | September 30, |
| | 2014 | | 2013 | | 2014 | | 2013 |
AFC LLC | $ | -- | $ | -- | $ | -- | $ | 173 |
Australian Country Cinemas | | 56 | | 49 | | 128 | | 97 |
Shadow View Land and Farming LLC | | (22) | | (24) | | (49) | | (38) |
Sutton Hill Properties | | (34) | | 13 | | (102) | | (158) |
Net income (loss) attributable to noncontrolling interest | $ | 0 | $ | 38 | $ | (23) | $ | 74 |
Summary of Controlling and Noncontrolling Stockholders’ Equity
A summary of the changes in controlling and noncontrolling stockholders’ equity is as follows (dollars in thousands):
| | | | | | |
| | | | | | |
| | Controlling Stockholders’ Equity | | Noncontrolling Stockholders’ Equity | | Total Stockholders’ Equity |
Equity at – January 1, 2014 | $ | 117,140 | $ | 4,607 | $ | 121,747 |
Net Income (loss) | | 8,481 | | (23) | | 8,458 |
Increase in additional paid in capital | | 1,062 | | -- | | 1,062 |
Treasury stock purchased | | (2,342) | | -- | | (2,342) |
Contributions from noncontrolling stockholders - SHP | | -- | | 327 | | 327 |
Distributions to noncontrolling stockholders | | -- | | (101) | | (101) |
Accumulated other comprehensive income | | (3,957) | | (14) | | (3,971) |
Equity at – September 30, 2014 | $ | 120,385 | $ | 4,796 | $ | 125,181 |
| | | | | | |
| | | | | | |
| | Controlling Stockholders’ Equity | | Noncontrolling Stockholders’ Equity | | Total Stockholders’ Equity |
Equity at – January 1, 2013 | $ | 126,856 | $ | 4,098 | $ | 130,954 |
Net Income | | 5,860 | | 74 | | 5,934 |
Increase in additional paid in capital | | 297 | | 76 | | 373 |
Contributions from noncontrolling stockholders - SHP | | -- | | 2,513 | | 2,513 |
Distributions to noncontrolling stockholders | | -- | | (2,103) | | (2,103) |
Accumulated other comprehensive income | | (12,488) | | (57) | | (12,545) |
Equity at – September 30, 2013 | $ | 120,525 | $ | 4,601 | $ | 125,126 |
Note 15 – Common Stock
Common Stock Issuance
DuringFor the nine months ended September 30, 2015 and 2014, and 2013, we issued 125,209 and 217,890, respectively, of Class A Nonvoting shares to an executive employee associated with his prior years’ stock grants. the weighted average assumptions used in the option-valuation model were as follows:
Table Of Contents
| | | | | | | | | | |
| | | | | 2015 | | 2014 | |
Stock option exercise price | | | | | $ | 13.30 | | $ | 7.40 | |
Risk-free interest rate | | | | | | 2.23% | | 2.88% | |
Expected dividend yield | | | | | | -- | | -- | |
Expected option life in years | | | | | | 4 | | 10 | |
Expected volatility | | | | | | 31.86% | | 30.65% | |
Weighted average fair value | | | | | $ | 3.82 | | $ | 2.46 | |
We recorded compensation expense of $75,428 and $208,831 for the quarter and nine months ended September 30, 2015, respectively, and $34,000 and $102,000 for the same periods ended September 30, 2014, respectively. At September 30, 2015, the total unrecognized estimated compensation cost related to non-vested stock options was $653,626, which we expect to recognize over a weighted average vesting period of 1.86 years. 336,100 options were exercised during the nine months ended September 30, 2015 having an intrinsic value of $1.7 million, for which we received $2.7 million of cash and other consideration. The intrinsic, unrealized value of all options outstanding, vested and expected to vest, at September 30, 2015 was $2.3 million, of which 58.3% are currently exercisable.
The following table summarizes the information of options outstanding and exercisable as of September 30, 2015 and December 31, 2014:
| | | | | | | | | | | | | | | | | | | | | | | | |
| | Options Outstanding | | Exercisable Options |
| | Number of Options | | Weighted Average Exercise Price | | Weighted Average Remaining Years of Contractual Life | | Number of Options | | Weighted Average Exercise Price | | Weighted Average Remaining Years of Contractual Life |
(Shares in thousands) | | Class A | | Class B | | Class A | | Class B | | Class A & B | | Class A | | Class B | | Class A | | Class B | | Class A & B |
Balance - December 31, 2014 | | 568 | | 185 | | $ | 6.88 | | $ | 9.90 | | 2.44 | | 348 | | 185 | | $ | 6.82 | | $ | 9.90 | | 3.11 |
Granted | | 12 | | -- | | | 12.34 | | | -- | | | | 13 | | -- | | | -- | | | -- | | |
Exercised | | (48) | | -- | | | 6.87 | | | -- | | | | (47) | | -- | | | -- | | | -- | | |
Balance - March 31, 2015 | | 532 | | 185 | | $ | 7.01 | | $ | 9.90 | | 3.05 | | 314 | | 185 | | $ | 7.02 | | $ | 9.90 | | 2.64 |
Granted | | 100 | | -- | | | 13.42 | | | -- | | | | 31 | | -- | | | -- | | | -- | | |
Exercised | | (90) | | (85) | | | 5.29 | | | 9.51 | | | | (89) | | (85) | | | -- | | | -- | | |
Forfeited | | (4) | | -- | | | 6.23 | | | -- | | | | (3) | | -- | | | -- | | | -- | | |
Balance - June 30, 2015 | | 538 | | 100 | | $ | 8.49 | | $ | 10.24 | | 3.23 | | 253 | | 100 | | $ | 7.56 | | $ | 10.24 | | 2.41 |
Granted | | - | | - | | | - | | | - | | | | 13 | | - | | | - | | | - | | |
Exercised | | (10) | | (100) | | | 8.35 | | | 10.24 | | | | (10) | | (100) | (1) | | - | | | - | | |
Forfeited | | (4) | | - | | | 6.23 | | | - | | | | (2) | | - | | | - | | | - | | |
Balance - September 30, 2015 | | 524 | | -- | | $ | 8.51 | | | - | | 3.28 | | 254 | | -- | | $ | 7.46 | | $ | -- | | 2.65 |
| | | | | | | | | | | | | | | | | | | | | | | | |
(1) The 100,000 Class B common stock options were exercised by a trust owned by the beneficial owners of the Company.
Common Stock Buyback
On May 16, 2014, the Company's board of directors authorized management, at its discretion, to spend from time to time up to an aggregate of $10.0 million to acquire shares of Reading’s Common Stock. This approved stock repurchase plan supercedessupersedes and effectively cancels the program that was approved by the board on May 14, 2004, which allowed management to purchase up to 350,000 shares of Reading’s Common Stock.
The repurchase program allows Reading to repurchase its shares from time to time in accordance with the requirements of the Securities and Exchange CommissionSEC on the open market, in block trades and in privately negotiated transactions, depending on market conditions and other factors. All purchases are subject to the availability of shares at prices that are acceptable to Reading, and accordingly, no assurances can be given as to the timing or number of shares that may ultimately be acquired pursuant to this authorization.
Under this approved buyback program, the companyCompany has repurchased $2.3$7.2 million worth of common stock.stock at an average price of $12.92 per share. This leaves $7.7$2.8 million available for repurchase as of September 30, 2014.2015.
Note 1615 – Derivative Instruments
As more fully described in our 2013 Annual Report, we are exposed to interest rate changes from our outstanding floating rate borrowings. We manage our fixed to floating rate debt mix to mitigate the impact of adverse changes in interest rates on earnings and cash flows and on the market value of our borrowings. From time to time, we may enter into interest rate hedging contracts, which effectively convert a portionderivative instruments to hedge the interest rate risk that results from the characteristics of our variable rate debtfloating-rate borrowings. Our use of derivative transactions is intended to a fixed rate over the term of interest rate swaps or fix the maximum variable rate with an interest rate cap. For an explanation of the impact of swaps on our interest paid for the periods presented, see Note 11 – Notes Payable.
As part of our US Minetta and Orpheum Theatres Loan, we entered into a five year LIBOR rate cap of 4.00% with a loan margin of 2.75%. See Note 11 – Notes Payable. Additionally, on June 3, 2013, we entered into a new swap agreement for our BofA Revolver that will take effect on December 31, 2014 with a pay fixed rate of 1.15% and an expiration date of October 31, 2017.
The following table sets forth the terms of our interest rate swap and capreduce long-term fluctuations in cash flows caused by market movements. All derivative instruments are recorded on the balance sheet at fair value with changes in fair value through interest expense in the Consolidated Statement of Operations. As of September 30, 2014:
| | | | | | | | |
| | | | | | | | |
Type of Instrument | | Notional Amount | | Pay Fixed Rate | | Receive Variable Rate | | Maturity Date |
Interest rate swap | $ | 62,750,000 | | 5.500% | | 2.715% | | June 30, 2016 |
Interest rate swap | $ | 27,913,000 | | 1.200% | | 0.233% | | October 31, 2017 |
Interest rate swap | $ | 31,500,000 | | 1.150% | | 0.150% | | October 31, 2017 |
Interest rate cap | $ | 7,500,000 | | 4.000% | | 0.000% | | June 1, 2018 |
In accordance with FASB ASC 815-10-35, Subsequent Valuation of Derivative Instruments and Hedging Instruments (“FASB ASC 815-10-35”), we marked our interest rate swap and cap instruments to market on the consolidated balance sheet resulting in a decrease in interest expense of $958,000 and decrease of $1.0 million during the three and nine months ended September 30, 2014, respectively, and a decrease of $209,000 and $1.6 million in interest expense during the three and nine months ended September 30, 2013, respectively. At September 30, 2014 and December 31, 2013, we recorded as other long-term liabilities the fair market value of our interest rate swaps and cap of $2.3 million and $3.3 million, respectively. In accordance with FASB ASC 815-10-35,2015, we have not designated any of our currentderivatives as accounting hedges in accordance with ASC 815, Derivatives and Hedging. Please refer to our Form 10-K for 2014 for additional information.
The Company’s derivative positions measured at fair value are summarized in the following tables:
| | | | | | | | | | | | | | | |
| | As of September 30, 2015 |
(Dollars in thousands) | | Notional | | Current Assets | | Other Assets | | Other Current Liabilities | | Other Long-Term Liabilities |
Interest rate swap | | $ | 93,646 | | $ | - | | $ | - | | $ | 962 | | $ | 520 |
Interest rate cap | | | 7,500 | | | - | | | 4 | | | - | | | - |
Total | | $ | 101,146 | | $ | - | | $ | 4 | | $ | 962 | | $ | 520 |
| | | | | | | | | | | | | | | |
| | As of December 31, 2014 |
(Dollars in thousands) | | Notional | | Current Assets | | Other Assets | | Other Current Liabilities | | Other Long-Term Liabilities |
Interest rate swap | | $ | 105,360 | | $ | | | $ | | | $ | | | $ | 2,153 |
Interest rate cap | | | 7,500 | | | | | | | | | | | | 24 |
Total | | $ | 112,860 | | $ | - | | $ | - | | $ | - | | $ | 2,177 |
The following table summarizes the unrealized gains or losses due to changes in fair value of the derivatives that are recorded in interest rate swap or cap positions as financial reporting hedges.expense in the Consolidated Statement of Operations, for the quarter and nine months ended September 30, 2015 and September 30, 2014.
| | | | | | | | | | | | |
| | | | | Quarter Ended | | Nine Months Ended |
(Dollars in thousands) | | | | | September 30, 2015 | | September 30, 2014 | | September 30, 2015 | | September 30, 2014 |
Net unrealized gains on interest rate derivatives | | $ | 239 | | $ | 958 | | $ | 698 | | $ | 1,028 |
Note 1716 – Fair Value of Financial InstrumentsMeasurements
FASB ASC 820-10,820, Fair Value Measurement (“FASB ASC 820-10”) establishes a fair value hierarchy that prioritizes the inputs to valuation techniques used to measure fair value. The statement requires that assets and liabilities carried at fair value be classified and disclosed in one of the following three categories:
| · | | Level 1: Quoted market prices in active markets for identical assets or liabilities.liabilities |
| · | | Level 2: Observable market based inputsQuoted prices for similar instruments in active markets; quoted prices for identical or unobservable inputssimilar instruments in markets that are corroborated by market data.not active; and model-derived valuations in which all significant inputs and significant value drivers are observable in active markets |
| · | | Level 3: UnobservableValuations derived from valuation techniques in which one or more significant inputs thator significant value drivers are not corroborated by market data.unobservable |
We used the following methods and assumptions to estimate the fair values of the assets and liabilities:
Level 1 Fair Value Measurements – are based on market quotes of our marketable securities.
Level 2 Fair Value Measurements – Interest Rate Swaps
The following tables summarize our financial assets and Caps – The fair value of interest rate swapfinancial liabilities carried and cap instruments are estimated based on market data and quotes from counter parties to the agreements that are corroborated by market data.
Level 3 Fair Value Measurements – Impaired Property – For assets measured on a non-recurring basis, such as real estate assets that are required to be recorded at fair value as a result of an impairment, our estimates of fair value are based on management’s best estimate derived from evaluating market sales data for comparable properties developed by a third party appraiser and arriving at management’s estimate of fair value based on such comparable data primarily based on properties with similar characteristics.
As of September 30, 2014 and December 31, 2013, we held certain items that are required to be measured at fair value on a recurring basis. These included available for sale securitiesbasis as of September 30, 2015 and interest rate derivative contracts. Our available-for-saleDecember 31, 2014, by level within the fair value hierarchy.
| | | | | | | | | | | | |
| | Fair Value Measurement at September 30, 2015 |
(Dollars in thousands) | | Level 1 | | Level 2 | | Level 3 | | Total |
Assets | | | | | | | | | | | | |
Investments | | $ | 43 | | $ | - | | $ | - | | $ | 43 |
Derivatives | | | - | | | 4 | | | - | | | 4 |
Liabilities | | | | | | | | | | | | |
Derivatives | | | - | | | (1,482) | | | - | | | (1,482) |
Total recorded at fair value | | $ | 43 | | $ | (1,478) | | $ | - | | $ | (1,435) |
| | | | | | | | | | | | |
| | Fair Value Measurement at December 31, 2014 |
(Dollars in thousands) | | Level 1 | | Level 2 | | Level 3 | | Total |
Assets | | | | | | | | | | | | |
Investments | | $ | 54 | | $ | - | | $ | - | | $ | 54 |
Derivatives | | | - | | | - | | | - | | | - |
Liabilities | | | | | | | | | | | | |
Derivatives | | | - | | | (2,177) | | | | | | (2,177) |
Total recorded at fair value | | $ | 54 | | $ | (2,177) | | $ | - | | $ | (2,123) |
The following tables summarize our financial liabilities that are carried at cost and measured at fair value on a recurring basis as of September 30, 2015 and December 31, 2014, by level within the fair value hierarchy.
| | | | | | | | | | | | | | | |
| | | | | Fair Value Measurement at September 30, 2015 |
(Dollars in thousands) | | Carrying Value | | Level 1 | | Level 2 | | Level 3 | | Total |
Notes payable | | $ | 117,805 | | $ | - | | $ | - | | $ | 116,740 | | $ | 116,740 |
Subordinated debt | | | 27,913 | | | - | | | - | | | 13,166 | | | 13,166 |
| | $ | 145,718 | | $ | - | | $ | - | | $ | 129,906 | | $ | 129,906 |
| | | | | | | | | | | | | | | |
| | | | | Fair Value Measurement at December 31, 2014 |
(Dollars in thousands) | | Carrying Value | | Level 1 | | Level 2 | | Level 3 | | Total |
Notes payable | | $ | 136,123 | | $ | - | | $ | - | | $ | 116,115 | | $ | 116,115 |
Subordinated debt | | | 27,913 | | | - | | | - | | | 10,196 | | | 10,196 |
| | $ | 164,036 | | $ | - | | $ | - | | $ | 126,311 | | $ | 126,311 |
Following is a description of the valuation methodologies used to estimate the fair value of our financial assets and liabilities. There have been no changes in the methodologies used at September 30, 2015 and December 31, 2014.
Level 1 investments in marketable securities primarily consist of investments associated with the ownership of marketable securities in U.S. and New Zealand andZealand. These investments are valued based on observable market quotes on the U.S. Derivativelast trading date of the reporting period.
Level 2 derivative financial instruments are related to our economic hedge of interest rates.
The fair values of the interest rate swap and cap agreements are determined using the market standard methodology of discounting the futurevalued based on discounted cash payments and cash receipts on the pay and receive legs of the interest swap agreementsflow models that have the net effect of swapping the estimated variable rate note payment stream for a fixed rate payment stream over the period of the swap. The variableincorporate observable inputs such as interest rates used inand yield curves from the calculation of projected receipts on the interest rate swap agreements are based on an expectation of future interest rates derived from observable market interest rate curves and volatilities. To comply with the provisions of FASB ASC 820-10, we incorporate credit valuation adjustments to reflect both our own nonperformance risk and the respective counterparty's nonperformance risk in the fair value measurements. Although we have determined that the majority of the inputs used to value our derivatives fall within Level 2 of the fair value hierarchy, thederivative counterparties. The credit valuation adjustments associated with our derivatives utilize Level 3 inputs, such asnon-performance risk and counterparty credit risk are incorporated in the fair value estimates of current credit spreads, to evaluate the likelihood of default by our counterparties and us. However, asderivatives. As of September 30, 20142015 and December 31, 2013,2014, we have assessed the significance of the impact of the credit valuation adjustments on the overall valuation and determinedconcluded that the credit valuation adjustments arewere not significant to the overall valuation of our derivatives. As a result, we have determined that our derivative valuations in their entirety are classified in Level 2 of the fair value hierarchy. The nature of our interest rate swap and cap derivative instruments is described in Note 16 – Derivative Instruments.
We have consistently applied these valuation techniques in all periods presented and believe we have obtained the most accurate information available for the types of derivative contracts we hold. Additionally, there were no transfers of assets and liabilities between levels 1, 2, or 3 during the nine months ended September 30, 2014.
We measure and record the following assets and liabilities at fair value on a recurring basis subject to the disclosure requirements of FASB ASC 820-10 (dollars in thousands):
| | | | | | | | | |
| | | | | | | | | |
| | | Book Value | | Fair Value |
| | | September 30, | | December 31, | | September 30, | | December 31, |
Financial Instrument | Level | | 2014 | | 2013 | | 2014 | | 2013 |
Investment in marketable securities | 1 | $ | 51 | $ | 55 | $ | 51 | $ | 55 |
Interest rate swaps and cap liability | 2 | $ | 2,260 | $ | 3,288 | $ | 2,260 | $ | 3,288 |
20
We measure the following liabilities at fair value on a recurring basis subject to the disclosure requirements of FASB ASC 820-10 (dollars in thousands):
| | | | | | | | | | |
| | | | | | | | | | |
| | | | Book Value | | Fair Value |
| | | | September 30, | | December 31, | | September 30, | | December 31, |
Financial Instrument | Level | | | 2014 | | 2013 | | 2014 | | 2013 |
Notes payable | 3 | | $ | 131,743 | $ | 140,547 | $ | 109,479 | $ | 121,411 |
Subordinated debt | 3 | | $ | 27,913 | $ | 27,913 | $ | 10,096 | $ | 11,067 |
We estimated the fair value ofLevel 3 borrowings include our secured mortgage notes payable,and unsecured notes payable, trust preferred securities and other debt instruments by performinginstruments. The borrowings are valued based on discounted cash flow analyses using anmodels that incorporate appropriate market discount rate.rates. We calculated the market discount rate by obtaining period-end treasury rates for fixed-rate debt, or LIBOR rates for variable-rate debt, for maturities that correspond to the maturities of our debt, adding appropriate credit spreads derived from information obtained from third-party financial institutions. These credit spreads take into account factors such as our credit standing, therate, debt maturity, types of the debt, whether the debt is secured or unsecured,borrowings, and the loan-to-value ratios of the debt.
Note 18 - Subsequent Events
NoneThe Company’s financial instruments also include cash, cash equivalents, receivables and account payable. The carrying values of these financial instruments approximate the fair values. Additionally, there were no transfers of assets and liabilities between levels 1, 2, or 3 during the nine months ended September 30, 2015 and September 30, 2014.
Item 2 – Management’s Discussion and Analysis of Financial Condition and Results of Operations
We are an internationally diversified company principally focused on the development, ownership, and operation of entertainment and real estate assets in the United States, Australia, and New Zealand. Currently, we operate in two business segments:
| · | | cinema exhibition, through our 5658 multiplex cinemas; and |
| · | | real estate, including real estate development and the rental of retail, commercial, and live theater assets. |
We believe that these two business segments can complement one another, as we can use the comparatively consistent cash flows generated by our cinema operations to fund the front-end cash demands of our real estate development business.
We manage our worldwide cinema exhibition businesses under various different brands:
| · | | in the US, under the following brands: Reading Cinema, Angelika Film Center, Consolidated Amusements,Theaters, and City Cinemas brands;Cinemas; |
| · | | in Australia, under the Reading Cinema brand; and |
| · | | in New Zealand, under the Reading Cinema and Rialto brands. |
Cinema Activities
We continue to (i) consider new opportunities to expand our international cinema operations while continuingcircuit, (ii) evaluate our existing cinema portfolio to cull those cinema assets that are underperformingdetermine ways to maximize profitability through strategic renovations or haveprogramming adjustments, and (iii) determine the most efficient ways to dispose of cinemas carrying unacceptable risk profiles on a go-forward basis. OnTo increase attendance and improve our cash flow, our operational strategy has focused on improving the overall experience of the cinema guest through (i) improving our interaction on social and electronic media, (ii) expanding the quality and variety of our food & drink menu, (iii) delivering a premium sight and sound presentation with a filmmaker focus, (iv) offer the most comfortable cinematic presentation, (iv) broaden the scope of our programming to increase attendance and box office, (v) deliver hospitality focused guest service and (vi) engage our guests through design of our cinema spaces. As we renovate and reposition our existing cinemas, we intended where practical to add beer and wine service and, at some locations, cocktail type beverages. We have obtained liquor licenses for both of our Texas locations, for four of our California locations, and for the Ward Theater in Hawaii. The latter is the first liquor license granted to a cinema on the island of Oahu.
US cinema activities
In October 2015, we completed the renovation and re-branding of our former Reading Cinemas at Carmel Mountain Plaza in San Diego, California, which is now an Angelika Film Center & Café. Our efforts included (i) a complete lobby renovation now reflecting the signature sleek design of the Angelika brand, (ii) the installation of luxury electric recliner seating and state-of-the-art digital sound and projection in each auditorium and (iii) the installation of kitchen and bar facilities allowing for a more expanded food and drink menu. Like other Angelikas, this cinema will include (a) diverse quality film and event programming and (b) due to the obtaining of a full liquor license, a menu of craft beers, select wine and mixed drinks and a menu of hand prepared small bite meals.
The lease entered into on April 17, 2014 we entered into a leasewith an affiliate of Edens (“EDENS”) providing for the development of a new 8- screen multi-plex Angelika-stylestate-of-the art cinemaAngelika Film Center at Union Market in Washington DC has been terminated due to be builtcost and feasibility issues. However, EDENS and the Company remain committed to the development of a state-of-the art Angelika Film Center as a part of Union Market, and are currently in lease negotiations with respect to an alternative site within the Union Market areaarea.
Reflecting our dedication to providing our guests a premium presentation, the Company entered into its first license agreement with IMAX. The Company is in the process of Washington D.C. On June 13, 2014 we opened a temporary “pop-up”converting one of its auditoriums at the cinema at the Valley Plaza Mall in Bakersfield, California to servicean IMAX presentation.
Currently, the site duringCompany offers beer, wine and/or cocktails at five of its US cinemas and has the developmentlicense to begin selling beer, wine and constructionmixed drinks at four other theaters in the US.
We completed an agreement with the property owners of the permanent cinema. On December 31, 2013 we acquired ownershipReading Cinemas in the Gaslamp district of San Diego, California which allows us to surrender that lease on or after January 15, 2016 and pay an early termination fee to the Plano cinema in Plano, Texas, a cinema that we have been managing for approximately 10 years but did not own. In addition, on July 25, 2014, we officially opened our 6-screen cinema in Dunedin, New Zealand. The Dunedinlandlord of $1.0 million. This cinema was under lease to Hoytspart of a group of cinemas acquired from Pacific Theaters in 2008 and, though we received a credit against the purchase price at the time of the acquisition, it has been unprofitable since the acquisition.
Australia cinema activities
In September 2015, we acquiredcompleted a renovation of our 14 screen Reading Cinemas at Harbour Town Shopping Center on the propertyGold Coast in June 2007. Queensland, Australia, which is the largest theater by screen count on the Gold Coast and is a key asset within the Group having entertained more than ten million customers over the past fifteen years. The highlight of this renovation was the inclusion of our premium large format auditorium, TITAN XC (Extreme Cinema), which features a 66-feet wide ‘wall-to-wall’ screen and Dolby Atmos, a fully immersive sound system. The renovation also included finish upgrades in the cinema’s affordable luxury ‘dine-in’ cinema combining a fully licensed lounge bar and full food menu.
During the third quarter of 2015, we have continued the Company wide initiative to work our assets harder with a view to driving higher customer volumes and a flow through to improved bottom line yields. August and September are typically our softest trading months of the year although, during the quarter, we achieved a 4.9% uplift in our per screen customer numbers over prior year.
Innovative value pricing, improved food and beverage offerings and proactive social media engagement with our customers was a primary focus and to that end social media has been a powerful tool for connecting with and marketing to customers in real time. Our consolidated Facebook data base ‘likes’ across 20 individual cinema business unit Facebook pages numbers 240,500 people who engage with us on a regular basis.
We have continued to focus upon our company wide customer service training program with a view to improving staff productivity, the quality of customer interactions and ultimately underpinning an improvement to our per capita transaction spend. Refining and remixing our food and beverage offer has been an ongoing initiative with a view to minimizing our cost of sales and improving the inventory blend of our over the counter customer offer.
New Zealand cinema activities
In New Zealand, in the fourth quarter of 2015, we are also refurbishingscheduled to open a new state-of-the-art eight screen Reading Cinemas at the Lynn Mall in Auckland, which is operated by Kiwi Property. This new theater will feature a TITAN XC auditorium screen and repositioningtwo luxury dine- in auditoriums. Our two “Gold Lounge Cinemas” will feature electric recliner seating, a fully licensed lounge bar and full food menu, while charging our Carmel Mountain theater in San Diego County as a luxury Angelika theater.guests an affordable ticket price.
Real Estate Activities
In recent periods we have focused our real estate development activities on (i) the dispositiondisposal of certain assets (Moonee Ponds and Burwood) whichBurwood that, we believe to have achieved their full potential land value and Lake Taupo and the Doheny Condominium, which we determined to be non-core assets), (ii) the improvement and expansion of our shopping center assets (anincluding (a) an anchor grocery store tenancy and additional general retail for our Courtenay Central development at Wellington, New Zealand, (b) a multiplex cinema and a multi-plex cinemaadditional general retail for our Newmarket Shopping Center in Brisbane, Australia and (c) additional general retail and restaurant space for our Auburn Shopping Center in Sydney, Australia, (iii) the redevelopment of our Union Square and Cinemas 1,2,&31, 2, 3 properties in Manhattan and (iv) the procurement of land use entitlements for our landholdings in Coachella, California (202 acres) and Manukau, New Zealand (64 acres). The market for New York City property has continuedIn addition, we are under contract to strengthen,acquire a parcel adjacent to our Newmarket Shopping Center currently improved with comparable sales being reported in the range of $1,100 per buildable square foot. an office building. It is anticipated that this contract will close on November 30, 2015 and that this parcel will ultimately be integrated into our Newmarket Shopping Center.
Our business plan is to continue with the build-outfurther development of our existing operating properties, such as our Wellington, New Zealand site, Brisbane, Australia site and our Newmarket,Sydney, Australia site, to redevelop our Union Square and Cinemas 1,2&31, 2, 3 properties in New York, to continue to pursue the various land use entitlements needed for the development of our landholdings in New Zealand and California, and to seek out additional, profitable real estate development opportunities with an existing or potential entertainment focus, while continuing to use and judiciously expand our presence in the cinema exhibition business by identifying, developing, and acquiring cinema properties when and where we believe to be appropriate.
In the United States, we are continuing to progress the development of our Union Square and Cinemas 1, 2, 3 (“Cinemas”) properties, each located in Manhattan. The market for New York City property has continued to strengthen with comparable sales being reported in the range of $1,100 per buildable square foot. With respect to our Union Square Property, (i) we have received authorization from the Landmarks Commission to redevelop the property, adding approximately 23,000 square footage of rentable space to the current 46,000 square foot building for a total of approximately 69,000 square feet of rentable space, (ii) entered into a Development Management Agreement with Edifice Real Estate Partners, LLC, to assist in the supervision and administration of the project, (iii) entered into a real estate brokerage agreement with Newmark Grubb Knight Frank to serve as our exclusive marketing agent, and (iv) retained Gensler to assist with space layout and interior design. We filed our application for a variance with the Board of Standards and Approvals and on October 8, 2015, the Manhattan Community Board 5 recommended approval of our variance application. While no assurances can be given, it is our current intention to commence pre-construction in the first quarter of 2016.
With respect to our Cinemas property, we have received the consent of our minority member to the redevelopment of the property. We are evaluating the potential to redevelop the property as a mixed use retail and residential and/or hotel property. We are currently working with the owners of the adjacent property (on the corner of 3rd Avenue and 60th Street) on a feasibility study (being prepared by Edifice Real Estate Partners, LLC) for the joint development of our properties as a mixed-use property.
In Australia, we received Brisbane City Planning Council approval in June 2015 for the design and construction of an eight-screen cinema complex with 10,000 square feet (950 square meters) of specialty retail to be located below the cinema and additional mezzanine level parking for an estimated total cost of $24.6 million (A$35.0 million) in our existing Newmarket (Brisbane, Australia) shopping center. Construction is expected to commence in the second quarter of 2016, with a projected opening in the fourth quarter of 2017. On March 6, 2015, we entered into an unconditional contract to acquire an adjoining property to our Newmarket, Australia site for $5.2 million (A$7.25 million) with $4.6 million (A$6.53 million) due on November 30, 2015. Under U.S. GAAP, we recorded the deposit of $600,000 (A$725,000) along with the relevant taxes paid as assets on our Consolidated Balance Sheet. The remaining balance due is not recorded as liability on our Consolidated Balance Sheet as of September 30, 2015. This property is currently improved with an office building.
In New Zealand, we received town planning approval in May 2015 from the City Council for a $10.9 million (NZ$17.0 million) supermarket development project at our Courtenay Central ETRC at Wellington, New Zealand. We are currently reviewing the supermarket design and construction costs and expect to advance negotiations with our lease in November 2015. In addition, we may sell all or portionscurrently intend to add additional general retail within the existing ETRC shell.
Over the past 24 months, we have culled our real estate holdings to focus on those projects where we believe we can bring material value. In this process, we sold our property in Lake Taupo, New Zealand, for $2.3 million (NZ$3.4 million) which closes in two tranches with a balance of $767,000 (NZ$1.2 million) by the final close of March 31, 2016. We sold our properties in order to provide liquidity for other projects. We have entered into a contract to sell our propertyland holdings in Moonee Ponds, Australia which is to close next yearon April 15, 2015 for $17.4 million (A$22.6 million) and have sold our propertyland holdings in Burwood, Australia, for $47.0 million (A$65.0 million) on May 12, 2014 with a balance due of $51.1$41.1 million (AUS$(A$58.5 million) that is scheduled to be paid at closing in December 2017. We sold the Doheny Condo for $3.0 million, which closed on February 25, 2015. These sales were made based on our belief that the assets involved had reached the highest value that we could reasonably achieve without investing substantial additional sums for land use planning, construction, and marketing. We continue to evaluate new investment opportunities in this segment to deploy the net proceeds from these sales.
Financing Activities
On June 27, 2014,May 21, 2015, we refinanced our existing three-tiered credit facility with NAB. It is comprised of (1) the Bank Bill DiscountNew Zealand Corporate Credit Facility with a $32.0 million (NZ$50.0 million) facility limit of AUS$61.3 millionwith the same bank (Westpac Bank), bearing an interest rate of 2.35%1.75% above BBBR and maturing on March 31, 2018. The facility is broken into two tranches, one a $22.4 million (NZ$ 35.0 million) credit facility and the BBSY, and amortization at AUS$2.0second tranche for a $9.6 million per year; (2) the Bill Discount Facility – Revolving(NZ$15.0 million) facility to be used for construction funding. Both tranches are collateralized by our New Zealand operations.
On June 2, 2015, we replaced our US Union Square Term Loan with a facility limitan $8.0 million "non-revolving" line of AUS$10.0 million andcredit with East West Bank, collateralized by our Union Square property. The line of credit bears an interest rate of 1.50%2.95% above the BBSY90-day LIBOR and matures on any undrawn portion; and (3) the Bank Guarantee FacilityJune 2, 2017, with a facility limit of AUS$5.0 million. We are fully drawn on the Bank Bill Discount Facility, have drawn none of the Bill Discount Facility-Revolving and are utilizing AUS$2.6 million on the Bank Guarantee Facility. All three have an expiry date of June 30, 2019. The collateraloption to extend for this facility is basically all the Australian cash flows and assets, other than the contract rights relating to the disposition of our Burwood and Moonee Ponds properties. The proceeds of the Burwood and Moonee Ponds transactions are likewise not subject to these financing agreements and may be freely utilized by us. BBSY is the Bank Bill Swap Bid base rate for this facility, and is currently 2.65% producing current all in rates of 5.00% and 4.15% respectively for the two facilities.one additional year.
RESULTS OF OPERATIONS
The table below summarizes the results of operations for each of our principal business segments along with the non-segment information for the current quarter and current nine-month period ended September 30, 2015 and the prior-year quarter and prior-year nine-month period ended September 30, 2014, respectively:
| | | | | | | | | | | | | | | | | | | | | | | |
| | | Quarter Ended | | | | | Nine Months Ended | | | |
(Dollars in thousands) | | September 30, 2015 | | September 30, 2014 | | % Change
Better/(Worse) | | September 30, 2015 | | September 30, 2014 | | % Change
Better/(Worse) |
SEGMENT RESULTS | | | | | | | | | | | | | | | | | | | | | | |
| Revenue | | | | | | | | | | | | | | | | | | | | | | |
| Cinema exhibition | | $ | 54,368 | | $ | 60,947 | | | (11) | % | | $ | 180,223 | | $ | 180,225 | | | - | % |
| Real estate | | | 4,968 | | | 6,035 | | | (18) | % | | | 15,908 | | | 18,396 | | | (14) | % |
| Inter-segment elimination | | | (1,548) | | | (1,951) | | | 21 | % | | | (4,957) | | | (5,615) | | | 12 | % |
| Total revenue | | | 57,788 | | | 65,031 | | | (11) | % | | | 191,174 | | | 193,006 | | | (1) | % |
| Operating expense | | | | | | | | | | | | | | | | | | | | | | |
| Cinema exhibition | | | (46,011) | | | (50,243) | | | 8 | % | | | (145,782) | | | (147,631) | | | 1 | % |
| Real estate | | | (2,570) | | | (2,289) | | | (12) | % | | | (7,004) | | | (7,523) | | | 7 | % |
| Inter-segment elimination | | | 1,548 | | | 1,951 | | | (21) | % | | | 4,957 | | | 5,615 | | | (12) | % |
| Total operating expense | | | (47,033) | | | (50,581) | | | 7 | % | | | (147,829) | | | (149,539) | | | 1 | % |
| Depreciation and amortization | | | | | | | | | | | | | | | | | | | | | | |
| Cinema exhibition | | | (2,669) | | | (2,765) | | | 3 | % | | | (8,133) | | | (8,378) | | | 3 | % |
| Real estate | | | (746) | | | (964) | | | 23 | % | | | (2,416) | | | (2,839) | | | 15 | % |
| Total depreciation and amortization | | | (3,415) | | | (3,729) | | | 8 | % | | | (10,549) | | | (11,217) | | | 6 | % |
| General and administrative expense | | | | | | | | | | | | | | | | | | | | | | |
| Cinema exhibition | | | (850) | | | (803) | | | (6) | % | | | (2,563) | | | (2,903) | | | 12 | % |
| Real estate | | | (209) | | | (436) | | | 52 | % | | | (536) | | | (870) | | | 38 | % |
| Total general and administrative expense | | | (1,059) | | | (1,239) | | | 15 | % | | | (3,099) | | | (3,773) | | | 18 | % |
| Segment operating income | | | | | | | | | | | | | | | | | | | | | | |
| Cinema exhibition | | | 4,838 | | | 7,136 | | | (32) | % | | | 23,745 | | | 21,313 | | | 11 | % |
| Real estate | | | 1,443 | | | 2,346 | | | (38) | % | | | 5,952 | | | 7,164 | | | (17) | % |
| Total segment operating income | | $ | 6,281 | | $ | 9,482 | | | (34) | % | | $ | 29,697 | | $ | 28,477 | | | 4 | % |
NON-SEGMENT RESULTS | | | | | | | | | | | | | | | | | | | | |
| Depreciation and amortization expense | | | (86) | | | (92) | | | 7 | % | | | (220) | | | (273) | | | 19 | % |
| General and administrative expense | | | (3,075) | | | (3,217) | | | 4 | % | | | (10,637) | | | (10,950) | | | 3 | % |
| Interest expense, net | | | (1,894) | | | (1,411) | | | (34) | % | | | (6,070) | | | (6,537) | | | 7 | % |
| Equity earnings of unconsolidated joint ventures and entities | | | 195 | | | 222 | | | (12) | % | | | 915 | | | 833 | | | 10 | % |
| Gain on sale of assets | | | -- | | | 25 | | | nm | % | | | 11,023 | | | 25 | | | > 100 | % |
| Other income (expense) | | | (577) | | | 242 | | | (> 100) | % | | | (667) | | | 1,630 | | | (> 100) | % |
| Income before income taxes | | | 844 | | | 5,251 | | | (84) | % | | | 24,041 | | | 13,205 | | | 82 | % |
| Income tax expense | | | (517) | | | (1,312) | | | 61 | % | | | (4,605) | | | (4,747) | | | 3 | % |
Net income | | | 327 | | | 3,939 | | | (92) | % | | | 19,436 | | | 8,458 | | | > 100 | % |
| Net loss attributable to noncontrolling interests | | | 54 | | | -- | | | nm | | | 60 | | | 23 | | | > 100 | % |
Net income attributable to RDI common stockholders | | $ | 381 | | $ | 3,939 | | | (90) | % | | $ | 19,496 | | $ | 8,481 | | | > 100 | % |
Basic EPS | | $ | 0.02 | | $ | 0.17 | | | (90) | % | | $ | 0.84 | | $ | 0.36 | | | > 100 | % |
On June 26, 2014, our controlled subsidiary Sutton Hill Properties, LLC, refinanced with Santander Bank, N.A, the then existing $15.0 million term loan on our Cinema 1,2&3 property. The new loan has a 2-year term, payable interest only until maturity and includes a line of credit of $6.0 million for the acquisition of rights to add additional density to any redevelopment of the property (“air rights”). The loan has an interest rate of 3.50% over the 30-day Libor. The unused portion of the line of credit has an interest rate of 0.25% over the 30-day Libor. To date none of the $6.0 million line of credit has been drawn.
Consolidated Results and Non-Segment Results
Quarter Results
Revenue for the quarter decreased by 11%, or $7.2 million, to $57.8 million, and net income attributable to RDI common stockholders decreased by $3.6 million to $381,000 as of OperationsSeptember 30, 2015. EPS for the quarter decreased by $0.15 to $0.02 from $0.17 in the prior-year quarter. Of this decrease, approximately $0.09 resulted from weaker foreign exchange rates against the U.S. dollar and legal and insurance expenses. Operating earnings declined by $0.06 based on a less favorable operating quarter, while higher interest expenses were offset by lower income tax expense. Refer to the explanation below for more details.
General and administrative expense
General and administrative expense for the quarter decreased by 4%, or $142,000, mainly due to lower payroll expenses and exchange rate movements resulting in lower Australia and New Zealand general and administration expense in U.S. dollars, partially offset by higher director and consulting fees and higher legal expenses. For more information about legal expenses, please refer to Item 1- Legal Proceedings.
Interest expense, net
Interest expense, net represents interest expense less interest income. Net interest expense for the quarter increased by 34%, or $483,000, mainly due to a $719,000 increase in interest expense from less favorable derivatives revaluations compared to 2014, partially offset by higher interest income.
Income tax expense
Income taxes decreased by $795,000 compared to the prior-year quarter, mainly due to lower results of operations in the current quarter.
Nine-Month Results
Revenue for the nine-month period decreased by 1%, or $1.8 million, to $191.2 million and net income attributable to RDI common stockholders increased by 130%, or $11.0 million, to $19.5 million. EPS for the nine months ended September 30, 2015 increased to $0.84 from $0.36 in the prior-year nine-month period, mainly attributable to gain on sale of assets and to higher earnings from increased attendance in Australia and New Zealand, partially offset by the $0.11 impact from changing foreign exchange rates.
General and administrative expense
General and administrative expense for the nine-month period decreased by 3%, or $313,000, mainly due to lower payroll expenses and exchange rate movements resulting in lower Australia and New Zealand expense in U.S. dollars, partially offset by higher legal expense. For more information about the legal expense, please refer to Item 1- Legal Proceedings.
Interest expense, net
Interest expense, net for the nine-month period decreased by 7%, or $467,000, mainly due to foreign exchange rate movements which resulted in lower interest expense when converted to U.S. dollars, a lower debt balance and higher interest income, partially offset by unfavorable derivatives revaluation.
Gain on sale of assets
Net gain on sale of assets for the nine-month period increased by $11.0 million, primarily due to the sale of our property at Moonee Ponds site.
Income tax expense
Income taxes decreased by $142,000 compared to the prior-year nine-month period, mainly due to a current-period reversal of prior-year tax expense connected with the prior-year presumption (reversed in the current year) that Australian earnings were not indefinitely reinvested overseas, partially offset by additional tax expense from increased results of operations.
Business Segment Results
At September 30, 2014,2015, we owned and operated 5254 cinemas with 434443 screens, had interests in certain unconsolidated joint ventures and entities that own an additional 3 cinemas with 29 screens and managed 1 cinemascinema with 4 screens. Regarding our real estate, duringDuring the period, we also (i) owned and operated four Entertainment Themed Retail Centers (“ETRCs”) that we developed in Australia and New Zealand, (ii) owned the fee interests in four developed commercial properties in Manhattan and Chicago improved with live theaters comprising seven stages and ancillary retail and commercial space, (iii) owned the fee interests underlying one of our Manhattan cinemas, (iv) held for development an additional four parcels aggregating approximately 75 acres located principally in urbanized areas of Australia and New Zealand (calculated net of our Moonee PondsLake Taupo and Burwood Properties), and (v) owned 50% of a 202-acre property that is zoned for the development of up to 816over 500 single-family residential units in the U.S. In addition, we continue to hold various properties that had been previously used in our historic railroad operations.
The tables below summarizeCompany transacts business in Australia and New Zealand and is subject to risks associated with changing foreign currency exchange rates. During the results of operations for each of our principal business segments forcurrent quarter compared to the three (“2014 Quarter”)prior-year quarter, the Australian dollar and New Zealand dollar weakened against the U.S. dollars by 22% and 23%, respectively. During the current nine (“2014 Nine Months”) months ended September 30, 2015 compared to the same period in 2014, the Australian dollar and the three (“2013 Quarter”)New Zealand dollar weakened against the U.S. dollar by 17% and nine (“2013 Nine Months”) months ended September 30, 2013, respectively (dollars16%, respectively. Refer to Note 3 – Operations in thousands):
| | | | | | | | |
| | | | | | | | |
Three Months Ended September 30, 2014 | Cinema Exhibition | Real Estate | Intersegment Eliminations | Total |
Revenue | $ | 60,947 | $ | 6,035 | $ | (1,951) | $ | 65,031 |
Operating expense | | 50,243 | | 2,289 | | (1,951) | | 50,581 |
Depreciation and amortization | | 2,765 | | 964 | | -- | | 3,729 |
General and administrative expense | | 803 | | 436 | | -- | | 1,239 |
Segment operating income | $ | 7,136 | $ | 2,346 | $ | -- | $ | 9,482 |
| | | | | | | | |
Three Months Ended September 30, 2013 | Cinema Exhibition | Real Estate | Intersegment Eliminations | Total |
Revenue | $ | 61,228 | $ | 6,157 | $ | (1,913) | $ | 65,472 |
Operating expense | | 50,655 | | 2,716 | | (1,913) | | 51,458 |
Depreciation and amortization | | 2,540 | | 951 | | -- | | 3,491 |
General and administrative expense | | 891 | | 185 | | -- | | 1,076 |
Segment operating income | $ | 7,142 | $ | 2,305 | $ | -- | $ | 9,447 |
| | | | | | | | |
| | | | | | | | |
Reconciliation to net income attributable to Reading International, Inc. shareholders: | | | | | 2014 Quarter | 2013 Quarter |
Total segment operating income | | | | | $ | 9,482 | $ | 9,447 |
Non-segment: | | | | | | | | |
Depreciation and amortization expense | | | | | | 92 | | 111 |
General and administrative expense | | | | | | 3,217 | | 3,510 |
Operating income | | | | | | 6,173 | | 5,826 |
Interest expense, net | | | | | | (1,411) | | (2,814) |
Other income (expense) | | | | | | 242 | | (55) |
Gain on sale of assets | | | | | | 25 | | -- |
Income tax expense | | | | | | (1,312) | | (751) |
Equity earnings of unconsolidated joint ventures and entities | | | | | | 222 | | 225 |
Net income | | | | | $ | 3,939 | $ | 2,431 |
Net (income) attributable to noncontrolling interests | | | | | | -- | | (38) |
Net income attributable to Reading International, Inc. common shareholders | | | | | $ | 3,939 | $ | 2,393 |
| | | | | | | | |
| | | | | | | | |
Nine Months Ended September 30, 2014 | Cinema Exhibition | Real Estate | Intersegment Eliminations | Total |
Revenue | $ | 180,225 | $ | 18,396 | $ | (5,615) | $ | 193,006 |
Operating expense | | 147,631 | | 7,523 | | (5,615) | | 149,539 |
Depreciation and amortization | | 8,378 | | 2,839 | | -- | | 11,217 |
General and administrative expense | | 2,903 | | 870 | | -- | | 3,773 |
Segment operating income | $ | 21,313 | $ | 7,164 | $ | -- | $ | 28,477 |
| | | | | | | | |
Nine Months Ended September 30, 2013 | Cinema Exhibition | Real Estate | Intersegment Eliminations | Total |
Revenue | $ | 180,657 | $ | 19,764 | $ | (5,740) | $ | 194,681 |
Operating expense | | 151,612 | | 8,115 | | (5,740) | | 153,987 |
Depreciation and amortization | | 7,824 | | 3,086 | | -- | | 10,910 |
General and administrative expense | | 2,463 | | 519 | | -- | | 2,982 |
Segment operating income | $ | 18,758 | $ | 8,044 | $ | -- | $ | 26,802 |
| | | | | | | | |
| | | | | | | | |
Reconciliation to net income attributable | | | | | 2014 Nine | 2013 Nine |
to Reading International, Inc. shareholders: | | | | | Months | Months |
Total segment operating income | | | | | $ | 28,477 | $ | 26,802 |
Non-segment: | | | | | | | | |
Depreciation and amortization expense | | | | | | 273 | | 333 |
General and administrative expense | | | | | | 10,950 | | 10,341 |
Operating income | | | | | | 17,254 | | 16,128 |
Interest expense, net | | | | | | (6,537) | | (8,124) |
Other income | | | | | | 1,630 | | 72 |
Gain (loss) on sale of assets | | | | | | 25 | | (7) |
Income tax expense | | | | | | (4,747) | | (3,140) |
Equity earnings of unconsolidated joint ventures and entities | | | | | | 833 | | 1,005 |
Net income | | | | | $ | 8,458 | $ | 5,934 |
Net (income) loss attributable to noncontrolling interests | | | | | | 23 | | (74) |
Net income attributable to Reading International, Inc. common shareholders | | | | | $ | 8,481 | $ | 5,860 |
Cinema Exhibition Segment
Included in the cinema exhibition segment above are revenue and expense from the operations of 52 cinema complexes with 434 screens during the 2014 Quarter and 51 cinema complexes with 429 screens during the 2013 Quarter. The following tables detail our cinema exhibition segment operating resultsForeign Currency for the three months ended September 30, 2014 and 2013, respectively (dollars in thousands):further information.
| | | | | | | | |
| | | | | | | | |
Three Months Ended September 30, 2014 | | United States | | Australia | | New Zealand | | Total |
Admissions revenue | $ | 20,283 | $ | 15,606 | $ | 4,348 | $ | 40,237 |
Concessions revenue | | 8,851 | | 6,657 | | 1,784 | | 17,292 |
Advertising and other revenue | | 1,690 | | 1,393 | | 335 | | 3,418 |
Total revenue | | 30,824 | | 23,656 | | 6,467 | | 60,947 |
| | | | | | | | |
Film rent and advertising cost | | 10,332 | | 7,108 | | 2,067 | | 19,507 |
Concession cost | | 1,553 | | 1,333 | | 467 | | 3,353 |
Occupancy expense | | 6,385 | | 4,383 | | 1,186 | | 11,954 |
Other operating expense | | 9,166 | | 4,671 | | 1,592 | | 15,429 |
Total operating expense | | 27,436 | | 17,495 | | 5,312 | | 50,243 |
| | | | | | | | |
Depreciation and amortization | | 1,218 | | 1,179 | | 368 | | 2,765 |
General and administrative expense | | 565 | | 231 | | 7 | | 803 |
Segment operating income | $ | 1,605 | $ | 4,751 | $ | 780 | $ | 7,136 |
| | | | | | | | |
Operating Data as a Percentage of Revenue for the Three Months Ended September 30, 2014 | | United States | | Australia | | New Zealand | | Total |
Admissions revenue | | 65.8% | | 66.0% | | 67.2% | | 66.0% |
Concessions revenue | | 28.7% | | 28.1% | | 27.6% | | 28.4% |
Advertising and other revenue | | 5.5% | | 5.9% | | 5.2% | | 5.6% |
Total revenue | | 100.0% | | 100.0% | | 100.0% | | 100.0% |
| | | | | | | | |
Film rent and advertising cost | | 50.9% | | 45.5% | | 47.5% | | 48.5% |
Concession cost | | 17.5% | | 20.0% | | 26.2% | | 19.4% |
Occupancy expense | | 20.7% | | 18.5% | | 18.3% | | 19.6% |
Other operating expense | | 29.7% | | 19.7% | | 24.6% | | 25.3% |
Total operating cost and expense | | 89.0% | | 74.0% | | 82.1% | | 82.4% |
| | | | | | | | |
Depreciation and amortization | | 4.0% | | 5.0% | | 5.7% | | 4.5% |
General and administrative expense | | 1.8% | | 1.0% | | 0.1% | | 1.3% |
Segment operating income | | 5.2% | | 20.1% | | 12.1% | | 11.7% |
| | | | | | | | |
| | | | | | | | |
Three Months Ended September 30, 2013 | | United States | | Australia | | New Zealand | | Total |
Admissions revenue | $ | 22,825 | $ | 14,851 | $ | 3,682 | $ | 41,358 |
Concessions revenue | | 9,327 | | 5,954 | | 1,404 | | 16,685 |
Advertising and other revenue | | 1,792 | | 1,177 | | 216 | | 3,185 |
Total revenue | | 33,944 | | 21,982 | | 5,302 | | 61,228 |
| | | | | | | | |
Cinema cost | | 11,516 | | 6,471 | | 1,611 | | 19,598 |
Concession cost | | 1,584 | | 1,141 | | 365 | | 3,090 |
Occupancy expense | | 6,367 | | 4,380 | | 941 | | 11,688 |
Other operating expense | | 8,864 | | 5,813 | | 1,602 | | 16,279 |
Total operating expense | | 28,331 | | 17,805 | | 4,519 | | 50,655 |
| | | | | | | | |
Depreciation and amortization | | 1,512 | | 816 | | 212 | | 2,540 |
General and administrative expense | | 572 | | 317 | | 2 | | 891 |
Segment operating income | $ | 3,529 | $ | 3,044 | $ | 569 | $ | 7,142 |
| | | | | | | | |
Cinema Exhibition
Operating Data as a Percentage of Revenue for the Three Months Ended September 30, 2013 | | United States | | Australia | | New Zealand | | Total |
| | 67.2% | | 67.6% | | 69.4% | | 67.5% |
Concessions revenue | | 27.5% | | 27.1% | | 26.5% | | 27.3% |
Advertising and other revenue | | 5.3% | | 5.4% | | 4.1% | | 5.2% |
Total revenue | | 100.0% | | 100.0% | | 100.0% | | 100.0% |
| | | | | | | | |
Film rent and advertising cost | | 50.5% | | 43.6% | | 43.8% | | 47.4% |
Concession cost | | 17.0% | | 19.2% | | 26.0% | | 18.5% |
Occupancy expense | | 18.8% | | 19.9% | | 17.7% | | 19.1% |
Other operating expense | | 26.1% | | 26.4% | | 30.2% | | 26.6% |
Total operating cost and expense | | 83.5% | | 81.0% | | 85.2% | | 82.7% |
| | | | | | | | |
Depreciation and amortization | | 4.5% | | 3.7% | | 4.0% | | 4.1% |
General and administrative expense | | 1.7% | | 1.4% | | 0.0% | | 1.5% |
Segment operating income | | 10.4% | | 13.8% | | 10.7% | | 11.7% |
| ·
| | Cinema revenue decreased for the 2014 Quarter by $281,000 or 0.5% compared to the same period in 2013, despite strong showing in Australia and New Zealand, due to the US revenue being $3.1 million lower than 2013.
|
| ·
| | Total operating expense decreased by $411,886 or 0.8% compared to the same period in 2013. Operating expense as a percent of gross revenue decreased from 82.7%to 82.4% in 2014. This decrease was driven by Australia and New Zealand, both showing declines in operating expense percentage, but was offset by an increase in the U.S.
|
| ·
| | Depreciation expense increased for the 2014 Quarter by $225,000 or 8.9% compared to the same period in 2013, due to additions of cinema assets.
|
| ·
| | General and administrative expense for the 2014 Quarter decreased by $88,000 or 9.9% for the 2014 Quarter compared to the 2013, with Australia providing all the decrease.
|
| ·
| | The Australian quarterly average exchange rate to the U.S dollar increased to 0.9247 for the 2014 Quarter from 0.9165 for the 2013 Quarter an increase of 0.9% The New Zealand quarterly average exchange rate to the U.S dollar climbed to 0.8419 for the 2014 Quarter from 0.7988 for the 2013 Quarter, an increase of 5.4%. Both had an impact on the individual components of our income statement.
|
| ·
| | Because of the above, and driven by positive results in Australia and New Zealand, which offset a decline of $1.9 million in the US, cinema exhibition segment operating income was flat to last year.
|
The following tables detail our cinema exhibition segment operating results for the quarter and nine months ended September 30, 2015 and 2014, and 2013, respectively (dollars in thousands):respectively:
| | | | | | | | |
Nine Months Ended September 30, 2014 | | United States | | Australia | | New Zealand | | Total |
Admissions revenue | $ | 61,358 | $ | 46,078 | $ | 12,043 | $ | 119,479 |
Concessions revenue | | 26,515 | | 18,814 | | 4,850 | | 50,179 |
Advertising and other revenue | | 5,021 | | 4,617 | | 929 | | 10,567 |
Total revenues | | 92,894 | | 69,509 | | 17,822 | | 180,225 |
| | | | | | | | |
Cinema cost | | 31,828 | | 21,219 | | 5,609 | | 58,656 |
Concession cost | | 4,625 | | 3,724 | | 1,246 | | 9,595 |
Occupancy expense | | 18,651 | | 13,034 | | 3,298 | | 34,983 |
Other operating expense | | 25,654 | | 14,608 | | 4,135 | | 44,398 |
Total operating expense | | 80,759 | | 52,586 | | 14,287 | | 147,631 |
| | | | | | | | |
Depreciation and amortization | | 3,907 | | 3,547 | | 924 | | 8,378 |
General and administrative expense | | 2,111 | | 756 | | 36 | | 2,903 |
Segment operating income | $ | 6,117 | $ | 12,620 | $ | 2,575 | $ | 21,313 |
| | | | | | | | |
Operating Data as a Percentage of Revenue for the Nine Months Ended
September 30, 2014 | | United States | | Australia | | New Zealand | | Total |
Admissions revenue | | 66.1% | | 66.3% | | 67.6% | | 66.3% |
Concessions revenue | | 28.5% | | 27.1% | | 27.2% | | 27.8% |
Advertising and other revenue | | 5.4% | | 6.6% | | 5.2% | | 5.9% |
Total revenue | | 100.0% | | 100.0% | | 100.0% | | 100.0% |
| | | | | | | | |
Film rent and advertising cost | | 51.9% | | 46.1% | | 46.6% | | 49.1% |
| | | | | | | | | | | | | | | | | | | | |
| | | | | | | | | | | | | | | | % Change |
| | | | Quarter Ended | | Nine Months Ended | | Fav / (Unfav) |
(Dollars in thousands) | | September 30, 2015 | | September 30, 2014 | | September 30, 2015 | | September 30, 2014 | | Quarter
Ended | | Nine Months Ended |
REVENUE | | | | | | | | | | | | | | | | | | |
| United States | Admissions revenue | | $ | 19,965 | | $ | 20,283 | | $ | 62,198 | | $ | 61,358 | | (2) | % | | 1 | % |
| | Concessions revenue | | | 8,967 | | | 8,851 | | | 27,668 | | | 26,515 | | 1 | % | | 4 | % |
| | Advertising and other revenue | | | 1,981 | | | 1,690 | | | 5,704 | | | 5,021 | | 17 | % | | 14 | % |
| | | | $ | 30,913 | | $ | 30,824 | | $ | 95,570 | | $ | 92,894 | | - | % | | 3 | % |
| Australia | Admissions revenue | | $ | 11,908 | | $ | 15,606 | | $ | 43,398 | | $ | 46,078 | | (24) | % | | (6) | % |
| | Concessions revenue | | | 5,337 | | | 6,657 | | | 19,281 | | | 18,814 | | (20) | % | | 2 | % |
| | Advertising and other revenue | | | 1,278 | | | 1,393 | | | 4,495 | | | 4,617 | | (8) | % | | (3) | % |
| | | | $ | 18,523 | | $ | 23,656 | | $ | 67,174 | | $ | 69,509 | | (22) | % | | (3) | % |
| New Zealand | Admissions revenue | | $ | 3,303 | | $ | 4,348 | | $ | 11,806 | | $ | 12,043 | | (24) | % | | (2) | % |
| | Concessions revenue | | | 1,374 | | | 1,784 | | | 4,840 | | | 4,850 | | (23) | % | | - | % |
| | Advertising and other revenue | | | 255 | | | 335 | | | 833 | | | 929 | | (24) | % | | (10) | % |
| | | | $ | 4,932 | | $ | 6,467 | | $ | 17,479 | | $ | 17,822 | | (24) | % | | (2) | % |
| | | | | | | | | | | | | | | | | | | | |
| Total revenue | | $ | 54,368 | | $ | 60,947 | | $ | 180,223 | | $ | 180,225 | | (11) | % | | - | % |
OPERATING EXPENSE | | | | | | | | | | | | | | | | | | |
| United States | Film rent and advertising cost | | $ | (10,424) | | $ | (10,332) | | $ | (32,967) | | $ | (31,828) | | (1) | % | | (4) | % |
| | Concession cost | | | (1,569) | | | (1,553) | | | (4,646) | | | (4,625) | | (1) | % | | - | % |
| | Occupancy expense | | | (6,759) | | | (6,385) | | | (20,184) | | | (18,651) | | (6) | % | | (8) | % |
| | Other operating expense | | | (9,161) | | | (9,166) | | | (26,140) | | | (25,654) | | 0 | % | | (2) | % |
| | | | $ | (27,913) | | $ | (27,436) | | $ | (83,937) | | $ | (80,758) | | (2) | % | | (4) | % |
| Australia | Film rent and advertising cost | | $ | (5,303) | | $ | (7,108) | | $ | (19,950) | | $ | (21,219) | | 25 | % | | 6 | % |
| | Concession cost | | | (1,071) | | | (1,333) | | | (3,829) | | | (3,724) | | 20 | % | | (3) | % |
| | Occupancy expense | | | (3,398) | | | (4,383) | | | (11,005) | | | (13,034) | | 22 | % | | 16 | % |
| | Other operating expense | | | (4,425) | | | (4,671) | | | (13,783) | | | (14,608) | | 5 | % | | 6 | % |
| | | | $ | (14,197) | | $ | (17,495) | | $ | (48,567) | | $ | (52,585) | | 19 | % | | 8 | % |
| New Zealand | Film rent and advertising cost | | $ | (1,453) | | $ | (2,067) | | $ | (5,388) | | $ | (5,609) | | 30 | % | | 4 | % |
| | Concession cost | | | (322) | | | (467) | | | (1,120) | | | (1,246) | | 31 | % | | 10 | % |
| | Occupancy expense | | | (914) | | | (1,186) | | | (3,031) | | | (3,298) | | 23 | % | | 8 | % |
| | Other operating expense | | | (1,212) | | | (1,592) | | | (3,739) | | | (4,135) | | 24 | % | | 10 | % |
| | | | $ | (3,901) | | $ | (5,312) | | $ | (13,278) | | $ | (14,288) | | 27 | % | | 7 | % |
| | | | | | | | | | | | | | | | | | | | |
| Total operating expense | | $ | (46,011) | | $ | (50,243) | | $ | (145,782) | | $ | (147,631) | | 8 | % | | 1 | % |
DEPRECIATION, AMORTIZATION, GENERAL AND ADMINISTRATIVE EXPENSE | | | | | | | | | | | | | | | | | | |
| United States | Depreciation and amortization | | $ | (1,338) | | $ | (1,218) | | $ | (3,839) | | $ | (3,907) | | (10) | % | | 2 | % |
| | General and administrative expense | | | (659) | | | (565) | | | (2,000) | | | (2,111) | | (17) | % | | 5 | % |
| | | | $ | (1,997) | | $ | (1,783) | | $ | (5,839) | | $ | (6,018) | | (12) | % | | 3 | % |
| Australia | Depreciation and amortization | | $ | (1,036) | | $ | (1,179) | | $ | (3,324) | | $ | (3,547) | | 12 | % | | 6 | % |
| | General and administrative expense | | | (226) | | | (231) | | | (581) | | | (756) | | 2 | % | | 23 | % |
| | | | $ | (1,262) | | $ | (1,410) | | $ | (3,905) | | $ | (4,303) | | 10 | % | | 9 | % |
| New Zealand | Depreciation and amortization | | $ | (295) | | $ | (368) | | $ | (970) | | $ | (924) | | 20 | % | | (5) | % |
| | General and administrative expense | | | 35 | | | (7) | | | 18 | | | (36) | | nm | % | | nm | |
| | | | $ | (260) | | $ | (375) | | $ | (952) | | $ | (960) | | 31 | % | | 1 | % |
| | | | | | | | | | | | | | | | | | | | |
| Total depreciation, amortization, general and administrative expense | | $ | (3,519) | | $ | (3,568) | | $ | (10,696) | | $ | (11,281) | | (1) | % | | 5 | % |
OPERATING INCOME - CINEMA | | | | | | | | | | | | | | | | | | |
| United States | | $ | 1,003 | | $ | 1,605 | | $ | 5,794 | | $ | 6,118 | | (38) | % | | (5) | % |
| Australia | | | 3,064 | | | 4,751 | | | 14,702 | | | 12,621 | | (36) | % | | 16 | % |
| New Zealand | | | 771 | | | 780 | | | 3,249 | | | 2,574 | | (1) | % | | 26 | % |
| Total Cinema operating income | | $ | 4,838 | | $ | 7,136 | | $ | 23,745 | | $ | 21,313 | | (32) | % | | 11 | % |
Concession cost | | 17.4% | | 19.8% | | 25.7% | | 19.1% |
Occupancy expense | | 20.1% | | 18.8% | | 18.5% | | 19.4% |
Other operating expense | | 27.6% | | 21.0% | | 23.2% | | 24.6% |
Total operating cost and expense | | 86.9% | | 75.7% | | 80.2% | | 81.9% |
| | | | | | | | |
Depreciation and amortization | | 4.2% | | 5.1% | | 5.2% | | 4.6% |
General and administrative expense | | 2.3% | | 1.1% | | 0.2% | | 1.6% |
Segment operating income | | 6.6% | | 18.2% | | 14.4% | | 11.8% |
| | | | | | | | |
| | | | | | | | |
Nine Months Ended September 30, 2013 | | United States | | Australia | | New Zealand | | Total |
Admissions revenue | $ | 63,070 | $ | 48,328 | $ | 11,111 | $ | 122,509 |
Concessions revenue | | 26,410 | | 18,336 | | 4,097 | | 48,843 |
Advertising and other revenue | | 4,712 | | 3,888 | | 705 | | 9,305 |
Total revenues | | 94,192 | | 70,552 | | 15,913 | | 180,657 |
| | | | | | | | |
Cinema cost | | 31,992 | | 21,514 | | 4,918 | | 58,424 |
Concession cost | | 4,480 | | 3,712 | | 1,048 | | 9,240 |
Occupancy expense | | 19,317 | | 13,909 | | 2,852 | | 36,078 |
Other operating expense | | 24,815 | | 18,411 | | 4,644 | | 47,870 |
Total operating expense | | 80,604 | | 57,546 | | 13,462 | | 151,612 |
| | | | | | | | |
Depreciation and amortization | | 4,643 | | 2,468 | | 713 | | 7,824 |
General and administrative expense | | 1,739 | | 722 | | 2 | | 2,463 |
Segment operating income | $ | 7,206 | $ | 9,816 | $ | 1,736 | $ | 18,758 |
| | | | | | | | |
Operating Data as a Percentage of Revenue for the Nine Months Ended
September 30, 2013 | | United States | | Australia | | New Zealand | | Total |
Admissions revenue | | 67.0% | | 68.5% | | 69.8% | | 67.8% |
Concessions revenue | | 28.0% | | 26.0% | | 25.7% | | 27.0% |
Advertising and other revenue | | 5.0% | | 5.5% | | 4.4% | | 5.2% |
Total revenue | | 100.0% | | 100.0% | | 100.0% | | 100.0% |
| | | | | | | | |
Film rent and advertising cost | | 50.7% | | 44.5% | | 44.3% | | 47.7% |
Concession cost | | 17.0% | | 20.2% | | 25.6% | | 18.9% |
Occupancy expense | | 20.5% | | 19.7% | | 17.9% | | 20.0% |
Other operating expense | | 26.3% | | 26.1% | | 29.2% | | 26.5% |
Total operating cost and expense | | 85.6% | | 81.6% | | 84.6% | | 83.9% |
| | | | | | | | |
Depreciation and amortization | | 4.9% | | 3.5% | | 4.5% | | 4.3% |
General and administrative expense | | 1.8% | | 1.0% | | 0.0% | | 1.4% |
Segment operating income | | 7.6% | | 13.9% | | 10.9% | | 10.4% |
The table below presents the operating results as a percentage of revenue for the quarter and nine months ended September 30, 2015 and 2014, respectively:
| ·
| | Cinema revenue decreased for the 2014 Nine Months by $432,000 or 0.2% compared to the same period in 2013. The U.S. decline of $1.3 million being offset by a strong $1.9 million increase in New Zealand.
|
| ·
| | Operating expense decreased for the 2014 Nine Months by $4.0 million or 2.6% compared to the same period in 2013. Overall, our operating expense as a percent of revenue decreased from 83.9% during the 2013 Nine Months to 81.9% for the 2014 Nine Months; a significant decrease in Australia’s operating expense as a result of improved operating efficiencies was the main reason for the decrease in operating expense percentage year over year.
|
| ·
| | Depreciation expense increased for the 2014 Nine Months by $554,000 or 7.1% compared to the same period in 2013 for the same reasons noted above for the 2014 Quarter.
|
| ·
| | General and administrative expense increased by $440,000 or 17.9% for the 2014 Nine Months compared to the 2013 Nine Months. This was driven primarily by the U.S. cinema segment.
|
| ·
| | The Australian quarterly exchange rate to the U.S. dollar declined to 0.9183 for the 2014 Nine Months from 0.9821 for the 2013 Nine Months, a decrease of 6.5%. The New Zealand quarterly exchange rate to the U.S. dollar increased to 0.8467 for the 2014 Nine Months from 0.8182 for the 2013 Nine Months, an increase of 3.5%. Both had an impact on the individual components of our income statement.
|
| ·
| | Because of the above, the cinema exhibition segment income increased for the 2014 Nine Months by $2.6 million or 13.6% compared to the same period in 2013 caused by a decrease in operating expense.
|
| | | | | | | | | | | | | | |
| | | | Quarter Ended | | Nine Months Ended |
(Dollars in thousands) | | September 30, 2015 | | September 30, 2014 | | September 30, 2015 | | September 30, 2014 |
REVENUE | | | | | | | | | | | | |
| United States | Admissions revenue | | | 65% | | | 66% | | | 65% | | | 66% |
| | Concessions revenue | | | 29% | | | 29% | | | 29% | | | 29% |
| | Advertising and other revenue | | | 6% | | | 5% | | | 6% | | | 5% |
| | | | | 100% | | | 100% | | | 100% | | | 100% |
| Australia | Admissions revenue | | | 64% | | | 66% | | | 65% | | | 66% |
| | Concessions revenue | | | 29% | | | 28% | | | 29% | | | 27% |
| | Advertising and other revenue | | | 7% | | | 6% | | | 7% | | | 7% |
| | | | | 100% | | | 100% | | | 100% | | | 100% |
| New Zealand | Admissions revenue | | | 67% | | | 67% | | | 68% | | | 68% |
| | Concessions revenue | | | 28% | | | 28% | | | 28% | | | 27% |
| | Advertising and other revenue | | | 5% | | | 5% | | | 5% | | | 5% |
| | | | | 100% | | | 100% | | | 100% | | | 100% |
| Total revenue | | | | 100% | | | 100% | | | 100% | | | 100% |
OPERATING EXPENSE | | | | | | | | | | | | |
| United States | Film rent and advertising cost | | | 52% | | | 51% | | | 53% | | | 52% |
| | Concession cost | | | 17% | | | 18% | | | 17% | | | 17% |
| | Occupancy expense | | | 22% | | | 21% | | | 21% | | | 20% |
| | Other operating expense | | | 30% | | | 30% | | | 27% | | | 28% |
| | | | | 90% | | | 89% | | | 88% | | | 87% |
| Australia | Film rent and advertising cost | | | 45% | | | 46% | | | 46% | | | 46% |
| | Concession cost | | | 20% | | | 20% | | | 20% | | | 20% |
| | Occupancy expense | | | 18% | | | 19% | | | 16% | | | 19% |
| | Other operating expense | | | 24% | | | 20% | | | 21% | | | 21% |
| | | | | 77% | | | 74% | | | 72% | | | 76% |
| New Zealand | Film rent and advertising cost | | | 44% | | | 48% | | | 46% | | | 47% |
| | Concession cost | | | 23% | | | 26% | | | 23% | | | 26% |
| | Occupancy expense | | | 19% | | | 18% | | | 17% | | | 19% |
| | Other operating expense | | | 25% | | | 25% | | | 21% | | | 23% |
| | | | | 79% | | | 82% | | | 76% | | | 80% |
| Total operating expense | | | 85% | | | 82% | | | 81% | | | 82% |
DEPRECIATION, AMORTIZATION, GENERAL AND ADMINISTRATIVE EXPENSE | | | | | | | | | | | | |
| United States | Depreciation and amortization | | | 4% | | | 4% | | | 4% | | | 4% |
| | General and administrative expense | | | 2% | | | 2% | | | 2% | | | 2% |
| | | | | 6% | | | 6% | | | 6% | | | 6% |
| Australia | Depreciation and amortization | | | 6% | | | 5% | | | 5% | | | 5% |
| | General and administrative expense | | | 1% | | | 1% | | | 1% | | | 1% |
| | | | | 7% | | | 6% | | | 6% | | | 6% |
| New Zealand | Depreciation and amortization | | | 6% | | | 6% | | | 6% | | | 5% |
| | General and administrative expense | | | -1% | | | 0% | | | 0% | | | 0% |
| | | | | 5% | | | 6% | | | 5% | | | 5% |
| Total depreciation, amortization, general and administrative expense | | | 6% | | | 6% | | | 6% | | | 6% |
OPERATING INCOME - CINEMA | | | | | | | | | | | | |
| United States | | | 3% | | | 5% | | | 6% | | | 7% |
| Australia | | | 17% | | | 20% | | | 22% | | | 18% |
| New Zealand | | | 16% | | | 12% | | | 19% | | | 14% |
| Total Cinema operating income | | | 9% | | | 12% | | | 13% | | | 12% |
Quarterly Results:
Segment operating income
Cinema operating income decreased by 32%, or $2.3 million, to $4.8 million for the quarter ended September 30, 2015 compared to September 30, 2014, mainly due to 11% lower revenue and 6% higher general and administrative expense, partially offset by 8% lower operating expense. Refer below for further detailed explanation.
Revenue
Cinema revenue for the quarter decreased by 11%, or $6.6 million, primarily due to unfavorable impact from foreign exchange rate movements of the Australian dollars and New Zealand dollars to U.S. dollars.
Operating expense
Operating expenses for the quarter decreased by 8%, or $4.2 million, primarily driven by foreign exchange rate movements explained above. US Cinema operating expense increased slightly by 2%, or $477,000, mainly due to higher occupancy expenses from higher performance-driven lease expense. Australia cinema operating expense decreased by 19%, or $3.3 million, primarily due to foreign exchange rate movements, resulting in lower film rent and advertising cost and lower occupancy cost. In New Zealand, operating expenses decreased by 27%, or $1.4 million, mainly due to foreign exchange rate movements.
Operating expense as a percentage of gross revenue increased from 82% to 85%, mainly due to higher expense explained previously.
Nine Months Results:
Segment operating income
Cinema segment operating income increased by 11%, or $2.4 million, to $23.7 million for the nine-month period ended September 30, 2015 compared to September 30, 2014, primarily driven by 1% lower operating expense and 12% lower general and administrative expense. Refer below for further detailed explanation
Revenue
Cinema revenue for the nine-month period was consistent with the same period of 2014, primarily attributable to higher attendances in Australia and New Zealand, offset by the unfavorable impact from the foreign exchange movements. Comparing the nine months period of the current year and prior year, Australia dollars and New Zealand dollars weakened against U.S. dollars by 17% and 16%, respectively.
The nine-month revenue in the United States increased by 3%, or $2.7 million, primarily driven by a higher average admission price. Australia cinema revenue decreased by 3%, or $2.3 million, primarily due to higher admission revenue and higher concession revenue as result of higher attendance partially offset by unfavorable impact from foreign exchange rate movements. In New Zealand, cinema revenue decreased by 2%, or $343,000, mainly due to unfavorable impact from foreign exchange rate movements, partially offset by higher admission revenue and higher concession revenue as result of higher attendance and the opening of our Dunedin cinema in the last week of June 2014.
Operating expense
Operating expense for the nine-month period decreased by 1%, or $1.8 million, mainly attributable to foreign currency movements. U.S. operating expense increased by 4%, or $3.2 million, mainly caused by higher occupancy cost. Australia and New Zealand cinema operating expense decreased by 8% and 7%, respectively, primarily due to favorable impact from foreign exchange rate movements.
Operating expense as a percentage of gross revenue improved by 1% to 81%, mainly attributable to the percentage of fixed costs compared to the increases in our revenue streams.
Depreciation, amortization, general and administrative expense
Depreciation, amortization, general and administrative expense for the nine-month period decreased by 5%, or $585,000, primarily driven by lower general and administrative expense. General and administrative expense decreased by 12%, or $340,000, mainly driven by cost reductions in the U.S. cinema segment and favorable currency effect for expenses in Australia and New Zealand, partially offset by higher payroll expense.
Real Estate Segment
The following tables detail our real estate segment operating results for the three months ended September 30, 2014quarter and 2013, respectively (dollars in thousands):
| | | | | | | | |
| | | | | | | | |
Three Months Ended September 30, 2014 | | United States | | Australia | | New Zealand | | Total |
Live theater rental and ancillary income | $ | 670 | $ | -- | $ | -- | $ | 670 |
Property rental income | | 470 | | 3,512 | | 1,383 | | 5,365 |
Total revenues | | 1,140 | | 3,512 | | 1,383 | | 6,035 |
| | | | | | | | |
Live theater cost | | 306 | | -- | | -- | | 306 |
Property cost | | 43 | | 500 | | 439 | | 982 |
Occupancy expense | | 235 | | 563 | | 202 | | 1,000 |
Total operating expense | | 584 | | 1,063 | | 641 | | 2,288 |
| | | | | | | | |
Depreciation and amortization | | 81 | | 642 | | 241 | | 964 |
General and administrative expense | | 12 | | 409 | | 15 | | 436 |
Segment operating income | $ | 463 | $ | 1,398 | $ | 486 | $ | 2,347 |
| | | | | | | | |
Operating Data as a Percentage of Revenue for the Three Months Ended September 30, 2014 | | United States | | Australia | | New Zealand | | Total |
Live theater rental and ancillary revenue | | 58.8% | | 0.0% | | 0.0% | | 11.1% |
Property rental revenue | | 41.2% | | 100.0% | | 100.0% | | 88.9% |
Total revenue | | 100.0% | | 100.0% | | 100.0% | | 100.0% |
| | | | | | | | |
Live theater cost | | 45.7% | | 0.0% | | 0.0% | | 45.7% |
Property cost | | 9.1% | | 14.2% | | 31.7% | | 18.3% |
Occupancy expense | | 20.6% | | 16.0% | | 14.6% | | 16.6% |
Total operating cost and expense | | 51.2% | | 30.3% | | 46.3% | | 37.9% |
| | | | | | | | |
Depreciation and amortization | | 7.1% | | 18.3% | | 17.4% | | 16.0% |
General and administrative expense | | 1.1% | | 11.6% | | 1.1% | | 7.2% |
Segment operating income | | 40.6% | | 39.8% | | 35.1% | | 38.9% |
| | | | | | | | |
| | | | | | | | |
Three Months Ended September 30, 2013 | | United States | | Australia | | New Zealand | | Total |
Live theater rental and ancillary income | $ | 765 | $ | -- | $ | -- | $ | 765 |
Property rental income | | 416 | | 3,407 | | 1,569 | | 5,392 |
Total revenues | | 1,181 | | 3,407 | | 1,569 | | 6,157 |
| | | | | | | | |
Live theater cost | | 511 | | -- | | -- | | 511 |
Property cost | | 79 | | 622 | | 432 | | 1,133 |
Occupancy expense | | 120 | | 751 | | 201 | | 1,072 |
Total operating expense | | 710 | | 1,373 | | 633 | | 2,716 |
| | | | | | | | |
Depreciation and amortization | | 78 | | 627 | | 246 | | 951 |
General and administrative expense | | 5 | | 167 | | 13 | | 185 |
Segment operating income | $ | 388 | $ | 1,240 | $ | 677 | $ | 2,305 |
| | | | | | | | |
Operating Data as a Percentage of Revenue for the Three Months Ended September 30, 2013 | | United States | | Australia | | New Zealand | | Total |
Live theater rental and ancillary revenue | | 64.8% | | 0.0% | | 0.0% | | 12.4% |
Property rental revenue | | 35.2% | | 100.0% | | 100.0% | | 87.6% |
Total revenue | | 100.0% | | 100.0% | | 100.0% | | 100.0% |
| | | | | | | | |
Live theater cost | | 66.8% | | 0.0% | | 0.0% | | 66.8% |
Property cost | | 19.0% | | 18.3% | | 27.5% | | 21.0% |
Occupancy expense | | 10.2% | | 22.0% | | 12.8% | | 17.4% |
Total operating cost and expense | | 60.1% | | 40.3% | | 40.3% | | 44.1% |
| | | | | | | | |
Depreciation and amortization | | 6.6% | | 18.4% | | 15.7% | | 15.4% |
General and administrative expense | | 0.4% | | 4.9% | | 0.8% | | 3.0% |
Segment operating income | | 32.9% | | 36.4% | | 43.1% | | 37.4% |
| ·
| | Real estate revenue decreased for the 2014 Quarter by $122,000 or 2.0% compared to the same period in 2013. The decrease in New Zealand revenue is primarily the result of the closure of the Courtenay Central parking structure which has resulted in an estimated loss of revenue for the New Zealand operations of $2.0 million a year together with the termination of the Hoyts lease at our Dunedin property. For the 2014 Quarter, live theatre revenue in the U.S. decreased by $95,000 from the 2013 Quarter.
|
| ·
| | Operating expense for the real estate segment decreased for the 2014 Quarter by $428,000 or 15.8% compared to the same period in 2013. The decrease in operating expense is attributable to the same factors as discussed above regarding the change in revenue.
|
| ·
| | General and administrative expense for the real estate segment increased by $251,000 for the 2014 Quarter compared to the 2013 Quarter due to personnel changes in the Australian real estate department.
|
| ·
| | The Australian quarterly average exchange rate to the U.S dollar climbed to 0.9247 for the 2014 Quarter from 0.9165 for the 2013 Quarter an increase of 0.9% The New Zealand quarterly average exchange rate to the U.S dollar climbed to 0.8419 for the 2014 Quarter from 0.7988 for the 2013 Quarter, an increase of 5.4%. Both had an impact on the individual components of our income statement.
|
| ·
| | Real estate segment net operating income decreased for the 2014 Quarter by $42,000 or 1.8% compared to the same period in 2013, due mainly from the reduction in net operating income from the Courtenay Central parking structure closure.
|
The following tables detail our real estate segment operating results for the nine months ended September 30, 2015 and 2014, and 2013, respectively (dollars in thousands):respectively:
| | | | | | | | |
| | | | | | | | |
Nine Months Ended September 30, 2014 | | United States | | Australia | | New Zealand | | Total |
Live theater rental and ancillary income | $ | 2,541 | $ | -- | $ | -- | $ | 2,541 |
Property rental income | | 1,321 | | 10,377 | | 4,157 | | 15,855 |
Total revenues | | 3,862 | | 10,377 | | 4,157 | | 18,396 |
| | | | | | | | |
Live theater cost | | 1,204 | | -- | | -- | | 1,204 |
Property cost | | (37) | | 1,737 | | 1,248 | | 2,948 |
Occupancy expense | | 730 | | 1,982 | | 659 | | 3,371 |
Total operating expense | | 1,897 | | 3,719 | | 1,907 | | 7,523 |
| | | | | | | | |
Depreciation and amortization | | 246 | | 1,893 | | 700 | | 2,839 |
| | | | | | | | | | | | | | | | | | | | |
| | | | | | | | | | | | | | | | % Change |
| | | | Quarter Ended | | Nine Months Ended | | Fav / (Unfav) |
(Dollars in thousands) | | September 30, 2015 | | September 30, 2014 | | September 30, 2015 | | September 30, 2014 | | Quarter Ended | | Nine Months Ended |
REVENUE | | | | | | | | | | | | | | | | | | |
| United States | Live theater rental and ancillary income | | $ | 806 | | $ | 670 | | $ | 2,511 | | $ | 2,541 | | 20 | % | | (1) | % |
| | Property rental income | | | 388 | | | 470 | | | 1,277 | | | 1,321 | | (17) | % | | (3) | % |
| | | | | 1,194 | | | 1,140 | | | 3,788 | | | 3,862 | | 5 | % | | (2) | % |
| Australia | Property rental income | | | 2,696 | | | 3,512 | | | 8,427 | | | 10,377 | | (23) | % | | (19) | % |
| New Zealand | Property rental income | | | 1,078 | | | 1,383 | | | 3,693 | | | 4,157 | | (22) | % | | (11) | % |
| | | | | | | | | | | | | | | | | | | | |
| Total revenue | | $ | 4,968 | | $ | 6,035 | | $ | 15,908 | | $ | 18,396 | | (18) | % | | (14) | % |
OPERATING EXPENSE | | | | | | | | | | | | | | | | | | |
| United States | Live theater cost | | $ | (912) | | $ | (307) | | $ | (1,811) | | $ | (1,204) | | (197) | % | | (50) | % |
| | Property cost | | | (33) | | | (43) | | | (124) | | | 37 | | 23 | % | | 435 | % |
| | Occupancy expense | | | (265) | | | (235) | | | (758) | | | (730) | | (13) | % | | (4) | % |
| | | | | (1,210) | | | (585) | | | (2,693) | | | (1,897) | | (107) | % | | (42) | % |
| Australia | Property cost | | | (466) | | | (500) | | | (1,355) | | | (1,737) | | 7 | % | | 22 | % |
| | Occupancy expense | | | (404) | | | (563) | | | (1,339) | | | (1,982) | | 28 | % | | 32 | % |
| | | | | (870) | | | (1,063) | | | (2,694) | | | (3,719) | | 18 | % | | 28 | % |
| New Zealand | Property cost | | | (332) | | | (439) | | | (1,115) | | | (1,248) | | 24 | % | | 11 | % |
| | Occupancy expense | | | (158) | | | (202) | | | (502) | | | (659) | | 22 | % | | 24 | % |
| | | | | (490) | | | (641) | | | (1,617) | | | (1,907) | | 24 | % | | 15 | % |
| | | | | | | | | | | | | | | | | | | | |
| Total operating expense | | $ | (2,570) | | $ | (2,289) | | $ | (7,004) | | $ | (7,523) | | (12) | % | | 7 | % |
DEPRECIATION, AMORTIZATION, GENERAL AND ADMINISTRATIVE EXPENSE | | | | | | | | | | | | | | | | | | |
| United States | Depreciation and amortization | | $ | (86) | | $ | (81) | | $ | (247) | | $ | (246) | | (6) | % | | - | % |
| | General and administrative expense | | | (20) | | | (12) | | | 40 | | | (34) | | (67) | % | | 218 | % |
| | | | | (106) | | | (93) | | | (207) | | | (280) | | (14) | % | | 26 | % |
| Australia | Depreciation and amortization | | $ | (447) | | $ | (642) | | $ | (1,458) | | $ | (1,893) | | 30 | % | | 23 | % |
| | General and administrative expense | | | (178) | | | (409) | | | (534) | | | (794) | | 56 | % | | 33 | % |
| | | | | (625) | | | (1,051) | | | (1,992) | | | (2,687) | | 41 | % | | 26 | % |
| New Zealand | Depreciation and amortization | | | (213) | | | (241) | | | (711) | | | (700) | | 12 | % | | (2) | % |
| | General and administrative expense | | | (11) | | | (15) | | | (42) | | | (42) | | 27 | % | | - | % |
| | | | | (224) | | | (256) | | | (753) | | | (742) | | 13 | % | | (1) | % |
| | | | | | | | | | | | | | | | | | | | |
| Total depreciation, amortization, general and administrative expense | | $ | (955) | | $ | (1,400) | | $ | (2,952) | | $ | (3,709) | | 32 | % | | 20 | % |
OPERATING INCOME - REAL ESTATE | | | | | | | | | | | | | | | | | | |
| United States | | $ | (122) | | $ | 462 | | $ | 888 | | $ | 1,685 | | (126) | % | | (47) | % |
| Australia | | | 1,201 | | | 1,398 | | | 3,741 | | | 3,971 | | (14) | % | | (6) | % |
| New Zealand | | | 364 | | | 486 | | | 1,323 | | | 1,508 | | (25) | % | | (12) | % |
| Total real estate operating income | | $ | 1,443 | | $ | 2,346 | | $ | 5,952 | | $ | 7,164 | | (38) | % | | (17) | % |
Table Of Contents
General and administrative expense | | 34 | | 794 | | 42 | | 870 |
Segment operating income | $ | 1,685 | $ | 3,971 | $ | 1,508 | $ | 7,164 |
| | | | | | | | |
Operating Data as a Percentage of Revenue for the Nine Months Ended September 30, 2014 | | United States | | Australia | | New Zealand | | Total |
Live theater rental and ancillary revenue | | 65.8% | | 0.0% | | 0.0% | | 13.8% |
Property rental revenue | | 34.2% | | 100.0% | | 100.0% | | 86.2% |
Total revenue | | 100.0% | | 100.0% | | 100.0% | | 100.0% |
| | | | | | | | |
Live theater cost | | 47.4% | | 0.0% | | 0.0% | | 47.4% |
Property cost | | -2.8% | | 16.7% | | 30.0% | | 18.6% |
Occupancy expense | | 18.9% | | 19.1% | | 15.9% | | 18.3% |
Total operating cost and expense | | 49.1% | | 35.8% | | 45.9% | | 40.9% |
| | | | | | | | |
Depreciation and amortization | | 6.4% | | 18.2% | | 16.8% | | 15.4% |
General and administrative expense | | 0.9% | | 7.7% | | 1.0% | | 4.7% |
Segment operating income | | 43.6% | | 38.3% | | 36.3% | | 38.9% |
| | | | | | | | |
| | | | | | | | |
Nine Months Ended September 30, 2013 | | United States | | Australia | | New Zealand | | Total |
Live theater rental and ancillary income | $ | 2,292 | $ | -- | $ | -- | $ | 2,292 |
Property rental income | | 1,247 | | 10,740 | | 5,485 | | 17,472 |
Total revenues | | 3,539 | | 10,740 | | 5,485 | | 19,764 |
| | | | | | | | |
Live theater cost | | 1,460 | | -- | | -- | | 1,460 |
Property cost | | 229 | | 1,785 | | 1,262 | | 3,277 |
Occupancy expense | | 401 | | 2,376 | | 601 | | 3,379 |
Total operating expense | | 2,091 | | 4,161 | | 1,863 | | 8,115 |
| | | | | | | | |
Depreciation and amortization | | 235 | | 2,001 | | 850 | | 3,086 |
General and administrative expense | | 77 | | 406 | | 36 | | 519 |
Segment operating income | $ | 1,136 | $ | 4,172 | $ | 2,736 | $ | 8,044 |
| | | | | | | | |
Operating Data as a Percentage of Revenue for the Nine Months Ended September 30, 2013 | | United States | | Australia | | New Zealand | | Total |
Live theater rental and ancillary revenue | | 64.8% | | 0.0% | | 0.0% | | 11.6% |
Property rental revenue | | 35.2% | | 100.0% | | 100.0% | | 88.4% |
Total revenue | | 100.0% | | 100.0% | | 100.0% | | 100.0% |
| | | | | | | | |
Live theater cost | | 63.7% | | 0.0% | | 0.0% | | 63.7% |
Property cost | | 18.4% | | 16.6% | | 23.0% | | 18.8% |
Occupancy expense | | 11.3% | | 22.1% | | 11.0% | | 17.1% |
Total operating cost and expense | | 59.1% | | 38.7% | | 34.0% | | 41.1% |
| | | | | | | | |
Depreciation and amortization | | 6.6% | | 18.6% | | 15.5% | | 15.6% |
General and administrative expense | | 2.2% | | 3.8% | | 0.7% | | 2.6% |
Segment operating income | | 32.1% | | 38.8% | | 49.9% | | 40.7% |
The table below presents the operating results as a percentage of revenue for the quarter and nine months ended September 30, 2015 and 2014, respectively: | ·
| | Real estate revenue decreased for the 2014 Nine Months by $1.4 million or 6.9% compared to the same period in 2013. The decrease in New Zealand revenue is primarily the result of the closure of the Courtenay Central parking structure which has resulted in an estimated loss of revenue for the New Zealand operations of $2.0 million a year together with the termination of the Hoyts lease at our Dunedin property. This was offset by an overall increase in live theatre revenue by $249,000 or 10.9% compared to the same period in 2013
|
| ·
| | Operating expense for the real estate segment decreased for the 2014 Nine Months by $592,000 or 7.3% compared to the same period in 2013. This decrease in operating expense was due to the same reasons noted above for the quarterly results.
|
| ·
| | The Australian quarterly exchange rate to the U.S. dollar declined to 0.9247 for the 2014 Nine Months from 0.9821 for the 2013 Nine Months, a decrease of 5.8%. The New Zealand quarterly exchange rate to the U.S. dollar increased to 0.8515 for the 2014 Nine Months from 0.8182 for the 2013 Nine Months, an increase of 4.1%. Both had an impact on the individual components of our income statement.
|
| ·
| | Real estate segment income decreased for the 2014 Nine Months by $880,000 or 10.9% compared to the same period in 2013, due primarily to the shortfall in operating income from the Courtenay Central parking structure closure, offset by a decrease in operating expenses for 2014 Nine Months and positive operating results from the live theater operations compared to the same period in 2013.
|
| | | | | | | | | | | | | | |
| | | | Quarter Ended | | Nine Months Ended |
(Dollars in thousands) | | September 30, 2015 | | September 30, 2014 | | September 30, 2015 | | September 30, 2014 |
REVENUE | | | | | | | | | | | | |
| United States | Live theater rental and ancillary income | | | 68% | | | 59% | | | 66% | | | 66% |
| | Property rental income | | | 32% | | | 41% | | | 34% | | | 34% |
| | | | | 100% | | | 100% | | | 100% | | | 100% |
| Australia | Property rental income | | | 100% | | | 100% | | | 100% | | | 100% |
| New Zealand | Property rental income | | | 100% | | | 100% | | | 100% | | | 100% |
| Total revenue | | | 100% | | | 100% | | | 100% | | | 100% |
OPERATING EXPENSE | | | | | | | | | | | | |
| United States | Live theater cost | | | 113% | | | 46% | | | 72% | | | 47% |
| | Property cost | | | 9% | | | 9% | | | 10% | | | -3% |
| | Occupancy expense | | | 22% | | | 21% | | | 20% | | | 19% |
| | | | | 101% | | | 51% | | | 71% | | | 49% |
| Australia | Property cost | | | 17% | | | 14% | | | 16% | | | 17% |
| | Occupancy expense | | | 15% | | | 16% | | | 16% | | | 19% |
| | | | | 32% | | | 30% | | | 32% | | | 36% |
| New Zealand | Property cost | | | 31% | | | 32% | | | 30% | | | 30% |
| | Occupancy expense | | | 15% | | | 15% | | | 14% | | | 16% |
| | | | | 45% | | | 46% | | | 44% | | | 46% |
| Total operating expense | | | 52% | | | 38% | | | 44% | | | 41% |
DEPRECIATION, AMORTIZATION, GENERAL AND ADMINISTRATIVE EXPENSE | | | | | | | | | | | | |
| United States | Depreciation and amortization | | | 7% | | | 7% | | | 7% | | | 6% |
| | General and administrative expense | | | 2% | | | 1% | | | -1% | | | 1% |
| | | | | 9% | | | 8% | | | 5% | | | 7% |
| Australia | Depreciation and amortization | | | 17% | | | 18% | | | 17% | | | 18% |
| | General and administrative expense | | | 7% | | | 12% | | | 6% | | | 8% |
| | | | | 23% | | | 30% | | | 24% | | | 26% |
| New Zealand | Depreciation and amortization | | | 20% | | | 17% | | | 19% | | | 17% |
| | General and administrative expense | | | 1% | | | 1% | | | 1% | | | 1% |
| | | | | 21% | | | 19% | | | 20% | | | 18% |
| Total depreciation, amortization, general and administrative expense | | | 19% | | | 23% | | | 19% | | | 20% |
OPERATING INCOME - REAL ESTATE | | | | | | | | | | | | |
| United States | | | -10% | | | 41% | | | 23% | | | 44% |
| Australia | | | 45% | | | 40% | | | 44% | | | 38% |
| New Zealand | | | 34% | | | 35% | | | 36% | | | 36% |
| Total real estate operating income | | | 29% | | | 39% | | | 37% | | | 39% |
Corporate
Quarterly ResultsResults:
Segment operating income
Real estate segment operating income decreased by 38%, or $903,000 to $1.4 million for the quarter ended September 30, 2015 compared to September 30, 2014, mainly driven by 18% lower revenue, 12% higher operating expense, partially offset by 23% lower depreciation and amortization and 52% lower general and administrative expense. Refer below for further explanation.
Revenue
Real estate revenue for the quarter decreased by 18%, or $1.1 million, mainly driven by lower property rental income from Australia and New Zealand caused by the weakening Australia dollar and New Zealand dollar compared to U.S. dollar.
Operating expense
Operating expense for the quarter increased by 12% or $281,000, due to $625,000 higher operating expense from U.S. mainly related to increased legal costs in the live theater business, partially offset by $344,000 lower costs in Australia and New Zealand due to the foreign currency movements. The legal expenses relate to the costs (litigation and arbitration) associated with the prosecution of certain claims against the licensee of one of our Manhattan live theaters.
Depreciation, amortization, general and administrative expense
Depreciation, amortization, general and administrative expense decreased by 32%, or $445,000, due to lower depreciation and amortization and lower general and administrative expense. Depreciation and amortization expense for the quarter decreased by 23%, or $218,000, mainly due to foreign exchange rate movements. General and administration expense for the quarter decreased by 52%, or $227,000, mainly attributable to $162,000 in higher consulting fees in 2014.
Nine Months Results:
Segment operating income
Real estate segment operating income decreased by 17%, or $1.2 million, to $6.0 million for the nine-month period ended September 30, 2015 compared to September 30, 2014, primarily attributable to 14% lower revenue, partially offset by 7% lower operating expense, 15% lower depreciation and amortization and 38% lower general and administrative expense. Refer below for further explanation.
Revenue
Real estate revenue for the nine-month period decreased by 14%, or $2.5 million, mainly driven by lower property rental income from Australia and New Zealand caused by the foreign exchange rate movements.
Operating expense
Operating expense for the nine-month period decreased by 7%, or $519,000, mainly attributable to lowering of operating costs after the sale of our Burwood property and the appreciation of the U.S. dollar against New Zealand dollar and the Australian dollar, partially offset by higher legal costs in our live theater business. The legal expenses relate to the costs (litigation and arbitration) associated with the prosecution of certain claims against the licensee of one of our Manhattan live theaters.
Depreciation, amortization, general and administrative expense
Depreciation, amortization, general and administrative expense for the nine-month period decreased by 20%, or 757,000, primarily driven by lower depreciation and amortization expense and lower general and administrative expense. Depreciation and amortization expense for the nine-month period decreased by 15%, or $423,000, mainly due to a number of new site upgrades and the appreciation of the U.S. dollar against the New Zealand dollar and Australian dollar. General and administrative expense decreased slightly by $293,000 for the nine-month period decreased by 38%, or $334,000, mainly attributable to $162,000 in higher consulting fees in 2014, Quarter comparedin addition to the 2013 Quarter.
Net interest expense decreased by $1.4 for the 2014 Quarter compared to the 2013 Quarter. Our interest expense was lower in the 2014 Quarter due to a change in mark-to-market interestfavorable impact from foreign exchange rate swap valuations for the quarter.
Income taxes increased by $561,000 due to improved pretax income in the 2014 Quarter compared to the 2013 Quarter.
Nine Months Results
General and administrative expense increased by $609,000 for the 2014 Nine Months compared to the 2013 Nine Months. The increase in general and administrative expense during the 2014 Nine Months was due primarily to the increase in pension expenses estimated by our third party actuarial valuation report for 2014.
Net interest expense decreased by $1.5 million for the 2014 Nine Months compared to the 2013 Nine Months as a result of favorable changes in the mark-to-market swap valuations.
Income tax expense increased by $1.6 million for the 2014 Nine Months compared to the 2013 Nine Months primarily because of improved pre-tax income during 2014 compared to 2013.
Other income increased $1.4 million due to insurance proceeds received during the 2014 period for the Courtenay Central parking structure business interruption recovery claim.
Net Income (Loss) Attributable to Reading International, Inc. Common Shareholders
We recorded a net income attributable to Reading International, Inc. common shareholders of $3.9 million for the 2014 Quarter compared to a net income of $2.4 million for the 2013 Quarter and a net income of $8.5 million for the 2014 Nine Months compared to a net income of $5.9 million for the 2013 Nine Months. As described above, the increase in net income from 2013 to 2014 was primarily due to improved efficiencies in operations of the cinema business, which is reflected in the decrease in the cinema business total operating expense for the 2014 Nine Months by $4.0 million or 2.6% compared to the same period in 2013.movements.
Business Plan, Capital Resources, and Liquidity
BUSINESS PLAN, LIQUIDITY AND CAPITAL RESOURCES
Business Planplan
Our cinema exhibition business plan is to continue to identify, develop, and acquire cinema properties, where reasonably available, that allow us to leverage our cinema expertise and technology over a larger operating base.
Our real estate business plan is to begin development of our existing land assets, to be sensitive to opportunities to convert our entertainment assets to higher and better uses, or, when appropriate, to dispose of such assets.
In addition, we review opportunities to monetize our assets where such action could lead to a financially acceptable outcome. We will also continue to investigate potential synergistic acquisitions that may not readily fall into either of our two cinema or real estate segments.
Liquidity and capital resources
Liquidity risk is the risk relating to our ability to meet our financial obligations when they come due. In today’s environment, our financial obligations arise mainly from capital expenditure needs, working capital requirements, and debt servicing requirements. We manage the liquidity risk by ensuring our ability to generate sufficient cash flows from operating activities and to obtain adequate, reasonable financing and/or to convert non-performing or non-strategic assets into cash.
The change in cash and cash equivalents is as follows.
| | | | | | | | | |
| | Nine Months Ended | | |
(Dollars in thousands) | | September 30, 2015 | | September 30, 2014 | | % Change |
Net cash provided by operating activities | | $ | 21,367 | | $ | 14,814 | | 44 | % |
Net cash provided (used) by investing activities | | | 8,734 | | | (3,040) | | 387 | % |
Net cash used in financing activities | | | (10,586) | | | (7,768) | | (36) | % |
Impact of exchange rate on cash | | | (7,682) | | | (1,066) | | (621) | % |
Increase in cash and cash equivalents | | $ | 11,833 | | $ | 2,940 | | 302 | % |
Operating activities
Cash provided by operating activities during the current nine-month period increased by 44%, or $6.6 million, to $21.4 million, primarily driven by an increase of $9.2 million in changes in operating assets and liabilities, partially offset by a $2.6 million decrease in operational cash flows.
Investing activities
Cash provided by investing activities during the current nine-month period increased by $11.8 million, to $8.7 million, primarily generated by $21.9 million of proceeds from the sale of our properties and $1.3 million change in restricted cash, partially offset by $14.4 million used for property enhancements to our existing properties.
Financing Activities
The $10.6 million cash used in the financing activities during the current nine-month period was primarily related to $7.3 million loan repayments and $3.1 million used to repurchase Class A non-voting stock.
The $7.7 million of cash used in financing activities during the prior-year nine-month period was primarily attributable to $6.6 million loan repayments and $2.3 million used to repurchase Class A non-voting stock, partially offset by $975,000 proceeds from the exercise of stock options.
We manage our cash, investments and capital structure so we are able to meet the short-term and long-term obligations of our business, while maintaining financial flexibility and liquidity. We forecast, analyze and monitor our cash flows to enable investment and financing within the overall constraints of our financial strategy.
At September 30, 2015, our consolidated cash and cash equivalents totaled $62.1 million. Of Contentsthis amount, $46.8 million and $9.3 million was held by our Australia and New Zealand subsidiaries, respectively. Our intention is to indefinitely reinvest Australia earnings but not indefinitely reinvest New Zealand earnings. If these earnings were used to fund domestic operations, they would be subject to additional income taxes upon repatriation.
We have historically funded our working capital requirements, capital expenditures, investments in the acquisition of individual properties primarily from internally generated cash flows. The Company had $41.7 million unused capacity of available corporate credit facilities at September 30, 2015. In addition, we have $6.0 million and $9.6 million unused capacity for Cinema 1,2,3 and construction funding for New Zealand, respectively.
Contractual ObligationsWe expect to refinance the $15.0 million Cinema 1,2,3 Term Loan (USA) prior to the maturity date of July 1, 2016.
CONTRACTUAL OBLIGATIONS, COMMITMENTS AND CONTINGENCIES
The following table provides information with respect to the maturities and scheduled principal repayments of our secured debt and leaserecorded contractual obligations atas of September 30, 2014 (in thousands):2015:
| | | | | | | | | | | | | | | | | | | | | | | | | | | | |
| | | | | | | | | | | | | | | | | | | | | | | | | | | | | | | | | | | |
| | 2014 | | 2015 | | 2016 | | 2017 | | 2018 | | Thereafter | | Total | |
Debt | $ | 2,294 | $ | 33,521 | $ | 20,247 | $ | 22,747 | $ | 9,247 | $ | 43,685 | $ | 131,743 | |
Subordinated notes (trust preferred securities) | | -- | | -- | | -- | | -- | | -- | | 27,913 | | 27,913 | |
(Dollars in thousands) | | | 2015 | | 2016 | | 2017 | | 2018 | | 2019 | | Thereafter | | Total |
Notes payable | | | $ | 351 | | $ | 16,404 | | $ | 9,404 | | $ | 26,796 | | $ | 64,850 | | $ | -- | | $ | 117,805 |
Subordinated debt | | | | -- | | | -- | | | -- | | | -- | | | -- | | | 27,913 | | | 27,913 |
Tax settlement liability | | 870 | | 2,974 | | -- | | -- | | -- | | -- | | 3,844 | | | 364 | | | -- | | | -- | | | -- | | | -- | | | -- | | | 364 |
Pension liability | | 171 | | 684 | | 684 | | 684 | | 684 | | 4,643 | | 7,550 | | | 855 | | | 684 | | | 684 | | | 684 | | | 684 | | | 4,139 | | | 7,730 |
Lease obligations | | 6,482 | | 32,234 | | 28,504 | | 25,878 | | 22,089 | | 60,654 | | 175,841 | | | 7,717 | | | 28,289 | | | 25,892 | | | 19,733 | | | 17,416 | | | 71,470 | | | 170,517 |
Estimated interest on debt | | 1,809 | | 5,876 | | 5,007 | | 4,505 | | 3,627 | | 10,918 | | 31,741 | | | 1,479 | | | 5,562 | | | 5,062 | | | 4,053 | | | 2,766 | | | 8,919 | | | 27,842 |
Total | $ | 11,626 | $ | 75,289 | $ | 54,442 | $ | 53,814 | $ | 35,647 | $ | 147,814 | $ | 378,632 | | $ | 10,766 | | $ | 50,939 | | $ | 41,042 | | $ | 51,266 | | $ | 85,716 | | $ | 112,441 | | $ | 352,171 |
We base estimated(1) Estimated interest on long-term debt is based on the anticipated loan balances for future periods calculated againstand current fixed and variableapplicable interest rates.
We adopted FASB ASC 740-10-25 on January 1, 2007. As of adoption, the total amount of gross unrecognized tax benefits for uncertain tax positions was $12.5 million decreasing to $2.3 million as of September 30, 2014 primarily as a result of the settlement on January 6, 2011 of our Tax Audit/Litigation matter.
Unconsolidated Debtdebt
Total debt of unconsolidated joint ventures and entities was $623,000$678,000 (NZ$1.0 million) and $634,000$592,000 (NZ$760,000) as of September 30, 20142015 and December 31, 2013,2014, respectively. Our share of unconsolidated debt, based on our ownership percentage, was $208,000$226,000 and $211,000$197,000 as of September 30, 20142015 and December 31, 2013,2014, respectively. This debt is guaranteed by one of our subsidiaries to the extent of our ownership percentage.
Off-BalanceOff balance sheet arrangements
On March 6, 2015, we entered into an unconditional contract to acquire an adjoining property to our Newmarket, Australia site for $5.3 million (A$7.5 million), with $4.7 million (A$6.75 million) due on November 30, 2015. Under U.S. GAAP, we recorded the deposit of $600,000 (A$750,000) along with the relevant taxes paid as assets on our Consolidated Balance Sheet. The remaining balance due is not recorded as liability on our Consolidated Balance Sheet Arrangementsas of September 30, 2015.
ThereLitigation
We are currently involved in certain legal proceedings and, as required, have accrued estimates of probable and estimable losses for the resolution of these claims.
Where we are the plaintiffs, we expense all legal fees on an on-going basis and make no off-balance sheet transactions, arrangements or obligations (including contingent obligations)provision for any potential settlement amounts until received. In Australia, the prevailing party is usually entitled to recover its attorneys’ fees, which typically work out to be approximately 60% of the amounts actually spent where first class legal counsel is engaged at customary rates. Where we are a plaintiff, we have likewise made no provision for the liability for the defendant’s attorneys' fees in the event we are determined not to be the prevailing party.
Where we are the defendants, we accrue for probable damages that have, orinsurance may not cover as they become known and can be reasonably estimated. In our opinion, any claims and litigation in which we are currently involved are not reasonably likely to have a current or future material adverse effect on our financial condition, changes in the financial condition, revenues or expenses,business, results of operations, liquidity, capital expenditures,financial position, or capital resources.liquidity. It is possible, however, that future results of the operations for any particular quarterly or annual period could be materially affected by the ultimate outcome of the legal proceedings. Please refer to Item 1 – Legal Proceedings in Part II – Other Information in this report and our 2014 Annual Report for more information. There have been no material changes to our litigation exposure since our 2014 Annual Report, except as set forth in Item 1 – Legal Proceedings.
CRITICAL ACCOUNTING POLICIES
The SEC defines critical accounting policies as those that are, in management’s view, most important to the portrayal of the company’s financial condition and results of operations and the most demanding in their calls on judgment. We believe our most critical accounting policies relate to:
| · | | impairment of long-lived assets, including goodwill and intangible assets, |
| · | | tax valuation allowance and obligations, and |
| · | | legal and environmental obligations. |
We discuss these critical accounting policies in our 2014 Annual Report and advise you to refer to that discussion.
Refer to Note 1 – Basis of Presentation for more information regarding new and recently adopted accounting pronouncements.
FINANCIAL RISK MANAGEMENT
Currency Riskand interest rate risk
The Company’s objective in managing exposure to foreign currency and interest rate fluctuations is to reduce volatility of earnings and cash flows in order to allow management to focus on core business issues and challenges.
We are subject tocurrently manage our currency risk because we conduct a significant portion of our businessexposure by creating, whenever possible, natural hedges in Australia and New Zealand. Set forth below is a chart indicating the various exchange rates at certain pointsThis involves local country sourcing of goods and services as well as borrowing in time for the Australian and New Zealand Dollar vis-à-vis the US Dollar over the past 20 years.
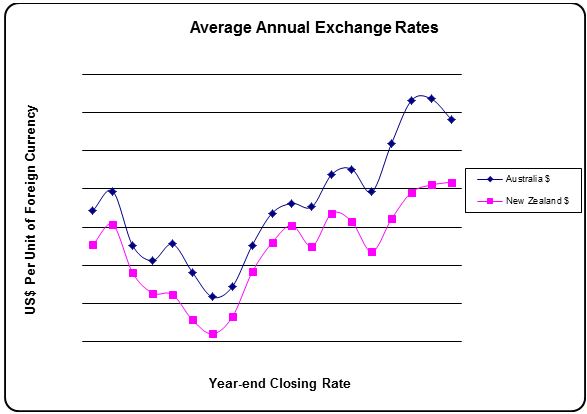
We do not engage in currency hedging activities. Rather, to the extent possible, we operate our Australian and New Zealand operations on a self-funding basis. Our policy in Australia and New Zealand islocal currencies to match revenues and expenses, whenever possible, in local currencies. Asexpenses. Since we intend to conduct business on a result, we have procured in local currencies the majorityself-funding basis, except for funds used to pay on appropriate share of our expenses in Australia and New Zealand.domestic corporate overhead), we do not believe the currency fluctuations presents a material risk to the Company. As oursuch, we do not use derivative financial instruments to hedge against the risk of foreign currency exposure.
Our U.S. operations are funded in part by the operational results of Australia and New Zealand, fluctuations in these foreign currencies affect such funding. As we continue to progress with our acquisition and development activities in Australia and New Zealand, the effect of variations in currency values will likely increase.
LiquiditySet forth below is a chart reflecting the currency trends for the Australian and Capital Resources
Our ability to generate sufficient cash flows from operating activities in order to meet our obligations and commitments drives our liquidity position. This is further affected by our ability to obtain adequate, reasonable financing and/or to convert non-performing or non-strategic assets into cash.
Currently, our liquidity needs arise primarily from:
| ·
| | capital expenditure needs;
|
| ·
| | working capital requirements; and
|
| ·
| | debt servicing requirements.
|
Expiring Debt and Liquidity Requirements
Expiring Long-Term Debt
Our New Zealand Corporate Credit Facility matures on March 31, 2015 and as suchDollars vis-à-vis the balance of $21.8 million (NZ$28.0 million) has been reclassified as a current liability onU.S. Dollars over the consolidated balance sheet as of September 30, 2014.
Additionally, the term of our Union Square Theatre Term Loan matures on May 1, 2015. Accordingly, the outstanding balance of this debt of $6.5 million has been classified as a current liability on the consolidated balance sheet as of September 30, 2014.
While no assurances can be given that we will be successful, we currently anticipate that these loans will either be extended or replaced prior to their maturities.past 20 years.
Tax Settlement Liability
As indicated in our 2013 Annual Report, in accordance with the agreement between the U.S. Internal Revenue Service and our subsidiary, Craig Corporation, it is obligated to pay $290,000 per month, $3.5 million per year, in settlement for its tax liability for its tax year 1996. At September 30, 2014, Craig Corporation’s remaining tax liability under this agreement was approximately $3.8 million.
For the abovementioned liabilities, we believe that we have sufficient borrowing capacity under our various credit facilities, together with our $40.6 million of cash and cash equivalents, to meet our anticipated short-term working capital requirements for the next twelve months.
Operating Activities
Cash provided by operations was $15.0 million in the 2014 Nine Months compared to $16.2 million in the 2013 Nine Months. The year-to-year decrease in cash provided by operations of $1.3 million was due primarily to a $4.1 million increase in operational cash flows offset by a $5.4 million change in operating assets and liabilities.
Investing Activities
Cash used in investing activities for the 2014 Nine Months was $3.0 million compared to $898,000 used in investing activities for the 2013 Nine Months, a change of $2.1 million. The $3.0 million of cash used in investing activities for the 2014 Nine Months related to:
| ·
| | $5.3 million in deposits from a sale of property; and
|
| ·
| | $212,000 of distributions from unconsolidated JV’s and entities;
|
offset by
| ·
| | $8.6 million in property enhancements to our existing properties.
|
The $898,000 of cash provided by investing activities for the 2013 Nine Months was primarily related to:
| ·
| | $1.6 million in cash provided from restricted cash;
|
| ·
| | $2.0 million of proceeds from a note receivable; and
|
| ·
| | $8.0 million of proceeds from time deposits;
|
offset by
| ·
| | $12.7 million in property enhancements to our existing properties;
|
Financing Activities
Cash used in financing activities for the 2014 Nine Months was 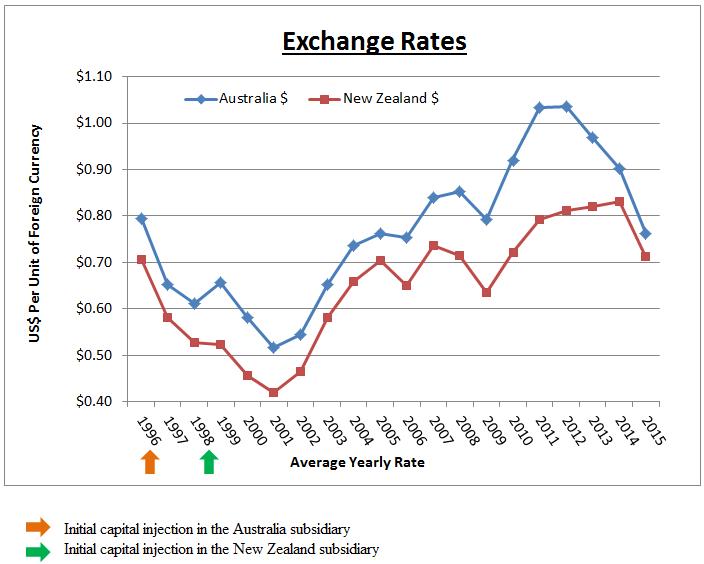
$7.8 million compared to $14.3 million of cash used in financing activities for the same period in 2013, resulting in a change of $6.5 million. The $7.8 million in cash used in financing activities during the 2014 Nine Months was primarily related to:
| ·
| | $6.6 million of loan repayments; and
|
| ·
| | $2.3 million used to repurchase Class A non-voting stock;
|
offset by
| ·
| | $975,000 of proceeds from the exercise of stock options.
|
The $14.3 million in cash used in financing activities during the 2013 Nine Months was primarily related to:
| ·
| | $25.1 million of loan repayment including a $6.4 million payoff of our former Liberty Theaters Term Loan, a $6.8 million pay off our Sutton Hill Capital Note, $4.6 million in payments on our Bank of America Revolver and Line of Credit, $6.5 million in payments on our NAB term debt, and a $592,000 pay off of the Nationwide Loan 1; and
|
| ·
| | $2.1 million in noncontrolling interests’ distributions;
|
offset by
| ·
| | $12.5 million of new borrowing including $5.0 million from our Bank of America Revolver and $7.5 million from our new loan on the Orpheum and Minetta Lane Theatres, net of $103,000 of borrowing costs;
|
| ·
| | $263,000 in noncontrolling interests’ contributions; and
|
| ·
| | $249,000 of proceeds from the exercise of stock options.
|
Critical Accounting Policies
The SEC defines critical accounting policies as those that are, in management’s view, most important to the portrayal of the company’s financial condition and results of operations and the most demanding in their calls on judgment. Although accounting for our core business of cinema and live theater exhibition with a real estate focus is relatively straightforward, we believe our most critical accounting policies relate to:
| ·
| | impairment of long-lived assets, including goodwill and intangible assets;
|
| ·
| | tax valuation allowance and obligations; and
|
| ·
| | legal and environmental obligations.
|
We discuss these critical accounting policies in our 2013 Annual Report and advise you to refer to that discussion.
In May 2014, the Financial Accounting Standards Board issued a new standard to achieve a consistent application of revenue recognition within the U.S resulting in a single revenue model to be applied by reporting companies under U.S. general accepted accounting principles. The new standard is effective beginning in the first quarter of 2017. While we feel the impact of the proposed revenue recognition will have minimal impact on our business since our revenues predominantly come from movie ticket sales and concession purchases we intend to go through the analysis to ensure that we are in compliance.
Financial Risk Management
Our internally developed risk management procedure seeks to minimize the potentially negative effects of changes in currency exchange rates and interest rates on the results of operations. Our primary exposure to fluctuations in the financial markets is currently due to changes in interest rates and currency exchange rates between U.S and Australia and New Zealand.
As our operational focus continues to shift to Australia and New Zealand, unrealized foreign currency translation gains and losses could materially affect our financial position. We currently manage our currency exposure by creating, whenever possible, natural hedges in Australia and New Zealand. This involves local country sourcing of goods and services as well as borrowing in local currencies.
Our exposure to interest rate risk arises out of our long-term debt obligations. Consistent with our internally developed guidelines,floating-rate borrowings. To manage the risk, we seek to reduce the negative effects of changes in interest rates by changing the character of theutilize interest rate on our long-term debt, converting a variable rate into a fixed rate by entering into derivative contracts onto convert certain borrowing transactions. Our Australian credit facilities provide for floating interest rates but require that not less than a certain percentage offloating-rate borrowings into fixed-rate borrowings. It is the loans be swappedCompany’s policy to enter into fixed rate obligations using derivative contracts.
In accordance with FASB ASC 815-10-35, Subsequent Valuation of Derivative Instruments and Hedging Instruments (“FASB ASC 815-10-35”), we marked our interest rate swap and cap instrumentsderivative transactions only to market on the consolidated balance sheet resulting in a decrease in interest expense of $958,000 and a decrease of $1.0 million during the three and nine months ended September 30, 2014, respectively, and an decrease of $209,000 and $1.6 million in interest expense during the three and nine months ended September 30, 2013, respectively. At September 30, 2014 and December 31, 2013, we recorded the fair market value of our interest rate swaps and cap of $2.3 million and $3.3 million, respectively,extent considered necessary to meet its objectives as stated above. The Company does not enter into these transactions or any other long-term liabilities. In accordance with FASB ASC 815-10-35, we have not designated any of our current interest rate swap or cap positions as financial reporting hedges.hedging transactions for speculative purposes.
Inflation
We continually monitor inflation and the effects of changing prices. Inflation increases the cost of goods and services used. Competitive conditions in many of our markets restrict our ability to recover fully the higher costs of acquired goods and services through price increases. We attempt to mitigate the impact of inflation by implementing continuous process improvement solutions to enhance productivity and efficiency and, as a result, lower costs and operating expenses. In our opinion, we have managed the effects of inflation appropriately, and, as a result, it has not had a material impact on our operations and the resulting financial position or liquidity.
Litigation
We are currently, and are from time to time, involved with claims and lawsuits arising in the ordinary course of our business. Some examples of the types of claims are:
| ·
| | contractual obligations;
|
| ·
| | environmental matters; and
|
Where we are the plaintiffs, we expense all legal fees on an on-going basis and make no provision for any potential settlement amounts until received. In Australia, the prevailing party is entitled to recover its attorneys’ fees, which typically work out to be approximately 60% of the amounts actually spent where first class legal counsel is engaged at customary rates. Where we are a plaintiff, we have likewise made no provision for the liability for the defendant’s attorneys' fees in the event we are determined not to be the prevailing party.
Where we are the defendants, we accrue for probable damages that insurance may not cover as they become known and can be reasonably estimated. In our opinion, any claims and litigation in which we are currently involved are not reasonably likely to have a material adverse effect on our business, results of operations, financial position, or liquidity. However, we do not give any assurance as to the ultimate outcome of such claims and litigation. The resolution of such claims and litigation could be material to our operating results for any particular period, depending on the level of income for such period. There have been no material changes to our litigation exposure since our 2013 Annual Report.
Forward-Looking StatementsFORWARD LOOKING STATEMENTS
Our statements in this interim quarterly report contain a variety of forward-looking statementstatements as defined by the Securities Litigation Reform Act of 1995. Forward-looking statements reflect only our expectations regarding future events and operating performance and necessarily speak only as of the date the information was prepared. No guarantees can be given that our expectation will in fact be realized, in whole or in part. You can recognize these statements by our use of words such as, by way of example, “may,” “might,“will,” “expect,” “believe,” and “anticipate” or other similar terminology.
These forward-looking statements reflect our expectation after having considered a variety of risks and uncertainties. However, they are necessarily the product of internal discussion and do not necessarily completely reflect the views of individual members of our Board of Directors or of our management team. Individual Board members and individual members of our management team may have a different viewsview as to the risks and uncertainties involved, and may have different views as to future events or our operating performance.
Among the factors that could cause actual results to differ materially from those expressed in or underlying our forward-looking statements are the following:
| · | | Withwith respect to our cinema operations:
|
| o | | Thethe number and attractiveness to movie goers of the films released in future periods;
|
| o | | Thethe amount of money spent by film distributors to promote their motion pictures;
|
| o | | Thethe licensing fees and terms required by film distributors from motion picture exhibitors in order to exhibit their films;
|
| o | | The continued willingness of moviegoers to spend money on our concession items;
|
| o
| | Thethe comparative attractiveness of motion pictures as a source of entertainment and willingness and/or ability of consumers (i) to spend their dollars on entertainment and (ii) to spend their entertainment dollars on movies in an outside-the-homeoutside the home environment;
|
| o | | Thethe extent to which we encounter competition from other cinema exhibitors, from other sources of outside of the homeoutside-the-home entertainment, and from inside the homeinside-the-home entertainment options, such as “home theaters” and competitive film product distribution technology such as, by way of example, cable, satellite broadcast DVD and VHSDVD rentals and sales, and so called “movies on demand”;
|
| o
| | the extent to which we can digitalize our cinema circuit compared to our competitors;online streaming; and
|
| o | | Thethe extent to and the efficiency with which we are able to integrate acquisitions of cinema circuits with our existing operations.
|
| · | | Withwith respect to our real estate development and operation activities:
|
| o | | Thethe rental rates and capitalization rates applicable to the markets in which we operate and the quality of properties that we own;
|
| o | | Thethe extent to which we can obtain on a timely basis the various land use approvals and entitlements needed to develop our properties;
|
| o | | Thethe risks and uncertainties associated with real estate development;
|
| o | | Thethe availability and cost of labor and materials;
|
| o | | Competitioncompetition for development sites and tenants;
|
| o | | Environmentalenvironmental remediation issues; and
|
| o | | Thethe extent to which our cinemas can continue to serve as an anchor tenant whothat will, in turn, be influenced by the same factors as will influence generally the results of our cinema operations.operations; and
|
| o | | certain of our activities are in geologically active areas, creating a risk of damage and/or disruption of real estate and/or cinema businesses from earthquakes. |
| · | | Withwith respect to our operations generally as an international company involved in both the development and operation of cinemas and the development and operation of real estate; and previously engaged for many years in the railroad business in the United States:
|
| o | | Ourour ongoing access to borrowed funds and capital and the interest that must be paid on that debt and the returns that must be paid on such capital;
|
| o | | Thethe relative values of the currency used in the countries in which we operate;
|
| o | | Changeschanges in government regulation;regulation, including by way of example, the costs resulting from the implementation of the requirements of Sarbanes-Oxley;
|
| o | | Ourour labor relations and costs of labor (including future government requirements with respect to pension liabilities, disability insurance and health coverage, and vacations and leave);
|
| o | | Ourour exposure from time to time to legal claims and to uninsurable risks such as those related to our historic railroad operations, including potential environmental claims and health relatedhealth-related claims relating to alleged exposure to asbestos or other substances now or in the future recognized as being possible causes of cancer or other health related problems;
|
| o | | Changeschanges in future effective tax rates and the results of currently ongoing and future potential audits by taxing authorities having jurisdiction over our various companies; and
|
| o | | Changeschanges in applicable accounting policies and practices.
|
The above list is not necessarily exhaustive, as business is by definition unpredictable and risky, and subject to influence by numerous factors outside of our control, such as changes in government regulation or policy, competition, interest rates, supply, technological innovation, changes in consumer taste and fancy, weather, and the extent to which consumers in our markets have the economic wherewithal to spend money on beyond-the-home entertainment.
Given the variety and unpredictability of the factors that will ultimately influence our businesses and our results of operation, it naturally follows that no guarantees can be given that any of our forward-looking statements will ultimately prove to be correct. Actual results will undoubtedly vary and there is no guarantee as to how our securities will perform either when considered in isolation or when compared to other securities or investment opportunities.
Finally, we undertake no obligation to update publicly or to revise any of our forward-looking statements, whether as a result of new information, future events or otherwise, except as may be required under applicable law. Accordingly, you should always note the date to which our forward-looking statements speak.
Additionally, certain of the presentations included in this interim quarterly report may contain “non-GAAP financial measures.” In such case, a reconciliation of this information to our GAAP financial statements will be made available in connection with such statements.
Item 3 – Quantitative and Qualitative Disclosure about Market Risk
The SEC requires that registrants include information about potential effects of changes in currency exchange and interest rates in their filings. Several alternatives, all with some limitations, have been offered. We base the following discussion on a sensitivity analysis that models the effects of fluctuations in currency exchange rates and interest rates. This analysis is constrained by several factors, including the following:
| · | | It is based on a single point in time; and |
| · | | It does not include the effects of other complex market reactions that would arise from the changes modeled. |
Although the results of such an analysis may be useful as a benchmark, they should not be viewed as forecasts.
At September 30, 2014,2015, approximately 52%48% and 21%19% of our assets were invested in assets denominated in Australian dollars (Reading Australia) and New Zealand dollars (Reading New Zealand), respectively, including approximately $31.4$56.1 million in cash and cash equivalents. At December 31, 2013,2014, approximately 55%44% and 18%20% of our assets were invested in assets denominated in Australian dollars (Reading Australia) and New Zealand dollars (Reading New Zealand), including approximately $34.5$40.1 million in cash and cash equivalents.
Our policy in Australia and New Zealand is to match revenues and expenses, whenever possible, in local currencies. As a result, we have procured in local currencies a majority of our expenses in Australia and New Zealand. Due to the developing nature of our operations in Australia and New Zealand, our revenue is not yet significantly greater than our operating and interest expenses. Despite this natural hedge, recent movements in foreign currencies have had an effect on our current earnings. Although foreign currency has had an effect on our current earnings, the effect of the translation adjustment on our assets and liabilities noted in our other comprehensive income was an increasedecrease of $16.4 million and a increase of $6.4$13.7 million for the three and nine months ended September 30, 2014, respectively.2015. As we continue to progress our acquisition and development activities in Australia and New Zealand, we cannot assure you that the foreign currency effect on our earnings will be negligible in the future.
Historically, our policy has been to borrow in local currencies to finance the development and construction of our ETRCslong-term assets in Australia and New Zealand whenever possible. As a result, the borrowings in local currencies have provided somewhat of a natural hedge against the foreign currency exchange exposure. Even so, and as a result of our issuance of fully subordinated notes (TPS)Trust Preferred Securities in 2007, and their subsequent partial repayment, approximately 66%68% and 49%48% of our Australian and New Zealand assets, respectively, remain subject to such exposure, unless we elect to hedge our foreign currency exchange between the US and Australian and New Zealand dollars. If the foreign currency rates were to fluctuate by 10%, the resulting change in Australian and New Zealand assets would be $13.1$11.9 million and $3.9$3.3 million, respectively, and the change in our quarterly net income (loss) would be $797,000$1,377,000 and $149,000,$51,000, respectively. Presently, we have no plan to hedge such exposure.
We record unrealized foreign currency translation gains or losses that could materially affect our financial position. As of September 30, 20142015 and December 31, 2013, we have recorded a2014, the balance of cumulative unrealized foreign currency translation adjustments was approximately $3.3 million gain of approximately $38.9and $31.1 million and $65.6 million,gain, respectively.
Historically, we maintain most of our cash and cash equivalent balances in short-term money market instruments with original maturities of three months or less. Due to the short-term nature of such investments, a change of 1% in short-term interest rates would not have a material effect on our financial condition.
While we have typically used fixed rate financing (secured by first mortgages) in the U.S., fixed rate financing is typically not available to corporate borrowers in Australia and New Zealand. The majority of our Australian and New Zealand bank loans have variable rates. The Australian facility provides for floating interest rates, but requires that not less than a certain percentage of the loan bewe currently have swapped into fixed rate obligations (see Financial Risk Management above). Taking into consideration our interest rate swaps and cap,derivatives, a 1% increase or decreasechange in short-term interest rates would have resulted in approximately $162,000 increase or decrease$152,000 change in our 2014 Quarter’scurrent quarter interest expense.
Item 4 – Controls and Procedures
We maintain disclosure controls and procedures that are designed to ensure that information required to be disclosed in the Company’s reports filed under the Securities Exchange Act reports,of 1934, as amended (the “Exchange Act”), is recorded, processed, summarized and reported within the time periods specified in the SEC’s rules and forms and that such information is accumulated and communicated to our management, including our Chief Executive Officer and Chief Financial Officer, as appropriate, to allow for timely decisions regarding required disclosure. In designing and evaluating the disclosure controls and procedures, management recognizes that any controls and procedures, no matter how well designed and operated, can provide only reasonable assurance of achieving the desired control objectives, and our management is required to apply its judgment in evaluating the cost-benefit relationship of possible controls and procedures.
Under the supervision and with the participation of our management, including our principal executive officer and principal financial officer, we conducted an evaluation of our disclosure controls and procedures, in connection withas such, term is defined under Rule 13a-15(e) promulgated under the preparation of this Quarterly Report. Exchange Act.
In its evaluations, our management, including our chief executive officer and our chief financial officer, identified2014, we noted a material weakness in our internal control over financial reporting based on their discoveryregarding certain controls related to income tax. We anticipate that our audited consolidated financial statements forthese controls will be updated and fully implemented during the fiscal year ended December 31, 2013 and unaudited consolidated financial statements for the quarters ended March 31, 2014 and June 30, 2014 erroneously omitted a $1.4 million tax effectfourth quarter of a 2013 year-end transaction by one of our Reading Australia subsidiaries. Properly included,2015. In this context, we have instituted additional processes to bolster these controls including strengthening the tax effect would have resulteddepartment and retaining a Big Four accounting firm to assist in an increase in our deferred tax assetthe review of taxation matters on a quarterly and total assets and a corresponding increase in our other consolidated income and total liabilities and shareholders’ equity, but would not have had a material effect on our financial condition or results of operations as reflected in our prior financial statements.
In light of the foregoing, our management concluded that our disclosure controls and procedures were not effective to ensure that the tax effect of transactions in our foreign jurisdictions was reported. As a means of remedying the material weakness and improving our controls and procedures, we have determined to engage tax advisors to support our accounting for taxes in countries in which we have no employees experienced in tax matters.annual basis.
Changes in Internal Control over Financial Reporting
No change in our internal control over financial reporting (as defined in Rule 13a-15(f) and 15d-15(f) under the Exchange Act) occurred during the quarter ended September 30, 20142015 that has materially affected, or is reasonably likely to materially affect, our internal control over financial reporting.
PART II – OtherOther Information
Item 1 – Legal Proceedings
On June 12, 2015, the Board of Directors terminated James J. Cotter, Jr. as the President and Chief Executive Officer of our Company. That same day, Mr. Cotter, Jr. filed a lawsuit, styled as both an individual and a derivative action, and titled “James J. Cotter, Jr., individually and derivatively on behalf of Reading International, Inc. vs. Margaret Cotter, et al.” Case No,: A-15-719860-V, Dept XI (the “Cotter Jr. Derivative Action” and the “Cotter, Jr. Complaint,” respectively) against the Company and each of our other then sitting directors (Ellen Cotter, Margaret Cotter, Guy Adams, William Gould, Edward Kane, Douglas McEachern, and Tim Storey: the “Defendant Directors”) in the Eighth Judicial District Court of the State of Nevada for Clark County (the “Nevada District Court”). The lawsuit alleges, among other things, that the Defendant Directors breached their fiduciary duties in taking the actions to terminate Mr. Cotter, Jr. as President and Chief Executive Officer of the Company.
In a derivative action, the stockholder plaintiff seeks damages or other relief for the benefit of the corporation, and not for the stockholder plaintiff’s individual benefit. Accordingly, the Company is, at least in theory, only a nominal defendant in such a derivative action. However, as a practical matter, because Mr. Cotter, Jr. is also seeking an order that our board’s determination to terminate Mr. Cotter Jr. was ineffective and that he should be reinstated as the President and CEO of the Company (an injunctive remedy that would be binding on the Company), our Company is incurring significant cost and expense defending the decision to terminate Mr. Cotter, Jr. as President and Chief Executive Officer. Also, the Company continues to incur costs promulgating and responding to discovery demands and satisfying indemnity obligations to the Defendant Directors.
Our directors and officers liability insurer is providing insurance coverage, subject to a $500,000 deductible and its standard reservation of rights, with respect to the defense of the Director Defendants. Our former director, Tim Storey, retired as a director on October 11, 2015, but continues to be a defendant in the Cotter, Jr. Derivative Action. Our new directors, Dr. Judy Codding and Mr. Michael Wrotniak, are not named in the Cotter Jr. Derivative Action as they were not directors at the time of the breaches of fiduciary duty alleged by Mr. Cotter, Jr.
Pursuant to the terms of Mr. Cotter Jr.’s employment agreement with the Company, disputes relating to his employment are to be arbitrated. Accordingly, on July 14, 2015, the Company filed an arbitration demand with the American Arbitration Association against Mr. Cotter, Jr. The demand seeks declaratory relief, among other things, that Mr. Cotter, Jr.'s employment and employment agreement with the Company have been validly terminated and that the Board of Directors validly removed him from his positions as Chief Executive Officer and President of the Company and positions with the Company’s subsidiaries.
Mr. Cotter, Jr. has filed a counter-complaint in the arbitration, asserting claims for breach of his employment contract, declaratory relief, and contractual indemnification. On October 21, 2015, Mr. Cotter, Jr clarified his counter-complaint, to state that he “is not presently seeking damages for the act of RDI's purported termination of his employment agreement and for the act of RDI's purporting to sever its employment relationship with James Jr. Rather, James Jr. is seeking damages for the cessation of severance payments and benefits, and damages on account of RDI's failure to perform its indemnification obligations.” Accordingly, it is the Company’s understanding that Mr. Cotter, Jr. is conceding in the arbitration that the Company was within its legal rights to terminate Mr. Cotter, Jr. without establishing any cause for such termination. On October 16, 2015, Mr. Cotter, Jr. filed a motion to stay the arbitration pending the resolution of the Cotter Jr. Derivative Action. On October 30, 2015, the Company filed an opposition to Mr. Cotter, Jr.’s motion to stay. No hearing on this issue has been scheduled.
On August 6, 2015, the Company received notice that a Motion to Intervene in the Cotter Jr Derivative Action and that a proposed derivative complaint had been filed in the Nevada District Court captioned T2 Partners Management, LP, a Delaware limited partnership, doing business as Kase Capital Management; T2 Accredited Fund, LP, a Delaware limited partnership, doing business as Kase Fund; T2 Qualified Fund, LP, a Delaware limited partnership, doing business as Kase Qualified Fund; Tilson Offshore Fund, Ltd, a Cayman Islands exempted company; T2 Partners Management I, LLC, a Delaware limited liability company, doing business as Kase Management: T2 Partners Management Group, LLC, a Delaware limited liability company, doing business as Kase Group; JMG Capital Management, LLC, a Delaware limited liability company, Pacific Capital Management, LLC, a Delaware limited liability company, derivatively on behalf of Reading International, Inc. vs. Margaret Cotter, Ellen Cotter, Guy Adams, Edward Kane, Douglas McEachern, Timothy Storey, William Gould and Does 1 through 100, inclusive, as defendants, and, Reading International, Inc., a Nevada corporation, as Nominal Defendant (the “T2 Derivative Action” ). On August 11, 2015, the Court granted the motion of T2 Partners Management, LP et. al. (the “T2 Plaintiffs”), allowing these plaintiffs to file their complaint (the “T2 Derivative Complaint”).
The T2 Plaintiffs allege various violations of fiduciary duty, abuse of control, gross mismanagement and corporate waste by the defendant directors. More specifically the T2 Derivative Complaint seeks certain monetary damages, as well as equitable and expedited injunctive relief, attorney fees and costs of suit. Once again, the Company has been named as a nominal defendant. However, because the T2 Derivative Complaint also seeks the reinstatement of Mr. Cotter, Jr., as our President and CEO, it is being defended by the Company. In addition, the Company continues to incur costs promulgating and responding to discovery demands and satisfying indemnity obligations to the Defendant Directors. The Defendant Directors are the same as named in the Cotter Jr. Derivative Action and the cost of their defense is likewise being covered by our directors and officer’s liability insurance carrier with the same reservations of right as in the Cotter Jr. Derivative Action, but without any separate deductible.
On August 3, 2015, Mr. Cotter, Jr. filed a motion for preliminary injunction together with a motion to expedite discovery. The T2 Plaintiffs joined in this these motions. On August 11, 2015, the Court granted in part Mr. Cotter’s Motion to Expedite Discovery.
On September 9, 2015, certain of the Defendant Director filed a Motion to Dismiss the T2 Derivative Complaint. The Company joined this Motion to Dismiss on September 14, 2015. The hearing on this Motion to Dismiss was vacated as the T2 Plaintiffs voluntarily withdrew the T2 Derivative Complaint, with the parties agreeing that T2 Plaintiffs would have leave to amend the Complaint. As of the date of this report, no amended complaint has been filed by the T2 Plaintiffs. Accordingly, at the present time, the Company is not certain as to what the amended complaint will allege or what remedies will be sought or even whether any amended complaint will be filed.
On October 22, 2015, Mr. Cotter, Jr. filed an amended complaint removing all of his individual claims, and purporting to be purely derivative in nature (the “Cotter, Jr. Amended Derivative Complaint”), and which included certain new allegations relating, among other things, to the exercise of stock options held by his father’s estate to acquire additional shares of Class B Voting Stock, and certain alleged misrepresentations in the Company’s proxy materials. The Cotter, Jr. Amended Derivative Complaint continues to seek reinstatement of Mr. Cotter, Jr. as the Company’s President and Chief Executive Officer and to collect unspecified derivative damages. The Company anticipates filing a motion to dismiss the Cotter, Jr. Amended Derivative Complaint based on Mr. Cotter, Jr.’s failure to adequately plead damages.
On October 29, 2015, a status conference was held with respect to the derivative cases. Counsel for Mr. Cotter, Jr., represented in open court that the only claims he intended to pursue were derivative in nature. At the hearing, the Court terminated expedited discovery and took the request for injunctive relief by Mr. Cotter, Jr. and the T2 Plaintiff’s off calendar. The Court ordered that discovery continue in the ordinary course and set a tentative trial date for November 2016.
In summary, with respect to the arbitration: Mr. Cotter, Jr. has withdrawn his claim that the Company had no right to terminate his employment without cause and seeks only recovery of his severance payments, performance of certain indemnification obligations and attorney’s fees. The Company seeks a determination that it has no obligation to pay Mr. Cotter, Jr. any severance benefits and to recover attorney’s fees and damages. With respect to the derivative cases, expedited discovery has been terminated and no preliminary injunction hearing is pending. Discovery is progressing in the ordinary course, and it is currently anticipated that the matter will not go to trial before late next year. Mr. Cotter, Jr. has filed an amended derivative complaint, removing all individual claims, but continues to seek reinstatement as the Company’s president and chief executive officer. The T2 Plaintiffs have voluntarily withdrawn their complaint in the face of the then pending Motion to Dismiss, and have not refiled the complaint as of the date of this report.
The Company believes that the claims set forth in the Cotter Jr. Amended Derivative Complaint and in the now withdrawn T2 Complaint are entirely without merit and seek equitable remedies for which no relief can be given. The Company intends to defend vigorously against any attempt to reinstate Mr. Cotter, Jr. as President and Chief Executive Officer or to effect changes in the rights of our Company’s stockholders, and the Defendant Directors intend to defend vigorously against any claims that they have breached any fiduciary duties or are liable to the Company for damages.
In April, 2015, Liberty Theatres, LLC, a wholly owned subsidiary of the Company (“Liberty”) commenced an American Arbitration Association arbitration proceeding (Case No.:) against The Stomp Company Limited Partnership (the “Producers”) in response to the Producers’ purported termination of their license agreement with Liberty. Liberty seeks specific performance, injunctive and declaratory relief and damages. The Producers have counterclaimed for unspecified damages alleging that Liberty has interfered with the Producer’s endeavors to move the show to another Off-Broadway theater. The arbitration is ongoing. The Company believes that Liberty’s position is well-founded and that it should prevail.
For a description of other legal proceedings, please refer to Item 3 entitled Legal Proceedings contained in the Company’s Annual Report on Form 10-K for the year ended December 31, 2013.2014.
Item 1A – Risk Factors
There have been no material changes in risk factors as previously disclosed in our annual report on Form 10-K filed on March 7, 201416, 2015 with the SEC for the fiscal year ended December 31, 2013.2014.
Item 2 – Unregistered Sales of Equity Securities and Use of Proceeds
For a description of grants of stock to certain executives, see the Stock Based Compensation section under see Note 2 – Equity and Stock-Based Compensation to our Condensed Consolidated Financial Statements.
Item 3 – Defaults upon Senior Securities
None.
Item 5 – Other Information
On August 7, 2014,June 12, 2015, the Company announced the termination of James J. Cotter, Sr. advised the Board of Directors that, due to health reasons, he was resigning, effective immediately,Jr. as our Company’s ChairmanPresident and Chief Executive Officer, and as a director. Theeffective immediately. Effective June 12, 2015, our Board of Directors has elected James J.appointed Ellen M. Cotter Jr. to serve as our newinterim President and Chief Executive Officer, Ellen Marie Cotter to serve as our new Chairman, and Margaret Cotter to serve as our new Vice Chairman. Mr.succeeding James J. Cotter,Cotter. Jr. The Company has resigned his position as Vice Chairman butengaged the assistance of a leading executive search firm to identify a permanent President and Chief Executive Officer, which will continue to serve as our President.
Mr. Andrzej Matyczynski has agreed to extend his current September 1, 2014 retirement date for three months, until December 1, 2014. During this period, he will serve as our Chief Financial Officer until a successor has been retained. Thereafter, he will assist in the transitioning of this office.
Ellen Marie Cotter, Margaret Cotterconsider both internal and James J. Cotter, Jr. are the children of James J. Cotter, Sr. and have advised us that they consider their interest in our Company to be a long term family asset and that they intend to continue the Company in the direction established by their father--- as a motion picture exhibition and real estate company.external candidates.
Ellen Cotter is currently the head of our Domestic Cinema Operations. She joined our Company in 1998 and has been a director since 2013.
Margaret Cotter has been a director since 2002 and has been President of our live theaters and manages the real estate which houses each of the four live theaters since 2000. She heads the day-to-day pre-development process and transition of our properties from theatre operations to major realty developments which currently include the Union Square and Cinemas 123 properties.
James J. Cotter, Jr. was initially elected to the Board in 2002, served from 2007, until his resignation on August 7, 2014, as Vice Chairman to assume the duties of CEO, and continues to serve as the President of our Company. Further information about Mr. Cotter, Jr.’s business history and related party transactions involving our Company and the Cotter family is set forth in our Proxy Materials filed on Schedule 14A for our 2014 Annual Meeting of Stockholders, and incorporated by reference herein. There are no related party transactions between our company and Mr. Cotter, Jr. other than the employment contract relating to his services as President, filed as Exhibit 10.2 to our Company’s report on form 10Q for the Period ended June 30, 2013 and incorporated by reference as exhibit 10.34 to our Company’s report on form 10K for the period ended December 31, 2013.
We are advised by Ellen Cotter, James J. Cotter, Jr. and Margaret Cotter, that they intend to recommend to the Board of Directors that, going forward, the position of Chairman be rotated among them, depending upon their respective availabilities and workloads.
Item 6 – Exhibits
| |
3.15.03
| Amendment to the Amended Articleand Restated Bylaws of IncorporationReading International, Inc. |
10.1 | John Hunter Separation Agreement
|
10.2
| James J Cotter, Jr. Employment Agreement between Reading International Inc. and William D. Ellis, General Counsel
|
31.1 | Certification Pursuant to Section 302 of the Sarbanes-Oxley Act of 2002, filed herewith. |
31.2 | Certification Pursuant to Section 302 of the Sarbanes-Oxley Act of 2002, filed herewith. |
32 | Certifications Pursuant to Section 906 of the Sarbanes-Oxley Act of 2002, filed herewith. |
101.INS | XBRL Instance Document |
101.SCH | XBRL Taxonomy Extension Schema |
101.CAL | XBRL Taxonomy Extension Calculation |
101.DEF | XBRL Taxonomy Extension Definition |
101.LAB | XBRL Taxonomy Extension Labels |
101.PRE | XBRL Taxonomy Extension Presentation |
SIGNATURES
Pursuant to the requirements of the Securities Exchange Act of 1934, the Registrant has duly caused this report to be signed on its behalf by the undersigned thereunto duly authorized.
READING INTERNATIONAL, INC.
Date:November 12, 20145, 2015
By: /s/ James J.Ellen M. Cotter Jr.
James J.Ellen M. Cotter Jr.
Chief Executive Officer
Date:November 12, 20145, 2015
By: /s/ Andrzej MatyczynskiDevasis Ghose
Andrzej MatyczynskiDevasis Ghose
Chief Financial Officer
EXHIBIT 31.1
CERTIFICATIONS
PURSUANT TO SECTION 302 OF THE SARBANES-OXLEY ACT OF 2002
I, James J. Cotter, Jr., certify that:
| 1)
| | I have reviewed this quarterly report on Form 10-Q of Reading International, Inc.;
|
| 2)
| | Based on my knowledge, this quarterly report does not contain any untrue statement of a material fact or omit to state a material fact necessary to make the statements made, in light of the circumstances under which such statements were made, not misleading with respect to the period covered by this quarterly report;
|
| 3)
| | Based on my knowledge, the financial statements and other financial information included in this quarterly report fairly present in all material respects the financial condition, results of operations and cash flows of the registrant as of, and for, the periods presented in this quarterly report;
|
| 4)
| | The registrant's other certifying officer and I are responsible for establishing and maintaining disclosure controls and procedures (as defined in Exchange Act Rules 13a-15(e) and 15d-15(e)) and internal control over financial reporting (as defined in Exchange Act Rules 13a-15(f) and 15d-15(f)) for the registrant and we have:
|
| a)
| | designed such disclosure controls and procedures to ensure that material information relating to the registrant, including its consolidated subsidiaries, is made known to us by others within those entities, particularly during the period in which this quarterly report is being prepared;
|
| b)
| | designed such internal control over financial reporting, or caused such internal control over financial reporting to be designed under our supervision, to provide reasonable assurance regarding the reliability of financial reporting and the preparation of financial statements for external purposes in accordance with generally accepted accounting principles;
|
| c)
| | evaluated the effectiveness of the registrant's disclosure controls and procedures as of the end of the period covered by this report based on such evaluation; and
|
| d)
| | presented in this quarterly report our conclusions about the effectiveness of the disclosure controls and procedures based on our evaluation as of the Evaluation Date;
|
| 5)
| | The registrant's other certifying officer and I have disclosed, based on our most recent evaluation, to the registrant's auditors and the audit committee of registrant's board of directors (or persons performing the equivalent function):
|
| a)
| | all significant deficiencies in the design or operation of internal controls which could adversely affect the registrant's ability to record, process, summarize and report financial data and have identified for the registrant's auditors any material weaknesses in internal controls; and
|
| b)
| | any fraud, whether or not material, that involves management or other employees who have a significant role in the registrant's internal controls; and
|
| 6)
| | The registrant's other certifying officer and I have indicated in this quarterly report whether or not there were significant changes in internal controls or in other factors that could significantly affect internal controls subsequent to the date of our most recent evaluation, including any corrective actions with regard to significant deficiencies and material weaknesses.
|
By:/s/ James J. Cotter, Jr.
James J. Cotter, Jr.
Chief Executive Officer
November 12, 2014
EXHIBIT 31.2
CERTIFICATIONS
PURSUANT TO SECTION 302 OF THE SARBANES-OXLEY ACT OF 2002
I, Andrzej Matyczynski, certify that:
| 1)
| | I have reviewed this quarterly report on Form 10-Q of Reading International, Inc.;
|
| 2)
| | Based on my knowledge, this quarterly report does not contain any untrue statement of a material fact or omit to state a material fact necessary to make the statements made, in light of the circumstances under which such statements were made, not misleading with respect to the period covered by this quarterly report;
|
| 3)
| | Based on my knowledge, the financial statements and other financial information included in this quarterly report fairly present in all material respects the financial condition, results of operations and cash flows of the registrant as of, and for, the periods presented in this quarterly report;
|
| 4)
| | The registrant's other certifying officer and I are responsible for establishing and maintaining disclosure controls and procedures (as defined in Exchange Act Rules 13a-15(e) and 15d-15(e)) and internal control over financial reporting (as defined in Exchange Act Rules 13a-15(f) and 15d-15(f)) for the registrant and we have:
|
| a)
| | designed such disclosure controls and procedures to ensure that material information relating to the registrant, including its consolidated subsidiaries, is made known to us by others within those entities, particularly during the period in which this quarterly report is being prepared;
|
| b)
| | designed such internal control over financial reporting, or caused such internal control over financial reporting to be designed under our supervision, to provide reasonable assurance regarding the reliability of financial reporting and the preparation of financial statements for external purposes in accordance with generally accepted accounting principles;
|
| c)
| | evaluated the effectiveness of the registrant's disclosure controls and procedures as of the end of the period covered by this report based on such evaluation; and
|
| d)
| | presented in this quarterly report our conclusions about the effectiveness of the disclosure controls and procedures based on our evaluation as of the Evaluation Date;
|
| 5)
| | The registrant's other certifying officer and I have disclosed, based on our most recent evaluation, to the registrant's auditors and the audit committee of registrant's board of directors (or persons performing the equivalent function):
|
| a)
| | all significant deficiencies in the design or operation of internal controls which could adversely affect the registrant's ability to record, process, summarize and report financial data and have identified for the registrant's auditors any material weaknesses in internal controls; and
|
| b)
| | any fraud, whether or not material, that involves management or other employees who have a significant role in the registrant's internal controls; and
|
| 6)
| | The registrant's other certifying officer and I have indicated in this quarterly report whether or not there were significant changes in internal controls or in other factors that could significantly affect internal controls subsequent to the date of our most recent evaluation, including any corrective actions with regard to significant deficiencies and material weaknesses.
|
By:/s/ Andrzej Matyczynski
Andrzej Matyczynski
Chief Financial Officer
November 12, 2014
EXHIBIT 32
CERTIFICATION PURSUANT TO
18 U.S.C. SECTION 1350,
AS ADOPTED PURSUANT TO
SECTION 906 OF THE SARBANES-OXLEY ACT OF 2002
Each of the undersigned hereby certifies, in his capacity as an officer of Reading International, Inc. (the “Company”), for purposes of 18 U.S.C. Section 1350, as adopted pursuant to Section 906 of the Sarbanes-Oxley Act of 2002, that to the best of his knowledge:
| ·
| | The Quarterly Report of the Company on Form 10-Q for the period ended September 30, 2014 as filed with the Securities and Exchange Commission fully complies with the requirements of Section 13(a) and 15(d), as applicable, of the Securities Exchange Act of 1934; and
|
| ·
| | The information contained in such report fairly presents, in all material respects, the financial condition and results of operation of the Company.
|
A signed original of this written statement required by Section 906 has been provided to the Company and will be retained by the Company and furnished to the Securities and Exchange Commission or its staff upon request.
Dated: November 12, 2014
/s/ James J. Cotter, Jr.
Name:James J. Cotter, Jr.
Title:Chief Executive Officer
/s/ Andrzej Matyczynski
Name:Andrzej Matyczynski
Title:Chief Financial Officer
Exhibit 3.1
CERTIFICATE OF AMENDMENT AND RESTATEMENT
OF
ARTICLES OF INCORPORATION
OF
READING INTERNATIONAL, INC.
A Nevada Corporation
The undersigned hereby certifies as follows:
| 1.He is the duly elected and acting Secretary of Reading International, Inc., a Nevada corporation (the “Corporation”).
|
| 2.On March 7, 2013, the Board of Directors of the Corporation unanimously approved the amendment and restatement of the Corporation’s articles of incorporation (the “Articles”), pursuant to Section 78.385 of the Nevada Revised Statutes (“NRS”).
|
| 3.On May 16, 2013, upon the recommendation of the Board of Directors of the Corporation, the proposed amendment to the Articles was submitted to the stockholders of the Corporation. The stockholders of the Corporation’s $.01 par value Class B Voting common stock (“Class B Common Stock”) were entitled to vote on the amendment, with the amendment to the Articles requiring the affirmative vote of a majority of the outstanding Class B Common Stock. The holders of a majority of Class B Common Stock voted in favor of the amendment to Article IV to add Section 4.7, requiring the Corporation to obtain stockholder approval to engage in any transaction(s), involving the sale, issuance or potential issuance of the Corporation’s Class B Common Stock. The Corporation, having received the approval required for the amendment, incorporates the amended provision of the Articles in the Amended and Restated Articles of Incorporation attached hereto.
|
| 4.Article IV, Capital Stock, is hereby amended to include Section 4.7, such section to read in full as follows:
|
4.7Certain Issuances of Preferred Stock. The Corporation shall not, without the approval or ratification of the holders of a majority of the outstanding shares of Class B Voting Common Stock, engage in any transaction or series of related transactions, involving the sale, issuance or potential issuance by the Corporation of shares of any class of Preferred Stock (or securities convertible into or exchangeable for shares of any class of Preferred Stock) having voting rights, other than voting rights with respect to the approval of any change in the rights, privileges or preferences of such class of Preferred Stock.
| 1.The Corporation’s Articles are hereby amended and restated to read in full as follows:
|
AMENDED AND RESTATED
ARTICLES OF INCORPORATION
OF
READING INTERNATIONAL, INC.
A NEVADA CORPORATION
ARTICLE I
NAME
The name of the corporation is Reading International, Inc. (the “Corporation”).
ARTICLE II
RESIDENT AGENT AND REGISTERED OFFICE
This section was intentionally omitted.
ARTICLE III
PURPOSE
The purpose of the Corporation is to engage in any lawful act or activity for which corporations may be organized under the NRS.
ARTICLE IV
CAPITAL STOCK
4.1Number of Authorized Shares; Par Value. The aggregate number of shares which the Corporation shall have authority to issue is one hundred forty million (140,000,000) shares to be designated respectively as “Class A Non-Voting Common Stock,” “Class B Voting Common Stock” and “Preferred Stock” divided as follows:
| (a)
| | Class A Non-Voting Common Stock. The total number of authorized shares of Class A Non-Voting Common Stock shall be one hundred million (100,000,000) shares with the par value of $.01 per share.
|
| (b)
| | Class B Voting Common Stock. The total number of authorized shares of Class B Voting Common Stock shall be twenty million (20,000,000) shares with the par value of $.01 per share.
|
| (c)
| | Preferred Stock. The total number of authorized shares of Preferred Stock shall be twenty million (20,000,000) shares with the par value of $.01 per share.
|
| (d)
| | Increase or Decrease in Authorized Shares. The total number of authorized shares of Class A Non-Voting Common Stock, Class B Voting Common Stock or Preferred Stock may be increased or decreased (but not below the number of shares thereof then outstanding) by the affirmative vote of the holders of a majority of the stock of the Corporation entitled to vote.
|
| 4.2Class A Non-Voting Common Stock Voting Rights. Class A Non-Voting Common Stock shall have no voting rights; provided, however, that the holders of the Class A Non-Voting Common Stock will be entitled to vote as a separate class on any amendments to the Articles of Incorporation or any merger which would adversely affect their rights, privileges or preferences, or any liquidation or dissolution in which such holders would receive securities with rights, privileges or preferences less beneficial than those held by them as holders of Class A Non-Voting Common Stock.
|
| 4.3Class B Voting Common Stock Voting Rights. The holders of the Class B Voting Common Stock shall be entitled to one vote per one share of Class B Voting Common Stock on all matters submitted to the stockholders of the Corporation for a vote.
|
| 4.4Other Rights, Preferences and Privileges of Class A Non-Voting Common Stock and Class B Voting Common Stock. Except as otherwise specifically set forth herein with respect to voting, all shares of Class A Non-Voting Common Stock and Class B Voting Common Stock shall have the same rights, preferences and privileges with respect to dividends, distributions, or any liquidation or dissolution of the Corporation.
|
| 4.5Preferred Stock. The Preferred Stock may be issued at any time or from time to time, in any one or more series, and any such series shall be comprised of such number of shares and may have such voting powers, whole or limited, or no voting powers, and such designations, preferences and relative, participating, optional or other special rights and qualifications, limitations or restrictions thereof, including liquidation preferences, as shall be stated and expressed in the resolution or resolutions of the board of directors of the Corporation, the board of directors being hereby expressly vested with such power and authority to the full extent now or hereafter permitted by law.
|
| 4.6Certain Issuances of Class B Voting Common Stock. The Corporation shall not, without the approval or ratification of the holders of a majority of the outstanding shares of Class B Voting Common Stock, engage in any transaction, or series of related transactions, involving the sale, issuance or potential issuance by the Corporation of shares of Class B Voting Common Stock (or securities convertible into or exchangeable for shares of Class B Voting Common Stock) equal to 5% or more of the shares of Class B Voting Common Stock as of the date of such sale or issuance; provided, however, that this Section 4.6 shall not apply to the sale or issuance of shares of Class B Voting Common Stock pursuant to the exercise of stock options outstanding as of the date this Section 4.6 is made part of the Amended and Restated Articles of Incorporation of the Corporation.
|
4.7. Certain Issuances of Preferred Stock: The Corporation shall not, without the approval or ratification of the holders of a majority of the outstanding shares of Class B Voting Common Stock, engage in any transaction or series of related transactions, involving the sale, issuance or potential issuance by the Corporation of shares of any class of Preferred Stock (or securities convertible into or exchangeable for shares of any class of Preferred Stock) having voting rights, other than voting rights with respect to the approval of any change in the rights, privileges or preferences of such class of Preferred Stock.
ARTICLE V
DIRECTORS
The business and affairs of the Corporation shall be managed by or under the direction of the board of directors, which initially shall consist of one director. Provided that the Corporation has at least one director, the number of directors may at any time or times be increased or decreased as provided in the bylaws; provided, however that the number of directors shall not exceed ten.
ARTICLE VI
BYLAWS
In furtherance and not in limitation of the powers conferred upon the board of directors of the Corporation by the NRS, the board of directors shall have the power to alter, amend, change, add to and repeal, from time to time, the bylaws of the Corporation, subject to the rights of the stockholders entitled to vote with respect thereto to alter, amend, change, add to and repeal the bylaws adopted by the directors of the Corporation.
ARTICLE VII
ELECTION OF DIRECTORS
Unless the bylaws of the Corporation provide for the division of the directors into classes and except as may otherwise be provided in the bylaws of the Corporation, all directors shall be elected to hold office until their respective successors are elected and qualified, or until their earlier resignation or removal, at the annual meeting of the stockholders, whether telephonic or not, within or without the State of Nevada or by written consent and such election need not be by written ballot.
ARTICLE VIII
SALE OF ASSETS
In furtherance of the powers conferred on the stockholders of the Corporation by the NRS, the stockholders of the Corporation shall have the power to vote on any proposed sale of substantially all of the Corporation’s assets.
ARTICLE IX
AMENDMENT OF ARTICLES OF INCORPORATION
In the event the board of directors of the Corporation determines that it is in the Corporation’s best interest to amend these Articles of Incorporation, the board of directors shall adopt a resolution setting forth the proposed amendment and declaring its advisability and submit the matter to the stockholders entitled to vote thereon for the consideration thereof in accordance with the provisions of the NRS and these Articles of Incorporation. In the resolution setting forth the proposed amendment, the board of directors may insert a provision allowing the board of directors to later abandon the amendment, without concurrence by the stockholders, after the amendment has received stockholder approval but before the amendment is filed with the Nevada Secretary of State.
ARTICLE XI
ACQUISITIONS OF CONTROLLING INTEREST
The Corporation elects not to be governed by the provisions of Chapters 78.378 to 78.3793, inclusive, of the NRS pertaining to acquisitions of controlling interest.
ARTICLE XII
COMBINATIONS WITH INTERESTED STOCKHOLDERS
The Corporation elects not to be governed by the provisions of Chapters 78.411 to 78.444, inclusive, of the NRS pertaining to combinations with interested stockholders.
ARTICLE XIII
DIRECTORS’ AND OFFICERS’ LIABILITY
A director or officer of the Corporation shall not be personally liable to this Corporation or its stockholders for damages for breach of fiduciary duty as a director or officer, but this Article shall not eliminate or limit the liability of a director or officer for (i) acts or omissions which involve intentional misconduct, fraud or a knowing violation of law or (ii) the unlawful payment of distributions. Any repeal or modification of this Article by the stockholders of the Corporation shall be prospective only, and shall not adversely affect any limitation on the personal liability of a director or officer of the Corporation for acts or omissions prior to such repeal or modification.
In Witness Whereof, the undersigned has executed this Certificate of Amendment and Restatement as of the 27th day of June, 2014.
_/s/ James J. Cotter_____________________________
James J. Cotter, Jr., President