UNITED STATES
SECURITIES AND EXCHANGE COMMISSION
Washington, D.C. 20549
_____________________________________________________
FORM 10-Q
(Mark One)
☑
|
|
þ | QUARTERLY REPORT PURSUANT TO SECTION 13 OR 15(D) OF THE SECURITIES EXCHANGE ACT OF 1934 |
For the quarterly period ended: SeptemberJune 30, 20192020
OR
☐
|
|
¨ | TRANSITION REPORT PURSUANT TO SECTION 13 OR 15(D) OF THE SECURITIES EXCHANGE ACT OF 1934 |
For the transition period from ___________ to ___________
Commission file number 1-8625

READING INTERNATIONAL, INC.
(Exact name of Registrant as specified in its charter)
NEVADA
(
|
|
Nevada State or other jurisdiction of incorporation or organization) | 95-3885184 (IRS Employer Identification No.)Number) |
5995 Sepulveda Boulevard, Suite 300 Culver City, CA (Address of principal executive offices) |
90230 (Zip Code) |
Registrant’s telephone number, including area code: (213) 235-2240
Securities registered pursuant to Section 12(b) of the Act:
|
|
|
|
|
Title of each class |
| Trading Symbol(s)Symbol |
| Name of each exchange on which registered |
Class A Nonvoting Common Stock, $0.01 par value |
| RDI |
| The Nasdaq Stock Market LLCNASDAQ
|
Class B Voting Common Stock, $0.01 par value |
| RDIB |
| The Nasdaq Stock Market LLCNASDAQ
|
Indicate by check mark whether the registrant:registrant (1) has filed all reports required to be filed by Section 13 or 15(d) of the Securities Exchange Act of 1934 during the preceding twelve12 months (or for such shorter period that the registrant was required to file such reports), and (2) has been subject to such filing requirements for the past 90 days. Yes ☑þ No ☐¨
Indicate by check mark whether the registrant has submitted electronically every Interactive Data File required to be submitted and posted pursuant to Rule 405 of Regulation S-T (§ 232.405 of this chapter) during the preceding 12 months (or for such shorter period that the registrant was required to submit and post such files). Yes ☑þ No ☐¨
Indicate by check mark whether the registrant is a large accelerated filer, an accelerated filer, a non-accelerated filer, a smaller reporting company, or an emerging growth company. See definitions of “large accelerated filer”,filer,” “accelerated filer”,filer,” “smaller reporting company,” and “emerging growth company” in Rule 12b-2 of the Exchange Act.
Large accelerated filer ☐ Accelerated filer ☑ Non-accelerated filer ☐Filer ¨ Accelerated Filer þ Non-Accelerated Filer ¨ Smaller reporting company ☐Emerging growth company ☐Reporting Company ¨ Emerging Growth Company ¨
If an emerging growth company, indicate by check mark if the registrant has elected not to use the extended transition period for complying with any new or revised financial accounting standards provided pursuant to Section 13(a) of the Exchange Act. ☐¨
Indicate by check mark whether the registrant is a shell company (as defined in Rule 12b-2 of the Exchange Act). Yes ☐¨ No ☑þ
Indicate the number of shares outstanding of each of the issuer’s classes of common stock, as of the latest practicable date. As of November 8, 2019August 7, 2020, there were 20,404,57320,067,635 shares of Class A Nonvoting Common Stock, $0.01 par value per share and 1,680,590 shares of Class B Voting Common Stock, $0.01 par value per share outstanding.
READING INTERNATIONAL, INC. AND SUBSIDIARIES
TABLE OF CONTENTS
PART 1 – FINANCIAL INFORMATION
Item 1 - Financial Statements
READING INTERNATIONAL, INC.
CONSOLIDATED BALANCE SHEETS
(U.S. dollars in thousands, except share information)
| | | | |
|
|
|
|
| | | | | | |
|
|
|
|
|
|
| | September 30, | | December 31, |
| June 30, |
| December 31, |
| | 2019 | | 2018 |
| 2020 |
| 2019 |
ASSETS | | (unaudited) | | | |
| (unaudited) |
|
|
|
Current Assets: | | | | | | |
|
|
|
|
|
|
Cash and cash equivalents | | $ | 8,708 | | $ | 13,127 |
| $ | 40,364 |
| $ | 12,135 |
Receivables | | 4,363 | | 8,045 |
| 3,255 |
| 7,085 |
Inventory | | 1,195 | | 1,419 |
| 1,204 |
| 1,674 |
Prepaid and other current assets | | 10,831 | | 7,667 |
| 12,630 |
| 6,105 |
Total current assets | | | 25,097 | | | 30,258 |
|
| 57,453 |
|
| 26,999 |
Operating property, net | | 248,100 | | 257,667 |
|
| 247,330 |
| 258,138 |
Operating lease right-of-use assets | | 216,963 | | — |
|
| 217,692 |
| 229,879 |
Investment and development property, net | | 107,292 | | 86,804 |
|
| 119,667 |
| 114,024 |
Investment in unconsolidated joint ventures | | 4,721 | | 5,121 |
|
| 4,556 |
| 5,069 |
Goodwill | | 19,913 | | 19,445 |
|
| 26,008 |
| 26,448 |
Intangible assets, net | | 3,607 | | 7,369 |
|
| 4,549 |
| 4,320 |
Deferred tax asset, net | | 25,959 | | 26,235 |
|
| 3,386 |
| 3,444 |
Other assets | | | 6,164 | | | 6,129 |
|
| 7,109 |
|
| 6,668 |
Total assets | | $ | 657,816 | | $ | 439,028 |
| $ | 687,750 |
| $ | 674,989 |
LIABILITIES AND STOCKHOLDERS' EQUITY | | | | | | |
|
|
|
|
|
|
Current Liabilities: | | | | |
|
|
|
|
Accounts payable and accrued liabilities | | $ | 24,318 | | $ | 26,154 |
| $ | 28,179 |
| $ | 29,436 |
Film rent payable | | 6,430 | | 8,661 |
| 1,551 |
| 8,716 |
Debt - current portion | | 34,374 | | 30,393 |
| 40,331 |
| 36,736 |
Subordinated debt - current portion | |
| 644 |
| 644 |
Derivative financial instruments - current portion | | 105 | | 41 |
| 218 |
| 109 |
Taxes payable - current | | 611 | | 1,710 |
| 1,855 |
| 140 |
Deferred current revenue | | 6,406 | | 9,264 |
| 9,128 |
| 11,324 |
Operating lease liabilities - current portion | | 19,579 | | — |
| 21,091 |
| 20,379 |
Other current liabilities | | | 9,339 | | | 9,305 |
|
| 9,400 |
|
| 3,653 |
Total current liabilities | | | 101,162 | | | 85,528 |
|
| 112,397 |
|
| 111,137 |
Debt - long-term portion | | 131,681 | | 106,286 |
| 203,650 |
| 140,602 |
Derivative financial instruments - non-current portion | | 291 | | 145 |
| 329 |
| 233 |
Subordinated debt, net | | 26,255 | | 26,061 |
| 28,796 |
| 29,030 |
Noncurrent tax liabilities | | 11,647 | | 11,530 |
| 12,697 |
| 12,353 |
Operating lease liabilities - non-current portion | | 210,737 | | — |
| 210,560 |
| 223,164 |
Other liabilities | | | 12,330 | | | 28,931 |
|
| 13,735 |
|
| 18,854 |
Total liabilities | | | 494,103 | | | 258,481 |
|
| 582,164 |
|
| 535,373 |
Commitments and contingencies (Note 13) | | | | | | | |
Commitments and contingencies (Note 14) | |
|
| |
|
| |
Stockholders’ equity: | | | | |
|
|
|
|
Class A non-voting common stock, par value $0.01, 100,000,000 shares authorized, | | | | |
|
|
|
|
32,963,489 issued and 20,404,573 outstanding at September 30, 2019 and 33,112,337 issued and 21,194,748 outstanding at December 31, 2018 | | | 231 | | 232 | |
33,003,745 issued and 20,067,635 outstanding at June 30, 2020 and 32,963,489 issued and 20,102,535 outstanding at December 31, 2019 | |
|
| 231 |
| 231 |
Class B voting common stock, par value $0.01, 20,000,000 shares authorized and | | | | |
|
|
|
|
1,680,590 issued and outstanding at September 30, 2019 and December 31, 2018 | | 17 | | 17 | |
Nonvoting preferred stock, par value $0.01, 12,000 shares authorized and no issued | | | | | |
or outstanding shares at September 30, 2019 and December 31, 2018 | | — | | — | |
1,680,590 issued and outstanding at June 30, 2020 and December 31, 2019 | |
| 17 |
| 17 |
Nonvoting preferred stock, par value $0.01, 12,000 shares authorized and 0 issued | |
|
|
|
|
or outstanding shares at June 30, 2020 and December 31, 2019 | |
| — |
| — |
Additional paid-in capital | | 148,236 | | 147,452 |
| 149,266 |
| 148,602 |
Retained earnings | | 48,859 | | 47,616 | |
Retained earnings/(deficits) | |
| (7,930) |
| 20,647 |
Treasury shares | | (36,541) | | (25,222) |
| (40,407) |
| (39,737) |
Accumulated other comprehensive income | | | (1,288) | | | 6,115 |
|
| 417 |
|
| 5,589 |
Total Reading International, Inc. stockholders’ equity | | | 159,514 | | | 176,210 |
|
| 101,594 |
|
| 135,349 |
Noncontrolling interests | | | 4,199 | | | 4,337 |
|
| 3,992 |
|
| 4,267 |
Total stockholders’ equity | | | 163,713 | | | 180,547 |
|
| 105,586 |
|
| 139,616 |
Total liabilities and stockholders’ equity | | $ | 657,816 | | $ | 439,028 |
| $ | 687,750 |
| $ | 674,989 |
See accompanying Notes to the Unaudited Consolidated Financial Statements.
READING INTERNATIONAL, INC.
CONSOLIDATED STATEMENTS OF INCOME
(Unaudited; U.S. dollars in thousands, except per share data)
| | | | | | | | |
|
|
|
|
|
|
|
|
| | | | | | | | | | | | |
|
|
|
|
|
|
|
|
|
|
|
|
| | Quarter Ended | | Nine Months Ended |
| Quarter Ended |
| Six Months Ended |
| | September 30, | | September 30, |
| June 30, |
| June 30, |
| | 2019 | | 2018 | | 2019 | | 2018 |
| 2020 |
| 2019 |
| 2020 |
| 2019 |
Revenue | | | | | | | | | | | | |
|
|
|
|
|
|
|
|
|
|
|
|
Cinema | | $ | 66,733 | | 70,671 | | $ | 197,101 | | $ | 223,109 |
| $ | 1,217 |
| 72,296 |
| $ | 47,527 |
| $ | 130,223 |
Real estate | | | 3,723 | | | 3,590 | | | 11,001 | | | 11,286 |
|
| 2,205 |
|
| 3,713 |
|
| 5,123 |
|
| 7,278 |
Total revenue | | | 70,456 | | | 74,261 | | | 208,102 | | | 234,395 |
|
| 3,422 |
|
| 76,009 |
|
| 52,650 |
|
| 137,501 |
Costs and expenses | | | | | | | | | | | | |
|
|
|
|
|
|
|
|
|
|
|
|
Cinema | | (53,709) | | (54,929) | | (158,273) | | (170,183) |
| (13,660) |
| (56,235) |
| (55,952) |
| (104,564) |
Real estate | | (2,225) | | (2,475) | | (7,108) | | (7,408) |
| (1,589) |
| (2,438) |
| (4,349) |
| (4,883) |
Depreciation and amortization | | (5,704) | | (5,829) | | (16,870) | | (16,705) |
| (5,266) |
| (5,572) |
| (10,537) |
| (11,166) |
General and administrative | | (5,908) | | (6,489) | | (18,426) | | (21,250) |
| (5,102) |
| (6,034) |
| (11,047) |
| (12,518) |
Total costs and expenses | | | (67,546) | | | (69,722) | | | (200,677) | | | (215,546) |
|
| (25,617) |
|
| (70,279) |
|
| (81,885) |
|
| (133,131) |
Operating income (loss) | | | 2,910 | | | 4,539 | | | 7,425 | | | 18,849 |
|
| (22,195) |
|
| 5,730 |
|
| (29,235) |
|
| 4,370 |
Interest expense, net | | (1,871) | | (1,748) | | (5,924) | | (5,132) |
| (2,004) |
| (2,204) |
| (3,797) |
| (4,054) |
Gain (loss) on sale of assets | | (1) | | — | | (1) | | — | |
Other income (expense) | | | 141 | | | (130) | | | 190 | | | (273) |
|
| 19 |
|
| 71 |
|
| (196) |
|
| 50 |
Income (loss) before income tax expense and equity earnings of unconsolidated joint ventures | | | 1,179 | | | 2,661 | | | 1,690 | | | 13,444 |
|
| (24,180) |
|
| 3,597 |
|
| (33,228) |
|
| 366 |
Equity earnings of unconsolidated joint ventures | | | 220 | | | 80 | | | 581 | | | 667 |
|
| (274) |
|
| 327 |
|
| (195) |
|
| 361 |
Income (loss) before income taxes | | | 1,399 | | | 2,741 | | | 2,271 | | | 14,111 |
|
| (24,454) |
|
| 3,924 |
|
| (33,423) |
|
| 727 |
Income tax benefit (expense) | | | (547) | | | (1,482) | | | (1,159) | | | (4,618) |
|
| 1,567 |
|
| (1,630) |
|
| 4,580 |
|
| (573) |
Net income (loss) | | $ | 852 | | $ | 1,259 | | $ | 1,112 | | $ | 9,493 |
| $ | (22,887) |
| $ | 2,294 |
| $ | (28,843) |
| $ | 154 |
Less: net income (loss) attributable to noncontrolling interests | | | (50) | | | (38) | | | (103) | | | 88 |
|
| (185) |
|
| (37) |
|
| (266) |
|
| (53) |
Net income (loss) attributable to Reading International, Inc. common shareholders | | $ | 902 | | $ | 1,297 | | $ | 1,215 | | $ | 9,405 |
| $ | (22,702) |
|
| 2,331 |
| $ | (28,577) |
| $ | 207 |
Basic earnings (loss) per share attributable to Reading International, Inc. shareholders | | $ | 0.04 | | $ | 0.06 | | $ | 0.05 | | $ | 0.41 |
| $ | (1.04) |
|
| 0.10 |
| $ | (1.31) |
| $ | 0.01 |
Diluted earnings (loss) per share attributable to Reading International, Inc. shareholders | | $ | 0.04 | | $ | 0.06 | | $ | 0.05 | | $ | 0.41 |
| $ | (1.04) |
|
| 0.10 |
| $ | (1.31) |
| $ | 0.01 |
Weighted average number of shares outstanding–basic | | | 22,546,827 | | | 23,006,040 | | | 22,791,530 | | | 22,988,227 |
|
| 21,742,667 |
|
| 22,894,083 |
|
| 21,749,356 |
|
| 22,901,764 |
Weighted average number of shares outstanding–diluted | | | 22,688,230 | | | 23,197,924 | | | 22,952,838 | | | 23,185,021 |
|
| 22,095,136 |
|
| 23,059,733 |
|
| 22,102,215 |
|
| 23,074,673 |
See accompanying Notes to the Unaudited Consolidated Financial Statements.
READING INTERNATIONAL, INC.
CONSOLIDATED STATEMENTS OF COMPREHENSIVE INCOME
(Unaudited; U.S. dollars in thousands)
| | | | | | | | |
|
|
|
|
|
|
|
|
| | | | | | | | | | |
|
|
|
|
|
|
|
|
|
|
| | Quarter Ended | | Nine Months Ended |
| Quarter Ended |
| Six Months Ended |
| | September 30, | | September 30, |
| June 30, |
| June 30, |
| | 2019 | | 2018 | | 2019 | | 2018 |
| 2020 |
| 2019 |
| 2020 |
| 2019 |
Net income (loss) | | $ | 852 | | $ | 1,259 | | $ | 1,112 | | $ | 9,493 |
| $ | (22,887) |
| $ | 2,294 |
| $ | (28,843) |
| $ | 154 |
Foreign currency translation gain (loss) | | (6,598) | | (3,547) | | (7,355) | | (12,318) |
| 10,655 |
| (2,279) |
| (5,051) |
| (753) |
Gain (loss) on cash flow hedges | | (20) | | — | | (211) | | — |
| 10 |
| (122) |
| (205) |
| (191) |
Other | | | 51 | | | 53 | | 159 | | | 155 |
|
| 51 |
|
| 55 |
| 84 |
|
| 108 |
Comprehensive income (loss) | | | (5,715) | | | (2,235) | | (6,295) | | | (2,670) |
|
| (12,171) |
|
| (52) |
| (34,015) |
|
| (682) |
Less: net income (loss) attributable to noncontrolling interests | | (50) | | (38) | | (103) | | 88 |
| (185) |
| (37) |
| (266) |
| (53) |
Less: comprehensive income (loss) attributable to noncontrolling interests | | | (2) | | | (5) | | | (2) | | | (15) |
|
| (9) |
|
| (1) |
|
| (9) |
|
| — |
Comprehensive income (loss) attributable to Reading International, Inc. | | $ | (5,663) | | | (2,192) | | $ | (6,190) | | $ | (2,743) |
| $ | (11,977) |
|
| (14) |
| $ | (33,740) |
| $ | (629) |
See accompanying Notes to the Unaudited Consolidated Financial Statements.
READING INTERNATIONAL, INC.
CONSOLIDATED STATEMENTS OF CASH FLOWS
(Unaudited; U.S. dollars in thousands)
| | | | |
|
|
|
|
| | | | |
|
|
|
|
| | Nine Months Ended |
| Six Months Ended |
| | September 30, |
| June 30, |
| | 2019 | | 2018 |
| 2020 |
| 2019 |
Operating Activities | | | | | | |
|
|
|
|
|
|
Net income (loss) | | $ | 1,112 | | $ | 9,493 |
| $ | (28,843) |
| $ | 154 |
Adjustments to reconcile net income (loss) to net cash provided by operating activities: | | | | | |
|
|
|
|
|
Equity earnings of unconsolidated joint ventures | | | (581) | | (667) |
|
| 195 |
| (361) |
Distributions of earnings from unconsolidated joint ventures | | | 760 | | 532 |
|
| 229 |
| 537 |
Amortization of operating leases | | | 15,719 | | — |
|
| 10,244 |
| 10,823 |
Amortization of finance leases | | | 121 | | — |
|
| 64 |
| 82 |
Change in operating lease liabilities | | | (15,209) | | — |
|
| (9,894) |
| (10,381) |
Interest on hedged derivatives | | | 1 | | — |
|
| — |
| (1) |
Change in net deferred tax assets | | | 272 | | (888) |
|
| — |
| (69) |
Depreciation and amortization | | | 16,870 | | 16,705 |
|
| 10,537 |
| 11,166 |
Other amortization | | | 1,088 | | 7 |
|
| 401 |
| 717 |
Stock based compensation expense | | | 1,097 | | 1,066 |
|
| 704 |
| 680 |
Net changes in operating assets and liabilities: | | | | | |
|
|
|
| — |
Receivables | | | 3,393 | | 4,492 |
|
| 3,724 |
| (1,325) |
Prepaid and other assets | | | (4,757) | | (545) |
|
| (5,773) |
| (2,477) |
Payments for accrued pension | | | (513) | | (2,655) |
|
| (342) |
| (342) |
Accounts payable and accrued expenses | | | (3,165) | | 411 |
|
| 1,300 |
| (3,282) |
Film rent payable | | | (2,129) | | (6,366) |
|
| (6,953) |
| (415) |
Taxes payable | | | (1,091) | | (877) |
|
| 1,707 |
| (1,183) |
Deferred revenue and other liabilities | | | (2,191) | | | (1,636) |
|
| (426) |
|
| (1,265) |
Net cash provided by (used in) operating activities | | | 10,797 | | | 19,072 |
|
| (23,126) |
|
| 3,058 |
Investing Activities | | | | | | |
|
|
|
|
|
|
Insurance recoveries relating to property damage and demolition costs | | | 168 | | — |
|
| — |
| 169 |
Purchases of and additions to operating and investment properties | | | (33,205) | | (50,118) |
|
| (13,948) |
| (23,227) |
Acquisition of business combinations | | | (1,380) | | — |
|
| — |
| (1,380) |
Change in restricted cash | | | 1,334 | | (1,556) |
|
| — |
| 473 |
Contributions to unconsolidated joint ventures | |
|
| (63) |
| — |
Net cash provided by (used in) investing activities | | | (33,083) | | | (51,674) |
|
| (14,011) |
|
| (23,965) |
Financing Activities | | | | | | |
|
|
|
|
|
|
Repayment of long-term borrowings | | | (31,692) | | (29,546) |
|
| (22,311) |
| (14,945) |
Repayment of finance lease principal | | | (120) | | — |
|
| (62) |
| (80) |
Proceeds from borrowings | | | 58,677 | | 65,213 |
|
| 87,206 |
| 34,703 |
Capitalized borrowing costs | | | (502) | | — |
|
| (649) |
| (257) |
Repurchase of Class A Nonvoting Common Stock | | | (7,800) | | (397) |
|
| (989) |
| (2,631) |
(Cash paid) proceeds from the settlement of employee share transactions | | | (315) | | 340 |
|
| (40) |
| (290) |
Noncontrolling interest contributions | | | 55 | | 75 |
|
| — |
| 27 |
Noncontrolling interest distributions | | | (42) | | | (117) |
|
| — |
|
| (42) |
Net cash provided by (used in) financing activities | | | 18,261 | | | 35,568 |
|
| 63,155 |
|
| 16,485 |
Effect of exchange rate changes on cash and cash equivalents | | | (394) | | | (920) |
|
| 2,211 |
|
| (189) |
Net decrease in cash and cash equivalents | | (4,419) | | 2,046 | |
Net increase (decrease) in cash and cash equivalents | |
| 28,229 |
| (4,611) |
Cash and cash equivalents at January 1 | | | 13,127 | | | 13,668 |
|
| 12,135 |
|
| 13,127 |
Cash and cash equivalents at September 30 | | $ | 8,708 | | $ | 15,714 | |
Cash and cash equivalents at June 30 | |
| $ | 40,364 |
| $ | 8,516 |
Supplemental Disclosures | | | | | | |
|
|
|
|
|
|
Interest paid | | $ | 8,134 | | $ | 5,762 |
| $ | 4,837 |
| $ | 4,974 |
Income taxes paid | | | 5,669 | | 6,365 |
|
| 439 |
| 3,783 |
Non-Cash Transactions | | | | |
|
|
|
|
Additions to operating and investing properties through accrued expenses | | | 5,768 | | 2,911 |
|
| 2,760 |
| 4,482 |
See accompanying Notes to the Unaudited Consolidated Financial Statements.
READING INTERNATIONAL, INC.
NOTES TO CONSOLIDATED FINANCIAL STATEMENTS (Unaudited)
Note 1 – Description of Business and Segment Reporting
The Company
Reading International, Inc., a Nevada corporation (“RDI” and collectively with our consolidated subsidiaries and corporate predecessors, the “Company”, “Reading”“Company,” “Reading,” and “we”, “us”,“we,” “us,” or “our”), was incorporated in 1999. Our businesses consist primarily of:
| ·
| | the operation, development and ownership of multiplex cinemas in the United States, Australia, and New Zealand; and,
|
| ·
| | the development, ownership, operation and/or rental of retail, commercial and live venue real estate assets in Australia, New Zealand, and the United States.
|
the development, ownership, and operation of multiplex cinemas in the United States, Australia, and New Zealand; and,
the development, ownership, operation and/or rental of retail, commercial and live venue real estate assets in the United States, Australia, and New Zealand.
Business Segments
Reported below are the operating segments of the Company for which separate financial information is available and evaluated regularly by the Chief Executive Officer, the chief operating decision-maker of the Company. As part of our real estate activities, we hold undeveloped land in urban and suburban centers in Australia, New Zealand, and the United States.States, Australia, and New Zealand.
The table below summarizes the results of operations for each of our business segments for the quarter and ninesix months ended SeptemberJune 30, 20192020 and 2018,2019, respectively. Operating expense includes costs associated with the day-to-day operations of the cinemas and the management of rental properties, including our live theatertheatre assets.
| | | | | | | | |
|
|
|
|
|
|
|
|
| | | | | | | | |
|
|
|
|
|
|
|
|
| | Quarter Ended | | Nine Months Ended |
| Quarter Ended |
| Six Months Ended |
| | September 30, | | September 30, |
| June 30, |
| June 30, |
(Dollars in thousands) | | 2019 | | 2018 | | 2019 | | 2018 |
| 2020 |
| 2019 |
| 2020 |
| 2019 |
Revenue: | | | | | | | | | | | | |
|
|
|
|
|
|
|
|
|
|
|
|
Cinema exhibition | | $ | 66,733 | | $ | 70,671 | | $ | 197,101 | | $ | 223,109 |
| $ | 1,217 |
| $ | 72,296 |
| $ | 47,527 |
| $ | 130,223 |
Real estate | | 5,531 | | 5,771 | | 16,525 | | 18,204 |
| 2,303 |
| 5,564 |
| 6,905 |
| 10,994 |
Inter-segment elimination | | | (1,808) | | | (2,181) | | | (5,524) | | | (6,918) |
|
| (98) |
|
| (1,851) |
|
| (1,782) |
|
| (3,716) |
| | $ | 70,456 | | $ | 74,261 | | $ | 208,102 | | $ | 234,395 |
| $ | 3,422 |
| $ | 76,009 |
| $ | 52,650 |
| $ | 137,501 |
Segment operating income (loss): | | | | | | | | | | | | |
|
|
|
|
|
|
|
|
|
|
|
|
Cinema exhibition | | $ | 6,021 | | $ | 8,202 | | $ | 17,931 | | $ | 30,983 |
| $ | (17,254) |
| $ | 9,182 |
| $ | (19,908) |
| $ | 11,767 |
Real estate | | | 1,485 | | | 1,260 | | | 3,987 | | | 4,896 |
|
| (807) |
|
| 1,345 |
|
| (620) |
|
| 2,502 |
| | $ | 7,506 | | $ | 9,462 | | $ | 21,918 | | $ | 35,879 |
| $ | (18,061) |
| $ | 10,527 |
| $ | (20,528) |
| $ | 14,269 |
A reconciliation of segment operating income to income before income taxes is as follows:
| | | | | | | | |
|
|
|
|
|
|
|
|
| | | | | | | | |
|
|
|
|
|
|
|
|
| | Quarter Ended | | Nine Months Ended |
| Quarter Ended |
| Six Months Ended |
| | September 30, | | September 30, |
| June 30, |
| June 30, |
(Dollars in thousands) | | 2019 | | 2018 | | 2019 | | 2018 |
| 2020 |
| 2019 |
| 2020 |
| 2019 |
Segment operating income (loss) | | $ | 7,506 | | $ | 9,462 | | $ | 21,918 | | $ | 35,879 |
| $ | (18,061) |
| $ | 10,527 |
| $ | (20,528) |
| $ | 14,269 |
Unallocated corporate expense | | | | | | | | |
|
|
|
|
|
|
|
|
Depreciation and amortization expense | | (103) | | (92) | | (288) | | (313) |
| (227) |
| (127) |
| (419) |
| (188) |
General and administrative expense | | (4,493) | | (4,831) | | (14,205) | | (16,717) |
| (3,907) |
| (4,670) |
| (8,288) |
| (9,710) |
Interest expense, net | | (1,871) | | (1,748) | | (5,924) | | (5,132) |
| (2,004) |
| (2,204) |
| (3,797) |
| (4,055) |
Equity earnings of unconsolidated joint ventures | | 220 | | 80 | | 581 | | 667 |
| (274) |
| 327 |
| (195) |
| 361 |
Gain (loss) on sale of assets | | (1) | | — | | (1) | | — | |
Other income (expense) | | | 141 | | | (130) | | | 190 | | | (273) |
|
| 19 |
|
| 71 |
|
| (196) |
|
| 50 |
Income (loss) before income tax expense | | $ | 1,399 | | $ | 2,741 | | $ | 2,271 | | $ | 14,111 |
| $ | (24,454) |
| $ | 3,924 |
| $ | (33,423) |
| $ | 727 |
Note 2 – Summary of Significant Accounting Policies
Basis of Consolidation
The accompanying consolidated financial statements include the accounts of the Company’s wholly-owned subsidiaries as well as majority-owned subsidiaries that the Company controls, and should be read in conjunction with the Company’s Annual Report on Form 10-K as of and for the year ended December 31, 20182019 (“20182019 Form 10-K”). All significant intercompany balances and transactions have been eliminated on consolidation. These consolidated financial statements were prepared in accordance with accounting principles generally accepted in the United States of America (“U.S. GAAP”) for interim reporting with the instructions for Form 10-Q and Rule 10-01 of Regulation S-X of the Securities and Exchange Commission (“SEC”). As such, they do not include
all information and footnotes required by U.S. GAAP for complete financial statements. We believe that we have included all normal and recurring adjustments necessary for a fair presentation of the results for the interim period.
Operating results for the quarter and ninesix months ended SeptemberJune 30, 20192020 are not necessarily indicative of the results that may be expected for the year ending December 31, 2019.2020.
Use of Estimates
The preparation of consolidated financial statements in conformity with U.S. GAAP requires management to make estimates and assumptions that affect the amounts reported in the consolidated financial statements and footnotes thereto. Significant estimates include (i) projections we make regarding the recoverability and impairment of our assets (including goodwill and intangibles), (ii) valuations of our derivative instruments, (iii) recoverability of our deferred tax assets, (iv) estimation of breakage and redemption experience rates, which drive how we recognize breakage on our gift card and gift certificates, and revenue from our customer loyalty program, and (v) allocation of insurance proceeds to various recoverable components.components, and (vi) estimation of our Incremental Borrowing Rate (“IBR”) as relates to the valuation of our right-of-use assets and lease liabilities. Actual results may differ from those estimates.
Recently Adopted and Issued Accounting Pronouncements
Adopted:
| 1)
| | Accounting Standards Update (“ASU”) 2016-02 Leases: In February 2016, the Financial Accounting Standards Board (“FASB”) issued a new accounting standard, Accounting Standards Codification (“ASC”) 842 Leases, to increase transparency and comparability among organizations by requiring the recognition of right-of-use assets and lease liabilities on the balance sheet. Leases will be classified as either finance or operating, with classification affecting the pattern of expense recognition in the income statement. A modified retrospective transition approach is required for lessees with capital and operating leases existing at, or entered into after, the beginning of the earliest comparative period presented in the financial statements, with certain practical expedients available.
|
1)On April 8, 2020, the FASB released FASB Staff Q&A Topic 842 and Topic 840: Accounting for Lease Concessions Related to the Effects of the COVID-19 Pandemic. This provides optional relief when accounting for modifications to leases obtained as a result of COVID-19 which otherwise would have required full modification assessment under ASC 842. Where we have obtained rent concessions from our landlords, or provided concessions to our tenants, we have elected not to perform the standard Topic 842 modification evaluation where the concession does not result in the total consideration required by the contract being substantially less than the total consideration originally required by the contract. Under the guidance, where we have received or provided deferrals of rent, we have recorded the deferrals as receivables or payables, and where we have received or provided abatements, we have recorded these as variable rents in the consolidated statements of income.
2)On January 1, 2020, we adopted ASU 2017-04, Intangibles – Goodwill and Other (Topic 350): Simplifying the Test for Goodwill Impairment. This new guidance removes the second step of the two-step impairment test for measuring goodwill and is to be applied on a prospective basis only. Adoption of this standard has no material effect on our consolidated financial statements.
3)On January 1, 2020, we adopted ASU 2016-13, Financial Instruments – Credit Losses (Topic 326). This new guidance replaces the incurred loss impairment methodology under prior GAAP with a methodology that reflects expected credit losses and requires consideration of a broader range of reasonable and supportable information to inform credit loss estimates. We have no history of significant bad debt losses and as such adoption of this standard has no material effect on our consolidated financial statements.
4)On January 1, 2019, we adopted the new accounting standard ASC 842 ASU 2016-02 Leases (Topic 842)using the modified retrospectivecurrent adjustment method. We recognized the cumulative effect of initially applying the new leasing standard as an adjustment to the opening balance of retained earnings. The comparative information has not been restated and continues to be reported under the accounting standards in effect for those periods. The standard had a material impact on our consolidated balance sheets, but not on our consolidated income statements or statements of cash flow.
| | | | | | | | | |
(Dollars in thousands) | | Balance at
December 31,
2018 | | Adjustments
due to ASC
842 | | Balance at
January 1,
2019 |
Assets | | | | | | | | | |
Operating property, net | | $ | 257,667 | | $ | 370 | | $ | 258,037 |
Operating lease right-of-use assets | | | — | | | 232,319 | | | 232,319 |
Intangible assets, net | | | 7,369 | | | (3,542) | | | 3,827 |
Deferred tax asset, net | | | 26,235 | | | 82 | | | 26,317 |
Liabilities | | | | | | | | | |
Operating lease liabilities | | $ | — | | $ | 245,280 | | $ | 245,280 |
Other non-current liabilities | | | 28,931 | | | (16,033) | | | 12,898 |
Stockholders' Equity | | | | | | | | | |
Non-controlling interest | | $ | 4,337 | | $ | (46) | | $ | 4,291 |
Retained earnings | | | 47,616 | | | 28 | | | 47,644 |
| | | | | | | | | | | | | | | | | | |
| | Quarter Ended September 30, 2019 | | Nine Months Ended September 30, 2019 |
(Dollars in thousands) | | As Reported, September 30, 2019 | | Balances Without Adoption of ASC 842 | | Effect of
change
Higher /
(Lower) | | As Reported, September 30, 2019 | | Balances
Without
Adoption of
ASC 842 | | Effect of
change
Higher /
(Lower) |
Cinema costs and expenses | | $ | 53,709 | | $ | 53,746 | | $ | (37) | | $ | 158,273 | | $ | 158,357 | | $ | (84) |
Depreciation and amortization | | | 5,704 | | | 5,665 | | | 39 | | | 16,870 | | | 16,749 | | | 121 |
General and administrative | | | 5,908 | | | 5,949 | | | (41) | | | 18,426 | | | 18,554 | | | (128) |
Interest expense, net | | | 1,871 | | | 1,867 | | | 4 | | | 5,924 | | | 5,914 | | | 10 |
Income tax (benefit) expense | | | 547 | | | 535 | | | 12 | | | 1,159 | | | 1,132 | | | 27 |
Net income (loss) | | $ | 852 | | $ | 829 | | $ | 23 | | $ | 1,112 | | $ | 1,058 | | $ | 54 |
| | | | | | | | | |
(Dollars in thousands) | | As Reported,
September 30, 2019 | | Balances
Without
Adoption of
ASC 842 | | Effect of
change
Higher /
(Lower) |
Assets | | | | | | | | | |
Operating property, net | | $ | 248,100 | | $ | 247,939 | | $ | 161 |
Intangible assets | | | 3,607 | | | 6,894 | | | (3,287) |
Operating lease right-of-use assets | | | 216,963 | | | — | | | 216,963 |
Deferred tax asset, net | | | 25,959 | | | 25,904 | | | 55 |
Liabilities | | | | | | | | | |
Other current liabilities | | $ | 9,339 | | $ | 9,459 | | $ | (120) |
Operating lease liabilities, current | | | 19,579 | | | — | | | 19,579 |
Other non-current liabilities | | | 12,330 | | | 28,727 | | | (16,397) |
Operating lease liabilities, non-current | | | 210,737 | | | — | | | 210,737 |
Stockholders' Equity | | | | | | | | | |
Retained earnings | | $ | 48,859 | | $ | 48,805 | | $ | 54 |
| 2)
| | ASU 2014-09 Revenue from Contracts with Customers: On January 1, 2018, we adopted the new accounting standard ASC 606 Revenue from Contracts with Customers using the modified retrospective method. We recognized the cumulative effect of initially applying the new revenue standard as an adjustment to the opening balance of retained earnings. The comparative information was not restated. Adoption of this standard has no material effect on our consolidated financial statements.
|
| 3)
| | On January 1, 2018, we adopted ASU 2016-18, Statement of Cash Flows (Topic 230): Restricted Cash, a consensus of the FASB Emerging Issues Task Force. This standard requires that amounts generally described as restricted cash and cash equivalents be combined with unrestricted cash and cash equivalents when reconciling the beginning and end of period balances on the statement of cash flows. Adoption of this standard has no material effect on our consolidated statement of cash flows.
|
| 4)
| | On January 1, 2018, we adopted ASU 2016-15, Statement of Cash Flows (Topic 230): Classification of Certain Cash Receipts and Cash Payments. The standard applies to eight (8) specific cash flow classification issues, reducing the current and potential future diversity in the presentation of certain cash flows. Adoption of this standard has no material effect on our consolidated statement of cash flows.
|
| 5)
| | On January 1, 2018, we adopted ASU 2017-07, Compensation—Retirement Benefits (Topic 715): Improving the Presentation of Net Periodic Pension Cost and Net Periodic Postretirement Benefit Cost. This standard (i) requires that an employer disaggregate the service cost component from the other components of net benefit cost, and (ii) specifies how to present the service cost component and the other components of net benefit cost in the income statement and (iii) allows only the service cost component of net benefit cost to be eligible for capitalization. Adoption of this standard has no material impact on our consolidated financial statements.
|
| 6)
| | On January 1, 2018, we adopted ASU 2017-01, Business Combinations (Topic 805): Clarifying the Definition of a Business. This ASU provides that when substantially all of the fair value of the gross assets acquired (or disposed of) is concentrated in a single identifiable asset or a group of similar identifiable assets, the asset is not a “business”, thus reducing the number of transactions that need further evaluation for business combination. The standard has no material impact on our current consolidated financial statements, and we do not expect itto be applicable to our consolidated financial statements in the near term unless we enter into a definitive business acquisition transaction.
|
Issued:
| v
| | ASUs Effective 2019 and Beyond
|
| ·
| | Goodwill Impairment Simplification (ASU 2017-04, Intangibles – Goodwill and Other (Topic 350): Simplifying the Test for Goodwill Impairment)
|
Issued by FASB in January 2017, this standard removes the second step of the two-step impairment test for measuring goodwill and is to be applied on a prospective basis only. The new standard is effective for the Company on January 1, 2020, including interim periods within the year of adoption. Early adoption is permitted for interim or annual goodwill impairment tests performed on testing dates after January 1, 2017. Early adoption is not being contemplated. It is not anticipated that adoption of this standard will have any material impact on our consolidated financial statements.
Issued:
ASUs Effective 2020 and Beyond
1)In March 2020, the FASB issued ASU 2020-04, Reference Rate Reform (Topic 848): Facilitation of the Effects of Reference Rate Reform on Financial Reporting. The amendments in this update provide optional expedients and exceptions for applying generally accepted accounting principles to contracts, hedging relationships and other transactions that reference London Interbank Offered Rate (“LIBOR”) or another reference rate expected to be discontinued because of reference rate reform. ASC 2020-04 is effective as of March 12, 2020 through December 31, 2022. The Company is currently evaluating the effect the new standard will have on its consolidated financial statements.
Prior period financial statement correction of immaterial errors
Sales Tax
During the fourth quarter of 2019, we identified immaterial errors related to the accounting for sales tax on certain products sold from cinemas dating back to 2017. These errors resulted in an overstatement of revenue for certain periods.
We assessed the materiality of these errors on our financial statements for prior periods in accordance with the SEC Staff Accounting Bulletin (“SAB”) No. 99, Materiality, codified in ASC 250, Presentation of Financial Statements, and concluded that they were not material to any prior annual or interim periods. However, the aggregate amount of $993,000 related to the prior period immaterial
errors through September 30, 2019, would have been material to the full year Consolidated Statement of Operations to December 31, 2019, presented within the December 31, 2019, Form 10-K. Consequently, in accordance with ASC 250 (specifically SAB No. 108, Considering the Effects of Prior Year Misstatements when Quantifying Misstatements in Current Year Financial Statements), we have corrected these errors for all prior periods presented by revising the consolidated financial statements and other financial information included herein.
The following is a summary of the previously issued financial statement line items for all periods and statements included in this Form 10-Q report affected by the correction.
Consolidated Statements of Operations:
|
|
|
|
|
|
|
|
|
|
|
|
|
|
|
|
|
|
|
|
| Quarter Ended June 30, 2019 |
| Six Months Ended June 30, 2019 |
(Dollars in thousands) |
| As Reported |
| Adjustment |
| As Revised |
| As Reported |
| Adjustment |
| As Revised |
Cinema revenue |
| $ | 72,383 |
|
| (87) |
|
| 72,296 |
| $ | 130,368 |
|
| (145) |
|
| 130,223 |
Total revenue |
|
| 76,096 |
|
| (87) |
|
| 76,009 |
|
| 137,646 |
|
| (145) |
|
| 137,501 |
Operating income (loss) |
|
| 5,817 |
|
| (87) |
|
| 5,730 |
|
| 4,515 |
|
| (145) |
|
| 4,370 |
Income (loss) before income taxes |
|
| 4,011 |
|
| (87) |
|
| 3,924 |
|
| 872 |
|
| (145) |
|
| 727 |
Income tax (expense) benefit |
|
| (1,654) |
|
| 24 |
|
| (1,630) |
|
| (612) |
|
| 39 |
|
| (573) |
Net income (loss) |
|
| 2,357 |
|
| (63) |
|
| 2,294 |
|
| 260 |
|
| (106) |
|
| 154 |
Net income (loss) attributable to Reading International, Inc. common shareholders |
|
| 2,394 |
|
| (63) |
|
| 2,331 |
|
| 313 |
|
| (106) |
|
| 207 |
|
|
|
|
|
|
|
|
|
|
|
|
|
|
|
|
|
|
|
Basic earnings (loss) per share |
| $ | 0.10 |
|
| (0.00) |
|
| 0.10 |
| $ | 0.01 |
|
| (0.00) |
|
| 0.01 |
Diluted earnings (loss) per share |
|
| 0.10 |
|
| (0.00) |
|
| 0.10 |
|
| 0.01 |
|
| (0.00) |
|
| 0.01 |
Consolidated Balance Sheets:
|
|
|
|
|
|
|
|
|
|
|
|
|
|
|
|
|
|
|
|
|
|
|
|
|
|
|
|
|
| Summary of Equity |
(Dollars in thousands) |
|
|
|
|
|
|
|
|
|
| As Reported |
| Adjustment |
| As Revised |
Equity at January 1, 2019 |
|
|
|
|
|
|
|
|
|
| $ | 180,547 |
| $ | (568) |
| $ | 179,979 |
Net income (loss) attributable to Reading International, Inc. common shareholders |
|
|
|
|
|
|
|
|
|
|
| 260 |
|
| (106) |
|
| 154 |
Equity at June 30, 2019 |
|
|
|
|
|
|
|
|
|
|
| 177,697 |
|
| (674) |
|
| 177,023 |
Consolidated Statements of Cash Flows:
|
|
|
|
|
|
|
|
|
|
|
|
|
|
|
|
|
|
|
|
|
|
|
|
|
|
|
|
|
| Six Months Ended June 30, 2019 |
(Dollars in thousands) |
|
|
|
|
|
|
|
|
|
| As Reported |
| Adjustment |
| As Revised |
Net income (loss) |
|
|
|
|
|
|
|
|
|
| $ | 260 |
| $ | (106) |
| $ | 154 |
Change in net deferred tax assets |
|
|
|
|
|
|
|
|
|
|
| (30) |
|
| (39) |
|
| (69) |
Accounts payable and accrued expenses |
|
|
|
|
|
|
|
|
|
|
| (3,427) |
|
| 145 |
|
| (3,282) |
Net cash provided by operating activities |
|
|
|
|
|
|
|
|
|
|
| 3,058 |
|
| — |
|
| 3,058 |
Note 3 – Impact of COVID-19 Pandemic and Liquidity
On March 11, 2020, the World Health Organization (“WHO”) declared the novel coronavirus, COVID-19, a global pandemic. Following the date of this declaration, a number of jurisdictions imposed various restrictions on “non-essential” activities. In the jurisdictions in which we operate, these restrictions typically included closure of all business deemed “non-essential” (including movie-theaters and most other indoor forms of entertainment), and that all “non-essential” workers, and all members of the public, remain in their homes. As a result, beginning in March 2020 and continuing through and beyond the end of the first quarter of 2020, we temporarily closed all of our live theatres and cinema operations in the U.S., Australia and New Zealand. Operating restrictions adopted in Australia and New Zealand also affected, and to varying degrees continue to affect, many of our tenants at our retail shopping centers. While most of these tenants have, to date, remained open for trading, we have in many cases agreed to rent abatements or deferrals.
In second quarter of 2020, several jurisdictions began relaxing COVID-19 restrictions, but principally due to pressure on their economies, rather than material containment of COVID-19. Conversely, certain jurisdictions are to varying degrees reinstating their lockdowns due to the resurgence of COVID-19, while others are continuing to remove or lessen restrictions. The current uncertainty resulting from these differing approaches, and the local and global affects that these may have, is expected to continue until the COVID-19 spread is considered materially contained. There is no reliable estimate as to when this will be.
Cinema Segment Impact
As of June 3, 2020, we had re-opened all of the cinemas in our New Zealand circuit except for our Reading Cinemas at Courtenay Central (which continues to be closed due to seismic concerns), with social distancing measures in place. These government imposed social distancing requirements were discontinued in New Zealand on June 8, 2020. Throughout June and July, 2020, we re-opened all of our Australia circuit with social distancing measures in place, but as the state of Victoria went from partial lockdown to full lockdown on August 5, 2020, all of our 7 cinemas in that state were required to close. This lockdown is currently scheduled to end on September 15, 2020, but no assurances can be given regarding this timing and no precise date for cinema re-opening can be determined with respect to this state. Our U.S. cinema circuits have not re-opened since the beginning of their temporary closures, and while we have taken steps to prepare for re-opening, the date of any re-opening has not yet been finally determined.
Our decisions to re-open, and whether to remain open, will be impacted by a variety of considerations including movie availability, customer demand, and safety considerations relative to our staff and customers, as well as by applicable governmental mandates.
Real Estate Segment Impact
Substantially all of our tenants in our Australian real estate business are currently open for trading. We have, to varying degrees, supported certain tenants with rent abatements and deferrals, and may continue to do so until we believe that such tenants are in the position to fully perform their obligations despite COVID-19 impacts.
Liquidity Impact
The repercussions of COVID-19 resulted in a significant decrease in the Company’s revenues and earnings in the first six months of 2020. The closure of our cinemas resulted in effectively 0 revenue in the second quarter of 2020, and during the period in which our cinemas are closed, we will continue to experience significantly lower revenues and earnings. Our cinema operations will continue to generate effectively no revenue while they are closed to the public, and their revenue generating capabilities when open are dependent upon a number of factors including the timing and quality of new film product, governmental mandates regarding social distancing, customer density and hours of operation, and customer behavior and willingness to spend discretionary income on movie-going. With regards to our real estate operations, while all of our Australian real estate tenants are currently trading (other than certain tenants who have closed for reasons unrelated to COVID-19), our real estate revenue and earnings may continue to be affected by any support that we may deem necessary to provide to certain tenants through incremental rent relief measures.
As a direct result of the impacts of COVID-19, we have renegotiated certain financial covenant modifications with the applicable lenders. These modifications permit us to classify the relevant debt instruments as long term and are further discussed below in Note 11 – Debt.
As of June 30, 2020, the Company had negative working capital of $54.9 million. In response to the uncertainties associated with COVID-19, the Company has taken and is continuing to take significant steps to preserve cash by eliminating non-essential costs, reducing employee hours and deferring all non-essential capital expenditures to minimum levels. The Company has successfully negotiated rent abatements and deferrals with substantially all of its landlords and continues to pursue additional concessions. The Company has also successfully secured access to government wage subsidy programs in Australia and New Zealand, programs which currently expire on September 25, 2020 and August 20, 2020, respectively. The Company continues to review various programs offered by governmental agencies in the jurisdictions where it operates as those programs are further defined or revised, but there can be no guarantee that the Company will qualify for any such programs or, even if it does qualify, the degree that it may be successful in its applications for such support. As of June 30, 2020, management had drawn down in full the operating debt facilities available to the Company and is currently reviewing the potential sale of certain non-core real estate assets or the use of our unencumbered properties to provide collateral to support current or new financings in order to meet future liquidity demands.
Impairment Considerations
The Company considers that the events and factors described above constitute impairment indicators under ASC 360 Property, Plant and Equipment. The Company performed a quantitative recoverability test of the carrying values of all of its asset groups. The Company estimated the undiscounted future cash flows expected to result from the use of these asset groups and determined that there was 0 impairment as of June 30, 2020. The cash flow estimates used in this review are consistent with budgetary revisions performed by management in response to COVID-19. The realization of these forecasts is dependent on a number of variables and conditions, many of which are due to the uncertainties associated with COVID-19 and as a result, actual results may materially differ from management’s estimates.
The Company considers that the events and factors described above constitute impairment indicators under ASC 350 Intangibles – Goodwill and Other. The Company performed a quantitative goodwill impairment test and determined that its goodwill was 0t impaired as of June 30, 2020. The test was performed at reporting unit level by comparing each reporting unit’s carrying value, including goodwill, to its fair value. The fair value of each reporting unit was assessed using a discounted cash flow model based on the budgetary revisions performed by management in response to COVID-19. The realization of these forecasts is dependent on a number of variables and conditions, many of which are due to the uncertainties associated with COVID-19 and as a result, actual results may materially differ from management’s estimates.
Note 4 – Operations in Foreign Currency
We have significant assets in Australia and New Zealand. Historically, we have conducted our Australian and New Zealand operations (collectively “foreign operations”) on a self-funding basis, where we use cash flows generated by our foreign operations to pay for the expense of those foreign operations. Our Australian and New Zealand assets and liabilities are translated from their functional currencies of Australian dollar (“AU$”) and New Zealand dollar (“NZ$”), respectively, to the U.S. dollar based on the exchange rate as of SeptemberJune 30, 2019.2020. The carrying value of the assets and liabilities of our foreign operations fluctuates as a result of changes in the exchange rates between the functional currencies of the foreign operations and the U.S. dollar. The translation adjustments are accumulated in the Accumulated Other Comprehensive Income in the Consolidated Balance Sheets.
Due to the natural-hedge nature of our funding policy, we have not historically used derivative financial instruments to hedge against the risk of foreign currency exposure. However, in certain circumstances, we move funds between jurisdictions where circumstances encouraged us to do so from an overall economic standpoint. Going forward, particularly in light of recent tax law changes, we intend to take a more global view of our financial resources, and to be more flexible in making use of resources from one jurisdiction in other jurisdictions.
Presented in the table below are the currency exchange rates for Australia and New Zealand:
| | | | | | | | | |
|
|
|
|
|
|
|
|
|
| | | | | | | | | |
|
|
|
|
|
|
|
|
|
| Foreign Currency / USD | Foreign Currency / USD |
| As of and
for the
quarter
ended | | As of and for the nine months ended | | As of and
for the
twelve months
ended | | As of and
for the
quarter
ended | | As of and for the nine months ended | As of and
for the
quarter
ended |
| As of and
for the
six months ended |
| As of and
for the
twelve months
ended |
| As of and
for the
quarter
ended |
| As of and
for the
six months ended |
| September 30, 2019 | | December 31, 2018 | | September 30, 2018 | June 30, 2020 |
| December 31, 2019 |
| June 30, 2019 |
Spot Rate | | | | | | | | | |
|
|
|
|
|
|
|
|
|
Australian Dollar | 0.6746 | | 0.7046 | | 0.7238 | 0.6893 |
| 0.7030 |
| 0.7009 |
New Zealand Dollar | 0.6262 | | 0.6711 | | 0.6635 | 0.6446 |
| 0.6745 |
| 0.6711 |
Average Rate | | | | | | | | | |
|
|
|
|
|
|
|
|
|
Australian Dollar | 0.6856 | | 0.6993 | | 0.7479 | | 0.7311 | | 0.7580 | 0.6576 |
| 0.6577 |
| 0.6954 |
| 0.7001 |
| 0.7062 |
New Zealand Dollar | 0.6486 | | 0.6643 | | 0.6930 | | 0.6685 | | 0.7002 | 0.6183 |
| 0.6266 |
| 0.6593 |
| 0.6626 |
| 0.6721 |
Note 45 – Earnings Per Share
Basic earnings per share (“EPS”) is calculated by dividing the net income attributable to the Company’s common stockholders by the weighted average number of common shares outstanding during the period. Diluted EPS is calculated by dividing the net income attributable to the Company’s common stockholders by the weighted average number of common and common equivalent shares outstanding during the period and is calculated using the treasury stock method for equity-based compensation awards.
The following table sets forth the computation of basic and diluted EPS and a reconciliation of the weighted average number of common and common equivalent shares outstanding:
| | | | | | | | | | | | |
|
|
|
|
|
|
|
|
|
|
|
|
| | | | | | | | | | | | |
|
|
|
|
|
|
|
|
|
|
|
|
| | Quarter Ended | | Nine Months Ended |
| Quarter Ended |
| Six Months Ended |
| | September 30, | | September 30, |
| June 30, |
| June 30, |
(Dollars in thousands, except share data) | | 2019 | | 2018 | | 2019 | | 2018 |
| 2020 |
| 2019 |
| 2020 |
| 2019 |
Numerator: | | | | | | | | | | | | |
|
|
|
|
|
|
|
|
|
|
|
|
Net income (loss) attributable to RDI common stockholders | | $ | 902 | | $ | 1,297 | | $ | 1,215 | | $ | 9,405 |
| $ | (22,702) |
| $ | 2,331 |
| $ | (28,577) |
| $ | 207 |
Denominator: | | | | | | | | | | | | |
|
|
|
|
|
|
|
|
|
|
|
|
Weighted average number of common stock – basic | | | 22,546,827 | | | 23,006,040 | | | 22,791,530 | | | 22,988,227 |
|
| 21,742,667 |
|
| 22,894,083 |
|
| 21,749,356 |
|
| 22,901,764 |
Weighted average dilutive impact of awards | | | 141,403 | | | 191,884 | | | 161,308 | | | 196,794 |
|
| 352,469 |
|
| 165,650 |
|
| 352,859 |
|
| 172,909 |
Weighted average number of common stock – diluted | | | 22,688,230 | | | 23,197,924 | | | 22,952,838 | | | 23,185,021 |
|
| 22,095,136 |
|
| 23,059,733 |
|
| 22,102,215 |
|
| 23,074,673 |
Basic earnings (loss) per share attributable to RDI common stockholders | | $ | 0.04 | | $ | 0.06 | | $ | 0.05 | | $ | 0.41 |
| $ | (1.04) |
| $ | 0.10 |
| $ | (1.31) |
| $ | 0.01 |
Diluted earnings (loss) per share attributable to RDI common stockholders | | $ | 0.04 | | $ | 0.06 | | $ | 0.05 | | $ | 0.41 |
| $ | (1.04) |
| $ | 0.10 |
| $ | (1.31) |
| $ | 0.01 |
Awards excluded from diluted earnings (loss) per share | | | 516,010 | | | 276,681 | | | 516,010 | | | 126,840 |
|
| 678,377 |
|
| 516,010 |
|
| 703,377 |
|
| 516,010 |
Our weighted average number of common stock - basic decreased, primarily as a result of the repurchase of shares of Class A Non-Voting Common Stock pursuant to our current stock repurchase program offset by the issuance of shares due to the exercise of share options and vesting of restricted stock units. During the first ninesix months of 2019,2020, we repurchased 856,56375,157 shares of Class A Non-Voting Common Stock at an average price of $13.20$8.92 per share. All purchases occurred in the first quarter of 2020.
Note 56 – Property and Equipment
Operating Property, net
As of SeptemberJune 30, 20192020, and December 31, 2018,2019, property associated with our operating activities is summarized as follows:
| | | | |
|
|
|
|
| | | | |
|
|
|
|
| | September 30, | | December 31, |
| June 30, |
| December 31, |
(Dollars in thousands) | | 2019 | | 2018 |
| 2020 |
| 2019 |
Land | | $ | 73,675 | | $ | 75,689 |
| $ | 72,791 |
| $ | 75,663 |
Building and improvements | | | 143,408 | | 149,734 |
|
| 145,769 |
| 149,852 |
Leasehold improvements | | | 55,867 | | 55,299 |
|
| 57,110 |
| 56,912 |
Fixtures and equipment | | | 172,687 | | 167,943 |
|
| 184,814 |
| 186,949 |
Construction-in-progress | | | 7,032 | | | 3,478 |
|
| 10,689 |
|
| 5,484 |
Total cost | | | 452,669 | | | 452,143 |
|
| 471,173 |
|
| 474,860 |
Less: accumulated depreciation | | | (204,569) | | | (194,476) |
|
| (223,843) |
|
| (216,722) |
Operating property, net | | $ | 248,100 | | $ | 257,667 |
| $ | 247,330 |
| $ | 258,138 |
Depreciation expense for operating property was $5.5$5.0 million and $16.3$10.2 million for the quarter and ninesix months ended SeptemberJune 30, 20192020 respectively and $5.4 million and $15.6$10.8 million for the quarter and ninesix months ended SeptemberJune 30, 2018, respectively.2019.
Investment and Development Property, net
As of SeptemberJune 30, 20192020, and December 31, 2018,2019, our investment and development property is summarized below:
| | | | |
|
|
|
|
| | | | | |
|
|
|
|
|
| | September 30, | | December 31, |
| June 30, |
| December 31, |
(Dollars in thousands) | | 2019 | | 2018 |
| 2020 |
| 2019 |
Land | | $ | 23,392 | | $ | 24,371 |
| $ | 25,628 |
| $ | 24,446 |
Building | | 1,900 | | 1,900 |
| 1,900 |
|
| 1,900 |
Construction-in-progress (including capitalized interest) | | | 82,000 | | | 60,533 |
|
| 92,139 |
|
| 87,678 |
Investment and development property | | $ | 107,292 | | $ | 86,804 |
| $ | 119,667 |
| $ | 114,024 |
Construction-in-Progress – Operating and Investing Properties
Construction-in-Progress balances are included in both our operating and development properties. The balances of our major projects along with the movements for the ninesix months ended SeptemberJune 30, 20192020 are shown below:
| | | | | | | | | | | | | | | |
|
|
|
|
|
|
|
|
|
|
|
|
|
|
|
| | | | | | | | | | | | | | | |
|
|
|
|
|
|
|
|
|
|
|
|
|
|
|
(Dollars in thousands) | | Balance,
December 31,
2018 | | Additions during the period(1) | | Completed
during the
period | | Foreign
currency
translation | | Balance, September 30, 2019 |
| Balance, December 31, 2019 |
| Additions during the period(1) |
| Completed
during the
period |
| Foreign
currency
translation |
| Balance, June 30, 2020 |
Union Square development | | $ | 55,634 | | $ | 21,098 | | $ | — | | $ | — | | $ | 76,732 |
| $ | 81,934 |
| $ | 4,468 |
| $ | — |
| $ | — |
| $ | 86,402 |
Courtenay Central development | | | 5,571 | | | 611 | | | (40) | | | (411) | | | 5,731 |
|
| 6,364 |
|
| 419 |
|
| — |
|
| (272) |
|
| 6,511 |
Cinema developments and improvements | | | 1,664 | | | 13,470 | | | (9,931) | | | (75) | | | 5,128 |
|
| 3,032 |
|
| 5,646 |
|
| (1,071) |
|
| 46 |
|
| 7,653 |
Other real estate projects | | | 1,142 | | | 717 | | | (338) | | | (80) | | | 1,441 |
|
| 1,832 |
|
| 1,001 |
|
| (537) |
|
| (34) |
|
| 2,262 |
Total | | $ | 64,011 | | $ | 35,896 | | $ | (10,309) | | $ | (566) | | $ | 89,032 |
| $ | 93,162 |
| $ | 11,534 |
| $ | (1,608) |
| $ | (260) |
| $ | 102,828 |
| (1)
| | Includes capitalized interest of $2.2million and $4.9 million for the quarter and nine months ended September 30, 2019.
|
(1)Includes capitalized interest of $0.8 million and $1.7 million for the quarter and six months ended June 30, 2020.
Real Estate Transactions
Purchase of Income Producing Property at Auburn/Redyard, Australia– On June 29, 2018, we added 20,870 square feet of land, improved with a 16,830 square foot office building, to our Auburn/Redyard entertainment-themed center (“ETC”). The property was acquired at auction for $3.5 million (AU$4.5 million) and is bordered by our existing ETC on three sides. The property is leased to Telstra through July 2022. This lease will allow us time to plan for the efficient integration of the property into our ETC. With this acquisition, Auburn/Redyard now represents approximately 519,992 square feet (48,309 square meters) of land, with approximately 1,620 feet (498 meters) of uninterrupted frontage to Parramatta Road, a major Sydney arterial motorway.
Purchase of Land at Cannon Park in Townsville, Australia – On June 13, 2018, we acquired a 163,000 square foot (15,150 square meter) parcel of land at our Cannon Park ETC, in connection with the restructuring of our relationship with the adjacent land owner. Prior to the restructuring, this parcel was commonly owned by us and the adjoining land owner. In the restructuring, the adjoining land owner conveyed to us its interest in the parcel for AU$1. We granted the adjoining land owner certain access rights with respect to that parcel.
Exercise of Option to Acquire Ground Lessee’s interest in Ground Lease and Improvements Constituting the Village East Cinema – On August 28, 2019, we exercised our option to acquire the ground lessee’s interest in the 13 year ground lease underlying and the real property assets constituting our Village East Cinema in Manhattan. The purchase price under the option is $5.9 million. It is anticipated that the transaction will close on or about May 31, 2020. 2021.
Note 67 – Investments in Unconsolidated Joint Ventures
Our investments in unconsolidated joint ventures are accounted for under the equity method of accounting.
The table below summarizes our active investment holdings in two2 (2) unconsolidated joint ventures as of SeptemberJune 30, 20192020 and December 31, 2018:2019:
| | | | | | |
|
|
|
|
|
|
| | | | | | | | |
|
|
|
|
|
|
|
|
| | | | September 30, | | December 31, |
|
|
| June 30, |
| December 31, |
(Dollars in thousands) | | Interest | | 2019 | | 2018 |
| Interest |
| 2020 |
| 2019 |
Rialto Cinemas | | 50.0% | | $ | 1,112 | | $ | 1,260 |
| 50.0% |
| $ | 1,041 |
| $ | 1,175 |
Mt. Gravatt | | 33.3% | | | 3,609 | | | 3,861 |
| 33.3% |
|
| 3,515 |
|
| 3,894 |
Total investments | | | | $ | 4,721 | | $ | 5,121 |
|
|
| $ | 4,556 |
| $ | 5,069 |
For the quarter and ninesix months ended SeptemberJune 30, 20192020 and 2018,2019, the recognized share of equity earnings from our investments in unconsolidated joint ventures are as follows:
| | | | | | | | |
|
|
|
|
|
|
|
|
| | | | | | | | | | |
|
|
|
|
|
|
|
|
|
|
| | Quarter Ended | | Nine Months Ended |
| Quarter Ended |
| Six Months Ended |
| | September 30, | | September 30, |
| June 30, |
| June 30, |
(Dollars in thousands) | | 2019 | | 2018 | | 2019 | | 2018 |
| 2020 |
| 2019 |
| 2020 |
| 2019 |
Rialto Cinemas | | $ | 64 | | $ | — | | $ | 78 | | $ | 152 |
| $ | (95) |
| $ | 71 |
| $ | (109) |
| $ | 14 |
Mt. Gravatt | | | 156 | | | 80 | | | 503 | | | 515 |
|
| (179) |
|
| 256 |
|
| (86) |
|
| 347 |
Total equity earnings | | $ | 220 | | $ | 80 | | $ | 581 | | $ | 667 |
| $ | (274) |
| $ | 327 |
| $ | (195) |
| $ | 361 |
Note 78 – Goodwill and Intangible Assets
The table below summarizes goodwill by business segment as of SeptemberJune 30, 20192020 and December 31, 2018. 2019.
| | | | | | |
|
|
|
|
|
|
| | | | | | | | | |
|
|
|
|
|
|
|
|
|
(Dollars in thousands) | | Cinema | | Real Estate | | Total |
| Cinema |
| Real Estate |
| Total |
Balance at December 31, 2018 | | $ | 14,221 | | $ | 5,224 | | $ | 19,445 | |
Balance at December 31, 2019 | |
| $ | 21,224 |
| $ | 5,224 |
| $ | 26,448 |
Change in goodwill due to a purchase of a business combination | | 1,225 | | — | | 1,225 |
| 120 |
| — |
| 120 |
Foreign currency translation adjustment | | | (757) | | | — | | | (757) |
|
| (560) |
|
| — |
|
| (560) |
Balance at September 30, 2019 | | $ | 14,689 | | $ | 5,224 | | $ | 19,913 | |
Balance at June 30, 2020 | |
| $ | 20,784 |
| $ | 5,224 |
| $ | 26,008 |
The Company is required to test goodwill and other intangible assets for impairment on an annual basis and, if current events or circumstances require, on an interim basis. The Company has performed an interim goodwill assessment as described in Note 3 – Impact of COVID-19 Pandemic and Liquidity. Our next annual evaluation of goodwill and other intangible assets is scheduled during the fourth quarter of 2019.2020. To test the impairment of goodwill, the Company compares the fair value of each reporting unit to its carrying amount, including the goodwill, to determine if there is potential goodwill impairment. A reporting unit is generally one level below the operating segment. As of SeptemberJune 30, 2019,2020, we were not aware that any events indicating potential impairment of goodwill had occurred.occurred outside of those described at Note 3 – Impact of COVID-19 Pandemic and Liquidity.
The tables below summarize intangible assets other than goodwill, as of SeptemberJune 30, 20192020 and December 31, 2018,2019, respectively.
| | | | | | | | |
|
|
|
|
|
|
|
|
| | | | | | | | | | | |
|
|
|
|
|
|
|
|
|
|
|
| | As of September 30, 2019 |
| As of June 30, 2020 |
(Dollars in thousands) | | Beneficial
Leases | | Trade
Name | | Other
Intangible
Assets | | Total |
| Beneficial
Leases |
| Trade
Name |
| Other
Intangible
Assets |
| Total |
Gross carrying amount | | $ | 14,973 | | $ | 7,258 | | $ | 2,262 | | $ | 24,493 |
| $ | 12,241 |
| $ | 9,062 |
| $ | 4,711 |
| $ | 26,014 |
Less: Accumulated amortization | | | (14,388) | | | (5,389) | | | (1,109) | | | (20,886) |
|
| (10,161) |
|
| (7,224) |
|
| (4,080) |
|
| (21,465) |
Net intangible assets other than goodwill | | $ | 585 | | $ | 1,869 | | $ | 1,153 | | $ | 3,607 |
| $ | 2,080 |
| $ | 1,838 |
| $ | 631 |
| $ | 4,549 |
| | | | | | | | |
|
|
|
|
|
|
|
|
| | | | | | | | | | | |
|
|
|
|
|
|
|
|
|
|
|
| | As of December 31, 2018 |
| As of December 31, 2019 |
(Dollars in thousands) | | Beneficial
Leases | | Trade
Name | | Other
Intangible
Assets | | Total |
| Beneficial
Leases |
| Trade
Name |
| Other
Intangible
Assets |
| Total |
Gross carrying amount | | $ | 28,592 | | $ | 7,254 | | $ | 1,951 | | $ | 37,797 |
| $ | 15,048 |
| $ | 7,258 |
| $ | 3,145 |
| $ | 25,451 |
Less: Accumulated amortization | | | (24,145) | | | (5,207) | | | (1,076) | | | (30,428) |
|
| (14,496) |
|
| (5,449) |
|
| (1,186) |
|
| (21,131) |
Net intangible assets other than goodwill | | $ | 4,447 | | $ | 2,047 | | $ | 875 | | $ | 7,369 |
| $ | 552 |
| $ | 1,809 |
| $ | 1,959 |
| $ | 4,320 |
Beneficial leases wereobtained in business combinations where we are the landlord are amortized over the life of the lease up to 30 years up until January 1, 2019. Under ASC 842 they are now incorporated into the relevant right-of-use asset.leases. Trade names are amortized based on the accelerated amortization method over their estimated useful life of 30 years, and other intangible assets are amortized over their estimated useful lives of up to 30 years (except for transferrable liquor licenses, which are indefinite-lived assets). The table below summarizes the amortization expense of intangible assets for the quarter and ninesix months ended SeptemberJune 30, 2019. 2020.
| | | | | | | | |
|
|
|
|
|
|
|
|
| | | | | | | | | | |
|
|
|
|
|
|
|
|
|
|
| | Quarter Ended | | Nine Months Ended |
| Quarter Ended |
| Six Months Ended |
| | September 30, | | September 30, |
| June 30, |
| June 30, |
(Dollars in thousands) | | 2019 | | 2018 | | 2019 | | 2018 |
| 2020 |
| 2019 |
| 2020 |
| 2019 |
Beneficial lease amortization | | $ | 60 | | $ | 284 | | $ | 224 | | $ | 783 |
| $ | 25 |
| $ | 85 |
| $ | 50 |
| $ | 164 |
Other amortization | | | 106 | | | 380 | | | 311 | | | 285 |
|
| 229 |
|
| 104 |
|
| 306 |
|
| 205 |
Total intangible assets amortization | | $ | 166 | | $ | 664 | | $ | 535 | | $ | 1,068 |
| $ | 254 |
| $ | 189 |
| $ | 356 |
| $ | 369 |
Note 89 – Prepaid and Other Assets
Prepaid and other assets are summarized as follows:
| | | | |
|
|
|
|
| | | | | | |
|
|
|
|
|
|
| | September 30, | | December 31, |
| June 30, |
| December 31, |
(Dollars in thousands) | | 2019 | | 2018 |
| 2020 |
| 2019 |
Prepaid and other current assets | | | | | | |
|
|
|
|
|
|
Prepaid expenses | | $ | 2,887 | | $ | 1,761 |
| $ | 2,689 |
| $ | 2,163 |
Prepaid rent | | | 895 | | 930 |
|
| 281 |
| 1,093 |
Prepaid taxes | | | 632 | | 646 |
|
| 2,220 |
| 912 |
Income taxes receivable | | | 6,148 | | 2,704 |
|
| 7,162 |
| 1,669 |
Deposits | | | 218 | | 242 |
|
| 245 |
| 214 |
Investment in marketable securities | | | 44 | | 42 |
|
| 26 |
| 47 |
Restricted cash | | | 7 | | | 1,342 |
|
| 7 |
|
| 7 |
Total prepaid and other current assets | | $ | 10,831 | | $ | 7,667 |
| $ | 12,630 |
| $ | 6,105 |
Other non-current assets | | | | | | |
|
|
|
|
|
|
Straight-line rent | | | 4,184 | | 4,150 |
|
| 5,129 |
| 4,689 |
Other non-cinema and non-rental real estate assets | | | 1,134 | | 1,134 |
|
| 1,134 |
| 1,134 |
Investment in Reading International Trust I | | | 838 | | 838 |
|
| 838 |
| 838 |
Long-term deposits | | | 8 | | 7 |
|
| 8 |
| 7 |
Total other non-current assets | | $ | 6,164 | | $ | 6,129 |
| $ | 7,109 |
| $ | 6,668 |
Note 910 – Income Taxes
The U.S. Coronavirus Aid, Relief, and Economic Security Act (the “CARES Act”) was enacted on March 27, 2020 to provide, among other things, tax relief to companies impacted by the COVID-19 pandemic. The CARES Act includes, among other items, provisions for net operating loss carryback, modifications to the business interest expense deduction, a technical correction to tax depreciation methods for qualified improvement property, and alternative minimum tax credit refunds. During the quarter ended March 31, 2020, we recorded a tax benefit of $3.6 million arising from the carryback of the net operating loss generated in the taxable year ended December 31, 2019.
The interim provision for income taxes is different from the amount determined by applying the U.S. federal statutory rate to consolidated income or loss before taxes. The differences are attributable to foreign tax rate differential, unrecognized tax benefits, and foreign tax credit. Our effective tax rate was 51.1%13.7% and 32.7%78.8% for the ninesix months ended SeptemberJune 30, 20192020 and 2018,2019, respectively. The change between 20192020 and 20182019 is primarily due to lower pretax income and accrued interest related to uncertain tax benefits.benefits from the carryback of the Company’s 2019 net operating loss, as the result of the CARES Act, to 2015 and 2016 tax years where the federal tax rate was 35%, offset by increase in valuation allowance in 2020. The forecasted effective tax rate is updated each quarter as new information becomes available.
Note 1011 – Debt
The Company’s borrowings at SeptemberJune 30, 20192020 and December 31, 2018,2019, net of deferred financing costs and including the impact of interest rate derivatives on effective interest rates, are summarized below:
| | | | | | | | | | | | | | | |
|
|
|
|
|
|
|
|
|
|
|
|
|
|
|
| | | | | | | | | | | | | | | |
|
|
|
|
|
|
|
|
|
|
|
|
|
|
|
| | As of September 30, 2019 |
| As of June 30, 2020 |
(Dollars in thousands) | | Maturity Date | | Contractual
Facility | | Balance,
Gross | | Balance,
Net(1) | | Stated
Interest Rate | | Effective
Interest
Rate |
| Maturity Date |
| Contractual
Facility |
| Balance,
Gross |
| Balance,
Net(1) |
| Stated
Interest Rate |
| Effective
Interest
Rate |
Denominated in USD | | | | | | | | | | | | | | | |
|
|
|
|
|
|
|
|
|
|
|
|
|
|
|
Trust Preferred Securities (USA) | | April 30, 2027 | | $ | 27,913 | | $ | 27,913 | | $ | 26,228 | | 6.27% | | 6.27% |
| April 30, 2027 |
| $ | 27,913 |
| $ | 27,913 |
| $ | 26,395 |
| 4.76% |
| 4.76% |
Bank of America Credit Facility (USA) | | October 1, 2020 | | | 55,000 | | | 27,000 | | | 26,959 | | 4.79% | | 4.79% |
| March 6, 2023 |
|
| 55,000 |
|
| 55,000 |
|
| 54,906 |
| 3.18% |
| 3.18% |
Bank of America Line of Credit (USA) | | October 1, 2020 | | | 5,000 | | | 5,000 | | | 5,000 | | 5.04% | | 5.04% |
| March 6, 2023 |
|
| 5,000 |
|
| 5,000 |
|
| 5,000 |
| 3.18% |
| 3.18% |
Banc of America digital projector loan (USA) | | December 28, 2019 | | | 706 | | | 706 | | | 706 | | 5.00% | | 5.00% | |
Cinemas 1, 2, 3 Term Loan (USA) | | December 1, 2019 | | | 18,767 | | | 18,767 | | | 18,597 | | 3.25% | | 3.25% |
| April 1, 2022 |
|
| 24,907 |
|
| 24,907 |
|
| 24,498 |
| 4.25% |
| 4.25% |
Minetta & Orpheum Theatres Loan (USA)(2) | | November 1, 2023 | | | 8,000 | | | 8,000 | | | 7,880 | | 4.15% | | 5.15% |
| November 1, 2023 |
|
| 8,000 |
|
| 8,000 |
|
| 7,900 |
| 2.22% |
| 5.15% |
U.S. Corporate Office Term Loan (USA) | | January 1, 2027 | | | 9,320 | | | 9,320 | | | 9,210 | | 4.64% / 4.44% | | 4.61% |
| January 1, 2027 |
|
| 9,199 |
|
| 9,199 |
|
| 9,100 |
| 4.64% / 4.44% |
| 4.61% |
Purchase Money Promissory Note | | September 18, 2024 | | | 3,519 | | | 3,519 | | | 3,519 | | 5.00% | | 5.00% | |
Purchase Money Promissory Note (USA) | |
| September 18, 2024 |
|
| 3,045 |
|
| 3,045 |
|
| 3,045 |
| 5.00% |
| 5.00% |
Union Square Construction Financing (USA) | | December 29, 2019 | | | 50,000 | | | 32,350 | | | 31,915 | | 6.27% | | 6.27% |
| December 29, 2020 |
|
| 50,000 |
|
| 39,506 |
|
| 39,396 |
| 5.50% |
| 5.50% |
Denominated in foreign currency ("FC") (3) | | | | | | | | | | | | | | | |
|
|
|
|
|
|
|
|
|
|
|
|
|
|
|
NAB Corporate Term Loan (AU) | | December 31, 2023 | | | 80,952 | | | 54,977 | | | 54,782 | | 1.91% | | 1.91% |
| December 31, 2023 |
|
| 82,716 |
|
| 82,716 |
|
| 82,553 |
| 1.29% |
| 1.29% |
Westpac Bank Corporate (NZ) | | December 31, 2023 | | | 20,038 | | | 7,514 | | | 7,514 | | 3.05% | | 3.05% |
| December 31, 2023 |
|
| 20,627 |
|
| 20,627 |
|
| 20,628 |
| 2.30% |
| 2.30% |
| | | | $ | 279,215 | | $ | 195,066 | | $ | 192,310 | | | | |
|
|
| $ | 286,407 |
| $ | 275,913 |
| $ | 273,421 |
|
|
|
|
(1)Net of deferred financing costs amounting to $2.5 million. (2)The interest rate derivative associated with the Minetta & Orpheum loan provides for an effective fixed rate of 5.15%. (3) | (1)
| | Net of deferred financing costs amounting to $2.8 million.
|
| (2)
| | The interest rate derivative associated with the Minetta & Orpheum loan provides for an effective fixed rate of 5.15%.
|
The contractual facilities and outstanding balances of the foreign currency denominated borrowings were translated into U.S. dollars based on the applicable exchange rates as of June 30, 2020.
| | | | | | | | | | | | | | | |
|
|
|
|
|
|
|
|
|
|
|
|
|
|
|
| | | | | | | | | | | | | | | |
|
|
|
|
|
|
|
|
|
|
|
|
|
|
|
| | As of December 31, 2018 |
| As of December 31, 2019 |
(Dollars in thousands) | | Maturity Date | | Contractual
Facility | | Balance,
Gross | | Balance, Net(1) | | Stated
Interest
Rate | | Effective Interest Rate |
| Maturity Date |
| Contractual
Facility |
| Balance,
Gross |
| Balance, Net(1) |
| Stated
Interest
Rate |
| Effective Interest Rate |
Denominated in USD | | | | | | | | | | | | | | | |
|
|
|
|
|
|
|
|
|
|
|
|
|
|
|
Trust Preferred Securities (USA)(2) | | April 30, 2027 | | $ | 27,913 | | $ | 27,913 | | $ | 26,061 | | 6.52% | | 6.52% |
| April 30, 2027 |
| $ | 27,913 |
| $ | 27,913 |
| $ | 26,311 |
| 5.94% |
| 5.94% |
Bank of America Credit Facility (USA)(2) | | May 1, 2020 | | | 55,000 | | | 25,000 | | | 25,000 | | 5.02% | | 5.02% |
| March 6, 2023 |
|
| 55,000 |
|
| 33,500 |
|
| 33,445 |
| 4.80% |
| 4.80% |
Bank of America Line of Credit (USA) | | October 31, 2019 | | | 5,000 | | | — | | | — | | 5.48% | | 5.48% |
| March 6, 2023 |
|
| 5,000 |
|
| — |
|
| — |
| 4.80% |
| 4.80% |
Banc of America digital projector loan (USA) | | December 28, 2019 | | | 2,604 | | | 2,604 | | | 2,604 | | 5.00% | | 5.00% | |
Cinemas 1, 2, 3 Term Loan (USA) | | September 1, 2019 | | | 19,086 | | | 19,086 | | | 18,838 | | 3.25% | | 3.25% |
| April 1, 2022 |
|
| 18,658 |
|
| 18,658 |
|
| 18,532 |
| 3.25% |
| 3.25% |
Minetta & Orpheum Theatres Loan (USA) | | November 1, 2023 | | | 8,000 | | | 8,000 | | | 7,857 | | 4.88% | | 4.88% | |
Minetta & Orpheum Theatres Loan (USA)(2) | |
| November 1, 2023 |
|
| 8,000 |
|
| 8,000 |
|
| 7,887 |
| 3.74% |
| 5.15% |
U.S. Corporate Office Term Loan (USA) | | January 1, 2027 | | | 9,495 | | | 9,495 | | | 9,373 | | 4.64% / 4.44% | | 4.61% |
| January 1, 2027 |
|
| 9,260 |
|
| 9,260 |
|
| 9,153 |
| 4.64% / 4.44% |
| 4.64% |
Union Square Construction Financing (USA) | | December 29, 2019 | | | 57,500 | | | 27,182 | | | 25,280 | | 6.76% / 12.51% | | 8.35% |
| December 29, 2020 |
|
| 50,000 |
|
| 36,048 |
|
| 36,035 |
| 6.02% |
| 6.02% |
Purchase Money Promissory Note (USA) | |
| September 18, 2024 |
|
| 3,363 |
|
| 3,363 |
|
| 3,363 |
| 5.00% |
| 5.00% |
Denominated in foreign currency ("FC")(3) | | | | | | | | | | | | | | | |
|
|
|
|
|
|
|
|
|
|
|
|
|
|
|
NAB Corporate Loan Facility (AU) | | December 31, 2023 | | | 46,856 | | | 37,696 | | | 37,660 | | 3.05% | | 3.05% | |
Westpac Corporate Credit Facility (NZ) | | December 31, 2023 | | | 21,475 | | | 10,067 | | | 10,067 | | 3.80% | | 3.80% | |
| | | | $ | 252,929 | | $ | 167,043 | | $ | 162,740 | | | | | |
NAB Corporate Term Loan (AU) | |
| December 31, 2023 |
|
| 84,360 |
|
| 65,731 |
|
| 65,541 |
| 1.77% |
| 1.77% |
Westpac Bank Corporate (NZ) | |
| December 31, 2023 |
|
| 21,584 |
|
| 6,745 |
|
| 6,745 |
| 3.05% |
| 3.05% |
Total | |
|
|
| $ | 283,138 |
| $ | 209,218 |
| $ | 207,012 |
|
|
|
|
| (1)
| | Net of deferred financing costs amounting to $4.3 million.
|
| (2)
| | The interest rate derivatives associated with the Trust Preferred Securities and the Bank of America Credit Facility expired in October 2017 so the effective interest rate no longer applied as of December 31, 2018.
|
| (3)
| | The contractual facilities and outstanding balances of the foreign currency denominated borrowings were translated into U.S. dollars based on the applicable exchange rates as of December 31, 2018.
|
(1)Net of deferred financing costs amounting to $2.2 million.
(2)The interest rate derivative associated with the Minetta & Orpheum loan provides for an effective fixed rate of 5.15%.
(3)The contractual facilities and outstanding balances of the foreign currency denominated borrowings were translated into U.S. dollars based on the applicable exchange rates as of December 31, 2019.
Our loan arrangements are presented, net of the deferred financing costs, on the face of our consolidated balance sheet as follows:
| | | | |
|
|
|
|
| | | | |
|
|
|
|
| | September 30, | | December 31, |
| June 30, |
| December 31, |
Balance Sheet Caption | | 2019 | | 2018 |
| 2020 |
| 2019 |
Debt - current portion | | $ | 34,374 | | $ | 30,393 |
| $ | 40,331 |
| $ | 36,736 |
Debt - long-term portion | | 131,681 | | 106,286 |
| 203,650 |
|
| 140,602 |
Subordinated debt | | | 26,255 | | | 26,061 | |
Subordinated debt - current portion | |
| 644 |
|
| 644 |
Subordinated debt - long-term portion | |
|
| 28,796 |
|
| 29,030 |
Total borrowings | | $ | 192,310 | | $ | 162,740 |
| $ | 273,421 |
| $ | 207,012 |
Impact of COVID-19
As a result of the impact of COVID-19, we have obtained certain modifications to our loan agreements with the Bank of America, National Australia Bank and Westpac for the quarter ended June 30, 2020. These loan modifications included changes to some of the covenant compliance terms and waivers to certain covenant testing periods for these lenders. We currently have 0 covenant breaches to which loan modifications or waivers to the covenant testing periods have not been obtained.
Bank of America Credit Facility
On March 3, 2016,6, 2020, we amended our $55.0 million credit facility with Bank of America extending the maturity date to permit real property acquisition loans. This amendment reduces the applicable consolidated leverage ratio covenant by 0.25% and modifies the termMarch 6, 2023. The refinanced facility carries an interest rate of the facility2.5% - 3.0%, depending on certain financial ratios plus a variable rate based on the earlierloan defined “Eurodollar” interest rate.
On August 7, 2020, we modified certain financial covenants within this credit facility and temporarily suspended the testing of certain other covenant tests through measurement period ending September 30, 2021. The testing of the eighteen months fromfinancial covenant resumes for measurement period ending December 31, 2021. In addition to the datecovenant modifications, the interest rate on borrowings under this facility was fixed at 3.0% above the “Eurodollar” rate, which itself now has a floor of such borrowing or the maturity date of the credit agreement.1.0%. Such a modification was not considered to be substantial in accordance withunder U.S. GAAP. On March 5, 2019, this Credit Facility was extended for six (6) months to May 1, 2020. On August 8, 2019, this Credit Facility was extended by an additional four months to September 1, 2020. On November 5, 2019, this Credit Facility was further extended by an additional one month to October 1, 2020.
Bank of America Line of Credit
In October 2016,On March 6, 2020, the term of thisour $5.0 million line of credit was extended to October 31, 2019. Such modification was not considered to be substantial under US GAAP.March 6, 2023. On August 8, 2019,7, 2020 we modified the interest rate on this Lineline of Credit was extended an additional ten months to September 1, 2020. On November 5, 2019, this Linecredit, wherein the LIBOR portion of Credit was further extended by an additional one month to October 1, 2020.the rate now has a floor of 1.0%.
Minetta and Orpheum Theatres Loan
On October 12, 2018, we refinanced our $7.5 million loan with Santander Bank, which is secured by our Minetta and Orpheum Theatres, with a loan for a five year term of $8.0 million. Such modification was not considered to be substantial under USU.S. GAAP.
Banc of America Digital Projector Loan
On February 5, 2018, we purchased our U.S. digital cinema projectors, which had previously been held on operating leases, using a $4.6 million loan from Banc of America. We made further U.S. digital projector purchases, of projectors similarly held on other operating leases, in March and April 2018, increasing this loan to $4.9 million. This loan carries an interest rate of 5% and is due and payable December 28, 2019.
44 Union Square Construction Financing
On December 29, 2016, we closed on our new construction finance facilities totaling $57.5 million to fund the non-equity portion of the anticipated construction costs of the redevelopment of our property at 44 Union Square in New York City. The combined facilities consisted of $50.0 million in aggregate loans (comprised of three3 loan tranches) from Bank of the Ozarks (“BOTO”), and a $7.5 million mezzanine loan from Tammany Mezz Investor, LLC, an affiliate of Fisher Brothers. AtAs of December 31, 2016, Bank of the OzarksBOTO advanced $8.0 million to repay the then existing $8.0 million loan with East West Bank. As of September 30, 2019, an additional $24.4 million had been advanced under the senior loan facility. On August 8, 2019, we repaid in full the $7.5 million mezzanine loan from Tammany Mezz Investor, LLC. On January 24, 2020, we exercised the first of our 2 extension options on the BOTO loan, taking the maturity to December 29, 2020.
U.S. Corporate Office Term Loan
On December 13, 2016, we obtained a ten-yearten year $8.4 million mortgage loan on our new Los AngelesCulver City Corporate Headquarters at a fixed annual interest rate of 4.64%. This loan provided for a second loan upon completion of certain improvements. On June 26, 2017, we obtained a further $1.5 million under this provision at a fixed annual interest rate of 4.44%.
Cinemas 1,2,3 Term Loan
On August 31, 2016,March 13, 2020, Sutton Hill Properties LLC (“SHP”), a 75% subsidiary of RDI, refinanced its $15.0$20.0 million Santander Bank term loan with Valley National Bank with a new lender, Valley National Bank. This new $20.0term loan of $25.0 million, loan is collateralized by our Cinemas 1,2,3 property and bears an interest rate of 3.25% per annum, with principal installments4.25%, and accruing interest paid monthly. The new loan matured on September 1, 2019, with a one-time option to extend maturity date for another year. On August 8, 2019, this maturity date was extendedof April 1, 2022 with 2 six month options to December 1, 2019, with the one-time option to extend the maturity date for another year preserved. Such modification was not considered to be substantial under US GAAP. extend.
Purchase Money Promissory Note
On September 18, 2019, we purchased for $5.5 million 407,000 Company Class A shares in a privately negotiated transaction under our Share Repurchase Program for $5.5 million.Program. Of this amount, $3.5 million was paid by the issuance of a Purchase Money Promissory Note, which bears an interest rate of 5.0% per annum, payable in equal quarterly payments of principal plus accrued interest. The Purchase Money Promissory Note matures on September 18, 2024.
Westpac Bank Corporate Credit Facility (NZ)
On December 20, 2018, we restructured our Westpac Corporate Credit Facilities. The maturity of the 1st tranche (general/non-construction credit line) was extended to December 31, 2023, with the available facility being reduced from NZ$35.0 million to NZ$32.0 million. The facility bears an interest rate of 1.75% above the Bank Bill Bid Rate on the drawn down balance and a 1.1% line of credit charge on the entire facility. The 2nd tranche (construction line) with a facility of NZ$18.0 million was removed.
On June 29, 2020, Westpac pushed out the June 30, 2020 covenant testing date to July 31, 2020. On July 27, 2020, Westpac waived the requirement to test certain covenants as of July 31, 2020. This agreement also increased the interest rate and line of credit charge to 2.40% above the Bank Bill Bid Rate and 1.65% respectively. The maturity date was extended to January 1, 2024. Such modifications of this facility were not renewed.considered to be substantial under U.S. GAAP. At the request of Westpac, we have deposited $10.3 million (NZ$16.0 million) in a term deposit with Westpac, as we have no current operating need for such funds in New Zealand.
Australian NAB Corporate Term Loan (AU)
On March 15, 2019, we amended our Revolving Corporate Markets Loan Facility with National Australia Bank (“NAB”) from a facility comprised of (i) a AU$66.5 million loan facility with an interest rate of 0.95% above the Bank Bill Swap Bid Rate (“BBSY”) and a maturity date of June 30, 2019 and (ii) a bank guarantee of AU$5.0 million at a rate of 1.90% per annum into a (i) AU$120.0 million Corporate Loan facility at rates of 0.85%-1.30% above BBSY depending on certain ratios with a due date of December 31, 2023, of which AU$80.0 million is revolving and AU$40.0 million is core and (ii) a Bank Guarantee Facility of AU$5.0 million at a rate of 1.85% per annum. Such modifications of this particular term loan were not considered to be substantial under USU.S. GAAP.
On August 6, 2020, we modified certain covenants within this Revolving Corporate Markets Loan Facility. These modifications apply until the quarter ended June 30, 2021. In addition, for the period in which these covenant modifications apply, the interest rate on amounts borrowed under the facility is 1.75%. Such a modification was not considered to be substantial under U.S. GAAP.
Note 1112 – Other Liabilities
Other liabilities are summarized as follows:
| | | | |
|
|
|
|
| | | | |
|
|
|
|
| | September 30, | | December 31, |
| June 30, |
| December 31, |
(Dollars in thousands) | | 2019 | | 2018 |
| 2020 |
| 2019 |
Current liabilities | | | | | | |
|
|
|
|
|
|
Lease liability | | $ | 5,900 | | $ | 5,900 |
| $ | 5,900 |
| $ | — |
Liability for demolition costs | | 2,548 | | 2,630 |
| 2,623 |
| 2,745 |
Accrued pension | | 684 | | 684 |
| 684 |
| 684 |
Security deposit payable | | 83 | | 84 |
| 109 |
| 114 |
Finance lease liabilities | | 117 | | — |
| 51 |
| 93 |
Other | | | 7 | | | 7 |
|
| 33 |
|
| 17 |
Other current liabilities | | $ | 9,339 | | $ | 9,305 |
| $ | 9,400 |
| $ | 3,653 |
Other liabilities | | | | | | |
|
|
|
|
|
|
Straight-line rent | | $ | — | | $ | 16,362 | |
Lease make-good provision | | 5,930 | | 5,614 |
| 6,716 |
| 6,667 |
Accrued pension | | 4,571 | | 4,670 |
| 4,261 |
| 4,469 |
Environmental reserve | | 1,656 | | 1,656 |
| 1,656 |
| 1,656 |
Deferred revenue - real estate | | — | | 32 | |
Lease liability | |
| — |
| 5,900 |
Acquired leases | | 38 | | 91 |
| 32 |
| 37 |
Finance lease liabilities | | 128 | | — |
| 92 |
| 116 |
Other | | | 7 | | | 506 |
|
| 978 |
|
| 9 |
Other liabilities | | $ | 12,330 | | $ | 28,931 |
| $ | 13,735 |
| $ | 18,854 |
Pension Liability – Supplemental Executive Retirement Plan
On August 29, 2014, the Supplemental Executive Retirement Plan (“SERP”) that has been effective since March 1, 2007, was ended and replaced in accordance with the terms of a pension annuity. As a result of the termination of the SERP program, the accrued pension liability of $7.6 million was reversed and replaced with this pension annuity liability of $7.5 million. The valuation of the liability is based on the present value of $10.2 million discounted at a rate of 4.25% over a 15-year term, resulting in a monthly payment of $57,000. The discounted value of $2.7 million (which is the difference between the estimated payout of $10.2 million and the present value of $7.5 million) as of August 29, 2014 will be amortized and expensed based on the 15-year term. In addition, the accumulated actuarial loss of $3.1 million recorded, as part of other comprehensive income will also be amortized based on the 15-year term.
In February 2018, we made a payment of $2.4 million relating to the annuity representing payments for the 42 months outstanding at the time. Monthly ongoing payments of $57,000 are now being made.
As a result of the above, included in our current and non-current liabilities are accrued pension costs of $5.3$4.9 million at SeptemberJune 30, 2019.2020. The benefits of our pension plan are fully vested and therefore no0 service costs were recognized for the quarter and ninesix months ended SeptemberJune 30, 20192020 and 2018.2019. Our pension plan is unfunded.
During the quarter and ninesix months ended SeptemberJune 30, 2020, the interest cost was $66,000 and $134,000, respectively, and the actuarial loss was $51,000 and $103,000, respectively. During the quarter and six months ended June 30, 2019, the interest cost was $70,000$298,000 and $414,000$343,000, respectively, and the actuarial loss was $52,000 and $155,000$103,000, respectively. During the quarter and nine months ended September 30, 2018, the interest cost was $45,000 and $135,000 respectively, and the actuarial loss was $52,000 and $156,000 respectively.
Note 1213 – Accumulated Other Comprehensive Income
The following table summarizes the changes in each component of accumulated other comprehensive income attributable to RDI:
| | | | | | | | | | | | | |
|
|
|
|
|
|
|
|
|
|
| | | | | | | | | | | | | |
|
|
|
|
|
|
|
|
|
|
(Dollars in thousands) | Foreign
Currency
Items | | Unrealized
Gain (Losses)
on Available-
for-Sale
Investments | | Accrued
Pension
Service Costs | | Hedge Accounting Reserve | | Total | Foreign
Currency
Items |
| Unrealized
Gain (Losses)
on Available-
for-Sale
Investments |
| Accrued
Pension
Service Costs |
| Hedge
Accounting
Reserve |
| Total |
Balance at January 1, 2019 | $ | 8,687 | | $ | 3 | | $ | (2,438) | | $ | (137) | | $ | 6,115 | |
Balance at January 1, 2020 | | $ | 8,118 |
| $ | 10 |
| $ | (2,287) |
| $ | (252) |
| $ | 5,589 |
| | | | | | | | | | | | | |
|
|
|
|
|
|
|
|
|
|
|
|
|
Change related to derivatives | | | | | | | | | | | | | |
|
|
|
|
|
|
|
|
|
|
|
|
|
Total change in hedge fair value recorded in Other Comprehensive Income | | — | | | — | | | — | | | (253) | | | (253) |
| — |
|
| — |
|
| — |
| (285) |
|
| (285) |
Other comprehensive income before reclassifications | |
|
|
|
|
|
|
|
|
|
| — |
|
| — |
Amounts reclassified from accumulated other comprehensive income | | — | | | — | | | — | | | 42 | | | 42 |
| — |
|
| — |
|
| — |
|
| 80 |
|
| 80 |
Net change related to derivatives | | — | | | — | | | — | | | (211) | | | (211) |
| — |
|
| — |
|
| — |
|
| (205) |
|
| (205) |
| | | | | | | | | | | | | |
|
|
|
|
|
|
|
|
|
|
|
|
|
Net current-period other comprehensive income (loss) | | (7,351) | | | 4 | | | 155 | | | (211) | | | (7,403) |
| (5,051) |
|
| (19) |
|
| 103 |
|
| (205) |
|
| (5,172) |
Balance at September 30, 2019 | $ | 1,336 | | $ | 7 | | $ | (2,283) | | $ | (348) | | $ | (1,288) | |
Balance at June 30, 2020 | | $ | 3,067 |
| $ | (9) |
| $ | (2,184) |
| $ | (457) |
| $ | 417 |
Note 1314 – Commitments and Contingencies
Litigation General
We are currently involved in certain legal proceedings and, as required, have accrued estimates of probable and estimable losses for the resolution of these claims, including legal costs.
| ·
| | Where we are a plaintiff, we accrue legal fees as incurred on an on-going basis and make no provision for any potential settlement amounts until received. In Australia, the prevailing party is usually entitled to recover its attorneys’ fees, which recoveries typically work out to be approximately 60% of the amounts actually spent where first-class legal counsel is engaged at customary rates. Where we are a plaintiff, we have likewise made no provision for the liability for the defendant’s attorneys' fees in the event we are determined not to be the prevailing party.
|
| ·
| | Where we are a defendant, we accrue for probable damages that insurance may not cover as they become known and can be reasonably estimated, as permitted under ASC 450-20 Loss Contingencies. In our opinion, any claims and litigation in which we are currently involved are not reasonably likely to have a material adverse effect on our business, results of operations, financial position, or liquidity. It is possible, however, that future results of the operations for any particular quarterly or annual period could be materially affected by the ultimate outcome of the legal proceedings. From time-to-time, we are involved with claims and lawsuits arising in the ordinary course of our business that may include contractual obligations, insurance claims, tax claims, employment matters, and anti-trust issues, among other matters.
|
Where we are a plaintiff, we accrue legal fees as incurred on an on-going basis and make no provision for any potential settlement amounts until received. In Australia, the prevailing party is usually entitled to recover its attorneys’ fees, which recoveries typically work out to be approximately 60% of the amounts actually spent where first-class legal counsel is engaged at customary rates. Where we are a plaintiff, we have likewise made no provision for the liability for the defendant’s attorneys' fees in the event we are determined not to be the prevailing party.
Where we are a defendant, we accrue for probable damages that insurance may not cover as they become known and can be reasonably estimated, as permitted under ASC 450-20 Loss Contingencies. In our opinion, any claims and litigation in which we are currently involved are not reasonably likely to have a material adverse effect on our business, results of operations, financial position, or liquidity. It is possible, however, that future results of the operations for any particular quarterly or annual period could be materially affected by the ultimate outcome of the legal proceedings. From time-to-time, we are involved with claims and lawsuits arising in the ordinary course of our business that may include contractual obligations, insurance claims, tax claims, employment matters, and anti-trust issues, among other matters.
All of these matters require significant judgments based on the facts known to us. These judgments are inherently uncertain and can change significantly when additional facts become known. We provide accruals for matters that have probable likelihood of occurrence and can be properly estimated as to their expected negative outcome. We do not record expected gains until the proceeds are received by us. However, we typically make no accruals for potential costs of defense, as such amounts are inherently uncertain and dependent upon the scope, extent and aggressiveness of the activities of the applicable plaintiff.
Environmental and Asbestos Claims on Reading Legacy Operations
Certain of our subsidiaries were historically involved in railroad operations, coal mining, and manufacturing. Also, certain of these subsidiaries appear in the chain-of-title of properties that may suffer from pollution. Accordingly, certain of these subsidiaries have, from time-to-time, been named in and may in the future be named in various actions brought under applicable environmental laws. Also, we are in the real estate development business and may encounter from time-to-time unanticipated environmental conditions at properties that we have acquired for development. These environmental conditions can increase the cost of such projects and adversely affect the value and potential for profit of such projects. We do not currently believe that our exposure under applicable environmental laws is material in amount.
From time to time, there are claims brought against us relating to the exposure of former employees of our railroad operations to asbestos and coal dust. These are generally covered by an insurance settlement reached in September 1990 with our insurance providers. However, this insurance settlement does not cover litigation by people who were not our employees and who may claim
second-hand exposure to asbestos, coal dust and/or other chemicals or elements now recognized as potentially causing cancer in humans. Our known exposure to these types of claims, asserted or probable of being asserted, is not material.
Cotter Jr. Derivative Litigation
This action was originally brought by James J. Cotter, Jr. (“Cotter Jr.”) in June 2015 in the Nevada District Court against all of the Directors of the Company and against the Company as a nominal defendant: James J. Cotter, Jr., individually and derivatively on behalf of Reading International, Inc. vs. Margaret Cotter, et al.” Case No,:No: A-15-719860-V. Summary judgment has been entered against Cotter, Jr., and in favor of all defendants and a $1.55 million cost judgment has been entered against Cotter, Jr., and in favor of our Company. Cotter, Jr. has appealed both judgements. Our application for attorney’s fees was denied, and we have appealed that determination. The issues on appeal are currently being briefed. No dateThe appeals have been consolidated and fully briefed and are scheduled for oral argument has been set. It is unlikely that any hearing will be held this year.before the Nevada Supreme Court on September 8, 2020. As the Directors and Officers Liability Insurance Policy covering Cotter, Jr.’s claims in the Derivative Case ($10.0 million) has been exhausted, the financial burden of defending our Directors against these claims, as required by applicable Nevada Law, has fallen upon our Company. During 2018,2019, out-of-pocket third partythird-party costs in the amount of approximately $3.5 million$925,000 were incurred by our Company in defending against these claims. For the ninesix months ended SeptemberJune 30, 2019,2020, an additional $782,000$75,000 had been expensed, relating principally to the preparation of appellate briefs with respect to the Derivative Litigation.
Employment Litigation
The Company is currently involved in two2 California employment matters which include substantially overlapping wage and hour claims: Taylor Brown, individually, and on behalf of other members of the general public similarly situated vs. Reading Cinemas et al. Superior Court of the State of California for the County of Kern, Case No. BCV-19-1000390 (“Brown v. RC,” and the “Brown Class Action Complaint” respectively) and Peter M. Wagner, Jr., an individual, vs. Consolidated Entertainment, Inc. et al., Superior Court of the State of California for the County of San Diego, Case NO. 37-2019-00030695-CU-WT-CTL (“Wagner v. CEI,” and the “Wagner Individual Complaint” respectively). Brown v. RC was initially filed in December 2018, as an individual action and refiled as a putative class action in February 2019, but not served until June 24, 2019. These lawsuits seek damages, and attorneys’ fees, relating to alleged violations of California labor laws relating to meal periods, rest periods, reporting time pay, unpaid wages, timely pay upon termination and wage statements violations. Wagner v. CEI was filed as a discrimination and retaliation lawsuit in June 2019. The following month, in July 2019, a notice was served on us by separate counsel for Mr. Wagner under the California Private Attorney General Act of 2004 (Cal. Labor Code Section 2698, et seq)seq) (the “Wagner PAGA Claim”) purportedly asserting in a representational capacity claims under the PAGA statute, overlapping, in substantial part, the allegations set forth in the Brown Class Action Complaint. On March 6, 2020, Wagner filed a purported class action in the Superior Court of California, County of San Diego, again covering basically the same allegations as set forth in the Brown Class Action Complaint, and titled Peter M. Wagner, an individual, on behalf of himself and all others similarly situated vs. Reading International, Inc., Consolidated Entertainment, Inc. and Does 1 through 25, Case No. 37-2020-000127-CU-OE-CTL (the “Wagner Class Action”). Neither plaintiff has specified the amount of damages sought.
The Company is investigating and intends to vigorously defend the allegations of the Brown Class Action Complaint, the Wagner Individual Complaint, and the Wagner PAGA Claim and deniesthe Wagner Class Action Complaint. In addition, we have denied that a PAGA representative action is appropriate. These matters are in their early stages, and the putative class action hasactions have not been certified. As these cases are in early stages, the Company is unable to predict the outcome of the litigation or the range of potential loss, if any; however, the Company believes that its potential liability with respect to such matters is not material to its overall financial position, results of operations and cash flows. Accordingly, the Company has not established a reserve for loss in connection with these matters.
Note 1415 – Non-controlling Interests
These are composed of the following enterprises:
| ·
| | Australia Country Cinemas Pty Ltd. - 25% noncontrolling interest owned by Panorama Group International Pty Ltd.;
|
| ·
| | Shadow View Land and Farming, LLC - 50% noncontrolling membership interest owned by either the estate of Mr. James J. Cotter, Sr. (the “Cotter Estate”) and/or the James J. Cotter, Sr. Living Trust (the “Cotter Trust”); and,
|
| ·
| | Sutton Hill Properties, LLC - 25% noncontrolling interest owned by Sutton Hill Capital, LLC (which in turn is 50% owned by the Cotter Estate and/or the Cotter Trust).
|
Australia Country Cinemas Pty Ltd. - 25% noncontrolling interest owned by Panorama Group International Pty Ltd.;
Shadow View Land and Farming, LLC - 50% noncontrolling membership interest owned by either the estate of Mr. James J. Cotter, Sr. (the “Cotter Estate”) and/or the James J. Cotter, Sr. Living Trust (the “Cotter Trust”); and,
Sutton Hill Properties, LLC - 25% noncontrolling interest owned by Sutton Hill Capital, LLC (which in turn is 50% owned by the Cotter Estate and/or the Cotter Trust).
The components of noncontrolling interests are as follows:
| | | | |
|
|
|
|
| | | | | | |
|
|
|
|
|
|
| | September 30, | | December 31, |
| June 30, |
| December 31, |
(Dollars in thousands) | | 2019 | | 2018 |
| 2020 |
| 2019 |
Australian Country Cinemas, Pty Ltd | | $ | 68 | | $ | 89 |
| $ | 64 |
| $ | 119 |
Shadow View Land and Farming, LLC | | 2,131 | | 2,153 |
| 2,102 |
|
| 2,145 |
Sutton Hill Properties, LLC | | | 2,000 | | | 2,095 |
|
| 1,826 |
|
| 2,003 |
Noncontrolling interests in consolidated subsidiaries | | $ | 4,199 | | $ | 4,337 |
| $ | 3,992 |
| $ | 4,267 |
The components of income attributable to noncontrolling interests are as follows:
| | | | | | | | |
|
|
|
|
|
|
|
|
| | | | | | | | | | | | |
|
|
|
|
|
|
|
|
|
|
|
|
| | Quarter Ended | | Nine Months Ended |
| Quarter Ended |
| Six Months Ended |
| | September 30, | | September 30, |
| June 30, |
| June 30, |
(Dollars in thousands) | | 2019 | | 2018 | | 2019 | | 2018 |
| 2020 |
| 2019 |
| 2020 |
| 2019 |
Australian Country Cinemas, Pty Ltd | | $ | 32 | | $ | (36) | | $ | 69 | | $ | 96 |
| $ | (45) |
| $ | 28 |
| $ | (46) |
| $ | 36 |
Shadow View Land and Farming, LLC | | (43) | | (16) | | (77) | | (41) |
|
| (22) |
| (20) |
| (43) |
| (34) |
Sutton Hill Properties, LLC | | | (39) | | | 14 | | | (95) | | | 33 |
|
| (118) |
|
| (45) |
|
| (177) |
|
| (55) |
Net income (loss) attributable to noncontrolling interests | | $ | (50) | | $ | (38) | | $ | (103) | | $ | 88 |
| $ | (185) |
| $ | (37) |
| $ | (266) |
| $ | (53) |
Summary of Controlling and Noncontrolling Stockholders’ Equity
A summary of the changes in controlling and noncontrolling stockholders’ equity is as follows:
| | | | | | | | | | | | | | | | | | | | |
|
|
|
|
|
|
|
|
|
|
|
|
|
|
|
|
|
|
|
|
| Common Shares | | | Retained | | | Accumulated | Reading | | | | | Common Shares |
|
| Retained |
|
| Accumulated | Reading |
|
|
|
|
| Class A | Class A | Class B | Class B | Additional | Earnings | | | Other | International Inc. | | | Total | Class A | Class A | Class B | Class B | Additional | Earnings |
|
| Other | International Inc. |
|
| Total |
| Non-Voting | Par | Voting | Par | Paid-In | (Accumulated | Treasury | Comprehensive | Stockholders’ | Noncontrolling | Stockholders’ | Non-Voting | Par | Voting | Par | Paid-In | (Accumulated | Treasury | Comprehensive | Stockholders’ | Noncontrolling | Stockholders’ |
(Dollars in thousands, except shares) | Shares | Value | Shares | Value | Capital | Deficit) | Shares | Income/(Loss) | Equity | Interests | Equity | Shares | Value | Shares | Value | Capital | Deficit) | Shares | Income (Loss) | Equity | Interests | Equity |
At January 1, 2019 | 21,195 | $ | 232 | 1,680 | $ | 17 | $ | 147,452 | $ | 47,616 | $ | (25,222) | $ | 6,115 | $ | 176,210 | $ | 4,337 | $ | 180,547 | |
Net income | — | | — | — | | — | | — | | (2,081) | | — | | — | | (2,081) | | (16) | | (2,097) | |
Adjustments to opening retained earnings on adoption of ASC 842 | — | | — | — | | — | | — | | 28 | | — | | — | | 28 | | (46) | | (18) | |
At January 1, 2020 | | 20,103 | $ | 231 | 1,680 | $ | 17 | $ | 148,602 | $ | 20,647 | $ | (39,737) | $ | 5,589 | $ | 135,349 | $ | 4,267 | $ | 139,616 |
Net income (loss) | | — |
| — | — |
| — |
| — |
| (5,875) |
| — |
| — |
| (5,875) |
| (81) |
| (5,956) |
Other comprehensive income, net | — | | — | — | | — | | — | | — | | — | | 1,510 | | 1,510 | | 1 | | 1,511 | — |
| — | — |
| — |
| — |
| — |
| — |
| (15,879) |
| (15,879) |
| (18) |
| (15,897) |
Share-based compensation expense | — | | — | — | | — | | 280 | | — | | — | | — | | 280 | | — | | 280 | — |
| — | — |
| — |
| 336 |
| — |
| — |
| — |
| 336 |
| — |
| 336 |
Share repurchase plan | — | | — | — | | — | | — | | — | | (9) | | — | | (9) | | — | | (9) | (75) |
| — | — |
| — |
| — |
| — |
| (670) |
| — |
| (670) |
| — |
| (671) |
Class A common stock issued for share-based bonuses and options exercised | — | | — | — | | — | | (185) | | — | | — | | — | | (185) | | — | | (185) | |
In-kind exchange of share for the exercise of options, net issued | — | | — | — | | — | | — | | — | | — | | — | | — | | — | | — | — |
| — | — |
| — |
| — |
| — |
| — |
| — |
| — |
| — |
| — |
Restricted Stock Units | 40 | | 1 | — | | — | | (75) | | — | | — | | — | | (74) | | — | | (74) | 19 |
|
| — |
| — |
| (30) |
| — |
| — |
| — |
| (30) |
| — |
| (30) |
Contributions from noncontrolling stockholders | — | | — | — | | — | | — | | — | | — | | — | | — | | 18 | | 18 | — |
| — | — |
| — |
| — |
| — |
| — |
| — |
| — |
| — |
| — |
Distributions to noncontrolling stockholders | — | | — | — | | — | | — | | — | | — | | — | | — | | (27) | | (27) | — |
| — | — |
| — |
| — |
| — |
| — |
| — |
| — |
| — |
| — |
At March 31, 2019 | 21,235 | $ | 233 | 1,680 | $ | 17 | $ | 147,472 | $ | 45,563 | $ | (25,231) | $ | 7,625 | $ | 175,679 | $ | 4,267 | $ | 179,946 | |
At March 31, 2020 | | 20,047 | $ | 231 | 1,680 | $ | 17 | $ | 148,908 | $ | 14,772 | $ | (40,407) | $ | (10,290) | $ | 113,231 | $ | 4,168 | $ | 117,399 |
Net income | — | | — | — | | — | | — | | 2,394 | | — | | — | | 2,394 | | (37) | | 2,357 | — |
| — | — |
| — |
| — |
| (22,702) |
| — |
| — |
| (22,702) |
| (185) |
| (22,887) |
Other comprehensive income, net | — | | — | — | | — | | — | | — | | — | | (2,346) | | (2,346) | | (1) | | (2,347) | — |
| — | — |
| — |
| — |
| — |
| — |
| 10,707 |
| 10,707 |
| 9 |
| 10,716 |
Share-based compensation expense | — | | — | — | | — | | 400 | | — | | — | | — | | 400 | | — | | 400 | — |
| — | — |
| — |
| 369 |
| — |
| — |
| — |
| 369 |
| — |
| 369 |
Share repurchase plan | (197) | | — | — | | — | | — | | — | | (2,622) | | — | | (2,622) | | — | | (2,622) | — |
| — | — |
| — |
| — |
| — |
| 0 |
| — |
| 0 |
| — |
| 0 |
Class A common stock issued for share-based bonuses and options exercised | — | | — | — | | — | | — | | — | | — | | — | | — | | — | | — | — |
| — | — |
| — |
| — |
| — |
| — |
| — |
| — |
| — |
| — |
In-kind exchange of share for the exercise of options, net issued | — | | — | — | | — | | — | | — | | — | | — | | — | | — | | — | — |
| — | — |
| — |
| — |
| — |
| — |
| — |
| — |
| — |
| — |
Restricted Stock Units | 33 | | — | — | | — | | (31) | | — | | — | | — | | (31) | | — | | (31) | 21 |
|
| — |
| — |
| (11) |
| — |
| — |
| — |
| (11) |
| — |
| (11) |
Contributions from noncontrolling stockholders | — | | — | — | | — | | — | | — | | — | | — | | — | | 9 | | 9 | — |
| — | — |
| — |
| — |
| — |
| — |
| — |
| — |
| — |
| — |
Distributions to noncontrolling stockholders | — | | — | — | | — | | — | | — | | — | | — | | — | | (15) | | (15) | — |
| — | — |
| — |
| — |
| — |
| — |
| — |
| — |
| — |
| — |
At June 30, 2019 | 21,071 | $ | 233 | 1,680 | $ | 17 | $ | 147,841 | $ | 47,957 | $ | (27,853) | $ | 5,279 | $ | 173,474 | $ | 4,223 | $ | 177,697 | |
Net income | — | | — | — | | — | | — | | 902 | | — | | — | | 902 | | (50) | | 852 | |
Other comprehensive income, net | — | | — | — | | — | | — | | — | | — | | (6,567) | | (6,567) | | (2) | | (6,569) | |
Share-based compensation expense | — | | — | — | | — | | 417 | | — | | — | | — | | 417 | | — | | 417 | |
Share repurchase plan | (660) | | — | — | | — | | — | | — | | (8,690) | | — | | (8,690) | | — | | (8,690) | |
Class A common stock issued for share-based bonuses and options exercised | — | | — | — | | — | | — | | — | | — | | — | | — | | — | �� | — | |
In-kind exchange of share for the exercise of options, net issued | — | | — | — | | — | | — | | — | | — | | — | | — | | — | | — | |
Restricted Stock Units | (6) | | — | — | | — | | (22) | | — | | — | | — | | (22) | | — | | (22) | |
Retirements | — | | (2) | — | | — | | — | | — | | 2 | | — | | — | | — | | — | |
Contributions from noncontrolling stockholders | — | | — | — | | — | | — | | — | | — | | — | | — | | 28 | | 28 | |
Distributions to noncontrolling stockholders | — | | — | — | | — | | — | | — | | — | | — | | — | | — | | — | |
At September 30, 2019 | 20,405 | $ | 231 | 1,680 | $ | 17 | $ | 148,236 | $ | 48,859 | $ | (36,541) | $ | (1,288) | $ | 159,514 | $ | 4,199 | $ | 163,713 | |
At June 30, 2020 | | 20,068 |
| 231 | 1,680 |
| 17 |
| 149,266 |
| (7,930) |
| (40,407) |
| 417 |
| 101,594 |
| 3,992 |
| 105,586 |
|
|
|
|
|
|
|
|
|
|
|
|
|
|
|
|
|
|
|
|
|
| Common Shares |
|
| Retained |
|
| Accumulated | Reading |
|
|
|
|
| Class A | Class A | Class B | Class B | Additional | Earnings |
|
| Other | International Inc. |
|
| Total |
| Non-Voting | Par | Voting | Par | Paid-In | (Accumulated | Treasury | Comprehensive | Stockholders’ | Noncontrolling | Stockholders’ |
(Dollars in thousands, except shares) | Shares | Value | Shares | Value | Capital | Deficit) | Shares | Income (Loss) | Equity | Interests | Equity |
At January 1, 2019 | 21,195 | $ | 232 | 1,680 | $ | 17 | $ | 147,452 | $ | 47,048 | $ | (25,222) | $ | 6,115 | $ | 175,642 | $ | 4,337 | $ | 179,979 |
Net income (loss) | — |
| — | — |
| — |
| — |
| (2,124) |
| — |
| — |
| (2,124) |
| (16) |
| (2,140) |
Adjustments to opening retained earnings on adoption of ASC 842 | — |
| — | — |
| — |
| — |
| 28 |
| — |
| — |
| 28 |
| (46) |
| (18) |
Other comprehensive income, net | — |
| — | — |
| — |
| — |
| — |
| — |
| 1,510 |
| 1,510 |
| 1 |
| 1,511 |
Share-based compensation expense | — |
| — | — |
| — |
| 280 |
| — |
| — |
| — |
| 280 |
| — |
| 280 |
Share repurchase plan | — |
| — | — |
| — |
| — |
| — |
| (9) |
| — |
| (9) |
| — |
| (9) |
Class A common stock issued for share-based bonuses and options exercised | — |
| — | — |
| — |
| (185) |
| — |
| — |
| — |
| (185) |
| — |
| (185) |
Restricted Stock Units | 40 |
| 1 | — |
| — |
| (75) |
| — |
| — |
| — |
| (74) |
| — |
| (74) |
Contributions from noncontrolling stockholders | — |
| — | — |
| — |
| — |
| — |
| — |
| — |
| — |
| 18 |
| 18 |
Distributions to noncontrolling stockholders | — |
| — | — |
| — |
| — |
| — |
| — |
| — |
| — |
| (27) |
| (27) |
At March 31, 2019 | 21,235 | $ | 233 | 1,680 | $ | 17 | $ | 147,472 | $ | 44,952 | $ | (25,231) | $ | 7,625 | $ | 175,068 | $ | 4,267 | $ | 179,335 |
Net income | — |
| — | — |
| — |
| — |
| 2,331 |
| — |
| — |
| 2,331 |
| (37) |
| 2,294 |
Other comprehensive income, net | — |
| — | — |
| — |
| — |
| — |
| — |
| (2,346) |
| (2,346) |
| (1) |
| (2,347) |
Share-based compensation expense | — |
| — | — |
| — |
| 400 |
| — |
| — |
| — |
| 400 |
| — |
| 400 |
Share repurchase plan | (197) |
| — | — |
| — |
| — |
| — |
| (2,622) |
| — |
| (2,622) |
| — |
| (2,622) |
Class A common stock issued for share-based bonuses and options exercised | — |
| — | — |
| — |
| — |
| — |
| — |
| — |
| — |
| — |
| — |
In-kind exchange of share for the exercise of options, net issued | — |
| — | — |
| — |
| — |
| — |
| — |
| — |
| — |
| — |
| — |
Restricted Stock Units | 33 |
| — | — |
| — |
| (31) |
| — |
| — |
| — |
| (31) |
| — |
| (31) |
Contributions from noncontrolling stockholders | — |
| — | — |
| — |
| — |
| — |
| — |
| — |
| — |
| 9 |
| 9 |
Distributions to noncontrolling stockholders | — |
| — | — |
| — |
| — |
| — |
| — |
| — |
| — |
| (15) |
| (15) |
At June 30, 2019 | 21,071 | $ | 233 | 1,680 | $ | 17 | $ | 147,841 | $ | 47,283 | $ | (27,853) | $ | 5,279 | $ | 172,800 | $ | 4,223 | $ | 177,023 |
Note 1516 – Stock-Based Compensation and Stock Repurchases
Employee and Director Stock OptionIncentive Plan
The Company may grant stock options and other share-based payment awards of our Common Stock to eligible employees, directors, and consultants under the 2010 Stock Incentive Plan, as amended (the “Plan”). The aggregate total number of shares of the Common Stock authorized for issuance under the Plan is 2,197,460.
During the Company’s 2017 Annual Stockholders’ Meeting held on November 7, 2017, the Company's stockholders, upon recommendationat June 30, 2020 was 2,197,460, of the Board of Directors, approved an amendment to the Plan to increase the number of shares of common stock issuable under the Plan by an additional 947,460 shares. The effect of the increase was to restore the amount ofwhich 505,265 remain available for future issuance. In total, 1,692,195 shares of Common Stock available under the Plan from the 302,540 shares availablehad, as of September 30, 2017, back upthat date, been issued or reserved for issuance pursuant to its original reserve of 1,250,000 shares. As of September 30, 2019, we had 778,304 shares remaining for future issuances.the previously granted options and/or granted restricted stock units.
Stock options are generally granted at exercise prices equal to the grant-date market prices and typically expire no later than five years from the grant date. In contrast to a stock option where the grantee buys the Company’s share at an exercise price determined on grant date, a restricted stock unit (“RSU”) entitles the grantee to receive one share for every RSU based on a vesting plan. At the discretion of our Compensationplan, typically between one and Stock Options Committee, the vesting period of stock options and RSUs granted to employees rangesfour years from zero to four years.grant. Grants to directors and certain executive officers are subject to Board approval.approval; discretion to make grants to other officers and employees has been delegated to the Compensation and Stock Options Committee. At the time the options are exercised or RSUs vest and are settled, at the discretion of management, we will issue treasury shares or make a new issuance of shares to the option or RSU holder.
Stock Options
We estimate the grant-date fair value of our stock options using the Black-Scholes option-valuation model, which takes into account assumptions such as the dividend yield, the risk-free interest rate, the expected stock price volatility, and the expected life of the options. We expense the estimated grant-date fair values of options over the vesting period on a straight-line basis. Based on our historical experience, the “deemed exercise” of expiring in-the-money options and the relative market price to strike price of the options, we have not hereto estimated any forfeitures of vested or unvested options.
There were nil and 219,408NaN stock options were issued in the six months ended June 30, 2020. Stock options covering 219,408 shares issued in the quarter and ninesix months ended SeptemberJune 30, 2019, respectively.all in the first quarter of 2019. The weighted average assumptions used in the option-valuation model were as follows:
| | | | |
|
|
|
|
| | | | |
|
|
|
|
| | Nine Months Ended September 30, |
| Six Months Ended June 30, |
| | 2019 | | 2018 |
| 2020 |
| 2019 |
Stock option exercise price | | $ | 16.12 | | $ | 16.40 |
| $ | — |
| $ | 16.12 |
Risk-free interest rate | | 2.42% | | | 2.56% |
|
| — |
|
| 2.42% |
Expected dividend yield | | — | | | — |
|
| — |
|
| — |
Expected option life in years | | 3.75 | | | 3.75 |
|
| — |
|
| 3.75 |
Expected volatility | | 23.32% | | | 24.99% |
|
| — |
|
| 23.32% |
Weighted average fair value | | $ | 3.50 | | $ | 3.80 |
| $ | — |
| $ | 3.50 |
For the quarters ended SeptemberJune 30, 20192020 and 2018,2019, we recorded compensation expense of $120,000 and $129,000, and $115,000, respectively.respectively with respect to our prior stock option grants. For the ninesix months ended SeptemberJune 30, 20192020 and SeptemberJune 30, 2018,2019, we recorded compensation expense of $329,000$239,000 and $312,000,$200,000, respectively. At SeptemberJune 30, 2019,2020, the total unrecognized estimated compensation expense related to non-vested stock options was $1.2$0.9 million, which we expect to recognize over a weighted average vesting period of 1.911.57 years. The intrinsic, unrealized value of all options outstanding vested and expected to vest, at SeptemberJune 30, 20192020 was $0.2 million,nil, as the closing price of which 100% are currently exercisable.our Common Stock on that date was $4.25.
The following table summarizes the number of options outstanding and exercisable as of SeptemberJune 30, 20192020 and December 31, 2018:2019:
| | | | | | | | |
|
|
|
|
|
|
|
|
| | | | | | | | | |
|
|
|
|
|
|
|
|
|
| | Outstanding Stock Options - Class A Shares |
| Outstanding Stock Options - Class A Shares |
| | Number
of Options | | Weighted
Average
Exercise Price | | Weighted
Average
Remaining
Years of
Contractual
Life | | Aggregate
Intrinsic
Value |
| Number
of Options |
| Weighted
Average
Exercise Price |
| Weighted
Average
Remaining
Years of
Contractual
Life |
| Aggregate
Intrinsic
Value |
| | Class A | | Class A | | Class A | | Class A |
| Class A |
| Class A |
| Class A |
| Class A |
Balance - December 31, 2017 | | 524,589 | | $ | 12.50 | | 3.15 | | $ | 3,054,325 | |
Granted | | 126,840 | | | 16.40 | | — | | | — | |
Exercised | | (60,000) | | | 6.02 | | — | | | 610,249 | |
Forfeited | | (4,960) | | | 12.08 | | — | | | — | |
Balance - December 31, 2018 | | 586,469 | | $ | 14.01 | | 2.88 | | $ | 1,530,528 |
| 586,469 |
| $ | 14.01 |
| 2.88 |
| $ | 1,530,528 |
Granted | | 219,408 | | | 16.12 | | — | | | — |
| 219,408 |
|
| 16.12 |
| — |
|
| — |
Exercised | | (69,500) | | | 13.42 | | — | | | 185,175 |
| (69,500) |
|
| 13.42 |
| — |
|
| 185,175 |
Forfeited | | (25,000) | | | 13.42 | | — | | | — |
| (25,000) |
|
| 13.42 |
| — |
|
| — |
Balance - September 30, 2019 | | 711,377 | | $ | 14.74 | | 3.04 | | $ | 164,930 | |
Balance - December 31, 2019 | |
| 711,377 |
| $ | 14.74 |
| 2.79 |
| $ | 136,350 |
Granted | |
| — |
|
| — |
| — |
|
| — |
Exercised | |
| — |
|
| — |
| — |
|
| — |
Forfeited | |
| (8,000) |
|
| 12.34 |
| — |
|
| — |
Balance - June 30, 2020 | |
| 703,377 |
| $ | 14.79 |
| 1.57 |
| $ | — |
Restricted Stock Units
We estimate the grant-date fair values of our RSUs using theour Company’s stock price at grant-date and record such fair values as compensation expense over the vesting period on a straight-line basis. The following table summarizes the status of the RSUs granted to-date as of SeptemberJune 30, 2019:2020:
| | | | | | | | | | | | |
|
|
|
|
|
|
|
|
|
|
|
|
| | | | | | | | | | | | |
|
|
|
|
|
|
|
|
|
|
|
|
| | Outstanding Restricted Stock Units |
| Outstanding Restricted Stock Units |
| | RSU Grants (in units) | | | | Vested, | | Unvested, | | Forfeited, |
| RSU Grants (in units) |
|
|
| Vested, |
| Unvested, |
| Forfeited, |
Grant Date | | Directors | | Management | | Total
Grants | | September 30,
2019 | | September 30,
2019 | | September 30,
2019 |
| Directors |
| Management |
| Total
Grants |
| June 30, 2020 |
| June 30, 2020 |
| June 30, 2020 |
March 10, 2016 | | 35,147 | | 27,381 | | 62,528 | | 55,684 | | 6,844 | | |
| 35,147 |
| 27,381 |
| 62,528 |
| 62,262 |
| — |
| 266 |
April 11, 2016 | | — | | 5,625 | | 5,625 | | 3,962 | | 1,146 | | 517 |
| — |
| 5,625 |
| 5,625 |
| 5,108 |
| — |
| 517 |
March 23, 2017 | | 30,681 | | 32,463 | | 63,144 | | 46,919 | | 16,225 | | |
| 30,681 |
| 32,463 |
| 63,144 |
| 54,196 |
| 8,416 |
| 532 |
August 29, 2017 | | — | | 7,394 | | 7,394 | | 5,546 | | 1,848 | | |
| — |
| 7,394 |
| 7,394 |
| 5,546 |
| 1,848 |
|
|
January 2, 2018 | | 29,393 | | — | | 29,393 | | 29,393 | | — | | |
| 29,393 |
| — |
| 29,393 |
| 29,393 |
| — |
|
|
April 12, 2018 | | — | | 29,596 | | 29,596 | | 7,409 | | 22,187 | | |
| — |
| 29,596 |
| 29,596 |
| 14,553 |
| 14,268 |
| 775 |
April 13, 2018 | | — | | 14,669 | | 14,669 | | 3,668 | | 11,001 | | |
| — |
| 14,669 |
| 14,669 |
| 7,336 |
| 7,333 |
|
|
July 6, 2018 | | — | | 932 | | 932 | | — | | — | | 932 |
| — |
| 932 |
| 932 |
| — |
| — |
| 932 |
November 7, 2018 | | 23,010 | | — | | 23,010 | | 23,010 | | — | | |
| 23,010 |
| — |
| 23,010 |
| 23,010 |
| — |
|
|
March 13, 2019 | | — | | 40,709 | | 40,709 | | — | | 40,709 | | |
| — |
| 24,366 |
| 24,366 |
| 5,316 |
| 15,946 |
| 3,104 |
March 14, 2019 | | — | | 6,984 | | 6,984 | | — | | 6,984 | | |
| — |
| 23,327 |
| 23,327 |
| 5,832 |
| 17,495 |
|
|
May 7, 2019 | | 11,565 | | — | | 11,565 | | — | | 11,565 | | |
| 11,565 |
| — |
| 11,565 |
| 11,565 |
| — |
|
|
March 10, 2020 | |
| — |
| 287,163 |
| 287,163 |
| — |
| 287,163 |
|
|
| | | | | | | | | | | | |
|
|
|
|
|
|
|
|
|
|
|
|
Total | | 129,796 | | 165,753 | | 295,549 | | 175,591 | | 118,509 | | 1,449 |
| 129,796 |
| 452,916 |
| 582,712 |
| 224,117 |
| 352,469 |
| 6,126 |
RSU awards to management vest 25% aton the endanniversary of eachthe grant date over a period of four years. Beginning this year, for 4 years. a performance component has been added to certain of the RSUs granted to Management. On March 10, 2020, RSUs covering 287,163 shares were issued to members of executive management and other employees of our Company.
Prior to November 7, 2018, RSU awards to non-employee directors vested 100% in January of the following year in which such RSUs were granted. At the November 7, 2018 Board meeting, it was determined that it would be more appropriate for the vesting of RSUs to align with the director’s term of office. Accordingly, the RSUs granted on November 7, 2018, vestvested on the first to occur of (i) 5:00 pm, Los Angeles, CA time on the last business day prior to the one-yearone year anniversary of the grant date, or (ii) the date on which the recipient’s term as a director shall endended and the recipient or, as the case may be, the recipient’s successor iswas elected to the board of directors at the next occurring annual meeting or special meeting of stockholders called for such purpose (the “Vesting Date”). This means that the Vesting Date ofdirectors. Accordingly, the RSUs granted to directors on November 7, 2018 was the date of thevested on May 7, 2019 annual meeting of stockholders on May 7, 2019.stockholders. Due to the fact that theour Company has moved up itsour annual meeting of stockholders from November to May this year, this created a shorter than normalin 2019, the vesting period for the RSUs issued on November 7, 2018.2018 was shorter than anticipated. In order to adjust for this factor, the award of RSUs to directors made immediately following the 2019 Annual Meeting of Stockholders was determined using a value of $35,000 or one half of lastthe dollar amount of the prior year's annual grant. The RSUs issued to non-employee directors on May 7, 2019 vested on May 6, 2020. NaN RSUs have been issued to non-employee directors since May 7, 2019.
For the quarter ended SeptemberJune 30, 20192020 and 2018,2019, we recorded compensation expense of $288,000$255,000 and $233,000,$271,000, respectively. For the ninesix months ended SeptemberJune 30, 20192020 and September 30, 20182019, we recorded compensation expense of $768,000$470,000 and $754,000$480,000, respectively. The total unrecognized compensation expense related to the non-vested RSUs was $1.6$2.5 million as of SeptemberJune 30, 2019,2020, which we expect to recognize over a weighted average vesting period of 1.742.02 years.
Stock Repurchase Program
On March 2, 2017, the Company's Board of Directors authorized management, at its discretion, to spend up to an aggregate of $25.0 million to acquire shares of Reading’s Class A Non-Voting Common Stock. On March 14, 2019, the Board of Directors extended this stock buy-back program for two years, through March 2, 2021. TheOn March 10, 2020, the Board of Directors did not increaseincreased the authorized amount which was $16.2by $25.0 million atand extended it to March 31, 2019.2, 2022. At the present time, the amount available under the repurchase program authorization is $26.0 million.
The repurchase program allows Reading to repurchase its shares in accordance with the requirements of the SEC on the open market, in block trades and in privately negotiated transactions, depending on market conditions and other factors. All purchases are subject to the availability of shares at prices that are acceptable to Reading, and accordingly, no assurances can be given as to the timing or number of shares that may ultimately be acquired pursuant to this authorization.
Under the stock repurchase program, as of SeptemberJune 30, 2019,2020, the Company hashad reacquired a total of 1,415,6241,792,819 shares of Class A Non-Voting Common Stock for $20.1$24.0 million at an average price of $14.23$13.39 per share (excluding transaction costs). 659,60875,157 shares of Class A Non-Voting Common Stock were purchased during the quarter ended September 30, 2019March 31, 2020 at an average price of $13.17$8.92 per share. NaN shares of Class A Non-Voting Common Stock were purchased during the quarter ended June 30, 2020. This leaves $4.9$26.0 million available under the March 2, 2017 program, as extended, to March 2, 2021. 2022.
Note 1617 - Leases
In all leases, whether we are the lessor or lessee, we define lease term as the non-cancellable term of the lease plus any renewals covered by renewal options that are reasonably certain of exercise based on our assessment of economic factors relevant to the lessee. The non-cancellable term of the lease commences on the date the lessor makes the underlying property in the lease available to the lessee, irrespective of when lease payments begin under the contract.
As Lessee
We have operating leases for certain cinemas and corporate offices, and finance leases for certain equipment assets. Our leases have remaining lease terms of 1 to 20 years, with certain leases having options to extend to up to a further 20 years.
Contracts are analyzed in accordance with the criteria set out in ASC 842 to determine if there is a lease present. For contracts that contain an operating lease, we account for the lease component and the non-lease component together as a single component. For contracts that contain a finance lease we account for the lease component and the non-lease component separately in accordance with ASC 842.
In leases where we are the lessee, we recognize a right of use asset and lease liability at lease commencement, which is measured by discounting lease payments using an incremental borrowing rate applicable to the relevant country and lease term of the lease as the discount rate. Subsequent amortization of the right of use asset and accretion of the lease liability for an operating lease is recognized as a single lease cost, on a straight linestraight-line basis, over the term of the lease. A finance lease right-of-use asset is depreciated on a straight linestraight-line basis over the lesser of the useful life of the leased asset or the lease term. Interest on each finance lease liability is determined as the amount that results in a constant periodic discount rate on the remaining balance of the liability. Property taxes and other non-lease costs are accounted for on an accrual basis.
Lease payments for our cinema operating leases consist of fixed base rent, and for certain leases, variable lease payments consisting of contracted percentages of revenue, changes in the relevant CPI, and/or other contracted financial metrics.
As a result of the impacts of COVID-19, we have obtained certain concessions from our landlords. We have elected to account for these concessions as if there have been no changes to the underlying contracts, thereby recognizing abatements secured as variable lease expenses, and increasing payables for lease payment deferrals.
The components of lease expense are as follows:
| | | | | | | | |
|
|
|
|
|
|
|
|
| | Quarter Ended | | Nine Months Ended |
| Quarter Ended |
| Six Months Ended |
| | September 30, | | September 30, |
| June 30, |
| June 30, |
(Dollars in thousands) | | 2019 | | 2018 | | 2019 | | 2018 |
| 2020 |
| 2019 |
| 2020 |
| 2019 |
Lease cost | | | | | | | | | | | | |
|
|
|
|
|
|
|
|
|
|
|
|
Finance lease cost: | | | | | | | | | | | | |
|
|
|
|
|
|
|
|
|
|
|
|
Amortization of right-of-use assets | | $ | 40 | | $ | — | | $ | 121 | | $ | — |
| $ | 24 |
| $ | 41 |
| $ | 64 |
| $ | 82 |
Interest on lease liabilities | | | 3 | | | — | | | 10 | | | — |
|
| 2 |
|
| 4 |
|
| 5 |
|
| 7 |
Operating lease cost | | 7,773 | | — | | 23,339 | | — |
|
| 8,079 |
| 7,899 |
| 16,099 |
| 15,784 |
Variable lease cost | | | 320 | | | — | | | 1,174 | | | — |
|
| (833) |
|
| 517 |
|
| (652) |
|
| 619 |
Total lease cost | | $ | 8,136 | | $ | — | | $ | 24,644 | | $ | — |
| $ | 7,272 |
| $ | 8,461 |
| $ | 15,515 |
| $ | 16,492 |
Supplemental cash flow information related to leases is as follows:
| | | | |
|
|
|
|
|
|
|
|
| | Nine Months Ended |
|
|
|
|
|
| Six Months Ended |
| | September 30, |
|
|
|
|
|
| June 30, |
(Dollars in thousands) | | 2019 | | 2018 |
|
|
|
|
|
| 2020 |
| 2019 |
Cash flows relating to lease cost | | | | | | |
|
|
|
|
|
|
|
|
|
|
|
Cash paid for amounts included in the measurement of lease liabilities: | | | | | | |
|
|
|
|
|
|
|
|
|
|
|
Operating cash flows for finance leases | | $ | 128 | | $ | — |
|
|
|
|
|
| $ | 68 |
| $ | 87 |
Operating cash flows for operating leases | | | 22,988 | | | — |
|
|
|
|
|
|
| 8,436 |
|
| 15,531 |
Right-of-use assets obtained in exchange for new finance lease liabilities | | — | | — |
|
|
|
|
|
| — |
| — |
Right-of-use assets obtained in exchange for new operating lease liabilities | | 5,760 | | — |
|
|
|
|
|
| 179 |
| 5,760 |
Supplemental balance sheet information related to leases is as follows:
| | | | |
|
|
|
|
|
|
|
|
| | September 30, | | December 31, |
|
|
|
|
|
| June 30, |
| December 31, |
(Dollars in thousands) | | 2019 | | 2018 |
|
|
|
|
|
| 2020 |
| 2019 |
Operating leases | | | | | | |
|
|
|
|
|
|
|
|
|
|
|
Operating lease right-of-use assets | | $ | 216,963 | | $ | — |
|
|
|
|
|
| $ | 217,692 |
| $ | 229,879 |
Operating lease liabilities - current portion | | | 19,579 | | | — |
|
|
|
|
|
|
| 21,091 |
|
| 20,379 |
Operating lease liabilities - non-current portion | | | 210,737 | | | — |
|
|
|
|
|
|
| 210,560 |
|
| 223,164 |
Total operating lease liabilities | | $ | 230,316 | | $ | — |
|
|
|
|
|
| $ | 231,651 |
| $ | 243,543 |
Finance leases | | | | | | |
|
|
|
|
|
|
|
|
|
|
|
Property plant and equipment, gross | | 362 | | — |
|
|
|
|
|
| 366 |
| 370 |
Accumulated depreciation | | | (121) | | | — |
|
|
|
|
|
|
| (228) |
|
| (165) |
Property plant and equipment, net | | $ | 241 | | $ | — |
|
|
|
|
|
| $ | 138 |
| $ | 205 |
Other current liabilities | | | 117 | | | — |
|
|
|
|
|
|
| 51 |
|
| 93 |
Other long-term liabilities | | | 128 | | | — |
|
|
|
|
|
|
| 92 |
|
| 116 |
Total finance lease liabilities | | $ | 245 | | $ | — |
|
|
|
|
|
| $ | 143 |
| $ | 209 |
| | | | | | |
|
|
|
|
|
|
|
|
|
|
|
Other information | | | | | | |
|
|
|
|
|
|
|
|
|
|
|
|
Weighted-average remaining lease term - finance leases | | | 3 | | | — |
|
|
|
|
|
|
|
| 3 |
|
| 3 |
Weighted-average remaining lease term - operating leases | | | 11 | | | — |
|
|
|
|
|
|
|
| 11 |
|
| 11 |
Weighted-average discount rate - finance leases | | | 5.10% | | | — |
|
|
|
|
|
|
|
| 5.25% |
|
| 5.13% |
Weighted-average discount rate - operating leases | | | 4.98% | | | — |
|
|
|
|
|
|
|
| 4.78% |
|
| 4.86% |
The Maturitiesmaturities of our leases were as follows:
| | | | |
|
|
|
|
|
|
|
|
(Dollars in thousands) | | Operating
leases | | Finance
leases |
|
|
|
|
|
|
| Operating
leases |
| Finance
leases |
2019 | | $ | 7,673 | | $ | 43 | |
2020 | | 30,631 | | 98 |
|
|
|
|
|
|
| $ | 15,819 |
| $ | 31 |
2021 | | 30,956 | | 52 |
|
|
|
|
|
|
|
| 32,010 |
|
| 53 |
2022 | | 30,963 | | 42 |
|
|
|
|
|
|
|
| 32,018 |
|
| 42 |
2023 | | 30,102 | | 29 |
|
|
|
|
|
|
|
| 31,292 |
|
| 28 |
2024 | |
|
|
|
|
|
|
|
| 29,466 |
|
| — |
Thereafter | | | 172,589 | | | — |
|
|
|
|
|
|
|
| 159,647 |
|
| — |
Total lease payments | | $ | 302,914 | | $ | 264 |
|
|
|
|
|
|
| $ | 300,252 |
| $ | 154 |
Less imputed interest | | | (72,598) | | | (19) |
|
|
|
|
|
|
|
| (68,601) |
|
| (11) |
Total | | $ | 230,316 | | $ | 245 |
|
|
|
|
|
|
| $ | 231,651 |
| $ | 143 |
As of SeptemberJune 30, 2019,2020, we have additional operating leases, primarily for cinemas, that have not yet commenced operations of approximately $36.0 million. It is anticipated that these operating leases will commence between fiscal year 20192020 and fiscal year 2021 with lease terms of 15 to 20 years.
As Lessor
We have entered into various leases as a lessor for our owned real estate properties. These leases vary in length between 1 and 20 years, with certain leases containing options to extend at the behest of the applicable tenants. Lease components consist of fixed base rent, and for certain leases, variable lease payments consisting of contracted percentages of revenue, changes in the relevant CPI, and/or other contracted financial metrics. None of our leases grant any right to the tenant to purchase the underlying asset.
We recognize lease payments for operating leases as property revenue on a straight-line basis over the lease term. Lease incentive payments we make to lessees are amortized as a reduction in property revenue over the lease term.
As a result of the impacts of COVID-19, we have provided certain concessions to specific tenants. We have elected to account for these concessions as if there have been no changes to the underlying contracts, thereby recognizing abatements granted as variable lease payments through revenue and increasing receivables for lease payment deferrals.
Lease income relating to operating lease payments was as follows:
| | | | | | | | |
|
|
|
|
|
|
|
|
| | Quarter Ended | | Nine Months Ended |
| Quarter Ended |
| Six Months Ended |
| | September 30, | | September 30, |
| June 30, |
| June 30, |
(Dollars in thousands) | | 2019 | | 2018 | | 2019 | | 2018 |
| 2020 |
| 2019 |
| 2020 |
| 2019 |
Components of lease income | | | | | | | | | | | | |
|
|
|
|
|
|
|
|
|
|
|
|
Lease payments | | $ | 2,246 | | $ | 2,362 | | $ | 6,819 | | $ | 7,073 |
| $ | 2,245 |
| $ | 2,344 |
| $ | 4,566 |
| $ | 4,573 |
Variable lease payments | | | 302 | | | 55 | | | 898 | | | 708 |
|
| (364) |
|
| 331 |
|
| (201) |
|
| 596 |
Total lease income | | $ | 2,548�� | | $ | 2,417 | | $ | 7,717 | | $ | 7,781 |
| $ | 1,881 |
| $ | 2,675 |
| $ | 4,365 |
| $ | 5,169 |
The book value of underlying assets under operating leases from owned assets was as follows:
| | | | | | | | |
|
|
|
|
|
|
|
|
| | | | | | September 30, | | December 31, |
|
|
|
|
| June 30, |
| December 31, |
(Dollars in thousands) | | | | | | 2019 | | 2018 |
|
|
|
|
| 2020 |
| 2019 |
Building and improvements | | | | | | | | | | |
|
|
|
|
|
|
|
|
|
|
Gross balance | | | | | | $ | 65,103 | | $ | 67,887 |
|
|
|
|
| $ | 69,123 |
| $ | 67,766 |
Accumulated depreciation | | | | | | | (18,278) | | | (17,709) |
|
|
|
|
|
| (20,677) |
|
| (20,220) |
Net Book Value | | | | | | $ | 46,825 | | $ | 50,178 |
|
|
|
|
| $ | 48,446 |
| $ | 47,546 |
The Maturity of our leases were as follows:
| | | | | | | | |
|
|
|
|
|
|
|
|
(Dollars in thousands) | | | | | | | | | | Operating
leases |
|
|
|
|
|
|
|
|
|
| Operating
leases |
2019 | | | | | | | | | | $ | 1,954 | |
2020 | | | | | | | | | | 7,301 |
|
|
|
|
|
|
|
|
| $ | 3,890 |
2021 | | | | | | | | | | 6,831 |
|
|
|
|
|
|
|
|
|
| 7,552 |
2022 | | | | | | | | | | 5,984 |
|
|
|
|
|
|
|
|
|
| 6,780 |
2023 | | | | | | | | | | 5,275 |
|
|
|
|
|
|
|
|
|
| 6,106 |
2024 | |
|
|
|
|
|
|
|
|
|
| 5,208 |
Thereafter | | | | | | | | | | | 10,214 |
|
|
|
|
|
|
|
|
|
| 7,634 |
Total | | | | | | | | | | $ | 37,559 |
|
|
|
|
|
|
|
|
| $ | 37,170 |
Note 1718 – Hedge Accounting
As of SeptemberJune 30, 20192020, and December 31, 2018,2019, the Company held interest rate derivatives in the total notional amount of $8.0 million and $8.0 million, respectively.
The derivatives are recorded on the balance sheet at fair value and are included in the following line items:
| | | | | | | | |
|
|
|
|
|
|
|
|
| | Liability Derivatives |
| Liability Derivatives |
| | September 30, | | December 31, |
| June 30, |
| December 31, |
| | 2019 | | 2018 |
| 2020 |
| 2019 |
(Dollars in thousands) | | Balance sheet location | | Fair value | | Balance sheet location | | Fair value |
| Balance sheet location |
| Fair value |
| Balance sheet location |
| Fair value |
Interest rate contracts | | Derivative financial instruments - current portion | | $ | 105 | | Derivative financial instruments - current portion | | $ | 41 |
| Derivative financial instruments - current portion |
| $ | 218 |
| Derivative financial instruments - current portion |
| $ | 109 |
| | Derivative financial instruments - non-current portion | | | 291 | | Derivative financial instruments - non-current portion | | | 145 |
| Derivative financial instruments - non-current portion |
|
| 329 |
| Derivative financial instruments - non-current portion |
|
| 233 |
Total derivatives designated as hedging instruments | | | | $ | 396 | | | | $ | 186 |
|
|
| $ | 547 |
|
|
| $ | 342 |
Total derivatives | | | | $ | 396 | | | | $ | 186 |
|
|
| $ | 547 |
|
|
| $ | 342 |
We have no0 derivatives designated as hedging instruments which are in asset positions.
The changes in fair value are recorded in Other Comprehensive Income and released into interest expense in the same period(s) in which the hedged transactions affect earnings. In the quarter and ninesix months ended to SeptemberJune 30, 20192020 and SeptemberJune 30, 2018,2019, respectively, the derivative instruments affected Comprehensive Income as follows:
| | | | | | | | | |
|
|
|
|
|
|
|
|
|
(Dollars in thousands) | Location of Loss Recognized in Income on Derivatives | | Amount of Loss Recognized in Income on Derivatives | Location of Loss Recognized in Income on Derivatives |
| Amount of Loss Recognized in Income on Derivatives |
| | | Quarter Ended September 30, 2019 | | Nine Months Ended September 30, 2019 |
|
| Quarter Ended June 30, 2020 |
| Six Months Ended June 30, 2020 |
| | | | 2019 | | | 2018 | | | 2019 | | | 2018 |
|
|
| 2020 |
|
| 2019 |
|
| 2020 |
|
| 2019 |
Interest rate contracts | Interest expense | | $ | 18 | | $ | — | | $ | 42 | | $ | — | Interest expense |
| $ | 52 |
| $ | 13 |
| $ | 80 |
| $ | 24 |
Total | | | $ | 18 | | $ | — | | $ | 42 | | $ | — |
|
| $ | 52 |
| $ | 13 |
| $ | 80 |
| $ | 24 |
| | | | | | | | | |
|
|
|
|
|
|
|
|
|
| | Loss Recognized in OCI on Derivatives (Effective Portion) |
| Loss Recognized in OCI on Derivatives (Effective Portion) |
(Dollars in thousands) | | Amount | | Amount |
| Amount |
| Amount |
| | Quarter Ended September 30 | | Nine Months Ended September 30 |
| Quarter Ended June 30 |
| Six Months Ended June 30 |
| | | 2019 | | | 2018 | | | 2019 | | | 2018 |
|
| 2020 |
|
| 2019 |
|
| 2020 |
|
| 2019 |
Interest rate contracts | | $ | 38 | | $ | — | | $ | 253 | | $ | — |
| $ | 52 |
| $ | 134 |
| $ | 285 |
| $ | 215 |
Total | | $ | 38 | | $ | — | | $ | 253 | | $ | — |
| $ | 52 |
| $ | 134 |
| $ | 285 |
| $ | 215 |
| | | | | | | | | | | | |
|
|
|
|
|
|
|
|
|
|
|
|
| |
| Loss Reclassified from AOCI into Income (Effective Portion) |
Line Item | | Amount | | Amount |
| Amount |
| Amount |
| | Quarter Ended September 30 | | Nine Months Ended September 30 |
| Quarter Ended June 30 |
| Six Months Ended June 30 |
| | | 2019 | | | 2018 | | | 2019 | | | 2018 |
|
| 2020 |
|
| 2019 |
|
| 2020 |
|
| 2019 |
Interest expense | | $ | 18 | | $ | — | | $ | 42 | | $ | — |
| $ | 52 |
| $ | 13 |
| $ | 80 |
| $ | 24 |
Total | | $ | 18 | | $ | — | | $ | 42 | | $ | — |
| $ | 52 |
| $ | 13 |
| $ | 80 |
| $ | 24 |
The derivative has no0 ineffective portion, and consequently no0 losses have been recognized directly in income.
Note 1819 – Fair Value Measurements
ASC 820, Fair Value Measurement establishes a fair value hierarchy that prioritizes the inputs to valuation techniques used to measure fair value. The statement requires that assets and liabilities carried at fair value be classified and disclosed in one of the following three categories:
| ·
| | Level 1: Quoted market prices in active markets for identical assets or liabilities;
|
| ·
| | Level 2: Quoted prices for similar instruments in active markets; quoted prices for identical or similar instruments in markets that are not active; and model-derived valuations in which all significant inputs and significant value drivers are observable in active markets; and,
|
| ·
| | Level 3: Valuations derived from valuation techniques in which one or more significant inputs or significant value drivers are unobservable.
|
Level 1: Quoted market prices in active markets for identical assets or liabilities;
Level 2: Quoted prices for similar instruments in active markets; quoted prices for identical or similar instruments in markets that are not active; and model-derived valuations in which all significant inputs and significant value drivers are observable in active markets; and,
Level 3: Valuations derived from valuation techniques in which one or more significant inputs or significant value drivers are unobservable.
As of SeptemberJune 30, 20192020, and December 31, 2018 material2019 we had derivative financial assets and financial liabilities were carried and measured at fair value on a recurring basis.basis of $547,000 and $342,000 respectively.
The following tables summarize our financial liabilities that are carried at cost and measured at fair value on a non-recurring basis as of SeptemberJune 30, 20192020 and December 31, 2018,2019, by level within the fair value hierarchy.
| | | | | | | | | | |
|
|
|
|
|
|
|
|
|
|
| | | | | | | | | | | | | |
|
|
|
|
|
|
|
|
|
|
|
|
|
| | | | | Fair Value Measurement at September 30, 2019 |
|
|
|
| Fair Value Measurement at June 30, 2020 |
(Dollars in thousands) | | Carrying
Value(1) | | Level 1 | | Level 2 | | Level 3 | | Total |
| Carrying
Value(1) |
| Level 1 |
| Level 2 |
| Level 3 |
| Total |
Notes payable | | $ | 167,153 | | $ | — | | $ | — | | $ | 170,459 | | $ | 170,459 |
| $ | 244,955 |
| $ | — |
| $ | — |
| $ | 248,948 |
| $ | 248,948 |
Subordinated debt | | | 27,913 | | | — | | | — | | | 19,008 | | | 19,008 |
|
| 30,958 |
|
| — |
|
| — |
|
| 20,722 |
|
| 20,722 |
| | $ | 195,066 | | $ | — | | $ | — | | $ | 189,467 | | $ | 189,467 |
| $ | 275,913 |
| $ | — |
| $ | — |
| $ | 269,670 |
| $ | 269,670 |
|
|
|
|
|
|
|
|
|
|
|
|
|
|
|
|
|
|
|
|
|
|
|
|
|
|
|
|
|
|
|
|
|
|
|
|
| Fair Value Measurement at December 31, 2019 |
(Dollars in thousands) |
| Carrying
Value(1) |
| Level 1 |
| Level 2 |
| Level 3 |
| Total |
Notes payable |
| $ | 177,942 |
| $ | — |
| $ | — |
| $ | 181,916 |
| $ | 181,916 |
Subordinated debt |
|
| 31,276 |
|
| — |
|
| — |
|
| 22,132 |
|
| 22,132 |
|
| $ | 209,218 |
| $ | — |
| $ | — |
| $ | 204,048 |
| $ | 204,048 |
(1)These balances are presented before any deduction for deferred financing costs.
28
| | | | | | | | | | | | | | | |
| | | | | | | | | | | | | | | |
| | | | | Fair Value Measurement at December 31, 2018 |
(Dollars in thousands) | | Carrying
Value(1) | | Level 1 | | Level 2 | | Level 3 | | Total |
Notes payable | | $ | 139,130 | | $ | — | | $ | — | | $ | 143,564 | | $ | 143,564 |
Subordinated debt | | | 27,913 | | | — | | | — | | | 18,895 | | | 18,895 |
| | $ | 167,043 | | $ | — | | $ | — | | $ | 162,459 | | $ | 162,459 |
| (1)
| | These balances are presented before any deduction for deferred financing costs.
|
Following is a description of the valuation methodologies used to estimate the fair value of our financial assets and liabilities. There have been no changes in the methodologies used at SeptemberJune 30, 20192020 and December 31, 2018.
| ·
| | Level 1 investments in marketable securities primarily consist of investments associated with the ownership of marketable securities in U.S. and New Zealand. These investments are valued based on observable market quotes on the last trading date of the reporting period.
|
| ·
| | Level 2 derivative financial instruments are valued based on discounted cash flow models that incorporate observable inputs such as interest rates and yield curves from the derivative counterparties. The credit valuation adjustments associated with our non-performance risk and counterparty credit risk are incorporated in the fair value estimates of our derivatives. As of September 30, 2019 and December 31, 2018, we concluded that the credit valuation adjustments were not significant to the overall valuation of our derivatives.
|
| ·
| | Level 3 borrowings include our secured and unsecured notes payable, trust preferred securities and other debt instruments. The borrowings are valued based on discounted cash flow models that incorporate appropriate market discount rates. We calculated the market discount rate by obtaining period-end treasury rates for fixed-rate debt, or LIBOR for variable-rate debt, for maturities that correspond to the maturities of our debt, adding appropriate credit spreads derived from information obtained from third-party financial institutions. These credit spreads take into account factors such as our credit rate, debt maturity, types of borrowings, and the loan-to-value ratios of the debt.
|
2019.
Level 1 investments in marketable securities primarily consist of investments associated with the ownership of marketable securities in U.S. and New Zealand. These investments are valued based on observable market quotes on the last trading date of the reporting period.
Level 2 derivative financial instruments are valued based on discounted cash flow models that incorporate observable inputs such as interest rates and yield curves from the derivative counterparties. The credit valuation adjustments associated with our non-performance risk and counterparty credit risk are incorporated in the fair value estimates of our derivatives. As of June 30, 2020, and December 31, 2019, we concluded that the credit valuation adjustments were not significant to the overall valuation of our derivatives.
Level 3 borrowings include our secured and unsecured notes payable, trust preferred securities and other debt instruments. The borrowings are valued based on discounted cash flow models that incorporate appropriate market discount rates. We calculated the market discount rate by obtaining period-end treasury rates for fixed-rate debt, or LIBOR for variable-rate debt, for maturities that correspond to the maturities of our debt, adding appropriate credit spreads derived from information obtained from third-party financial institutions. These credit spreads take into account factors such as our credit rate, debt maturity, types of borrowings, and the loan-to-value ratios of the debt.
The Company’s financial instruments also include cash, cash equivalents, receivables and accounts payable. The carrying values of these financial instruments approximate the fair values due to their short maturities. Additionally, there were no0 transfers of assets and liabilities between levels 1, 2, or 3 during the quarter and ninesix months ended SeptemberJune 30, 20192020 and SeptemberJune 30, 2018.2019.
Note 1920 – Business CombinationCombinations
Devonport, Tasmania, Australia
On January 30, 2019, we purchased the tenant’s interest and other operating assets of an established four-screen cinema in Devonport, Tasmania, Australia, for $1.4 million (AU$1.95 million).million. We commenced trading from this new cinema site on January 30, 2019.
The total purchase price was allocated to the identifiable assets acquired based on our estimates of their fair values on the acquisition date. The identified assets included fixtures and equipment and immaterial working capital balances. There were immaterial liabilities assumed.
Our final purchase price allocation is as follows:
|
|
|
|
|
|
|
|
|
|
(Dollars in thousands) |
| Preliminary Purchase Price Allocation(1) |
| Measurement Period Adjustments(2) |
| Final Purchase Price Allocation(1) |
Tangible Assets |
|
|
|
|
|
|
|
|
|
Operating property: |
|
|
|
|
|
|
|
|
|
Fixtures and equipment |
| $ | 153 |
| $ | — |
| $ | 153 |
Intangible Assets |
|
|
|
|
|
|
|
|
|
Goodwill |
|
| 1,248 |
|
| (23) |
|
| 1,225 |
Total assets acquired |
|
| 1,401 |
|
| (23) |
|
| 1,378 |
|
|
|
|
|
|
|
|
|
|
Net assets acquired |
| $ | 1,401 |
| $ | (23) |
| $ | 1,378 |
(1)The balances were translated into U.S. Dollars based on the applicable exchange rate as of the date of acquisition, January 30, 2019. (2)The measurement period adjustments relate to finalization of immaterial employee obligations.
State Cinema Hobart, Tasmania, Australia
On December 3, 2019, we purchased the tenant’s interest and other operating assets of an established ten-screen cinema in Hobart, Tasmania, Australia, for $6.2 million. We commenced trading from this new cinema site on December 5, 2019.
| (1)
| | The balances were translated into U.S. Dollars based on the applicable exchange rate as of the date of acquisition, January 30, 2019.
|
| (2)
| | The measurement period adjustments relate to finalization of immaterial employee obligations.
|
The Company finalized its purchase price allocation in the first quarter of 2020. The total purchase price was allocated to the identifiable assets acquired based on our estimates of their fair values on the acquisition date. The identified assets include fixtures and equipment, the State Cinema brand, inventory and immaterial working capital balances. The determination of the fair values of the acquired assets (and the related determination of their estimated lives where depreciation is permitted) requires significant judgment. There were immaterial liabilities assumed, including certain gift card obligations.
Our final purchase price allocation is as follows:
|
|
|
|
|
|
|
|
|
|
(Dollars in thousands) |
| Preliminary Purchase Price Allocation(1) |
| Measurement Period Adjustments |
| Final Purchase Price Allocation(1) |
Tangible Assets |
|
|
|
|
|
|
|
|
|
Operating property: |
|
|
|
|
|
|
|
|
|
Fixtures and equipment |
| $ | 481 |
|
| (119) |
| $ | 362 |
Deferred tax |
|
| 5 |
|
| — |
|
| 5 |
Current assets: |
|
|
|
|
|
|
|
|
|
Inventory |
|
| 333 |
|
| — |
|
| 333 |
|
|
|
|
|
|
|
|
|
|
Intangible Assets |
|
|
|
|
|
|
|
|
|
Brand name |
|
| — |
|
| 250 |
|
| 250 |
Liquor license |
|
|
|
|
| 1 |
|
| 1 |
Goodwill |
|
| 5,617 |
|
| (132) |
|
| 5,485 |
Total assets acquired |
|
| 6,436 |
|
| — |
|
| 6,436 |
|
|
|
|
|
|
|
|
|
|
Liabilities |
|
|
|
|
|
|
|
|
|
Employee liabilities |
|
| (20) |
|
| — |
|
| (20) |
Deferred revenue balances |
|
| (236) |
|
| — |
|
| (236) |
Total liabilities acquired |
|
| (256) |
|
| — |
|
| (256) |
|
|
|
|
|
|
|
|
|
|
Net assets acquired |
| $ | 6,180 |
|
| — |
| $ | 6,180 |
(1)The balances were translated into U.S. Dollars based on the applicable exchange rate as of the date of acquisition, December 5, 2019.
Note 21 – Subsequent Events
Lender Waivers and Modifications
Subsequent to June 30, 2020, we modified certain financial covenants and borrowing rates pertaining to our Bank of America, NAB and Westpac debt facilities as detailed at Note 11 – Debt.
On July 1, 2020, at the request of the bank, we moved $10.3 million (NZ$16.0 million) of cash to a 30 day term deposit held by Westpac.
This MD&A should be read in conjunction with the accompanying unaudited consolidated financial statements included in Part I, Item 1 (Financial Statements). The foregoing discussions and analyses contain certain forward-looking statements. Please refer to the “Forward Looking“Forward-Looking Statements” included at the conclusion of this section and our “Risk Factors” set forth in our 20182019 Form 10-K, Part 1, Item 1A and the Risk Factors set out below.
Item 2 – Management’s DiscussionsDiscussion and Analysis (“MD&A”) of Financial Condition and Results of Operations
Ongoing Impact of COVID-19 Pandemic
A number of jurisdictions adopted strict lockdowns aimed at controlling the spread of COVID-19 in the first quarter of 2020. In the second quarter of 2020, several jurisdictions began relaxing COVID-19 restrictions, principally due to pressure on their economies, rather than material containment of COVID-19. Conversely, certain jurisdictions are to varying degrees reinstating their lockdowns due to the re-emergence of COVID-19, while others are continuing to remove restrictions. The current uncertainty resulting from these differing approaches, and the local and global affects that these may have, is expected to continue until the COVID-19 spread is considered materially contained or there is an approved vaccine.
At the end of May 2020, New Zealand’s government began easing restrictions on closures and by June 3, 2020, our New Zealand cinema circuit re-opened, except for our Reading Cinemas at Courtenay Central, which is temporarily closed due to seismic concerns. Upon re-opening, we implemented a number of new safety measures based on guidance from health authorities and applicable government agencies, including physical distancing practices and an increased focus on disinfection and sanitization. As of June 8, 2020, governmentally imposed physical distancing requirements had been discontinued for all New Zealand cinemas, and we liberalized our admission policies in some respects. Trolls World Tour released in New Zealand on July 1, 2020, drew patrons back to our cinemas, but the lack of new major movies has led to declines in attendance even with the safety measures we have implemented compared to the same period in 2019. The next major movie slated for release in New Zealand is Warner Bros.’s Tenet on August 27, 2020. While we are encouraged by the strong slate of movies from the major studios currently scheduled for release in New Zealand in the third and fourth quarters of 2020 and beyond, no assurance can be given that these current release dates will hold.
On July 1, 2020, we re-opened our Australian cinema circuit and implemented a number of new safety protocols. However, on July 8, 2020, we had to close six of our seven theaters in the state of Victoria, due to a spike in new COVID-19 cases, as the local government ordered a six-week closure. On August 5, 2020, the seventh cinema had to be closed as the state announced a full lockdown, which has been proposed to last until mid-September 2020. No new tentpole movies have been released to the Australian market since our cinemas have re-opened. Therefore, our attendance has been light. As of today, the first major movie slated for release in Australia is Christopher Nolan’s Tenet on August 27, 2020, with the exception to the state of Victoria which will release the film upon government restrictions easing and the re-opening of cinemas in that jurisdiction. Again, while we are encouraged by the strong slate of movies from the major studios currently scheduled for release in Australia in the third and fourth quarters of 2020 and beyond, no assurances can be given that these current release dates will hold.
In the United States, we are developing a comprehensive strategy for when we re-open our 24 cinemas in California, Hawaii, Texas, New York, New Jersey, Virginia, and Washington, D.C. On September 3, 2020, the long-awaited Tenet is scheduled to open in the U.S. in select cities. Like our circuits in New Zealand and Australia, we will re-open our cinemas with an elevated set of cleaning protocols and new operating strategies, including physical distancing through reduced seat counts. We expect to announce shortly an opening date for select cinemas in markets where cinemas are permitted to operate. We will announce opening dates for our other cinemas in the U.S. upon receiving (i) greater certainty from the major studios as to their release schedule and (ii) clearance from the local government authorities. If local government authorities remove restrictions, we anticipate opening one to two weeks prior to the opening of at least two major studio releases.
Since the end of March 2020, we have been in discussions with our landlords concerning negotiations of rent abatement or deferrals. In most cases, we were able to achieve deferrals from April to July of 2020 with terms of repayment beginning in 2021, which will preserve the Company’s liquidity. These negotiations were completed on a location-by-location basis. While no assurances can be given on future deferrals, if there is a delay in the timing of the theatre re-openings, we may be able to negotiate additional occupancy relief.
Our Results Continue to be Impacted by COVID-19
The repercussions of the COVID-19 pandemic resulted in a drastic decrease in our Company’s revenues and earnings in the second quarter of 2020. We believe that the lack of new product, the ongoing temporary closures of many of our cinemas, and our social distancing measures materially adversely impacted our second quarter 2020 cinema attendance. Naturally, during the period in which our cinemas remain closed, we will continue to experience a significant loss of revenues and negative operating income.
Our real estate business has been less significantly impacted by the COVID-19 pandemic than our cinema business. In Australia, our centers at Newmarket Village (Brisbane area, QLD), Cannon Park (Townsville, QLD), The Belmont Common (Perth area, WA), and Auburn Redyard (Sydney area, NSW) remained open for business through the second quarter of 2020. In the United States, we have received some rental revenue related to our live theatre business and began recording revenue from our Culver City tenant in the second quarter of 2020. However, while our real estate assets comprise a significant portion of our asset value, they have historically been responsible for only approximately 9% of our revenues and 24% of our overall operating income.
Our Company will likely continue to be significantly impacted by the COVID-19 pandemic even after all of our cinemas have re-opened. The global economic impact of the COVID-19 pandemic has led to high levels of unemployment in our operating jurisdictions and may lead to lower consumer spending in the near term. Physical distancing and increased cleaning protocols may also delay our ability to produce financial results at pre-COVID-19 pandemic levels. Finally, in order to attract guests to our cinemas, we need to offer compelling movies that they want to see in a cinema environment. While we believe that the major studios will be releasing a strong slate of movies through the end of 2020 and into 2021, no assurances can be given that the major studios will maintain current release dates or as to the timeline for the development, production, and release of new movies.
Counter balancing to some extent the challenges posed by the COVID-19 pandemic on a going forward basis, are what we believe to be the ongoing desire of people to enjoy entertainment outside of their homes. While no assurance can be given, we believe that, as our society re-opens, we will see cinemas once again return to their historic position as a principal source of outside the home entertainment, both in the U.S. and abroad. In the U.S. we have maintained key operating personnel in place and have worked out arrangements with substantially all of our landlords to maintain our leases while conserving cash; we are ready to expeditiously open our cinemas, when film becomes available and consumer demand returns in accordance with the respective government guidelines and restrictions.
BUSINESS OVERVIEW
We are an internationally diversified company principally focused on the development, lease or ownership, and operation of entertainment and real estate assets in the United States, Australia, and New Zealand. As of September 30, 2019,Currently, we operate in two business segments:
| ·
| | Cinema exhibition, through our 58 multiplex cinemas; and,
|
| ·
| | Real estate, including real estate development and the rental or licensing of retail, commercial and live theatre assets.
|
We believeCinema exhibition, through our 60 multiplex cinemas.
Real estate, including real estate development and the rental of retail, commercial, and live theatre assets.
For the last several years, we have consistently stated that these two business segments complementhave complemented one another, as we can usehave used the comparatively consistent cash flows generated by our cinema operations to fund the front-end cash demands of our real estate development business. As we navigate the uncertainty and challenges posed by the global COVID-19 pandemic, we continue to believe that this two-pronged diversified international business strategy has supported the strength and long-term viability of our Company. We believe that our strong real estate base provides us with flexibility and asset strength not available to those of our competitors who have only cinema leasehold assets.
Key Performance Indicators
Two key performance indicators utilized by management are EBITDA and food and beverage spend per patron (“SPP”). Due to the COVID-19 pandemic and the temporary closure of substantially all of our live theatre and cinema operations in the U.S., Australia, and New Zealand for most of the three and a substantial portion of the six month periods ended June 30, 2020, management does not currently believe that a discussion of Reading’s key performance indicators will serve as a useful metric for stockholders. Management intends to resume providing a discussion of our key performance indicators in future filings.
Cinema Exhibition Overview
We manageoperate our worldwide cinema exhibition businesses under various brands:
| ·
| | in the U.S., under the following brands: Reading Cinemas, Angelika Film Centers, Consolidated Theatres, and City Cinemas;
|
| ·
| | in Australia, under the Reading Cinemas brand; and,
|
| ·
| | in New Zealand, under the Reading Cinemas and Rialto Cinemas brands.
|
in the U.S., under the Reading Cinemas, Angelika Film Centers, Consolidated Theatres, and City Cinemas brands.
in Australia, under the Reading Cinemas, State Cinema, and the unconsolidated joint venture Event Cinemas brands.
in New Zealand, under the Reading Cinemas and the unconsolidated joint ventures Rialto Cinemas brands.
Shown in the following table are the number of locations and theater screens in our theater circuit in each country, by state/territory/region, and indicating our cinema brands, and our interest in the underlying assets as of SeptemberJune 30, 2019.2020.
| | | | | | | | | | | | |
|
|
|
|
|
|
|
|
|
|
|
|
| | | | | | | | | | | | |
|
|
|
|
|
|
|
|
|
|
|
|
| | State / Territory / | | Location | | Screen | | Interest in Asset
Underlying the Cinema | | |
| State / Territory / |
| Location |
| Screen |
| Interest in Asset
Underlying the Cinema |
|
|
Country | | Region | | Count | | Count | | Leased | | Owned | | Operating Brands |
| Region |
| Count |
| Count |
| Leased |
| Owned |
| Operating Brands |
United States | | Hawaii | | 9 | | 98 | | 9 | | | | Consolidated Theatres |
| Hawaii |
| 9 |
| 98 |
| 9 |
|
|
| Consolidated Theatres |
| | California | | 7 | | 88 | | 7 | | | | Reading Cinemas, Angelika Film Center |
| California |
| 7 |
| 88 |
| 7 |
|
|
| Reading Cinemas, Angelika Film Center |
| | New York | | 3 | | 16 | | 2 | | 1 | | Angelika Film Center, City Cinemas |
| New York |
| 3 |
| 16 |
| 2 |
| 1 |
| Angelika Film Center, City Cinemas |
| | Texas | | 2 | | 13 | | 2 | | | | Angelika Film Center |
| Texas |
| 2 |
| 13 |
| 2 |
|
|
| Angelika Film Center |
| | New Jersey | | 1 | | 12 | | 1 | | | | Reading Cinemas |
| New Jersey |
| 1 |
| 12 |
| 1 |
|
|
| Reading Cinemas |
| | Virginia | | 1 | | 8 | | 1 | | | | Angelika Film Center |
| Virginia |
| 1 |
| 8 |
| 1 |
|
|
| Angelika Film Center |
| | Washington DC | | 1 | | 3 | | 1 | | | | Angelika Film Center |
| Washington, D.C. |
| 1 |
| 3 |
| 1 |
|
|
| Angelika Film Center |
| | U.S. Total | | 24 | | 238 | | 23 | | 1 | | |
| U.S. Total |
| 24 |
| 238 |
| 23 |
| 1 |
|
|
Australia | | New South Wales | | 6 | | 44 | | 4 | | 2 | | Reading Cinemas |
| Victoria |
| 7 |
| 51 |
| 7 |
|
|
| Reading Cinemas |
| | Victoria | | 6 | | 43 | | 6 | | | | Reading Cinemas |
| New South Wales |
| 6 |
| 44 |
| 4 |
| 2 |
| Reading Cinemas |
| | Queensland | | 5 | | 50 | | 2 | | 3 | | Reading Cinemas, Event Cinemas(1) |
| Queensland |
| 5 |
| 50 |
| 2 |
| 3 |
| Reading Cinemas, Event Cinemas(1) |
| | Western Australia | | 2 | | 16 | | 1 | | 1 | | Reading Cinemas |
| Western Australia |
| 2 |
| 16 |
| 1 |
| 1 |
| Reading Cinemas |
| | South Australia | | 2 | | 15 | | 2 | | | | Reading Cinemas |
| South Australia |
| 2 |
| 15 |
| 2 |
|
|
| Reading Cinemas |
| | Tasmania | | 1 | | 4 | | 1 | | | | Reading Cinemas |
| Tasmania |
| 2 |
| 14 |
| 2 |
|
|
| Reading Cinemas, State Cinema |
| | Australia Total | | 22 | | 172 | | 16 | | 6 | | |
| Australia Total |
| 24 |
| 190 |
| 18 |
| 6 |
|
|
New Zealand | | Wellington | | 3 | | 18 | | 2 | | 1 | | Reading Cinemas |
| Wellington |
| 3 |
| 18 |
| 2 |
| 1 |
| Reading Cinemas |
| | Otago | | 3 | | 15 | | 2 | | 1 | | Reading Cinemas, Rialto Cinemas(2) |
| Otago |
| 3 |
| 15 |
| 2 |
| 1 |
| Reading Cinemas, Rialto Cinemas(2) |
| | Auckland | | 2 | | 15 | | 2 | | | | Reading Cinemas, Rialto Cinemas(2) |
| Auckland |
| 2 |
| 15 |
| 2 |
|
|
| Reading Cinemas, Rialto Cinemas(2) |
| | Canterbury | | 1 | | 8 | | 1 | | | | Reading Cinemas |
| Canterbury |
| 1 |
| 8 |
| 1 |
|
|
| Reading Cinemas |
| | Southland | | 1 | | 5 | | | | 1 | | Reading Cinemas |
| Southland |
| 1 |
| 5 |
|
|
| 1 |
| Reading Cinemas |
| | Bay of Plenty | | 1 | | 5 | | | | 1 | | Reading Cinemas |
| Bay of Plenty |
| 1 |
| 5 |
|
|
| 1 |
| Reading Cinemas |
| | Hawke's Bay | | 1 | | 4 | | | | 1 | | Reading Cinemas |
| Hawke's Bay |
| 1 |
| 4 |
|
|
| 1 |
| Reading Cinemas |
| | New Zealand Total | | 12 | | 70 | | 7 | | 5 | | |
| New Zealand Total |
| 12 |
| 70 |
| 7 |
| 5 |
|
|
GRAND TOTAL | | | | 58 | | 480 | | 46 | | 12 | | |
|
|
| 60 |
| 498 |
| 48 |
| 12 |
|
|
| (1)
| | Included above, the Company has a 33.3% unincorporated joint venture interest in a 16-screen cinema located in Mt. Gravatt, Queensland managed by Event Cinemas.
|
| (2)
| | Included above, the Company is a 50% joint venture partner in two New Zealand Rialto cinemas, with a total of 13-screens. We are responsible for the booking of these cinemas and our joint venture partner, Event Cinemas, manages their day-to-day operations.
|
(1)The Company has a 33.3% unincorporated joint venture interest in a 16-screen cinema located in Mt. Gravatt, Queensland managed by Event Cinemas.
(2)The Company is a 50% joint venture partner in two New Zealand Rialto Cinemas, with a total of 13-screens. We are responsible for the booking of these cinemas and our joint venture partner, Event Cinemas, manages their day-to-day operations.
Real Estate Overview
We engage in the real estate business through development and theour ownership and rental or licensing to third parties of retail, commercial and live theatre assets. We own the fee interests in all three of our live theatres, and in 12 of our cinemas (as presented in the preceding table). Our real estate business creates long-term value for our stockholders through the continuous improvement and development of our investment and operating properties, including our entertainment-themed centers (“ETCs”).ETCs.
Our real estate activities have historically consisted principally of:
the ownership of fee or long-term leasehold interests in properties used in our cinema exhibition activities or which were acquired for the development of cinemas or cinema-based real estate development projects; the acquisition of fee interests in land for general real estate development; the licensing to production companies of the use of our live theatres; and, the redevelopment of our existing fee-owned cinema or live theatre sites to their highest and best use.
| ·
| | the ownership of fee or long-term leasehold interests in properties used in our cinema exhibition activities or which were acquired for the development of cinemas or cinema-based real estate development projects;
|
| ·
| | the acquisition and development of fee interests in land;
|
| ·
| | the licensing to production companies of the use of our live theatres; and,
|
| ·
| | the redevelopment of our existing fee-owned cinema or live theatre sites to their highest and best use.
|
Cinema Exhibition
Our cinema revenue consists primarily of admissions, Food & Beverage (“F&B”), advertising, gift cards, theater rentals, and online convenience fee revenue generated by the sale of our cinema tickets at the theater, on our own websites, and mobile apps. Cinema operating expense consists of the costs directly attributable to the operation of the cinemas, including film rent expense, operating costs, and occupancy costs. Cinema revenue and expense fluctuate with the availability of quality first run films and the numbers of weeks such first run films stay in the market. For a breakdown of our current cinema assets that we previously ownedown and/or managed,manage, please see Part I, Item 1 – Our Business of our 20182019 Form 10-K.
While our capital projects in recent years have been focused in growing our real estate segment, we have over the past two years also placed special emphasismaintained our focus on the expansionimproving and upgrading ofenhancing our cinema exhibition portfolio, as discussed below:
Cinema Additions (including refurbishments and re-openings)Enhancements
The latest additions and enhancements to our cinema portfolio are as follows:
| ·
| | Opening our first dine-in concept, “Spotlight” in the United States: On March 30, 2018 we finished the conversion of one wing (six auditoriums) at our Reading Cinema in Murrieta, California (Cal Oaks) to our dine-in concept brand, “Spotlight”.
|
| ·
| | AU and NZ Additions/Refurbishments:On January30, 2019, we purchased the tenant’s interest and other operating assets of an established four-screen cinema in Devonport, Tasmania, Australia, for $1.4 million (AU$1.95 million). We commenced trading from this new cinema site on January30, 2019. For the first nine months of 2019, we invested in two additional Gold Lounge auditoriums at our Harbour Town cinema, and converted two screens to TITAN LUXE with fully recliner seating and renovated the Gold Lounge auditorium at West Lakes. This is in addition to the previously disclosed significant improvements at The Palms, Maitland and Waurn Ponds. During January 2019, we closed our Courtenay Central cinema, servicing the Wellington market due to seismic concerns. We are currently working on our re-development and seismic strengthening plans for this facility. In order to service this market while we develop our plans for the redevelopment of Courtenay Central, we have opened a three-screen, 440 seat pop-up cinema in Lower Hutt, a suburb of Wellington, New Zealand. In 2017 and 2018, we improved the following theaters: Belmont, Rouse Hill, Napier, Charlestown, Elizabeth, Auburn and Rotorua.
|
| ·
| | U.S. Refurbishments: For the first nine months of 2019, we continued investing in refurbishments of two Consolidated Theatres in Hawaii in Mililani and Kahala on Oahu. We also added a TITAN XC screen and reserved seating at ourAcquisition of a well-established Cinema in Devonport, Tasmania, Australia: On January 30, 2019, we purchased the tenant’s interest and other operating assets of a well-established four-screen cinema in Devonport, Tasmania, Australia, for $1.4 million (AU$1.95 million). We commenced trading from this new cinema site on January 30, 2019. Leased a Cinema space in Lower Hutt, adjacent to Wellington, New Zealand: To mitigate the ongoing temporary closure of Reading Cinemas at Courtenay Central, we opened a three-screen cinema that trades as The Hutt Pop Up by Reading Cinemas in late June 2019. Acquisition of a Dynamic Arthouse Cinema in Hobart, Tasmania, Australia: On December 5, 2019, we acquired the iconic State Cinema for $6.2 million (AU$9.0 million). This leasehold interest features 10 screens, a roof top cinema and bar, a large café, and a bookstore. Opened a new state-of-the-art six-screen Cinema in Melbourne, Australia: On December 6, 2019, we opened a six-screen Reading Cinemas in Rohnert Park, California. Since 2017, we have continued to invest in the refurbishment and enhancements of our existing cinemas, as contemplated by our strategic plan. During 2017 and 2018, we substantially refurbished seven locations: our Cal Oaks, Valley Plaza and Grossmont cinemas in California; our Ward, Pearlridge, and Mililani locations in Hawaii; and our Manville cinema in New Jersey.
|
Cinema Pipeline
We currently plan to upgrade or begin the upgrade of 9 cinemas in the Burwood Brickworks shopping center offering a TITAN LUXE with DOLBY ATMOS immersive sound, enhanced food and beverage offerings, and full recliner seating in all auditoriums.
U.S., Refurbishments: In 2019 and 2020, we continued to invest in the refurbishment and enhancements of our existing cinemas, as contemplated by our strategic plan. During this period, three locations had significant refurbishment work performed: our Rohnert Park location in California and our Mililani and Kahala (work commenced in late 2019 but is currently suspended due to the COVID-19 shutdown) locations in Hawaii.
AU and NZ Refurbishments: In 2019 and 2020, we improved eight theaters: Chirnside Park, Dandenong, Harbour Town, Maitland, Rhodes, Waurn Ponds, West Lakes, and The Palms.
Cinema Pipeline
In the first quarter of 2020, we continued with the renovation of our Consolidated Theatres at the Kahala Mall in Honolulu in the U.S. However, this renovation has been halted due to the governmental restrictions imposed due to the COVID pandemic. We do not have a definitive schedule for re-commencing this renovation.
In Australia, we previously announced the construction of four new Reading Cinemas pursuant to Agreements to Lease: (i) Altona, VIC, (ii) Traralgon, VIC, (iii) Jindalee, QLD and New Zealand between now and the end of the year.
(iv) South City Square in Brisbane, QLD. We have entered into lease agreementsan agreement-in-principle with our Altona landlord in the State of Victoria to extend that cinema fit-out handover date. Based on our agreement, the potential opening date of that new cinema will likely be delayed until early 2021. With respect to our Traralgon cinema in the State of Victoria, the landlord has been delayed in turning over the space for five new cinemascinema fit-out and discussions about the tenancy and scheduling are ongoing. We do not anticipate that the cinema in Australia (31 screens), which we anticipateTraralgon will come onlineopen in 2019 - 2021. This includes2020.
Practical Completion has been achieved for Altona, with Traralgon and Jindalee expected to be achieved during the recently announced state-of-the art cinema at Miller’s Junctionfourth quarter 2020. We will continue to evaluate the timing of these fit-out obligations in Melbourne, Australia.light of our future capital needs.
Our focus with respect to new cinemas is on featuringincludes state-of-the-art projection and sound, luxury recliner seating, enhanced F&B (typically including alcohol service), and typically at least one major TITAN type presentation screen. We are emphasizing best in classOur focus is on providing best-in-class services and amenities in order tothat will differentiate ourselvesus from in-home and mobile viewing options. We believe that a night at the movies should be a special and premium experience and, indeed, that it must be in orderable to compete with the variety of options being offered to consumers through other platforms.
Throughout 2019,During 2020, we will continue to focusalso be focusing on the rollout and enhancement of our proprietary online ticketing capabilities and social media interfaces. These are intended to enhance the convenience of our offerings and to promote customerguest affinity with the experience and product that we are presenting.offering. We will also be focusing on post-COVID-19 technology improvements to facilitate improved social distancing and contactless experiences. Further, expanding our online capabilities, we anticipate launching limited F&B ordering online for our cinema circuits in the U.S., Australia, and New Zealand during the third quarter of 2020.
Cinema Closures
As of the end of the first quarter of 2020, all of our cinemas in the United States, Australia, and New Zealand were temporarily closed in accordance with the directions and recommendations of the relevant local, state, and federal authorities relating to the COVID-19 pandemic. As the COVID-19 pandemic outbreak has been largely contained in most areas in Australia and New Zealand, and the restrictions have been reduced by local government authorities, we have re-opened most of our cinemas in Australia and all of our cinemas in New Zealand (other than our cinema at Courtenay Central). As of June 3, 2020, we had re-opened our New Zealand circuit except for our Reading Cinemas at Courtenay Central (which continues to be closed due to seismic concerns). As of July 1, 2020, we had re-opened our Australian cinema circuit, however, as of August 5, 2020, due to a spike in new COVID-19 cases, we shut down all seven of our theaters in the state of Victoria. In the U.S., we currently anticipate re-opening our cinemas once we have certainty that the major studios will begin releasing major tentpole movies in our cinemas and local government restrictions permit the opening of movie theaters. Until those conditions are met, we will not announce re-opening dates.
In January 2019, we temporarily closed our Courtenay Central cinema in Wellington, New Zealand. This temporary closure is ongoing due to seismic concerns. While we have continued during the COVID-19 pandemic to advance our planning for the center, and have continued conversations with consultants, potential tenants, and city representatives, given the uncertainty surrounding the COVID-19 pandemic situation, we have no fixed time frame for the commencement of the redevelopment of this property.
During the second andquarter of 2019, the Company’s management agreement for the operation of the 86th Street Cinema in New York City terminated due to the expiration of the underlying lease. Additionally, during the third quarter of 2019, the leases underlying our historically profitable Paris Theatre and Beekman Theatre and 86th Street Theater in New York City allboth expired. Our effortsWe were unable to obtain extensions or new leases for these cinemas on commercially reasonable terms were unsuccessful.terms.
While someIn December 2019, we temporarily closed our Consolidated Theatres at the Kahala Mall in Honolulu for a top-to-bottom renovation, a closure that is currently ongoing. The renovation is not yet completed, and our construction has been effectively halted by the governmental restrictions imposed on us in reaction to the COVID-19 pandemic. When re-opened, the theatre will feature recliner seating throughout along with a state-of-the-art kitchen and an elevated F&B menu.
Some of our theaterscinemas have encountered new competition, and while we believe that others will benefit from planned refurbishment and upgrading. The scope, extent and timing of such refurbishment and upgrading none ofwill be necessarily impacted by our leased theaters are currently slated for closure.need to preserve capital and liquidity while we work through the various challenges posed by the ongoing COVID-19 pandemic.
Upgrades to our Film Exhibition Technology and Theater Amenities
As a partpreviously discussed, we continue to focus on areas of our program to bringthe well-established cinema business where we believe we have growth potential and ultimately, provide long-term value to our stockholders,stockholders. In order to meet our changing role in the entertainment industry, we continue to explore cinema markets where we believe there to be an ongoing growth potential and to upgradehave invested both in (i) the technology and amenities offered at our existing sites. These include (i) upgrading of our existing cinemas and (ii) developing new cinemas to provide our customers with premium offerings, including state-of-the-art presentation (including sound, lounges, and bar service), and luxury recliner seating. TheAs of June 30, 2020, all of the upgrades to our theater circuits’ film exhibition technology and amenities over the years are as summarized in the following table (including joint ventures):table:
| | | |
| | | |
| Location
Count | | Screen
Count |
Screen Format | | | |
Digital (all cinemas in our theater circuit) | 58 | | 480 |
IMAX | 1 | | 1 |
TITAN XC and LUXE | 22 | | 26 |
Dine-in Service | | | |
Gold Lounge (AU/NZ)(1) | 10 | | 26 |
Premium (AU/NZ)(2) | 12 | | 22 |
Spotlight (U.S.)(3) | 1 | | 6 |
Upgraded Food & Beverage menu (U.S.)(4) | 15 | | n/a |
Premium Seating (recliner seating features) | 25 | | 149 |
Liquor Licenses Obtained(5) | 31 | | n/a |
| (1)
| | Gold Lounge: This is our "First Class Full Dine-in Service" in our Australian and New Zealand cinemas, which includes upgraded F&B menu (with alcoholic beverages), luxury recliner seating features (intimate 25-50 seat cinemas) and waiter service.
|
| (2)
| | Premium Service: This is our "Business Class Dine-in Service" in our Australian and New Zealand cinemas, which typically includes upgraded F&B menu (some with alcoholic beverages) and may include luxury recliner seating features (less intimate 80-seat cinemas), but no waiter service.
|
| (3)
| | Spotlight Service: On March 30, 2018 we opened “Spotlight,” our first dine-in cinema concept in the United States at Reading Cinemas in Murrieta, California. Six of our 17 auditoriums at this theater feature this dine-in concept.
|
| (4)
| | Upgraded Food & Beverage Menu: Fifteen of our U.S. theaters feature an elevated food and beverage menu served from a common counter, which includes, without limitation, beer, wine and/or spirits and a food menu beyond traditional concessions. We have worked with former Food Network executives to create a menu of locally inspired and freshly prepared items.
|
| (5)
| | Liquor Licenses: Licenses are applicable at each cinema location, rather than each theatre auditorium. For accounting purposes, we capitalize the cost of successfully purchasing or applying for liquor licenses meeting certain thresholds as an intangible asset due to long-term economic benefits derived on future sales of alcoholic beverages.
|
|
|
|
|
|
|
|
|
| Location
Count |
| Screen
Count |
Screen Format |
|
|
|
Digital (all cinemas in our theater circuit) | 60 |
| 498 |
IMAX | 1 |
| 1 |
TITAN XC and LUXE | 24 |
| 29 |
Dine-in Service |
|
|
|
Gold Lounge (AU/NZ)(1) | 9 |
| 24 |
Premium (AU/NZ)(2) | 14 |
| 33 |
Spotlight (U.S.)(3) | 1 |
| 6 |
Upgraded Food & Beverage menu (U.S.)(4) | 16 |
| n/a |
Premium Seating (features recliner seating) | 26 |
| 161 |
Liquor Licenses (Selling)(5) | 33 |
| n/a |
(1)Gold Lounge: This is our "First Class Full Dine-in Service" in our Australian and New Zealand cinemas, which includes an upgraded F&B menu (with alcoholic beverages), luxury recliner seating features (intimate 25-50 seat cinemas) and waiter service.
(2)Premium Service: This is our "Business Class Dine-in Service" in our Australian and New Zealand cinemas, which typically includes upgraded F&B menu (some with alcoholic beverages) and may include luxury recliner seating features (less intimate 80-seat cinemas), but no waiter service.
(3)Spotlight Service: On March 30, 2018 we opened “Spotlight,” our first dine-in cinema concept in the United States at Reading Cinemas in Murrieta, California. Six of our 17 auditoriums at this theater feature this dine-in concept.
(4)Upgraded Food & Beverage Menu: 16 of our U.S. theaters feature an elevated F&B menu served from a common counter, which includes, without limitation, beer, wine and/or spirits, and a food menu beyond traditional concessions. We have worked with former Food Network executives to create a menu of locally inspired and freshly prepared items.
(5)Liquor Licenses: Licenses are applicable at each cinema location, rather than each theater auditorium. For accounting purposes, we capitalize the cost of successfully purchasing or applying for liquor licenses meeting certain thresholds as an intangible asset due to long-term economic benefits derived on future sales of alcoholic beverages. As of June 30, 2020, we have six pending applications for additional liquor licenses in the U.S.
Real Estate
Our
As of June 30, 2020, our operating properties currently consistsconsisted of the following assets:
| ·
| | our Newmarket, Queensland ETC, our Belmont, Western Australia ETC, our Auburn, New South Wales ETC, our Townsville, Queensland ETC, our Wellington, New Zealand ETC, and our Cinemas 1,2,3, New York, NY;
|
| ·
| | two single-auditorium live theatres in Manhattan (Minetta Lane and Orpheum) and a four-auditorium live theater complex (including the accompanying ancillary retail and commercial space) in Chicago (The Royal George);
|
| ·
| | our Worldwide Headquarters building in Culver City, California and our Australia corporate office building in Melbourne, Australia; and,
|
| ·
| | the ancillary retail and commercial space at some of our non-ETC cinema properties.
|
following:
WeNewmarket Village (Brisbane area, QLD), Cannon Park (Townsville, QLD), The Belmont Common (Perth area, WA) Auburn Redyard (Sydney area, NSW), and Courtenay Central (Wellington area, NZ);
two single-auditorium live theatres in Manhattan (Minetta Lane and Orpheum) and a four-auditorium live theatre complex (including the accompanying ancillary retail and commercial tenants) in Chicago (The Royal George);
our worldwide headquarters’ building in Culver City, California and our Australia corporate office building in Melbourne, Australia; and,
the ancillary retail and commercial tenants at some of our non-ETC cinema properties.
In late March of 2020, trading restrictions enforced by the government affected many of our tenants at our properties, including Newmarket Village (Brisbane area, QLD), Cannon Park (Townsville, QLD), The Belmont Common (Perth area, WA), Auburn Redyard (Sydney area, NSW), and Courtenay Central (Wellington area, NZ), although trading restrictions were enforced, all of these properties remained open for business through the COVID-19 crisis. These affected tenants represented a majority of the third-party tenants at each of these centers. However, most of our tenants are currently licenseopen for business at our Minetta Lane theatre to Audible, Inc., a subsidiary of Amazon. This agreement continues through March 2020,Australia and Audible has an option to extend for one additional year through March 2021. We are advised that Audible intends to produce plays featuring a limited cast of one or two characters and special live performance engagements, record those productions and make them availableNew Zealand properties (other than tenant’s whose closures were unrelated to the public through the Audible streaming service.COVID-19 pandemic).
In addition, we have various parcels of unimproved real estate held for development in Australia and New Zealand and certain unimproved land in the United States, including some that was used in our legacy activities.
Our key real estate transactions in recent years are as follows:
Strategic Acquisitions
| ·
| | Purchase of Land at Cannon Park, Australia –On June 13, 2018, we acquired a 163,000 square foot (15,150 square meter) parcel at our Cannon Park ETC, in connection with the restructuring of our relationship with the adjacent land owner. Prior to the restructuring, this parcel was commonly owned by us and the adjoining land owner. In the restructuring, the adjoining land owner conveyed to us its interest in the parcel for AU$1. We granted the adjoining land owner certain access rights.
|
| ·
| | Purchase of Property in Auburn, Australia – On June 29, 2018, we added 20,870 square feet of land, improved with a 16,830 square foot office building, to our Auburn/Redyard ETC. The property was acquired at auction for $3.5 million (AU$4.5 million) and is bordered by our existing ETC on three sides. The property is leased to Telstra through July 2022. This will allow us time to plan for the efficient integration of the property into our ETC. The final settlement payment was made in early October 2018.
|
| ·
| | Exercise of Option to Acquire Ground Lessee’s interest in Ground Lease and Improvements Constituting the Village East Cinema – On August 28, 2019, we exercised our option to acquire the ground lessee’s interest in the 13 year ground lease underlying and the real property assets constituting our Village East Cinema in Manhattan. The purchase price under the option is $5.9 million. It is anticipated that the transaction will close on or about May 31, 2020.
|
Value-creating Opportunities
Purchase of Property in Auburn, Australia – On June 29, 2018, we added 20,870 square feet of land, improved with a 16,830 square foot office building, to our Auburn Redyard ETC. The property was acquired at auction for $3.5 million (AU$4.5 million) and is bordered by our existing ETC on three sides. The property is leased to Telstra through July 2022. This lease will allow us time to plan for the efficient integration of the property into our ETC. With this acquisition, Auburn Redyard now represents approximately 519,358 square feet of land, with approximately 1,641 feet of uninterrupted frontage to Parramatta Road, a major Sydney arterial motorway.
Exercise of Option to Acquire Ground Lessee’s interest in Ground Lease and Improvements Constituting the Village East Cinema – On August 28, 2019, we exercised our option to acquire the ground lessee’s interest in the ground lease underlying and the real property assets constituting our Village East Cinema in Manhattan. The purchase price under the option is $5.9 million. It is now anticipated that the transaction will close on or about May 31, 2021. On March 12, 2020, we amended the original agreement to (i) extend the term of the lease to January 31, 2022 and extend the put option to December 4, 2021 and (ii) at the request of Sutton Hill Capital L.L.C. (“SHC”), in connection with our deferral of the closing date for our acquisition of SHC’s interest in the Village East Cinema, the Company reinstated and extended until December 4, 2021 SHC’s right to put that interest to us. That put right had previously expired on December 4, 2019. We are engagedadvised by SHC that it wanted this reinstatement and extension in severalorder to assure itself that, in the event of the non-performance by us of our current contractual obligation to close our purchase of the interest in the ground lease on or about the extended date of May 31, 2021, that it could (as, in effect, an additional remedy) exercise this reinstated and extended put right. As the transaction is a related party transaction, it was reviewed and approved by our Board’s Audit and Conflicts Committee and supported by a third-party valuation, which showed substantial value in the option and, upon closing, will result in an annual rent savings of $590,000.
Value-creating Opportunities
The implementation of most of our real estate development projectsplans have been delayed due to COVID-19 and the need to conserve capital. However, we continue to believe that our Company’s strong real estate base will provide (i) increased financial security through the potential sale of certain non-core real estate assets or (ii) provide collateral for strategic re-financing, in each case to meet liquidity demands. We intend to continue to emphasize the prudent development of our real estate assets.
United States:
Sepulveda Office Building (Culver City, U.S.)– On May 27, 2020, we leased on a multi-year basis the entire second floor of our headquarter building in Culver City, California (approximately 11,000 usable square feet) to WWP (wwpinc.com), a global company with over 35 years of experience providing the cosmetics and personal care industries with a range of packaging needs. On the date of the lease, possession of the space was turned over to WWP, which is responsible for building out its space. On a straight-line basis, rent commenced during the second quarter of 2020, and we anticipate receiving rental payments during the fourth quarter of 2020.
44 Union Square (New York City, U.S.) – Historically known as Tammany Hall, this building with approximately 73,113 square feet of net rentable area overlooks Manhattan’s Union Square. During the COVID-19 pandemic, New York City shut down non-essential construction and business, including construction work at our site. However, the construction of the improvements necessary to obtain a core and shell temporary certificate of occupancy were substantially completed prior to the shutdown. On July 1, 2020, the site re-opened for construction activities, and we anticipate that the core and shell temporary certificate of occupancy will be in place by the end of August 2020 as only the completion of certain fireproofing remains to be completed.
While the Real Estate Board of New York prohibited leasing activity during the COVID-19 shutdown, in June 2020, our leasing team commenced ramping up their leasing efforts. This building, hailed as a dramatic pièce derésistance with its first in the city, over 800-piece glass dome, bringing the future to New York’s fabled past and was awarded in 2017 the AIA QUAD Design Honor Award, and the Architizer A+ Awards, Typology Winner, Commercial Award. It is one of a very limited number of “brandable” sites available for immediate lease in New York City. We believe 44 Union Square will be attractive to potential tenants interested in both (i) operating in New York City and (ii) seeking to have greater control over the size and design of their spaces in a post-COVID-19 environment. As a practical matter, the building has now reached a state of completion where the premises can be delivered immediately upon the execution of leases.
Minetta Lane Theatre (New York City, U.S.) – We have completed an initial feasibility study regarding the potential redevelopment of this property. However, at the present time, our theatre is being used by Audible, a subsidiary of Amazon, to present plays featuring a limited cast of one or two characters and special live performance engagements, which it is recording and making available to the public through the Audible streaming service. Due to COVID-19, no shows have been presented since March 2020.
Cinemas 1,2,3 Redevelopment (New York City, U.S.) – As previously disclosed, our endeavors to negotiate a joint development deal with our adjoining neighbors have not borne fruit. Given the closure of our two cinemas in New York City’s Upper East Side, we have determined to continue to operate this location as a cinema for at least the near term. We are pursuing a rezoning of this property so as to allow us to continue our cinema use as a part of any such redevelopment. However, all other redevelopment activity related to this location has been suspended, until we are able to develop a better understanding of the ongoing effects of COVID-19 on our assets and the market.
New Zealand:
Manukau/Wiri Land Rezoning (Auckland, New Zealand) – We continued to progress the infrastructure plans for our 64.0-acre property, which we previously re-zoned from agricultural to light industrial uses, and to the remaining 6.4-acre property, zoned for heavy industrial use, each located in the highly sought after industrial market of Manukau/Wiri close to the Auckland Airport.
In June 2020, the Auckland Council granted to us and the adjoining landowner, subject to certain conditions, certain consents required to construct certain infrastructure needed to take advantage of the new light industrial zoning.
Notwithstanding that the Auckland Airport recently announced that the COVID-19 pandemic may lead to an indefinite suspension of certain expansion plans, including the “Park and Ride” facility near our propertiesproperty, we continue to their highestview the industrial property sector as being one of the most resilient in the current economic climate. We believe that the work completed to date has contributed to the overall value of our land in Manukau/Wiri.
Courtenay Central Redevelopment (Wellington, New Zealand) – Located in the heart of Wellington – New Zealand’s capital city – our Courtenay Central property covers 161,071 square feet of land situated proximate to (i) the Te Papa Tongarewa Museum (attracting over 1.5 million visitors annually, pre-COVID), and best use. The most notable(ii) across the street from the site of the future Wellington Convention and Exhibition Centre (wcec.co.nz), the capital’s first premium conference and exhibition space, which is due to be completed in 2023. Despite the COVID-19 pandemic, construction for this major public project has resumed and plans include the creation of a public concourse linking through to Wakefield Street, which is across the street from our Courtenay Central project.
As previously reported, damage from the 2016 Kaikoura earthquake necessitated demolition of our nine-story parking garage at the site, and unrelated seismic issues caused us to close major portions of the existing cinema and retail structure in early 2019. Prior to the COVID-19 pandemic, the real estate team had developed a comprehensive plan featuring a variety of uses to complement and build upon the “destination quality” of the Courtenay Central location. Notwithstanding the COVID-19 pandemic, our real estate team is continuing to work with our consultants, potential tenants, and city representatives to advance our redevelopment plans for this property.
Corporate Matters
Stock Repurchase Program – Our Board approved a $25.0 million repurchase program on March 2, 2017 and on March 14, 2019, extended the program through March 2, 2021. Under this authorization Reading may repurchase its Class A Non-Voting Common Stock from time to time in accordance with the requirements of the Securities and Exchange Commission on the open market, in block trades and in privately negotiated transactions, depending on market conditions and other factors. Through June 30, 2020, we have repurchased 1,792,819 shares of Class A Non-Voting Common Stock at an average price of $13.39 per share (excluding transaction costs). Of these, value-creating projects are as follows:75,157 shares were purchased during the six months ended June 30, 2020, at an average price of $8.92 per share. These purchases occurred in the first quarter of 2020. On March 10, 2020, our Board of Directors authorized a $25.0 million increase to our stock repurchase program, bringing our total authorized repurchase amount remaining to $26.0 million, and extended the program to March 2, 2022.
Due to the COVID-19 pandemic and its impact on our overall liquidity, our stock repurchase program will likely take a lower capital allocation priority for the foreseeable future.
Board Compensation and Stock Options Committee – Our Compensation and Stock Options Committee, in early 2020, determined to pay out no cash bonuses, with respect to 2019, to any Reading senior executives, including our CEO. No non-employee director RSUs or stock options have been issued with respect to 2020.
| ·
| | Re-Development of 44 Union Square (New York, U.S.) During July 2019, we topped out the steel dome capping our redevelopment of historic Tammany Hall at 44 Union Square and the last of the glass was installed last month. We anticipate filing for our core and shell temporary certificate of occupancy in December 2019 and are in final negotiations of a long-term lease for approximately 90% of the net rentable area of the building. This lease would be for office use, and the remaining 7,200 square feet of ground floor space (facing onto Union Square) continues to be marketed for retail use by Newmark.
|
| ·
| | Expansion Project for our Newmarket Shopping Center at an affluent suburb of Brisbane, Australia. In December 2017, we opened our eight-screen Reading Cinema with TITAN LUXE, including 10,355squarefeet of additional retail space and 124 parking spaces. As of September 30, 2019, 100% of this new retail space has been leased.
|
| §
| | Cinemas 1,2,3 Redevelopment – As previously disclosed, our endeavors to negotiate a joint development deal with our adjoining neighbors have not borne fruit. Given the closure of our three cinemas in New York City’s Upper East Side, we have determined to continue to operate this location as a cinema for at least the near term.
|
| ·
| | Manukau Land Rezoning – In August 2016, the Auckland City Council up-zoned 64.0 acres of our property in Manukau from agricultural to light industrial use. The remaining 6.4 acres were already zoned for heavy industrial use. With our zoning enhancement goal having been achieved, we are working with adjoining landholders to jointly advance necessary infrastructure improvement issues. Over the past nine months, we have developed budgets and layouts and have made the various resource consent filings required for the construction of anticipated infrastructure. We estimate that our property will support approximately 1.6 million square feet of improvements. We see this property as a future value realization opportunity for us. This tract is adjacent to the Auckland Airport, which is currently undergoing a major improvement and expansion project.
|
Corporate Matters
| §
| | Stock Repurchase Program – Our Board approved a $25-million repurchase program on March 2, 2017, and extended it on March 14, 2019. Under this authorization Reading may repurchase its Class A Non-Voting Common Stock from time to time in accordance with the requirements of the Securities and Exchange Commission on the open market, in block trades and in privately negotiated transactions, depending on market conditions and other factors. The new authorization continues through March 2, 2021. Through September 30, 2019, we have repurchased 1,415,624 shares of Class A Non-Voting Common Stock at $14.23 per share (excluding transaction costs). 659,608 shares were purchased during the quarter ended September 30, 2019, at an average price of $13.17 per share. As of September 30, 2019, $4.9 million was available under the March 2, 2017 program, as extended, for repurchase.
|
Our Financing Strategy
OurPrior to COVID-19, our treasury management is focused on cash management usingused cash balances to reduce debt. WePrior to the interruptions to our revenues caused by the COVID-19 pandemic, we have used cash generated from operations and other excess cash, to the extent not needed forto fund capital expenditures,investments contemplated by our business plan, to pay down our loans and credit facilities providingfacilities. This has provided us flexibility onwith availability under our available loan facilities for future use and thereby, reducingreduced interest charges. On a periodic basis, we reviewhave reviewed the maturities of our borrowing arrangements and negotiate for renewals and extensions where necessary in the current circumstances. We completed amending and extending various financing arrangements less than two weeks prior to the COVID-19 government mandated shutdowns, which we believe has helped provide necessary liquidity to see us through the COVID-19 crisis.
In response to the COVID-19 pandemic, the closure of our theaters, and the trading restrictions placed on many of our real estate tenants at our entertainment themed shopping centers, we had, as of June 30, 2020, fully drawn-down on all our available operating lines-of-credit to provide future liquidity.
As a result of the impact of COVID-19, we have obtained certain modifications to our loan agreements with the Bank of America, N.A., National Australia Bank, and Westpac New Zealand Limited for the quarter ended June 30, 2020 to ensure future liquidity in light of the COVID-19 pandemic. These loan modifications included changes to some of the covenant compliance terms and waivers to certain covenant testing periods for these lenders. We currently have no covenant breaches to which loan modifications or waivers to the covenant testing periods have not been obtained.
Bank of America Loan
On March 15,6, 2020, we (i) entered into an amendment for our $55.0 million credit facility with Bank of America, which supports our U.S. Cinema operations, extending the maturity date to March 6, 2023 and implementing an interest rate of 2.5% - 3.0% dependent on certain financial ratios plus a variable rate and (ii) extended the term of our $5.0 million line of credit with Bank of America to March 6, 2023.
On August 7, 2020, we modified certain financial covenants within this credit facility and temporarily suspended the testing of certain other covenant tests through measurement period ending September 30, 2021. The testing of the financial covenant resumes for measurement period ending December 31, 2021. The modifications also include new covenants related to maintenance of certain liquidity levels. Under the Amendment, cash balances in excess of $3.0 million will be used to paydown the facility debt. However, this is not a reduction in that credit facility and, subject to the satisfaction of draw down requirements, will be available for re-borrowing. In addition to the covenant modifications, the interest rate on borrowings under this facility was fixed at 3.0% above the “Eurodollar” rate, which itself now has a floor of 1.0%. In regard to the line of credit, we also modified the interest rate, wherein the LIBOR portion of the rate now has a floor of 1.0%. Such modifications were not considered to be substantial under U.S. GAAP.
Cinemas 1,2,3 Term Loan
On March 13, 2020, Sutton Hill Properties LLC, our 75% subsidiary, increased its term loan with Valley National Bank to $25.0 million from $20.0 million, with an interest rate based on (i) the two year U.S. Treasury Rate plus 2.5% or (ii) 4.25%, whichever is greater. The current interest rate used for the Valley National Loan is 4.25%.
Australian NAB Corporate Term Loan (AU)
Prior to COVID-19, in March 2019, we amended our Revolving Corporate Markets Loan Facility with National Australia Bank (“NAB”)NAB from a facility comprised of (i) a AU$66.5 million loan facility with an interest rate of 0.95% above the Bank Bill Swap Bid Rate (“BBSY”)BBSY and a maturity date of June 30, 2019 and (ii) a bank guarantee of AU$5.0 million at a rate of 1.90% per annum into (i) a (i) AU$120.0 million corporate loanCorporate Loan facility at ratesa rate of 0.85%-1.30% - 1.3% above BBSY, depending on certain ratios, with a due date of December 31, 2023, of which AU$80.0 million is revolving and AU$40.0 million is core and (ii) a bank guarantee facilityBank Guarantee Facility of AU$5.0 million at a rate of 1.85% per annum. Such debt modifications of this particular term loan were not considered to be substantial under USU.S. GAAP.
On August 6, 2020, we modified certain covenants within this Revolving Corporate Markets Loan Facility with NAB (the “NAB Amendment”). These modifications apply until the quarter ended June 30, 2021. In addition, for the period in which these covenant modifications apply, the interest rate on amounts borrowed under the facility is 1.75%. The NAB Amendment modifies the Fixed Charge Cover Ratio testing for the quarters through June 30, 2021 so that ratio testing is calculated on each respective quarter’s trading performance, as opposed to annually and waives the leverage ratio testing through the quarter ended June 30, 2021. Such a modification was not considered to be substantial under U.S. GAAP.
Westpac Bank Corporate Credit Facility (NZ)
On December 20, 2018, we restructured our Westpac Corporate Credit Facilities. The maturity of the 1st1st tranche (general/non-construction credit line) was extended to December 31, 2023, with the available facility being reduced from NZ$35.0 million to NZ$32.0 million. The facility bears an interest rate of 1.75% above the Bank Bill Bid Rate on the drawn down balance and a 1.1% line of credit charge on the entire facility. The 2nd2nd tranche (construction line) with a facility of NZ$18.0 million was removed.
On November 5, 2019, weJune 29, 2020, Westpac pushed out the June 30, 2020 covenant testing date to July 31, 2020. On July 27, 2020, Westpac waived the requirement to test certain covenants as of July 31, 2020. This agreement also increased the interest rate and line of credit charge to 2.40% above the Bank Bill Bid Rate and 1.65%, respectively. The maturity date was extended our current Bankto January 1, 2024. Such modifications of America credit facilities until October 1, 2020 (the $55.0 million credit line).this facility were not considered to be substantial under U.S. GAAP.
Refer to our 20182019 Form 10-K for more details on our cinema and real estate segments.
RESULTS OF OPERATIONS
The table below summarizes the results of operations for each of our principal business segments along with the non-segment information for the quarter and ninesix months ended SeptemberJune 30, 2020 and June 30, 2019, and September 30, 2018, respectively.respectively:
| | | | | | | | | | | | | | | | | | | | |
|
|
|
|
|
|
|
|
|
|
|
|
|
|
|
|
|
|
|
|
| | | Quarter Ended | | % Change | | Nine Months Ended | | % Change |
|
| Quarter Ended |
| % Change |
| Six Months Ended |
| % Change |
(Dollars in thousands) | (Dollars in thousands) | | September 30,
2019 | | September 30,
2018 | | Fav/
(Unfav) | | September 30,
2019 | | September 30,
2018 | | Fav/
(Unfav) | (Dollars in thousands) |
| June 30,
2020 |
| June 30,
2019 |
| Fav/
(Unfav) |
| June 30,
2020 |
| June 30,
2019 |
| Fav/
(Unfav) |
SEGMENT RESULTS | SEGMENT RESULTS | | | | | | | | | | | | | | | | | | | | SEGMENT RESULTS |
|
|
|
|
|
|
|
|
|
|
|
|
|
|
|
|
|
|
|
| Revenue | | | | | | | | | | | | | | | | | | | | | Revenue |
|
|
|
|
|
|
|
|
|
|
|
|
|
|
|
|
|
|
|
|
| Cinema exhibition | | $ | 66,733 | | | 70,671 | | (6) | % | | $ | 197,101 | | $ | 223,109 | | (12) | % | Cinema exhibition |
| $ | 1,217 |
| $ | 72,296 |
| (98) | % |
| $ | 47,527 |
| $ | 130,223 |
| (64) | % |
| Real estate | | | 5,531 | | | 5,771 | | (4) | % | | | 16,525 | | | 18,204 | | (9) | % | Real estate |
|
| 2,303 |
|
| 5,564 |
| (59) | % |
|
| 6,905 |
|
| 10,994 |
| (37) | % |
| Inter-segment elimination | | | (1,808) | | | (2,181) | | 17 | % | | | (5,524) | | | (6,918) | | 20 | % | Inter-segment elimination |
|
| (98) |
|
| (1,851) |
| 95 | % |
|
| (1,782) |
|
| (3,716) |
| 52 | % |
| Total revenue | | | 70,456 | | | 74,261 | | (5) | % | | | 208,102 | | | 234,395 | | (11) | % | Total revenue |
|
| 3,422 |
|
| 76,009 |
| (95) | % |
|
| 52,650 |
|
| 137,501 |
| (62) | % |
| Operating expense | | | | | | | | | | | | | | | | | | | | | Operating expense |
|
|
|
|
|
|
|
|
|
|
|
|
|
|
|
|
|
|
|
|
| Cinema exhibition | | | (55,517) | | | (57,111) | | 3 | % | | | (163,797) | | | (177,101) | | 8 | % | Cinema exhibition |
|
| (13,758) |
|
| (58,086) |
| 76 | % |
|
| (57,734) |
|
| (108,280) |
| 47 | % |
| Real estate | | | (2,225) | | | (2,474) | | 10 | % | | | (7,108) | | | (7,409) | | 4 | % | Real estate |
|
| (1,589) |
|
| (2,438) |
| 35 | % |
|
| (4,349) |
|
| (4,883) |
| 11 | % |
| Inter-segment elimination | | | 1,808 | | | 2,181 | | (17) | % | | | 5,524 | | | 6,918 | | (20) | % | Inter-segment elimination |
|
| 98 |
|
| 1,851 |
| (95) | % |
|
| 1,782 |
|
| 3,716 |
| 52 | % |
| Total operating expense | | | (55,934) | | | (57,404) | | 3 | % | | | (165,381) | | | (177,592) | | 7 | % | Total operating expense |
|
| (15,249) |
|
| (58,673) |
| 74 | % |
|
| (60,301) |
|
| (109,447) |
| 45 | % |
| Depreciation and amortization | | | | | | | | | | | | | | | | | | | | | Depreciation and amortization |
|
|
|
|
|
|
|
|
|
|
|
|
|
|
|
|
|
|
|
|
| Cinema exhibition | | | (4,271) | | | (4,352) | | 2 | % | | | (12,519) | | | (12,199) | | (3) | % | Cinema exhibition |
|
| (3,764) |
|
| (4,091) |
| 8 | % |
|
| (7,543) |
|
| (8,247) |
| 9 | % |
| Real estate | | | (1,330) | | | (1,385) | | 4 | % | | | (4,061) | | | (4,193) | | 3 | % | Real estate |
|
| (1,275) |
|
| (1,354) |
| 6 | % |
|
| (2,575) |
|
| (2,731) |
| 6 | % |
| Total depreciation and amortization | | | (5,601) | | | (5,737) | | 2 | % | | | (16,580) | | | (16,392) | | (1) | % | Total depreciation and amortization |
|
| (5,039) |
|
| (5,445) |
| 7 | % |
|
| (10,118) |
|
| (10,978) |
| 8 | % |
| General and administrative expense | | | | | | | | | | | | | | | | | | | | | General and administrative expense |
|
|
|
|
|
|
|
|
|
|
|
|
|
|
|
|
|
|
|
|
| Cinema exhibition | | | (924) | | | (1,006) | | 8 | % | | | (2,854) | | | (2,826) | | (1) | % | Cinema exhibition |
|
| (949) |
|
| (937) |
| (1) | % |
|
| (2,158) |
|
| (1,929) |
| (12) | % |
| Real estate | | | (491) | | | (652) | | 25 | % | | | (1,369) | | | (1,706) | | 20 | % | Real estate |
|
| (246) |
|
| (427) |
| 42 | % |
|
| (601) |
|
| (878) |
| 32 | % |
| Total general and administrative expense | | | (1,415) | | | (1,658) | | 15 | % | | | (4,223) | | | (4,532) | | 7 | % | Total general and administrative expense |
|
| (1,195) |
|
| (1,364) |
| 12 | % |
|
| (2,759) |
|
| (2,807) |
| 2 | % |
| Segment operating income | | | | | | | | | | | | | | | | | | | | | Segment operating income |
|
|
|
|
|
|
|
|
|
|
|
|
|
|
|
|
|
|
|
|
| Cinema exhibition | | | 6,021 | | | 8,202 | | (27) | % | | | 17,931 | | | 30,983 | | (42) | % | Cinema exhibition |
|
| (17,254) |
|
| 9,182 |
| (>100) | % |
|
| (19,908) |
|
| 11,767 |
| (>100) | % |
| Real estate | | | 1,485 | | | 1,260 | | 18 | % | | | 3,987 | | | 4,896 | | (19) | % | Real estate |
|
| (807) |
|
| 1,345 |
| (>100) | % |
|
| (620) |
|
| 2,502 |
| (>100) | % |
| Total segment operating income | | $ | 7,506 | | $ | 9,462 | | (21) | % | | $ | 21,918 | | $ | 35,879 | | (39) | % | Total segment operating income |
| $ | (18,061) |
| $ | 10,527 |
| (>100) | % |
| $ | (20,528) |
| $ | 14,269 |
| (>100) | % |
NON-SEGMENT RESULTS | NON-SEGMENT RESULTS | | | | | | | | | | | | | | | | | | | NON-SEGMENT RESULTS |
|
|
|
|
|
|
|
|
|
|
|
|
|
|
|
|
|
|
| Depreciation and amortization expense | | | (103) | | | (92) | | (12) | % | | | (288) | | | (313) | | 8 | % | Depreciation and amortization expense |
|
| (227) |
|
| (127) |
| (79) | % |
|
| (419) |
|
| (188) |
| (>100) | % |
| General and administrative expense | | | (4,493) | | | (4,831) | | 7 | % | | | (14,205) | | | (16,717) | | 15 | % | General and administrative expense |
|
| (3,907) |
|
| (4,670) |
| 16 | % |
|
| (8,288) |
|
| (9,710) |
| 15 | % |
| Interest expense, net | | | (1,871) | | | (1,748) | | (7) | % | | | (5,924) | | | (5,132) | | (15) | % | Interest expense, net |
|
| (2,004) |
|
| (2,204) |
| 9 | % |
|
| (3,797) |
|
| (4,055) |
| 6 | % |
| Equity earnings of unconsolidated joint ventures | | | 220 | | | 80 | | >100 | % | | | 581 | | | 667 | | (13) | % | Equity earnings of unconsolidated joint ventures |
|
| (274) |
|
| 327 |
| (>100) | % |
|
| (195) |
|
| 361 |
| (>100) | % |
| Gain (loss) on sale of assets | | | (1) | | | — | | nm | | | (1) | | | — | | nm | % | Other income (expense) |
|
| 19 |
|
| 71 |
| (73) | % |
|
| (196) |
|
| 50 |
| (>100) | % |
| Other income (expense) | | | 141 | | | (130) | | >100 | % | | | 190 | | | (273) | | >100 | % | Income before income taxes |
|
| (24,454) |
|
| 3,924 |
| (>100) | % |
|
| (33,423) |
|
| 727 |
| (>100) | % |
| Income before income taxes | | | 1,399 | | | 2,741 | | (49) | % | | | 2,271 | | | 14,111 | | (84) | % | Income tax benefit (expense) |
|
| 1,567 |
|
| (1,630) |
| >100 | % |
|
| 4,580 |
|
| (573) |
| >100 | % |
| Income tax benefit (expense) | | | (547) | | | (1,482) | | 63 | % | | | (1,159) | | | (4,618) | | 75 | % | |
Net income (loss) | Net income (loss) | | | 852 | | | 1,259 | | (32) | % | | | 1,112 | | | 9,493 | | (88) | % | Net income (loss) |
|
| (22,887) |
|
| 2,294 |
| (>100) | % |
|
| (28,843) |
|
| 154 |
| (>100) | % |
| Less: net (income) loss attributable to noncontrolling interests | | | (50) | | | (38) | | (32) | % | | | (103) | | | 88 | | (>100) | % | Less: net income (loss) attributable to noncontrolling interests |
|
| (185) |
|
| (37) |
| (>100) | % |
|
| (266) |
|
| (53) |
| (>100) | % |
Net income (loss) attributable to RDI common stockholders | Net income (loss) attributable to RDI common stockholders | | $ | 902 | | $ | 1,297 | | (30) | % | | $ | 1,215 | | $ | 9,405 | | (87) | % | Net income (loss) attributable to RDI common stockholders |
| $ | (22,702) |
| $ | 2,331 |
| (>100) | % |
| $ | (28,577) |
| $ | 207 |
| (>100) | % |
Basic EPS | | $ | 0.04 | | $ | 0.06 | | (33) | % | | $ | 0.05 | | $ | 0.41 | | (88) | % | |
Basic earnings (loss) per share | | Basic earnings (loss) per share |
| $ | (1.04) |
| $ | 0.10 |
| (>100) | % |
| $ | (1.31) |
| $ | 0.01 |
| (>100) | % |
Consolidated and Non-Segment Results:
ThirdSecond Quarter and NineSix Months Net Results
For the quarter ended September 30, 2019, netNet income attributable to RDI common stockholders decreased by 30%, or $0.4$25.0 million, to $0.9a loss of $22.7 million for the quarter ended June 30, 2020, compared to the same period in the prior year. Basic EPS for the quarter ended SeptemberJune 30, 2019,2020 decreased by $0.02$1.14, to $0.04a loss of $1.04 compared to $0.06 for the quarter ended SeptemberJune 30, 2018,2019, mainly attributed to decreases in revenue inongoing temporary closure of a portion of our cinemas during the Cinema business segment,second quarter of 2020, offset by reductions of segment variable expenses and a 7% reduction in non-segment general and administrative expenses. Additionally, revenues were adversely impactedto some extent by the continued weakeningre-opening of themost of our Australian and all of our New Zealand dollar compared to the U.S. dollar.cinemas (other than our cinema at Courtenay Central) in June of 2020.
For the ninesix months ended SeptemberJune 30, 2019,2020, net income attributable to RDI common stockholders decreased by 87%, or $8.2$28.8 million, to $1.2a loss of $28.6 million, compared to the same period prior year. Basic EPS for the ninesix months ended SeptemberJune 30, 2019,2020 decreased by $0.36,$1.32, to $0.05a loss of $1.31 compared to the ninesix months ended SeptemberJune 30, 2018, mainly attributable2019. These results are due to decreasesthe COVID-19 pandemic which led to the temporary closures of all of our global cinemas in revenueMarch of 2020. Prior to the cinema closures, however, seat occupancy was already being reduced in bothorder to implement social distancing measures and limit the Cinemaspread of the virus for the health and safety of moviegoers, as well as our employees. In regard to our Real Estate Segment, many of the tenants at our centers were affected by governmental trading restrictions in Australia and New Zealand, however, all of our Australian retail centers remained open for business segments partially offsetthrough the COVID-19 crisis. While the COVID-19 pandemic impacted the operations of certain tenants at our Australian centers, occupancy across our Australian centers for our third-party tenants was over 85% as of June 30, 2020. Tenants in our New Zealand properties were also impacted by governmental enforced closures on the entire country for a 15% decrease in non-segment general and administrative expenses.four-week period. However, due to the proactive decision of the New Zealand government, most tenants are now trading well, with no further restrictions.
With respect to both the three monthquarter and the nine monthsix-month period, net income attributable to RDI common stockholders was adversely impacted by the declining value of the AustraliaAustralian and New Zealand dollar compared toversus the U.S. dollar compared to the same periods for the prior year. See Note 3 to the Consolidated Financial Statements. Since December 31, 2018, the Australian dollar has declined by 4.3% and the New Zealand dollar has declined by 6.7% compared to the U.S. dollar. See discussion of Australian and New Zealand results, below.
Revenue for the quarter ended SeptemberJune 30, 20192020 decreased by 5%95%, or $3.8$72.6 million, to $70.5$3.4 million compared to the same period prior year.
Revenue for the six months ended June 30, 2020 decreased by 62%, or $84.9 million, to $52.7 million compared to the same period prior year. Revenue decreased in both the Cinema and Real Estate operating segments.
Revenue for the nine months ended September 30, 2019 decreased by 11%, or $26.3 million, to $208.1 million compared to the same period prior year. The revenue decreases were due to a (i) decrease in revenue from our cinema business primarilysegment across all three countries due to the soft film slate,temporary closure of our cinemas in the United States, Australia, and (ii)New Zealand as a decrease in revenue fromresult of COVID-19 partially mitigated by the Real Estate business segment primarily due to the closurere-opening of most of our Australian and all of our New Zealand cinemas (other than our cinema at Courtenay Central) in June of 2020. In our Real Estate segment, revenue decreased as a result of the net rentable areaongoing temporary closure of Courtenay Central dueour Live Theatres, rent abatements provided to third-party tenants in our abundance of caution relative to potential seismic issues. Overseas revenues were also adversely impacted byAustralian ETCs, the continued weakening foreign exchange rate of the Australian and New Zealand dollar compared todollars, as well as the U.S. dollar. While expenses are down overall, due totrading restrictions enforced by the fact thatlocal governments on our occupancy costs with respect to our cinemareal estate operations are mostly fixed, the decrease in revenues disproportionally impacts the earnings from these operations, even though our film rent, cinema level laborAustralia and costs of goods sold are largely variable. In the case of New Zealand, the situation was exacerbated by the temporary closurebeginning in late March of our cinema at Courtenay Central. In order to partially compensate for the loss of our Courtenay Central cinema, during June 2019, we opened a three-screen, 440 seat pop-up theater, in Lower Hutt, a suburb of Wellington, New Zealand.2020.
Non-Segment General & Administrative Expenses
Non-segment general and administrative expense for the quarter ended SeptemberJune 30, 20192020 decreased by 7%16%, or $0.3$0.8 million, to $4.5$3.9 million compared to the same period in the prior year, related to lower legal expenses, consulting fees, and various compensation costs.year.
For the ninesix months ended SeptemberJune 30, 2019, the decrease was2020, non-segment general and administrative expense decreased by 15%, or $2.5$1.4 million, to $14.2$8.3 million compared to the ninesix months ended June 30, 2019 due to a decrease in legal fees. Further, in Australia and New Zealand, we have enjoyed the benefits of wage subsidies provided by their respective governments, which have covered, and continue to cover, a high proportion of the costs of our cinema level personnel in Australia and virtually all of the costs of our cinema level personnel in New Zealand. The wage subsidy programs in Australia and New Zealand are currently scheduled to continue through September 30, 2018, primarily related25, 2020 and August 11, 2020, respectively. The wage subsidy program in Australia is to lower legal expenses.be extended but has yet to be codified.
Income Tax ExpenseBenefit
Income tax expensebenefit for the quarter and ninesix months ended SeptemberJune 30, 2019, decreased2020 increased by $0.9$3.2 million and $3.5$5.2 million, respectively, compared to the equivalent prior-yearprior year period. The change between 20192020 and 20182019 is primarily related to lower pretax income fortax benefits from the quartercarryback of the Company’s 2019 net operating loss, as the result of the CARES Act, to 2015 and first nine months of 2019. 2016 tax years where the federal tax rate was 35%, offset by increase in valuation allowance in 2020.
Business Segment Results
At SeptemberAs of June 30, 2019,2020, we leased or owned and operated 5860 cinemas with 480498 screens, which includes our interests in certain unconsolidated joint ventures that own 3 (three)total three cinemas with 29 screens. InAs of June 30, 2020, we also:
expanded into Tasmania acquiring a four-screen cinema in Devonport in the first quarter of 2019 we acquiredand a proven four-screenten-screen cinema (the State Cinema) in Devonport, Tasmania, Australia. During June 2019, we Hobart in the fourth quarter of 2019;
opened a three-screen cinema trading as “The Hutt Pop Up by Reading Cinemas”pop-up in Lower Hutt a suburblocated in the greater region of Wellington, New Zealand. InZealand at the secondend of June 2019;
ended our management agreement related to the 86th Street Cinema in New York City due to the expiration of the underlying lease and third quarter, we closed three cinemasour profitable Paris and Beekman theatres in New York City due to lease expirations. We also (i) expirations;
launched our six-screen Reading Cinemas in Burwood, a suburb of Melbourne, Australia, in December 2019;
owned and operated 5 (five)five ETCs located in Newmarket Village (a suburb of Brisbane), Belmont (a suburb of Perth), Auburn Redyard (a suburb of Sydney), and in TownsvilleCannon Park (in Townsville) in Australia, and WellingtonCourtenay Central (in Wellington) in New Zealand, (ii) Zealand;
owned and operated our headquartersheadquarters’ office buildingsbuilding in Culver City (an emerging high-tech and communications hub in Los Angeles County) and, during the second quarter 2020, entered a multi-year lease with a corporate tenant for the entire second floor;
owned and operated our headquarters’ office building in Melbourne, Australia, (iii) Australia;
owned and operated the fee interests in three developed commercial properties in Manhattan and Chicago improved with live theatres comprising 6 (six)six stages and ancillary retail and commercial space (our fourth live theatre was closed at the end of 2015 as part of the redevelopment of 44 Union Square in New York City), (iv) space;
owned a 75% managing member interest in a limited liability company which in turn owns the fee interest in Cinemas 1,2,3, (v) 1,2,3;
owned our Union Square development property with approximately 73,113 square feet of net leasable area comprised of retail and office space, currently in the leasing phase;
held for development approximately 70.4 acres70.4-acres of developable industrial land located next to the Auckland Airport in New Zealand, (vi) Zealand;
owned a 50% managing member interest in a limited liability company, which in turn owns a 202-acre property in Coachella, California that is zoned approximately 150 acres150-acres for single-family residential use (maximum 550 homes) and approximately 50 acres50-acres for high density mixed use in the U.S., that is held for development, and, (vii) and;
owned 197 acres197-acres principally in Pennsylvania from our legacy railroad business, including the Reading Viaduct in downtown Philadelphia. In addition, at the present time, we have agreements in place for the leasing of an additional five cinemas with 31 screens currently under development.
TheOur Company transacts business in Australia and New Zealand and is subject to risks associated with changingfluctuations in foreign currency exchange rates. TheDuring the second quarter of 2020, compared to the same period prior year, the Australian dollar and New Zealand dollars based on the spot ratedollar weakened versus prior quarter against the U.S. dollar slightly negatively impacting the value of our assetsby 6.1% and liabilities. The average rate for the nine months ended September 30, 2019 and 2018 has also weakened by 7.7% and 5.1%6.7%, respectively. This has decreased the value of our Australian and New Zealand revenues and expenses. Refer to Note 3 – Operations in Foreign Currency for further information.
Cinema Exhibition
The following table details our cinema exhibition segment operating results for the quarter and ninesix months ended SeptemberJune 30, 2020 and June 30, 2019, and September 30, 2018, respectively:
| | | | | | | | | | | | | | | | | | | | |
|
|
|
|
|
|
|
|
|
|
|
|
|
|
|
|
|
|
|
|
| | | | | | | | | | | | | | | | | % Change |
|
|
|
|
|
|
|
|
|
|
|
|
|
|
|
| % Change |
| | | Quarter Ended | | Nine Months Ended | | Fav/(Unfav) |
|
| Quarter Ended |
| Six Months Ended |
| Fav/(Unfav) |
(Dollars in thousands) | (Dollars in thousands) | September 30,
2019 | % of Revenue | September 30,
2018 | % of Revenue | | September 30,
2019 | % of Revenue | September 30,
2018 | % of Revenue | | Quarter
Ended | Nine Months Ended | (Dollars in thousands) | June 30,
2020 | % of Revenue | June 30,
2019 | % of Revenue |
| June 30,
2020 | % of Revenue | June 30,
2019 | % of Revenue |
| Quarter
Ended | Six Months Ended |
REVENUE | REVENUE | | | | | | | | | | | | | | | | | | | REVENUE |
|
|
|
|
|
|
|
|
|
|
|
|
|
|
|
|
|
|
| United States | Admissions revenue | $ | 22,540 | 34% | $ | 25,664 | 36% | | $ | 67,173 | 34% | $ | 78,506 | 35% | | (12) | % | (14) | % | United States | Admissions revenue | $ | 1 | 0% | $ | 24,635 | 34% |
| $ | 13,915 | 29% | $ | 44,488 | 34% |
| (100) | % | (69) | % |
| | Food & beverage revenue | | 11,606 | 17% | | 11,659 | 16% | | | 34,304 | 18% | | 36,029 | 16% | | - | % | (5) | % |
| Food & beverage revenue |
| 94 | 8% |
| 13,123 | 18% |
|
| 7,058 | 15% |
| 22,699 | 18% |
| (99) | % | (69) | % |
| | Advertising and other revenue | | 2,604 | 4% | | 2,715 | 4% | | | 8,266 | 4% | | 7,902 | 4% | | (4) | % | 5 | % |
| Advertising and other revenue |
| 374 | 31% |
| 3,116 | 5% |
|
| 2,802 | 7% |
| 5,661 | 4% |
| (88) | % | (51) | % |
| | | $ | 36,750 | 55% | $ | 40,038 | 57% | | $ | 109,743 | 56% | $ | 122,437 | 55% | | (8) | % | (10) | % |
|
| $ | 469 | 39% | $ | 40,874 | 57% |
| $ | 23,775 | 50% | $ | 72,848 | 56% |
| (99) | % | (67) | % |
| Australia | Admissions revenue | $ | 15,603 | 23% | $ | 15,428 | 22% | | $ | 46,219 | 23% | $ | 49,658 | 22% | | 1 | % | (7) | % | Australia | Admissions revenue | $ | 238 | 20% | $ | 16,579 | 23% |
| $ | 12,748 | 27% | $ | 30,615 | 24% |
| (99) | % | (58) | % |
| | Food & beverage revenue | | 7,014 | 11% | | 6,861 | 10% | | | 20,482 | 10% | | 22,869 | 10% | | 2 | % | (10) | % |
| Food & beverage revenue |
| 144 | 11% |
| 7,407 | 10% |
|
| 5,755 | 12% |
| 13,468 | 10% |
| (98) | % | (57) | % |
| | Advertising and other revenue | | 1,662 | 2% | | 1,370 | 2% | | | 4,617 | 3% | | 4,986 | 2% | | 21 | % | (7) | % |
| Advertising and other revenue |
| 118 | 10% |
| 1,613 | 2% |
|
| 1,584 | 3% |
| 2,956 | 2% |
| (93) | % | (46) | % |
| | | $ | 24,279 | 36% | $ | 23,659 | 33% | | $ | 71,318 | 36% | $ | 77,513 | 35% | | 3 | % | (8) | % |
|
| $ | 500 | 41% | $ | 25,599 | 35% |
| $ | 20,087 | 41% | $ | 47,039 | 36% |
| (98) | % | (57) | % |
| New Zealand | Admissions revenue | $ | 3,862 | 6% | $ | 4,601 | 7% | | $ | 10,734 | 5% | $ | 15,109 | 7% | | (16) | % | (29) | % | New Zealand | Admissions revenue | $ | 138 | 11% | $ | 3,881 | 5% |
| $ | 2,403 | 5% | $ | 6,873 | 5% |
| (96) | % | (65) | % |
| | Food & beverage revenue | | 1,618 | 3% | | 1,992 | 3% | | | 4,549 | 3% | | 6,792 | 3% | | (19) | % | (33) | % |
| Food & beverage revenue |
| 67 | 6% |
| 1,621 | 2% |
|
| 1,051 | 2% |
| 2,930 | 2% |
| (96) | % | (64) | % |
| | Advertising and other revenue | | 224 | 0% | | 381 | 1% | | | 757 | 0% | | 1,258 | 1% | | (41) | % | (40) | % |
| Advertising and other revenue |
| 43 | 3% |
| 321 | 1% |
|
| 211 | 1% |
| 533 | 1% |
| (87) | % | (60) | % |
| | | $ | 5,704 | 9% | $ | 6,974 | 10% | | $ | 16,040 | 8% | $ | 23,159 | 10% | | (18) | % | (31) | % |
|
| $ | 248 | 20% | $ | 5,823 | 8% |
| $ | 3,665 | 8% | $ | 10,336 | 8% |
| (96) | % | (65) | % |
| | | | | | | | | | | | | | | | | | | | |
|
|
|
|
|
|
|
|
|
|
|
|
|
|
|
|
|
|
|
|
| Total revenue | $ | 66,733 | 100% | $ | 70,671 | 100% | | $ | 197,101 | 100% | $ | 223,109 | 100% | | (6) | % | (12) | % | Total revenue | $ | 1,217 | 100% | $ | 72,296 | 100% |
| $ | 47,527 | 100% | $ | 130,223 | 100% |
| (98) | % | (64) | % |
OPERATING EXPENSE | OPERATING EXPENSE | | | | | | | | | | | | | | | | | | | OPERATING EXPENSE |
|
|
|
|
|
|
|
|
|
|
|
|
|
|
|
|
|
|
| United States | Film rent and advertising cost | $ | (12,215) | 19% | $ | (13,525) | 19% | | $ | (35,989) | 19% | $ | (41,958) | 19% | | 10 | % | 14 | % | United States | Film rent and advertising cost | $ | (11) | 1% | $ | (13,650) | 19% |
| $ | (7,268) | 16% | $ | (23,773) | 18% |
| 100 | % | 69 | % |
| | Food & beverage cost | | (2,642) | 4% | | (2,595) | 4% | | | (7,952) | 4% | | (7,817) | 4% | | (2) | % | (2) | % |
| Food & beverage cost |
| (188) | 15% |
| (2,988) | 4% |
|
| (2,008) | 4% |
| (5,310) | 4% |
| 94 | % | 62 | % |
| | Occupancy expense | | (6,655) | 10% | | (7,193) | 10% | | | (20,487) | 10% | | (21,777) | 10% | | 7 | % | 6 | % |
| Occupancy expense |
| (6,791) | 558% |
| (6,886) | 10% |
|
| (13,377) | 27% |
| (13,831) | 11% |
| 1 | % | 3 | % |
| | Other operating expense | | (11,674) | 17% | | (11,021) | 16% | | | (33,237) | 17% | | (31,639) | 14% | | (6) | % | (5) | % |
| Other operating expense |
| (2,888) | 237% |
| (11,389) | 15% |
|
| (12,129) | 26% |
| (21,563) | 17% |
| 75 | % | 44 | % |
| | | $ | (33,186) | 50% | $ | (34,334) | 49% | | $ | (97,665) | 50% | $ | (103,191) | 46% | | 3 | % | 5 | % |
|
| $ | (9,878) | 811% | $ | (34,913) | 48% |
| $ | (34,782) | 72% | $ | (64,477) | 50% |
| 72 | % | 46 | % |
| Australia | Film rent and advertising cost | $ | (7,456) | 11% | $ | (6,945) | 10% | | $ | (21,764) | 11% | $ | (22,935) | 10% | | (7) | % | 5 | % | Australia | Film rent and advertising cost | $ | (142) | 12% | $ | (8,029) | 11% |
| $ | (5,607) | 12% | $ | (14,307) | 11% |
| 98 | % | 61 | % |
| | Food & beverage cost | | (1,326) | 2% | | (1,365) | 2% | | | (3,847) | 2% | | (4,563) | 2% | | 3 | % | 16 | % |
| Food & beverage cost |
| (107) | 9% |
| (1,406) | 2% |
|
| (1,262) | 2% |
| (2,521) | 2% |
| 92 | % | 50 | % |
| | Occupancy expense | | (3,948) | 6% | | (3,834) | 5% | | | (11,882) | 6% | | (12,216) | 5% | | (3) | % | 3 | % |
| Occupancy expense |
| (1,799) | 148% |
| (3,971) | 5% |
|
| (5,687) | 12% |
| (7,934) | 6% |
| 55 | % | 28 | % |
| | Other operating expense | | (5,267) | 8% | | (5,265) | 7% | | | (16,048) | 8% | | (16,611) | 7% | | - | % | 3 | % |
| Other operating expense |
| (1,139) | 95% |
| (5,366) | 8% |
|
| (6,526) | 14% |
| (10,781) | 8% |
| 79 | % | 39 | % |
| | | $ | (17,997) | 27% | $ | (17,409) | 25% | | $ | (53,541) | 27% | $ | (56,325) | 25% | | (3) | % | 5 | % |
|
| $ | (3,187) | 262% | $ | (18,772) | 26% |
| $ | (19,082) | 40% | $ | (35,543) | 27% |
| 83 | % | 46 | % |
| New Zealand | Film rent and advertising cost | $ | (1,835) | 3% | $ | (2,164) | 3% | | $ | (5,065) | 3% | $ | (7,102) | 3% | | 15 | % | 29 | % | New Zealand | Film rent and advertising cost | $ | (45) | 4% | $ | (1,894) | 3% |
| $ | (1,101) | 2% | $ | (3,231) | 2% |
| 98 | % | 66 | % |
| | Food & beverage cost | | (328) | 0% | | (448) | 1% | | | (945) | 0% | | (1,513) | 1% | | 27 | % | 38 | % |
| Food & beverage cost |
| (25) | 1% |
| (326) | 0% |
|
| (220) | 1% |
| (618) | 1% |
| 92 | % | 64 | % |
| | Occupancy expense | | (891) | 1% | | (1,221) | 2% | | | (2,602) | 1% | | (3,923) | 2% | | 27 | % | 34 | % |
| Occupancy expense |
| (255) | 21% |
| (907) | 1% |
|
| (1,074) | 2% |
| (1,711) | 1% |
| 72 | % | 37 | % |
| | Other operating expense | | (1,280) | 2% | | (1,535) | 2% | | | (3,979) | 2% | | (5,047) | 2% | | 17 | % | 21 | % |
| Other operating expense |
| (368) | 30% |
| (1,274) | 2% |
|
| (1,475) | 3% |
| (2,699) | 2% |
| 71 | % | 45 | % |
| | | $ | (4,334) | 6% | $ | (5,368) | 8% | | $ | (12,591) | 6% | $ | (17,585) | 8% | | 19 | % | 28 | % |
|
| $ | (693) | 57% | $ | (4,401) | 6% |
| $ | (3,870) | 8% | $ | (8,259) | 6% |
| 84 | % | 53 | % |
| | | | | | | | | | | | | | | | | | | | |
|
|
|
|
|
|
|
|
|
|
|
|
|
|
|
|
|
|
|
|
| Total operating expense | $ | (55,517) | 83% | $ | (57,111) | 81% | | $ | (163,797) | 83% | $ | (177,101) | 79% | | 3 | % | 8 | % | Total operating expense | $ | (13,758) | 1130% | $ | (58,086) | 80% |
| $ | (57,734) | 120% | $ | (108,279) | 83% |
| 76 | % | 47 | % |
DEPRECIATION, AMORTIZATION, GENERAL AND ADMINISTRATIVE EXPENSE | DEPRECIATION, AMORTIZATION, GENERAL AND ADMINISTRATIVE EXPENSE | | | | | | | | | | | | | | | | | | | DEPRECIATION, AMORTIZATION, GENERAL AND ADMINISTRATIVE EXPENSE |
|
|
|
|
|
|
|
|
|
|
|
|
|
|
|
|
|
|
| United States | Depreciation and amortization | $ | (2,647) | 4% | $ | (2,787) | 4% | | $ | (7,790) | 4% | $ | (7,388) | 3% | | 5 | % | (5) | % | United States | Depreciation and amortization | $ | (1,988) | 163% | $ | (2,516) | 3% |
| $ | (4,008) | 9% | $ | (5,141) | 4% |
| 21 | % | 22 | % |
| | General and administrative expense | | (480) | 1% | | (607) | 1% | | | (1,516) | 1% | | (1,850) | 1% | | 21 | % | 18 | % |
| General and administrative expense |
| (700) | 58% |
| (432) | 1% |
|
| (1,567) | 3% |
| (1,036) | 1% |
| (62) | % | (51) | % |
| | | $ | (3,127) | 5% | $ | (3,394) | 5% | | $ | (9,306) | 5% | $ | (9,238) | 4% | | 8 | % | (1) | % |
|
| $ | (2,688) | 221% | $ | (2,948) | 4% |
| $ | (5,575) | 12% | $ | (6,177) | 5% |
| 9 | % | 10 | % |
| Australia | Depreciation and amortization | $ | (1,227) | 2% | $ | (1,187) | 2% | | $ | (3,630) | 2% | $ | (3,572) | 2% | | (3) | % | (2) | % | Australia | Depreciation and amortization | $ | (1,421) | 117% | $ | (1,222) | 1% |
| $ | (2,814) | 6% | $ | (2,403) | 1% |
| (16) | % | (17) | % |
| | General and administrative expense | | (384) | 1% | | (385) | 1% | | | (1,238) | 1% | | (974) | 0% | | - | % | (27) | % |
| General and administrative expense |
| (229) | 19% |
| (467) | 1% |
|
| (600) | 1% |
| (854) | 1% |
| 51 | % | 30 | % |
| | | $ | (1,611) | 3% | $ | (1,572) | 2% | | $ | (4,868) | 3% | $ | (4,546) | 2% | | (2) | % | (7) | % |
|
| $ | (1,650) | 136% | $ | (1,689) | 2% |
| $ | (3,414) | 7% | $ | (3,257) | 2% |
| 2 | % | (5) | % |
| New Zealand | Depreciation and amortization | $ | (396) | 1% | $ | (378) | 1% | | $ | (1,099) | 1% | $ | (1,239) | 1% | | (5) | % | 11 | % | New Zealand | Depreciation and amortization | $ | (355) | 29% | $ | (352) | 1% |
| $ | (721) | 2% | $ | (703) | 1% |
| (1) | % | (3) | % |
| | General and administrative expense | | (61) | 0% | | (14) | 0% | | | (100) | 0% | | (2) | 0% | | (>100) | % | (>100) | % |
| General and administrative expense |
| (20) | 2% |
| (39) | 0% |
|
| 9 | (0)% |
| (39) | 0% |
| 49 | % | >100 | % |
| | | $ | (457) | 1% | $ | (392) | 1% | | $ | (1,199) | 1% | $ | (1,241) | 1% | | (17) | % | 3 | % |
|
| $ | (375) | 31% | $ | (391) | 1% |
| $ | (712) | 1% | $ | (742) | 1% |
| 4 | % | 4 | % |
| | | | | | | | | | | | | | | | | | | | |
|
|
|
|
|
|
|
|
|
|
|
|
|
|
|
|
|
|
|
|
| Total depreciation, amortization, general and administrative expense | $ | (5,195) | 9% | $ | (5,358) | 8% | | $ | (15,373) | 9% | $ | (15,025) | 7% | | 3 | % | (2) | % | Total depreciation, amortization, general and administrative expense | $ | (4,713) | 387% | $ | (5,028) | 7% |
| $ | (9,701) | 21% | $ | (10,176) | 8% |
| 6 | % | 5 | % |
OPERATING INCOME – CINEMA | | | | | | | | | | | | | | | | | | | |
OPERATING INCOME (LOSS) – CINEMA | | OPERATING INCOME (LOSS) – CINEMA |
|
|
|
|
|
|
|
|
|
|
|
|
|
|
|
|
|
|
| United States | $ | 437 | 1% | $ | 2,310 | 3% | | $ | 2,772 | 1% | $ | 10,008 | 4% | | (81) | % | (72) | % | United States | $ | (12,097) | (994)% | $ | 3,013 | 4% |
| $ | (16,582) | (35)% | $ | 2,193 | 2% |
| (>100) | % | (>100) | % |
| Australia | | 4,671 | 7% | | 4,678 | 7% | | | 12,909 | 7% | | 16,642 | 7% | | - | % | (22) | % | Australia |
| (4,337) | (356)% |
| 5,138 | 7% |
|
| (2,409) | (5)% |
| 8,239 | 6% |
| (>100) | % | (>100) | % |
| New Zealand | | 913 | 1% | | 1,214 | 2% | | | 2,250 | 1% | | 4,333 | 2% | | (25) | % | (48) | % | New Zealand |
| (820) | (66)% |
| 1,031 | 2% |
|
| (917) | (2)% |
| 1,335 | 1% |
| (>100) | % | (>100) | % |
| Total Cinema operating income | $ | 6,021 | 9% | $ | 8,202 | 12% | | $ | 17,931 | 9% | $ | 30,983 | 14% | | (27) | % | (42) | % | Total Cinema operating income (loss) | $ | (17,254) | (1418)% | $ | 9,182 | 13% |
| $ | (19,908) | (42)% | $ | 11,767 | 9% |
| (>100) | % | (>100) | % |
3rdSecond Quarter Results
Cinema Segment operating income
Cinema segment operating income for the second quarter 2020 decreased by 27%, or $2.2$26.4 million, to $6.0a loss of $17.3 million for the quarter ended September 30, 2019when compared to September 30, 2018, which wasthe same period in 2019. This significant decrease is due to a decrease in attendance in all three circuits, the continued temporary closure of our Courtenay Central Cinema in Wellington,cinemas due to the COVID-19 pandemic, and partially mitigated by (i) the re-opening of most of our Australia and all of our New Zealand theaters (other than our cinema at Courtenay Central) in June of 2020, (ii) the absence of internal rent revenue from our fee-interest cinemas due to the COVID-19 shutdowns, and (iii) the rent abatements from a weakening foreign currency exchange rate, offset by fluctuations in average ticket price (“ATP”), and spend per patron (“SPP”) as outlined below. number of our landlords.
Revenue
Revenue
Cinema revenue decreased by 6%98%, or $3.9$71.1 million, to $66.7$1.2 million for the second quarter ended September 30, 20192020, compared to September 30, 2018, primarily attributable to a weaker slate of film from arthouse/specialty distributors in the U.S., a weakening foreign currency exchange rate, and a decrease in attendance in all three circuits, offset by the full quarter operations of Mililani during 2019 as it was closed for renovations during the same period prior year.in 2019.
Below are the changes in our cinema revenue by market:
| ·
| | U.S. cinema revenue decreased by 8%, or $3.3 million, to $36.8 million for the third quarter due to a 14% decrease in attendance; offset by a 13% increase in SPP and a 2% increase in ATP.
|
| ·
| | Australia cinema revenue increased by 3%, or $0.6 million, to $24.3 million for the third quarter, primarily due to a 4% increase in SPP and 3% increase in ATP, offset by a 2% decrease in attendance.
|
| ·
| | New Zealand cinema revenue decreased by 18%, or $1.3 million, to $5.7 million for the third quarter due to a decrease of 24% in attendance (significantly due to the temporary closure of our Courtenay Central Cinema), offset by a 13% increase in SPP and a 10% increase in ATP, and the opening of The Hutt cinema during the second quarter of 2019.
|
U.S. cinema revenue decreased by 99%, or $40.4 million, to $0.5 million for the second quarter 2020, due to a 100% decrease in attendance. These decreases were due to the ongoing temporary closures of our U.S. Cinemas as a result of the COVID-19 pandemic, and the temporary closure of our Consolidated Theatre at the Kahala Mall in Honolulu since December of 2019 for renovations.
Australia cinema revenue decreased by 98%, or $25.1 million, to $0.5 million for the second quarter 2020, due to a 99% decrease in attendance. These decreases were due to the ongoing temporary closures of our cinemas in Australia as a result of the COVID-19 pandemic partially mitigated by the re-opening of most of our cinemas in Australia in June of 2020. These results were further impacted by the decline in value of the Australian dollar and a lack of new major studio tentpole releases upon re-opening.
New Zealand cinema revenue decreased by 96%, or $5.6 million, to $0.2 million for the second quarter 2020, due to a 96% decrease in attendance. These decreases were due to the ongoing temporary closures of our cinemas in New Zealand as a result of the COVID-19 pandemic partially mitigated by the re-opening of our cinemas in New Zealand in June of 2020, excluding Courtenay Central. These results were further impacted by the decline in value of the New Zealand dollar and a lack of new major studio releases upon re-opening.
Operating expense
Operating expense for the thirdsecond quarter ended September 30, 20192020, decreased by 3%76%, or $1.6$44.3 million, to $55.5$13.8 million, compared to the same quarter in 2018 primarily attributable to (i) lower film rent expense driven by lower admissions revenue, (ii) lower occupancy expenses and (iii) to a lesser extent lower F&B costs due to lower F&B revenue primarily in New Zealand (significantlyprincipally due to the ongoing temporary closureclosures of our cinemas as a result of the Courtenay Central Cinema).COVID-19 pandemic. In Australia and New Zealand, we have enjoyed the benefits of wage subsidies provided by their respective governments, which have covered, and continue to cover, a high proportion of the costs of our cinema level personnel in Australia and virtually all of the costs of our cinema level personnel in New Zealand. The wage subsidy programs in Australia and New Zealand are currently scheduled to continue through September 25, 2020 and August 11, 2020, respectively. The wage subsidy program in Australia is to be extended but has yet to be codified. This decline was also due to savings in internal and external rent abatements received in the second quarter of 2020 as a result of the COVID-19 pandemic.
Operating expense as a percentage of gross revenue has increased to 83%over 100 percentage points for the thirdsecond quarter of 2019,2020, compared to 81% for80% in the same period in 2018,2019, due to the significantly lower than anticipated revenue in our box office and the fact that certain of our occupancy costs are generally fixed and cannot be adjusted to reflect such lower admission levels.
Depreciation, amortization, general and administrative expense
Depreciation, amortization, general and administrative expense for the second quarter ended September 30, 2019,2020, decreased slightly at $5.2by 6%, or $0.3 million, to $4.7 million, compared to $5.4 million for the third quarter 2018. The 3%same period in 2019. This decrease of $0.2 million is attributable to a reduction in depreciation expense for our U.S. cinemas digital projector lease, which has been substantially depreciated by the end of 2019, offset by an increase in legal fees. Total depreciation, amortization, general and amortizationadministrative expense were partially reduced by the foreign exchange movements in the U.S. cinema segment.Australia and New Zealand.
Nine Month
Six Months Results
Cinema Segment operating income
Cinema segment operating income for the six months ended June 30, 2020 decreased by 42%, or $13.1$31.7 million, to $17.9a loss of $19.9 million for the nine months ended September 30, 2019when compared to the nine months ended September 30, 2018, primarilysame period in 2019. This decrease is due to (i) reduced seating occupancy as a weak film slate worldwide resulting in decreases inresult of social distancing measures, and (ii) the ongoing temporary closure of our cinemas, which both led to a significant attendance worldwide. Additionally, Courtenay Central Cinema in Wellington,drop since March 2020, partially mitigated by the re-opening of most of our Australia and New Zealand was temporarily closedtheaters in January 2019 due to seismic concerns and has not reopened.June of 2020.
Revenue
Cinema revenue decreased by 12%64%, or $26.0$82.7 million, to $197.1$47.5 million for the ninesix months ended SeptemberJune 30, 20192020 compared to Septemberthe same period in 2019.
Below are the changes in our cinema revenue by market:
U.S. cinema revenue decreased by 67%, or $49.1 million, to $23.8 million for the six months ended June 30, 2018, primarily driven2020, due to a 70% decrease in attendance. These decreases were significantly due to the social distancing measures put in place and the ongoing temporary closures since late March 2020 of our U.S. Cinemas as a result of the COVID-19 pandemic, the temporary closure of our Consolidated Theatre at the Kahala Mall in Honolulu since December of 2019 for renovations, and the closures of our 86th Street, Paris, and Beekman cinemas since mid-2019.
Australia cinema revenue decreased by 57%, or $27.0 million, to $20.1 million for the six months ended June 30, 2020, due to a 59% decrease in attendance. These decreases were significantly due to the ongoing temporary closures of our cinemas in Australia as a result of the COVID-19 pandemic partially mitigated by the re-opening of most of our cinemas in Australia in June of 2020. These results were further impacted by the decline in value of the Australian dollar.
New Zealand cinema revenue decreased attendance worldwide, and offset by fluctuations65%, or $6.7 million, to $3.7 million for the six months ended June 30, 2020, due to a 65% decrease in average ticket price (“ATP”), and spend per patron (“SPP”)attendance. These decreases were significantly due to the temporary closures of our cinemas in New Zealand as outlined below:
| ·
| | U.S. cinema revenue decreased by 10%, or $12.7 million, to $109.7 million, due to a 16% decrease in attendance, offset by a 11% increase in SPP, and a 2% increase in ATP. According to industry sources, the U.S. exhibition industry admissions for the nine months ended September 30, 2019 were down 6%, declining from $7.7 billion to $7.3 billion for the same period in the prior year. Our declines were greater than the industry average due principally to the fact that we feature art and foreign film in a number of our facilities, which was more heavily impacted during the period than conventional film product.
|
| ·
| | Australia cinema revenue decreased by 8%, or $6.2 million, to $71.3 million, primarily due to a 7% decrease in attendance, a 3% decrease in SPP, while ATP remained relatively flat.
|
| ·
| | New Zealand cinema revenue decreased by 31%, or $7.1 million, to $16.0 million, as a result of a 32% decrease in attendance (significantly due to the temporary closure of our Courtenay Central Cinema); offset by a 5% increase in ATP and a 4% increase in SPP.
|
a result of the COVID-19 pandemic partially mitigated by the re-opening of our cinemas in New Zealand in June of 2020, excluding Courtenay Central, which remains closed due to seismic concerns. These results were further impacted by the decline in value of the New Zealand dollar.
Operating expense
Operating expense for the ninesix months ended SeptemberJune 30, 20192020, decreased by 8%47%, or $13.3$50.5 million, to $163.8$57.7 million, primarily attributable to (i) lower film rent due to lower admissions revenue, (ii) lower F&B costs due to lower F&B revenue, and (iii) lower occupancy costs due to the temporary closureclosures of Courtenay Central Cinema offsetour cinemas as a result of the COVID-19 pandemic, which for our U.S. cinemas and a portion of our Australian cinemas continues to be ongoing. The temporary closures of our cinemas ultimately led to employee terminations in late March in the U.S. resulting in a reduction in labor costs. In Australia and New Zealand, we did not need to terminate employees as we have enjoyed the benefits of wage subsidies provided by their respective governments, which have covered, and continue to cover, virtually all of the foreign currency movements. Of course, since we own Courtenay Central,costs of our real estate revenues were adversely impactedcinema level personnel. The wage subsidy programs in an equal amount.Australia and New Zealand are currently scheduled to continue through September 25, 2020 and August 11, 2020, respectively. The wage subsidy program in Australia is to be extended but has yet to be codified. We did not, unfortunately, qualify for the Paycheck Protection Program in the U.S. This decline was also due to savings in internal and external rent abatements received in the second quarter of 2020 as a result of the COVID-19 pandemic.
Operating expense as a percentage of gross revenue has increased by 37 percentage points, to 83%120% for the ninesix months ended SeptemberJune 30, 2019,2020, compared to 79%83% in the same period for 2018,in 2019, due to the significantly lower than anticipated revenue in our box office and the fact that certain of our occupancy costs are generally fixed and cannot be adjusted to reflect such lower admission levels.
Depreciation, amortization, general and administrative expense
Depreciation, amortization, general and administrative expense for the ninesix months ended SeptemberJune 30, 2019 increased2020, decreased by 2%5%, or $0.3$0.5 million, to $15.4$9.7 million, compared to the same period in 2018.2019. This decrease is attributable to a reduction in depreciation expense remained relatively flat as the number offor our U.S. cinemas opened or assets placed into servicedigital projector lease, which has been minimal resultingsubstantially depreciated by the end of 2019 and a decrease in only slightly higherlegal fees. Total depreciation, costsamortization, general and theseadministrative expense were partially offsetreduced by the foreign exchange movements in Australia and New Zealand.
Real Estate
The following table details our real estate segment operating results for the quarter and ninesix months ended SeptemberJune 30, 2020 and June 30, 2019, and 2018, respectively:
| |
|
|
|
|
|
|
|
|
|
|
|
|
|
|
|
|
|
|
|
|
| | | | | | | | | | | | | | | | | | | | |
|
|
|
|
|
|
|
|
|
|
|
|
|
|
|
| % Change |
| | | Quarter Ended | | Nine Months Ended | | Fav/(Unfav) |
|
| Quarter Ended |
| Six Months Ended |
| Fav/(Unfav) |
(Dollars in thousands) | (Dollars in thousands) | September 30,
2019 | % of
Revenue | September 30,
2018 | % of
Revenue | | September 30,
2019 | % of
Revenue | September 30,
2018 | % of
Revenue | | Quarter Ended | Nine Months Ended | (Dollars in thousands) | June 30,
2020 | % of
Revenue | June 30,
2019 | % of
Revenue |
| June 30,
2020 | % of
Revenue | June 30,
2019 | % of
Revenue |
| Quarter Ended | Six Months Ended |
REVENUE | REVENUE | | | | | | | | | | | | | | | | | | | REVENUE |
|
|
|
|
|
|
|
|
|
|
|
|
|
|
|
|
|
|
| United States | Live theater rental and ancillary income | $ | 955 | 17% | $ | 756 | 13% | | $ | 2,721 | 16% | $ | 2,257 | 12% | | 26 | % | 21 | % | United States | Live theatre rental and ancillary income | $ | 206 | 9% | $ | 831 | 15% |
| $ | 780 | 11% | $ | 1,767 | 16% |
| (75) | % | (56) | % |
| | Property rental income | | 51 | 1% | | 49 | 1% | | | 152 | 1% | | 153 | 1% | | 4 | % | (1) | % |
| Property rental income |
| 100 | 4% |
| 49 | 1% |
|
| 152 | 2% |
| 101 | 1% |
| >100 | % | 50 | % |
| | | | 1,006 | 18% | | 805 | 14% | | | 2,873 | 17% | | 2,410 | 13% | | 25 | % | 19 | % |
|
|
| 306 | 13% |
| 880 | 16% |
|
| 932 | 13% |
| 1,868 | 17% |
| (65) | % | (50) | % |
| Australia | Property rental income | | 3,905 | 71% | | 3,847 | 67% | | | 11,873 | 72% | | 12,305 | 68% | | 2 | % | (4) | % | Australia | Property rental income |
| 1,911 | 83% |
| 4,052 | 73% |
|
| 5,489 | 80% |
| 7,967 | 72% |
| (53) | % | (31) | % |
| New Zealand | Property rental income | | 620 | 11% | | 1,119 | 19% | | | 1,779 | 11% | | 3,489 | 19% | | (45) | % | (49) | % | New Zealand | Property rental income |
| 86 | 4% |
| 632 | 11% |
|
| 484 | 7% |
| 1,159 | 11% |
| (86) | % | (58) | % |
| | | | | | | | | | | | | | | | | | | | |
|
|
|
|
|
|
|
|
|
|
|
|
|
|
|
|
|
|
|
|
| Total revenue | | $ | 5,531 | 100% | $ | 5,771 | 100% | | $ | 16,525 | 100% | $ | 18,204 | 100% | | (4) | % | (9) | % | Total revenue |
| $ | 2,303 | 100% | $ | 5,564 | 100% |
| $ | 6,905 | 100% | $ | 10,994 | 100% |
| (59) | % | (37) | % |
OPERATING EXPENSE | OPERATING EXPENSE | | | | | | | | | | | | | | | | | | | OPERATING EXPENSE |
|
|
|
|
|
|
|
|
|
|
|
|
|
|
|
|
|
|
| United States | Live theater cost | $ | (323) | 6% | $ | (325) | 6% | | $ | (920) | 5% | $ | (951) | 5% | | 1 | % | 3 | % | United States | Live theatre cost | $ | (132) | 6% | $ | (297) | 6% |
| $ | (474) | 7% | $ | (596) | 5% |
| 56 | % | 20 | % |
| | Property cost | | (147) | 3% | | (117) | 2% | | | (461) | 3% | | (392) | 2% | | (26) | % | (18) | % |
| Property cost |
| (195) | 8% |
| (156) | 3% |
|
| (817) | 12% |
| (314) | 3% |
| (25) | % | (>100) | % |
| | Occupancy expense | | (74) | 1% | | (167) | 3% | | | (353) | 2% | | (526) | 3% | | 56 | % | 33 | % |
| Occupancy expense |
| (162) | 7% |
| (128) | 2% |
|
| (321) | 4% |
| (278) | 3% |
| (27) | % | (15) | % |
| | | | (544) | 10% | | (609) | 11% | | | (1,734) | 10% | | (1,869) | 10% | | 11 | % | 7 | % |
|
|
| (489) | 21% |
| (581) | 11% |
|
| (1,612) | 23% |
| (1,188) | 11% |
| 16 | % | (36) | % |
| Australia | Property cost | | (619) | 11% | | (796) | 14% | | | (2,107) | 13% | | (2,300) | 13% | | 22 | % | 8 | % | Australia | Property cost |
| (429) | 19% |
| (787) | 14% |
|
| (1,080) | 16% |
| (1,488) | 14% |
| 45 | % | 27 | % |
| | Occupancy expense | | (669) | 12% | | (634) | 11% | | | (2,024) | 12% | | (1,871) | 10% | | (6) | % | (8) | % |
| Occupancy expense |
| (368) | 16% |
| (664) | 12% |
|
| (952) | 14% |
| (1,356) | 12% |
| 45 | % | 30 | % |
| | | | (1,288) | 23% | | (1,430) | 25% | | | (4,131) | 25% | | (4,171) | 23% | | 10 | % | 1 | % |
|
|
| (797) | 35% |
| (1,451) | 26% |
|
| (2,032) | 30% |
| (2,844) | 26% |
| 45 | % | 29 | % |
| New Zealand | Property cost | | (284) | 5% | | (282) | 5% | | | (849) | 6% | | (920) | 5% | | (1) | % | 8 | % | New Zealand | Property cost |
| (200) | 9% |
| (268) | 5% |
|
| (499) | 7% |
| (566) | 5% |
| 25 | % | 12 | % |
| | Occupancy expense | | (109) | 2% | | (153) | 3% | | | (394) | 2% | | (449) | 2% | | 29 | % | 12 | % |
| Occupancy expense |
| (103) | 4% |
| (138) | 2% |
|
| (206) | 3% |
| (285) | 2% |
| 25 | % | 28 | % |
| | | | (393) | 7% | | (435) | 8% | | | (1,243) | 8% | | (1,369) | 8% | | 10 | % | 9 | % |
|
|
| (303) | 13% |
| (406) | 7% |
|
| (705) | 10% |
| (851) | 7% |
| 25 | % | 17 | % |
| | | | | | | | | | | | | | | | | | | | |
|
|
|
|
|
|
|
|
|
|
|
|
|
|
|
|
|
|
|
|
| Total operating expense | | $ | (2,225) | 40% | $ | (2,474) | 43% | | $ | (7,108) | 43% | $ | (7,409) | 41% | | 10 | % | 4 | % | Total operating expense |
| $ | (1,589) | 69% | $ | (2,438) | 44% |
| $ | (4,349) | 63% | $ | (4,883) | 44% |
| 35 | % | 11 | % |
DEPRECIATION, AMORTIZATION, GENERAL AND ADMINISTRATIVE EXPENSE | DEPRECIATION, AMORTIZATION, GENERAL AND ADMINISTRATIVE EXPENSE | | | | | | | | | | | | | | | | | | | DEPRECIATION, AMORTIZATION, GENERAL AND ADMINISTRATIVE EXPENSE |
|
|
|
|
|
|
|
|
|
|
|
|
|
|
|
|
|
|
| United States | Depreciation and amortization | $ | (196) | 4% | $ | (197) | 3% | | $ | (584) | 4% | $ | (582) | 3% | | 1 | % | - | % | United States | Depreciation and amortization | $ | (203) | 9% | $ | (194) | 4% |
| $ | (405) | 6% | $ | (390) | 4% |
| (5) | % | (4) | % |
| | General and administrative expense | | (54) | 1% | | (153) | 3% | | | (392) | 2% | | (473) | 3% | | 65 | % | 17 | % |
| General and administrative expense |
| (199) | 8% |
| (178) | 3% |
|
| (390) | 6% |
| (337) | 3% |
| (12) | % | (16) | % |
| | | | (250) | 5% | | (350) | 6% | | | (976) | 6% | | (1,055) | 6% | | 29 | % | 7 | % |
|
|
| (402) | 17% |
| (372) | 7% |
|
| (795) | 12% |
| (727) | 7% |
| (8) | % | (9) | % |
| Australia | Depreciation and amortization | $ | (892) | 16% | $ | (938) | 16% | | $ | (2,729) | 17% | $ | (2,830) | 16% | | 5 | % | 4 | % | Australia | Depreciation and amortization | $ | (845) | 37% | $ | (911) | 16% |
| $ | (1,708) | 25% | $ | (1,837) | 16% |
| 7 | % | 7 | % |
| | General and administrative expense | | (320) | 6% | | (499) | 9% | | | (860) | 5% | | (1,233) | 7% | | 36 | % | 30 | % |
| General and administrative expense |
| (74) | 3% |
| (248) | 5% |
|
| (242) | 3% |
| (540) | 5% |
| 70 | % | 55 | % |
| | | | (1,212) | 22% | | (1,437) | 25% | | | (3,589) | 22% | | (4,063) | 22% | | 16 | % | 12 | % |
|
|
| (919) | 40% |
| (1,159) | 21% |
|
| (1,950) | 28% |
| (2,377) | 21% |
| 21 | % | 18 | % |
| New Zealand | Depreciation and amortization | | (243) | 4% | | (250) | 4% | | | (748) | 5% | | (781) | 4% | | 3 | % | 4 | % | New Zealand | Depreciation and amortization |
| (227) | 10% |
| (249) | 4% |
|
| (462) | 6% |
| (504) | 5% |
| 9 | % | 8 | % |
| | General and administrative expense | | (116) | 2% | | — | 0% | | | (117) | 1% | | — | 0% | | - | % | - | % |
| General and administrative expense |
| 27 | (1)% |
| (1) | 0% |
|
| 31 | (0)% |
| (1) | 0% |
| >100 | % | >100 | % |
| | | | (359) | 6% | | (250) | 4% | | | (865) | 6% | | (781) | 4% | | (44) | % | (11) | % |
|
|
| (200) | 9% |
| (250) | 4% |
|
| (431) | 6% |
| (505) | 5% |
| 20 | % | 15 | % |
| Total depreciation, amortization, general and administrative expense | $ | (1,821) | 33% | $ | (2,037) | 35% | | $ | (5,430) | 34% | $ | (5,899) | 32% | | 11 | % | 8 | % | Total depreciation, amortization, general and administrative expense | $ | (1,521) | 66% | $ | (1,781) | 32% |
| $ | (3,176) | 46% | $ | (3,609) | 33% |
| 15 | % | 12 | % |
OPERATING INCOME - REAL ESTATE | | | | | | | | | | | | | | | | | | | |
OPERATING INCOME (LOSS) - REAL ESTATE | | OPERATING INCOME (LOSS) - REAL ESTATE |
|
|
|
|
|
|
|
|
|
|
|
|
|
|
|
|
|
|
| United States | $ | 212 | 4% | $ | (154) | (3)% | | $ | 163 | 1% | $ | (514) | (3)% | | >100 | % | >100 | % | United States | $ | (585) | (25)% | $ | (73) | (1)% |
| $ | (1,475) | (21)% | $ | (47) | (0)% |
| (>100) | % | (>100) | % |
| Australia | | 1,405 | 24% | | 980 | 17% | | | 4,153 | 25% | | 4,071 | 22% | | 43 | % | 2 | % | Australia |
| 195 | 8% |
| 1,442 | 26% |
|
| 1,507 | 21% |
| 2,746 | 25% |
| (86) | % | (45) | % |
| New Zealand | | (132) | -2% | | 434 | 8% | | | (329) | (2)% | | 1,339 | 7% | | (>100) | % | (>100) | % | New Zealand |
| (417) | (18)% |
| (24) | (1)% |
|
| (652) | (9)% |
| (197) | (2)% |
| (>100) | % | (>100) | % |
| Total real estate operating income | $ | 1,485 | 27% | $ | 1,260 | 22% | | $ | 3,987 | 24% | $ | 4,896 | 27% | | 18 | % | (19) | % | Total real estate operating income (loss) | $ | (807) | (35)% | $ | 1,345 | 24% |
| $ | (620) | (9)% | $ | 2,502 | 23% |
| (>100) | % | (>100) | % |
3rdSecond Quarter Results
Real Estate Segment incomeIncome
Real estate segment operating income increaseddecreased by 18%, or $0.2$2.2 million, to $1.5a loss of $0.8 million for the quarter ended SeptemberJune 30, 2020 compared to June 30, 2019, compareddue to the third quarter ended September 30, 2018, primarily due toabatements and lower intercompany rent revenue from our fee-interest cinemas along with the government prohibition of live stage presentations in indoor venues in the U.S. This decline was further impacted by the unfavorable foreign currency movements in both Australia and New Zealand, partially offset bypayments from portions of license fees of our Live Theatre agreements and by a decrease in operating expenses in all three circuits; offset by a decrease in revenue in the New Zealand operations, specifically the ongoing closure of most of the net rentable area of Courtenay Central, offset by increased revenue from our live theatres.expense.
Revenue
Real estate revenue for the thirdsecond quarter 2019of 2020 decreased by 4%59%, or $0.2$3.3 million, to $5.5$2.3 million compared to the thirdsecond quarter of 2018 primarily2019, due to a decreasethe ongoing pandemic which resulted in revenues from our New Zealand segment related to the closure of portionsour U.S. Live Theatres. Further, referring to our Australian real estate revenue, a federal government Code of Courtenay Central. Conduct was prepared as a guiding reference for landlords and tenants to assist rental negotiations in regard to abatements. In addition, state governments have enacted laws to legislate rental relief for eligible tenants, and while the Code of Conduct is often reflected, in part, in this legislation, the states have also decided to draft the legislation at their discretion. Consistent in the various legislation is a rent relief element with reference to tenancy sales volumes, especially in situations of enforced closure. In addition to that, a weakening foreign currency exchange rate in the Australian and New Zealand dollars also contributed to the decline in revenue.
Operating expense
Operating expense for the quarter ended SeptemberJune 30, 20192020 decreased by 10%35%, or $0.2$0.8 million, to $2.2$1.6 million, compared to the thirdsecond quarter ended June 30, 2019, due to the COVID-19 pandemic. Throughout the second quarter of 2018, primarily driven2020, all capital costs and many operating expenses were significantly reduced and various projects and maintenance works were postponed. Further, in Australia, various State Revenue Offices (SRO) implemented support measures for commercial landlords whereby land tax relief was provided by way of a reduction in property costs in the Australia segment.percentage of land tax waiver.
Depreciation, amortization, generalAmortization, General and administrative expenseAdministrative Expense
Depreciation, amortization, general and administrative expense for the quarter ended SeptemberJune 30, 20192020 decreased 11%15%, or $0.2$0.3 million, to $1.8$1.5 million compared to the previous yearsecond quarter driven mainly byended June 30, 2019, due to a decrease of expensesforeign-owner surcharge forgiveness in Queensland, Australia for the twelve months ended June 2020, that reversed in the Australia segmentsecond quarter of general and administrative expenses.2020 as part of the COVID-19 relief program.
NineSix Month Results
Real Estate Segment incomeIncome
Real estate segment operating income decreased by 19%, or $0.9$3.1 million, to $4.0a loss of $0.6 million for the ninesix months ended SeptemberJune 30, 2019,2020, compared to the same period in 2018, primarily2019. This decrease is attributable to anthe temporary closures of our U.S. Live Theatres because of the COVID-19 pandemic. This decline was partially offset by decreases in operating lossexpenses in the U.S. Live Theatres, Australia, and New Zealand circuit of $0.3 million for 2019, comparedZealand. In addition to an operating gain of $1.3 million for the nine months ended September 30, 2018. Real estate segment income has declined predominantly due to Courtenay Central’s partial closure andthat, a weakening foreign currency exchange rate.rate also contributed to the decline in operating income.
Revenue
Real estate revenue for the ninesix months ended SeptemberJune 30, 20192020 decreased by 9%37%, or $1.7$4.1 million, to $16.5$6.9 million, primarily due to the partialongoing temporary closure of the Courtenay Central ETC in 2019, which was open for the entire year in 2018, andour Live Theatres, further impacted by the unfavorable impact of foreign currency movements in both Australia and New Zealand.
Operating expenseExpense
Operating expense for the ninesix months ended SeptemberJune 30, 20192020 decreased by 4%11%, or $0.3$0.5 million, to $7.1$4.3 million, due to a reduction ofdecrease in occupancy costsexpense in the U.S. segment.our Australia and New Zealand segments.
Depreciation, amortization, generalAmortization, General and administrative expenseAdministrative Expense
Depreciation, amortization, general and administrative expense for the ninesix months ended SeptemberJune 30, 20192020 decreased by 8%12%, or $0.5$0.4 million, to $5.4$3.2 million, primarily driven by general and administrative expense reductions in the U.S. and Australia, while depreciation remained relatively flat.
LIQUIDITY AND CAPITAL RESOURCES
In response to uncertainties associated with the outbreak of the COVID-19 pandemic and its impact on our Company’s business, management, as of June 30, 2020, had drawn-down the available operating borrowing capacity in the first quarter of 2020. Total outstanding borrowings were $275.9 million at June 30, 2020. Our Company’s use of these funds is in some ways limited due to limitations on the expatriation of funds from Australia and New Zealand to the United States and limitations on our use of proceeds from our $55.0 million Bank of America Credit Facility for purposes unrelated to our U.S. cinema activities.
The coronavirus outbreak has materially adversely affected the economies (and cinema exhibition in particular) of the United States, Australia, and New Zealand. Outbreaks of COVID-19 have caused cinemas and other public assembly venues to close. To comply with the rules, guidelines, and recommendations enacted by local, state, and federal government authorities, we temporarily closed all of our cinemas in March of 2020. While our cinemas in New Zealand are now re-opened without social distancing guidelines, most of our Australian cinemas have re-opened and continue to abide by social distancing guidelines. However, on July 8, 2020, we had to close six of our seven theaters in the state of Victoria, due to a spike in new COVID-19 cases, as the local government has ordered a minimum six-week closure. On August 5, 2020, the seventh cinema also had to be closed as the state went into full lockdown, which is currently proposed to last through mid-September 2020.
Cinema attendance is driven by film. Certain major studios have announced the delayed release of major motion pictures. While we currently anticipate the release of such major motion pictures to resume during the third and fourth quarters of 2020 and beyond, no assurances can be given as this is something over which we have no control. The delayed releases of major motion pictures, assuming the effects of the COVID-19 pandemic are surmounted, will push revenues into later quarters, thereby reducing our full year revenues, and may accelerate our decisions to consider more permanent reductions of operational levels at our cinemas. However, even if such film product is forthcoming, operating revenues may continue to be adversely impacted by ongoing governmental restrictions, social distancing requirements, the adoption and implementation of new sanitization protocols, and potential hesitancy of patrons to return to public indoor venues.
With respect to the re-opening of our venues in Australia and New Zealand, we have implemented an extensive set of new protocols to protect the health and well-being of our employees. Such employee protocols, include, without limitation, (i) creating work spaces that take into account social distancing requirements and recommendations, (ii) the installation of plexiglass shields at concession and ticket stations, (iii) the reduction of areas where cash can be accepted, and (iv) increased cleaning and sanitization standards. Additionally, in Australia and New Zealand, we are complying with all governmentally mandated contact tracing requirements.
In the U.S., we are developing substantially similar protocols for the employees at our cinemas and live theaters, and we will require that employees wear masks during their shifts.
With respect to our home office employees, the Company is similarly developing a new set of protocols for implementation in the office environment. As of the date of filing of this Form 10-Q, our home offices in Culver City, CA, New York City, NY, Wellington, New Zealand and Melbourne, Australia have not been officially re-opened.
The impact of the COVID-19 pandemic on our business has reduced our liquidity and our management, consequently, has postponed, or reprioritized capital expenditures based on assessments of conditions and liquidity requirements.
Our bank loans require that our Company comply with certain covenants. The longer the COVID-19 pandemic and the associated limitations (both legal and practical) on our business exist, the more likely it becomes, in the absence of other actions by our Company, that we will be unable to continue to comply with these covenants. However, in such an event, our Company expects (but no assurances can be given) to be able to obtain an amendment or waiver from its lenders. In the absence of such waivers, it is our current intention to look to our real estate assets to provide needed liquidity. We, for example, have retained Newmark Knight Frank to assist us in the refinancing of the construction loan on our 44 Union Square property. That 73,113 net rentable square foot retail and office property located on Union Square in Manhattan, is substantially completed and in the lease up phase. Total debt against that property aggregates less than $40.0 million. Our 202-acre Coachella property is unencumbered. That property is currently zoned for residential and mixed-use purposes. Our 70+ acre Manukau/Wiri industrial property (next to the Auckland Airport) is likewise unencumbered. Unlike pure cinema exhibition companies, we own the fee interest under all of our live theatres, and in 12 of our cinemas.
Prior to the COVID-19 pandemic, our cinema exhibition business plan ishad been to enhance our current cinemas where it iswas financially reasonable to do so; develop our specialty cinemas in select markets; expand our food and beverageF&B offering, and continue on an opportunistic basis, to identify, develop, and acquire cinema properties at reasonable prices that allow us to leverage our cinema expertise over a larger operating base. This continues to be our plan once we are able to re-open, subject to liquidity constraints.
OurWe continue to advance most of our real estate business plan is to completeinitiatives as these are, generally speaking, still in the planning stage and, as a result, less impacted than projects in their construction phase. We, fortunately, have only two projects in a construction phase – the redevelopment of our 44 Union Square property in New York City; to reassessManhattan and master-plan the Cinemas 1,2,3 property for redevelopment as a stand-alone 96,000 square foot mixed use propertyrefurbishment of our Consolidated Theatre at the Kahala Mall in Honolulu. 44 Union Square is substantially completed and in the interimlease up phase. We anticipate that our Consolidated Theatre at the Kahala Mall will re-open for business within a few weeks after the construction is completed, which should be about a few months of work following re-commencement of construction after relaxation of COVID-19 related government restrictions.
Our pre-COVID-19 business plan with respect to continue to use it as a cinema;the Real Estate segment of our business was to continue the master planning of the expansionbuild-out of our Townsville ETCNewmarket Village and Auburn ETCs in Australia; to master planmaster-plan and consider the redevelopment of our Courtenay Central site in New Zealand into an urban entertainment center with a focus on cinema exhibition, food and beverage, and grocery store uses; and in Manukau,Manukau/Wiri, New Zealand, to continue to develop in concert with other major land owners, of plans for the development and funding oflandowners, the infrastructure needed to support the construction of income-producing light industrial improvements; to reassess and master-plan our Cinemas 1,2,3 property for redevelopment as a stand-alone 96,000 square foot mixed use property and in the interim to continue to use it as a cinema; and to continue to be sensitive to opportunities to convert our entertainment assets to higher and better uses, or, where appropriate, to dispose of such assets. We will alsoCurrently, we have determined to postpone further consideration of any redevelopment of our Cinemas 1,2,3 property until we better understand the impact of the COVID-19 pandemic on our assets and the market. However, we continue to explore potential synergistic acquisitions that may not readily fall into eitheradvance the planning of our cinema or real estate segment.remaining projects.
The success of our Company is naturally dependent on our ongoing ability to execute these business plans effectively through our available resources (both cash and available borrowing facilities), while still timely and effectively managingaddressing our liquidity risk in ordera timely manner. Liquidity risk is the risk relating to our ability to meet our financial obligations when they come due. AtPrior to the present,COVID-19 pandemic, our financial obligations arisearose mainly from capital expenditure needs, working capital requirements, and debt servicing requirements. We managemanaged the liquidity risk by ensuring our abilityworking to generate sufficientadequate cash flows from operating activities, and to obtain adequate, reasonableand maintain appropriate financing or extension of maturity dates under reasonable arrangements, and/or if needed to convert non-performing or non-strategic assets into cash.cash as appropriate under the circumstances. During the pandemic, we have to rely on our ability to control costs, to generate revenue from different sources, and to maintain and obtain adequate and reasonable financing, while at the same time reviewing our options to convert non-strategic assets into cash, if needed. Historically, we have funded our capital expenditures out of operating cash flow. Obviously, with our revenues severely curtailed by the closure and other limitations imposed on our cinema activities, we have needed to look to our lenders for the near term. We, however, remain confident in our cinema industry, and that it will once again be the primary engine through which we fund our liquidity needs.
At SeptemberJune 30, 2019,2020, our consolidated cash and cash equivalents totaled $8.7$40.4 million. Of this amount, $2.7$22.9 million, $3.8 million, and $1.1$13.7 million were held by our U.S., Australian, and New Zealand subsidiaries,operations, respectively. Our intention for cash derived from Australia earnings cumulativeDue to December 31, 2018 is to indefinitely reinvest those offshore. For Australia cash derived from earnings in 2019 and after, and for all cash derived from New Zealand earnings,the impact of COVID-19, we do not intend to indefinitely reinvest offshore. Any cashoffshore any earnings derived from Australia orour Australian and New Zealand earnings not indefinitely reinvested may be subject to certain additional state income taxes when earned.operations.
The changes in cash and cash equivalents for the ninesix months ended SeptemberJune 30, 20192020 and 2018June 30, 2019 are discussed as follows:
| | | | | | | |
|
|
|
|
|
|
|
| | | | | | | |
|
|
|
|
|
|
|
| | Nine Months Ended | | | |
| Six Months Ended |
|
|
|
| | September 30, | | | |
| June 30, |
|
|
|
(Dollars in thousands) | | 2019 | | 2018 | | % Change |
| 2020 |
| 2019 |
| % Change |
Net cash provided by (used in) operating activities | | $ | 10,797 | | $ | 19,072 | | (43) | % |
| $ | (23,126) |
| $ | 3,058 |
| (>100) | % |
Net cash provided by (used in) investing activities | | (33,083) | | (51,674) | | 36 | % |
| (14,011) |
| (23,965) |
| 42 | % |
Net cash provided by (used in) financing activities | | 18,261 | | 35,568 | | (49) | % |
| 63,155 |
| 16,485 |
| >100 | % |
Effect of exchange rate changes on cash and cash equivalents | | | (394) | | | (920) | | 57 | % |
|
| 2,211 |
|
| (189) |
| >100 | % |
Increase (decrease) in cash and cash equivalents | | $ | (4,419) | | $ | 2,046 | | (>100) | % |
| $ | 28,229 |
| $ | (4,611) |
| >100 | % |
Operating activities
Cash provided byused in operating activities for the first ninesix months of 2019 decreasedended June 30, 2020 increased by $8.3$26.2 million, to $10.8net cash used of $23.1 million primarily driven by $5.0$29.7 million lower cash inflows from operating activities as well as a $3.3$3.5 million decrease in net operating assets.
Investing activities
Cash used in investing activities during the ninesix months ended SeptemberJune 30, 20192020 decreased by $18.6$10.0 million compared to the same period in 2018,2019, to net cash used of $33.1 million, primarily$14.0 million. This decrease is due to a decrease inthe suspension of our cinema refurbishment activities due to the COVID-19 shutdown when compared to the first nine months of 2018, and the substantial completion of the upgrading and expansion of our Newmarket and Auburn/Redyard ETCssame period in 2018. During the first nine months of 2019, we invested in renovations at West Lakes, Harbour Town, and Union Square. It is anticipated that spending on our cinema activities will pick up over the remainder of the year.2019.
Financing activities
The $18.3$63.2 million net cash provided by financing activities during the ninesix months ended SeptemberJune 30, 20192020 was primarily related to $58.7$87.2 million of new borrowings, offset by $31.7$22.3 million of loan repayments. Proceeds from these new borrowings related towill be used towards working capital provided for ongoing operations in the ongoing construction of our 44 Union Square project in ManhattanU.S., Australia, and to fundNew Zealand during the capital improvements in our cinemas and real estate segments. Additionally, $7.8 million was used as part of our Stock Repurchase Program.COVID-19 pandemic.
In addition, cash for interest expenses paid was $2.4 million higher for the nine months ended September 30, 2019 compared to the same period 2018, primarily due to increased average debt balances.
On March 2, 2017,10, 2020, the Board of Directors authorized aincreased the stock repurchase program to repurchase up tocapacity by $25.0 million of Reading’s Class A Non-Voting Common Stock. The Board on March 14, 2019,and extended that programit to March 2, 2021.2022. At SeptemberJune 30, 2019,2020, there was $4.9$26.0 million of capacity remaining in that authorization.authorization. During the ninefirst six months ended September 30, 2019of 2020, we have spent $11.3 million (financed in part by the issuance to the seller of suchrepurchased 75,157 shares of a purchase price promissory note of $3.5 million due on September 18, 2024) on repurchasing 856,563 shares ofour Class A Non-Voting Common Stock.
We manage our cash, investments and capital structure so we are ableStock, at an average price of $8.92. These purchases occurred in the first quarter of 2020. In view of the need to meet the short-term and long-term obligations of our business, while maintaining financial flexibility and liquidity. We forecast, analyze and monitor our cash flows to enable investment and financing within the overall constraints ofgarner our financial strategy. In recent years,resources, for the foreseeable future our treasury management has been focused on more aggressive cash management using cash balancesstock repurchase program will likely take a lower capital allocation priority.
Prior to reduce debt. In earlier years,the COVID-19 pandemic, we maintained significant cash balances in our bank accounts. We have used cash generated from operations and other excess cash, to the extent not needed for any capital expenditures,investment, to pay down our loans and credit facilities providing us some flexibility on our available loan facilities for future use and thereby, reducing interest charges. As a part of our COVID-19 planning, we have determined to maintain significant cash balances, and have accordingly fully drawn-down on all our available operating bank lines.
The table below presents the changes in our total available resources (cash and borrowings), debt-to-equity ratio, working capital, and other relevant information addressing our liquidity for the nine monthssecond quarter ended SeptemberJune 30, 20192020 and preceding four years:
| | | | | | | | | | | | | | | |
|
|
|
|
|
|
|
|
|
|
|
|
|
|
|
| | | | | | | | | | | | | | | |
|
|
|
|
|
|
|
|
|
|
|
|
|
|
|
| | As of and for the 9-Months Ended | | Year Ended December 31 |
| As of and for the 6-Months Ended |
| Year Ended December 31 |
($ in thousands) | | September 30, 2019 | | 2018 | | 2017 | | 2016 | | 2015 (2) |
| June 30, 2020 |
| 2019 |
| 2018(3) |
| 2017(2)(3) |
| 2016(2) |
Total Resources (cash and borrowings) | | | | | | | | | | | | | | | |
|
|
|
|
|
|
|
|
|
|
|
|
|
|
|
Cash and cash equivalents (unrestricted) | | $ | 8,708 | | $ | 13,127 | | $ | 13,668 | | $ | 19,017 | | $ | 19,702 |
| $ | 40,364 |
| $ | 12,135 |
| $ | 13,127 |
| $ | 13,668 |
| $ | 19,017 |
Unused borrowing facility | | | 84,149 | | | 85,886 | | | 137,231 | | | 117,599 | | | 70,134 |
|
| 10,494 |
|
| 73,920 |
|
| 85,886 |
|
| 137,231 |
|
| 117,599 |
Restricted for capital projects (1) | | | 17,650 | | | 30,318 | | | 62,280 | | | 62,024 | | | 10,263 |
|
| 10,494 |
|
| 13,952 |
|
| 30,318 |
|
| 62,280 |
|
| 62,024 |
Unrestricted capacity | | | 66,499 | | | 55,568 | | | 74,951 | | | 55,575 | | | 59,871 |
|
| — |
|
| 59,968 |
|
| 55,568 |
|
| 74,951 |
|
| 55,575 |
Total resources at period end | | | 92,857 | | | 99,013 | | | 150,899 | | | 136,616 | | | 89,836 |
|
| 50,858 |
|
| 86,055 |
|
| 99,013 |
|
| 150,899 |
|
| 136,616 |
Total unrestricted resources at period end | | | 75,207 | | | 68,695 | | | 88,619 | | | 74,592 | | | 79,573 |
|
| 40,364 |
|
| 72,103 |
|
| 68,695 |
|
| 88,619 |
|
| 74,592 |
Debt-to-Equity Ratio | | | | | | | | | | | | | | | |
|
|
|
|
|
|
|
|
|
|
|
|
|
|
|
Total contractual facility | | $ | 279,215 | | $ | 252,929 | | $ | 271,732 | | $ | 266,134 | | $ | 207,075 |
| $ | 286,407 |
| $ | 283,138 |
| $ | 252,929 |
| $ | 271,732 |
| $ | 266,134 |
Total debt (gross of deferred financing costs) | | | 195,311 | | | 167,043 | | | 134,501 | | | 148,535 | | | 130,941 |
|
| 275,913 |
|
| 209,218 |
|
| 167,043 |
|
| 134,501 |
|
| 148,535 |
Current | | | 34,374 | | | 30,393 | | | 8,109 | | | 567 | | | 15,000 |
|
| 40,331 |
|
| 37,380 |
|
| 30,393 |
|
| 8,109 |
|
| 567 |
Non-current | | | 160,692 | | | 136,650 | | | 126,392 | | | 147,968 | | | 115,941 |
|
| 235,582 |
|
| 171,838 |
|
| 136,650 |
|
| 126,392 |
|
| 147,968 |
Finance lease liabilities | | | 245 | | | — | | | — | | | — | | | — |
|
| 143 |
|
| 209 |
|
| — |
|
| — |
|
| — |
Total book equity | | | 163,713 | | | 180,547 | | | 181,618 | | | 146,890 | | | 138,951 |
|
| 105,586 |
|
| 139,616 |
|
| 179,979 |
|
| 181,382 |
|
| 146,890 |
Debt-to-equity ratio | | | 1.19 | | | 0.93 | | | 0.74 | | | 1.01 | | | 0.94 |
|
| 2.61 |
|
| 1.50 |
|
| 0.93 |
|
| 0.74 |
|
| 1.01 |
Changes in Working Capital | | | | | | | | | | | | | | | |
|
|
|
|
|
|
|
|
|
|
|
|
|
|
|
Working capital (deficit) (3)(4) | | $ | (76,065) | | $ | (55,270) | | $ | (46,971) | | $ | 6,655 | | $ | (35,581) |
| $ | (54,944) |
| $ | (84,138) |
| $ | (56,047) |
| $ | (47,294) |
| $ | 6,655 |
Current ratio | | | 0.25 | | | 0.35 | | | 0.42 | | | 1.10 | | | 0.51 |
|
| 0.51 |
|
| 0.24 |
|
| 0.35 |
|
| 0.41 |
|
| 1.10 |
Capital Expenditures (including acquisitions) | | $ | 34,585 | | $ | 56,827 | | $ | 76,708 | | $ | 49,166 | | $ | 53,119 |
| $ | 13,948 |
| $ | 47,722 |
| $ | 56,827 |
| $ | 76,708 |
| $ | 49,166 |
| (1)
| | This relates to the construction facilities specifically negotiated for: (i) 44 Union Square redevelopment project, obtained in December 2016, and (ii) New Zealand construction projects, obtained in May 2015. The New Zealand construction loan expired December 31, 2018.
|
| (2)
| | Certain 2015 balances included the restatement impact as a result of a change in accounting principle (see Note 2 – Summary of Significant Accounting Policies – Accounting Changes). Certain 2017 and 2016 balances included the restatement impact as a result of a prior period financial statement correction of immaterial errors (see Note 2 – Summary of Significant Accounting Policies – Prior Period Financial Statement Correction of Immaterial Errors).
|
| (3)
| | Typically our working capital (deficit) is negative as we receive revenue from our cinema business ahead of the time that we have to pay our associated liabilities. We use the money we receive to pay down our borrowings in the first instance
|
(1)This relates to the construction facilities specifically negotiated for: (i) 44 Union Square redevelopment project, obtained in December 2016, and (ii) New Zealand construction projects, obtained in May 2015. The New Zealand construction loan expired December 31, 2018.
(2)Certain 2017 and 2016 balances included the restatement impact as a result of a prior period financial statement correction of immaterial errors (see Note 2 – Summary of Significant Accounting Policies – Prior Period Financial Statement Correction of Immaterial Errors).
(3)See Note 2 – Summary Accounting Policies – Prior Period Financial Statements Correction of Immaterial Errors of the 2019 Form 10-K for the prior period adjustments for accounting for accrued sales tax deemed not material.
(4)Typically, our working capital is reported as a deficit, as we receive revenue from our cinema business ahead of the time that we have to pay our associated liabilities. We use the money we receive to pay down our borrowings in the first instance
CONTRACTUAL OBLIGATIONS, COMMITMENTS AND CONTINGENCIES
The following table provides information with respect to the maturities and scheduled principal repayments of our recorded contractual obligations and certain of our commitments and contingencies, either recorded or off-balance sheet, as of SeptemberJune 30, 2019: 2020:
| | | | | | | | | | | | | | | | | | | | | |
|
|
|
|
|
|
|
|
|
|
|
|
|
|
|
|
|
|
|
|
|
| | | | | | | | | | | | | | | | | | | | | |
|
|
|
|
|
|
|
|
|
|
|
|
|
|
|
|
|
|
|
|
|
(Dollars in thousands) | | 2019 | | 2020 | | 2021 | | 2022 | | 2023 | | Thereafter | | Total |
| 2020 |
| 2021 |
| 2022 |
| 2023 |
| 2024 |
| Thereafter |
| Total |
Debt(1) | | $ | 33,326 | | $ | 51,603 | | $ | 934 | | $ | 981 | | $ | 71,521 | | $ | 8,788 | | $ | 167,153 |
| $ | 40,020 |
| $ | 846 |
| $ | 24,260 |
| $ | 171,626 |
| $ | 293 |
| $ | 7,910 |
| $ | 244,955 |
Operating leases, including imputed interest | | | 7,673 | | | 30,631 | | | 30,956 | | | 30,963 | | | 30,102 | | | 172,589 | | | 302,914 |
|
| 15,819 |
|
| 32,010 |
|
| 32,018 |
|
| 31,292 |
|
| 29,466 |
|
| 159,647 |
|
| 300,252 |
Finance leases, including imputed interest | | | 43 | | | 98 | | | 52 | | | 42 | | | 29 | | | — | | | 264 |
|
| 31 |
|
| 53 |
|
| 42 |
|
| 28 |
|
| — |
|
| — |
|
| 154 |
Subordinated debt(1) | | | — | | | — | | | — | | | — | | | — | | | 27,913 | | | 27,913 |
|
| 326 |
|
| 676 |
|
| 711 |
|
| 747 |
|
| 585 |
|
| 27,913 |
|
| 30,958 |
Pension liability | | | 171 | | | 684 | | | 684 | | | 684 | | | 684 | | | 2,348 | | | 5,255 |
|
| 342 |
|
| 684 |
|
| 684 |
|
| 684 |
|
| 684 |
|
| 1,867 |
|
| 4,945 |
Estimated interest on debt (2) | | | 2,359 | | | 6,867 | | | 5,003 | | | 4,969 | | | 4,915 | | | 7,184 | | | 31,297 |
|
| 4,932 |
|
| 7,224 |
|
| 6,397 |
|
| 4,551 |
|
| 1,690 |
|
| 3,987 |
|
| 28,781 |
Village East purchase option(3) | | | — | | | 5,900 | | | — | | | — | | | — | | | — | | | 5,900 |
|
| — |
|
| 5,900 |
|
| — |
|
| — |
|
| — |
|
| — |
|
| 5,900 |
Total | | $ | 43,572 | | $ | 95,783 | | $ | 37,629 | | $ | 37,639 | | $ | 107,251 | | $ | 218,822 | | $ | 540,696 |
| $ | 61,470 |
| $ | 47,393 |
| $ | 64,112 |
| $ | 208,928 |
| $ | 32,718 |
| $ | 201,324 |
| $ | 615,945 |
| (1)
| | Information is presented gross of deferred financing costs.
|
| (2)
| | Estimated interest on debt is based on the anticipated loan balances for future periods and current applicable interest rates.
|
| (3)
| | Represents the lease liability of the option associated with the ground lease purchase of the Village East Cinema.
|
(1)Information is presented gross of deferred financing costs.
(2)Estimated interest on debt is based on the anticipated loan balances for future periods and current applicable interest rates.
(3)Represents the lease liability of the option associated with the ground lease purchase of the Village East Cinema.
Refer to Note 1314 – Commitments and Contingencies for additional information.
Litigation
Litigation
We are currently involved in certain legal proceedings and, as required, have accrued estimates of probable and estimable losses for the resolution of these claims.
Where we are the plaintiffs, we expense all legal fees on an on-goingongoing basis and make no provision for any potential settlement amounts until received. In Australia, the prevailing party is usually entitled to recover its attorneys’ fees, which recoveries typically work out to be approximately 60% of the amounts actually spent where first classfirst-class legal counsel is engaged at customary rates. Where we are a plaintiff, we have likewise made no provision for the liability for the defendant’s attorneys' fees in the event we are determined not to be the prevailing party.
Where we are the defendants, we accrue for probable damages that insurance may not cover as they become known and can be reasonably estimated. In our opinion, any claims and litigation in which we are currently involved are not reasonably likely to have a material adverse effect on our business, results of operations, financial position, or liquidity. It is possible, however, that future results of the operations for any particular quarterly or annual period could be materially affected by the ultimate outcome of the legal proceedings.
Please refer to Item 3 – Legal Proceedings in our 20182019 Form 10-K for more information. There have been no material changes to our litigation since our 20182019 Form 10-K, except as set forth in Note1314 – Commitments and Contingencies in the accompanying consolidated financial statements included in this Form 10-Q.
Off-Balance Sheet Arrangements
See Note 1314 – Commitments and Contingencies to the Consolidated Financial Statements included herein on this report, there are no off-balance sheet arrangements or obligations (including contingent obligations) that have, or are reasonably likely to have, a current or future material effect on our financial condition, changes in the financial condition, revenue or expense, results of operations, liquidity, capital expenditures or capital resources.
CRITICAL ACCOUNTING POLICIES
We believe that the application of the following accounting policies requires significant judgments and estimates in the preparation of our Consolidated Financial Statements and hence, are critical to our business operations and the understanding of our financial results:
(i) Impairment of Long-lived Assets (other than Goodwill and Intangible Assets with indefinite lives) – we evaluate our long-lived assets and finite-lived intangible assets using historical and projected data of cash flows as our primary indicator of potential impairment and we take into consideration the seasonality of our business. If the sum of the estimated, undiscounted future cash flows is less than the carrying amount of the asset, then an impairment is recognized for the amount by which the carrying value of the asset exceeds its estimated fair value based on an appraisal or a discounted cash flow calculation. For certain non-income producing properties or for those assets with no consistent historical or projected cash flows, we obtain appraisals or other evidence to evaluate whether there are impairment indicators for these assets.
Besides the write-down of the carrying amount of our parking structure adjacent to our Courtenay Central ETC in Wellington, New Zealand due to earthquake damage during the fourth quarter of 2016, no otherNo impairment losses were recorded for long-lived and finite-lived intangible assets for the three yearssix months ended December 31, 2018. Refer to Note 20 – Insurance Recoveries on Impairment and Related Losses due to Earthquake in the 2018 Form 10-K for further details.June 30, 2020.
(ii) Impairment of Goodwill and Intangible Assets with indefinite lives – goodwill and intangible assets with indefinite useful lives are not amortized, but instead, tested for impairment at least annually on a reporting unit basis. The impairment evaluation is based on the present value of estimated future cash flows of each reporting unit plus the expected terminal value. There are significant assumptions and estimates used in determining the future cash flows and terminal value. The most significant assumptions include our cost of debt and cost of equity assumptions that comprise the weighted average cost of capital for each reporting unit. Accordingly, actual results could vary materially from such estimates.
No impairment losses were recorded for goodwill and indefinite-lived intangible assets for the nine monthssecond quarter ended SeptemberJune 30, 2019. 2020.
FINANCIAL RISK MANAGEMENT
International Business Risks
Our international operations are subject to a variety of risks, including the following:
| ·
| | Currency Risk: while we report our earnings and net assets in U.S. dollars, substantial portions of our revenue and of our obligations are denominated in either Australian or New Zealand dollars. The value of these currencies can vary significantly compared to the U.S. dollar and compared to each other. We do not hedge the currency risk, but rather have relied upon the
|
natural hedges that exist as a result of the fact that our film costs are typically fixed as a percentage of the box office, and our local operating costs and obligations are likewise typically denominated in local currencies. However, we do have intercompany debt and our ability to service this debt could be adversely impacted by declines in the relative value of the Australian and New Zealand dollar compared to the U.S. dollar. Also, our use of local borrowings to mitigate the business risk of currency fluctuations has reduced our flexibility to move cash between jurisdictions. Set forth below is a chart of the exchange ratios between these three currencies since 1996:
|
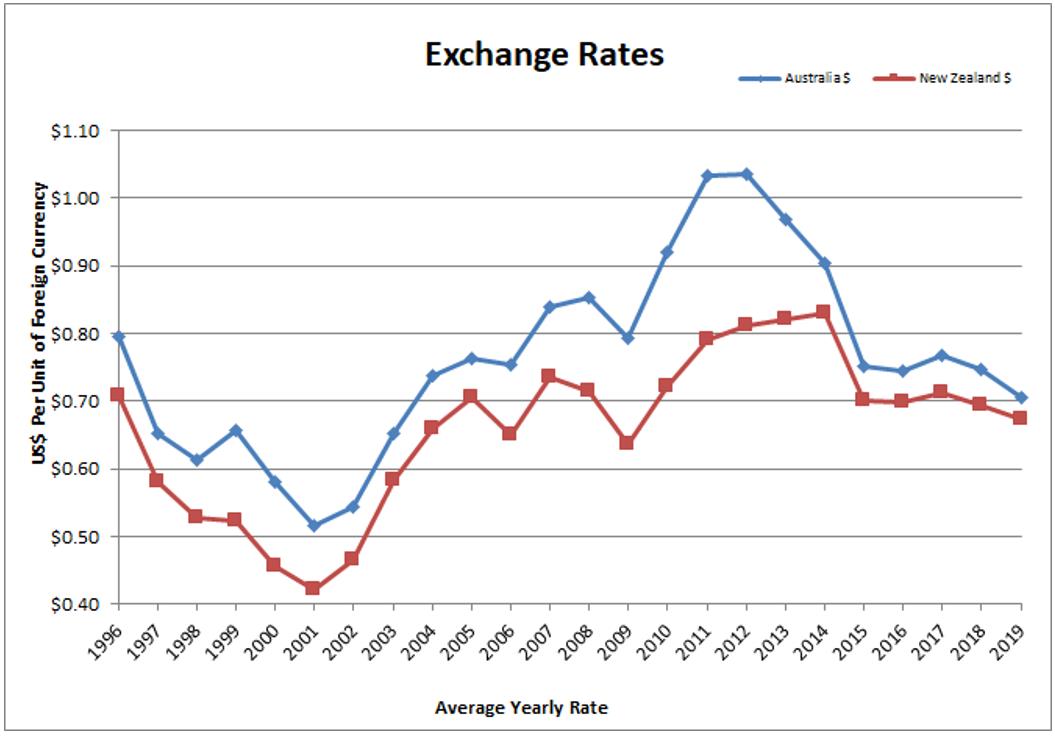
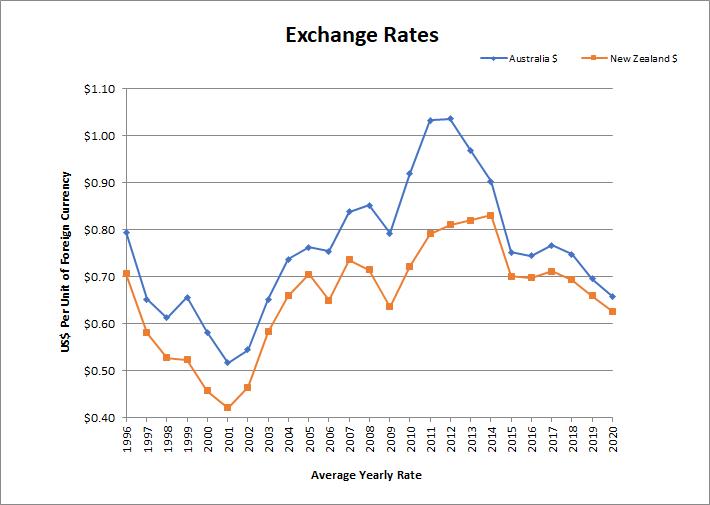
In recent periods, we have repaid intercompany debt and used the proceeds to fund capital investment in the United States. Accordingly, our debt levels in Australia are higher than they would have been if funds had not been returned for such purposes. On a company wide basis, this means that a reduction in the relative strength of the U.S. dollar versus the Australian dollarDollar and/or the New Zealand dollar willwould effectively raise the overall cost of our borrowing and capital and make it more expensive to return funds from the United States to Australia and New Zealand.
Risk of adverse government regulation: currently, we believe that relations between the United States, Australia, and New Zealand are good. However, no assurances can be given that these relationships will continue, and that Australia and New Zealand will not in the future seek to regulate more highly the business done by U.S. companies in their countries.
Risk of adverse labor relations: deterioration in labor relations could lead to an increased cost of labor (including future government requirements with respect to pension liabilities, disability insurance and health coverage, and vacations and leave).
Our exposure to interest rate risk arises out of our intermediate term floating-rate borrowings. To manage the risk, we utilize interest rate derivative contracts to convert certain floating-rate borrowings into fixed-rate borrowings. It is the Company’s policy to enter into interest rate derivative transactions only to the extent considered necessary to meet its objectives as stated above. The Company does not enter into these transactions or any other hedging transactions for speculative purposes.
Inflation
We continually monitor inflation and the effects of changing prices. Inflation increases the cost of goods and services used. Competitive conditions in many of our markets restrict our ability to recover fully the higher costs of acquired goods and services through price increases. We attempt to mitigate the impact of inflation by implementing continuous process improvement solutions to enhance productivity and efficiency and, as a result, lower costs and operating expenses. The effects of inflation have not had a material impact on our operations and the resulting financial position or liquidity.
FORWARD-LOOKING STATEMENTS
45
FORWARD LOOKING STATEMENTS
Our statements in this interim quarterly report contain a variety of forward-looking statements as defined by the Securities Litigation Reform Act of 1995.1995, including those related to the expected timing of the re-opening of our cinemas and theatres and the completion and opening of the 44 Union Square project in New York City, including an issuance of a core and shell temporary certificate of occupancy thereof; our belief regarding the attractiveness of the 44 Union Square project to potential tenants; our expectations regarding the commencement of rental income on our office building; our expectations regarding the resiliency of the industrial property sector in New Zealand; our expectations regarding our stock repurchase program; our expectations regarding credit facility covenant compliance and our ability to continue to obtain necessary covenant waivers; and our expectations of our liquidity and capital requirements and the allocation of funds. Forward-looking statements reflect only our expectations regarding future events and operating performance and necessarily speak only as of the date the information was prepared. No guarantees can be given that our expectation will in fact be realized, in whole or in part. You can recognize these statements by our use of words, such as by way of example, “may,” “will,” “expect,” “believe,” and “anticipate” or other similar terminology.
These forward-looking statements reflect our expectation after having considered a variety of risks and uncertainties. However, they are necessarily the product of internal discussion and do not necessarily completely reflect the views of individual members of our Board of Directors or of our management team. Individual Board members and individual members of our management team may have different views as to the risks and uncertainties involved and may have different views as to future events or our operating performance.
Among the risks, uncertainties, and other factors that could cause actual results to differ materially from those expressed in or underlying our forward-looking statements are the following:
with respect to our cinema operations: the adverse impact of the COVID-19 pandemic which resulted in the temporary shutdown of our global theaters beginning in March 2020, and the adverse effects such pandemic may continue to have on our anticipated cinema re-opening dates and on the dates that public performances will resume in our live theatres in New York City and Chicago; the adverse effects of the COVID-19 pandemic on the Company’s results from operations, liquidity, cash flows, financial condition, and access to credit markets; the adverse impact of the COVID-19 pandemic on short-term and/or long-term entertainment, leisure and discretionary spending habits and practices of our patrons; the decrease in attendance at our cinemas and theatres after they have re-opened due to (i) continued safety and health concerns, (ii) a change in consumer behavior in favor of alternative forms of entertainment, or (iii) additional regulatory requirements limiting our seating capacity; reduction in operating margins (or negative operating margins) due to the implementation of social distancing and other health and safety protocols; potentially uninsurable liability exposure to customers and staff should they become (or allege that they have become) infected with COVID-19 while at one of our facilities; unwillingness of employees to report to work due to the adverse effects of the COVID-19 pandemic or to otherwise conduct work under any revised work environment protocols; the adverse impact that the COVID-19 pandemic may have on the national and global macroeconomic environment; competition from cinema operators who have successfully used debtor laws to reduce their debt and/or rent exposure; the uncertainty as to the scope and extent of government responses to the COVID-19 pandemic; the disruptions or reductions in the utilization of entertainment, shopping, and hospitality venues, as well as in our operations, due to pandemics, epidemics, widespread health emergencies, or outbreaks of infectious diseases such as the coronavirus, or to changing consumer tastes and habits; the number and attractiveness to moviegoers of the films released in future periods, and potential changes in release dates for motion pictures; the lack of availability of films in the short- or long-term as a result of (i) major film distributors releasing scheduled films on alternative channels or (ii) disruptions of film production; the amount of money spent by film distributors to promote their motion pictures; the licensing fees and terms required by film distributors from motion picture exhibitors in order to exhibit their films; | ·
| | with respect to our cinema operations:
|
| o
| | the number and attractiveness to moviegoers of the films released in future periods;
|
| o
| | the amount of money spent by film distributors to promote their motion pictures;
|
| o
| | the licensing fees and terms required by film distributors from motion picture exhibitors in order to exhibit their films;
|
| o
| | the comparative attractiveness of motion pictures as a source of entertainment and willingness and/or ability of consumers (i) to spend their dollars on entertainment and (ii) to spend their entertainment dollars on movies in and outside the home environment;
|
| o
| | the extent to which we encounter competition from other cinema exhibitors, from other sources of outside-the-home entertainment, and from inside-the-home entertainment options, such as “home theaters” and competitive film product distribution technology, such as, by way of example, cable, satellite broadcast and Blu-ray/DVD rentals and sales, and so called “movies on demand”;
|
| o
| | the impact of certain competitors’ subscription or advance pay programs;
|
| o
| | the cost and impact of improvements to our cinemas, such as improved seating, enhanced food and beverage offerings and other improvements;
|
| o
| | disruptions during theater improvements;
|
| o
| | the extent to and the efficiency with which we are able to integrate acquisitions of cinema circuits with our existing operations; and
|
| o
| | certain of our activities are in geologically active areas, creating a risk of damage and/or disruption of real estate and/or cinema businesses from earthquakes.
|
| ·
| | with respect to our real estate development and operation activities:
|
| o
| | the rental rates and capitalization rates applicable to the markets in which we operate and the quality of properties that we own;
|
| o
| | the ability to negotiate and execute lease agreements with material tenants;
|
| o
| | the extent to which we can obtain on a timely basis the various land use approvals and entitlements needed to develop our properties;
|
| o
| | the risks and uncertainties associated with real estate development;
|
| o
| | the availability and cost of labor and materials;
|
| o
| | the ability to obtain all permits to construct improvements;
|
| o
| | the ability to finance improvements;
|
| o
| | the disruptions from construction;
|
| o
| | the possibility of construction delays, work stoppage and material shortage;
|
| o
| | competition for development sites and tenants;
|
| o
| | environmental remediation issues;
|
| o
| | the extent to which our cinemas can continue to serve as an anchor tenant that will, in turn, be influenced by the same factors as will influence generally the results of our cinema operations;
|
| o
| | the increased depreciation and amortization expense as construction projects transition to leased real property;
|
| o
| | the ability to negotiate and execute joint venture opportunities and relationships;and
|
| o
| | certain of our activities are in geologically active areas, creating a risk of damage and/or disruption of real estate and/or cinema businesses from earthquakes.
|
the comparative attractiveness of motion pictures as a source of entertainment and willingness and/or ability of consumers (i) to spend their dollars on entertainment and (ii) to spend their entertainment dollars on movies in an outside-the-home environment; the extent to which we encounter competition from other cinema exhibitors, from other sources of outside-the-home entertainment, and from inside-the-home entertainment options, such as “home theaters” and competitive film product distribution technology, such as, streaming, cable, satellite broadcast, Blu-ray/DVD rentals and sales, and so called “movies on demand”; the impact of certain competitors’ subscription or advance pay programs;
the cost and impact of improvements to our cinemas, such as improved seating, enhanced food and beverage offerings, and other improvements; the ability to negotiate favorable rent payment terms with our landlords; disruptions during theater improvements; the extent to, and the efficiency with, which we are able to integrate acquisitions of cinema circuits with our existing operations; in the U.S., the impact of any termination of the so called “Paramount Decree;” the risk of damage and/or disruption of cinema businesses from earthquakes as certain of our operations are in geologically active areas; and the impact of protests, demonstrations, and civil unrest on, among other things, government policy, consumer willingness to go to the movies, and the spread of COVID-19. with respect to our real estate development and operation activities: the impact of the COVID-19 pandemic may continue to affect many of our tenants at our real estate operations in the United States, Australia, and New Zealand, their ability to pay rent, and to stay in business; the impact of the COVID-19 pandemic on our construction projects and on our ability to open construction sites and to secure needed labor and materials; uncertainty as to governmental responses to COVID-19; the potential sale of certain non-core real estate assets; the rental rates and capitalization rates applicable to the markets in which we operate and the quality of properties that we own; the ability to negotiate and execute lease agreements with material tenants; the extent to which we can obtain on a timely basis the various land use approvals and entitlements needed to develop our properties; the risks and uncertainties associated with real estate development; the availability and cost of labor and materials; the ability to obtain all permits to construct improvements; the ability to finance improvements; the disruptions to our business from construction and/or renovations; the possibility of construction delays, work stoppage, and material shortage; competition for development sites and tenants; environmental remediation issues; the extent to which our cinemas can continue to serve as an anchor tenant that will, in turn, be influenced by the same factors as will influence generally the results of our cinema operations; the increased depreciation and amortization expense as construction projects transition to leased real property; the ability to negotiate and execute joint venture opportunities and relationships; the risk of damage and/or disruption of real estate businesses from earthquakes as certain of our operations are in geologically active areas; the disruptions or reductions in the utilization of entertainment, shopping and hospitality venues, as well as in our operations, due to pandemics, epidemics, widespread health emergencies, or outbreaks of infectious diseases such as the coronavirus, or to changing consumer tastes and habits; and the impact of protests, demonstrations, and civil unrest on government policy, consumer willingness to visit shopping centers, and the spread of COVID-19, among other things. with respect to our operations generally as an international company involved in both the development and operation of cinemas and the development and operation of real estate and previously engaged for many years in the railroad business in the United States: our ability to renew, extend, renegotiate or replace our loans that mature in 2020; our ability to grow our Company and provide value to our stockholders; our ongoing access to borrowed funds and capital and the interest that must be paid on that debt and the returns that must be paid on such capital, and our ability to borrow funds to help cover the cessation of cash flows we are experiencing during the COVID-19 pandemic; our ability to reallocate funds among jurisdictions to meet short-term liquidity needs; | o
| | our ability to renew, extend or renegotiate our loans that mature in 2020;
|
| o
| | our ability to grow our Company and provide value to our stockholders;
|
| o
| | our ongoing access to borrowed funds and capital and the interest that must be paid on that debt and the returns that must be paid on such capital;
|
| o
| | expenses, management and Board distraction and other effects of the litigation efforts mounted by James Cotter, Jr. against the Company, including his efforts to cause a sale of voting control of the Company;
|
| o
| | the relative values of the currency used in the countries in which we operate;
|
| o
| | changes in government regulation, including by way of example, the costs resulting from the implementation of the requirements of Sarbanes-Oxley;
|
| o
| | our labor relations and costs of labor (including future government requirements with respect to minimum wages, shift scheduling, the use of consultants, pension liabilities, disability insurance and health coverage, and vacations and leave);
|
| o
| | our exposure from time to time to legal claims and to uninsurable risks such as those related to our historic railroad operations, including potential environmental claims and health-related claims relating to alleged exposure to asbestos or other substances now or in the future recognized as being possible causes of cancer or other health related problems, and class actions and private attorney general wage and hour based claims;
|
| o
| | our exposure to cyber-security risks, including misappropriation of customer information or other breaches of information security;
|
| o
| | changes in future effective tax rates and the results of currently ongoing and future potential audits by taxing authorities having jurisdiction over our various companies; and
|
| o
| | changes in applicable accounting policies and practices.
|
expenses, management and Board distraction, and other effects of the litigation efforts mounted by James Cotter, Jr. against the Company, including his efforts to cause a sale of voting control of the Company;
the relative values of the currency used in the countries in which we operate;
the impact that any discontinuance, modification or other reform of London Inter-Bank Offered Rate (LIBOR), or the establishment of alternative reference rates, may have on our LIBOR-based debt instruments;
changes in government regulation, including by way of example, the costs resulting from the implementation of the requirements of Sarbanes-Oxley;
our labor relations and costs of labor (including future government requirements with respect to minimum wages, shift scheduling, the use of consultants, pension liabilities, disability insurance and health coverage, and vacations and leave);
our exposure from time to time to legal claims and to uninsurable risks, such as those related to our historic railroad operations, including potential environmental claims and health-related claims relating to alleged exposure to asbestos or other substances now or in the future recognized as being possible causes of cancer or other health related problems, and class actions and private attorney general wage and hour and/or safe work place based claims;
our exposure to cybersecurity risks, including misappropriation of customer information or other breaches of information security;
the impact of major outbreaks of contagious diseases, such as COVID-19;
the availability of employees and/or their ability or willingness to conduct work under any revised work environment protocols;
the increased risks related to employee matters, including increased employment litigation and claims relating to terminations or furloughs caused by theater and entertainment-themed centers (“ETC”) closures;
our ability to generate significant cash flow from operations if our theaters and/or ETCs continue to experience demand at levels significantly lower than historical levels, which could lead to a substantial increase in indebtedness and negatively impact our ability to comply with the financial covenants, if applicable, in our debt agreements;
our ability to comply with credit facility covenants and our ability to obtain necessary covenant waivers and necessary credit facility amendments;
changes in future effective tax rates and the results of currently ongoing and future potential audits by taxing authorities having jurisdiction over our various companies; and
changes in applicable accounting policies and practices.
The above list is not necessarily exhaustive, as business is by definition unpredictable and risky, and subject to influence by numerous factors outside of our control, such as changes in government regulation or policy, competition, interest rates, supply, technological innovation, changes in consumer taste and fancy, weather, earthquakes, pandemics, such as COVID-19, and the extent to which consumers in our markets have the economic wherewithal to spend money on beyond-the-home entertainment. Refer to Item 1A - Risk Factors – of our Annual Report on Form 10-K for the year ended December 31, 2019, as well as the risk factors set forth in any other filings made under the Securities Act of 1934, as amended, including any of our Quarterly Reports on Form 10-Q, for more information.
Given the variety and unpredictability of the factors that will ultimately influence our businesses and our results of operation, no guarantees can be given that any of our forward-looking statements will ultimately prove to be correct. Actual results will undoubtedly vary and there is no guarantee as to how our securities will perform either when considered in isolation or when compared to other securities or investment opportunities.
In addition to the forward-looking factors set forth above, we encourage you to review Item 1A. “Risk Factors,” from our Company’s Annual Report on SEC Form 10-K for the Year Ended December 31, 2018, as well as the risk factors set forth in any other filings made under the Securities Act of 1934, as amended, including any of our Quarterly Report of Form 10-Q.
Finally, we undertake no obligation to publicly update or to revise any of our forward-looking statements, whether as a result of new information, future events or otherwise, except as may be required under applicable law. Accordingly, you should always note the date to which our forward-looking statements speak.
Item 3 – Quantitative and Qualitative Disclosure about Market Risk
The SEC requires that registrants include information about potential effects of changes in currency exchange and interest rates in their filings. Several alternatives, all with some limitations, have been offered. We base the following discussion on a sensitivity analysis that models the effects of fluctuations in currency exchange rates and interest rates. This analysis is constrained by several factors, including the following:
| ·
| | It is based on a single point in time; and
|
| ·
| | It does not include the effects of other complex market reactions that would arise from the changes modeled.
|
It is based on a single point in time; and
It does not include the effects of other complex market reactions that would arise from the changes modeled.
Although the results of such an analysis may be useful as a benchmark, they should not be viewed as forecasts.
At SeptemberJune 30, 2019,2020, approximately 32%35% and 10%11% of our assets were invested in assets denominated in Australian dollars (Reading Australia) and New Zealand dollars (Reading New Zealand), respectively, including approximately $3.8$17.5 million in cash and cash equivalents. At December 31, 2018,2019, approximately 36%37% and 14%10% of our assets were invested in assets denominated in Australian dollars (Reading Australia) and New Zealand dollars (Reading New Zealand), including approximately $5.5$4.3 million in cash and cash equivalents.
Our policy in Australia and New Zealand is to match revenues and expenses, whenever possible, in local currencies. As a result, we have procured a majority of our expenses in Australia and New Zealand in local currencies. Despite this natural hedge, recent movements in foreign currencies have had an effect on our current earnings. Although foreign currency has had an effect on our current earnings, theThe effect of the translation adjustment on our assets and liabilities noted in our other comprehensive income was ana decrease of $7.4$5.1 million for the ninesix months ended SeptemberJune 30, 2019.2020. As we continue to progress our acquisition and development activities in Australia and New Zealand, we cannot assure youno assurances can be given that the foreign currency effect on our earnings will not be material in the future.
Historically, our policy has been to borrow in local currencies to finance the development and construction of our long-term assets in Australia and New Zealand whenever possible.Zealand. As a result, the borrowings in local currencies have provided somewhat of a natural hedge against the foreign currency exchange exposure. Even so, and asWe have also historically paid management fees to the U.S. to cover a resultportion of our issuancedomestic overhead. The weakening Australian and New Zealand currencies, however, will adversely impact our ability to rely on such funding for ongoing support of our domestic overhead.
In 2007, we issued subordinated Trust Preferred Securities denominated in 2007,US Dollars, and their subsequent partial repayment,substantially deployed those funds in our New Zealand subsidiaries, thus exposing approximately 36% and 63%59% of our Australian and New Zealand assets respectively, remain subject to such exposure, unless we electcurrency risk. Those funds were returned to hedge our foreign currency exchange between the USU.S. parent company permanently and Australianin full during 2019, and the New Zealand dollars. Ifsubsidiaries were released from liability under the foreign currency rates were to fluctuate by 10%, the resulting change in Australian and New Zealand assets would be $7.6 million and $4.1 million, respectively, and the change in our quarterly net income (loss) would be $0.9 million and ($0.1) million, respectively.Securities. Presently, we have no planplans to hedge such exposure.make new borrowings in currencies other than the local currency.
We record unrealized foreign currency translation gains or losses that could materially affect our financial position. As of SeptemberJune 30, 20192020 and December 31, 2018,2019, the balance of cumulative foreign currency translation adjustments were approximately $1.3$3.1 million loss and $8.1 million gain, and $8.7 million gain, respectively.
Historically, we maintain most of our cash and cash equivalent balances in short-term money market instruments with original maturities of three months or less. Due to the short-term nature of such investments, a change of 1% in short-term interest rates would not have a material effect on our financial condition. The negative spread between our borrowing costs and earned interest will exacerbate as we hold cash to provide a safety net to meet our expenses while our cinema operations are closed and our tenant income curtailed.
We have a combination of fixed and variable interest rate loans. In connection with our variable interest rate loans, a change of approximately 1% in short-term interest rates would have resulted in approximately $270,000$527,000 increase or decrease in our quarterly interest expense.
For further discussion on market risks, please refer to International Business Risks included in Item 2, Part 1 of this Form 10-Q.
Item 4 – Controls and Procedures
We maintain disclosure controls and procedures that are designed to ensure that information required to be disclosed in the Company’s reports filed under the Securities Exchange Act of 1934, as amended (the “Exchange Act”), is recorded, processed, summarized and reported within the time periods specified in the SEC’s rules and forms and that such information is accumulated and communicated to our management, including our Chief Executive Officer and Chief Financial Officer, as appropriate, to allow for timely decisions regarding required disclosure. In designing and evaluating the disclosure controls and procedures, management recognizes that any controls and procedures, no matter how well designed and operated, can provide only reasonable assurance of achieving the desired control objectives, and our management is required to apply its judgment in evaluating the cost-benefit relationship of possible controls and procedures.
Under the supervision and with the participation of our management, including our principal executive officer and principal financial officer, we conducted an evaluation of our disclosure controls and procedures, as such, term is defined under Rule 13a-15(e) promulgated under the Exchange Act. Based upon that evaluation, we concluded that, as of SeptemberJune 30, 2019,2020, our disclosure controls and procedures were effective.
Changes in Internal Control over Financial Reporting
There were no other changes in our internal control over financial reporting (as defined in Rule 13a-15(f) and 15d-15(f) under the Exchange Act) that occurred during the second quarter and nine months ended SeptemberJune 30, 20192020 that have materially affected, or are reasonably likely to materially affect, our internal control over financial reporting.
PART II – Other Information
Item 1 – Legal Proceedings
The information required under Part II, Item 1 (Legal Proceedings) is incorporated by reference to the information contained in Note 13 – Commitments and Contingencies to the Consolidated Financial Statements included herein in Part I, Item 1 (Financial Statements) on this Quarterly Report on Form 10-Q.
Cotter Jr. Derivative Litigation
This action was originally brought by James J. Cotter, Jr. (“Cotter Jr.”) in June 2015 in the Nevada District Court against all of the Directors of the Company and against the Company as a nominal defendant: James J. Cotter, Jr., individually and derivatively on behalf of Reading International, Inc. vs. Margaret Cotter, et al.” Case No,:No: A-15-719860-V. Summary judgment has been entered against Cotter, Jr., and in favor of all defendants and a $1.55 million cost judgment has been entered against Cotter, Jr., and in favor of our Company. Cotter, Jr. has appealed both judgements. Our application for attorney’s fees was denied, and we have appealed that determination. The issuesappeals have been consolidated and fully briefed and are scheduled for hearing before the Nevada Supreme Court on appeal are currently being briefed. No date for oral argument has been set. It is unlikely that any hearing will be held this year.September 8, 2020. As the Directors and Officers Liability Insurance Policy covering Cotter, Jr.’s claims in the Derivative Case ($10.0 million) has been exhausted, the financial burden of defending our Directors against these claims, as required by applicable Nevada Law, has fallen upon our Company. During 2018,2019, out-of-pocket third partythird-party costs in the amount of approximately $3.5 million$925,000 were incurred by our Company in defending against these claims. For the ninesix months ended SeptemberJune 30, 2019,2020, an additional $782,000$75,000 had been expensed, relating principally to the preparation of appellate briefs with respect to the Derivative Litigation.
Employment Litigation
The Company is currently involved in two California employment matters which include substantially overlapping wage and hour claims: Taylor Brown, individually, and on behalf of other members of the general public similarly situated vs. Reading Cinemas et al. Superior Court of the State of California for the County of Kern, Case No. BCV-19-1000390 (“Brown v. RC,” and the “Brown Class Action Complaint” respectively) and Peter M. Wagner, Jr., an individual, vs. Consolidated Entertainment, Inc. et al., Superior Court of the State of California for the County of San Diego, Case NO. 37-2019-00030695-CU-WT-CTL (“Wagner v. CEI,” and the “Wagner Individual Complaint” respectively). Brown v. RC was initially filed in December 2018, as an individual action and refiled as a putative class action in February 2019, but not served until June 24, 2019. These lawsuits seek damages, and attorneys’ fees, relating to alleged violations of California labor laws relating to meal periods, rest periods, reporting time pay, unpaid wages, timely pay upon termination and wage statements violations. Wagner v. CEI was filed as a discrimination and retaliation lawsuit in June 2019. The following month, in July 2019, a notice was served on us by separate counsel for Mr. Wagner under the California Private Attorney General Act of 2004 (Cal. Labor Code Section 2698, et seq) (the “Wagner PAGA Claim”) purportedly asserting in a representational capacity claims under the PAGA statute, overlapping, in substantial part, the allegations set forth in the Brown Class Action Complaint. On March 6, 2020, Wagner filed a purported class action in the Superior Court of California, County of San Diego, again covering basically the same allegations as set forth in the Brown Class Action Complaint, and titled Peter M. Wagner, an individual, on behalf of himself and all others similarly situated vs. Reading International, Inc., Consolidated Entertainment, Inc. and Does 1 through 25, Case No. 37-2020-000127-CU-OE-CTL (the “Wagner Class Action”). Neither plaintiff has specified the amount of damages sought.
The Company is investigating and intends to vigorously defend the allegations of the Brown Class Action Complaint, the Wagner Individual Complaint, and the Wagner PAGA Claim and deniesthe Wagner Class Action Complaint. In addition, we have denied that a PAGA representative action is appropriate. These matters are in their early stages, and the putative class action hasactions have not been certified. As these cases are in early stages, the Company is unable to predict the outcome of the litigation or the range of potential loss, if any; however, the Company believes that its potential liability with respect to such matters is not material to its overall financial position, results of operations and cash flows. Accordingly, the Company has not established a reserve for loss in connection with these matters.
For further details on our legal proceedings, please refer to Item 3, Legal Proceedings, contained in our 20182019 Form 10-K.
Item 1A – Risk Factors
ThereWe are subject to risks related to corporate social responsibility and reputation Many factors influence our reputation and the value of our brands including the perception held by our customers, business partners, other key stakeholders, and the communities in which we do business. Any harm to our reputation could impact employee engagement and retention and the willingness of customers and our partners to do business with us, which could have been noa material changes in risk factors as previously disclosed inadverse effect on our 2018 Form 10-K.business, results of operations and cash flows.
Item 2 – Unregistered Sales of Equity Securities and Use of Proceeds
There were no unregistered sales of our equity securities and no repurchases of our common stock during the periods covered by this report.second quarter ended June 30, 2020.
The following table summarizes our repurchases under the March 2, 2017, stock repurchase program through to September 30, 2019:
| | | | | | | | | | |
| | | | | | | | | | |
Period | | Total Number of Shares Purchased | | Average Price Paid per Share | | Total Number of Shares Purchased as part of our Stock Buy-Back Program | | Approximate Dollar Value of Shares that may yet be Purchased under the Stock Buy-Back Program |
March 2017 | | 41,899 | | $ | 15.99 | | 41,899 | | $ | 24,330,149 |
May 2017 | | 98,816 | | $ | 15.78 | | 98,816 | | $ | 22,771,316 |
June 2017 | | 70,234 | | $ | 16.39 | | 70,234 | | $ | 21,620,212 |
August 2017 | | 160,489 | | $ | 15.82 | | 160,489 | | $ | 19,081,288 |
September 2017 | | 31,718 | | $ | 15.77 | | 31,718 | | $ | 18,581,038 |
December 2017 | | 6,567 | | $ | 16.01 | | 6,567 | | $ | 18,475,900 |
February 2018 | | 8,500 | | $ | 16.98 | | 8,500 | | $ | 18,331,570 |
March 2018 | | 10,138 | | $ | 16.99 | | 10,138 | | $ | 18,159,364 |
April 2018 | | 5,000 | | $ | 16.12 | | 5,000 | | $ | 18,078,764 |
December 2018 | | 125,700 | | $ | 15.24 | | 125,700 | | $ | 16,162,529 |
March 2019 | | 566 | | $ | 16.08 | | 566 | | $ | 16,153,428 |
April 2019 | | 571 | | $ | 16.27 | | 571 | | $ | 16,144,138 |
May 2019 | | 36,100 | | $ | 13.77 | | 36,100 | | $ | 15,647,160 |
June 2019 | | 159,718 | | $ | 13.22 | | 159,718 | | $ | 13,536,171 |
July 2019 | | 62,748 | | $ | 13.11 | | 62,748 | | $ | 12,713,392 |
August 2019 | | 121,291 | | $ | 12.15 | | 121,291 | | $ | 11,239,920 |
September 2019 | | 475,569 | | $ | 13.43 | | 475,569 | | $ | 4,851,835 |
Total | | 1,415,624 | | $ | 14.23 | | 1,415,624 | | $ | 4,851,835 |
For a description of grants of stock to certain executives, see the Stock Based Compensation section under see Note 15 – Equity and Stock-Based Compensation to our Consolidated Financial Statements.
Item 3 – Defaults upon Senior Securities
None.
Item 4 – Mine Safety Disclosure
Not applicable.
Item 5 – Other Information
On November 5, 2019,Item 1.01 Entry into a Material Definitive Agreement
We incorporate by reference the Company promoted Gilbert Avanes as Chief Financial Officerinformation contained in Note 11 - Debt of the Company effective immediately. Mr. Avanes will continue serving asNotes to Consolidated Financial Statements (Unaudited) in Part I, Item 1 of this quarterly report relating to the Company’s principal financial officer. Mr. Avanes had previously served as the Company’s interim Chief Financial Officer since January 24, 2019, in additionrespective amendments to his existing position as Treasurer. In connectionour credit agreements with the promotion,Bank of America, N.A., National Australia Bank Limited and Westpac New Zealand Limited. Such descriptions are only a summary of the Company increased Mr. Avanes’ annual base salarymaterial provisions of the respective amendments and do not purport to $275,000. The additional information required by Form 8-K Item 5.02(c)(2)be complete and (3) regarding Mr. Avanes is incorporatedare qualified in their entirety by reference fromto the Company’s Form 8-K filed on January 29, 2019provisions in such amendments, a copy of which are attached to this report as Exhibits 10.1, 10.2 and the Company’s Proxy Statement on Schedule 14A filed on April 16, 2019.10.3.
Item 6 – Exhibits
HIDDEN_ROW |
|
31.1
|
|
10.1 | Letter of Variation dated July 27, 2020 between Westpac New Zealand Limited and Reading Courtenay Central Limited, filed herewith. |
10.2 | Amendment Letter dated August 6, 2020 between National Australian Bank Limited and Reading Entertainment Australia Pty. Ltd., filed herewith. |
10.3 | Waiver and Second Amendment to Second Amended and Restated Credit Agreement dated August 7, 2020 between Consolidated Amusement Holdings, LLC, and Bank of America, N.A., filed herewith. |
31.1 | Certification of the Principal Executive Officer Pursuant to Section 302 of the Sarbanes-Oxley Act of 2002,, filed herewith. |
31.2 | Certification of the Principal Financial Officer Pursuant to Section 302 of the Sarbanes-Oxley Act of 2002,, filed herewith. |
32 | Certifications Pursuant to Section 906 of the Sarbanes-Oxley Act of 2002,, furnished herewith. |
101.INS101
| XBRL Instance DocumentThe following material from the Company’s Quarterly Report on Form 10-Q for the quarter ended June 30, 2020, formatted in iXBRL (Inline Extensible Business Reporting Language): (i) Consolidated Balance Sheets, (ii) Consolidated Statements of Income, (iii) Consolidated Statements of Comprehensive Income, (iv) Consolidated Statements of Cash Flows, and (v) the Notes to the Consolidated Financial Statements.
|
101.SCH104
| XBRL Taxonomy Extension Schema
|
101.CAL
| XBRL Taxonomy Extension Calculation
|
101.DEF
| XBRL Taxonomy Extension Definition
|
101.LAB
| XBRL Taxonomy Extension Labels
|
101.PRE
| XBRL Taxonomy Extension PresentationCover Page Interactive Data File (formatted in iXBRL and contained in Exhibit 101)
|
____________________
SIGNATURES
Pursuant to the requirements of the Securities Exchange Act of 1934, the Registrant has duly caused this report to be signed on its behalf by the undersigned thereunto duly authorized.
READING INTERNATIONAL, INC.
Date: November 12, 2019August 10, 2020
By: /s/ Ellen M. Cotter
Ellen M. Cotter
President and Chief Executive Officer
Date: November 12, 2019August 10, 2020
By: /s/ Gilbert Avanes
Gilbert Avanes
Executive Vice President, Chief Financial Officer and Treasurer