UNITED STATES
SECURITIES AND EXCHANGE COMMISSION
Washington, D.C. 20549
Form 10-Q
| | | | | |
| ☑ | |
þ | QUARTERLY REPORT PURSUANT TO SECTION 13 OR 15(d) OF THE SECURITIES EXCHANGE ACT OF 1934 |
For the quarterly period ended December 31, 20172023
or
| | | | | |
| ☐ | |
o | TRANSITION REPORT PURSUANT TO SECTION 13 OR 15(d) OF THE SECURITIES EXCHANGE ACT OF 1934 |
For the transition period from ________ to ________
Commission File Number: 1-11373
Cardinal Health, Inc.
(Exact name of registrant as specified in its charter)
| | | | | | | | | | | | | | | | | | | | |
| Ohio | | 31-0958666 |
| |
Ohio | 31-0958666 |
(State or other jurisdiction of
incorporation or organization)
| | | (IRS Employer
Identification No.)
|
| | | | | | |
7000 Cardinal Place Dublin, Ohio | , | Dublin | , | Ohio | | 43017 |
| (Address of principal executive offices) | | (Zip Code) |
| |
(614) 757-5000 |
(Registrant’s telephone number, including area code) |
(614) 757-5000
(Registrant’s telephone number, including area code)
| | | | | | | | |
| Securities registered pursuant to Section 12(b) of the Act: |
| Title of each class | Trading Symbol(s) | Name of each exchange on which registered |
| Common shares (without par value) | CAH | New York Stock Exchange |
Indicate by check mark whether the registrant (1) has filed all reports required to be filed by Section 13 or 15(d) of the Securities Exchange Act of 1934 during the preceding 12 months (or for such shorter period that the registrant was required to file such reports), and (2) has been subject to such filing requirements for the past 90 days. Yes þ No o
Indicate by check mark whether the registrant has submitted electronically and posted on its corporate Website, if any, every Interactive Data File required to be submitted and posted pursuant to Rule 405 of Regulation S-T (§232.405 of this chapter) during the preceding 12 months (or for such shorter period that the registrant was required to submit and post such files). Yes þ No o
Indicate by check mark whether the registrant is a large accelerated filer, an accelerated filer, a non-accelerated filer, a smaller reporting company, or an emerging growth company. See the definitions of “large accelerated filer,” “accelerated filer,” “smaller reporting company” and "emerging growth company" in Rule 12b-2 of the Exchange Act.
| | | | | | | | | | | | | | | | | |
| |
Large accelerated filerþ | ☑ | | Accelerated filero | ☐ | |
Non-accelerated filero (Do not check if a smaller reporting company) | ☐ | | Smaller reporting companyo | ☐ | |
| | |
Emerging growth companyo |
If an emerging growth company, indicate by check mark if the registrant has elected not to use the extended transition period for complying with any new or revised financial accounting standards provided pursuant to Section 13(a) of the Exchange Act o
☐ | |
If an emerging growth company, indicate by check mark if the registrant has elected not to use the extended transition period for complying with any new or revised financial accounting standards provided pursuant to Section 13(a) of the Exchange Act ☐
Indicate by check mark whether the registrant is a shell company (as defined in Rule 12b-2 of the Exchange Act). Yes o☐ No þ
The number of the registrant’s common shares, without par value, outstanding as of January 31, 2018,26, 2024, was the following: 314,706,914.243,233,153.
|
| |
Cardinal Health Q2 Fiscal 20182024 Form 10-Q |
Table of Contents
About Cardinal Health
Cardinal Health, Inc. is, an Ohio corporation formed in 1979, and is a globally integratedglobal healthcare services and products company providing customized solutions for hospitals, healthcare systems, pharmacies, ambulatory surgery centers, clinical laboratories, physician offices and physician offices.patients in the home. We provide pharmaceuticals and medical products and pharmaceuticals and cost-effective solutions that enhance supply chain efficiency. We connect patients, providers, payers, pharmacists and manufacturers for integrated care coordination and better patient management. We manage our business and report our financial results in two segments: Pharmaceutical and Medical. As used in this report, “we,” “our,” “us,” and similar pronouns refer to Cardinal Health, Inc. and its majority-owned and consolidated subsidiaries, unless the context requires otherwise. Our fiscal year ends on June 30. References to fiscal 20182024 and fiscal 20172023 and to FY18FY24 and FY17FY23 are to the fiscal years ending or ended June 30, 20182024 and June 30, 2017,2023, respectively.
Forward-Looking Statements
This Quarterly Report on Form 10-Q for the quarter ended December 31, 20172023 (this "Form 10-Q") (including information incorporated by reference) includes "forward-looking statements" addressing expectations, prospects, estimates and other matters that are dependent upon future events or developments. Many forward-looking statements appear in Management’s Discussion and Analysis of Financial Condition and Results of Operations ("MD&A"), but there are others in this Form 10-Q, which may be identified by words such as "expect," "anticipate," "intend," "plan," "believe," "will," "should," "could," "would," "project," "continue," "likely," and similar expressions, and include statements reflecting future results trends or guidance, statements of outlook and expense accruals. These matters are subject to risks and uncertainties that could cause actual results to differ materially from those made, projected or implied. The most significant of these risks and uncertainties are described in Exhibit 99.1 to this Form 10-Q, including Exhibit 99.1, and in "Risk Factors" in our Annual Report on Form 10-K for the fiscal year ended June 30, 20172023 (our “2017“2023 Form 10-K”). Forward-looking statements in this Form 10-Q speak only as of the date of this document. Except to the extent required by applicable law, we undertake no obligation to update or revise any forward-looking statement.
Non-GAAP Financial Measures
In the "Overview of Consolidated Results" section of MD&A, we use financial measures that are derived from our consolidated financial data but are not presented in our condensed consolidated financial statements prepared in accordance with U.S. generally accepted accounting principles ("GAAP"). These measures are considered "non-GAAP financial measures" under the United States Securities and Exchange Commission ("SEC") rules. The reasons we use these non-GAAP financial measures and the reconciliations to their most directly comparable GAAP financial measures are included in the “Explanation and Reconciliation of Non-GAAP Financial Measures” section following MD&A in this Form 10-Q.
| | | | | | | | |
| | |
1 | Cardinal Health | Q2Fiscal 20182024 Form 10-Q | |
Management's Discussion and Analysis of Financial Condition and Results of Operations
The discussion and analysis presented below is concerned with material changes in financial condition and results of operations, including amounts and certainty of cash flows from operations and from outside sources, between the periods specified in our condensed consolidated balance sheets at December 31, 20172023 and June 30, 2017,2023, and in our condensed consolidated statements of earningsearnings/(loss) for the three and six months ended December 31, 20172023 and 2016.2022. All comparisons presented are with respect to the prior-year period, unless stated otherwise. This discussion and analysis should be read in conjunction with the MD&A included in our 20172023 Form 10-K.
| | | | | | | | |
| | |
2 | Cardinal Health | Q2Fiscal 2024 Form 10-Q | |
Overview of Consolidated Results
Revenue
During the three and six months ended December 31, 2017, revenue increased 6 percent to $35.2 billion and 4 percent to $67.8 billion, respectively, primarily due to sales growth from pharmaceutical distribution and specialty pharmaceutical customers, partially offset by the previously announced May 2017 expiration of a large pharmaceutical distribution mail order customer contract. Medical segment acquisitions also contributed to the increase in revenue during the three and six months ended December 31, 2017.
|
| | |
| Cardinal Health | Q2Fiscal 2018 Form 10-Q
| 2 |
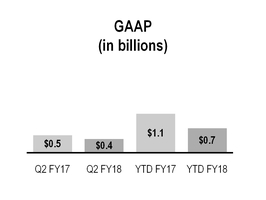
GAAP and Non-GAAP Operating Earnings
|
| | | | | | | | | | | | | | | | | | | | | |
| | Three Months Ended December 31, | | Six Months Ended December 31, |
| (in millions) | 2017 | | 2016 | | Change | | 2017 | | 2016 | | Change |
| GAAP operating earnings | $ | 399 |
| | $ | 542 |
| | (26 | )% | | $ | 661 |
| | $ | 1,076 |
| | (39 | )% |
| LIFO charges/(credits) | — |
| | 9 |
| | | | — |
| | 9 |
| | |
| Restructuring and employee severance | 21 |
| | 7 |
| | | | 153 |
| | 16 |
| | |
| Amortization and other acquisition-related costs | 184 |
| | 115 |
| | | | 368 |
| | 237 |
| | |
| Impairments and (gain)/loss on disposal of assets | 68 |
| | 9 |
| | | | 68 |
| | 12 |
| | |
| Litigation (recoveries)/charges, net | 58 |
| | 19 |
| | | | 90 |
| | 20 |
| | |
| Non-GAAP operating earnings | $ | 730 |
| | $ | 701 |
| | 4 | % | | $ | 1,340 |
| | $ | 1,370 |
| | (2 | )% |
The sum of the components may not equal the total due to rounding.
The decrease in GAAP operating earnings during the three months ended December 31, 2017 was primarily due to increased amortization of acquisition-related intangible assets as a result of the Patient Recovery Business acquisition; the write-down of the net assets held for sale from the divestiture of our China distribution business; litigation charges associated with inferior vena cava (IVC) filter product liability claims; performance from Cardinal Health Brand products; costs related to our multi-year project to replace certain Pharmaceutical segment finance and operating information systems; and Pharmaceutical segment generics program performance, which includes the negative impact of generic pharmaceutical customer pricing changes offset by the benefits of Red Oak Sourcing. These factors were partially offset by the segment profit contribution from acquisitions, including the Patient Recovery Business acquisition. In addition to the factors affecting GAAP earnings for the three months described above, the decrease in GAAP operating earnings during the six months ended December 31, 2017 includes contract termination restructuring costs to transition the distribution of our Medical segment's surgeon gloves in certain international markets from a third-party distribution arrangement to a direct distribution model.
The increase in non-GAAP operating earnings during the three months ended December 31, 2017 was primarily due to contributions from acquisitions, including the Patient Recovery Business acquisition. These factors were largely offset by performance from Cardinal Health Brand products, costs related to our multi-year project to replace certain Pharmaceutical segment finance and operating information systems and Pharmaceutical segment generics program performance.
The decrease in non-GAAP operating earnings during the six months ended December 31, 2017was primarily due to our Pharmaceutical segment generics program performance, costs related to our multi-year project to replace certain Pharmaceutical segment finance and operating information systems and performance from Cardinal Health Brand products. The decreases were partially offset by contributions from acquisitions, including the Patient Recovery Business acquisition.
|
| | |
3
| Cardinal Health | Q2Fiscal 2018 Form 10-Q
| |
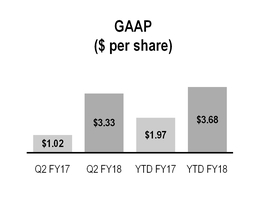
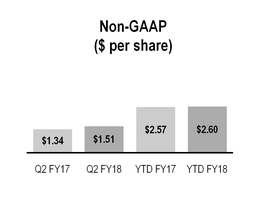
GAAP and Non-GAAP Diluted EPS
|
| | | | | | | | | | | | | | | | | | | | | |
| | Three Months Ended December 31, | | Six Months Ended December 31, |
| ($ per share) | 2017 | | 2016 | | Change | | 2017 | | 2016 | | Change |
GAAP (1) | $ | 3.33 |
| | $ | 1.02 |
| | 226 | % | | $ | 3.68 |
| | $ | 1.97 |
| | 87 | % |
| LIFO charges/(credits) | — |
| | 0.02 |
| | | | — |
| | 0.02 |
| | |
| Restructuring and employee severance | 0.07 |
| | 0.01 |
| | | | 0.34 |
| | 0.03 |
| | |
| Amortization and other acquisition-related costs | 0.46 |
| | 0.24 |
| | | | 0.85 |
| | 0.49 |
| | |
| Impairments and (gain)/loss on disposal of assets | 0.35 |
| | 0.02 |
| | | | 0.35 |
| | 0.02 |
| | |
| Litigation (recoveries)/charges, net | 0.13 |
| | 0.04 |
| | | | 0.19 |
| | 0.04 |
| | |
| Transitional tax benefit, net | (2.83 | ) | | — |
| | | | (2.82 | ) | | — |
| | |
Non-GAAP (1) | $ | 1.51 |
| | $ | 1.34 |
| | 13 | % | | $ | 2.60 |
| | $ | 2.57 |
| | 1 | % |
The sum of the components may not equal the total due to rounding.
| |
(1) | diluted earnings per share attributable to Cardinal Health, Inc. ("diluted EPS") |
During the three and six months ended December 31, 2017, GAAP diluted EPS2023, revenue increased 12 percent and 11 percent to $57.4 billion and $112.2 billion, respectively, primarily due to the net benefitbranded and specialty pharmaceutical sales growth from enactmentexisting customers.
GAAP and Non-GAAP Operating Earnings/(Loss)
| | | | | | | | | | | | | | | | | | | | | | | | | | | | | | | | | | | |
| Three Months Ended December 31, | | Six Months Ended December 31, |
| (in millions) | 2023 | | 2022 | | Change | | 2023 | | 2022 | | Change |
| GAAP operating earnings/(loss) | $ | 482 | | | $ | (119) | | | N.M. | | $ | 468 | | | $ | 18 | | | N.M. |
| Surgical gown recall income | (1) | | | — | | | | | (1) | | | — | | | |
| State opioid assessment related to prior fiscal years | — | | | (6) | | | | | — | | | (6) | | | |
| | | | | | | | | | | |
| Shareholder cooperation agreement costs | — | | | 2 | | | | | — | | | 8 | | | |
| Restructuring and employee severance | 28 | | | 17 | | | | | 53 | | | 46 | | | |
| Amortization and other acquisition-related costs | 63 | | | 71 | | | | | 127 | | | 142 | | | |
| Impairments and (gain)/loss on disposal of assets, net | 1 | | | 710 | | | | | 538 | | | 863 | | | |
| Litigation (recoveries)/charges, net | (11) | | | (207) | | | | | (52) | | | (180) | | | |
| | | | | | | | | | | |
| | | | | | | | | | | |
| Non-GAAP operating earnings | $ | 562 | | | $ | 467 | | | 20 | % | | $ | 1,133 | | | $ | 891 | | | 27 | % |
The sum of the U.S. Tax Cutscomponents and Jobs Act ("Tax Act"), partially offset by the net impact of the factors impactingcertain computations may reflect rounding adjustments.
We had GAAP operating earnings and an increase in interest expense.
Duringof $482 million during the three months ended December 31, 2017, non-GAAP diluted EPS increased primarily due2023 and a GAAP operating loss of $119 million during the three months ended December 31, 2022, which reflects the $709 million pre-tax goodwill impairment charge related to the benefit of applying a lower U.S. federal statutory tax rate to U.S. pre-tax non-GAAP earnings as a result ofMedical segment recognized during the Tax Act and the net benefit of the factors impacting non-GAAPthree months ended December 31, 2022.
We had GAAP operating earnings partially offset by an increase in interest expense.
Duringof $468 million and $18 million during the six months ended December 31,
2017,2023 and 2022, respectively, which included $581 million and $863 million pre-tax goodwill impairment charges related to the Medical segment, respectively. See "Critical Accounting Policies and Sensitive Accounting Estimates" section of this MD&A and Note 4 of the "Notes to Condensed Consolidated Financial Statements" for additional detail related to goodwill impairment.GAAP operating earnings during the three and six months ended December 31, 2022 were favorably impacted by litigation recoveries. See "Results of Operations" section of this MD&A and Note 6 of the "Notes to Condensed Consolidated Financial Statements" for additional detail related to litigation recoveries. Non-GAAP operating earnings during the three and six months ended December 31, 2023 increased 20 percent and 27 percent, respectively, due to an increase in Pharmaceutical and Medical segment profit.
| | | | | | | | |
| | |
3 | Cardinal Health | Q2Fiscal 2024 Form 10-Q | |
GAAP and Non-GAAP Diluted EPS
| | | | | | | | | | | | | | | | | | | | | | | | | | | | | | | | | | | |
| Three Months Ended December 31, | | Six Months Ended December 31, |
| ($ per share) | 2023 | | 2022 | | Change | | 2023 | | 2022 | | Change |
GAAP diluted EPS (1) | $ | 1.43 | | | $ | (0.50) | | | N.M. | | $ | 1.44 | | | $ | (0.08) | | | N.M. |
| Surgical gown recall income | — | | | — | | | | | — | | | — | | | |
| State opioid assessment related to prior fiscal years | — | | | (0.02) | | | | | — | | | (0.02) | | | |
| | | | | | | | | | | |
| Shareholder cooperation agreement costs | — | | | 0.01 | | | | | — | | | 0.02 | | | |
| Restructuring and employee severance | 0.09 | | | 0.05 | | | | | 0.16 | | | 0.13 | | | |
| Amortization and other acquisition-related costs | 0.19 | | | 0.20 | | | | | 0.38 | | | 0.40 | | | |
Impairments and (gain)/loss on disposal of assets, net (2) | 0.14 | | | 2.06 | | | | | 1.71 | | | 2.46 | | | |
| Litigation (recoveries)/charges, net | (0.03) | | | (0.48) | | | | | (0.14) | | | (0.39) | | | |
| | | | | | | | | | | |
| | | | | | | | | | | |
Non-GAAP diluted EPS (1) | $ | 1.82 | | | $ | 1.32 | | | 38 | % | | $ | 3.55 | | | $ | 2.52 | | | 41 | % |
The sum of the components and certain computations may reflect rounding adjustments.
The reconciling items are presented within this table net of tax. See quantification of tax effect of each reconciling item in our GAAP to Non-GAAP Reconciliations in the "Explanation and Reconciliation of Non-GAAP Financial Measures."
(1)Diluted earnings/(loss) per share attributable to Cardinal Health, Inc. ("diluted EPS").
(2)For the six months ended December 31, 2023, impairments and (gain)/loss on disposal of assets, net includes a pre-tax goodwill impairment charge of $581 million related to the Medical segment. For fiscal 2024, the net tax benefit related to the impairment charge is $45 million and is included in the annual effective tax rate. As a result, the tax benefit for the six months ended December 31, 2023 increased approximately by an incremental $65 million and will increase the provision for income taxes for the remainder of fiscal 2024.
For the three and six months December 31, 2022, impairments and (gain)/loss on disposal of assets, net included cumulative pre-tax goodwill impairment charges of $709 million and $863 million, respectively, related to the Medical segment. For fiscal 2023, the net tax benefit related to these impairment charges was $68 million and was included in the annual effective tax rate. As a result, the amount of tax benefit increased approximately by an incremental $118 million and $140 million for the three and six months ended December 31, 2022, respectively, and increased the provision for income taxes for the remainder of fiscal 2023.
During the three and six months ended December 31, 2023, GAAP diluted EPS was favorably impacted by an increase in Pharmaceutical and Medical segment profit. GAAP diluted EPS was adversely impacted by the goodwill impairment charges related to the Medical segment, which had a $(1.91) per share after tax impact during the six months ended December 31, 2023, and $(2.05) and $(2.46) per share after tax impact during the three and six months ended December 31, 2022, respectively. See "Critical Accounting Policies and Sensitive Accounting Estimates" section of this MD&A, and Note 4 and Note 7 of the "Notes to Condensed Consolidated Financial Statements" for additional detail. GAAP EPS during the three and six months ended December 31, 2022 also includes the favorable impact of litigation recoveries as described further in the "Results of Operations" section of this MD&A and Note 6 of the "Notes to Condensed Consolidated Financial Statements." During the three and six months ended December 31, 2023, non-GAAP diluted EPS increased primarily38 percent and 41 percent to $1.82 and $3.55 per share, respectively, due to the benefit of applyinghigher non-GAAP operating earnings, a lower U.S. federal statutory tax rate to U.S. pre-tax non-GAAP earnings as a result of the Tax Act, largely offset by an increase inshare count and interest expense and the factors impacting non-GAAP operating earnings.expense.
Cash and Equivalents
Our cash and equivalents balance was $1.2$4.6 billion at December 31, 20172023 compared to $6.9$4.0 billion at June 30, 2017. The decrease in2023. During the six months ended December 31, 2023, net cash provided by operating activities was $1.7 billion, which includes the impact of our annual payment of $378 million related to the agreement to settle the vast majority of the opioid lawsuits filed by states and equivalentslocal governmental entities (the "National Opioid Settlement Agreement"). In addition, during the six months ended December 31, 2017 was due to $6.1 billion paid2023, we deployed $750 million for acquisitions, $403share repurchases, $255 million to redeem our 1.7% notes due 2018for cash dividends and $296$206 million paid in dividends, offset in part by net cash provided by operating activities of $1.5 billion.
for capital expenditures.
| | | | | | | | |
| | |
4 | Cardinal Health |Q2Fiscal 20182024 Form 10-Q | | 4
Significant Developments in Fiscal 20182024 and Trends
AcquisitionsOperating and Divestitures
Segment Reporting Structure Changes Patient Recovery BusinessIn January 2024, we announced a change in our organizational structure and have re-aligned our reporting structure under two reportable segments, effective January 1, 2024: Pharmaceutical and Specialty Solutions segment and Global Medical Products and Distribution segment. All remaining operating segments that are not significant enough to require separate reportable segment disclosures are included in Other. Results in this Form 10-Q are reported under our prior organizational and reporting structure. The following indicates the changes from the second quarter of fiscal 2024 to the new reporting structure, which will be reported for the first time in the third quarter of fiscal 2024:
•Pharmaceutical and Specialty Solutions segment: This reportable segment will be comprised of all businesses formerly within our Pharmaceutical segment except Nuclear and Precision Health Solutions.
•Global Medical Products and Distribution segment: This reportable segment will be comprised of all businesses formerly within our Medical segment except at-Home Solutions and OptiFreight Logistics.
•Other: This will consist of the remaining operating segments, Nuclear and Precision Health Solutions, at-Home Solutions and OptiFreight Logistics.
Specialty Networks Acquisition
On July 29, 2017, we acquired the Patient Care, Deep Vein Thrombosis, and Nutritional Insufficiency businesses (the "Patient Recovery Business") from Medtronic plc for $6.1 billion in cash. The Patient Recovery Business manufactures 23 categories of medical products that are sold into multiple healthcare channels, and include numerous industry-leading brands, such as Curity, Kendall, Dover, Argyle and Kangaroo. The acquisition further expanded the Medical segment's portfolio of self-manufactured products.
China Distribution Business Divestiture
On November 14, 2017,January 31, 2024, we announced that we signedhad entered into a definitive agreement to sell our pharmaceuticalacquire Specialty Networks, a technology-enabled multi-specialty group purchasing and medical products distribution business in China ("China distribution business") to Shanghai Pharmaceuticals Holding Co., Ltd. The divestiture does not include Cardinal Health’s remaining businesses in China, including Cordis and its recently acquired Patient Recovery Business.
The transaction closed on February 1, 2018 with gross proceedspractice enhancement organization for a purchase price of $1.2 billion.billion in cash, subject to certain adjustments. Specialty Networks creates clinical and economic value for independent specialty providers and partners across multiple specialty GPOs: UroGPO, Gastrologix and GastroGPO, and United Rheumatology. The net proceeds are approximately $800 million after adjusting for third party indebtedness, taxes,acquisition will further expand our offering in key therapeutic areas by enhancing our downstream provider-focused analytics capabilities and otherservice offerings and by accelerating our upstream data and research opportunities with biopharma manufacturers.
This transaction expenses and adjustments. In connectionis subject to the satisfaction of customary closing conditions, including receipt of required regulatory approvals. We plan to fund the acquisition with the sale,available cash.
COVID-19 Vaccine Distribution
Pharmaceutical segment profit was favorably impacted during the three and six months ended December 31, 2017, we recognized2023 on a $67 million write-down of the net assets held for sale. The write-down is non-deductible for tax purposes. We also recognized estimated tax expense of $57 million relatedyear-over-year basis in part due to the transaction.
Pharmaceutical Segment
Within our Pharmaceutical segment, we continuecompany beginning to expect fiscal 2018 segment profit to be less than our fiscal 2017 segment profit due primarily to generic pharmaceutical customer pricing changes. However, as is generallydistribute the case, the frequency,recently commercially available COVID-19 vaccines following U.S. Food and Drug Administration approval of updated vaccines in September 2023. The timing, magnitude and profit impact of pharmaceutical customer pricing changesvaccine distribution volume for the remainder of fiscal 2024 and branded and generic pharmaceutical manufacturer pricing changes remain uncertain and their impact onbeyond remains uncertain.
Generics Program
The performance of our Pharmaceutical segment profit and consolidated operating earnings in fiscal 2018 could be more or less than we expect.
Patient Recovery Business Acquisition
The acquisitiongenerics program positively impacted the year-over-year comparison of the Patient Recovery Business increased MedicalPharmaceutical segment revenue and profit during the three and six months ended December 31, 2017. We expect2023. The Pharmaceutical segment generics program includes, among other things, the acquisition to increase Medicalimpact of generic pharmaceutical product launches, customer volumes, pricing changes, the Red Oak Sourcing, LLC venture ("Red Oak Sourcing") with CVS Health Corporation ("CVS Health") and generic pharmaceutical contract manufacturing and sourcing costs.
The frequency, timing, magnitude and profit impact of generic pharmaceutical customer volumes, pricing changes, customer contract renewals, generic pharmaceutical manufacturer pricing changes and generic pharmaceutical contract manufacturing and sourcing costs all impact Pharmaceutical segment profit moreand are subject to risks and uncertainties. These risks and uncertainties may impact Pharmaceutical segment profit and consolidated operating earnings during the remainder of fiscal 2018 than it did during the six months ended December 31, 2017.2024.
Tax Cuts
Medical SegmentInflationary Impacts Beginning in fiscal 2022, Medical segment profit was negatively affected by incremental inflationary impacts, primarily related to transportation (including ocean and Jobs Actdomestic freight), commodities and labor, and global supply chain constraints. Since that time, we have taken actions to partially mitigate these impacts, including implementing certain price increases and evolving our pricing and
The Tax Act was enacted on December 22, 2017. The Tax Act, among other things, reduces the U.S. federal corporate tax rate from 35 percent
| | | | | | | | |
| | |
5 | Cardinal Health | Q2Fiscal 2024 Form 10-Q | |
commercial contracting processes to 21 percent and requires companies to pay a one-time tax to repatriate, for U.S. purposes, earnings of certain foreign subsidiaries that were previously deferred for tax purposes.provide us with greater pricing flexibility. In addition, beginning July 1, 2018 for us, it limits certain deductionsdecreases in some product-related costs have been recognized as the higher-cost inventory moved through our supply chain and creates new taxes on certain foreign sourced earnings.was replaced by lower-cost inventory. These net inflationary impacts negatively affected Medical segment profit during fiscal 2023. The rate change is effective at the beginning of calendar year 2018 and, as a result, we have a blended U.S. federal statutory tax rate of 28.1 percent for our fiscal year 2018. The application of the lower federal tax rate to our year-to-date U.S. pre-tax earnings resulted in a tax benefitnet inflationary impacts were less significant during the three months ended December 31, 2017. Additionally, we recognized a $894 million net transitional tax benefit comprised of the remeasurement of our U.S. deferred tax assets and liabilities at the lower tax rate partially offset by the provisional expense for the repatriation tax.
We are still completing our accounting for the tax effects of the Tax Act because all of the necessary information is not currently available, prepared, or analyzed. As such, the amounts we have recorded are provisional estimates and, as permitted by the SEC, we will continue to assess the impact of enactment of the Tax Act and we may record additional provisional amounts or adjustments to provisional amounts during the remainder of fiscal 2018 and in the first half of fiscal 2019.
|
| | |
5
| Cardinal Health | Q2Fiscal 2018 Form 10-Q
| |
|
| | |
MD&A | Results of Operations | |
Results of Operations
Revenue
|
| | | | | | | | | | | | | | | | | | | | | |
| | Three Months Ended December 31, | | Six Months Ended December 31, |
| (in millions) | 2017 | | 2016 | | Change | | 2017 | | 2016 | | Change |
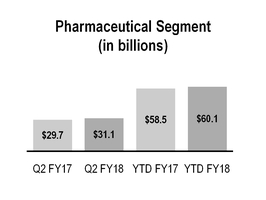
| Pharmaceutical | $ | 31,146 |
| | $ | 29,743 |
| | 5 | % | | $ | 60,066 |
| | $ | 58,505 |
| | 3 | % |
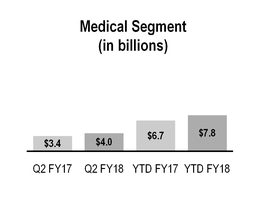
| Medical | 4,044 |
| | 3,410 |
| | 19 | % | | 7,768 |
| | 6,690 |
| | 16 | % |
| Total segment revenue | 35,190 |
| | 33,153 |
| | 6 | % | | 67,834 |
| | 65,195 |
| | 4 | % |
| Corporate | (4 | ) | | (3 | ) | | 33 | % | | (7 | ) | | (6 | ) | | 17 | % |
| Total revenue | $ | 35,186 |
| | $ | 33,150 |
| | 6 | % | | $ | 67,827 |
| | $ | 65,189 |
| | 4 | % |
Pharmaceutical Segment
Pharmaceutical segment revenue growth for the three and six months ended December 31, 2017 was primarily2023 and had a favorable impact on Medical segment profit on a year-over-year basis.
We expect these net inflationary impacts to continue to affect Medical segment profit during the remainder of fiscal 2024, but to a significantly lesser extent than in fiscal 2023 and prior periods, due to $2.5 billionour mitigation actions, together with continued decreases in certain product-related costs. However, these inflationary costs are difficult to predict and $3.5 billion, respectively,may be greater than we expect or continue longer than our current expectations. Our actions to increase prices and evolve our contracting strategies are subject to contingencies and uncertainties and it is possible that our results of operations will be adversely impacted to a greater extent than we currently anticipate or that we may not be able to mitigate the negative impact to the extent or on the timeline we anticipate.
Volumes within Products and Distribution
Medical segment profit was adversely impacted during fiscal 2023 in part due to lower volumes within products and distribution, which includes our Cardinal Health branded medical products. We expect Cardinal Health branded medical products sales growth in fiscal 2024 and beyond. The timing, magnitude and profit impact of this anticipated sales growth is subject to risks and uncertainties, which may impact Medical segment profit.
Medical Segment Goodwill
The change in segment structure as discussed above will result in changes to the composition of our reporting units. Accordingly, we will be required to reallocate the goodwill in reporting units affected by the change using a relative fair value approach and assess goodwill for impairment both before and after the reallocation. While we have not identified any indicators of impairment during the three months ended December 31, 2023 within the current reporting units, we may recognize a goodwill impairment charge following the reallocation if the carrying value of a new reporting unit exceeds its estimated fair value.
During the three months ended September 30, 2023, we performed interim goodwill impairment testing for the Medical operating segment (excluding our Cardinal Health at-Home Solutions division) ("Medical Unit") due to an increase in the risk-free interest rate. This testing resulted in a pre-tax charge of $581 million which was included in impairments and (gain)/loss on disposal of assets, net in our condensed consolidated statements of earnings/(loss). See "Critical Accounting Policies and Sensitive Accounting Estimates" section of this MD&A and Note 4 of the "Notes to Condensed Consolidated Financial Statements" for additional detail. Adverse changes in key assumptions or a significant change in industry or economic trends during the remainder of fiscal 2024 and beyond could result in additional goodwill impairments. Shareholder Cooperation Agreement In September 2022, we entered into a Cooperation Agreement (the "Cooperation Agreement") with Elliott Associates, L.P. and Elliott International, L.P. (together, "Elliott") under which our Board of Directors (the "Board"), among other things, (1) appointed four new independent directors, including a representative from pharmaceutical distributionElliott, and (2) formed an advisory Business Review Committee of the Board, which is tasked with undertaking a comprehensive review of our strategy, portfolio, capital-allocation framework and operations. In May 2023, we extended the term of the Cooperation Agreement until the later of July 15, 2024 or until Elliott's representative ceases to serve on, or resigns from, the Board. In connection with this extension, the Board has extended the term of the Business Review Committee until July 15, 2024.
The evaluation and implementation of any actions recommended by the Business Review Committee and the Board have impacted and may continue to impact our business, financial position and results of operations during the remainder of fiscal 2024 and beyond. We have incurred, and may incur additional legal, consulting and other expenses related to the Cooperation Agreement and the activities of the Business Review Committee.
| | | | | | | | |
| | |
6 | Cardinal Health | Q2Fiscal 2024 Form 10-Q | |
| | | | | | | | |
| MD&A | Results of Operations | |
Results of Operations
Revenue
| | | | | | | | | | | | | | | | | | | | | | | | | | | | | | | | | | | |
| Three Months Ended December 31, | | Six Months Ended December 31, |
| (in millions) | 2023 | | 2022 | | Change | | 2023 | | 2022 | | Change |
| Pharmaceutical | $ | 53,520 | | | $ | 47,673 | | | 12 | % | | $ | 104,526 | | | $ | 93,501 | | | 12 | % |
| Medical | 3,928 | | | 3,797 | | | 3 | % | | 7,688 | | | 7,575 | | | 1 | % |
| Total segment revenue | 57,448 | | | 51,470 | | | 12 | % | | 112,214 | | | 101,076 | | | 11 | % |
| Corporate | (3) | | | (1) | | | N.M. | | (6) | | | (4) | | | N.M. |
| Total revenue | $ | 57,445 | | | $ | 51,469 | | | 12 | % | | $ | 112,208 | | | $ | 101,072 | | | 11 | % |
Pharmaceutical Segment
Pharmaceutical segment revenue increased during the three and six months ended December 31, 2023 due to branded and specialty pharmaceutical sales growth, largely from existing customers, partially offsetwhich increased revenue by the previously announced May 2017 expiration of a large pharmaceutical distribution mail order customer contract.$5.8 billion and $10.9 billion, respectively.
Medical Segment
Medical segment revenue increased during the three and six months ended December 31, 2023, primarily due to sales growth in at-Home Solutions and in products and distribution. The increase in products and distribution was primarily driven by higher Cardinal Health brand volumes and the effect of price increases to mitigate inflationary impacts partially offset by the adverse impact of personal protective equipment ("PPE") volumes and pricing.
Cost of Products Sold
Cost of products sold for the three and six months ended December 31, 2017 was primarily due2023 increased 12 percent to $545 million$55.6 billion and $877 million,$108.6 billion, respectively, of contributions from acquisitions, including the Patient Recovery Business acquisition, and sales growth from new and existing customers.
Cost of Products Sold
Cost of products sold for the three and six months ended December 31, 2017 increased $1.8 billion(6 percent) and $2.3 billion (4 percent) compared to the prior-year periods respectively, as a result ofdue to the same factors affecting the changes in revenue and gross margin.
| | | | | | | | |
| | |
7 | Cardinal Health |Q2Fiscal 20182024 Form 10-Q | | 6
| | | | | | | | |
| MD&A | Results of Operations | |
|
| | |
MD&A | Results of Operations | |
| | | | Three Months Ended December 31, | | Six Months Ended December 31, |
| Three Months Ended December 31, | | | Three Months Ended December 31, | | Six Months Ended December 31, |
| (in millions) | 2017 | | 2016 | | Change | | 2017 | | 2016 | | Change | (in millions) | 2023 | | 2022 | | Change | | 2023 | | 2022 | | Change |
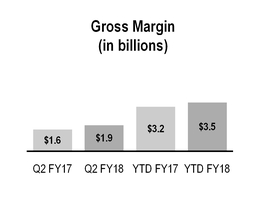
| Gross margin | $ | 1,861 |
| | $ | 1,602 |
| | 16 | % | | $ | 3,533 |
| | $ | 3,192 |
| | 11 | % | Gross margin | $ | 1,846 | | | $ | | $ | 1,663 | | | 11 | | 11 | % | | $ | 3,614 | | | $ | | $ | 3,277 | | | 10 | | 10 | % |
|
Gross margin increased during the three and six months ended December 31, 2017 increased $259 million and $341 million, respectively, compared2023 primarily due to the beneficial comparison to the prior-year period primarily due to acquisitions ($235 millionnet inflationary impacts in the Medical segment, the performance of our generics program in the Pharmaceutical segment and $336 million, respectively), includingincreased contribution from branded pharmaceutical and specialty pharmaceutical products, which includes the Patient Recovery Business acquisition.
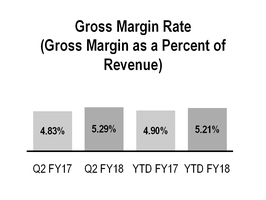
favorable impact from COVID-19 vaccine distribution.Gross margin rate grew 46 and 31declined 2 basis points during both the three and six months ended December 31, 2017, respectively, due to acquisitions, including2023, with the Patient Recovery Business acquisition, partiallyimpact of unfavorable changes in overall product mix mostly offset by the negative impactbeneficial comparison to the prior-year net inflationary impacts in the Medical segment and the performance of our generics program in the Pharmaceutical segment. The changes in overall product mix were primarily driven by increased pharmaceutical distribution product mix.
Distribution, Selling, General and Administrative ("SG&A") Expenses
| | | | | | | | | | | | | | | | | | | | | | | | | | | | | | | | | | | |
| Three Months Ended December 31, | | Six Months Ended December 31, |
| (in millions) | 2023 | | 2022 | | Change | | 2023 | | 2022 | | Change |
| SG&A expenses | $ | 1,283 | | | $ | 1,191 | | | 8 | % | | $ | 2,480 | | | $ | 2,388 | | | 4 | % |
|
| | | | | | | | | | | | | | | | | | | | | |
| | Three Months Ended December 31, | | Six Months Ended December 31, |
| (in millions) | 2017 | | 2016 | | Change | | 2017 | | 2016 | | Change |
| SG&A expenses | $ | 1,131 |
| | $ | 910 |
| | 24 | % | | $ | 2,193 |
| | $ | 1,831 |
| | 20 | % |
The increase in SG&A expenses duringDuring the three and six months ended December 31, 2017 was2023, SG&A expenses increased primarily due to acquisitions ($135 million and $225 million, respectively), including the Patient Recovery Business acquisition, andhigher costs to support sales growth, expenses related to our multi-year project to replace certain Pharmaceutical segment financeinvestment projects and operating information systems.compensation-related costs.
| | | | | | | | |
| | |
78
| Cardinal Health | Q2Fiscal 20182024 Form 10-Q | |
| | | | | | | | |
| MD&A | | |
MD&A | Results of Operations | |
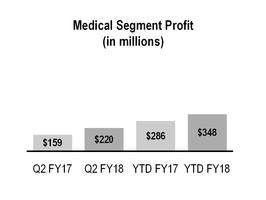
Segment Profit
We evaluate segment performance based on segment profit, among other measures. See Note 1512 of the "Notes to Condensed Consolidated Financial Statements" for additional information on segment profit. |
| | | | | | | | | | | | | | | | | | | | | |
| | Three Months Ended December 31, | | Six Months Ended December 31, |
| (in millions) | 2017 | | 2016 | | Change | | 2017 | | 2016 | | Change |
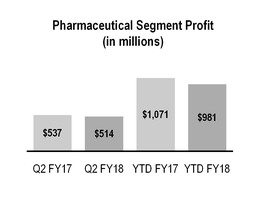
| Pharmaceutical | $ | 514 |
| | $ | 537 |
| | (4 | )% | | $ | 981 |
| | $ | 1,071 |
| | (8 | )% |
| Medical | 220 |
| | 159 |
| | 38 | % | | 348 |
| | 286 |
| | 22 | % |
| Total segment profit | 734 |
| | 696 |
| | 5 | % | | 1,329 |
| | 1,357 |
| | (2 | )% |
| Corporate | (335 | ) | | (154 | ) | | 118 | % | | (668 | ) | | (281 | ) | | 138 | % |
| Total consolidated operating earnings | $ | 399 |
| | $ | 542 |
| | (26 | )% | | $ | 661 |
| | $ | 1,076 |
| | (39 | )% |
| | | | | | | | | | | | | | | | | | | | | | | | | | | | | | | | | | | |
| Three Months Ended December 31, | | Six Months Ended December 31, |
| (in millions) | 2023 | | 2022 | | Change | | 2023 | | 2022 | | Change |
| Pharmaceutical | $ | 518 | | | $ | 464 | | | 12 | % | | $ | 1,025 | | | $ | 895 | | | 15 | % |
| Medical | 71 | | | 17 | | | N.M | | 142 | | | 9 | | | N.M |
| Total segment profit | 589 | | | 481 | | | 22 | % | | 1,167 | | | 904 | | | 29 | % |
| Corporate | (107) | | | (600) | | | N.M. | | (699) | | | (886) | | | N.M. |
| Total consolidated operating earnings/(loss) | $ | 482 | | | $ | (119) | | | N.M. | | $ | 468 | | | $ | 18 | | | N.M. |
Pharmaceutical Segment Profit
The decrease in Pharmaceutical segment profit increased during the three months ended December 31, 2017 was primarily due to costs related to our multi-year project to replace certain Pharmaceutical segment finance and operating information systems and our generic program performance, which includes the negative impact of generic pharmaceutical customer pricing changes partially offset by the benefits of Red Oak Sourcing. Performance from our specialty pharmaceutical products distribution and services business positively impacted Pharmaceutical segment profit.
The decrease in Pharmaceutical segment profit during the six months ended December 31, 2017 was2023 primarily due to the performance of our genericgenerics program performance and costs related to our multi-year project to replace certain Pharmaceutical segment financeincreased contribution from branded pharmaceutical and operating information systems. Performance from our specialty pharmaceutical products, which includes the favorable impact from COVID-19 vaccine distribution, and services business positively impacted Pharmaceutical segment profit.partially offset by higher costs to support sales growth.
Cash and Equivalents
Our cash and equivalents balance was $4.6 billion at December 31, 2023 compared to $4.0 billion at June 30, 2023. During the six months ended December 31, 2023, net cash provided by operating activities was $1.7 billion, which includes the impact of our annual payment of $378 million related to the agreement to settle the vast majority of the opioid lawsuits filed by states and local governmental entities (the "National Opioid Settlement Agreement"). In addition, during the six months ended December 31, 2023, we deployed $750 million for share repurchases, $255 million for cash dividends and $206 million for capital expenditures.
| | | | | | | | |
| | |
4 | Cardinal Health | Q2Fiscal 2024 Form 10-Q | |
Significant Developments in Fiscal 2024 and Trends
Operating and Segment Reporting Structure Changes
In January 2024, we announced a change in our organizational structure and have re-aligned our reporting structure under two reportable segments, effective January 1, 2024: Pharmaceutical and Specialty Solutions segment and Global Medical Segment ProfitProducts and Distribution segment. All remaining operating segments that are not significant enough to require separate reportable segment disclosures are included in Other. Results in this Form 10-Q are reported under our prior organizational and reporting structure. The following indicates the changes from the second quarter of fiscal 2024 to the new reporting structure, which will be reported for the first time in the third quarter of fiscal 2024:
•Pharmaceutical and Specialty Solutions segment: This reportable segment will be comprised of all businesses formerly within our Pharmaceutical segment except Nuclear and Precision Health Solutions.
•Global Medical Products and Distribution segment: This reportable segment will be comprised of all businesses formerly within our Medical segment except at-Home Solutions and OptiFreight Logistics.
•Other: This will consist of the remaining operating segments, Nuclear and Precision Health Solutions, at-Home Solutions and OptiFreight Logistics.
Specialty Networks Acquisition
On January 31, 2024, we announced that we had entered into a definitive agreement to acquire Specialty Networks, a technology-enabled multi-specialty group purchasing and practice enhancement organization for a purchase price of $1.2 billion in cash, subject to certain adjustments. Specialty Networks creates clinical and economic value for independent specialty providers and partners across multiple specialty GPOs: UroGPO, Gastrologix and GastroGPO, and United Rheumatology. The increasesacquisition will further expand our offering in Medicalkey therapeutic areas by enhancing our downstream provider-focused analytics capabilities and service offerings and by accelerating our upstream data and research opportunities with biopharma manufacturers.
This transaction is subject to the satisfaction of customary closing conditions, including receipt of required regulatory approvals. We plan to fund the acquisition with available cash.
COVID-19 Vaccine Distribution
Pharmaceutical segment profit was favorably impacted during the three and six months ended December 31, 2023 on a year-over-year basis in part due to the company beginning to distribute the recently commercially available COVID-19 vaccines following U.S. Food and Drug Administration approval of updated vaccines in September 2023. The timing, magnitude and profit impact of vaccine distribution volume for the remainder of fiscal 2024 and beyond remains uncertain.
Generics Program
The performance of our Pharmaceutical segment generics program positively impacted the year-over-year comparison of Pharmaceutical segment profit during the three and six months ended December 31, 2017 were primarily due to acquisitions, which included2023. The Pharmaceutical segment generics program includes, among other things, the unfavorable costimpact of products sold impact fromgeneric pharmaceutical product launches, customer volumes, pricing changes, the fair value step up of inventory acquiredRed Oak Sourcing, LLC venture ("Red Oak Sourcing") with the Patient Recovery Business acquisition. The increases were partially offset by performance from CardinalCVS Health Brand products.
CorporateCorporation ("CVS Health") and generic pharmaceutical contract manufacturing and sourcing costs.
The frequency, timing, magnitude and profit impact of generic pharmaceutical customer volumes, pricing changes, customer contract renewals, generic pharmaceutical manufacturer pricing changes and generic pharmaceutical contract manufacturing and sourcing costs all impact Pharmaceutical segment profit and are subject to risks and uncertainties. These risks and uncertainties may impact Pharmaceutical segment profit and consolidated operating earnings during the remainder of fiscal 2024.
Medical SegmentInflationary Impacts Beginning in Corporatefiscal 2022, Medical segment profit was negatively affected by incremental inflationary impacts, primarily related to transportation (including ocean and domestic freight), commodities and labor, and global supply chain constraints. Since that time, we have taken actions to partially mitigate these impacts, including implementing certain price increases and evolving our pricing and
| | | | | | | | |
| | |
5 | Cardinal Health | Q2Fiscal 2024 Form 10-Q | |
commercial contracting processes to provide us with greater pricing flexibility. In addition, decreases in some product-related costs have been recognized as the higher-cost inventory moved through our supply chain and was replaced by lower-cost inventory. These net inflationary impacts negatively affected Medical segment profit during fiscal 2023. The net inflationary impacts were less significant during the three and six months ended December 31, 2017 were2023 and had a favorable impact on Medical segment profit on a year-over-year basis.
We expect these net inflationary impacts to continue to affect Medical segment profit during the remainder of fiscal 2024, but to a significantly lesser extent than in fiscal 2023 and prior periods, due to our mitigation actions, together with continued decreases in certain product-related costs. However, these inflationary costs are difficult to predict and may be greater than we expect or continue longer than our current expectations. Our actions to increase prices and evolve our contracting strategies are subject to contingencies and uncertainties and it is possible that our results of operations will be adversely impacted to a greater extent than we currently anticipate or that we may not be able to mitigate the factorsnegative impact to the extent or on the timeline we anticipate.
Volumes within Products and Distribution
Medical segment profit was adversely impacted during fiscal 2023 in part due to lower volumes within products and distribution, which includes our Cardinal Health branded medical products. We expect Cardinal Health branded medical products sales growth in fiscal 2024 and beyond. The timing, magnitude and profit impact of this anticipated sales growth is subject to risks and uncertainties, which may impact Medical segment profit.
Medical Segment Goodwill
The change in segment structure as discussed above will result in changes to the Other Componentscomposition of Consolidated Operating Earnings section that follows.
|
| | |
| Cardinal Health | Q2Fiscal 2018 Form 10-Q
| 8 |
|
| | |
MD&A | Results of Operations | |
Other Components of Consolidated Operating Earnings
In additionour reporting units. Accordingly, we will be required to revenue, gross margin and SG&A expenses discussed previously, consolidated operating earnings were impactedreallocate the goodwill in reporting units affected by the following:
|
| | | | | | | | | | | | | | | |
| | Three Months Ended December 31, | | Six Months Ended December 31, |
| (in millions) | 2017 | | 2016 | | 2017 | | 2016 |
| Restructuring and employee severance | $ | 21 |
| | $ | 7 |
| | $ | 153 |
| | $ | 16 |
|
| Amortization and other acquisition-related costs | 184 |
| | 115 |
| | 368 |
| | 237 |
|
| Impairments and (gain)/loss on disposal of assets, net | 68 |
| | 9 |
| | 68 |
| | 12 |
|
| Litigation (recoveries)/charges, net | 58 |
| | 19 |
| | 90 |
| | 20 |
|
Restructuringchange using a relative fair value approach and Employee Severance
The increase in restructuringassess goodwill for impairment both before and employee severanceafter the reallocation. While we have not identified any indicators of impairment during the six months ended December 31, 2017 was primarily due to $125 million in contract termination costs to transition the distribution of our Medical segment's surgeon gloves in certain international markets from a third-party distribution arrangement to a direct distribution model.
Amortization and Other Acquisition-Related Costs
Amortization of acquisition-related intangible assets was $150 million and $95 million for the three months ended December 31, 2017 and 2016, respectively, and $285 million and $196 million2023 within the current reporting units, we may recognize a goodwill impairment charge following the reallocation if the carrying value of a new reporting unit exceeds its estimated fair value.
During the three months ended September 30, 2023, we performed interim goodwill impairment testing for the six months ended December 31, 2017Medical operating segment (excluding our Cardinal Health at-Home Solutions division) ("Medical Unit") due to an increase in the risk-free interest rate. This testing resulted in a pre-tax charge of $581 million which was included in impairments and 2016, respectively. (gain)/loss on disposal of assets, net in our condensed consolidated statements of earnings/(loss). See "Critical Accounting Policies and Sensitive Accounting Estimates" section of this MD&A and Note 4 of the "Notes to Condensed Consolidated Financial Statements" for additional detail. Adverse changes in key assumptions or a significant change in industry or economic trends during the remainder of fiscal 2024 and beyond could result in additional goodwill impairments. Shareholder Cooperation Agreement In September 2022, we entered into a Cooperation Agreement (the "Cooperation Agreement") with Elliott Associates, L.P. and Elliott International, L.P. (together, "Elliott") under which our Board of Directors (the "Board"), among other things, (1) appointed four new independent directors, including a representative from Elliott, and (2) formed an advisory Business Review Committee of the Board, which is tasked with undertaking a comprehensive review of our strategy, portfolio, capital-allocation framework and operations. In May 2023, we extended the term of the Cooperation Agreement until the later of July 15, 2024 or until Elliott's representative ceases to serve on, or resigns from, the Board. In connection with this extension, the Board has extended the term of the Business Review Committee until July 15, 2024.
The increases in amortizationevaluation and implementation of acquisition-related intangible assetsany actions recommended by the Business Review Committee and the Board have impacted and may continue to impact our business, financial position and results of operations during the remainder of fiscal 2024 and beyond. We have incurred, and may incur additional legal, consulting and other expenses related to the Cooperation Agreement and the activities of the Business Review Committee.
| | | | | | | | |
| | |
6 | Cardinal Health | Q2Fiscal 2024 Form 10-Q | |
| | | | | | | | |
| MD&A | Results of Operations | |
Results of Operations
Revenue
| | | | | | | | | | | | | | | | | | | | | | | | | | | | | | | | | | | |
| Three Months Ended December 31, | | Six Months Ended December 31, |
| (in millions) | 2023 | | 2022 | | Change | | 2023 | | 2022 | | Change |
| Pharmaceutical | $ | 53,520 | | | $ | 47,673 | | | 12 | % | | $ | 104,526 | | | $ | 93,501 | | | 12 | % |
| Medical | 3,928 | | | 3,797 | | | 3 | % | | 7,688 | | | 7,575 | | | 1 | % |
| Total segment revenue | 57,448 | | | 51,470 | | | 12 | % | | 112,214 | | | 101,076 | | | 11 | % |
| Corporate | (3) | | | (1) | | | N.M. | | (6) | | | (4) | | | N.M. |
| Total revenue | $ | 57,445 | | | $ | 51,469 | | | 12 | % | | $ | 112,208 | | | $ | 101,072 | | | 11 | % |
Pharmaceutical Segment
Pharmaceutical segment revenue increased during the three and six months ended December 31, 2017 were largely2023 due to branded and specialty pharmaceutical sales growth, largely from existing customers, which increased revenue by $5.8 billion and $10.9 billion, respectively.
Medical Segment
Medical segment revenue increased during the Patient Recovery Business acquisition.
three and six months ended December 31, 2023, primarily due to sales growth in at-Home Solutions and in products and distribution. The increase in products and distribution was primarily driven by higher Cardinal Health brand volumes and the effect of price increases to mitigate inflationary impacts partially offset by the adverse impact of personal protective equipment ("PPE") volumes and pricing.Cost of Products Sold
Transaction and integration costs associated with the Patient Recovery Business acquisition were $24 million and $61 millionCost of products sold for the three and six months ended December 31, 2017, respectively.2023 increased 12 percent to $55.6 billion and $108.6 billion, respectively, compared to the prior-year periods due to the factors affecting the changes in revenue and gross margin.
Impairments
| | | | | | | | |
| | |
7 | Cardinal Health | Q2Fiscal 2024 Form 10-Q | |
| | | | | | | | |
| MD&A | Results of Operations | |
Gross Margin
| | | | | | | | | | | | | | | | | | | | | | | | | | | | | | | | | | | |
| Three Months Ended December 31, | | Six Months Ended December 31, |
| (in millions) | 2023 | | 2022 | | Change | | 2023 | | 2022 | | Change |
| Gross margin | $ | 1,846 | | | $ | 1,663 | | | 11 | % | | $ | 3,614 | | | $ | 3,277 | | | 10 | % |
| | | | | | | | | | | |
Gross margin increased during the three and (gain)/losssix months ended December 31, 2023 primarily due to the beneficial comparison to the prior-year net inflationary impacts in the Medical segment, the performance of our generics program in the Pharmaceutical segment and increased contribution from branded pharmaceutical and specialty pharmaceutical products, which includes the favorable impact from COVID-19 vaccine distribution.
Gross margin rate declined 2 basis points during both the three and six months ended December 31, 2023, with the impact of unfavorable changes in overall product mix mostly offset by the beneficial comparison to the prior-year net inflationary impacts in the Medical segment and the performance of our generics program in the Pharmaceutical segment. The changes in overall product mix were primarily driven by increased pharmaceutical distribution branded sales, which have a dilutive impact on disposal of assets, netour overall gross margin rate.
Distribution, Selling, General and Administrative ("SG&A") Expenses
| | | | | | | | | | | | | | | | | | | | | | | | | | | | | | | | | | | |
| Three Months Ended December 31, | | Six Months Ended December 31, |
| (in millions) | 2023 | | 2022 | | Change | | 2023 | | 2022 | | Change |
| SG&A expenses | $ | 1,283 | | | $ | 1,191 | | | 8 | % | | $ | 2,480 | | | $ | 2,388 | | | 4 | % |
During the three and six months ended December 31, 2017 we recognized a $67 million write-down2023, SG&A expenses increased primarily due to higher costs to support sales growth, expenses related to investment projects and compensation-related costs.
| | | | | | | | |
| | |
8 | Cardinal Health | Q2Fiscal 2024 Form 10-Q | |
| | | | | | | | |
| MD&A | Results of Operations | |
Segment Profit
We evaluate segment performance based on segment profit, among other measures. See Note 12 of the assets held"Notes to Condensed Consolidated Financial Statements" for sale from the divestiture of our China distribution business.additional information on segment profit. Litigation (Recoveries)/Charges, Net

The increases in litigation charges | | | | | | | | | | | | | | | | | | | | | | | | | | | | | | | | | | | |
| Three Months Ended December 31, | | Six Months Ended December 31, |
| (in millions) | 2023 | | 2022 | | Change | | 2023 | | 2022 | | Change |
| Pharmaceutical | $ | 518 | | | $ | 464 | | | 12 | % | | $ | 1,025 | | | $ | 895 | | | 15 | % |
| Medical | 71 | | | 17 | | | N.M | | 142 | | | 9 | | | N.M |
| Total segment profit | 589 | | | 481 | | | 22 | % | | 1,167 | | | 904 | | | 29 | % |
| Corporate | (107) | | | (600) | | | N.M. | | (699) | | | (886) | | | N.M. |
| Total consolidated operating earnings/(loss) | $ | 482 | | | $ | (119) | | | N.M. | | $ | 468 | | | $ | 18 | | | N.M. |
Pharmaceutical Segment Profit
Pharmaceutical segment profit increased during the three and six months ended December 31, 2017 were due to an increase in estimated losses and legal defense costs associated with inferior vena cava (IVC) filter product liability claims.
Earnings Before Income Taxes
In addition to the items discussed above, earnings before income taxes were impacted by the following:
|
| | | | | | | | | | | | | | | | | | | | | |
| | Three Months Ended December 31, | | Six Months Ended December 31, |
| (in millions) | 2017 | | 2016 | | Change | | 2017 | | 2016 | | Change |
| Other (income)/expense, net | $ | (5 | ) | | $ | 7 |
| | N.M. |
| | $ | (4 | ) | | $ | 3 |
| | N.M. |
|
| Interest expense, net | $ | 87 |
| | $ | 44 |
| | 96 | % | | $ | 168 |
| | $ | 88 |
| | 91 | % |
| Loss on extinguishment of debt | $ | — |
| | $ | — |
| | N.M. |
| | $ | 2 |
| | $ | — |
| | N.M. |
|
Interest expense, net
The increases in interest expense during the three and six months ended December 31, 2017 was2023 primarily due to increased debt issued in June 2017 to fund a portion of the purchase price of the Patient Recovery Business acquisition.
Provision for/(Benefit from) Income Taxes
During the three months ended December 31, 2017 and 2016, the effective tax rate was (231.9) percent and 34.0 percent, respectively. During the six months ended December 31, 2017 and 2016, the effective tax rate was (136.6) percent and 35.6 percent, respectively. The change in the effective tax rate for the three and six months ended December 31, 2017 compared to the prior periods is due to the net benefit from enactment of the Tax Act.
The net benefit from the Tax Act during the three and six months ended December 31, 2017 includes a provisional net tax benefit of $935 million related to the remeasurementperformance of our deferred tax assetsgenerics program and
liabilities increased contribution from branded pharmaceutical and specialty pharmaceutical products, which includes the favorable impact from COVID-19 vaccine distribution, partially offset by higher costs to the new federal statutory rate, the benefit from the impact of applying a lower federal tax rate to our year-to-date U.S. pre-tax earnings and a provisional tax expense of $41 million for the one-time repatriation tax applied to our undistributed foreign earnings.support sales growth.
Our effective tax rate also includes $57 million of tax expense recognized in connection with the sale of our China distribution business.
|
| | |
9
| Cardinal Health | Q2Fiscal 2018 Form 10-Q
| |
|
| | |
MD&A | Liquidity and Capital Resources | |
Liquidity and Capital Resources
We currently believe that, based on available capital resources (cash on hand and committed credit facilities) and projected operating cash flow, we have adequate capital resources to fund working capital needs; currently anticipated capital expenditures; currently anticipated business growth and expansion; contractual obligations; tax payments; and current and projected debt service requirements, dividends and share repurchases. If we decide to engage in one or more acquisitions, depending on the size and timing of such transactions, we may need to access capital markets for additional financing.
Cash and Equivalents
Our cash and equivalents balance was $1.2$4.6 billion at December 31, 20172023 compared to $6.9$4.0 billion at June 30, 2017. At 2023. During the six months ended December 31, 20172023, net cash provided by operating activities was $1.7 billion, which includes the impact of our annual payment of $378 million related to the agreement to settle the vast majority of the opioid lawsuits filed by states and local governmental entities (the "National Opioid Settlement Agreement"). In addition, during the six months ended December 31, 2023, we deployed $750 million for share repurchases, $255 million for cash dividends and $206 million for capital expenditures.
| | | | | | | | |
| | |
4 | Cardinal Health | Q2Fiscal 2024 Form 10-Q | |
Significant Developments in Fiscal 2024 and Trends
Operating and Segment Reporting Structure Changes
In January 2024, we announced a change in our organizational structure and have re-aligned our reporting structure under two reportable segments, effective January 1, 2024: Pharmaceutical and Specialty Solutions segment and Global Medical Products and Distribution segment. All remaining operating segments that are not significant enough to require separate reportable segment disclosures are included in Other. Results in this Form 10-Q are reported under our prior organizational and reporting structure. The following indicates the changes from the second quarter of fiscal 2024 to the new reporting structure, which will be reported for the first time in the third quarter of fiscal 2024:
•Pharmaceutical and Specialty Solutions segment: This reportable segment will be comprised of all businesses formerly within our Pharmaceutical segment except Nuclear and Precision Health Solutions.
•Global Medical Products and Distribution segment: This reportable segment will be comprised of all businesses formerly within our Medical segment except at-Home Solutions and OptiFreight Logistics.
•Other: This will consist of the remaining operating segments, Nuclear and Precision Health Solutions, at-Home Solutions and OptiFreight Logistics.
Specialty Networks Acquisition
On January 31, 2024, we announced that we had entered into a definitive agreement to acquire Specialty Networks, a technology-enabled multi-specialty group purchasing and practice enhancement organization for a purchase price of $1.2 billion in cash, subject to certain adjustments. Specialty Networks creates clinical and economic value for independent specialty providers and partners across multiple specialty GPOs: UroGPO, Gastrologix and GastroGPO, and United Rheumatology. The acquisition will further expand our offering in key therapeutic areas by enhancing our downstream provider-focused analytics capabilities and service offerings and by accelerating our upstream data and research opportunities with biopharma manufacturers.
This transaction is subject to the satisfaction of customary closing conditions, including receipt of required regulatory approvals. We plan to fund the acquisition with available cash.
COVID-19 Vaccine Distribution
Pharmaceutical segment profit was favorably impacted during the three and six months ended December 31, 2023 on a year-over-year basis in part due to the company beginning to distribute the recently commercially available COVID-19 vaccines following U.S. Food and Drug Administration approval of updated vaccines in September 2023. The timing, magnitude and profit impact of vaccine distribution volume for the remainder of fiscal 2024 and beyond remains uncertain.
Generics Program
The performance of our Pharmaceutical segment generics program positively impacted the year-over-year comparison of Pharmaceutical segment profit during the three and six months ended December 31, 2023. The Pharmaceutical segment generics program includes, among other things, the impact of generic pharmaceutical product launches, customer volumes, pricing changes, the Red Oak Sourcing, LLC venture ("Red Oak Sourcing") with CVS Health Corporation ("CVS Health") and generic pharmaceutical contract manufacturing and sourcing costs.
The frequency, timing, magnitude and profit impact of generic pharmaceutical customer volumes, pricing changes, customer contract renewals, generic pharmaceutical manufacturer pricing changes and generic pharmaceutical contract manufacturing and sourcing costs all impact Pharmaceutical segment profit and are subject to risks and uncertainties. These risks and uncertainties may impact Pharmaceutical segment profit and consolidated operating earnings during the remainder of fiscal 2024.
Medical SegmentInflationary Impacts Beginning in fiscal 2022, Medical segment profit was negatively affected by incremental inflationary impacts, primarily related to transportation (including ocean and domestic freight), commodities and labor, and global supply chain constraints. Since that time, we have taken actions to partially mitigate these impacts, including implementing certain price increases and evolving our pricing and
| | | | | | | | |
| | |
5 | Cardinal Health | Q2Fiscal 2024 Form 10-Q | |
commercial contracting processes to provide us with greater pricing flexibility. In addition, decreases in some product-related costs have been recognized as the higher-cost inventory moved through our supply chain and was replaced by lower-cost inventory. These net inflationary impacts negatively affected Medical segment profit during fiscal 2023. The net inflationary impacts were less significant during the three and six months ended December 31, 2023 and had a favorable impact on Medical segment profit on a year-over-year basis.
We expect these net inflationary impacts to continue to affect Medical segment profit during the remainder of fiscal 2024, but to a significantly lesser extent than in fiscal 2023 and prior periods, due to our mitigation actions, together with continued decreases in certain product-related costs. However, these inflationary costs are difficult to predict and may be greater than we expect or continue longer than our current expectations. Our actions to increase prices and evolve our contracting strategies are subject to contingencies and uncertainties and it is possible that our results of operations will be adversely impacted to a greater extent than we currently anticipate or that we may not be able to mitigate the negative impact to the extent or on the timeline we anticipate.
Volumes within Products and Distribution
Medical segment profit was adversely impacted during fiscal 2023 in part due to lower volumes within products and distribution, which includes our Cardinal Health branded medical products. We expect Cardinal Health branded medical products sales growth in fiscal 2024 and beyond. The timing, magnitude and profit impact of this anticipated sales growth is subject to risks and uncertainties, which may impact Medical segment profit.
Medical Segment Goodwill
The change in segment structure as discussed above will result in changes to the composition of our reporting units. Accordingly, we will be required to reallocate the goodwill in reporting units affected by the change using a relative fair value approach and assess goodwill for impairment both before and after the reallocation. While we have not identified any indicators of impairment during the three months ended December 31, 2023 within the current reporting units, we may recognize a goodwill impairment charge following the reallocation if the carrying value of a new reporting unit exceeds its estimated fair value.
During the three months ended September 30, 2023, we performed interim goodwill impairment testing for the Medical operating segment (excluding our Cardinal Health at-Home Solutions division) ("Medical Unit") due to an increase in the risk-free interest rate. This testing resulted in a pre-tax charge of $581 million which was included in impairments and (gain)/loss on disposal of assets, net in our condensed consolidated statements of earnings/(loss). See "Critical Accounting Policies and Sensitive Accounting Estimates" section of this MD&A and Note 4 of the "Notes to Condensed Consolidated Financial Statements" for additional detail. Adverse changes in key assumptions or a significant change in industry or economic trends during the remainder of fiscal 2024 and beyond could result in additional goodwill impairments. Shareholder Cooperation Agreement In September 2022, we entered into a Cooperation Agreement (the "Cooperation Agreement") with Elliott Associates, L.P. and Elliott International, L.P. (together, "Elliott") under which our Board of Directors (the "Board"), among other things, (1) appointed four new independent directors, including a representative from Elliott, and (2) formed an advisory Business Review Committee of the Board, which is tasked with undertaking a comprehensive review of our strategy, portfolio, capital-allocation framework and operations. In May 2023, we extended the term of the Cooperation Agreement until the later of July 15, 2024 or until Elliott's representative ceases to serve on, or resigns from, the Board. In connection with this extension, the Board has extended the term of the Business Review Committee until July 15, 2024.
The evaluation and implementation of any actions recommended by the Business Review Committee and the Board have impacted and may continue to impact our business, financial position and results of operations during the remainder of fiscal 2024 and beyond. We have incurred, and may incur additional legal, consulting and other expenses related to the Cooperation Agreement and the activities of the Business Review Committee.
| | | | | | | | |
| | |
6 | Cardinal Health | Q2Fiscal 2024 Form 10-Q | |
| | | | | | | | |
| MD&A | Results of Operations | |
Results of Operations
Revenue
| | | | | | | | | | | | | | | | | | | | | | | | | | | | | | | | | | | |
| Three Months Ended December 31, | | Six Months Ended December 31, |
| (in millions) | 2023 | | 2022 | | Change | | 2023 | | 2022 | | Change |
| Pharmaceutical | $ | 53,520 | | | $ | 47,673 | | | 12 | % | | $ | 104,526 | | | $ | 93,501 | | | 12 | % |
| Medical | 3,928 | | | 3,797 | | | 3 | % | | 7,688 | | | 7,575 | | | 1 | % |
| Total segment revenue | 57,448 | | | 51,470 | | | 12 | % | | 112,214 | | | 101,076 | | | 11 | % |
| Corporate | (3) | | | (1) | | | N.M. | | (6) | | | (4) | | | N.M. |
| Total revenue | $ | 57,445 | | | $ | 51,469 | | | 12 | % | | $ | 112,208 | | | $ | 101,072 | | | 11 | % |
Pharmaceutical Segment
Pharmaceutical segment revenue increased during the three and six months ended December 31, 2023 due to branded and specialty pharmaceutical sales growth, largely from existing customers, which increased revenue by $5.8 billion and $10.9 billion, respectively.
Medical Segment
Medical segment revenue increased during the three and six months ended December 31, 2023, primarily due to sales growth in at-Home Solutions and in products and distribution. The increase in products and distribution was primarily driven by higher Cardinal Health brand volumes and the effect of price increases to mitigate inflationary impacts partially offset by the adverse impact of personal protective equipment ("PPE") volumes and pricing.
Cost of Products Sold
Cost of products sold for the three and six months ended December 31, 2023 increased 12 percent to $55.6 billion and $108.6 billion, respectively, compared to the prior-year periods due to the factors affecting the changes in revenue and gross margin.
| | | | | | | | |
| | |
7 | Cardinal Health | Q2Fiscal 2024 Form 10-Q | |
| | | | | | | | |
| MD&A | Results of Operations | |
Gross Margin
| | | | | | | | | | | | | | | | | | | | | | | | | | | | | | | | | | | |
| Three Months Ended December 31, | | Six Months Ended December 31, |
| (in millions) | 2023 | | 2022 | | Change | | 2023 | | 2022 | | Change |
| Gross margin | $ | 1,846 | | | $ | 1,663 | | | 11 | % | | $ | 3,614 | | | $ | 3,277 | | | 10 | % |
| | | | | | | | | | | |
Gross margin increased during the three and six months ended December 31, 2023 primarily due to the beneficial comparison to the prior-year net inflationary impacts in the Medical segment, the performance of our generics program in the Pharmaceutical segment and increased contribution from branded pharmaceutical and specialty pharmaceutical products, which includes the favorable impact from COVID-19 vaccine distribution.
Gross margin rate declined 2 basis points during both the three and six months ended December 31, 2023, with the impact of unfavorable changes in overall product mix mostly offset by the beneficial comparison to the prior-year net inflationary impacts in the Medical segment and the performance of our generics program in the Pharmaceutical segment. The changes in overall product mix were primarily driven by increased pharmaceutical distribution branded sales, which have a dilutive impact on our overall gross margin rate.
Distribution, Selling, General and Administrative ("SG&A") Expenses
| | | | | | | | | | | | | | | | | | | | | | | | | | | | | | | | | | | |
| Three Months Ended December 31, | | Six Months Ended December 31, |
| (in millions) | 2023 | | 2022 | | Change | | 2023 | | 2022 | | Change |
| SG&A expenses | $ | 1,283 | | | $ | 1,191 | | | 8 | % | | $ | 2,480 | | | $ | 2,388 | | | 4 | % |
During the three and six months ended December 31, 2023, SG&A expenses increased primarily due to higher costs to support sales growth, expenses related to investment projects and compensation-related costs.
| | | | | | | | |
| | |
8 | Cardinal Health | Q2Fiscal 2024 Form 10-Q | |
| | | | | | | | |
| MD&A | Results of Operations | |
Segment Profit
We evaluate segment performance based on segment profit, among other measures. See Note 12 of the "Notes to Condensed Consolidated Financial Statements" for additional information on segment profit. | | | | | | | | | | | | | | | | | | | | | | | | | | | | | | | | | | | |
| Three Months Ended December 31, | | Six Months Ended December 31, |
| (in millions) | 2023 | | 2022 | | Change | | 2023 | | 2022 | | Change |
| Pharmaceutical | $ | 518 | | | $ | 464 | | | 12 | % | | $ | 1,025 | | | $ | 895 | | | 15 | % |
| Medical | 71 | | | 17 | | | N.M | | 142 | | | 9 | | | N.M |
| Total segment profit | 589 | | | 481 | | | 22 | % | | 1,167 | | | 904 | | | 29 | % |
| Corporate | (107) | | | (600) | | | N.M. | | (699) | | | (886) | | | N.M. |
| Total consolidated operating earnings/(loss) | $ | 482 | | | $ | (119) | | | N.M. | | $ | 468 | | | $ | 18 | | | N.M. |
Pharmaceutical Segment Profit
Pharmaceutical segment profit increased during the three and six months ended December 31, 2023 primarily due to the performance of our generics program and increased contribution from branded pharmaceutical and specialty pharmaceutical products, which includes the favorable impact from COVID-19 vaccine distribution, partially offset by higher costs to support sales growth.
Medical Segment Profit
Medical segment profit increased during the three and six months ended December 31, 2023 due to the beneficial comparison to the prior-year net inflationary impacts, including the effects of mitigation actions.
Corporate
The changes in Corporate during the three and six months ended December 31, 2023 were due to the factors discussed in the "Other Components of Consolidated Operating Earnings/(Loss)" section that follows.
| | | | | | | | |
| | |
9 | Cardinal Health | Q2Fiscal 2024 Form 10-Q | |
| | | | | | | | |
| MD&A | Results of Operations | |
Other Components of Consolidated Operating Earnings/(Loss)
In addition to revenue, gross margin and SG&A expenses discussed previously, consolidated operating earnings/(loss) were impacted by the following:
| | | | | | | | | | | | | | | | | | | | | | | |
| Three Months Ended December 31, | | Six Months Ended December 31, |
| (in millions) | 2023 | | 2022 | | 2023 | | 2022 |
| Restructuring and employee severance | $ | 28 | | | $ | 17 | | | $ | 53 | | | $ | 46 | |
| Amortization and other acquisition-related costs | 63 | | | 71 | | | 127 | | | 142 | |
| Impairments and (gain)/loss on disposal of assets, net | 1 | | | 710 | | | 538 | | | 863 | |
| Litigation (recoveries)/charges, net | (11) | | | (207) | | | (52) | | | (180) | |
Restructuring and Employee Severance
Restructuring and employee severance costs during the three and six months ended December 31, 2023 were primarily related to certain projects resulting from reviews of our strategy, portfolio, capital-allocation framework and operations and the implementation of certain enterprise-wide cost-savings measures. During the three and six months ended December 31, 2022, costs were primarily related to the implementation of certain enterprise-wide cost-savings measures.
Amortization and Other Acquisition-Related Costs
Amortization of acquisition-related intangible assets was $63 million and $71 million for the three months ended December 31, 2023 and 2022, respectively, and $127 million and $142 million for the six months ended December 31, 2023 and 2022, respectively.
Impairments and (Gain)/Loss on Disposal of Assets, Net
We recognized $581 million of pre-tax non-cash goodwill impairment charges related to our Medical segment during the six months ended December 31, 2023, and $709 million and $863 million during the three and six months ended December 31, 2022, respectively, as discussed further in the "Critical Accounting Policies and Sensitive Accounting Estimates" section of this MD&A and Note 4 of the "Notes to Condensed Consolidated Financial Statements." Litigation (Recoveries)/Charges, Net
We recognized income for net recoveries in class action antitrust lawsuits in which we were a class member or plaintiff of $31 million and $71 million during the three and six months ended December 31, 2023, respectively, and $66 million during the three and six months ended December 31, 2022.
During the three and six months ended December 31, 2023, we recognized a $22 million charge related to an agreement in principle with the Alabama Attorney General, under which we would pay approximately $123 million to the State of Alabama over a period of ten years to resolve opioid-related claims brought by the State and its political subdivisions. See Note 6 of the "Notes to Condensed Consolidated Financial Statements" for additional information. We recognized income of $46 million and $25 million during the three and six months ended December 31, 2022, respectively, primarily related to a reduction of the reserve for the estimated settlement and defense costs for the Cordis OptEase and TrapEase inferior vena cava ("IVC") product liability due to the execution of certain settlement agreements.
During the three and six months ended December 31, 2022, we recognized income of $93 million due to net proceeds from the settlement of a shareholder derivative litigation matter.
Earnings/(Loss) Before Income Taxes
In addition to the items discussed above, earnings/(loss) before income taxes were impacted by the following:
| | | | | | | | | | | | | | | | | | | | | | | | | | | | | | | | | | | |
| Three Months Ended December 31, | | Six Months Ended December 31, |
| (in millions) | 2023 | | 2022 | | Change | | 2023 | | 2022 | | Change |
| Other (income)/expense, net | $ | (16) | | | $ | (7) | | | N.M. | | $ | (18) | | | $ | (5) | | | N.M. |
| Interest expense, net | 8 | | | 25 | | | (68) | % | | 22 | | | 50 | | | (56) | % |
| | | | | | | | | | | |
| | | | | | | | | | | |
Interest Expense, Net
During the three and six months ended December 31, 2023, interest expense decreased by 68 percent and 56 percent, respectively, primarily due to increased interest income from cash and equivalents.
| | | | | | | | |
| | |
10 | Cardinal Health | Q2Fiscal 2024 Form 10-Q | |
| | | | | | | | |
| MD&A | Results of Operations | |
Provision for Income Taxes
The effective tax rate was 27.7 percent and 5.4 percent during the three months ended December 31, 2023 and 2022, respectively, and 22.4 percent and 30.0 percent during the six months ended December 31, 2023 and 2022, respectively. These tax rates reflect the impact of the tax effects of goodwill impairment charges as well as certain other discrete items. See Note 7 of the "Notes to Condensed Consolidated Financial Statements" for additional information, during the three and six months ended December 31, 2023 and 2022. Tax Effects of Goodwill Impairment Charges
During the six months ended December 31, 2023, we recognized cumulative pre-tax goodwill impairment charges of $581 million related to the Medical Unit. The net tax benefit related to these charges is $45 million for fiscal 2024.
Unless an item is considered discrete because it is unusual or infrequent, the tax impact of the item is included in our estimated annual effective tax rate. When items are recognized through our estimated annual effective tax rate, we apply our estimated annual effective tax rate to the earnings/(loss) before income taxes for the year-to-date period to compute our impact from income taxes for the current quarter and year-to-date period. The tax impacts of discrete items are recognized in their entirety in the period in which they occur.
The tax effect of the goodwill impairment charges recorded during the six months ended December 31, 2023 was included in our estimated annual effective tax rate because it was not considered unusual or infrequent, given that we recorded goodwill impairments in prior fiscal years. The impact of the non-deductible goodwill increased the estimated annual effective tax rate for fiscal 2024. Applying the higher tax rate to the pre-tax income for the six months ended December 31, 2023 resulted in recognizing an incremental interim tax benefit of approximately $65 million which impacted the provision for income taxes in the condensed consolidated statements of earnings/(loss) during the three months ended December 31, 2023 and prepaid expenses and other assets in the condensed consolidated balance sheet at December 31, 2023. The incremental interim tax benefit will reverse in the future quarters of fiscal 2024.
| | | | | | | | |
| | |
11 | Cardinal Health | Q2Fiscal 2024 Form 10-Q | |
| | | | | | | | |
| MD&A | Liquidity and Capital Resources | |
Liquidity and Capital Resources
We currently believe that, based on available capital resources and projected operating cash flow, we have adequate capital resources to fund our operations and expected future cash needs as described below. If we decide to engage in one or more acquisitions in addition to the acquisition of Specialty Networks, depending on the size and timing of such transactions, we may need to access capital markets for additional financing.
Cash and Equivalents
Our cash and equivalents balance was $4.6 billion at December 31, 2023 compared to $4.0 billion at June 30, 2023.
During the six months ended December 31, 2023, net cash provided by operating activities was $1.7 billion, which includes the impact of our annual payment of $378 million related to the National Opioid Settlement Agreement. In addition, we deployed cash of $750 million for share repurchases, $255 million for cash dividends and $206 million for capital expenditures.
At December 31, 2023, our cash and equivalents were held in cash depository accounts with major banks or invested in high quality, short-term liquid investments.
During the six months ended December 31, 2017, we deployed $6.1 billion for acquisitions, net of cash acquired, $403 million to redeem our 1.7% notes due 2018, $296 million for cash dividends, $168 million for capital expenditures and $150 million on share repurchases; net cash provided by operating activities was $1.5 billion, driven primarily by net earnings. Additionally, we had $151 million outstanding under our commercial paper program as of December 31, 2017. The $802 million increase in net cash provided by operating activities during the six months ended December 31, 2017 compared to the prior-year period was primarily due to changes in working capital.
The cash and equivalents balance at December 31, 2017 included $538 million of cash held by subsidiaries outside of the United States.
As a result of the Tax Act, we have recognized a provisional amount of $41 million for the one-time U.S. repatriation tax on undistributed earnings of foreign subsidiaries. Though these foreign earnings have been deemed to be repatriated from a U.S. federal tax perspective, we have not yet completed our assessment of the Tax Act on our plans to reinvest foreign earnings and as such have not changed our prior conclusion that the earnings are indefinitely reinvested. As such, no non-U.S. taxes were recorded at December 31, 2017. If we decide to repatriate these earnings in the future, we may be subject to certain non-U.S. taxes at that time. See Note 8 of the "Notes to Condensed Consolidated Financial Statements" for additional information on the Tax Act.Changes in working capital, which impact operating cash flow, can vary significantly depending on factors such as the timing of
customer payments, inventory purchases, and payments to vendors and tax payments in the regular course of business, as well as fluctuating working capital needs driven by customer and product mix.
The cash and equivalents balance at December 31, 2023 includes $670 million of cash held by subsidiaries outside of the United States.
Other Financing Arrangements and Financial Instruments
Credit Facilities and Commercial Paper
In addition to cash and equivalents and operating cash flow, other sources of liquidity at December 31, 2023 include a $2.0 billion commercial paper program, which is backed by a $2.0 billion revolving credit facility, andfacility. We also have a $1.0 billion committed receivables sales facility program.
facility. At December 31, 2017,2023, we had $151 millionno amounts outstanding under our commercial paper program, and no amounts outstanding under the revolving credit facility, or theour committed receivables sales facility.
In February 2023, we extended our $2.0 billion revolving credit facility through February 25, 2028. In September 2022, we renewed our committed receivables sales facility program. During the six months ended December 31, 2017, we had maximum amounts outstandingprogram through Cardinal Health Funding, LLC ("CHF") through September 30, 2025. In September 2023, Cardinal Health 23 Funding, LLC was added as a seller under our commercial paper and
committed receivables programs of $1.3 billion and an average daily amount outstanding of $381 million.sales facility.
Our revolving credit facility and committed receivables sales facility programsfacilities require us to maintain as of the end of any calendar quarter, a consolidated net leverage ratio of no more than 4.25-to-1, which will reduce to 3.25-to-1 in March 2019. The ratio temporarily increased as result of our acquisition of the Patient Recovery Business.3.75-to-1. As of December 31, 2017,2023, we were in compliance with this financial covenant.
Long-Term Debt and Other Short-Term Borrowings
We had total long-term obligations, including the current portion and other short-term borrowings, of $4.7 billion at both December 31, 2023 and June 30, 2023.
| | | | | | | | |
| | |
12 | Cardinal Health |Q2Fiscal 20182024 Form 10-Q | | 10
| | | | | | | | |
| MD&A | | |
MD&A | Liquidity and Capital Resources | |
Capital Deployment
Opioid Litigation Settlement Agreement
We had $5.47 billion accrued at December 31, 2023 related to certain opioid litigation, as further described within Note 6 of the "Notes to Condensed Consolidated Financial Statements." We expect the majority of the remaining payment amounts to occur through 2038. During the six months ended December 31, 2023, we made our third annual payment of $378 million under the National Opioid Settlement Agreement. The amounts of these future payments may differ from the payments that we have already made. In January 2024, we made payments of approximately $238 million to prepay at a pre-negotiated discount certain future payment amounts totaling approximately $344 million owed under each of the National Opioid Settlement Agreement, West Virginia Subdivisions Settlement Agreement and settlement agreements with Native American tribes and Cherokee Nation. The majority of the prepayment relates to the seventh annual payment as due under the National Opioid Settlement Agreement. As a result of these prepayments, we expect to recognize income of approximately $100 million in litigation charges/(recoveries), net in our condensed consolidated statements of earnings/(loss) during the three months ended March 31, 2024.
Capital Expenditures
Capital expenditures during the six months ended December 31, 20172023 and 20162022 were $168$206 million and $213$155 million, respectively.
Dividends
On each of May 11, 2023, August 9, 2023, and November 8, 2017,14, 2023, our Board of Directors approved a quarterly dividend of $0.4624$0.5006 per share, or $1.85$2.00 per share on an annualized basis, which waswere paid on July 15, 2023, October 15, 2023, and January 15, 20182024 to shareholders of record on July 3, 2023, October 3, 2023, and January 2, 2018.2024, respectively.
Share Repurchases
During the six months ended December 31, 2017,2023, we repurchased $150deployed $750 million for repurchases of our common shares.shares, in the aggregate, under accelerated share repurchase ("ASR") programs. We funded the repurchasesASR programs with available cash and short term borrowings. Atcash. See Note 10 of the "Notes to Condensed Consolidated Financial Statements" for additional information. As of December 31, 2017,2023, we had $293 millionhave $3.5 billion remaining under our existing share repurchase program. On February 7, 2018, our Board of Directors approved a new $1.0 billion share repurchase program that expires on December 31, 2020.
authorization.Funding forSpecialty Networks Acquisition of Patient Recovery Business
On July 29, 2017,January 31, 2024, we acquired the Patient Recovery Business from Medtronic plcannounced that we had entered into a definitive agreement to acquire Specialty Networks, a technology-enabled multi-specialty group purchasing and practice enhancement organization for $6.1a purchase price of $1.2 billion in cash.cash, subject to certain adjustments. We fundedplan to fund the acquisition through $4.5 billion in new long-term debt issued in June 2017, the use of existing cash and borrowings under existing credit arrangements.
China Distribution Business Divestiture
On February 1, 2018, we completed the divestiture of our China distribution business to Shanghai Pharmaceuticals Holding Co., Ltd. for gross proceeds of $1.2 billion. The net proceeds are approximately $800 million after adjusting for third-party indebtedness, taxes, and other transaction expenses and adjustments.with available cash.
| | | | | | | | |
| | |
1113
| Cardinal Health | Q2Fiscal 20182024 Form 10-Q | |
Other Items
The MD&A in our 20172023 Form 10-K addresses our contractual obligations critical accounting policies and sensitive accounting estimates and off-balance sheet arrangements,cash requirements, as of and for the fiscal year ended June 30, 2017. There2023. Other than in connection with our proposed acquisition of Specialty Networks, there have been no subsequent material changes outside of the ordinary course of business to those items, exceptitems. See Note 14 of the "Notes to Condensed Consolidated Financial Statements" for additional information.
Critical Accounting Policies and Sensitive Accounting Estimates
The discussion and analysis presented below is a supplemental disclosure to the critical accounting policies and sensitive accounting estimates relatedspecified in our consolidated balance sheet at June 30, 2023. This discussion and analysis should be read in conjunction with the Critical Accounting Policies and Sensitive Accounting Estimates included in our 2023 Form 10-K and our Form 10-Q for the quarters ended September 30, 2023.
Critical accounting policies are those accounting policies that (i) can have a significant impact on our financial condition and results of operations and (ii) require the use of complex and subjective estimates based upon past experience and management’s judgment. Other people applying reasonable judgment to the assets heldsame facts and circumstances could develop different estimates. Because estimates are inherently uncertain, actual results may differ, including due to the risks discussed in "Risk Factors" and other risks discussed in our 2023 Form 10-K and our other filings with the SEC since June 30, 2023.
Goodwill
Purchased goodwill is tested for sale classificationimpairment annually or when indicators of impairment exist. Goodwill impairment testing involves a comparison of the China distribution businessestimated fair value of reporting units to the respective carrying amount, which may be performed utilizing either a qualitative or quantitative assessment. Qualitative factors are first assessed to determine if it is more likely than not that the fair value of a reporting unit is less than its carrying amount. If it is determined that it is more likely than not that the fair value does not exceed the carrying amount, then a quantitative test is performed. The quantitative goodwill impairment test involves a comparison of the estimated fair value of the reporting unit to the respective carrying amount. A reporting unit is defined as an operating segment or one level below an operating segment (also known as a component).
Our reporting units are: Pharmaceutical operating segment (excluding our Nuclear and Precision Health Solutions division); Nuclear and Precision Health Solutions division; Medical operating segment (excluding our Cardinal Health at-Home Solutions division) (“Medical Unit”); and Cardinal Health at-Home Solutions division.
Goodwill impairment testing involves judgment, including the accounting effects resulting fromidentification of reporting units, qualitative evaluation of events and circumstances to determine if it is more likely than not that an impairment exists, and, if necessary, the Tax Act asestimation of the fair value of the applicable reporting unit. Our qualitative evaluation considers the weight of evidence and significance of all identified events and circumstances and most relevant drivers of fair value, both positive and negative, in determining whether it is more likely than not that the fair value of a reporting unit is less than its carrying amount.
Changes to Reportable Segments for Fiscal 2024
As discussed further in the Overview section of this MD&A, effective January 1, 2024, we implemented a new enterprise operating and segment reporting structure. The updated structure comprises two reportable segments: Pharmaceutical and Specialty Solutions segment and Global Medical Products and Distribution segment. All remaining operating segments that are not significant enough to require separate reportable segment disclosures are included in Other.
This change in segment structure will result in changes to the composition of our reporting units. Accordingly, we will be required to reallocate the goodwill in reporting units affected by the change using a relative fair value approach and assess goodwill for impairment both before, and after the reallocation. While we have not identified any indicators of impairment during the three months ended December 31, 2023 within the current reporting units, we may recognize a goodwill impairment charge following the reallocation if the carrying value of a new reporting unit exceeds its estimated fair value.
Medical Unit Goodwill
Potential changes in the reporting units within our Medical operating segment may result in a goodwill impairment charge. As of December 31, 2023, the total goodwill balance within the Medical Unit was $139 million. As discussed above, we have not identified any indicators of impairment during the three months ended December 31, 2023 within our reporting units, including the Medical Unit.
During the three months ended September 30, 2023, we elected to bypass the qualitative assessment and perform quantitative goodwill impairment testing for the Medical Unit due to an increase
| | | | | | | | |
| | |
14 | Cardinal Health | Q2Fiscal 2024 Form 10-Q | |
in the risk-free interest rate used in the discount rate. Our determination of the estimated fair value of the Medical Unit is based on a combination of the income-based approach (using a discount rate of 11 percent and a terminal growth rate of 2 percent), and market-based approaches. Additionally, we assigned a weighting of 80 percent to the discounted cash flow method, 10 percent to the guideline public company method, and 10 percent to the guideline transaction method. The carrying amount exceeded the fair value, which resulted in a pre-tax impairment charge of $581 million for the Medical Unit, which was recognized during the six months ended December 31, 2023 and is included in impairments and (gain)/loss on disposal of assets, net in our condensed consolidated statements of earnings/(loss). This impairment charge was driven by an increase of 1 percent in the discount rate primarily due to an increase in the risk-free interest rate. The discount rate used for the interim goodwill impairment testing at June 30, 2023 was 10 percent. See Note 4 and Note 8, respectively, of the "Notes to Condensed Consolidated Financial Statements."Statements" for further discussion.
While we consider the assumptions used in our determination of the estimated fair value of the Medical Unit to be reasonable and appropriate, they are complex and subjective, and additional adverse changes in one key assumption or a combination of key assumptions during fiscal 2024 may significantly affect future estimates. These assumptions include, among other things, a failure to meet expected earnings or other financial plans, including the execution of key initiatives related to optimizing and growing sales of Cardinal Health branded medical products, increasing growth in certain strategic divisions within our Medical segment, and driving simplification efforts and cost optimization projects, or unanticipated events and circumstances, such as changes in assumptions about the duration and magnitude of increased supply chain and commodities costs and our planned efforts to mitigate such impact, including price increases or surcharges; further disruptions in the supply chain; manufacturing cost inefficiencies resulting from lower than anticipated sales volume, an increase in the discount rate; a decrease in the terminal growth rate; increases in tax rates; or a significant change in industry or economic trends.
Adverse changes in key assumptions may result in a decline in fair value below the carrying value in the future and therefore, an impairment of our Medical Unit goodwill in future periods, which could adversely affect our results of operations. For example, if we were to increase the discount rate by a hypothetical 0.5 percent, the fair value for the Medical Unit would have further decreased by approximately $450 million. Additionally, a hypothetical 25 basis point decrease in long-term gross margin rates, which could be impacted by changes in Cardinal Health branded medical product sales growth rate assumptions, would have further decreased the fair value for the Medical Unit by approximately $300 million.
During the three months ended December 31, 2022 and September 30, 2022, we performed quantitative goodwill impairment testing for the Medical Unit. This quantitative testing
resulted in the carrying amount of the Medical Unit exceeding the fair value, resulting in pre-tax goodwill impairment charges of $709 million and $154 million recorded during the three months ended December 31, 2022 and September 30, 2022, respectively.
|
| | |
| Cardinal Health | Q2Fiscal 2018 Form 10-Q
| 12 |
| | | | | | | | |
| | |
15 | Cardinal Health | Q2Fiscal 2024 Form 10-Q | |
| | | | | | | | |
| Explanation and Reconciliation of Non-GAAP Financial Measures | | |
Explanation and Reconciliation of Non-GAAP Financial Measures
The "Overview of Consolidated Results" section within MD&A in this Form 10-Q contains financial measures that are not calculated in accordance with GAAP.
In addition to analyzing our business based on financial information prepared in accordance with GAAP, we use these non-GAAP financial measures internally to evaluate our performance, engage in financial and operational planning, and determine incentive compensation because we believe that these measures provide additional perspective on and, in some circumstances are more closely correlated to, the performance of our underlying, ongoing business. We provide these non-GAAP financial measures to investors as supplemental metrics to assist readers in assessing the effects of items and events on our financial and operating results on a year-over-year basis and in comparing our performance to that of our competitors. However, the non-GAAP financial measures that we use may be calculated differently from, and therefore may not be comparable to, similarly titled measures used by other companies. The non-GAAP financial measures disclosed by us should not be considered a substitute for, or superior to, financial measures calculated in accordance with GAAP, and the financial results calculated in accordance with GAAP and reconciliations to those financial statements set forth below should be carefully evaluated.
Exclusions from Non-GAAP Financial Measures
Management believes it is useful to exclude the following items from the non-GAAP measures presented in this Form 10-Qreport for its own and for investors’ assessment of the business for the reasons identified below:
•LIFO charges and credits are excluded because the factors that drive last-in first-out ("LIFO") inventory charges or credits, such as pharmaceutical manufacturer price appreciation or deflation and year-end inventory levels (which can be meaningfully influenced by customer buying behavior immediately preceding our fiscal year-end), are largely out of our control and cannot be accurately predicted. The exclusion of LIFO charges and credits from non-GAAP metrics facilitates comparison of our current financial results to our historical financial results and to our peer group companies’ financial results.
We did not recognize any LIFO charges or credits during the periods presented.•Surgical gown recall costs or income includes inventory write-offs and certain remediation and supply disruption costs, net of related insurance recoveries, arising from the January 2020 recall of select Association for the Advancement of Medical Instrumentation ("AAMI") Level 3 surgical gowns and voluntary field actions (a recall of some packs and a corrective action allowing overlabeling of other packs) for Presource Procedure Packs containing affected gowns. Income from surgical gown recall costs represents insurance recoveries of these certain costs. We have excluded these costs from our non-GAAP metrics to allow investors to better understand the underlying operating results of the business and to facilitate comparison of our current financial results to our historical financial results and to our peer group companies’ financial results.
•State opioid assessments related to prior fiscal years is the portion of state assessments for prescription opioid medications that were sold or distributed in periods prior to the period in which the expense is incurred. This portion is excluded from non-GAAP financial measures because it is retrospectively applied to sales in prior fiscal years and inclusion would obscure analysis of the current fiscal year results of our underlying, ongoing business. Additionally, while states' laws may require us to make payments on an ongoing basis, the portion of the assessment related to sales in prior periods are contemplated to be one-time, nonrecurring items. Income from state opioid assessments related to prior fiscal years represents reversals of accruals due to changes in estimates or when the underlying assessments were invalidated by a Court or reimbursed by manufacturers.
•Shareholder cooperation agreement costs includes costs such as legal, consulting and other expenses incurred in relation to the agreement (the "Cooperation Agreement") entered into among Elliott Associates, L.P., Elliott International, L.P. (together, "Elliott") and Cardinal Health, including costs incurred to negotiate and finalize the Cooperation Agreement and costs incurred by the Business Review Committee of the Board of Directors, which was formed under this Cooperation Agreement. We have excluded these costs from our non-GAAP metrics because they do not occur in or reflect the ordinary course of our ongoing business operations and may obscure analysis of trends and financial performance.
•Restructuring and employee severance costs are excluded because they relate to programs in which we fundamentally change our operations and because they are not part of the ongoing operations of our underlying business.business and include, but are not limited to, costs related to divestitures, closing and consolidating facilities, changing the way we manufacture or distribute our products, moving manufacturing of a product to another location, changes in production or business process outsourcing or insourcing, employee severance and realigning operations.
| | | | | | | | |
| | |
16 | Cardinal Health | Q2Fiscal 2024 Form 10-Q | |
| | | | | | | | |
| Explanation and Reconciliation of Non-GAAP Financial Measures | | |
•Amortization and other acquisition-related costs, which include transaction costs, integration costs, and changes in the fair value of contingent consideration obligations, are excluded primarily for consistency with the presentationbecause they are not part of the ongoing operations of our underlying business and to facilitate comparison of our current financial results ofto our historical financial results and to our peer group companies.companies' financial results. Additionally, costs for amortization of acquisition-related intangible assets are non-cash amounts, which are variable in amount and frequency and are significantly impacted by the timing and size of acquisitions, so their exclusion facilitates comparison of historical, current and forecasted financial results. We also exclude other acquisition-related costs, which are directly related to an acquisition but do not meet the criteria to be recognized on the acquired entity’s initial balance sheet as part of the purchase price allocation. These costs are also significantly impacted by the timing, complexity and size of acquisitions.
•Impairments and gain or loss on disposal of assets, net are excluded because they do not occur in or reflect the ordinary course of our ongoing business operations and are inherently unpredictable in timing and amount, and in the case of impairments, are non-cash amounts, so their exclusion facilitates comparison of historical, current and forecasted financial results.
•Litigation recoveries or charges, net are excluded because they often relate to events that may have occurred in prior or multiple periods, do not occur in or reflect the ordinary course of our business and are inherently unpredictable in timing and amount.
•Loss on early extinguishment of debt is excluded because it does not typically occur in the normal course of business and may obscure analysis of trends and financial performance. Additionally, the amount and frequency of this type of charge is not consistent and is significantly impacted by the timing and size of debt financingextinguishment transactions.
Transitional tax benefit, net related to the Tax Cuts and Jobs Act is excluded because it results from the one-time impact during the one-year measurement period of a very significant change in the U.S. federal corporate tax rate and, due to the significant size of the benefit, obscures analysis of trends and financial performance. The transitional tax benefit includes the estimate for the re-measurement of deferred tax assets and liabilities due to the reduction of the U.S. federal corporate income tax rate and the repatriation tax on undistributed foreign earnings, both of which are subject to adjustment during an up to 12 month measurement period.
The tax effect for each of the items listed above other than the transitional tax benefit item, is determined using the tax rate and other tax attributes applicable to the item and the jurisdiction(s) in which the item is recorded. The gross, tax and net impact of each item are presented with our GAAP to non-GAAP reconciliations.
|
| | |
13
| Cardinal Health | Q2Fiscal 2018 Form 10-Q
| |
|
| | |
Explanation and Reconciliation of Non-GAAP Financial Measures | | |
Definitions
Growth rate calculation: growth rates in this Form 10-Qreport are determined by dividing the difference between current-period results and prior-period results by prior-period results.
Non-GAAP operating earnings:earnings: operating earningsearnings/(loss) excluding (1) LIFO charges/(credits), (2) surgical gown recall costs/(income), (3) state opioid assessment related to prior fiscal years, (4) shareholder cooperation agreement costs, (5) restructuring and employee severance, (3)(6) amortization and other acquisition-related costs, (4)(7) impairments and (gain)/loss on disposal of assets, net and (5)(8) litigation (recoveries)/charges, net.
Non-GAAP earnings before income taxes: earningstaxes: earnings/(loss) before income taxes excluding (1) LIFO charges/(credits), (2) surgical gown recall costs/(income), (3) state opioid assessment related to prior fiscal years, (4) shareholder cooperation agreement costs, (5) restructuring and employee severance, (3)(6) amortization and other acquisition-related costs, (4)(7) impairments and (gain)/loss on disposal of assets, (5)net and (8) litigation (recoveries)/charges, net and (6)(9) loss on early extinguishment of debt.
Non-GAAP net earnings attributable to Cardinal Health, Inc.: net earnings net earnings/(loss) attributable to Cardinal Health, Inc. excluding (1) LIFO charges/(credits), (2) surgical gown recall costs/(income), (3) state opioid assessment related to prior fiscal years, (4) shareholder cooperation agreement costs, (5) restructuring and employee severance, (3)(6) amortization and other acquisition-related costs, (4)(7) impairments and (gain)/loss on disposal of assets, (5)net and (8) litigation (recoveries)/charges, net (6)and (9) loss on early extinguishment of debt.
Non-GAAP effective tax rate: provision for/(benefit from) income taxes adjusted for the tax impacts of (1) LIFO charges/(credits), (2) surgical gown recall costs/(income), (3) state opioid assessment related to prior fiscal years, (4) shareholder cooperation agreement costs, (5) restructuring and employee severance, (6) amortization and other acquisition-related costs, (7) impairments and (gain)/loss on disposal of assets, net and (8) litigation (recoveries)/charges, net and (9) loss on early extinguishment of debt each net of tax, and (7) transitional tax benefit, net.divided by (earnings/(loss) before income taxes adjusted for the nine items above).
Non-GAAP diluted EPSearnings per share attributable to Cardinal Health, Inc.: non-GAAP net earnings attributable to Cardinal Health, Inc. divided by diluted weighted-average shares outstanding.
|
| | |
| Cardinal Health | Q2Fiscal 2018 Form 10-Q
| 14 |
| | | | | | | | |
| | |
17 | Cardinal Health | Q2Fiscal 2024 Form 10-Q | |
| | | | | | | | |
| Explanation and Reconciliation of Non-GAAP Financial Measures | | |
GAAP to Non-GAAP ReconciliationsReconciliation | | | | (in millions, except per common share amounts) | Operating Earnings | Operating Earnings Growth Rate | Earnings Before Income Taxes | Provision for/(Benefit from) Income Taxes | Net Earnings1 | Net Earnings1 Growth Rate | Diluted EPS1 | Diluted EPS1 Growth Rate |
| | Three Months Ended December 31, 2017 |
| | (in millions, except per common share amounts) | |
| | (in millions, except per common share amounts) | | | | | | Operating Earnings/(Loss) | Operating Earnings Growth Rate | Earnings/(Loss) Before Income Taxes | Provision for/(Benefit From) Income Taxes | Net Earnings/(Loss)1 | Net Earnings1 Growth Rate | Diluted EPS1,2 | Diluted EPS1 Growth Rate |
| | | | | Three Months Ended December 31, 2023 | | | | | | | Three Months Ended December 31, 2023 |
| GAAP | $ | 399 |
| (26 | )% | $ | 317 |
| $ | (736 | ) | $ | 1,053 |
| 225 | % | $ | 3.33 |
| 226 | % | GAAP | | | | | $ | 482 | | N.M. | N.M. | $ | 490 | | $ | 136 | | $ | 353 | | N.M. | N.M. | $ | 1.43 | | N.M. | N.M. |
| | Surgical gown recall income | |
| Surgical gown recall income | |
| Surgical gown recall income | |
| | Restructuring and employee severance | |
| | Restructuring and employee severance | |
| | Restructuring and employee severance | 21 |
| | 21 |
| (2 | ) | 23 |
| | 0.07 |
| |
| Amortization and other acquisition-related costs | 184 |
| | 184 |
| 41 |
| 143 |
| | 0.46 |
| |
| Impairments and loss on disposal of assets | 68 |
| | 68 |
| (43 | ) | 111 |
| | 0.35 |
| |
| Amortization and other acquisition-related costs | |
| Amortization and other acquisition-related costs | |
| Impairments and (gain)/loss on disposal of assets, net | |
| Impairments and (gain)/loss on disposal of assets, net | |
| Impairments and (gain)/loss on disposal of assets, net | |
| Litigation (recoveries)/charges, net | 58 |
| | 58 |
| 17 |
| 41 |
| | 0.13 |
| |
Transitional tax benefit, net2 | — |
|
| — |
| 894 |
| (894 | ) |
| (2.83 | ) |
|
| Litigation (recoveries)/charges, net | |
| Litigation (recoveries)/charges, net | |
| | Non-GAAP | $ | 730 |
| 4 | % | $ | 648 |
| $ | 171 |
| $ | 478 |
| 12 | % | $ | 1.51 |
| 13 | % |
| | | | | | | |
| | Three Months Ended December 31, 2016 |
| GAAP | $ | 542 |
| (4 | )% | $ | 491 |
| $ | 167 |
| $ | 324 |
| — | % | $ | 1.02 |
| 4 | % |
| LIFO charges/(credits) | 9 |
|
| 9 |
| 4 |
| 5 |
|
| 0.02 |
|
|
| Restructuring and employee severance | 7 |
|
| 7 |
| 2 |
| 5 |
|
| 0.01 |
|
|
| Amortization and other acquisition-related costs | 115 |
|
| 115 |
| 39 |
| 76 |
|
| 0.24 |
|
|
| Impairments and loss on disposal of assets | 9 |
|
| 9 |
| 3 |
| 6 |
|
| 0.02 |
|
|
| Litigation (recoveries)/charges, net | 19 |
|
| 19 |
| 7 |
| 12 |
|
| 0.04 |
|
|
| Non-GAAP | $ | 701 |
| (4 | )% | $ | 650 |
| $ | 222 |
| $ | 427 |
| (1 | )% | $ | 1.34 |
| 3 | % |
| | | | | | | |
| | Six Months Ended December 31, 2017 |
| Non-GAAP | | | | | | $ | 562 | | 20 | % | $ | 569 | | $ | 121 | | $ | 447 | | 29 | % | $ | 1.82 | | 38 | % |
| | | | | Three Months Ended December 31, 2022 | | | | | | | Three Months Ended December 31, 2022 |
| GAAP | $ | 661 |
| (39 | )% | $ | 495 |
| $ | (675 | ) | $ | 1,168 |
| 85 | % | $ | 3.68 |
| 87 | % | GAAP | | | | | $ | (119) | | (87) | (87) | % | $ | (137) | | $ | (7) | | $ | (130) | | N.M. | N.M. | $ | (0.50) | | N.M. | N.M. |
| | State opioid assessment related to prior fiscal years | |
| State opioid assessment related to prior fiscal years | |
| State opioid assessment related to prior fiscal years | |
| Shareholder cooperation agreement costs | |
| Shareholder cooperation agreement costs | |
| Shareholder cooperation agreement costs | |
| Restructuring and employee severance | |
| Restructuring and employee severance | |
| Restructuring and employee severance | 153 |
| | 153 |
| 45 |
| 108 |
| | 0.34 |
| |
| Amortization and other acquisition-related costs | 368 |
| | 368 |
| 98 |
| 270 |
| | 0.85 |
| |
| Impairments and loss on disposal of assets | 68 |
| | 68 |
| (43 | ) | 111 |
| | 0.35 |
| |
| Amortization and other acquisition-related costs | |
| Amortization and other acquisition-related costs | |
Impairments and (gain)/loss on disposal of assets, net 3 | |
Impairments and (gain)/loss on disposal of assets, net 3 | |
Impairments and (gain)/loss on disposal of assets, net 3 | |
| Litigation (recoveries)/charges, net | 90 |
| | 90 |
| 30 |
| 60 |
| | 0.19 |
| |
| Loss on extinguishment of debt | — |
| | 2 |
| 1 |
| 1 |
| | — |
| |
Transitional tax benefit, net2 | — |
|
| — |
| 894 |
| (894 | ) |
| (2.82 | ) |
|
| Litigation (recoveries)/charges, net | |
| Litigation (recoveries)/charges, net | |
| | Non-GAAP | $ | 1,340 |
| (2 | )% | $ | 1,175 |
| $ | 350 |
| $ | 823 |
| — | % | $ | 2.60 |
| 1 | % |
| | | | | | | |
| | Six Months Ended December 31, 2016 |
| | Non-GAAP | |
| | Non-GAAP | | | | | | $ | 467 | | — | % | $ | 450 | | $ | 104 | | $ | 346 | | (3) | % | $ | 1.32 | | 4 | % |
| | | | | Six Months Ended December 31, 2023 | | | | | | | Six Months Ended December 31, 2023 |
| GAAP | $ | 1,076 |
| (9 | )% | $ | 985 |
| $ | 351 |
| $ | 633 |
| (11 | )% | $ | 1.97 |
| (8 | )% | GAAP | | | | | $ | 468 | | N.M. | N.M. | $ | 464 | | $ | 104 | | $ | 358 | | N.M. | N.M. | $ | 1.44 | | N.M. | N.M. |
| LIFO charges/(credits) | 9 |
|
| 9 |
| 4 |
| 5 |
|
| 0.02 |
|
|
| | Surgical gown recall income | |
| Surgical gown recall income | |
| Surgical gown recall income | |
| | Restructuring and employee severance | |
| | Restructuring and employee severance | |
| | Restructuring and employee severance | 16 |
|
| 16 |
| 6 |
| 10 |
|
| 0.03 |
|
|
| Amortization and other acquisition-related costs | 237 |
|
| 237 |
| 79 |
| 158 |
|
| 0.49 |
|
|
| Impairments and (gain)/loss on disposal of assets | 12 |
|
| 12 |
| 4 |
| 8 |
|
| 0.02 |
|
|
| Amortization and other acquisition-related costs | |
| Amortization and other acquisition-related costs | |
Impairments and (gain)/loss on disposal of assets, net 3 | |
Impairments and (gain)/loss on disposal of assets, net 3 | |
Impairments and (gain)/loss on disposal of assets, net 3 | |
| Litigation (recoveries)/charges, net | 20 |
|
| 20 |
| 8 |
| 12 |
|
| 0.04 |
|
|
| Litigation (recoveries)/charges, net | |
| Litigation (recoveries)/charges, net | |
| | Non-GAAP | $ | 1,370 |
| (6 | )% | $ | 1,279 |
| $ | 452 |
| $ | 826 |
| (7 | )% | $ | 2.57 |
| (4 | )% |
| Non-GAAP | |
| Non-GAAP | | | | | | $ | 1,133 | | 27 | % | $ | 1,129 | | $ | 247 | | $ | 880 | | 30 | % | $ | 3.55 | | 41 | % |
| | | | | Six Months Ended December 31, 2022 | | | | | | | Six Months Ended December 31, 2022 |
| GAAP | | GAAP | | | | | $ | 18 | | N.M. | $ | (27) | | $ | (8) | | $ | (20) | | N.M. | $ | (0.08) | | N.M. |
| State opioid assessment related to prior fiscal years | |
| | Shareholder cooperation agreement costs | |
| | Shareholder cooperation agreement costs | |
| | Shareholder cooperation agreement costs | |
| Restructuring and employee severance | |
| Restructuring and employee severance | |
| Restructuring and employee severance | |
| Amortization and other acquisition-related costs | |
| Amortization and other acquisition-related costs | |
| Amortization and other acquisition-related costs | |
Impairments and (gain)/loss on disposal of assets, net 3 | |
Impairments and (gain)/loss on disposal of assets, net 3 | |
Impairments and (gain)/loss on disposal of assets, net 3 | |
| Litigation (recoveries)/charges, net | |
| Litigation (recoveries)/charges, net | |
| Litigation (recoveries)/charges, net | |
| | Non-GAAP | |
| | Non-GAAP | |
| | Non-GAAP | | | | | | $ | 891 | | (10) | % | $ | 846 | | $ | 170 | | $ | 675 | | (7) | % | $ | 2.52 | | (2) | % |
| | | | | | | | |
| | |
118
| attributable to Cardinal Health Inc.| Q2Fiscal 2024 Form 10-Q | |
| | | | | | | | |
2
Explanation and Reconciliation of Non-GAAP Financial Measures | | Reflects the estimated net transitional benefit from the remeasurement of our deferred tax assets and liabilities partially offset by the repatriation tax on cash and earnings of foreign subsidiaries. We have not yet completed our analysis of the impact of the Tax Act and, as such, these amounts are provisional estimates and we may record additional provisional amounts or adjustments to the provisional amounts in future periods. See Note 8 of the "Notes to Condensed Consolidated Financial Statements" for more information on the Tax Act. |
1 Attributable to Cardinal Health, Inc.
2 For the three and six months ended December 31, 2022, GAAP diluted EPS and the EPS impact from the GAAP to non-GAAP per share reconciling items are calculated using a weighted average of 261 million and 266 million common shares, respectively, which excludes potentially dilutive securities from the denominator due to their anti-dilutive effects resulting from our GAAP net loss for the periods. For the three and six months ended December 31, 2022, non-GAAP diluted EPS is calculated using a weighted average of 263 million and 268 million common shares, which includes potentially dilutive shares.
3 For the six months ended December 31, 2023, impairments and (gain)/loss on disposal of assets, net includes a pre-tax goodwill impairment charge of $581 million related to the Medical segment. For fiscal 2024, the net tax benefit related to the impairment charge is $45 million and is included in the annual effective tax rate. As a result, the tax benefit for the six months ended December 31, 2023 increased approximately by an incremental $65 million and will increase the provision for income taxes for the remainder of fiscal 2024.
For the three and six months December 31, 2022, impairments and (gain)/loss on disposal of assets, net included cumulative pre-tax goodwill impairment charges of $709 million and $863 million, respectively, related to the Medical segment. For fiscal 2023, the net tax benefit related to these impairment charges was $68 million and was included in the annual effective tax rate. As a result, the amount of tax benefit increased approximately by an incremental $118 million and $140 million for the three and six months ended December 31, 2022, respectively, and increased the provision for income taxes for the remainder of fiscal 2023.
The sum of the components and certain computations may not equal the total due to rounding.reflect rounding adjustments.
We generally apply varying tax rates depending on the item's nature and tax jurisdiction where it is incurred.
| | | | | | | | |
| | |
1519
| Cardinal Health | Q2Fiscal 20182024 Form 10-Q | |
Quantitative and Qualitative Disclosures About Market Risk
As previously disclosedThere have been no material changes in the quantitative and qualitative market risk disclosures included in our 20172023 Form 10-K as a result of the completion of the acquisition of the Patient Recovery Business, our exposure to both translational and transactional foreign exchange rate fluctuations has increased since the end of fiscal 2017. At the time of filing this Form 10-Q, we have not completed our analysis to quantify these impacts. Our direct exposure to market price changes for commodities has increased by approximately $108 million as a result of the completion of the acquisition of the Patient Recovery Business.2023 through December 31, 2023.
Controls and Procedures
Evaluation of Disclosure Controls and Procedures
We evaluated, with the participation of our principal executive officer and principal financial officer, the effectiveness of our disclosure controls and procedures (as defined in Rule 13a-15(e) under the Securities Exchange Act of 1934 (the "Exchange Act")) as of December 31, 2017.2023. Based on this evaluation, our principal executive officer and principal financial officer have concluded that as of December 31, 2017,2023, our disclosure controls and procedures were effective to provide reasonable assurance that information required to be disclosed in our reports under the Exchange Act is recorded, processed, summarized, and reported within the time periods specified in the SEC rules and forms and that such information is accumulated and communicated to management as appropriate to allow timely decisions regarding required disclosure.
Changes in Internal Control Over Financial Reporting
There were no changes in our internal control over financial reporting during the quarter ended December 31, 20172023 that have materially affected, or are reasonably likely to materially affect, our internal control over financial reporting.
| | | | | | | | |
| | |
20 | Cardinal Health | Q2Fiscal 2024 Form 10-Q | |
Legal Proceedings
The legal proceedings described in Note 96 of the "Notes to Condensed Consolidated Financial Statements" are incorporated in this "Legal Proceedings" section by reference. Risk Factors
You should carefully consider the information in this Form 10-Q, and the risk factors discussed in "Risk Factors" and other risks discussed in our 20172023 Form 10-K, our Form 10-Q for the quarter ended September 30, 2023, and our other filings with the SEC since June 30, 2017. 2023. These risks could materially and adversely affect our results of operations, financial condition, liquidity, and cash flows. Our business also could be affected by risks that we are not presently aware of or that we currently consider immaterial to our operations.
Our pending acquisition of Specialty Networks subjects us to various risks and uncertainties. As discussed in the MD&A section, on January 31, 2024, we announced that we had entered into a definitive agreement to acquire Specialty Networks for a purchase price of $1.2 billion in cash, subject to certain adjustments. The acquisition will further expand the Pharmaceutical segment's portfolio of Specialty services. We plan to fund the acquisition with available cash.
Consummation of the pending acquisition is subject to various risks and uncertainties, including the following: the ability to successfully complete the acquisition on a timely basis, including receipt of required regulatory approvals and satisfaction of other closing conditions; and the conditions of the credit markets.
If we are successful in completing the acquisition, we will be subject to other risks, including the following: we may fail to realize the synergies and other benefits we expect from the acquisition; the use of a significant portion of our cash may have an adverse effect on our liquidity, limit our flexibility in responding to other business opportunities, and increase our vulnerability to adverse economic and industry conditions; we may fail to retain key personnel of the acquired businesses; future developments may impair the value of our purchased goodwill or intangible assets; we may face difficulties establishing, integrating or combining operations and systems; we may face challenges retaining the customers of the acquired businesses; we may encounter unforeseen internal control, regulatory or compliance issues; and we may face other additional risks relating to regulatory matters, legal proceedings, and tax laws or positions.
Unregistered Sales of Equity Securities, and Use of Proceeds, and Issuer Purchases of Equity Securities
Issuer Purchases of Equity Securities
| | | | | | | | | | | | | | | | | | | | | | | |
|
| | | | | | | |
| Period | Total Number
of Shares
Purchased (1) | | Average Price Paid per Share (2,3) | | Total Number of Shares Purchased as Part of Publicly Announced Programs (2,3,4) | | Approximate Dollar Value of Shares That May Yet be Purchased Under the Program (4) (in millions) |
| October 2023 | 1,251,107 | | | $ | 79.94 | | | 1,250,909 | | | $ | 3,843 | |
| November 2023 | 1,967,452 | | | 101.66 | | | 1,967,342 | | | 3,543 | |
| December 2023 | 444,271 | | | 112.57 | | | 444,161 | | | 3,493 | |
| Total | 3,662,830 | | | $ | 95.57 | | | 3,662,412 | | | $ | 3,493 | |
|
| | | | | | | | | | | | | |
| Period | Total Number
of Shares
Purchased (1) | | Average Price Paid per Share | | Total Number of Shares
Purchased
as Part of Publicly Announced Program (2) | | Approximate Dollar Value of Shares That May Yet be Purchased Under the Program (2) (in millions) |
| October 2017 | 144 |
| | $ | 66.06 |
| | — |
| | $ | 293 |
|
| November 2017 | 148 |
| | 59.38 |
| | — |
| | 293 |
|
| December 2017 | 177 |
| | 61.50 |
| | — |
| | 293 |
|
| Total | 469 |
| | $ | 62.23 |
| | — |
| | $ | 293 |
|
| |
(1) | Reflects 144, 148 and 177 common shares purchased in October, November and December 2017, respectively, through a rabbi trust as investments of participants in our Deferred Compensation Plan. |
| |
(2) | On May 4, 2016, our Board of Directors approved a $1.0 billion share repurchase program that expires on December 31, 2019. On February 7, 2018, our Board of Directors approved a new $1.0 billion share repurchase program that expires on December 31, 2020. |
(1)Reflects 198, 110 and 110 common shares purchased in October, November and December 2023, respectively, through a rabbi trust as investments of participants in our Deferred Compensation Plan. (2)On November 6, 2023, we entered into an ASR program to purchase common shares for an aggregate purchase price of $250 million and received an initial delivery of 2.0 million common shares using a reference price of $101.66. The ASR program concluded on December 13, 2023 at a volume weighted average price per common share of $103.67 resulting in a final delivery of 0.4 million common shares. See Note 10 of the "Notes to Condensed Consolidated Financial Statements" for additional information. (3)On August 16, 2023, we entered into an ASR program to purchase common shares for an aggregate purchase price of $500 million and received an initial delivery of 4.4 million common shares using a reference price of $90.57. The ASR program concluded on October 31, 2023 at a volume weighted average price per common share of $88.22 resulting in a final delivery of 1.3 million common shares. See Note 10 of the "Notes to Condensed Consolidated Financial Statements" for additional information. (4)On June 7, 2023, our Board of Directors approved a new $3.5 billion share repurchase program, which will expire on December 31, 2027. As of December 31, 2023, we had $3.5 billion authorized for share repurchases remaining under this program.
| | | | | | | | |
| | |
21 | Cardinal Health |Q2Fiscal 20182024 Form 10-Q | | 16
Other Information
Rule 10b5-1 Plan Adoptions and Modifications
During the three months ended December 31, 2023, no director or officer adopted, modified or terminated a "Rule 10b5-1 trading arrangement" or "non-Rule10b5-1 trading arrangement" as each term is defined in Section 408(a) of Regulation S-K under the Exchange Act.
| | | | | | | | |
| | |
22 | Cardinal Health | Q2Fiscal 2024 Form 10-Q | |
Condensed Consolidated Statements of EarningsEarnings/(Loss)
(Unaudited)
| | | | Three Months Ended December 31, | | Six Months Ended December 31, |
| Three Months Ended December 31, | | | Three Months Ended December 31, | | Six Months Ended December 31, |
| (in millions, except per common share amounts) | 2017 | | 2016 | | 2017 | | 2016 | (in millions, except per common share amounts) | 2023 | | 2022 | | 2023 | | 2022 |
| Revenue | $ | 35,186 |
| | $ | 33,150 |
| | $ | 67,827 |
| | $ | 65,189 |
|
| Cost of products sold | 33,325 |
| | 31,548 |
| | 64,294 |
| | 61,997 |
|
| Gross margin | 1,861 |
| | 1,602 |
| | 3,533 |
| | 3,192 |
|
| | | | | | | | |
| Operating expenses: | | | | | | | |
| Operating expenses: | |
| Operating expenses: | |
| Distribution, selling, general and administrative expenses | |
| Distribution, selling, general and administrative expenses | |
| Distribution, selling, general and administrative expenses | 1,131 |
| | 910 |
| | 2,193 |
| | 1,831 |
|
| Restructuring and employee severance | 21 |
| | 7 |
| | 153 |
| | 16 |
|
| Amortization and other acquisition-related costs | 184 |
| | 115 |
| | 368 |
| | 237 |
|
| Impairments and loss on disposal of assets, net | 68 |
| | 9 |
| | 68 |
| | 12 |
|
| Impairments and (gain)/loss on disposal of assets, net | |
| Litigation (recoveries)/charges, net | 58 |
| | 19 |
| | 90 |
| | 20 |
|
| Operating earnings | 399 |
| | 542 |
| | 661 |
| | 1,076 |
|
| Operating earnings/(loss) | |
| | | | | | | | |
| Other (income)/expense, net | (5 | ) | | 7 |
| | (4 | ) | | 3 |
|
| Other (income)/expense, net | |
| Other (income)/expense, net | |
| Interest expense, net | 87 |
| | 44 |
| | 168 |
| | 88 |
|
| Loss on extinguishment of debt | — |
| | — |
| | 2 |
| | — |
|
| Earnings before income taxes | 317 |
| | 491 |
| | 495 |
| | 985 |
|
| | Earnings/(loss) before income taxes | |
| | Earnings/(loss) before income taxes | |
| | Earnings/(loss) before income taxes | |
| | | | | | | | |
| Provision for/(benefit from) income taxes | (736 | ) | | 167 |
| | (675 | ) | | 351 |
|
| Net earnings | 1,053 |
| | 324 |
| | 1,170 |
| | 634 |
|
| Provision for/(benefit from) income taxes | |
| Provision for/(benefit from) income taxes | |
| Net earnings/(loss) | |
| | | | | | | | | |
| Less: Net earnings attributable to noncontrolling interests | — |
| | — |
| | (2 | ) | | (1 | ) |
| Net earnings attributable to Cardinal Health, Inc. | $ | 1,053 |
| | $ | 324 |
| | $ | 1,168 |
| | $ | 633 |
|
| | | | | | | | |
| Earnings per common share attributable to Cardinal Health, Inc.: | | | | | | | |
| | Less: Net earnings attributable to noncontrolling interests | |
| | Less: Net earnings attributable to noncontrolling interests | |
| Net earnings/(loss) attributable to Cardinal Health, Inc. | |
| | Earnings/(Loss) per common share attributable to Cardinal Health, Inc.: | |
| Earnings/(Loss) per common share attributable to Cardinal Health, Inc.: | |
| Earnings/(Loss) per common share attributable to Cardinal Health, Inc.: | |
| Basic | |
| Basic | |
| Basic | $ | 3.35 |
| | $ | 1.02 |
| | $ | 3.70 |
| | $ | 1.99 |
|
| Diluted | 3.33 |
| | 1.02 |
| | 3.68 |
| | 1.97 |
|
| | | | | | | | |
| Weighted-average number of common shares outstanding: | | | | | | | |
| Weighted-average number of common shares outstanding: | |
| Weighted-average number of common shares outstanding: | |
| Basic | |
| Basic | |
| Basic | 315 |
| | 318 |
| | 315 |
| | 319 |
| 245 | | 261 | | 247 | | 266 |
| Diluted | 316 |
| | 319 |
| | 317 |
| | 321 |
| Diluted | 246 | | 261 | | 248 | | 266 |
| | | | | | | | |
| Cash dividends declared per common share | $ | 0.4624 |
| | $ | 0.4489 |
| | $ | 0.9248 |
| | $ | 0.8978 |
|
| Cash dividends declared per common share | |
| Cash dividends declared per common share | |
See notes to condensed consolidated financial statements.
| | | | | | | | |
| | |
1723
| Cardinal Health | Q2Fiscal 20182024 Form 10-Q | |
Condensed Consolidated Statements of Comprehensive IncomeIncome/(Loss)
(Unaudited)
| | | | Three Months Ended December 31, | | Six Months Ended December 31, |
| Three Months Ended December 31, | | | Three Months Ended December 31, | | Six Months Ended December 31, |
| (in millions) | 2017 | | 2016 | | 2017 | | 2016 | (in millions) | 2023 | | 2022 | | 2023 | | 2022 |
| Net earnings | $ | 1,053 |
| | $ | 324 |
| | $ | 1,170 |
| | $ | 634 |
|
| Net earnings/(loss) | |
| | | | | | | | |
| Other comprehensive income/(loss): | | | | | | | |
| Other comprehensive income/(loss): | |
| Other comprehensive income/(loss): | |
| Foreign currency translation adjustments and other | (9 | ) | | (78 | ) | | 31 |
| | (80 | ) |
| Net unrealized gain/(loss) on derivative instruments, net of tax | — |
| | 24 |
| | (1 | ) | | 26 |
|
| Foreign currency translation adjustments and other | |
| Foreign currency translation adjustments and other | |
| | Net unrealized gain on derivative instruments, net of tax | |
| Net unrealized gain on derivative instruments, net of tax | |
| Net unrealized gain on derivative instruments, net of tax | |
| Total other comprehensive income/(loss), net of tax | (9 | ) | | (54 | ) | | 30 |
| | (54 | ) |
| | | | | | | | |
| Total comprehensive income | 1,044 |
| | 270 |
| | 1,200 |
| | 580 |
|
| Total comprehensive income/(loss) | |
| Total comprehensive income/(loss) | |
| Total comprehensive income/(loss) | |
| | | | | | | | |
| Less: comprehensive income attributable to noncontrolling interests | — |
| | — |
| | (2 | ) | | (1 | ) |
| Total comprehensive income attributable to Cardinal Health, Inc. | $ | 1,044 |
| | $ | 270 |
| | $ | 1,198 |
| | $ | 579 |
|
| Less: comprehensive income attributable to noncontrolling interests | |
| Less: comprehensive income attributable to noncontrolling interests | |
| | Total comprehensive income/(loss) attributable to Cardinal Health, Inc. | |
| Total comprehensive income/(loss) attributable to Cardinal Health, Inc. | |
| Total comprehensive income/(loss) attributable to Cardinal Health, Inc. | |
See notes to condensed consolidated financial statements.
| | | | | | | | |
| | |
24 | Cardinal Health |Q2Fiscal 20182024 Form 10-Q | | 18
Condensed Consolidated Balance Sheets | | | | | | | | | | | |
| (in millions) | December 31, 2023 | | June 30, 2023 |
| (Unaudited) | | |
| Assets | | | |
| Current assets: | | | |
| Cash and equivalents | $ | 4,591 | | | $ | 4,043 | |
| Trade receivables, net | 11,788 | | | 11,344 | |
| Inventories, net | 18,451 | | | 15,940 | |
| Prepaid expenses and other | 2,816 | | | 2,362 | |
| Assets held for sale | 12 | | | 144 | |
| Total current assets | 37,658 | | | 33,833 | |
| | | |
| Property and equipment, net | 2,446 | | | 2,462 | |
| Goodwill and other intangibles, net | 5,371 | | | 6,081 | |
| | | |
| Other assets | 1,098 | | | 1,041 | |
| Total assets | $ | 46,573 | | | $ | 43,417 | |
| | | |
| Liabilities and Shareholders’ Deficit | | | |
| Current liabilities: | | | |
| Accounts payable | $ | 34,259 | | | $ | 29,813 | |
| Current portion of long-term obligations and other short-term borrowings | 1,188 | | | 792 | |
| Other accrued liabilities | 2,839 | | | 3,059 | |
| Liabilities related to assets held for sale | — | | | 42 | |
| Total current liabilities | 38,286 | | | 33,706 | |
| | | |
| Long-term obligations, less current portion | 3,535 | | | 3,909 | |
| Deferred income taxes and other liabilities | 8,199 | | | 8,653 | |
| | | |
| Shareholders’ deficit: | | | |
| Preferred shares, without par value: | | | |
Authorized—500 thousand shares, Issued—none | — | | | — | |
| Common shares, without par value: | | | |
Authorized—755 million shares, Issued—327 million shares at December 31, 2023 and June 30, 2023 | 2,855 | | | 2,747 | |
| Accumulated deficit | (425) | | | (534) | |
Common shares in treasury, at cost: 83 million shares and 76 million shares at December 31, 2023 and June 30, 2023, respectively | (5,724) | | | (4,914) | |
| Accumulated other comprehensive loss | (155) | | | (151) | |
| Total Cardinal Health, Inc. shareholders' deficit | (3,449) | | | (2,852) | |
| Noncontrolling interests | 2 | | | 1 | |
| Total shareholders’ deficit | (3,447) | | | (2,851) | |
| Total liabilities and shareholders’ deficit | $ | 46,573 | | | $ | 43,417 | |
(Unaudited)
|
| | | | | | | |
| (in millions) | December 31, 2017 | | June 30, 2017 |
| Assets | | | |
| Current assets: | | | |
| Cash and equivalents | $ | 1,249 |
| | $ | 6,879 |
|
| Trade receivables, net | 7,664 |
| | 8,048 |
|
| Inventories, net | 12,087 |
| | 11,301 |
|
| Prepaid expenses and other | 1,972 |
| | 2,117 |
|
| Assets held for sale | 2,216 |
| | — |
|
| Total current assets | 25,188 |
| | 28,345 |
|
| | | | |
| Property and equipment, net | 2,547 |
| | 1,879 |
|
| Goodwill and other intangibles, net | 14,366 |
| | 9,207 |
|
| Other assets | 804 |
| | 681 |
|
| Total assets | $ | 42,905 |
| | $ | 40,112 |
|
| | | | |
| Liabilities, Redeemable Noncontrolling Interests and Shareholders’ Equity | | | |
| Current liabilities: | | | |
| Accounts payable | $ | 19,194 |
| | $ | 17,906 |
|
| Current portion of long-term obligations and other short-term borrowings | 702 |
| | 1,327 |
|
| Other accrued liabilities | 1,890 |
| | 1,988 |
|
| Liabilities related to assets held for sale | 1,339 |
|
| — |
|
| Total current liabilities | 23,125 |
| | 21,221 |
|
| | | | |
| Long-term obligations, less current portion | 9,057 |
| | 9,068 |
|
| Deferred income taxes and other liabilities | 3,091 |
| | 2,877 |
|
| | | | |
| Redeemable noncontrolling interests | 13 |
| | 118 |
|
| | | | |
| Shareholders’ equity: | | | |
| Preferred shares, without par value: | | | |
Authorized—500 thousand shares, Issued—none | — |
| | — |
|
| Common shares, without par value: | | | |
Authorized—755 million shares, Issued—327 million shares at December 31, 2017 and June 30, 2017, respectively | 2,694 |
| | 2,697 |
|
| Retained earnings | 5,848 |
| | 4,967 |
|
Common shares in treasury, at cost: 12 million shares and 11 million shares at December 31, 2017 and June 30, 2017, respectively | (848 | ) | | (731 | ) |
| Accumulated other comprehensive loss | (95 | ) | | (125 | ) |
| Total Cardinal Health, Inc. shareholders' equity | 7,599 |
| | 6,808 |
|
| Noncontrolling interests | 20 |
| | 20 |
|
| Total shareholders’ equity | 7,619 |
| | 6,828 |
|
| Total liabilities, redeemable noncontrolling interests and shareholders’ equity | $ | 42,905 |
| | $ | 40,112 |
|
| | | | | | | | |
| | |
1925
| Cardinal Health | Q2Fiscal 20182024 Form 10-Q | |
Condensed Consolidated Statements of Shareholders' Deficit
(Unaudited)
| | | | | | | | | | | | | | | | | | | | | | | | | | | | | | | | | | | | | | | | | | | | | | | | |
| Common Shares | | Accumulated Deficit | | Treasury Shares | | Accumulated Other
Comprehensive
Loss | | Noncontrolling Interests | | Total Shareholders’ Deficit | |
| (in millions) | Shares Issued | | Amount | | | Shares | | Amount | | | | |
| Three Months Ended December 31, 2023 | |
| Balance at September 30, 2023 | 327 | | | $ | 2,728 | | | $ | (654) | | | (80) | | | $ | (5,400) | | | $ | (165) | | | $ | 1 | | | $ | (3,490) | | |
| Net earnings | | | | | 353 | | | | | | | | | 1 | | | 354 | | |
| Other comprehensive income, net of tax | | | | | | | | | | | 10 | | | | | 10 | | |
| | | | | | | | | | | | | | | | |
| Employee stock plans activity, net of shares withheld for employee taxes | — | | | 27 | | | | | — | | | 30 | | | | | | | 57 | | |
| Share repurchase program activity | | | 100 | | | | | (4) | | | (354) | | | | | | | (254) | | |
| Dividends declared | | | | | (123) | | | | | | | | | | | (123) | | |
| Other | | | | | (1) | | | 1 | | | | | | | — | | | (1) | | |
| Balance at December 31, 2023 | 327 | | | $ | 2,855 | | | $ | (425) | | | (83) | | | $ | (5,724) | | | $ | (155) | | | $ | 2 | | | $ | (3,447) | | |
| | | | | | | | | | | | | | | | | | | | | | | | | | | | | | | | | | | | | | | | | | | | | | | |
| Three Months Ended December 31, 2022 |
| Balance at September 30, 2022 | 327 | | | $ | 2,576 | | | $ | (301) | | | (65) | | | $ | (3,880) | | | $ | (176) | | | $ | 1 | | | $ | (1,780) | |
| Net loss | | | | | (130) | | | | | | | | | — | | | (130) | |
| Other comprehensive income, net of tax | | | | | | | | | | | 30 | | | | | 30 | |
| | | | | | | | | | | | | | | |
| Employee stock plans activity, net of shares withheld for employee taxes | — | | | 21 | | | | | 1 | | | 26 | | | | | | | 47 | |
| Share repurchase program activity | | | 150 | | | | | (4) | | | (400) | | | | | | | (250) | |
| Dividends declared | | | | | (129) | | | | | | | | | | | (129) | |
| | | | | | | | | | | | | | | |
| Balance at December 31, 2022 | 327 | | | $ | 2,747 | | | $ | (560) | | | (68) | | | $ | (4,254) | | | $ | (146) | | | $ | 1 | | | $ | (2,212) | |
| | | | | | | | | | | | | | | | | | | | | | | | | | | | | | | | | | | | | | | | | | | | | | | |
| | | | | | | | | | | |
| | | | | | | | | | | | |
| Six Months Ended December 31, 2023 |
| Balance at June 30, 2023 | 327 | | | $ | 2,747 | | | $ | (534) | | | (76) | | | $ | (4,914) | | | $ | (151) | | | $ | 1 | | | $ | (2,851) | |
| Net earnings | | | | | 358 | | | | | | | | | 2 | | | 360 | |
| Other comprehensive loss, net of tax | | | | | | | | | | | (4) | | | | | (4) | |
| | | | | | | | | | | | | | | |
| Employee stock plans activity, net of shares withheld for employee taxes | | | 8 | | | | | 1 | | | 49 | | | | | | | 57 | |
| Share repurchase program activity | | | 100 | | | | | (9) | | | (859) | | | | | | | (759) | |
| Dividends declared | | | | | (249) | | | | | | | | | | | (249) | |
| Other | | | | | — | | | 1 | | | | | | | (1) | | | (1) | |
| Balance at December 31, 2023 | 327 | | | $ | 2,855 | | | $ | (425) | | | (83) | | | $ | (5,724) | | | $ | (155) | | | $ | 2 | | | $ | (3,447) | |
| | | | | | | | | | | | | | | | | | | | | | | | | | | | | | | | | | | | | | | | | | | | | | | |
| Six Months Ended December 31, 2022 |
| Balance at June 30, 2022 | 327 | | | $ | 2,813 | | | $ | (280) | | | (54) | | | $ | (3,128) | | | $ | (114) | | | $ | 3 | | | $ | (706) | |
| Net earnings/(loss) | | | | | (20) | | | | | | | | | 1 | | | (19) | |
| Other comprehensive loss, net of tax | | | | | | | | | | | (32) | | | | | (32) | |
| Purchase of noncontrolling interests | | | | | | | | | | | | | (2) | | | (2) | |
| Employee stock plans activity, net of shares withheld for employee taxes | — | | | (16) | | | | | 2 | | | 74 | | | | | | | 58 | |
| Share repurchase program activity | | | (50) | | | | | (16) | | | (1,200) | | | | | | | (1,250) | |
| Dividends declared | | | | | (260) | | | | | | | | | | | (260) | |
| Other | | | | | | | | | | | | | (1) | | | (1) | |
| Balance at December 31, 2022 | 327 | | | $ | 2,747 | | | $ | (560) | | | (68) | | | $ | (4,254) | | | $ | (146) | | | $ | 1 | | | $ | (2,212) | |
See notes to condensed consolidated financial statements.
| | | | | | | | |
| | |
26 | Cardinal Health | Q2Fiscal 2024 Form 10-Q | |
Condensed Consolidated Statements of Cash Flows
(Unaudited)
| | | | | | | | | | | |
| Six Months Ended December 31, |
| (in millions) | 2023 | | 2022 |
| Cash flows from operating activities: | | | |
| Net earnings/(loss) | $ | 360 | | | $ | (19) | |
| | | |
| Adjustments to reconcile net earnings/(loss) to net cash provided by operating activities: | | | |
| Depreciation and amortization | 347 | | | 341 | |
| Impairments and (gain)/loss on disposal of assets, net | 538 | | | 863 | |
| | | |
| | | |
| | | |
| Share-based compensation | 57 | | | 48 | |
| | | |
| Provision for bad debts | 43 | | | 59 | |
| Change in operating assets and liabilities, net of effects from acquisitions and divestitures: | | | |
| Increase in trade receivables | (487) | | | (919) | |
| Increase in inventories | (2,536) | | | (1,643) | |
| Increase in accounts payable | 4,446 | | | 2,954 | |
| Other accrued liabilities and operating items, net | (1,034) | | | (1,064) | |
| Net cash provided by operating activities | 1,734 | | | 620 | |
| | | |
| Cash flows from investing activities: | | | |
| Proceeds from divestitures, net of cash sold | 9 | | | — | |
| | | |
| Additions to property and equipment | (206) | | | (155) | |
| Proceeds from disposal of property and equipment | 2 | | | 2 | |
| Purchases of investments | (2) | | | (5) | |
| Proceeds from investments | 1 | | | 1 | |
| Proceeds from net investment hedge terminations | 28 | | | — | |
| Net cash used in investing activities | (168) | | | (157) | |
| | | |
| Cash flows from financing activities: | | | |
| | | |
| | | |
| Reduction of long-term obligations | (15) | | | (13) | |
| Net tax proceeds from share-based compensation | 1 | | | 9 | |
| | | |
| Dividends on common shares | (255) | | | (271) | |
| Purchase of treasury shares | (750) | | | (1,250) | |
| Net cash used in financing activities | (1,019) | | | (1,525) | |
| | | |
| Effect of exchange rate changes on cash and equivalents | 1 | | | (1) | |
| | | |
| | | |
| Net increase/(decrease) in cash and equivalents | 548 | | | (1,063) | |
| Cash and equivalents at beginning of period | 4,043 | | | 4,717 | |
| Cash and equivalents at end of period | $ | 4,591 | | | $ | 3,654 | |
|
| | | | | | | |
| | Six Months Ended December 31, |
| (in millions) | 2017 | | 2016 |
| Cash flows from operating activities: | | | |
| Net earnings | $ | 1,170 |
| | $ | 634 |
|
| | | | |
| Adjustments to reconcile net earnings to net cash provided by operating activities: | | | |
| Depreciation and amortization | 520 |
| | 339 |
|
| Loss on extinguishment of debt | 2 |
| | — |
|
| Impairments and loss on sale of other investments | 6 |
| | 3 |
|
| Impairments and loss on disposal of assets, net | 68 |
| | 12 |
|
| Share-based compensation | 40 |
| | 47 |
|
| Provision for bad debts | 49 |
| | 29 |
|
| Change in operating assets and liabilities, net of effects from acquisitions: | | | |
| Increase in trade receivables | (617 | ) | | (146 | ) |
| Increase in inventories | (995 | ) | | (1,294 | ) |
| Increase in accounts payable | 2,107 |
| | 1,563 |
|
| Other accrued liabilities and operating items, net | (890 | ) | | (529 | ) |
| Net cash provided by operating activities | 1,460 |
| | 658 |
|
| | | | |
| Cash flows from investing activities: | | | |
| Acquisition of subsidiaries, net of cash acquired | (6,141 | ) | | (11 | ) |
| Additions to property and equipment | (168 | ) | | (213 | ) |
| Purchase of available-for-sale securities and other investments | (6 | ) | | (125 | ) |
| Proceeds from sale of available-for-sale securities and other investments | 65 |
| | 72 |
|
| Proceeds from maturities of available-for-sale securities | — |
| | 39 |
|
| Proceeds from divestitures and disposal of property and equipment and held for sale assets | 1 |
| | 1 |
|
| Net cash used in investing activities | (6,249 | ) | | (237 | ) |
| | | | |
| Cash flows from financing activities: | | | |
| Payment of contingent consideration obligation | (17 | ) | | — |
|
| Net change in short-term borrowings | 155 |
| | 33 |
|
| Purchase of noncontrolling interests | (106 | ) | | (12 | ) |
| Proceeds from long-term obligations, net of issuance costs | 3 |
| | — |
|
| Reduction of long-term obligations | (403 | ) | | (60 | ) |
| Proceeds from interest rate swap terminations | — |
| | 14 |
|
| Net tax proceeds/(withholdings) from share-based compensation | (16 | ) | | — |
|
| Excess tax benefits from share-based compensation | — |
| | 32 |
|
| Dividends on common shares | (296 | ) | | (293 | ) |
| Purchase of treasury shares | (150 | ) | | (600 | ) |
| Net cash used in financing activities | (830 | ) | | (886 | ) |
| | | | |
| Effect of exchange rates changes on cash and equivalents | 7 |
| | (10 | ) |
| Cash reclassified to assets held for sale | (18 | ) | | — |
|
| | | | |
| Net decrease in cash and equivalents | (5,630 | ) | | (475 | ) |
| Cash and equivalents at beginning of period | 6,879 |
| | 2,356 |
|
| Cash and equivalents at end of period | $ | 1,249 |
| | $ | 1,881 |
|
See notes to condensed consolidated financial statements.
| | | | | | | | |
| | |
27 | Cardinal Health |Q2Fiscal 20182024 Form 10-Q | | 20
| | | | | | | | |
| | |
| Notes to Financial Statements | | |
Notes to Condensed Consolidated Financial Statements
1. Basis of Presentation and Summary of Significant Accounting Policies
Basis of Presentation
Our condensed consolidated financial statements include the accounts of all majority-owned or controlledconsolidated subsidiaries, and all significant intercompany transactions and amounts have been eliminated. The results of businesses acquired or disposed of are included in the condensed consolidated financial statements from the date of the acquisition or up to the date of disposal, respectively.
References to "we," "our," and similar pronouns in this Quarterly Report on Form 10-Q for the quarter ended December 31, 20172023 (this "Form 10-Q") referare to Cardinal Health, Inc. and its majority-owned or controlledconsolidated subsidiaries unless the context requires otherwise.
Our fiscal year ends on June 30. References to fiscal 20182024 and 20172023 in these condensed consolidated financial statements are to the fiscal years ending or ended June 30, 20182024 and June 30, 2017,2023, respectively.
Our condensed consolidated financial statements have been prepared in accordance with the U.S. Securities and Exchange Commission ("SEC") instructions to Quarterly Reports on Form 10-Q and include the information and disclosures required by accounting principles generally accepted in the United States ("GAAP") for interim financial reporting. The preparation of financial statements in conformity with GAAP requires us to make estimates, judgments and assumptions that affect amounts reported in the condensed consolidated financial statements and accompanying notes. Actual amounts may differ from these estimated amounts.
In our opinion, all adjustments necessary for a fair presentation of the condensed consolidated financial statements have been included. Except as disclosed elsewhere in this Form 10-Q, all such adjustments are of a normal and recurring nature. In addition, financial results presented for this fiscal 20182024 interim period are not necessarily indicative of the results that may be expected for the full fiscal year ending June 30, 2018.2024. These condensed consolidated financial statements are unaudited and, accordingly, should be read in conjunction with the audited consolidated financial statements and related notes contained in our Annual Report on Form 10-K for the fiscal year ended June 30, 2017 (the "20172023 (our "2023 Form 10-K").
Recent
Recently Issued Financial Accounting Standards
In August 2017,Not Yet Adopted
We assess the adoption impacts of recently issued accounting standards by the Financial Accounting Standards Board (the "FASB"("FASB") on our condensed consolidated financial statements as well as material updates to previous assessments, if any, from our fiscal 2023 Form 10-K.
Segment Reporting
In November 2023, the FASB issued accounting guidanceAccounting Standards Update ("ASU") 2023-07 - Segment Reporting (Topic 280): Improvements to Reportable Segment Disclosures, which is intended to improve and simplify accounting rules around hedge accounting. Theenhances reportable segment disclosure requirements, primarily through disclosures of significant segment expenses. This guidance will be effective for us in our fiscal 2025 Form 10-K and the first quarterguidance must be applied retrospectively to all prior periods presented. We are currently evaluating the impact of adoption of this guidance on our disclosures.
Income Tax Disclosure
In December 2023, the FASB issued ASU 2023-09 Income Taxes (Topic 740): Improvements to Income Tax Disclosures, which enhances income tax disclosures primarily related to the rate reconciliation and income taxes paid information. This guidance also includes certain other amendments to improve the effectiveness of income tax disclosures. This guidance will be effective for us in our fiscal 20202026 Form 10-K and early adoption isshould be applied on a prospective basis, with retrospective application permitted. We are currently evaluating the impact of adoption of this standardguidance on our consolidated financial statements.disclosures.
In January 2017, the FASB issued amendedRecently Adopted Financial Accounting Standards
There were no new material accounting guidance that simplifies the accounting for goodwill impairment by eliminating the step of measuring a goodwill impairment by estimating the implied fair value of goodwill. Instead, goodwill impairment will be measured as the amount by which the reporting unit's carrying value exceeds its fair value, limited to the carrying value of goodwill. Westandards adopted this guidance in the second quartersix months ended December 31, 2023.
| | | | | | | | |
| | |
28 | Cardinal Health | Q2Fiscal 2024 Form 10-Q | |
| | | | | | | | |
| Notes to Financial Statements | | |
2. Divestitures
On June 5, 2023, we signed a definitive agreement to contribute the OutcomesTM business to Transaction Data Systems ("TDS"), a portfolio company of fiscal 2018.BlackRock Long Term Private Capital and GTCR, in exchange for a 16 percent equity interest in the combined entity. The adoption did
not have an impacttransaction closed on July 10, 2023 and we recognized a pre-tax gain of $53 million during the six months ended December 31, 2023, which was included in impairments and (gain)/loss on disposal of assets, net in our condensed consolidated financial statements.statements of earnings/(loss). This gain includes our initial recognition of an equity method investment in the combined entity for $147 million.
In March 2016,We determined that the FASB issued amended accounting guidance that changeddivestiture of the accounting for certain aspects of share-based compensation to employees. The guidance requires all income tax effects of share-based awardsOutcomesTM business does not meet the criteria to be recognized in the statement of earningsclassified as awards vest or are settled. Additionally, the guidance increases the amount employers can withhold in shares to cover employee income taxes without requiring liability classification and allows a policy election for accounting for forfeitures.discontinued operations. The primary impact of adoption is the recognition of excess tax benefits in the statement of earnings on a prospective basis, rather than as a component of equity. The impact on the presentation in the condensed consolidated statement of cash flows is also prospective. We adopted this guidance in the first quarter of fiscal 2018. The impact of adoption on the provision for/(benefit from) income taxes on our condensed consolidated statement of earnings was immaterial. The inclusion of excess tax benefits and deficiencies as a component of our income tax expense will increase volatilityOutcomesTM business operated within our provision for/(benefit from) income taxes as the amountPharmaceutical segment.
3. Restructuring and Employee Severance
The following tables summarize restructuring and employee severance costs:
| | | | | | | | | | | |
| Three Months Ended December 31, |
| (in millions) | 2023 | | 2022 |
| Employee-related | $ | 8 | | | $ | 10 | |
| Facility exit and other | 20 | | | 7 | |
| Total restructuring and employee severance | $ | 28 | | | $ | 17 | |
| | | | | | | | | | | |
| Six Months Ended December 31, |
| (in millions) | 2023 | | 2022 |
| Employee-related | $ | 15 | | | $ | 29 | |
| Facility exit and other | 38 | | | 17 | |
| Total restructuring and employee severance | $ | 53 | | | $ | 46 | |
Employee-related costs primarily consist of excess taxtermination benefits or deficiencies from share-based compensation awards depends on our stock price at the date the awards vest or settle.
In February 2016, the FASB issued amended accounting guidance that requires lesseesprovided to recognize most leases on the balance sheet as a lease liabilityemployees who have been involuntarily terminated, duplicate payroll costs and corresponding right-of-use asset. The guidance also requires disclosures that meet the objectiveretention bonuses incurred during transition periods. Facility exit and other costs primarily consist of enabling financial statement usersproject consulting fees, accelerated depreciation, professional, project management and other service fees to assess the amount, timing, and uncertainty of cash flows arising from leases. This guidance will be effective for us in the first quarter of fiscal 2020, with early adoption permitted. We are currently evaluating the impact of this standard on our consolidated financial statements and the options for adoption.
In May 2014, the FASB issued amended accounting guidance related to revenue recognition which is effective for us in the first quarter of fiscal 2019. This guidance is based on the principle that revenue is recognized in an amount that reflects the consideration to which an entity expects to be entitled in exchange for the transfer of goods or services to customers. The guidance also requires additional disclosure about the nature, amount, timing, and uncertainty of revenue and cash flows arising from customer contracts, including significant judgments and changes in judgments and assets recognized from costs incurred to obtain or fulfill a contract. The FASB also subsequently issued several amendments to the standard, including clarification on principal versus agent considerations, performance obligations and licensing, and certain scope improvements and practical expedients.
We continue to make progress on our evaluation of the amended revenue recognition guidance. Our revenue is primarily distribution revenue, which we recognize at a point in time when title transfers to customers and we have no further obligation to provide services related to such merchandise. Although we are continuing to assess the impact of the amended guidance, we generally anticipate that the timing of recognition of distribution revenue will be substantially
|
| | |
21
| Cardinal Health | Q2Fiscal 2018 Form 10-Q
| |
|
| | |
Notes to Financial Statements | | |
unchanged under the amended guidance and we do not expect the adoption of the amended accounting guidance to have a material impact on our consolidated financial statements. During the remainder of fiscal 2018 we will quantify the impact of adoption, if any, and implement any required changes to processes to meet the new accounting, reporting and disclosure requirements and will update our internal controls and policies accordingly. Additionally, we are continuing to evaluate our method of adoption.
2. Acquisitions
Patient Recovery Business
On July 29, 2017, we acquired the Patient Care, Deep Vein Thrombosis, and Nutritional Insufficiency businesses (the "Patient Recovery Business") from Medtronic plc for $6.1 billion in cash. The Patient Recovery Business manufactures 23 categories of medical products sold into multiple healthcare channels, and includes numerous industry-leading brands, such as Curity, Kendall, Dover, Argyle and Kangaroo. The acquisition further expanded the Medical segment's portfolio of self-manufactured products. We closed the Patient Recovery Business acquisition in 28 principal countries on July 29, 2017, and acquired control of, for GAAP purposes, and the rights to, the net economic benefit from the entire Patient Recovery Business in the remaining countries at the closing. We are in the process of transitioning legal ownership in the remaining non-principal countries, which we expect to complete by the end of calendar 2018. The results for the entire Patient Recovery Business in all countries are included in the condensed consolidated financial statements beginning July 29, 2017. We funded the acquisition through $4.5 billion in new long-term debt, existing cash and borrowings under our existing credit arrangements.
Transaction and integrationsupport divestitures, costs associated with the acquisition of the Patient Recovery business were $24 millionvacant facilities, and $61 millioncertain other divestiture-related costs.
Restructuring and employee severance costs during the three and six months ended December 31, 2017, respectively, and are included in amortization and other acquisition-related costs in the condensed consolidated statements of earnings.
Fair Value of Assets Acquired and Liabilities Assumed
The allocation of the purchase price for the acquisition of the Patient Recovery Business is not yet finalized and is subject2023 were primarily related to adjustment as we complete the valuation analysis for this acquisition.
The valuation of identifiable intangible assets utilizes significant unobservable inputs and thus represents a Level 3 nonrecurring fair value measurement. The estimated fair value of the identifiable intangible assets was determined using income-based approaches, which includes market participant expectations of the cash flows that an asset could generate over its economic life, discounted back to present value using an appropriate rate of return. The weighted- average discount rate used to arrive at the present value of the identifiable intangible assets was 8.2 percent, and considers the inherent risk of each intangible asset relative to the internal rate of return and weighted-average cost of capital.
The following table summarizes the estimated fair value of the assets acquired and liabilities assumed as of the acquisition date for the Patient Recovery Business:
|
| | | |
| (in millions) | Patient Recovery Business |
| Identifiable intangible assets: | |
| Customer relationships (1) | $ | 1,733 |
|
| Trade names (2) | 187 |
|
| Developed technology and other (3) | 732 |
|
| Total identifiable intangible assets acquired | 2,652 |
|
| | |
| Cash and equivalents | 22 |
|
| Inventories | 426 |
|
| Prepaid expenses and other | 249 |
|
| Property and equipment, net | 752 |
|
| Other accrued liabilities | (307 | ) |
| Deferred income taxes and other liabilities | (851 | ) |
| Total identifiable net assets acquired/(liabilities assumed) | 2,943 |
|
| Goodwill | 3,137 |
|
| Total net assets acquired | $ | 6,080 |
|
| |
(1) | The range of useful lives for customer relationships is 10 to 18 years. |
| |
(2) | The useful life of trade names is 15 years. |
| |
(3) | The useful life of developed technology is 15 years. |
3. Restructuring and Employee Severance
The following table summarizes restructuring and employee severance costs:
|
| | | | | | | |
| | Three Months Ended December 31, |
| (in millions) | 2017 | | 2016 |
| Employee-related costs (1) | $ | 15 |
| | $ | 6 |
|
| Facility exit and other costs (2) | 6 |
| | 1 |
|
| Total restructuring and employee severance | $ | 21 |
| | $ | 7 |
|
|
| | | | | | | |
| | Six Months Ended December 31, |
| (in millions) | 2017 | | 2016 |
| Employee-related costs (1) | $ | 19 |
| | $ | 13 |
|
| Facility exit and other costs (2) | 134 |
| | 3 |
|
| Total restructuring and employee severance | $ | 153 |
| | $ | 16 |
|
| |
(1) | Employee-related costs primarily consist of termination benefits provided to employees who have been involuntarily terminated and duplicate payroll costs during transition periods. |
| |
(2) | Facility exit and other costs primarily consist of product distribution and lease contract termination costs, accelerated depreciation, equipment relocation costs, project consulting fees and costs associated with restructuring our delivery of information technology infrastructure services. |
In September 2017, we entered into an agreement to transition the distributioncertain projects resulting from review of our Medical segment's surgeon gloves instrategy portfolio, capital-allocation framework and operation and the implementation of certain international markets from a third-party distribution arrangement to a direct distribution model. The expected costs with this restructuring include $125 million, on a pre-tax basis, in contract termination costs.
|
| | |
| Cardinal Health | Q2Fiscal 2018 Form 10-Q
| 22 |
|
| | |
Notes to Financial Statements | | |
These costs are reflected in facility exitenterprise-wide cost-savings measures. During the three and other costs in the condensed consolidated statement of earnings during the six months ended December 31, 2017. We paid $65 million2022, restructuring and employee severance costs were primarily related to implementation of the contract termination fee during the three months ended December 31, 2017 and the remaining $60 million during January 2018.certain enterprise-wide cost-saving measures.
The following table summarizes activity related to liabilities associated with restructuring and employee severance:
| | | | | | | | | | | | | | | | | |
| (in millions) | Employee-
Related Costs | | Facility Exit
and Other Costs | | Total |
| Balance at June 30, 2023 | $ | 44 | | | $ | 2 | | | $ | 46 | |
| Additions | 8 | | | 4 | | | 12 | |
| Payments and other adjustments | (18) | | | (1) | | | (19) | |
| Balance at December 31, 2023 | $ | 34 | | | $ | 5 | | | $ | 39 | |
|
| | | | | | | | | | | |
| (in millions) | Employee- Related Costs | | Facility Exit and Other Costs | | Total |
| Balance at June 30, 2017 | $ | 41 |
| | $ | — |
| | $ | 41 |
|
| Additions | 11 |
| | 130 |
| | 141 |
|
| Payments and other adjustments | (16 | ) | | (66 | ) | | (82 | ) |
| Balance at December 31, 2017 | $ | 36 |
| | $ | 64 |
| | $ | 100 |
|
| | | | | | | | |
| | |
29 | Cardinal Health | Q2Fiscal 2024 Form 10-Q | |
4. Assets Held for Sale
We classify assets and liabilities (the “disposal group”) as held for sale when management commits to a plan to sell the disposal group in its present condition and at a price that is reasonable in relation to its current fair value. We also consider whether an active program to locate a buyer has been initiated and if it is probable that the sale will occur within one year without significant changes to the plan to sell. Upon classification of the disposal group as held for sale, we test the assets for impairment and cease related depreciation and amortization.
In November 2017, we signed a definitive agreement with Shanghai Pharmaceuticals Holding Co., Ltd. to sell our pharmaceutical and medical products distribution business in China ("China distribution business") for gross proceeds of $1.2 billion. The transaction closed on February 1, 2018 for net proceeds of approximately $800 million after adjusting for third party indebtedness, taxes, and other transaction expenses and adjustments.
During the three months ended December 31, 2017, we met the criteria for the related assets and liabilities of the China distribution business to be classified as held for sale. We determined that the sale of the China distribution business does not meet the criteria to be classified as discontinued operations. The China distribution business primarily operates within our Pharmaceutical segment, with a smaller portion operating within our Medical segment.
At December 31, 2017, the book value of the disposal group exceeded its fair value less cost to sell. Accordingly, we recognized a $67 million write-down on the disposal group in impairments and loss on disposal of assets in our condensed consolidated statement of earnings. This write-down includes a $2 million gain related to currency translation adjustments in accumulated other comprehensive income. The write-down is non-deductible for tax purposes. We also recognized provisional tax expense of $57 million related to the transaction. See Note 8 for additional information regarding income taxes.
| | | | | | | | |
| Notes to Financial Statements | | |
The following table presents information related to the assets and liabilities that were classified as held for sale at December 31, 2017 in the condensed consolidated balance sheets:
|
| | | | |
| (in millions) | | December 31, 2017 |
| Trade Receivables, net | | $ | 952 |
|
| Inventories, net | | 622 |
|
| Goodwill and other intangibles, net | | 448 |
|
| Other assets | | 261 |
|
| Impairment of assets held for sale | | (67 | ) |
| Total assets held for sale | | 2,216 |
|
| | | |
| Accounts Payable | | 818 |
|
| Current portion of long-term obligations and other short term borrowings | | 397 |
|
| Other liabilities | | 124 |
|
| Total liabilities related to assets held for sale | | $ | 1,339 |
|
5.4. Goodwill and Other Intangible Assets
Goodwill
The following table summarizes the changes in the carrying amount of goodwill by segment and in total:
| | | | | | | | | | | | | | | | | |
| (in millions) | Pharmaceutical | | Medical (1) | | Total |
| Balance at June 30, 2023 | $ | 2,649 | | | $ | 1,960 | | | $ | 4,609 | |
| Goodwill acquired, net of purchase price adjustments | — | | | (3) | | | (3) | |
| Foreign currency translation adjustments and other | — | | | (1) | | | (1) | |
| Goodwill impairment | — | | | (581) | | | (581) | |
| Balance at December 31, 2023 | $ | 2,649 | | | $ | 1,375 | | | $ | 4,024 | |
|
| | | | | | | | | | | |
| (in millions) | Pharmaceutical | | Medical | | Total |
| Balance at June 30, 2017 | $ | 2,939 |
| | $ | 4,282 |
| | $ | 7,221 |
|
| Goodwill acquired, net of purchase price adjustments | 1 |
| | 3,187 |
| | 3,188 |
|
| Foreign currency translation adjustments and other | 14 |
| | 9 |
| | 23 |
|
| Reclassified to assets held for sale | (333 | ) | | (54 | ) | | (387 | ) |
| Balance at December 31, 2017 | $ | 2,621 |
| | $ | 7,424 |
| | $ | 10,045 |
|
TheWe have not identified any indicators of impairment during the three months ended December 31, 2023 within our reporting units, including the Medical Unit.
During the three months ended September 30, 2023, we elected to bypass the qualitative assessment and perform quantitative goodwill impairment testing for the Medical Unit due to an increase in the risk-free interest rate used in the discount rate. Our determination of the estimated fair value of the Medical segment goodwillUnit is based on a combination of the income-based approach (using a discount rate of 11 percent and a terminal growth rate of 2 percent), and market-based approaches. Additionally, we assigned a weighting of 80 percent to the discounted cash flow method, 10 percent to the guideline public company method, and 10 percent to the guideline transaction method. The carrying amount exceeded the fair value, which resulted in a pre-tax impairment charge of $581 million for the Medical Unit, which was recognized during the six months ended December 31, 2023 and is included in impairments and (gain)/loss on disposal of assets, net in our condensed consolidated statements of earnings/(loss). This impairment charge was driven by an increase of 1 percent in the discount rate primarily due to an increase in the Patient Recovery Business acquisition. Goodwill recognized in connection withrisk-free interest rate. The discount rate used for the Patient Recovery Business acquisition primarily represents the expected benefits from certain synergies of integrating the business, the existing workforce of the acquired entity, and the expected growth from new customers.interim goodwill impairment testing at June 30, 2023 was 10 percent.
During the three months ended December 31, 2017,2022 and September 30, 2022, we performed quantitative goodwill impairment testing for the Medical Unit. This quantitative testing resulted in the carrying amount of $387the Medical Unit exceeding the fair value, resulting in pre-tax goodwill impairment charges of $709 million was reclassified to assets held for sale in connection withand $154 million recorded during the sale of our China distribution business, discussed further in Note 4.three months ended December 31, 2022 and September 30, 2022, respectively.
|
| | |
23
| Cardinal Health | Q2Fiscal 2018 Form 10-Q
| |
|
| | |
Notes to Financial Statements | | |
Other Intangible Assets
The following tables summarize other intangible assets by class at: | | | | | | | | | | | | | | | | | | | | | | | |
| December 31, 2023 |
| (in millions) | Gross
Intangible | | Accumulated
Amortization | | Net
Intangible | | Weighted- Average Remaining Amortization Period (Years) |
| Indefinite-life intangibles: | | | | | | | |
| Trademarks and patents | $ | 12 | | | $ | — | | | $ | 12 | | | N/A |
| Total indefinite-life intangibles | 12 | | | — | | | 12 | | | N/A |
| | | | | | | |
| Definite-life intangibles: | | | | | | | |
| Customer relationships | 3,175 | | | 2,357 | | | 818 | | | 9 |
| Trademarks, trade names and patents | 546 | | | 394 | | | 152 | | | 7 |
| Developed technology and other | 1,022 | | | 657 | | | 365 | | | 8 |
| Total definite-life intangibles | 4,743 | | | 3,408 | | | 1,335 | | | 8 |
| Total other intangible assets | $ | 4,755 | | | $ | 3,408 | | | $ | 1,347 | | | N/A |
| | | | | | | | | | | | | | | | | |
| June 30, 2023 |
| (in millions) | Gross
Intangible | | Accumulated
Amortization | | Net
Intangible |
| Indefinite-life intangibles: | | | | | |
| Trademarks and patents | $ | 11 | | | $ | — | | | $ | 11 | |
| Total indefinite-life intangibles | 11 | | | — | | | 11 | |
| | | | | |
| Definite-life intangibles: | | | | | |
| Customer relationships | 3,174 | | | 2,274 | | | 900 | |
| Trademarks, trade names and patents | 546 | | | 380 | | | 166 | |
| Developed technology and other | 1,021 | | | 626 | | | 395 | |
| Total definite-life intangibles | 4,741 | | | 3,280 | | | 1,461 | |
| Total other intangible assets | $ | 4,752 | | | $ | 3,280 | | | $ | 1,472 | |
|
| | | | | | | | | | | | | |
| | December 31, 2017 |
| (in millions) | Gross Intangible | | Accumulated Amortization | | Net Intangible | | Weighted- Average Remaining Amortization Period (Years) |
| Indefinite-life intangibles: | | | | | | | |
| IPR&D, trademarks and other | $ | 62 |
| | $ | — |
| | $ | 62 |
| | N/A |
| Total indefinite-life intangibles | 62 |
| | — |
| | 62 |
| | N/A |
| | | | | | | | |
| Definite-life intangibles: | | | | | | | |
| Customer relationships | 3,614 |
| | 1,074 |
| | 2,540 |
| | 13 |
| Trademarks, trade names and patents | 686 |
| | 224 |
| | 462 |
| | 14 |
| Developed technology and other | 1,648 |
| | 391 |
| | 1,257 |
| | 12 |
| Total definite-life intangibles | 5,948 |
| | 1,689 |
| | 4,259 |
| | 13 |
| Total other intangible assets | $ | 6,010 |
| | $ | 1,689 |
| | $ | 4,321 |
| | N/A |
|
| | | | | | | | | | | |
| | June 30, 2017 |
| (in millions) | Gross Intangible | | Accumulated Amortization | | Net Intangible |
| Indefinite-life intangibles: | | | | | |
| IPR&D, trademarks and other | $ | 61 |
| | $ | — |
| | $ | 61 |
|
| Total indefinite-life intangibles | 61 |
| | — |
| | 61 |
|
| | | | | | |
| Definite-life intangibles: | | | | | |
| Customer relationships | 1,966 |
| | 967 |
| | 999 |
|
| Trademarks, trade names and patents | 509 |
| | 195 |
| | 314 |
|
| Developed technology and other | 916 |
| | 304 |
| | 612 |
|
| Total definite-life intangibles | 3,391 |
| | 1,466 |
| | 1,925 |
|
| Total other intangible assets | $ | 3,452 |
| | $ | 1,466 |
| | $ | 1,986 |
|
The increase in definite-life intangibles is primarily due to the Patient Recovery Business acquisition. Total amortization of intangible assets was $152$63 million and $95$71 million for the three months ended December 31, 20172023 and 2016,2022, respectively, and $287$127 million and $196$142 million for the six months ended December 31, 20172023 and 2016,2022, respectively. For acquisitions closed on or before December 31, 2017, estimatedEstimated annual amortization of intangible assets for the remainder of fiscal 20182024 through 20222028 is as follows: $289$127 million, $553$226 million, $522$206 million, $450$174 million and $417$148 million.
During the three months ended December 31, 2017, other intangible assets of $61 million were transferred to assets held for sale in
| | | | | | | | |
| | |
30 | Cardinal Health | Q2Fiscal 2024 Form 10-Q | |
| | | | | | | | |
| Notes to Financial Statements | | |
connection with the sale of our China distribution business, discussed further in Note 4.6. Available-for-Sale Securities
We invest in marketable securities, which are classified as available-for-sale and are carried at fair value in the condensed consolidated balance sheets. We held the following investments in marketable securities at fair value at:
|
| | | | | | | |
| (in millions) | December 31, 2017 | | June 30, 2017 |
| Current available-for-sale securities: | | | |
| Treasury bills | $ | — |
| | $ | 25 |
|
| International bonds | — |
| | 3 |
|
| Corporate bonds | — |
| | 30 |
|
| U.S. agency bonds | — |
| | 3 |
|
| Asset-backed securities | — |
| | 3 |
|
| International equity securities | — |
| | 1 |
|
| Total available-for-sale securities | $ | — |
| | $ | 65 |
|
In July 2017, we liquidated our marketable securities. There were no unrealized gains or loss at December 31, 2017, and gross unrealized gains and losses were immaterial at June 30, 2017. During the six months ended December 31, 2017 and 2016, gross realized gains and losses were immaterial and we did not recognize any other-than-temporary impairments.
7.5. Long-Term Obligations and Other Short-Term Borrowings
Long-Term Debt
At December 31, 2017 and June 30, 2017, weWe had total long termlong-term obligations, including the current portion and other short-term borrowings, of $9.8$4.7 billion at both December 31, 2023 and $10.4 billion, respectively. June 30, 2023. All the notes represent unsecured obligations of Cardinal Health, Inc. and rank equally in right of payment with all of our existing and future unsecured and unsubordinated indebtedness. Interest is paid pursuant to the terms of the obligations. These notes are effectively subordinated to the liabilities of our subsidiaries, including trade payables of $19.2 billion.
In$34.3 billion and $29.8 billion at December 31, 2023 and June 2017, we issued additional debt with the aggregate principal amount of $5.2 billion to fund a portion of the acquisition of the Patient Recovery Business, to redeem the $400 million 1.7% Notes due 2018 and for general corporate purposes. The notes issued in June 2017 were 1.948% Notes due 2019, 2.616% Notes due 2022, 3.079% Notes due 2024, 3.410% Notes due 2027, 4.368% Notes due 2047, and floating rate Notes due 2022.30, 2023, respectively.
Other Financing Arrangements
In addition to cash and equivalents and operating cash flow, other sources of liquidity include a $2.0 billion commercial paper program which is backed by a $2.0 billion revolving credit facility andfacility. We also have a $1.0 billion committed receivables sales facility program.facility. At December 31, 2017,2023, we had $151 million outstanding under the commercial paper program and no amounts outstanding under theour commercial paper program, revolving credit facility andor our committed receivables sales facility.
In February 2023, we extended our $2.0 billion revolving credit facility program.
|
| | |
| Cardinal Health | Q2Fiscal 2018 Form 10-Q
| 24 |
|
| | |
Notes to Financial Statements | | |
through February 25, 2028. In November 2016,September 2022, we renewed our committed receivables sales facility program through Cardinal Health Funding, LLC (“CHF”) through November 1, 2019.September 30, 2025. In September 2023, Cardinal Health 23 Funding, LLC ("CH-23 Funding") was added as a seller under our committed receivables sales facility. Each of CHF and CH-23 Funding was organized forthe sole purpose of buying receivables and selling undivided interests in those receivables to third-party purchasers. Although consolidated with Cardinal Health, Inc. in accordance with GAAP, each of CHF and CH-23 Funding is a separate legal entity from Cardinal Health, Inc. and from our respective subsidiary that sells receivables to CHF. CHF or CH-23 Funding, as applicable. Each of CHF and CH-23 Funding is designed to be a special purpose, bankruptcy-remote entity whose assets are available solely to satisfy the claims of its respective creditors.
Our revolving credit and committed receivables sales facilities require us to maintain a consolidated net leverage ratio of no more than 3.75-to-1. As of December 31, 2023, we were in compliance with this financial covenant. 8.
6. Commitments, Contingent Liabilities and Litigation
Commitments
Generic Sourcing Venture with CVS Health
In July 2014, we established Red Oak Sourcing, LLC ("Red Oak Sourcing"), a U.S.-based generic pharmaceutical sourcing venture with CVS Health Corporation ("CVS Health") for an initial term of 10 years. Red Oak Sourcing negotiates generic pharmaceutical supply contracts on behalf of its participants. In August 2021, we amended our agreement to extend the term through June 2029. We are required to make quarterly payments to CVS Health for the term of the arrangement.
Contingencies
New York Opioid Stewardship Act
In April 2018, the State of New York passed a budget which included the Opioid Stewardship Act (the "OSA"). The OSA created an aggregate $100 million annual assessment on all manufacturers and distributors licensed to sell or distribute opioids in New York. Under the OSA, each licensed manufacturer and distributor would be required to pay a portion of the assessment based on its share of the total morphine milligram equivalents sold or distributed in New York during the applicable calendar year, beginning in 2017. Subsequently, New York passed a new statute that modified the assessment going forward and limited the OSA to two years (2017 and 2018).
We accrue contingencies if it is probable that a liability has been incurred and the amount can be estimated. During the fiscal year 2023, we recorded $6 million of income to reduce the previously estimated accrual to the invoiced amount for the calendar year 2018 assessment. At June 30, 2023, we had an outstanding liability of $3 million, which was paid in full during first quarter of fiscal year 2024.
Legal Proceedings
We become involved from time to time in disputes, litigation and regulatory matters.
From time to time, we determine that products we distribute, source, manufacture or market do not meet our specifications, regulatory requirements, or published standards. When we or a regulatory agency identify a potential quality or regulatory issue, we investigate and take appropriate corrective action. Such actions have led to product recalls, costs to repair or replace affected products, temporary interruptions in product sales, restrictions on importation, product liability claims and lawsuits and can lead to action by regulators. Even absent an identified regulatory or quality issue or product recall, we can become subject to product liability claims and lawsuits.
From time to time, we become aware through employees, internal audits or other parties of possible compliance matters, such as complaints or concerns relating to accounting, internal accounting controls, financial reporting, auditing, or other ethical matters or
| | | | | | | | |
| | |
31 | Cardinal Health | Q2Fiscal 2024 Form 10-Q | |
| | | | | | | | |
| Notes to Financial Statements | | |
relating to compliance with laws such as healthcare fraud and abuse, anti-corruption or anti-bribery laws. When we become aware of such possible compliance matters, we investigate internally and take appropriate corrective action. In addition, from time to time, we receive subpoenas or requests for information from various federal or state agencies relating to our business or to the business of a customer, supplier or other industry participants. Internal investigations, subpoenas or requests for information could directly or indirectly lead to the assertion of claims or the commencement of legal proceedings against us or result in sanctions.
We have been named from time to time in qui tam actions initiated by private third parties. In such actions, the private parties purport to act on behalf of federal or state governments, allege that false claims have been submitted for payment by the government and may receive an award if their claims are successful. After a private party has filed a qui tam action, the government must investigate the private party's claim and determine whether to intervene in and take control over the litigation. These actions may remain under seal while the government makes this determination. If the government declines to intervene, the private party may nonetheless continue to pursue the litigation on his or her own purporting to act on behalf of the government.
We accrue for contingencies related to disputes, litigation and regulatory matters if it is probable that a liability has been incurred and the amount of the loss can be reasonably estimated. Because these matters are inherently unpredictable and unfavorable developments or resolutions can occur, assessing contingencies is highly subjective and requires judgments about future events. We regularly review contingencies to determine whether our accruals and related disclosures are adequate. The amount of ultimate loss may differ from these estimates.
We recognize income from the favorable outcome of litigation when we receive the associated cash or assets.
We recognize estimated loss contingencies for certain litigation and regulatory matters and income from favorable resolution of litigation in litigation (recoveries)/charges, net in our condensed consolidated statements of earnings/(loss); however, losses and recoveries of lost profits from disputes that occur in the ordinary course of business are included within segment profit.
Opioid Lawsuits and Investigations
Cardinal Health, other Pharmaceutical wholesalers and other participants in the pharmaceutical supply chain have been named as a defendant in lawsuits related to the distribution of opioid pain medications. These lawsuits seek equitable relief and monetary damages based on a variety of legal theories, including various common law claims, such as public nuisance, negligence, unjust enrichment, personal injury, as well as violations of controlled substance laws, the Racketeer Influenced and Corrupt Organization Act and various other statutes. Plaintiffs in these lawsuits include governmental entities as well as private parties, such as unions and other health and welfare funds, hospital
system and other healthcare providers, businesses and Individuals.
We have also received federal grand jury subpoenas issued in connection with investigations being conducted by the U.S. Attorney's Office for the Eastern District of New York and the Fraud Section of the U.S. Department of Justice ("DOJ"). We have also received civil request for information, subpoenas and other request from other DOJ offices. These investigations concern operation of our anti-diversion program, our anti-diversion policies and procedures and distribution of certain controlled substances. We are cooperating with these investigations. We are unable to predict the outcomes of any of these investigations.
In total, as of December 31, 2023, we have $5.47 billion accrued for these matters, of which $420 million is included in other accrued liabilities and remainder is included in deferred income taxes and other liabilities in our condensed consolidated balance sheets.
Because loss contingencies are inherently unpredictable and unfavorable developments or resolutions can occur, the assessment is highly subjective and requires judgements about future events. We regularly review these opioid litigation matters to determine whether our accrual is adequate. The amount of ultimate loss may differ materially from this accrual, whether as a result of settlement discussions, a judicial decision or verdict or otherwise, but we are not able to estimate a range of reasonably possible additional losses for these matters. We continue to strongly dispute the allegations made in these lawsuits and none of these agreements is an admission of liability or wrong doing. Please see below for additional description of these matters.
States & Political Subdivisions
In February 2022, we along with two other national distributors (collectively, the "Distributors") independently approved a settlement agreement (the "National Opioid Settlement Agreement") to settle the vast majority of opioid lawsuits and claims brought by states and political subdivisions. This National Opioid Settlement Agreement became effective on April 2, 2022. In addition to the Distributors, parties to the National Opioid Settlement Agreement include 48 states, the District of Columbia and 5 U.S. territories. Over 99 percent of political subdivisions in settling states (by population as calculated under the National Opioid Settlement Agreement) that had brought opioid-related suits against us have chosen to join the National Opioid Settlement Agreement or have had their claims addressed by state legislation (together with settling states and territories, the "Settling Governmental Entities").
In November 2023, we reached an agreement in principle with the Alabama Attorney General, under which we would pay approximately $123 million to the State of Alabama over a period of ten years to resolve opioid-related claims brought by the State and its political subdivisions. This agreement is subject to certain contingencies, including subdivision participation. During the three and six months ended December 31, 2023, we recognized a
| | | | | | | | |
| | |
32 | Cardinal Health | Q2Fiscal 2024 Form 10-Q | |
| | | | | | | | |
| Notes to Financial Statements | | |
$22 million charge in litigation (recoveries)/charge, net in the condensed consolidated statements of earnings/(loss) related to this agreement.
Through January 2024, we have paid the Settling Governmental Entities approximately $1.5 billion, which includes the January 2024 prepayment of certain future payment amounts described below. We expect to pay Settling Governmental Entities additional amounts up to $4.9 billion through 2038. The National Opioid Settlement Agreement also includes injunctive relief terms related to Distributors' controlled substance anti-diversion programs. A monitor is overseeing compliance with these provisions until 2027. In addition, the Distributors are engaging a third-party vendor to act as clearinghouse for data aggregation and reporting, which Distributors will fund for 10 years. As a result of the National Opioid Settlement Agreement, the vast majority of lawsuits brought against us by State and other political subdivisions have been dismissed. We continue to engage in resolution discussions with certain nonparticipating political subdivisions and intend to defend ourselves vigorously against all remaining lawsuits.
Other Settlements
West Virginia subdivisions and Native American tribes were not a part of the National Opioid Settlement Agreement, and we had separate settlement negotiations with these groups. In July 2022, a judgment in favor of the Distributors was entered in bench trial before a federal judge in West Virginia in a case brought by Cabell County and City of Huntington. Plaintiffs have appealed this decision to the Fourth Circuit Court of Appeals. In July 2022, the Distributors reached an agreement to settle the opioid-related claims of the majority of the remaining West Virginia subdivisions. Under this agreement, we agreed to pay eligible West Virginia subdivisions up to approximately $124 million over an eleven-year period. This agreement became effective in October 2022 when all participating subdivisions dismissed their cases.
In October 2022, we executed a final settlement agreement with the Native American Tribes, pursuant to which we will pay up to approximately $136 million over five years. In connection with this settlement, the court entered dismissals for the Native American tribes' cases.
Prepayment of Future Payment Years
In January 2024, we made payments of approximately $238 million to prepay at a pre-negotiated discount certain future payment amounts totaling approximately $344 million owed under each of the National Opioid Settlement Agreement, West Virginia Subdivisions Settlement Agreement and settlement agreements with Native American tribes and Cherokee Nation. The majority of the prepayment relates to the seventh annual payment as due under the National Opioid Settlement Agreement. As a result of these prepayments, we expect to recognize income of approximately $100 million in litigation charges/(recoveries), net in our condensed consolidated statements of earnings/(loss) during the three months ended March 31, 2024.
Private Plaintiffs
The National Opioid Settlement Agreement does not address claims by private parties, which includes unions and other health and welfare funds, hospital systems and other healthcare providers, businesses and individuals alleging personal injury. Lawsuits brought by private plaintiffs that were pending as of January 26, 2023 were 395. Of these, 103 are purported class actions. The causes of action asserted by these plaintiffs are similar to those asserted by public plaintiffs. We are engaged in resolution discussions with certain private plaintiffs; however, we are vigorously defending ourselves in all these matters.
A trial in a case involving 21 plaintiffs began in state court in Georgia in January 2023 and concluded in March 2023 with a verdict for the company and other defendants on all claims. In July 2023, the judge denied the plaintiffs' motion for a new trial. Plaintiffs have filed a notice of appeal and defendants have filed a notice of cross-appeal. A trial involving eight hospital plaintiffs is scheduled to begin in Alabama in July 2024.
Insurance Litigation
We are involved in ongoing legal proceedings with insurers related their obligations to reimburse us for defense and indemnity costs in connection with the lawsuits described above. During fiscal year 2023, we received approximately $10 million in insurance recoveries related to these matters.
Cordis IVC Filter Matters
We have been named as a defendant in approximately 400 product liability lawsuits coordinated in Alameda County Superior Court in California involving claims by approximately 4,500 plaintiffs that allege personal injuries associated with the use of inferior vena cava ("IVC") filter products. These lawsuits sought a variety of remedies, including unspecified monetary damages. The divestiture of the Cordis business did not include product liability related to the IVC filters in the U.S. and Canada, which we retained.
In April 2023, we executed a settlement agreement that, if certain conditions are satisfied, will resolve 4,375 claims for $275 million. This settlement agreement is subject to certain conditions, including certain opt-in thresholds. Between May and September 2023, we made settlement payments totaling $275 million into a qualified settlement fund, which will be disbursed to the plaintiffs if required conditions are satisfied. Since July 2021, we have also entered into other agreements to settle 2,798 product liability claims. While these settlements will resolve the vast majority of IVC filter product liability claims, they will not resolve all of them, and we intend to continue to vigorously defend ourselves in the remaining lawsuits.
Additionally, in August 2021, the Attorney General for the State of New Mexico filed an action against certain IVC filter manufacturers, including us, alleging claims under New Mexico's Unfair Practices Act, Medicaid Fraud Act and Fraud Against Taxpayers Act. The allegations made are similar to those made in
| | | | | | | | |
| | |
33 | Cardinal Health | Q2Fiscal 2024 Form 10-Q | |
| | | | | | | | |
| Notes to Financial Statements | | |
the product liability lawsuits. We intend to vigorously defend ourselves against these claims.
We recognized income of $103 million during fiscal year 2023, primarily related to a reduction of the reserve for the estimated settlement and defense costs for these matters due to the execution of the settlements noted above. At December 31, 2023, we had a total of $300 million accrued for losses and legal defense costs, related to the IVC filter product liability lawsuits in our condensed consolidated balance sheets.
Other Civil Litigation
Generic Pharmaceutical Pricing Antitrust Litigation
In December 2019, pharmaceutical distributors including us were added as defendants in a civil class action lawsuit filed by indirect purchasers of generic drugs, such as hospitals and retail pharmacies. The indirect purchaser case is part of a multidistrict litigation consisting of multiple individual class action matters consolidated in the Eastern District of Pennsylvania. The indirect purchaser plaintiffs allege that pharmaceutical distributors encouraged manufacturers to increase prices, provided anti-competitive pricing information to manufacturers and improperly engaged in customer allocation. In May 2020, the court granted our motion to dismiss. In July 2022, the indirect purchasers filed an amended complaint and in August 2022, we filed a motion to dismiss the amended complaint. We are vigorously defending ourselves in this matter.
Antitrust Litigation Proceeds
We recognized income for net recoveries in class action antitrust lawsuits in which we were a class member or plaintiff of $31 million and $71 million during the three and six months ended December 31, 2023, respectively, and $66 million during the three and six months ended December 31, 2022.
7. Income Taxes
Fluctuations in our provision for/(benefit from)for income taxes as a percentage of pretaxour pre-tax earnings (“effective tax rate”) are generally due to changes in international and U.S. state effective tax rates resulting from our business mix and discrete items. In our second quarter ending December 31, 2017 new U.S. tax legislation, as discussed further below, was the primary driver of fluctuations.
U.S. Tax Cuts and Jobs Act
On December 22, 2017, the United States enacted the Tax Cuts and Jobs Act (the “Tax Act”). The Tax Act makes broad and complex changes to the U.S. tax code that affect our fiscal year 2018 financial results in two primary ways. First, effective as of January 1, 2018, the Tax Act reduces the U.S. federal corporate tax rate from 35 percent to 21 percent. Second, it requires companies to pay a one-time U.S. repatriation tax on certain undistributed earnings of foreign subsidiaries. Because our fiscal year ends in June, we have a blended U.S. Federal statutory tax rate for fiscal 2018 of 28.1 percent under the Tax Act. The Tax Act also establishes new tax provisions that will affect us beginning July 1, 2018 including, (1) eliminating the U.S. manufacturing deduction; (2) establishing new limitations on deductible interest expense and certain executive compensation; (3) eliminating the corporate alternative minimum tax; (4) creating the base erosion anti-abuse tax; (5) creating a new provision designed to tax global intangible low-tax income (“GILTI”); (6) generally eliminating U.S. federal income taxes on dividends from foreign subsidiaries; and (7) changing rules related to uses and limitations of net operating loss carryforwards created in tax years beginning after December 31, 2017.
Regarding the new GILTI tax rules, we are allowed to make an accounting policy election to either (1) treat taxes due on future GILTI exclusions in U.S. taxable income as a current period expense when incurred or (2) reflect such portion of the future GILTI exclusions in U.S. taxable income that relate to existing basis differences in our measurement of deferred taxes. Our analysis of the new GILTI rules and how they may impact us is incomplete. Accordingly, we have not made a policy election regarding the treatment of the GILTI tax.
Also on December 22, 2017, the SEC issued Staff Accounting Bulletin 118 (SAB 118) allowing companies to use provisional estimates to record the effects of the Tax Act. SAB 118 also provides a measurement period (not to exceed one year from the date of enactment) to complete the accounting for the impacts of the Tax Act.
We are still completing our accounting for the tax effects of the Tax Act because all the necessary information is not currently available,
prepared, or analyzed. As permitted by SAB 118, we have made reasonable estimates of the effects of the Tax Act on our financial results. As we complete our analysis of the accounting for the tax effects of enactment of the Tax Act, we may record additional provisional amounts or adjustments to provisional amounts as discrete items in future periods.
Remeasurement of Deferred Tax Assets and Liabilities
As a result of the enactment of a lower tax rate, we remeasured our U.S. deferred tax assets and liabilities based on the rates at which they are expected to reverse in the future. While we are still analyzing certain aspects of the Tax Act and refining our calculations, we have recorded a provisional net benefit of $935 million in the three months ended December 31, 2017 related to this required remeasurement. The provisional estimate is based on currently available information related to deferred tax assets and liabilities which is subject to change as additional information becomes available, prepared, and analyzed.
Repatriation Tax on Undistributed Foreign Earnings
In connection with the required one-time U.S. repatriation tax on undistributed earnings of foreign subsidiaries, we recorded a provisional tax expense of $41 million in the three months ended December 31, 2017. The Tax Act permits the payment of this tax over an eight-year period beginning in fiscal 2019. Though these foreign earnings have been deemed to be repatriated from a U.S. federal tax perspective, we have not yet completed our assessment of the Tax Act on our plans to reinvest foreign earnings and as such have not changed our prior conclusion that the earnings are indefinitely reinvested. The repatriation tax is based on currently available information and technical guidance related to the new tax law. The provisional estimate will be updated when additional information related to undistributed foreign earnings, foreign taxes and foreign cash and equivalents becomes available, prepared and analyzed.
Effective Tax Rate
During the three months ended December 31, 2017 and 2016, the effective tax rate was (231.9) percent and 34.0 percent, respectively. During the six months ended December 31, 2017 and 2016, the effective tax rate was (136.6) percent and 35.6 percent, respectively. The change in the effective tax rate for the three and six months ended December 31, 2017 compared to2023, the prior periods is due to the net benefit from enactmenteffective tax rate was 27.7 percent and 22.4 percent, respectively, and reflects any impact of the Tax Act.
The net benefit fromtax effects of the Tax Actgoodwill impairment charges recognized during the three and six months ended December 31, 2017 includes2023.
During the aforementioned provisionalthree and six months ended December 31, 2022, the effective tax rate was 5.4 percent and 30.0 percent, respectively, and reflects the impact of the tax effects of the goodwill impairment charges recognized during the three and six months ended December 31, 2022.
Tax Effects of Goodwill Impairment Charge
During the six months ended December 31, 2023, we recognized a $581 million pre-tax charge for goodwill impairment related to the Medical Unit. The net tax benefit of $935 million related to these charges is $45 million for fiscal 2024.
Unless an item is considered discrete because it is unusual or infrequent, the remeasurementtax impact of the item is included in our deferredestimated annual effective tax assets and liabilitiesrate. When items are recognized through our estimated annual effective tax rate, we apply our estimated annual effective tax rate to the new federal statutoryearnings before income taxes for the year-to-date period to compute our impact from income taxes for the current quarter and year-to-date period. The tax impacts of discrete items are recognized in their entirety in the period in which they occur.
The tax effect of the goodwill impairment charge during the six months ended December 31, 2023 was included in our estimated annual effective tax rate because it was not considered unusual or infrequent, given that we recorded goodwill impairments in prior fiscal years. The impact of the non-deductible goodwill increased the estimated annual effective tax rate for fiscal 2024. Applying the higher tax rate to the pre-tax income for the six months ended December 31, 2023 resulted in recognizing an incremental interim tax benefit of approximately $65 million, which impacted the benefit from income taxes in the impactcondensed consolidated statements of applying a lower federalearnings/(loss) during the three months ended December 31, 2023 and prepaid expenses and other assets in the condensed consolidated balance sheet at December 31, 2023. This interim tax rate to year-to-date U.S. pre-tax earnings and the provisional tax expensebenefit will reverse in future quarters of $41 million based on the one-time repatriation tax applied to our undistributed foreign earnings.fiscal 2024.
Our effective tax rate also includes $57 million of tax expense recognized in connection with the sale of our China distribution business.
Unrecognized Tax Benefits
At December 31, 2017 and June 30, 2017, weWe had $520$959 million and $417 million$1.0 billion of unrecognized tax benefits respectively. The
|
| | |
| Cardinal Health | Q2Fiscal 2018 Form 10-Q
| 25 |
|
| | |
Notes to Financial Statements | | |
at December 31, 20172023 and June 30, 2017,2023, respectively. The December 31, 2023 and June 30, 2023 balances include $277$864 million and $268$873 million of unrecognized tax benefits, respectively, that if recognized, would have an impact on the effective tax rate.
At December 31, 20172023 and June 30, 2017,2023, we had $125$52 million and $99$65 million, respectively, accrued for the payment of interest and penalties related to unrecognized tax benefits, which we recognize in the provision for/(benefit from)from income taxes in the condensed consolidated statements of earnings.earnings/(loss). These balances are gross amounts before any tax benefits and are included in deferred income taxes and other liabilities in the condensed consolidated balance sheets.
It is reasonably possible that there could be a change in the amount of unrecognized tax benefits within the next 12 months due to activities of the U.S. Internal Revenue Service ("IRS") or other taxing authorities, possible settlement of IRS and other audit issues, reassessment of existing unrecognized tax benefits or the expiration of statutes of limitations. We estimate that the range of the possible change in unrecognized tax benefits within the next 12 months is between zero and a net decrease of up to $30 million, exclusive of penalties and interest.
| | | | | | | | |
| | |
34 | Cardinal Health | Q2Fiscal 2024 Form 10-Q | |
| | | | | | | | |
| Notes to Financial Statements | | |
Other Tax Matters
We file income tax returns in the U.S. federal jurisdiction, various U.S. state jurisdictions, and various foreign jurisdictions. With few exceptions, we are subject to audit by taxing authorities for fiscal years 20082015 through the current fiscal year.
We are a party to a tax matters agreement with CareFusion Corporation ("CareFusion"), which has been acquired bya subsidiary of Becton, Dickinson and Company. Under the tax matters agreement, CareFusion is obligated to indemnify us for certain tax exposures and transaction taxes prior to our fiscal 2010 spin-off of CareFusion. In December 2023, the estimated tax exposure was updated to reflect adjustments based on settlement discussions with the IRS. Additionally, Cardinal received a partial payment from CareFusion to be applied towards the anticipated liability. As a result, the indemnification receivable was reduced. The indemnification receivable was $146$20 million and $142$82 million at December 31, 20172023 and June 30, 2017,2023, respectively, and is included in other assets in the condensed consolidated balance sheets.
As a result of the acquisition of the Patient Recovery Business from Medtronic plc, we have an indemnification receivable of $136 million recognized as of December 31, 2017. Under the purchase agreement, Medtronic plc is obligated to indemnify us for certain tax exposures and transaction taxes related to periods prior to our acquisition of the Patient Recovery Business. In January 2018, Medtronic plc paid $85 million of this amount to us which we placed on deposit with the IRS.
9. Commitments, Contingent Liabilities and Litigation
Commitments
Generic Sourcing Venture with CVS Health Corporation ("CVS Health")
In July 2014, we established Red Oak Sourcing, LLC ("Red Oak Sourcing"), a U.S.-based generic pharmaceutical sourcing venture with CVS Health for an initial term of 10 years. Red Oak Sourcing negotiates generic pharmaceutical supply contracts on behalf of both companies. Due to the achievement of predetermined milestones, we are required to make quarterly payments of $45.6 million to CVS Health for the remainder of the initial term.
Legal Proceedings
We become involved from time to time in disputes, litigation, and regulatory matters.
We may be named from time to time in qui tam actions initiated by private third parties. In such actions, the private parties purport to act on behalf of federal or state governments, allege that false claims have been submitted for payment by the government and may receive an award if their claims are successful. After a private party has filed a qui tam action, the government must investigate the private party's claim and determine whether to intervene in and take control over the litigation. These actions may remain under seal while the government makes this determination. If the government declines to intervene, the private party may nonetheless continue to pursue the litigation on his or her own purporting to act on behalf of the government.
From time to time, we become aware through employees, internal audits or other parties of possible compliance matters, such as complaints or concerns relating to accounting, internal accounting controls, financial reporting, auditing, or other ethical matters or relating to compliance with laws such as healthcare fraud and abuse, anti-corruption or anti-bribery laws. When we become aware of such possible compliance matters, we investigate internally and take appropriate corrective action. In addition, from time to time, we receive subpoenas or requests for information from various federal or state agencies relating to our business or to the business of a customer, supplier or other industry participants. Internal investigations, subpoenas or requests for information could lead to the assertion of claims or the commencement of legal proceedings against us or result in sanctions.
From time to time, we may determine that products we manufacture or market do not meet our specifications, regulatory requirements, or published standards. When we or a regulatory agency identify a potential quality or regulatory issue, we investigate and take appropriate corrective action. Such actions can lead to product recalls, costs to repair or replace affected products, temporary interruptions in product sales, action by regulators and product liability claims and lawsuits, including class actions. Even absent an identified regulatory or quality issue or product recall, we can become subject to product liability claims and lawsuits.
We accrue for contingencies related to disputes, litigation and regulatory matters if it is probable that a liability has been incurred and the amount of the loss can be reasonably estimated. Because these matters are inherently unpredictable and unfavorable developments or resolutions can occur, assessing contingencies is highly subjective and requires judgments about future events. We regularly review contingencies to determine whether our accruals and related disclosures are adequate. The amount of ultimate loss may differ from these estimates.
We recognize income from the favorable outcome of litigation when we receive the associated cash or assets.
We recognize estimated loss contingencies for certain litigation and regulatory matters and income from favorable resolution of litigation in litigation (recoveries)/charges in our condensed consolidated statements of earnings.
Opioid Lawsuits
Pharmaceutical wholesale distributors, including us, have been named as defendants in a number of lawsuits relating to the distribution of prescription opioid pain medications. These lawsuits, which have been filed in various federal, state and other courts, allege violations of controlled substance laws and various other statutes as
|
| | |
| Cardinal Health | Q2Fiscal 2018 Form 10-Q
| 26 |
|
| | |
Notes to Financial Statements | | |
well as common law claims, including negligence, public nuisance and unjust enrichment, and seek equitable relief and monetary damages. Many of these lawsuits also name pharmaceutical manufacturers, retail chains and other entities as defendants.
As of February 2, 2018, we are named as a defendant in 343 lawsuits in 36 jurisdictions. The plaintiffs in these lawsuits include 317 counties, municipalities and other entities; two state attorneys general; and 23 union and other health and welfare funds and hospital systems and other health care providers. Of these lawsuits, ten are purported class actions. In December 2017, all federal lawsuits (298 as of February 2, 2018) were ordered to be transferred for consolidated pre-trial proceedings in a Multi-District Litigation proceeding in the United States District Court for the Northern District of Ohio. We are vigorously defending ourselves in these lawsuits. Since these lawsuits are in early stages, we are unable to predict their outcome or estimate a range of reasonably possible losses.
In addition to the two state attorneys general who have sued us, we, along with other distributors, have, since September 2017, received requests related to an investigation being conducted by a group of 39 U.S. state attorneys general relating to the distribution of opioid medication. This investigation is part of a broader investigation of pharmaceutical manufacturers and distributors. We also have received civil investigative demands, subpoenas or requests for information from nine individual state attorneys general offices. We are cooperating with these investigations.
Product Liability Lawsuits
As of February 2, 2018, we are named as a defendant in 112 product liability lawsuits filed in Alameda County Superior Court in California involving claims by approximately 1,362 plaintiffs that allege personal injuries associated with the use of Cordis OptEase and TrapEase inferior vena cava (IVC) filter products. Another 17 lawsuits involving similar claims by approximately 28 plaintiffs are pending in other jurisdictions. These lawsuits seek a variety of remedies, including unspecified monetary damages. We are vigorously defending ourselves in these lawsuits.
At December 31, 2017, we had a total of $184 million, net of expected insurance recoveries, accrued for losses and legal defense costs related to the Cordis IVC filter lawsuits. While we have recorded accruals based on our assessment of these matters, because these lawsuits are in early stages, we are unable to estimate a range of reasonably possible losses in excess of this accrued amount.
10.8. Fair Value Measurements
Assets and (liabilities) measuredLiabilities Measured on a recurring basisRecurring Basis
The following tables present the fair values for assets and (liabilities) measured on a recurring basis at:
| | | | | | | | | | | | | | | | | | | | | | | |
| December 31, 2023 |
| (in millions) | Level 1 | | Level 2 | | Level 3 | | Total |
| Assets: | | | | | | | |
| Cash equivalents | $ | 1,708 | | | $ | — | | | $ | — | | | $ | 1,708 | |
| | | | | | | |
| Other investments (1) | 102 | | | — | | | — | | | 102 | |
| | | | | | | |
| Liabilities: | | | | | | | |
| Forward contracts (2) | — | | | (73) | | | — | | | (73) | |
| | | | | | | |
| | | | | | | |
| | | | | | | |
| | | | December 31, 2017 |
| June 30, 2023 | | | June 30, 2023 |
| (in millions) | Level 1 | | Level 2 | | Level 3 | | Total | (in millions) | Level 1 | | Level 2 | | Level 3 | | Total |
| Assets: | | | | | | | |
| Cash equivalents | $ | — |
| | $ | — |
| | $ | — |
| | $ | — |
|
| Available-for-sale securities (2) | — |
| | — |
| | — |
| | — |
|
| Other investments (3) | 122 |
| | — |
| | — |
| | 122 |
|
| Cash equivalents | |
| Cash equivalents | |
| | Other investments (1) | |
| Other investments (1) | |
| Other investments (1) | |
| | Liabilities: | | | | | | | |
| Forward contracts (1) | — |
| | (33 | ) | | — |
| | (33 | ) |
| Contingent consideration (4) | — |
| | — |
| | (21 | ) | | (21 | ) |
| Liabilities: | |
| Liabilities: | |
| | Forward contracts (2) | |
| | Forward contracts (2) | |
| | Forward contracts (2) | |
|
| | | | | | | | | | | | | | | |
| | June 30, 2017 |
| (in millions) | Level 1 | | Level 2 | | Level 3 | | Total |
| Assets: | | | | | | | |
| Cash equivalents | $ | 739 |
| | $ | — |
| | $ | — |
| | $ | 739 |
|
| Available-for-sale securities (2) | — |
| | 65 |
| | — |
| | 65 |
|
| Other investments (3) | 116 |
| | — |
| | — |
| | 116 |
|
| Liabilities: | | | | | | | |
| Forward contracts (1) | — |
| | (21 | ) | | — |
| | (21 | ) |
| Contingent consideration (4) | — |
| | — |
| | (32 | ) | | (32 | ) |
| |
(1) | The fair value of interest rate swaps, foreign currency contracts and commodity contracts is determined based on the present value of expected future cash flows considering the risks involved, including non-performance risk, and using discount rates appropriate for the respective maturities. Observable Level 2 inputs are used to determine the present value of expected future cash flows. The fair value of these derivative contracts, which are subject to master netting arrangements under certain circumstances, is presented on a gross basis in the condensed consolidated balance sheets. |
| |
(2) | We invest in marketable securities, which are classified as available-for-sale and are carried at fair value in the condensed consolidated balance sheets. Observable Level 2 inputs such as quoted prices for similar securities, interest rate spreads, yield curves and credit risk are used to determine the fair value. See Note 6 for additional information regarding available-for-sale securities. |
| |
(3) | (1)The other investments balance includes investments in mutual funds, which are used to offset fluctuations in deferred compensation liabilities. These mutual funds primarily invest in the equity securities of companies with both large and small market capitalization and high quality fixed income debt securities. The fair value of these investments is determined using quoted market prices. |
| |
(4) | Contingent consideration represents the obligations incurred in connection with acquisitions. We do not deem the fair value of the contingent consideration obligations under any single acquisition to be significant. The estimate of fair value of the contingent consideration obligations requires subjective assumptions to be made regarding future business results, discount rates, discount periods, and probabilities assigned to various potential business result scenarios and was determined using probability assessments with respect to the likelihood of reaching various targets or of achieving certain milestones. The fair value measurement is based on significant inputs unobservable in the market and thus represents a Level 3 measurement. Changes in current expectations of progress could change the probability of achieving the targets within the measurement periods and result in an increase or decrease in the fair value of the contingent consideration obligation.
|
|
| | |
27
| Cardinal Health | Q2Fiscal 2018 Form 10-Q
| |
|
| | |
Notes to Financial Statements | | |
The following table presents those liabilities measured at fair value of these investments is determined using quoted market prices.
(2)The fair value of interest rate swaps, foreign currency contracts, and net investment hedges is determined based on the present value of expected future cash flows considering the risks involved, including non-performance risk, and using discount rates appropriate for the respective maturities. Observable Level 2 inputs are used to determine the present value of expected future cash flows. The fair value of these derivative contracts, which are subject to master netting arrangements under certain circumstances, is presented on a recurringgross basis using unobservable inputs (Level 3):
|
| | | |
| (in millions) | Contingent Consideration Obligation |
| Balance at June 30, 2017 | $ | 32 |
|
| Additions from acquisitions | 5 |
|
| Changes in fair value of contingent consideration (1) | — |
|
| Payment of contingent consideration | (17 | ) |
| Balance at December 31, 2017 | $ | 21 |
|
The sum ofin prepaid expenses and other, other assets, other accrued liabilities, and deferred income taxes and other liabilities within the components may not equal the total due to rounding.condensed consolidated balance sheets.
| |
(1) | Amount is included in amortization and other acquisition-related costs in the condensed consolidated statements of earnings. |
Assets and (liabilities) measuredMeasured on a nonrecurring basisNonrecurring Basis
AssetsAs discussed further in Note 2, on July 10, 2023, we closed the transaction to contribute the Outcomes™ business to TDS, a portfolio company of BlackRock Long Term Private Capital and liabilities heldGTCR, in exchange for sale of $2.2 billion and $1.3 billion, respectively,a 16 percent equity interest in the combined entity. We accounted for this investment initially at December 31, 2017 are related to the sale of our China distribution business that closed on February 1, 2018. There were no assets or liabilities held for sale at June 30, 2017. These estimatedits fair values utilizedvalue using Level 3 unobservable inputs based on expected sales proceeds followingunder the discounted cash flow method. Accordingly, we recognized a competitive bidding process. See Note 4 for additional information regarding assets and liabilities held for sale.$147 million equity method investment during the six months ended December 31, 2023.11.
| | | | | | | | |
| | |
35 | Cardinal Health | Q2Fiscal 2024 Form 10-Q | |
| | | | | | | | |
| Notes to Financial Statements | | |
9. Financial Instruments
We utilize derivative financial instruments to manage exposure to certain risks related to our ongoing operations. The primary risks managed through the use of derivative instruments include interest rate risk, currency exchange risk and commodity price risk. We do not use derivative instruments for trading or speculative purposes. While the majority of our derivative instruments are designated as hedging instruments, we also enter into derivative instruments that are designed to hedge a risk but are not designated as hedging instruments. These derivative instruments are adjusted to current fair value through earnings at the end of each period. We are exposed to counterparty credit risk on all of our derivative instruments. Accordingly, we have established and maintain strict counterparty credit guidelines and only enter into derivative instruments with major financial institutions that are rated investment grade or better. We do not have significant exposure to any one counterparty and we believe the risk of loss is remote. Additionally, we do not require collateral under these agreements.
Interest Rate Risk Management
We are exposed to the impact of interest rate changes. Our derivativeobjective is to manage the impact of interest rate changes on cash flows and hedging programsthe market value of our borrowings. We utilize a mix of debt maturities on our fixed-rate debt to manage changes in interest rates. In addition, we enter into interest rate swaps to further manage our exposure to interest rate variations related to our borrowings and to lower our overall borrowing costs.
Currency Exchange Risk Management
We conduct business in several major international currencies and are consistentsubject to risks associated with those describedchanging foreign exchange rates. Our objective is to reduce earnings and cash flow volatility associated with foreign exchange rate changes to allow management to focus its attention on business operations. Accordingly, we enter into various contracts that change in value as foreign exchange rates change to protect the value of existing foreign currency assets and liabilities, commitments and anticipated foreign currency revenue and expenses.
Commodity Price Risk Management
We are exposed to changes in the 2017 Form 10-K. The amountprice of ineffectivenesscertain commodities. Our objective is to reduce earnings and cash flow volatility associated with forecasted purchases of these commodities to allow management to focus its attention on business operations. Accordingly, we enter into derivative instruments was immaterial forcontracts when possible to manage the price risk associated with certain forecasted purchases.
Fair Value Hedges
We enter into pay-floating interest rate swaps to hedge the changes in the fair value of fixed-rate debt resulting from fluctuations in interest rates. These contracts are designated and qualify as fair value hedges. Accordingly, the gain or loss recorded on the pay-floating interest rate swaps is directly offset by the change in fair value of the underlying debt. Both the derivative
instrument and the underlying debt are adjusted to market value at the end of each period with any resulting gain or loss recorded in interest expense, net in the condensed consolidated statements of earnings/(loss). For the three and six months ended December 31, 20172023 and 2016.2022, there were no gains or losses recorded to interest expense as changes in the market value of our derivative instruments offset changes in the market value of the underlying debt.
During the six months ended December 31, 20172023 and 2016,2022, we entered into pay-floating interest rate swaps with a total notional amounts of $350$200 million and $100 million, respectively.each. These swaps have been designated as fair value hedges of our fixed rate debt and are included in deferred income taxes and other assetsliabilities in theour condensed consolidated balance sheet.sheets.
Cash Flow Hedges
We enter into derivative instruments to hedge our exposure to changes in cash flows attributable to interest rate, foreign currency and commodity price fluctuations associated with certain forecasted transactions. These derivative instruments are designated and qualify as cash flow hedges. Accordingly, the gain or loss on the derivative instrument is reported as a component of accumulated other comprehensive loss and reclassified into earnings in the same line item associated with the forecasted transaction and in the same period during which the hedged transaction affects earnings.
Pre-tax gains and losses recognized in other comprehensive income/(loss) were immaterial and a $2 million loss for the three months ended December 31, 2023 and 2022, respectively, and a $1 million gain and a $2 million gain for the six months ended December 31, 2023 and 2022, respectively. Gains recognized in accumulated other comprehensive loss and reclassified into earnings were $1 million and immaterial for the three months ended December 31, 2023 and 2022, respectively, and $2 million and immaterial for the six months ended December 31, 2023 and 2022, respectively. Gains currently included within accumulated other comprehensive loss associated with our cash flow hedges to be reclassified into net earnings within the next 12 months are $3 million.
Net Investment Hedges
We hedge the foreign currency risk associated with certain net investment positions in foreign subsidiaries. To accomplish this, we enter into cross-currency swaps that are designated as hedges of net investments.
During the six months ended December 31, 2016,2023, we entered into forward¥18 billion ($120 million) cross-currency swaps maturing in September 2025 and ¥18 billion ($120 million) cross-currency swaps maturing in June 2027.
During the six months ended December 31, 2023, we terminated the ¥38 billion ($300 million) cross-currency swaps entered into in January 2023 and received net settlement in cash of $28 million, recorded in proceeds from net investment hedge terminations in our condensed consolidated statements of cash flows.
| | | | | | | | |
| | |
36 | Cardinal Health | Q2Fiscal 2024 Form 10-Q | |
| | | | | | | | |
| Notes to Financial Statements | | |
Cross-currency swaps designated as net investment hedges are marked to market using the current spot exchange rate as of the end of the period, with gains and losses included in the foreign currency translation component of accumulated other comprehensive loss until the sale or substantial liquidation of the underlying net investments. To the extent the cross-currency swaps designated as net investment hedges are not highly effective, changes in carrying value attributable to the change in spot rates are recorded in earnings.
Pre-tax losses from net investment hedges recorded in the foreign currency translation component of accumulated other comprehensive loss were $16 million and $43 million during the three months ended December 31, 2023 and 2022, respectively, and $5 million and $21 million during the six months ended December 31, 2023 and 2022, respectively. Gains recognized in interest rate swaps withexpense, net in the condensed consolidated statements of earnings/(loss) for the portion of the net investment hedges excluded from the assessment of hedge effectiveness were $4 million during both the three months ended December 31, 2023 and 2022, and $7 million and $8 million during the six months ended December 31, 2023 and 2022, respectively.
Economic (Non-Designated) Hedges
We enter into foreign currency contracts to manage our foreign exchange exposure related to sales transactions, intercompany financing transactions and other balance sheet items subject to revaluation that do not meet the requirements for hedge accounting treatment. Accordingly, these derivative instruments are adjusted to current market value at the end of each period through earnings. The gain or loss recorded on these instruments is substantially offset by the remeasurement adjustment on the foreign currency denominated asset or liability. The settlement of the derivative instrument and the remeasurement adjustment on the foreign currency denominated asset or liability are both recorded in other (income)/expense, net. We recorded an immaterial loss and a total notional amount of $200$3 million to hedge probable, but not firmly committed, future transactions associated with our debt.gain during the three months ended December 31, 2023 and 2022, respectively, and an immaterial loss and a $3 million loss during the six months ended December 31, 2023 and 2022, respectively. The principal currencies managed through foreign currency contracts are the Chinese renminbi, Canadian dollar, Indian rupee, Euro and British pound.
Fair Value of Financial Instruments
The carrying amounts of cash and equivalents, trade receivables, accounts payable and other accrued liabilities at December 31, 20172023 and June 30, 20172023 approximate fair value due to their short-term maturities.
The following table summarizes the estimated fair value of our long-term obligations and other short-term borrowings compared to the respective carrying amounts at:
| | | (in millions) | December 31, 2017 | | June 30, 2017 | (in millions) | December 31, 2023 | | June 30, 2023 |
| Estimated fair value | $ | 9,801 |
| | $ | 10,713 |
|
| Carrying amount | 9,759 |
| | 10,395 |
|
The fair value of our long-term obligations and other short-term borrowings is estimated based on either the quoted market prices for the same or similar issues or other inputs derived from available market information, which represents a Level 2 measurement.
12. Redeemable Noncontrolling Interests10. Shareholders' Deficit
In connection withWe repurchased $750 million and $1.3 billion of our common shares, in the acquisition of a 71 percent ownership interest in naviHealthaggregate, through share repurchase programs during fiscal 2016, we recognized redeemable noncontrolling interest with a fair value of $119 million at the acquisition date.
During the six months ended December 31, 2017, certain third-party noncontrolling interest holders exercised their put right on the noncontrolling interest representing 16 percent of naviHealth with a redemption value of $103 million2023 and a carrying value of $109 million, which we settled in cash. As a result of this settlement, our ownership in naviHealth increased to 98 percent.
The following table summarizes activity in redeemable noncontrolling interests:
|
| | | |
| (in millions) | Redeemable Noncontrolling Interest |
| Balance at June 30, 2017 | $ | 118 |
|
| Net earnings attributable to redeemable noncontrolling interests | 2 |
|
| Net purchase of redeemable noncontrolling interests | (103 | ) |
| Adjustment of redeemable noncontrolling interests to redemption value | (4 | ) |
| Balance at December 31, 2017 | $ | 13 |
|
13. Shareholders' Equity
During the six months ended December 31, 2017, we repurchased 2.2 million common shares having an aggregate cost of $150 million. The average price paid per common share was $67.92.2022, respectively. We funded the repurchases with available cash and short-term borrowings.
During the six months ended December 31, 2016, we repurchased 8.1 million common shares having an aggregate cost of $600 million. The average price paid per common share was $74.08. We funded the repurchases with available cash.
The common shares repurchased are held in treasury to be used for general corporate purposes.
During the sixthree months ended December 31, 2016,2023, we retired 37entered into an accelerated share repurchase ("ASR") program to repurchase common shares for an aggregate purchase price of $250 million. We received an initial delivery of 2.0 million common shares using a reference price of $101.66. The program concluded on December 13, 2023 at a volume weighted average price per common share of $103.67 resulting in treasury.a final delivery of 0.4 million common shares.
During the three months ended September 30, 2023, we entered into an ASR program to repurchase common shares for an aggregate purchase price of $500 million. We received an initial delivery of 4.4 million common shares using a reference price of $90.57. The retirementprogram concluded on October 31, 2023 at a volume weighted average price per common share of these$88.22 resulting in a final delivery of 1.3 million common shares.
During the three months ended June 30, 2023, we entered into an ASR program to repurchase common shares had no impactfor an aggregate purchase of $500 million. We received an initial delivery of 4.6 million common shares using a reference price of $87.18. The program concluded on total shareholders' equity; however, it did impact certain individual componentsAugust 16, 2023 at a volume weighted average price per common share of shareholders' equity as follows: $2.5$91.15 resulting in a final delivery of 0.9 million common shares.
During the three months ended December 31, 2022, we entered into an ASR program to repurchase common shares for an aggregate purchase price of $250 million. We received an initial delivery of 2.6 million common shares using a reference price of $76.58. The program concluded on January 13, 2023 at a volume weighted average price per common share of $77.50 resulting in a final delivery of 0.6 million common shares.
During the three months ended September 30, 2022, we entered into an ASR program to repurchase common shares for an aggregate purchase price of $1.0 billion. We received an initial
| | | | | | | | |
| | |
37 | Cardinal Health |Q2Fiscal 20182024 Form 10-Q | | 28
| | | | | | | | |
| | |
| Notes to Financial Statements | | |
billion decrease indelivery of 12.0 million common shares using a reference price of $66.74. The program concluded on December 23, 2022 at a volume weighted average price per common share of $73.36 resulting in treasury, $302a final delivery of 1.6 million decrease in common shares, and $2.2 billion decrease in retained earnings.shares.
Accumulated Other Comprehensive Loss
The following table summarizestables summarize the changes in the balance of accumulated other comprehensive loss by component and in total:
| | | | | | | | | | | | | | | | | |
| (in millions) | Foreign
Currency
Translation
Adjustments | | Unrealized
Gain/(Loss) on
Derivatives,
net of tax | | Accumulated Other
Comprehensive
Loss |
| Balance at June 30, 2023 | $ | (137) | | | $ | (14) | | | $ | (151) | |
| Other comprehensive income/(loss), before reclassifications | (5) | | | 5 | | | — | |
| Amounts reclassified to earnings | — | | | (4) | | | (4) | |
| Total other comprehensive income/(loss) attributable to Cardinal Health, Inc., net of tax benefit of $1 million | (5) | | | 1 | | | (4) | |
| Balance at December 31, 2023 | $ | (142) | | | $ | (13) | | | $ | (155) | |
| | | | | | | | | | | | | | | | | |
| (in millions) | Foreign
Currency
Translation
Adjustments | | Unrealized
Gain/(Loss) on
Derivatives,
net of tax | | Accumulated Other
Comprehensive
Loss |
| Balance at June 30, 2022 | $ | (102) | | | $ | (12) | | | $ | (114) | |
| Other comprehensive income/(loss), before reclassifications | (38) | | | 11 | | | (27) | |
| Amounts reclassified to earnings | — | | | (5) | | | (5) | |
| Total other comprehensive loss attributable to Cardinal Health, Inc., net of tax benefit of $5 million | (38) | | | 6 | | | (32) | |
| Balance at December 31, 2022 | $ | (140) | | | $ | (6) | | | $ | (146) | |
|
| | | | | | | | | | | |
| (in millions) | Foreign Currency Translation Adjustments | | Unrealized Gain/(Loss) on Derivatives, net of tax | | Accumulated Other Comprehensive Loss |
| Balance at June 30, 2017 | $ | (148 | ) | | $ | 23 |
| | $ | (125 | ) |
| Other comprehensive income/(loss), before reclassifications | 31 |
| | (1 | ) | | 30 |
|
| Amounts reclassified to earnings | — |
| | — |
| | — |
|
| Other comprehensive income/(loss), net of tax | 31 |
| | (1 | ) | | 30 |
|
| Balance at December 31, 2017 | $ | (117 | ) | | $ | 22 |
| | $ | (95 | ) |
Activity related to realized and unrealized gains and losses on available-for-sale securities, as described in Note 6, was immaterial during the six months ended December 31, 2017.14. Earnings11. Earnings/(Loss) Per Share Attributable to Cardinal Health, Inc.
The following table reconcilestables reconcile the number of common shares used to compute basic and diluted earningsearnings/(loss) per share attributable to Cardinal Health, Inc.:
| | | | | | | | | | | |
| Three Months Ended December 31, |
| (in millions) | 2023 | | 2022 |
| Weighted-average common shares–basic | 245 | | | 261 | |
| Effect of dilutive securities: | | | |
| Employee stock options, restricted share units and performance share units | 1 | | | — | |
| Weighted-average common shares–diluted | 246 | | | 261 | |
|
| | | | | |
| | Three Months Ended December 31, |
| (in millions) | 2017 | | 2016 |
| Weighted-average common shares–basic | 315 |
| | 318 |
|
| Effect of dilutive securities: | | | |
| Employee stock options, restricted share units and performance share units | 1 |
| | 1 |
|
| Weighted-average common shares–diluted | 316 |
| | 319 |
|
| | | | Six Months Ended December 31, |
| Six Months Ended December 31, | | | Six Months Ended December 31, |
| (in millions) | 2017 | | 2016 | (in millions) | 2023 | | 2022 |
| Weighted-average common shares–basic | 315 |
| | 319 |
|
| Effect of dilutive securities: | | | |
| Employee stock options, restricted share units and performance share units | 2 |
| | 2 |
|
| Employee stock options, restricted share units and performance share units | |
| Employee stock options, restricted share units and performance share units | |
| Weighted-average common shares–diluted | 317 |
| | 321 |
|
The potentially dilutive employee stock options, restricted share units and performance share units that were antidilutive were 7 millionimmaterial and 41 million for the three months ended December 31, 2017 and 2016, respectively, and 6 million and 3 million for the six months ended December 31, 20172023, respectively.
The potentially dilutive employee stock options, restricted share units and 2016,performance share units that were antidilutive were 3 million and 5 million for the three and six months ended December 31, 2022, respectively.
For both the three and six months ended December 31, 2022, there were 2 million potentially dilutive employee stock options, restricted share units and performance share units not included in the computation of diluted loss per common share attributable to Cardinal Health, Inc. because their effect would have been antidilutive as a result of the net loss during those periods.15.12. Segment Information
Our operations are principally managed on a products and services basis and are comprised of two operating segments, which are the same as our reportable segments: Pharmaceutical and Medical. The factors for determining the reportable segments include the manner in which management evaluates performance for purposes of allocating resources and assessing performance combined with the nature of the individual business activities.
Our Pharmaceutical segment distributes branded and generic pharmaceutical, specialty pharmaceutical and over-the-counter healthcare and consumer products in the United States. This segment also provides services to pharmaceutical manufacturers and healthcare providers for specialty pharmaceutical products; provides pharmacy management services to hospitals and operates a limited number of pharmacies, including pharmacies in community health centers; operates nuclear pharmacies and radiopharmaceutical manufacturing facilities; and repackages generic pharmaceuticals and over-the-counter healthcare products.
Our Medical segment manufactures, sources and distributes Cardinal Health branded medical, surgical and laboratory products, which are sold in the United States, Canada, Europe, Asia and other markets. In addition to distributing Cardinal Health branded products, this segment also distributes a broad range of medical, surgical and laboratory products known as national brand products and provides supply chain services and solutions to hospitals, ambulatory surgery centers, clinical laboratories and other healthcare providers in the United States and Canada. This segment also distributes medical products to patients' homes in
| | | | | | | | |
| | |
38 | Cardinal Health | Q2Fiscal 2024 Form 10-Q | |
| | | | | | | | |
| Notes to Financial Statements | | |
the United States through our Cardinal Health at-Home Solutions division.
In January 2024, we announced a change in our organizational structure and have re-aligned our reporting structure under two reportable segments: Pharmaceutical and Specialty Solutions segment and Global Medical Products and Distribution segment. All remaining operating segments that are not significant enough to require separate reportable segment disclosures are included in Other. The following table presentsindicates the changes in our reporting structure effective January 1, 2024:
•Pharmaceutical and Specialty Solutions segment: This reportable segment will comprise all businesses formerly within our Pharmaceutical segment except Nuclear and Precision Health Solutions.
•Global Medical Products and Distribution segment: This reportable segment will comprise all businesses formerly within our Medical segment except at-Home Solutions and OptiFreight Logistics.
•Other: This will consist of the remaining operating segments, Nuclear and Precision Health Solutions, at-Home Solutions and OptiFreight Logistics.
Revenue
The following tables present revenue for each reportable segment, disaggregated revenue within our two reportable segments and Corporate:
| | | | | | | | | | | |
| Three Months Ended December 31, |
| (in millions) | 2023 | | 2022 |
| Pharmaceutical and Specialty Pharmaceutical Distribution and Services (1) | $ | 53,190 | | | $ | 47,391 | |
| Nuclear and Precision Health Solutions | 330 | | | 282 | |
| Pharmaceutical segment revenue | 53,520 | | | 47,673 | |
| Medical Products and Distribution (2) | 3,167 | | | 3,099 | |
| Cardinal Health at-Home Solutions | 761 | | | 698 | |
| Medical segment revenue | 3,928 | | | 3,797 | |
| Total segment revenue | 57,448 | | | 51,470 | |
| Corporate (3) | (3) | | | (1) | |
| Total revenue | $ | 57,445 | | | $ | 51,469 | |
|
| | | | | | | |
| | Three Months Ended December 31, |
| (in millions) | 2017 | | 2016 |
| Pharmaceutical | $ | 31,146 |
| | $ | 29,743 |
|
| Medical | 4,044 |
| | 3,410 |
|
| Total segment revenue | 35,190 |
| | 33,153 |
|
| Corporate (1) | (4 | ) | | (3 | ) |
| Total revenue | $ | 35,186 |
| | $ | 33,150 |
|
| | | | | | | | | | | |
| Six Months Ended December 31, |
| (in millions) | 2023 | | 2022 |
| Pharmaceutical and Specialty Pharmaceutical Distribution and Services (1) | $ | 103,872 | | | $ | 92,938 | |
| Nuclear and Precision Health Solutions | 654 | | | 563 | |
| Pharmaceutical segment revenue | 104,526 | | | 93,501 | |
| Medical Products and Distribution (2) | 6,243 | | | 6,239 | |
| Cardinal Health at-Home Solutions | 1,445 | | | 1,336 | |
| Medical segment revenue | 7,688 | | | 7,575 | |
| Total segment revenue | 112,214 | | | 101,076 | |
| Corporate (3) | (6) | | | (4) | |
| Total revenue | $ | 112,208 | | | $ | 101,072 | |
|
| | | | | | | |
| | Six Months Ended December 31, |
| (in millions) | 2017 | | 2016 |
| Pharmaceutical | $ | 60,066 |
| | $ | 58,505 |
|
| Medical | 7,768 |
| | 6,690 |
|
| Total segment revenue | 67,834 |
| | 65,195 |
|
| Corporate (1) | (7 | ) | | (6 | ) |
| Total revenue | $ | 67,827 |
| | $ | 65,189 |
|
| |
(1) | Corporate revenue consists of the elimination of inter-segment revenue and other revenue not allocated to the segments. |
(1)Comprised of all Pharmaceutical segment businesses except for Nuclear and Precision Health Solutions division.
(2)Comprised of all Medical segment businesses except for Cardinal Health at-Home Solutions division.
(3)Corporate revenue consists of the elimination of inter-segment revenue and other revenue not allocated to the segments.
The following tables present revenue by geographic area:
| | | | | | | | | | | |
| Three Months Ended December 31, |
| (in millions) | 2023 | | 2022 |
| United States | $ | 56,241 | | | $ | 50,333 | |
| International | 1,207 | | | 1,137 | |
| Total segment revenue | 57,448 | | | 51,470 | |
| Corporate (1) | (3) | | | (1) | |
| Total revenue | $ | 57,445 | | | $ | 51,469 | |
| | | | | | | | | | | |
| Six Months Ended December 31, |
| (in millions) | 2023 | | 2022 |
| United States | $ | 109,798 | | | $ | 98,810 | |
| International | 2,416 | | | 2,266 | |
| Total segment revenue | 112,214 | | | 101,076 | |
| Corporate (1) | (6) | | | (4) | |
| Total revenue | $ | 112,208 | | | $ | 101,072 | |
(1)Corporate revenue consists of the elimination of inter-segment revenue and other revenue not allocated to the segments.
Segment Profit
We evaluate segment performance based on segment profit, among other measures. Segment profit is segment revenue, less segment cost of products sold, less segment distribution, selling, general and administrative ("SG&A") expenses. Segment SG&A expenses include share-based compensation expense as well as allocated corporate expenses for shared functions, including corporate management, corporate finance, financial and customer care shared services, human resources, information technology and legal and compliance. The results attributable to noncontrolling interests are recorded within segment profit.compliance, including certain litigation defense costs. Corporate expenses are allocated to the segments based on headcount, level of benefit provided and other ratable allocation
| | | | | | | | |
| | |
39 | Cardinal Health | Q2Fiscal 2024 Form 10-Q | |
| | | | | | | | |
| Notes to Financial Statements | | |
methodologies. The results attributable to noncontrolling interests are recorded within segment profit.
We do not allocate the following items to our segments:
•last-in first-out, or ("LIFO"), inventory charges/(credits);
•surgical gown recall costs/(income);
•state opioid assessment related to prior fiscal years;
•shareholder cooperation agreement costs;
•restructuring and employee severance;
•amortization and other acquisition-related costs;
•impairments and (gain)/loss on disposal of assets; assets, net; in connection with goodwill impairment testing for the Medical Unit as discussed further in Note 4, we recognized cumulative pre-tax goodwill impairment charges of $581 million and $863 million during the six months ended December 31, 2023 and $709 million during the three months ended December 31, 2022; •litigation (recoveries)/charges, net;
•other income,(income)/expense, net;
•interest expense, net;
•loss on early extinguishment of debt; and
•provision for/(benefit from) income taxes.taxes
In addition, certain investment spending, certain portions of enterprise-wide incentive compensation and other spending are not allocated to the segments. Investment spending generally includes the first-year spend for certain projects that require incremental investments in the form of additional operating expenses. We
|
| | |
29
| Cardinal Health | Q2Fiscal 2018 Form 10-Q
| |
|
| | |
Notes to Financial Statements | | |
encourage our segments and corporate functions to identify investmentBecause approval for these projects that will promote innovation and provide future returns. As approval decisions for such projects areis dependent uponon executive management, thewe retain these expenses for such projects are often retained at Corporate. Investment spending within Corporate was $6$14 million and $1$5 million for the three months ended December 31, 20172023 and 2016,2022, respectively, and $11$20 million and $2$11 million for the six months ended December 31, 20172023 and 2016,2022, respectively.
The following table presentstables present segment profit by reportable segment and Corporate:
| | | | | | | | | | | |
| Three Months Ended December 31, |
| (in millions) | 2023 | | 2022 |
| Pharmaceutical | $ | 518 | | | $ | 464 | |
| Medical | 71 | | | 17 | |
| Total segment profit | 589 | | | 481 | |
| Corporate | (107) | | | (600) | |
| Total operating earnings/(loss) | $ | 482 | | | $ | (119) | |
|
| | | | | | | |
| | Three Months Ended December 31, |
| (in millions) | 2017 | | 2016 |
| Pharmaceutical | $ | 514 |
| | $ | 537 |
|
| Medical | 220 |
| | 159 |
|
| Total segment profit | 734 |
| | 696 |
|
| Corporate | (335 | ) | | (154 | ) |
| Total operating earnings | $ | 399 |
| | $ | 542 |
|
| | | | Six Months Ended December 31, |
| Six Months Ended December 31, | | | Six Months Ended December 31, |
| (in millions) | 2017 | | 2016 | (in millions) | 2023 | | 2022 |
| Pharmaceutical | $ | 981 |
| | $ | 1,071 |
|
| Medical | 348 |
| | 286 |
|
| Total segment profit | 1,329 |
| | 1,357 |
|
| Corporate | (668 | ) | | (281 | ) |
| Total operating earnings | $ | 661 |
| | $ | 1,076 |
|
| Total operating earnings/(loss) | |
The following table presents total assets for each reportable segment and Corporate at:
| | | | | | | | | | | |
| (in millions) | December 31,
2023 | | June 30,
2023 |
| Pharmaceutical | $ | 31,018 | | | $ | 28,077 | |
| Medical | 9,817 | | | 10,130 | |
| Corporate | 5,738 | | | 5,210 | |
| Total assets | $ | 46,573 | | | $ | 43,417 | |
|
| | | | | | | |
| (in millions) | December 31,
2017 | | June 30,
2017 |
| Pharmaceutical | $ | 23,014 |
| | $ | 21,848 |
|
| Medical | 17,993 |
| | 10,688 |
|
| Corporate | 1,898 |
| | 7,576 |
|
| Total assets | $ | 42,905 |
| | $ | 40,112 |
|
16.13. Share-Based Compensation
We maintain stock incentive plans (collectively, the “Plans”) for the benefit of certain of our officers, directors and employees.
The following table providestables provide total share-based compensation expense by type of award:
|
| | | | | | | |
| | Three Months Ended December 31, |
| (in millions) | 2017 | | 2016 |
| Restricted share unit expense | $ | 16 |
| | $ | 17 |
|
| Employee stock option expense | 5 |
| | 5 |
|
| Performance share unit expense | 2 |
| | 2 |
|
| Total share-based compensation | $ | 23 |
| | $ | 24 |
|
| | | | | | | | | | | |
| Three Months Ended December 31, |
| (in millions) | 2023 | | 2022 |
| Restricted share unit expense | $ | 17 | | | $ | 15 | |
| | | |
| Performance share unit expense | 11 | | | 10 | |
| Total share-based compensation | $ | 28 | | | $ | 25 | |
| | | | Six Months Ended December 31, |
| Six Months Ended December 31, | | | Six Months Ended December 31, |
| (in millions) | 2017 | | 2016 | (in millions) | 2023 | | 2022 |
| Restricted share unit expense | $ | 34 |
| | $ | 34 |
|
| Employee stock option expense | 10 |
| | 10 |
|
| | Performance share unit expense | |
| Performance share unit expense | |
| Performance share unit expense | (4 | ) | | 3 |
|
| Total share-based compensation | $ | 40 |
| | $ | 47 |
|
The total tax benefit related to share-based compensation was $5$4 million and $8$3 million for the three months ended December 31, 20172023 and 2016,2022, respectively, and $11$8 million and $16$6 million for the six months ended December 31, 20172023 and 2016,2022, respectively.
Restricted Share Units
Restricted share units granted under the Plans generally vest in equal annual installments over three years. Restricted share units accrue cash dividend equivalents that are payable upon vesting of the awards.
| | | | | | | | |
| | |
40 | Cardinal Health | Q2Fiscal 2024 Form 10-Q | |
| | | | | | | | |
| Notes to Financial Statements | | |
The following table summarizes all transactions related to restricted share units under the Plans:
| | | (in millions, except per share amounts) | Restricted Share Units | | Weighted-Average Grant Date Fair Value per Share | (in millions, except per share amounts) | Restricted Share Units | | Weighted-Average
Grant Date Fair
Value per Share |
| Nonvested at June 30, 2017 | 2 |
| | $ | 76.72 |
|
| Nonvested at June 30, 2023 | |
| Granted | 1 |
| | 66.10 |
|
| Vested | (1 | ) | | 79.80 |
|
| Canceled and forfeited | — |
| | — |
|
| Nonvested at December 31, 2017 | 2 |
| | $ | 67.92 |
|
| Nonvested at December 31, 2023 | |
At December 31, 2017,2023, the total pre-tax compensation cost, net of estimated forfeitures, related to nonvested restricted share units not yet recognized was $107$103 million, which is expected to be recognized over a weighted-average period of two years.
Stock Options
Employee stock options granted under the Plans generally vest in equal annual installments over three years and are exercisable for ten years from the grant date. All stock options are exercisable at a price equal to the market value of the common shares underlying the option on the grant date.
The following table summarizes all stock option transactions under the Plans:
|
| | | | | | |
| (in millions, except per share amounts) | Stock Options | | Weighted-Average Exercise Price per Common Share |
| Outstanding at June 30, 2017 | 6 |
| | $ | 63.44 |
|
| Granted | 2 |
| | 66.44 |
|
| Exercised | — |
| | — |
|
| Canceled and forfeited | — |
| | — |
|
| Outstanding at December 31, 2017 | 8 |
| | $ | 64.28 |
|
| Exercisable at December 31, 2017 | 5 |
| | $ | 59.14 |
|
At December 31, 2017, the total pre-tax compensation cost, net of estimated forfeitures, related to nonvested stock options not yet recognized was $31 million, which is expected to be recognized over
|
| | |
| Cardinal Health | Q2Fiscal 2018 Form 10-Q
| 30 |
|
| | |
Notes to Financial Statements | | |
a weighted-average period of two years. The following tables provide additional detail related to stock options:
|
| | | | | | | |
| (in millions) | December 31, 2017 | | June 30, 2017 |
| Aggregate intrinsic value of outstanding options at period end | $ | 47 |
| | $ | 109 |
|
| Aggregate intrinsic value of exercisable options at period end | 47 |
| | 106 |
|
|
| | | |
| (in years) | December 31, 2017 | | June 30, 2017 |
| Weighted-average remaining contractual life of outstanding options | 7 | | 7 |
| Weighted-average remaining contractual life of exercisable options | 6 | | 6 |
Performance Share Units
Performance share units vest over a three-year performance period based on achievement of specific performance goals. Based on the extent to which the targets are achieved, vested shares may range from zero to 200234 percent of the target award amount.amount for both the fiscal 2022 and 2023 grants and zero to 240 percent of the target award for the fiscal 2024 grant. Performance share units accrue cash dividend equivalents that are payable upon vesting of the awards.
The following table summarizes all transactions related to performance share units under the Plans (based on target award amounts):
| | | | | | | | | | | |
| (in millions, except per share amounts) | Performance
Share Units | | Weighted-Average
Grant Date Fair
Value per Share |
| Nonvested at June 30, 2023 | 1.2 | | | $ | 82.17 | |
| Granted | 0.6 | | | 94.66 | |
| Vested | (0.4) | | | 62.26 | |
| Canceled and forfeited | — | | | — | |
| Nonvested at December 31, 2023 | 1.4 | | | $ | 96.55 | |
|
| | | | | | |
| (in millions, except per share amounts) | Performance Share Units | | Weighted-Average Grant Date Fair Value per Share |
| Nonvested at June 30, 2017 | 0.6 |
| | $ | 77.83 |
|
| Granted | 0.2 |
| | 66.43 |
|
| Vested (1) | (0.2 | ) | | 71.57 |
|
| Canceled and forfeited | — |
| | — |
|
| Nonvested at December 31, 2017 | 0.6 |
| | $ | 75.14 |
|
(1) Vested based on achievement of 133 percent of the target performance goal.
At December 31, 2017,2023, the total pre-tax compensation cost, net of estimated forfeitures, related to nonvested performance share units not yet recognized was $16$60 million, which is expected to be recognized over a weighted-average period of two years if targetsperformance goals are achieved.
17.
14. Subsequent Events
On February 1, 2018,January 31, 2024, we closed on the sale of our China distribution businessannounced that we had entered into a definitive agreement to Shanghai Pharmaceuticals Holding Co., Ltd.acquire Specialty Networks, a technology-enabled multi-specialty group purchasing and practice enhancement organization for gross proceedsa purchase price of $1.2 billion in cash, subject to certain adjustments. Specialty Networks creates clinical and net proceeds of approximately $800 million.economic value for independent specialty providers and partners across multiple specialty GPOs: UroGPO, Gastrologix and GastroGPO, and United Rheumatology. The information needed to calculate the loss on sale was not available at the time these condensed consolidated financial statements were prepared. We estimated the loss as of December 31, 2017 to be $67 million, which we recognized as a write-down on the disposal groupacquisition will further expand our offering in impairmentskey therapeutic areas by enhancing our downstream provider-focused analytics capabilities and loss on disposal of assets inservice offerings and by accelerating our condensed consolidated statement of earnings.upstream data and research opportunities with biopharma manufacturers.
On January 3, 2018, we paid the remaining $60 million of the contract termination fee relatedThis transaction is subject to the agreementsatisfaction of customary closing conditions, including receipt of required regulatory approvals. We plan to transitionfund the distribution of our Medical segment's surgeon gloves in certain international markets from a third-party distribution arrangement to a direct distribution model.acquisition with available cash.
| | | | | | | | |
| | |
3141
| Cardinal Health | Q2Fiscal 20182024 Form 10-Q | |
Exhibits
| | | | | |
Exhibit
Number | Exhibit Description |
| |
Exhibit
Number
| Exhibit Description |
2.13.1 | Amendment No. 2, dated as of October 2, 2017, to Stock and Asset Purchase Agreement, dated as of March 2, 2015, by and between Ethicon, Inc. and Cardinal Health, Inc. (incorporated by reference to Exhibit 2.2 to Cardinal Health's Quarterly Report on Form 10-Q for the quarter ended September 30, 2017, File No. 1-11373) |
2.2 | |
3.1 | |
| 3.2 | |
10.1 | |
10.2 | |
10.3 | |
10.410.1 | |
12.131.1 | |
31.1 | |
| 31.2 | |
| 32.1 | |
| 99.1 | |
| 101.INS | XBRL Instance Document
| 101.SCH | Inline XBRL Taxonomy Extension Schema Document |
| 101.CAL | Inline XBRL Taxonomy Extension Calculation Linkbase Document |
| 101.DEF | Inline XBRL Taxonomy Definition Linkbase Document |
| 101.LAB | Inline XBRL Taxonomy Extension Label Linkbase Document |
| 101.PRE | Inline XBRL Taxonomy Extension Presentation Linkbase Document |
| 104 | Cover Page Interactive Data File - formatted in Inline XBRL (included as Exhibit 101) |
| * Certain schedules have been omitted pursuant to Item 601(a)(5) of Regulation S0-K under the Exchange Act. The company undertakes to furnish supplemental copies of any of the omitted schedules to the SEC upon request. |
Cardinal Health Website
Cardinal Health uses its website as a channel of distribution for material company information. Important information, including news releases, financial information, earnings and analyst presentations, and information about upcoming presentations and events is routinely posted and accessible at ir.cardinalhealth.com. In addition, the website allows investors and other interested persons to sign up automatically to receive e-mail alerts when the company postswe post news releases, SEC filings and certain other information on its website.
|
| | |
| Cardinal Health | Q2Fiscal 2018 Form 10-Q
| 32 |
| | | | | | | | |
| | |
42 | Cardinal Health | Q2Fiscal 2024 Form 10-Q | |
| | | | | | | | |
| Form 10-Q Cross Reference Index | | |
Form 10-Q Cross Reference Index
| | | | | | | | |
| Item Number | | Page |
| | |
| Item Number | Page |
| | |
| Part I. Financial Information | |
| Item 1 | | |
| Item 2 | | |
| Item 3 | | |
| Item 4 | | |
| | |
| Part II. Other Information | |
| Item 1 | | |
| Item 1A | | |
| Item 2 | | |
| Item 3 | Defaults Upon Senior Securities | N/A |
| Item 4 | Mine Safety Disclosures | N/A |
| Item 5 | | N/A |
Item 6 | | |
| Item 6 | | |
| | |
| | | | | | | | |
| | |
N/A43 | Not applicableCardinal Health | Q2Fiscal 2024 Form 10-Q | |
| | | | | | | | |
| Additional Information | | |
33
| Cardinal Health | Q2Fiscal 2018 Form 10-Q
| |
Signatures
Pursuant to the requirements of Section 13 or 15(d) of the Securities Exchange Act of 1934, the registrant has duly caused this report to be signed on its behalf by the undersigned, thereunto duly authorized.
| | | | | | | | |
| | Cardinal Health, Inc. |
| | |
| Date: | February 1, 2024 | /s/ JASON M. HOLLAR |
| | Jason M. Hollar |
| | Chief Executive Officer |
| | |
| | /s/ AARON E. ALT |
| | Aaron E. Alt |
| | Chief Financial Officer |
| | | | | | | | |
| | |
44 | | Cardinal Health Inc. |
| | |
Date: | February 8, 2018 | /s/ MICHAEL C. KAUFMANN |
| | Michael C. Kaufmann |
| | Chief Executive Officer |
| | |
| | /s/ JORGE M. GOMEZ |
| | Jorge M. Gomez |
| | Chief Financial Officer |
|
| | |
| Cardinal Health |Q2Fiscal 20182024 Form 10-Q
| | 34