UNITED STATES
SECURITIES AND EXCHANGE COMMISSION
Washington, D.C. 20549
FORM 10-Q
|
| | |
| (Mark one) | | |
| ☒ | QUARTERLY REPORT PURSUANT TO SECTION 13 OR 15(d) OF THE SECURITIES EXCHANGE ACT OF 1934 |
| | For the quarterly period ended September 30, 2017 |
For the quarterly period ended June 30, 2019
OR
|
| | |
| ☐ | TRANSITION REPORT PURSUANT TO SECTION 13 OR 15(d) OF THE SECURITIES EXCHANGE ACT OF 1934 | |
| | |
| | For the transition period from to | |
Commission file number: 1-8606
Verizon Communications Inc.
(Exact name of registrant as specified in its charter)
|
| | |
| Delaware | | 23-2259884 |
(State or other jurisdiction of incorporation or organization) | | (I.R.S. Employer Identification No.) |
|
| | | |
1095 Avenue of the Americas New York, New York
| | 10036 |
| New York | New York | | |
| (Address of principal executive offices) | | (Zip Code) |
Registrant’s telephone number, including area code: (212) (212) 395-1000
Securities registered pursuant to Section 12(b) of the Act:
|
| | | | |
| Title of Each Class | | Trading Symbol(s) | | Name of Exchange on Which Registered |
| Common Stock, par value $0.10 | | VZ | | New York Stock Exchange |
| Common Stock, par value $0.10 | | VZ | | The NASDAQ Global Select Market |
| 2.375% Notes due 2022 | | VZ22A | | New York Stock Exchange |
| 0.500% Notes due 2022 | | VZ22B | | New York Stock Exchange |
| 1.625% Notes due 2024 | | VZ24B | | New York Stock Exchange |
| 4.073% Notes due 2024 | | VZ24C | | New York Stock Exchange |
| 0.875% Notes due 2025 | | VZ25 | | New York Stock Exchange |
| 3.25% Notes due 2026 | | VZ26 | | New York Stock Exchange |
| 1.375% Notes due 2026 | | VZ26B | | New York Stock Exchange |
| 0.875% Notes due 2027 | | VZ27E | | New York Stock Exchange |
| 1.375% Notes due 2028 | | VZ28 | | New York Stock Exchange |
| 1.875% Notes due 2029 | | VZ29B | | New York Stock Exchange |
| 1.250% Notes due 2030 | | VZ30 | | New York Stock Exchange |
| 2.625% Notes due 2031 | | VZ31 | | New York Stock Exchange |
| 2.500% Notes due 2031 | | VZ31A | | New York Stock Exchange |
| 4.75% Notes due 2034 | | VZ34 | | New York Stock Exchange |
| 3.125% Notes due 2035 | | VZ35 | | New York Stock Exchange |
| 3.375% Notes due 2036 | | VZ36A | | New York Stock Exchange |
| 2.875% Notes due 2038 | | VZ38B | | New York Stock Exchange |
Indicate by check mark whether the registrant (1) has filed all reports required to be filed by Section 13 or 15(d) of the Securities Exchange Act of 1934 during the preceding 12 months (or for such shorter period that the registrant was required to file such reports), and (2) has been subject to such filing requirements for the past 90 days. ☒ Yes ☐ No
Indicate by check mark whether the registrant has submitted electronically and posted on its corporate Web site, if any, every Interactive Data File required to be submitted and posted pursuant to Rule 405 of Regulation S-T (§232.405 of this chapter) during the preceding 12 months (or for such shorter period that the registrant was required to submit and post such files). ☒ Yes ☐ No
Indicate by check mark whether the registrant is a large accelerated filer, an accelerated filer, a non-accelerated filer, smaller reporting company, or an emerging growth company. See the definitions of “large accelerated filer,” “accelerated filer,” “smaller reporting company,” and “emerging growth company” in Rule 12b-2 of the Exchange Act.
|
| | | | | |
| Indicate by check mark whether the registrant is a large accelerated filer, an accelerated filer, a non-accelerated filer, a smaller reporting company, or an emerging growth company. See the definitions of "large accelerated filer," "accelerated filer," "smaller reporting company," and "emerging growth company" in Rule 12b-2 of the Exchange Act. |
| | | | | |
| Large accelerated filer | ☒ | ☒ | Accelerated filer | | ☐ |
| Non-accelerated filer | ☐ | ☐ (Do not check if a smaller reporting company) | Smaller reporting company | | ☐ |
| | | | Emerging growth company | | ☐ |
If an emerging growth company, indicate by check mark if the registrant has elected not to use the extended transition period for complying with any new or revised financial accounting standards provided pursuant to Section 13(a) of the Exchange Act. ☐
Indicate by check mark whether the registrant is a shell company (as defined in Rule 12b-2 of the Exchange Act). ☐ Yes ☒ No
At SeptemberJune 30, 2017, 4,079,440,8362019, 4,135,764,809 shares of the registrant’s common stock were outstanding, after deducting 162,933,404155,668,837 shares held in treasury.
|
|
Table of ContentsTABLE OF CONTENTS |
|
| | |
| Item No. | | Page |
| | |
| |
| | | |
| Item 1. | | |
| | | |
| | | |
| | Three and ninesix months ended SeptemberJune 30, 20172019 and 20162018 | |
| | | |
| | | |
| | Three and ninesix months ended SeptemberJune 30, 20172019 and 20162018 | |
| | | |
| | | |
| | At SeptemberJune 30, 20172019 and December 31, 20162018 | |
| | | |
| | | |
| | NineSix months ended SeptemberJune 30, 20172019 and 20162018 | |
| | | |
| | | |
| | | |
| Item 2. | | |
| | | |
| Item 3. | | |
| | | |
| Item 4. | | |
| | |
| |
| | | |
| Item 1. | | |
| | | |
| Item 1A. | | |
| | | |
| Item 2. | | |
| | | |
| Item 6. | | |
| | |
| |
| | |
| |
|
|
| Part I - Financial Information |
|
|
| Item 1. Financial Statements (Unaudited) |
|
|
Condensed Consolidated Statements of Income Verizon Communications Inc. and Subsidiaries |
|
| | | | | | | | | | | | | | | |
| | Three Months Ended | | | Six Months Ended | |
| | June 30, | | | June 30, | |
| (dollars in millions, except per share amounts) (unaudited) | 2019 |
| | 2018 |
| | 2019 |
| | 2018 |
|
| | | | | | | | |
| Operating Revenues | | | | | | | |
| Service revenues and other | $ | 27,351 |
| | $ | 27,159 |
| | $ | 54,548 |
| | $ | 53,891 |
|
| Wireless equipment revenues | 4,720 |
| | 5,044 |
| | 9,651 |
| | 10,084 |
|
| Total Operating Revenues | 32,071 |
| | 32,203 |
| | 64,199 |
| | 63,975 |
|
| | | | | | | | |
| Operating Expenses | | | | | | | |
| Cost of services (exclusive of items shown below) | 7,702 |
| | 8,234 |
| | 15,494 |
| | 16,180 |
|
| Cost of wireless equipment | 5,019 |
| | 5,397 |
| | 10,217 |
| | 10,706 |
|
| Selling, general and administrative expense | 7,268 |
| | 7,605 |
| | 14,466 |
| | 14,449 |
|
| Depreciation and amortization expense | 4,232 |
| | 4,350 |
| | 8,463 |
| | 8,674 |
|
| Total Operating Expenses | 24,221 |
| | 25,586 |
| | 48,640 |
| | 50,009 |
|
| | | | | | | | |
| Operating Income | 7,850 |
| | 6,617 |
| | 15,559 |
| | 13,966 |
|
| Equity in losses of unconsolidated businesses | (13 | ) | | (228 | ) | | (19 | ) | | (247 | ) |
| Other income (expense), net | (1,312 | ) | | 360 |
| | (1,017 | ) | | 285 |
|
| Interest expense | (1,215 | ) | | (1,222 | ) | | (2,425 | ) | | (2,423 | ) |
| Income Before Provision For Income Taxes | 5,310 |
| | 5,527 |
| | 12,098 |
| | 11,581 |
|
| Provision for income taxes | (1,236 | ) | | (1,281 | ) | | (2,864 | ) | | (2,669 | ) |
| Net Income | $ | 4,074 |
| | $ | 4,246 |
| | $ | 9,234 |
| | $ | 8,912 |
|
| | | | | | | | |
| Net income attributable to noncontrolling interests | $ | 130 |
| | $ | 126 |
| | $ | 258 |
| | $ | 247 |
|
| Net income attributable to Verizon | 3,944 |
| | 4,120 |
| | 8,976 |
| | 8,665 |
|
| Net Income | $ | 4,074 |
| | $ | 4,246 |
| | $ | 9,234 |
| | $ | 8,912 |
|
| | | | | | | | |
| Basic Earnings Per Common Share | | | | | | | |
| Net income attributable to Verizon | $ | 0.95 |
| | $ | 1.00 |
| | $ | 2.17 |
| | $ | 2.10 |
|
| Weighted-average shares outstanding (in millions) | 4,138 |
| | 4,135 |
| | 4,138 |
| | 4,120 |
|
| | | | | | | | |
| Diluted Earnings Per Common Share | | | | | | | |
| Net income attributable to Verizon | $ | 0.95 |
| | $ | 1.00 |
| | $ | 2.17 |
| | $ | 2.10 |
|
| Weighted-average shares outstanding (in millions) | 4,139 |
| | 4,139 |
| | 4,140 |
| | 4,123 |
|
See Notes to Condensed Consolidated Financial Statements
|
|
Condensed Consolidated Statements of Comprehensive Income Verizon Communications Inc. and Subsidiaries |
|
| | | | | | | | | | | | | | | |
| | Three Months Ended | | | Nine Months Ended | |
| | September 30, | | | September 30, | |
| (dollars in millions, except per share amounts) (unaudited) | 2017 |
| | 2016 |
| | 2017 |
| | 2016 |
|
| | | | | | | | |
| Operating Revenues | | | | | | | |
| Service revenues and other | $ | 27,365 |
| | $ | 26,813 |
| | $ | 79,665 |
| | $ | 81,858 |
|
| Wireless equipment revenues | 4,352 |
| | 4,124 |
| | 12,414 |
| | 11,782 |
|
| Total Operating Revenues | 31,717 |
| | 30,937 |
| | 92,079 |
| | 93,640 |
|
| | | | | | | | |
| Operating Expenses | | | | | | | |
| Cost of services (exclusive of items shown below) | 7,640 |
| | 6,989 |
| | 21,573 |
| | 22,180 |
|
| Wireless cost of equipment | 4,965 |
| | 5,240 |
| | 14,808 |
| | 14,882 |
|
| Selling, general and administrative expense (including net gain on sale of divested | | | | | | | |
| businesses of $1,774 and $1,007 for the nine months ended September 30, 2017 | | | | | | | |
| and 2016, respectively) | 7,632 |
| | 8,226 |
| | 20,579 |
| | 25,601 |
|
| Depreciation and amortization expense | 4,272 |
| | 3,942 |
| | 12,498 |
| | 11,941 |
|
| Total Operating Expenses | 24,509 |
| | 24,397 |
| | 69,458 |
| | 74,604 |
|
| | | | | | | | |
| Operating Income | 7,208 |
| | 6,540 |
| | 22,621 |
| | 19,036 |
|
| Equity in losses of unconsolidated businesses | (22 | ) | | (23 | ) | | (71 | ) | | (63 | ) |
| Other income (expense), net | (511 | ) | | 97 |
| | (1,376 | ) | | (1,697 | ) |
| Interest expense | (1,164 | ) | | (1,038 | ) | | (3,514 | ) | | (3,239 | ) |
| Income Before Provision For Income Taxes | 5,511 |
| | 5,576 |
| | 17,660 |
| | 14,037 |
|
| Provision for income taxes | (1,775 | ) | | (1,829 | ) | | (5,893 | ) | | (5,029 | ) |
| Net Income | $ | 3,736 |
| | $ | 3,747 |
| | $ | 11,767 |
| | $ | 9,008 |
|
| | | | | | | | |
| Net income attributable to noncontrolling interests | $ | 116 |
| | $ | 127 |
| | $ | 335 |
| | $ | 376 |
|
| Net income attributable to Verizon | 3,620 |
| | 3,620 |
| | 11,432 |
| | 8,632 |
|
| Net Income | $ | 3,736 |
| | $ | 3,747 |
| | $ | 11,767 |
| | $ | 9,008 |
|
| | | | | | | | |
| Basic Earnings Per Common Share | | | | | | | |
| Net income attributable to Verizon | $ | 0.89 |
| | $ | 0.89 |
| | $ | 2.80 |
| | $ | 2.12 |
|
| Weighted-average shares outstanding (in millions) | 4,084 |
| | 4,079 |
| | 4,083 |
| | 4,080 |
|
| | | | | | | | |
| Diluted Earnings Per Common Share | | | | | | | |
| Net income attributable to Verizon | $ | 0.89 |
| | $ | 0.89 |
| | $ | 2.80 |
| | $ | 2.11 |
|
| Weighted-average shares outstanding (in millions) | 4,089 |
| | 4,086 |
| | 4,088 |
| | 4,086 |
|
| | | | | | | | |
| Dividends declared per common share | $ | 0.5900 |
| | $ | 0.5775 |
| | $ | 1.7450 |
| | $ | 1.7075 |
|
|
| | | | | | | | | | | | | | | |
| | Three Months Ended | | | Six Months Ended | |
| | June 30, | | | June 30, | |
| (dollars in millions) (unaudited) | 2019 |
| | 2018 |
| | 2019 |
| | 2018 |
|
| | | | | | | | |
| Net Income | $ | 4,074 |
| | $ | 4,246 |
| | $ | 9,234 |
| | $ | 8,912 |
|
| Other Comprehensive Income (Loss), Net of Tax (Expense) Benefit | | | | | | | |
| Foreign currency translation adjustments, net of tax of $3, $13, $(2) and $6 | (67 | ) | | (176 | ) | | (43 | ) | | (83 | ) |
| Unrealized gain (loss) on cash flow hedges, net of tax of $193, $55, $198 and $(125) | (537 | ) | | (152 | ) | | (550 | ) | | 349 |
|
| Unrealized gain (loss) on marketable securities, net of tax of $0, $0, $(2) and $1 | 4 |
| | 1 |
| | 8 |
| | (4 | ) |
| Defined benefit pension and postretirement plans, net of tax of $56, $58, $112 and $118 | (169 | ) | | (173 | ) | | (338 | ) | | (346 | ) |
| Other comprehensive loss attributable to Verizon | (769 | ) | | (500 | ) | | (923 | ) | | (84 | ) |
| Total Comprehensive Income | $ | 3,305 |
| | $ | 3,746 |
| | $ | 8,311 |
| | $ | 8,828 |
|
| | | | | | | | |
| Comprehensive income attributable to noncontrolling interests | $ | 130 |
| | $ | 126 |
| | $ | 258 |
| | $ | 247 |
|
| Comprehensive income attributable to Verizon | 3,175 |
| | 3,620 |
| | 8,053 |
| | 8,581 |
|
| Total Comprehensive Income | $ | 3,305 |
| | $ | 3,746 |
| | $ | 8,311 |
| | $ | 8,828 |
|
See Notes to Condensed Consolidated Financial Statements
Condensed Consolidated Statements of Comprehensive Income |
|
Condensed Consolidated Balance Sheets Verizon Communications Inc. and Subsidiaries |
Verizon Communications Inc. and Subsidiaries
|
| | | | | | | | | | | | | | | |
| | Three Months Ended | | | Nine Months Ended | |
| | September 30, | | | September 30, | |
| (dollars in millions) (unaudited) | 2017 |
| | 2016 |
| | 2017 |
| | 2016 |
|
| | | | | | | | |
| Net Income | $ | 3,736 |
| | $ | 3,747 |
| | $ | 11,767 |
| | $ | 9,008 |
|
| Other Comprehensive Income (loss), net of taxes | | | | | | | |
| Foreign currency translation adjustments | 117 |
| | (78 | ) | | 205 |
| | (23 | ) |
| Unrealized gain (loss) on cash flow hedges | 104 |
| | 147 |
| | (94 | ) | | (58 | ) |
| Unrealized gain (loss) on marketable securities | 1 |
| | (19 | ) | | (5 | ) | | (35 | ) |
| Defined benefit pension and postretirement plans | 177 |
| | (139 | ) | | (96 | ) | | 2,324 |
|
| Other comprehensive income (loss) attributable to Verizon | 399 |
| | (89 | ) | | 10 |
| | 2,208 |
|
| Total Comprehensive Income | $ | 4,135 |
| | $ | 3,658 |
| | $ | 11,777 |
| | $ | 11,216 |
|
| | | | | | | | |
| Comprehensive income attributable to noncontrolling interests | $ | 116 |
| | $ | 127 |
| | $ | 335 |
| | $ | 376 |
|
| Comprehensive income attributable to Verizon | 4,019 |
| | 3,531 |
| | 11,442 |
| | 10,840 |
|
| Total Comprehensive Income | $ | 4,135 |
| | $ | 3,658 |
| | $ | 11,777 |
| | $ | 11,216 |
|
|
| | | | | | | |
| | At June 30, |
| | At December 31, |
|
| (dollars in millions, except per share amounts) (unaudited) | 2019 |
| | 2018 |
|
| | | | |
| Assets | | | |
| Current assets | | | |
| Cash and cash equivalents | $ | 1,949 |
| | $ | 2,745 |
|
| Accounts receivable, net of allowances of $745 and $765 | 24,926 |
| | 25,102 |
|
| Inventories | 1,167 |
| | 1,336 |
|
| Prepaid expenses and other | 5,266 |
| | 5,453 |
|
| Total current assets | 33,308 |
| | 34,636 |
|
| | | | |
| Property, plant and equipment | 257,395 |
| | 252,835 |
|
| Less accumulated depreciation | 169,577 |
| | 163,549 |
|
| Property, plant and equipment, net | 87,818 |
| | 89,286 |
|
| | | | |
| Investments in unconsolidated businesses | 650 |
| | 671 |
|
| Wireless licenses | 94,333 |
| | 94,130 |
|
| Goodwill | 24,632 |
| | 24,614 |
|
| Other intangible assets, net | 9,474 |
| | 9,775 |
|
| Operating lease right-of-use assets | 22,467 |
| | — |
|
| Other assets | 10,426 |
| | 11,717 |
|
| Total assets | $ | 283,108 |
| | $ | 264,829 |
|
| | | | |
| Liabilities and Equity | | | |
| Current liabilities | | | |
| Debt maturing within one year | $ | 8,773 |
| | $ | 7,190 |
|
| Accounts payable and accrued liabilities | 17,633 |
| | 22,501 |
|
| Current operating lease liabilities | 3,154 |
| | — |
|
| Other current liabilities | 8,654 |
| | 8,239 |
|
| Total current liabilities | 38,214 |
| | 37,930 |
|
| | | | |
| Long-term debt | 104,598 |
| | 105,873 |
|
| Employee benefit obligations | 18,040 |
| | 18,599 |
|
| Deferred income taxes | 34,225 |
| | 33,795 |
|
| Non-current operating lease liabilities | 18,254 |
| | — |
|
| Other liabilities | 11,830 |
| | 13,922 |
|
| Total long-term liabilities | 186,947 |
| | 172,189 |
|
| | | | |
| Commitments and Contingencies (Note 12) |
| |
|
| | | | |
| Equity | | | |
| Series preferred stock ($0.10 par value; 250,000,000 shares authorized; none issued) | — |
| | — |
|
| Common stock ($0.10 par value; 6,250,000,000 shares authorized in each period; 4,291,433,646 issued in each period) | 429 |
| | 429 |
|
| Additional paid in capital | 13,419 |
| | 13,437 |
|
| Retained earnings | 47,945 |
| | 43,542 |
|
| Accumulated other comprehensive income | 1,447 |
| | 2,370 |
|
| Common stock in treasury, at cost (155,668,837 and 159,400,267 shares outstanding) | (6,823 | ) | | (6,986 | ) |
| Deferred compensation – employee stock ownership plans and other | 165 |
| | 353 |
|
| Noncontrolling interests | 1,365 |
| | 1,565 |
|
| Total equity | 57,947 |
| | 54,710 |
|
| Total liabilities and equity | $ | 283,108 |
| | $ | 264,829 |
|
See Notes to Condensed Consolidated Financial Statements
Condensed Consolidated Balance Sheets |
|
Condensed Consolidated Statements of Cash Flows Verizon Communications Inc. and Subsidiaries |
|
| | | | | | | |
| | At September 30, |
| | At December 31, |
|
| (dollars in millions, except per share amounts) (unaudited) | 2017 |
| | 2016 |
|
| | | | |
| Assets | | | |
| Current assets | | | |
| Cash and cash equivalents | $ | 4,487 |
| | $ | 2,880 |
|
| Accounts receivable, net of allowances of $908 and $845 | 21,549 |
| | 17,513 |
|
| Inventories | 1,276 |
| | 1,202 |
|
| Assets held for sale | 275 |
| | 882 |
|
| Prepaid expenses and other | 3,280 |
| | 3,918 |
|
| Total current assets | 30,867 |
| | 26,395 |
|
| | | | |
| Plant, property and equipment | 242,608 |
| | 232,215 |
|
| Less accumulated depreciation | 155,986 |
| | 147,464 |
|
| Plant, property and equipment, net | 86,622 |
| | 84,751 |
|
| | | | |
| Investments in unconsolidated businesses | 1,054 |
| | 1,110 |
|
| Wireless licenses | 87,883 |
| | 86,673 |
|
| Goodwill | 28,725 |
| | 27,205 |
|
| Other intangible assets, net | 10,993 |
| | 8,897 |
|
| Non-current assets held for sale | — |
| | 613 |
|
| Other assets | 8,538 |
| | 8,536 |
|
| Total assets | $ | 254,682 |
| | $ | 244,180 |
|
| | | | |
| Liabilities and Equity | | | |
| Current liabilities | | | |
| Debt maturing within one year | $ | 2,180 |
| | $ | 2,645 |
|
| Accounts payable and accrued liabilities | 18,434 |
| | 19,593 |
|
| Other | 8,316 |
| | 8,102 |
|
| Total current liabilities | 28,930 |
| | 30,340 |
|
| | | | |
| Long-term debt | 115,317 |
| | 105,433 |
|
| Employee benefit obligations | 21,131 |
| | 26,166 |
|
| Deferred income taxes | 48,345 |
| | 45,964 |
|
| Other liabilities | 12,508 |
| | 12,245 |
|
| | | | |
| Equity | | | |
| Series preferred stock ($.10 par value; none issued) | — |
| | — |
|
| Common stock ($.10 par value; 4,242,374,240 shares issued in each period) | 424 |
| | 424 |
|
| Contributed capital | 11,098 |
| | 11,182 |
|
| Reinvested earnings | 19,373 |
| | 15,059 |
|
| Accumulated other comprehensive income | 2,683 |
| | 2,673 |
|
| Common stock in treasury, at cost | (7,141 | ) | | (7,263 | ) |
| Deferred compensation – employee stock ownership plans and other | 411 |
| | 449 |
|
| Noncontrolling interests | 1,603 |
| | 1,508 |
|
| Total equity | 28,451 |
| | 24,032 |
|
| Total liabilities and equity | $ | 254,682 |
| | $ | 244,180 |
|
|
| | | | | | | |
| | Six Months Ended | |
| | June 30, | |
| (dollars in millions) (unaudited) | 2019 |
| | 2018 |
|
| | | | |
| Cash Flows from Operating Activities | | | |
| Net Income | $ | 9,234 |
| | $ | 8,912 |
|
| Adjustments to reconcile net income to net cash provided by operating activities: | | | |
| Depreciation and amortization expense | 8,463 |
| | 8,674 |
|
| Employee retirement benefits | (294 | ) | | (300 | ) |
| Deferred income taxes | 588 |
| | 1,354 |
|
| Provision for uncollectible accounts | 738 |
| | 462 |
|
| Equity in losses of unconsolidated businesses, net of dividends received | 50 |
| | 268 |
|
| Changes in current assets and liabilities, net of effects from acquisition/disposition of businesses | (4,593 | ) | | (1,538 | ) |
| Discretionary employee benefits contributions | (300 | ) | | (1,679 | ) |
| Other, net | 1,950 |
| | 280 |
|
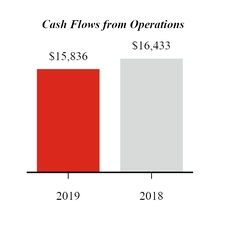
| Net cash provided by operating activities | 15,836 |
| | 16,433 |
|
| | | | |
| Cash Flows from Investing Activities | | | |
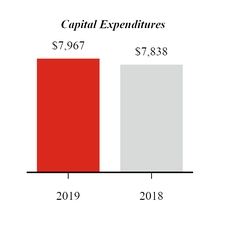
| Capital expenditures (including capitalized software) | (7,967 | ) | | (7,838 | ) |
| Acquisitions of businesses, net of cash acquired | (28 | ) | | (38 | ) |
| Acquisitions of wireless licenses | (199 | ) | | (1,155 | ) |
| Other, net | (395 | ) | | 303 |
|
| Net cash used in investing activities | (8,589 | ) | | (8,728 | ) |
| | | | |
| Cash Flows from Financing Activities | | | |
| Proceeds from long-term borrowings | 6,237 |
| | 4,584 |
|
| Proceeds from asset-backed long-term borrowings | 3,982 |
| | 1,716 |
|
| Repayments of long-term borrowings and finance lease obligations | (9,630 | ) | | (6,568 | ) |
| Repayments of asset-backed long-term borrowings | (2,817 | ) | | (2,000 | ) |
| Dividends paid | (4,981 | ) | | (4,845 | ) |
| Other, net | (834 | ) | | (752 | ) |
| Net cash used in financing activities | (8,043 | ) | | (7,865 | ) |
| | | | |
| Decrease in cash, cash equivalents and restricted cash | (796 | ) | | (160 | ) |
| Cash, cash equivalents and restricted cash, beginning of period | 3,916 |
| | 2,888 |
|
| Cash, cash equivalents and restricted cash, end of period (Note 1) | $ | 3,120 |
| | $ | 2,728 |
|
See Notes to Condensed Consolidated Financial Statements
Condensed Consolidated Statements of Cash Flows
Verizon Communications Inc. and Subsidiaries
|
| | | | | | | |
| | Nine Months Ended | |
| | September 30, | |
| (dollars in millions) (unaudited) | 2017 |
| | 2016 |
|
| | | | |
| Cash Flows from Operating Activities | | | |
| Net Income | $ | 11,767 |
| | $ | 9,008 |
|
| Adjustments to reconcile net income to net cash provided by operating activities: | | | |
| Depreciation and amortization expense | 12,498 |
| | 11,941 |
|
| Employee retirement benefits | (334 | ) | | 4,531 |
|
| Deferred income taxes | 2,577 |
| | (2,331 | ) |
| Provision for uncollectible accounts | 842 |
| | 963 |
|
| Equity in losses of unconsolidated businesses, net of dividends received | 100 |
| | 94 |
|
| Changes in current assets and liabilities, net of effects from acquisition/disposition of businesses | (5,513 | ) | | (4,010 | ) |
| Discretionary contributions to qualified pension plans | (3,411 | ) | | (186 | ) |
| Net gain on sale of divested businesses | (1,774 | ) | | (1,007 | ) |
| Other, net | 469 |
| | (1,279 | ) |
| Net cash provided by operating activities | 17,221 |
| | 17,724 |
|
| | | | |
| Cash Flows from Investing Activities | | | |
| Capital expenditures (including capitalized software) | (11,282 | ) | | (11,398 | ) |
| Acquisitions of businesses, net of cash acquired | (6,295 | ) | | (963 | ) |
| Acquisitions of wireless licenses | (469 | ) | | (410 | ) |
| Proceeds from dispositions of businesses | 3,614 |
| | 9,882 |
|
| Other, net | 731 |
| | 350 |
|
| Net cash used in investing activities | (13,701 | ) | | (2,539 | ) |
| | | | |
| Cash Flows from Financing Activities | | | |
| Proceeds from long-term borrowings | 21,915 |
| | 8,152 |
|
| Proceeds from asset-backed long-term borrowings | 2,878 |
| | 2,594 |
|
| Repayments of long-term borrowings and capital lease obligations | (16,457 | ) | | (14,510 | ) |
| Decrease in short-term obligations, excluding current maturities | (160 | ) | | (120 | ) |
| Dividends paid | (7,067 | ) | | (6,908 | ) |
| Other, net | (3,022 | ) | | (2,422 | ) |
| Net cash used in financing activities | (1,913 | ) | | (13,214 | ) |
| | | | |
| Increase in cash and cash equivalents | 1,607 |
| | 1,971 |
|
| Cash and cash equivalents, beginning of period | 2,880 |
| | 4,470 |
|
| Cash and cash equivalents, end of period | $ | 4,487 |
| | $ | 6,441 |
|
See Notes to Condensed Consolidated Financial Statements
Notes to Condensed Consolidated Financial Statements
Verizon Communications Inc. and Subsidiaries
(Unaudited)
|
|
Notes to Condensed Consolidated Financial Statements(Unaudited) Verizon Communications Inc. and Subsidiaries |
|
| |
| Note 1. | Basis of Presentation |
The accompanying unaudited condensed consolidated financial statements have been prepared in accordance with generally accepted accounting principles (GAAP) in the United States (U.S.) and based upon Securities and Exchange Commission (SEC) rules that permit reduced disclosure for interim periods. For a more complete discussion of significant accounting policies and certain other information, you should refer to the financial statements included in theof Verizon Communications Inc. (Verizon or the Company) included in our Annual Report on Form 10-K for the year ended December 31, 2016.2018. These financial statements reflect all adjustments that are necessary for a fair presentation of results of operations and financial condition for the interim periods shown, including normal recurring accruals and other items. The results for the interim periods are not necessarily indicative of results for the full year.
In November 2018, we announced a strategic reorganization of our business. Under the new structure, effective April 1, 2019, there are two reportable segments that we operate and manage as strategic business units - Verizon Consumer Group (Consumer) and Verizon Business Group (Business). In conjunction with the new reporting structure, we recast our segment disclosures for all periods presented.
Our Consumer segment provides consumer-focused wireless and wireline communications services and products. Our wireless services are provided across one of the most extensive wireless networks in the U.S. under the Verizon Wireless brand and through wholesale and other arrangements. Our wireline services are provided in nine states in the Mid-Atlantic and Northeastern U.S., as well as Washington D.C., over our 100% fiber-optic network under the Fios brand and over a traditional copper-based network to customers who are not served by Fios. Our Consumer segment’s wireless and wireline products and services are available to our retail customers, as well as resellers that purchase wireless network access from us on a wholesale basis.
Our Business segment provides wireless and wireline communications services and products, video and data services, corporate networking solutions, security and managed network services, local and long distance voice services and network access to deliver various Internet of Things (IoT) services and products. We provide these products and services to businesses, government customers and wireless and wireline carriers across the U.S. and select products and services to customers around the world.
Basis of Presentation
We have reclassified certain prior periodyear amounts to conform to the current period presentation.year presentation, including impacts for changes in our reportable segments.
Earnings Per Common Share
There were a total of approximately 52 million outstanding dilutive securities, primarily consisting of restricted stock units, included in the computation of diluted earnings per common share for both the three and ninesix months ended SeptemberJune 30, 2017, respectively.2019. There were a total of approximately 7 million and 64 million outstanding dilutive securities, primarily consisting of restricted stock units, included in the computation of diluted earnings per common share for both the three and ninesix months ended SeptemberJune 30, 2016, respectively.2018.
Cash, Cash Equivalents and Restricted Cash
We consider all highly liquid investments with an original maturity of 90 days or less when purchased to be cash equivalents. Cash equivalents are stated at cost, which approximates quoted market value and includes amounts held in money market funds.
Cash collections on the device payment plan agreement receivables collateralizing asset-backed debt securities are required at certain specified times to be placed into segregated accounts. Deposits to the segregated accounts are considered restricted cash and are included in Prepaid expenses and other and Other assets in our condensed consolidated balance sheets.
Cash, cash equivalents and restricted cash are included in the following line items on the condensed consolidated balance sheets:
|
| | | | | | | | | | | |
| | At June 30, |
| | At December 31, |
| | Increase / (Decrease) |
|
| (dollars in millions) | 2019 |
| | 2018 |
| |
| Cash and cash equivalents | $ | 1,949 |
| | $ | 2,745 |
| | $ | (796 | ) |
| Restricted cash: | | | | | |
| Prepaid expenses and other | 1,055 |
| | 1,047 |
| | 8 |
|
| Other assets | 116 |
| | 124 |
| | (8 | ) |
| Cash, cash equivalents and restricted cash | $ | 3,120 |
| | $ | 3,916 |
| | $ | (796 | ) |
Goodwill
Goodwill is the excess of the acquisition cost of businesses over the fair value of the identifiable net assets acquired. Impairment testing for goodwill is performed annually in the fourth quarter or more frequently if impairment indicators are present. We transitioned into our new segment reporting structure effective April 1, 2019, which resulted in certain changes to our operating segments and reporting units. Upon the
date of reorganization, the goodwill of our historical Wireless reporting unit, historical Wireline reporting unit and historical Verizon Connect reporting unit were reallocated to our new Consumer and Business reporting units using a relative fair value approach.
We performed an impairment assessment of the impacted reporting units, specifically our historical Wireless, historical Wireline and historical Connect reporting units on March 31, 2019, immediately before our strategic reorganization became effective. Our impairment assessments indicated that the fair value for each of our historical Wireless, historical Wireline and historical Connect reporting units exceeded their respective carrying value, and therefore did not result in a goodwill impairment. We then performed an impairment assessment for our Consumer and Business reporting units on April 1, 2019, immediately following our strategic reorganization. Our impairment assessments indicated that the fair value for each of our Consumer and Business reporting units exceeded their respective carrying values and therefore, did not result in a goodwill impairment. Our Media reporting unit was not impacted by the strategic reorganization and there was no indicator of impairment.
Recently Adopted Accounting StandardsStandard
In January 2017, theThe following Accounting Standard Updates (ASUs) were issued by Financial Accounting Standards Board (FASB) issued Accounting Standards Update (ASU) 2017-04, “Intangibles - Goodwill, and Other (Topic 350): Simplifying the Test for Goodwill Impairment.” have been recently adopted by Verizon.
|
| | | | | |
| Description | Date of Adoption | Effect on Financial Statements |
| ASU 2016-02, ASU 2018-01, ASU 2018-10, ASU 2018-11, ASU 2018-20 and ASU 2019-01, Leases (Topic 842) |
| The FASB issued Topic 842 requiring entities to recognize assets and liabilities on the balance sheet for all leases, with certain exceptions. In addition, Topic 842 will enable users of financial statements to further understand the amount, timing and uncertainty of cash flows arising from leases. Topic 842 allows for a modified retrospective application and is effective as of the first quarter of 2019. Entities are allowed to apply the modified retrospective approach: (1) retrospectively to each prior reporting period presented in the financial statements with the cumulative-effect adjustment recognized at the beginning of the earliest comparative period presented; or (2) retrospectively at the beginning of the period of adoption (January 1, 2019) through a cumulative-effect adjustment. The modified retrospective approach includes a number of optional practical expedients that entities may elect to apply. | 1/1/2019 | We adopted Topic 842 beginning on January 1, 2019, using the modified retrospective approach with a cumulative-effect adjustment to opening retained earnings recorded at the beginning of the period of adoption. Therefore, upon adoption, we have recognized and measured leases without revising comparative period information or disclosure. We recorded an increase of $410 million (net of tax) to retained earnings on January 1, 2019 which related to deferred sale leaseback gains recognized from prior transactions. Additionally, the adoption of the standard had a significant impact in our condensed consolidated balance sheet due to the recognition of $22.1 billion of operating lease liabilities, along with $23.2 billion of operating lease right-of-use-assets. |
|
The amendments in this update eliminate the requirement to perform step twocumulative after-tax effect of the goodwill impairment test, which requires a hypothetical purchase price allocation when an impairment is determinedchanges made to have occurred. A goodwill impairment will now be the amount by which a reporting unit’s carrying value exceeds its fair value, not to exceed the carrying amount of goodwill. This standard update is effective as of the first quarter of 2020; however, early adoption is permitted for any interim or annual impairment tests performed after January 1, 2017. Verizon early adopted this standard as of January 1, 2017.
In March 2016, the FASB issued ASU 2016-09, “Compensation - Stock Compensation (Topic 718): Improvements to Employee Share-Based Payment Accounting.” This standard update intends to simplify several aspects of the accounting for share-based payment transactions, including the income tax consequences, classification of awards as either equity or liabilities, and classification on the statement of cash flows. This standard update is effective as of the first quarter of 2017. The adoption of this standard update did not have a significant impact on our condensed consolidated financial statements.balance sheet for the adoption of Topic 842 were as follows:
|
| | | | | | | | | | | |
| (dollars in millions) | At December 31, 2018 |
| | Adjustments due to Topic 842 |
| | At January 1, 2019 |
|
| Prepaid expenses and other | $ | 5,453 |
| | $ | (329 | ) | | $ | 5,124 |
|
| Operating lease right-of-use assets | — |
| | 23,241 |
| | 23,241 |
|
| Other assets | 11,717 |
| | (2,048 | ) | | 9,669 |
|
| Accounts payable and accrued liabilities | 22,501 |
| | (3 | ) | | 22,498 |
|
| Other current liabilities | 8,239 |
| | (2 | ) | | 8,237 |
|
| Current operating lease liabilities | — |
| | 2,931 |
| | 2,931 |
|
| Deferred income taxes | 33,795 |
| | 139 |
| | 33,934 |
|
| Non-current operating lease liabilities | — |
| | 19,203 |
| | 19,203 |
|
| Other liabilities | 13,922 |
| | (1,815 | ) | | 12,107 |
|
| Retained earnings | 43,542 |
| | 410 |
| | 43,952 |
|
| Noncontrolling interests | 1,565 |
| | 1 |
| | 1,566 |
|
In addition to the increase to the operating lease liabilities and right-of-use assets and the derecognition of deferred sale leaseback gains through opening retained earnings, Topic 842 also resulted in reclassifying the presentation of prepaid and deferred rent to operating lease right-of-use assets. The operating lease right-of-use assets amount also includes the balance of any prepaid lease payments, unamortized initial direct costs, and lease incentives.
We elected the package of practical expedients permitted under the transition guidance within the new standard. Accordingly, we have adopted these practical expedients and did not reassess: (1) whether an expired or existing contract is a lease or contains an embedded lease; (2) lease classification of an expired or existing lease; or (3) capitalization of initial direct costs for an expired or existing lease. In addition, we have elected the land easement transition practical expedient, and did not reassess whether an existing or expired land easement is a lease or contains a lease if it has not historically been accounted for as a lease.
We lease network equipment including towers, distributed antenna systems, small cells, real estate, connectivity mediums which include dark fiber, equipment leases, and other various types of assets for use in our operations under both operating and finance leases. We assess whether an arrangement is a lease or contains a lease at inception. For arrangements considered leases or that contain a lease that is accounted for
Recently Issued Accounting Standardsseparately, we determine the classification and initial measurement of the right-of-use asset and lease liability at the lease commencement date, which is the date that the underlying asset becomes available for use.
For both operating and finance leases, we recognize a right-of-use asset, which represents our right to use the underlying asset for the lease term, and a lease liability, which represents the present value of our obligation to make payments arising over the lease term. The present value of the lease payments is calculated using the incremental borrowing rate for operating and finance leases. The incremental borrowing rate is determined using a portfolio approach based on the rate of interest that the Company would have to pay to borrow an amount equal to the lease payments on a collateralized basis over a similar term. Management uses the unsecured borrowing rate and risk-adjusts that rate to approximate a collateralized rate, which will be updated on a quarterly basis for measurement of new lease liabilities.
In August 2017,those circumstances where the FASB issuedCompany is the lessee, we have elected to account for non-lease components associated with our leases (e.g., common area maintenance costs) and lease components as a single lease component for substantially all of our asset classes. Additionally, in arrangements where we are the lessor, we have customer premise equipment for which we apply the lease and non-lease component practical expedient and account for non-lease components (e.g., service revenue) and lease components as combined components under the revenue recognition guidance in ASU 2017-12, “Derivatives and Hedging2014-09, "Revenue from Contracts with Customers" (Topic 815): Targeted Improvements to Accounting606) as the service revenues are the predominant components in the arrangements.
Rent expense for Hedging Activities.” The amendments in this update simplify the application of hedge accounting and increase the transparency of hedge results. The updated standard also amends the presentation and disclosure requirements and changes how companies can assess the effectiveness of their hedging relationships. Companies will now have until the end of the first quarter in whichoperating leases is recognized on a hedge is entered into to perform an initial assessment of a hedge’s effectiveness. After initial qualification, the new guidance permits a qualitative effectiveness assessment for certain hedges instead of a quantitative test if the company can reasonably support an expectation of high effectiveness throughoutstraight-line basis over the term of the hedge. An initial quantitative test to establish that the hedge relationshiplease and is highly effective is still required. For cash flow hedges, if the hedge is highly effective, all changesincluded in the fair valueeither Cost of the derivative hedging instrument will be recorded in Other comprehensive income (loss). These changes in fair value will be reclassified to earnings when the hedged item impacts earnings. The standard update is effective as of the first quarter of 2019; however, early adoption is permitted within an interim period. We intend to early adopt this standard in the fourth quarter of 2017services or Selling, general and do not expect it to have a significant impact on our condensed consolidated financial statements.
In March 2017, the FASB issued ASU 2017-07, “Compensation - Retirement Benefits (Topic 715): Improving the Presentation of Net Periodic Pension Cost and Net Periodic Postretirement Benefit Cost.” The amendments in this update require an employer to report the service cost component in the same line item or items as other compensation costs arising from services rendered by the pertinent employees during the period. The other components of net benefit cost, including the recognition of prior service credits, will be presented in the income statement separately from the service cost component and outside a subtotal of income from operations. The amendments in this update also allow only the service cost component of pension and other postretirement benefit costs to be eligible for capitalization when applicable. The amendments in this update would be applied retrospectively for the presentation of the service cost component and other components of net periodic benefit cost in the income statement and prospectively, on and after the effective date, for the capitalization of the service cost component of net periodic benefit cost in assets. Disclosures of the nature of and reason for the change in accounting principle would be required in the first interim and annual reporting periods of adoption. This standard update is effective as of the first quarter of 2018; however, early adoption is permitted as of the beginning of an annual period for which financial statements have not been issued. We will adopt this standard in the first quarter of 2018. The impact of the retrospective adoption of this standard update will be a decrease to consolidated operating income of approximately $0.2 billion and $0.7 billion for the three and nine months ended September 30, 2017, respectively, and an increase to consolidated operating income of approximately $0.4 billion and $4.1 billion for the three and nine months ended September 30, 2016, respectively. There will be no impact to consolidated net income for the three and nine months ended September 30, 2017 and 2016.
In February 2017, the FASB issued ASU 2017-05, “Other Income - Gains and Losses From the Derecognition of Nonfinancial Assets (Subtopic 610-20): Clarifying the Scope of Asset Derecognition Guidance and Accounting for Partial Sales of Nonfinancial Assets.” The new guidance defines an “in substance nonfinancial asset” as an asset or group of assets for which substantially all of the fair value consists of nonfinancial assets and the group or subsidiary is not a business. The standard requires entities to derecognize nonfinancial assets or in substance nonfinancial assets when the entity no longer has (or ceases to have) a controlling financial interest in the legal entity that holds the asset and the entity transfers control of the asset. The standard update also unifies guidance related to partial sales of nonfinancial assets to be more consistent with the sale of a business. This standard update is effective as of the first quarter of 2018; however, early adoption is permitted. We do not expect that this standard update will have a significant impact on our condensed consolidated financial statements.
In January 2017, the FASB issued ASU 2017-01, “Business Combinations (Topic 805): Clarifying the Definition of a Business.” The amendments in this update provide a framework, the screen, in which to evaluate whether a set of transferred assets and activities is a business. The screen requires that the set is not a business when substantially all of the fair value of the gross assets acquired is concentrated in a single identifiable asset or a group of similar identifiable assets. The standard also aligns the definition of outputs with how outputs are described in Accounting Standards Codification (ASC) 606, Revenue from Contracts with Customers. This standard is effective as of the first quarter of 2018; however, early adoption is permitted. We plan to early adopt this standard, on a prospective basis in the fourth quarter of 2017.
In November 2016, the FASB issued ASU 2016-18, “Statement of Cash Flows (Topic 230): Restricted Cash.” The amendments in this update require that cash and cash equivalent balances in a statement of cash flows include those amounts deemed to be restricted cash and restricted cash equivalents. This standard update is effective as of the first quarter of 2018; however, early adoption is permitted. We do not expect the adoption of this standard will have a significant impact on our condensed consolidated financial statements.
In August 2016, the FASB issued ASU 2016-15, “Statement of Cash Flows (Topic 230): Classification of Certain Cash Receipts and Cash Payments.” This standard update addresses eight specific cash flow issues with the objective of reducing the existing diversity in practice for these issues. Among the updates, this standard update requires cash receipts from payments on a transferor’s beneficial interests in securitized trade receivables to be classified as cash inflows from investing activities. This standard update is effective as of the first quarter of 2018; however, early adoption is permitted. We expect the amendment relating to beneficial interests in securitization transactions will have an impact on our presentation of collections of the deferred purchase price from sales of wireless device payment plan agreement receivablesadministrative expense in our condensed consolidated statements of cash flows. Upon adoptionincome, based on the use of this standard updatethe facility on which rent is being paid. Variable rent payments related to both operating and finance leases are expensed in the first quarterperiod incurred. Our variable lease payments consist of 2018,payments dependent on various external indicators, including real estate taxes, common area maintenance charges and utility usage.
Operating leases with a term of 12 months or less are not recorded on the balance sheet; we expect to retrospectively reclassify approximately $0.6 billionrecognize a rent expense for these leases on a straight-line basis over the lease term.
We recognize the amortization of collectionsthe right-of-use asset for our finance leases on a straight-line basis over the shorter of deferred purchase price related to collections from customers from Cash flows from operating activities to Cash flows from investing activitiesthe term of the lease or the useful life of the right-of-use asset in Depreciation and amortization expense in our condensed consolidated statementstatements of cash flows forincome. The interest expense related to finance leases is recognized using the nine months ended September 30, 2017 and $1.1 billion in our consolidated statement of cash flows for the year ended December 31, 2016.
In June 2016, the FASB issued ASU 2016-13, “Financial Instruments - Credit Losses (Topic 326): Measurement of Credit Losses on Financial Instruments.” This standard update requires that certain financial assets be measured at amortized cost net of an allowance for estimated credit losses such that the net receivable represents the present value of expected cash collection. In addition, this standard update requires that certain financial assets be measured at amortized cost reflecting an allowance for estimated credit losses expected to occur over the life of the assets. The estimate of credit losses must beeffective interest method based on all relevant information including historical information, current conditionsthe discount rate determined at lease commencement and reasonable and supportable forecasts that affect the collectability of the amounts. This standard update is effective as of the first quarter of 2020; however, early adoption is permitted. We are currently evaluating the impact that this standard update will have onincluded within Interest expense in our condensed consolidated financial statements.statements of income.
In February 2016, the FASB issued ASU 2016-02, “Leases (Topic 842).” This standard update intends to increase transparency and improve comparability by requiring entities to recognize assets and liabilities on the balance sheetSee Note 5 for all leases, with certain exceptions. In addition, through improved disclosure requirements, the standard update will enable users of financial statements to further understand the amount, timing, and uncertainty of cash flows arising from leases. This standard update is effective as of the first quarter of 2019; however, early adoption is permitted. Verizon’s current operating lease portfolio is primarily comprised of network, real estate, and equipment leases. Upon adoption of this standard, we expect our balance sheet to include a right of use asset and liabilityadditional information related to substantially all operating lease arrangements. Weleases, including disclosure required under Topic 842.
Recently Issued Accounting Standards
The following ASUs have established a cross-functional coordinated implementation team to implementbeen recently issued by the standard update related to leases. We are in the process of determining the scope of arrangements that will be subject to this standard as well as assessing the impact to our systems, processes and internal controls to meet the standard update’s reporting and disclosure requirements.FASB.
|
| | | | | |
| Description | Date of Adoption | Effect on Financial Statements |
| ASU 2016-13, ASU 2018-19, ASU 2019-04, ASU 2019-05, Financial Instruments - Credit Losses (Topic 326) |
| In June 2016, the FASB issued this standard update which requires certain financial assets be measured at amortized cost net of an allowance for estimated credit losses such that the net receivable represents the present value of expected cash collection. In addition, this standard update requires that certain financial assets be measured at amortized cost reflecting an allowance for estimated credit losses expected to occur over the life of the assets. The estimate of credit losses must be based on all relevant information including historical information, current conditions and reasonable and supportable forecasts that affect the collectability of the amounts. An entity will apply the update through a cumulative effect adjustment to retained earnings as of the beginning of the first reporting period in which the guidance is effective (January 1, 2020). A prospective transition approach is required for debt securities for which an other-than-temporary impairment has been recognized before the effective date. Early adoption of this standard is permitted. | 1/1/2020 | We are currently evaluating the impacts that this standard update will have on our various financial assets, which we expect to include, but are not limited to, our device payment plan agreement receivables, service receivables and contract assets.
We have established a cross-functional coordinated team to implement the standard update. We are in the process of determining the potential impacts to our processes, including allowance estimation models, and internal controls in order to meet the standard update's accounting and reporting requirements.
|
|
|
In May 2014, the FASB issued ASU 2014-09, “Revenue from Contracts with Customers (Topic 606).” This standard update, along with related subsequently issued updates, clarifies the principles for recognizing revenue and develops a common revenue standard for United States (U.S.) generally accepted accounting principles (GAAP). The standard update also amends current guidance for the recognition of costs to obtain and fulfill contracts with customers such that incremental costs of obtaining and direct costs of fulfilling contracts with customers will be deferred and amortized consistent with the transfer of the related good or service. The standard update intends to provide a more robust framework for addressing revenue issues; improve comparability of revenue recognition practices across entities, industries, jurisdictions, and capital markets; and provide more useful information to users of financial statements through improved disclosure requirements. The two permitted transition methods under the new standard are the full retrospective method, in which case the standard would be applied to each prior reporting period presented and the cumulative effect of applying the standard would be recognized at the earliest period shown, or the modified retrospective method, in which case the standard is applied only to the most current period presented and the cumulative effect of applying the standard would be recognized at the date of initial application. In August 2015, an accounting standard update was issued that delayed the effective date of this standard until the first quarter of 2018, at which time we plan to adopt the standard using the modified retrospective approach.
We are in the process of evaluating the impact of the standard update. The ultimate impact on revenue resulting from the application of the new standard will be subject to assessments that are dependent on many variables, including, but not limited to, the terms of our contractual arrangements and our mix of business. Upon adoption, we expect that the allocation of revenue between equipment and service for our wireless fixed-term service plans will result in more revenue allocated to equipment and recognized earlier as compared with current GAAP. We expect the timing of recognition of our sales commission expenses will also be impacted, as a substantial portion of these costs, which are currently expensed, will be capitalized and amortized as described above. In 2016, total sales commission expenses were approximately $4.2 billion. In 2017, we expect total sales commission expenses to decline as our wireless customers continue to migrate from our fixed-term service plans to device payment plans which have lower commission structures.
We have established a cross-functional coordinated implementation team to implement the standard update related to the recognition of revenue from contracts with customers. We have identified and are in the process of implementing changes to our systems, processes and internal controls to meet the standard update’s reporting and disclosure requirements.
|
|
| Note 2. Revenues and Contract Costs |
We earn revenue from contracts with customers, primarily through the provision of telecommunications and other services and through the sale of wireless equipment.
Revenue by Category
We have two reportable segments that we operate and manage as strategic business units - Consumer and Business. Revenue is disaggregated by products and services within Consumer, and customer groups (Global Enterprise, Small and Medium Business, Public Sector and Other, and Wholesale) within Business. See Note 11 for additional information on revenue by segment.
Corporate and other includes the results of our media business, Verizon Media Group (Verizon Media), which operated under the "Oath" brand until January 2019, and other businesses. Verizon Media generated revenues from contracts with customers under Topic 606 of approximately $1.8 billion and $3.6 billion, during the three and six months ended June 30, 2019, respectively. Verizon Media generated revenues from contracts with customers under Topic 606 of approximately $1.9 billion and $3.8 billion during the three and six months ended June 30, 2018, respectively.
We also earn revenues, that are not accounted for under Topic 606, from leasing arrangements (such as towers), captive reinsurance arrangements primarily related to wireless device insurance and the interest on equipment financed on a device payment plan agreement when sold to the customer by an authorized agent. As allowed by the practical expedient within Topic 842, we have elected to combine the lease and non-lease components for those arrangements of customer premise equipment where we are the lessor as components accounted for under Topic 606. During the three and six months ended June 30, 2019, revenues from arrangements that were not accounted for under Topic 606 were approximately $797 million and $1.6 billion, respectively. During the three and six months ended June 30, 2018, revenues from arrangements that were not accounted for under Topic 606 were approximately $1.1 billion and $2.3 billion, respectively.
Remaining Performance Obligations
When allocating the total contract transaction price to identified performance obligations, a portion of the total transaction price may relate to service performance obligations which were not satisfied or are partially satisfied as of the end of the reporting period. Below we disclose information relating to these unsatisfied performance obligations. Upon adoption, we elected to apply the practical expedient available under Topic 606 that provides the option to exclude the expected revenues arising from unsatisfied performance obligations related to contracts that have an original expected duration of one year or less. This situation primarily arises with respect to certain month-to-month service contracts. At June 30, 2019, month-to-month service contracts represented approximately 87% of our wireless postpaid contracts and approximately 57% of our wireline Consumer and Small and Medium Business contracts, compared to June 30, 2018, for which month-to-month service contracts represented approximately 83% of our wireless postpaid contracts and 56% of our wireline Consumer and Small and Medium Business contracts.
Additionally, certain contracts provide customers the option to purchase additional services. The fees related to these additional services are recognized when the customer exercises the option (typically on a month-to-month basis).
Contracts for wireless services are generally either month-to-month and cancellable at any time (typically under a device payment plan) or contain terms ranging from greater than one month to up to two years (typically under a fixed-term plan). Additionally, customers may incur charges based on usage or additional optional services purchased in conjunction with entering into a contract that can be cancelled at any time and therefore are not included in the transaction price. The transaction price allocated to service performance obligations, which are not satisfied or are partially satisfied as of the end of the reporting period, are generally related to our fixed-term plans.
Our Consumer group customers also include other telecommunications companies who utilize Verizon's networks to resell wireless service to their respective end customers. Reseller arrangements generally include a stated contract term, which typically extends longer than two years. These arrangements generally include an annual minimum revenue commitment over the term of the contract for which revenues will be recognized in future periods.
Consumer customer contracts for wireline services generally have a service term of two years; however, this term may be shorter than twelve months or may be month-to-month. Certain contracts with Business customers for wireline services extend into future periods, contain fixed monthly fees and usage-based fees, and can include annual commitments in each year of the contract or commitments over the entire specified contract term; however, a significant number of contracts for wireline services with our Business customers have a contract term that is twelve months or less.
Additionally, there are certain contracts with Business customers for wireline services that have a contractual minimum fee over the total contract term. We cannot predict the time period when revenue will be recognized related to those contracts; thus, they are excluded from the time bands below. These contracts have varying terms spanning over approximately five years ending in June 2024 and have aggregate contract minimum payments totaling $3.9 billion.
At June 30, 2019, the transaction price related to unsatisfied performance obligations for total Verizon that is expected to be recognized for 2019, 2020 and thereafter was $10.8 billion, $14.7 billion and $5.9 billion, respectively. Remaining performance obligation estimates are subject to change and are affected by several factors, including terminations and changes in the timing and scope of contracts, arising from contract modifications.
Accounts Receivable and Contract Balances
The timing of revenue recognition may differ from the time of billing to our customers. Receivables presented in our consolidated balance sheet represent an unconditional right to consideration. Contract balances represent amounts from an arrangement when either Verizon has performed, by transferring goods or services to the customer in advance of receiving all or partial consideration for such goods and services from the customer,
or the customer has made payment to Verizon in advance of obtaining control of the goods and/or services promised to the customer in the contract.
Contract assets primarily relate to our rights to consideration for goods or services provided to customers but for which we do not have an unconditional right at the reporting date. Under a fixed-term plan, total contract revenue is allocated between wireless service and equipment revenues. In conjunction with these arrangements, a contract asset is created, which represents the difference between the amount of equipment revenue recognized upon sale and the amount of consideration received from the customer when the performance obligation related to the transfer of control of the equipment is satisfied. The contract asset is reclassified to accounts receivable as wireless services are provided and billed. We have the right to bill the customer as service is provided over time, which results in our right to the payment being unconditional. The contract asset balances are presented in our consolidated balance sheet as Prepaid expenses and other and Other assets. We assess our contract assets for impairment on a quarterly basis and will recognize an impairment charge to the extent their carrying amount is not recoverable.
Contract liabilities arise when we bill our customers and receive consideration in advance of providing the goods or services promised in the contract. We typically bill service one month in advance, which is the primary component of the contract liability balance. Contract liabilities are recognized as revenue when services are provided to the customer. The contract liability balances are presented in our condensed consolidated balance sheet as Other current liabilities and Other liabilities.
The following table presents information about receivables from contracts with customers:
|
| | | | | | | | | | | | | | | |
| | At June 30, |
| | At January 1, |
| | At June 30, |
| | At January 1, |
|
| (dollars in millions) | 2019 |
| | 2019 |
| | 2018 |
| | 2018 |
|
Receivables(1) | $ | 12,173 |
| | $ | 12,104 |
| | $ | 11,412 |
| | $ | 12,073 |
|
Device payment plan agreement receivables(2) | 10,053 |
| | 8,940 |
| | 5,258 |
| | 1,461 |
|
| |
2.(1) | Balances do not include receivables related to the following contracts: leasing arrangements (such as towers), captive reinsurance arrangements primarily related to wireless device insurance and the interest on equipment financed on a device payment plan agreement when sold to the customer by an authorized agent. |
| |
(2) | Included in device payment plan agreement receivables presented in Note 7. Balances do not include receivables related to contracts completed prior to January 1, 2018 and receivables derived from the sale of equipment on a device payment plan through an authorized agent. |
The following table presents information about contract balances:
|
| | | | | | | | | | | | | | | |
| | At June 30, |
| | At January 1, |
| | At June 30, |
| | At January 1, |
|
| | 2019 |
| | 2019 |
| | 2018 |
| | 2018 |
|
| Contract asset | $ | 1,059 |
| | $ | 1,003 |
| | $ | 1,059 |
| | $ | 1,170 |
|
Contract liability (1) | 4,946 |
| | 4,943 |
| | 4,652 |
| | 4,452 |
|
(1) Revenue recognized related to contract liabilities existing at January 1, 2019 and January 1, 2018 were $194 million and $3.9 billion, for the three and six months ended June 30, 2019, respectively, and $327 million and $3.8 billion, for the three and six months ended June 30, 2018.
The balance of contract assets and contract liabilities recorded in our condensed consolidated balance sheet were as follows:
|
| | | | | | | |
| At June 30, |
| | At December 31, |
|
| (dollars in millions) | 2019 |
| | 2018 |
|
| Assets | | | |
| Prepaid expenses and other | $ | 812 |
| | $ | 757 |
|
| Other assets | 247 |
| | 246 |
|
| Total | $ | 1,059 |
| | $ | 1,003 |
|
| | | | |
| Liabilities | | | |
| Other current liabilities | $ | 4,323 |
| | $ | 4,207 |
|
| Other liabilities | 623 |
| | 736 |
|
| Total | $ | 4,946 |
| | $ | 4,943 |
|
Contract Costs
Topic 606 requires the recognition of an asset for incremental costs to obtain a customer contract, which are then amortized to expense over the respective periods of expected benefit. We recognize an asset for incremental commission expenses paid to internal and external sales personnel and agents in conjunction with obtaining customer contracts. We only defer these costs when we have determined the commissions are incremental costs that would not have been incurred absent the customer contract and are expected to be recoverable. Costs to obtain a contract are amortized and recorded ratably as commission expense over the period representing the transfer of goods or services to which the assets relate. Costs to obtain wireless contracts are amortized over both of our Consumer and Business customers' estimated device upgrade cycles, as such costs are typically incurred each time a customer upgrades. Costs to obtain wireline contracts are amortized as expense over the estimated customer relationship period for our Consumer customers. Incremental costs to obtain wireline contracts for our Business customers are insignificant.
We also defer costs incurred to fulfill contracts that: (1) relate directly to the contract; (2) are expected to generate resources that will be used to satisfy our performance obligation under the contract; and (3) are expected to be recovered through revenue generated under the contract. Contract fulfillment costs are expensed as we satisfy our performance obligations and recorded in Cost of services. These costs principally relate to direct costs that enhance our wireline business resources, such as costs incurred to install circuits. Costs to obtain contracts are recorded in Selling, general and administrative expense.
We determine the amortization periods for our costs incurred to obtain or fulfill a customer contract at a portfolio level due to the similarities within these customer contract portfolios.
Other costs, such as general costs or costs related to past performance obligations, are expensed as incurred.
Collectively, costs to obtain a contract and costs to fulfill a contract are referred to as Deferred contract costs, and amortized over a two- to five-year period. Deferred contract costs are classified as current or non-current within Prepaid expenses and other and Other assets, respectively.
The balances of Deferred contract costs included in our condensed consolidated balance sheet were as follows:
|
| | | | | | | |
| At June 30, |
| | At December 31, |
|
| (dollars in millions) | 2019 |
| | 2018 |
|
| Assets | | | |
| Prepaid expenses and other | $ | 2,352 |
| | $ | 2,083 |
|
| Other assets | 1,774 |
| | 1,812 |
|
| Total | $ | 4,126 |
| | $ | 3,895 |
|
For the three and six months ended June 30, 2019, we recognized expense of $639 million and $1.3 billion, respectively, associated with the amortization of Deferred contract costs, primarily within Selling, general and administrative expense in our condensed consolidated statements of income. For the three and six months ended June 30, 2018, we recognized expense of $471 million and $877 million, respectively, associated with the amortization of Deferred contract costs, primarily within Selling, general and administrative expense in our condensed consolidated statements of income.
We assess our Deferred contract costs for impairment on a quarterly basis. We recognize an impairment charge to the extent the carrying amount of a deferred cost exceeds the remaining amount of consideration we expect to receive in exchange for the goods and services related to the cost, less the expected costs related directly to providing those goods and services that have not yet been recognized as expenses. There have been no impairment charges recognized for the three and six months ended June 30, 2019 or June 30, 2018.
|
|
| Note 3. Acquisitions and Divestitures |
Wireless
Spectrum License Transactions
DuringIn 2019, the fourth quarterFederal Communications Commission (FCC) completed two millimeter wave spectrum license auctions. Verizon participated in these auctions and was the high bidder on 9 and 1,066 licenses, respectively, in the 24 Gigahertz (GHz) and 28 GHz bands. We submitted an application to the FCC and paid cash of 2016, we entered into a license exchange agreement with affiliates of AT&T Inc. to exchange certain Advanced Wireless Services (AWS) and Personal Communication Services (PCS) spectrum licenses. This non-cash exchange was completed in February 2017, at which time we received $1.0 billion of AWS and PCS spectrum licenses at fair value and recorded a pre-tax gain of $0.1 billion in Selling, general and administrative expense on our condensed consolidated statement of incomeapproximately $521 million for the nine months ended September 30, 2017.
During the first quarter of 2017, we entered into a license exchange agreement with affiliates of Sprint Corporation, which provides for the exchange of certain PCSlicenses that will be issued. The deposits related to these spectrum licenses. This non-cash exchange was completed in May 2017. As a result, we received $0.1 billion of PCS spectrum licenses at fair value and recorded an insignificant gain in Selling, general and administrative expense on our condensed consolidated statement of income for the nine months ended September 30, 2017.
During the third quarter of 2017, we entered into a license exchange agreement with affiliates of T-Mobile USA, Inc. to exchange certain AWS and PCS spectrum licenses. As a result of this agreement, $0.3 billion of Wireless licenses are classified as held for sale onwithin Other assets in our condensed consolidated balance sheet at Septembersheets as of June 30, 2017. This non-cash exchange is subject to customary closing conditions and is expected to be completed in the fourth quarter of 2017. Upon completion of this transaction, we expect to record a gain which will be determined upon the closing of the transaction.2019.
During both the three and ninesix months ended SeptemberJune 30, 2017,2019, we entered into and completed various other wireless license transactions for an insignificant amount of cash consideration.
Straight PathOther
On May 11, 2017, we entered into a purchase agreement to acquire Straight Path Communications Inc. (Straight Path), a holder of millimeter wave spectrum configured for fifth-generation (5G) wireless services, for consideration reflecting an enterprise value of approximately $3.1 billion. Under the terms of the purchase agreement, we agreed to pay (i) Straight Path shareholders $184.00 per share, payable in Verizon shares, and (ii) certain transaction costs payable in cash of approximately $0.7 billion, consisting primarily of a fee to be paid to the Federal Communications Commission (FCC). The acquisition is subject to customary regulatory approvals and closing conditions, and is expected to close by the end of the first quarter of 2018.
Wireline
XO Holdings
In February 2016, we entered into a purchase agreement to acquire XO Holdings’ wireline business (XO), which owns and operates one of the largest fiber-based Internet Protocol (IP) and Ethernet networks. Concurrently, we entered into a separate agreement to lease certain wireless spectrum from a wholly-owned subsidiary of XO Holdings that holds its wireless spectrum, which included an option, subject to certain conditions, to buy the subsidiary. In February 2017, we completed our acquisition of XO for total cash consideration of approximately $1.8 billion, of which $0.1 billion was paid in 2015. In April 2017, we exercised our option to buy the subsidiary for approximately $0.2 billion, subject to certain adjustments. The transaction is subject to customary regulatory approvals and is expected to close by the end of 2017. Upon closing, the spectrum acquired as part of the transaction will be used for our 5G technology deployment.
The condensed consolidated financial statements include the results of XO’s operations from the date the acquisition closed. If the acquisition of XO had been completed as of January 1, 2016, the results of operations of Verizon would not have been significantly different than our previously reported results of operations.
The acquisition of XO was accounted for as a business combination. Since the business combination and the lease agreement with the purchase option were entered into contemporaneously, the total cash consideration of $1.8 billion has been preliminarily allocated between them on a relative fair value basis. The preliminary allocation of the purchase price for the business combination will be finalized within 12 months following the close of the acquisition. We preliminarily recorded approximately $0.4 billion of goodwill, and $0.3 billion of other intangible assets. Goodwill
is calculated as the difference between the acquisition date fair value of the consideration transferred and the fair value of the net assets acquired. The goodwill recorded as a result of the XO transaction represents future economic benefits we expect to achieve as a result of the acquisition. The goodwill related to this acquisition is included within our Wireline segment (see Note 3 for additional information).
Data Center Sale
On December 6, 2016, we entered into a definitive agreement, which was subsequently amended on March 21, 2017, with Equinix, Inc. pursuant to which we agreed to sell 23 customer-facing data center sites in the U.S. and Latin America, for approximately $3.6 billion, subject to certain adjustments (Data Center Sale). The transaction closed on May 1, 2017.
For the nine months ended September 30, 2017 andDuring both the three and ninesix months ended SeptemberJune 30, 2016, these sites generated2019, we completed various other acquisitions for an insignificant amount of revenues and earnings. As a result of the closing of the transaction, we derecognized assets with a carrying value of $1.4 billion, primarily consisting of goodwill, plant, property and equipment and other intangible assets. The liabilities associated with the sale were insignificant.cash consideration.
In connection with the Data Center Sale and other insignificant transactions, we recorded a net gain on sale of divested businesses of approximately $1.8 billion in Selling, general and administrative expense on our condensed consolidated statement of income for the nine months ended September 30, 2017.
WideOpenWest, Inc.
On August 1, 2017, we entered into a definitive agreement to purchase certain fiber-optic network assets in the Chicago market from WideOpenWest, Inc. (WOW!), a leading provider of communications services. The transaction is expected to close by the end of 2017. In addition, the parties entered into a separate agreement pursuant to which WOW! will complete the build-out of the network assets by the second half of 2018. The total cash consideration for the transactions is expected to be approximately $0.3 billion.
Other
Acquisition of Yahoo! Inc.’s Operating Business
On July 23, 2016, Verizon entered into a stock purchase agreement (the Purchase Agreement) with Yahoo! Inc. (Yahoo). Pursuant to the Purchase Agreement, upon the terms and subject to the conditions thereof, we agreed to acquire the stock of one or more subsidiaries of Yahoo holding all of Yahoo’s operating business, for approximately $4.83 billion in cash, subject to certain adjustments (the Transaction).
On February 20, 2017, Verizon and Yahoo entered into an amendment to the Purchase Agreement, pursuant to which the Transaction purchase price was reduced by $350 million to approximately $4.48 billion in cash, subject to certain adjustments. Subject to certain exceptions, the parties also agreed that certain user security and data breaches incurred by Yahoo (and the losses arising therefrom) were to be disregarded (1) for purposes of specified conditions to Verizon’s obligations to close the Transaction and (2) in determining whether a “Business Material Adverse Effect” under the Purchase Agreement has occurred.
Concurrently with the amendment of the Purchase Agreement, Yahoo and Yahoo Holdings, Inc., a wholly-owned subsidiary of Yahoo that Verizon agreed to purchase pursuant to the Transaction, also entered into an amendment to the related reorganization agreement, pursuant to which Yahoo (which changed its name to Altaba Inc. following the closing of the Transaction) retains 50% of certain post-closing liabilities arising out of governmental or third-party investigations, litigations or other claims related to certain user security and data breaches incurred by Yahoo prior to its acquisition by Verizon, including an August 2013 data breach disclosed by Yahoo on December 14, 2016. At that time, Yahoo disclosed that more than one billion of the approximately three billion accounts existing in 2013 had likely been affected. In accordance with the original Transaction agreements, Yahoo will continue to retain 100% of any liabilities arising out of any shareholder lawsuits (including derivative claims) and investigations and actions by the SEC.
Prior to the closing of the Transaction, pursuant to a related reorganization agreement, Yahoo transferred all of the assets and liabilities constituting Yahoo’s operating business to the subsidiaries that we acquired in the Transaction. The assets that we acquired did not include Yahoo’s ownership interests in Alibaba, Yahoo! Japan and certain other investments, certain undeveloped land recently divested by Yahoo, certain non-core intellectual property or its cash, other than the cash from its operating business we acquired. We received for our benefit and that of our current and certain future affiliates a non-exclusive, worldwide, perpetual, royalty-free license to all of Yahoo’s intellectual property that was not conveyed with the business.
On June 13, 2017, we completed the Transaction. The aggregate purchase consideration at the closing of the Transaction was approximately $4.8 billion.
On October 3, 2017, based upon new intelligence that we received in connection with our integration of Yahoo's operating business, we disclosed that we believe that the August 2013 data breach previously disclosed by Yahoo affected all of its accounts.
Oath, our newly branded organization that combines Yahoo’s operating business with our existing Media business, is a diverse house of more than 50 media and technology brands that engages approximately a billion people around the world. We believe that the Transaction represents a critical step in growing the global scale needed for our digital media company and building the future of brands using powerful technology, trusted content and differentiated data.
The acquisition of Yahoo’s operating business has been accounted for as a business combination. We are currently assessing the identification and measurement of the assets acquired and liabilities assumed. The preliminary results, which are summarized below, will be finalized within 12 months following the close of the acquisition. The preliminary results do not include any amount for potential liability arising from certain user security and data breaches since a reasonable estimate of loss, if any, cannot be determined at this time. We will continue to evaluate the accounting for these contingencies in conjunction with finalizing our accounting for this business combination and thereafter. When the valuations are finalized, any changes to the preliminary valuation of assets acquired and liabilities assumed may result in adjustments to the preliminary fair value of the net identifiable assets acquired and goodwill.
The fair values of the assets acquired and liabilities assumed were determined using the income, cost, market and multiple period excess earnings approaches. The fair value measurements were primarily based on significant inputs that are not observable in the market and thus represent a Level 3 measurement as defined in ASC 820, Fair Value Measurement, other than long-term debt assumed in the acquisition. The income approach was primarily used to value the intangible assets, consisting primarily of acquired technology and customer relationships. The income approach indicates value for an asset based on the present value of cash flow projected to be generated by the asset. Projected cash flow is discounted at a required rate of return that reflects the relative risk of achieving the cash flow and the time value of money. The cost approach, which estimates value by determining the current cost of replacing an asset with another of equivalent economic utility, was used, as appropriate, for plant, property and equipment. The cost to replace a given asset reflects the estimated reproduction or replacement cost for the property, less an allowance for loss in value due to depreciation.
The following table summarizes the consideration to Yahoo’s shareholders and the preliminary identification of the assets acquired, including cash acquired of $0.2 billion, and liabilities assumed as of the close of the acquisition, as well as the fair value at the acquisition date of Yahoo’s noncontrolling interests:
|
| | | |
| (dollars in millions) | As of June 13, 2017 |
|
| Cash payment to Yahoo’s equity holders | $ | 4,723 |
|
| Estimated liabilities to be paid | 38 |
|
| Total consideration | $ | 4,761 |
|
| | |
| Assets acquired: | |
| Goodwill | $ | 1,041 |
|
| Intangible assets subject to amortization | 2,519 |
|
| Property, plant, and equipment | 1,805 |
|
| Other | 1,332 |
|
| Total assets acquired | 6,697 |
|
| | |
| Liabilities assumed: | |
| Total liabilities assumed | 1,885 |
|
| | |
| Net assets acquired: | 4,812 |
|
| Noncontrolling interest | (51 | ) |
| Total consideration | $ | 4,761 |
|
On the closing date of the Transaction, each unvested and outstanding Yahoo restricted stock unit award that was held by an employee who became an employee of Verizon was replaced with a Verizon restricted stock unit award, which is generally payable in cash upon the applicable vesting date. The value of those outstanding restricted stock units on the acquisition date was approximately $1.0 billion.
Goodwill is calculated as the difference between the acquisition date fair value of the consideration transferred and the fair value of the net assets acquired. The goodwill is primarily attributable to increased synergies that are expected to be achieved from the integration of Yahoo’s operating business into our Media business. The preliminary goodwill related to this acquisition is included within Corporate and other (see Note 3 for additional information).
The condensed consolidated financial statements include the results of Yahoo’s operating business from the date the acquisition closed. If the acquisition of Yahoo’s operating business had been completed as of January 1, 2016, the results of operations of Verizon would not have been significantly different than our previously reported results of operations.
Acquisition and Integration Related Charges
In connection with the Yahoo Transaction, we recognized the following charges, which were recorded in Selling, general and administrative expense on our condensed consolidated statements of income:
|
| | | | | | | | | | | | | | | |
| | Three Months Ended | | | Nine Months Ended | |
| | September 30, | | | September 30, | |
| (dollars in millions) | 2017 |
| | 2016 |
| | 2017 |
| | 2016 |
|
| Severance | $ | 84 |
| | $ | — |
| | $ | 454 |
| | $ | — |
|
| Transaction costs | 1 |
| | — |
| | 67 |
| | — |
|
| Integration costs | 60 |
| | — |
| | 116 |
| | — |
|
| | $ | 145 |
| | $ | — |
| | $ | 637 |
| | $ | — |
|
|
| |
3. | Note 4. Wireless Licenses, Goodwill, and Other Intangible Assets |
Wireless Licenses
Changes in theThe carrying amountamounts of Wireless licenses are as follows:
|
| | | | | | |
| | At June 30, |
| At December 31, |
|
| (dollars in millions) | 2019 |
| 2018 |
|
| Wireless licenses | $ | 94,333 |
| $ | 94,130 |
|
|
| | | |
| | (dollars in millions) |
|
| Balance at January 1, 2017 | $ | 86,673 |
|
| Acquisitions (Note 2) | 108 |
|
| Capitalized interest on wireless licenses | 361 |
|
| Reclassifications, adjustments and other | 741 |
|
| Balance at September 30, 2017 | $ | 87,883 |
|
Reclassifications, adjustments and other includes $1.0 billion received in exchanges of wireless licenses, offset by $0.3 billion of wireless licenses that are classified as Assets held for sale on our condensed consolidated balance sheet at September 30, 2017.
At SeptemberJune 30, 2017,2019 and 2018, approximately $10.0$6.6 billion and $11.5 billion, respectively, of wireless licenses were under development for commercial service for which we were capitalizing interest costs. We recorded approximately $168 million and $269 million of capitalized interest on wireless licenses for the six months ended June 30, 2019 and 2018, respectively.
The average remaining renewal period forof our wireless licenses portfolio was 5.44.3 years as of SeptemberJune 30, 2017.2019.
Goodwill
The Company transitioned into our new reporting structure as of April 1, 2019. The table below shows the reallocation of goodwill from our historical reporting structure to our current reporting structure.
Changes in the carrying amount of Goodwill are as follows:
|
| | | | | | | | | | | | | | | | | | | | | | | |
| (dollars in millions) | Consumer |
| | Business |
| | Wireless |
| | Wireline |
| | Other |
| | Total |
|
Balance at January 1, 2019 (1) | $ | — |
| | $ | — |
| | $ | 18,397 |
| | $ | 3,871 |
| | $ | 2,346 |
| | $ | 24,614 |
|
| Acquisitions | — |
| | — |
| | — |
| | 20 |
| | — |
| | 20 |
|
| Reclassifications, adjustments and other | — |
| | — |
| | — |
| | 1 |
| | — |
| | 1 |
|
| Balance at March 31, 2019 | — |
| | — |
| | 18,397 |
| | 3,892 |
| | 2,346 |
| | 24,635 |
|
Reporting Unit reallocation (2) | 17,104 |
| | 7,269 |
| | (18,397 | ) | | (3,892 | ) | | (2,084 | ) | | — |
|
| Balance at April 1, 2019 | 17,104 |
| | 7,269 |
| | — |
| | — |
| | 262 |
| | 24,635 |
|
| Acquisitions | — |
|
| 1 |
| | — |
| | — |
| | — |
| | 1 |
|
| Reclassifications, adjustments and other | — |
| | (4 | ) | | — |
| | — |
| | — |
| | (4 | ) |
| Balance at June 30, 2019 | $ | 17,104 |
| | $ | 7,266 |
| | $ | — |
| | $ | — |
| | $ | 262 |
| | $ | 24,632 |
|
|
| | | | | | | | | | | | | | | |
| (dollars in millions) | Wireless |
| | Wireline |
| | Other |
| | Total |
|
| Balance at January 1, 2017 | $ | 18,393 |
| | $ | 3,784 |
| | $ | 5,028 |
| | $ | 27,205 |
|
| Acquisitions (Note 2) | 4 |
| | 443 |
| | 1,068 |
| | 1,515 |
|
| Reclassifications, adjustments and other | — |
| | 1 |
| | 4 |
| | 5 |
|
| Balance at September 30, 2017 | $ | 18,397 |
| | $ | 4,228 |
| | $ | 6,100 |
| | $ | 28,725 |
|
(1) Goodwill is net of accumulated impairment charge of $4.6 billion, related to our Media reporting unit (included within Other in the table above), which was recorded in the fourth quarter of 2018.
At September 30, 2017, we recognized preliminary(2) Represents the reallocation of goodwill of $1.0 billion in Corporate and other as a result of the acquisition of Yahoo’s operating business, and $0.4 billionCompany reorganizing its segments as described in Wireline as a result of the acquisition of XO. See Note 2 for additional information.1.
Other Intangible Assets
The following table displays the composition of Other intangible assets, net:
|
| | | | | | | | | | | | | | | | | | | | | | | |
| | At June 30, 2019 | | | At December 31, 2018 | |
| (dollars in millions) | Gross Amount |
| | Accumulated Amortization |
| | Net Amount |
| | Gross Amount |
| | Accumulated Amortization |
| | Net Amount |
|
| Customer lists (8 to 13 years) | $ | 3,948 |
| | $ | (1,299 | ) | | $ | 2,649 |
| | $ | 3,951 |
| | $ | (1,121 | ) | | $ | 2,830 |
|
| Non-network internal-use software (3 to 7 years) | 19,354 |
| | (13,589 | ) | | 5,765 |
| | 18,603 |
| | (12,785 | ) | | 5,818 |
|
| Other (2 to 25 years) | 1,985 |
| | (925 | ) | | 1,060 |
| | 1,988 |
| | (861 | ) | | 1,127 |
|
| Total | $ | 25,287 |
| | $ | (15,813 | ) | | $ | 9,474 |
| | $ | 24,542 |
| | $ | (14,767 | ) | | $ | 9,775 |
|
|
| | | | | | | | | | | | | | | | | | | | | | | |
| | At September 30, 2017 | | | At December 31, 2016 | |
| (dollars in millions) | Gross Amount |
| | Accumulated Amortization |
| | Net Amount |
| | Gross Amount |
| | Accumulated Amortization |
| | Net Amount |
|
| Customer lists (5 to 13 years) | $ | 4,062 |
| | $ | (623 | ) | | $ | 3,439 |
| | $ | 2,884 |
| | $ | (480 | ) | | $ | 2,404 |
|
| Non-network internal-use software (5 to 7 years) | 17,663 |
| | (11,922 | ) | | 5,741 |
| | 16,135 |
| | (10,913 | ) | | 5,222 |
|
| Other (2 to 25 years) | 2,529 |
| | (716 | ) | | 1,813 |
| | 1,854 |
| | (583 | ) | | 1,271 |
|
| Total | $ | 24,254 |
| | $ | (13,261 | ) | | $ | 10,993 |
| | $ | 20,873 |
| | $ | (11,976 | ) | | $ | 8,897 |
|
At September 30, 2017, we recognized preliminary other intangible assets of $2.5 billion in Corporate and other as a result of the acquisition of Yahoo’s operating business, and $0.3 billion in Wireline as a result of the acquisition of XO. See Note 2 for additional information.
The amortization expense for Other intangible assets was as follows:
|
| | | | | | | |
| | Three Months Ended |
| | Six Months Ended |
|
| (dollars in millions) | June 30, |
| | June 30, |
|
| 2019 | $ | 569 |
| | $ | 1,124 |
|
| 2018 | 557 |
| | 1,091 |
|
|
| | | | | | | |
| | Three Months Ended |
| | Nine Months Ended |
|
| (dollars in millions) | September 30, |
| | September 30, |
|
| 2017 | $ | 536 |
| | $ | 1,473 |
|
| 2016 | 419 |
| | 1,255 |
|
The estimated future amortization expense for Other intangible assets for the remainder of the current year and next 5 years is as follows:
|
| | | |
| Years | (dollars in millions) |
|
| Remainder of 2019 | $ | 1,086 |
|
| 2020 | 1,903 |
|
| 2021 | 1,610 |
|
| 2022 | 1,335 |
|
| 2023 | 1,049 |
|
| 2024 | 795 |
|
|
| | | |
| Years | (dollars in millions) |
|
| Remainder of 2017 | $ | 547 |
|
| 2018 | 2,036 |
|
| 2019 | 1,763 |
|
| 2020 | 1,469 |
|
| 2021 | 1,239 |
|
| 2022 | 1,045 |
|
|
| |
4. | DebtNote 5. Leasing Arrangements |
ChangesWe enter into various lease arrangements for network equipment including towers, distributed antenna systems, small cells, real estate and connectivity mediums including dark fiber, equipment leases, and other various types of assets for use in our operations. Our leases have remaining lease terms ranging from 1 year to debt24 years, some of which include options that we can elect to extend the leases term for up to 25 years, and some of which include options to terminate the leases. For the majority of leases entered into during the nine months ended September 30, 2017current period, we have concluded it is not reasonably certain that we would exercise the options to extend the lease or terminate the lease. Therefore, as of the lease commencement date, our lease terms generally do not include these options. We include options to extend the lease when it is reasonably certain that we will exercise that option.
During March 2015, we completed a transaction with American Tower Corporation (American Tower) pursuant to which American Tower acquired the exclusive rights to lease and operate approximately 11,300 of our wireless towers for an upfront payment of $5.0 billion. We have subleased capacity on the towers from American Tower for a minimum of 10 years at current market rates in 2015, with options to renew. We continue to include the towers in Property, plant and equipment, net in our condensed consolidated balance sheets and depreciate them accordingly. In addition to the rights to lease and operate the towers, American Tower assumed the interest in the underlying ground leases related to these towers. While American Tower can renegotiate the terms of and is responsible for paying the ground leases, we are still the primary obligor for these leases and accordingly, the present value of these ground leases are included in our operating lease right-of-use assets and operating lease liabilities. We do not expect to be required to make ground lease payments unless American Tower defaults, which we determined to be remote.
The components of net lease cost were as follows:
|
| | | | | | | | | | | |
| (dollars in millions) | Debt Maturing within One Year |
| | Long-term Debt |
| | Total |
|
| Balance at January 1, 2017 | $ | 2,645 |
| | $ | 105,433 |
| | $ | 108,078 |
|
| Proceeds from long-term borrowings | 65 |
| | 21,850 |
| | 21,915 |
|
| Proceeds from asset-backed long-term borrowings | — |
| | 2,878 |
| | 2,878 |
|
| Repayments of long-term borrowings and capital leases obligations | (4,503 | ) | | (11,954 | ) | | (16,457 | ) |
| Decrease in short-term obligations, excluding current maturities | (160 | ) | | — |
| | (160 | ) |
| Reclassifications of long-term debt | 3,945 |
| | (3,945 | ) | | — |
|
| Other | 188 |
| | 1,055 |
| | 1,243 |
|
| Balance at September 30, 2017 | $ | 2,180 |
| | $ | 115,317 |
| | $ | 117,497 |
|
|
| | | | | | | | |
| | | Three Months Ended |
| | Six Months Ended |
|
| | | June 30, |
| | June 30, |
|
| (dollars in millions) | Classification | 2019 |
| | 2019 |
|
Operating lease cost (1) | Cost of services Selling, general and administrative expense | $ | 1,178 |
| | $ | 2,348 |
|
| Finance lease cost: | | | | |
| Amortization of right-of-use assets | Depreciation and amortization expense | 82 |
| | 168 |
|
| Interest on lease liabilities | Interest expense | 10 |
| | 19 |
|
Short-term lease cost (1) | Cost of services Selling, general and administrative expense | 8 |
| | 24 |
|
Variable lease cost (1) | Cost of services
Selling, general and administrative expense | 51 |
| | 108 |
|
| Sublease income | Service revenues and other | (67 | ) | | (134 | ) |
| Total net lease cost | | $ | 1,262 |
| | $ | 2,533 |
|
(1) All operating lease costs, including short-term and variable lease costs, are split between Cost of services and Selling, general and administrative expense in the condensed consolidated statements of income based on the use of the facility that the rent is being paid on. See Note 1 for additional information. Variable lease costs represent payments that are dependent on a rate or index, or on usage of the asset.
Supplemental disclosure for the statement of cash flows related to operating and finance leases were as follows:
|
| | | |
| | Six Months Ended |
|
| | June 30, |
|
| (dollars in millions) | 2019 |
|
| Cash Flows from Operating Activities | |
| Cash paid for amounts included in the measurement of lease liabilities | |
| Operating cash flows for operating leases | $ | (2,089 | ) |
| Operating cash flows for finance leases | (19 | ) |
| Cash Flows from Financing Activities | |
| Financing cash flows for finance leases | (178 | ) |
| Supplemental lease cash flow disclosures | |
| Operating lease right-of-use assets obtained in exchange for new operating lease liabilities | 1,300 |
|
| Right-of-use assets obtained in exchange for new finance lease liabilities | 221 |
|
Supplemental disclosures for the balance sheet related to finance leases were as follows:
|
| | | |
| | At June 30, |
|
| (dollars in millions) | 2019 |
|
| Assets | |
| Property, plant and equipment, net | $ | 823 |
|
| | |
| Liabilities | |
| Debt maturing within one year | $ | 321 |
|
| Long-term debt | 627 |
|
| Total Finance lease liabilities | $ | 948 |
|
The weighted-average remaining lease term and the weighted-average discount rate of our leases were as follows:
|
| | |
| At June 30, |
|
| 2019 |
|
| Weighted-average remaining lease term (years) | |
| Operating Leases | 9 |
|
| Finance Leases | 4 |
|
| Weighted-average discount rate | |
| Operating Leases | 4.1 | % |
| Finance Leases | 4.0 | % |
The Company's maturity analysis of operating and finance lease liabilities as of June 30, 2019 were as follows:
|
| | | | | | | |
| (dollars in millions) | Operating Leases |
| | Finance Leases |
|
| Remainder of 2019 | $ | 1,996 |
| | $ | 178 |
|
| 2020 | 3,840 |
| | 291 |
|
| 2021 | 3,460 |
| | 198 |
|
| 2022 | 3,067 |
| | 137 |
|
| 2023 | 2,713 |
| | 88 |
|
| Thereafter | 11,094 |
| | 144 |
|
| Total lease payments | 26,170 |
| | 1,036 |
|
| Less interest | (4,762 | ) | | (88 | ) |
| Present value of lease liabilities | 21,408 |
| | 948 |
|
| Less current obligation | (3,154 | ) | | (321 | ) |
| Long-term obligation at June 30, 2019 | $ | 18,254 |
| | $ | 627 |
|
As of June 30, 2019, we have contractually obligated lease payments amounting to $477 million for an office facility operating lease that has not yet commenced. We have legally obligated lease payments for various other operating leases that have not yet commenced for which the total obligation was not significant. We have certain rights and obligations for these leases, but have not recognized an operating lease right-of-use asset or an operating lease liability since they have not yet commenced.
Real Estate Transaction
On July 23, 2019, Verizon completed a sale-leaseback transaction for buildings and real estate. We received total gross proceeds of $1.0 billion. We lease backed a portion of the buildings and real estate sold and accounted for it as an operating lease. The term of the leaseback is for two years with four options to renew for an additional three months each.
Significant Debt Transactions
The following table shows the transactions that occurred during the six months ended June 30, 2019.
February Exchange Offers and Cash Offers In February 2017, we completed private |
| | | | | | | |
| (dollars in millions) | Principal Amount Exchanged |
| | Principal Amount Issued |
|
| Verizon 1.750% - 5.150% notes and floating rate notes, due 2021 - 2025 | $ | 3,892 |
| | $ | — |
|
| GTE LLC 8.750% debentures, due 2021 | 21 |
| | — |
|
Verizon 4.016% notes due 2029 (1) | — |
| | 4,000 |
|
| Total | $ | 3,913 |
| | $ | 4,000 |
|
(1) Total exchange and tender offers for 18 series of notesamount issued by Verizon Communications (February Old Notes) for (i) new notes issued by Verizon Communications (and, for certain series, cash) (February Exchange Offers) or (ii) cash (February Cash Offers). The February Old Notes had coupon rates ranging from 1.375% to 8.950% and maturity dates ranging from 2018 to 2043. In connection with the February Exchange Offers, we issued $3.2 billion aggregate principalin consideration does not include an insignificant amount of Verizon Communications 2.946% Notes due 2022, $1.7 billion aggregate principal amount of Verizon Communications 4.812% Notes due 2039 and $4.1 billion aggregate principal amount of Verizon Communications 5.012% Notes due 2049, plus applicable cash of $0.6 billion, in exchange for $8.3 billion aggregate principal amount of February Old Notes. In connection with the February Cash Offers, we paid $0.5 billion cashused to purchase $0.5 billion aggregate principal amount of February Old Notes. We subsequently purchased an additional $0.1 billion aggregate principal amount of February Old Notes for $0.1 billion cash, from certain holders whose tenders of notes in the February Cash Offers had been rejected. In addition to the exchange or purchase price, any accrued and unpaid interest on Old February Notes was paid at settlement.settle.
Term Loan Credit Agreement
In March 2017, we prepaid $1.7 billion of the outstanding $3.3 billion term loan that had an original maturity date of July 2019. During April 2017, we repaid the remaining outstanding amount under the term loan agreement.
In March 2017, we completed tender offers for 30 series of notes issued by Verizon Communications and certain of its subsidiaries with coupon rates ranging from 5.125% to 8.950% and maturity dates ranging from 2018 to 2043 (March Tender Offers). In connection with the March Tender Offers, we purchased $2.8 billion aggregate principal amount of Verizon Communications notes, $0.2 billion aggregate principal amount of our operating telephone company subsidiary debentures and $0.1 billion aggregate principal amount of GTE LLC notes for total cash consideration of $3.8 billion. |
| | | | | | | |
| (dollars in millions) | Principal Amount Purchased |
| | Cash Consideration (1) |
|
| Verizon 5.012% notes due 2054 | $ | 3,192 |
| | $ | 3,626 |
|
| Verizon 4.672% notes due 2055 | 1,308 |
| | 1,404 |
|
| Total | $ | 4,500 |
| | $ | 5,030 |
|
(1) In addition to the purchase price, any accrued and unpaid interest on the purchased notes was paid to the date of purchase.
Debt Redemptions, Repurchases and Repayments |
| | | | | | |
| (dollars in millions) | Principal Redeemed / Repaid |
| | Amount Paid as % of Principal (1) |
|
| March 2019 | | | |
| Verizon 5.900% notes due 2054 | $ | 500 |
| | 100.000 | % |
| Verizon 1.375% notes due 2019 | 206 |
| | 100.000 | % |
| Verizon 1.750% notes due 2021 | 621 |
| | 100.000 | % |
| Verizon 3.000% notes due 2021 | 930 |
| | 101.061 | % |
| Verizon 3.500% notes due 2021 | 315 |
| | 102.180 | % |
| Open market repurchases of various Verizon notes | 163 |
| | Various |
|
| March 2019 total | 2,735 |
| | |
| | | | |
| June 2019 | | | |
| Verizon 2.625% notes due 2020 | 831 |
| | 100.037 | % |
| Verizon 3.500% notes due 2021 | 736 |
| | 102.238 | % |
| Verizon floating rate (LIBOR + 0.770%) notes due 2019 | 229 |
| | 100.000 | % |
| June 2019 total | 1,796 |
| | |
| Total | $ | 4,531 |
| | |
(1) Percentages represent price paid to redeem, repurchase and repay.
August Exchange Offers and Cash Offers
In August 2017, we completed private exchange and tender offers for 17 series of notes issued by Verizon Communications and GTE LLC (August Old Notes) for (i) new notes issued by Verizon Communications (and, for certain series, cash) or (ii) cash (August Exchange Offers and Cash Offers). The August Old Notes had coupon rates ranging from 1.375% to 8.750%, and maturity dates ranging from 2018 to 2023. In connection with the August Exchange Offers and Cash Offers, we issued $4.0 billion of Verizon Communications 3.376% Notes due 2025, in exchange for $4.0 billion aggregate principal amount of August Old Notes and paid $3.0 billion cash to purchase $3.0 billion aggregate principal amount of August Old Notes. In addition to the exchange or purchase price, any accrued and unpaid interest on Old August Notes was paid at settlement.
August Tender Offers
In August 2017, we completed tender offers for 29 series of notes issued by Verizon Communications and certain of its subsidiaries with coupon rates ranging from 5.050% to 8.950% and maturity dates ranging from 2022 to 2043 (August Tender Offers). In connection with the August Tender Offers, we purchased $1.5 billion aggregate principal amount of Verizon Communications notes, $0.1 billion aggregate principal amount of our operating telephone company subsidiary debentures, $0.2 billion aggregate principal amount of Alltel Corporation notes, and an insignificant amount of GTE LLC notes, for total cash consideration of $2.1 billion. In addition to the purchase price, any accrued and unpaid interest on the purchased notes was paid to the date of purchase.
Debt Issuances and Redemptions During February 2017, we redeemed $0.2 billion of the $0.6 billion 6.940% GTE LLC Notes due 2028 at 124.8% of the principal amount of the notes repurchased (see “Early Debt Redemptions”). |
| | | | | | | |
| (amounts in millions) | Principal Amount Issued |
| | Net Proceeds (1) |
|
| March 2019 | | | |
Verizon 3.875% notes due 2029 (2) | $ | 1,000 |
| | $ | 994 |
|
| Verizon 5.000% notes due 2051 | 510 |
| | 506 |
|
| March 2019 total | $ | 1,510 |
| | $ | 1,500 |
|
| | | | |
| June 2019 | | | |
| Verizon 0.875% notes due 2027 | € | 1,250 |
| | 1,391 |
|
| Verizon 1.250% notes due 2030 | € | 1,250 |
| | 1,385 |
|
| Verizon 2.500% notes due 2031 | £ | 500 |
| | 647 |
|
| June 2019 total |
|
| | 3,423 |
|
| Total | | | $ | 4,923 |
|
During February 2017, we issued approximately $1.5 billion aggregate principal amount of 4.950% Notes due 2047. The issuance of these notes resulted in cash(1) Net proceeds of approximately $1.5 billion,were net of discountsdiscount and issuance costs and after reimbursement of certain expenses. The net proceeds were used for general corporate purposes.costs.
During March 2017, we issued $11.0 billion aggregate principal(2) An amount of fixed and floating rate notes. The issuance of these notes resulted in cash proceeds of approximately $10.9 billion, net of discounts and issuance costs and after reimbursement of certain expenses. The issuance consisted of the following series of notes: $1.4 billion aggregate principal amount of Floating Rate Notes due 2022, $1.85 billion aggregate principal amount of 3.125% Notes due 2022, $3.25 billion aggregate principal amount of 4.125% Notes due 2027, $3.0 billion aggregate principal amount of 5.250% Notes due 2037, and $1.5 billion aggregate principal amount of 5.500% Notes due 2047. The floating rate notes bear interest at a rate equal to the three-month London Interbank Offered Rate (LIBOR) plus 1.000% which ratenet proceeds from this green bond will be reset quarterly. The net proceeds were primarily used forto fund, in whole or in part, "Eligible Green Investments." "Eligible Green Investments" include new and existing investments made by us during the March Tender Offers and general corporate purposes, including discretionary contributionsperiod from two years prior to our qualified pension plans of $3.4 billion. We also used certainthe issuance of the net proceeds to finance our acquisitiongreen bond through the maturity date of Yahoo’s operating business.the green bond, in the following categories: (1) renewable energy; (2) energy efficiency; (3) green buildings; (4) sustainable water management; and (5) biodiversity and conservation.
Short-Term Borrowing and Commercial Paper Program
During April 2017,the three months ended June 30, 2019, we redeemedrepaid $600 million in whole $0.5 billion aggregate principal amount of Verizon Communications 6.100% Notes due 2018 at 104.485% of the principal amount of such notes and $0.5 billion aggregate principal amount of Verizon Communications 5.500% Notes due 2018 at 103.323% of the principal amount of such notes, plus accrued and unpaid interest to the date of redemption.
During May 2017, we issued $1.5 billion aggregate principal amount of Floating Rate Notes due 2020. The issuance of these notes resulted in cash proceeds of approximately $1.5 billion, net of discounts and issuance costs. The floating rate notes bear interest at a rate equal to three-month LIBOR plus 0.550% which will be reset quarterly. The net proceeds were primarily used for general corporate purposes, which included the repayment of outstanding indebtedness. In addition we issued CHF 0.6 billion aggregate principal amount of 0.375% Bonds due 2023, and CHF 0.4 billion aggregate principal amount of 1.000% Bonds due 2027. The issuance of these bonds resulted in cash proceeds of approximately $1.0 billion, net of discounts and issuance costs. The net proceeds were primarily used for general corporate purposes including the repayment of debt.
During May 2017, we initiated a retail notes program in connection with the issuance and sale from time to time of our notes that are due nine months or more from the dateshort term credit facility and there was no outstanding balance as of issue. June 30, 2019.
As of SeptemberJune 30, 20172019, we have issued $0.7 billionhad $200 million of retail notes with interest rates ranging from 2.600% to 4.900% and maturity dates ranging from 2022 to 2047.commercial paper outstanding.
During June 2017, $1.3 billion of Verizon Communications floating rate notes matured and were repaid.
During June 2017, we redeemed in whole $0.5 billion aggregate principal amount of Verizon Communications 1.100% Notes due 2017 at 100.003% of the principal amount of such notes, plus accrued and unpaid interest to the date of redemption.
During August 2017, we issued $3.0 billion aggregate principal amount of 4.500% Notes due 2033 resulting in cash proceeds of approximately $3.0 billion, net of discounts and issuance costs. In addition, we issued the following four series of Australian Dollar (AUD) denominated notes resulting in cash proceeds of $1.7 billion net of discounts and issuance costs: AUD 0.55 billion aggregate principal amount of 3.500% Notes due 2023, AUD 0.45 billion aggregate principal amount of 4.050% Notes due 2025, AUD 0.7 billion aggregate principal amount of 4.500% Notes due 2027 and AUD 0.5 billion aggregate principal amount of Floating Rate Notes due 2023. The floating rate notes bear interest at a rate equal to the three-month Bank Bill Swap Reference Rate plus 1.220% which will be reset quarterly. In addition, we issued $1.0 billion aggregate principal amount of 5.150% Notes due 2050 resulting in cash proceeds of approximately $0.9 billion, net of discounts, issuance costs and
reimbursement of certain expenses. The proceeds of the notes issued during August 2017 were used for general corporate purposes including the repayment of debt.
During September 2017, we redeemed in whole $1.3 billion aggregate principal amount of Verizon Communications 3.650% Notes due 2018, at 101.961% of the principal amount of such notes, plus accrued and unpaid interest to the date of redemption.
Asset-Backed Debt
As of SeptemberJune 30, 2017,2019, the carrying value of our asset-backed debt was $7.9$11.3 billion. Our asset-backed debt includes notes (the Asset-Backed Notes (ABS Notes) issued to third-party investors (Investors) and loans (ABS Financing Facility)Facilities) received from banks and their conduit facilities (collectively, the Banks). Our consolidated asset-backed securitizationdebt bankruptcy remote legal entities (each, an ABS Entity or collectively, the ABS Entities) issue the debt or are otherwise party to the transaction documentation in connection with our asset-backed debt transactions. Under the terms of our asset-backed debt, we transfer device payment plan agreement receivables from Cellco Partnership (Cellco) and certain other affiliates of Verizon (collectively, the Originators) transfer device payment plan agreement receivables to one of the ABS Entities, which in turn transfers such receivables to another ABS Entity that issues the debt. Verizon entities retain the equity interests in the ABS Entities, which represent the rights to all funds not needed to make required payments on the asset-backed debt and other related payments and expenses.
Our asset-backed debt is secured by the transferred device payment plan agreement receivables and future collections on such receivables. The device payment plan agreement receivables transferred to the ABS Entities and related assets, consisting primarily of restricted cash, will only be available for payment of asset-backed debt and expenses related thereto, payments to the Originators in respect of additional transfers of device payment plan agreement receivables, and other obligations arising from our asset-backed debt transactions, and will not be available to pay other obligations or claims of Verizon’s creditors until the associated asset-backed debt and other obligations are satisfied. The Investors or Banks, as applicable, which hold our asset-backed debt have legal recourse to the assets securing the debt, but do not have any recourse to Verizon with respect to the payment of principal and interest on the debt. Under a parent support agreement, Verizon has agreed to guarantee certain of the payment obligations of Cellco Partnership and the Originators to the ABS Entities.
Cash collections on the device payment plan agreement receivables collateralizing asset-backed debt securities are required at certain specified times to be placed into segregated accounts. Deposits to the segregated accounts are considered restricted cash and are included in Prepaid expenses and other and Other assets onin our condensed consolidated balance sheets.
Proceeds from our asset-backed debt transactions deposits to the segregated accounts and payments to the Originators in respect of additional transfers of device payment plan agreement receivables are reflected in Cash flows from financing activities in our condensed consolidated statements of cash flows. Repayments of our asset-backed debt and related interest payments made from the segregated accounts are non-cash activities and therefore not reflected within Cash flows from financing activities in our condensed consolidated statements of cash flows. The asset-backed debt issued and the assets securing this debt are included onin our condensed consolidated balance sheets.
Asset-BackedABS Notes
In March 2017,During the six months ended June 30, 2019, we issued approximately $1.3 billion aggregate principal amount of senior and junior Asset-Backedcompleted the following ABS Notes through an ABS Entity.transactions:
|
| | | | | | |
| (dollars in millions) | Interest Rates % | | Expected Weighted-average Life to Maturity (in years) | Principal Amount Issued |
|
| March 2019 | | | | |
| A-1a Senior class notes | 2.930 | | 2.50 | $ | 900 |
|
| A-1b Senior floating rate class notes | LIBOR + 0.330 | (1) | 2.50 | 100 |
|
| B Junior class notes | 3.020 | | 3.22 | 69 |
|
| C Junior class notes | 3.220 | | 3.40 | 53 |
|
| March 2019 total | | | | 1,122 |
|
| | | | | |
| June 2019 | | | | |
| A-1a Senior class notes | 2.330 | | 2.52 | 855 |
|
| A-1b Senior floating rate class notes | LIBOR + 0.450 | (1) | 2.52 | 145 |
|
| B Junior class notes | 2.400 | | 3.28 | 69 |
|
| C Junior class notes | 2.600 | | 3.47 | 53 |
|
| June 2019 total | | | | 1,122 |
|
| Total | | | | $ | 2,244 |
|
(1) The Class A senior Asset-Backed Notes had an expected weighted-average life to maturity of 2.6 yearsone-month London Interbank Offered Rate (LIBOR) rate at issuance and bear interest at 2.060% per annum, the Class B junior Asset-Backed Notes had an expected weighted-average life to maturity of 3.38 years at issuance and bear interest at 2.450% per annum and the Class C junior Asset-Backed Notes had an expected weighted-average life to maturity of 3.64 years at issuance and bear interest at 2.650% per annum.June 30, 2019 was 2.398%.
In June 2017, we issued approximately $1.3 billion aggregate principal amount of senior and junior Asset-Backed Notes through an ABS Entity. The Class A senior Asset-Backed Notes had an expected weighted-average life to maturity of 2.47 years at issuance and bear interest at 1.920% per annum, the Class B junior Asset-Backed Notes had an expected weighted-average life to maturity of 3.11 years at issuance and bear interest at 2.220% per annum and the Class C junior Asset-Backed Notes had an expected weighted-average life to maturity of 3.34 years at issuance and bear interest at 2.380% per annum.
In October 2017, we issued approximately $1.4 billion aggregate principal amount of senior and junior Asset-Backed Notes through an ABS Entity. The Class A-1a senior Asset-Backed Notes had an expected weighted-average life to maturity of 2.48 years at issuance and bear interest at 2.060% per annum, the Class A-1b senior Asset-Backed Notes had an expected weighted -average life to maturity of 2.48 years at issuance and bear interest at one-month LIBOR + 0.270%, which rate will be reset monthly, the Class B junior Asset-Backed Notes had an expected weighted-average life to maturity of 3.12 years at issuance and bear interest at 2.380% per annum and the Class C junior Asset-Backed Notes had an expected weighted-average life to maturity of 3.35 years at issuance and bear interest at 2.530% per annum.
Under the terms of the Asset-Backedeach series of ABS Notes, there is a two-yeartwo year revolving period during which we may transfer additional receivables to the ABS Entity.
ABS Financing Facility
As of September 30, 2017, aggregate outstanding borrowings under two loans under In April 2019, the ABS Financing Facility were approximately $2.8 billion. The ABS Financing Facility has a two year revolving period of the ABS Notes issued in March 2017 ended and we began to repay principal on the 2017-1 Class A senior ABS Notes. During the three and six months ended June 30, 2019, we made aggregate principal repayments of $794 million and $1.4 billion, respectively, for all ABS Notes.
ABS Financing Facilities
In May 2018, we entered into an ABS financing facility with a number of financial institutions (2018 ABS Financing Facility). One loan agreement was entered into in connection with the 2018 ABS financing facility. During the three months ended June 30, 2019, the remaining $540 million outstanding under the loan agreement was prepaid, and the loan agreement was terminated.
In September 2016, we entered into an ABS Financing Facility with a number of financial institutions, which was amended and restated in May 2019 (2019 ABS Financing Facility). Under the terms of the 2019 ABS Financing Facility, the financial institutions made advances under asset-backed loans backed by device payment plan agreement receivables of both consumer and business customers. Two loan agreements were entered into in connection with the 2019 ABS Financing Facility in September 2016 and May 2017 and a third was entered into in May 2019. The 2016 and 2017 loan agreements had a final maturity date in March 2021 and bore interest at a floating rate. The two year revolving period of the two loan agreements ended in September 2018. The 2019 loan agreement has a final maturity date in May 2023 and bears interest at floating rates. There is a one year revolving period until May 2020, which may be extended during whichwith the approval of the financial institutions. Under all of the loan agreements, we may transfer additional receivableshave the right to prepay all or a portion of the ABS Entity.advances at any time without penalty, but in certain cases, with breakage costs. Subject to certain conditions, we may also remove receivables from the ABS Entity.
Although During the three months ended June 30, 2019, we paid off both the 2016 and 2017 loans for an aggregate of $671 million primarily with proceeds from the 2019 loan agreement. As of June 30, 2019, there was an outstanding balance under the 2019 ABS Financing Facility are fully drawn as of September 30, 2017,$1.8 billion. In August 2019, we haveprepaid $1.5 billion of the right to prepay all or a portion thereof at any time without penalty, butloan made in certain cases, with breakage costs. If we choose to prepay,May 2019 under the amount prepaid shall be available for further drawdowns until September 2018, except in certain circumstances.2019 ABS Financing Facility.
Variable Interest Entities (VIEs)
The ABS Entities meet the definition of a VIE for which we have determined that we are the primary beneficiary as we have both the power to direct the activities of the entity that most significantly impact the entity’s performance and the obligation to absorb losses or the right to receive benefits of the entity. Therefore, the assets, liabilities and activities of the ABS Entities are consolidated in our financial results and are included in amounts presented on the face of our condensed consolidated balance sheets.
The assets and liabilities related to our asset-backed debt arrangements included onin our condensed consolidated balance sheets were as follows:
|
| | | | | | | |
| | At June 30, |
| | At December 31, |
|
| (dollars in millions) | 2019 |
| | 2018 |
|
| Assets | | | |
| Account receivable, net | $ | 10,095 |
| | $ | 8,861 |
|
| Prepaid expenses and other | 1,020 |
| | 989 |
|
| Other assets | 3,353 |
| | 2,725 |
|
| | | | |
| Liabilities | | | |
| Accounts payable and accrued liabilities | 11 |
| | 7 |
|
| Short-term portion of long-term debt | 4,477 |
| | 5,352 |
|
| Long-term debt | 6,775 |
| | 4,724 |
|
|
| | | | | | | |
| | At September 30, |
| | At December 31, |
|
| (dollars in millions) | 2017 |
| | 2016 |
|
| Assets | | | |
| Account receivable, net | $ | 7,395 |
| | $ | 3,383 |
|
| Prepaid expenses and other | 444 |
| | 236 |
|
| Other assets | 2,666 |
| | 2,383 |
|
| | | | |
| Liabilities | | | |
| Accounts payable and accrued liabilities | 4 |
| | 4 |
|
| Short-term portion of long-term debt | 633 |
| | — |
|
| Long-term debt | 7,237 |
| | 4,988 |
|
See Note 57 for additional information on device payment plan agreement receivables used to secure asset-backed debt.
Credit Facilities
As of SeptemberJune 30, 2017,2019, the unused borrowing capacity under our $9.0$9.5 billion credit facility was approximately $8.9$9.4 billion. The credit facility does not require us to comply with financial covenants or maintain specified credit ratings, and it permits us to borrow even if our business has incurred a material adverse change. We use the credit facility for the issuance of letters of credit and for general corporate purposes.
We had fully drawn from theIn March 2016, we entered into a $1.0 billion equipment credit facility entered into in March 2016 insured by Eksportkreditnamnden, Stockholm, Sweden (EKN), the Swedishan export credit agency.agency with a maturity date of December 2024. As of SeptemberJune 30, 2017, we had an2019, the outstanding balance of $0.9 billion to repay.was $647 million. We used this credit facility to finance network equipment-related purchases.
In July 2017, we entered into equipment credit facilities insured by various export credit agencies providing us with the ability to borrow up to $4.0 billion to finance equipment-related purchases.purchases with maturity dates ranging from July 2022 to May 2027. The facilities have multiple borrowings available, portions of which extend through October 2019, contingent upon the amount of eligible equipment-related purchases made by Verizon. At Septemberthat we make. During the three and six months ended June 30, 2017,2019, we have not drawn ondrew down $450 million and $874 million, respectively, from these facilities. During the six months ended June 30, 2018, we drew down $1.7 billion from these facilities. As of June 30, 2019, we had an outstanding balance of $3.5 billion.
Additional Financing Activities (Non-Cash Transaction)Non-Cash Transaction
During the ninesix months ended SeptemberJune 30, 20172019 and 2018, we financed, primarily through alternativevendor financing arrangements, the purchase of approximately $0.4 billion$221 million and $862 million respectively, of long-lived assets consisting primarily of network equipment. At Septemberboth June 30, 2017, $1.12019 and 2018, $1.0 billion and $1.4 billion, respectively, relating to these financing arrangements, including those entered into in prior years and liabilities assumed through acquisitions, remained outstanding. These purchases are non-cash financing activities and therefore are not reflected within Capital expenditures onin our condensed consolidated statements of cash flows.
Early Debt Redemptions
During both the three and ninesix months ended SeptemberJune 30, 2017,2019, we recorded losses on early debt redemption costsredemptions of $0.5$1.5 billion related to the May tender offers and $1.3 billion, respectively.
We recognize early debt redemption costsother insignificant transactions, which were recorded in Other income (expense), net onin our condensed consolidated statements of income.
During the six months ended June 30, 2018, we recorded losses on early debt redemptions of $249 million related to the 2018 March tender offers for 13 series of notes issued by Verizon with coupon rates ranging from 1.750% to 5.012% and maturity dates ranging from 2021 to 2055, which were recorded in Other income (expense), net in our condensed consolidated statements of income.
Guarantees
We guarantee the debentures of our operating telephone company subsidiaries. As of SeptemberJune 30, 2017, $1.0 billion2019, $796 million aggregate principal amount of these obligations remained outstanding. Each guarantee will remain in place for the life of the obligation unless terminated pursuant to its terms, including the operating telephone company no longer being a wholly-owned subsidiary of Verizon.
We also guarantee the debt obligations of GTE LLC as successor in interest to GTE Corporation that were issued and outstanding prior to July 1, 2003. As of SeptemberJune 30, 2017, $0.8 billion2019, $423 million aggregate principal amount of these obligations remainremained outstanding.
|
| |
5. | Note 7. Wireless Device Payment Plans |
Under the Verizon device payment program, our eligible wireless customers purchase wireless devices under a device payment plan agreement. Customers that activate service on devices purchased under the device payment program pay lower service fees as compared to those under our fixed-term service plans, and their device payment plan charge is included on their standard wireless monthly bill. As of January 2017, we no longer offer consumersConsumer customers new fixed-term, subsidized service plans for phones.phones; however, we continue to offer subsidized plans to our Business
customers. We also continue to service existing plans for customers who have not yet purchased and activated devices under the Verizon device payment program.
Wireless Device Payment Plan Agreement Receivables
The following table displays device payment plan agreement receivables, net, that continue to be recognized in our condensed consolidated balance sheets:
|
| | | | | | | |
| | At June 30, |
| | At December 31, |
|
| (dollars in millions) | 2019 |
| | 2018 |
|
| Device payment plan agreement receivables, gross | $ | 18,327 |
| | $ | 19,313 |
|
| Unamortized imputed interest | (455 | ) | | (546 | ) |
| Device payment plan agreement receivables, net of unamortized imputed interest | 17,872 |
| | 18,767 |
|
| Allowance for credit losses | (487 | ) | | (597 | ) |
| Device payment plan agreement receivables, net | $ | 17,385 |
| | $ | 18,170 |
|
| | | | |
| Classified in our condensed consolidated balance sheets: | | | |
| Accounts receivable, net | $ | 12,486 |
| | $ | 12,624 |
|
| Other assets | 4,899 |
| | 5,546 |
|
| Device payment plan agreement receivables, net | $ | 17,385 |
| | $ | 18,170 |
|
|
| | | | | | | |
| | At September 30, |
| | At December 31, |
|
| (dollars in millions) | 2017 |
| | 2016 |
|
| Device payment plan agreement receivables, gross | $ | 15,434 |
| | $ | 11,797 |
|
| Unamortized imputed interest | (716 | ) | | (511 | ) |
| Device payment plan agreement receivables, net of unamortized imputed interest | 14,718 |
| | 11,286 |
|
| Allowance for credit losses | (727 | ) | | (688 | ) |
| Device payment plan agreement receivables, net | $ | 13,991 |
| | $ | 10,598 |
|
| | | | |
| Classified on our condensed consolidated balance sheets: | | | |
| Accounts receivable, net | $ | 9,860 |
| | $ | 6,140 |
|
| Other assets | 4,131 |
| | 4,458 |
|
| Device payment plan agreement receivables, net | $ | 13,991 |
| | $ | 10,598 |
|
Included in our device payment plan agreement receivables, net at SeptemberJune 30, 2017,2019 and December 31, 2018, are net device payment plan agreement receivables of $10.0$13.4 billion and $11.5 billion, respectively, that have been transferred to ABS Entities and continue to be reported in our condensed consolidated balance sheet.sheets. See Note 6 for additional information. We believe the carrying value of our installment loans receivables approximate their fair value using a Level 3 expected cash flow model.
We may offer our customers certain promotions wherethat allow a customer can trade-in his or herto trade in their owned device in connection with the purchase of a new device. Under these types of promotions, the customer receives a credit for the value of the trade-in device. In addition, we may provide the customer with additional future credits that will be applied against the customer’s monthly bill as long as service is maintained. We recognize a liability for the trade-in device measured at fair value, which is approximateddetermined by considering several factors, including the weighted-average selling prices obtained in recent resales of similar devices eligible for trade-in. Future credits are recognized when earned by the customer. Device payment plan agreement receivables, net does not reflect the trade-in device liability. At SeptemberJune 30, 2017,2019 and December 31, 2018 the amount of trade-in liability was insignificant.$60 million and $64 million, respectively.
From time to time, on select devices,we offer certain marketing promotions have been revocably offered tothat allow our customers to upgrade to a new device after paying down a certain specified portion of the required device payment plan agreement amount as well as trading in their device in good working order.
At the time of the sale of When a customer enters into a device payment plan agreement with the right to upgrade to a new device, we account for this trade-in right as a guarantee obligation.
For indirect channel wireless contracts with customers, we impute risk adjusted interest on the device payment plan agreement receivables. We record the imputed interest as a reduction to the related accounts receivable. Interest income, which is included within Service revenues and other onin our condensed consolidated statements of income, is recognized over the financed device payment term.
When originating device payment plan agreements, we use internal and external data sources to create a credit risk score to measure the credit quality of a customer and to determine eligibility for the device payment program. If a customer is either new to Verizon Wireless or has less than 210 days of customer tenure with Verizon Wireless (a new customer), the credit decision process relies more heavily on external data sources. If the customer has 210 days or more of customer tenure with Verizon Wireless (an existing customer), the credit decision process relies on internal data sources. Verizon Wireless’ experience has been that the payment attributes of longer tenured customers are highly predictive for estimating their abilityreliability to pay in the future.make future payments. External data sources include obtaining a credit report from a national consumer credit reporting agency, if available. Verizon Wireless uses its internal data and/or credit data obtained from the credit reporting agencies to create a custom credit risk score. The custom credit risk score is generated automatically (except with respect to a small number of applications where the information needs manual intervention) from the applicant’s credit data using Verizon Wireless’ proprietary custom credit models, which are empirically derived, demonstrably and statistically sound. The credit risk score measures the likelihood that the potential customer will become severely delinquent and be disconnected for non-payment. For a small portion of new customer applications, a traditional credit report is not available from one of the national credit reporting agencies because the potential customer does not have sufficient credit history. In those instances, alternate credit data is used for the risk assessment.
Based on the custom credit risk score, we assign each customer to a credit class, each of which has specified offers of credit including an account level spending limit and either a specifiedmaximum amount of credit allowed per device or a required down payment percentage. During the fourth quarter of 2018 Verizon Wireless moved all customers, new and existing, from a required down payment percentage, between zero and specified100%, to a maximum amount of credit limits. Device payment plan agreement receivables originated from customers assigned to credit classes requiring no down payment represent the lowest risk. Device payment plan agreement receivables originated from customers assigned to credit classes requiring a down payment represent a higher risk.per device.
Subsequent to origination, Verizon Wireless monitors delinquency and write-off experience as key credit quality indicators for its portfolio of device payment plan agreements and fixed-term service plans. The extent of our collection efforts with respect to a particular customer are based on the results of proprietary custom empirically derived internal behavioral scoring models whichthat analyze the customer’s past performance to
predict the likelihood of the customer falling further delinquent. These customer scoring models assess a number of variables, including origination characteristics, customer account history and payment patterns. Based on the score derived from these models, accounts are grouped by risk category to determine the collection strategy to be applied to such accounts. We continuously monitor collection performance results and the credit quality of our device payment plan agreement receivables based on a variety of metrics, including aging. Verizon Wireless considers an account to be delinquent and in default status if there are unpaid charges remaining on the account on the day after the bill’s due date.
The balance and aging of the device payment plan agreement receivables on a gross basis were as follows:
|
| | | | | | | |
| | At June 30, |
| | At December 31, |
|
| (dollars in millions) | 2019 |
| | 2018 |
|
| Unbilled | $ | 17,042 |
| | $ | 18,043 |
|
| Billed: | | | |
| Current | 1,028 |
| | 986 |
|
| Past due | 257 |
| | 284 |
|
| Device payment plan agreement receivables, gross | $ | 18,327 |
| | $ | 19,313 |
|
|
| | | | | | | |
| | At September 30, |
| | At December 31, |
|
| (dollars in millions) | 2017 |
| | 2016 |
|
| Unbilled | $ | 14,508 |
| | $ | 11,089 |
|
| Billed: | | | |
| Current | 760 |
| | 557 |
|
| Past due | 166 |
| | 151 |
|
| Device payment plan agreement receivables, gross | $ | 15,434 |
| | $ | 11,797 |
|
Activity in the allowance for credit losses for the device payment plan agreement receivables was as follows:
|
| | | | | | | |
| (dollars in millions) | 2019 |
| | 2018 |
|
| Balance at January 1, | $ | 597 |
| | $ | 848 |
|
| Bad debt expense | 401 |
| | 237 |
|
| Write-offs | (511 | ) | | (331 | ) |
| Balance at June 30, | $ | 487 |
| | $ | 754 |
|
|
| | | | | | | |
| (dollars in millions) | 2017 |
| | 2016 |
|
| Balance at January 1, | $ | 688 |
| | $ | 444 |
|
| Bad debt expense | 477 |
| | 437 |
|
| Write-offs | (438 | ) | | (347 | ) |
| Allowance related to receivables sold | — |
| | 59 |
|
| Other | — |
| | 8 |
|
| Balance at September 30, | $ | 727 |
| | $ | 601 |
|
Sales of Wireless Device Payment Plan Agreement Receivables
During 2015 and 2016, we established programs pursuant to a Receivables Purchase Agreement, or RPA, to sell from time to time, on an uncommitted basis, eligible device payment plan agreement receivables to a group of primarily relationship banks (Purchasers) on both a revolving (Revolving Program) and non-revolving (Non-Revolving Program) basis. The receivables sold under the RPA are no longer considered assets of Verizon. The outstanding portfolio of device payment plan agreement receivables derecognized from our condensed consolidated balance sheets, but which we continue to service, was $0.6 billion at September 30, 2017 and $6.4 billion at September 30, 2016. At September 30, 2017, the total portfolio of device payment plan agreement receivables, including derecognized device payment plan agreement receivables that we are servicing was $16.0 billion.
Under the Non-Revolving Program, we transferred eligible device payment plan agreement receivables to wholly-owned subsidiaries that are bankruptcy remote special purpose entities (Sellers). The Sellers sold the receivables to the Purchasers for upfront cash proceeds and additional consideration upon settlement of the receivables (the deferred purchase price). As of September 30, 2017, no sold receivables remain outstanding under the Non-Revolving program. Under the Revolving Program, the Sellers sold eligible device payment plan agreement receivables on a revolving basis, subject to a maximum funding limit, to the Purchasers. Sales of eligible receivables by the Sellers, once initiated, generally occurred and were settled on a monthly basis. Customer payments made towards receivables sold under the Revolving Program were available to purchase additional eligible device payment plan agreement receivables originated during the revolving period. We elected to end the revolving period in July 2016.
We continue to bill and collect on the receivables in exchange for a monthly servicing fee, which is insignificant. Eligible receivables under the RPA excluded device payment plan agreements where a new customer was required to provide a down payment. The sales of receivables under the RPA did not have a significant impact on our condensed consolidated statements of income. The cash proceeds received from the Purchasers were recorded within Cash flows provided by operating activities on our condensed consolidated statements of cash flows.
There were no sales of device payment plan agreement receivables under the Revolving Program or the Non-Revolving Program during the three and nine months ended September 30, 2017. There were no sales of device payment plan agreement receivables during the three months ended September 30, 2016. During the nine months ended September 30, 2016, we sold $3.3 billion of receivables, net of allowances and imputed interest, under the Revolving Program. We received cash proceeds from new transfers of $2.0 billion and cash proceeds from reinvested collections of $0.9 billion and recorded a deferred purchase price of $0.4 billion.
Deferred Purchase Price
Under the RPA, the deferred purchase price was initially recorded at fair value, based on the remaining device payment amounts expected to be collected, adjusted, as applicable, for the time value of money and by the timing and estimated value of the device trade-in in connection with upgrades. The estimated value of the device trade-in considers prices expected to be offered to us by independent third parties. This estimate contemplates changes in value after the launch of a device. The fair value measurements are considered to be Level 3 measurements within the
fair value hierarchy. The collection of the deferred purchase price is contingent on collections from customers. Collections, which were returned as deferred purchase price and recorded within Cash flows provided by operating activities on our condensed consolidated statements of cash flows, were insignificant and $0.6 billion, during the three and nine months ended September 30, 2017, respectively, and $0.4 billion and $0.5 billion during the three and nine months ended September 30, 2016, respectively. Collections, recorded within Cash flows used in investing activities on our condensed consolidated statements of cash flows, were $0.5 billion during the three and nine months ended September 30, 2017, respectively, and insignificant during both the three and nine months ended September 30, 2016. At September 30, 2017, our deferred purchase price receivable, which is held by the Sellers, was comprised of $0.5 billion included within Prepaid expenses and other in our condensed consolidated balance sheet. At December 31, 2016, our deferred purchase price receivable was comprised of $1.2 billion included within Prepaid expenses and other and $0.4 billion included within Other assets in our condensed consolidated balance sheet.
Variable Interest Entities (VIEs)
Under the RPA, the Sellers’ sole business consists of the acquisition of the receivables from Cellco Partnership and certain other affiliates of Verizon and the resale of the receivables to the Purchasers. The assets of the Sellers are not available to be used to satisfy obligations of any Verizon entities other than the Sellers. We determined that the Sellers are VIEs as they lack sufficient equity to finance their activities. Given that we have the power to direct the activities of the Sellers that most significantly impact the Sellers’ economic performance, we are deemed to be the primary beneficiary of the Sellers. As a result, we consolidate the assets and liabilities of the Sellers into our condensed consolidated balance sheets.
Continuing Involvement
Verizon has continuing involvement with the sold receivables as it services the receivables. We continue to service the customer and their related receivables on behalf of the Purchasers, including facilitating customer payment collection, in exchange for a monthly servicing fee. While servicing the receivables, the same policies and procedures are applied to the sold receivables that apply to owned receivables, and we continue to maintain normal relationships with our customers. The credit quality of the customers we continue to service is consistent throughout the periods presented. To date, we have collected and remitted to the Purchasers approximately $10.1 billion, net of fees. At September 30, 2017, the amount remaining to be remitted to the Purchasers is insignificant. Credit losses on receivables sold were insignificant during both the nine months ended September 30, 2017 and 2016.
In addition, we have continuing involvement related to the sold receivables as we may be responsible for absorbing additional credit losses pursuant to the agreements. The Company’s maximum exposure to loss related to the involvement with the Sellers is limited to the amount of the outstanding deferred purchase price, which was $0.5 billion as of September 30, 2017. The maximum exposure to loss represents an estimated loss that would be incurred under severe, hypothetical circumstances whereby the Company would not receive the portion of the proceeds withheld by the Purchasers. As we believe the probability of these circumstances occurring is remote, the maximum exposure to loss is not an indication of the Company’s expected loss.
|
| |
6. | Note 8. Fair Value Measurements |
Recurring Fair Value Measurements
The following table presents the balances of assets and liabilities measured at fair value on a recurring basis at Septemberas of June 30, 2017:2019:
| | | (dollars in millions) | Level 1(1) |
| | Level 2(2) |
| | Level 3(3) |
| | Total |
| Level 1(1) |
| | Level 2(2) |
| | Level 3(3) |
| | Total |
|
| Assets: | | | | | | | | | | | | | | |
| Other assets: | | | | | | | | | | | | | | |
| Equity securities | $ | 79 |
| | $ | — |
| | $ | — |
| | $ | 79 |
| |
| Fixed income securities | — |
| | 378 |
| | — |
| | 378 |
| $ | — |
| | $ | 434 |
| | $ | — |
| | $ | 434 |
|
| Interest rate swaps | — |
| | 162 |
| | — |
| | 162 |
| — |
| | 529 |
| | — |
| | 529 |
|
| Cross currency swaps | — |
| | 333 |
| | — |
| | 333 |
| — |
| | 170 |
| | — |
| | 170 |
|
| Interest rate cap | — |
| | 3 |
| | — |
| | 3 |
| |
| Interest rate caps | | — |
| | 2 |
| | — |
| | 2 |
|
| Foreign exchange forwards | | — |
| | 5 |
| | — |
| | 5 |
|
| Total | $ | 79 |
| | $ | 876 |
| | $ | — |
| | $ | 955 |
| $ | — |
| | $ | 1,140 |
| | $ | — |
| | $ | 1,140 |
|
| | | | | | | | | | | | | | | |
| Liabilities: | | | | | | | | | | | | | | |
| Other liabilities: | | | | | | | | | | | | | | |
| Interest rate swaps | $ | — |
| | $ | 183 |
| | $ | — |
| | $ | 183 |
| $ | — |
| | $ | 189 |
| | $ | — |
| | $ | 189 |
|
| Cross currency swaps | — |
| | 1,058 |
| | — |
| | 1,058 |
| — |
| | 814 |
| | — |
| | 814 |
|
| Forward starting interest rate swaps | | — |
| | 536 |
| | — |
| | 536 |
|
| Interest rate caps | | — |
| | 1 |
| | — |
| | 1 |
|
| Total | $ | — |
| | $ | 1,241 |
| | $ | — |
| | $ | 1,241 |
| $ | — |
| | $ | 1,540 |
| | $ | — |
| | $ | 1,540 |
|
The following table presents the balances of assets and liabilities measured at fair value on a recurring basis atas of December 31, 2016:2018:
| | | (dollars in millions) | Level 1(1) |
| | Level 2(2) |
| | Level 3(3) |
| | Total |
| Level 1(1) |
| | Level 2(2) |
| | Level 3(3) |
| | Total |
|
| Assets: | | | | | | | | | | | | | | |
| Other assets: | | | | | | | | | | | | | | |
| Equity securities | $ | 123 |
| | $ | — |
| | $ | — |
| | $ | 123 |
| |
| Fixed income securities | 10 |
| | 566 |
| | — |
| | 576 |
| $ | — |
| | $ | 405 |
| | $ | — |
| | $ | 405 |
|
| Interest rate swaps | — |
| | 71 |
| | — |
| | 71 |
| — |
| | 3 |
| | — |
| | 3 |
|
| Cross currency swaps | — |
| | 45 |
| | — |
| | 45 |
| — |
| | 220 |
| | — |
| | 220 |
|
| Interest rate caps | — |
| | 10 |
| | — |
| | 10 |
| — |
| | 14 |
| | — |
| | 14 |
|
| Total | $ | 133 |
| | $ | 692 |
| | $ | — |
| | $ | 825 |
| $ | — |
| | $ | 642 |
| | $ | — |
| | $ | 642 |
|
| | | | | | | | | | | | | | | |
| Liabilities: | | | | | | | | | | | | | | |
| Other liabilities: | | | | | | | | | | | | | | |
| Interest rate swaps | $ | — |
| | $ | 236 |
| | $ | — |
| | $ | 236 |
| $ | — |
| | $ | 813 |
| | $ | — |
| | $ | 813 |
|
| Cross currency swaps | — |
| | 1,803 |
| | — |
| | 1,803 |
| — |
| | 536 |
| | — |
| | 536 |
|
| Forward starting interest rate swaps | | — |
| | 60 |
| | — |
| | 60 |
|
| Interest rate caps | | — |
| | 4 |
| | — |
| | 4 |
|
| Total | $ | — |
| | $ | 2,039 |
| | $ | — |
| | $ | 2,039 |
| $ | — |
| | $ | 1,413 |
| | $ | — |
| | $ | 1,413 |
|
| |
(1) | quotedQuoted prices in active markets for identical assets or liabilities |
| |
(2) | observableObservable inputs other than quoted prices in active markets for identical assets and liabilities |
| |
(3) | no observableUnobservable pricing inputs in the market |
Equity securities consistCertain of our equity investments do not have readily determinable fair values and are excluded from the tables above. Such investments are measured at cost, less any impairment, plus or minus changes resulting from observable price changes in common stockorderly transactions for an identical or similar investment of domesticthe same issuer and international corporations measured using quoted pricesare included in active markets.Investments in unconsolidated businesses in our condensed consolidated balance sheets. As of June 30, 2019 and December 31, 2018, the carrying amount of our investments without readily determinable fair values were $289 million and $248 million, respectively. During the three and six months ended June 30, 2019, there were insignificant adjustments due to observable price changes and there were no impairment charges. Cumulative adjustments due to observable price changes and impairment charges were $58 million and insignificant, respectively.
Fixed income securities consist primarily of investments in municipal bonds as well as U.S. Treasury securities. We use quoted prices in active markets for our U.S. Treasury securities, therefore these securities are classified as Level 1.bonds. For all other fixed income securities that do not have quoted prices in active markets, we use alternative matrix pricing resulting in these debt securities being classified as Level 2.
Derivative contracts are valued using models based on readily observable market parameters for all substantial terms of our derivative contracts and thus are classified within Level 2. We use mid-market pricing for fair value measurements of our derivative instruments. Our derivative instruments are recorded on a gross basis.
We recognize transfers between levels of the fair value hierarchy as of the end of the reporting period. There were no transfers between Level 1 and Level 2 during the ninesix months ended SeptemberJune 30, 20172019 and 2016.2018.
Fair Value of Short-term and Long-term Debt
The fair value of our debt is determined using various methods, including quoted prices for identical terms and maturities, which is a Level 1 measurement, as well as quoted prices for similar terms and maturities in inactive markets and future cash flows discounted at current rates, which are Level 2 measurements. The fair value of our short-term and long-term debt, excluding capitalfinance leases, was as follows:
|
| | | | | | | | | | | | | | | |
| | At June 30, | | | At December 31, | |
| | 2019 | | | 2018 | |
| (dollars in millions) | Carrying Amount |
| | Fair Value |
| | Carrying Amount |
| | Fair Value |
|
| Short- and long-term debt, excluding finance leases | $ | 112,424 |
| | $ | 129,342 |
| | $ | 112,159 |
| | $ | 118,535 |
|
|
| | | | | | | | | | | | | | | |
| | At September 30, | | | At December 31, | |
| | 2017 | | | 2016 | |
| (dollars in millions) | Carrying Amount |
| | Fair Value |
| | Carrying Amount |
| | Fair Value |
|
| Short- and long-term debt, excluding capital leases | $ | 116,512 |
| | $ | 128,096 |
| | $ | 107,128 |
| | $ | 117,584 |
|
Derivative Instruments
The following table sets forth the notional amounts of our outstanding derivative instruments:
|
| | | | | | | |
| | At June 30, |
| | At December 31, |
|
| (dollars in millions) | 2019 |
| | 2018 |
|
| Interest rate swaps | $ | 19,084 |
| | $ | 19,813 |
|
| Cross currency swaps | 20,091 |
| | 16,638 |
|
| Forward starting interest rate swaps | 3,000 |
| | 4,000 |
|
| Interest rate caps | 1,292 |
| | 2,218 |
|
| Foreign exchange forwards | 1,035 |
| | 600 |
|
|
| | | | | | | |
| | At September 30, |
| | At December 31, |
|
| | 2017 |
| | 2016 |
|
| (dollars in millions) | Notional Amount |
| | Notional Amount |
|
| Interest rate swaps | $ | 20,168 |
| | $ | 13,099 |
|
| Cross currency swaps | 15,666 |
| | 12,890 |
|
| Interest rate caps | 2,840 |
| | 2,540 |
|
Interest Rate Swaps
We enter into interest rate swaps to achieve a targeted mix of fixed and variable rate debt. We principally receive fixed rates and pay variable rates based on LIBOR, resulting in a net increase or decrease to Interest expense. These swaps are designated as fair value hedges and hedge against interest rate risk exposure of designated debt issuances. We record the interest rate swaps at fair value onin our condensed consolidated
balance sheets as assets and liabilities. Changes in the fair value of the interest rate swaps are recorded to Interest expense, which are offset by changes in the fair value of the hedged debt due to changes in interest rates.
During the first quarter of 2017,six months ended June 30, 2019, we entered into interest rate swaps with a total notional value of $3.5 billion.
During the third quarter of 2017, we entered into interest rate swaps with a total notional value of $4.0 billion$510 million and settled interest rate swaps with a total notional value of $0.5$1.2 billion.
The ineffective portionportions of ourthese interest rate swaps was insignificant for the three and ninesix months ended SeptemberJune 30, 20172019 were insignificant and 2016.$60 million, respectively, and insignificant for the similar periods in 2018.
Forward Interest Rate SwapsThe following amounts were recorded in Long-term debt in our condensed consolidated balance sheets related to cumulative basis adjustments for fair value hedges:
In order to manage our exposure to future interest rate changes, we previously entered into forward interest rate swaps. We designated these contracts as cash flow hedges. During the third quarter of 2016, we settled all outstanding forward interest rate swaps. During the three and nine months ended September 30, 2016, pre-tax losses of an insignificant amount and $0.2 billion, respectively, were recognized in Other comprehensive income (loss). |
| | | | | | | |
| | At June 30, |
| | At December 31, |
|
| (dollars in millions) | 2019 |
| | 2018 |
|
| Carrying amount of hedged liabilities | $ | 19,341 |
| | $ | 18,903 |
|
| Cumulative amount of fair value hedging adjustment included in the carrying amount of the hedged liabilities | 373 |
| | (785 | ) |
Cross Currency Swaps
We have entered into cross currency swaps designated as cash flow hedges to exchange our British Pound Sterling, Euro, Swiss Franc and Australian Dollar-denominated cash flows into U.S. dollars and to fix our cash payments in U.S. dollars, as well as to mitigate the impact of foreign currency transaction gains or losses.
During the second quarter of 2017,three and six months ended June 30, 2019, we entered into cross currency swaps with a total notional value of $1.0$3.5 billion.
During the third quarter of 2017, we entered into cross currency swaps with a total notional value of approximately $1.8 billion.
During the three and ninesix months ended SeptemberJune 30, 2017,2019, pre-tax gainslosses of $0.5 billion$340 million and $1.0 billion,$328 million, respectively, were recognized in Other comprehensive income (loss). During the three and ninesix months ended SeptemberJune 30, 2016,2018, a pre-tax gainsloss of $0.3$1.1 billion and $0.1 billionan insignificant pretax gain, respectively, were recognized in Other comprehensive income (loss). A portion of the gains and losses recognized in Other comprehensive income (loss) was reclassified to Other income (expense), net to offset the related pre-tax foreign currency transaction gain or loss on the underlying hedged item.
Forward Starting Interest Rate Swaps
We have entered into forward starting interest rate swaps designated as cash flow hedges in order to manage our exposure to interest rate changes on future forecasted transactions.
During the three and six months ended June 30, 2019, we did not enter into any new forward starting interest rate swaps. During the three months ended June 30, 2019, we did not settle any forward starting interest rate swaps and for the six months ended June 30, 2019, we settled swaps with a total notional value of $1.0 billion. During the three and six months ended June 30, 2019, pre-tax losses of $293 million and $497 million, respectively, were recognized in Other comprehensive income (loss).
We hedge our exposure to the variability in future cash flows based on the expected maturities of the related forecasted debt issuance.
Net Investment Hedges
We have designated certain foreign currency debt instruments as net investment hedges to mitigate foreign exchange exposure related to non-U.S. dollar net investments in certain foreign subsidiaries against changes in foreign exchange rates. The notional amount of the Euro-denominated debt as a net investment hedge was $0.9 billion and $0.8 billion at September€750 million as of both June 30, 20172019 and December 31, 2016, respectively.2018.
Undesignated Derivatives
We also have the following derivative contracts which we use as an economic hedgehedges but for which we have elected not to apply hedge accounting.
Interest Rate Caps
We enter into interest rate caps to mitigate our interest exposure to interest rate increases on our ABS Financing Facility.Facilities and ABS Notes. During the second quarterthree and six months ended June 30, 2019 and 2018, we recognized an insignificant amount in Interest expense.
Foreign Exchange Forwards
We enter into British Pound Sterling and Euro foreign exchange forwards to mitigate our foreign exchange rate risk related to non-functional currency denominated monetary assets and liabilities of 2017,international subsidiaries. During the three and six months ended June 30, 2019, we entered into interest rate capsforeign exchange forwards with a total notional value of $0.3 billion.$3.1 billion and $6.1 billion, respectively, and settled foreign exchange forwards with a total notional value of $3.0 billion and $5.6 billion, respectively. During the three and ninesix months ended SeptemberJune 30, 2017,2019, we recognized an insignificant increaseamount in Interest expense.Other income (expense), net.
Concentrations of Credit Risk
Financial instruments that subject us to concentrations of credit risk consist primarily of temporary cash investments, short-term and long-term investments, trade receivables, including device payment plan agreement receivables, certain notes receivable, including lease receivables, and derivative contracts.
Counterparties to our derivative contracts are also major financial institutions with whom we have negotiated derivatives agreements (ISDA master agreements) and credit support annex (CSA) agreements (CSA) which provide rules for collateral exchange. Our CSAs generally require collateralized arrangementsNegotiations and executions of new ISDA master agreements and CSA agreements with our counterparties in connection with uncleared derivatives, but as of September 30, 2017, we have entered into amendments to ourcontinued throughout 2018 and 2019. The newly executed CSA agreements with substantially all ofcontain rating based thresholds such that we or our counterparties that suspend the requirement for cashmay be required to hold or post collateral posting for a specified periodbased upon changes in outstanding positions as compared to established thresholds and changes in credit ratings. At June 30, 2019 we held approximately $0.1 billion and at December 31, 2018 we posted approximately $0.1 billion of time by both counterparties.collateral related to derivative contracts under collateral exchange arrangements, which were recorded as Other current liabilities and Prepaid expenses and other, respectively, in our condensed consolidated balance sheets. While we may be exposed to credit losses due to the nonperformance of our counterparties, we consider the risk remote and do not expect that any such nonperformance would result in a significant effect on our results of operations or financial condition due to our diversified pool of counterparties. During the first and second quarter of 2017, we paid an insignificant amount of cash to extend certain of such amendments to certain collateral exchange arrangements. As a result of the amendments to the CSA agreements, we did not post any collateral at September 30, 2017. At December 31, 2016, we posted collateral of approximately $0.2 billion related to derivative contracts under collateral exchange arrangements, which were recorded as Prepaid expenses and other in our condensed consolidated balance sheet.
|
| |
7. | Stock-Based Compensation |
Verizon Communications Long-Term Incentive Plan
In May 2017, Verizon’s shareholders approved the 2017 Long-Term Incentive Plan (the 2017 Plan) and terminated Verizon’s authority to grant new awards under the Verizon 2009 Long-Term Incentive Plan (the 2009 Plan). Consistent with the 2009 Plan, the 2017 Plan provides for broad-based equity grants to employees, including executive officers, and permits the granting of stock options, stock appreciation rights, restricted stock, restricted stock units, performance shares, performance stock units and other awards. Upon approval of the 2017 Plan, Verizon reserved the 91 million shares that were reserved but not issued under the 2009 Plan for future issuance under the 2017 Plan.
Restricted Stock Units
The 2009 Plan and 2017 Plan provide for grants of Restricted Stock Units (RSUs). For RSUs granted prior to 2017, vesting generally occurs at the end of the third year. For the 2017 grants, vesting generally occurs in three equal installments on each anniversary of the grant date. The RSUs are generally classified as equity awards because the RSUs will be paid in Verizon common stock upon vesting. The RSU equity awards are measured using the grant date fair value of Verizon common stock and are not remeasured at the end of each reporting period. Dividend equivalent units are also paid to participants at the time the RSU award is paid, and in the same proportion as the RSU award.
In connection with our acquisition of Yahoo’s operating business, on the closing date of the Transaction each unvested and outstanding Yahoo RSU award that was held by an employee who became an employee of Verizon was replaced with a Verizon RSU award, which is generally payable in cash upon the applicable vesting date. These awards are classified as liability awards and are measured at fair value at the end of each reporting period.
Performance Stock Units
The 2009 Plan and 2017 Plan also provide for grants of Performance Stock Units (PSUs) that generally vest at the end of the third year after the grant. As defined by the 2009 Plan and 2017 Plan, the Human Resources Committee of the Board of Directors determines the number of PSUs a participant earns based on the extent to which the corresponding performance goals have been achieved over the three-year performance cycle. The PSUs are classified as liability awards because the PSU awards are paid in cash upon vesting. The PSU award liability is measured at its fair value at the end of each reporting period and, therefore, will fluctuate based on the price of Verizon common stock as well as performance relative to the targets. Dividend equivalent units are also paid to participants at the time that the PSU award is determined and paid, and in the same proportion as the PSU award. The granted and cancelled activity for the PSU award includes adjustments for the performance goals achieved.
The following table summarizes the Restricted Stock Unit and Performance Stock Unit activity:
|
| | | | | | | | |
| | Restricted Stock Units | | Performance Stock Units |
|
| (shares in thousands) | Equity Awards |
| | Liability Awards |
| |
| Outstanding, January 1, 2017 | 13,308 |
| | — |
| | 17,919 |
|
| Granted | 6,360 |
| | 22,073 |
| | 6,564 |
|
| Payments | (4,987 | ) | | (4,909 | ) | | (6,031 | ) |
| Cancelled/Forfeited | (198 | ) | | (1,686 | ) | | (321 | ) |
| Outstanding, September 30, 2017 | 14,483 |
| | 15,478 |
| | 18,131 |
|
As of September 30, 2017, unrecognized compensation expense related to the unvested portion of Verizon’s RSUs and PSUs was approximately $1.2 billion and is expected to be recognized over approximately two years.
The equity RSUs granted in 2017 have a weighted-average grant date fair value of $49.93 per unit.
|
| |
8. | Note 9. Employee Benefits |
We maintain non-contributory defined benefit pension plans for many of ourcertain employees. In addition, we maintain postretirement health care and life insurance plans for certain retirees and their dependents, which are both contributory and non-contributory, and include a limit on our share of the cost for certain recentcurrent and future retirees. In accordance with our accounting policy for pension and other postretirement benefits, operating expenses include service costs associated with pension and benefit relatedother postretirement benefits while other credits and/or charges based on actuarial assumptions, including projected discount rates, and an estimated return on plan assets.assets, and impact from health care trend rates are reported in Other income (expense), net. These estimates are updated in the fourth quarter or upon a remeasurement event to reflect actual return on plan assets and updated actuarial assumptions.assumptions or upon a remeasurement event. The adjustment will beis recognized in our consolidatedthe income statement of income during the fourth quarter or upon a remeasurement event pursuant to our accounting policy for the recognition of actuarial gains and losses.
Net Periodic Benefit Cost (Income)
The following table summarizes the components of net periodic benefit cost (income) cost related to our pension and postretirement health care and life insurance plans:
| | | (dollars in millions) | Pension | | Health Care and Life | | |
| Three Months Ended September 30, | 2017 |
| | 2016 |
| | 2017 |
| | 2016 |
| |
| | | (dollars in millions) | |
| | | Pension | | Health Care and Life | |
| Three Months Ended June 30, | | 2019 |
| | 2018 |
| | 2019 |
| | 2018 |
|
| Service cost - Cost of services | | $ | 50 |
| | $ | 59 |
| | $ | 19 |
| | $ | 26 |
|
| Service cost - Selling, general and administrative expense | | 12 |
| | 14 |
| | 5 |
| | 6 |
|
| Service cost | $ | 70 |
| | $ | 82 |
| | $ | 37 |
| | $ | 40 |
| $ | 62 |
| | $ | 73 |
| | $ | 24 |
| | $ | 32 |
|
| | | | | | | | | |
| Amortization of prior service cost (credit) | 10 |
| | 10 |
| | (235 | ) | | (235 | ) | $ | 16 |
| | $ | 10 |
| | $ | (243 | ) | | $ | (244 | ) |
| Expected return on plan assets | (315 | ) | | (257 | ) | | (13 | ) | | (13 | ) | (282 | ) | | (329 | ) | | (10 | ) | | (11 | ) |
| Interest cost | 171 |
| | 162 |
| | 164 |
| | 162 |
| 176 |
| | 166 |
| | 158 |
| | 154 |
|
| Remeasurement loss, net | — |
| | 555 |
| | — |
| | — |
| |
| Net periodic benefit (income) cost | $ | (64 | ) | | $ | 552 |
| | $ | (47 | ) | | $ | (46 | ) | |
| Termination benefits | — |
| | 4 |
| | — |
| | — |
| |
| Other components | | $ | (90 | ) | | $ | (153 | ) | | $ | (95 | ) | | $ | (101 | ) |
| | | | | | | | | |
| Total | $ | (64 | ) | | $ | 556 |
| | $ | (47 | ) | | $ | (46 | ) | $ | (28 | ) | | $ | (80 | ) | | $ | (71 | ) | | $ | (69 | ) |
|
| | | | | | | | | | | | | | | |
| | (dollars in millions) | |
| | Pension | | Health Care and Life | |
| Six Months Ended June 30, | 2019 |
| | 2018 |
| | 2019 |
| | 2018 |
|
| Service cost - Cost of services | $ | 100 |
| | $ | 117 |
| | $ | 39 |
| | $ | 52 |
|
| Service cost - Selling, general and administrative expense | 23 |
| | 28 |
| | 9 |
| | 12 |
|
| Service cost | $ | 123 |
| | $ | 145 |
| | $ | 48 |
| | $ | 64 |
|
| | | | | | | | |
| Amortization of prior service cost (credit) | $ | 31 |
| | $ | 20 |
| | $ | (486 | ) | | $ | (488 | ) |
| Expected return on plan assets | (564 | ) | | (658 | ) | | (19 | ) | | (22 | ) |
| Interest cost | 354 |
| | 332 |
| | 315 |
| | 307 |
|
| Remeasurement gain, net | (96 | ) | | — |
| | — |
| | — |
|
| Other components | $ | (275 | ) | | $ | (306 | ) | | $ | (190 | ) | | $ | (203 | ) |
| | | | | | | | |
| Total | $ | (152 | ) | | $ | (161 | ) | | $ | (142 | ) | | $ | (139 | ) |
|
| | | | | | | | | | | | | | | |
| (dollars in millions) | Pension | | Health Care and Life | |
| Nine Months Ended September 30, | 2017 |
| | 2016 |
| | 2017 |
| | 2016 |
|
| Service cost | $ | 210 |
| | $ | 238 |
| | $ | 111 |
| | $ | 153 |
|
| Amortization of prior service cost (credit) | 29 |
| | 12 |
| | (705 | ) | | (421 | ) |
| Expected return on plan assets | (947 | ) | | (785 | ) | | (39 | ) | | (41 | ) |
| Interest cost | 513 |
| | 518 |
| | 494 |
| | 583 |
|
| Remeasurement loss, net | — |
| | 1,977 |
| | — |
| | 2,293 |
|
| Net periodic benefit (income) cost | $ | (195 | ) | | $ | 1,960 |
| | $ | (139 | ) | | $ | 2,567 |
|
| Termination benefits | — |
| | 4 |
| | — |
| | — |
|
| Total | $ | (195 | ) | | $ | 1,964 |
| | $ | (139 | ) | | $ | 2,567 |
|
Changes in Other Postretirement Benefit Plans
During the three months ended September 30, 2017, amendments were made to certain postretirement plans related to retiree medical benefits for management and certain union represented employees and retirees. The impactservice cost component of the plan amendments was a reduction in our postretirement benefit plan obligations of approximately $0.5 billion, which has been recorded as a net increase to Accumulated other comprehensive income of $0.3 billion (net of taxes of $0.2 billion). The impact of the amount recorded in Accumulated other comprehensive income that will be reclassified to net periodic benefit cost (income) is minimal. recorded in Cost of services and Selling, general and administrative expense in the condensed consolidated statements of income while the other components, including mark-to-market adjustments, if any, are recorded in Other income (expense), net.
Severance, Pension and Benefit Charges2018 Voluntary Separation Program
DuringIn September 2018, we announced a Voluntary Separation Program for select U.S.-based management employees. Approximately 10,400 eligible employees separated from the three and nine months ended September 30, 2017, we recorded a pre-tax severance charge of approximately $0.1 billion and $0.7 billion, respectively, primarily in connection with the acquisition of Yahoo's operating business.
During the nine months ended September 30, 2016, we recorded a net pre-tax curtailment gain of $0.5 billion due to the eliminationCompany under this program as of the accrualend of June 2019. The severance benefits for some or all future services of a significant number ofpayments to these employees covered by three of our defined benefit pension plans and one of our other postretirement benefit plans.
During the three months ended September 30, 2016, we recorded net pre-tax severance, pension and benefit charges of approximately $0.8 billion primarily for our pension plans in accordance with our accounting policyare expected to recognize actuarial gains and losses in the period in which they occur. The pension remeasurement charges of $0.6 billion primarily related to settlements for employees who received lump-sum distributions in five of our defined benefit pension plans. The charges were primarily driven by a decrease in our discount rate assumption of $0.8 billion used to determine the current year liabilities of our pension plans, partially offsetbe substantially completed by the difference between our expected return on assetsend of 7.0% and our annualized actual return on assets of 11.0% at August 31, 2016 ($0.2 billion). Our weighted-average discount rate assumption was 3.61% at August 31, 2016. As part of this charge, we recorded severance costs of $0.2 billion under our existing separation plans.September 2019.
During the three months ended June 30, 2016 we recorded net pre-tax pension and benefit remeasurement charges of approximately $3.6 billion in accordance with our accounting policy to recognize actuarial gains and losses in the period in which they occur. These charges were comprised of a net pre-tax pension and benefit remeasurement charge of $0.8 billion measured as of April 1, 2016 related to curtailments in three of our defined benefit pension plans and one of our other postretirement benefit plans, a net pre-tax pension and benefit remeasurement charge of $2.7 billion measured as of May 31, 2016 in two of our defined benefit pension plans and three of our other postretirement benefit plans as a result of our accounting for the contractual healthcare caps and bargained for changes, and a net pre-tax pension and benefit remeasurement charge of $0.1 billion measured as of May 31, 2016 related to settlements for employees who received lump-sum distributions in three of Verizon’s defined benefit pension plans. The pension and benefit remeasurement charges were primarily driven by a decrease in our discount rate assumption used to determine the current year liabilities of our pension and other postretirement benefit plans ($2.7 billion) and updated healthcare cost trend rate assumptions ($0.9 billion). Our weighted-average discount rate assumption decreased from 4.60% at December 31, 2015 to 3.99% at May 31, 2016.
During the three months ended March 31, 2016, we also recorded a net pre-tax pension and benefit remeasurement charge of $0.2 billion related to settlements for employees who received lump-sum distribution in one of Verizon’s defined benefit pension plans.
Severance Payments
During the three and ninesix months ended SeptemberJune 30, 2017,2019, we paid severance benefits of $0.2 billion$643 million and $0.6$1.5 billion, respectively. During both the three and six month ended June 30, 2019, we recorded net pre-tax severance charges of an insignificant amount. At SeptemberJune 30, 2017,2019, we had a remaining severance liability of $0.6 billion,$765 million, a portion of which includes future contractual payments to employees separated as a result of September 30, 2017.the Voluntary Separation Program.
Employer Contributions
During the three and ninesix months ended SeptemberJune 30, 2017,2019, we contributed $0.2 billion and $4.0 billion, respectively,made a discretionary contribution of $300 million to our qualified pension plans, which included $3.4plans. As a result of the $300 million and $1.0 billion of discretionary pension contributions during the ninesix months ended SeptemberJune 30, 2017. The contributions2019 and 2018, respectively, we do not expect mandatory pension funding through December 31, 2019. There was no contribution made to our nonqualified pension plans were $0.1 billion during the three and ninesix months ended SeptemberJune 30, 2017.2019. There have been no significant changes with respect to the nonqualified pension and other postretirement benefit plans contributions in 2017 as previously disclosed in Part II. Item 7 “Management’s Discussion and Analysis2019.
Remeasurement gain, net
During the six months ended June 30, 2019, we recorded a net pre-tax remeasurement gain of Financial Condition and Results of Operations”$96 million in our Annual Reportpension plans triggered by the Voluntary Separation Program for select U.S.-based management employees and other headcount reduction initiatives, primarily driven by a $150 million credit due to the difference between our estimated return on Form 10-K forassets and our actual return on assets, offset by a $54 million charge due to a change in our discount rate assumption used to determine the current year ended December 31, 2016.liabilities of our pension plans.
|
| |
9. | Note 10. Equity and Accumulated Other Comprehensive Income |
Equity
Changes in the components of Total equity were as follows:
|
| | | | | | | | | | | |
| | Attributable |
| | Noncontrolling |
| | Total |
|
| (dollars in millions) | to Verizon |
| | Interests |
| | Equity |
|
| Balance at January 1, 2017 | $ | 22,524 |
| | $ | 1,508 |
| | $ | 24,032 |
|
| | | | | | |
| Net income | 11,432 |
| | 335 |
| | 11,767 |
|
| Other comprehensive income | 10 |
| | — |
| | 10 |
|
| Comprehensive income | 11,442 |
| | 335 |
| | 11,777 |
|
| | | | | | |
| Contributed capital | (84 | ) | | — |
| | (84 | ) |
| Dividends declared | (7,118 | ) | | — |
| | (7,118 | ) |
| Common stock in treasury | 122 |
| | — |
| | 122 |
|
| Distributions and other | (38 | ) | | (240 | ) | | (278 | ) |
| Balance at September 30, 2017 | $ | 26,848 |
| | $ | 1,603 |
| | $ | 28,451 |
|
|
| | | | | | | | | | | | | | |
| (dollars in millions, except per share amounts, and shares in thousands) |
| Three months ended June 30, | 2019 |
| | | | 2018 |
| | | |
| | Shares |
| | Amount |
| | Shares |
| | Amount |
| |
| Common Stock | | | | | | | | |
| Balance at beginning of period | 4,291,434 |
| | $ | 429 |
| | 4,291,422 |
| | $ | 429 |
| |
| Common shares issued | — |
| | — |
| | 12 |
| | — |
| |
| Balance at end of period | 4,291,434 |
| | 429 |
| | 4,291,434 |
| | 429 |
| |
| | | | | | | | | |
| Additional Paid In Capital | | | | | | | | |
| Balance at beginning of period | | | 13,418 |
| | | | 13,437 |
| |
| Other | | | 1 |
| | | | 1 |
| |
| Balance at end of period | | | 13,419 |
| | | | 13,438 |
| |
| | | | | | | | | |
| Retained Earnings | | | | | | | | |
| Balance at beginning of period | | | 46,493 |
| | | | 39,974 |
| |
| Net income attributable to Verizon | | | 3,944 |
| | | | 4,120 |
| |
| Dividends declared ($0.6025, $0.5900 per share) | | | (2,492 | ) | | | | (2,437 | ) | |
| Balance at end of period | | | 47,945 |
| | | | 41,657 |
| |
| | | | | | | | | |
| Accumulated Other Comprehensive Income | | | | | | | | |
| Balance at beginning of period attributable to Verizon | | | 2,216 |
| | | | 3,705 |
| |
| Foreign currency translation adjustments | | | (67 | ) | | | | (176 | ) | |
| Unrealized loss on cash flow hedges | | | (537 | ) | | | | (152 | ) | |
| Unrealized gain on marketable securities | | | 4 |
| | | | 1 |
| |
| Defined benefit pension and postretirement plans | | | (169 | ) | | | | (173 | ) | |
| Other comprehensive loss | | | (769 | ) | | | | (500 | ) | |
| Balance at end of period attributable to Verizon | | | 1,447 |
| | | | 3,205 |
| |
| | | | | | | | | |
| Treasury Stock | | | | | | | | |
| Balance at beginning of period | (155,727 | ) | | (6,825 | ) | | (159,526 | ) | | (6,992 | ) | |
| Employee plans | 58 |
| | 2 |
| | 28 |
| | 2 |
| |
| Shareholder plans | — |
| | — |
| | — |
| | — |
| |
| Balance at end of period | (155,669 | ) | | (6,823 | ) | | (159,498 | ) | | (6,990 | ) | |
| | | | | | | | | |
| Deferred Compensation-ESOPs and Other | | | | | | | | |
| Balance at beginning of period | | | 125 |
| | | | 228 |
| |
| Restricted stock equity grant | | | 44 |
| | | | 38 |
| |
| Amortization | | | (4 | ) | | | | 19 |
| |
| Balance at end of period | | | 165 |
| | | | 285 |
| |
| | | | | | | | | |
| Noncontrolling Interests | | | | | | | | |
| Balance at beginning of period | | | 1,604 |
| | | | 1,564 |
| |
| Total comprehensive income | | | 130 |
| | | | 126 |
| |
| Distributions and other | | | (369 | ) | | | | (139 | ) | |
| Balance at end of period | | | 1,365 |
| | | | 1,551 |
| |
| Total Equity | | | $ | 57,947 |
| | | | $ | 53,575 |
| |
|
| | | | | | | | | | | | | | |
| | | | | | | | | |
| (dollars in millions, except per share amounts, and shares in thousands) |
| Six months ended June 30, | 2019 |
| | | | 2018 |
| | | |
| | Shares |
| | Amount |
| | Shares |
| | Amount |
| |
| Common Stock | | | | | | | | |
| Balance at beginning of year | 4,291,434 |
| | $ | 429 |
| | 4,242,374 |
| | $ | 424 |
| |
| Common shares issued | — |
| | — |
| | 49,060 |
| | 5 |
| |
| Balance at end of period | 4,291,434 |
| | 429 |
| | 4,291,434 |
| | 429 |
| |
| | | | | | | | | |
| Additional Paid In Capital | | | | | | | | |
| Balance at beginning of year | | | 13,437 |
| | | | 11,101 |
| |
| Other | | | (18 | ) | | | | 2,337 |
| |
| Balance at end of period | | | 13,419 |
| | | | 13,438 |
| |
| | | | | | | | | |
| Retained Earnings | | | | | | | | |
| Balance at beginning of year | | | 43,542 |
| | | | 35,635 |
| |
| Opening balance sheet adjustment | | | 410 |
| (1) | | | 2,232 |
| (2) |
| Adjusted opening balance | | | 43,952 |
| | | | 37,867 |
| |
| Net income attributable to Verizon | | | 8,976 |
| | | | 8,665 |
| |
| Dividends declared ($1.205, $1.1800 per share) | | | (4,983 | ) | | | | (4,875 | ) | |
| Balance at end of period | | | 47,945 |
| | | | 41,657 |
| |
| | | | | | | | | |
| Accumulated Other Comprehensive Income | | | | | | | | |
| Balance at beginning of year attributable to Verizon | | | 2,370 |
| | | | 2,659 |
| |
| Opening balance sheet adjustment | | | — |
| | | | 630 |
| (2) |
| Adjusted opening balance | | | 2,370 |
| | | | 3,289 |
| |
| Foreign currency translation adjustments | | | (43 | ) | | | | (83 | ) | |
| Unrealized gain (loss) on cash flow hedges | | | (550 | ) | | | | 349 |
| |
| Unrealized gain (loss) on marketable securities | | | 8 |
| | | | (4 | ) | |
| Defined benefit pension and postretirement plans | | | (338 | ) | | | | (346 | ) | |
| Other comprehensive loss | | | (923 | ) | | | | (84 | ) | |
| Balance at end of period attributable to Verizon | | | 1,447 |
| | | | 3,205 |
| |
| | | | | | | | | |
| Treasury Stock | | | | | | | | |
| Balance at beginning of year | (159,400 | ) | | (6,986 | ) | | (162,898 | ) | | (7,139 | ) | |
| Employee plans | 3,726 |
| | 163 |
| | 3,396 |
| | 149 |
| |
| Shareholder plans | 5 |
| | — |
| | 4 |
| | — |
| |
| Balance at end of period | (155,669 | ) | | (6,823 | ) | | (159,498 | ) | | (6,990 | ) | |
| | | | | | | | | |
| Deferred Compensation-ESOPs and Other | | | | | | | | |
| Balance at beginning of year | | | 353 |
| | | | 416 |
| |
| Restricted stock equity grant | | | 79 |
| | | | 91 |
| |
| Amortization | | | (267 | ) | | | | (222 | ) | |
| Balance at end of period | | | 165 |
| | | | 285 |
| |
| | | | | | | | | |
| Noncontrolling Interests | | | | | | | | |
| Balance at beginning of year | | | 1,565 |
| | | | 1,591 |
| |
| Opening balance sheet adjustment | | | 1 |
| (1) | | | 44 |
| (2) |
| Adjusted opening balance | | | 1,566 |
| | | | 1,635 |
| |
| Total comprehensive income | | | 258 |
| | | | 247 |
| |
| Distributions and other | | | (459 | ) | | | | (331 | ) | |
| Balance at end of period | | | 1,365 |
| | | | 1,551 |
| |
| Total Equity | | | $ | 57,947 |
| | | | $ | 53,575 |
| |
(1) Opening balance sheet adjustments for the six months ended June 30, 2019 are due to the adoption of Topic 842 on January 1, 2019. See Note 1 for additional information.
(2) Opening balance sheet adjustments for the six months ended June 30, 2018 are due to the adoption of multiple ASUs on January 1, 2018. Refer to the consolidated financial statements and notes thereto included in the Company’s Annual Report on Form 10-K for the fiscal year ended December 31, 2018 for additional information.
Common Stock
On March 3, 2017, the Verizon Board of Directors approved a new share buyback program, which authorized the repurchase of up to 100 million shares of Verizon common stock terminating no later than the close of business on February 28, 2020. The program permits Verizon to repurchase shares over time, with the amount and timing of repurchases depending on market conditions and corporate needs.
Verizon did not repurchase any shares of Verizon common stock through its previously authorized share buyback program during the ninesix months ended SeptemberJune 30, 2017.2019. At June 30, 2019, the maximum number of shares that could be purchased by or on behalf of Verizon under our share buyback program was 100 million.
Common stock has been used from time to time to satisfy some of the funding requirements of employee and shareowner plans, including 2.83.7 million common shares issued from Treasury stock during the ninesix months ended SeptemberJune 30, 2017.2019.
In connection with our acquisition of Straight Path Communications, Inc. in February 2018, we issued approximately 49 million shares of Verizon common stock, valued at approximately $2.4 billion.
Accumulated Other Comprehensive Income
The changes in the balances of Accumulated other comprehensive income by component arewere as follows:
|
| | | | | | | | | | | | | | | | | | | |
| (dollars in millions) | Foreign currency translation adjustments |
| | Unrealized gain (loss) on cash flow hedges |
| | Unrealized gain on marketable securities |
| | Defined benefit pension and postretirement plans |
| | Total |
|
| Balance at January 1, 2019 | $ | (600 | ) | | $ | (80 | ) | | $ | 20 |
| | $ | 3,030 |
| | $ | 2,370 |
|
| Other comprehensive income (loss) | (43 | ) | | (607 | ) | | 8 |
| | — |
| | (642 | ) |
| Amounts reclassified to net income | — |
| | 57 |
| | — |
| | (338 | ) | | (281 | ) |
| Net other comprehensive income (loss) | (43 | ) | | (550 | ) | | 8 |
| | (338 | ) | | (923 | ) |
| Balance at June 30, 2019 | $ | (643 | ) | | $ | (630 | ) | | $ | 28 |
| | $ | 2,692 |
| | $ | 1,447 |
|
|
| | | | | | | | | | | | | | | | | | | |
| (dollars in millions) | Foreign currency translation adjustments |
| | Unrealized loss on cash flow hedges |
| | Unrealized loss on marketable securities |
| | Defined benefit pension and postretirement plans |
| | Total |
|
| Balance at January 1, 2017 | $ | (713 | ) | | $ | (80 | ) | | $ | 46 |
| | $ | 3,420 |
| | $ | 2,673 |
|
| Other comprehensive income | 205 |
| | 619 |
| | 14 |
| | 316 |
| | 1,154 |
|
| Amounts reclassified to net income | — |
| | (713 | ) | | (19 | ) | | (412 | ) | | (1,144 | ) |
| Net other comprehensive income (loss) | 205 |
| | (94 | ) | | (5 | ) | | (96 | ) | | 10 |
|
| Balance at September 30, 2017 | $ | (508 | ) | | $ | (174 | ) | | $ | 41 |
| | $ | 3,324 |
| | $ | 2,683 |
|
The amounts presented above in net other comprehensive income (loss) are net of taxes. The amounts reclassified to net income related to unrealized gain on cash flow hedges in the table above are included in Other income (expense), net and Interest expense onin our condensed consolidated statements of income (seeincome. See Note 68 for additional information). The amounts reclassified to net income related to marketable securities in the table above are included in Other income (expense), net on our condensed consolidated statements of income.information. The amounts reclassified to net income related to defined benefit pension and postretirement plans in the table above are included in Cost of services and Selling, general and administrative expense onin our condensed consolidated statements of income (seeincome. See Note 89 for additional information).information.
|
| |
10. | Note 11. Segment Information |
Reportable Segments
We haveAs discussed in Note 1, in November 2018, we announced a strategic reorganization of our business.Under the new structure, effective April 1, 2019, there are two reportable segments Wireless and Wireline, whichthat we operate and manage as strategic business units - Consumer and organize by products and services, and customer groups, respectively.Business. In conjunction with the new reporting structure, we recast our segment disclosures for all periods presented. We measure and evaluate our reportable segments based on segment operating income, consistent with the chief operating decision maker’s assessment of segment performance.
Our segments and their principal activities consist of the following:
|
| | |
| Segment | | Description |
WirelessVerizon Consumer Group | Wireless’ | Our Consumer segment provides consumer-focused wireless and wireline communications services and products. Our wireless services are provided across one of the most extensive wireless networks in the U.S. under the Verizon Wireless brand and through wholesale and other arrangements. Our wireline services are provided in nine states in the Mid-Atlantic and Northeastern U.S., as well as Washington D.C., over our 100% fiber-optic network under the Fios brand and over a traditional copper-based network to customers who are not served by Fios. |
| | |
Verizon
Business Group | | Our Business segment provides wireless and wireline communications services and products, and services include wireless voicevideo and data services, and equipment sales, which are provided to consumer, business and government customers across the U.S. |
Wireline | Wireline’s voice, data and video communications products and enhanced services include broadband video and data, corporate networking solutions, security and managed network services, and local and long distance voice services.services and network access to deliver various IoT services and products. We provide these products and services to consumers in the U.S., as well as to carriers, businesses, and government customers both inand wireless and wireline carriers across the U.S. and select products and services to customers around the world. |
During
Our Consumer segment’s wireless and wireline products and services are available to our retail customers, as well as resellers that purchase wireless network access from us on a wholesale basis. Our Business segment’s wireless and wireline products and services are organized by the first quarter of 2017, Verizon reorganized theprimary customer groups within its Wireline segment. Previously, the customer groups in the Wireline segment consisted of Mass Markets (which included Consumer Retail and Small Business subgroups),targeted by these offerings: Global Enterprise, Small and GlobalMedium Business, Public Sector and Other, and Wholesale. Pursuant to the reorganization, there are now four customer groups within the Wireline segment: Consumer Markets, which includes the customers previously included in Consumer Retail; Enterprise Solutions, which includes the large business customers, including multinational corporations, and federal government customers previously included in Global Enterprise; Partner Solutions, which includes the customers previously included in Global Wholesale; and Business Markets, a new customer group, which includes U.S.-based small business customers previously included in Mass Markets and U.S.-based medium business customers, state and local government customers and educational institutions previously included in Global Enterprise.
Corporate and other includes the results of ourVerizon Media, business, branded Oath, our telematics and other businesses, investments in unconsolidated businesses, unallocated corporate expenses, certain pension and other employee benefit related costs and lease financing.interest and financing expenses. Corporate and other also includes the historical results of divested businesses and other adjustments and gains and losses that are not allocated in assessing segment performance due to their nature. Although such transactions are excluded from the business segment results, they are included in reported consolidated earnings. Gains and losses from these transactions that are not individually significant are included in all segment results as these items are included in the chief operating decision maker’s assessment of segment performance. We completed our acquisition of Yahoo’s operating business on June 13, 2017.
On April 1, 2016, we completed the sale of our local exchange business and related landline activities in California, Florida and Texas, including Fios Internet and video customers, switched and special access lines and high-speed Internet service and long distance voice accounts in these three states to Frontier Communications Corporation (Frontier). The transaction, which included the acquisition by Frontier of the equity interests of Verizon’s incumbent local exchange carriers (ILECs) in California, Florida and Texas, did not involve any assets or liabilities of Verizon Wireless. Additionally, on May 1, 2017, we completed the Data Center Sale (see Note 2 for additional information). The results of operations for these divestitures and other insignificant transactions is included within Corporate and other for all periods presented to reflect comparable segment operating results consistent with the information regularly reviewed by our chief operating decision maker.
In addition, Corporate and other includes the results of our telematics businesses for all periods presented, which were reclassified from our Wireline segment effective April 1, 2016. The impact of this reclassification was insignificant to our condensed consolidated financial statements or our segment results of operations.
The reconciliation of segment operating revenues and expenses to consolidated operating revenues and expenses below includes the effects of special items that managementthe chief operating decision maker does not consider in assessing segment performance, primarily because of their nature.
We have adjusted prior period consolidated and segment information, where applicable, to conform to the current period presentation.
The following table provides operating financial information for our two reportable segments:
|
| | | | | | | | | | | | | | | |
| | Three Months Ended | | | Six Months Ended | |
| | June 30, | | | June 30, | |
| (dollars in millions) | 2019 |
| | 2018 |
| | 2019 |
| | 2018 |
|
| External Operating Revenues | | | | | | | |
| Consumer | | | | | | | |
| Service | $ | 16,350 |
| | $ | 16,050 |
| | $ | 32,611 |
| | $ | 31,864 |
|
| Wireless equipment | 3,904 |
| | 4,251 |
| | 8,070 |
| | 8,521 |
|
| Other | 1,680 |
| | 1,650 |
| | 3,350 |
| | 3,130 |
|
| Total Consumer | 21,934 |
| | 21,951 |
| | 44,031 |
| | 43,515 |
|
| | | | | | | | |
| Business | | | | | | | |
| Global Enterprise | 2,673 |
| | 2,808 |
| | 5,363 |
| | 5,632 |
|
| Small and Medium Business | 2,781 |
| | 2,638 |
| | 5,485 |
| | 5,166 |
|
| Public Sector and Other | 1,492 |
| | 1,437 |
| | 2,963 |
| | 2,866 |
|
| Wholesale | 810 |
| | 956 |
| | 1,650 |
| | 1,941 |
|
| Total Business | 7,756 |
| | 7,839 |
| | 15,461 |
| | 15,605 |
|
| Total reportable segments | $ | 29,690 |
| | $ | 29,790 |
| | $ | 59,492 |
| | $ | 59,120 |
|
| | | | | | | | |
| Intersegment Revenues | | | | | | | |
| Consumer | $ | 61 |
| | $ | 52 |
| | $ | 112 |
| | $ | 115 |
|
| Business | 12 |
| | 12 |
| | 26 |
| | 29 |
|
| Total reportable segments | $ | 73 |
| | $ | 64 |
| | $ | 138 |
| | $ | 144 |
|
| | | | | | | | |
| Total Operating Revenues | | | | | | | |
| Consumer | $ | 21,995 |
| | $ | 22,003 |
| | $ | 44,143 |
| | $ | 43,630 |
|
Business(1) | 7,768 |
| | 7,851 |
| | 15,487 |
| | 15,634 |
|
| Total reportable segments | $ | 29,763 |
| | $ | 29,854 |
| | $ | 59,630 |
| | $ | 59,264 |
|
| | | | | | | | |
| Operating Income | | | | | | | |
| Consumer | $ | 7,336 |
| | $ | 7,060 |
| | $ | 14,586 |
| | $ | 13,995 |
|
| Business | 1,071 |
| | 1,101 |
| | 2,119 |
| | 2,215 |
|
| Total reportable segments | $ | 8,407 |
| | $ | 8,161 |
| | $ | 16,705 |
| | $ | 16,210 |
|
(1) Service and other revenues included in our Business segment amounted to approximately $7.0 billion and $13.9 billion for the three and six months ended June 30, 2019, respectively, and approximately $7.1 billion and $14.0 billion for the three and six months ended June 30, 2018, respectively. Wireless equipment revenues included in our Business segment amounted to approximately $814 million and $1.6 billion for the three and six months ended June 30, 2019, respectively, and approximately $793 million and $1.6 billion for the three and six months ended June 30, 2018, respectively.
The following table provides Fios revenue for our two reportable segments:
|
| | | | | | | | | | | | | | | |
| | Three Months Ended | | | Nine Months Ended | |
| | September 30, | | | September 30, | |
| (dollars in millions) | 2017 |
| | 2016 |
| | 2017 |
| | 2016 |
|
| External Operating Revenues | | | | | | | |
| Wireless | | | | | | | |
| Service | $ | 15,823 |
| | $ | 16,647 |
| | $ | 47,158 |
| | $ | 50,108 |
|
| Equipment | 4,352 |
| | 4,124 |
| | 12,414 |
| | 11,782 |
|
| Other | 1,328 |
| | 1,249 |
| | 3,916 |
| | 3,661 |
|
| Total Wireless | 21,503 |
| | 22,020 |
| | 63,488 |
| | 65,551 |
|
| | | | | | | | |
| Wireline | | | | | | | |
| Consumer Markets | 3,203 |
| | 3,174 |
| | 9,588 |
| | 9,519 |
|
| Enterprise Solutions | 2,262 |
| | 2,273 |
| | 6,881 |
| | 6,887 |
|
| Partner Solutions | 997 |
| | 990 |
| | 2,993 |
| | 3,015 |
|
| Business Markets | 903 |
| | 834 |
| | 2,700 |
| | 2,534 |
|
| Other | 48 |
| | 76 |
| | 183 |
| | 242 |
|
| Total Wireline | 7,413 |
| | 7,347 |
| | 22,345 |
| | 22,197 |
|
| Total reportable segments | $ | 28,916 |
| | $ | 29,367 |
| | $ | 85,833 |
| | $ | 87,748 |
|
| | | | | | | | |
| Intersegment Revenues | | | | | | | |
| Wireless | $ | 77 |
| | $ | 81 |
| | $ | 252 |
| | $ | 258 |
|
| Wireline | 249 |
| | 229 |
| | 718 |
| | 706 |
|
| Total reportable segments | $ | 326 |
| | $ | 310 |
| | $ | 970 |
| | $ | 964 |
|
| | | | | | | | |
| Total Operating Revenues | | | | | | | |
| Wireless | $ | 21,580 |
| | $ | 22,101 |
| | $ | 63,740 |
| | $ | 65,809 |
|
| Wireline | 7,662 |
| | 7,576 |
| | 23,063 |
| | 22,903 |
|
| Total reportable segments | $ | 29,242 |
| | $ | 29,677 |
| | $ | 86,803 |
| | $ | 88,712 |
|
| | | | | | | | |
| Operating Income (Loss) | | | | | | | |
| Wireless | $ | 7,603 |
| | $ | 7,647 |
| | $ | 22,089 |
| | $ | 23,544 |
|
| Wireline | 65 |
| | 73 |
| | 318 |
| | (631 | ) |
| Total reportable segments | $ | 7,668 |
| | $ | 7,720 |
| | $ | 22,407 |
| | $ | 22,913 |
|
|
| | | | | | | | | | | | | | | |
| | Three Months Ended | | | Six Months Ended | |
| | June 30, | | | June 30, | |
| (dollars in millions) | 2019 |
| | 2018 |
| | 2019 |
| | 2018 |
|
| Consumer | $ | 2,772 |
| | $ | 2,738 |
| | $ | 5,536 |
| | $ | 5,472 |
|
| Business | 239 |
| | 218 |
| | 482 |
| | 435 |
|
| Total Fios revenue | $ | 3,011 |
| | $ | 2,956 |
| | $ | 6,018 |
| | $ | 5,907 |
|
The following table provides Wireless service revenue under our current reportable structure and includes intersegment activity:
|
| | | | | | | | | | | | | | | |
| | Three Months Ended | | | Six Months Ended | |
| | June 30, | | | June 30, | |
| (dollars in millions) | 2019 |
| | 2018 |
| | 2019 |
| | 2018 |
|
| Consumer | $ | 13,456 |
| | $ | 13,122 |
| | $ | 26,813 |
| | $ | 26,003 |
|
| Business | 2,775 |
| | 2,615 |
| | 5,469 |
| | 5,116 |
|
| Total Wireless service revenue | $ | 16,231 |
| | $ | 15,737 |
| | $ | 32,282 |
| | $ | 31,119 |
|
|
| | | | | | | |
| | At September 30, |
| | At December 31, |
|
| (dollars in millions) | 2017 |
| | 2016 |
|
| Assets | | | |
| Wireless | $ | 228,238 |
| | $ | 211,345 |
|
| Wireline | 70,049 |
| | 66,679 |
|
| Total reportable segments | 298,287 |
| | 278,024 |
|
| Corporate and other | 224,236 |
| | 213,787 |
|
| Eliminations | (267,841 | ) | | (247,631 | ) |
| Total consolidated - reported | $ | 254,682 |
| | $ | 244,180 |
|
Reconciliation to Consolidated Financial Information
A reconciliation of the reportable segment operating revenues to consolidated operating revenues is as follows:
|
| | | | | | | | | | | | | | | |
| | Three Months Ended | | | Six Months Ended | |
| | June 30, | | | June 30, | |
| (dollars in millions) | 2019 |
| | 2018 |
| | 2019 |
| | 2018 |
|
| Total reportable segment operating revenues | $ | 29,763 |
| | $ | 29,854 |
| | $ | 59,630 |
| | $ | 59,264 |
|
| Corporate and other | 2,412 |
| | 2,429 |
| | 4,747 |
| | 4,891 |
|
| Eliminations | (104 | ) | | (80 | ) | | (178 | ) | | (180 | ) |
| Total consolidated operating revenues | $ | 32,071 |
| | $ | 32,203 |
| | $ | 64,199 |
| | $ | 63,975 |
|
|
| | | | | | | | | | | | | | | |
| | Three Months Ended | | | Nine Months Ended | |
| | September 30, | | | September 30, | |
| (dollars in millions) | 2017 |
| | 2016 |
| | 2017 |
| | 2016 |
|
| Total reportable segment operating revenues | $ | 29,242 |
| | $ | 29,677 |
| | $ | 86,803 |
| | $ | 88,712 |
|
| Corporate and other | 2,796 |
| | 1,403 |
| | 6,034 |
| | 4,078 |
|
| Eliminations | (375 | ) | | (354 | ) | | (1,126 | ) | | (1,060 | ) |
| Operating results from divested businesses | 54 |
| | 211 |
| | 368 |
| | 1,910 |
|
| Total consolidated operating revenues | $ | 31,717 |
| | $ | 30,937 |
| | $ | 92,079 |
| | $ | 93,640 |
|
Fios revenues are included within our Wireline segment and amounted to approximately $2.9 billion and $8.7 billion, respectively, for the three and nine months ended September 30, 2017. Fios revenues amounted to approximately $2.8 billion and $8.3 billion, respectively, for the three and nine months ended September 30, 2016.
A reconciliation of the total of the reportable segments’segment operating income to consolidated income before provision for income taxes is as follows:
| | | | Three Months Ended | | | Nine Months Ended | | Three Months Ended | | | Six Months Ended | |
| | September 30, | | | September 30, | | June 30, | | | June 30, | |
| (dollars in millions) | 2017 |
| | 2016 |
| | 2017 |
| | 2016 |
| 2019 |
| | 2018 |
| | 2019 |
| | 2018 |
|
| Total reportable segment operating income | $ | 7,668 |
| | $ | 7,720 |
| | $ | 22,407 |
| | $ | 22,913 |
| $ | 8,407 |
| | $ | 8,161 |
| | $ | 16,705 |
| | $ | 16,210 |
|
| Corporate and other | (311 | ) | | (466 | ) | | (910 | ) | | (1,432 | ) | (354 | ) | | (426 | ) | | (740 | ) | | (811 | ) |
Severance, pension and benefit charges (Note 8) (1) | — |
| | (797 | ) | | (195 | ) | | (4,512 | ) | |
| Net gain on sale of divested businesses (Note 2) | — |
| | — |
| | 1,774 |
| | 1,007 |
| |
Acquisition and integration related charges (Note 2, Note 8) (1) | (166 | ) | | — |
| | (730 | ) | | — |
| |
| Gain on spectrum license transaction (Note 2) | — |
| | — |
| | 126 |
| | 142 |
| |
| Operating results from divested businesses | 17 |
| | 83 |
| | 149 |
| | 918 |
| |
| Severance charges (Note 9) | | — |
| | (339 | ) | | — |
| | (339 | ) |
| Other components of net periodic benefit charges (Note 9) | | (203 | ) |
| (208 | ) | | (406 | ) | | (416 | ) |
| Acquisition and integration related charges | | — |
| | (120 | ) | | — |
| | (227 | ) |
| Product realignment charges | | — |
| | (451 | ) | | — |
| | (451 | ) |
| Total consolidated operating income | 7,208 |
| | 6,540 |
| | 22,621 |
| | 19,036 |
| 7,850 |
| | 6,617 |
| | 15,559 |
| | 13,966 |
|
| | | | | | | | | | | | | | | |
| Equity in losses of unconsolidated businesses | (22 | ) | | (23 | ) | | (71 | ) | | (63 | ) | (13 | ) | | (228 | ) | | (19 | ) | | (247 | ) |
| Other income (expense), net | (511 | ) | | 97 |
| | (1,376 | ) | | (1,697 | ) | (1,312 | ) | | 360 |
| | (1,017 | ) | | 285 |
|
| Interest expense | (1,164 | ) | | (1,038 | ) | | (3,514 | ) | | (3,239 | ) | (1,215 | ) | | (1,222 | ) | | (2,425 | ) | | (2,423 | ) |
| Income Before Provision For Income Taxes | $ | 5,511 |
| | $ | 5,576 |
| | $ | 17,660 |
| | $ | 14,037 |
| $ | 5,310 |
| | $ | 5,527 |
| | $ | 12,098 |
| | $ | 11,581 |
|
(1) certain amounts have been reclassified to conform to the current period's presentation
No single customer accounted for more than 10% of our total operating revenues during the three and ninesix months ended SeptemberJune 30, 20172019 and 2016.2018.
The chief operating decision maker does not review disaggregated assets on a segment basis; therefore, such information is not presented. Depreciation included in the measure of segment profitability is allocated primarily based on proportional usage.
|
| |
11. | Note 12. Commitments and Contingencies |
In the ordinary course of business, Verizon is involved in various commercial litigation and regulatory proceedings at the state and federal level. Where it is determined, in consultation with counsel based on litigation and settlement risks, that a loss is probable and estimable in a given matter, the Company establishes an accrual. In none of the currently pending matters is the amount of accrual significant.material. An estimate of the reasonably possible loss or range of loss in excess of the amounts already accrued cannot be made at this time due to various factors typical in contested proceedings, includingincluding: (1) uncertain damage theories and demands; (2) a less than complete factual record; (3) uncertainty concerning legal theories and their resolution by courts or regulators; and (4) the unpredictable nature of the opposing party and its demands. We continuously monitor these proceedings as they develop and adjust any accrual or disclosure as needed. We do not expect that the ultimate resolution of any pending regulatory or legal matter in future periods, including the Hicksville matter described below, will have a significantmaterial effect on our financial condition, but it could have a significantmaterial effect on our results of operations for a given reporting period.
Reserves have been established to cover environmental matters relating to discontinued businesses and past telecommunications activities. These reserves include funds to address contamination at the site of a former Sylvania facility in Hicksville, NY, which had processed nuclear fuel rods in the 1950s and 1960s. In September 2005, the Army Corps of Engineers (ACE) accepted the site into its Formerly Utilized Sites Remedial Action Program. As a result, the ACE has taken primary responsibility for addressing the contamination at the site. An adjustment to the reserves may be made after a cost allocation is conducted with respect to the past and future expenses of all of the parties. Adjustments to the environmental reserve may also be made based upon the actual conditions found at other sites requiring remediation.
Verizon is currently involved in approximately 4030 federal district court actions alleging that Verizon is infringing various patents. Most of these cases are brought by non-practicing entities and effectively seek only monetary damages; a small number are brought by companies that have sold products and maycould seek injunctive relief as well. These cases have progressed to various stages and a small number may go to trial in the coming 12 months if they are not otherwise resolved.
In connection with the execution of agreements for the sales of businesses and investments, Verizon ordinarily provides representations and warranties to the purchasers pertaining to a variety of nonfinancial matters, such as ownership of the securities being sold, as well as indemnity
from certain financial losses. From time to time, counterparties may make claims under these provisions, and Verizon will seek to defend against those claims and resolve them in the ordinary course of business.
Subsequent to the sale of Verizon Information Services Canada in 2004, we continue to provide a guarantee to publish directories, which was issued when the directory business was purchased in 2001 and had a 30-year term (before extensions). The preexisting guarantee continues, without modification, despite the subsequent sale of Verizon Information Services Canada and the spin-off of our domestic print and Internet yellow pages directories business. The possible financial impact of the guarantee, which is not expected to be adverse, cannot be reasonably
estimated as a variety of the potential outcomes available under the guarantee result in costs and revenues or benefits that may offset each other. We do not believe performance under the guarantee is likely.
|
|
| Item 2. Management’s Discussion and Analysis of Financial Condition and Results of Operations |
Verizon Communications Inc. (Verizon, or the Company) is a holding company that, acting through its subsidiaries, is one of the world’s leading providers of communications, information and entertainment products and services to consumers, businesses and governmental agencies.government entities. With a presence around the world, we offer voice, data and video services and solutions on our wireless and wireline networks that are designed to meet customers’ demand for mobility, reliable network connectivity, security and control. We have two reportable segments, Wireless and Wireline. Our wireless business, operating as Verizon Wireless, provides voice and data services and equipment sales across the United States (U.S.) using one of the most extensive and reliable wireless networks. Our wireline business provides consumer, business and government customers with communications products and enhanced services, including broadband video and data, corporate networking solutions, security and managed network services and local and long distance voice services, and also owns and operates one of the most expansive end-to-end Global Internet Protocol (IP) networks. We have a highly skilled, diverse and dedicated workforce of approximately 160,100135,900 employees as of SeptemberJune 30, 2017.2019.
To compete effectively in today’s dynamic marketplace, we are focused on transforming around the capabilities of our high-performing networks with a goal of futureto drive growth based on delivering what customers want and need in the new digital world. Our priorities for 2017During 2019, we are to leveragefocused on leveraging our network leadership, retainleadership; retaining and growgrowing our high qualityhigh-quality customer base while balancing profitability, enhanceprofitability; enhancing ecosystems in mediagrowth businesses; and telematics, and drivedriving monetization of our networks and solutions. We are creating business value by earning customers’, employees’ and shareholders’ trust, minimizing our environmental impact, and maximizing customer growth while creating social benefit through our products and services. Our strategy requires significant capital investments primarily to acquire wireless spectrum, put the spectrum into service, provide additional capacity for growth in our networks, invest in the fiber-optic networkfiber that supports our businesses, evolve and maintain our networks and develop and maintain significant advanced information technology systems and data system capabilities. We believe that steady and consistent investments in our networks and platforms will drive innovative products and services and fuel our growth.
We are consistently deploying new network architecture and technologies to extend our leadership in both fourth-generation (4G) and fifth-generation (5G) wireless networks. We expect that our Intelligent Edge Network design will allow us to realize significant efficiencies by utilizing multi-purpose infrastructure utilizing common architecture within the core and providing flexibility to meet customer demands. In addition, protecting the privacy of our customers’ information and the security of our systems and networks will continuecontinues to be a priority at Verizon. Our network leadership will continue to beis the hallmark of our brand and provide the fundamental strength atfoundation for the connectivity, platform and solutions layers upon which we build our competitive advantage.
Strategic TransactionsHighlights of Our Financial Results for the Three Months Ended June 30, 2019 and 2018
Acquisition of Yahoo! Inc.’s Operating Business(dollars in millions)
On July 23, 2016, Verizon entered into a stock purchase agreement (the Purchase Agreement) with Yahoo! Inc. (Yahoo). Pursuant to the Purchase Agreement, upon the terms and subject to the conditions thereof, we agreed to acquire the stock of one or more subsidiaries of Yahoo holding all of Yahoo’s operating business, for approximately $4.83 billion in cash, subject to certain adjustments (the Transaction).
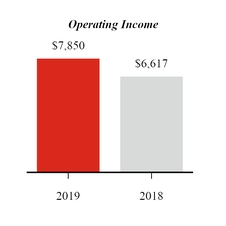
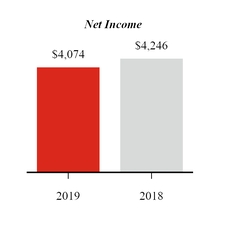
On February 20, 2017, Verizon and Yahoo entered into an amendment to the Purchase Agreement, pursuant to which the Transaction purchase price was reduced by $350 million to approximately $4.48 billion in cash, subject to certain adjustments. Subject to certain exceptions, the parties also agreed that certain user security and data breaches incurred by Yahoo (and the losses arising therefrom) were to be disregarded (1) for purposesHighlights of specified conditions to Verizon’s obligations to close the Transaction and (2) in determining whether a “Business Material Adverse Effect” under the Purchase Agreement has occurred.
Concurrently with the amendment of the Purchase Agreement, Yahoo and Yahoo Holdings, Inc., a wholly-owned subsidiary of Yahoo that Verizon agreed to purchase pursuant to the Transaction, also entered into an amendment to the related reorganization agreement, pursuant to which Yahoo (which changed its name to Altaba Inc. following the closing of the Transaction) retains 50% of certain post-closing liabilities arising out of governmental or third-party investigations, litigations or other claims related to certain user security and data breaches incurred by Yahoo prior to its acquisition by Verizon, including an August 2013 data breach disclosed by Yahoo on December 14, 2016. At that time, Yahoo disclosed that more than one billion of the approximately three billion accounts existing in 2013 had likely been affected. In accordance with the original Transaction agreements, Yahoo will continue to retain 100% of any liabilities arising out of any shareholder lawsuits (including derivative claims) and investigations and actions by the Securities and Exchange Commission (SEC).
On June 13, 2017, we completed the Transaction. The aggregate purchase consideration at the closing of the Transaction was approximately $4.8 billion.
On October 3, 2017, based upon new intelligence that we received in connection with our integration of Yahoo's operating business, we disclosed that we believe that the August 2013 data breach previously disclosed by Yahoo affected all of its accounts.
Network Evolution
We are reinventing our network architecture around a common fiber platform that will support both our wireless and wireline technologies. Our multi-use fiber build is critical to expand the future capabilities of both our wireless and wireline networks, while reducing the cost to deliver services to our customers. We expect that this new “One Fiber” architecture will improve our 4G Long-Term Evolution (LTE) coverage, speed the deployment of 5G technology, deliver high-speed Fios broadband to homes and businesses and create new opportunities in the small and medium business market. We expect to have further opportunities for expansion with our acquisition of XO Holdings’ wireline business (XO), which at the time of acquisition, was one of the largest fiber-based IP and Ethernet networks. We completed this acquisition on February 1, 2017 for total cash consideration of approximately $1.8 billion, of which $0.1 billion was paid in 2015.
In April 2017, we exercised our option to buy a wholly-owned subsidiary of XO Holdings that holds its wireless spectrum for approximately $0.2 billion, subject to certain adjustments. The transaction is subject to customary regulatory approvals and is expected to close by the end of 2017. Upon closing, the spectrum acquired as part of the transaction will be used for our 5G technology deployment.
On May 11, 2017, we entered into a purchase agreement to acquire Straight Path Communications Inc. (Straight Path), a holder of millimeter wave spectrum configured for 5G wireless services, for consideration reflecting an enterprise value of approximately $3.1 billion. Under the terms of the purchase agreement, we agreed to pay (i) Straight Path shareholders $184.00 per share, payable in Verizon shares, and (ii) certain transaction costs payable in cash of approximately $0.7 billion, consisting primarily of a fee to be paid to the Federal Communications Commission (FCC). The acquisition is subject to customary regulatory approvals and closing conditions, and is expected to close by the end of the first quarter of 2018.
On August 1, 2017, we entered into a definitive agreement to purchase certain fiber-optic network assets in the Chicago market from WideOpenWest, Inc. (WOW!), a leading provider of communications services. The transaction is expected to close by the end of 2017. In addition, the parties entered into a separate agreement pursuant to which WOW! will complete the build-out of the network assets by the second half of 2018. The total cash considerationFinancial Results for the transactions is expected to be approximately $0.3 billion.Six Months Ended June 30, 2019 and 2018
(dollars in millions)
Data Center Sale
On December 6, 2016, we entered into a definitive agreement, which was subsequently amended on March 21, 2017, with Equinix, Inc. (Equinix) pursuant to which we agreed to sell 23 customer-facing data center sites in the U.S. and Latin America, for approximately $3.6 billion, subject to certain adjustments (Data Center Sale). The transaction closed on May 1, 2017 (see Note 2 to the condensed consolidated financial statements for additional information).
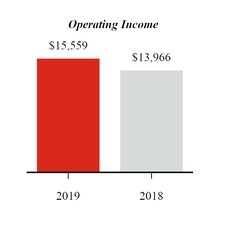
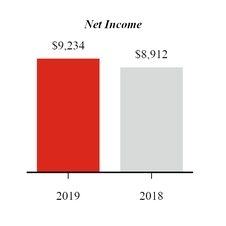
Business Overview
In the sections that follow,November 2018, we provide information about the important aspectsannounced a strategic reorganization of our operations and investments, both atbusiness. Under the consolidated and segment levels, and discuss our results of operations, financial position and sources and uses of cash. We havenew structure, effective April 1, 2019, there are two reportable segments Wireless and Wireline, whichthat we operate and manage as strategic business units - Verizon Consumer Group (Consumer) and organizeVerizon Business Group (Business). In conjunction with the new reporting structure, we recast our segment disclosures for all periods presented.
Revenue by productsSegment for the Three Months Ended June 30, 2019 and 2018
———
Note: Excludes eliminations.
Revenue by Segment for the Six Months Ended June 30, 2019 and 2018
———
Note: Excludes eliminations.
Verizon Consumer Group
Our Consumer segment provides consumer-focused wireless and wireline communications services and customer groups, respectively.
Wireless
products. Our Wireless segment, doing business as Verizon Wireless, provides wireless communications products and services are provided across one of the most extensive wireless networks in the U.S. We provide theseUnited States (U.S.) under the Verizon Wireless brand and through wholesale and other arrangements. Our wireline services and equipment sales to consumer, business and government customersare provided in nine states in the Mid-Atlantic and Northeastern U.S., as well as Washington D.C., over our 100% fiber-optic network under the Fios brand and over a traditional copper-based network to customers who are not served by Fios. Our Consumer segment's wireless and wireline products and services are available to our retail customers, as well as resellers that purchase wireless network access from us on a wholesale basis.
Customers can obtain our wireless services on a postpaid andor prepaid basis. Postpaid connections representA retail postpaid connection represents an individual linesline of service for a wireless device for which a customer is generally billed one month in advance for a monthly access charge in return for a monthly network service allowance,access to and usage beyond the allowance is billed monthly in arrears.of network services. Our prepaid service is offered only to Consumer customers and enables individuals to obtain wireless services without credit verification by paying for all services in advance.
We offer various postpaid account service plans, The Consumer segment also offers several categories of wireless equipment to customers, including shared data plans, single connection plansa variety of smartphone and other plans tailoredhandsets, wireless-enabled Internet devices, such as tablets, laptop computers and netbooks, and other wireless-enabled connected devices, such as smart watches and other wearables.
In addition to the needs of our customers. Our shared data plans typically feature domestic unlimited voice minutes, unlimited domesticwireless services and international text,equipment discussed above, Consumer sells residential fixed connectivity solutions, including Internet, video and picture messaging,voice services, and a single data allowance that can be shared among the wireless devicesnetwork access to resellers on a customer’s account. These allowances will vary from time to time as partwholesale basis. The Consumer segment's operating revenues for the three and six months ended June 30, 2019 totaled $22.0 billion and $44.1 billion, respectively, representing a relatively flat change and an increase of promotional offers or in response to market circumstances. Our unlimited plans, available to our consumer and small business customers, offer among other things, unlimited domestic voice, data and texting. Both our shared data plans and unlimited plans include our High Definition Voice and Video Calling, while certain plans also include Mobile Hotspot services, on compatible devices.
Under the Verizon device payment program, our eligible wireless customers purchase wireless devices under a device payment plan agreement. Customers that activate service on devices purchased under the device payment program, or on a compatible device that they already own, pay lower service fees (unsubsidized service pricing) as1.2%, respectively, compared to those under fixed-term service plans.the similar periods in 2018. As of January 2017, we no longer offer consumers fixed-term service plans for phones.June 30, 2019, Consumer had approximately 94 million wireless retail connections, 6 million broadband connections and 4 million Fios video connections.
We are focusing our wireless capital spending on adding capacity and density to our 4G LTE network. Approximately 98% of our total data traffic in September 2017 was carried on our 4G LTE network. We are investing in the densification of our network by utilizing small cell technology, in-building solutions and distributed antenna systems. Densification enables us to add capacity to manage mobile video consumption and demand for Internet of Things (IoT), as well as position us for future 5G technology. We are committed to developing and deploying 5G wireless technology. We are working with key partners to ensure the aggressive pace of innovation, standards development and appropriate requirements for this next generation of wireless technology. Based on the outcome of our ongoing pre-commercial trials, we intend to be the first company to deploy a 5G fixed wireless broadband network in the U.S. We expect to launch a fixed commercial wireless service supported by this network in 2018, depending on the results of pre-commercial trials, which are ongoing.
WirelineVerizon Business Group
Our WirelineBusiness segment provides voice, datawireless and videowireline communications productsservices and enhanced services, including broadbandproducts, video and data services, corporate networking solutions, security and managed network services, and local and long distance voice services.services and network access to deliver various Internet of Things (IoT) services and products, including Verizon Connect’s solutions which support fleet tracking management, compliance management, field service management, asset tracking and other types of mobile resource management. We provide these products and services to consumers in the U.S., as well as to carriers, businesses, and government customers both inand wireless and wireline carriers across the U.S. and select products and services to customers around the world.
In our Wireline business, to compensate The Business segment's operating revenues for the shrinking market for traditional voice service, we continuethree and six months ended June 30, 2019 totaled $7.8 billion and $15.5 billion, respectively, representing a decrease of 1.1% and 0.9%, respectively, compared to build our Wireline segment around data, videothe similar periods in 2018. As of June 30, 2019, Business had approximately 24 million wireless retail postpaid connections and advanced business services – areas where demand for reliable high-speed connections is growing. We expect our One Fiber initiative will aid in the densification of our 4G LTE wireless network and position us for future 5G technology. The expansion of our multi-useapproximately 500 thousand broadband connections.
fiber footprint also creates opportunities to generate revenue from fiber-based services in our Wireline business. We continue to seek ways to increase revenue and further realize operating and capital efficiencies as well as maximize profitability for our Fios services.
Corporate and Other
Corporate and other includes the results of our media business, Verizon Media business, branded Oath, telematicsGroup (Verizon Media), which operated under the "Oath" brand until January 2019, and other businesses, investments in unconsolidated businesses, unallocated corporate expenses, certain pension and other employee benefit related costs and lease financing.interest and financing expenses. Corporate and other also includes the historical results of divested businesses and other adjustments and gains and losses that are not allocated in assessing segment performance due to their nature. Although such transactions are excluded from the business segment results, they are included in reported consolidated earnings. Gains and losses from these transactions that are not individually significant are included in all segment results as these items are included in the chief operating decision maker’s assessment of segment performance.
Oath, our newly branded organization that combines Yahoo’s operating business with our existingVerizon Media business, is aincludes diverse house of more than 50 media and technology brands that engages approximately aserve both consumers and businesses. Verizon Media provides consumers with owned and operated search properties and finance, news, sports and entertainment offerings and provides other businesses and partners access to consumers through digital advertising platforms. Verizon Media's total operating revenues were $1.8 billion people around the world. We believe that the Transaction represents a critical step in growing the global scale neededand $3.6 billion, respectively for our digital media company and building the future of brands using powerful technology, trusted content and differentiated data. For the three months ended September 30, 2017, Oath generated revenues of approximately $2.0 billion. See Note 2 to the condensed consolidated financial statements for additional information.
On April 1, 2016, we completed the sale (Access Line Sale) of our local exchange business and related landline activities in California, Florida and Texas, including Fios Internet and video customers, switched and special access lines and high-speed Internet service (HSI) and long distance voice accounts in these three states to Frontier Communications Corporation (Frontier). The transaction, which includes the acquisition by Frontier of the equity interests of Verizon’s incumbent local exchange carriers (ILECs) in California, Florida and Texas, did not involve any assets or liabilities of Verizon Wireless. On May 1, 2017, we completed the sale of 23 customer-facing data center sites in the United States and Latin America (see Note 2 to the condensed consolidated financial statements for additional information). The results of operations for these divestitures and other insignificant transactions are included within Corporate and other for all periods presented to reflect comparable segment operating results consistent with the information regularly reviewed by our chief operating decision maker. See “Operating Results From Divested Businesses” and Note 10 to the condensed consolidated financial statements for additional information.
In addition, Corporate and other includes the results of our telematics businesses for all periods presented, which were reclassified from our Wireline segment effective April 1, 2016. The impact of this reclassification was insignificant to our condensed consolidated financial statements or our segment results of operations.
We are also building our growth capabilities in the emerging IoT market by developing business models to monetize usage on our network at the connectivity and platform layers. For the three and ninesix months ended SeptemberJune 30, 2017, we recognized IoT revenues,2019, which represent revenues on IoT productrepresents a decrease of 2.9% and connectivity service revenues, of $0.4 billion and $1.1 billion, a 55% and 69% increase,5.1%, respectively, compared to the prior year period. This increase was primarily attributable to our acquisitions of Fleetmatics Group PLC and Telogis, Inc.similar periods in the second half of 2016, which enable us to provide a comprehensive suite of services and solutions in the Telematics market.2018.
Capital Expenditures and Investments
We continue to invest in our wireless network,networks, high-speed fiber and other advanced technologies to position ourselves at the center of growth trends for the future. During the ninesix months ended SeptemberJune 30, 2017,2019, these investments included $11.3$8.0 billion for capital expenditures. See “Cash"Cash Flows Used in Investing Activities” and “Operating Environment and Trends”Activities" for additional information. We believe that our investments aimed at expanding our portfolio of products and services will provide our customers with an efficient, reliable infrastructure for competing in the information economy.
Global Network and Technology
We are focusing our capital spending on adding capacity and density to our 4G Long-Term Evolution (LTE) network, while positioning for 5G. We are densifying our 4G LTE network by utilizing small cell technology, in-building solutions and distributed antenna systems. Network densification not only enables us to add capacity to address increasing mobile video consumption and the growing demand for IoT products and services, but it also positions us for the deployment of 5G technology. Over the past several years, we have been leading the development of 5G wireless technology industry standards and the ecosystems for fixed and mobile 5G wireless services. We believe 5G technology can provide users with eight capabilities, or currencies. The eight currencies are peak data rates, mobile data volumes, mobility, number of connected devices, energy efficiency, service deployment, reduced latency and improved reliability. We expect that 5G technology will provide higher throughput and lower latency than the current 4G LTE technology and enable our networks to handle more traffic as the number of Internet-connected devices grows. During 2018, we commercially launched 5G Home initially on proprietary standards in four U.S. markets: Sacramento, Los Angeles, Houston and Indianapolis. We will shift to the global standards as soon as the compatible devices and equipment become available. In February 2019, we announced that we expect to expand 5G Home coverage to more markets in the second half of 2019. In 2019, we launched our 5G Ultra Wideband Network in Chicago, Minneapolis, Denver, Providence, St. Paul, Washington DC, Atlanta, Detroit and Indianapolis, with a target of the network becoming commercially available in 30 plus markets by year-end. In addition, we launched the first 5G-compatible smartphone in April 2019.
To compensate for the shrinking market for traditional copper-based products, we continue to build our wireline business around fiber-based networks supporting data, video and advanced business services - areas where demand for reliable high-speed connections is growing. We are evolving the architecture of our networks to a next-generation multi-use platform, providing improved efficiency and virtualization, increased automation and opportunities for edge computing services that will support both our fiber-based and radio access network technologies. We call this the Intelligent Edge Network. We expect that this new architecture will simplify operations by eliminating legacy network elements, improve our 4G LTE wireless coverage, speed the deployment of 5G wireless technology, and create new opportunities in the business market.
Operating Environment and Trends
There have been no significant changes to the information related to trends affecting our business that was previously disclosed in “Management’sthe "Management’s Discussion and Analysis of Financial Condition and Results of Operations”Operations" included in our Annual Report on Form 10-K for the year ended December 31, 2016.2018, except either as a result of our segment realignment or as discussed below.
We adopted Accounting Standard Update (ASU) 2016-02, ASU 2018-01, ASU 2018-10, ASU 2018-11, ASU 2018-20 and ASU 2019-01, Leases (Topic 842) on January 1, 2019, using the modified retrospective application. This method does not impact the prior periods, which continue to reflect the accounting treatment prior to the adoption of Topic 842. As a result, for items that were affected by our adoption of Topic 842, financial results of periods prior to January 1, 2019 are not comparable to the current period financial results. See Notes 1 and 5 to the condensed consolidated financial statements for additional information.
Recent Developments
In September 2018, we announced a Voluntary Separation Program for select U.S.-based management employees. Approximately 10,400 eligible employees separated from the Company under this program as of the end of June 2019. The severance benefits payments to these employees are expected to be substantially completed by the end of September 2019.
In 2019, the Federal Communications Commission (FCC) completed 2 millimeter wave spectrum license auctions. Verizon participated in these auctions and was the high bidder on 9 and 1,066 licenses, respectively, in the 24 Gigahertz (GHz) and 28 GHz bands. We submitted an application to the FCC and paid cash of approximately $521 million for the licenses that will be issued.
On July 23, 2019, Verizon completed a sale-leaseback transaction for buildings and real estate. We received total gross proceeds of $1.0 billion. We lease backed a portion of the buildings and real estate sold and accounted for it as an operating lease. The term of the leaseback is for two years with 4 options to renew for an additional three months each.
Critical Accounting Estimates
Upon the date of reorganization on April 1, 2019, the goodwill of our historical Wireless reporting unit, historical Wireline reporting unit and historical Verizon Connect reporting unit were reallocated to our new Consumer and Business reporting units. At June 30, 2019, the balance of our goodwill was approximately $24.6 billion, of which $17.1 billion was in our Consumer reporting unit, $7.3 billion was in our Business reporting unit, and $262 million was in Other, which includes our Media reporting unit and other corporate entities. To determine if goodwill is potentially impaired, we have the option to perform a qualitative assessment to determine whether it is more likely than not that the fair value of a reporting unit is less than its carrying value. If we elect not to conduct the qualitative assessment or if indicators of a potential impairment exist, the determination of whether an impairment has occurred requires the determination of the fair value of the reporting unit being assessed.
We performed a quantitative assessment of our current reporting units, Consumer and Business, subsequent to the strategic reorganization. Our impairment assessments indicated that the fair value for each of our Consumer and Business reporting units significantly exceeded their respective carrying values and therefore, did not result in a goodwill impairment. Our Media reporting unit was not impacted by the strategic reorganization and there were no indicators of impairment during the second quarter of 2019.
Under our quantitative assessment, the fair value of the reporting unit is calculated using a market approach and a discounted cash flow method. The market approach includes the use of comparative multiples to corroborate discounted cash flow results. The discounted cash flow method is based on the present value of two components-projected cash flows and a terminal value. The terminal value represents the expected normalized future cash flows of the reporting unit beyond the cash flows from the discrete projection period. The fair value of the reporting unit is calculated based on the sum of the present value of the cash flows from the discrete period and the present value of the terminal value. The discount rate represented our estimate of the weighted-average cost of capital, or expected return, that a marketplace participant would have required as of the valuation date. The application of our goodwill impairment test required key assumptions underlying our valuation model. The discounted cash flow analysis factored in assumptions on discount rates and terminal growth rates to reflect risk profiles of key strategic revenue and cost initiatives, as well as revenue and earnings before interest, taxes, depreciation and amortization expenses (EBITDA) growth relative to history and market trends and expectations. The market multiples approach incorporated significant judgment involved in the selection comparable public company multiples and benchmarks. The selection of companies was influenced by differences in growth and profitability, and volatility in market prices of peer companies. These valuation inputs are inherently uncertain, and a significant adverse change in one or a combination of these inputs could trigger a goodwill impairment loss in the future.
|
|
| Consolidated Results of Operations |
In this section, we discuss our overall results of operations and highlight special items that are not included in our segment results. In “Segment"Segment Results of Operations,”" we review the performance of our two reportable segments in more detail.
| | | | Three Months Ended | | | | | | | Nine Months Ended | | | | | | Three Months Ended | | | | | | | Six Months Ended | | | | | |
| | September 30, | | | Increase/ | | September 30, | | | Increase/ | June 30, | | | Increase/ | | June 30, | | | Increase/ |
| (dollars in millions) | 2017 |
| | 2016 |
| | (Decrease) | | 2017 |
| | 2016 |
| | (Decrease) | 2019 |
| | 2018 |
| | (Decrease) | | 2019 |
| | 2018 |
| | (Decrease) |
| Wireless | $ | 21,580 |
| | $ | 22,101 |
| | $ | (521 | ) | | (2.4 | )% | | $ | 63,740 |
| | $ | 65,809 |
| | $ | (2,069 | ) | | (3.1 | )% | |
| Wireline | 7,662 |
| | 7,576 |
| | 86 |
| | 1.1 |
| | 23,063 |
| | 22,903 |
| | 160 |
| | 0.7 |
| |
| Consumer | | $ | 21,995 |
| | $ | 22,003 |
| | $ | (8 | ) | | — | % | | $ | 44,143 |
| | $ | 43,630 |
| | $ | 513 |
| | 1.2 | % |
| Business | | 7,768 |
| | 7,851 |
| | (83 | ) | | (1.1 | ) | | 15,487 |
| | 15,634 |
| | (147 | ) | | (0.9 | ) |
| Corporate and other | 2,850 |
| | 1,614 |
| | 1,236 |
| | 76.6 |
| | 6,402 |
| | 5,988 |
| | 414 |
| | 6.9 |
| 2,412 |
| | 2,429 |
| | (17 | ) | | (0.7 | ) | | 4,747 |
| | 4,891 |
| | (144 | ) | | (2.9 | ) |
| Eliminations | (375 | ) | | (354 | ) | | (21 | ) | | 5.9 |
| | (1,126 | ) | | (1,060 | ) | | (66 | ) | | 6.2 |
| (104 | ) | | (80 | ) | | (24 | ) | | 30.0 |
| | (178 | ) | | (180 | ) | | 2 |
| | (1.1 | ) |
| Consolidated Revenues | $ | 31,717 |
| | $ | 30,937 |
| | $ | 780 |
| | 2.5 |
| | $ | 92,079 |
| | $ | 93,640 |
| | $ | (1,561 | ) | | (1.7 | ) | $ | 32,071 |
| | $ | 32,203 |
| | $ | (132 | ) | | (0.4 | ) | | $ | 64,199 |
| | $ | 63,975 |
| | $ | 224 |
| | 0.4 |
|
DuringConsolidated revenues decreased $132 million, or 0.4%, and increased $224 million, or 0.4%, during the three and six months ended June 30, 2019, respectively, compared to the similar periods in 2018. The decrease in revenues during the three months ended SeptemberJune 30, 2017, consolidated2019 was due to decreases in revenues increased $0.8 billion, or 2.5%, compared toat our Business segment and Corporate and other. The increase in revenues during the similar period in 2016,six months ended June 30, 2019 was due to an increase in revenues within Corporate and other,at our Consumer segment, partially offset by a declinedecreases in revenues at our Wireless segment. During the nine months ended September 30, 2017, consolidated revenues decreased $1.6 billion, or 1.7%, compared to the similar period in 2016, due to a decline in revenues at our WirelessBusiness segment partially offset by an increase in revenues withinand Corporate and other.
Revenues for our segments are discussed separately below under the heading “Segment"Segment Results of Operations.”"
Corporate and other revenues increased $1.2 billion,decreased 0.7%, and $144 million, or 76.6%2.9%, during the three and six months ended SeptemberJune 30, 2017,2019, respectively, compared to the similar periodperiods in 2016,2018. The decrease in revenues during the three and six months ended June 30, 2019 was primarily due to an increasea decrease of $55 million and $193 million, respectively, in revenue as a result of the acquisition of Yahoo’s operating business in the second quarter of 2017 as well as fleet service revenue growth in our telematics business, partially offset by the Data Center Sale on May 1, 2017 and other insignificant transactions (see “Operating Results From Divested Businesses”).revenues within Verizon Media.
Corporate and other revenues increased $0.4 billion, or 6.9%, during the nine months ended September 30, 2017, compared to the similar period in 2016, primarily due to an increase in revenue as a result of the acquisition of Yahoo’s operating business on June 13, 2017 and fleet service revenue growth in our telematics business. These increases were partially offset by the Access Line Sale on April 1, 2016 and the Data Center Sale on May 1, 2017 and other insignificant transactions (see “Operating Results From Divested Businesses”). During the nine months ended September 30, 2017, our Media business represented approximately 62% of revenues in Corporate and other.
|
|
| Consolidated Operating Expenses |
| | | | Three Months Ended | | | | | | | Nine Months Ended | | | | | | Three Months Ended | | | | | | | Six Months Ended | | | | | |
| | September 30, | | | Increase/ | | September 30, | | | Increase/ | June 30, | | | Increase/ | | June 30, | | | Increase/ |
| (dollars in millions) | 2017 |
| | 2016 |
| | (Decrease) | | 2017 |
| | 2016 |
| | (Decrease) | 2019 |
| | 2018 |
| | (Decrease) | | 2019 |
| | 2018 |
| | (Decrease) |
| Cost of services | $ | 7,640 |
| | $ | 6,989 |
| | $ | 651 |
| | 9.3 | % | | $ | 21,573 |
| | $ | 22,180 |
| | $ | (607 | ) | | (2.7 | )% | $ | 7,702 |
| | $ | 8,234 |
| | $ | (532 | ) | | (6.5 | )% | | $ | 15,494 |
| | $ | 16,180 |
| | $ | (686 | ) | | (4.2 | )% |
| Wireless cost of equipment | 4,965 |
| | 5,240 |
| | (275 | ) | | (5.2 | ) | | 14,808 |
| | 14,882 |
| | (74 | ) | | (0.5 | ) | |
| Cost of wireless equipment | | 5,019 |
| | 5,397 |
| | (378 | ) | | (7.0 | ) | | 10,217 |
| | 10,706 |
| | (489 | ) | | (4.6 | ) |
| Selling, general and administrative expense | 7,632 |
| | 8,226 |
| | (594 | ) | | (7.2 | ) | | 20,579 |
| | 25,601 |
| | (5,022 | ) | | (19.6 | ) | 7,268 |
| | 7,605 |
| | (337 | ) | | (4.4 | ) | | 14,466 |
| | 14,449 |
| | 17 |
| | 0.1 |
|
| Depreciation and amortization expense | 4,272 |
| | 3,942 |
| | 330 |
| | 8.4 |
| | 12,498 |
| | 11,941 |
| | 557 |
| | 4.7 |
| 4,232 |
| | 4,350 |
| | (118 | ) | | (2.7 | ) | | 8,463 |
| | 8,674 |
| | (211 | ) | | (2.4 | ) |
| Consolidated Operating Expenses | $ | 24,509 |
| | $ | 24,397 |
| | $ | 112 |
| | 0.5 |
| | $ | 69,458 |
| | $ | 74,604 |
| | $ | (5,146 | ) | | (6.9 | ) | $ | 24,221 |
| | $ | 25,586 |
| | $ | (1,365 | ) | | (5.3 | ) | | $ | 48,640 |
| | $ | 50,009 |
| | $ | (1,369 | ) | | (2.7 | ) |
Cost of Services
Cost of services increased $0.7 billion, or 9.3%, duringincludes the three months ended September 30, 2017, comparedfollowing costs directly attributable to the similar period in 2016, primarily due to the acquisition of Yahoo’s operating business as well as an increase ina service: salaries and wages, benefits, materials and supplies, content costs, contracted services, network access and accesstransport costs, atcustomer provisioning costs, computer systems support, and costs to support our Wireline segment.outsourcing contracts and technical facilities. Aggregate customer care costs, which include billing and service provisioning, are allocated between Cost of services and Selling, general and administrative expense.
Cost of services decreased $0.6 billion,$532 million, or 2.7%6.5%, and $686 million, or 4.2%, during the ninethree and six months ended SeptemberJune 30, 2017,2019, respectively, compared to the similar periodperiods in 2016,2018, primarily due to the completion of the Access Line Sale on April 1, 2016 and the Data Center Sale on May 1, 2017 and other insignificant transactions (see “Operating Results From Divested Businesses”), the fact that we did not incur incrementala decrease in employee related costs due to lower headcount, a decrease in 2017 as a result of the union work stoppage that commenced on April 13, 2016 and ended on June 1, 2016 (2016 Work Stoppage),network access costs due to reduction in voice connections and a declineproduct realignment charge in net pension and postretirement benefit costs primarily driven by collective bargaining agreements ratified in June 2016 at our Wireline segment. These2018 (see "Special Items"). The decreases were partially offset by an increase in expensesrent expense as a result of adding capacity to the acquisition of Yahoo's operating business.networks to support increased demand.
Wireless Cost of Wireless Equipment
Cost of wireless equipment decreased $0.3 billion,$378 million, or 5.2%7.0%, and $0.1 billion,$489 million, or 0.5%4.6%, respectively, during the three and ninesix months ended SeptemberJune 30, 2017,2019, respectively, compared to the similar periods in 2016,2018, primarily as a result of a declinedeclines in the number of smartphone and internet unitswireless devices sold as a result of an elongation of the handset upgrade cycle, partially offset by a shiftshifts to higher priced unitsdevices in the mix of devices sold.
Selling, General and Administrative Expense
Selling, general and administrative expense decreased $0.6 billion, or 7.2%, during the three months ended September 30, 2017, compared to the similar period in 2016, primarily dueincludes: salaries and wages and benefits not directly attributable to a decrease in severance, pensionservice or product, bad debt charges, taxes other than income taxes, advertising and benefit charges (see “Special Items”), and a decline in sales commission expense, employee related costs, bad debt expensecall center and advertising expense at our Wireless segment. These decreases were partially
offset by an increase in expenses asinformation technology costs, regulatory fees, professional service fees, and rent and utilities for administrative space. Also included is a resultportion of the acquisitionaggregate customer care costs as discussed above in "Cost of Yahoo's operating business in the second quarter of 2017 as well as acquisition and integration related charges primarily in connection with the acquisition of Yahoo's operating business (see “Special Items”)Services".
Selling, general and administrative expense decreased $5.0 billion,$337 million, or 19.6%4.4%, and increased 0.1%, during the ninethree and six months ended SeptemberJune 30, 2017,2019, respectively, compared to the similar periodperiods in 2016,2018. The decrease during the three months ended June 30, 2019 was primarily due to a decrease in severance, pension and benefit charges, an increase in the net gain on sale of divested businesses (see “Special Items”), a decline in sales commission expense, employee related costs bad debt expense and advertising at our Wireless segment,the acquisition and a decrease dueintegration related charges in 2018 primarily related to the Access Line Sale on April 1, 2016 and the Data Center Sale on May 1, 2017 and other insignificant transactionsacquisition of Yahoo! Inc.'s (Yahoo) operating business (see “Operating Results From Divested Businesses”"Special items"). These decreases were partially offset by an increase in advertising expenses, sales commission expense and bad debt expense. The increase in sales commission expense is due to a lower net deferral of commission costs in the current year as compared to the prior year, as a result of the acquisitionadoption of Yahoo's operating businessASU 2014-09, "Revenue from Contracts with Customers" (Topic 606) on January 1, 2018 using a modified retrospective approach. The increase during the six months ended June 13, 2017,30, 2019 was primarily due to increases in advertising expenses, sales commission and bad debt expense. These increases were partially offset by decreases in employee related costs primarily due to the Voluntary Separation Program and the acquisition and integration related charges in 2018 primarily in connection withrelated to the acquisition of Yahoo’sYahoo operating business (see “Special Items”"Special Items").
Depreciation and Amortization Expense
Depreciation and amortization expense decreased $118 million, or 2.7%, and $211 million, or 2.4%, during the impact of costs relatedthree and six months ended June 30, 2019 compared to the natural disasterssimilar periods in Florida and Texas.2018. This decrease was primarily driven by the change in the mix of net depreciable assets.
Special Charges (Credits)
Special charges (credits) included in operating expenses were as follows:
|
| | | | | | | | | | | | | | | |
| | Three Months Ended | | | Nine Months Ended | |
| | September 30, | | | September 30, | |
| (dollars in millions) | 2017 |
| | 2016 |
| | 2017 |
| | 2016 |
|
| Net gain on sale of divested businesses | $ | — |
| | $ | — |
| | $ | (1,774 | ) | | $ | (1,007 | ) |
| Acquisition and integration related charges | 166 |
| | — |
| | 730 |
| | — |
|
| Severance, pension and benefit charges | — |
| | 797 |
| | 195 |
| | 4,512 |
|
| Gain on spectrum license transaction | — |
| | — |
| | (126 | ) | | (142 | ) |
See “Special Items” for a description of these special items.
Operating Results From Divested Businesses
On April 1, 2016, we completed the Access Line Sale. On May 1, 2017, we completed the Data Center Sale. The results of operations related to these divestitures and other insignificant transactions are included within Corporate and other for all periods presented to reflect comparable segment operating results consistent with the information regularly reviewed by our chief operating decision maker. The results of operations related to these divestitures included within Corporate and other are as follows:
|
| | | | | | | | | | | | | | | |
| | Three Months Ended | | | Nine Months Ended | |
| | September 30, | | | September 30, | |
| (dollars in millions) | 2017 |
| | 2016 |
| | 2017 |
| | 2016 |
|
| Operating Results From Divested Businesses | | | | | | | |
| Operating revenues | $ | 54 |
| | $ | 211 |
| | $ | 368 |
| | $ | 1,910 |
|
| Cost of services | 24 |
| | 71 |
| | 129 |
| | 677 |
|
| Selling, general and administrative expense | 13 |
| | 25 |
| | 68 |
| | 218 |
|
| Depreciation and amortization expense | — |
| | 32 |
| | 22 |
| | 97 |
|
|
|
| Other Consolidated Results |
Other Income (Expense), Net
Additional information relating to Other income (expense), net is as follows:
| | | | Three Months Ended | | | | | | | Nine Months Ended | | | | | | Three Months Ended | | | | | | | Six Months Ended | | | | | |
| | September 30, | | | Increase/ | | September 30, | | | Increase/ | June 30, | | | Increase/ | | June 30, | | | Increase/ |
| (dollars in millions) | 2017 |
| | 2016 |
| | (Decrease) | | 2017 |
| | 2016 |
| | (Decrease) | 2019 |
| | 2018 |
| | (Decrease) | | 2019 |
| | 2018 |
| | (Decrease) |
| Interest income | $ | 23 |
| | $ | 16 |
| | $ | 7 |
| | 43.8 | % | | $ | 57 |
| | $ | 42 |
| | $ | 15 |
| | 35.7 | % | $ | 31 |
| | $ | 20 |
| | $ | 11 |
| | 55.0 | % | | $ | 60 |
| | $ | 36 |
| | $ | 24 |
| | 66.7 | % |
| Other components of net periodic benefit cost | | 185 |
| | 254 |
| | (69 | ) | | (27.2 | ) | | 465 |
| | 509 |
| | (44 | ) | | (8.6 | ) |
| Other, net | (534 | ) | | 81 |
| | (615 | ) | | nm |
| | (1,433 | ) | | (1,739 | ) | | 306 |
| | (17.6 | ) | (1,528 | ) | | 86 |
| | (1,614 | ) | | nm |
| | (1,542 | ) | | (260 | ) | | (1,282 | ) | | nm |
|
| Total | $ | (511 | ) | | $ | 97 |
| | $ | (608 | ) | | nm |
| | $ | (1,376 | ) | | $ | (1,697 | ) | | $ | 321 |
| | (18.9 | ) | $ | (1,312 | ) | | $ | 360 |
| | $ | (1,672 | ) | | nm |
| | $ | (1,017 | ) | | $ | 285 |
| | $ | (1,302 | ) | | nm |
|
nm-nm - not meaningful
Other income (expense), net, reflects certain items not directly related to our core operations, including interest income, gains and losses from asset dispositions, debt extinguishment costs and components of net periodic pension and postretirement benefit costs. The changedecrease in Other income (expense), net during the three months ended SeptemberJune 30, 2017,2019, compared to the similar period in 20162018, was primarily driven by losses on early debt redemption costsredemptions of $0.5$1.5 billion recorded during the third quarter of 2017.2019. The changedecrease in Other income (expense), net during the ninesix months ended SeptemberJune 30, 2017,2019, compared to the similar period in 2016,2018, was primarily driven by an increase in early debt redemption costs of $1.3 billion, comparedbillion. In addition, we recorded a $96 million benefit, primarily attributable to $1.8 billion recordeda pension remeasurement gain, during 2016 (see “Special Items”).the six months ended June 30, 2019.
Special Charges
Special charges included in Other income (expense), net were as follows:
|
| | | | | | | | | | | | | | | |
| | Three Months Ended | | | Nine Months Ended | |
| | September 30, | | | September 30, | |
| (dollars in millions) | 2017 |
| | 2016 |
| | 2017 |
| | 2016 |
|
| Early debt redemption costs | $ | 454 |
| | $ | — |
| | $ | 1,302 |
| | $ | 1,822 |
|
Interest Expense
| | | | Three Months Ended | | | | | | | Nine Months Ended | | | | | | Three Months Ended | | | | | | | Six Months Ended | | | | | |
| | September 30, | | | Increase/ | | September 30, | | | Increase/ | June 30, | | | Increase/ | | June 30, | | | Increase/ |
| (dollars in millions) | 2017 |
| | 2016 |
| | (Decrease) | | 2017 |
| | 2016 |
| | (Decrease) | 2019 |
| | 2018 |
| | (Decrease) | | 2019 |
| | 2018 |
| | (Decrease) |
| Total interest costs on debt balances | $ | 1,338 |
| | $ | 1,214 |
| | $ | 124 |
| | 10.2 | % | | $ | 4,030 |
| | $ | 3,770 |
| | $ | 260 |
| | 6.9 | % | $ | 1,377 |
| | $ | 1,421 |
| | $ | (44 | ) | | (3.1 | )% | | $ | 2,744 |
| | $ | 2,798 |
| | $ | (54 | ) | | (1.9 | )% |
| Less capitalized interest costs | 174 |
| | 176 |
| | (2 | ) | | (1.1 | ) | | 516 |
| | 531 |
| | (15 | ) | | (2.8 | ) | 162 |
| | 199 |
| | (37 | ) | | (18.6 | ) | | 319 |
| | 375 |
| | (56 | ) | | (14.9 | ) |
| Total | $ | 1,164 |
| | $ | 1,038 |
| | $ | 126 |
| | 12.1 |
| | $ | 3,514 |
| | $ | 3,239 |
| | $ | 275 |
| | 8.5 |
| $ | 1,215 |
| | $ | 1,222 |
| | $ | (7 | ) | | (0.6 | ) | | $ | 2,425 |
| | $ | 2,423 |
| | $ | 2 |
| | 0.1 |
|
| | | | | | | | | | | | | | | | | | | | | | | | | | | | | | | |
| Average debt outstanding | $ | 117,753 |
| | $ | 103,247 |
| | | | | | $ | 114,792 |
| | $ | 105,153 |
| | | | | $ | 115,163 |
| | $ | 117,800 |
| | | | | | $ | 114,414 |
| | $ | 117,719 |
| | | | |
| Effective interest rate | 4.5 | % | | 4.7 | % | | | | | | 4.7 | % | | 4.8 | % | | | | | 4.8 | % | | 4.8 | % | | | | | | 4.8 | % | | 4.8 | % | | | | |
Total interest costs on debt balances increasedexpense decreased during the three and nine months ended SeptemberJune 30, 2017,2019, compared to the similar periods in 2016,2018, primarily due to higherlower average debt balances, (see “Consolidated Financial Condition”).offset by lower capitalized interest costs. Total interest expense increased during the six months ended June 30, 2019, compared to the similar periods in 2018, primarily due to lower capitalized interest costs offsetting lower average debt balances.
Provision for Income Taxes
| | | | Three Months Ended | | | | | Nine Months Ended | | | | Three Months Ended | | | | | Six Months Ended | | | |
| | September 30, | | | Increase/ | | September 30, | | | Increase/ | June 30, | | | Increase/ | | June 30, | | | Increase/ |
| (dollars in millions) | 2017 |
| | 2016 |
| | (Decrease) | | 2017 |
| | 2016 |
| | (Decrease) | 2019 |
| | 2018 |
| | (Decrease) | | 2019 |
| | 2018 |
| | (Decrease) |
| Provision for income taxes | $ | 1,775 |
| | $ | 1,829 |
| | $ | (54 | ) | | (3.0 | )% | | $ | 5,893 |
| | $ | 5,029 |
| | $ | 864 |
| | 17.2 | % | $ | 1,236 |
| | $ | 1,281 |
| | $ | (45 | ) | | (3.5 | )% | | $ | 2,864 |
| | $ | 2,669 |
| | $ | 195 |
| | 7.3 | % |
| Effective income tax rate | 32.2 | % | | 32.8 | % | | | | | | 33.4 | % | | 35.8 | % | | | | | 23.3 | % | | 23.2 | % | | | | | | 23.7 | % | | 23.0 | % | | | | |
The effective income tax rate is calculated by dividing the provision for income taxes by income before the provision for income taxes. The effective income tax rate and the provision for income taxes for the three months ended SeptemberJune 30, 20172019 is comparable to the similar period in 2016.2018. The decreaseincrease in the effective income tax rate during the ninesix months ended SeptemberJune 30, 2017,2019, compared to the similar period in 2016,2018, was primarily due to lower unfavorable tax impactsbenefits from goodwill not deductible for tax purposes in connection with the Data Center Sale in the current period compared to the Access Line Salefunding employee benefit obligations in the prior period as well as the effective income tax rate impact of lower income before income taxes due to pension and benefit charges recordedthat did not reoccur in the priorcurrent period. The increase in the provision for income taxes during the ninesix months ended SeptemberJune 30, 2017,2019, compared to the similar period in 2016,2018, was primarily due to the impact of higheran increase in income before income taxes in the current period.
Unrecognized Tax Benefits
Unrecognized tax benefits were $2.3$2.8 billion at SeptemberJune 30, 20172019 and $1.9$2.9 billion at December 31, 2016.2018. Interest and penalties related to unrecognized tax benefits were $0.2 billion$367 million (after-tax) and $348 million (after-tax) at SeptemberJune 30, 20172019 and $0.1 billion (after-tax) at December 31, 2016. The increase in unrecognized tax benefits was primarily related to the acquisition of Yahoo’s operating business.2018, respectively.
Verizon and/or its subsidiaries file income tax returns in the U.S. federal jurisdiction, and various state, local and foreign jurisdictions. As a large taxpayer, we are under audit by the Internal Revenue Service (IRS) and multiple state and foreign jurisdictions for various open tax years. It is reasonably possible that the amount of the liability for unrecognized tax benefits could change by a significant amount in the next twelve months. An estimate of the range of the possible change cannot be made until these tax matters are further developed or resolved.
|
|
Consolidated Net Income, Operating Income, Consolidated EBITDA and Consolidated Adjusted EBITDA |
Consolidated earnings before interest, taxes, depreciation and amortization expenses (Consolidated EBITDA)EBITDA and Consolidated Adjusted EBITDA, which are presented below, are non-GAAPnon-generally accepted accounting principles (GAAP) measures that we believe are useful to management, investors and other users of our financial information in evaluating operating profitability on a more variable cost basis as they exclude the depreciation and amortization expense related primarily to capital expenditures and acquisitions that occurred in prior years, as well as in evaluating operating performance in relation to Verizon’s competitors. Consolidated EBITDA is calculated by adding back interest, taxes and depreciation and amortization expense,expenses to net income.
Consolidated Adjusted EBITDA is calculated by excluding from Consolidated EBITDA the effect of the following non-operational items: equity in losses of unconsolidated businesses and other income (expense),and expense, net, to net income.
Consolidated Adjusted EBITDA is calculated by excludingas well as the effect of special items from the calculation of Consolidated EBITDA.items. We believe that this measure is useful to management, investors and other users of our financial information in evaluating the effectiveness of our operations and underlying business trends in a manner that is consistent with management’s evaluation of business performance. We believe that Consolidated Adjusted EBITDA is widely used by investors to compare a company’s operating performance to its competitors by minimizing impacts caused by differences in capital structure, taxes and depreciation policies. Further, the exclusion of non-operational items and special items enables comparability to prior period performance and trend analysis. See “Special Items”"Special Items" for additional details regarding these special items.information.
Operating expenses include pension and other postretirement benefit related credits and/or charges based on actuarial assumptions, including projected discount rates and an estimated return on plan assets. Such estimates are updated at least annually at the end of the fiscal year to reflect actual return on plan assets and updated actuarial assumptions or more frequently if significant events arise which require an interim remeasurement. The adjustment has been recognized in the income statement during the fourth quarter or upon a remeasurement event pursuant to our accounting policy for the recognition of actuarial gains/losses. We believe the exclusion of these actuarial gains or losses enables management, investors and other users of our financial information to assess our performance on a more comparable basis and is consistent with management’s own evaluation of performance.
It is management’s intent to provide non-GAAP financial information to enhance the understanding of Verizon’s GAAP financial information, and it should be considered by the reader in addition to, but not instead of, the financial statements prepared in accordance with GAAP. Each non-GAAP financial measure is presented along with the corresponding GAAP measure so as not to imply that more emphasis should be placed on the non-GAAP measure. We believe that non-GAAP measures provide relevant and useful information, which is used by management, investors and other users of our financial information as well as by our management in assessing both consolidated and segment performance. The non-GAAP financial information presented may be determined or calculated differently by other companies and may not be directly comparable to that of other companies.
| | | | Three Months Ended | | | Nine Months Ended | | Three Months Ended | | | Six Months Ended | |
| | September 30, | | | September 30, | | June 30, | | | June 30, | |
| (dollars in millions) | 2017 |
| | 2016 |
| | 2017 |
| | 2016 |
| 2019 |
| | 2018 |
| | 2019 |
| | 2018 |
|
| Consolidated Net Income | $ | 3,736 |
| | $ | 3,747 |
| | $ | 11,767 |
| | $ | 9,008 |
| $ | 4,074 |
| | $ | 4,246 |
| | $ | 9,234 |
| | $ | 8,912 |
|
| Add (Less): | | | | | | | | |
| Add: | |
| | | | | | |
| Provision for income taxes | 1,775 |
| | 1,829 |
| | 5,893 |
| | 5,029 |
| 1,236 |
| | 1,281 |
| | 2,864 |
| | 2,669 |
|
| Interest expense | 1,164 |
| | 1,038 |
| | 3,514 |
| | 3,239 |
| 1,215 |
| | 1,222 |
| | 2,425 |
| | 2,423 |
|
| Other (income) expense, net | 511 |
| | (97 | ) | | 1,376 |
| | 1,697 |
| |
| Equity in losses of unconsolidated businesses | 22 |
| | 23 |
| | 71 |
| | 63 |
| |
| Consolidated Operating Income | $ | 7,208 |
| | $ | 6,540 |
| | $ | 22,621 |
| | $ | 19,036 |
| |
| Add Depreciation and amortization expense | 4,272 |
| | 3,942 |
| | 12,498 |
| | 11,941 |
| |
| Consolidated EBITDA | $ | 11,480 |
| | $ | 10,482 |
| | $ | 35,119 |
| | $ | 30,977 |
| |
| Depreciation and amortization expense | | 4,232 |
| | 4,350 |
| | 8,463 |
| | 8,674 |
|
| Consolidated EBITDA* | | $ | 10,757 |
| | $ | 11,099 |
| | $ | 22,986 |
| | $ | 22,678 |
|
| | | | | | | | | | | | | | | |
| Add (Less): | | | | | | | | | | | | | | |
| Net gain on sale of divested businesses | — |
| | — |
| | (1,774 | ) | | (1,007 | ) | |
| Acquisition and integration related charges | 166 |
| | — |
| | 725 |
| | — |
| |
| Severance, pension and benefit charges | — |
| | 797 |
| | 195 |
| | 4,512 |
| |
| Gain on spectrum license transaction | — |
| | — |
| | (126 | ) | | (142 | ) | |
| Other (income) expense, net† | | $ | 1,312 |
| | $ | (360 | ) | | $ | 1,017 |
| | $ | (285 | ) |
| Equity in losses of unconsolidated businesses | | 13 |
| | 228 |
| | 19 |
| | 247 |
|
| Severance, pension and benefits charges | | — |
| | 339 |
| | — |
| | 339 |
|
Acquisition and integration related charges‡ | | — |
| | 109 |
| | — |
| | 214 |
|
Product realignment charges‡ | | — |
| | 450 |
| | — |
| | 450 |
|
| Consolidated Adjusted EBITDA | $ | 11,646 |
| | $ | 11,279 |
| | $ | 34,139 |
| | $ | 34,340 |
| $ | 12,082 |
| | $ | 11,865 |
| | $ | 24,022 |
| | $ | 23,643 |
|
* Prior period figures have been amended to conform to the current period's calculation of Consolidated EBITDA.
† Includes Pension and benefits mark-to-market adjustments and early debt redemption costs, where applicable.
‡ Excludes depreciation and amortization expense.
The changes in Consolidated Net Income, Consolidated Operating Income, Consolidated EBITDA and Consolidated Adjusted EBITDA in the table above during the three and ninesix months ended SeptemberJune 30, 2017,2019, compared to the similar periodsperiod in 2016,2018, were primarily a result of the factors described in connection with operating revenues and operating expenses.
|
|
| Segment Results of Operations |
We have two reportable segments Wireless and Wireline, whichthat we operate and manage as strategic business units, Consumer and organize by products and services, and customer groups, respectively.Business. We measure and evaluate our reportable segments based on segment operating income. The use of segment operating income is consistent with the chief operating decision maker’s assessment of segment performance.
To aid in the understanding of segment performance as it relates to segment operating income, we use the following operating statistics to evaluate the overall effectiveness of our segments:
Wireless retail connections are retail customer device postpaid and prepaid connections. Retail connections under an account may include those from smartphones and basic phones (collectively, phones) as well as tablets and other Internet devices, including wearables and retail IoT devices.
Wireless retail postpaid connections are retail postpaid customer device connections. Retail connections under an account may include those from phones, as well as tablets and other Internet devices, including wearables and retail IoT devices.
Fios Internet connections are the total number of connections to the Internet using Fios Internet services.
Fios video connections are the total number of connections to traditional linear video programming using Fios video services.
Broadband connections are thetotal number of connections to the Internet using Digital Subscriber Line (DSL) and Fios Internet services.
Voice connections are thetotal number of traditional switched access lines in service and Fios digital voice connections.
Wireless retail connections, net additions are thetotal number of additional retail customer device postpaid and prepaid connections, less the number of device disconnects within the current period.
Wireless retail postpaid connections, net additions are the total number of additional retail customer device postpaid connections, less the number of device disconnects within the current period.
Wireless retail postpaid phone connections, net additions are the total number of additional retail customer postpaid phone connections, less the number of phone disconnects within the current period.
Churn is the rate at which service to either retail or postpaid retail connections is terminated on a monthly basis.
Wireless retail postpaid ARPA is the calculated average service revenue per account (ARPA) from retail postpaid accounts, which does not include recurring device payment plan billings related to the Verizon device payment program.
Wireless retail postpaid accounts are retailcustomers that are directly served and managed under the Verizon Wireless brand and use its services. Accounts include unlimited plans, shared data plans and corporate accounts, as well as legacy single connection plans and family plans. A single account may include monthly wireless services for a variety of connected devices.
Wireless retail postpaid connections per account is calculated by dividing the total number of retail postpaid connections by the number of retail postpaid accounts as of the end of the period.
Segment earnings before interest, taxes, depreciation and amortization (Segment EBITDA), which is presented below, is a non-GAAP measure and does not purport to be an alternative to operating income (loss) as a measure of operating performance. We believe this measure is useful to management, investors and other users of our financial information in evaluating operating profitability on a more variable cost basis as it excludes the depreciation and amortization expenses related primarily to capital expenditures and acquisitions that occurred in prior years, as well as in evaluating operating performance in relation to our competitors. Segment EBITDA is calculated by adding back depreciation and amortization expense to segment operating income (loss). Segment EBITDA margin is calculated by dividing Segment EBITDA by total segment operating revenues. You can find additional information about our segments in Note 1011 to the condensed consolidated financial statements.
Our Consumer segment provides consumer-focused wireless and wireline communications services and products. Our wireless services are provided across one of the most extensive wireless networks in the U.S. under the Verizon Wireless brand and through wholesale and other arrangements. Our wireline services are provided in nine states in the Mid-Atlantic and Northeastern U.S., as well as Washington D.C., over our 100% fiber-optic network under the Fios brand and over a traditional copper-based network to customers who are not served by Fios.
Operating Revenues and Selected Operating Statistics
|
| | | | | | | | | | | | | | | | | | | | | | | | | | | | | |
| | Three Months Ended | | | | | Nine Months Ended | | | |
| (dollars in millions, except | September 30, | | | Increase/ | | September 30, | | | Increase/ |
| ARPA and I-ARPA) | 2017 |
| | 2016 |
| | (Decrease) | | 2017 |
| | 2016 |
| | (Decrease) |
| Service | $ | 15,841 |
| | $ | 16,684 |
| | $ | (843 | ) | | (5.1 | )% | | $ | 47,241 |
| | $ | 50,234 |
| | $ | (2,993 | ) | | (6.0 | )% |
| Equipment | 4,352 |
| | 4,124 |
| | 228 |
| | 5.5 |
| | 12,414 |
| | 11,782 |
| | 632 |
| | 5.4 |
|
| Other | 1,387 |
| | 1,293 |
| | 94 |
| | 7.3 |
| | 4,085 |
| | 3,793 |
| | 292 |
| | 7.7 |
|
| Total Operating Revenues | $ | 21,580 |
| | $ | 22,101 |
| | $ | (521 | ) | | (2.4 | ) | | $ | 63,740 |
| | $ | 65,809 |
| | $ | (2,069 | ) | | (3.1 | ) |
| | | | | | | | | | | | | | | | |
Connections (‘000): (1) | | | | | | | | | | | | | | | |
| Retail | | | | | | | | | 115,274 |
| | 113,676 |
| | 1,598 |
| | 1.4 |
|
| Retail postpaid | | | | | | | | | 109,686 |
| | 108,220 |
| | 1,466 |
| | 1.4 |
|
| | | | | | | | | | | | | | | | |
Net additions in period (‘000): (2) | | | | | | | | | | | | | | | |
| Retail connections | 742 |
| | 525 |
| | 217 |
| | 41.3 |
| | 1,051 |
| | 1,573 |
| | (522 | ) | | (33.2 | ) |
| Retail postpaid connections | 603 |
| | 442 |
| | 161 |
| | 36.4 |
| | 910 |
| | 1,697 |
| | (787 | ) | | (46.4 | ) |
| | | | | | | | | | | | | | | | |
| Churn Rate: | | | | | | | | | | | | | | | |
| Retail connections | 1.19 | % | | 1.28 | % | | | | | | 1.25 | % | | 1.23 | % | | | | |
| Retail postpaid connections | 0.97 | % | | 1.04 | % | | | | | | 1.02 | % | | 0.98 | % | | | | |
| | | | | | | | | | | | | | | | |
| Account Statistics: | | | | | | | | | | | | | | | |
| Retail postpaid ARPA | $ | 136.31 |
| | $ | 144.94 |
| | $ | (8.63 | ) | | (6.0 | ) | | $ | 136.06 |
| | $ | 145.12 |
| | $ | (9.06 | ) | | (6.2 | ) |
| Retail postpaid I-ARPA | $ | 166.98 |
| | $ | 169.49 |
| | $ | (2.51 | ) | | (1.5 | ) | | $ | 165.98 |
| | $ | 167.23 |
| | $ | (1.25 | ) | | (0.7 | ) |
| | | | | | | | | | | | | | | | |
Retail postpaid accounts (‘000) (1) | | | | | | | | | 35,364 |
| | 35,530 |
| | (166 | ) | | (0.5 | ) |
Retail postpaid connections per account (1) | | | | | | | | | 3.10 |
| | 3.05 |
| | 0.05 |
| | 1.6 |
|
|
| | | | | | | | | | | | | | | | | | | | | | | | | | | | | |
| | Three Months Ended | | | | | Six Months Ended | | | |
| | June 30, | | | Increase/ | | June 30, | | | Increase/ |
| (dollars in millions, except ARPA) | 2019 |
| | 2018 |
| | (Decrease) | | 2019 |
| | 2018 |
| | (Decrease) |
| Service | $ | 16,350 |
| | $ | 16,049 |
| | $ | 301 |
| | 1.9 | % | | $ | 32,609 |
| | $ | 31,873 |
| | $ | 736 |
| | 2.3 | % |
| Wireless equipment | 3,903 |
| | 4,251 |
| | (348 | ) | | (8.2 | ) | | 8,069 |
| | 8,521 |
| | (452 | ) | | (5.3 | ) |
| Other | 1,742 |
| | 1,703 |
| | 39 |
| | 2.3 |
| | 3,465 |
| | 3,236 |
| | 229 |
| | 7.1 |
|
| Total Operating Revenues | $ | 21,995 |
| | $ | 22,003 |
| | $ | (8 | ) | | — |
| | $ | 44,143 |
| | $ | 43,630 |
| | $ | 513 |
| | 1.2 |
|
| | | | | | | | | | | | | | | | |
Connections (‘000): (1) | | | | | | | | | | | | | | | |
| Wireless retail connections | | | | | | | | | 93,896 |
| | 93,816 |
| | 80 |
| | 0.1 |
|
| Wireless retail postpaid connections | | | | | | | | | 89,630 |
| | 88,984 |
| | 646 |
| | 0.7 |
|
| Fios Internet connections | | | | | | | | | 5,837 |
| | 5,663 |
| | 174 |
| | 3.1 |
|
| Fios video connections | | | | | | | | | 4,270 |
| | 4,487 |
| | (217 | ) | | (4.8 | ) |
| Broadband connections | | | | | | | | | 6,474 |
| | 6,447 |
| | 27 |
| | 0.4 |
|
| Voice connections | | | | | | | | | 6,058 |
| | 6,631 |
| | (573 | ) | | (8.6 | ) |
| | | | | | | | | | | | | | | | |
Net Additions in Period (‘000): (2) | | | | | | | | | | | | | | | |
| Wireless retail | (87 | ) | | (89 | ) | | 2 |
| | 2.2 |
| | (464 | ) | | (479 | ) | | 15 |
| | 3.1 |
|
| Wireless retail postpaid | 126 |
| | 147 |
| | (21 | ) | | (14.3 | ) | | (75 | ) | | 92 |
| | (167 | ) | | nm |
|
| Wireless retail postpaid phones | 73 |
| | 17 |
| | 56 |
| | nm |
| | (90 | ) | | (136 | ) | | 46 |
| | 33.8 |
|
| | | | | | | | | | | | | | | | |
| Churn Rate: | | | | | | | | | | | | | | | |
| Wireless retail | 1.23 | % | | 1.19 | % | | | | | | 1.28 | % | | 1.25 | % | | | | |
| Wireless retail postpaid | 0.97 | % | | 0.93 | % | | | | | | 1.03 | % | | 0.97 | % | | | | |
| Wireless retail postpaid phones | 0.72 | % | | 0.71 | % | | | | | | 0.76 | % | | 0.74 | % | | | | |
| | | | | | | | | | | | | | | | |
| Account Statistics: | | | | | | | | | | | | | | | |
| Wireless retail postpaid ARPA | $ | 118.15 |
| | $ | 115.53 |
| | $ | 2.62 |
| | 2.3 |
| | $ | 117.80 |
| | $ | 114.49 |
| | $ | 3.31 |
| | 2.9 |
|
Wireless retail postpaid accounts (‘000) (1) | | | | | | | | | 33,924 |
| | 34,045 |
| | (121 | ) | | (0.4 | ) |
Wireless retail postpaid connections per account (1) | | | | | | | | | 2.64 |
| | 2.61 |
| | 0.03 |
| | 1.1 |
|
| |
(2) | Excluding acquisitions and adjustments |
nm - not meaningful
Wireless’Consumer’s total operating revenues decreased by $0.5 billion,were unchanged and increased $513 million, or 2.4%1.2%, and $2.1 billion, or 3.1%, respectively, during the three and ninesix months ended SeptemberJune 30, 2017,2019, respectively, compared to the similar periods in 2016,2018, primarily as a result of a declineincreases in serviceService and Other revenues, partially offset by an increasedecreases in Wireless equipment revenues.revenue.
Accounts and Connections
Retail postpaid accounts primarily represent retail customers with Verizon Wireless that are directly served and managed by Verizon Wireless and use its branded services. Accounts include shared data plans, unlimited plans, and corporate accounts, as well as legacy single connection plans and family plans. A single account may include monthly wireless services for a variety of connected devices.
Retail connections represent our retail customer device postpaid and prepaid connections. Churn is the rate at which service to connections is terminated. Retail connections under an account may include those from smartphones and basic phones (collectively, phones) as well as tablets and other devices connected to the Internet, including retail IoT devices. The U.S. wireless market has achieved a high penetration of smartphones which reduces the opportunity for new phone connection growth for the industry. Retail postpaid connection net additions increased during the three months ended September 30, 2017, compared to the similar period in 2016, primarily due to a lower retail postpaid connection churn rate, driven by lower churn on postpaid phone connections, partially offset by a decrease in retail postpaid gross additions. Retail postpaid connection net additions decreased during the nine months ended September 30, 2017, compared to the similar period in 2016, primarily due to a decrease in retail postpaid gross additions as well as a higher retail postpaid connection churn rate, driven by higher churn on tablet connections.
Retail Postpaid Connections per Account
Retail postpaid connections per account is calculated by dividing the total number of retail postpaid connections by the number of retail postpaid accounts as of the end of the period. Retail postpaid connections per account increased 1.6% as of September 30, 2017, compared to September 30, 2016. The increase in retail postpaid connections per account is primarily due to an increase in Internet devices, which represented 18.6% of our retail postpaid connection base as of September 30, 2017, compared to 18.1% as of September 30, 2016.
Service Revenue
Service revenue which does not include recurring device payment plan billings related to the Verizon device payment program, decreased by $0.8 billion,increased $301 million, or 5.1%1.9%, and $3.0 billion,$736 million, or 6.0%2.3%, respectively, during the three and ninesix months ended SeptemberJune 30, 2017,2019, respectively, compared to the similar periods in 2016, primarily due to lower postpaid2018. These increases were driven by increases in wireless service and Fios revenues, partially offset by decreases in wireline voice and DSL services.
Wireless service revenue including decreased overage revenueincreased 2.5% and access revenue. Overage revenue pressure was primarily related to the ongoing migration to the pricing plans introduced in 2016, which feature safety mode and carryover data, and the introduction of unlimited pricing plans in 2017. Service revenue was also negatively impacted as a result of the ongoing customer migration to plans with unsubsidized service pricing. The pace of migration to unsubsidized price plans is slowing, as the majority of customers are already on such plans.
Customer migration to unsubsidized service pricing is driven in part by an increase in the activation of devices purchased under the Verizon device payment program. For both the three and nine months ended September 30, 2017, phone activations under the Verizon device payment program represented approximately 77% of retail postpaid phones activated compared to approximately 70% and 69%3.1%, respectively, during the three and ninesix months ended SeptemberJune 30, 2016. At September 30, 2017, approximately 78% of our retail postpaid phone connections were on unsubsidized service pricing compared to approximately 60% at September 30, 2016. At September 30, 2017, approximately 49% of our retail postpaid phone connections participated in the Verizon device payment program compared to approximately 41% at September 30, 2016.
Service revenue plus recurring device payment plan billings related to the Verizon device payment program, which represents the total value received from our wireless connections, decreased 1.1% and 1.0%,2019, respectively, during the three and nine months ended September 30, 2017, compared to the similar periods in 2016.
Retail2018. These increases were due to increases in wireless access revenue, driven by customers shifting to higher access plans including unlimited plans and increases in the number of devices per account, the declining fixed-term subsidized plan base, and data usage growth from reseller accounts. Wireless retail postpaid ARPA (the average service revenue per account from retail postpaid accounts)increased 2.3% and 2.9%, which does not include recurring device payment plan billings related to the Verizon device payment program, was negatively impacted during the three and ninesix months ended SeptemberJune 30, 2017,2019, respectively, compared to the similar periods in 2016, as a result of customer migration to plans with unsubsidized service pricing, including our new price plans launched during 2016, which feature safety mode and carryover data, and the introduction of unlimited data plans in 2017. Retail postpaid I-ARPA (the average service revenue per account from retail postpaid accounts plus recurring device payment plan billings), which represents the monthly recurring value received on a per account basis from our retail postpaid accounts, decreased 1.5% and 0.7%, respectively, during2018.
For the three and ninesix months ended SeptemberJune 30, 2017,2019, Fios revenue totaled $2.8 billion and $5.5 billion, respectively, and increased 1.2%, and $64 million, or 1.2%, respectively, compared to the similar periods in 2016. The decrease is driven by service revenue decline,2018. These increases are due to a 3.1% increase in Fios Internet connections, reflecting increased demand in higher broadband speeds, partially offset by increasing recurring device payment plan billings.a 4.8% decrease in Fios video connections, reflecting the ongoing shift from traditional linear video to over-the-top (OTT) offerings.
Equipment Revenue
EquipmentService revenue increased $0.2 billion, or 5.5%,attributable to wireline voice and $0.6 billion, or 5.4%, respectively,DSL broadband services declined during the three and ninesix months ended SeptemberJune 30, 2017,2019, compared to the similar periods in 2016,2018. The declines are primarily due to a decrease of 8.6% in voice connections resulting primarily from competition and technology substitution with wireless and competing Voice over Internet Protocol (VoIP) and cable telephony services.
Wireless Equipment Revenue
Wireless equipment revenue decreased $348 million, or 8.2%, and $452 million, or 5.3%, during the three and six months ended June 30, 2019, respectively, compared to the similar periods in 2018, as a result of overall declines in wireless device sales primarily due to an increase inelongation of the Verizon device payment program take rate and an increase in the price of deviceshandset upgrade cycle, as well as increased promotions, partially offset by an overall declinea shift to higher priced units in device sales.the mix of wireless devices sold.
Under the Verizon device payment program, we recognize a higher amount of equipment revenue at the time of sale of devices. For both the three and nine months ended September 30, 2017, phone activations under the Verizon device payment program represented approximately 77% of retail postpaid phones activated compared to approximately 70% and 69%, respectively, during the three and nine months ended September 30, 2016.
Other Revenue
Other revenue includes non-service revenues such as regulatory fees, cost recovery surcharges, revenues associated with our device protection package, sublease rentalsleasing and financing revenue. interest on equipment financed under a device payment plan agreement when sold to the customer by an authorized agent.
Other revenue increased $0.1 billion, or 7.3%2.3%, and $0.3 billion,$229 million, or 7.7%7.1%, respectively, during the three and ninesix months ended SeptemberJune 30, 2017,2019, respectively, compared to the similar periods in 2016,2018, primarily due to financing revenues from our device payment program and a volume-driven increase in revenuesvolume increases related to our wireless device protection package.plans. Pricing increases related to our wireless device protection plans also contributed to the increase in Other revenue during the six months ended June 30, 2019.
Operating Expenses
| | | | Three Months Ended | | | | | Nine Months Ended | | | | Three Months Ended | | | | | Six Months Ended | | | |
| | September 30, | | | Increase/ | | September 30, | | | Increase/ | June 30, | | | Increase/ | | June 30, | | | Increase/ |
| (dollars in millions) | 2017 |
| | 2016 |
| | (Decrease) | | 2017 |
| | 2016 |
| | (Decrease) | 2019 |
| | 2018 |
| | (Decrease) | | 2019 |
| | 2018 |
| | (Decrease) |
| Cost of services | $ | 2,052 |
| | $ | 2,006 |
| | $ | 46 |
| | 2.3 | % | | $ | 6,007 |
| | $ | 5,932 |
| | $ | 75 |
| | 1.3 | % | $ | 3,847 |
| | $ | 3,842 |
| | $ | 5 |
| | 0.1 | % | | $ | 7,726 |
| | $ | 7,615 |
| | $ | 111 |
| | 1.5 | % |
| Cost of equipment | 4,965 |
| | 5,240 |
| | (275 | ) | | (5.2 | ) | | 14,808 |
| | 14,882 |
| | (74 | ) | | (0.5 | ) | |
| Cost of wireless equipment | | 3,909 |
| | 4,296 |
| | (387 | ) | | (9.0 | ) | | 8,051 |
| | 8,569 |
| | (518 | ) | | (6.0 | ) |
| Selling, general and administrative expense | 4,594 |
| | 4,921 |
| | (327 | ) | | (6.6 | ) | | 13,785 |
| | 14,589 |
| | (804 | ) | | (5.5 | ) | 4,022 |
| | 3,808 |
| | 214 |
| | 5.6 |
| | 8,005 |
| | 7,479 |
| | 526 |
| | 7.0 |
|
| Depreciation and amortization expense | 2,366 |
| | 2,287 |
| | 79 |
| | 3.5 |
| | 7,051 |
| | 6,862 |
| | 189 |
| | 2.8 |
| 2,881 |
| | 2,997 |
| | (116 | ) | | (3.9 | ) | | 5,775 |
| | 5,972 |
| | (197 | ) | | (3.3 | ) |
| Total Operating Expenses | $ | 13,977 |
| | $ | 14,454 |
| | $ | (477 | ) | | (3.3 | ) | | $ | 41,651 |
| | $ | 42,265 |
| | $ | (614 | ) | | (1.5 | ) | $ | 14,659 |
| | $ | 14,943 |
| | $ | (284 | ) | | (1.9 | ) | | $ | 29,557 |
| | $ | 29,635 |
| | $ | (78 | ) | | (0.3 | ) |
Cost of Services
Cost of services increased 2.3%0.1%, and $0.1 billion,$111 million, or 1.3%1.5%, respectively, during the three and ninesix months ended SeptemberJune 30, 2017,2019, respectively, compared to the similar periods in 2016,2018, primarily due to higherincreases in rent expense as a result of an increase in macroadding capacity to the networks to support demand and small cell sites supporting network capacity expansion and densification, as well as a volume-driven increaseincreases in costs related to the device protection package offered to our wireless retail postpaid customers. Partially offsetting theseThese increases were partially offset by both decreases in employee related costs related to long distanceas well as decreases in access costs and roaming. roaming for the three and six months ended June 30, 2019.
Cost of Wireless Equipment
Cost of wireless equipment decreased $0.3 billion,$387 million, or 5.2%9.0%, and $0.1 billion,$518 million, or 0.5%6.0%, during the three and ninesix months ended SeptemberJune 30, 2017,2019, respectively, compared to the similar periods in 2016,2018, primarily as a result of a declinedeclines in the number of smartphone and internet unitswireless devices sold as a result of an elongation of the handset upgrade cycle, partially offset by a shiftshifts to higher priced unitsdevices in the mix of devices sold.
Selling, General and Administrative Expense
Selling, general and administrative expense decreased $0.3 billion,increased $214 million, or 6.6%5.6%, and $0.8 billion,$526 million, or 5.5%7.0%, respectively, during the three and ninesix months ended SeptemberJune 30, 2017,2019, respectively, compared to the similar periods in 2016,2018, primarily due to a $0.1 billionincreases in advertising costs, sales commission and $0.4 billion declinebad debt expense. The increase in sales commission expense respectively,is due to a lower net deferral of commission costs in the current year as wellcompared to the prior year, as a declineresult of the adoption of Topic 606 on January 1, 2018 using a modified retrospective approach. These increases were partially offset by decreases in employee related costs primarily due to reduced headcount, bad debt expense and advertising expense, offset by the impact of costs related to the natural disasters in Florida and Texas. The decline in sales commission expense during the three and nine months ended September 30, 2017, compared to the similar periods in 2016, was driven by an increase in the proportion of activations under the Verizon device payment program, which has a lower commission per unit than activations under traditional fixed-term service plans, as well as an overall decline in activations.Voluntary Separation Program.
Depreciation and Amortization Expense
Depreciation and amortization expense increased $0.1 billion,decreased $116 million, or 3.5%3.9%, and $0.2 billion,$197 million, or 2.8%3.3%, during the three and ninesix months ended SeptemberJune 30, 2017,2019, respectively, compared to the similar periods in 2016, primarily2018, driven by an increasethe change in netthe mix of total Verizon depreciable assets and Consumer's usage of those assets.
Segment Operating Income and EBITDA
| | | | Three Months Ended | | | | | Nine Months Ended | | | | Three Months Ended | | | | | Six Months Ended | | | |
| | September 30, | | | Increase/ | | September 30, | | | Increase/ | June 30, | | | Increase/ | | June 30, | | | Increase/ |
| (dollars in millions) | 2017 |
| | 2016 |
| | (Decrease) | | 2017 |
| | 2016 |
| | (Decrease) | 2019 |
| | 2018 |
| | (Decrease) | | 2019 |
| | 2018 |
| | (Decrease) |
| Segment Operating Income | $ | 7,603 |
| | $ | 7,647 |
| | $ | (44 | ) | | (0.6 | )% | | $ | 22,089 |
| | $ | 23,544 |
| | $ | (1,455 | ) | | (6.2 | )% | $ | 7,336 |
| | $ | 7,060 |
| | $ | 276 |
| | 3.9 | % | | $ | 14,586 |
| | $ | 13,995 |
| | $ | 591 |
| | 4.2 | % |
| Add Depreciation and amortization expense | 2,366 |
| | 2,287 |
| | 79 |
| | 3.5 |
| | 7,051 |
| | 6,862 |
| | 189 |
| | 2.8 |
| 2,881 |
| | 2,997 |
| | (116 | ) | | (3.9 | ) | | 5,775 |
| | 5,972 |
| | (197 | ) | | (3.3 | ) |
| Segment EBITDA | $ | 9,969 |
| | $ | 9,934 |
| | $ | 35 |
| | 0.4 |
| | $ | 29,140 |
| | $ | 30,406 |
| | $ | (1,266 | ) | | (4.2 | ) | $ | 10,217 |
| | $ | 10,057 |
| | $ | 160 |
| | 1.6 |
| | $ | 20,361 |
| | $ | 19,967 |
| | $ | 394 |
| | 2.0 |
|
| Segment operating income margin | 35.2 | % | | 34.6 | % | | | | | | 34.7 | % | | 35.8 | % | | | | | 33.4 | % | | 32.1 | % | | | | | | 33.0 | % | | 32.1 | % | | | | |
| Segment EBITDA margin | 46.2 | % | | 44.9 | % | | | | | | 45.7 | % | | 46.2 | % | | | | | 46.5 | % | | 45.7 | % | | | | | | 46.1 | % | | 45.8 | % | | | | |
The changes in the table above during the three and ninesix months ended SeptemberJune 30, 2017,2019, compared to the similar periods in 2016,2018, were primarily a result of the factors described in connection with operating revenues and operating expenses.
During the first quarter of 2017, Verizon reorganized the customer groups within its Wireline segment. Previously, the customer groups in the WirelineOur Business segment consisted of Mass Markets (which included Consumer Retailprovides wireless and Small Business subgroups), Global Enterprisewireline communications services and Global Wholesale. Pursuantproducts, video and data services, corporate networking solutions, security and managed network services, local and long distance voice services and network access to the reorganization, there are now four customer groups within the Wireline segment: Consumer Markets, which includes the customers previously included in Consumer Retail; Enterprise Solutions, which includes the large business customers, including multinational corporations,deliver various IoT services and federal government customers previously included in Global Enterprise; Partner Solutions, which includes the customers previously included in Global Wholesale;products. We provide these products and Business Markets, a new customer group, which includes U.S.-based small business customers previously included in Mass Markets and U.S.-based medium business customers, state and localservices to businesses, government customers and educational institutions previously includedwireless and wireline carriers across the U.S. and select products and services to customers around the world. The Business segment is organized in four customer groups: Global Enterprise.Enterprise, Small and Medium Business, Public Sector and Other, and Wholesale.
The operating revenues from XO are included in the Wireline segment results as of February 2017, following the completion of the acquisition, and are included with the Enterprise Solutions, Partner Solutions and Business Markets customer groups. Total operating revenues of XO for the three and nine months ended September 30, 2017 were $0.3 billion and $0.8 billion, respectively.
The operating results and statistics for all periods presented below exclude the results of the Access Line Sale on April 1, 2016, the Data Center Sale on May 1, 2017 and other insignificant transactions (see “Operating Results From Divested Businesses”). The results were adjusted to reflect comparable segment operating results consistent with the information regularly reviewed by our chief operating decision maker.
Operating Revenues and Selected Operating Statistics
|
| | | | | | | | | | | | | | | | | | | | | | | | | | | | | |
| | Three Months Ended | | | | | | | Nine Months Ended | | | | | |
| | September 30, | | | Increase/ | | September 30, | | | Increase/ |
| (dollars in millions) | 2017 |
| | 2016 |
| | (Decrease) | | 2017 |
| | 2016 |
| | (Decrease) |
| Consumer Markets | $ | 3,204 |
| | $ | 3,174 |
| | $ | 30 |
| | 0.9 | % | | $ | 9,589 |
| | $ | 9,519 |
| | $ | 70 |
| | 0.7 | % |
| Enterprise Solutions | 2,262 |
| | 2,273 |
| | (11 | ) | | (0.5 | ) | | 6,882 |
| | 6,888 |
| | (6 | ) | | (0.1 | ) |
| Partner Solutions | 1,244 |
| | 1,219 |
| | 25 |
| | 2.1 |
| | 3,708 |
| | 3,722 |
| | (14 | ) | | (0.4 | ) |
| Business Markets | 903 |
| | 834 |
| | 69 |
| | 8.3 |
| | 2,700 |
| | 2,534 |
| | 166 |
| | 6.6 |
|
| Other | 49 |
| | 76 |
| | (27 | ) | | (35.5 | ) | | 184 |
| | 240 |
| | (56 | ) | | (23.3 | ) |
| Total Operating Revenues | $ | 7,662 |
| | $ | 7,576 |
| | $ | 86 |
| | 1.1 |
| | $ | 23,063 |
| | $ | 22,903 |
| | $ | 160 |
| | 0.7 |
|
| | | | | | | | | | | | | | | | |
Connections (‘000):(1) | | | | | | | | | | | | | | | |
| Total voice connections | | | | | | | | | 13,100 |
| | 14,194 |
| | (1,094 | ) | | (7.7 | ) |
| | | | | | | | | | | | | | | | |
| Total Broadband connections | | | | | | | | | 6,978 |
| | 7,038 |
| | (60 | ) | | (0.9 | ) |
| Fios Internet subscribers | | | | | | | | | 5,803 |
| | 5,585 |
| | 218 |
| | 3.9 |
|
| Fios Video subscribers | | | | | | | | | 4,648 |
| | 4,673 |
| | (25 | ) | | (0.5 | ) |
|
| | | | | | | | | | | | | | | | | | | | | | | | | | | | | |
| | Three Months Ended | | | | | | | Six Months Ended | | | | | |
| | June 30, | | | Increase/ | | June 30, | | | Increase/ |
| (dollars in millions) | 2019 |
| | 2018 |
| | (Decrease) | | 2019 |
| | 2018 |
| | (Decrease) |
| Global Enterprise | $ | 2,673 |
| | $ | 2,808 |
| | $ | (135 | ) | | (4.8 | )% | | $ | 5,364 |
| | $ | 5,634 |
| | $ | (270 | ) | | (4.8 | )% |
| Small and Medium Business | 2,785 |
| | 2,642 |
| | 143 |
| | 5.4 |
| | 5,493 |
| | 5,176 |
| | 317 |
| | 6.1 |
|
| Public Sector and Other | 1,492 |
| | 1,437 |
| | 55 |
| | 3.8 |
| | 2,963 |
| | 2,867 |
| | 96 |
| | 3.3 |
|
| Wholesale | 818 |
| | 964 |
| | (146 | ) | | (15.1 | ) | | 1,667 |
| | 1,957 |
| | (290 | ) | | (14.8 | ) |
Total Operating Revenues (1) | $ | 7,768 |
| | $ | 7,851 |
| | $ | (83 | ) | | (1.1 | ) | | $ | 15,487 |
| | $ | 15,634 |
| | $ | (147 | ) | | (0.9 | ) |
| | | | | | | | | | | | | | | | |
Connections (‘000): (2) | | | | | | | | | | | | | | | |
| Wireless retail postpaid connections |
|
| |
|
| |
|
| |
|
| | 24,221 |
| | 22,638 |
| | 1,583 |
| | 7.0 |
|
| Fios Internet connections |
| |
| |
| |
| | 316 |
| | 296 |
| | 20 |
| | 6.8 |
|
| Fios video connections |
|
| |
|
| |
|
| |
|
| | 76 |
| | 73 |
| | 3 |
| | 4.1 |
|
| Broadband connections |
| |
| |
| |
| | 494 |
| | 509 |
| | (15 | ) | | (2.9 | ) |
| Voice connections |
|
| |
|
| |
|
| |
|
| | 5,163 |
| | 5,639 |
| | (476 | ) | | (8.4 | ) |
| | | | | | | | | | | | | | | | |
Net additions in period (‘000): (3) | | | | | | | | | | | | | | | |
| Wireless retail postpaid | 325 |
| | 384 |
| | (59 | ) | | (15.4 | ) | | 587 |
| | 699 |
| | (112 | ) | | (16.0 | ) |
| Wireless retail postpaid phones | 172 |
| | 182 |
| | (10 | ) | | (5.5 | ) | | 291 |
| | 311 |
| | (20 | ) | | (6.4 | ) |
| | | | | | | | | | | | | | | | |
| Churn Rate: | | | | | | | | | | | | | | | |
| Wireless retail postpaid | 1.21 | % | | 1.16 | % | | | | | | 1.23 | % | | 1.16 | % | | | | |
| Wireless retail postpaid phones | 0.97 | % | | 0.96 | % | | | | | | 0.99 | % | | 0.96 | % | | | | |
| |
(1) | Service and other revenues included in our Business segment amounted to approximately $7.0 billion and $13.9 billion for the three and six months ended June 30, 2019, respectively, and approximately $7.1 billion and $14.0 billion for the three and six months ended June 30, 2018, respectively. Wireless equipment revenues included in our Business segment amounted to approximately $814 million and $1.6 billion for the three and six months ended June 30, 2019, respectively, and approximately $793 million and $1.6 billion for the three and six months ended June 30, 2018, respectively. |
| |
(3) | Excluding acquisitions and adjustments |
Wireline’sBusiness’s total operating revenues increased $0.1 billion,decreased $83 million, or 1.1%, and $0.2 billion,$147 million, or 0.7%0.9%, respectively, during the three and ninesix months ended SeptemberJune 30, 2017,2019, compared to the similar periods in 2016,2018. Both periods’ decrease were primarily as a result of increasesdecreases in Business Markets, as a result of the acquisition of XO,Global Enterprise and Fios revenues. The increase during the nine months ended September 30, 2017 wasWholesale revenues, partially offset by declinesincreases in Partner SolutionsSmall and Medium Business and Public Sector and Other revenues. The 2016 Work Stoppage negatively impacted revenue for the nine months ended September 30, 2016.
FiosGlobal Enterprise
Global Enterprise offers services to large businesses, which are identified based on their size and volume of business with Verizon, as well as non-U.S. public sector customers.
Global Enterprise revenues were $2.9 billiondecreased $135 million, or 4.8%, and $8.7 billion, respectively,$270 million, or 4.8%, during the three and ninesix months ended SeptemberJune 30, 2017, compared to $2.8 billion and $8.3 billion during the similar periods in 2016. During the nine months ended September 30, 2017, our Fios Internet subscriber base grew by 3.9% and our Fios Video subscriber base decreased by 0.5%, compared to the similar period in 2016, reflecting the ongoing shift from traditional linear video to over-the-top offerings.
Consumer Markets
Consumer Markets operations provide broadband Internet and video services (including HSI, Fios Internet and Fios video services) and local and long distance voice services to residential subscribers.
Consumer Markets revenues increased 0.9% and 0.7%,2019, respectively during the three and nine months ended September 30, 2017, compared to the similar periods in 2016, as increases in Fios revenues due to subscriber growth for Fios services (Internet, video and voice) and higher pay-per-view sales due to marquee events during the third quarter were partially offset by the continued decline of voice service revenues.
Consumer Fios revenues increased $0.1 billion, or 4.6%, and $0.3 billion, or 4.4%, respectively, during the three and nine months ended September 30, 2017, compared to the similar periods in 2016. Fios represented approximately 85% of Consumer revenue for both the three and nine months ended September 30, 2017, compared to approximately 82% during the similar periods in 2016.
The decline of voice service revenues was primarily due to a 7.1% decline in retail residence voice connections resulting primarily from competition and technology substitution with wireless, competing VoIP (voice over IP) and cable telephony services. Total voice connections include traditional switched access lines in service as well as Fios digital voice connections.
Enterprise Solutions
Enterprise Solutions helps customers deliver an adaptive enterprise while mitigating risk and maintaining continuity, to capitalize on the data driven world and create personalized experiences. Enterprise Solutions offers traditional circuit-based network services, and advanced networking solutions including Private IP, Ethernet, and Software Defined Wide Area Network, along with our traditional voice services and advanced workforce productivity and customer contact center solutions. Our Enterprise Solutions include security services to manage, monitor, and mitigate cyber-attacks. Enterprise Solutions provides professional and integrated managed services, delivering solutions for large businesses, including multinational corporations, and federal government customers.
Enterprise Solutions revenues decreased 0.5% and 0.1%, respectively, during the three and nine months ended September 30, 2017, compared to the similar periods in 2016. The decrease during the three and nine months ended September 30, 2017 is2018, primarily due to declines in traditional data and voice communicationscommunication services as a result of competitive price pressures, offset by the acquisition of XO.pressures.
Partner SolutionsSmall and Medium Business
Partner Solutions provides communicationsSmall and Medium Business offers wireless services including data, voice and local dial tone and broadband services primarily to local, long distance and other carriers that use our facilities to provide services to their customers.
Partner Solutions revenues increased 2.1% and decreased 0.4%, respectively, during the three and nine months ended September 30, 2017, compared to the similar periods in 2016. The increase during the three months ended September 30, 2017 was primarily due to the acquisition of XO during February 2017, offset by declines in traditional voice revenues due to the effect of technology substitution as well as continuing contraction of market rates due to competition. The decrease during the nine months ended September 30, 2017 was primarily due to declines in traditional voice revenues due to the effect of technology substitution as well as continuing contraction of market rates due to competition, offset by an increase in data revenues as a result of the acquisition of XO. As a result of technology substitution, the number of core data circuits at September 30, 2017 decreased 19.5% compared to September 30, 2016. The decline in traditional voice revenue is driven by a 7.4% decline in domestic wholesale connections at September 30, 2017, compared to September 30, 2016.
Business Markets
Business Markets offers traditionalequipment, tailored voice and networking products, Fios services, IP Networking, advanced voice solutions, security, and managed ITinformation technology services to our U.S.-based smallcustomers that do not meet the requirements to be categorized as Global Enterprise.
Small and medium businesses, state and local governments, and educational institutions.
Medium Business Markets revenues increased $0.1 billion,$143 million, or 8.3%5.4%, and $0.2 billion,$317 million, or 6.6%6.1%, respectively, during the three and ninesix months ended SeptemberJune 30, 2017,2019, respectively compared to the similar periods in 2016, primarily2018, largely due to increases in wireless postpaid service revenue, as a result of an increase in the amount of wireless retail postpaid connections. These increases were further driven by wireless equipment revenue due to the acquisitionincrease in the number of XO during February 2017,smartphone units sold, as well as increases in revenue related to Fios services. These increases were partially offset by revenue declines related to the loss of voice and HSIDSL service connections. During the six months ended June 30, 2019, there was an increase in other revenue due to volume and rate-driven increases in revenue related to our wireless device protection package.
For the three and six months ended June 30, 2019, Fios revenues totaled $227 million and $456 million, respectively, and increased 14.0% and $61 million or 15.4%, respectively, compared to the similar period in 2018, reflecting the increase in total connections as well as increased demand in higher broadband speeds.
Public Sector and Other
Public Sector and Other offers wireless products and services, as well as wireline connectivity solutions, to U.S. federal, state and local governments and educational institutions. These services include the services offered by Consumer discussed above and business services and connectivity similar to the products and services offered by the Global Enterprise group, in each case, with features and pricing designed to address the needs of governments and educational institutions.
Public Sector and Other revenues increased $55 million, or 3.8%, and $96 million, or 3.3%, during the three and six months ended June 30, 2019, compared to the similar periods in 2018, respectively, due to increases in networking, customer premise equipment, as well as wireless equipment revenue, due to a shift in higher priced units in the mix of devices sold and increases in wireless device sales. The increases were further driven by wireless postpaid service revenue as a result of competitive price pressures. Business Markets northeast footprint delivers ILECan increase in wireless retail postpaid connections.
Wholesale
Wholesale offers wireline communications services including data, voice, local dial tone and broadband services primarily to local, long distance, and wireless carriers that use our facilities to provide services to their customers.
Wholesale revenues decreased $146 million, or 15.1%, and $290 million, or 14.8%, during the three and six months ended June 30, 2019, compared to the similar periods in 2018, respectively, due to declines in core data products, which face secular declines.and traditional voice services resulting from the effect of technology substitution and continuing contraction of market rates due to competition.
Operating Expenses
| | | | Three Months Ended | | | | | Nine Months Ended | | | | Three Months Ended | | | | | Six Months Ended | | | |
| | September 30, | | | Increase/ | | September 30, | | | Increase/ | June 30, | | | Increase/ | | June 30, | | | Increase/ |
| (dollars in millions) | 2017 |
| | 2016 |
| | (Decrease) | | 2017 |
| | 2016 |
| | (Decrease) | 2019 |
| | 2018 |
| | (Decrease) | | 2019 |
| | 2018 |
| | (Decrease) |
| Cost of services | $ | 4,496 |
| | $ | 4,369 |
| | $ | 127 |
| | 2.9 | % | | $ | 13,457 |
| | $ | 13,996 |
| | $ | (539 | ) | | (3.9 | )% | $ | 2,581 |
| | $ | 2,660 |
| | $ | (79 | ) | | (3.0 | )% | | $ | 5,172 |
| | $ | 5,370 |
| | $ | (198 | ) | | (3.7 | )% |
| Cost of wireless equipment | | 1,109 |
| | 1,101 |
| | 8 |
| | 0.7 |
| | 2,166 |
| | 2,137 |
| | 29 |
| | 1.4 |
|
| Selling, general and administrative expense | 1,552 |
| | 1,667 |
| | (115 | ) | | (6.9 | ) | | 4,716 |
| | 4,998 |
| | (282 | ) | | (5.6 | ) | 1,961 |
| | 1,930 |
| | 31 |
| | 1.6 |
| | 3,942 |
| | 3,794 |
| | 148 |
| | 3.9 |
|
| Depreciation and amortization expense | 1,549 |
| | 1,467 |
| | 82 |
| | 5.6 |
| | 4,572 |
| | 4,540 |
| | 32 |
| | 0.7 |
| 1,046 |
| | 1,059 |
| | (13 | ) | | (1.2 | ) | | 2,088 |
| | 2,118 |
| | (30 | ) | | (1.4 | ) |
| Total Operating Expenses | $ | 7,597 |
| | $ | 7,503 |
| | $ | 94 |
| | 1.3 |
| | $ | 22,745 |
| | $ | 23,534 |
| | $ | (789 | ) | | (3.4 | ) | $ | 6,697 |
| | $ | 6,750 |
| | $ | (53 | ) | | (0.8 | ) | | $ | 13,368 |
| | $ | 13,419 |
| | $ | (51 | ) | | (0.4 | ) |
Cost of Services
Cost of services increased $0.1 billion,decreased $79 million, or 2.9%3.0%, and $198 million, or 3.7%, during the three and six months ended SeptemberJune 30, 2017,2019, compared to the similar periodperiods in 2016,2018, primarily related to decreases in personnel costs due to an increase in content costs associated with continued programming license fee increases and Fios subscriber growth and an increase in access costsa lower headcount primarily as a result of the acquisitionVoluntary Separation Program and decreases in access costs due to a reduction of XO during February 2017.voice connections, which were partially offset by increases in wireline equipment costs.
Cost of services decreased $0.5 billion, or 3.9%Wireless Equipment
Cost of wireless equipment increased 0.7%, and 1.4%, during the ninethree and six months ended SeptemberJune 30, 2017,2019, compared to the similar periodperiods in 2016, primarily due to the fact that we did not incur incremental costs in 2017 as a result of the 2016 Work Stoppage, and a decline in net pension and postretirement benefit costs2018, primarily driven by collective bargaining agreements ratifieda shift to higher priced units in June 2016. These decreasesthe mix of devices sold. During the six months ended, the increases were partially offsetfurther driven by an increase in content costs associated with continued programming license fee increases and Fios subscriber growth and an increase in access costs as a resultthe number of the acquisition of XO.smartphone units sold.
Selling, General and Administrative Expense
Selling, general and administrative expense decreased $0.1 billion,increased 1.6%, and $148 million, or 6.9%3.9%, during the three and six months ended SeptemberJune 30, 2017,2019, compared to the similar periodperiods in 2016, due to decreases2018, primarily driven by increases in transaction taxes and regulatoryadvertising expenses and contracted services,sales commission expense, which were partially offset by the acquisition of XO.
Selling, general and administrative expense decreased $0.3 billion, or 5.6%, during the nine months ended September 30, 2017, compareddecreases in employee related costs primarily due to the similar period in 2016, due to a decline in net pension and postretirement benefit costs, primarily driven by collective bargaining agreements ratified in June 2016, transaction taxes and regulatory expenses, contracted services, and the fact that there were no 2016 Work Stoppage costs in 2017, partially offset by the acquisition of XO.Voluntary Separation Program.
Depreciation and Amortization Expense
Depreciation and amortization expense increased $0.1 billion, or 5.6%decreased 1.2%, and 1.4%, during the three and six months ended SeptemberJune 30, 2017,2019, compared to the similar periodperiods in 2016, and 0.7% during2018, driven by the nine months ended September 30, 2017, compared tochange in the similar period in 2016, primarily due to increases in netmix of total Verizon depreciable assets as a resultand Business's usage of the acquisition of XO.those assets.
Segment Operating Income (Loss) and EBITDA
| | | | Three Months Ended | | | | | Nine Months Ended | | | | Three Months Ended | | | | | Six Months Ended | | | |
| | September 30, | | | Increase/ | | September 30, | | | Increase/ | June 30, | | | Increase/ | | June 30, | | | Increase/ |
| (dollars in millions) | 2017 |
| | 2016 |
| | (Decrease) | | 2017 |
| | 2016 |
| | (Decrease) | 2019 |
| | 2018 |
| | (Decrease) | | 2019 |
| | 2018 |
| | (Decrease) |
| Segment Operating Income (Loss) | $ | 65 |
| | $ | 73 |
| | $ | (8 | ) | | (11.0 | )% | | $ | 318 |
| | $ | (631 | ) | | $ | 949 |
| | nm |
| |
| Segment Operating Income | | $ | 1,071 |
| | $ | 1,101 |
| | $ | (30 | ) | | (2.7 | )% | | $ | 2,119 |
| | $ | 2,215 |
| | $ | (96 | ) | | (4.3 | )% |
| Add Depreciation and amortization expense | 1,549 |
| | 1,467 |
| | 82 |
| | 5.6 |
| | 4,572 |
| | 4,540 |
| | 32 |
| | 0.7 | % | 1,046 |
| | 1,059 |
| | (13 | ) | | (1.2 | )% | | 2,088 |
| | 2,118 |
| | (30 | ) | | (1.4 | ) |
| Segment EBITDA | $ | 1,614 |
| | $ | 1,540 |
| | $ | 74 |
| | 4.8 |
| | $ | 4,890 |
| | $ | 3,909 |
| | $ | 981 |
| | 25.1 |
| $ | 2,117 |
| | $ | 2,160 |
| | $ | (43 | ) | | (2.0 | ) | | $ | 4,207 |
| | $ | 4,333 |
| | $ | (126 | ) | | (2.9 | ) |
| Segment operating income (loss) margin | 0.8 | % | | 1.0 | % | | | | | | 1.4 | % | | (2.8 | )% | | | | | |
| | | | | | | | | | | | | | | | | |
| Segment operating income margin | | 13.8 | % | | 14.0 | % | | | | | | 13.7 | % | | 14.2 | % | | | | |
| Segment EBITDA margin | 21.1 | % | | 20.3 | % | | | | | | 21.2 | % | | 17.1 | % | | | | | 27.3 | % | | 27.5 | % | | | | | | 27.2 | % | | 27.7 | % | | | | |
nm - not meaningful
The changes in the table above during the three and ninesix months ended SeptemberJune 30, 2017,2019, compared to the similar periods in 2016,2018, were primarily a result of the factors described in connection with operating revenues and operating expenses.
Items excluded from our Wireline segment Operating income (loss), which were reclassified to Corporate and other, were as follows:
|
| | | | | | | | | | | | | | | |
| | Three Months Ended | | | Nine Months Ended | |
| | September 30, | | | September 30, | |
| (dollars in millions) | 2017 |
| | 2016 |
| | 2017 |
| | 2016 |
|
| Operating results from divested businesses | $ | (17 | ) | | $ | (83 | ) | | $ | (149 | ) | | $ | (918 | ) |
|
|
Early Debt Redemption Costs |
|
| | | | | | | | | | | | | | | |
| | Three Months Ended | | | Six Months Ended | |
| | June 30, | | | June 30, | |
| (dollars in millions) | 2019 |
| | 2018 |
| | 2019 |
| | 2018 |
|
| Severance, pension and benefits charges | | | | | | | |
| Selling, general and administrative expense | $ | — |
| | $ | 339 |
| | $ | — |
| | $ | 339 |
|
| Other income (expense), net | — |
| | — |
| | (96 | ) | | — |
|
| Acquisition and integration related charges | | | | | | | |
| Selling, general and administrative expense | — |
| | 109 |
| | — |
| | 214 |
|
| Depreciation and amortization expense | — |
| | 11 |
| | — |
| | 13 |
|
| Product realignment charges | | | | | | | |
| Cost of services | — |
| | 303 |
| | — |
| | 303 |
|
| Selling, general and administrative expense | — |
| | 147 |
| | — |
| | 147 |
|
| Equity in losses of unconsolidated businesses | — |
| | 207 |
| | — |
| | 207 |
|
| Depreciation and amortization expense | — |
| | 1 |
| | — |
| | 1 |
|
| Early debt redemption costs | | | | | | | |
| Other income (expense), net | 1,544 |
| | — |
| | 1,544 |
| | 249 |
|
| Total | $ | 1,544 |
| | $ | 1,117 |
| | $ | 1,448 |
| | $ | 1,473 |
|
During the three and nine months ended September 30, 2017, we recorded early debt redemption costs of $0.5 billion and $1.3 billion, respectively.
During the nine months ended September 30, 2016, we recorded net debt redemption costs of $1.8 billion in connection with early redemptions and notes tendered during the year.
See Note 4 to the condensed consolidated financial statements for additional information related to our early debt redemptions.
|
|
Net Gain on Sale of Divested Businesses |
During the second quarter of 2017, we completed the Data Center Sale. In connection with the Data Center Sale and other insignificant transactions, we recorded a net gain on the sale of divested businesses of approximately $1.8 billion in Selling, general and administrative expense on our condensed consolidated statement of income for the nine months ended September 30, 2017.
During the second quarter of 2016, we completed the sale of the local exchange business and related landline activities in California, Florida and Texas. As a result of this transaction, we recorded a pre-tax gain of approximately $1.0 billion in Selling, general and administrative expense on our condensed consolidated statement of income for the nine months ended September 30, 2016. The pre-tax gain included a $0.5 billion pension and postretirement benefit curtailment gain due to the elimination of the accrual of pension and other postretirement benefits for some or all future services of a significant number of employees covered in three of our defined benefit pension plans and one of our other postretirement benefit plans.
The Consolidated Adjusted EBITDA non-GAAP measure presented in the Consolidated Net Income, Operating IncomeConsolidated EBITDA and Consolidated Adjusted EBITDA discussion (See “Consolidated(see "Consolidated Results of Operations”Operations") excludes all of the net gain on saleamounts included above, as described below.
The income and expenses related to special items included in our consolidated results of divested businesses described above. operations were as follows:
|
|
Acquisition and Integration Related Charges |
|
| | | | | | | | | | | | | | | |
| | Three Months Ended | | | Six Months Ended | |
| | June 30, | | | June 30, | |
| (dollars in millions) | 2019 |
| | 2018 |
| | 2019 |
| | 2018 |
|
| Within Total Operating Expenses | $ | — |
| | $ | 910 |
| | $ | — |
| | $ | 1,017 |
|
| Within Equity in losses of unconsolidated businesses | — |
| | 207 |
| | — |
| | 207 |
|
| Within Other income (expense), net | 1,544 |
| | — |
| | 1,448 |
| | 249 |
|
| Total | $ | 1,544 |
| | $ | 1,117 |
| | $ | 1,448 |
| | $ | 1,473 |
|
Severance, Pension and Benefits Charges
During the second quarter of 2017, we completed the acquisition of Yahoo’s operating business. We recorded acquisition and integration related charges of approximately $0.1 billion and $0.7 billion during the three and ninesix months ended SeptemberJune 30, 2017, respectively, including $0.1 billion and $0.5 billion of acquisition related severance charges during the three and nine months ended September 30, 2017, respectively, primarily related to the acquisition of Yahoo’s operating business. These charges were primarily recorded in Selling, general and administrative expense on our condensed consolidated statements of income for the three and nine months ended September 30, 2017.
The Consolidated Adjusted EBITDA non-GAAP measure presented in the Consolidated Net Income, Operating Income and EBITDA discussion (See “Consolidated Results of Operations”) excludes the acquisition and integration related charges described above.
|
|
Severance, Pension and Benefit Charges |
During the nine months ended September 30, 2017,2019, we recorded a pre-tax severance charge of approximately $0.2 billion, exclusive of acquisition related severance charges.
During the three months ended September 30, 2016, we recorded net pre-tax severance, pension and benefit chargesremeasurement credit of approximately $0.8 billion, primarily for$96 million in our pension plans triggered by the Voluntary Separation Program for select U.S.-based management employees and other headcount reduction initiatives, primarily driven by a $150 million credit due to the difference between our estimated return on assets and our actual return on assets, offset by a $54 million charge due to a change in our discount rate assumption used to determine the current year liabilities of our pension plans. Pension and benefit activity was recorded in accordance with our accounting policy to recognize actuarial gains and losses in the period in which they occur. The
During both the three and six months ended June 30, 2018, we recorded a pre-tax severance charge of approximately $339 million, exclusive of acquisition related severance charges.
See Note 9 to the condensed consolidated financial statements for additional information related to our 2019 pension remeasurementand benefits credits.
Acquisition and Integration Related Charges
Acquisition and integration related charges of $0.6 billionrecorded during the three and six months ended June 30, 2018 primarily related to settlements for employees who received lump-sum distributionsthe acquisition of Yahoo’s operating business in five of our defined benefit pension plans. The charges were primarily driven by a decrease in our discount rate assumption of $0.8 billion used to determine the current year liabilities of our pension plans, partially offset by the difference between our expected return on assets of 7.0% and our annualized actual return on assets of 11.0% at August 31, 2016 ($0.2 billion). Our weighted-average discount rate assumption was 3.61% at August 31, 2016. As part of this charge, we recorded severance costs of $0.2 billion under our existing separation plans.June 2017.
Product Realignment Charges
During the three months ended June 30, 2016,2018, we recorded net pre-tax pension and benefit remeasurementproduct realignment charges of approximately $3.6 billion in accordance with our accounting policy$658 million. Product realignment charges primarily relate to recognize actuarial gainsthe discontinuation of the go90 platform and losses in the period in which they occur.associated content. These charges were comprised of a net pre-tax pension and benefit remeasurement charge of $0.8 billion measured as of April 1, 2016 related to curtailments in three of our defined benefit pension plans and one of our other postretirement benefit plans, a net pre-tax pension and benefit remeasurement charge of $2.7 billion measured as of May 31, 2016 in two of our defined benefit pension plans and three of our other postretirement benefit plans as a result of our accounting for the contractual healthcare caps and bargained for changes, and a net pre-tax pension and benefit remeasurement charge of $0.1 billion measured as of May 31, 2016 related to settlements for employees who received lump-sum distributions in three of Verizon’s defined benefit pension plans. The pension and benefit remeasurement charges were primarily driven by a decrease in our discount rate assumption used to determine the current year liabilities of our pension and other postretirement benefit plans ($2.7 billion) and updated healthcare cost trend rate assumptions ($0.9 billion). Our weighted-average discount rate assumption decreased from 4.60% at December 31, 2015 to 3.99% at May 31, 2016.
During the three months ended March 31, 2016, we also recorded a net pre-tax pension and benefit remeasurement charge of $0.2 billion related to settlements for employees who received lump-sum distribution in one of Verizon’s defined benefit pension plans.
The Consolidated Adjusted EBITDA non-GAAP measure presented in the Consolidated Net Income, Operating Income and EBITDA discussion (See “Consolidated Results of Operations”) excludes the severance, pension and benefit charges described above.
|
|
Gain on Spectrum License Transactions |
During the first quarter of 2017, we completed a license exchange transaction with affiliates of AT&T Inc. (AT&T) to exchange certain Advanced Wireless Services (AWS) and Personal Communication Services (PCS) spectrum licenses. As a result of this non-cash exchange, we received $1.0 billion of AWS and PCS spectrum licenses at fair value and we recorded a pre-tax gain of approximately $0.1 billion in Selling, general and administrative expense, Cost of services, Equity in losses of unconsolidated businesses, and Depreciation and amortization expense on our condensed consolidated statements of income for the three and six months ended June 30, 2018.
Early Debt Redemption Costs
During both the three and six months ended June 30, 2019, we recorded losses on early debt redemptions of $1.5 billion in connection with the tender offers of notes issued by Verizon with coupon rates ranging from 4.672% to 5.012% and maturity dates ranging from 2054 to 2055. These losses were recorded in Other income (expense), net on our condensed consolidated statement of income for the nine months ended September 30, 2017.income.
During the first quarter of 2016, we completed a license exchange transaction with affiliates of AT&T to exchange certain AWS and PCS spectrum licenses. As a result of this non-cash exchange, we received $0.4��billion of AWS and PCS spectrum licenses at fair value andsix months ended June 30, 2018, we recorded a pre-tax gainlosses on early debt redemptions of approximately $0.1 billion$249 million in Selling, generalconnection with the tender offers for 13 series of notes issued by Verizon with coupon rates ranging from 1.750% to 5.012% and administrative expensematurity dates ranging from 2021 to 2055. These losses were recorded in Other income (expense), net on our condensed consolidated statement of income for the nine months ended September 30, 2016.income.
The Consolidated Adjusted EBITDA non-GAAP measure presented in the Consolidated Net Income, Operating Income and EBITDA discussion (see “Consolidated Results of Operations”) excludes the gains on the spectrum license transactions described above.
|
|
Operating Results From Divested Businesses |
On April 1, 2016, we completed the sale of our local exchange business and related landline activities in California, Florida and Texas to Frontier. On May 1, 2017, we completed the Data Center Sale.
|
|
| Consolidated Financial Condition |
| | | | Nine Months Ended | | | | Six Months Ended | | | |
| | September 30, | | | | June 30, | | | |
| (dollars in millions) | 2017 |
| | 2016 |
| | Change |
| 2019 |
| | 2018 |
| | Change |
|
| Cash Flows Provided By (Used In) | | | | | | | | | | |
| Operating activities | $ | 17,221 |
| | $ | 17,724 |
| | $ | (503 | ) | $ | 15,836 |
| | $ | 16,433 |
| | $ | (597 | ) |
| Investing activities | (13,701 | ) | | (2,539 | ) | | (11,162 | ) | (8,589 | ) | | (8,728 | ) | | 139 |
|
| Financing activities | (1,913 | ) | | (13,214 | ) | | 11,301 |
| (8,043 | ) | | (7,865 | ) | | (178 | ) |
| Increase In Cash and Cash Equivalents | $ | 1,607 |
| | $ | 1,971 |
| | $ | (364 | ) | |
| Decrease in cash, cash equivalents and restricted cash | | $ | (796 | ) | | $ | (160 | ) | | $ | (636 | ) |
We use the net cash generated from our operations to fund network expansion and modernization of our networks, service and repay external financing, pay dividends, invest in new businesses and, when appropriate, buy back shares of our outstanding common stock. Our sources of funds, primarily from operations and, to the extent necessary, from external financing arrangements, are sufficient to meet ongoing operating and investing requirements. We expect that our capital spending requirements will continue to be financed primarily through internally generated funds. Debt or equity financing may be needed to fund additional investments or development activities or to maintain an appropriate capital structure to ensure our financial flexibility. Our cash and cash equivalents are primarily held both domestically and internationally, and are invested to maintain principal and provide liquidity. Accordingly, we do not have significant exposure to foreign currency fluctuations. See “Market Risk”"Market Risk" for additional information regarding our foreign currency risk management strategies.
Our available external financing arrangements include an active commercial paper program, credit available under credit facilities and other bank lines of credit, vendor financing arrangements, issuances of registered debt or equity securities, U.S. retail medium-term notes and privately-placedother capital market securities.securities that are privately-placed or offered overseas. In addition, our available arrangements towe monetize our device payment plan agreement receivables includethrough asset-backed securitizations and sales of selected receivables to relationship banks.debt transactions.
Cash Flows Provided By Operating Activities |
|
Cash Flows Provided By Operating Activities |
Our primary source of funds continues to be cash generated from operations, primarily from our Wireless segment.operations. Net cash provided by operating activities decreased $597 million during the ninesix months ended SeptemberJune 30, 2017 decreased by $0.5 billion,2019, compared to the similar period in 2016,2018, primarily due to ouran increase in earnings and a decrease in discretionary contributions to qualified pensionemployee benefit plans, of $3.4 billion (approximately $2.1 billion, net of tax benefit), the change in the method in which we monetize device payment plan receivables, as discussed below, andoffset by changes in working capital, partially offset bywhich includes an increase in earnings.cash income taxes, and severance payments as a result of the Voluntary Separation Program during the six months ended June 30, 2019, compared to the similar period in 2018. We made $300 million and $1.7 billion in discretionary employee benefits contributions during the six months ended June 30, 2019 and 2018, respectively, to our defined benefit pension plan. As a result of the discretionary pension contribution, our mandatorycontributions, we expect that there will be no required pension funding through 2020 is expected to be minimal,until 2024, which will continue to benefit future cash flows. Further, the funded status of our qualified pension plan is improved.improved as a result of the contributions.
During 2016, we changed the method in which we monetize device payment plan receivables from sales of device payment plan receivables, which were recorded within cash flows provided by operating activities, to asset-backed securitization transactions, which are recorded in cash flows from financing activities. During the nine months ended September 30, 2016, we received cash proceeds related to new sales of wireless device payment plan agreement receivables of approximately $2.0 billion. See Note 5 to the condensed consolidated financial statements for additional information. During the nine months ended September 30, 2017, we received proceeds from asset-backed securitization transactions of approximately $2.9 billion. See Note 4 to the condensed consolidated financial statements and “Cash Flows Used In Financing Activities” for additional information.
|
|
| Cash Flows Used In Investing Activities |
Capital Expenditures
Capital expenditures continue to relate primarily to the use of capital resources to facilitate the introduction of new products and services, enhance responsiveness to competitive challenges, maintain the existing infrastructure and increase the operating efficiency and productivity of our networks.
Capital expenditures, including capitalized software, were as follows:
|
| | | | | | | |
| | Nine Months Ended | |
| | September 30, | |
| (dollars in millions) | 2017 |
| | 2016 |
|
| Wireless | $ | 6,927 |
| | $ | 7,776 |
|
| Wireline | 3,358 |
| | 2,856 |
|
| Other | 997 |
| | 766 |
|
| | $ | 11,282 |
| | $ | 11,398 |
|
| Total as a percentage of revenue | 12.3 | % | | 12.2 | % |
|
| | | | | | | |
| | Six Months Ended | |
| | June 30, | |
| (dollars in millions) | 2019 |
| | 2018 |
|
| Capital expenditures (including capitalized software) | $ | 7,967 |
| | $ | 7,838 |
|
| Total as a percentage of revenue | 12.4 | % | | 12.3 | % |
Capital expenditures decreased at Wirelessincreased, during the ninesix months ended SeptemberJune 30, 2017, compared to the similar period in 2016,2019, primarily due to the timing ofan increase in investments to increasesupport multi-use fiber assets, which support the capacitydensification of our 4G LTE network. Capital expenditures increased at Wireline asnetwork and a result of an increase in capital expenditures used for fiber assets.continued focus on 5G technology deployment. Our investments are primarily related to network infrastructure to support the business.
Acquisitions
In February 2017,2019, the Federal Communications Commission (FCC) completed two millimeter wave spectrum license auctions. Verizon acquired XO, which ownsparticipated in these auctions and operates one ofwas the largest fiber-based IPhigh bidder on 9 and Ethernet networks, for total1,066 licenses, respectively, in the 24 Gigahertz (GHz) and 28 GHz bands. We submitted an application to the FCC and paid cash consideration of approximately $1.8 billion,$521 million for the licenses that will be issued. The deposits related to these spectrum licenses are classified within Other assets in our condensed consolidated balance sheets as of which $0.1 billion was paid in 2015.June 30, 2019.
OnDuring both the three and six months ended June 13, 2017, Verizon acquired Yahoo’s operating business30, 2019, we completed various other acquisitions for cash consideration of approximately $4.5 billion, netan insignificant amount of cash acquired.consideration.
Dispositions
During the nine months ended September 30, 2017, we received net cash proceeds of $3.5 billion in connection with the Data Center Sale on May 1, 2017. We also completed other insignificant transactions during the nine months ended September 30, 2017.
|
|
Cash Flows Used In Financing Activities |
Cash Flows Used In Financing Activities
We seek to maintain a mix of fixed and variable rate debt to lower borrowing costs within reasonable risk parameters and to protect against earnings and cash flow volatility resulting from changes in market conditions. During the ninesix months ended SeptemberJune 30, 20172019 and 2016,2018, net cash used in financing activities was $1.9$8.0 billion and $13.2$7.9 billion, respectively.
During the ninesix months ended SeptemberJune 30, 2017,2019, our net cash used in financing activities of $1.9$8.0 billion was primarily driven by repayments, redemptions and repurchases of long-term borrowings and capitalfinance lease obligations of $16.5$9.6 billion, $7.1 billion paid in cash dividends of $5.0 billion, and net debt related costsrepayments of $2.2asset-backed long-term borrowings of $2.8 billion. These uses of cash were partially offset by proceeds from long-term borrowings of $21.9$6.2 billion and proceeds from asset-backed long-term borrowings of $2.9$4.0 billion.
Proceeds from and Repayments of Long-Term Borrowings
At SeptemberJune 30, 2017,2019, our total debt increased to $117.5$113.4 billion, compared to $108.1$113.1 billion at December 31, 2016.2018. During the ninesix months ended SeptemberJune 30, 20172019 and 2016,2018, our effective interest rate was 4.7% and 4.8%, respectively.. See Note 46 to the condensed consolidated financial statements for additional information regarding our debt activity.
Verizon may continue to acquire debt securities issued by Verizon and its affiliates in the future through open market purchases, privately negotiated transactions, tender offers, exchange offers, or otherwise, upon such terms and at such prices as Verizon may from time to time determine for cash or other consideration.
Asset-Backed Debt
As of September 30, 2017, the carrying value of our asset-backed debt was $7.9 billion. Our asset-backed debt includes notes (the Asset-Backed Notes) issued to third-party investors (Investors) and loans (ABS Financing Facility) received from banks and their conduit facilities (collectively, the Banks). Our consolidated asset-backed securitization bankruptcy remote legal entities (each, an ABS Entity or collectively, the ABS Entities) issue the debt or are otherwise party to the transaction documentation in connection with our asset-backed debt transactions. Under the terms of our asset-backed debt, we transfer device payment plan agreement receivables from Cellco Partnership and certain other affiliates of Verizon (collectively, the Originators) to one of the ABS Entities, which in turn transfers such receivables to another ABS Entity that issues the debt. Verizon entities retain the equity interests in the ABS Entities, which represent the rights to all funds not needed to make required payments on the asset-backed debt and other related payments and expenses.
Our asset-backed debt is secured by the transferred device payment plan agreement receivables and future collections on such receivables. The device payment plan agreement receivables transferred to the ABS Entities and related assets, consisting primarily of restricted cash, will only be available for payment of asset-backed debt and expenses related thereto, payments to the Originators in respect of additional transfers of device payment plan agreement receivables, and other obligations arising from our asset-backed debt transactions, and will not be available to pay other obligations or claims of Verizon’s creditors until the associated asset-backed debt and other obligations are satisfied. The Investors or Banks, as applicable, which hold our asset-backed debt have legal recourse to the assets securing the debt, but do not have any recourse to Verizon with respect to the payment of principal and interest on the debt. Under a parent support agreement, Verizon has agreed to guarantee certain of the payment obligations of Cellco Partnership and the Originators to the ABS Entities.
Cash collections on the device payment plan agreement receivables collateralizing asset-backed debt securities are required at certain specified times to be placed into segregated accounts. Deposits to the segregated accounts are considered restricted cash and are included in Prepaid expenses and other and Other assets onin our condensed consolidated balance sheets.
Proceeds from our asset-backed debt transactions deposits to the segregated accounts and payments to the Originators in respect of additional transfers of device payment plan agreement receivables are reflected in Cash flows from financing activities in our condensed consolidated statements of cash flows. Repayments of our asset-backed debt and related interest payments made from the segregated accounts are non-cash activities and therefore not reflected within Cash flows from financing activities in our condensed consolidated statements of cash flows. The asset-backed debt issued and the assets securing this debt are included onin our condensed consolidated balance sheets.
See Note 6 to the consolidated financial statements for additional information.
Other, net
Other, net financing activities during the ninesix months ended SeptemberJune 30, 20172019 includes net debt related costs$526 million premium paid due to early extinguishment of $2.2 billion.debt.
Credit Facilities
As of SeptemberJune 30, 2017,2019, the unused borrowing capacity under our $9.0$9.5 billion credit facility was approximately $8.9$9.4 billion. The credit facility does not require us to comply with financial covenants or maintain specified credit ratings, and it permits us to borrow even if our business has incurred a material adverse change. We use the credit facility for the issuance of letters of credit and for general corporate purposes.
We had fully drawn from theIn March 2016, we entered into a $1.0 billion equipment credit facility entered into in March 2016 insured by Eksportkreditnamnden, Stockholm, Sweden (EKN), the Swedishan export credit agency.agency with a maturity date of December 2024. As of SeptemberJune 30, 2017, we had an2019, the outstanding balance of $0.9 billion to repay.was $647 million. We used this credit facility to finance network equipment-related purchases.
In July 2017, we entered into equipment credit facilities insured by various export credit agencies providing us with the ability to borrow up to $4.0 billion to finance equipment-related purchases.purchases with maturity dates ranging from July 2022 to May 2027. The facilities have multiple borrowings available, portions of which extend through October 2019 contingent upon the amount of eligible equipment-related purchases made by Verizon. At Septemberthat we make. During the three and six months ended June 30, 2017,2019, we have not drawn ondrew $450 million and $874 million, respectively from these facilities. As of June 30, 2019, we had an outstanding balance of $3.5 billion.
Dividends
As in prior periods, dividend payments were a significant use of capital resources. During the third quarter of 2017, Verizon's Board of Directors increased our quarterly dividend payments by 2.2% to $0.5900 per share from $0.5775 per share in the prior year period. During the nine months ended September 30, 2017, weWe paid $7.1$5.0 billion and $4.8 billion in cash dividends.dividends during the six months ended June 30, 2019 and 2018, respectively.
Covenants
Our credit agreements contain covenants that are typical for large, investment grade companies. These covenants include requirements to pay interest and principal in a timely fashion, pay taxes, maintain insurance with responsible and reputable insurance companies, preserve our corporate existence, keep appropriate books and records of financial transactions, maintain our properties, provide financial and other reports to our lenders, limit pledging and disposition of assets and mergers and consolidations, and other similar covenants.
We and our consolidated subsidiaries are in compliance with all of our financial and restrictive covenants.
|
|
Change In Cash, Cash Equivalents and Restricted Cash and Cash Equivalents |
Our Cash and cash equivalents at SeptemberJune 30, 20172019 totaled $4.5$1.9 billion, a $1.6 billion increase$796 million decrease compared to Cash and cash equivalents at December 31, 2016,2018, primarily as a result of the factors discussed above.
Restricted cash totaled $1.2 billion at both June 30, 2019 and December 31, 2018, primarily related to cash collections on the device payment plan agreement receivables that are required at certain specified times to be placed into segregated accounts.
Free Cash Flow
Free cash flow is a non-GAAP financial measure that reflects an additional way of viewing our liquidity that, when viewed with our GAAP results, provides a more complete understanding of factors and trends affecting our cash flows. Free cash flow is calculated by subtracting capital expenditures from net cash provided by operating activities. We believe it is a more conservative measure of cash flow since purchases of fixed assets are necessary for ongoing operations. Free cash flow has limitations due to the fact that it does not represent the residual cash flow available for discretionary expenditures. For example, free cash flow does not incorporate payments made on capitalfinance lease obligations or cash payments for business acquisitions. Therefore, we believe it is important to view free cash flow as a complement to our entire condensed consolidated statements of cash flows. Free cash flow is calculated by subtracting capital expenditures from net cash provided by operating activities.
The following table reconciles net cash provided by operating activities to Freefree cash flow:
| | | | Nine Months Ended | | | | Six Months Ended | | | |
| | September 30, | | | | June 30, | | | |
| (dollars in millions) | 2017 |
| | 2016 |
| | Change |
| 2019 |
| | 2018 |
| | Change |
|
| Net cash provided by operating activities | $ | 17,221 |
| | $ | 17,724 |
| | $ | (503 | ) | $ | 15,836 |
| | $ | 16,433 |
| | $ | (597 | ) |
| Less Capital expenditures (including capitalized software) | 11,282 |
| | 11,398 |
| | (116 | ) | 7,967 |
| | 7,838 |
| | 129 |
|
| Free cash flow | $ | 5,939 |
| | $ | 6,326 |
| | $ | (387 | ) | $ | 7,869 |
| | $ | 8,595 |
| | $ | (726 | ) |
The changedecrease in Freefree cash flow during the ninesix months ended SeptemberJune 30, 2017,2019, compared to the similar period in 2016, was primarily due to our discretionary contributions to qualified pension plans2018, is a reflection of $3.4 billion (approximately $2.1 billion, net of tax benefit), the changedecrease in the method in which we monetize device payment plan receivables, as discussed below,operating cash flows and changes in working capital, partially offset by an increase in earnings. As a result of the discretionary pension contribution, our mandatory pension funding through 2020 is expected to be minimal, which will benefit future cash flows. Further, the funded status of our qualified pension plan is improved.capital expenditures discussed above.
During 2016, we changed the method in which we monetize device payment plan receivables from sales of device payment plan receivables, which were recorded within cash flows provided by operating activities, to asset-backed securitization transactions, which are recorded in cash flows from financing activities. During the nine months ended September 30, 2016, we received cash proceeds related to new sales of wireless device payment plan agreement receivables of approximately $2.0 billion. See Note 5 to the condensed consolidated financial statements for additional information. During the nine months ended September 30, 2017, we received proceeds from asset-backed securitization transactions of approximately $2.9 billion. See Note 4 to the condensed consolidated financial statements and “Cash Flows Used In Financing Activities” for additional information.
We are exposed to various types of market risk in the normal course of business, including the impact of interest rate changes, foreign currency exchange rate fluctuations, changes in investment, equity and commodity prices and changes in corporate tax rates. We employ risk management strategies, which may include the use of a variety of derivatives including, but not limited to, cross currency swaps, forward starting interest rate swaps, interest rate swaps, and interest rate caps.caps and foreign exchange forwards. We do not hold derivatives for trading purposes.
It is our general policy to enter into interest rate, foreign currency and other derivative transactions only to the extent necessary to achieve our desired objectives in optimizing exposure to various market risks. Our objectives include maintaining a mix of fixed and variable rate debt to lower borrowing costs within reasonable risk parameters and to protect against earnings and cash flow volatility resulting from changes in market conditions. We do not hedge our market risk exposure in a manner that would completely eliminate the effect of changes in interest rates and foreign exchange rates on our earnings.
Counterparties to our derivative contracts are also major financial institutions with whom we have negotiated derivatives agreements (ISDA master agreements) and credit support annex (CSA) agreements (CSA) which provide rules for collateral exchange. Our CSAs generally require collateralized arrangementsNegotiations and executions of new ISDA master agreements and CSA agreements with our counterparties in connection with uncleared derivatives, but as of September 30, 2017, we have entered into amendments to ourcontinued throughout 2018 and 2019. The newly executed CSA agreements with substantially all ofcontain rating based thresholds such that we or our counterparties that suspend the requirement for cashmay be required to hold or post collateral posting for a specified periodbased upon changes in outstanding positions as compared to established thresholds and changes in credit ratings. At June 30, 2019 we held approximately $0.1 billion and at December 31, 2018 we posted approximately $0.1 billion of time by both counterparties.collateral related to derivative contracts under collateral exchange arrangements, which were recorded as Other current liabilities and Prepaid expenses and other, respectively, in our condensed consolidated balance sheets. While we may be exposed to credit losses due to the nonperformance of our counterparties, we consider the risk remote and do not expect that any such nonperformance would result in a significant effect on our results of operations or financial condition due to our diversified pool of counterparties. During the first and second quarter of 2017, we paid an insignificant amount of cash to extend certain of such amendments to certain collateral exchange arrangements. As a result of the amendments to the CSA agreements, we did not post any collateral at September 30, 2017. At December 31, 2016, we posted collateral of approximately $0.2 billion related to derivative contracts under collateral exchange arrangements, which were recorded as Prepaid expenses and other in our condensed consolidated balance sheet. See Note 68 to the condensed consolidated financial statements for additional information regarding the derivative portfolio.
We are exposed to changes in interest rates, primarily on our short-term debt and the portion of long-term debt that carries floating interest rates. As of SeptemberJune 30, 2017,2019, approximately 76%78% of the aggregate principal amount of our total debt portfolio consisted of fixed rate indebtedness, including the effect of interest rate swap agreements designated as hedges. The impact of a 100 basis point100-basis-point change in interest rates affecting our floating rate debt would result in a change in annual interest expense, including our interest rate swap agreements that are designated as hedges, of approximately $0.3 billion.$258 million. The interest rates on substantially all of our existing long-term debt obligations are unaffected by changes to our credit ratings.
Interest Rate Swaps
We enter into interest rate swaps to achieve a targeted mix of fixed and variable rate debt. We principally receive fixed rates and pay variable rates based on the London Interbank Offered Rate, resulting in a net increase or decrease to Interest expense. These swaps are designated as fair value hedges and hedge against interest rate risk exposure of designated debt issuances. At SeptemberJune 30, 2017,2019, the fair value of the asset and liability of these contracts were $0.2 billion,$529 million and $189 million, respectively. At December 31, 2016,2018, the fair value of the asset and liability of these contracts were $0.1 billioninsignificant and $0.2 billion,$813 million, respectively. At SeptemberJune 30, 20172019 and December 31, 2016,2018, the total notional amount of the interest rate swaps was $20.2$19.1 billion and $13.1$19.8 billion, respectively.
Forward Starting Interest Rate Swaps
We have entered into forward starting interest rate swaps designated as cash flow hedges in order to manage our exposure to interest rate changes on future forecasted transactions. At June 30, 2019, the fair value of the liability of these contracts was $536 million. At December 31, 2018, the fair value of the liability of these contracts was $60 million. At June 30, 2019 and December 31, 2018, the total notional amount of the forward starting interest rate swaps was $3.0 billion and $4.0 billion, respectively.
Interest Rate Caps
We also have interest rate caps which we use as an economic hedge but for which we have elected not to apply hedge accounting. During 2016, we enteredWe enter into interest rate caps to mitigate our interest exposure to interest rate increases on our ABS Financing Facility.Facilities and ABS Notes. The fair value of the asset and liability of these contracts waswere insignificant at Septemberboth June 30, 20172019 and December 31, 2016, respectively.2018. At SeptemberJune 30, 20172019 and December 31, 2016,2018, the total notional value of these contracts was $2.8$1.3 billion and $2.5$2.2 billion, respectively.
|
|
| Foreign Currency Translation |
The functional currency for our foreign operations is primarily the local currency. The translation of income statement and balance sheet amounts of our foreign operations into U.S. dollars is recorded as cumulative translation adjustments, which are included in Accumulated other comprehensive income in our condensed consolidated balance sheets. Gains and losses on foreign currency transactions are recorded in the condensed consolidated statements of income in Other income (expense), net. At SeptemberJune 30, 2017,2019, our primary translation exposure was to the British Pound Sterling, Euro, Australian Dollar and Japanese Yen.
Cross Currency Swaps
We enterhave entered into cross currency swaps designated as cash flow hedges to exchange our British Pound Sterling, Euro, Swiss Franc and Australian Dollar-denominated debtcash flows into U.S. dollars and to fix our future interest and principalcash payments in U.S. dollars, as well as to mitigate the effectimpact of foreign currency transaction gains or losses. These swaps are designated as cash flow hedges. The fair value of the asset of these contracts was $0.3 billion$170 million at June 30, 2019 and insignificant $220 million
at SeptemberDecember 31, 2018. At June 30, 20172019 and December 31, 2016, respectively. At September 30, 2017 and December 31, 2016,2018, the fair value of the liability of these contracts was $1.1 billion$814 million and $1.8 billion,$536 million, respectively. At SeptemberJune 30, 20172019 and December 31, 2016,2018, the total notional amount of the cross currency swaps was $15.7$20.1 billion and $12.9$16.6 billion, respectively.
Foreign Exchange Forwards
We also have foreign exchange forwards which we use as an economic hedge but for which we have elected not to apply hedge accounting. We enter into British Pound Sterling and Euro foreign exchange forwards to mitigate our foreign exchange rate risk related to non-functional currency denominated monetary assets and liabilities of international subsidiaries. At June 30, 2019, the fair value of the asset of these contracts was insignificant. At June 30, 2019 and December 31, 2018, the total notional amount of the foreign exchange forwards was $1.0 billion and $600 million, respectively.
|
|
| Acquisitions and Divestitures |
Wireless
Spectrum License Transactions
From time to time, we enter into agreements to buy, sell or exchange spectrum licenses. We believe these spectrum license transactions have allowed us to continue to enhance the reliability of our wireless network, while also resulting in a more efficient use of spectrum. See Note 2 to the condensed consolidated financial statements for additional information regarding our spectrum license transactions.
Straight Path
On May 11, 2017, we entered into a purchase agreement to acquire Straight Path, a holder of millimeter wave spectrum configured for 5G wireless services, for consideration reflecting an enterprise value of approximately $3.1 billion. Under the terms of the purchase agreement, we agreed to pay (i) Straight Path shareholders $184.00 per share, payable in Verizon shares, and (ii) certain transaction costs payable in cash of approximately $0.7 billion, consisting primarily of a fee to be paid to the FCC. The acquisition is subject to customary regulatory approvals and closing conditions, and is expected to close by the end of the first quarter of 2018.
Wireline
XO Holdings
In February 2016, we entered into a purchase agreement to acquire XO, which owns and operates one of the largest fiber-based IP and Ethernet networks. Concurrently, we entered into a separate agreement to lease certain wireless spectrum from a wholly-owned subsidiary of XO Holdings that holds its wireless spectrum, which included an option, subject to certain conditions, to buy the subsidiary. In February 2017, we completed our acquisition of XO for total cash consideration of approximately $1.8 billion, of which $0.1 billion was paid in 2015. In April 2017, we exercised our option to buy the subsidiary for approximately $0.2 billion, subject to certain adjustments. The transaction is subject to customary regulatory approvals and is expected to close by the end of 2017. Upon closing, the spectrum acquired as part of the transaction will be used for our 5G technology deployment.
Data Center Sale
On December 6, 2016, we entered into a definitive agreement, which was subsequently amended on March 21, 2017, with Equinix pursuant to which we agreed to sell 23 customer-facing data center sites in the U.S. and Latin America, for approximately $3.6 billion, subject to certain adjustments. The transaction closed on May 1, 2017.
WideOpenWest, Inc.
On August 1, 2017, we entered into a definitive agreement to purchase certain fiber-optic network assets in the Chicago market from WOW!, a leading provider of communications services. The transaction is expected to close by the end of 2017. In addition, the parties entered into a separate agreement pursuant to which WOW! will complete the build-out of the network assets by the second half of 2018. The total cash consideration for the transactions is expected to be approximately $0.3 billion.
Other
Acquisition of Yahoo! Inc.’s Operating Business
On July 23, 2016, Verizon entered into a stock purchase agreement with Yahoo. Pursuant to the Purchase Agreement, upon the terms and subject to the conditions thereof, we agreed to acquire the stock of one or more subsidiaries of Yahoo holding all of Yahoo’s operating business, for approximately $4.83 billion in cash, subject to certain adjustments.
On February 20, 2017, Verizon and Yahoo entered into an amendment to the Purchase Agreement, pursuant to which the Transaction purchase price was reduced by $350 million to approximately $4.48 billion in cash, subject to certain adjustments. Subject to certain exceptions, the parties also agreed that certain user security and data breaches incurred by Yahoo (and the losses arising therefrom) were to be disregarded (1) for purposes of specified conditions to Verizon’s obligations to close the Transaction and (2) in determining whether a “Business Material Adverse Effect” under the Purchase Agreement has occurred.
Concurrently with the amendment of the Purchase Agreement, Yahoo and Yahoo Holdings, Inc., a wholly-owned subsidiary of Yahoo that Verizon agreed to purchase pursuant to the Transaction, also entered into an amendment to the related reorganization agreement, pursuant to which Yahoo (which changed its name to Altaba Inc. following the closing of the Transaction) retains 50% of certain post-closing liabilities arising out of governmental or third-party investigations, litigations or other claims related to certain user security and data breaches incurred by Yahoo prior to its acquisition by Verizon, including an August 2013 data breach disclosed by Yahoo on December 14, 2016. At that time, Yahoo disclosed that more than one billion of the approximately three billion accounts existing in 2013 had likely been affected. In accordance with the original Transaction agreements, Yahoo will continue to retain 100% of any liabilities arising out of any shareholder lawsuits (including derivative claims) and investigations and actions by the SEC.
Prior to the closing of the Transaction, pursuant to a related reorganization agreement, Yahoo transferred all of the assets and liabilities constituting Yahoo’s operating business to the subsidiaries that we acquired in the Transaction. The assets that we acquired did not include Yahoo’s ownership interests in Alibaba, Yahoo! Japan and certain other investments, certain undeveloped land recently divested by Yahoo, certain non-core intellectual
property or its cash, other than the cash from its operating business we acquired. We received for our benefit and that of our current and certain future affiliates a non-exclusive, worldwide, perpetual, royalty-free license to all of Yahoo’s intellectual property that was not conveyed with the business.
On June 13, 2017, we completed the Transaction. The aggregate purchase consideration at the closing of the Transaction was approximately $4.8 billion.
On October 3 2017, based upon new intelligence that we received in connection with our integration of Yahoo's operating business, we disclosed that we believe that the August 2013 data breach previously disclosed by Yahoo affected all of its accounts.
Oath, our newly branded organization that combines Yahoo’s operating business with our existing Media business, is a diverse house of more than 50 media and technology brands that engages approximately a billion people around the world. We believe that the Transaction represents a critical step in growing the global scale needed for our digital media company and building the future of brands using powerful technology, trusted content and differentiated data. See Note 2 to the condensed consolidated financial statements for additional information.
Other
From time to time, we enter into strategic agreements to acquire various other businesses and investments. See Note 23 to the condensed consolidated financial statements for additional information.
|
|
| Other Factors That May Affect Future Results |
|
|
Regulatory and Competitive Trends |
In the “Regulatory and Competitive Trends” sectionTrends
There have been no material changes to Regulatory and Competitive Trends as previously disclosed in Part I, Item 1. “Business”I. "Business" included in our Annual Report on Form 10-K for the year ended December 31, 2016, we reported in the Privacy and Data Security subsection that the FCC released new privacy and data security rules in November 2016 that would have applied to all telecommunications services, including2018, except as a result of our fixed and mobile voice and broadband services. On April 3, 2017, the President signed into law a bill that nullifies those rules. We also reported in the Broadband subsection on the status of the FCC’s treatment of broadband Internet access services. In May 2017, the FCC released a notice proposing to reverse the 2015 Title II Order and return to “light touch” regulation of broadband internet access services. In addition, in the Intercarrier Compensation and Network Access subsection, we noted that the FCC regulates some of the rates that carriers pay each other for the exchange of voice traffic over different networks and other aspects of interconnection for some voice services, as well as some of the rates and terms and conditions for certain wireline “business data services” and other services and network facilities. Verizon is both a seller and a buyer of these services, and both makes and receives interconnection payments. In April 2017, the FCC issued an order, which is currently under appeal that revised the regulatory structure for business data services, eliminating tariffing obligations and ex ante price regulations in markets the FCC determined to be competitive.segment realignment.
Reserves have been established to cover environmental matters relating to discontinued businesses and past telecommunications activities. These reserves include funds to address contamination at the site of a former Sylvania facility in Hicksville, NY, which had processed nuclear fuel rods in the 1950s and 1960s. In September 2005, the Army Corps of Engineers (ACE) accepted the site into its Formerly Utilized Sites Remedial Action Program. As a result, the ACE has taken primary responsibility for addressing the contamination at the site. An adjustment to the reserves may be made after a cost allocation is conducted with respect to the past and future expenses of all of the parties. Adjustments to the environmental reserve may also be made based upon the actual conditions found at other sites requiring remediation.
|
|
| Recently Issued Accounting Standards |
See Note 1 to the condensed consolidated financial statements for a discussion of recently issued accounting standard updates not yet adopted as of SeptemberJune 30, 2017.2019.
|
|
| Cautionary Statement Concerning Forward-Looking Statements |
In this report we have made forward-looking statements. These statements are based on our estimates and assumptions and are subject to risks and uncertainties. Forward-looking statements include the information concerning our possible or assumed future results of operations. Forward-looking statements also include those preceded or followed by the words “anticipates,” “believes,” “estimates,” “hopes”"anticipates," "believes," "estimates," "expects," "hopes" or similar expressions. For those statements, we claim the protection of the safe harbor for forward-looking statements contained in the Private Securities Litigation Reform Act of 1995. We undertake no obligation to revise or publicly release the results of any revision to these forward-looking statements, except as required by law. Given these risks and uncertainties, readers are cautioned not to place undue reliance on such forward-looking statements.
The following important factors, along with those discussed elsewhere in this report and in other filings with the Securities and Exchange Commission (SEC), could affect future results and could cause those results to differ materially from those expressed in the forward-looking statements:
adverse conditions in the U.S. and international economies;
the effects of competition in the markets in which we operate;
material changes in technology or technology substitution;
disruption of our key suppliers’ provisioning of products or services;
changes in the regulatory environment in which we operate, including any increase in restrictions on our ability to operate our networks;
breaches of network or information technology security, natural disasters, terrorist attacks or acts of war or significant litigation and any resulting financial impact not covered by insurance;
our high level of indebtedness;
an adverse change in the ratings afforded our debt securities by nationally accredited ratings organizations or adverse conditions in the credit markets affecting the cost, including interest rates, and/or availability of further financing;
material adverse changes in labor matters, including labor negotiations, and any resulting financial and/or operational impact;
significant increases in benefit plan costs or lower investment returns on plan assets;
changes in tax laws or treaties, or in their interpretation;
changes in accounting assumptions that regulatory agencies, including the SEC, may require or that result from changes in the accounting rules or their application, which could result in an impact on earnings;
the inability to implement our business strategies; and
the inability to realize the expected benefits of strategic transactions.
|
|
| Item 3. Quantitative and Qualitative Disclosures About Market Risk |
Information relating to market risk is included in Item 2, Management’s Discussion and Analysis of Financial Condition and Results of Operations under the caption “Market"Market Risk.”"
|
|
| Item 4. Controls and Procedures |
Our chief executive officerChief Executive Officer and chief financial officerChief Financial Officer have evaluated the effectiveness of the registrant’s disclosure controls and procedures (as defined in Rules 13a-15(e) and 15d-15(e) of the Securities Exchange Act of 1934), as of the end of the period covered by this quarterly report, that ensure that information relating to the registrant which is required to be disclosed in this report is recorded, processed, summarized and reported within required time periods using the criteria for effective internal control established in Internal Control–Integrated Framework issued by the Committee of Sponsoring Organizations of the Treadway Commission in 2013. Based on this evaluation, our chief executive officerChief Executive Officer and chief financial officerChief Financial Officer have concluded that the registrant’s disclosure controls and procedures were effective as of SeptemberJune 30, 2017.2019.
In the ordinary course of business, we routinely review our system of internal control over financial reporting and make changes to our systems and processes that are intended to ensure an effective internal control environment. ThereWe modified certain internal controls in connection with the new segment reporting structure, which was effective as of April 1, 2019. Other than the above-noted change, there were no changes in the Company’s internal control over financial reporting during the thirdsecond quarter of 20172019 that have materially affected, or are reasonably likely to materially affect, our internal control over financial reporting.
|
|
| Part II – Other Information |
|
|
| Item 1. Legal Proceedings |
In October 2013, the California Attorney General’s Office notified Verizon California Inc. and othercertain Verizon companies of potential violations of California state hazardous waste statutes primarily arising from the disposal of electronic components, batteries and aerosol cans at certain California facilities. We are cooperating with this investigation and continue to review our operations relating to the management of hazardous waste. While penalties relating to the alleged violations could exceed $100,000, we do not expect that any penalties ultimately incurred will be material. On April 1, 2016, we completed
See Note 12 to the sale to Frontier of our landline business operated by Verizon California Inc. and certain other Verizon landline companies. As a result of this transaction, Frontier now owns and operates Verizon California Inc. and has assumed the liabilities of Verizon California Inc. that may arise as a result of these alleged violations.condensed consolidated financial statements for additional information regarding legal proceedings.
There have been no material changes to our risk factors as previously disclosed in Part I, Item 1A. ofincluded in our Annual Report on Form 10-K10‑K for the year ended December 31, 2016.2018.
|
|
| Item 2. Unregistered Sales of Equity Securities and Use of Proceeds |
OnIn March 3, 2017, the Verizon Board of Directors authorized a new share buyback program to repurchase up to 100 million shares of the Company’s common stock. The new program will terminate when the aggregate number of shares purchased reaches 100 million, or at the close of business on February 28, 2020, whichever is sooner. Under the program, shares may be repurchased in privately negotiated transactions and on the open market, including through plans complying with Rule 10b5-1(c) under the Exchange Act. The timing and number of shares purchased under the program, if any, will depend on market conditions and the Company’s capital allocation priorities.
Verizon did not repurchase any shares of Verizon common stock during the three months ended SeptemberJune 30, 2017.2019. At SeptemberJune 30, 2017,2019, the maximum number of shares that could be purchased by or on behalf of Verizon under our share buyback program was 100 million.
|
| | |
Exhibit Number | | Description |
| | |
12 | | Computation of Ratio of Earnings to Fixed Charges. |
| | |
| 31.1 | | Certification of Chief Executive Officer pursuant to Section 302 of the Sarbanes-Oxley Act of 2002. |
| | |
| 31.2 | | Certification of Chief Financial Officer pursuant to Section 302 of the Sarbanes-Oxley Act of 2002. |
| | |
| 32.1 | | Certification of Chief Executive Officer pursuant to Section 906 of the Sarbanes-Oxley Act of 2002. |
| | |
| 32.2 | | Certification of Chief Financial Officer pursuant to Section 906 of the Sarbanes-Oxley Act of 2002. |
| | |
| 101.INS | | XBRL Instance Document.Document - the instance document does not appear in the interactive data file because its XBRL tags are embedded within the inline XBRL document. |
| | |
| 101.SCH | | XBRL Taxonomy Extension Schema Document. |
| | |
| 101.PRE | | XBRL Taxonomy Presentation Linkbase Document. |
| | |
| 101.CAL | | XBRL Taxonomy Calculation Linkbase Document. |
| | |
| 101.LAB | | XBRL Taxonomy Label Linkbase Document. |
| | |
| 101.DEF | | XBRL Taxonomy Extension Definition Linkbase Document. |
| |
| 104 | | Cover Page Interactive Data File (formatted as inline XBRL with applicable taxonomy extension information contained in Exhibits 101). |
Pursuant to the requirements of the Securities Exchange Act of 1934, the registrant has duly caused this report to be signed on its behalf by the undersigned thereunto duly authorized.
|
| | | | |
| | | VERIZON COMMUNICATIONS INC. |
| | | |
Date: October 26, 2017August 8, 2019 | | By | | /s/ Anthony T. Skiadas |
| | | | | Anthony T. Skiadas |
| | | | | Senior Vice President and Controller |
| | | | | (Principal Accounting Officer) |
Exhibit Index
|
| | |
Exhibit Number | | Description |
| | |
| | Computation of Ratio of Earnings to Fixed Charges. |
| |
| | Certification of Chief Executive Officer pursuant to Section 302 of the Sarbanes-Oxley Act of 2002. |
| | |
| | Certification of Chief Financial Officer pursuant to Section 302 of the Sarbanes-Oxley Act of 2002. |
| | |
| | Certification of Chief Executive Officer pursuant to Section 906 of the Sarbanes-Oxley Act of 2002. |
| | |
| | Certification of Chief Financial Officer pursuant to Section 906 of the Sarbanes-Oxley Act of 2002. |
| | |
| 101.INS | | XBRL Instance Document.Document - the instance document does not appear in the interactive data file because its XBRL tags are embedded within the inline XBRL document. |
| | |
| 101.SCH | | XBRL Taxonomy Extension Schema Document. |
| | |
| 101.PRE | | XBRL Taxonomy Presentation Linkbase Document. |
| | |
| 101.CAL | | XBRL Taxonomy Calculation Linkbase Document. |
| | |
| 101.LAB | | XBRL Taxonomy Label Linkbase Document. |
| | |
| 101.DEF | | XBRL Taxonomy Extension Definition Linkbase Document. |
| | |
| 104 | | Cover Page Interactive Data File (formatted as inline XBRL with applicable taxonomy extension information contained in Exhibits 101). |
| | |