UNITED STATES
SECURITIES AND EXCHANGE COMMISSION
Washington, D.C. 20549
FORM 10-Q
| | | | | | | | |
| (Mark one) | | |
| ☒ | QUARTERLY REPORT PURSUANT TO SECTION 13 OR 15(d)
OF THE SECURITIES EXCHANGE ACT OF 1934 | |
For the quarterly period ended June 30, 20202021
OR
| | | | | | | | |
| ☐ | TRANSITION REPORT PURSUANT TO SECTION 13 OR 15(d)
OF THE SECURITIES EXCHANGE ACT OF 1934 | |
| | |
| For the transition period from to | |
Commission file number: 1-8606
Verizon Communications Inc.
(Exact name of registrant as specified in its charter)
| | | | | | | | |
| Delaware | | 23-2259884 |
(State or other jurisdiction
of incorporation or organization) | | (I.R.S. Employer Identification No.) |
| | | | | | | | | | | |
| 1095 Avenue of the Americas | | | 10036 |
| New York, | New York | | |
| (Address of principal executive offices) | | | (Zip Code) |
Registrant’s telephone number, including area code: (212) 395-1000
Securities registered pursuant to Section 12(b) of the Act:
| | | | | | | | | | | | | | |
| Title of Each Class | | Trading Symbol(s) | | Name of Each Exchange on Which Registered |
| Common Stock, par value $0.10 | | VZ | | New York Stock Exchange |
| Common Stock, par value $0.10 | | VZ | | The NASDAQ Global Select Market |
| 1.625% Notes due 2024 | | VZ24B | | New York Stock Exchange |
| 4.073% Notes due 2024 | | VZ24C | | New York Stock Exchange |
| 0.875% Notes due 2025 | | VZ25 | | New York Stock Exchange |
| 3.250% Notes due 2026 | | VZ26 | | New York Stock Exchange |
| 1.375% Notes due 2026 | | VZ26B | | New York Stock Exchange |
| 0.875% Notes due 2027 | | VZ27E | | New York Stock Exchange |
| 1.375% Notes due 2028 | | VZ28 | | New York Stock Exchange |
| 1.125% Notes due 2028 | | VZ28A | | New York Stock Exchange |
| 2.350% Fixed Rate Notes due 2028 | | VZ28C | | New York Stock Exchange |
| 1.875% Notes due 2029 | | VZ29B | | New York Stock Exchange |
| 0.375% Notes due 2029 | | VZ29D | | New York Stock Exchange |
| 1.250% Notes due 2030 | | VZ30 | | New York Stock Exchange |
| 1.875% Notes due 2030 | | VZ30A | | New York Stock Exchange |
| 2.625% Notes due 2031 | | VZ31 | | New York Stock Exchange |
| 2.500% Notes due 2031 | | VZ31A | | New York Stock Exchange |
| 3.000% Fixed Rate Notes due 2031 | | VZ31D | | New York Stock Exchange |
| 0.875% Notes due 2032 | | VZ32 | | New York Stock Exchange |
| 0.750% Notes due 2032 | | VZ32A | | New York Stock Exchange |
| 1.300% Notes due 2033 | | VZ33B | | New York Stock Exchange |
| 4.750% Notes due 2034 | | VZ34 | | New York Stock Exchange |
| 3.125% Notes due 2035 | | VZ35 | | New York Stock Exchange |
| 1.125% Notes due 2035 | | VZ35A | | New York Stock Exchange |
| 3.375% Notes due 2036 | | VZ36A | | New York Stock Exchange |
| 2.875% Notes due 2038 | | VZ38B | | New York Stock Exchange |
| 1.875% Notes due 2038 | | VZ38C | | New York Stock Exchange |
| 1.500% Notes due 2039 | | VZ39C | | New York Stock Exchange |
| 3.500% Fixed Rate Notes due 2039 | | VZ39D | | New York Stock Exchange |
| 1.850% Notes due 2040 | | VZ40 | | New York Stock Exchange |
| 3.850% Fixed Rate Notes due 2041 | | VZ41C | | New York Stock Exchange |
Indicate by check mark whether the registrant (1) has filed all reports required to be filed by Section 13 or 15(d) of the Securities Exchange Act of 1934 during the preceding 12 months (or for such shorter period that the registrant was required to file such reports), and (2) has been subject to such filing requirements for the past 90 days. ☒ Yes ☐ No
Indicate by check mark whether the registrant has submitted electronically every Interactive Data File required to be submitted pursuant to Rule 405 of Regulation S-T (§232.405 of this chapter) during the preceding 12 months (or for such shorter period that the registrant was required to submit such files). ☒ Yes ☐ No
| | | | | | | | | | | | | | | | | |
| Indicate by check mark whether the registrant is a large accelerated filer, an accelerated filer, a non-accelerated filer, a smaller reporting company, or an emerging growth company. See the definitions of "large accelerated filer," "accelerated filer," "smaller reporting company," and "emerging growth company" in Rule 12b-2 of the Exchange Act. | | | | | |
| | | | | |
| Large accelerated filer | ☒ | | Accelerated filer | ☐ |
| Non-accelerated filer | ☐ | | Smaller reporting company | ☐ |
| | | | Emerging growth company | ☐ |
If an emerging growth company, indicate by check mark if the registrant has elected not to use the extended transition period for complying with any new or revised financial accounting standards provided pursuant to Section 13(a) of the Exchange Act. ☐
Indicate by check mark whether the registrant is a shell company (as defined in Rule 12b-2 of the Exchange Act). ☐ Yes ☒ No
At June 30, 2020, 4,138,053,8702021, 4,140,116,007 shares of the registrant’s common stock were outstanding, after deducting 153,379,776151,317,639 shares held in treasury.
| | | | | | | | |
| Item No. | | Page |
| | |
| | |
| | |
| Item 1. | | |
| | |
| | |
| Three and six months ended June 30, 20202021 and 20192020 | |
| | |
| | |
| Three and six months ended June 30, 20202021 and 20192020 | |
| | |
| | |
| At June 30, 20202021 and December 31, 20192020 | |
| | |
| | |
| Six months ended June 30, 20202021 and 20192020 | |
| | |
| | |
| | |
| Item 2. | | |
| | |
| Item 3. | | |
| | |
| Item 4. | | |
| | |
| | |
| | |
| Item 1. | | |
| | |
| Item 1A. | | |
| | |
| Item 2. | | |
| | |
| Item 6. | | |
| | |
| | |
| | |
| | |
| | |
| Part I - Financial Information |
| | |
| Item 1. Financial Statements (Unaudited) |
| | |
Condensed Consolidated Statements of Income |
| Verizon Communications Inc. and Subsidiaries |
| | | Three Months Ended | | | Six Months Ended | | | Three Months Ended | | Six Months Ended |
| | | June 30, | | | June 30, | | | June 30, | | June 30, |
| (dollars in millions, except per share amounts) (unaudited) | (dollars in millions, except per share amounts) (unaudited) | 2020 | | 2019 | | 2020 | | 2019 | (dollars in millions, except per share amounts) (unaudited) | 2021 | | 2020 | | 2021 | | 2020 |
| | Operating Revenues | Operating Revenues | | Operating Revenues | |
| Service revenues and other | Service revenues and other | $ | 26,692 | | | $ | 27,351 | | | $ | 54,173 | | | $ | 54,548 | | Service revenues and other | $ | 28,221 | | | $ | 26,692 | | | $ | 56,144 | | | $ | 54,173 | |
| Wireless equipment revenues | Wireless equipment revenues | 3,755 | | | 4,720 | | | 7,884 | | | 9,651 | | Wireless equipment revenues | 5,543 | | | 3,755 | | | 10,487 | | | 7,884 | |
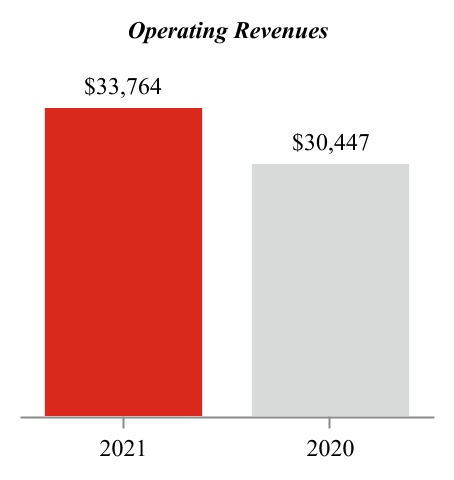
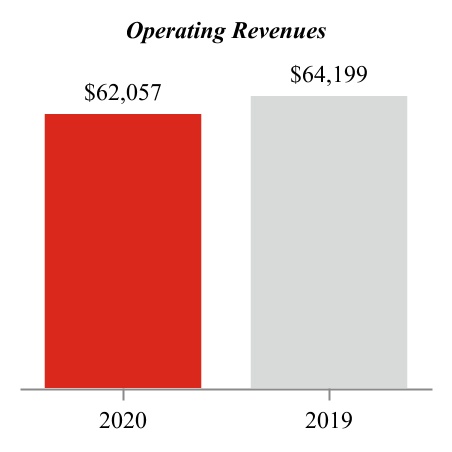
| Total Operating Revenues | Total Operating Revenues | 30,447 | | | 32,071 | | | 62,057 | | | 64,199 | | Total Operating Revenues | 33,764 | | | 30,447 | | | 66,631 | | | 62,057 | |
| | Operating Expenses | Operating Expenses | | Operating Expenses | |
| Cost of services (exclusive of items shown below) | Cost of services (exclusive of items shown below) | 7,639 | | | 7,702 | | | 15,393 | | | 15,494 | | Cost of services (exclusive of items shown below) | 8,324 | | | 7,639 | | | 16,344 | | | 15,393 | |
| Cost of wireless equipment | Cost of wireless equipment | 4,110 | | | 5,019 | | | 8,652 | | | 10,217 | | Cost of wireless equipment | 5,931 | | | 4,110 | | | 11,433 | | | 8,652 | |
| Selling, general and administrative expense | Selling, general and administrative expense | 7,156 | | | 7,268 | | | 15,741 | | | 14,466 | | Selling, general and administrative expense | 7,324 | | | 7,156 | | | 14,725 | | | 15,741 | |
| Depreciation and amortization expense | Depreciation and amortization expense | 4,181 | | | 4,232 | | | 8,331 | | | 8,463 | | Depreciation and amortization expense | 4,020 | | | 4,181 | | | 8,194 | | | 8,331 | |
| Total Operating Expenses | Total Operating Expenses | 23,086 | | | 24,221 | | | 48,117 | | | 48,640 | | Total Operating Expenses | 25,599 | | | 23,086 | | | 50,696 | | | 48,117 | |
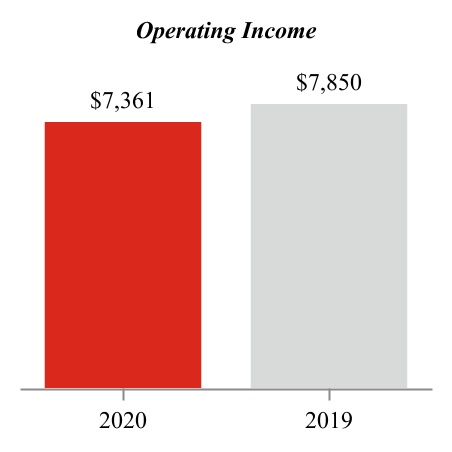
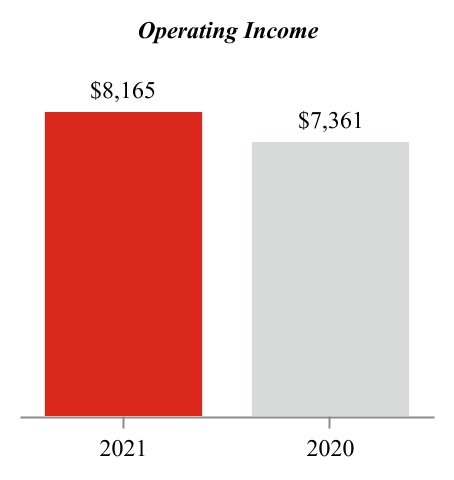
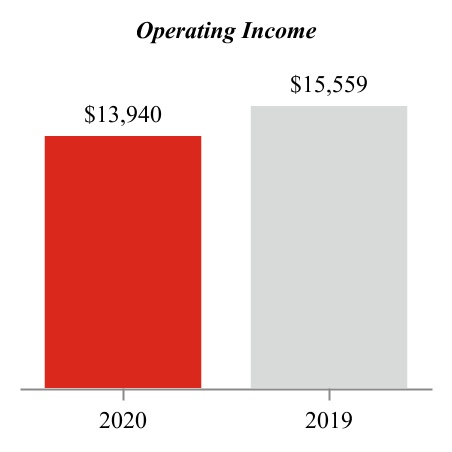
| | Operating Income | Operating Income | 7,361 | | | 7,850 | | | 13,940 | | | 15,559 | | Operating Income | 8,165 | | | 7,361 | | | 15,935 | | | 13,940 | |
| Equity in losses of unconsolidated businesses | (13) | | | (13) | | | (25) | | | (19) | | |
| Equity in earnings (losses) of unconsolidated businesses | | Equity in earnings (losses) of unconsolidated businesses | 1 | | | (13) | | | 9 | | | (25) | |
| Other income (expense), net | Other income (expense), net | (72) | | | (1,312) | | | 71 | | | (1,017) | | Other income (expense), net | 502 | | | (72) | | | 903 | | | 71 | |
| Interest expense | Interest expense | (1,089) | | | (1,215) | | | (2,123) | | | (2,425) | | Interest expense | (844) | | | (1,089) | | | (1,945) | | | (2,123) | |
| Income Before Provision For Income Taxes | Income Before Provision For Income Taxes | 6,187 | | | 5,310 | | | 11,863 | | | 12,098 | | Income Before Provision For Income Taxes | 7,824 | | | 6,187 | | | 14,902 | | | 11,863 | |
| Provision for income taxes | Provision for income taxes | (1,348) | | | (1,236) | | | (2,737) | | | (2,864) | | Provision for income taxes | (1,875) | | | (1,348) | | | (3,575) | | | (2,737) | |
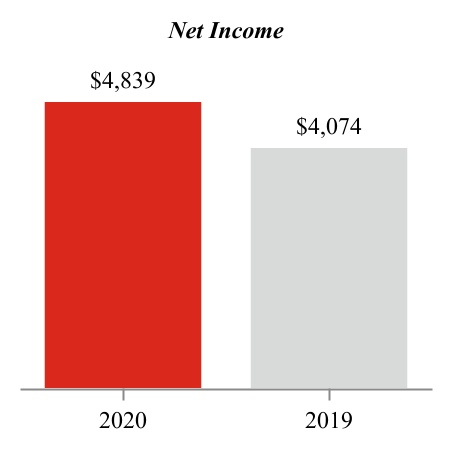
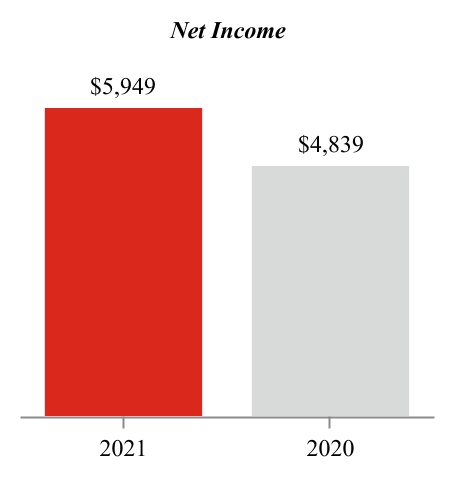
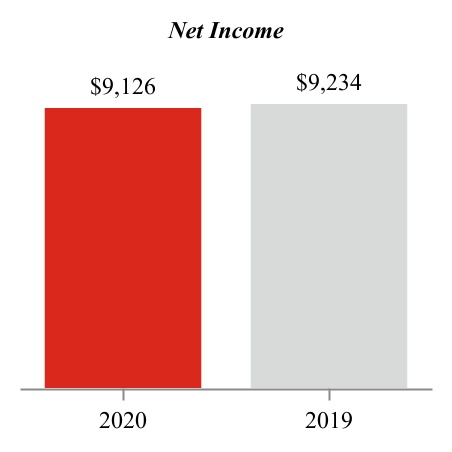
| Net Income | Net Income | $ | 4,839 | | | $ | 4,074 | | | $ | 9,126 | | | $ | 9,234 | | Net Income | $ | 5,949 | | | $ | 4,839 | | | $ | 11,327 | | | $ | 9,126 | |
| | Net income attributable to noncontrolling interests | Net income attributable to noncontrolling interests | $ | 139 | | | $ | 130 | | | $ | 270 | | | $ | 258 | | Net income attributable to noncontrolling interests | $ | 149 | | | $ | 139 | | | $ | 282 | | | $ | 270 | |
| Net income attributable to Verizon | Net income attributable to Verizon | 4,700 | | | 3,944 | | | 8,856 | | | 8,976 | | Net income attributable to Verizon | 5,800 | | | 4,700 | | | 11,045 | | | 8,856 | |
| Net Income | Net Income | $ | 4,839 | | | $ | 4,074 | | | $ | 9,126 | | | $ | 9,234 | | Net Income | $ | 5,949 | | | $ | 4,839 | | | $ | 11,327 | | | $ | 9,126 | |
| | Basic Earnings Per Common Share | Basic Earnings Per Common Share | | Basic Earnings Per Common Share | |
| Net income attributable to Verizon | Net income attributable to Verizon | $ | 1.14 | | | $ | 0.95 | | | $ | 2.14 | | | $ | 2.17 | | Net income attributable to Verizon | $ | 1.40 | | | $ | 1.14 | | | $ | 2.67 | | | $ | 2.14 | |
| Weighted-average shares outstanding (in millions) | Weighted-average shares outstanding (in millions) | 4,139 | | | 4,138 | | | 4,139 | | | 4,138 | | Weighted-average shares outstanding (in millions) | 4,141 | | | 4,139 | | | 4,141 | | | 4,139 | |
| | Diluted Earnings Per Common Share | Diluted Earnings Per Common Share | | Diluted Earnings Per Common Share | |
| Net income attributable to Verizon | Net income attributable to Verizon | $ | 1.13 | | | $ | 0.95 | | | $ | 2.14 | | | $ | 2.17 | | Net income attributable to Verizon | $ | 1.40 | | | $ | 1.13 | | | $ | 2.67 | | | $ | 2.14 | |
| Weighted-average shares outstanding (in millions) | Weighted-average shares outstanding (in millions) | 4,141 | | | 4,139 | | | 4,141 | | | 4,140 | | Weighted-average shares outstanding (in millions) | 4,143 | | | 4,141 | | | 4,143 | | | 4,141 | |
See Notes to Condensed Consolidated Financial Statements
| | |
Condensed Consolidated Statements of Comprehensive Income |
| Verizon Communications Inc. and Subsidiaries |
| | | | Three Months Ended | | | Six Months Ended | | | Three Months Ended | Six Months Ended |
| | June 30, | | | June 30, | | | June 30, |
| (dollars in millions) (unaudited) | (dollars in millions) (unaudited) | 2020 | | 2019 | | 2020 | | 2019 | (dollars in millions) (unaudited) | 2021 | | 2020 | 2021 | | 2020 |
| | Net Income | Net Income | $ | 4,839 | | | $ | 4,074 | | | $ | 9,126 | | | $ | 9,234 | | Net Income | $ | 5,949 | | | $ | 4,839 | | $ | 11,327 | | | $ | 9,126 | |
| Other Comprehensive Income (Loss), Net of Tax (Expense) Benefit | Other Comprehensive Income (Loss), Net of Tax (Expense) Benefit | | Other Comprehensive Income (Loss), Net of Tax (Expense) Benefit | |
| Foreign currency translation adjustments, net of tax of $4, $3, $0 and $(2) | 77 | | | (67) | | | (43) | | | (43) | | |
| Unrealized gain (loss) on cash flow hedges, net of tax of $(133), $193, $659 and $198 | 314 | | | (537) | | | (1,896) | | | (550) | | |
| Unrealized gain on marketable securities, net of tax of $(2), $0, $(1) and $(2) | 6 | | | 4 | | | 5 | | | 8 | | |
| Defined benefit pension and postretirement plans, net of tax of $55, $56, $111 and $112 | (169) | | | (169) | | | (338) | | | (338) | | |
| Foreign currency translation adjustments, net of tax of $(15), $4, $(7) and $0 | | Foreign currency translation adjustments, net of tax of $(15), $4, $(7) and $0 | 58 | | | 77 | | 20 | | | (43) | |
| Unrealized gain (loss) on cash flow hedges, net of tax of $294, $(133), $(46) and $659 | | Unrealized gain (loss) on cash flow hedges, net of tax of $294, $(133), $(46) and $659 | (777) | | | 314 | | 132 | | | (1,896) | |
| Unrealized gain (loss) on marketable securities, net of tax of $0, $(2), $1 and $(1) | | Unrealized gain (loss) on marketable securities, net of tax of $0, $(2), $1 and $(1) | 0 | | | 6 | | (5) | | | 5 | |
| Defined benefit pension and postretirement plans, net of tax of $52, $55, $103 and $111 | | Defined benefit pension and postretirement plans, net of tax of $52, $55, $103 and $111 | (155) | | | (169) | | (310) | | | (338) | |
| Other comprehensive income (loss) attributable to Verizon | Other comprehensive income (loss) attributable to Verizon | 228 | | | (769) | | | (2,272) | | | (923) | | Other comprehensive income (loss) attributable to Verizon | (874) | | | 228 | | (163) | | | (2,272) | |
| Total Comprehensive Income | Total Comprehensive Income | $ | 5,067 | | | $ | 3,305 | | | $ | 6,854 | | | $ | 8,311 | | Total Comprehensive Income | $ | 5,075 | | | $ | 5,067 | | $ | 11,164 | | | $ | 6,854 | |
| | Comprehensive income attributable to noncontrolling interests | Comprehensive income attributable to noncontrolling interests | $ | 139 | | | $ | 130 | | | $ | 270 | | | $ | 258 | | Comprehensive income attributable to noncontrolling interests | $ | 149 | | | $ | 139 | | $ | 282 | | | $ | 270 | |
| Comprehensive income attributable to Verizon | Comprehensive income attributable to Verizon | 4,928 | | | 3,175 | | | 6,584 | | | 8,053 | | Comprehensive income attributable to Verizon | 4,926 | | | 4,928 | | 10,882 | | | 6,584 | |
| Total Comprehensive Income | Total Comprehensive Income | $ | 5,067 | | | $ | 3,305 | | | $ | 6,854 | | | $ | 8,311 | | Total Comprehensive Income | $ | 5,075 | | | $ | 5,067 | | $ | 11,164 | | | $ | 6,854 | |
See Notes to Condensed Consolidated Financial Statements
| | |
Condensed Consolidated Balance Sheets |
| Verizon Communications Inc. and Subsidiaries |
| | | | At June 30, | | At December 31, | | At June 30, | | At December 31, |
| (dollars in millions, except per share amounts) (unaudited) | (dollars in millions, except per share amounts) (unaudited) | 2020 | | 2019 | (dollars in millions, except per share amounts) (unaudited) | 2021 | | 2020 |
| | Assets | Assets | | Assets | |
| Current assets | Current assets | | Current assets | |
| Cash and cash equivalents | Cash and cash equivalents | $ | 7,882 | | | $ | 2,594 | | Cash and cash equivalents | $ | 4,657 | | | $ | 22,171 | |
| Accounts receivable | Accounts receivable | 23,742 | | | 26,162 | | Accounts receivable | 22,237 | | | 25,169 | |
| Less Allowance for credit losses | Less Allowance for credit losses | 1,070 | | | — | | Less Allowance for credit losses | 980 | | | 1,252 | |
| Less Allowance for doubtful accounts | — | | | 733 | | |
| Accounts receivable, net (Note 1) | 22,672 | | | 25,429 | | |
| | Accounts receivable, net | | Accounts receivable, net | 21,257 | | | 23,917 | |
| Inventories | Inventories | 1,289 | | | 1,422 | | Inventories | 1,421 | | | 1,796 | |
| Prepaid expenses and other | Prepaid expenses and other | 5,490 | | | 8,028 | | Prepaid expenses and other | 8,291 | | | 6,710 | |
| Total current assets | Total current assets | 37,333 | | | 37,473 | | Total current assets | 35,626 | | | 54,594 | |
| | Property, plant and equipment | Property, plant and equipment | 272,714 | | | 265,734 | | Property, plant and equipment | 283,654 | | | 279,737 | |
| Less Accumulated depreciation | Less Accumulated depreciation | 179,960 | | | 173,819 | | Less Accumulated depreciation | 189,452 | | | 184,904 | |
| Property, plant and equipment, net | Property, plant and equipment, net | 92,754 | | | 91,915 | | Property, plant and equipment, net | 94,202 | | | 94,833 | |
| | Investments in unconsolidated businesses | Investments in unconsolidated businesses | 529 | | | 558 | | Investments in unconsolidated businesses | 560 | | | 589 | |
| Wireless licenses | Wireless licenses | 95,767 | | | 95,059 | | Wireless licenses | 98,034 | | | 96,097 | |
| Deposits for wireless licenses | | Deposits for wireless licenses | 45,910 | | | 2,772 | |
| Goodwill | Goodwill | 24,667 | | | 24,389 | | Goodwill | 24,915 | | | 24,773 | |
| Other intangible assets, net | Other intangible assets, net | 9,600 | | | 9,498 | | Other intangible assets, net | 7,002 | | | 9,413 | |
| Operating lease right-of-use assets | Operating lease right-of-use assets | 22,431 | | | 22,694 | | Operating lease right-of-use assets | 28,180 | | | 22,531 | |
| Other assets | Other assets | 10,178 | | | 10,141 | | Other assets | 14,761 | | | 10,879 | |
| Total assets | Total assets | $ | 293,259 | | | $ | 291,727 | | Total assets | $ | 349,190 | | | $ | 316,481 | |
| | Liabilities and Equity | Liabilities and Equity | | Liabilities and Equity | |
| Current liabilities | Current liabilities | | Current liabilities | |
| Debt maturing within one year | Debt maturing within one year | $ | 6,651 | | | $ | 10,777 | | Debt maturing within one year | $ | 7,023 | | | $ | 5,889 | |
| Accounts payable and accrued liabilities | Accounts payable and accrued liabilities | 19,297 | | | 21,806 | | Accounts payable and accrued liabilities | 17,328 | | | 20,658 | |
| Current operating lease liabilities | Current operating lease liabilities | 3,270 | | | 3,261 | | Current operating lease liabilities | 3,881 | | | 3,485 | |
| Other current liabilities | Other current liabilities | 9,668 | | | 9,024 | | Other current liabilities | 11,846 | | | 9,628 | |
| Total current liabilities | Total current liabilities | 38,886 | | | 44,868 | | Total current liabilities | 40,078 | | | 39,660 | |
| | Long-term debt | Long-term debt | 106,190 | | | 100,712 | | Long-term debt | 144,894 | | | 123,173 | |
| Employee benefit obligations | Employee benefit obligations | 17,821 | | | 17,952 | | Employee benefit obligations | 16,713 | | | 18,657 | |
| Deferred income taxes | Deferred income taxes | 33,798 | | | 34,703 | | Deferred income taxes | 37,534 | | | 35,711 | |
| Non-current operating lease liabilities | Non-current operating lease liabilities | 18,158 | | | 18,393 | | Non-current operating lease liabilities | 23,360 | | | 18,000 | |
| Other liabilities | Other liabilities | 14,293 | | | 12,264 | | Other liabilities | 11,499 | | | 12,008 | |
| Total long-term liabilities | Total long-term liabilities | 190,260 | | | 184,024 | | Total long-term liabilities | 234,000 | | | 207,549 | |
| | Commitments and Contingencies (Note 11) | | |
| Commitments and Contingencies (Note 12) | | Commitments and Contingencies (Note 12) | 0 | | 0 |
| | Equity | Equity | | Equity | |
| Series preferred stock ($0.10 par value; 250,000,000 shares authorized; NaN issued) | Series preferred stock ($0.10 par value; 250,000,000 shares authorized; NaN issued) | — | | | — | | Series preferred stock ($0.10 par value; 250,000,000 shares authorized; NaN issued) | 0 | | | 0 | |
| Common stock ($0.10 par value; 6,250,000,000 shares authorized in each period; 4,291,433,646 shares issued in each period) | 429 | | | 429 | | |
| Common stock ($0.10 par value; 6,250,000,000 shares authorized in each period; 4,291,433,646 shares issued) | | Common stock ($0.10 par value; 6,250,000,000 shares authorized in each period; 4,291,433,646 shares issued) | 429 | | | 429 | |
| Additional paid in capital | Additional paid in capital | 13,281 | | | 13,419 | | Additional paid in capital | 13,403 | | | 13,404 | |
| Retained earnings | Retained earnings | 56,746 | | | 53,147 | | Retained earnings | 66,310 | | | 60,464 | |
| Accumulated other comprehensive income (loss) | (1,274) | | | 998 | | |
| Common stock in treasury, at cost (153,379,776 and 155,605,527 shares outstanding) | (6,722) | | | (6,820) | | |
| Deferred compensation – employee stock ownership plans and other | 237 | | | 222 | | |
| Accumulated other comprehensive loss | | Accumulated other comprehensive loss | (234) | | | (71) | |
| Common stock in treasury, at cost (151,317,639 and 153,304,088 shares outstanding) | | Common stock in treasury, at cost (151,317,639 and 153,304,088 shares outstanding) | (6,632) | | | (6,719) | |
| Deferred compensation – employee stock ownership plans (ESOPs) and other | | Deferred compensation – employee stock ownership plans (ESOPs) and other | 408 | | | 335 | |
| Noncontrolling interests | Noncontrolling interests | 1,416 | | | 1,440 | | Noncontrolling interests | 1,428 | | | 1,430 | |
| Total equity | Total equity | 64,113 | | | 62,835 | | Total equity | 75,112 | | | 69,272 | |
| Total liabilities and equity | Total liabilities and equity | $ | 293,259 | | | $ | 291,727 | | Total liabilities and equity | $ | 349,190 | | | $ | 316,481 | |
See Notes to Condensed Consolidated Financial Statements
| | |
Condensed Consolidated Statements of Cash Flows |
| Verizon Communications Inc. and Subsidiaries |
| | | Six Months Ended | | | Six Months Ended |
| | | June 30, | | | June 30, |
| (dollars in millions) (unaudited) | (dollars in millions) (unaudited) | 2020 | | 2019 | (dollars in millions) (unaudited) | 2021 | | 2020 |
| | Cash Flows from Operating Activities | Cash Flows from Operating Activities | | Cash Flows from Operating Activities | |
| Net Income | Net Income | $ | 9,126 | | | $ | 9,234 | | Net Income | $ | 11,327 | | | $ | 9,126 | |
| Adjustments to reconcile net income to net cash provided by operating activities: | Adjustments to reconcile net income to net cash provided by operating activities: | | Adjustments to reconcile net income to net cash provided by operating activities: | |
| Depreciation and amortization expense | Depreciation and amortization expense | 8,331 | | | 8,463 | | Depreciation and amortization expense | 8,194 | | | 8,331 | |
| Employee retirement benefits | Employee retirement benefits | (32) | | | (294) | | Employee retirement benefits | (1,819) | | | (32) | |
| Deferred income taxes | Deferred income taxes | (120) | | | 588 | | Deferred income taxes | 1,978 | | | (120) | |
| Provision for expected credit losses | Provision for expected credit losses | 831 | | | 738 | | Provision for expected credit losses | 409 | | | 831 | |
| Equity in losses of unconsolidated businesses, net of dividends received | Equity in losses of unconsolidated businesses, net of dividends received | 46 | | | 50 | | Equity in losses of unconsolidated businesses, net of dividends received | 25 | | | 46 | |
| | Changes in current assets and liabilities, net of effects from acquisition/disposition of businesses | Changes in current assets and liabilities, net of effects from acquisition/disposition of businesses | 3,297 | | | (4,593) | | Changes in current assets and liabilities, net of effects from acquisition/disposition of businesses | 82 | | | 3,297 | |
| Discretionary employee benefits contributions | — | | | (300) | | |
| | Other, net | Other, net | 2,073 | | | 1,950 | | Other, net | 242 | | | 2,073 | |
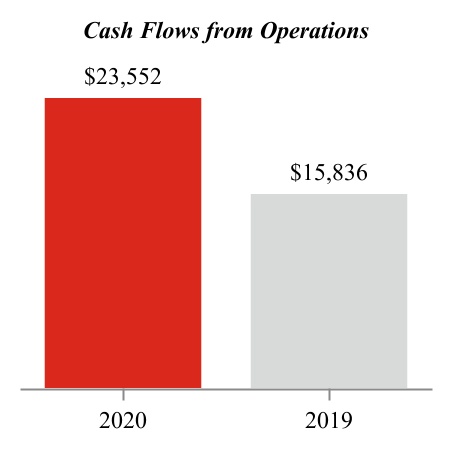
| Net cash provided by operating activities | Net cash provided by operating activities | 23,552 | | | 15,836 | | Net cash provided by operating activities | 20,438 | | | 23,552 | |
| | Cash Flows from Investing Activities | Cash Flows from Investing Activities | | Cash Flows from Investing Activities | |
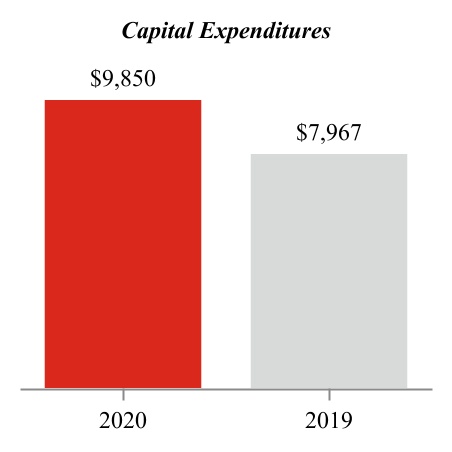
| Capital expenditures (including capitalized software) | Capital expenditures (including capitalized software) | (9,850) | | | (7,967) | | Capital expenditures (including capitalized software) | (8,716) | | | (9,850) | |
| Acquisitions of businesses, net of cash acquired | Acquisitions of businesses, net of cash acquired | (399) | | | (28) | | Acquisitions of businesses, net of cash acquired | (458) | | | (399) | |
| Acquisitions of wireless licenses | Acquisitions of wireless licenses | (1,801) | | | (199) | | Acquisitions of wireless licenses | (45,278) | | | (1,801) | |
| | Other, net | Other, net | (74) | | | (395) | | Other, net | 51 | | | (74) | |
| Net cash used in investing activities | Net cash used in investing activities | (12,124) | | | (8,589) | | Net cash used in investing activities | (54,401) | | | (12,124) | |
| | Cash Flows from Financing Activities | Cash Flows from Financing Activities | | Cash Flows from Financing Activities | |
| Proceeds from long-term borrowings | Proceeds from long-term borrowings | 9,305 | | | 6,237 | | Proceeds from long-term borrowings | 31,444 | | | 9,305 | |
| Proceeds from asset-backed long-term borrowings | Proceeds from asset-backed long-term borrowings | 2,844 | | | 3,982 | | Proceeds from asset-backed long-term borrowings | 2,695 | | | 2,844 | |
| Repayments of long-term borrowings and finance lease obligations | Repayments of long-term borrowings and finance lease obligations | (8,533) | | | (9,630) | | Repayments of long-term borrowings and finance lease obligations | (7,559) | | | (8,533) | |
| Repayments of asset-backed long-term borrowings | Repayments of asset-backed long-term borrowings | (4,612) | | | (2,817) | | Repayments of asset-backed long-term borrowings | (2,993) | | | (4,612) | |
| Dividends paid | Dividends paid | (5,090) | | | (4,981) | | Dividends paid | (5,198) | | | (5,090) | |
| Other, net | Other, net | (146) | | | (834) | | Other, net | (1,839) | | | (146) | |
| Net cash used in financing activities | (6,232) | | | (8,043) | | |
| Net cash provided by (used in) financing activities | | Net cash provided by (used in) financing activities | 16,550 | | | (6,232) | |
| | Increase (decrease) in cash, cash equivalents and restricted cash | Increase (decrease) in cash, cash equivalents and restricted cash | 5,196 | | | (796) | | Increase (decrease) in cash, cash equivalents and restricted cash | (17,413) | | | 5,196 | |
| Cash, cash equivalents and restricted cash, beginning of period | Cash, cash equivalents and restricted cash, beginning of period | 3,917 | | | 3,916 | | Cash, cash equivalents and restricted cash, beginning of period | 23,498 | | | 3,917 | |
| Cash, cash equivalents and restricted cash, end of period (Note 1) | Cash, cash equivalents and restricted cash, end of period (Note 1) | $ | 9,113 | | | $ | 3,120 | | Cash, cash equivalents and restricted cash, end of period (Note 1) | $ | 6,085 | | | $ | 9,113 | |
See Notes to Condensed Consolidated Financial Statements
| | |
Notes to Condensed Consolidated Financial Statements (Unaudited) |
| Verizon Communications Inc. and Subsidiaries |
| | |
| Note 1. Basis of Presentation |
The accompanying unaudited condensed consolidated financial statements have been prepared in accordance with generally accepted accounting principles (GAAP) in the United States (U.S.) and based upon Securities and Exchange Commission rules that permit reduced disclosure for interim periods. For a more complete discussion of significant accounting policies and certain other information, you should refer to the financial statements included in Verizon Communications Inc.'s (Verizon or the Company) Annual Report on Form 10-K for the year ended December 31, 2019.2020. These financial statements reflect all adjustments that are necessary for a fair presentation of results of operations and financial condition for the interim periods shown, including normal recurring accruals and other items. The results for the interim periods are not necessarily indicative of results for the full year.
Certain amounts have been reclassified to conform to the current period’s presentation.
Use of Estimates
U.S. GAAP requires management to make estimates and assumptions that affect reported amounts and disclosures. These estimates and assumptions take into account historical and forward-looking factors that the Company believes are reasonable, including but not limited to the potential impacts arising from the recent novel coronavirus (COVID-19) and public and private sector policies and initiatives aimed at reducing its transmission. As the extent and duration of the impacts from COVID-19 remain unclear, the Company’s estimates and assumptions may evolve as conditions change. Actual results could differ significantly from those estimates.
Examples of significant estimates include the allowance for credit losses, the recoverability of intangible assets, property, plant and equipment, and other long-lived assets, the incremental borrowing rate for the lease liability, fair value measurements, including those related to financial instruments, goodwill, spectrum licenses and intangible assets, unrecognized tax benefits, valuation allowances on tax assets, pension and postretirement benefit obligations, contingencies and the identification and valuation of assets acquired and liabilities assumed in connection with business combinations.
Earnings Per Common Share
There were a total of approximately 2 million outstanding dilutive securities, primarily consisting of restricted stock units, included in the computation of diluted earnings per common share for the three and six months ended June 30, 20202021 and June 30, 2019.2020.
Cash, Cash Equivalents and Restricted Cash
We consider all highly liquid investments with an original maturity of 90 days or less when purchased to be cash equivalents. Cash equivalents are stated at cost, which approximates quoted market value and includes amounts held in money market funds.
Cash collections on the device payment plan agreement receivables collateralizing our asset-backed debt securities are required at certain specified times to be placed into segregated accounts. Deposits to the segregated accounts are considered restricted cash and are included in Prepaid expenses and other and Other assets in our condensed consolidated balance sheets.
Assets held for sale include cash, cash equivalents and restricted cash in our media business, Verizon Media. See Note 3 for additional information.
Cash, cash equivalents and restricted cash are included in the following line items in the condensed consolidated balance sheets:
| | | | | | | | | | | | | | | | | |
| At June 30, | | At December 31, | | Increase / (Decrease) |
| (dollars in millions) | 2020 | | 2019 | | |
| Cash and cash equivalents | $ | 7,882 | | | $ | 2,594 | | | $ | 5,288 | |
| Restricted cash: | | | | | |
| Prepaid expenses and other | 1,101 | | | 1,221 | | | (120) | |
| Other assets | 130 | | | 102 | | | 28 | |
| Cash, cash equivalents and restricted cash | $ | 9,113 | | | $ | 3,917 | | | $ | 5,196 | |
Allowance for Credit Losses
Prior to January 1, 2020, accounts receivable were recorded at cost less an allowance for doubtful accounts. The gross amount of accounts receivable and corresponding allowance for doubtful accounts were presented separately in the condensed consolidated balance sheets. We maintained allowances for uncollectible accounts receivable, including our direct-channel device payment plan agreement receivables, for estimated losses resulting from the failure or inability of our customers to make required payments. Indirect-channel device payment receivables are considered financial instruments and were initially recorded at fair value net of imputed interest, and credit losses were recorded as incurred. However, receivable balances were assessed quarterly for impairment and an allowance was recorded if the receivable was considered impaired. Subsequent to January 1, 2020, accounts receivable are recorded at amortized cost less an allowance for credit losses that are not expected to be recovered. The gross amount of accounts receivable and corresponding allowance for credit losses are presented separately in the condensed consolidated balance sheets. We maintain allowances for credit losses resulting from the expected failure or inability of our customers to make required payments. We recognize the allowance for credit losses at inception and reassess quarterly based on management’s expectation of the asset’s collectability. The allowance is based on multiple factors including historical
experience with bad debts, the credit quality of the customer base, the aging of such receivables and current macroeconomic conditions, such as COVID-19, as well as management’s expectations of conditions in the future, if applicable. Our allowance for credit losses is based on management’s assessment of the collectability of assets pooled together with similar risk characteristics.
We pool our device payment plan agreement receivables based on the credit quality indicators and shared risk characteristics of "new customers" and "existing customers." New customers are defined as customers who have been with Verizon for less than 210 days if they are classified as a Consumer segment customer, or less than 12 months if they are classified as a Business segment customer. Existing customers are defined as customers who have been with Verizon for more than 210 days if they are in Consumer, or more than 12 months if they are in Business. We record an allowance to reduce the receivables to the amount that is expected to be collectible. For device payment plan agreement receivables, we record bad debt expense based on a default and loss calculation using our proprietary loss model. The expected loss rate is determined based on customer credit scores and other qualitative factors as noted above. The loss rate is assigned individually on a customer by customer basis and the custom credit scores are then aggregated by vintage and used in our proprietary loss model to calculate the weighted-average loss rate used for determining the allowance balance.
We monitor the collectability of our wireless service receivables as one overall pool. Wireline service receivables are disaggregated and pooled by the following customer groups: consumer, small and medium business, global enterprise and wholesale. For wireless service receivables and wireline consumer and small and medium business receivables, the allowance is calculated based on a 12 month rolling average write-off balance multiplied by the average life-cycle of an account from billing to write-off. The risk of loss is assessed over the contractual life of the receivables and we adjust the historical loss amounts for current and future conditions based on management’s qualitative considerations. For global enterprise and wholesale wireline receivables, the allowance for credit losses is based on historical write-off experience and individual customer credit risk, if applicable. We consider multiple factors in determining the allowance as discussed above.
Recently Adopted Accounting Standard
The following Accounting Standard Updates (ASUs) were issued by the Financial Accounting Standards Board (FASB), and have been recently adopted by Verizon.
| | | | | | | | | | | | | | |
Description | | Date of Adoption | Effect on Financial Statements | |
ASU 2016-13, ASU 2018-19, ASU 2019-04, and ASU 2019-05, Financial Instruments - Credit Losses (Topic 326) | | | | |
In June 2016, the FASB issued Topic 326 which requires certain financial assets to be measured at amortized cost net of an allowance for estimated credit losses, such that the net receivable represents the present value of expected cash collection. In addition, this standard update requires that certain financial assets be measured at amortized cost reflecting an allowance for estimated credit losses expected to occur over the life of the assets. The estimate of credit losses must be based on all relevant information including historical information, current conditions, and reasonable and supportable forecasts that affect the collectability of the amounts. An entity applies the update through a cumulative effect adjustment to retained earnings as of the beginning of the first reporting period in which the guidance is effective (January 1, 2020). A prospective transition approach is required for debt securities for which an other-than-temporary impairment has been recognized before the effective date. Early adoption of this standard is permitted. | | 1/1/2020 | We adopted Topic 326 beginning on January 1, 2020 using the modified retrospective approach with a cumulative effect adjustment to opening retained earnings recorded at the beginning of the period of adoption. Therefore upon adoption, we recognized and measured estimated credit losses without revising comparative period information or disclosures. We recorded the pre-tax cumulative effect of $265 million ($200 million net of tax) as a reduction to the January 1, 2020 opening balance of retained earnings, which was related to the timing of expected credit loss recognition for certain device payment plan receivables based upon reasonable and supportable forecasts of the future economic condition as of January 1, 2020. Additionally, the adoption of the standard impacted the condensed consolidated balance sheet by presenting financial assets measured at amortized cost separate from the allowance for estimated credit losses. There is no significant impact to our operating results for the current period due to this standard update. | |
| | | | |
ASU 2020-04, Reference Rate Reform (Topic 848) | | | | |
Topic 848 provides temporary optional guidance to ease the potential burden in accounting for reference rate reform. Topic 848 provides optional expedients and exceptions for applying U.S. GAAP to transactions affected by reference rate reform if certain criteria are met.
| | 3/12/2020 | Topic 848 was effective for the Company beginning on March 12, 2020, and we will apply the amendments prospectively through December 31, 2022. There was no impact to our condensed consolidated financial statements for the current period as a result of adopting this standard update. | |
The cumulative after-tax effect of the changes made to our condensed consolidated balance sheet for the adoption of Topic 326 were as follows:
| | | | | | | | | | | | | | | | | |
| (dollars in millions) | At December 31, 2019 | | Adjustments due to
Topic 326 | | At January 1, 2020 |
| Allowance for credit losses | $ | — | | | $ | 919 | | | $ | 919 | |
| Allowance for doubtful accounts | 733 | | | (733) | | | — | |
| Other assets | 10,141 | | | (79) | | | 10,062 | |
| Deferred income taxes | 34,703 | | | (65) | | | 34,638 | |
| Retained earnings | 53,147 | | | (200) | | | 52,947 | |
See Note 6 for additional information related to credit losses, including disclosures required under Topic 326. | | | | | | | | | | | | | | | | | |
| At June 30, | | At December 31, | | Increase / (Decrease) |
| (dollars in millions) | 2021 | | 2020 | |
| Cash and cash equivalents | $ | 4,657 | | | $ | 22,171 | | | $ | (17,514) | |
| Restricted cash: | | | | | |
| Prepaid expenses and other | 1,189 | | | 1,195 | | | (6) | |
| Other assets | 94 | | | 132 | | | (38) | |
| | | | | |
| Assets held for sale: | | | | | |
| Prepaid expenses and other | 145 | | | 0 | | | 145 | |
| Cash, cash equivalents and restricted cash | $ | 6,085 | | | $ | 23,498 | | | $ | (17,413) | |
| | |
| Note 2. Revenues and Contract Costs |
We earn revenue from contracts with customers, primarily through the provision of telecommunications and other services and through the sale of wireless equipment.
Revenue by Category
We have 2 reportable segments that we operate and manage as strategic business units - Consumer and Business. Revenue is disaggregated by products and services within Consumer and customer groups (Small and Medium Business, Global Enterprise, Public Sector and Other, and Wholesale) within Business. See Note 1011 for additional information on revenue by segment.
Corporate and other includes the results of our media business, Verizon Media Group (Verizon Media), and other businesses. Verizon Media generated revenues from contracts with customers under ASUAccounting Standards Updated (ASU) 2014-09, "Revenue from Contracts with Customers" (Topic 606) of approximately $2.1 billion and $3.9 billion during the three and six months ended June 30, 2021, respectively. Verizon Media generated revenues from contracts with customers under Topic 606 of approximately $1.4 billion and $3.1 billion during the three and six months ended June 30, 2020, respectively. Verizon Media generated revenues from contracts with customers under Topic 606 of approximately $1.8 billion and $3.6 billion during the three and six months ended June 30, 2019, respectively.
We also earn revenues that are not accounted for under Topic 606 from leasing arrangements (such as towers)those for towers and equipment), captive reinsurance arrangements primarily related to wireless device insurance and the interest on equipment financed onunder a device payment plan agreement when sold to the customer by an authorized agent. As allowed by the practical expedient within ASU 2016-02, "Leases" (Topic 842), we have elected to combine the lease and non-lease components for those arrangements of customer premise equipment where we are the lessor as components accounted for under Topic 606. During the three and six months ended June 30, 2021, revenues from
arrangements that were not accounted for under Topic 606 were approximately $768 million and $1.5 billion, respectively. During the three and six months ended June 30, 2020, revenues from arrangements that were not accounted for under Topic 606 were approximately $785 million and $1.6 billion, respectively. During the three and six months ended June 30, 2019, revenues from arrangements that were not accounted for under Topic 606 were approximately $797 million and $1.6 billion, respectively.
Remaining Performance Obligations
When allocating the total contract transaction price to identified performance obligations, a portion of the total transaction price may relate to service performance obligations which were not satisfied or are partially satisfied as of the end of the reporting period. Below we disclose information relating to these unsatisfied performance obligations. Upon adoption, we elected toWe apply the practical expedient available under Topic 606 that provides the option to exclude the expected revenues arising from unsatisfied performance obligations related to contracts that have an original expected duration of one year or less. This situation primarily arises with respect to certain month-to-month service contracts. At June 30, 2020,2021, month-to-month service contracts represented approximately 89%92% of our wireless postpaid contracts and approximately 67%80% of our wireline Consumer and Small and Medium Business contracts, compared to June 30, 2019,2020, for which month-to-month service contracts represented approximately 87%89% of our wireless postpaid contracts and 57%67% of our wireline Consumer and Small and Medium Business contracts.
Additionally, certain contracts provide customers the option to purchase additional services. The fees related to these additional services are recognized when the customer exercises the option (typically on a month-to-month basis).
Contracts for wireless services are generally either month-to-month and cancellable at any time (typically under a device payment plan) or contain terms ranging from greater than one month to up to two years (typically under a fixed-term plan). Additionally, customers may incur charges based on usage or additional optional services purchased in conjunction with entering into a contract that can be cancelledcanceled at any time and therefore are not included in the transaction price. The transaction price allocated to service performance obligations, which are not satisfied or are partially satisfied as of the end of the reporting period, are generally related to contracts that are not accounted for as month-to-month contracts.
Our Consumer group customers also include traditional wholesale resellers that purchase and resell wireless service under their own brands to their respective customers. Reseller arrangements generally include a stated contract term, which typically extends longer than two years and, in some cases, include a periodic minimum revenue commitment over the contract term for which revenues will be recognized in future periods.
Consumer customer contracts for wireline services are generally month-to-month; however, they may have a service term of two years or shorter than twelve months. Certain contracts with Business customers for wireline services extend into future periods, contain fixed monthly fees and usage-based fees, and can include annual commitments in each year of the contract or commitments over the entire specified contract term; however, a significant number of contracts for wireline services with our Business customers have a contract term that is twelve months or less.
Additionally, there are certain contracts with Business customers for wireline and telematics services and certain Verizon Media contracts with customers that have a contractual minimum fee over the total contract term. We cannot predict the time period when revenue will be recognized related to those contracts; thus, they are excluded from the time bands below. These contracts have varying terms spanning over approximately fiveseven years ending in June 2025January 2029 and have aggregate contract minimum payments totaling $2.7$2.8 billion.
At June 30, 2020,2021, the transaction price related to unsatisfied performance obligations for total Verizon that is expected to be recognized for the remainder of 2020, 2021, 2022 and thereafter was $10.3$9.4 billion, $13.1$11.7 billion and $4.0$3.4 billion, respectively. Remaining performance obligation estimates are subject to change and are affected by several factors, including terminations and changes in the timing and scope of contracts, arising from contract modifications.
Accounts Receivable and Contract Balances
The timing of revenue recognition may differ from the time of billing to our customers. Receivables presented in our condensed consolidated balance sheets represent an unconditional right to consideration. Contract balances represent amounts from an arrangement when either Verizon has performed, by transferring goods or services to the customer in advance of receiving all or partial consideration for such goods and services from the customer, or the customer has made payment to Verizon in advance of obtaining control of the goods and/or services promised to the customer in the contract.
Contract assets primarily relate to our rights to consideration for goods or services provided to customers but for which we do not have an unconditional right at the reporting date. Under a fixed-term plan, total contract revenue is allocated between wireless service and equipment revenues. In conjunction with these arrangements, a contract asset is created, which represents the difference between the amount of equipment revenue recognized upon sale and the amount of consideration received from the customer when the performance obligation related to the transfer of control of the equipment is satisfied. The contract asset is reclassified to accounts receivable as wireless services are provided and billed. We have the right to bill the customer as service is provided over time, which results in our right to the payment being unconditional. The contract asset balances are presented in our condensed consolidated balance sheets as Prepaid expenses and other and Other assets. We recognize the allowance for credit losses at inception and reassess quarterly based on management’s expectation of the asset’s collectability.
Contract liabilities arise when we bill our customers and receive consideration in advance of providing the goods or services promised in the contract. We typically bill service one month in advance, which is the primary component of the contract liability balance. Contract liabilities are recognized as revenue when services are provided to the customer. The contract liability balances are presented in our condensed consolidated balance sheets as Other current liabilities and Other liabilities.
The following table presents information about receivables from contracts with customers:
| | | At June 30, | | At January 1, | | At June 30, | | At January 1, | | At June 30, | | At January 1, | | At June 30, | | At January 1, |
| (dollars in millions) | (dollars in millions) | 2020 | | 2020 | | 2019 | | 2019 | (dollars in millions) | 2021 | | 2021 | | 2020 | | 2020 |
Receivables(1) | Receivables(1) | $ | 10,967 | | | $ | 12,078 | | | $ | 12,173 | | | $ | 12,104 | | Receivables(1) | $ | 9,387 | | | $ | 12,029 | | | $ | 10,967 | | | $ | 12,078 | |
Device payment plan agreement receivables(2) | Device payment plan agreement receivables(2) | 10,047 | | | 11,741 | | | 10,053 | | | 8,940 | | Device payment plan agreement receivables(2) | 10,836 | | | 10,358 | | | 10,047 | | | 11,741 | |
(1)Balances do not include receivables related to the following contracts: leasing arrangements (such as towers)those for towers and equipment), captive reinsurance arrangements primarily related to wireless device insurance and the interest on equipment financed onunder a device payment plan agreement when sold to the customer by an authorized agent.
(2)Included in device payment plan agreement receivables presented in Note 6.7. Balances do not include receivables related to contracts completed prior to January 1, 2018 and receivables derived from the sale of equipment on a device payment plan through an authorized agent.
The following table presents information about contract balances:
| | | At June 30, | | At January 1, | | At June 30, | | At January 1, | | At June 30, | | At January 1, | | At June 30, | | At January 1, |
| (dollars in millions) | (dollars in millions) | 2020 | | 2020 | | 2019 | | 2019 | (dollars in millions) | 2021 | | 2021 | | 2020 | | 2020 |
| Contract asset | Contract asset | $ | 993 | | | $ | 1,150 | | | $ | 1,059 | | | $ | 1,003 | | Contract asset | $ | 972 | | | $ | 937 | | | $ | 993 | | | $ | 1,150 | |
Contract liability (1) | Contract liability (1) | 5,275 | | | 5,307 | | | 4,946 | | | 4,943 | | Contract liability (1) | 5,846 | | | 5,598 | | | 5,275 | | | 5,307 | |
(1) Revenue recognized related to contract liabilities existing at January 1, 2021 were $199 million and $4.1 billion for the three and six months ended June 30, 2021, respectively. Revenue recognized related to contract liabilities existing at January 1, 2020 were $204 million and $4.0 billion, for the three and six months ended June 30, 2020, respectively. Revenue recognized related to contract liabilities existing at January 1, 2019 were $194 million and $3.9 billion, for the three and six months ended June 30, 2019, respectively.
The balance of contract assets and contract liabilities recorded in our condensed consolidated balance sheets were as follows:
| | | At June 30, | | At December 31, | | At June 30, | | At December 31, |
| (dollars in millions) | (dollars in millions) | 2020 | | 2019 | (dollars in millions) | 2021 | | 2020 |
| Assets | Assets | | Assets | |
| Prepaid expenses and other | Prepaid expenses and other | $ | 762 | | | $ | 848 | | Prepaid expenses and other | $ | 772 | | | $ | 733 | |
| Other assets | Other assets | 231 | | | 302 | | Other assets | 200 | | | 204 | |
| Total | Total | $ | 993 | | | $ | 1,150 | | Total | $ | 972 | | | $ | 937 | |
| | Liabilities | Liabilities | | Liabilities | |
| Other current liabilities | Other current liabilities | $ | 4,636 | | | $ | 4,651 | | Other current liabilities | $ | 4,985 | | | $ | 4,843 | |
| Other liabilities | Other liabilities | 639 | | | 656 | | Other liabilities | 861 | | | 755 | |
| Total | Total | $ | 5,275 | | | $ | 5,307 | | Total | $ | 5,846 | | | $ | 5,598 | |
Contract Costs
Topic 606 requires the recognition of an asset for incremental costs to obtain a customer contract, which are then amortized to expense over the respective periods of expected benefit. We recognize an asset for incremental commission expenses paid to internal and external sales personnel and agents in conjunction with obtaining customer contracts. We only defer these costs when we have determined the commissions are incremental costs that would not have been incurred absent the customer contract and are expected to be recoverable. Costs to obtain a contract are amortized and recorded ratably as commission expense over the period representing the transfer of goods or services to which the assets relate. Costs to obtain wireless contracts are amortized over both of our Consumer and Business customers' estimated device upgrade cycles, as such costs are typically incurred each time a customer upgrades. Costs to obtain wireline contracts are amortized as expense over the estimated customer relationship period for our Consumer customers. Incremental costs to obtain wireline contracts for our Business customers are insignificant. Costs to obtain contracts are recorded in Selling, general and administrative expense.
We also defer costs incurred to fulfill contracts that: (1) relate directly to the contract; (2) are expected to generate resources that will be used to satisfy our performance obligation under the contract; and (3) are expected to be recovered through revenue generated under the contract. Contract fulfillment costs are expensed as we satisfy our performance obligations and recorded in Cost of services. These costs principally relate to direct costs that enhance our wireline business resources, such as costs incurred to install circuits.
We determine the amortization periods for our costs incurred to obtain or fulfill a customer contract at a portfolio level due to the similarities within these customer contract portfolios.
Other costs, such as general costs or costs related to past performance obligations, are expensed as incurred.
Collectively, costs to obtain a contract and costs to fulfill a contract are referred to as deferred contract costs, and amortized over a two-to five-yearsix-year period. Deferred contract costs are classified as current or non-current within Prepaid expenses and other and Other assets, respectively.
The balances of deferred contract costs included in our condensed consolidated balance sheets were as follows:
| | | At June 30, | | At December 31, | | At June 30, | | At December 31, |
| (dollars in millions) | (dollars in millions) | 2020 | | 2019 | (dollars in millions) | 2021 | | 2020 |
| Assets | Assets | | Assets | |
| Prepaid expenses and other | Prepaid expenses and other | $ | 2,455 | | | $ | 2,578 | | Prepaid expenses and other | $ | 2,401 | | | $ | 2,472 | |
| Other assets | Other assets | 1,791 | | | 1,911 | | Other assets | 2,113 | | | 2,070 | |
| Total | Total | $ | 4,246 | | | $ | 4,489 | | Total | $ | 4,514 | | | $ | 4,542 | |
For the three and six months ended June 30, 2020,2021, we recognized expense of $767$743 million and $1.5 billion, respectively, associated with the amortization of deferred contract costs, primarily within Selling, general and administrative expense in our condensed consolidated statements of income. For the three and six months ended June 30, 2019,2020, we recognized expense of $639$767 million and $1.3$1.5 billion, respectively, associated with the amortization of deferred contract costs, primarily within Selling, general and administrative expense in our condensed consolidated statements of income.
We assess our deferred contract costs for impairment on a quarterly basis. We recognize an impairment charge to the extent the carrying amount of a deferred cost exceeds the remaining amount of consideration we expect to receive in exchange for the goods and services related to the cost, less the expected costs related directly to providing those goods and services that have not yet been recognized as expenses. There have been 0 impairment charges recognized for the three and six months ended June 30, 20202021 or June 30, 2019.2020.
| | |
| Note 3. Acquisitions and Divestitures |
Spectrum License Transactions
In March 2020, the Federal CommunicationCommunications Commission's (FCC) incentive auction, Auction 103, for spectrum licenses in the upper 37 Gigahertz (GHz), 39 GHz, and 47 GHz bands concluded. Verizon participated in this incentive auction and was the high bidder on 4,940 licenses, which primarily consisted of 37 GHz and, to a lesser extent, 39 GHz spectrum. As an incumbent licensee, our 39 GHz licenses provided us with incentive payments that were applied towards the purchase price of spectrum in the auction. The value of the licenses won by Verizon amounted to $3.4 billion, of which $1.8 billion was settled with the relinquished 39 GHz licenses. The remaining balance was settled in cash of $1.6 billion, of which $101 million was paid in December 2019. In connection with the incentive auction, a pre-tax net loss of $1.2 billion ($914 million after-tax) was recorded in Selling, general and administrative expense in the condensed consolidated statement of income forduring the six months ended June 30, 2020 because the exchange of the previously held licenses for new licenses had commercial substance. Refer toSee Note 4 for additional information. The new reconfigured licenses were received in the second quarter 2020 and are included in Wireless licenses in our condensed consolidated balance sheet. The average remaining renewal period
In September 2020, the FCC completed Auction 105 for Priority Access Licenses. Verizon participated in the auction and was the high bidder on 557 licenses in the 3.5 GHz band valued at approximately $1.9 billion. Verizon made payments for these acquired licenses in 2020 and received them from the FCC in March 2021. The purchase cost for these licenses and related capitalized interest, to the extent qualifying activities have occurred, are included in Wireless licenses in our condensed consolidated balance sheet.
In February 2021, the FCC concluded Auction 107 for C-Band wireless spectrum. Verizon was 9.9 years.the winning bidder on 3,511 licenses, consisting of contiguous C-Band spectrum bands ranging between 140 and 200 megahertz of C-Band spectrum in all 406 markets available in the auction. Verizon paid $45.5 billion for the licenses it won, of which $44.6 billion was paid in the first quarter of 2021. In accordance with the rules applicable to the auction, Verizon is required to make additional payments to acquire the licenses. The payments are for our allocable share of clearing costs incurred by, and incentive payments due to, the incumbent license holders associated with the auction, which are estimated to be $7.4 billion. We expect to begin making these payments in 2021 for the initial 46 markets and continue to do so for the remaining markets through 2024. These payments are dependent on the incumbent license holders accelerated clearing of the spectrum for Verizon’s use and, therefore, the final timing and amounts could differ based on the incumbent holders’ execution of their clearing process. Per FCC order, the clearing must be completed by December 2025.
The faircarrying value of the wireless spectrum won in Auction 107 will consist of all payments required to participate and purchase licenses represents a Level 2 measurementin the auction, including Verizon’s allocable share of clearing costs incurred by, and incentive payments due to, the incumbent license holders associated with the auction that we are obligated to pay in order to acquire the licenses. Carrying value will also include capitalized interest to the extent qualifying activities have occurred. On July 23, 2021 Verizon received the wireless licenses from the FCC. The carrying value is recorded within Deposits for wireless licenses in our condensed consolidated balance sheet as definedof June 30, 2021, and has been subsequently reclassified to Wireless licenses upon receipt of the corresponding licenses in Accounting Standards Codification 820, Fair Value Measurements and Disclosures, and was determined basedJuly 2021.
Refer to Note 6 for further details on the final auction price for each defined geographical area.significant debt transactions.
During the three and six months ended June 30, 2020,2021, we entered into and completed various other wireless license acquisitions for cash consideration of an insignificant amount and approximately $177$90 million, respectively. In March 2021, we reached 2 agreements to sell certain wireless licenses for insignificant cash consideration. As of June 30, 2021, these wireless licenses are classified as assets held for sale
within Other assets and we recognized a pre-tax loss during the six months ended June 30, 2021 of $223 million ($167 million after-tax). The agreements are subject to regulatory approval and buyer financing conditions.
BlueJeansBlue Jeans Network, Inc.
In April 2020, we entered into a definitive purchase agreement to acquire BlueJeansBlue Jeans Network, Inc. (BlueJeans), an enterprise-grade video conferencing and event platform, whose services are sold to Business customers globally. The transaction closed in May 2020. The aggregate cash consideration paid by Verizon at the closing of the transaction was approximately $396$397 million, net of cash acquired.
TracFone Wireless, Inc.
In September 2020, we entered into a purchase agreement (Tracfone Purchase Agreement) with América Móvil to acquire TracFone Wireless, Inc. (Tracfone), a provider of prepaid and value mobile services in the U.S. Under the terms of the Tracfone Purchase Agreement, we will acquire all of the stock of Tracfone for approximately $3.1 billion in cash and $3.1 billion in Verizon common stock, subject to customary adjustments, at closing. The number of shares issued will be based on an average trading price determined as of the closing date and is subject to a minimum number of shares issuable of 47,124,445 and a maximum number of shares issuable of 57,596,544. The Tracfone Purchase Agreement also includes up to an additional $650 million in future cash consideration related to the achievement of certain performance measures and other commercial arrangements. The transaction is subject to regulatory approvals and closing conditions and is expected to close in the second half of 2021.
Bluegrass Cellular
In October 2020, we entered into a definitive agreement to acquire certain assets of Bluegrass Cellular (Bluegrass), a rural wireless operator serving central Kentucky. Bluegrass provides wireless service to 210,000 customers in 34 counties in rural service areas 3, 4, and 5 in Central Kentucky. The transaction closed in March 2021. The aggregate cash consideration paid by Verizon at the closing of the transaction was approximately $410��million, net of cash acquired, which is subject to customary closing adjustments.
The financial results of BlueJeansBluegrass are included in the consolidated results of Verizon from the date of acquisition. These amounts are insignificant for the three months and six months ended June 30, 2020.2021.
The acquisition of BlueJeansBluegrass was accounted for as a business combination. We are currently assessing the identification and measurement of the assets acquired and liabilities assumed based on their fair values as of the close of the acquisition, subject to customary closing adjustments.acquisition. Preliminarily, we recorded approximately $282$141 million of goodwillplant, property and $192equipment, $135 million of other intangible assets which primarily consistedand $91 million of enterprise customer list and internally developed technology.goodwill. Goodwill is calculated as the difference between the acquisition date fair value of the consideration transferred and the fair value of the net assets acquired. The goodwill represents future economic benefits that we expect to achieve as a result of the acquisition. The goodwill related to this acquisition is included within Consumer.
Verizon Media
On May 2, 2021, Verizon entered into a definitive agreement with an affiliate of Apollo Global Management Inc. pursuant to which we agreed to sell Verizon Media in return for consideration of $4.3 billion in cash, subject to customary adjustments, $750 million in non-convertible preferred limited partnership units of the affiliate, and 10% of the fully-diluted common limited partnership units of the affiliate. The sale is subject to customary regulatory approvals and closing conditions and is expected to close in the second half of 2021.
The following table summarizes the major classes of assets and liabilities of Verizon Media which are currently included in Verizon's continuing operations and classified as held for sale in our condensed consolidated balance sheet as of June 30, 2021:
| | | | | | | |
| At June 30, | | |
| (dollars in millions) | 2021 | | |
| Assets held for sale: | | | |
| Prepaid expenses and other | | | |
| Cash and cash equivalents | $ | 100 | | | |
| Restricted cash | 45 | | | |
| Accounts receivable | 1,843 | | | |
| Other | 127 | | | |
| $ | 2,115 | | | |
| Other assets | | | |
| Property, plant and equipment, net | $ | 1,140 | | | |
| Other intangible assets, net | 2,469 | | | |
| Other | 227 | | | |
| $ | 3,836 | | | |
| Liabilities held for sale: | | | |
| Other current liabilities | | | |
| Accounts payable and accrued liabilities | $ | 1,665 | | | |
| Other | 280 | | | |
| $ | 1,945 | | | |
| | | |
| Other liabilities | $ | 390 | | | |
| | | |
| | | |
| | | |
The sale includes all of the assets of Verizon Media, including its brands, businesses, and web domains. The operating results of this business are included within our Corporate and other segment for all periods presented. Refer to Note 2 for further details on revenues generated by Verizon Media under Topic 606.
Other
During the three months ended June 30, 2020, we completed no other acquisitions. For theand six months ended June 30, 2020,2021, we completed other acquisitions for insignificant amounts of cash consideration.
| | |
| Note 4. Wireless Licenses, Goodwill, and Other Intangible Assets |
Wireless Licenses
The carrying amounts of our Wireless licenses, as well as wireless spectrum for which licenses have not yet been received, are as follows:
| | | At June 30, | At December 31, | | At June 30, | At December 31, |
| (dollars in millions) | (dollars in millions) | 2020 | 2019 | (dollars in millions) | 2021 | 2020 |
| Wireless licenses | Wireless licenses | $ | 95,767 | | $ | 95,059 | | Wireless licenses | $ | 98,034 | | $ | 96,097 | |
| Deposits for wireless licenses | | Deposits for wireless licenses | 45,910 | | 2,772 | |
At June 30, 2021 and 2020, and 2019, approximately $3.5$53.5 billion and $6.6$3.5 billion, respectively, of wireless licenses were under development for commercial service for which we were capitalizing interest costs. At June 30, 2021, the $53.5 billion was comprised of $8.0 billion recorded in Wireless licenses and $45.5 billion recorded in Deposits for wireless licenses. At June 30, 2020, $3.5 billion was recorded in Wireless licenses. We recorded approximately $101$154 million and $168$101 million of capitalized interest on wireless licenses for the six months ended June 30, 2021 and 2020, and 2019, respectively. We recorded approximately $455 million of capitalized interest on Deposits for wireless licenses during the six months ended June 30, 2021.
In Marchthe first quarter of 2020, we reclassified substantially all of our 39 GHz wireless licenses, including capitalized interest, with a carrying value of $2.8 billion to assets held for sale in connection with the FCC's incentive auction.auction, Auction 103. As a result, these wireless licenses were adjusted down to their fair value of $1.6 billion resulting in a pre-tax loss of $1.2 billion ($914 million after-tax) for the six months ended June 30,in 2020. The new reconfigured licenses were received in the second quarter 2020 and had a value of $3.4 billion. See Note 3 for additional information regarding spectrum license transactions.
During 2020,the six months ended June 30, 2021, we renewed various wireless licenses in accordance with FCC regulations. The average renewal period for these licenses was 10 years.
Goodwill
Changes in the carrying amount of Goodwill are as follows:
| | | | | | | | | | | | | | | | | | | | | | | |
| (dollars in millions) | Consumer | | Business | | Other | | Total |
Balance at January 1, 2020 (1) | $ | 17,104 | | | $ | 7,269 | | | $ | 16 | | | $ | 24,389 | |
| Acquisitions (Note 3) | — | | | 282 | | | — | | | 282 | |
| Reclassifications, adjustments and other | — | | | (4) | | | — | | | (4) | |
Balance at June 30, 2020 (1) | $ | 17,104 | | | $ | 7,547 | | | $ | 16 | | | $ | 24,667 | |
| | | | | | | | | | | | | | | | | | | | | | | |
| (dollars in millions) | Consumer | | Business | | Other | | Total |
Balance at January 1, 2021 (1) | $ | 17,222 | | | $ | 7,535 | | | $ | 16 | | | $ | 24,773 | |
Acquisitions (2) | 91 | | | 0 | | | 37 | | | 128 | |
| Reclassifications, adjustments and other | 3 | | | 11 | | | 0 | | | 14 | |
Balance at June 30, 2021 (1) | $ | 17,316 | | | $ | 7,546 | | | $ | 53 | | | $ | 24,915 | |
(1) Other Goodwill is net of accumulated impairment charges of $4.8 billion, related to our Media reporting unit.
(2) The change in goodwill due to acquisitions is related to Bluegrass and other insignificant transactions. See Note 3 for additional information.
Other Intangible Assets
The following table displays the composition of Other intangible assets, net as well as the respective amortization period:
| | | | At June 30, 2020 | | | At December 31, 2019 | | | At June 30, 2021 | | At December 31, 2020 |
| (dollars in millions) | (dollars in millions) | Gross
Amount | | Accumulated
Amortization | | Net
Amount | | Gross
Amount | | Accumulated
Amortization | | Net
Amount | (dollars in millions) | Gross
Amount | | Accumulated
Amortization | | Net
Amount | | Gross
Amount | | Accumulated
Amortization | | Net
Amount |
| Customer lists (8 to 13 years) | Customer lists (8 to 13 years) | $ | 4,009 | | | $ | (1,740) | | | $ | 2,269 | | | $ | 3,896 | | | $ | (1,511) | | | $ | 2,385 | | Customer lists (8 to 13 years) | $ | 1,951 | | | $ | (996) | | | $ | 955 | | | $ | 4,021 | | | $ | (1,961) | | | $ | 2,060 | |
| Non-network internal-use software (5 to 7 years) | Non-network internal-use software (5 to 7 years) | 21,670 | | | (15,292) | | | 6,378 | | | 20,530 | | | (14,418) | | | 6,112 | | Non-network internal-use software (5 to 7 years) | 20,080 | | | (14,182) | | | 5,898 | | | 21,685 | | | (15,104) | | | 6,581 | |
| Other (2 to 25 years) | 1,981 | | | (1,028) | | | 953 | | | 1,967 | | | (966) | | | 1,001 | | |
| Other (4 to 25 years) | | Other (4 to 25 years) | 901 | | | (752) | | | 149 | | | 1,771 | | | (999) | | | 772 | |
| Total | Total | $ | 27,660 | | | $ | (18,060) | | | $ | 9,600 | | | $ | 26,393 | | | $ | (16,895) | | | $ | 9,498 | | Total | $ | 22,932 | | | $ | (15,930) | | | $ | 7,002 | | | $ | 27,477 | | | $ | (18,064) | | | $ | 9,413 | |
The amortization expense for Other intangible assets was as follows:
| | | Three Months Ended | | Six Months Ended | | Three Months Ended | | Six Months Ended |
| (dollars in millions) | (dollars in millions) | June 30, | | June 30, | (dollars in millions) | June 30, | | June 30, |
| 2021 | | 2021 | $ | 480 | | | $ | 1,109 | |
| 2020 | 2020 | $ | 605 | | | $ | 1,197 | | 2020 | 605 | | | 1,197 | |
| 2019 | 569 | | | 1,124 | | |
The estimated future amortization expense for Other intangible assets for the remainder of the current year and next 5 years is as follows:
| | Years | Years | (dollars in millions) | Years | (dollars in millions) |
| Remainder of 2020 | $ | 1,194 | | |
| 2021 | 2,136 | | |
| Remainder of 2021 | | Remainder of 2021 | $ | 786 | |
| 2022 | 2022 | 1,838 | | 2022 | 1,565 | |
| 2023 | 2023 | 1,476 | | 2023 | 1,350 | |
| 2024 | 2024 | 1,105 | | 2024 | 1,114 | |
| 2025 | 2025 | 746 | | 2025 | 911 | |
| 2026 | | 2026 | 538 | |
| | |
| Note 5. Leasing Arrangements |
We enter into various lease arrangements for network equipment including towers, distributed antenna systems, small cells, real estate and connectivity mediums including dark fiber, equipment, and other various types of assets for use in our operations. Our leases have remaining lease terms ranging from 1 year to 30 years, some of which include options that we can elect to extend the leases term for up to 25 years, and some of which include options to terminate the leases. For the majority of leases entered into during the current period, we have concluded it is not reasonably certain that we would exercise the options to extend the lease or terminate the lease. Therefore, as of the lease commencement date, our lease terms generally do not include these options. We include options to extend the lease when it is reasonably certain that we will exercise that option.
In April 2021, Verizon executed agreements that modified the tenure and payment terms for certain existing cell tower operating leases to support the build out of our fifth generation wireless network.
The components of net lease cost were as follows: | | | | | | | | | | | | | | | | | | | | | | | |
| | Three Months Ended | Six Months Ended |
| | June 30, | June 30, |
| (dollars in millions) | Classification | 2021 | | 2020 | 2021 | | 2020 |
Operating lease cost (1) | Cost of services
Selling, general and administrative expense | $ | 1,341 | | | $ | 1,254 | | $ | 2,585 | | | $ | 2,475 | |
| Finance lease cost: | | | | | | | |
| Amortization of right-of-use assets | Depreciation and amortization expense | 66 | | | 40 | | 133 | | | 291 | |
| Interest on lease liabilities | Interest expense | 9 | | | 10 | | 17 | | | 20 | |
Short-term lease cost (1) | Cost of services
Selling, general and administrative expense | 4 | | | 5 | | 9 | | | 12 | |
Variable lease cost (1) | Cost of services
Selling, general and administrative expense | 78 | | | 76 | | 159 | | | 163 | |
| Sublease income | Service revenues and other | (49) | | | (74) | | (97) | | | (144) | |
| Total net lease cost | | $ | 1,449 | | | $ | 1,311 | | $ | 2,806 | | | $ | 2,817 | |
| | | | | | | |
| | | | | | | |
(1) All operating lease costs, including short-term and variable lease costs, are split between Cost of services and Selling, general and administrative expense in the condensed consolidated statements of income based on the use of the facility or equipment that the rent is being paid on. Refer to the consolidated financial statements included in Verizon's Annual Report on Form 10-K for the year ended December 31, 2020 for additional information. Variable lease costs represent payments that are dependent on a rate or index, or on usage of the asset.
The Company's maturity analysis of operating and finance lease liabilities as of June 30, 2021 were as follows: | | | | | | | | | | | |
| | | (dollars in millions) |
| Years | Operating Leases | | Finance Leases |
| Remainder of 2021 | $ | 2,186 | | | $ | 204 | |
| 2022 | 4,148 | | | 376 | |
| 2023 | 3,924 | | | 310 | |
| 2024 | 3,663 | | | 241 | |
| 2025 | 3,292 | | | 120 | |
| Thereafter | 14,516 | | | 97 | |
| Total lease payments | 31,729 | | | 1,348 | |
| Less interest | 4,488 | | | 73 | |
| Present value of lease liabilities | 27,241 | | | 1,275 | |
| Less current obligation | 3,881 | | | 377 | |
| Long-term obligation at June 30, 2021 | $ | 23,360 | | | $ | 898 | |
Significant Debt Transactions
Debt or equity financing may be needed to fund additional investments or development activities or to maintain an appropriate capital structure to ensure our financial flexibility.
The following table showstables show the significant transactions involving the senior unsecured debt securities of Verizon and its subsidiaries that occurred during the six months ended June 30, 2020.
Redemptions, Repurchases and Repayments
| | | | | | | | | | | | | |
| (dollars in millions) | Principal Redeemed/ Repurchased/ Repaid | | Amount Paid (1) | | |
| Three Months Ended March 31, 2020 | | | | | |
| Verizon 4.950% notes due 2047 | $ | 1,475 | | | $ | 1,475 | | | |
| | | | | |
| | | | | |
| | | | | |
| | | | | |
| | | | | |
| Three Months Ended March 31, 2020 total | $ | 1,475 | | | $ | 1,475 | | | |
| | | | | |
| | | | | |
| Three Months Ended June 30, 2020 | | | | | |
| Verizon 5.143% preferred stock due 2020 | $ | 1,650 | | | $ | 1,650 | | | |
Verizon floating rate (LIBOR +0.550%) notes due 2020 (2) | 1,018 | | | 1,018 | | | |
| Verizon 4.600% notes due 2021 | 920 | | | 949 | | | |
| Verizon 3.125% notes due 2022 | 1,256 | | | 1,314 | | | |
| Open market repurchases of various Verizon notes | 121 | | | 143 | | | |
Verizon 2.375% notes due 2022 (3) | € | 935 | | | $ | 1,199 | | | |
Verizon 0.500% notes due 2022 (4) | € | 454 | | | $ | 517 | | | |
| Three Months Ended June 30, 2020 total | | | 6,790 | | | |
| Six Months Ended June 30, 2020 total | | | $ | 8,265 | | | |
| | | | | |
| | | | | |
| | | | | |
| | | | | |
| | | | | |
| | | | | |
(1) Represents amount paid to redeem, repurchase or repay, excluding interest or dividend.
(2) The three-month London Interbank Offered Rate (LIBOR).
(3) Principal and premium amount repaid was €980 million. US dollar amount paid includes cash settlement from derivatives entered in connection with the transaction. See Note 7 for information on cross currency swaps.
(4) Principal and premium amount repaid was €463 million. US dollar amount paid includes cash settlement from derivatives entered in connection with the transaction. See Note 7 for information on cross currency swaps.
Issuances
| | | | | | | | | | | |
| (amounts in millions) | Principal Amount Issued | | Net Proceeds (1) |
| Three Months Ended March 31, 2020 | | | |
| Verizon 3.600% notes due 2060 | $ | 2,385 | | | $ | 2,369 | |
| Verizon 3.000% notes due 2027 | 750 | | | 747 | |
| Verizon 3.150% notes due 2030 | 1,500 | | | 1,489 | |
| Verizon 4.000% notes due 2050 | 1,250 | | | 1,241 | |
| Three Months Ended March 31, 2020 total | $ | 5,885 | | | $ | 5,846 | |
| | | |
| | | |
| Three Months Ended June 30, 2020 | | | |
Verizon 2.500% due 2030 (2) | C$ | 1,000 | | | $ | 705 | |
Verizon 3.625% due 2050 (2) | C$ | 300 | | | $ | 209 | |
Verizon 1.300% notes due 2033 (2) | € | 1,350 | | | $ | 1,464 | |
Verizon 1.850% notes due 2040 (2) | € | 800 | | | $ | 869 | |
| | | |
| | | |
| Three Months Ended June 30, 2020 total | | | 3,247 | |
| Six Months Ended June 30, 2020 total | | | $ | 9,093 | |
| | | |
| | | |
| | | |
| | | |
| | | |
| | | |
(1) Net proceeds were net of discount and issuance costs.
(2) See Note 7 for information on cross currency swaps.
Short-Term Borrowing and Commercial Paper Program
During the three months ended June 30, 2020, we repaid $700 million related to our bilateral short-term uncommitted bank credit facility. As of June 30, 2020, we had 0 amount outstanding related to this facility.
In April 2020, we issued $3.5 billion in commercial paper. During the three months ended June 30, 2020, we repaid $2.5 billion of commercial paper. As of June 30, 2020, we had $1.0 billion of commercial paper outstanding. In July 2020, we repaid $460 million of commercial paper.2021.
Repayments, Redemptions and Repurchases
| | | | | | | | | | | |
| (dollars in millions) | Principal Repaid/ Redeemed/ Repurchased | | Amount Paid (1) |
| | | |
| | | |
| | | |
| | | |
| | | |
| | | |
| | | |
| | | |
| | | |
| | | |
| Three Months Ended June 30, 2021 | | | |
| Verizon 2.946% notes due 2022 | $ | 713 | | | $ | 730 | |
| Verizon 2.450% notes due 2022 | 794 | | | 819 | |
| Verizon 5.150% notes due 2023 | 3,190 | | | 3,519 | |
| Open market repurchases of various Verizon and subsidiary notes | 1,994 | | | 2,440 | |
| | | |
| Three Months Ended June 30, 2021 total | 6,691 | | | 7,508 | |
| Six Months Ended June 30, 2021 total | $ | 6,691 | | | $ | 7,508 | |
| | | |
| | | |
| | | |
| | | |
| | | |
| | | |
| | | |
| | | |
(1) Represents amount paid to repay, redeem, or repurchase, excluding interest or dividend.
Issuances
| | | | | | | | | | | |
| (amounts in millions) | Principal Amount Issued | | Net Proceeds (1) |
| Three Months Ended March 31, 2021 | | | |
| Verizon 0.750% notes due 2024 | $ | 1,750 | | | $ | 1,746 | |
Verizon floating rate (Compounded SOFR(2) + 0.500%) notes due 2024 | 750 | | | 748 | |
| Verizon 1.450% notes due 2026 | 2,750 | | | 2,737 | |
Verizon floating rate (Compounded SOFR(2) + 0.790%) notes due 2026 | 750 | | | 748 | |
| Verizon 2.100% notes due 2028 | 3,000 | | | 2,988 | |
| Verizon 2.550% notes due 2031 | 4,250 | | | 4,216 | |
| Verizon 3.400% notes due 2041 | 3,750 | | | 3,726 | |
| Verizon 3.550% notes due 2051 | 4,500 | | | 4,426 | |
| Verizon 3.700% notes due 2061 | 3,500 | | | 3,439 | |
Verizon 0.375% notes due 2029 (3) | € | 1,000 | | | 1,186 | |
Verizon 0.750% notes due 2032 (3) | € | 1,000 | | | 1,181 | |
Verizon 1.125% notes due 2035 (3) | € | 750 | | | 878 | |
Verizon 2.375% notes due 2028 (3) | C$ | 1,000 | | | 800 | |
Verizon 4.050% notes due 2051 (3) | C$ | 500 | | | 399 | |
Verizon 2.350% notes due 2028 (3) | A$ | 600 | | | 463 | |
Verizon 3.000% notes due 2031 (3) | A$ | 500 | | | 385 | |
Verizon 3.850% notes due 2041 (3) | A$ | 150 | | | 116 | |
Verizon 0.193% bonds due 2028 (3) | CHF | 375 | | | 403 | |
Verizon 0.555% bonds due 2031 (3) | CHF | 325 | | | 349 | |
| Three Months Ended March 31, 2021 total | | | 30,934 | |
| Six Months Ended June 30, 2021 total | | | $ | 30,934 | |
| | | |
| | | |
| | | |
| | | |
| | | |
| | | |
| | | |
| | | |
| | | |
| | | |
| | | |
| | | |
| | | |
| | | |
| | | |
| | | |
| | | |
(1) Net proceeds were net of underwriting discounts and other issuance costs. In addition, for securities denominated in a currency other than the U.S. dollar, net proceeds are shown on a U.S. dollar equivalent basis.
(2) Compounded Secured Overnight Financing Rate (SOFR) is calculated using the SOFR Index published by the Federal Reserve Bank of New York in accordance with the terms of the notes. The Compounded SOFR for the initial interest period ending in June 2021 was 0.010%.
(3) See Note 8 for information on derivative transactions related to the issuances.
Asset-Backed Debt
As of June 30, 2020,2021, the carrying value of our asset-backed debt was $10.6$10.3 billion. Our asset-backed debt includes Asset-Backed Notes (ABS Notes) issued to third-party investors (Investors) and loans (ABS Financing Facilities) received from banks and their conduit facilities (collectively, the Banks). Our consolidated asset-backed debt bankruptcy remote legal entities (each, an ABS Entity or collectively, the ABS Entities) issue the debt or are otherwise party to the transaction documentation in connection with our asset-backed debt transactions. Under the terms of our asset-backed debt, Cellco Partnership (Cellco), a wholly-owned subsidiary of Verizon, and certain other affiliates of Verizon (collectively, the Originators) transfer device payment plan agreement receivables to one of the ABS Entities, which in turn transfers such receivables to another ABS Entity that issues the debt. Verizon entities retain the equity interests and residual interests, as applicable, in the ABS Entities, which represent the rights to all funds not needed to make required payments on the asset-backed debt and other related payments and expenses.
Our asset-backed debt is secured by the transferred device payment plan agreement receivables and future collections on such receivables. The device payment plan agreement receivables transferred to the ABS Entities and related assets, consisting primarily of restricted cash, will only be available for payment of asset-backed debt and expenses related thereto, payments to the Originators in respect of additional transfers
of device payment plan agreement receivables, and other obligations arising from our asset-backed debt transactions, and will not be available to pay other obligations or claims of Verizon’s creditors until the associated asset-backed debt and other obligations are satisfied. The Investors or Banks, as applicable, which hold our asset-backed debt have legal recourse to the assets securing the debt, but do not have any recourse to Verizon with respect to the payment of principal and interest on the debt. Under a parent support agreement, Verizon has agreed to guarantee certain of the payment obligations of Cellco and the Originators to the ABS Entities.
Cash collections on the device payment plan agreement receivables collateralizing our asset-backed debt securities are required at certain specified times to be placed into segregated accounts. Deposits to the segregated accounts are considered restricted cash and are included in Prepaid expenses and other and Other assets in our condensed consolidated balance sheets.
Proceeds from our asset-backed debt transactions are reflected in Cash flows from financing activities in our condensed consolidated statements of cash flows. The asset-backed debt issued and the assets securing this debt are included in our condensed consolidated balance sheets.
As mentioned above, the holders of our asset-backed debt do not have any recourse to Verizon with respect to the payment of principal and interest on the debt. However, if an early amortization of our asset-backed debt occurs, including as a result of increased customer delinquencies or losses relating to COVID-19, all collections on the securitized device payment plan agreement receivables would be used to pay principal and interest on the asset-backed debt, and our financing cash flow requirements would increase for the twelve months immediately following an early amortization event.
ABS Notes
During the six months ended June 30, 2020,2021, we completed the following ABS Notes transactions:
| | | | | | | | | | | | | | |
| (dollars in millions) | Interest Rates % | | Expected Weighted-average Life to Maturity (in years) | Principal Amount Issued |
| March 2020 | | | | |
| A-1a Senior class notes | 1.850 | | | 2.46 | $ | 1,326 | |
| A-1b Senior floating rate class notes | LIBOR + 0.270 | (1) | 2.46 | 100 | |
| B Junior class notes | 1.980 | | | 3.18 | 98 | |
| C Junior class notes | 2.060 | | | 3.36 | 76 | |
| | | | |
| | | | |
| | | | |
| | | | |
| | | | |
| | | | |
| | | | |
| | | | |
| Total | | | | $ | 1,600 | |
(1) The one-month LIBOR at June 30, 2020 was 0.162%. | | | | | | | | | | | | | | |
| (dollars in millions) | Interest Rates % | | Expected Weighted-average Life to Maturity (in years) | Principal Amount Issued |
| May 2021 | | | | |
| A Senior class notes | 0.500 | | 2.99 | $ | 1,500 | |
| B Junior class notes | 0.690 | | 2.99 | 119 | |
| C Junior class notes | 0.890 | | 2.99 | 81 | |
| Total | | | | $ | 1,700 | |
| | | | |
| | | | |
| | | | |
| | | | |
| | | | |
| | | | |
| | | | |
Under the terms of each series of ABS Notes, there is a two-year revolving period that is two years or up to three years, as applicable, during which we may transfer additional receivables to the ABS Entity. During the three and six months ended June 30, 2020,2021, we made aggregate principal repayments of $883$761 million and $1.9$1.5 billion, respectively, on ABS Notes that have entered the amortization period.
period, including principal payments made in connection with clean-up redemptions. In July 2020,2021, in connection with an optional acquisition of receivables and redemption of ABS Notes, we made a principal payment, in whole, for $137$125 million.
ABS Financing FacilitiesFacility
In May 2020,March 2021, we amended and restated our outstanding ABS financing facility originally entered into in 2016, and previously amended and restated in 2019, with a number of financial institutions (ABS Financing Facility). Underborrowed an additional $1.0 billion under the terms of the ABS Financing Facility, the financial institutions make advances under asset-backed loans backed by device payment plan agreement receivables of both consumer and business customers. One loan agreement is outstanding in connection with the ABS Financing Facility, and such loan agreement was amended and restated in May 2020. The loan agreement has a final maturity date in May 2024 and bears interest at floating rates. There is a one year revolving period untilFacility. In May 2021, which may be extended with the approvalaggregate outstanding balance of the financial institutions. Under the loan agreement, we have the right to prepay all or a portion of the advances at any time without penalty, but in certain cases, with breakage costs. Subject to
certain conditions, we may also remove receivables from the ABS Entity. In January 2020, we prepaid $1.3 billion of the loan under the loan agreement. In March 2020, we borrowed an additional $1.3 billion under the loan agreement. In June 2020, we prepaid $1.5 billion of the loan under the loan agreement. The aggregatewas fully repaid and there was 0 outstanding balance under the ABS Financing Facility was $1.8 billion as of June 30, 2020.2021.
Variable Interest Entities (VIEs)
The ABS Entities meet the definition of a VIE for which we have determined that we are the primary beneficiary as we have both the power to direct the activities of the entity that most significantly impact the entity’s performance and the obligation to absorb losses or the right to receive benefits of the entity. Therefore, the assets, liabilities and activities of the ABS Entities are consolidated in our financial results and are included in amounts presented on the face of our condensed consolidated balance sheets.
The assets and liabilities related to our asset-backed debt arrangements included in our condensed consolidated balance sheets were as follows:
| | | At June 30, | | At December 31, | | At June 30, | | At December 31, |
| (dollars in millions) | (dollars in millions) | 2020 | | 2019 | (dollars in millions) | 2021 | | 2020 |
| Assets | Assets | | Assets | |
| Account receivable, net | Account receivable, net | $ | 9,981 | | | $ | 10,525 | | Account receivable, net | $ | 8,877 | | | $ | 9,257 | |
| Prepaid expenses and other | Prepaid expenses and other | 1,053 | | | 1,180 | | Prepaid expenses and other | 1,189 | | | 1,128 | |
| Other assets | Other assets | 3,584 | | | 3,856 | | Other assets | 3,248 | | | 2,950 | |
| | Liabilities | Liabilities | | Liabilities | |
| Accounts payable and accrued liabilities | Accounts payable and accrued liabilities | 10 | | | 11 | | Accounts payable and accrued liabilities | 9 | | | 8 | |
| Short-term portion of long-term debt | 3,894 | | | 5,578 | | |
| Debt maturing within one year | | Debt maturing within one year | 4,344 | | | 4,191 | |
| Long-term debt | Long-term debt | 6,713 | | | 6,791 | | Long-term debt | 5,971 | | | 6,413 | |
See Note 67 for additional information on device payment plan agreement receivables used to secure asset-backed debt.
Long-Term Credit Facilities
| | | At June 30, 2020 | | | At June 30, 2021 |
| (dollars in millions) | (dollars in millions) | Maturities | | Facility Capacity | | Unused Capacity | | Principal Amount Outstanding | (dollars in millions) | Maturities | | Facility Capacity | | Unused Capacity | | Principal Amount Outstanding |
Verizon revolving credit facility (1) | Verizon revolving credit facility (1) | 2022 | | $ | 9,500 | | | $ | 9,392 | | | n/a | Verizon revolving credit facility (1) | 2024 | | $ | 9,500 | | | $ | 9,392 | | | N/A |
Various export credit facilities (2) | Various export credit facilities (2) | 2022-2027 | | 7,000 | | | 1,500 | | | $ | 4,206 | | Various export credit facilities (2) | 2022 - 2029 | | 7,500 | | | 530 | | | $ | 5,029 | |
| Total | Total | | $ | 16,500 | | | $ | 10,892 | | | $ | 4,206 | | Total | | $ | 17,000 | | | $ | 9,922 | | | $ | 5,029 | |
n/aN/A - not applicable
(1) The revolving credit facility does not require us to comply with financial covenants or maintain specified credit ratings, and it permits us to borrow even if our business has incurred a material adverse change. The revolving credit facility provides for the issuance of letters of credit.
(2) During the six months ended June 30, 2021, we drew down $470 million from these facilities. These credit facilities are used to finance equipment-related purchases. Borrowings under certain of these facilities amortize semi-annually in equal installments up to the applicable maturity dates. Maturities reflect maturity dates of principal amounts outstanding. Any amounts borrowed under these facilities and subsequently repaid cannot be reborrowed.
In July 2020, we drew $500 million from a $1.5 billion export credit facility entered into in June 2020 and fully drew down $500 million from an export credit facility entered into in July 2020.
Non-Cash Transactions
During the six months ended June 30, 20202021 and 2019,2020, we financed, primarily through vendoralternative financing arrangements, the purchase of approximately $673$145 million and $221$673 million, respectively, of long-lived assets consisting primarily of network equipment. AtAs of June 30, 20202021 and December 31, 2019,2020, $1.3 billion and $1.1$1.6 billion, respectively, relating to these financing arrangements, including those entered into in prior years and liabilities assumed through acquisitions, remained outstanding. These purchases are non-cash financing activities and therefore are not reflected within Capital expenditures in our condensed consolidated statements of cash flows.
Debt Extinguishment Losses
During both the three and six months ended June 30, 2021 and June 30, 2020, we recorded debt extinguishment losses of $1.1 billion and $102 million, respectively. The losses are recorded in Other income (expense), net in our condensed consolidated statements of income.
Guarantees
We guarantee the debentures of our operating telephone company subsidiaries. As of June 30, 2020,2021, $765 million aggregate principal amount of these obligations remained outstanding. Each guarantee will remain in place for the life of the obligation unless terminated pursuant to its terms, including the operating telephone company no longer being a wholly-owned subsidiary of Verizon.
We also guarantee the debt obligations of GTE LLC as successor in interest to GTE Corporation that were issued and outstanding prior to July 1, 2003. As of June 30, 2020,2021, $391 million aggregate principal amount of these obligations remained outstanding.
Covenants
We and our consolidated subsidiaries are in compliance with all of our restrictive covenants.covenants in our debt agreements.
| | |
Note 6.7. Device Payment Plan Agreement and Wireless Service Receivables |
The following table presents information about accounts receivable, net of allowances, recorded in our condensed consolidated balance sheet:
| | | At June 30, 2020 | | | At June 30, 2021 |
| (dollars in millions) | (dollars in millions) | Device payment plan agreement | | Wireless
service | | Other receivables(1) | | Total | (dollars in millions) | Device payment plan agreement | | Wireless
service | | Other receivables(1) | | Total |
Accounts receivable(2) | Accounts receivable(2) | $ | 12,017 | | | $ | 5,089 | | | $ | 6,636 | | | $ | 23,742 | | Accounts receivable(2) | $ | 12,157 | | | $ | 5,006 | | | $ | 5,074 | | | $ | 22,237 | |
| Less Allowance for credit losses | Less Allowance for credit losses | 584 | | | 234 | | | 252 | | | 1,070 | | Less Allowance for credit losses | 575 | | | 145 | | | 260 | | | 980 | |
| Accounts receivable, net of allowance | Accounts receivable, net of allowance | $ | 11,433 | | | $ | 4,855 | | | $ | 6,384 | | | $ | 22,672 | | Accounts receivable, net of allowance | $ | 11,582 | | | $ | 4,861 | | | $ | 4,814 | | | $ | 21,257 | |
(1) Other receivables primarily include wireline receivables, Verizon Media receivables and other receivables, the allowances for which are individually insignificant.
(2) Following the adoption of Topic 326 on January 1, 2020, accounts receivable are measured at amortized cost.
Under the Verizon device payment program, our eligible wireless customers purchase wireless devices under a device payment plan agreement. Customers that activate service on devices purchased under the device payment program pay lower service fees as compared to those under our fixed-term service plans, and their device payment plan charge is included on their wireless monthly bill. As of January 2017, weWe no longer offer Consumer customers new fixed-term, subsidized service plans for phones;devices; however, we continue to offer subsidized plans to our Business customers. We also continue to service existing plans for customers who have not yet purchased and activated devices under the Verizon device payment program.
The following table displays device payment plan agreement receivables, net, recognized in our condensed consolidated balance sheets:
| | | At June 30, | | At December 31, | | At June 30, | | At December 31, |
| (dollars in millions) | (dollars in millions) | 2020 | | 2019(1) | (dollars in millions) | 2021 | | 2020 |
| Device payment plan agreement receivables, gross | Device payment plan agreement receivables, gross | $ | 17,079 | | | $ | 19,493 | | Device payment plan agreement receivables, gross | $ | 18,537 | | | $ | 17,959 | |
| Unamortized imputed interest | Unamortized imputed interest | (429) | | | (454) | | Unamortized imputed interest | (397) | | | (453) | |
| Device payment plan agreement receivables, at amortized cost | Device payment plan agreement receivables, at amortized cost | 16,650 | | | 19,039 | | Device payment plan agreement receivables, at amortized cost | 18,140 | | | 17,506 | |
Allowance (2)(1) | Allowance (2)(1) | (795) | | | (472) | | Allowance (2)(1) | (833) | | | (940) | |
| Device payment plan agreement receivables, net | Device payment plan agreement receivables, net | $ | 15,855 | | | $ | 18,567 | | Device payment plan agreement receivables, net | $ | 17,307 | | | $ | 16,566 | |
| | Classified in our condensed consolidated balance sheets: | Classified in our condensed consolidated balance sheets: | | Classified in our condensed consolidated balance sheets: | |
| Accounts receivable, net | Accounts receivable, net | $ | 11,433 | | | $ | 13,045 | | Accounts receivable, net | $ | 11,582 | | | $ | 11,601 | |
| Other assets | Other assets | 4,422 | | | 5,522 | | Other assets | 5,725 | | | 4,965 | |
| Device payment plan agreement receivables, net | Device payment plan agreement receivables, net | $ | 15,855 | | | $ | 18,567 | | Device payment plan agreement receivables, net | $ | 17,307 | | | $ | 16,566 | |
(1) Balances reflected are prior to the adoption of Topic 326 on January 1, 2020.
(2)Includes allowance for both short-term and long-term device payment plan agreement receivables. The allowance as of June 30, 2020 and December 31, 2019 relate to our provision for credit losses and doubtful accounts, respectively.
Included in our device payment plan agreement receivables at June 30, 20202021 and December 31, 2019,2020, are net device payment plan agreement receivables of $13.5$12.0 billion and $14.3$12.1 billion, respectively, which have been transferred to ABS Entities and continue to be reported in our condensed consolidated balance sheets. See Note 56 for additional information. We believe the carrying value of these receivables approximate their fair value using a Level 3 expected cash flow model.
For indirect channel wireless contracts with customers, we impute risk adjusted interest on the device payment plan agreement receivables. We record the imputed interest as a reduction to the related accounts receivable. Interest income, which is included within Service revenues and other in our condensed consolidated statements of income, is recognized over the financed device payment term.
Promotions
In connection with certain device payment plan agreements, we may offer a promotion to allow our customers to upgrade to a new device after paying down a certain specified portion of the required device payment plan agreement amount as well as trading in their device in good working order. When a customer enters into a device payment plan agreement with the right to upgrade to a new device, we account for this trade-in right as a guarantee obligation. We recognize a liability measured at fair value for the customer’s right to trade in the device which is determined by considering several factors, including the weighted-average selling prices obtained in recent resales of similar devices eligible for trade-in. At June 30, 2021 and December 31, 2020, the amount of the guarantee liability was $52 million and insignificant, respectively.
We may offer certain promotions that allow a customer to trade in their owned device in connection with the purchase of a new device. Under these types of promotions, the customer receives a credit for the value of the trade-in device. At June 30, 2021 and December 31, 2020, the amount of trade-in liability was $174 million and $70 million, respectively.
In addition, we may provide the customer with additional future billing credits that will be applied against the customer’s monthly bill as long as service is maintained. We recognize a liability measured at fair value, for the customer’s right to trade-in the device which is determined by considering several factors, including the weighted-average selling prices obtained in recent resales of similar devices eligible for trade-in. FutureThese future billing credits are recognized when earned byaccounted for as consideration payable to a customer and are included in the customer. determination of total transaction price, resulting in a contract liability.
Device payment plan agreement receivables, net, does not reflect the trade-in deviceliability, additional future credits or the guarantee liability. At June 30, 2020 and December 31, 2019, the amount of trade-in liability was $55 million and $103 million, respectively.
From time to time, we offer certain marketing promotions that allow our customers to upgrade to a new device after paying down a certain specified portion of the required device payment plan agreement amount as well as trading in their device in good working order. When a
customer enters into a device payment plan agreement with the right to upgrade to a new device, we account for this trade-in right as a guarantee obligation.
Origination of Device Payment Plan Agreements
When originating device payment plan agreements, we use internal and external data sources to create a credit risk score to measure the credit quality of a customer and to determine eligibility for the device payment program. Verizon’s experience has been that the payment attributes of longer tenured customers are highly predictive for estimating their reliability to make future payments. Customers with longer tenures tend to exhibit similar risk characteristics to other customers with longer tenures, and receivables due from customers with longer tenures tend to perform better than receivables from customers that have not previously been Verizon customers. As a result of this experience, we make initial lending decisions based upon whether the customers are "established customers" or "short-tenured customers." If a Consumer customer has been a customer for 45 days or more, or if a Business customer has been a customer for 12 months or more, the customer is considered an "established customer." For established customers, the credit decision and ongoing credit monitoring processes rely on a combination of internal and external data sources. If a Consumer customer has been a customer less than 45 days, or a Business customer has been a customer for less than 12 months, the customer is considered a "short-tenured customer." For short-tenured customers, the credit decision and credit monitoring processes rely more heavily on external data sources.
Internal data and/or external credit data are obtained from the credit reporting agencies, if available, to create a custom credit risk score for Consumer customers. The custom credit risk score is generated automatically from the applicant’s credit data using proprietary custom credit models. The credit risk score measures the likelihood that the potential customer will become severely delinquent and be disconnected for non-payment. For a small portion of short-tenured customer applications, a traditional credit report is not available from one of the national credit reporting agencies because the potential customer does not have sufficient credit history. In those instances, alternative credit data is used for the risk assessment. For Business customers, we also verify the existence of the business with external data sources.
Based on the custom credit risk score, we assign each customer to a credit class, each of which has specified offers of credit including an account level spending limit and either a maximum amount of credit allowed per device or a required down payment percentage. During the fourth quarter 2018, we moved all Consumer customers, short-tenured and established, from a required down payment percentage, between 0 and 100%, to a maximum amount of credit per device.
Credit Quality Information
Subsequent to origination, we assess indicators for the quality of our wireless device payment plan agreement portfolio using two models, one for new customers and one for existing customers. The model for new customers pools all Consumer and Business wireless customers based on 210 days and 12 months or less, respectively, as "new customers." The model for existing customers pools all Consumer and Business wireless customers based on 210 days and 12 months or more, respectively, as "existing customers."
The following table presents device payment plan agreement receivables, at amortized cost, as of June 30, 2020,2021, by credit quality indicator and year of origination:
| | | Year of Origination | | | | Year of Origination | |
| (dollars in millions) | (dollars in millions) | 2020 | | 2019 | | 2018 | | Prior to 2018 | | Total | (dollars in millions) | 2021 | | 2020 | | Prior to 2020(1) | | | Total |
| New customers | New customers | $ | 1,042 | | | $ | 1,360 | | | $ | 169 | | | $ | 43 | | | $ | 2,614 | | New customers | $ | 1,335 | | | $ | 1,183 | | | $ | 218 | | | | $ | 2,736 | |
| Existing customers | Existing customers | 4,964 | | | 7,857 | | | 1,186 | | | 29 | | | 14,036 | | Existing customers | 7,074 | | | 7,072 | | | 1,258 | | | | 15,404 | |
| Total | Total | $ | 6,006 | | | $ | 9,217 | | | $ | 1,355 | | | $ | 72 | | | $ | 16,650 | | Total | $ | 8,409 | | | $ | 8,255 | | | $ | 1,476 | | | | $ | 18,140 | |
(1) Includes accounts that have been suspended at a point in time.
The data presented in the table above was last updated on June 30, 2020.2021.
We assess indicators for the quality of our wireless service receivables portfolio as one overall pool. As of June 30, 2020,2021, wireless service receivables, at amortized cost, originating in 20202021 and 20192020 were $5.0 billion and an insignificant amount, respectively.
Allowance for Credit Losses
The credit quality indicators are used in determining the estimated amount and the timing of expected credit losses for the device payment plan agreement and wireless service receivables portfolios.
19For device payment plan agreement receivables, we record bad debt expense based on a default and loss calculation using our proprietary loss model. The expected loss rate is determined based on customer credit scores and other qualitative factors as noted above. The loss rate is assigned individually on a customer by customer basis and the custom credit scores are then aggregated by vintage and used in our proprietary loss model to calculate the weighted-average loss rate used for determining the allowance balance.
We monitor the collectability of Contentsour wireless service receivables as one overall pool. Wireline service receivables are disaggregated and pooled by the following customer groups: consumer, small and medium business, global enterprise, public sector and wholesale. For wireless service receivables and wireline consumer and small and medium business receivables, the allowance is calculated based on a 12 month rolling average write-off balance multiplied by the average life-cycle of an account from billing to write-off. The risk of loss is assessed over the contractual life of the receivables and is adjusted based on the historical loss amounts for current and future conditions based on management’s qualitative considerations. For global enterprise, public sector and wholesale wireline receivables, the allowance for credit losses is based on historical write-off experience and individual customer credit risk, if applicable.
Activity in the allowance for credit losses by portfolio segment of receivables were as follows:
| | (dollars in millions) | (dollars in millions) | Device Payment Plan Agreement Receivables(1) | | Wireless Service Plan Receivables | (dollars in millions) | Device Payment Plan Agreement Receivables(1) | | Wireless Service Plan Receivables |
| Balance at January 1, 2020 | $ | 472 | | | $ | 156 | | |
| Opening balance sheet adjustment related to Topic 326 adoption | 265 | | | — | | |
| Adjusted opening balance, January 1, 2020 | 737 | | | 156 | | |
| Balance at January 1, 2021 | | Balance at January 1, 2021 | $ | 940 | | | $ | 262 | |
| | Current period provision for expected credit losses | Current period provision for expected credit losses | 449 | | | 252 | | Current period provision for expected credit losses | 235 | | | 87 | |
| Write-offs charged against the allowance | Write-offs charged against the allowance | (415) | | | (208) | | Write-offs charged against the allowance | (365) | | | (238) | |
| Recoveries collected | Recoveries collected | 24 | | | 34 | | Recoveries collected | 23 | | | 34 | |
| Balance at June 30, 2020 | $ | 795 | | | $ | 234 | | |
| Balance at June 30, 2021 | | Balance at June 30, 2021 | $ | 833 | | | $ | 145 | |
(1) Includes allowance for both short-term and long-term device payment plan agreement receivables.
We monitor delinquency and write-off experience based on the quality of our device payment plan agreement and wireless service receivables portfolios. The extent of our collection efforts with respect to a particular customer are based on the results of our proprietary custom internal scoring models that analyze the customer’s past performance to predict the likelihood of the customer falling further delinquent. These custom scoring models assess a number of variables, including origination characteristics, customer account history and payment patterns. Since our customers’ behaviors may be impacted by general economic conditions, we analyzed whether changes in macroeconomic conditions impact our credit loss experience and have concluded that our credit loss estimates are generally not materially impacted by reasonable and supportable forecasts of future economic conditions. Based on the score derived from these models, accounts are grouped by risk category to determine the collection strategy to be applied to such accounts. For device payment plan agreement receivables, we consider an account to be delinquent and in default status if there are unpaid charges remaining on the account on the day after the bill’s due date. For wireless service receivables, an account is considered delinquent 34 days after the bill cycle date. The risk class determines the speed and severity of the collections effort including initiatives taken to facilitate customer payment.
The balance and aging of the device payment plan agreement receivables, at amortized cost, were as follows:
| | | | | | | |
| At June 30, | | |
| (dollars in millions) | 20202021 | | |
| Unbilled | $ | 15,72017,040 | | | |
| Billed: | | | |
| Current | 832948 | | | |
| Past due | 98152 | | | |
| Device payment plan agreement receivables, at amortized cost | $ | 16,65018,140 | | | |
| | |
Note 7.8. Fair Value Measurements |
Recurring Fair Value Measurements
The following table presents the balances of assets and liabilities measured at fair value on a recurring basis as of June 30, 2020:2021:
| | (dollars in millions) | (dollars in millions) | Level 1(1) | | Level 2(2) | | Level 3(3) | | Total | (dollars in millions) | Level 1(1) | | Level 2(2) | | Level 3(3) | | Total |
| Assets: | Assets: | | Assets: | |
| Prepaid expenses and other: | Prepaid expenses and other: | | Prepaid expenses and other: | |
| Interest rate swaps | | Interest rate swaps | $ | 0 | | | $ | 184 | | | $ | 0 | | | $ | 184 | |
| | Cross currency swaps | | Cross currency swaps | 0 | | | 12 | | | 0 | | | 12 | |
| | Foreign exchange forwards | $ | — | | | $ | 5 | | | $ | — | | | $ | 5 | | |
| | Other assets: | Other assets: | | Other assets: | |
| | Fixed income securities | Fixed income securities | — | | | 458 | | | — | | | 458 | | Fixed income securities | 0 | | | 464 | | | 0 | | | 464 | |
| Interest rate swaps | Interest rate swaps | — | | | 1,935 | | | — | | | 1,935 | | Interest rate swaps | 0 | | | 330 | | | 0 | | | 330 | |
| Cross currency swaps | Cross currency swaps | — | | | 89 | | | — | | | 89 | | Cross currency swaps | 0 | | | 1,068 | | | 0 | | | 1,068 | |
| | Interest rate caps | — | | | 1 | | | — | | | 1 | | |
| | | Total | Total | $ | — | | | $ | 2,488 | | | $ | — | | | $ | 2,488 | | Total | $ | 0 | | | $ | 2,058 | | | $ | 0 | | | $ | 2,058 | |
| | Liabilities: | Liabilities: | | Liabilities: | |
| Other current liabilities: | Other current liabilities: | | Other current liabilities: | |
| | Foreign exchange forwards | | Foreign exchange forwards | $ | 0 | | | $ | 13 | | | $ | 0 | | | $ | 13 | |
| Cross currency swaps | | Cross currency swaps | 0 | | | 295 | | | 0 | | | 295 | |
| | Forward starting interest rate swaps | Forward starting interest rate swaps | $ | — | | | $ | 568 | | | $ | — | | | $ | 568 | | Forward starting interest rate swaps | 0 | | | 281 | | | 0 | | | 281 | |
| | Other liabilities: | | Other liabilities: | |
| Interest rate swaps | | Interest rate swaps | 0 | | | 572 | | | 0 | | | 572 | |
| Cross currency swaps | | Cross currency swaps | 0 | | | 462 | | | 0 | | | 462 | |
| | Other liabilities: | | |
| Interest rate swaps | — | | | 340 | | | — | | | 340 | | |
| Cross currency swaps | — | | | 2,590 | | | — | | | 2,590 | | |
| Forward starting interest rate swaps | — | | | 552 | | | — | | | 552 | | |
| Interest rate caps | — | | | 1 | | | — | | | 1 | | |
| | Total | Total | $ | — | | | $ | 4,051 | | | $ | — | | | $ | 4,051 | | Total | $ | 0 | | | $ | 1,623 | | | $ | 0 | | | $ | 1,623 | |
The following table presents the balances of assets and liabilities measured at fair value on a recurring basis as of December 31, 2019:2020:
| | (dollars in millions) | (dollars in millions) | Level 1(1) | | Level 2(2) | | Level 3(3) | | Total | (dollars in millions) | Level 1(1) | | Level 2(2) | | Level 3(3) | | Total |
| Assets: | Assets: | | Assets: | |
| Prepaid expenses and other: | | Prepaid expenses and other: | |
| | Foreign exchange forwards | | Foreign exchange forwards | $ | 0 | | | $ | 12 | | | $ | 0 | | | $ | 12 | |
| | Other assets: | Other assets: | | Other assets: | |
| | Fixed income securities | Fixed income securities | $ | — | | | $ | 442 | | | $ | — | | | $ | 442 | | Fixed income securities | 0 | | | 459 | | | 0 | | | 459 | |
| Interest rate swaps | Interest rate swaps | — | | | 568 | | | — | | | 568 | | Interest rate swaps | 0 | | | 787 | | | 0 | | | 787 | |
| Cross currency swaps | Cross currency swaps | — | | | 211 | | | — | | | 211 | | Cross currency swaps | 0 | | | 1,446 | | | 0 | | | 1,446 | |
| | Foreign exchange forwards | — | | | 5 | | | — | | | 5 | | |
| | | Total | Total | $ | — | | | $ | 1,226 | | | $ | — | | | $ | 1,226 | | Total | $ | 0 | | | $ | 2,704 | | | $ | 0 | | | $ | 2,704 | |
| | | | | |
| Liabilities: | Liabilities: | | Liabilities: | |
| Other current liabilities: | | Other current liabilities: | |
| | Forward starting interest rate swaps | | Forward starting interest rate swaps | $ | 0 | | | $ | 409 | | | $ | 0 | | | $ | 409 | |
| | Foreign exchange forwards | | Foreign exchange forwards | 0 | | | 2 | | | 0 | | | 2 | |
| | Other liabilities: | Other liabilities: | | Other liabilities: | |
| Interest rate swaps | Interest rate swaps | $ | — | | | $ | 173 | | | $ | — | | | $ | 173 | | Interest rate swaps | 0 | | | 303 | | | 0 | | | 303 | |
| Cross currency swaps | Cross currency swaps | — | | | 912 | | | — | | | 912 | | Cross currency swaps | 0 | | | 196 | | | 0 | | | 196 | |
| Forward starting interest rate swaps | Forward starting interest rate swaps | — | | | 604 | | | — | | | 604 | | Forward starting interest rate swaps | 0 | | | 388 | | | 0 | | | 388 | |
| | Total | Total | $ | — | | | $ | 1,689 | | | $ | — | | | $ | 1,689 | | Total | $ | 0 | | | $ | 1,298 | | | $ | 0 | | | $ | 1,298 | |
(1)Quoted prices in active markets for identical assets or liabilities.
(2)Observable inputs other than quoted prices in active markets for identical assets and liabilities.
(3)Unobservable pricing inputs in the market.
Certain of our equity investments do not have readily determinable fair values and are excluded from the tables above. Such investments are measured at cost, less any impairment, plus or minus changes resulting from observable price changes in orderly transactions for an identical or similar investment of the same issuer and are included in Investments in unconsolidated businesses in our condensed consolidated balance sheets. As of June 30, 20202021 and December 31, 2019,2020, the carrying amount of our investments without readily determinable fair values were $301$413 million and $284$402 million, respectively. During both the three and six months ended June 30, 2020,2021, there were insignificant adjustments due to observable price changes and there were insignificant impairment charges.changes. Cumulative adjustments due to observable price changes and impairment charges were insignificant.$87 million.
Fixed income securities consist primarily of investments in municipal bonds. ForThe valuation of the fixed income securities that do not haveare based on the quoted prices for similar assets in active markets we use alternative matrix pricing resultingor identical assets in inactive markets or models that apply inputs from observable market data. The valuation determines that these debt securities beingare classified as Level 2.
Derivative contracts are valued using models based on readily observable market parameters for all substantial terms of our derivative contracts and thus are classified within Level 2. We use mid-market pricing for fair value measurements of our derivative instruments. Our
derivative instruments are recorded on a gross basis. Cash flows from derivatives designated in a qualifying hedging relationship are classified in the same category as the cash flows from the hedged items.
We recognize transfers between levels of the fair value hierarchy as of the end of the reporting period.
Fair Value of Short-term and Long-term Debt
The fair value of our debt is determined using various methods, including quoted prices for identical debt instruments, which is a Level 1 measurement, as well as quoted prices for similar debt instruments with comparable terms and maturities, which is a Level 2 measurement.
The fair value of our short-term and long-term debt, excluding finance leases, was as follows:
| | | | | | | | | | | | | | | | | | | | | | | | | | | | | |
| | | | Fair Value | | | | | | |
| (dollars in millions) | Carrying
Amount | | Level 1 | | Level 2 | | Level 3 | | Total |
| At December 31, 2019 | $ | 110,373 | | | $ | 86,712 | | | $ | 42,488 | | | $ | — | | | $ | 129,200 | |
| At June 30, 2020 | 111,631 | | | 89,504 | | | 47,916 | | | — | | | 137,420 | |
| | | | | | | | | | | | | | | | | | | | | | | | | | | | | |
| | | | Fair Value |
| (dollars in millions) | Carrying
Amount | | Level 1 | | Level 2 | | Level 3 | | Total |
| At December 31, 2020 | $ | 127,778 | | | $ | 103,967 | | | $ | 52,785 | | | $ | 0 | | | $ | 156,752 | |
| At June 30, 2021 | 150,641 | | | 112,613 | | | 61,703 | | | 0 | | | 174,316 | |
Derivative Instruments
We enter into derivative transactions primarily to manage our exposure to fluctuations in foreign currency exchange rates and interest rates. We employ risk management strategies, which may include the use of a variety of derivatives including interest rate swaps, cross currency swaps, forward starting interest rate swaps, treasury rate locks, interest rate caps and foreign exchange forwards. We do not hold derivatives for trading purposes.
The following table sets forth the notional amounts of our outstanding derivative instruments:
| | | At June 30, | | At December 31, | | At June 30, | | At December 31, |
| (dollars in millions) | (dollars in millions) | 2020 | | 2019 | (dollars in millions) | 2021 | | 2020 |
| Interest rate swaps | Interest rate swaps | $ | 16,996 | | | $ | 17,004 | | Interest rate swaps | $ | 17,608 | | | $ | 17,768 | |
| Cross currency swaps | Cross currency swaps | 24,740 | | | 23,070 | | Cross currency swaps | 32,502 | | | 26,288 | |
| Forward starting interest rate swaps | Forward starting interest rate swaps | 2,000 | | | 3,000 | | Forward starting interest rate swaps | 1,000 | | | 2,000 | |
| Interest rate caps | 158 | | | 679 | | |
| | Foreign exchange forwards | Foreign exchange forwards | 960 | | | 1,130 | | Foreign exchange forwards | 1,490 | | | 1,405 | |
|
Interest Rate Swaps
We enter into interest rate swaps to achieve a targeted mix of fixed and variable rate debt. We principally receive fixed rates and pay variable rates, that are currently based on LIBOR, resulting in a net increase or decrease to Interest expense. These swaps are designated as fair value hedges and hedge against interest rate risk exposure of designated debt issuances. We record the interest rate swaps at fair value in our condensed consolidated balance sheets as assets and liabilities. Changes in the fair value of the interest rate swaps are recorded to Interest expense, which are offset by changes in the fair value of the hedged debt due to changes in interest rates.
During the three months ended June 30, 2021, we entered into and settled interest rate swaps with a total notional value of $1.6 billion and $1.8 billion, respectively. During the six months ended June 30, 2021, we entered into and settled interest rate swaps with a total notional value of $2.6 billion and $2.7 billion, respectively. During the three months ended June 30, 2020, we did 0t enter into any interest rate swaps and we settled interest rate swaps with a total notional value of $929 million. During the six months ended June 30, 2020, we entered into and settled interest rate swaps with a total notional value of $2.4 billion. During
The ineffective portion of these interest rate swaps were 0 and an insignificant amount of gains for the three months ended June 30, 2019, we did 0t enter into or settle any interest rate swaps. During theand six months ended June 30, 2019, we entered into and settled interest rate swaps with a total notional value of $510 million and $1.2 billion,2021, respectively.
The ineffective portion of these interest rate swaps were losses of an insignificant amount and gains of $56 million for the three and six months ended June 30, 2020, respectively. The ineffective portion of these interest rate swaps were gains of an insignificant amount and $60 million for the three and six months ended June 30, 2019, respectively.
The following amounts were recorded in Long-term debt in our condensed consolidated balance sheets related to cumulative basis adjustments for fair value hedges:
| | | At June 30, | | At December 31, | | At June 30, | | At December 31, |
| (dollars in millions) | (dollars in millions) | 2020 | | 2019 | (dollars in millions) | 2021 | | 2020 |
| Carrying amount of hedged liabilities | Carrying amount of hedged liabilities | $ | 18,438 | | | $ | 17,337 | | Carrying amount of hedged liabilities | $ | 18,021 | | | $ | 18,849 | |
| Cumulative amount of fair value hedging adjustment included in the carrying amount of the hedged liabilities | Cumulative amount of fair value hedging adjustment included in the carrying amount of the hedged liabilities | 1,544 | | | 433 | | Cumulative amount of fair value hedging adjustment included in the carrying amount of the hedged liabilities | 25 | | | 557 | |
| Cumulative amount of fair value hedging adjustment remaining for which hedge accounting has been discontinued | | Cumulative amount of fair value hedging adjustment remaining for which hedge accounting has been discontinued | 637 | | | 627 | |
Cross Currency Swaps
We have entered into cross currency swaps designated as cash flow hedges to exchange our British Pound Sterling, Euro, Swiss Franc, Canadian Dollar and Australian Dollar-denominated cash flows into U.S. dollars and to fix our cash payments in U.S. dollars, as well as to mitigate the impact of foreign currency transaction gains or losses.
During the three months ended June 30, 2021, we did 0t enter into or settle any cross currency swaps. During the six months ended June 30, 2021, we entered into cross currency swaps with a total notional value of $6.2 billion and we did 0t settle any cross currency swaps. During the three and six months ended June 30, 2021, a pre-tax loss of $701 million and $927 million, respectively, was recognized in Other comprehensive income (loss). During both the three and six months ended June 30, 2020, we entered into cross currency swaps with a total notional value of $3.3 billion and we settled cross currency swaps with a total notional value of $1.6 billion. During the three and six months ended June 30, 2020, a pre-tax gain of $1.0 billion and a pre-tax loss of $1.9 billion, respectively, were recognized in Other comprehensive income (loss). During the three and six months ended June 30, 2019, we entered into cross currency swaps with a total notional value of $3.5 billion and we did 0t settle any cross currency swaps. During the three and six months ended June 30, 2019, pre-tax losses of $340 million and $328 million, respectively, were recognized in Other comprehensive income (loss). A portion of the gains recognized in Other comprehensive income (loss) was reclassified to Other income (expense), net to offset the related pre-tax foreign currency transaction gain or loss on the underlying hedged item. See Note 10 for additional information.
Forward Starting Interest Rate Swaps
We have entered into forward starting interest rate swaps designated as cash flow hedges in order to manage our exposure to interest rate changes on future forecasted transactions. We hedge our exposure to the variability in future cash flows based on the expected maturities of the related forecasted debt issuance.
During both the three and six months ended June 30, 2021 and 2020, we did 0t enter into any new forward starting interest rate swaps. During both the three months ended June 30, 2021 and 2020, we did 0t settle any forward starting interest rate swaps. During both the six months ended June 30, 2021 and 2020, we settled forward starting interest rate swaps with a total notional value of $1.0 billion. During the six months ended June 30, 2021 and 2020, we paid $237 million and $293 million, respectively, for the settlement of forward starting interest rate swaps, which was recorded in Other, net within Cash Flow from Operating Activities. During the three and six months ended June 30, 2019, we did 0t enter into any new forward starting2021, a pre-tax loss of $121 million and a pre-tax gain of $279 million, respectively, were recognized in Other comprehensive income (loss),
resulting from interest rate swaps. During the three months ended June 30, 2019, we did 0t settle any forward starting interest rate swaps and, for the six months ended June 30, 2019, we settled forward starting interest rate swaps with a total notional value of $1.0 billion.movements. During the three and six months ended June 30, 2020, an insignificant pre-tax gain and a pre-tax loss of $809 million, respectively, were recognized in Other comprehensive income (loss), resulting from interest rate movements. During the three and six months ended June 30, 2019, pre-tax losses of $293 million and $497 million, respectively, werewas recognized in Other comprehensive income (loss), resulting from interest rate movements.
Treasury Rate Locks
We enter into treasury rate locks to mitigate our future interest rate risk. During both the three months ended June 30, 2021 and 2020, we did 0t enter into or settle any treasury rate locks designated as cash flow hedges, and we did 0t recognize any amount in our condensed consolidated financial statement.Other comprehensive income (loss). During the six months ended June 30, 2021, we entered into and settled treasury rate locks designated as cash flow hedges with a total notional value of $4.7 billion, and we recognized $251 million in Other comprehensive income (loss). During the six months ended June 30, 2021, we received $251 million from the settlement of treasury rate locks designated as cash flow hedges, which was recorded in Other, net within Cash Flow from Operating Activities. During the six months ended June 30, 2020, we entered into and settled treasury rate locks designated as cash flow hedges with a total notional value of $500 million, and we recognized an insignificant pre-tax loss in Other comprehensive income (loss). During the three and six months ended June 30, 2019, we did 0t enter into or settle any treasury rate locks designated as cash flow hedges, and we did 0t recognize any amount in our condensed consolidated financial statements.
Net Investment Hedges
We have designated certain foreign currency debt instruments as net investment hedges to mitigate foreign exchange exposure related to non-U.S. dollar net investments in certain foreign subsidiaries against changes in foreign exchange rates. In March 2021, we de-designated the existing net investment hedge and designated a new net investment hedge using a different Euro-denominated note. The notional amount of the Euro-denominated debt designated as a net investment hedge was €750 million as of both June 30, 20202021 and December 31, 2019.2020.
Undesignated Derivatives
We also have the following derivative contracts which we use as economic hedges but for which we have elected not to apply hedge accounting.
Interest Rate Caps
We enter into interest rate caps to mitigate our interest exposure to interest rate increases on our ABS Financing Facilities and ABS Notes. We recognized insignificant pre-tax losses in Interest expense during the three and six months ended June 30, 2020 and 2019.
Foreign Exchange Forwards
We enter into British Pound Sterling and Euro foreign exchange forwards to mitigate our foreign exchange rate risk related to non-functional currency denominated monetary assets and liabilities of international subsidiaries, as well as foreign exchange risk related to debt settlements. During the three months ended June 30, 2021, we entered into and settled foreign exchange forwards with a total notional value of $3.7 billion and $3.5 billion, respectively. During the six months ended June 30, 2021, we entered into and settled foreign exchange forwards with a total notional value of $7.2 billion and $7.1 billion, respectively. During the three months ended June 30, 2020, we entered into and settled foreign exchange forwards with a total notional value of $4.3 billion and $4.2 billion, respectively. During the six months ended June 30, 2020, we entered into and settled foreign exchange forwards with a total notional value of $6.9 billion and $7.1 billion, respectively. During the three months ended June 30, 2019, we entered into and settled foreign exchange forwards with a total notional value of $3.1 billion and $3.0 billion, respectively. During the six months ended June 30, 2019, we entered into2021, insignificant pre-tax gains and settled foreign exchange forwards with a total notional value of $6.1 billion and $5.6 billion, respectively.insignificant pre-tax losses, respectively, were recognized in Other income (expense), net. During the three and six months ended June 30, 2020, pre-tax gains of $81 million and an insignificant amount, respectively, were recognized in Other income (expense), net. During the three and six months ended June 30, 2019, insignificant pre-tax losses were recognized in Other income (expense), net.
Treasury Rate Locks
We enter into treasury rate locks to mitigate our future interest rate risk. During both the three and six months ended June 30, 2021, we did 0t enter into or settle any treasury rate locks that were not designated in hedging relationships, and we did 0t recognize any amount in our condensed consolidated financial statement. During the three months ended June 30, 2020, we did 0t enter into or settle any treasury rate locks, and we did 0t recognize any amount in our condensed consolidated financial statement.statements. During the six months ended June 30, 2020, we entered into and settled treasury rate locks with a total notional value of $1.6 billion, and we recognized an insignificant
pre-tax gain in Interest expense. During the three and six months ended June 30, 2019, we did 0t enter into or settle any treasury rate locks, and we did 0t recognize any amount in our condensed consolidated financial statements.
Concentrations of Credit Risk
Financial instruments that subject us to concentrations of credit risk consist primarily of temporary cash investments, short-term and long-term investments, trade receivables, including device payment plan agreement receivables, certain notes receivable, including lease receivables, and derivative contracts.
Counterparties to our derivative contracts are major financial institutions with whom we have negotiated derivatives agreements (ISDA master agreements) and credit support annex (CSA) agreements which provide rules for collateral exchange. The CSA agreements contain rating based thresholds such that we or our counterparties may be required to hold or post collateral based upon changes in outstanding positions as compared to established thresholds and changes in credit ratings. We do not offset fair value amounts recognized for derivative instruments and fair value amounts recognized for the right to reclaim cash collateral or the obligation to return cash collateral arising from derivative instruments recognized at fair value. At June 30, 2020,2021, we held $0.3$0.1 billion and posted an insignificant amount of collateral related to derivative contracts under collateral exchange agreements, which were recorded as Other current liabilities and Prepaid expenses and other, respectively, in our condensed consolidated balance sheet. At December 31, 2019,2020, we held an insignificant amount$0.2 billion of collateral related to derivative contracts under collateral exchange arrangements, which were recorded as Other current liabilities in our condensed consolidated balance sheet. While we may be exposed to credit losses due to the nonperformance of our counterparties, we consider the risk remote and do not expect that any such nonperformance would result in a significant effect on our results of operations or financial condition due to our diversified pool of counterparties.
| | |
Note 8.9. Employee Benefits |
We maintain non-contributory defined benefit pension plans for certain employees. In addition, we maintain postretirement health care and life insurance plans for certain retirees and their dependents, which are both contributory and non-contributory, and include a limit on our share of the cost for certain current and future retirees. In accordance with our accounting policy for pension and other postretirement benefits, operating expenses include service costs associated with pension and other postretirement benefits while other credits and/or charges based on actuarial assumptions, including projected discount rates, an estimated return on plan assets, and impact from health care trend rates are reported in Other income (expense), net. These estimates are updated in the fourth quarter to reflect actual return on plan assets and updated actuarial assumptions or upon a remeasurement event. The adjustment is recognized in the income statement during the fourth quarter or upon a remeasurement event pursuant to our accounting policy for the recognition of actuarial gains and losses.
Net Periodic Benefit Cost (Income)
The following table summarizes the components of net periodic benefit cost (income) related to our pension and postretirement health care and life insurance plans:
| | | (dollars in millions) | | | (dollars in millions) |
| | Pension | | | Health Care and Life | | | Pension | | Health Care and Life |
| Three Months Ended June 30, | Three Months Ended June 30, | 2020 | | 2019 | | 2020 | | 2019 | Three Months Ended June 30, | 2021 | | 2020 | | 2021 | | 2020 |
| Service cost - Cost of services | Service cost - Cost of services | $ | 59 | | | $ | 50 | | | $ | 23 | | | $ | 19 | | Service cost - Cost of services | $ | 62 | | | $ | 59 | | | $ | 23 | | | $ | 23 | |
| Service cost - Selling, general and administrative expense | Service cost - Selling, general and administrative expense | 14 | | | 12 | | | 5 | | | 5 | | Service cost - Selling, general and administrative expense | 9 | | | 14 | | | 5 | | | 5 | |
| Service cost | Service cost | $ | 73 | | | $ | 62 | | | $ | 28 | | | $ | 24 | | Service cost | $ | 71 | | | $ | 73 | | | $ | 28 | | | $ | 28 | |
| | Amortization of prior service cost (credit) | Amortization of prior service cost (credit) | $ | 15 | | | $ | 16 | | | $ | (242) | | | $ | (243) | | Amortization of prior service cost (credit) | $ | 15 | | | $ | 15 | | | $ | (224) | | | $ | (242) | |
| Expected return on plan assets | Expected return on plan assets | (296) | | | (282) | | | (6) | | | (10) | | Expected return on plan assets | (309) | | | (296) | | | (5) | | | (6) | |
| Interest cost | Interest cost | 137 | | | 176 | | | 107 | | | 158 | | Interest cost | 99 | | | 137 | | | 73 | | | 107 | |
| Remeasurement loss, net | 153 | | | — | | | — | | | — | | |
| Remeasurement loss (gain), net | | Remeasurement loss (gain), net | (1,314) | | | 153 | | | 0 | | | 0 | |
| | Other components | Other components | $ | 9 | | | $ | (90) | | | $ | (141) | | | $ | (95) | | Other components | $ | (1,509) | | | $ | 9 | | | $ | (156) | | | $ | (141) | |
| | Total | Total | $ | 82 | | | $ | (28) | | | $ | (113) | | | $ | (71) | | Total | $ | (1,438) | | | $ | 82 | | | $ | (128) | | | $ | (113) | |
| | | | | | | | | | | | | | | | | | | | | | | |
| (dollars in millions) | | | | | | |
| Pension | | | | Health Care and Life | | |
| Six Months Ended June 30, | 2020 | | 2019 | | 2020 | | 2019 |
| Service cost - Cost of services | $ | 118 | | | $ | 100 | | | $ | 45 | | | $ | 39 | |
| Service cost - Selling, general and administrative expense | 28 | | | 23 | | | 10 | | | 9 | |
| Service cost | $ | 146 | | | $ | 123 | | | $ | 55 | | | $ | 48 | |
| | | | | | | |
| Amortization of prior service cost (credit) | $ | 30 | | | $ | 31 | | | $ | (483) | | | $ | (486) | |
| Expected return on plan assets | (593) | | | (564) | | | (13) | | | (19) | |
| Interest cost | 277 | | | 354 | | | 214 | | | 315 | |
| Remeasurement loss (gain), net | 335 | | | (96) | | | — | | | — | |
| | | | | | | |
| Other components | $ | 49 | | | $ | (275) | | | $ | (282) | | | $ | (190) | |
| | | | | | | |
| Total | $ | 195 | | | $ | (152) | | | $ | (227) | | | $ | (142) | |
| | | | | | | | | | | | | | | | | | | | | | | |
| (dollars in millions) |
| Pension | | Health Care and Life |
| Six Months Ended June 30, | 2021 | | 2020 | | 2021 | | 2020 |
| Service cost - Cost of services | $ | 127 | | | $ | 118 | | | $ | 47 | | | $ | 45 | |
| Service cost - Selling, general and administrative expense | 18 | | | 28 | | | 10 | | | 10 | |
| Service cost | $ | 145 | | | $ | 146 | | | $ | 57 | | | $ | 55 | |
| | | | | | | |
| Amortization of prior service cost (credit) | $ | 30 | | | $ | 30 | | | $ | (447) | | | $ | (483) | |
| Expected return on plan assets | (618) | | | (593) | | | (11) | | | (13) | |
| Interest cost | 194 | | | 277 | | | 145 | | | 214 | |
| Remeasurement loss (gain), net | (1,314) | | | 335 | | | 0 | | | 0 | |
| | | | | | | |
| Other components | $ | (1,708) | | | $ | 49 | | | $ | (313) | | | $ | (282) | |
| | | | | | | |
| Total | $ | (1,563) | | | $ | 195 | | | $ | (256) | | | $ | (227) | |
The service cost component of net periodic benefit cost (income) is recorded in Cost of services and Selling, general and administrative expense in the condensed consolidated statements of income while the other components, including remeasurement adjustments, if any, are recorded in Other income (expense), net.
2018 Voluntary Separation Program
In December 2018, eligible employees began separating from the Company under a Voluntary Separation Program. The program finished at the end of June 2019. The severance benefits payments to these employees were substantially completed by the end of September 2019.
Severance Payments
During the three and six months ended June 30, 2020,2021, we paid severance benefits of $52 millionan insignificant amount and $175$129 million, respectively. During the six months ended June 30, 2020,2021, we recorded net pre-tax severance charges of an insignificant amount. At June 30, 2020,2021, we had a remaining severance liability of $443$490 million, a portion of which includes future contractual payments to separated employees.
Employer Contributions
During both the three and six months ended June 30, 2021 and June 30, 2020, we made 0 contributions to our qualified pension plans. During both the threeplans and six months ended June 30, 2020, we made insignificant contributions to our nonqualified pension plans. During the six months ended June 30, 2019, we made a discretionary pension contribution of $300 million to our qualified pension plans. We do not expect mandatory pension funding through December 31, 2020.2021. There have been no significant changes with respect to the nonqualified pension and other postretirement benefit plans contributions in 2020.2021.
Remeasurement loss (gain), net
During both the three and six months ended June 30, 2020,2021, we recorded neta pre-tax remeasurement lossesgain of $153 million and $335 million$1.3 billion in our pension plans respectively, triggered by settlements.settlements, primarily driven by a $1.2 billion credit mainly due to changes in our discount rate and changes in our lump sum interest rate assumptions used to determine the current year liabilities of our pension plans and a $122 million credit resulting from the difference between our estimated and our actual return on assets.
During the three months ended June 30, 2020, we recorded a net pre-tax remeasurement loss of $153 million primarily driven by a $163 million charge mainly due toresulting from the difference between our estimated return on assets and our actual return on assets and changes in our lump sum interest rate assumptions used to determine the current year liabilities of our pension plans, offset by a credit due to changes in our discount rate.
During the three months ended March 31, 2020, we recorded a net pre-tax remeasurement loss of $182 million primarily driven by a $196 million charge mainly due to changes in our discount rate and lump sum interest rate assumptions used to determine the current year liabilities of our pension plans, offset by a credit due toresulting from the difference between our estimated return on assets and our actual return on assets.
During the six months ended June 30, 2019, we recorded a net pre-tax remeasurement gain of $96 million in our pension plans triggered by the Voluntary Separation Program for select U.S.-based management employees and other headcount reduction initiatives, primarily driven by a $150 million credit due to the difference between our estimated return on assets and our actual return on assets, offset by a $54 million charge due to a change in our discount rate assumption used to determine the current year liabilities of our pension plans.
| | |
Note 9.10. Equity and Accumulated Other Comprehensive Income (Loss) |
Equity
Changes in the components of Total equity were as follows:
| | | (dollars in millions, except per share amounts, and shares in thousands) | (dollars in millions, except per share amounts, and shares in thousands) | | (dollars in millions, except per share amounts, and shares in thousands) |
| Three months ended June 30, | Three months ended June 30, | 2020 | | 2019 | | Three months ended June 30, | 2021 | | 2020 | |
| | Shares | | Amount | | Shares | | Amount | | | Shares | | Amount | | Shares | | Amount | |
| Common Stock | Common Stock | | Common Stock | |
| Balance at beginning of period | Balance at beginning of period | 4,291,434 | | | $ | 429 | | | 4,291,434 | | | $ | 429 | | | Balance at beginning of period | 4,291,434 | | | $ | 429 | | | 4,291,434 | | | $ | 429 | | |
| | Balance at end of period | Balance at end of period | 4,291,434 | | | 429 | | | 4,291,434 | | | 429 | | | Balance at end of period | 4,291,434 | | | 429 | | | 4,291,434 | | | 429 | | |
| | Additional Paid In Capital | Additional Paid In Capital | | Additional Paid In Capital | |
| Balance at beginning of period | Balance at beginning of period | | 13,302 | | | 13,418 | | | Balance at beginning of period | | 13,408 | | | 13,302 | | |
| | Other | Other | | (21) | | | 1 | | | Other | | (5) | | | (21) | | |
| Balance at end of period | Balance at end of period | | 13,281 | | | 13,419 | | | Balance at end of period | | 13,403 | | | 13,281 | | |
| | Retained Earnings | Retained Earnings | | Retained Earnings | |
| Balance at beginning of period | Balance at beginning of period | | 54,557 | | | 46,493 | | | Balance at beginning of period | | 63,107 | | | 54,557 | | |
| | Net income attributable to Verizon | Net income attributable to Verizon | | 4,700 | | | 3,944 | | | Net income attributable to Verizon | | 5,800 | | | 4,700 | | |
| Dividends declared ($0.6150, $0.6025 per share) | | (2,544) | | | (2,492) | | | |
| Dividends declared ($0.6275, $0.6150 per share) | | Dividends declared ($0.6275, $0.6150 per share) | | (2,597) | | | (2,544) | | |
| Other | Other | | 33 | | | — | | | Other | | 0 | | | 33 | | |
| Balance at end of period | Balance at end of period | | 56,746 | | | 47,945 | | | Balance at end of period | | 66,310 | | | 56,746 | | |
| | Accumulated Other Comprehensive Income (Loss) | Accumulated Other Comprehensive Income (Loss) | | Accumulated Other Comprehensive Income (Loss) | |
| Balance at beginning of period attributable to Verizon | Balance at beginning of period attributable to Verizon | | (1,502) | | | 2,216 | | | Balance at beginning of period attributable to Verizon | | 640 | | | (1,502) | | |
| | Foreign currency translation adjustments | Foreign currency translation adjustments | | 77 | | | (67) | | | Foreign currency translation adjustments | | 58 | | | 77 | | |
| Unrealized gain (loss) on cash flow hedges | Unrealized gain (loss) on cash flow hedges | | 314 | | | (537) | | | Unrealized gain (loss) on cash flow hedges | | (777) | | | 314 | | |
| Unrealized gain on marketable securities | | 6 | | | 4 | | | |
| Unrealized gain (loss) on marketable securities | | Unrealized gain (loss) on marketable securities | | 0 | | | 6 | | |
| Defined benefit pension and postretirement plans | Defined benefit pension and postretirement plans | | (169) | | | (169) | | | Defined benefit pension and postretirement plans | | (155) | | | (169) | | |
| Other comprehensive income (loss) | Other comprehensive income (loss) | | 228 | | | (769) | | | Other comprehensive income (loss) | | (874) | | | 228 | | |
| Balance at end of period attributable to Verizon | Balance at end of period attributable to Verizon | | (1,274) | | | 1,447 | | | Balance at end of period attributable to Verizon | | (234) | | | (1,274) | | |
| | Treasury Stock | Treasury Stock | | Treasury Stock | |
| Balance at beginning of period | Balance at beginning of period | (153,438) | | | (6,725) | | | (155,727) | | | (6,825) | | | Balance at beginning of period | (151,366) | | | (6,634) | | | (153,438) | | | (6,725) | | |
| | Employee plans | Employee plans | 58 | | | 3 | | | 58 | | | 2 | | | Employee plans | 48 | | | 2 | | | 58 | | | 3 | | |
| | Balance at end of period | Balance at end of period | (153,380) | | | (6,722) | | | (155,669) | | | (6,823) | | | Balance at end of period | (151,318) | | | (6,632) | | | (153,380) | | | (6,722) | | |
| | Deferred Compensation-ESOPs and Other | Deferred Compensation-ESOPs and Other | | Deferred Compensation-ESOPs and Other | |
| Balance at beginning of period | Balance at beginning of period | | 149 | | | 125 | | | Balance at beginning of period | | 282 | | | 149 | | |
| Restricted stock equity grant | Restricted stock equity grant | | 157 | | | 44 | | | Restricted stock equity grant | | 131 | | | 157 | | |
| Amortization | Amortization | | (69) | | | (4) | | | Amortization | | (5) | | | (69) | | |
| Balance at end of period | Balance at end of period | | 237 | | | 165 | | | Balance at end of period | | 408 | | | 237 | | |
| | Noncontrolling Interests | Noncontrolling Interests | | Noncontrolling Interests | |
| Balance at beginning of period | Balance at beginning of period | | 1,443 | | | 1,604 | | | Balance at beginning of period | | 1,451 | | | 1,443 | | |
| | Total comprehensive income | Total comprehensive income | | 139 | | | 130 | | | Total comprehensive income | | 149 | | | 139 | | |
| Distributions and other | Distributions and other | | (166) | | | (369) | | | Distributions and other | | (172) | | | (166) | | |
| Balance at end of period | Balance at end of period | | 1,416 | | | 1,365 | | | Balance at end of period | | 1,428 | | | 1,416 | | |
| Total Equity | Total Equity | | $ | 64,113 | | | $ | 57,947 | | | Total Equity | | $ | 75,112 | | | $ | 64,113 | | |
| | | (dollars in millions, except per share amounts, and shares in thousands) | (dollars in millions, except per share amounts, and shares in thousands) | | (dollars in millions, except per share amounts, and shares in thousands) |
| Six months ended June 30, | Six months ended June 30, | 2020 | | 2019 | | Six months ended June 30, | 2021 | | 2020 | |
| | Shares | | Amount | | Shares | | Amount | | | Shares | | Amount | | Shares | | Amount | |
| Common Stock | Common Stock | | Common Stock | |
| Balance at beginning of year | Balance at beginning of year | 4,291,434 | | | $ | 429 | | | 4,291,434 | | | $ | 429 | | | Balance at beginning of year | 4,291,434 | | | $ | 429 | | | 4,291,434 | | | $ | 429 | | |
| | Balance at end of period | Balance at end of period | 4,291,434 | | | 429 | | | 4,291,434 | | | 429 | | | Balance at end of period | 4,291,434 | | | 429 | | | 4,291,434 | | | 429 | | |
| | Additional Paid In Capital | Additional Paid In Capital | | Additional Paid In Capital | |
| Balance at beginning of year | Balance at beginning of year | | 13,419 | | | 13,437 | | | Balance at beginning of year | | 13,404 | | | 13,419 | | |
| | Other | Other | | (138) | | | (18) | | | Other | | (1) | | | (138) | | |
| Balance at end of period | Balance at end of period | | 13,281 | | | 13,419 | | | Balance at end of period | | 13,403 | | | 13,281 | | |
| | Retained Earnings | Retained Earnings | | Retained Earnings | |
| Balance at beginning of year | Balance at beginning of year | | 53,147 | | | 43,542 | | | Balance at beginning of year | | 60,464 | | | 53,147 | | |
| Opening balance sheet adjustment | Opening balance sheet adjustment | | (200) | | (1) | | 410 | | (2) | Opening balance sheet adjustment | | 0 | |
| | (200) | | (1) |
| Adjusted opening balance | Adjusted opening balance | | 52,947 | | | 43,952 | | | Adjusted opening balance | | 60,464 | | | 52,947 | | |
| Net income attributable to Verizon | Net income attributable to Verizon | | 8,856 | | | 8,976 | | | Net income attributable to Verizon | | 11,045 | | | 8,856 | | |
| Dividends declared ($1.2300, $1.2050 per share) | | (5,090) | | | (4,983) | | | |
| Dividends declared ($1.2550, $1.2300 per share) | | Dividends declared ($1.2550, $1.2300 per share) | | (5,199) | | | (5,090) | | |
| Other | Other | | 33 | | | — | | | Other | | 0 | | | 33 | | |
| Balance at end of period | Balance at end of period | | 56,746 | | | 47,945 | | | Balance at end of period | | 66,310 | | | 56,746 | | |
| | Accumulated Other Comprehensive Income (Loss) | Accumulated Other Comprehensive Income (Loss) | | Accumulated Other Comprehensive Income (Loss) | |
| Balance at beginning of year attributable to Verizon | Balance at beginning of year attributable to Verizon | | 998 | | | 2,370 | | | Balance at beginning of year attributable to Verizon | | (71) | | | 998 | | |
| | Foreign currency translation adjustments | Foreign currency translation adjustments | | (43) | | | (43) | | | Foreign currency translation adjustments | | 20 | | | (43) | | |
| Unrealized loss on cash flow hedges | | (1,896) | | | (550) | | | |
| Unrealized gain on marketable securities | | 5 | | | 8 | | | |
| Unrealized gain (loss) on cash flow hedges | | Unrealized gain (loss) on cash flow hedges | | 132 | | | (1,896) | | |
| Unrealized gain (loss) on marketable securities | | Unrealized gain (loss) on marketable securities | | (5) | | | 5 | | |
| Defined benefit pension and postretirement plans | Defined benefit pension and postretirement plans | | (338) | | | (338) | | | Defined benefit pension and postretirement plans | | (310) | | | (338) | | |
| Other comprehensive loss | Other comprehensive loss | | (2,272) | | | (923) | | | Other comprehensive loss | | (163) | | | (2,272) | | |
| Balance at end of period attributable to Verizon | Balance at end of period attributable to Verizon | | (1,274) | | | 1,447 | | | Balance at end of period attributable to Verizon | | (234) | | | (1,274) | | |
| | Treasury Stock | Treasury Stock | | Treasury Stock | |
| Balance at beginning of year | Balance at beginning of year | (155,606) | | | (6,820) | | | (159,400) | | | (6,986) | | | Balance at beginning of year | (153,304) | | | (6,719) | | | (155,606) | | | (6,820) | | |
| | Employee plans | Employee plans | 2,222 | | | 98 | | | 3,726 | | | 163 | | | Employee plans | 1,983 | | | 87 | | | 2,222 | | | 98 | | |
| Shareholder plans | Shareholder plans | 4 | | | — | | | 5 | | | — | | | Shareholder plans | 3 | | | 0 | | | 4 | | | 0 | | |
| | Balance at end of period | Balance at end of period | (153,380) | | | (6,722) | | | (155,669) | | | (6,823) | | | Balance at end of period | (151,318) | | | (6,632) | | | (153,380) | | | (6,722) | | |
| | Deferred Compensation-ESOPs and Other | Deferred Compensation-ESOPs and Other | | Deferred Compensation-ESOPs and Other | |
| Balance at beginning of year | Balance at beginning of year | | 222 | | | 353 | | | Balance at beginning of year | | 335 | | | 222 | | |
| Restricted stock equity grant | Restricted stock equity grant | | 172 | | | 79 | | | Restricted stock equity grant | | 230 | | | 172 | | |
| Amortization | Amortization | | (157) | | | (267) | | | Amortization | | (157) | | | (157) | | |
| Balance at end of period | Balance at end of period | | 237 | | | 165 | | | Balance at end of period | | 408 | | | 237 | | |
| | Noncontrolling Interests | Noncontrolling Interests | | Noncontrolling Interests | |
| Balance at beginning of year | Balance at beginning of year | | 1,440 | | | 1,565 | | | Balance at beginning of year | | 1,430 | | | 1,440 | | |
| Opening balance sheet adjustment | | — | | | 1 | | (2) | |
| Adjusted opening balance | | 1,440 | | | 1,566 | | | |
| | | Total comprehensive income | Total comprehensive income | | 270 | | | 258 | | | Total comprehensive income | | 282 | | | 270 | | |
| Distributions and other | Distributions and other | | (294) | | | (459) | | | Distributions and other | | (284) | | | (294) | | |
| Balance at end of period | Balance at end of period | | 1,416 | | | 1,365 | | | Balance at end of period | | 1,428 | | | 1,416 | | |
| Total Equity | Total Equity | | $ | 64,113 | | | $ | 57,947 | | | Total Equity | | $ | 75,112 | | | $ | 64,113 | | |
(1) The openingOpening balance sheet adjustment for the six months ended June 30, 2020 is due to the adoption of Topic 326, ASU 2016-13, Financial Instruments-Credit Losses and other ASUs on January 1, 2020. See Note 1 for additional information.
(2) Opening balance sheet adjustments for the six months ended June 30, 2019 are due to the adoption of Topic 842 on January 1, 2019. Refer to the consolidated financial statements included in Verizon's Annual Report on Form 10-K for the year ended December 31, 20192020 for additional information.
Common Stock
In February 2020, the Verizon Board of Directors authorized a share buyback program to repurchase up to 100 million shares of the Company's common stock. The program will terminate when the aggregate number of shares purchased reaches 100 million or a new share repurchase plan superseding the current plan is authorized, whichever is sooner. Verizon did not repurchase any shares of Verizon common stock under ourthrough its previously authorized share buyback programsprogram during the six months ended June 30, 2020.2021. At June 30, 2020,2021, the maximum number of shares that could be purchased by or on behalf of Verizon under our share buyback program was 100 million.
Common stock has been used from time to time to satisfy some of the funding requirements of employee and shareowner plans, including 2.22.0 million common shares issued from Treasury stock during the six months ended June 30, 2020.2021.
Accumulated Other Comprehensive Income (Loss)
The changes in the balances of Accumulated other comprehensive income (loss) by component were as follows:
| | (dollars in millions) | (dollars in millions) | Foreign
currency
translation
adjustments | | Unrealized loss on cash flow hedges | | Unrealized gain on marketable securities | | Defined
benefit
pension and
postretirement
plans | | Total | (dollars in millions) | Foreign
currency
translation
adjustments | | Unrealized gain (loss) on cash flow hedges | | Unrealized gain (loss) on marketable securities | | Defined
benefit
pension and
postretirement
plans | | Total |
| Balance at January 1, 2020 | $ | (584) | | | $ | (816) | | | $ | 27 | | | $ | 2,371 | | | $ | 998 | | |
| Balance at January 1, 2021 | | Balance at January 1, 2021 | $ | (404) | | | $ | (1,387) | | | $ | 25 | | | $ | 1,695 | | | $ | (71) | |
| | Other comprehensive income (loss) | Other comprehensive income (loss) | (43) | | | (2,065) | | | 5 | | | — | | | (2,103) | | Other comprehensive income (loss) | 20 | | | (294) | | | (5) | | | 0 | | | (279) | |
| Amounts reclassified to net income | Amounts reclassified to net income | — | | | 169 | | | — | | | (338) | | | (169) | | Amounts reclassified to net income | 0 | | | 426 | | | 0 | | | (310) | | | 116 | |
| Net other comprehensive income (loss) | Net other comprehensive income (loss) | (43) | | | (1,896) | | | 5 | | | (338) | | | (2,272) | | Net other comprehensive income (loss) | 20 | | | 132 | | | (5) | | | (310) | | | (163) | |
| Balance at June 30, 2020 | $ | (627) | | | $ | (2,712) | | | $ | 32 | | | $ | 2,033 | | | $ | (1,274) | | |
| Balance at June 30, 2021 | | Balance at June 30, 2021 | $ | (384) | | | $ | (1,255) | | | $ | 20 | | | $ | 1,385 | | | $ | (234) | |
The amounts presented above in net other comprehensive income (loss) are net of taxes. The amounts reclassified to net income related to unrealized loss on cash flow hedges in the table above are included in Other income (expense), net and Interest expense in our condensed consolidated statements of income. See Note 78 for additional information. The amounts reclassified to net income related to defined benefit pension and postretirement plans in the table above are included in Cost of services and Selling, general and administrative expenseOther income (expense), net in our condensed consolidated statements of income. See Note 89 for additional information.
| | |
Note 10.11. Segment Information |
Reportable Segments
We have 2 reportable segments that we operate and manage as strategic business units - Consumer and Business. We measure and evaluate our reportable segments based on segment operating income, consistent with the chief operating decision maker’s assessment of segment performance.
Our segments and their principal activities consist of the following:
| | | | | | | | |
| Segment | | Description |
Verizon
Consumer Group | | Our Consumer segment provides consumer-focused wireless and wireline communications services and products. Our wireless services are provided across one of the most extensive wireless networks in the U.S. under the Verizon brand and through wholesale and other arrangements. Our wireline services are provided in nine states in the Mid-Atlantic and Northeastern U.S., as well as Washington D.C., over our 100% fiber-optic network bythrough our Verizon Fios product portfolio and over a traditional copper-based network to customers who are not served by Fios. |
| | |
Verizon
Business Group | | Our Business segment provides wireless and wireline communications services and products, including data, video and conferencing services, corporate networking solutions, security and managed network services, local and long distance voice services and network access to deliver various IoT services and products. We provide these products and services to businesses, government customers and wireless and wireline carriers across the U.S. and select products and services to customers around the world. |
Our Consumer segment’s wireless and wireline products and services are available to our retail customers, as well as resellers that purchase wireless network access from us on a wholesale basis. Our Business segment’s wireless and wireline products and services are organized by the primary customer groups targeted by these offerings: Small and Medium Business, Global Enterprise, Public Sector and Other, and Wholesale.
Corporate and other includes the results of our media business, Verizon Media, and other businesses, investments in unconsolidated businesses, unallocated corporate expenses, certain pension and other employee benefit related costs and interest and financing expenses. Corporate and other also includes the historical results of divested businesses and other adjustments and gains and losses that are not allocated in assessing segment performance due to their nature. Although such transactions are excluded from the business segment results, they are included in reported consolidated earnings. Gains and losses from these transactions that are not individually significant are included in segment results as these items are included in the chief operating decision maker’s assessment of segment performance.
The reconciliation of segment operating revenues and expenses to consolidated operating revenues and expenses below includes the effects of special items that the chief operating decision maker does not consider in assessing segment performance, primarily because of their nature.
The following table provides operating financial information for our 2 reportable segments:
| | | | Three Months Ended | | | Six Months Ended | | | Three Months Ended | | Six Months Ended |
| | June 30, | | | June 30, | | | June 30, | | June 30, |
| (dollars in millions) | (dollars in millions) | 2020 | | 2019 | | 2020 | | 2019 | (dollars in millions) | 2021 | | 2020 | | 2021 | | 2020 |
| External Operating Revenues | External Operating Revenues | | External Operating Revenues | |
| Consumer | Consumer | | Consumer | |
| Service | Service | $ | 15,898 | | | $ | 16,350 | | | $ | 32,241 | | | $ | 32,611 | | Service | $ | 16,704 | | | $ | 15,898 | | | $ | 33,270 | | | $ | 32,241 | |
| Wireless equipment | Wireless equipment | 3,209 | | | 3,904 | | | 6,586 | | | 8,070 | | Wireless equipment | 4,739 | | | 3,209 | | | 8,931 | | | 6,586 | |
| Other | Other | 1,946 | | | 1,680 | | | 3,932 | | | 3,350 | | Other | 1,973 | | | 1,946 | | | 3,955 | | | 3,932 | |
| Total Consumer | Total Consumer | 21,053 | | | 21,934 | | | 42,759 | | | 44,031 | | Total Consumer | 23,416 | | | 21,053 | | | 46,156 | | | 42,759 | |
| | Business | Business | | Business | |
| Small and Medium Business | Small and Medium Business | 2,597 | | | 2,781 | | | 5,395 | | | 5,485 | | Small and Medium Business | 2,890 | | | 2,597 | | | 5,715 | | | 5,395 | |
| Global Enterprise | Global Enterprise | 2,587 | | | 2,673 | | | 5,217 | | | 5,363 | | Global Enterprise | 2,582 | | | 2,587 | | | 5,139 | | | 5,217 | |
| | Public Sector and Other | Public Sector and Other | 1,523 | | | 1,492 | | | 2,997 | | | 2,963 | | Public Sector and Other | 1,614 | | | 1,523 | | | 3,259 | | | 2,997 | |
| Wholesale | Wholesale | 756 | | | 810 | | | 1,516 | | | 1,650 | | Wholesale | 658 | | | 756 | | | 1,393 | | | 1,516 | |
| Total Business | Total Business | 7,463 | | | 7,756 | | | 15,125 | | | 15,461 | | Total Business | 7,744 | | | 7,463 | | | 15,506 | | | 15,125 | |
| Total reportable segments | Total reportable segments | $ | 28,516 | | | $ | 29,690 | | | $ | 57,884 | | | $ | 59,492 | | Total reportable segments | $ | 31,160 | | | $ | 28,516 | | | $ | 61,662 | | | $ | 57,884 | |
| | Intersegment Revenues | Intersegment Revenues | | Intersegment Revenues | |
| Consumer | Consumer | $ | 60 | | | $ | 61 | | | $ | 119 | | | $ | 112 | | Consumer | $ | 61 | | | $ | 60 | | | $ | 119 | | | $ | 119 | |
| Business | Business | 19 | | | 12 | | | 38 | | | 26 | | Business | 18 | | | 19 | | | 37 | | | 38 | |
| Total reportable segments | Total reportable segments | $ | 79 | | | $ | 73 | | | $ | 157 | | | $ | 138 | | Total reportable segments | $ | 79 | | | $ | 79 | | | $ | 156 | | | $ | 157 | |
| | Total Operating Revenues | Total Operating Revenues | | Total Operating Revenues | |
| Consumer | Consumer | $ | 21,113 | | | $ | 21,995 | | | $ | 42,878 | | | $ | 44,143 | | Consumer | $ | 23,477 | | | $ | 21,113 | | | $ | 46,275 | | | $ | 42,878 | |
Business(1) | Business(1) | 7,482 | | | 7,768 | | | 15,163 | | | 15,487 | | Business(1) | 7,762 | | | 7,482 | | | 15,543 | | | 15,163 | |
| Total reportable segments | Total reportable segments | $ | 28,595 | | | $ | 29,763 | | | $ | 58,041 | | | $ | 59,630 | | Total reportable segments | $ | 31,239 | | | $ | 28,595 | | | $ | 61,818 | | | $ | 58,041 | |
| | Operating Income | Operating Income | | Operating Income | |
| Consumer | Consumer | $ | 7,064 | | | $ | 7,336 | | | $ | 14,346 | | | $ | 14,586 | | Consumer | $ | 7,497 | | | $ | 7,064 | | | $ | 15,016 | | | $ | 14,346 | |
| Business | Business | 946 | | | 1,071 | | | 1,900 | | | 2,119 | | Business | 856 | | | 946 | | | 1,755 | | | 1,900 | |
| Total reportable segments | Total reportable segments | $ | 8,010 | | | $ | 8,407 | | | $ | 16,246 | | | $ | 16,705 | | Total reportable segments | $ | 8,353 | | | $ | 8,010 | | | $ | 16,771 | | | $ | 16,246 | |
(1) Service and other revenues included in our Business segment amounted to approximately $7.0 billion for both the three months ended June 30, 2021 and 2020, and 2019.respectively. Service and other revenues included in our Business segment amounted to approximately $14.0 billion and $13.9 billion for both the six months ended June 30, 2021 and 2020, and 2019.respectively. Wireless equipment revenues included in our Business segment amounted to approximately $804 million and $546 million for the three months ended June 30, 2021 and 2020, respectively. Wireless equipment revenues included in our Business segment amounted to approximately $1.6 billion and $1.3 billion for the three and six months ended June 30, 2020, respectively,2021 and approximately $814 million and $1.6 billion for the three and six months ended June 30, 2019,2020, respectively.
The following table provides Fios revenue for our 2 reportable segments:
| | | Three Months Ended | | | Six Months Ended | | | Three Months Ended | | Six Months Ended |
| | June 30, | | | June 30, | | | June 30, | | June 30, |
| (dollars in millions) | (dollars in millions) | 2020 | | 2019 | | 2020 | | 2019 | (dollars in millions) | 2021 | | 2020 | | 2021 | | 2020 |
| Consumer | Consumer | $ | 2,754 | | | $ | 2,772 | | | $ | 5,553 | | | $ | 5,536 | | Consumer | $ | 2,895 | | | $ | 2,754 | | | $ | 5,755 | | | $ | 5,553 | |
| Business | Business | 260 | | | 239 | | | 522 | | | 482 | | Business | 281 | | | 260 | | | 557 | | | 522 | |
| Total Fios revenue | Total Fios revenue | $ | 3,014 | | | $ | 3,011 | | | $ | 6,075 | | | $ | 6,018 | | Total Fios revenue | $ | 3,176 | | | $ | 3,014 | | | $ | 6,312 | | | $ | 6,075 | |
The following table provides Wireless service revenue for our reportable segments and includes intersegment activity:
| | | Three Months Ended | | | Six Months Ended | | | Three Months Ended | | Six Months Ended |
| | June 30, | | | June 30, | | | June 30, | | June 30, |
| (dollars in millions) | (dollars in millions) | 2020 | | 2019 | | 2020 | | 2019 | (dollars in millions) | 2021 | | 2020 | | 2021 | | 2020 |
| Consumer | Consumer | $ | 13,087 | | | $ | 13,456 | | | $ | 26,563 | | | $ | 26,813 | | Consumer | $ | 13,794 | | | $ | 13,087 | | | $ | 27,478 | | | $ | 26,563 | |
| Business | Business | 2,861 | | | 2,775 | | | 5,742 | | | 5,469 | | Business | 3,090 | | | 2,861 | | | 6,150 | | | 5,742 | |
| Total Wireless service revenue | Total Wireless service revenue | $ | 15,948 | | | $ | 16,231 | | | $ | 32,305 | | | $ | 32,282 | | Total Wireless service revenue | $ | 16,884 | | | $ | 15,948 | | | $ | 33,628 | | | $ | 32,305 | |
Reconciliation to Consolidated Financial Information
A reconciliation of the reportable segment operating revenues to consolidated operating revenues is as follows:
| | | Three Months Ended | | | Six Months Ended | | | Three Months Ended | | Six Months Ended |
| | | June 30, | | | June 30, | | | June 30, | | June 30, |
| (dollars in millions) | (dollars in millions) | 2020 | | 2019 | | 2020 | | 2019 | (dollars in millions) | 2021 | | 2020 | | 2021 | | 2020 |
| Total reportable segment operating revenues | Total reportable segment operating revenues | $ | 28,595 | | | $ | 29,763 | | | $ | 58,041 | | | $ | 59,630 | | Total reportable segment operating revenues | $ | 31,239 | | | $ | 28,595 | | | $ | 61,818 | | | $ | 58,041 | |
| Corporate and other | Corporate and other | 1,967 | | | 2,412 | | | 4,239 | | | 4,747 | | Corporate and other | 2,662 | | | 1,967 | | | 5,084 | | | 4,239 | |
| Eliminations | Eliminations | (115) | | | (104) | | | (223) | | | (178) | | Eliminations | (137) | | | (115) | | | (271) | | | (223) | |
| | Total consolidated operating revenues | Total consolidated operating revenues | $ | 30,447 | | | $ | 32,071 | | | $ | 62,057 | | | $ | 64,199 | | Total consolidated operating revenues | $ | 33,764 | | | $ | 30,447 | | | $ | 66,631 | | | $ | 62,057 | |
A reconciliation of the total reportable segment's operating income to consolidated income before provision for income taxes is as follows:
| | | | Three Months Ended | | | Six Months Ended | | | Three Months Ended | | Six Months Ended |
| | June 30, | | | June 30, | | | June 30, | | June 30, |
| (dollars in millions) | (dollars in millions) | 2020 | | 2019 | | 2020 | | 2019 | (dollars in millions) | 2021 | | 2020 | | 2021 | | 2020 |
| Total reportable segment operating income | Total reportable segment operating income | $ | 8,010 | | | $ | 8,407 | | | $ | 16,246 | | | $ | 16,705 | | Total reportable segment operating income | $ | 8,353 | | | $ | 8,010 | | | $ | 16,771 | | | $ | 16,246 | |
| Corporate and other | Corporate and other | (445) | | | (354) | | | (704) | | | (740) | | Corporate and other | 4 | | | (445) | | | (229) | | | (704) | |
| | Other components of net periodic benefit charges (Note 8) | (204) | | | (203) | | | (407) | | | (406) | | |
| Loss on spectrum license transaction (Note 3) | — | | | — | | | (1,195) | | | — | | |
| Other components of net periodic benefit charges (Note 9) | | Other components of net periodic benefit charges (Note 9) | (192) | | | (204) | | | (384) | | | (407) | |
| Loss on spectrum licenses (Note 3) | | Loss on spectrum licenses (Note 3) | 0 | | | 0 | | | (223) | | | (1,195) | |
| | Total consolidated operating income | Total consolidated operating income | 7,361 | | | 7,850 | | | 13,940 | | | 15,559 | | Total consolidated operating income | 8,165 | | | 7,361 | | | 15,935 | | | 13,940 | |
| | Equity in losses of unconsolidated businesses | (13) | | | (13) | | | (25) | | | (19) | | |
| Equity in earnings (losses) of unconsolidated businesses | | Equity in earnings (losses) of unconsolidated businesses | 1 | | | (13) | | | 9 | | | (25) | |
| Other income (expense), net | Other income (expense), net | (72) | | | (1,312) | | | 71 | | | (1,017) | | Other income (expense), net | 502 | | | (72) | | | 903 | | | 71 | |
| Interest expense | Interest expense | (1,089) | | | (1,215) | | | (2,123) | | | (2,425) | | Interest expense | (844) | | | (1,089) | | | (1,945) | | | (2,123) | |
| Income Before Provision For Income Taxes | Income Before Provision For Income Taxes | $ | 6,187 | | | $ | 5,310 | | | $ | 11,863 | | | $ | 12,098 | | Income Before Provision For Income Taxes | $ | 7,824 | | | $ | 6,187 | | | $ | 14,902 | | | $ | 11,863 | |
No single customer accounted for more than 10% of our total operating revenues during the three and six months ended June 30, 2020 and 2019.2021 or 2020.
The chief operating decision maker does not review disaggregated assets on a segment basis; therefore, such information is not presented. Depreciation included in the measure of segment profitability is primarily allocated based on proportional usage.
| | |
Note 11.12. Commitments and Contingencies |
In the ordinary course of business, Verizon is involved in various commercial litigation and regulatory proceedings at the state and federal level. Where it is determined, in consultation with counsel based on litigation and settlement risks, that a loss is probable and estimable in a given matter, the Company establishes an accrual. In none of the currently pending matters is the amount of accrual material. An estimate of the reasonably possible loss or range of loss in excess of the amounts already accrued cannot be made at this time due to various factors typical in contested proceedings, including: (1) uncertain damage theories and demands; (2) a less than complete factual record; (3) uncertainty concerning legal theories and their resolution by courts or regulators; and (4) the unpredictable nature of the opposing party and its demands. We continuously monitor these proceedings as they develop and adjust any accrual or disclosure as needed. We do not expect that the ultimate resolution of any pending regulatory or legal matter in future periods will have a material effect on our financial condition, but it could have a material effect on our results of operations for a given reporting period.
Verizon is currently involved in approximately 2520 federal district court actions alleging that Verizon is infringing various patents. Most of these cases are brought by non-practicing entities and effectively seek only monetary damages; a small number are brought by companies that have sold products and could seek injunctive relief as well. These cases have progressed to various stages and a small number may go to trial in the coming 12 months if they are not otherwise resolved.
In connection with the execution of agreements for the sales of businesses and investments, Verizon ordinarily provides representations and warranties to the purchasers pertaining to a variety of nonfinancial matters, such as ownership of the securities being sold, as well as indemnity from certain financial losses. From time to time, counterparties may make claims under these provisions, and Verizon will seek to defend against those claims and resolve them in the ordinary course of business.
Subsequent to the sale of Verizon Information Services Canada in 2004, we continue to provide a guarantee to publish directories, which was issued when the directory business was purchased in 2001 and had a 30-year term (before extensions). The preexisting guarantee continues, without modification, despite the subsequent sale of Verizon Information Services Canada and the spin-off of our domestic print and internet yellow pages directories business. The possible financial impact of the guarantee, which is not expected to be adverse, cannot be reasonably estimated as a variety of the potential outcomes available under the guarantee result in costs and revenues or benefits that may offset each other. We do not believe performance under the guarantee is likely.
During 2020,the six months ended June 30, 2021, Verizon entered into 41 renewable energy purchase agreements (REPAs)agreement (REPA) with a third parties. Each of the REPAsparty. The REPA is based on the expected operation of a renewable energy-generating facility and has a fixed price term from 12 to 18of 15 years from the commencement of the facility's entry into commercial operation, which is expected to occur in 2021 or 2023, as applicable.2022. The REPAsREPA generally areis expected to be financially settled based on the prevailing market price as energy is generated by the facilities.
| | |
| Item 2. Management’s Discussion and Analysis of Financial Condition and Results of Operations |
Verizon Communications Inc. (Verizon or the Company) is a holding company that, acting through its subsidiaries, is one of the world’s leading providers of communications, technology, information and entertainment products and services to consumers, businesses and government entities. With a presence around the world, we offer data, video and voice services and solutions on our networks and platforms that are designed to meet customers’ demand for mobility, reliable network connectivity, security and control. We have a highly diverse workforce of approximately 135,300 employees as of June 30, 2020.
To compete effectively in today’s dynamic marketplace, we are focused on the capabilities of our high-performing networks to drive growth based on delivering what customers want and need in the new digital world. During 2020,In 2021, we are focused on leveraging our network leadership; retaining and growing our high-quality customer base while balancing profitability; enhancing ecosystems in growth businesses; and driving monetization of our networks, platforms and solutions. We are creating business value by earning customers', employees' and shareholders' trust, limiting our environmental impact and continuing our customer base growth while creating social benefit through our products and services. Our strategy requires significant capital investments primarily to acquire wireless spectrum, put the spectrum into service, provide additional capacity for growth in our networks, invest in the fiber that supports our businesses, evolve and maintain our networks and develop and maintain significant advanced information technology systems and data system capabilities. We believe that steady and consistent investments in our networks and platforms will drive innovative products and services and fuel our growth.
We are consistently deploying new network architecture and technologies to secure our leadership in both fourth-generation (4G) and fifth-generation (5G) wireless networks. We expect that our next-generation multi-use platform, which we call the Intelligent Edge Network, will simplify operations by eliminating legacy network elements, speed the deployment of 5G wireless technology and create new opportunities in the business market in a cost efficient manner. Our network leadership is the hallmark of our brand and the foundation for the connectivity, platforms and solutions upon which we build our competitive advantage.
Highlights of Our Financial Results for the Three Months Ended June 30, 20202021 and 20192020
(dollars in millions)
Highlights of Our Financial Results for the Six Months Ended June 30, 2020 and 2019
Impacts of the Recent Novel Coronavirus (COVID-19)
This disclosure discusses the actions Verizon has taken in response to the COVID-19 crisis and the impacts that the situation has had on our business, as well as related known or expected trends. The disclosure in the remainder of this Management's Discussion & Analysis of Financial Condition and Results of Operations is qualified by the disclosure in this section on the impacts of COVID-19 and, to the extent that the disclosure in the remainder of Management's Discussion & Analysis refers to a financial or performance metric that has been affected by a trend or activity, that reference is in addition to any impact discussed in this section on the impacts of COVID-19.
COVID-19 was identified in China in late 2019 and has since spread throughout the world, including throughout the United States (U.S.). Public and private sector policies and initiatives to reduce the transmission of COVID-19 have varied significantly across the U.S., but during the period ended June 30, 2020 a significant percentage of the U.S. population was subject to meaningful restrictions on activities, which included limitations on the operation of non-essential businesses including retail operations, requirements that individuals remain in or close to their homes, school closures, limitations on large gatherings, travel restrictions and other policies to promote or enforce physical distancing. Similar restrictions have been implemented in many other countries in which we operate. As described below, these restrictions and our responses to them are significantly impacting how our customers use our products and services, how they interact with us, and how our employees work and provide services to our customers. In addition, governments have imposed a wide variety of consumer protection measures that limit how certain businesses, including telecommunications companies, can operate their businesses and interact with their customers. The crisis and governmental responses to the crisis have also resulted in a slowdown of global economic activity, which has significantly impacted our customers. As a result, prior trends in our business may not be applicable to our operations during the pendency of the crisis.
Most of the policies and initiatives referenced above were implemented during the latter part of the first quarter and during the second quarter 2020, as were Verizon’s activities described below. The impact of COVID-19 for the remainder of the year and beyond will depend significantly on the duration and potential cyclicality of the health crisis and the related public policy actions, additional initiatives we undertake in response to employee, market or regulatory needs or demands, the length and severity of the global economic slowdown, and whether and how our customers change their behaviors over the longer term.
Operations
In response to the crisis beginning in the first quarter 2020, we began executing our business continuity plans and evolving our operations to protect the safety of our employees and to continue to provide critical infrastructure and connectivity to our customers, as they have changed their ways of working and living. Some of the initiatives we took include:
•Highlights of Our Financial Results for the Moving over 115,000 of our 135,300 employees to remote work arrangements.
•Six Months EndedClosing nearly 70% of our company-owned retail store locations and moving to appointment-only access to our remaining store locations.
•Limiting our customer-focused field operations based on the criticality of the services being provided or repaired.
•Enhancing our safety protocols for employees who cannot work from home.
•Providing temporary additional compensation to employees in front line roles that cannot be done from home.
•Adjusting other compensation and benefits programs to address circumstances created by the crisis.
•Taking the Federal Communication Commission's (FCC's) "Keep Americans Connected" pledge, through which we pledged to waive late fees for, and not terminate service to, any of our consumer or small business customers who informed us that they had been impacted financially by the COVID-19 crisis through May 13, which we extended to June 30, 2020. Customers who enrolled2021 and 2020
(dollars in the pledge were also automatically enrolled in a repayment program following June 30, 2020.
•Providing additional data allocations to permit wireless consumer and small business customers to remain connected during the first several months of the pandemic.
•Waiving activation and upgrade fees through digital distribution channels.
•Working with business customers to address payment needs during the crisis.
•Maintaining effective governance and internal controls in a remote work environment.millions)
As some of the restrictions on physical movement and limitations on business and other activities described above eased to varying degrees during the second quarter 2020, we began the process of resuming certain of our operations, with the health and safety of our employees and customers as our utmost priority, and modifying some of our temporary policies. These initiatives include:
•Beginning to transition to facility access where feasible for those with remote work arrangements.
•Reopening certain temporarily closed company-owned retail store locations, with more than 60% of all company-owned retail store locations open as of June 30, 2020, introducing touch-less retail and providing curbside pickup options.
•Resuming certain customer-focused field operations.
•Discontinuing certain of our temporary compensation and benefits arrangements.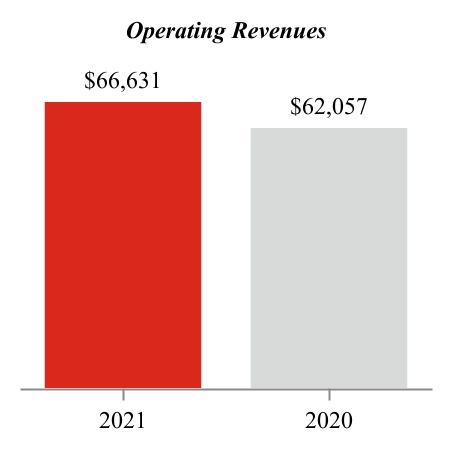
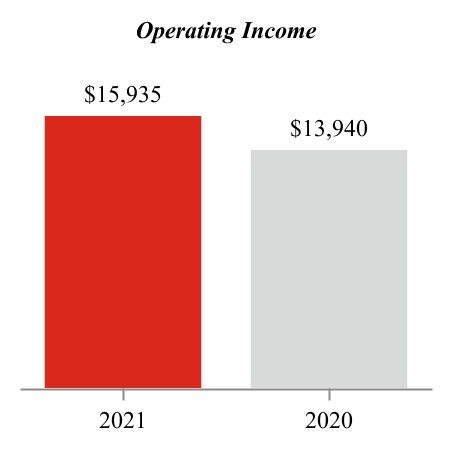
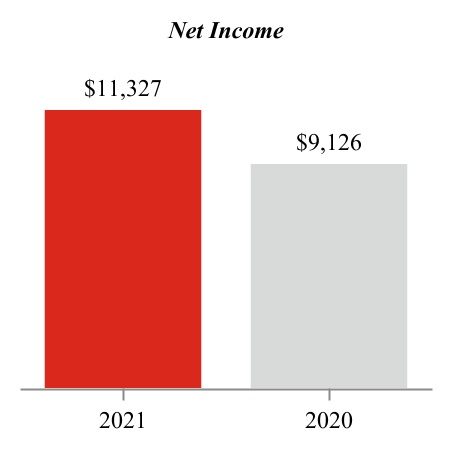
We expect that we will continue to revise our approach to these initiatives as the crisis evolves in the third quarter 2020 and beyond in order to meet the needs of our employees, customers and the Company and to continue to provide our products and services.
Operating Metrics
The following comparison of key performance metrics for the month of June 2020 with the same metrics for the entire second quarter 2020 shows the trends at the end of the second quarter compared to the quarter as a whole as the conditions in the various markets in which we operate evolved during the quarter.
| | | | | | | | | | | | | | | | | | | | | | | | | | | | | |
| | | | Verizon Business Group | | | | | |
| Verizon Consumer Group | | | Small and Medium Business | | Global Enterprise | | Public Sector and Other | |
| 2Q 2020 | June 2020 | | 2Q 2020 | June 2020 | 2Q 2020 | June 2020 | 2Q 2020 | June 2020 |
| Wireless retail postpaid gross additions | (29) | % | (21) | % | | (34) | % | (23) | % | (26) | % | (8) | % | 125 | % | 48 | % |
| Wireless retail postpaid phone churn | (21 bps) | (18 bps) | | (5 bps) | 4 bps | 1 bps | 17 bps | (22 bps) | (4 bps) |
| Wireless retail postpaid upgrades | (9) | % | — | % | | (26) | % | (4) | % | (35) | % | (23) | % | (32) | % | (27) | % |
| Wireless retail postpaid device activations | (17) | % | (9) | % | | (31) | % | (15) | % | (30) | % | (14) | % | 39 | % | 8 | % |
| Fios internet gross additions | (35) | % | (13) | % | | (49) | % | (4) | % | n/a | n/a | n/a | n/a |
n/a - not applicable
The following displays Verizon Media Group key performance metrics for the month of June 2020:
| | | | | |
| Verizon Media Group |
Monthly active users | 4 | % |
Yahoo Finance | 45 | % |
Yahoo News | 25 | % |
The above metrics reflect that during the second quarter 2020, our various customer groups experienced a wide range of trends in customer demand, as well as different trajectories in those trends towards the end of the quarter. As a result of resuming our business activities during the quarter as described above, consumer activity showed significant improvement in the month of June as compared to the second quarter as a whole. The level of decline in Consumer wireless retail postpaid gross additions improved in June from the decline level experienced in the beginning of the quarter, while churn remained historically low. Wireless upgrade volumes were flat in June, reflecting pent-up demand, the availability of 5G-enabled devices and the introduction of other new devices. Consumer Fios performance saw significant improvement in June 2020, reflecting the transition we made from halting in-home Fios installations in the beginning of the quarter to resuming in-home
installations in June, as well as the institution of innovative solutions for Fios self-installations.
In Business, we continued to experience significant pressure in Small and Medium Business throughout the quarter, with marginally higher churn and more robust upgrade activity in June. Among our Public Sector and Other and certain Global Enterprise customers, we experienced a surge in demand for connectivity in the beginning of the quarter to support front line crisis responders, work-from home and home schooling arrangements and other demands for critical connectivity services. Public Sector customers continued to demonstrate a robust demand for phones and connected devices throughout the quarter. In Global Enterprise, while we experienced a reduction in wireless volumes beginning in mid-April, we saw an improvement in gross add activity in June.
In Verizon Media, we continued to experience a decline in advertising and search revenue as advertisers paused or canceled campaigns during the second quarter 2020, and users searched for fewer commercial terms, providing less opportunity for monetization.
The progression of these trends in the third quarter and thereafter will depend on a number of factors, including how government policies with respect to physical distancing and reopening evolve and what the related macroeconomic impacts will be.
See "Segment Results of Operations" for additional information regarding our selected operating statistics.
Liquidity and Capital Resources
Verizon finished the second quarter 2020 in a strong financial position. As of June 30, 2020, our balance sheet included:
| | | | | |
Cash and cash equivalents | $ | 7.9 | billion |
Unsecured debt | $ | 102.2 | billion |
As of June 30, 2020, our Cash and cash equivalents balance was $7.9 billion compared to $2.6 billion as of December 31, 2019 and $1.9 billion as of June 30, 2019. We made the decision to maintain a higher cash balance in order to further protect the Company against the uncertainties of the COVID-19 crisis. During the three months ended June 30, 2020, we decreased the amount of unsecured notes maturing through 2022 by $3.8 billion. As of June 30, 2020, we have no unsecured notes maturing during the remainder of 2020 and we have less than $1.0 billion of unsecured notes maturing in 2021. As of June 30, 2020, we had not drawn down on our $9.5 billion revolving credit facility and the unused borrowing capacity was approximately $9.4 billion. The revolving credit facility does not require us to comply with financial covenants or maintain specified credit ratings, and it permits us to borrow even if our business has incurred a material adverse change. During the three months ended June 30, 2020, we entered into a $1.5 billion export credit facility, as well as issued $0.9 billion aggregate principal amount of Canadian dollar-denominated notes and $2.3 billion aggregate principal amount of Euro-denominated notes, and we were active in the commercial paper market. In July 2020, we drew $500 million from the export credit facility entered into in June 2020 and fully drew down $500 million from an export credit facility entered into in July 2020. In addition, we repaid $460 million of commercial paper.
The COVID-19 crisis, together with other dynamics in the marketplace, has caused borrowing costs to fluctuate significantly and, in certain cases, restricted the ability of borrowers to access the capital markets and other sources of financing. In order to provide financial flexibility and finance certain investments and projects, we may continue to utilize external financing arrangements that have been or may be affected by these market conditions. However, we believe that our cash on hand, the cash we expect to generate from our operations, and cash from other sources of financing available to us are, and will continue to be, sufficient to meet our ongoing operating, capital expenditure and investing requirements.
We expect to continue to have sufficient cash to fund our operations, although we could experience significant fluctuations in our cash flows from period to period during the crisis. The net cash generated from our operations provides our primary source of cash flows. While we have historically experienced consistently low levels of payment delinquencies among our consumer and business accounts, beginning late in the first quarter 2020, we started to see increases in delinquencies across our retail customer base and our small and medium business accounts. This change in delinquency rate moderated during the second quarter; however, if these levels of delinquencies begin to grow, they could have a material adverse impact on our cash flows. We could also experience fluctuations in our cash flows in the periods that follow the end of the COVID-19 crisis resulting from the ongoing impacts of the crisis on macroeconomic conditions in the U.S. and our customers working to become current on their bills beginning in the third quarter 2020.
In addition, we issue asset-backed debt secured by our device payment plan agreement receivables and the collections on such receivables. These transactions require us to comply with various tests, including delinquency and loss-related tests, which, if not met, would cause the asset-backed debt to amortize earlier and faster than otherwise expected. The holders of our asset-backed debt do not have any recourse to Verizon with respect to the payment of principal and interest on the debt. However, if an early amortization of our asset-backed debt occurs, including as a result of increased customer delinquencies or losses relating to COVID-19, all collections on the securitized device payment plan agreement receivables would be used to pay principal and interest on the asset-backed debt, and our financing cash flow requirements would increase for the twelve months immediately following an early amortization event.
Impacts on Financial Results
Our revenues and expenses in the first half of 2020 were impacted by COVID-19 as a result of the actions we took to care for our employees and to keep our customers connected and as a result of our customers’ changing activities as well as the restrictions on activities and the global economic slowdown, as described below. We estimate that the net impact of COVID-19 on our second quarter results was a reduction of approximately $0.14 in earnings per share, primarily as a result of decreases in wireless service revenue, decreases in advertising and
search revenue at Verizon Media, and the operational actions we took, as described above.
Revenues
As a result of our decision to keep our customers connected during the crisis, we experienced fewer step ups in data plans, lower overage revenues and lower fees from activations and upgrades and fewer fees in the first half of 2020. We also experienced lower roaming revenues, as our customers meaningfully reduced travel during the year. In Verizon Media we have seen a reduction in advertising and search revenue, as customers have scaled back their advertising campaigns.
We have also seen considerably less churn in the consumer wireless base and lower equipment volumes and upgrade rates since the beginning of the crisis. As a result of limited in-store engagement and these changing customer behaviors, we experienced significantly lower equipment revenue in the first half of 2020.
Expenses
While certain expenses, such as equipment cost, were lower as a result of the revenue impacts discussed above, these decreases were partially offset by increases in the allowance for credit losses, commission expense and compensation related costs. The increase in sales related compensation costs was a result of an expansion of our compensation programs for both employees and agents. This COVID-19 relief program did not qualify for deferral treatment as defined by Accounting Standards Update (ASU) 2014-09, "Revenue from Contracts with Customers;" however the costs were not materially different on a cash basis.
As a result of waiving late fees and keeping customers connected during the crisis pursuant to our pledge, and pursuant to various state orders and laws, we saw increases in delinquencies across our retail customer base and certain of our business accounts. This change in the delinquency rate has since has since moderated; however, if the levels of delinquencies for our consumer and small and medium business customers begin to grow again, additional provisions to our allowance for credit losses may be required, which could be significant. We continue to monitor customer behavior and our expected loss assumptions and estimates.
Other
In addition, equity and debt markets experienced significant volatility during the first half 2020 partially as a result of the crisis, and federal governmental actions to stimulate the economy have significantly impacted interest rates. These circumstances could affect the funding level of our pension plans and our calculated liabilities under our pension and other postemployment benefit plans. Other impacts from the crisis on our financial results in the third quarter and beyond could result from a further slowdown in the global economy, additional regulatory or legislative initiatives that impact our relationships with our customers, and other initiatives we undertake to respond to the needs of our employees and our customers.
We expect these impacts on our revenues and expenses to continue during the third quarter 2020 and beyond, though the extent of these impacts will depend on the factors described above.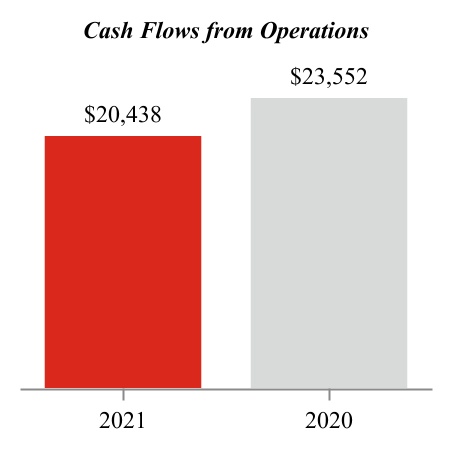
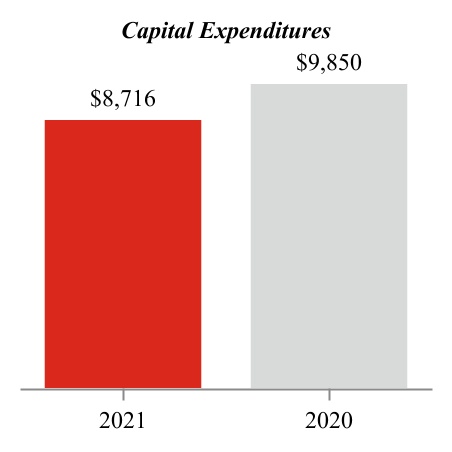
Business Overview
We have two reportable segments that we operate and manage as strategic business units - Verizon Consumer Group (Consumer) and Verizon Business Group (Business).
Revenue by Segment for the Three Months Ended June 30, 20202021 and 20192020
———
Note: Excludes eliminations.
Revenue by Segment for the Six Months Ended June 30, 20202021 and 20192020
———
Note: Excludes eliminations.
Verizon Consumer Group
Our Consumer segment provides consumer-focused wireless and wireline communications services and products. Our wireless services are provided across one of the most extensive wireless networks in the U.S.United States (U.S.) under the Verizon brand and through wholesale and other arrangements. Fixed wireless access (FWA) is also provided to consumers for broadband access through our wireless networks. Our wireline services are provided in nine states in the Mid-Atlantic and Northeastern U.S., as well as Washington D.C., over our 100% fiber-optic network bythrough our Verizon Fios product portfolio and over a traditional copper-based network to customers who are not served by Fios. Our Consumer segment's wireless and wireline products and services are available to our retail customers, as well as resellers that purchase wireless network access from us on a wholesale basis.
Customers can obtain our wireless services on a postpaid or prepaid basis. Our postpaid service is generally billed one month in advance for a monthly access charge in return for access to and usage of network services. Our prepaid service is offered only to Consumer customers and enables individuals to obtain wireless services without credit verification by paying for all services in advance. The Consumer segment also offers several categories of wireless equipment to customers, including a variety of smartphones and other handsets, wireless-enabled internet devices, such as tablets jetpacks, and other wireless-enabled connected devices, such as smart watches and other wearables.watches.
In addition to the wireless services and equipment discussed above, Consumer sells residential fixed connectivity solutions, including internet, video and voice services, and wireless network access to resellers on a wholesale basis. The Consumer segment's operating revenues for the three and six months ended June 30, 20202021 totaled $21.1$23.5 billion and $42.9$46.3 billion, respectively, representing a decreasean increase of 4.0%11.2% and 2.9%7.9%, respectively, compared to the similar periods in 2019.2020. See "Segment Results of Operations" for additional information regarding our Consumer segment’s operating performance and selected operating statistics.
Verizon Business Group
Our Business segment provides wireless and wireline communications services and products, including data, video and conferencing services, corporate networking solutions, security and managed network services, local and long distance voice services and network access to deliver various Internet of Things (IoT) services and products, including solutions that support fleet tracking management, compliance management, field service management, asset tracking and other types of mobile resource management. FWA is also provided to business customers for broadband access through our wireless networks. We provide these products and services to businesses, government customers and wireless and wireline carriers across the U.S. and select products and services to customers around the world. The Business segment's operating revenues for the three and six months ended June 30, 20202021 totaled $7.5$7.8 billion and $15.2$15.5 billion, respectively, representing a decreasean increase of 3.7% and 2.1%2.5%, respectively, compared to the similar periods in 2019.2020. See "Segment Results of Operations" for additional information regarding our Business segment’s operating performance and selected operating statistics.
Corporate and Other
Corporate and other includes the results of our media business, Verizon Media, and other businesses, investments in unconsolidated businesses, insurance captives, unallocated corporate expenses, certain pension and other employee benefit related costs and interest and financing expenses. Corporate and other also includes the historical results of divested businesses and other adjustments and gains and losses that are not allocated in assessing segment performance due to their nature. Although such transactions are excluded from the business segment results, they are included in reported consolidated earnings. Gains and losses from transactions that are not individually significant are included in segment results as these items are included in the chief operating decision maker’s assessment of segment performance.
Verizon Media includes diverse media and technology brands that serve both consumers and businesses. Verizon Media provides consumers with owned and operated and third-party search properties as well as mail, news, finance, sports and entertainment content, e-commerce and subscription offerings, and provides other businesses and partners access to consumers through digital advertising, content delivery and video streaming platforms. Verizon Media's total operating revenues were $1.4$2.1 billion and $3.1$3.9 billion, respectively, for the three and six months ended June 30, 2020,2021, which represents a decreasean increase of 24.5%49.7% and 14.5%28.1%, respectively, compared to the similar periods in 2019.
2021, Verizon entered into a definitive agreement with an affiliate of Apollo Global Management Inc. pursuant to which we agreed to sell Verizon Media to the affiliate. The sale is subject to customary regulatory approvals and closing conditions and is expected to close in the second half of 2021. See Note 3 to the condensed consolidated financial statements for additional information.
Capital Expenditures and Investments
We continue to invest in our wireless networks, high-speed fiber and other advanced technologies to position ourselves at the center of growth trends for the future. During the six months ended June 30, 2020,2021, these investments included $9.9$8.7 billion for capital expenditures. See "Cash Flows Used in Investing Activities" for additional information. Capital expenditures for 20202021 are currently expected to be in the range of $17.5 billion to $18.5 billion, including the continued investment infurther expansion of our 5G network.network in new and existing markets, the densification of our 4G Long-Term Evolution (LTE) wireless network to manage future traffic demands, and the continued deployment of our fiber infrastructure. Expenditures related to the deployment of our C-Band spectrum will be in addition to this amount, and are expected to be approximately $10 billion over three years, with $2 billion to $3 billion expected in 2021. As of June 30, 2021, our capital expenditures include $164 million related to our C-Band deployment. We believe that our investments aimed at expanding our portfolio of products and services will provide our customers with an efficient, reliable infrastructure for competing in the information economy.
Global Network and Technology
We are focusing our capital spending on adding capacity and density to our 4G Long-Term Evolution (LTE)LTE network, while also building our next generation 5G network. We are densifying our networknetworks by utilizing small cell technology, in-building solutions and distributed antenna systems. Network densification enables us to add capacity to address increasing mobile video consumption and the growing demand for IoT products and services on our 4G LTE and 5G networks. Over the past several years, we have been leading the development of 5G wireless technology industry standards and the ecosystems for fixed and mobile 5G wireless services. We expect that 5G technology will provide higher throughput and lower latency than the current 4G LTE technologytechnology and enable our networks to handle more traffic as the number of internet-connected devices grows. As of June 30, 2020, we have commercially launched 5G Home in six U.S. markets - two on global standards, one on proprietary standards and three on both standards. We have also launched our2021, 5G Ultra Wideband Networkis available in 35parts of 75 U.S. markets, as well as several 5G-compatible smartphonescities and other devices.5G Home is available in parts of 40 U.S. cities. 5G Nationwide is available in over 2,700 U.S. markets. 5G Nationwide uses low and mid-band spectrum and dynamic spectrum sharing (DSS) technology, which allows 5G service to run simultaneously with 4G LTE on multiple spectrum bands. With DSS, whenever customers move outside Verizon’s high-band Ultra Wideband coverage area, their 5G-enabled devices will remain on 5G technology using the lower spectrum bands where the 5G Nationwide network is available. This allows us to more fully and effectively utilize our current spectrum resources to serve both 4G and 5G customers.
To compensate for the shrinking market for traditional copper-based products, we continue to build fiber-based networks supporting data, video and advanced business services - areas where demand for reliable high-speed connections is growing. We are evolving the architecture of our networks to a next-generation multi-use platform,our Intelligent Edge Network, providing improved efficiency and virtualization, increased automation and opportunities for edge computing services that will support both our fiber-based and radio access network technologies. We call this the Intelligent Edge Network. We expect that this new architecture will simplify operations by eliminating legacy network elements, speed the deployment of 5G wireless technology and create new opportunities in the business market in a cost efficient manner.
Operating EnvironmentImpact of the Novel Coronavirus (COVID-19) Pandemic
For a discussion of the impacts on and Trends
The information relatedthe risks to trends affecting our business from COVID-19, refer to Item 1A Risk Factors and "Impacts of the Novel Coronavirus (COVID-19) Pandemic" in "Management’sItem 7 Management’s Discussion and Analysis of Financial Condition and Results of Operations"Operations included in our Annual Report on Form 10-K for the year ended December 31, 2019 is updated by2020. The impacts from the disclosure included above under "ImpactsCOVID-19 Pandemic on our operations were most significant during the second quarter of 2020, which also significantly impact the comparability of the Recent Novel Coronavirus (COVID-19)" andresults from the following information.second quarter of 2021 to the second quarter of 2020.
We adopted ASU 2016-13, ASU 2018-19, ASU 2019-04, ASU 2019-05, Financial Instruments - Credit Losses (Topic 326) on January 1, 2020, usingRecent Development
On July 23, 2021 Verizon received the modified retrospective application. This method does not impactwireless licenses from the prior periods, which continueFederal Communications Commission (FCC) in connection with C-Band wireless spectrum Auction 107. Following the receipt of the corresponding wireless licenses, the purchase cost for these licenses inclusive of related capitalized interest was reclassified from Deposits for wireless licenses to reflect the accounting treatment prior to the adoption of Topic 326. As a result, for items that were affected byWireless licenses in our adoption of Topic 326, financial results of periods prior to January 1, 2020 are not comparable to the current period financial results. See Notes 1 and 6 to the condensed consolidated financial statements for additional information.balance sheet.
| | |
| Consolidated Results of Operations |
In this section, we discuss our overall results of operations and highlight special items that are not included in our segment results. Our revenues and expenses in the first half of 2020 were impacted by COVID-19 as a result of the actions we took to care for our employees and keep our customers connected and as a result of our customers’ changing activities, restrictions on activities and the global economic slowdown. See "Overview" for more information. In "Segment Results of Operations," we review the performance of our two reportable segments in more detail.
Consolidated Revenues
| | | | Three Months Ended | | | | | | | Six Months Ended | | | | | | | Three Months Ended | | | | | | Six Months Ended | | | | |
| | | June 30, | | | Increase/ | | | June 30, | | | Increase/ | | | June 30, | | Increase/ | | June 30, | | Increase/ |
| (dollars in millions) | (dollars in millions) | 2020 | | 2019 | | (Decrease) | | | 2020 | | 2019 | | (Decrease) | | (dollars in millions) | 2021 | | 2020 | | (Decrease) | | 2021 | | 2020 | | (Decrease) |
| Consumer | Consumer | $ | 21,113 | | | $ | 21,995 | | | $ | (882) | | | (4.0) | % | | $ | 42,878 | | | $ | 44,143 | | | $ | (1,265) | | | (2.9) | % | Consumer | $ | 23,477 | | | $ | 21,113 | | | $ | 2,364 | | | 11.2 | % | | $ | 46,275 | | | $ | 42,878 | | | $ | 3,397 | | | 7.9 | % |
| Business | Business | 7,482 | | | 7,768 | | | (286) | | | (3.7) | | | 15,163 | | | 15,487 | | | (324) | | | (2.1) | | Business | 7,762 | | | 7,482 | | | 280 | | | 3.7 | | | 15,543 | | | 15,163 | | | 380 | | | 2.5 | |
| Corporate and other | Corporate and other | 1,967 | | | 2,412 | | | (445) | | | (18.4) | | | 4,239 | | | 4,747 | | | (508) | | | (10.7) | | Corporate and other | 2,662 | | | 1,967 | | | 695 | | | 35.3 | | | 5,084 | | | 4,239 | | | 845 | | | 19.9 | |
| Eliminations | Eliminations | (115) | | | (104) | | | (11) | | | 10.6 | | | (223) | | | (178) | | | (45) | | | 25.3 | | Eliminations | (137) | | | (115) | | | (22) | | | 19.1 | | | (271) | | | (223) | | | (48) | | | 21.5 | |
| Consolidated Revenues | Consolidated Revenues | $ | 30,447 | | | $ | 32,071 | | | $ | (1,624) | | | (5.1) | | | $ | 62,057 | | | $ | 64,199 | | | $ | (2,142) | | | (3.3) | | Consolidated Revenues | $ | 33,764 | | | $ | 30,447 | | | $ | 3,317 | | | 10.9 | | | $ | 66,631 | | | $ | 62,057 | | | $ | 4,574 | | | 7.4 | |
Consolidated revenues decreased $1.6 billion, or 5.1%, and $2.1 billion, or 3.3%,increased during both the three and six months ended June 30, 2020, respectively,2021, compared to the similar periods in 2019. The decreases in revenues were2020, due to decreases atrevenue increases in our Consumer segment, Business segment and Corporate and other.
Revenues for our segments are discussed separately below under the heading "Segment Results of Operations."
Corporate and other revenues decreased $445 million, or 18.4%, and $508 million, or 10.7%,increased during both the three and six months ended June 30, 2020, respectively,2021, compared to the similar periods in 2019,2020, primarily due to a decreasean increase of $449$687 million and $519$862 million, respectively, in revenues within Verizon Media.
Consolidated Operating Expenses
| | | | Three Months Ended | | | | | | | Six Months Ended | | | | | | | Three Months Ended | | | | | | Six Months Ended | | | | |
| | | June 30, | | | Increase/ | | | June 30, | | | Increase/ | | | June 30, | | Increase/ | | June 30, | | Increase/ |
| (dollars in millions) | (dollars in millions) | 2020 | | 2019 | | (Decrease) | | | 2020 | | 2019 | | (Decrease) | | (dollars in millions) | 2021 | | 2020 | | (Decrease) | | 2021 | | 2020 | | (Decrease) |
| Cost of services | Cost of services | $ | 7,639 | | | $ | 7,702 | | | $ | (63) | | | (0.8) | % | | $ | 15,393 | | | $ | 15,494 | | | $ | (101) | | | (0.7) | % | Cost of services | $ | 8,324 | | | $ | 7,639 | | | $ | 685 | | | 9.0 | % | | $ | 16,344 | | | $ | 15,393 | | | $ | 951 | | | 6.2 | % |
| Cost of wireless equipment | Cost of wireless equipment | 4,110 | | | 5,019 | | | (909) | | | (18.1) | | | 8,652 | | | 10,217 | | | (1,565) | | | (15.3) | | Cost of wireless equipment | 5,931 | | | 4,110 | | | 1,821 | | | 44.3 | | | 11,433 | | | 8,652 | | | 2,781 | | | 32.1 | |
| Selling, general and administrative expense | Selling, general and administrative expense | 7,156 | | | 7,268 | | | (112) | | | (1.5) | | | 15,741 | | | 14,466 | | | 1,275 | | | 8.8 | | Selling, general and administrative expense | 7,324 | | | 7,156 | | | 168 | | | 2.3 | | | 14,725 | | | 15,741 | | | (1,016) | | | (6.5) | |
| Depreciation and amortization expense | Depreciation and amortization expense | 4,181 | | | 4,232 | | | (51) | | | (1.2) | | | 8,331 | | | 8,463 | | | (132) | | | (1.6) | | Depreciation and amortization expense | 4,020 | | | 4,181 | | | (161) | | | (3.9) | | | 8,194 | | | 8,331 | | | (137) | | | (1.6) | |
| Consolidated Operating Expenses | Consolidated Operating Expenses | $ | 23,086 | | | $ | 24,221 | | | $ | (1,135) | | | (4.7) | | | $ | 48,117 | | | $ | 48,640 | | | $ | (523) | | | (1.1) | | Consolidated Operating Expenses | $ | 25,599 | | | $ | 23,086 | | | $ | 2,513 | | | 10.9 | | | $ | 50,696 | | | $ | 48,117 | | | $ | 2,579 | | | 5.4 | |
Operating expenses for our segments are discussed separately below under the heading "Segment Results of Operations."
Cost of Services
Cost of services includes the following costs directly attributable to a service: salaries and wages, benefits, materials and supplies, content costs, contracted services, network access and transport costs, customer provisioning costs, computer systems support, costs to support our outsourcing contracts and technical facilities and traffic acquisition costs. Aggregate customer service costs, which include billing and service provisioning, are allocated between Cost of services and Selling, general and administrative expense.
Cost of services decreased $63 million, or 0.8%, and $101 million, or 0.7%,increased during both the three and six months ended June 30, 2020, respectively,2021, compared to the similar periods in 2019,2020, primarily due to decreasesincreases in traffic acquisition costs, due to COVID-19, as well as decreases inprofessional services, and costs related to the device protection offerings to our wireless retail postpaid customers and access costs and roaming primarilycustomers. These increases were further driven by a decrease in travel due to COVID-19. These decreases were partially offset by increases in digital content costs,regulatory fees as a result of an increase in the Federal Universal Service Fund (FUSF) rate, rent expense as a result of both adding capacity to the networks to support demand wireline equipmentand lease modifications for certain existing cell towers, and building and facilities costs and personnel costs.primarily due to increased utility rates. See Note 5 to the condensed consolidated financial statements for additional information on the lease modifications. These increases were partially offset by a decrease in access costs resulting from a decline in voice services.
Cost of Wireless Equipment
Cost of wireless equipment decreased $909 million, or 18.1%, and $1.6 billion, or 15.3%,increased during both the three and six months ended June 30, 2020, respectively,2021, compared to the similar periods in 2019, as a result of declines2020, primarily due to increases in the number of wireless devices sold dueas well as a shift to an elongationhigher priced devices in the mix of wireless devices sold. For the handset upgrade cycle, and declines in activation and upgrade volumes primarily due to COVID-19.six months ended June 30, 2021, a further increase was driven by a recall undertaken for certain jetpack units.
Selling, General and Administrative Expense
Selling, general and administrative expense includes salaries and wages and benefits not directly attributable to a service or product, the allowanceprovision for credit losses, taxes other than income taxes, advertising and sales commission costs, call center and information technology costs, regulatory fees, professional service fees and rent and utilities for administrative space. Also included is a portion of the aggregate customer care costs as discussed above in "Cost of Services."
Selling, general and administrative expense decreased $112 million, or 1.5%,increased and increased $1.3 billion, or 8.8%,decreased during the three and six months ended June 30, 2020,2021, respectively, compared to the similar periods in 2019.2020. The decreaseincrease during the three months ended June 30, 2020, compared to the similar period in 2019,2021 was primarily due to decreasesan increase in advertising expense from brand messaging in 2021 as well as lower expenses in 2020 as a result of customer behavior during the allowanceCOVID-19 pandemic, insurance and regulatory settlements, and costs related to data and network systems. The increase was partially offset by a decrease in sales commission expense as a result of actions taken in 2020 in response to the COVID-19 pandemic, and provision for credit losses regulatory fees, personnel costs and advertising expenses. These decreases were partially offset by increasesas a result of both improvement in sales commission expense.payment trends in 2021 as well as actions taken in 2020 in response to the COVID-19 pandemic. The increasedecrease during the six months ended June 30, 2021 was primarily due to a $1.2 billion loss during the six months ended June 30, 2020 compared to the similar period in 2019, was primarily due to a $1.2 billion loss resulting from the spectrum license auction (see "Special Items") and increases inAuction 103, compared to the allowance for credit losses and sales commission expense. These increases were partially offset by decreases in regulatory fees, personnel costs and advertising expenses. The increase in the allowance for credit losses was primarily due to COVID-19. The increases in sales commission expense$223 million loss recognized during the three and six months ended June 30, 2021 resulting from agreements we entered into to sell certain wireless licenses. See "Special Items" for additional information. This decrease was further driven by a decrease in sales commission expense as a result of actions taken in 2020 were due to a lower net deferral of commission costs in the current year as comparedresponse to the prior year,COVID-19 pandemic, and provision for credit losses as a result of both improvement in payment trends in 2021 as well as incremental sales compensation while certain of our stores and agent locations are closedactions taken in 2020 in response to the COVID-19 pandemic. The decreases were partially offset by increases in advertising expense due to COVID-19.brand messaging in 2021 as well as lower expenses in 2020 as a result of customer behavior during the COVID-19 pandemic and costs related to data and network systems.
Depreciation and Amortization Expense
Depreciation and amortization expense decreased $51 million, or 1.2%, and $132 million, or 1.6%, during both the three and six months ended June 30, 2020, respectively,2021, compared to the similar periods in 2019,2020, primarily dueas a result of ceasing depreciation and amortization of certain assets of Verizon Media that were reclassified as assets held for sale during the quarter. See Note 3 to the change incondensed consolidated financial statements for additional information on the mix of net depreciable assets.Verizon Media sale.
Other Consolidated Results
Other Income (Expense), Net
Additional information relating to Other income (expense), net is as follows:
| | | Three Months Ended | | | Six Months Ended | | | | Three Months Ended | | Six Months Ended | |
| | | June 30, | | | Increase/ | | | June 30, | | | Increase/ | | | June 30, | | Increase/ | | June 30, | | Increase/ |
| (dollars in millions) | (dollars in millions) | 2020 | | 2019 | | (Decrease) | | | 2020 | | 2019 | | (Decrease) | | (dollars in millions) | 2021 | | 2020 | | (Decrease) | | 2021 | | 2020 | | (Decrease) |
| Interest income | Interest income | $ | 16 | | | $ | 31 | | | $ | (15) | | | (48.4) | % | | $ | 36 | | | $ | 60 | | | $ | (24) | | | (40.0) | % | Interest income | $ | 11 | | | $ | 16 | | | $ | (5) | | | (31.3) | % | | $ | 26 | | | $ | 36 | | | $ | (10) | | | (27.8) | % |
| Other components of net periodic benefit cost | 132 | | | 185 | | | (53) | | | (28.6) | | | 233 | | | 465 | | | (232) | | | (49.9) | | |
| Other components of net periodic benefit income | | Other components of net periodic benefit income | 1,665 | | | 132 | | | 1,533 | | | nm | | 2,021 | | | 233 | | | 1,788 | | | nm |
| Other, net | Other, net | (220) | | | (1,528) | | | 1,308 | | | (85.6) | | | (198) | | | (1,542) | | | 1,344 | | | (87.2) | | Other, net | (1,174) | | | (220) | | | (954) | | | nm | | (1,144) | | | (198) | | | (946) | | | nm |
| Total | Total | $ | (72) | | | $ | (1,312) | | | $ | 1,240 | | | (94.5) | | | $ | 71 | | | $ | (1,017) | | | $ | 1,088 | | | nm | Total | $ | 502 | | | $ | (72) | | | $ | 574 | | | nm | | $ | 903 | | | $ | 71 | | | $ | 832 | | | nm |
nm - not meaningful
Other income (expense), net, reflects certain items not directly related to our core operations, including interest income, gains and losses from non-operating asset dispositions, debt extinguishment costs, components of net periodic pension and postretirement benefit costscost and income and foreign exchange gains and losses.
The changechanges in Other income (expense), net during the three and six months ended June 30, 2021, compared to the similar periods in 2020, were primarily attributable to a pension remeasurement gain of $1.3 billion recorded during both the three and six months ended June 30, 2021, compared with pension remeasurement losses of $153 million and $335 million recorded during the three and six months ended June 30, 2020, compared to the similar period in 2019,respectively. This was primarily attributable to a comparative decreasepartially offset by an increase in early debt redemption costs of $1.4$1.0 billion partially offset by a pension remeasurement loss of $153 million recorded during both the three months ended June 30, 2020. The change in Other income (expense), net during theand six months ended June 30, 2020, compared to the similar period in 2019, was primarily attributable to a comparative decrease in early debt redemption costs of $1.4 billion, partially offset by a pension remeasurement loss of $335 million recorded during the six months ended June 30, 2020, compared with a pension remeasurement gain of $96 million recorded during the six months ended June 30, 2019.2021. See "Special Items" for additional information. In addition, the increases in Other income (expense), net during the six months ended June 30, 2020, compared to the similar period in 2019, were partially offset by foreign exchange losses.
Interest Expense
| | | Three Months Ended | | | Six Months Ended | | | | Three Months Ended | | Six Months Ended | |
| | | June 30, | | | Increase/ | | | June 30, | | | Increase/ | | | June 30, | | Increase/ | | June 30, | | Increase/ |
| (dollars in millions) | (dollars in millions) | 2020 | | 2019 | | (Decrease) | | | 2020 | | 2019 | | (Decrease) | | (dollars in millions) | 2021 | | 2020 | | (Decrease) | | 2021 | | 2020 | | (Decrease) |
| Total interest costs on debt balances | Total interest costs on debt balances | $ | 1,205 | | | $ | 1,377 | | | $ | (172) | | | (12.5) | % | | $ | 2,392 | | | $ | 2,744 | | | $ | (352) | | | (12.8) | % | Total interest costs on debt balances | $ | 1,397 | | | $ | 1,205 | | | $ | 192 | | | 15.9 | % | | $ | 2,672 | | | $ | 2,392 | | | $ | 280 | | | 11.7 | % |
| Less capitalized interest costs | Less capitalized interest costs | 116 | | | 162 | | | (46) | | | (28.4) | | | 269 | | | 319 | | | (50) | | | (15.7) | | Less capitalized interest costs | 553 | | | 116 | | | 437 | | | nm | | 727 | | | 269 | | | 458 | | | nm |
| Total | $ | 1,089 | | | $ | 1,215 | | | $ | (126) | | | (10.4) | | | $ | 2,123 | | | $ | 2,425 | | | $ | (302) | | | (12.5) | | |
| Total Interest Expense | | Total Interest Expense | $ | 844 | | | $ | 1,089 | | | $ | (245) | | | (22.5) | % | | $ | 1,945 | | | $ | 2,123 | | | $ | (178) | | | (8.4) | % |
| Average debt outstanding (1) (3) | Average debt outstanding (1) (3) | $ | 117,239 | | | $ | 115,163 | | | $ | 114,950 | | | $ | 114,414 | | | Average debt outstanding (1) (3) | $ | 155,251 | | | $ | 117,239 | | | $ | 143,767 | | | $ | 114,950 | | |
Effective interest rate (2) (3) | Effective interest rate (2) (3) | 4.1 | % | | 4.8 | % | | 4.2 | % | | 4.8 | % | | Effective interest rate (2) (3) | 3.6 | % | | 4.1 | % | | 3.7 | % | | 4.2 | % | |
(1)The average debt outstanding is a financial measure and is calculated by applying a simple average of the prior thirteen-monthmonths end balances of total short-term and long-term debt, net of discounts, premiums and unamortized debt issuance costs.
(2)The effective interest rate is the rate of actual interest incurred on debt. It is calculated by dividing the total interest costs on debt balances by the average debt outstanding.
(3)We believe that this measure is useful to management, investors and other users of our financial information in evaluating our debt financing cost and trends in our debt leverage management.
nm - not meaningful
Total interest expense decreased during both the three and six months ended June 30, 2020,2021, compared to the similar periods in 2019,2020, primarily due to decreases inhigher capitalized interest costs related to C-Band licenses won, partially offset by higher interest costs on higher average debt balances, which was partially offset by lower average interest rates as a result of our continued focus on optimizing our debt footprint and derivative activities.total borrowing costs. See Note 4 and Note 6 to the condensed consolidated financial statements for additional information.
Provision for Income Taxes
| | | Three Months Ended | | | | | | Six Months Ended | | | | | | Three Months Ended | | | | Six Months Ended | | |
| | | June 30, | | | Increase/ | | | June 30, | | | Increase/ | | | June 30, | | Increase/ | | June 30, | | Increase/ |
| (dollars in millions) | (dollars in millions) | 2020 | | 2019 | | (Decrease) | | | 2020 | | 2019 | | (Decrease) | | (dollars in millions) | 2021 | | 2020 | | (Decrease) | | 2021 | | 2020 | | (Decrease) |
| Provision for income taxes | Provision for income taxes | $ | 1,348 | | | $ | 1,236 | | | $ | 112 | | | 9.1 | % | | $ | 2,737 | | | $ | 2,864 | | | $ | (127) | | | (4.4) | % | Provision for income taxes | $ | 1,875 | | | $ | 1,348 | | | $ | 527 | | | 39.1 | % | | $ | 3,575 | | | $ | 2,737 | | | $ | 838 | | | 30.6 | % |
| Effective income tax rate | Effective income tax rate | 21.8 | % | | 23.3 | % | | 23.1 | % | | 23.7 | % | | Effective income tax rate | 24.0 | % | | 21.8 | % | | 24.0 | % | | 23.1 | % | |
The effective income tax rate is calculated by dividing the provision for income taxes by income before the provision for income taxes. The decreaseincrease in the effective income tax rate during both the three and six months ended June 30, 2020,2021 compared to the similar periods in 2019,2020 was primarily due to aggregatea larger tax benefitsbenefit recognized in the prior period from a series of legal entity restructurings incompared to the current period. The increase in the provision for income taxes during both the three and six months ended June 30, 2020,2021, compared to the similar periodperiods in 2019,2020, was primarily due to the increase in income before income taxes in the current period. The decrease in the provision for income taxes during the six months ended June 30, 2020, compared to the similar period in 2019, was due to the decrease in income before income taxes as well as aggregate tax benefits from a series of legal entity restructurings in the current period.
Unrecognized Tax Benefits
Unrecognized tax benefits were $2.7 billion and $2.9 billion at both June 30, 20202021 and December 31, 2019.2020, respectively. Interest and penalties related to unrecognized tax benefits were $369$352 million (after-tax) and $385$388 million (after-tax) at June 30, 20202021 and December 31, 2019,2020, respectively.
Verizon and/or its subsidiaries file income tax returns in the U.S. federal jurisdiction, and various state, local and foreign jurisdictions. As a large taxpayer, we are under audit by the Internal Revenue Service and multiple state and foreign jurisdictions for various open tax years. It is reasonably possible that the amount of the liability for unrecognized tax benefits could change by a significant amount in the next twelve months. An estimate of the range of the possible change cannot be made until these tax matters are further developed or resolved.
Consolidated Net Income, Consolidated EBITDA and Consolidated Adjusted EBITDA
Consolidated EBITDAearnings before interest, taxes, depreciation and amortization expenses (Consolidated EBITDA) and Consolidated Adjusted EBITDA, which are presented below, are non-generally accepted accounting principles (GAAP) measures that we believe are useful to management, investors and other users of our financial information in evaluating operating profitability on a more variable cost basis as they exclude the depreciation and amortization expense related primarily to capital expenditures and acquisitions that occurred in prior years, as well as in evaluating operating performance in relation to Verizon’s competitors. Consolidated EBITDA is calculated by adding back interest, taxes, depreciation and amortization expenses to net income.
Consolidated Adjusted EBITDA is calculated by excluding from Consolidated EBITDA the effect of the following non-operational items: equity in losses of unconsolidated businesses and other income and expense, net, as well as the effect of special items. We believe that this measure is useful to management, investors and other users of our financial information in evaluating the effectiveness of our operations and underlying business trends in a manner that is consistent with management’s evaluation of business performance. We believe that Consolidated Adjusted EBITDA is widely used by investors to compare a company’s operating performance to its competitors by minimizing impacts caused by differences in capital structure, taxes, and depreciation and amortization policies. Further, the exclusion of non-operational items and special items enables comparability to prior period performance and trend analysis. See "Special Items" for additional information.
It is management’s intent to provide non-GAAP financial information to enhance the understanding of Verizon’s GAAP financial information, and it should be considered by the reader in addition to, but not instead of, the financial statements prepared in accordance with GAAP. Each non-GAAP financial measure is presented along with the corresponding GAAP measure so as not to imply that more emphasis should be placed on the non-GAAP measure. We believe that providing these non-GAAP measures in addition to the GAAP measures allows management, investors and other users of our financial information to more fully and accurately assess both consolidated and segment performance. The non-GAAP financial information presented may be determined or calculated differently by other companies and may not be directly comparable to that of other companies.
| | | | | | | | | | | | | | | | | | | | | | | |
| | Three Months Ended | | | | Six Months Ended | | |
| June 30, | | | | June 30, | | |
| (dollars in millions) | 2020 | | 2019 | | 2020 | | 2019 |
| Consolidated Net Income | $ | 4,839 | | | $ | 4,074 | | | $ | 9,126 | | | $ | 9,234 | |
| Add: | | | | | | | |
| Provision for income taxes | 1,348 | | | 1,236 | | | 2,737 | | | 2,864 | |
Interest expense (1) | 1,089 | | | 1,215 | | | 2,123 | | | 2,425 | |
| Depreciation and amortization expense | 4,181 | | | 4,232 | | | 8,331 | | | 8,463 | |
| Consolidated EBITDA | $ | 11,457 | | | $ | 10,757 | | | $ | 22,317 | | | $ | 22,986 | |
| | | | | | | |
| Add (Less): | | | | | | | |
Other (income) expense, net (2) | $ | 72 | | | $ | 1,312 | | | $ | (71) | | | $ | 1,017 | |
| Equity in losses of unconsolidated businesses | 13 | | | 13 | | | 25 | | | 19 | |
| Loss on spectrum license auction | — | | | — | | | 1,195 | | | — | |
| | | | | | | |
| | | | | | | |
| | | | | | | |
| | | | | | | |
| | | | | | | |
| | | | | | | |
| | | | | | | |
| Consolidated Adjusted EBITDA | $ | 11,542 | | | $ | 12,082 | | | $ | 23,466 | | | $ | 24,022 | |
| | | | | | | | | | | | | | | | | | | | | | | |
| | Three Months Ended | | Six Months Ended |
| June 30, | | June 30, |
| (dollars in millions) | 2021 | | 2020 | | 2021 | | 2020 |
| Consolidated Net Income | $ | 5,949 | | | $ | 4,839 | | | $ | 11,327 | | | $ | 9,126 | |
| Add: | | | | | | | |
| Provision for income taxes | 1,875 | | | 1,348 | | | 3,575 | | | 2,737 | |
Interest expense (1) | 844 | | | 1,089 | | | 1,945 | | | 2,123 | |
| Depreciation and amortization expense | 4,020 | | | 4,181 | | | 8,194 | | | 8,331 | |
| Consolidated EBITDA | $ | 12,688 | | | $ | 11,457 | | | $ | 25,041 | | | $ | 22,317 | |
| | | | | | | |
| Add (Less): | | | | | | | |
Other (income) expense, net (2) | $ | (502) | | | $ | 72 | | | $ | (903) | | | $ | (71) | |
| Equity in losses (earnings) of unconsolidated businesses | (1) | | | 13 | | | (9) | | | 25 | |
| Loss on spectrum licenses | — | | | — | | | 223 | | | 1,195 | |
| | | | | | | |
| | | | | | | |
| | | | | | | |
| | | | | | | |
| | | | | | | |
| | | | | | | |
| | | | | | | |
| Consolidated Adjusted EBITDA | $ | 12,185 | | | $ | 11,542 | | | $ | 24,352 | | | $ | 23,466 | |
(1)Includes Early debt redemption costs, where applicable. See "Special Items" for additional information.
(2) Includes Pension and benefits mark-to-market adjustments and Early debt redemption costs, where applicable. See "Special Items" for additional information.
The changes in Consolidated Net Income, Consolidated EBITDA and Consolidated Adjusted EBITDA in the table above during the three and six months ended June 30, 2020,2021, compared to the similar periods in 2019,2020, were primarily a result of the factors described in connection with operating revenues and operating expenses.
| | |
| Segment Results of Operations |
We have three segments that we operate and manage as strategic business units, Consumer, Business and Media, of which Consumer and Business are our reportable segments. We measure and evaluate our segments based on segment operating income. The use of segment operating income is consistent with the chief operating decision maker’s assessment of segment performance.
To aid in the understanding of segment performance as it relates to segment operating income, management uses the following operating statistics to evaluate the overall effectiveness of our segments. We believe these operating statistics are useful to investors and other users of
our financial information because they provide additional insight into drivers of our segments’ operating results, key trends and performance relative to our peers. These operating statistics may be determined or calculated differently by other companies and may not be directly comparable to those statistics of other companies.
Wireless retail connections are retail customer device postpaid and prepaid connections as of the end of the period. Retail connections under an account may include those from smartphones and basic phones (collectively, phones), as well as tablets and other internet devices, including wearables and retail IoT devices. Wireless retail connections are calculated by adding total retail postpaid and prepaid new connections in the period to prior period retail connections, and subtracting total retail postpaid and prepaid disconnects in the period.
Wireless retail postpaid connections are retail postpaid customer device connections as of the end of the period. Retail connections under an account may include those from phones, as well as tablets and other internet devices, including wearables and retail IoT devices. Wireless retail postpaid connections are calculated by adding retail postpaid new connections in the period to prior period retail postpaid connections, and subtracting retail postpaid disconnects in the period.
Fios internet connections are the total number of connections to the internet using Fios internet services as of the end of the period. Fios internet connections are calculated by adding Fios internet new connections in the period to prior period Fios internet connections, and subtracting Fios internet disconnects in the period.
Fios video connections are the total number of connections to traditional linear video programming using Fios video services as of the end of the period. Fios video connections are calculated by adding Fios video net additions in the period to prior period Fios video connections. Fios video net additions are calculated by subtracting the Fios video disconnects from the Fios video new connections.
Broadband connections are the total number of connections to the internet using Digital Subscriber Line (DSL) and Fios internet services as of the end of the period. Broadband connections are calculated by adding broadband net additions in the period to prior period broadband connections. Broadband net additions are calculated by subtracting the broadband disconnects from the broadband new connections.
Voice connections are thetotal number of traditional switched access lines in service and Fios digital voice connections as of the end of the period. Voice connections are calculated by adding voice net additions in the period to prior period voice connections. Voice net additions are calculated by subtracting the voice disconnects from the voice new connections.
Wireless retail connections, net additions are the total number of additional retail customer device postpaid and prepaid connections, less the number of device disconnects in the period. Wireless retail connections, net additions in each period presented are calculated by subtracting the total retail postpaid and prepaid disconnects, net of certain adjustments, from the total retail postpaid and prepaid new connections in the period.
Wireless retail postpaid connections, net additions are the total number of additional retail customer device postpaid connections, less the number of device disconnects in the period. Wireless retail postpaid connections, net additions in each period presented are calculated by subtracting the retail postpaid disconnects, net of certain adjustments, from the retail postpaid new connections in the period.
Wireless retail postpaid phone connections, net additions are the total number of additional retail customer postpaid phone connections, less the number of phone disconnects in the period. Wireless retail postpaid phone connections, net additions in each period presented are calculated by subtracting the retail postpaid phone disconnects, net of certain adjustments, from the retail postpaid phone new connections in the period.
Fios internet, net additions are the total number of additional Fios internet connections, less the number of disconnects in the period. Fios internet, net additions are calculated by subtracting the Fios internet disconnects from the Fios internet new connections in the period.
Wireless Churn is the rate at which service to retail, retail postpaid, or retail postpaid phone connections is terminated on average in the period. The churn rate in each period presented is calculated by dividing retail disconnections, retail postpaid disconnections, or retail postpaid phone disconnections by the average retail connections, average retail postpaid connections, or average retail postpaid phone connections, respectively, in the period.
Wireless retail postpaid ARPA is the calculated average retail postpaid service revenue per account (ARPA) from retail postpaid accounts in the period. Wireless retail postpaid service revenue does not include recurring device payment plan billings related to the Verizon device payment program, plan billings related to total mobile protectionTotal Mobile Protection packages or regulatory fees. Wireless retail postpaid ARPA in each period presented is calculated by dividing retail postpaid service revenue by the average retail postpaid accounts in the period.
Wireless retail postpaid accounts are wireless retail customers that are directly served and managed under the Verizon brand and use its services as of the end of the period. Accounts include unlimited plans, shared data plans and corporate accounts, as well as legacy single connection plans and multi-connection family plans. A single account may include monthly wireless services for a variety of connected devices. Wireless retail postpaid accounts are calculated by adding retail postpaid new accounts to the prior period retail postpaid accounts.
Wireless retail postpaid connections per account is the calculated average number of retail postpaid connections per retail postpaid account as of the end of the period. Wireless retail postpaid connections per account is calculated by dividing the total number of retail postpaid connections by the number of retail postpaid accounts as of the end of the period.
Wireless retail postpaid gross additions are new retail postpaid connections that have activated service on the wireless network in the period. Wireless retail postpaid gross additions are calculated as the total number of new retail postpaid phone, tablet and other device connections in the period.
Wireless retail postpaid upgrades are retail postpaid connections that have upgraded a retail postpaid device in the period. Wireless retail postpaid upgrades are calculated as the total number of retail postpaid connections that upgraded retail postpaid phones, tablets and other devices in the period.
Wireless retail postpaid device activations are retail postpaid devices sold and activated on the wireless network during the period. Wireless retail postpaid device activations are calculated by adding the total of retail postpaid gross additions and the total number of retail postpaid upgrades in the period.
Fios internet gross additions are new Fios internet connections that have activated service at a new location in the period. Fios internet gross additions are calculated as the total number of new Fios internet connections activated in the period.
Verizon Media monthly active users are internet users who have visited Verizon Media products during a one-month period. Verizon Media monthly active users are calculated as the total number of users who visited Verizon Media products via desktop, laptop, smartphone or tablet devices by browsers or mobile applications during a one month period. Yahoo Finance and Yahoo News monthly active users are calculated as the total number of users who visited Yahoo Finance or Yahoo News products within Verizon Media's portfolio via desktop, laptop, smartphone or tablet devices by browsers or mobile applications during a one-month period.
Segment operating income margin reflects the profitability of the segment as a percentage of revenue. Segment operating income margin is calculated by dividing total segment operating income by total segment operating revenues.
Segment earnings before interest, taxes, depreciation and amortization (Segment EBITDA), which is presented below, is a non-GAAP measure and does not purport to be an alternative to operating income (loss) as a measure of operating performance. We believe this measure is useful to management, investors and other users of our financial information in evaluating operating profitability on a more variable cost basis as it excludes the depreciation and amortization expenses related primarily to capital expenditures and acquisitions that occurred in prior years, as well as in evaluating operating performance in relation to our competitors. Segment EBITDA is calculated by adding back depreciation and amortization expense to segment operating income (loss). Segment EBITDA margin is calculated by dividing Segment EBITDA by total segment operating revenues. You can find additional information about our segments in Note 1011 to the condensed consolidated financial statements.
Verizon Consumer Group
Our Consumer segment provides consumer-focused wireless and wireline communications services and products. Our wireless services are provided across one of the most extensive wireless networks in the U.S. under the Verizon brand and through wholesale and other arrangements. Our wireline services are provided in nine states in the Mid-Atlantic and Northeastern U.S., as well as Washington D.C., over our 100% fiber-optic network bythrough our Verizon Fios product portfolio and over a traditional copper-based network to customers who are not served by Fios.
Our revenues and expenses in the first half of 2020 were impacted by COVID-19 as a result of the actions we took to care for our employees and keep our customers connected and as a result of our customers’ changing activities, restrictions on activities and the global economic slowdown. See "Overview" for more information.
Operating Revenues and Selected Operating Statistics
| | | Three Months Ended | | | | | | Six Months Ended | | | | | | Three Months Ended | | | | Six Months Ended | | |
| | June 30, | | | Increase/ | | | June 30, | | | Increase/ | | | June 30, | | Increase/ | | June 30, | | Increase/ |
| (dollars in millions, except ARPA) | (dollars in millions, except ARPA) | 2020 | | 2019 | | (Decrease) | | | 2020 | | 2019 | | (Decrease) | | (dollars in millions, except ARPA) | 2021 | | 2020 | | (Decrease) | | 2021 | | 2020 | | (Decrease) |
| Service | Service | $ | 15,900 | | | $ | 16,350 | | | $ | (450) | | | (2.8)% | | $ | 32,241 | | | $ | 32,609 | | | $ | (368) | | | (1.1)% | Service | $ | 16,709 | | $ | 15,900 | | $ | 809 | | | 5.1 | % | | $ | 33,278 | | $ | 32,241 | | $ | 1,037 | | | 3.2 | % |
| Wireless equipment | Wireless equipment | 3,209 | | | 3,903 | | | (694) | | | (17.8) | | 6,586 | | | 8,069 | | | (1,483) | | | (18.4) | Wireless equipment | 4,739 | | 3,209 | | 1,530 | | | 47.7 | | | 8,931 | | 6,586 | | 2,345 | | | 35.6 | |
| Other | Other | 2,004 | | | 1,742 | | | 262 | | | 15.0 | | 4,051 | | | 3,465 | | | 586 | | | 16.9 | Other | 2,029 | | 2,004 | | 25 | | | 1.2 | | | 4,066 | | 4,051 | | 15 | | | 0.4 | |
| Total Operating Revenues | Total Operating Revenues | $ | 21,113 | | | $ | 21,995 | | | $ | (882) | | | (4.0) | | $ | 42,878 | | | $ | 44,143 | | | $ | (1,265) | | | (2.9) | Total Operating Revenues | $ | 23,477 | | $ | 21,113 | | $ | 2,364 | | | 11.2 | | | $ | 46,275 | | $ | 42,878 | | $ | 3,397 | | | 7.9 | |
| Connections (‘000):(1) | Connections (‘000):(1) | | Connections (‘000):(1) | |
| Wireless retail connections | Wireless retail connections | | 93,975 | | | 93,896 | | | 79 | | | 0.1 | Wireless retail connections | | 94,589 | | 93,975 | | 614 | | | 0.7 |
| Wireless retail postpaid connections | Wireless retail postpaid connections | | 89,977 | | | 89,630 | | | 347 | | | 0.4 | Wireless retail postpaid connections | | 90,514 | | 89,977 | | 537 | | | 0.6 |
| Fios internet connections | Fios internet connections | | 5,971 | | | 5,837 | | | 134 | | | 2.3 | Fios internet connections | | 6,392 | | 5,971 | | 421 | | | 7.1 |
| Fios video connections | Fios video connections | | 3,987 | | | 4,270 | | | (283) | | | (6.6) | Fios video connections | | 3,710 | | 3,987 | | (277) | | | (6.9) |
| Broadband connections | Broadband connections | | 6,468 | | | 6,474 | | | (6) | | | (0.1) | Broadband connections | | 6,783 | | 6,468 | | 315 | | | 4.9 |
| Voice connections | | 5,444 | | | 6,058 | | | (614) | | | (10.1) | |
| | | Net Additions in Period (‘000):(2) | Net Additions in Period (‘000):(2) | | Net Additions in Period (‘000):(2) | |
| Wireless retail | Wireless retail | 84 | | | (87) | | | 171 | | | nm | | (525) | | | (464) | | | (61) | | | (13.1) | Wireless retail | 368 | | 84 | | 284 | | | nm | | 61 | | (525) | | 586 | | | nm |
| Wireless retail postpaid | Wireless retail postpaid | 72 | | | 126 | | | (54) | | | (42.9) | | (453) | | | (75) | | | (378) | | | nm | Wireless retail postpaid | 350 | | 72 | | 278 | | | nm | | 24 | | (453) | | 477 | | | nm |
| Wireless retail postpaid phones | Wireless retail postpaid phones | 97 | | | 73 | | | 24 | | | 32.9 | | (210) | | | (90) | | | (120) | | | nm | Wireless retail postpaid phones | 197 | | 97 | | 100 | | | nm | | (28) | | (210) | | 182 | | | 86.7 |
| | Churn Rate: | Churn Rate: | | Churn Rate: | |
| Wireless retail | Wireless retail | 0.86 | % | | 1.23 | % | | 1.03 | % | | 1.28 | % | | Wireless retail | 0.97 | % | | 0.86 | % | | 1.04 | % | | 1.03 | % | |
| Wireless retail postpaid | Wireless retail postpaid | 0.69 | % | | 0.97 | % | | 0.85 | % | | 1.03 | % | | Wireless retail postpaid | 0.83 | % | | 0.69 | % | | 0.90 | % | | 0.85 | % | |
| Wireless retail postpaid phones | Wireless retail postpaid phones | 0.51 | % | | 0.72 | % | | 0.64 | % | | 0.76 | % | | Wireless retail postpaid phones | 0.65 | % | | 0.51 | % | | 0.71 | % | | 0.64 | % | |
| | Account Statistics: | Account Statistics: | | Account Statistics: | |
| Wireless retail postpaid ARPA | Wireless retail postpaid ARPA | $ | 116.02 | | | $ | 118.15 | | | $ | (2.13) | | | (1.8) | | $ | 117.44 | | | $ | 117.80 | | | $ | (0.36) | | | (0.3) | Wireless retail postpaid ARPA | $ | 121.24 | | $ | 116.02 | | $ | 5.22 | | | 4.5 | | $ | 121.05 | | $ | 117.44 | | $ | 3.61 | | | 3.1 |
| Wireless retail postpaid accounts (‘000) (1) | Wireless retail postpaid accounts (‘000) (1) | | 33,695 | | | 33,924 | | | (229) | | | (0.7) | Wireless retail postpaid accounts (‘000) (1) | | | | | | | | | 33,606 | | 33,695 | | (89) | | | (0.3) |
Wireless retail postpaid connections per account (1) | Wireless retail postpaid connections per account (1) | | 2.67 | | | 2.64 | | | 0.03 | | | 1.1 | Wireless retail postpaid connections per account (1) | | | | | | | | | 2.69 | | 2.67 | | 0.02 | | | 0.7 |
|
(1)As of end of period
(2)Includes certain adjustments
nm - not meaningful
Consumer’s total operating revenues decreased $882increased during both the three and six months ended June 30, 2021, compared to the similar periods in 2020, as a result of increases in Service, Wireless equipment and Other revenues.
Service Revenue
Service revenue increased during both the three and six months ended June 30, 2021, compared to the similar periods in 2020. These increases were primarily driven by increases in wireless service revenues.
Wireless service revenue increased $707 million, or 4.0%5.4%, and $1.3 billion,$915 million, or 2.9%3.4%, during the three and six months ended June 30, 2020,2021, respectively, compared to the similar periods in 2019, primarily as a result of decreases in Service and Wireless equipment revenues, partially offset by2020. These increases in Other revenue.
Service Revenue
Service revenue decreased $450 million, or 2.8%, and $368 million, or 1.1%, during the three and six months ended June 30, 2020, respectively, compared to the similar periods in 2019. These decreases were primarily due to decreasesgrowth in wireless servicemobile security products included in certain protection packages, growth from reseller accounts, growth in revenues related to content offerings and wireline voice and video services primarilygrowth in access revenues related to our postpaid plans. These increases were further driven by customers' changing activities and actions taken to keep our customers connected due to COVID-19.
Wireless service revenue decreased $369 million, or 2.7%, and $250 million, or 0.9%, during the three and six months ended June 30, 2020, respectively, compared to the similar periods in 2019. These decreases were due to decreases in data overage revenues driven by waivers of these charges due to COVID-19 as well as the shift to unlimited plans, decreases in roaming and TravelPass revenues primarily due to customers' changing activities due to COVID-19, and waived fees as part of customer assistance initiatives taken by Verizon in 2020 due to COVID-19. These decreases were partially offset by growth from reseller accounts. Wireless retail postpaid ARPA decreased 1.8% and 0.3% during the three and six months ended June 30, 2020, respectively, compared to the similar periods in 2019.COVID-19 pandemic that did not repeat.
For the three and six months ended June 30, 2020,2021, Fios service revenue totaled $2.6$2.7 billion and $5.2$5.4 billion, respectively, and decreased 0.7%increased $124 million, or 4.8%, and increased 0.3%$171 million, or 3.3%, respectively, compared to the similar periods in 2019. The decrease during the three months ended June 30, 2020 was2020. These increases were due to a decreaseincreases in Fios internet connections, reflecting increased demand for higher broadband speeds. The increases were partially offset by decreases in Fios video revenues, reflecting the ongoing shift from traditional linear video to over-the-top offerings, partially offset by increasesand decreases in Fios internet connections, reflecting increased demand for higher broadband speeds. The increase during the six months ended June 30, 2020 was due to a 2.3% increase in Fios internet connections, reflecting increased demand for higher broadband speeds, partially offset by a 6.6% decrease in Fios video connections, reflecting the ongoing shift from traditional linear video to over-the-top offerings.
Service revenue attributable to wireline voice services declined during the three and six months ended June 30, 2020, compared to the similar periods in 2019. The declines were primarily due to a decrease of 10.1% in voice connections resulting primarily from competition and technology substitution with wireless and competing Voice over Internet Protocol (VoIP) and cable telephony services.revenues.
Wireless Equipment Revenue
Wireless equipment revenue decreased $694 million, or 17.8%, and $1.5 billion, or 18.4%,increased during both the three and six months ended June 30, 2020, respectively,2021, compared to the similar periods in 2019, as a result of overall declines in wireless device sales primarily2020, due to an elongation of the handset upgrade cycle, and declines in activation and upgrade volumes primarily due to COVID-19. These decreases were partially offset by a shift to higher priced units in the mix of wireless devices sold and a decline in the number of promotions.
Other Revenue
Other revenue includes non-service revenues such as regulatory fees, cost recovery surcharges, revenues associated with our device protection offerings, leasing and interest on equipment financed under a device payment plan agreement when sold to the customer by an authorized agent.
Other revenue increased $262 million, or 15.0%, and $586 million, or 16.9%, during the three and six months ended June 30, 2020, respectively, compared to the similar periods in 2019, primarily driven by pricing and subscriber increases related to our wireless device protection offerings, as well as cost recovery surcharges.
Operating Expenses
| | | | | | | | | | | | | | | | | | | | | | | | | | | | | | | | | | | | | | | | | | | | | | | |
| Three Months Ended | | | | | | | | Six Months Ended | | | | | | |
| | June 30, | | | | Increase/ | | | | June 30, | | | | Increase/ | | |
| (dollars in millions) | 2020 | | 2019 | | (Decrease) | | | | 2020 | | 2019 | | (Decrease) | | |
| Cost of services | $ | 3,885 | | | $ | 3,847 | | | $ | 38 | | | 1.0 | % | | $ | 7,815 | | | $ | 7,726 | | | $ | 89 | | | 1.2 | % |
| Cost of wireless equipment | 3,299 | | | 3,909 | | | (610) | | | (15.6) | | | 6,750 | | | 8,051 | | | (1,301) | | | (16.2) | |
| Selling, general and administrative expense | 4,016 | | | 4,022 | | | (6) | | | (0.1) | | | 8,298 | | | 8,005 | | | 293 | | | 3.7 | |
| Depreciation and amortization expense | 2,849 | | | 2,881 | | | (32) | | | (1.1) | | | 5,669 | | | 5,775 | | | (106) | | | (1.8) | |
| Total Operating Expenses | $ | 14,049 | | | $ | 14,659 | | | $ | (610) | | | (4.2) | | | $ | 28,532 | | | $ | 29,557 | | | $ | (1,025) | | | (3.5) | |
Cost of Services
Cost of services increased 1.0%, and $89 million, or 1.2%, during the three and six months ended June 30, 2020, respectively, compared to the similar periods in 2019, primarily due to increases in digital content costs, increases in rent expense as a result of adding capacity to the networks to support demand and increases in employee-related costs. These increases were partially offset by decreases in costs related to the device protection offerings to our wireless retail postpaid customers and decreases in access costs and roaming primarily driven by a decrease in international travel due to COVID-19.
Cost of Wireless Equipment
Cost of wireless equipment decreased $610 million, or 15.6%, and $1.3 billion, or 16.2%, during the three and six months ended June 30, 2020, respectively, compared to the similar periods in 2019, as a result of declines in the number of wireless devices sold due to an elongationpartially as a result of the handset upgrade cycle,increased promotions and declines in activation and upgrade volumes primarily due to COVID-19. These decreases were partially offset by a shift to higher priced devices in the mix of wireless devices sold.
Operating Expenses
| | | | | | | | | | | | | | | | | | | | | | | | | | | | | | | | | | | | | | | | | | | | | | | |
| Three Months Ended | | | | Six Months Ended | | |
| | June 30, | | Increase/ | | June 30, | | Increase/ |
| (dollars in millions) | 2021 | | 2020 | | (Decrease) | | 2021 | | 2020 | | (Decrease) |
| Cost of services | $ | 4,181 | | | $ | 3,885 | | | $ | 296 | | | 7.6 | % | | $ | 8,181 | | | $ | 7,815 | | | $ | 366 | | | 4.7 | % |
| Cost of wireless equipment | 4,854 | | | 3,299 | | | 1,555 | | | 47.1 | | | 9,246 | | | 6,750 | | | 2,496 | | | 37.0 | |
| Selling, general and administrative expense | 4,045 | | | 4,016 | | | 29 | | | 0.7 | | | 8,071 | | | 8,298 | | | (227) | | | (2.7) | |
| Depreciation and amortization expense | 2,900 | | | 2,849 | | | 51 | | | 1.8 | | | 5,761 | | | 5,669 | | | 92 | | | 1.6 | |
| Total Operating Expenses | $ | 15,980 | | | $ | 14,049 | | | $ | 1,931 | | | 13.7 | | | $ | 31,259 | | | $ | 28,532 | | | $ | 2,727 | | | 9.6 | |
Cost of Services
Cost of services increased during both the three and six months ended June 30, 2021, compared to the similar periods in 2020. These increases were primarily due to increases in costs related to the device protection offerings to our wireless retail postpaid customers, rent expense as a result of both adding capacity to the networks to support demand and lease modifications for certain existing cell towers, regulatory fees as a result of an increase in the FUSF rate and personnel costs due to increase in compensation costs.
Cost of Wireless Equipment
Cost of wireless equipment increased during both the three and six months ended June 30, 2021, compared to the similar periods in 2020, due to increases in the number of wireless devices sold as well as a shift to higher priced devices in the mix of wireless devices sold. For the six months ended June 30, 2021, a further increase was driven by a recall undertaken for certain jetpack units.
Selling, General and Administrative Expense
Selling, general and administrative expense decreased 0.1%,remained relatively flat and increased $293 million, or 3.7%,decreased during the three and six months ended June 30, 2020,2021, respectively, compared to the similar periods in 2019.2020. The decrease during the three months ended June 30, 2020 was due to a decrease in the allowance for credit losses, partially offset by an increase in sales commission expense. The increase during the six months ended June 30, 2020 was due to increases in sales commission expense and allowance for credit losses, partially offset by decreases in personnel costs, data network systems charges and advertising expense. The increase in the allowance for credit losses was primarily due to COVID-19. The increases in sales commission expensechanges during the three and six months ended June 30, 20202021 were primarily due to decreases in sales commission expense as a lower net deferralresult of commission costsactions taken in the current year as compared2020 in response to the prior year,COVID-19 pandemic, and provision for credit losses as a result of both improvement in payment trends in 2021 as well as incremental sales compensation while certain of our storesactions taken in 2020 in response to the COVID-19 pandemic. For the three and agent locations are closedsix months ended June 30, 2021, the decreases were more than offset and partially offset, respectively, by increases in advertising expense due to COVID-19.brand messaging in 2021 as well as lower expenses in 2020 as a result of customer behavior during the COVID-19 pandemic.
Depreciation and Amortization Expense
Depreciation and amortization expense decreased 1.1%, and $106 million, or 1.8%,increased during both the three and six months ended June 30, 2020, respectively,2021, compared to the similar periods in 2019,2020, driven by the change in the mix of total Verizon depreciable assets and the Consumer segment'sConsumer's usage of those assets.
Segment Operating Income and EBITDA
| | | Three Months Ended | | | | | | Six Months Ended | | | | | | Three Months Ended | | | | Six Months Ended | | |
| | | June 30, | | | Increase/ | | | June 30, | | | Increase/ | | | June 30, | | Increase/ | | June 30, | | Increase/ |
| (dollars in millions) | (dollars in millions) | 2020 | | 2019 | | (Decrease) | | | 2020 | | 2019 | | (Decrease) | | (dollars in millions) | 2021 | | 2020 | | (Decrease) | | 2021 | | 2020 | | (Decrease) |
| Segment Operating Income | Segment Operating Income | $ | 7,064 | | | $ | 7,336 | | | $ | (272) | | | (3.7) | % | | $ | 14,346 | | | $ | 14,586 | | | $ | (240) | | | (1.6) | % | Segment Operating Income | $ | 7,497 | | | $ | 7,064 | | | $ | 433 | | | 6.1 | % | | $ | 15,016 | | | $ | 14,346 | | | $ | 670 | | | 4.7 | % |
| Add Depreciation and amortization expense | Add Depreciation and amortization expense | 2,849 | | | 2,881 | | | (32) | | | (1.1) | | | 5,669 | | | 5,775 | | | (106) | | | (1.8) | | Add Depreciation and amortization expense | 2,900 | | | 2,849 | | | 51 | | | 1.8 | | | 5,761 | | | 5,669 | | | 92 | | | 1.6 | |
| Segment EBITDA | Segment EBITDA | $ | 9,913 | | | $ | 10,217 | | | $ | (304) | | | (3.0) | | | $ | 20,015 | | | $ | 20,361 | | | $ | (346) | | | (1.7) | | Segment EBITDA | $ | 10,397 | | | $ | 9,913 | | | $ | 484 | | | 4.9 | | | $ | 20,777 | | | $ | 20,015 | | | $ | 762 | | | 3.8 | |
| | Segment operating income margin | Segment operating income margin | 33.5 | % | | 33.4 | % | | | 33.5 | % | | 33.0 | % | | | Segment operating income margin | 31.9 | % | | 33.5 | % | | | 32.4 | % | | 33.5 | % | | |
| Segment EBITDA margin | Segment EBITDA margin | 47.0 | % | | 46.5 | % | | 46.7 | % | | 46.1 | % | | Segment EBITDA margin | 44.3 | % | | 47.0 | % | | 44.9 | % | | 46.7 | % | |
The changes in the table above during the three and six months ended June 30, 2020,2021, compared to the similar periods in 2019,2020, were primarily a result of the factors described in connection with operating revenues and operating expenses.
Verizon Business Group
Our Business segment provides wireless and wireline communications services and products, including data, video and conferencing services, corporate networking solutions, security and managed network services, local and long distance voice services and network access to deliver various IoT services and products. We provide these products and services to businesses, government customers and wireless and wireline carriers across the U.S. and select products and services to customers around the world. The Business segment is organized in four customer groups: Small and Medium Business, Global Enterprise, Public Sector and Other, and Wholesale.
Our revenues and expenses in the first half
Operating Revenues and Selected Operating Statistics
| | | Three Months Ended | | | Six Months Ended | | | | Three Months Ended | | Six Months Ended | |
| | | June 30, | | | Increase/ | | | June 30, | | | Increase/ | | | June 30, | | Increase/ | | June 30, | | Increase/ |
| (dollars in millions) | (dollars in millions) | 2020 | | 2019 | | (Decrease) | | | 2020 | | 2019 | | (Decrease) | | (dollars in millions) | 2021 | | 2020 | | (Decrease) | | 2021 | | 2020 | | (Decrease) |
| Small and Medium Business | Small and Medium Business | $ | 2,601 | | | $ | 2,785 | | | $ | (184) | | | (6.6) | % | | $ | 5,405 | | | $ | 5,493 | | | $ | (88) | | | (1.6) | % | Small and Medium Business | $ | 2,895 | | | $ | 2,601 | | | $ | 294 | | | 11.3 | % | | $ | 5,725 | | $ | 5,405 | | $ | 320 | | | 5.9 | % |
| Global Enterprise | Global Enterprise | 2,589 | | | 2,673 | | | (84) | | | (3.1) | | | 5,220 | | | 5,364 | | | (144) | | | (2.7) | | Global Enterprise | 2,583 | | | 2,589 | | | (6) | | | (0.2) | | | 5,142 | | 5,220 | | (78) | | | (1.5) | |
| | Public Sector and Other | Public Sector and Other | 1,523 | | | 1,492 | | | 31 | | | 2.1 | | | 2,997 | | | 2,963 | | | 34 | | | 1.1 | | Public Sector and Other | 1,614 | | | 1,523 | | | 91 | | | 6.0 | | | 3,260 | | 2,997 | | 263 | | | 8.8 | |
| Wholesale | Wholesale | 769 | | | 818 | | | (49) | | | (6.0) | | | 1,541 | | | 1,667 | | | (126) | | | (7.6) | | Wholesale | 670 | | | 769 | | | (99) | | | (12.9) | | | 1,416 | | 1,541 | | (125) | | | (8.1) | |
Total Operating Revenues(1) | Total Operating Revenues(1) | $ | 7,482 | | | $ | 7,768 | | | $ | (286) | | | (3.7) | | | $ | 15,163 | | | $ | 15,487 | | | $ | (324) | | | (2.1) | | Total Operating Revenues(1) | $ | 7,762 | | | $ | 7,482 | | | $ | 280 | | | 3.7 | | | $ | 15,543 | | $ | 15,163 | | $ | 380 | | | 2.5 | |
| Connections (‘000):(2) | Connections (‘000):(2) | | Connections (‘000):(2) | |
| Wireless retail postpaid connections | Wireless retail postpaid connections | | 25,897 | | | 24,144 | | | 1,753 | | | 7.3 | | Wireless retail postpaid connections | | 26,740 | | 25,897 | | 843 | | | 3.3 | |
| Fios internet connections | Fios internet connections | | 327 | | | 316 | | | 11 | | | 3.5 | | Fios internet connections | | 346 | | 327 | | 19 | | | 5.8 | |
| Fios video connections | Fios video connections | | 75 | | | 76 | | | (1) | | | (1.3) | | Fios video connections | | 72 | | 75 | | (3) | | | (4.0) | |
| Broadband connections | Broadband connections | | 491 | | | 494 | | | (3) | | | (0.6) | | Broadband connections | | 480 | | 491 | | (11) | | | (2.2) | |
| Voice connections | | 4,758 | | | 5,163 | | | (405) | | | (7.8) | | |
| | | Net Additions in Period (‘000):(3) | Net Additions in Period (‘000):(3) | | Net Additions in Period (‘000):(3) | |
| Wireless retail postpaid | Wireless retail postpaid | 280 | | | 326 | | | (46) | | | (14.1) | | | 755 | | | 590 | | | 165 | | | 28.0 | | Wireless retail postpaid | 178 | | | 280 | | | (102) | | | (36.4) | | | 334 | | 755 | | (421) | | | (55.8) | |
| Wireless retail postpaid phones | Wireless retail postpaid phones | 76 | | | 171 | | | (95) | | | (55.6) | | | 315 | | | 291 | | | 24 | | | 8.2 | | Wireless retail postpaid phones | 78 | | | 76 | | | 2 | | | 2.6 | | | 125 | | 315 | | (190) | | | (60.3) | |
| | Churn Rate: | Churn Rate: | | Churn Rate: | |
| Wireless retail postpaid | Wireless retail postpaid | 1.12 | % | | 1.21 | % | | 1.21 | % | | 1.23 | % | | Wireless retail postpaid | 1.30 | % | | 1.12 | % | | 1.27 | % | | 1.21 | % | |
| Wireless retail postpaid phones | Wireless retail postpaid phones | 0.90 | % | | 0.97 | % | | 0.96 | % | | 0.99 | % | | Wireless retail postpaid phones | 1.07 | % | | 0.90 | % | | 1.04 | % | | 0.96 | % | |
|
(1)Service and other revenues included in our Business segment amounted to approximately $7.0 billion for both the three months ended June 30, 20202021 and 2019.2020. Service and other revenues included in our Business segment amounted to approximately $14.0 billion and $13.9 billion for both the six months ended June 30, 2021 and 2020, and 2019.respectively. Wireless equipment revenues included in our Business segment amounted to $804 million and $1.6 billion for the three and six months ended June 30, 2021, respectively, and $546 million and $1.3 billion for the three and six months ended June 30, 2020, respectively, and $814 million and $1.6 billion for the three and six months ended June 30, 2019, respectively.
(2)As of end of period
(3)Includes certain adjustments
Business’s total operating revenues decreased $286 million, or 3.7%, and $324 million, or 2.1%,increased during both the three and six months ended June 30, 2020, respectively,2021, compared to the similar periods in 2019,2020, primarily as a result of decreases in Small and Medium Business, Global Enterprise and Wholesale revenues, partially offset by increases in Public Sector and Other and Small and Medium Business revenues, partially offset by decreases in Global Enterprise and Wholesale revenues.
Small and Medium Business
Small and Medium Business offers wireless services and equipment, conferencing services, tailored voice and networking products, Fios services, IPInternet Protocol networking, advanced voice solutions and security and managed information technology services to our U.S.-based small and medium businesses that do not meet the requirements to be categorized as Global Enterprise, as described below.
Small and Medium Business revenues decreased $184 million, or 6.6%, and $88 million, or 1.6%,increased during both the three and six months ended June 30, 2020, respectively,2021, compared to the similar periods in 2019, primarily2020. The increases are due to decreased wireless equipment revenue and declines related to the loss of voice and DSL service connections. Wireless equipment revenue decreased as a result of declines in the number of wireless devices sold primarily due to an elongation of the handset upgrade cycle, declines in activation and upgrade volumes due to decreased demand and store closures due to COVID-19. The decreases were partially offset by a shift to higher priced units in the mix of wireless devices sold and a decline in the number of promotions. These revenue decreases were partially offset by increases in wireless retail postpaid service revenue of 1.9% and 5.5% during the three and six months ended June 30, 2020, respectively, as a result of increases in the amount of wireless retail postpaid connections, as well as increases in usage and non-recurring fees due to the impacts of the COVID-19 pandemic in the prior year. This was further driven by increases in wireless equipment revenue primarily due to an increase in the number of wireless devices sold and a shift to higher priced devices in the mix of wireless devices sold. The increases were partially offset by lower roaming and usage due to COVID-19. These increases were further driven by increased revenuedeclines related to our wireless device protection package, as well as increased revenue related to Fios services.the loss of voice and DSL service connections.
For the three and six months ended June 30, 2020,2021, Fios revenues totaled $227$244 million and $462$483 million, respectively, which represents an increase of 7.5% and were unchanged and increased 1.2%4.6%, respectively, compared to the similar periods in 2019. The increase in Fios revenues during the six months ended June 30, 20202020. This change reflects the increase in total connections, as well as increased demand for higher broadband speeds.
Global Enterprise
Global Enterprise offers services to large businesses, which are identified based on their size and volume of business with Verizon, as well as non-U.S. public sector customers.
Global Enterprise revenues decreased $84 million, or 3.1%, and $144 million, or 2.7%, during both the three and six months ended June 30, 2020, respectively,2021, compared to the similar periods in 2019,2020, primarily due to declines in both traditional data and voice communication services as a result of competitive price pressures,pressures. The decreases were further driven by decreases in advanced communication services due to a decline in usage, as well as decreaseda result of the COVID-19 pandemic, partially offset by increases due to the BlueJeans Network, Inc. (BlueJeans) acquisition. The decreases in revenue were partially offset by increases in wireless equipment revenue due to lower volumes due to COVID-19. During the three months ended June 30, 2020, the decrease in revenue was partially offset by an increase in advanced communication services revenues, partially duethe number of wireless devices sold and a shift to COVID-19, andhigher priced devices in the
mix of wireless devices, customer premise equipment revenues. During the six months ended June 30. 2020, the decrease in revenue was partially offset by increases in advanced communication services revenues, partially due to COVID-19, customer premise equipment revenuesvolumes, and wireless service revenues.FUSF surcharges due to a rate increase. See Note 3 to the condensed consolidated financial statements for additional information on the BlueJeans acquisition.
Public Sector and Other
Public Sector and Other offers wireless products and services as well as wireline connectivity and managed solutions to U.S. federal, state and local governments and educational institutions. These services include the business services and connectivity similar to the products and services offered by Global Enterprise, in each case, with features and pricing designed to address the needs of governments and educational institutions.
Public Sector and Other revenues increased 2.1% and 1.1% during both the three and six months ended June 30, 2020, respectively,2021, compared to the similar periods in 2019, due to2020, primarily driven by increases in wireless retail postpaid service revenue as a result of an increase in gross additions partially due to federal, state and educational agencies responding to COVID-19, partially offsetwireless connections. These increases were driven by decreasesshifting technology needs in networking revenue and traditional voice communication services.remote business environments, particularly in education.
Wholesale
Wholesale offers wireline communications services including data, voice, local dial tone and broadband services primarily to local, long distance, and wireless carriers that use our facilities to provide services to their customers.
Wholesale revenues decreased 6.0%, and $126 million, or 7.6%, during both the three and six months ended June 30, 2020, respectively,2021, compared to the similar periods in 2019,2020, primarily due to declines in core data resulting from the effect of technology substitution and continuing contraction of market rates due to competition, partially offset by an increasedecreases in traditional voice communication servicesand network connectivity due to COVID-19.technology substitution. For the six months ended June 30, 2021, the decrease was partially offset by increases in core data due to minimum commitment payments.
Operating Expenses
| | | Three Months Ended | | | | | | Six Months Ended | | | | | | Three Months Ended | | | | Six Months Ended | | |
| | | June 30, | | | Increase/ | | | June 30, | | | Increase/ | | | June 30, | | Increase/ | | June 30, | | Increase/ |
| (dollars in millions) | (dollars in millions) | 2020 | | 2019 | | (Decrease) | | | 2020 | | 2019 | | (Decrease) | | (dollars in millions) | 2021 | | 2020 | | (Decrease) | | 2021 | | 2020 | | (Decrease) |
| Cost of services | Cost of services | $ | 2,641 | | | $ | 2,581 | | | $ | 60 | | | 2.3 | % | | $ | 5,230 | | | $ | 5,172 | | | $ | 58 | | | 1.1 | % | Cost of services | $ | 2,729 | | | $ | 2,641 | | | $ | 88 | | | 3.3 | % | | $ | 5,419 | | | $ | 5,230 | | | $ | 189 | | | 3.6 | % |
| Cost of wireless equipment | Cost of wireless equipment | 812 | | | 1,109 | | | (297) | | | (26.8) | | | 1,902 | | | 2,166 | | | (264) | | | (12.2) | | Cost of wireless equipment | 1,076 | | | 812 | | | 264 | | | 32.5 | | | 2,187 | | | 1,902 | | | 285 | | | 15.0 | |
| Selling, general and administrative expense | Selling, general and administrative expense | 2,069 | | | 1,961 | | | 108 | | | 5.5 | | | 4,103 | | | 3,942 | | | 161 | | | 4.1 | | Selling, general and administrative expense | 2,086 | | | 2,069 | | | 17 | | | 0.8 | | | 4,154 | | | 4,103 | | | 51 | | | 1.2 | |
| Depreciation and amortization expense | Depreciation and amortization expense | 1,014 | | | 1,046 | | | (32) | | | (3.1) | | | 2,028 | | | 2,088 | | | (60) | | | (2.9) | | Depreciation and amortization expense | 1,015 | | | 1,014 | | | 1 | | | 0.1 | | | 2,028 | | | 2,028 | | | — | | | — | |
| Total Operating Expenses | Total Operating Expenses | $ | 6,536 | | | $ | 6,697 | | | $ | (161) | | | (2.4) | | | $ | 13,263 | | | $ | 13,368 | | | $ | (105) | | | (0.8) | | Total Operating Expenses | $ | 6,906 | | | $ | 6,536 | | | $ | 370 | | | 5.7 | | | $ | 13,788 | | | $ | 13,263 | | | $ | 525 | | | 4.0 | |
Cost of Services
Cost of services increased $60 million, or 2.3%, and $58 million, or 1.1%, during both the three and six months ended June 30, 2020, respectively,2021, compared to the similar periods in 2019,2020, primarily driven by increases in direct costs related to increases in professional services, building and facilities costs due to increased utility rates, and increased regulatory fees as a result of an increase in customer premise equipment, higher personnel costs and regulatory fees, whichthe FUSF rate. These increases were partially offset by lowerdecreases in access costs as well as lower facilities and fleet costs.resulting from a decline in voice services.
Cost of Wireless Equipment
Cost of wireless equipment decreased $297 million, or 26.8%, and $264 million, or 12.2%,increased during both the three and six months ended June 30, 2020, respectively,2021, compared to the similar periods in 2019,2020. For the three months ended June 30, 2021, the increase was primarily due to a decreaseincreases in the number of wireless devices sold resulting from declines in activation and upgrade volumes, primarily due to COVID-19, an elongation of the handset upgrade cycle, and a shift to lowerhigher priced unitsdevices in the mix of wireless devices sold. For the six months ended June 30, 2021, the increase was primarily due to a shift to higher priced devices in the mix of wireless devices sold and an increase in expenses as a result of a recall undertaken for certain jetpack units partially offset by a decline in the volume of wireless equipment sold.
Selling, General and Administrative Expense
Selling, general and administrative expense increased $108 million, or 5.5%,remained relatively flat and $161 million, or 4.1%,increased during the three and six months ended June 30, 2020,2021, respectively, compared to the similar periods in 2019, primarily driven by increases in personnel costs, advertising expenses and sales commission expense.2020. For the six months ended June 30, 2020, these2021 the increases were partially offset by a one-time international tax benefit. The increases in sales commission expense during the three and six months ended June 30, 2020 were due to a lower net deferral of commission costs in the current year as compared to the prior year, as well as incremental sales compensation while certain of our stores and agent locations are closed due to COVID-19.
Depreciation and Amortization Expense
Depreciation and amortization expense decreased 3.1%, and $60 million, or 2.9%, during the three and six months ended June 30, 2020, respectively, compared to the similar periods in 2019,primarily driven by the changean increase in the mix of total Verizon depreciable assetscosts related to data and the Business segment's usage of those assets.
Segment Operating Income and EBITDA
| | | | Three Months Ended | | | | | | Six Months Ended | | | | | | Three Months Ended | | | | Six Months Ended | | |
| | June 30, | | | Increase/ | | | June 30, | | | Increase/ | | | June 30, | | Increase/ | | June 30, | | Increase/ |
| (dollars in millions) | (dollars in millions) | 2020 | | 2019 | | (Decrease) | | | 2020 | | 2019 | | (Decrease) | | (dollars in millions) | 2021 | | 2020 | | (Decrease) | | 2021 | | 2020 | | (Decrease) |
| Segment Operating Income | Segment Operating Income | $ | 946 | | | $ | 1,071 | | | $ | (125) | | | (11.7) | % | | $ | 1,900 | | | $ | 2,119 | | | $ | (219) | | | (10.3) | % | Segment Operating Income | $ | 856 | | | $ | 946 | | | $ | (90) | | | (9.5) | % | | $ | 1,755 | | | $ | 1,900 | | | $ | (145) | | | (7.6) | % |
| Add Depreciation and amortization expense | Add Depreciation and amortization expense | 1,014 | | | 1,046 | | | (32) | | | (3.1) | % | | 2,028 | | | 2,088 | | | (60) | | | (2.9) | | Add Depreciation and amortization expense | 1,015 | | | 1,014 | | | 1 | | | 0.1 | | | 2,028 | | | 2,028 | | | — | | | — | |
| Segment EBITDA | Segment EBITDA | $ | 1,960 | | | $ | 2,117 | | | $ | (157) | | | (7.4) | | | $ | 3,928 | | | $ | 4,207 | | | $ | (279) | | | (6.6) | | Segment EBITDA | $ | 1,871 | | | $ | 1,960 | | | $ | (89) | | | (4.5) | | | $ | 3,783 | | | $ | 3,928 | | | $ | (145) | | | (3.7) | |
| | Segment operating income margin | Segment operating income margin | 12.6 | % | | 13.8 | % | | 12.5 | % | | 13.7 | % | | Segment operating income margin | 11.0 | % | | 12.6 | % | | 11.3 | % | | 12.5 | % | |
| Segment EBITDA margin | Segment EBITDA margin | 26.2 | % | | 27.3 | % | | 25.9 | % | | 27.2 | % | | Segment EBITDA margin | 24.1 | % | | 26.2 | % | | 24.3 | % | | 25.9 | % | |
The changes in the table above during the three and six months ended June 30, 2020,2021, compared to the similar periods in 2019,2020, were primarily a result of the factors described in connection with operating revenues and operating expenses.
| | | | | | | | | | | | | | | | | | | | | | | |
| | Three Months Ended | | | | Six Months Ended | | |
| June 30, | | | | June 30, | | |
| (dollars in millions) | 2020 | | 2019 | | 2020 | | 2019 |
| | | | | | | |
| | | | | | | |
| Severance, pension and benefits charges (credits) | | | | | | | |
| | | | | | | |
| Other income (expense), net | $ | 153 | | | $ | — | | | $ | 335 | | | $ | (96) | |
| | | | | | | |
| | | | | | | |
| | | | | | | |
| | | | | | | |
| | | | | | | |
| | | | | | | |
| | | | | | | |
| | | | | | | |
| | | | | | | |
| | | | | | | |
| | | | | | | |
| | | | | | | |
| Early debt redemption costs | | | | | | | |
| Other income (expense), net | 129 | | | 1,544 | | | 129 | | | 1,544 | |
| Interest expense | (27) | | | — | | | (27) | | | — | |
| | | | | | | |
| | | | | | | |
| Loss on spectrum license auction | | | | | | | |
| Selling, general and administrative expense | — | | | — | | | 1,195 | | | — | |
| Total | $ | 255 | | | $ | 1,544 | | | $ | 1,632 | | | $ | 1,448 | |
| | | | | | | | | | | | | | | | | | | | | | | |
| | Three Months Ended | | Six Months Ended |
| June 30, | | June 30, |
| (dollars in millions) | 2021 | | 2020 | | 2021 | | 2020 |
| | | | | | | |
| | | | | | | |
| | | | | | | |
| | | | | | | |
| Pension and benefits charges (credits) | | | | | | | |
| | | | | | | |
| Other income (expense), net | $ | (1,314) | | | $ | 153 | | | $ | (1,314) | | | $ | 335 | |
| | | | | | | |
| | | | | | | |
| | | | | | | |
| | | | | | | |
| | | | | | | |
| | | | | | | |
| | | | | | | |
| | | | | | | |
| | | | | | | |
| | | | | | | |
| Early debt redemption costs | | | | | | | |
| Other income (expense), net | 1,132 | | | 129 | | | 1,132 | | | 129 | |
| Interest expense | — | | | (27) | | | — | | | (27) | |
| | | | | | | |
| | | | | | | |
| Loss on spectrum licenses | | | | | | | |
| Selling, general and administrative expense | — | | | — | | | 223 | | | 1,195 | |
| Total | $ | (182) | | | $ | 255 | | | $ | 41 | | | $ | 1,632 | |
The Consolidated Adjusted EBITDA non-GAAP measure presented in the Consolidated Net Income, Consolidated EBITDA and Consolidated Adjusted EBITDA discussion (see "Consolidated Results of Operations") excludes all of the amounts included above, as described below.
The income and expenses related to special items included in our condensed consolidated results of operations were as follows:
| | | | Three Months Ended | | | Six Months Ended | | | Three Months Ended | | Six Months Ended |
| | June 30, | | | June 30, | | | June 30, | | June 30, |
| (dollars in millions) | (dollars in millions) | 2020 | | 2019 | | 2020 | | 2019 | (dollars in millions) | 2021 | | 2020 | | 2021 | | 2020 |
| Within Total Operating Expenses | Within Total Operating Expenses | $ | — | | | $ | — | | | $ | 1,195 | | | $ | — | | Within Total Operating Expenses | $ | — | | | $ | — | | | $ | 223 | | | $ | 1,195 | |
| | Within Other income (expense), net | Within Other income (expense), net | 282 | | | 1,544 | | | 464 | | | 1,448 | | Within Other income (expense), net | (182) | | | 282 | | | (182) | | | 464 | |
| Within Interest expense | Within Interest expense | (27) | | | — | | | (27) | | | — | | Within Interest expense | — | | | (27) | | | — | | | (27) | |
| Total | Total | $ | 255 | | | $ | 1,544 | | | $ | 1,632 | | | $ | 1,448 | | Total | $ | (182) | | | $ | 255 | | | $ | 41 | | | $ | 1,632 | |
Severance,
Pension and Benefits Charges (Credits)
During both the three and six months ended June 30, 2021, we recorded a pre-tax remeasurement gain of $1.3 billion in our pension plans triggered by settlements, primarily driven by a $1.2 billion credit mainly due to changes in our discount rate and changes in our lump sum interest rate assumptions used to determine the current year liabilities of our pension plans and a $122 million credit resulting from the difference between our estimated and our actual return on assets. Pension and benefit activity is recognized in the income statement during the fourth quarter or upon a remeasurement event pursuant to our accounting policy for the recognition of actuarial gains and losses
During the three and six months ended June 30, 2020, we recorded net pre-tax remeasurement losses of $153 million and $335 million, respectively, in our pension plans triggered by settlements.
During the three months ended June 30, 2020, we recorded a net pre-tax remeasurement loss of $153 million primarily driven by a $163 million charge mainly due toresulting from the difference between our estimated return on assets and our actual return on assets and changes in our lump sum interest rate assumptions used to determine the current year liabilities of our pension plans, offset by a credit due to changes in our discount rate.
During the three months ended March 31, 2020, we recorded a net pre-tax remeasurement loss of $182 million, primarily driven by a $196 million charge mainly due to changes in our discount rate and lump sum interest rate assumptions used to determine the current year liabilities of our pension plans, offset by a credit due toresulting from the difference between our estimated return on assets and our actual return on assets. Pension and benefit activity was recorded in accordance with our accounting policy to recognize actuarial gains and losses in the period in which they occur.
During the six months ended June 30, 2019, we recorded a net pre-tax remeasurement gain of $96 million in our pension plans triggered by the Voluntary Separation Program for select U.S.-based management employees and other headcount reduction initiatives, primarily driven by a $150 million credit due to the difference between our estimated return on assets and our actual return on assets, offset by a $54 million charge due to a change in our discount rate assumption used to determine the current year liabilities of our pension plans.
See Note 89 to the condensed consolidated financial statements for additional information related to our pension and benefits charges and credits.
Early Debt Redemption Costs
During both the three and six months ended June 30, 2021, we recorded pre-tax early debt redemption costs of $1.1 billion in connection with the redemptions of securities issued by Verizon and open market repurchases of various Verizon and subsidiary notes.
During both the three and six months ended June 30, 2020, we recorded net pre-tax early debt redemption costs of $102 million in connection with the redemptions of securities issued by Verizon and open market repurchases.
See Note 56 to the condensed consolidated financial statements for additional information on these redemptions.
Loss on Spectrum Licenses
During both the three and six months ended June 30, 2019,2021, we recordedrecognized a pre-tax losses on early debt redemptionsloss of $1.5 billion in connection with the tender offers$223 million as a result of notes issued by Verizon with coupon rates ranging from 4.672%signing two agreements to 5.012% and maturity dates ranging from 2054 to 2055.sell certain wireless licenses.
Loss on Spectrum License Auction
During the six months ended June 30, 2020, we recorded a pre-tax net loss of $1.2 billion as a result of the conclusion of the FCC incentive auction, Auction 103, for spectrum licenses in the upper 37 GHz,Gigahertz (GHz), 39 GHz and 47 GHz bands.
See Note 3 to the condensed consolidated financial statements for additional information.
| | |
| Consolidated Financial Condition |
| | | | Six Months Ended | | | | | Six Months Ended | | |
| | June 30, | | | | June 30, | |
| (dollars in millions) | (dollars in millions) | 2020 | | 2019 | | Change | (dollars in millions) | 2021 | | 2020 | | Change |
| Cash Flows Provided By (Used In) | Cash Flows Provided By (Used In) | | Cash Flows Provided By (Used In) | |
| Operating activities | Operating activities | $ | 23,552 | | | $ | 15,836 | | | $ | 7,716 | | Operating activities | $ | 20,438 | | | $ | 23,552 | | | $ | (3,114) | |
| Investing activities | Investing activities | (12,124) | | | (8,589) | | | (3,535) | | Investing activities | (54,401) | | | (12,124) | | | (42,277) | |
| Financing activities | Financing activities | (6,232) | | | (8,043) | | | 1,811 | | Financing activities | 16,550 | | | (6,232) | | | 22,782 | |
| Increase (decrease) in cash, cash equivalents and restricted cash | Increase (decrease) in cash, cash equivalents and restricted cash | $ | 5,196 | | | $ | (796) | | | $ | 5,992 | | Increase (decrease) in cash, cash equivalents and restricted cash | $ | (17,413) | | | $ | 5,196 | | | $ | (22,609) | |
We use the net cash generated from our operations to fund expansion and modernization of our networks, service and repay external financing, pay dividends, invest in new businesses and spectrum and, when appropriate, buy back shares of our outstanding common stock. Our sources of funds, primarily from operations and, to the extent necessary, from external financing arrangements, are sufficient to meet ongoing operating and investing requirements. We expect that our capital spending requirements will continue to be financed primarily through internally
generated funds. Debt or equity financing may be needed to fund additional investments or development activities or to maintain an appropriate capital structure to ensure our financial flexibility. Our cash and cash equivalents are held both domestically and internationally, and are invested to maintain principal and provide liquidity. See "Market Risk" for additional information regarding our foreign currency risk management strategies.
Our available external financing arrangements include an active commercial paper program, credit available under credit facilities and other bank lines of credit, vendor financing arrangements, issuances of registered debt or equity securities, U.S. retail medium-term notes and other capital market securities that are privately-placed or offered overseas. In addition, we monetize our device payment plan agreement receivables through asset-backed debt transactions.
We made the decision at the beginning of the COVID-19 pandemic to maintain a higher cash balance than our historical norm to further protect the Company against the economic uncertainties associated with the pandemic. Based on the state of the economic recovery, in the second quarter of 2021 we significantly reduced our cash balance.We expect to continue to evaluate our cash balance throughout 2021 and may determine to adjust it further depending on economic conditions.
Cash Flows Provided By Operating Activities
Our primary source of funds continues to be cash generated from operations. Net cash provided by operating activities increased $7.7decreased $3.1 billion during the six months ended June 30, 2020,2021, compared to the similar period in 2019,2020, primarily due to improvementschanges in working capital, which includes the COVID-19 related postponementhigher volumes in 2021, as well as activity during 2020 including tax benefits of approximately $2.0 billion from the postponement of second quarter 2020 tax payments to July 15th,and the receipt of thea $2.2 billion cash tax benefit related to the sale of preferred shares in a foreign affiliate, sold during the fourth quarter 2019, and lower volumes. In addition, an employee benefits contribution and voluntary separation program severance paymentsboth of which did not repeat in 2020.2021. In addition, we made a payment of $237 million for the settlement of forward starting interest rate swaps in 2021. These comparative increasesdecreases were partially offset by lower earnings. We made a $300an increase in earnings of $2.2 billion and the receipt of $251 million discretionary employee benefits contribution duringfrom the first quarter 2019 to our defined benefit pension plan.settlement of treasury rate locks. As a result of prior years' discretionary contributions and the 2019 discretionary pension contribution,fact that actual asset returns have been higher than expected, we expect that there will be no required pension funding until 2025,through 2030, subject to changes in market conditions. The 2019 contribution also improved the funded status of our qualified pension plan.
Cash Flows Used In Investing Activities
Capital Expenditures
Capital expenditures continue to relate primarily to the use of capital resources to increase the operating efficiency and productivity of our networks, maintain our existing infrastructure, facilitate the introduction of new products and services and enhance responsiveness to competitive challenges.
Capital expenditures, including capitalized software, for the six months ended June 30, 2021 and 2020 and 2019 were $9.9$8.7 billion and $8.0$9.9 billion, respectively. Capital expenditures increaseddecreased approximately $1.9$1.1 billion, or 23.6%11.5%, during the six months ended June 30, 2020,2021, compared to the similar period in 2019,2020, primarily due to a change in the timing of investments, as well as capital efficiencies from our business excellence initiatives. Our investments primarily relate to support multi-use fiberour network assets which support the densification of our 4G LTE network and our 5G technology deployment.business.
Acquisitions of Wireless Licenses
In March 2020,February 2021, the FCC completed an incentive auction, Auction 107, for mid-band spectrum licenses. Throughknown as C-Band. During the six months ended June 30, 2020,2021, we paid approximately $1.6$44.6 billion including $101 million paidfor spectrum licenses in December 2019. See Note 3 to the condensed consolidated financial statements for additional information.connection with this auction.
During the six months ended June 30, 2020,2021, we entered into and completed various other wireless license acquisitions for cash consideration of approximately $177$90 million.
During the six months ended June 30, 2021, we recorded capitalized interest related to wireless licenses and deposits for wireless licenses of $154 million and $455 million, respectively.
Acquisitions of Businesses, Net of Cash Acquired
In AprilOctober 2020, we entered into a definitive purchase agreement to acquire BlueJeans Network, Inc. (BlueJeans), an enterprise-grade video conferencing and event platform, whose services are sold to Business customers globally.certain assets of Bluegrass Cellular, a rural wireless operator serving central Kentucky. The transaction closed in May 2020.March 2021. The aggregate cash consideration paid by Verizon at the closing of the transaction was approximately $396$410 million, net of cash acquired. During the six months ended June 30, 2020, we completed various other acquisitions for insignificant amounts of cash consideration.acquired, which is subject to customary closing adjustments.
Cash Flows Used InProvided By (Used In) Financing Activities
We seek to maintain a mix of fixed and variable rate debt to lower borrowing costs within reasonable risk parameters and to protect against earnings and cash flow volatility resulting from changes in market conditions. During the six months ended June 30, 2021, net cash provided by financing activities was $16.6 billion. During the six months ended June 30, 2020, net cash used in financing activities was $6.2 billion. During the six months ended June 30, 2019, net cash used in financing activities was $8.0 billion.
During the six months ended June 30, 2020,2021, our net cash used inprovided by financing activities of $6.2 billion was primarily driven by proceeds from long-term borrowings of $31.4 billion and proceeds from asset-backed long-term borrowings of $2.7 billion. These proceeds were partially offset by repayments, redemptions and repurchases of long-term borrowings and finance lease obligations of $8.5$7.6 billion, cash dividends of $5.1$5.2 billion, and repayments of asset-backed long-term borrowings of $4.6 billion. These uses of cash were partially offset by proceeds from long-term borrowings of $9.3 billion and proceeds from asset-backed long-term borrowings of $2.8$3.0 billion.
At June 30, 2021, our total debt of $151.9 billion included unsecured debt of $141.6 billion and secured debt of $10.3 billion. At December 31, 2020, our total debt of $112.8$129.1 billion included unsecured debt of $102.2$118.5 billion and secured debt of $10.6 billion. At December 31, 2019, our total debt of $111.5 billion included unsecured debt of $99.1 billion and secured debt of $12.4 billion. During the six months ended June 30, 20202021 and 2019,2020, our effective interest rate was 4.2%3.7% and 4.8%4.2%, respectively. See Note 56 to the condensed consolidated financial statements for additional information regarding our debt activity.
Verizon may continue to acquire debt securities issued by Verizon and its affiliates in the future through open market purchases, redemptions, privately negotiated transactions, tender offers, exchange offers, or otherwise, upon such terms and at such prices as Verizon may from time to time determine, for cash or other consideration.
Asset-Backed Debt
Cash collections on the device payment plan agreement receivables collateralizing our asset-backed debt securities are required at certain specified times to be placed into segregated accounts. Deposits to the segregated accounts are considered restricted cash and are included in Prepaid expenses and other and Other assets in our condensed consolidated balance sheets.
Proceeds from our asset-backed debt transactions are reflected in Cash flows from financing activities in our condensed consolidated statements of cash flows. The asset-backed debt issued and the assets securing this debt are included in our condensed consolidated balance sheets.
See Note 56 to the condensed consolidated financial statements for additional information.
Long-Term Credit Facilities
| | | At June 30, 2020 | | | At June 30, 2021 |
| (dollars in millions) | (dollars in millions) | Maturities | | Facility Capacity | | Unused Capacity | | Principal Amount Outstanding | (dollars in millions) | Maturities | | Facility Capacity | | Unused Capacity | | Principal Amount Outstanding |
Verizon revolving credit facility (1) | Verizon revolving credit facility (1) | 2022 | | $ | 9,500 | | | $ | 9,392 | | | n/a | Verizon revolving credit facility (1) | 2024 | | $ | 9,500 | | | $ | 9,392 | | | N/A |
Various export credit facilities (2) | Various export credit facilities (2) | 2022-2027 | | 7,000 | | | 1,500 | | | 4,206 | | Various export credit facilities (2) | 2022 - 2029 | | 7,500 | | | 530 | | | $ | 5,029 | |
| Total | Total | | $ | 16,500 | | | $ | 10,892 | | | $ | 4,206 | | Total | | $ | 17,000 | | | $ | 9,922 | | | $ | 5,029 | |
N/A - not applicable
(1) The revolving credit facility does not require us to comply with financial covenants or maintain specified credit ratings, and it permits us to borrow even if our business has incurred a material adverse change. The revolving credit facility provides for the issuance of letters of credit.
(2) During the six months ended June 30, 2021, we drew down $470 million from these facilities. These credit facilities are used to finance equipment-related purchases. Borrowings under certain of these facilities amortize semi-annually in equal installments up to the applicable maturity dates. Maturities reflect maturity dates of principal amounts outstanding. Any amounts borrowed under these facilities and subsequently repaid cannot be reborrowed.
In July 2020, we drew $500
Other, Net
Other, net financing activities during the six months ended June 30, 2021 includes $295 million from a $1.5 billion export credit facility entered into in June 2020payments related to vendor financing arrangements, $150 million in postings of derivative collateral and fully drew down $500 million from an export credit facility entered into in July 2020.early debt redemption costs. See "Special Items" for additional information on the early debt redemption costs.
Dividends
As in prior periods, dividend payments were a significant use of capital resources. We paid $5.1$5.2 billion and $5.0$5.1 billion in cash dividends during the six months ended June 30, 20202021 and 2019,2020, respectively.
Covenants
Our credit agreements contain covenants that are typical for large, investment grade companies. These covenants include requirements to pay interest and principal in a timely fashion, pay taxes, maintain insurance with responsible and reputable insurance companies, preserve our corporate existence, keep appropriate books and records of financial transactions, maintain our properties, provide financial and other reports to our lenders, limit pledging and disposition of assets and mergers and consolidations, and other similar covenants.
We and our consolidated subsidiaries are in compliance with all of our restrictive covenants.covenants in our debt agreements.
Change In Cash, Cash Equivalents and Restricted Cash
Our Cash and cash equivalents at June 30, 20202021 totaled $7.9$4.7 billion, a $5.3$17.5 billion increasedecrease compared to December 31, 2019,2020, primarily as a result of the factors discussed above.
Restricted cash totaled $1.2 billion and $1.3 billion atas of both June 30, 20202021 and December 31, 2019, respectively,2020, primarily related to cash collections on the device payment plan agreement receivables that are required at certain specified times to be placed into segregated accounts.
Assets held for sale includes cash, cash equivalents and restricted cash in our media business, Verizon Media, and totaled $145 million as of June 30, 2021. See Note 3 to the condensed consolidated financial statements for additional information.
Free Cash Flow
Free cash flow is a non-GAAP financial measure that reflects an additional way of viewing our liquidity that, we believe, when viewed with our GAAP results, provides management, investors and other users of our financial information with a more complete understanding of factors and trends affecting our cash flows. Free cash flow is calculated by subtracting capital expenditures (including capitalized software) from net cash provided by operating activities. We believe it is a more conservative measure of cash flow since purchases of fixed assets are necessary for ongoing operations. Free cash flow has limitations due to the fact that it does not represent the residual cash flow available for discretionary expenditures. For example, free cash flow does not incorporate payments made on finance lease obligations or cash payments for business acquisitions or wireless licenses. Therefore, we believe it is important to view free cash flow as a complement to our entire condensed consolidated statements of cash flows.
The following table reconciles net cash provided by operating activities to free cash flow:
| | | | Six Months Ended | | | | | Six Months Ended | | |
| | June 30, | | | | June 30, | |
| (dollars in millions) | (dollars in millions) | 2020 | | 2019 | | Change | (dollars in millions) | 2021 | | 2020 | | Change |
| Net cash provided by operating activities | Net cash provided by operating activities | $ | 23,552 | | | $ | 15,836 | | | $ | 7,716 | | Net cash provided by operating activities | $ | 20,438 | | | $ | 23,552 | | | $ | (3,114) | |
| Less Capital expenditures (including capitalized software) | Less Capital expenditures (including capitalized software) | 9,850 | | | 7,967 | | | 1,883 | | Less Capital expenditures (including capitalized software) | 8,716 | | | 9,850 | | | (1,134) | |
| Free cash flow | Free cash flow | $ | 13,702 | | | $ | 7,869 | | | $ | 5,833 | | Free cash flow | $ | 11,722 | | | $ | 13,702 | | | $ | (1,980) | |
The increasedecrease in free cash flow during the six months ended June 30, 2020,2021, compared to the similar period in 2019,2020, is a reflection of the increasedecrease in operating cash flows, partially offset byas well as the increasedecrease in capital expenditures discussed above.
We are exposed to various types of market risk in the normal course of business, including the impact of interest rate changes, foreign currency exchange rate fluctuations, changes in investment, equity and commodity prices and changes in corporate tax rates. We employ risk management strategies, which may include the use of a variety of derivatives including cross currency swaps, forward starting interest rate swaps, interest rate swaps, interest rate caps, treasury rate locks and foreign exchange forwards. We do not hold derivatives for trading purposes.
It is our general policy to enter into interest rate, foreign currency and other derivative transactions only to the extent necessary to achieve our desired objectives in optimizing exposure to various market risks. Our objectives include maintaining a mix of fixed and variable rate debt to lower borrowing costs within reasonable risk parameters and to protect against earnings and cash flow volatility resulting from changes in market conditions. We do not hedge our market risk exposure in a manner that would completely eliminate the effect of changes in interest rates and foreign exchange rates on our earnings.
Counterparties to our derivative contracts are major financial institutions with whom we have negotiated derivatives agreements (ISDA master agreements) and credit support annex (CSA) agreements which provide rules for collateral exchange. The CSA agreements contain rating based thresholds such that we or our counterparties may be required to hold or post collateral based upon changes in outstanding positions as compared to established thresholds and changes in credit ratings. We do not offset fair value amounts recognized for derivative instruments and fair value amounts recognized for the right to reclaim cash collateral or the obligation to return cash collateral arising from derivative instruments recognized at fair value. At June 30, 2020,2021, we held $0.3$0.1 billion and posted an insignificant amount of collateral related to derivative contracts under collateral exchange agreements, which were recorded as Other current liabilities and Prepaid expenses and other, respectively, in our condensed consolidated balance sheet. At December 31, 2019,2020, we held an insignificant amount$0.2 billion of collateral related to derivative contracts under collateral exchange arrangements, which were recorded as Other current liabilities in our condensed consolidated balance sheet. While we may be exposed to credit losses due to the nonperformance of our counterparties, we consider the risk remote and do not expect that any such nonperformance would result in a significant effect on our results of operations or financial condition due to our diversified pool of counterparties. See Note 78 to the condensed consolidated financial statements for additional information regarding the derivative portfolio.
Interest Rate Risk
We are exposed to changes in interest rates, primarily on our short-term debt and the portion of long-term debt that carries floating interest rates. As of June 30, 2020,2021, approximately 80%85% of the aggregate principal amount of our total debt portfolio consisted of fixed ratefixed-rate indebtedness, including the effect of interest rate swap agreements designated as hedges. The impact of a 100-basis-point change in interest rates affecting our floating rate debt would result in a change in annual interest expense, including our interest rate swap agreements that are designated as hedges, of approximately $232$229 million. The interest rates on our existing long-term debt obligations are unaffected by changes to our credit ratings.
Certain of our floating rate debt and certain of our interest rate derivative transactions utilize interest rates that are linked to the London Inter-Bank Offered Rate (LIBOR) as the benchmark rate. LIBOR is the subject of recent U.S. and international regulatory guidance and proposals for reform. These reformsRegulators have announced that one-week and two-month U.S. dollar LIBOR rates will cease publication after December 31, 2021, and other pressures may causeU.S. dollar LIBOR to become unavailable or to perform or be reported differently than in the past.rates will cease publication after June 30, 2023. The consequences of these developments cannot be entirely predicted but could include an increase in the cost of our floating rate debt or exposure under our interest rate derivative transactions. We do not anticipate a significant impact to our financial position given our current mix of variable and fixed-rate debt, taking into account the impact of our interest rate hedging. The floating rate senior unsecured notes issued in March 2021 and certain of our interest rate derivative transactions utilize interest rates that are linked to the Secured Overnight Financing Rate as the benchmark rate.
Interest Rate Swaps
We enter into interest rate swaps to achieve a targeted mix of fixed and variable rate debt. We principally receive fixed rates and pay variable rates, that are currently based on LIBOR, resulting in a net increase or decrease to Interest expense. These swaps are designated as fair value hedges and hedge against interest rate risk exposure of designated debt issuances. At June 30, 2021, the fair value of the asset and liability of these contracts were $514 million and $572 million, respectively. At December 31, 2020, the fair value of the asset and liability of these contracts were $1.9 billion$787 million and $340$303 million, respectively. At December 31, 2019, the fair value of the asset and liability of these contracts were $568 million and $173 million, respectively. At both June 30, 20202021 and December 31, 2019,2020, the total notional amount of the interest rate swaps was $17.0 billion.$17.6 billion and $17.8 billion, respectively.
Forward Starting Interest Rate Swaps
We have entered into forward starting interest rate swaps designated as cash flow hedges in order to manage our exposure to interest rate changes on future forecasted transactions. At June 30, 2021, the fair value of the liability of these contracts was $281 million. At December 31, 2020, the fair value of the liability of these contracts was $1.1 billion. At December 31, 2019, the fair value of the liability of these contracts was $604$797 million. At June 30, 20202021 and December 31, 2019,2020, the total notional amount of the forward starting interest rate swaps was $2.0$1.0 billion and $3.0$2.0 billion, respectively.
InterestTreasury Rate CapsLocks
We also have interest rate caps which we use as an economic hedge but for which we have elected not to apply hedge accounting. We enter into interesttreasury rate capslocks to mitigate our interest exposure tofuture interest rate increases on our ABS Financing Facilities and ABS Notes. The fair value of the asset and liability of these contracts were insignificantrisk. There was no outstanding notional amount for treasury rate locks at both June 30, 2020 and2021 or December 31, 2019. At June 30, 2020 and December 31, 2019, the total notional value of these contracts was $158 million and $679 million, respectively.2020.
Foreign Currency Risk
The functional currency for our foreign operations is primarily the local currency. The translation of income statement and balance sheet amounts of our foreign operations into U.S. dollars is recorded as cumulative translation adjustments, which are included in Accumulated other comprehensive incomeloss in our condensed consolidated balance sheets. Gains and losses on foreign currency transactions are recorded in the condensed consolidated statements of income in Other income (expense), net. At June 30, 2020,2021, our primary translation exposure was to the British Pound Sterling, Euro, Australian Dollar, Canadian Dollar and Japanese Yen.
Cross Currency Swaps
We have entered into cross currency swaps designated as cash flow hedges to exchange our British Pound Sterling, Euro, Swiss Franc, Canadian Dollar and Australian Dollar-denominated cash flows into U.S. dollars and to fix our cash payments in U.S. dollars, as well as to mitigate the impact of foreign currency transaction gains or losses. At June 30, 2021, the fair value of the asset and liability of these contracts was $1.1 billion and $757 million, respectively. At December 31, 2020, the fair value of the asset and liability of these contracts was $89 million
$1.4 billion and $2.6 billion, respectively. At December 31, 2019, the fair value of the asset and liability of these contracts was $211 million and $912$196 million, respectively. At June 30, 20202021 and December 31, 2019,2020, the total notional amount of the cross currency swaps was $24.7$32.5 billion and $23.1$26.3 billion, respectively.
Foreign Exchange Forwards
We also have foreign exchange forwards which we use as an economic hedge but for which we have elected not to apply hedge accounting. We enter into British Pound Sterling and Euro foreign exchange forwards to mitigate our foreign exchange rate risk related to non-functional currency denominated monetary assets and liabilities of international subsidiaries, as well as foreign exchange risk related to debt settlements. At both June 30, 2020 and December 31, 2019,2021, the fair value of the asset and liability of these contracts was zero and insignificant, respectively. At December 31, 2020, the fair value of the asset and liability of these contracts was insignificant. At June 30, 20202021 and December 31, 2019,2020, the total notional amount of the foreign exchange forwards was $1.0$1.5 billion and $1.1$1.4 billion, respectively.
| | |
| Acquisitions and Divestitures |
Spectrum License Transactions
From time to time, we enter into agreements to buy, sell or exchange spectrum licenses. We believe these spectrum license transactions have allowed us to continue to enhance the reliability of our wireless network, while also resulting in a more efficient use of spectrum.
In March 2020, the FCC's incentive auction, Auction 103, for spectrum licenses in the upper 37 GHz, 39 GHz, and 47 GHz bands concluded. Verizon participated in this incentive auction and was the high bidder on 4,940 licenses, which primarily consisted of 37 GHz and, to a lesser extent, 39 GHz spectrum. As an incumbent licensee, our 39 GHz licenses provided us with incentive payments that were applied towards the purchase price of spectrum in the auction. The value of the licenses won by Verizon amounted to $3.4 billion, of which $1.8 billion was settled with the relinquished 39 GHz licenses. The new reconfigured licenses were received in the second quarter 2020 and are included in Wireless licenses in our condensed consolidated balance sheet.
In September 2020, the FCC completed Auction 105 for Priority Access Licenses. Verizon participated in the auction and was the high bidder on 557 licenses in the 3.5 GHz band valued at approximately $1.9 billion. Verizon made payments for these licenses in 2020 and received them from the FCC in March 2021. The purchase cost for these licenses and related capitalized interest, to the extent qualifying activities have occurred, are included in Wireless licenses in our condensed consolidated balance sheet.
In February 2021, the FCC concluded Auction 107 for C-Band wireless spectrum. Verizon was the winning bidder on 3,511 licenses, consisting of contiguous C-Band spectrum bands ranging between 140 and 200 megahertz of C-Band spectrum in all 406 markets available in the auction. Verizon paid $45.5 billion for the licenses it won, of which $44.6 billion was paid in the first quarter of 2021. The carrying value of the wireless spectrum won in Auction 107 will consist of all payments required to participate and purchase licenses in the auction, including Verizon’s allocable share of clearing costs incurred by, and incentive payments due to, the incumbent license holders associated with the auction that we are obligated to pay in order to acquire the licenses. Carrying value will also include capitalized interest to the extent qualifying activities have occurred. On July 23, 2021 Verizon received the wireless licenses from the FCC. The carrying value is recorded within Deposits for wireless licenses in our condensed consolidated balance sheet as of June 30, 2021, and has been subsequently reclassified to Wireless licenses upon receipt of the corresponding licenses in July 2021.
See Note 3 to the condensed consolidated financial statements for additional information.information regarding our spectrum license transactions.
BlueJeansBlue Jeans Network, Inc.
In April 2020, we entered into a definitive purchase agreement to acquire BlueJeans,Blue Jeans Network, Inc. (BlueJeans), an enterprise-grade video conferencing and event platform, whose services are sold to Business customers globally. The transaction closed in May 2020. The aggregate cash consideration paid by Verizon at the closing of the transaction was approximately $396$397 million, net of cash acquired.
TracFone Wireless, Inc.
In September 2020, we entered into a purchase agreement (Tracfone Purchase Agreement) with América Móvil to acquire Tracfone, a provider of prepaid and value mobile services in the U.S. Under the terms of the Tracfone Purchase Agreement, we will acquire all of the stock of Tracfone for approximately $3.1 billion in cash and $3.1 billion in Verizon common stock, subject to customary adjustments, at closing. The number of shares issued will be based on an average trading price determined as of the closing date and is subject to a minimum number of shares issuable of 47,124,445 and a maximum number of shares issuable of 57,596,544. The Tracfone Purchase Agreement also includes up to an additional $650 million in future cash consideration related to the achievement of certain performance measures and other commercial arrangements. The transaction is subject to regulatory approvals and closing conditions and is expected to close in the second half of 2021.
Bluegrass Cellular
In October 2020, we entered into a definitive agreement to acquire certain assets of Bluegrass Cellular (Bluegrass), a rural wireless operator serving central Kentucky. Bluegrass provides wireless service to 210,000 customers in 34 counties in rural service areas 3, 4, and 5 in Central Kentucky. The transaction closed in March 2021. The aggregate cash consideration paid by Verizon at the closing of the transaction was approximately $410 million, net of cash acquired, which is subject to customary closing adjustments. See Note 3 to the condensed consolidated financial statements for additional information.
Verizon Media
On May 2, 2021, Verizon entered into a definitive agreement with an affiliate of Apollo Global Management Inc. pursuant to which we agreed to sell Verizon Media in return for consideration of $4.3 billion in cash, subject to customary adjustments, $750 million in non-convertible preferred limited partnership units of the affiliate, and 10% of the fully-diluted common limited partnership units of the affiliate. The sale is subject to customary regulatory approvals and closing conditions and is expected to close in the second half of 2021. See Note 3 to the condensed consolidated financial statements for additional information.
Other
From time to time, we enter into strategic agreements to acquire various other businesses and investments. See Note 3 to the condensed consolidated financial statements for additional information.
| | |
| Other Factors That May Affect Future Results |
Regulatory and Competitive Trends
The information relatedThere have been no material changes to our Regulatory and Competitive Trends as previously disclosed in Part I, Item I. "Business" included in our Annual Report on Form 10-K for the year ended December 31, 2019 is updated by the disclosure included above under "Impacts of the Recent Novel Coronavirus (COVID-19)".2020.
| | |
| Cautionary Statement Concerning Forward-Looking Statements |
In this report we have made forward-looking statements. These statements are based on our estimates and assumptions and are subject to risks and uncertainties. Forward-looking statements include the information concerning our possible or assumed future results of operations. Forward-looking statements also include those preceded or followed by the words "anticipates," "believes," "estimates," "expects," "hopes""hopes," "forecasts," "plans" or similar expressions. For those statements, we claim the protection of the safe harbor for forward-looking statements contained in the Private Securities Litigation Reform Act of 1995. We undertake no obligation to revise or publicly release the results of any revision to these forward-looking statements, except as required by law. Given these risks and uncertainties, readers are cautioned not to place undue reliance on such forward-looking statements.
The following important factors, along with those discussed elsewhere in this report and in other filings with the Securities and Exchange Commission (SEC), could affect future results and could cause those results to differ materially from those expressed in the forward-looking statements:
•cyber attacks impacting our networks or systems and any resulting financial or reputational impact;
•natural disasters, terrorist attacks or acts of war or significant litigation and any resulting financial or reputational impact;
•the impact of the global outbreak of COVID-19 pandemic on our operations, our employees and the ways in which our customers use our networks and other products and services;
•disruption of our key suppliers’ or vendors' provisioning of products or services, including as a result of the COVID-19 outbreak;pandemic;
•material adverse changes in labor matters and any resulting financial or operational impact;
•the effects of competition in the markets in which we operate;
•failure to take advantage of developments in technology and address changes in consumer demand;
•performance issues or delays in the deployment of our 5G network resulting in significant costs or a reduction in the anticipated benefits of the enhancement to our networks;
•the inability to implement our business strategy;
•adverse conditions in the U.S. and international economies;
•changes in the regulatory environment in which we operate, including any increase in restrictions on our ability to operate our business;networks or businesses;
•our high level of indebtedness;
•an adverse change in the ratings afforded our debt securities by nationally accredited ratings organizations or adverse conditions in the credit markets affecting the cost, including interest rates, and/or availability of further financing;
•significant increases in benefit plan costs or lower investment returns on plan assets;
•changes in tax laws or treaties, or in their interpretation; and
•changes in accounting assumptions that regulatory agencies, including the SEC, may require or that result from changes in the accounting rules or their application, which could result in an impact on earnings.
| | |
| Item 3. Quantitative and Qualitative Disclosures About Market Risk |
Information relating to market risk is included in Item 2, Management’s Discussion and Analysis of Financial Condition and Results of Operations under the caption "Market Risk."
| | |
| Item 4. Controls and Procedures |
Our Chief Executive Officer and Chief Financial Officer have evaluated the effectiveness of the registrant’s disclosure controls and procedures (as defined in Rules 13a-15(e) and 15d-15(e) of the Securities Exchange Act of 1934), as of the end of the period covered by this quarterly report, that ensure that information relating to the registrant which is required to be disclosed in this report is recorded, processed, summarized and reported within required time periods using the criteria for effective internal control established in Internal Control–Integrated Framework issued by the Committee of Sponsoring Organizations of the Treadway Commission in 2013. Based on this evaluation, our Chief Executive Officer and Chief Financial Officer have concluded that the registrant’s disclosure controls and procedures were effective as of June 30, 2020.2021.
In the ordinary course of business, we routinely review our system of internal control over financial reporting and make changes to our systems and processes that are intended to ensure an effective internal control environment. ThereIn the third quarter of 2020, we began a multi-year implementation of a new global enterprise resource planning (ERP) system, which will replace many of our existing core financial systems. The ERP system is designed to enhance the flow of financial information, facilitate data analysis and accelerate information reporting. The implementation is expected to occur in phases over the next several years. During the second quarter of 2021, we have made changes to our internal controls to address processes impacted by the ERP system implementation.
As the phased implementation of the new ERP system continues, we could have changes to our processes and procedures which, in turn, could result in changes to our internal controls over financial reporting. As such changes occur, we will evaluate quarterly whether such changes materially affect our internal control over financial reporting.
Other than the above-noted changes, there were no changes in the Company’s internal control over financial reporting during the second quarter 20202021 that have materially affected, or are reasonably likely to materially affect, our internal control over financial reporting.
| | |
| Part II – Other Information |
| | |
| Item 1. Legal Proceedings |
In October 2013,Verizon is not subject to any administrative or judicial proceeding arising under any Federal, State or local provisions that have been enacted or adopted regulating the California Attorney General’s Office notified certain Verizon companiesdischarge of potential violationsmaterials into the environment or primarily for the purpose of California state hazardous waste statutes primarily arising fromprotecting the disposalenvironment that is likely to result in monetary sanctions of electronic components, batteries and aerosol cans at certain California facilities. We are cooperating with this investigation and continue to monitor our operations relating to the management of hazardous waste. While penalties relating to the alleged violations could exceed $100,000, we do not expect that any penalties ultimately incurred will be material.$1 million or more.
See Note 1112 to the condensed consolidated financial statements for additional information regarding legal proceedings.
There have been no material changes to our risk factors as previously disclosed in Part I, Item 1A. included in our Annual Report on Form 10-K for the year ended December 31, 2019 and in Part II, Item 1A. included in our Quarterly Report on Form 10-Q for the quarter ended March 31, 2020.
| | |
| Item 2. Unregistered Sales of Equity Securities and Use of Proceeds |
In February 2020, the Verizon Board of Directors authorized a share buyback program to repurchase up to 100 million shares of the Company's common stock. The program will terminate when the aggregate number of shares purchased reaches 100 million or a new share repurchase plan superseding the current plan is authorized, whichever is sooner. Under the program, shares may be repurchased in privately negotiated transactions, on the open market, or otherwise, including through plans complying with Rule 10b5-1 under the Exchange Act. The timing and number of shares purchased under the program, if any, will depend on market conditions and the Company's capital allocation priorities.
Verizon did not repurchase any shares of Verizon common stock during the three months ended June 30, 2020.2021. At June 30, 2020,2021, the maximum number of shares that could be purchased by or on behalf of Verizon under our share buyback program was 100 million.
| | | | | | | | |
Exhibit
Number | | Description |
| | |
4.110 | | Fifth Supplemental Indenture between Verizon, both individually and as successor in interest to Verizon Global Funding Corp., and U.S. Bank National Association, as successor trustee to Wachovia Bank, National Association, formerly known as First Union National Bank, as Trustee, dated asDescription of May 15, 2020 (incorporated by reference to Form 8-K filed on May 15, 2020, Exhibit 4.1).Special Cash Retention Award for G. Gowrappan. |
| | |
| 31.1 | | Certification of Chief Executive Officer pursuant to Section 302 of the Sarbanes-Oxley Act of 2002. |
| | |
| 31.2 | | Certification of Chief Financial Officer pursuant to Section 302 of the Sarbanes-Oxley Act of 2002. |
| | |
| 32.1 | | Certification of Chief Executive Officer pursuant to Section 906 of the Sarbanes-Oxley Act of 2002. |
| | |
| 32.2 | | Certification of Chief Financial Officer pursuant to Section 906 of the Sarbanes-Oxley Act of 2002. |
| | |
| 101.INS | | XBRL Instance Document - the instance document does not appear in the interactive data file because its XBRL tags are embedded within the inline XBRL document. |
| | |
| 101.SCH | | XBRL Taxonomy Extension Schema Document. |
| | |
| 101.PRE | | XBRL Taxonomy Presentation Linkbase Document. |
| | |
| 101.CAL | | XBRL Taxonomy Calculation Linkbase Document. |
| | |
| 101.LAB | | XBRL Taxonomy Label Linkbase Document. |
| | |
| 101.DEF | | XBRL Taxonomy Extension Definition Linkbase Document. |
| | |
| 104 | | Cover Page Interactive Data File (formatted as inline XBRL with applicable taxonomy extension information contained in Exhibits 101). |
Pursuant to the requirements of the Securities Exchange Act of 1934, the registrant has duly caused this report to be signed on its behalf by the undersigned thereunto duly authorized.
| | | | | | | | | | | | | | |
| | VERIZON COMMUNICATIONS INC. | | |
| | | | |
Date: July 28, 20202021 | | By | /s/ | Anthony T. Skiadas |
| | | | Anthony T. Skiadas |
| | | | Senior Vice President and Controller |
| | | | (Principal Accounting Officer) |
| | | | | | | | |
Exhibit
Number | | Description |
| | |
| | Fifth Supplemental Indenture between Verizon, both individually and as successor in interest to Verizon Global Funding Corp., and U.S. Bank National Association, as successor trustee to Wachovia Bank, National Association, formerly known as First Union National Bank, as Trustee, dated asDescription of May 15, 2020 (incorporated by reference to Form 8-K filed on May 15, 2020, Exhibit 4.1).Special Cash Retention Award for G. Gowrappan. |
| | |
| | Certification of Chief Executive Officer pursuant to Section 302 of the Sarbanes-Oxley Act of 2002. |
| | |
| | Certification of Chief Financial Officer pursuant to Section 302 of the Sarbanes-Oxley Act of 2002. |
| | |
| | Certification of Chief Executive Officer pursuant to Section 906 of the Sarbanes-Oxley Act of 2002. |
| | |
| | Certification of Chief Financial Officer pursuant to Section 906 of the Sarbanes-Oxley Act of 2002. |
| | |
| 101.INS | | XBRL Instance Document - the instance document does not appear in the interactive data file because its XBRL tags are embedded within the inline XBRL document. |
| | |
| 101.SCH | | XBRL Taxonomy Extension Schema Document. |
| | |
| 101.PRE | | XBRL Taxonomy Presentation Linkbase Document. |
| | |
| 101.CAL | | XBRL Taxonomy Calculation Linkbase Document. |
| | |
| 101.LAB | | XBRL Taxonomy Label Linkbase Document. |
| | |
| 101.DEF | | XBRL Taxonomy Extension Definition Linkbase Document. |
| | |
| 104 | | Cover Page Interactive Data File (formatted as inline XBRL with applicable taxonomy extension information contained in Exhibits 101). |
| | |