UNITED STATES
SECURITIES AND EXCHANGE COMMISSION
Washington, D.C. 20549
FORM 10-Q
| | | | | | | | |
| (Mark one) | | |
| ☒ | QUARTERLY REPORT PURSUANT TO SECTION 13 OR 15(d)
OF THE SECURITIES EXCHANGE ACT OF 1934 | |
For the quarterly period ended March 31,September 30, 2021
OR
| | | | | | | | |
| ☐ | TRANSITION REPORT PURSUANT TO SECTION 13 OR 15(d)
OF THE SECURITIES EXCHANGE ACT OF 1934 | |
| | |
| For the transition period from to | |
Commission file number: 1-8606
Verizon Communications Inc.
(Exact name of registrant as specified in its charter)
| | | | | | | | |
| Delaware | | 23-2259884 |
(State or other jurisdiction
of incorporation or organization) | | (I.R.S. Employer Identification No.) |
| | | | | | | | | | | |
| 1095 Avenue of the Americas | | 10036 |
| New York, | New York | | |
| (Address of principal executive offices) | | (Zip Code) |
Registrant’s telephone number, including area code: (212) 395-1000
Securities registered pursuant to Section 12(b) of the Act:
| | | | | | | | | | | | | | |
| Title of Each Class | | Trading Symbol(s) | | Name of Each Exchange on Which Registered |
| Common Stock, par value $0.10 | | VZ | | New York Stock Exchange |
| Common Stock, par value $0.10 | | VZ | | The NASDAQ Global Select Market |
| 1.625% Notes due 2024 | | VZ24B | | New York Stock Exchange |
| 4.073% Notes due 2024 | | VZ24C | | New York Stock Exchange |
| 0.875% Notes due 2025 | | VZ25 | | New York Stock Exchange |
| 3.250% Notes due 2026 | | VZ26 | | New York Stock Exchange |
| 1.375% Notes due 2026 | | VZ26B | | New York Stock Exchange |
| 0.875% Notes due 2027 | | VZ27E | | New York Stock Exchange |
| 1.375% Notes due 2028 | | VZ28 | | New York Stock Exchange |
| 1.125% Notes due 2028 | | VZ28A | | New York Stock Exchange |
| 2.350% Fixed Rate Notes due 2028 | | VZ28C | | New York Stock Exchange |
| 1.875% Notes due 2029 | | VZ29B | | New York Stock Exchange |
| 0.375% Notes due 2029 | | VZ29D | | New York Stock Exchange |
| 1.250% Notes due 2030 | | VZ30 | | New York Stock Exchange |
| 1.875% Notes due 2030 | | VZ30A | | New York Stock Exchange |
| 2.625% Notes due 2031 | | VZ31 | | New York Stock Exchange |
| 2.500% Notes due 2031 | | VZ31A | | New York Stock Exchange |
| 3.000% Fixed Rate Notes due 2031 | | VZ31D | | New York Stock Exchange |
| 0.875% Notes due 2032 | | VZ32 | | New York Stock Exchange |
| 0.750% Notes due 2032 | | VZ32A | | New York Stock Exchange |
| 1.300% Notes due 2033 | | VZ33B | | New York Stock Exchange |
| 4.750% Notes due 2034 | | VZ34 | | New York Stock Exchange |
| 3.125% Notes due 2035 | | VZ35 | | New York Stock Exchange |
| 1.125% Notes due 2035 | | VZ35A | | New York Stock Exchange |
| 3.375% Notes due 2036 | | VZ36A | | New York Stock Exchange |
| 2.875% Notes due 2038 | | VZ38B | | New York Stock Exchange |
| 1.875% Notes due 2038 | | VZ38C | | New York Stock Exchange |
| 1.500% Notes due 2039 | | VZ39C | | New York Stock Exchange |
| 3.500% Fixed Rate Notes due 2039 | | VZ39D | | New York Stock Exchange |
| 1.850% Notes due 2040 | | VZ40 | | New York Stock Exchange |
| 3.850% Fixed Rate Notes due 2041 | | VZ41C | | New York Stock Exchange |
Indicate by check mark whether the registrant (1) has filed all reports required to be filed by Section 13 or 15(d) of the Securities Exchange Act of 1934 during the preceding 12 months (or for such shorter period that the registrant was required to file such reports), and (2) has been subject to such filing requirements for the past 90 days. ☒ Yes ☐ No
Indicate by check mark whether the registrant has submitted electronically every Interactive Data File required to be submitted pursuant to Rule 405 of Regulation S-T (§232.405 of this chapter) during the preceding 12 months (or for such shorter period that the registrant was required to submit such files). ☒ Yes ☐ No
| | | | | | | | | | | | | | | | | |
| Indicate by check mark whether the registrant is a large accelerated filer, an accelerated filer, a non-accelerated filer, a smaller reporting company, or an emerging growth company. See the definitions of "large accelerated filer," "accelerated filer," "smaller reporting company," and "emerging growth company" in Rule 12b-2 of the Exchange Act. |
| | | | | |
| Large accelerated filer | ☒ | | Accelerated filer | ☐ |
| Non-accelerated filer | ☐ | | Smaller reporting company | ☐ |
| | | | Emerging growth company | ☐ |
If an emerging growth company, indicate by check mark if the registrant has elected not to use the extended transition period for complying with any new or revised financial accounting standards provided pursuant to Section 13(a) of the Exchange Act. ☐
Indicate by check mark whether the registrant is a shell company (as defined in Rule 12b-2 of the Exchange Act). ☐ Yes ☒ No
At March 31,September 30, 2021, 4,140,067,6334,140,163,896 shares of the registrant’s common stock were outstanding, after deducting 151,366,013151,269,750 shares held in treasury.
| | | | | | | | |
| Item No. | | Page |
| | |
| |
| | |
| Item 1. | | |
| | |
| | |
| Three and nine months ended March 31,September 30, 2021 and 2020 | |
| | |
| | |
| Three and nine months ended March 31,September 30, 2021 and 2020 | |
| | |
| | |
| At March 31,September 30, 2021 and December 31, 2020 | |
| | |
| | |
| ThreeNine months ended March 31,September 30, 2021 and 2020 | |
| | |
| | |
| | |
| Item 2. | | |
| | |
| Item 3. | | |
| | |
| Item 4. | | |
| |
| |
| | |
| Item 1. | | |
| | |
| Item 1A. | | |
| | |
| Item 2. | | |
| | |
| Item 6. | | |
| |
| |
| |
| |
| | |
| Part I - Financial Information |
| | |
| Item 1. Financial Statements (Unaudited) |
| | |
| Condensed Consolidated Statements of Income |
| Verizon Communications Inc. and Subsidiaries |
| | | Three Months Ended | | | Three Months Ended | | Nine Months Ended |
| | | March 31, | | | September 30, | | September 30, |
| (dollars in millions, except per share amounts) (unaudited) | (dollars in millions, except per share amounts) (unaudited) | 2021 | | 2020 | | (dollars in millions, except per share amounts) (unaudited) | 2021 | | 2020 | | 2021 | | 2020 |
| | Operating Revenues | Operating Revenues | | | Operating Revenues | |
| Service revenues and other | Service revenues and other | $ | 27,923 | | | $ | 27,481 | | | Service revenues and other | $ | 27,565 | | | $ | 27,431 | | | $ | 83,709 | | | $ | 81,604 | |
| Wireless equipment revenues | Wireless equipment revenues | 4,944 | | | 4,129 | | | Wireless equipment revenues | 5,350 | | | 4,112 | | | 15,837 | | | 11,996 | |
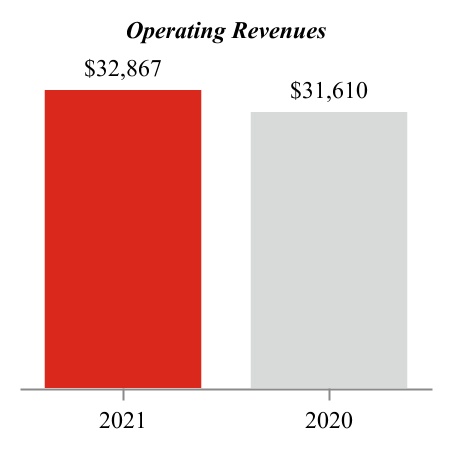
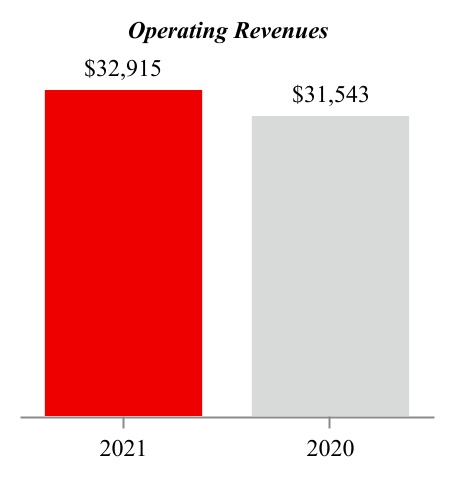
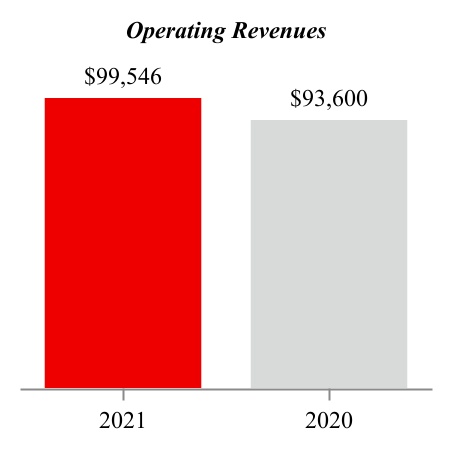
| Total Operating Revenues | Total Operating Revenues | 32,867 | | | 31,610 | | | Total Operating Revenues | 32,915 | | | 31,543 | | | 99,546 | | | 93,600 | |
| | Operating Expenses | Operating Expenses | | | Operating Expenses | |
| Cost of services (exclusive of items shown below) | Cost of services (exclusive of items shown below) | 8,020 | | | 7,754 | | | Cost of services (exclusive of items shown below) | 7,855 | | | 7,955 | | | 24,199 | | | 23,348 | |
| Cost of wireless equipment | Cost of wireless equipment | 5,502 | | | 4,542 | | | Cost of wireless equipment | 5,673 | | | 4,379 | | | 17,106 | | | 13,031 | |
| Selling, general and administrative expense | Selling, general and administrative expense | 7,401 | | | 8,585 | | | Selling, general and administrative expense | 6,521 | | | 7,339 | | | 21,246 | | | 23,080 | |
| Depreciation and amortization expense | Depreciation and amortization expense | 4,174 | | | 4,150 | | | Depreciation and amortization expense | 3,961 | | | 4,192 | | | 12,155 | | | 12,523 | |
| Total Operating Expenses | Total Operating Expenses | 25,097 | | | 25,031 | | | Total Operating Expenses | 24,010 | | | 23,865 | | | 74,706 | | | 71,982 | |
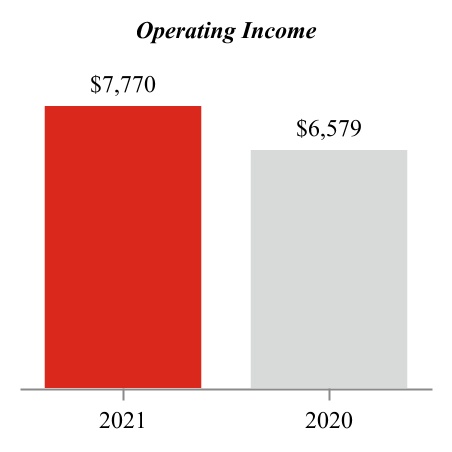
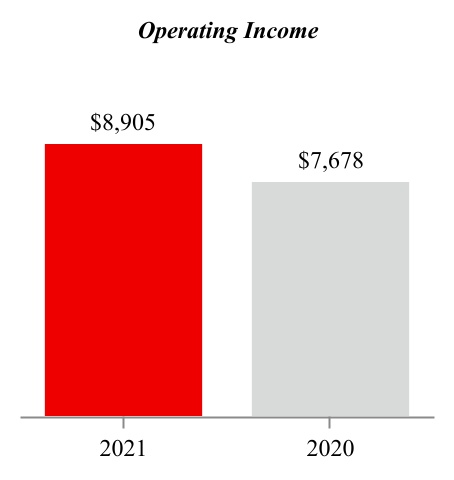
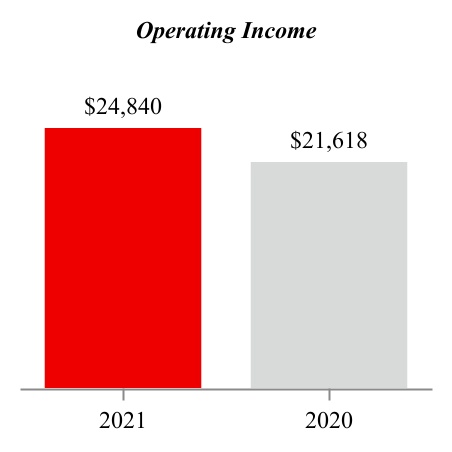
| | Operating Income | Operating Income | 7,770 | | | 6,579 | | | Operating Income | 8,905 | | | 7,678 | | | 24,840 | | | 21,618 | |
| Equity in earnings (losses) of unconsolidated businesses | Equity in earnings (losses) of unconsolidated businesses | 8 | | | (12) | | | Equity in earnings (losses) of unconsolidated businesses | 1 | | | (9) | | | 10 | | | (34) | |
| Other income, net | 401 | | | 143 | | | |
| Other income (expense), net | | Other income (expense), net | 269 | | | (774) | | | 1,172 | | | (703) | |
| Interest expense | Interest expense | (1,101) | | | (1,034) | | | Interest expense | (801) | | | (1,044) | | | (2,746) | | | (3,167) | |
| Income Before Provision For Income Taxes | Income Before Provision For Income Taxes | 7,078 | | | 5,676 | | | Income Before Provision For Income Taxes | 8,374 | | | 5,851 | | | 23,276 | | | 17,714 | |
| Provision for income taxes | Provision for income taxes | (1,700) | | | (1,389) | | | Provision for income taxes | (1,820) | | | (1,347) | | | (5,395) | | | (4,084) | |
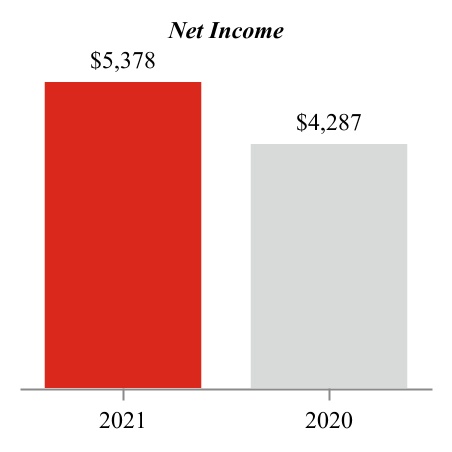
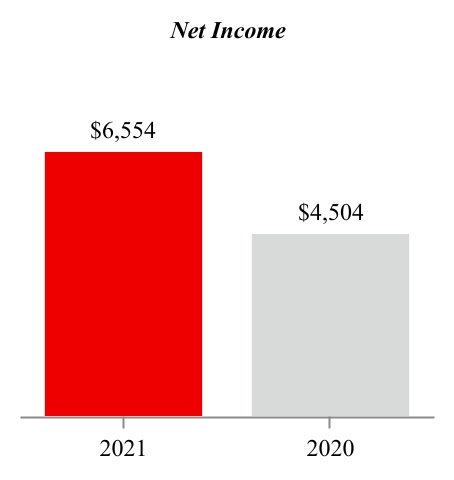
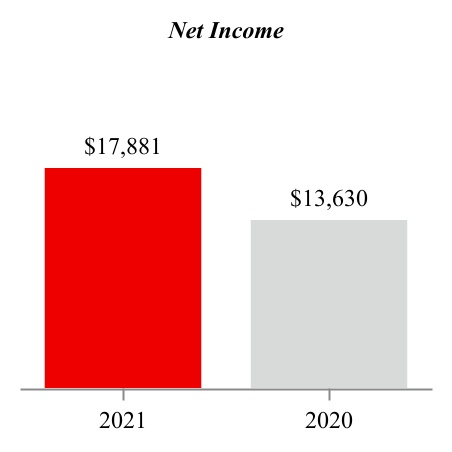
| Net Income | Net Income | $ | 5,378 | | | $ | 4,287 | | | Net Income | $ | 6,554 | | | $ | 4,504 | | | $ | 17,881 | | | $ | 13,630 | |
| | Net income attributable to noncontrolling interests | Net income attributable to noncontrolling interests | $ | 133 | | | $ | 131 | | | Net income attributable to noncontrolling interests | $ | 147 | | | $ | 147 | | | $ | 429 | | | $ | 417 | |
| Net income attributable to Verizon | Net income attributable to Verizon | 5,245 | | | 4,156 | | | Net income attributable to Verizon | 6,407 | | | 4,357 | | | 17,452 | | | 13,213 | |
| Net Income | Net Income | $ | 5,378 | | | $ | 4,287 | | | Net Income | $ | 6,554 | | | $ | 4,504 | | | $ | 17,881 | | | $ | 13,630 | |
| | Basic Earnings Per Common Share | Basic Earnings Per Common Share | | | Basic Earnings Per Common Share | |
| Net income attributable to Verizon | Net income attributable to Verizon | $ | 1.27 | | | $ | 1.00 | | | Net income attributable to Verizon | $ | 1.55 | | | $ | 1.05 | | | $ | 4.21 | | | $ | 3.19 | |
| Weighted-average shares outstanding (in millions) | Weighted-average shares outstanding (in millions) | 4,141 | | | 4,139 | | | Weighted-average shares outstanding (in millions) | 4,142 | | | 4,140 | | | 4,141 | | | 4,139 | |
| | Diluted Earnings Per Common Share | Diluted Earnings Per Common Share | | | Diluted Earnings Per Common Share | |
| Net income attributable to Verizon | Net income attributable to Verizon | $ | 1.27 | | | $ | 1.00 | | | Net income attributable to Verizon | $ | 1.55 | | | $ | 1.05 | | | $ | 4.21 | | | $ | 3.19 | |
| Weighted-average shares outstanding (in millions) | Weighted-average shares outstanding (in millions) | 4,142 | | | 4,141 | | | Weighted-average shares outstanding (in millions) | 4,144 | | | 4,142 | | | 4,143 | | | 4,141 | |
See Notes to Condensed Consolidated Financial Statements
| | |
| Condensed Consolidated Statements of Comprehensive Income |
| Verizon Communications Inc. and Subsidiaries |
| | | | Three Months Ended | | Three Months Ended | Nine Months Ended |
| | March 31, | | September 30, |
| (dollars in millions) (unaudited) | (dollars in millions) (unaudited) | 2021 | | 2020 | (dollars in millions) (unaudited) | 2021 | | 2020 | 2021 | | 2020 |
| | Net Income | Net Income | $ | 5,378 | | | $ | 4,287 | | Net Income | $ | 6,554 | | | $ | 4,504 | | $ | 17,881 | | | $ | 13,630 | |
| Other Comprehensive Income (Loss), Net of Tax (Expense) Benefit | Other Comprehensive Income (Loss), Net of Tax (Expense) Benefit | | Other Comprehensive Income (Loss), Net of Tax (Expense) Benefit | |
| Foreign currency translation adjustments, net of tax of $8 and $(4) | (38) | | | (120) | | |
| Unrealized gain (loss) on cash flow hedges, net of tax of $(340) and $792 | 909 | | | (2,210) | | |
| Unrealized loss on marketable securities, net of tax of $1 and $1 | (5) | | | (1) | | |
| Defined benefit pension and postretirement plans, net of tax of $51 and $56 | (155) | | | (169) | | |
| Foreign currency translation adjustments, net of tax of $(6), $10, $(13) and $10 | | Foreign currency translation adjustments, net of tax of $(6), $10, $(13) and $10 | (146) | | | 124 | | (126) | | | 81 | |
| Unrealized gain (loss) on cash flow hedges, net of tax of $61, $(176), $15 and $483 | | Unrealized gain (loss) on cash flow hedges, net of tax of $61, $(176), $15 and $483 | (174) | | | 505 | | (42) | | | (1,391) | |
| Unrealized gain (loss) on marketable securities, net of tax of $1, $(1), $2 and $(2) | | Unrealized gain (loss) on marketable securities, net of tax of $1, $(1), $2 and $(2) | — | | | 2 | | (5) | | | 7 | |
| Defined benefit pension and postretirement plans, net of tax of $51, $55, $154 and $166 | | Defined benefit pension and postretirement plans, net of tax of $51, $55, $154 and $166 | (155) | | | (169) | | (465) | | | (507) | |
| Other comprehensive income (loss) attributable to Verizon | Other comprehensive income (loss) attributable to Verizon | 711 | | | (2,500) | | Other comprehensive income (loss) attributable to Verizon | (475) | | | 462 | | (638) | | | (1,810) | |
| Total Comprehensive Income | Total Comprehensive Income | $ | 6,089 | | | $ | 1,787 | | Total Comprehensive Income | $ | 6,079 | | | $ | 4,966 | | $ | 17,243 | | | $ | 11,820 | |
| | Comprehensive income attributable to noncontrolling interests | Comprehensive income attributable to noncontrolling interests | $ | 133 | | | $ | 131 | | Comprehensive income attributable to noncontrolling interests | $ | 147 | | | $ | 147 | | $ | 429 | | | $ | 417 | |
| Comprehensive income attributable to Verizon | Comprehensive income attributable to Verizon | 5,956 | | | 1,656 | | Comprehensive income attributable to Verizon | 5,932 | | | 4,819 | | 16,814 | | | 11,403 | |
| Total Comprehensive Income | Total Comprehensive Income | $ | 6,089 | | | $ | 1,787 | | Total Comprehensive Income | $ | 6,079 | | | $ | 4,966 | | $ | 17,243 | | | $ | 11,820 | |
See Notes to Condensed Consolidated Financial Statements
| | |
| Condensed Consolidated Balance Sheets |
| Verizon Communications Inc. and Subsidiaries |
| | | | At March 31, | | At December 31, | | At September 30, | | At December 31, |
| (dollars in millions, except per share amounts) (unaudited) | (dollars in millions, except per share amounts) (unaudited) | 2021 | | 2020 | (dollars in millions, except per share amounts) (unaudited) | 2021 | | 2020 |
| | Assets | Assets | | Assets | |
| Current assets | Current assets | | Current assets | |
| Cash and cash equivalents | Cash and cash equivalents | $ | 10,205 | | | $ | 22,171 | | Cash and cash equivalents | $ | 9,936 | | | $ | 22,171 | |
| Accounts receivable | Accounts receivable | 23,611 | | | 25,169 | | Accounts receivable | 23,165 | | | 25,169 | |
| Less Allowance for credit losses | Less Allowance for credit losses | 1,104 | | | 1,252 | | Less Allowance for credit losses | 970 | | | 1,252 | |
| | Accounts receivable, net | Accounts receivable, net | 22,507 | | | 23,917 | | Accounts receivable, net | 22,195 | | | 23,917 | |
| Inventories | Inventories | 1,303 | | | 1,796 | | Inventories | 2,303 | | | 1,796 | |
| Prepaid expenses and other | Prepaid expenses and other | 5,632 | | | 6,710 | | Prepaid expenses and other | 5,843 | | | 6,710 | |
| Total current assets | Total current assets | 39,647 | | | 54,594 | | Total current assets | 40,277 | | | 54,594 | |
| | Property, plant and equipment | Property, plant and equipment | 282,742 | | | 279,737 | | Property, plant and equipment | 287,421 | | | 279,737 | |
| Less Accumulated depreciation | Less Accumulated depreciation | 187,866 | | | 184,904 | | Less Accumulated depreciation | 191,665 | | | 184,904 | |
| Property, plant and equipment, net | Property, plant and equipment, net | 94,876 | | | 94,833 | | Property, plant and equipment, net | 95,756 | | | 94,833 | |
| | Investments in unconsolidated businesses | Investments in unconsolidated businesses | 555 | | | 589 | | Investments in unconsolidated businesses | 1,100 | | | 589 | |
| Wireless licenses | Wireless licenses | 98,012 | | | 96,097 | | Wireless licenses | 145,767 | | | 96,097 | |
| Deposits for wireless licenses | Deposits for wireless licenses | 45,490 | | | 2,772 | | Deposits for wireless licenses | — | | | 2,772 | |
| Goodwill | Goodwill | 24,837 | | | 24,773 | | Goodwill | 24,887 | | | 24,773 | |
| Other intangible assets, net | Other intangible assets, net | 9,304 | | | 9,413 | | Other intangible assets, net | 7,022 | | | 9,413 | |
| Operating lease right-of-use assets | Operating lease right-of-use assets | 22,315 | | | 22,531 | | Operating lease right-of-use assets | 27,969 | | | 22,531 | |
| Other assets | Other assets | 10,537 | | | 10,879 | | Other assets | 10,679 | | | 10,879 | |
| Total assets | Total assets | $ | 345,573 | | | $ | 316,481 | | Total assets | $ | 353,457 | | | $ | 316,481 | |
| | Liabilities and Equity | Liabilities and Equity | | Liabilities and Equity | |
| Current liabilities | Current liabilities | | Current liabilities | |
| Debt maturing within one year | Debt maturing within one year | $ | 8,802 | | | $ | 5,889 | | Debt maturing within one year | $ | 7,623 | | | $ | 5,889 | |
| Accounts payable and accrued liabilities | Accounts payable and accrued liabilities | 17,219 | | | 20,658 | | Accounts payable and accrued liabilities | 20,153 | | | 20,658 | |
| Current operating lease liabilities | Current operating lease liabilities | 3,536 | | | 3,485 | | Current operating lease liabilities | 3,606 | | | 3,485 | |
| Other current liabilities | Other current liabilities | 9,173 | | | 9,628 | | Other current liabilities | 9,976 | | | 9,628 | |
| Total current liabilities | Total current liabilities | 38,730 | | | 39,660 | | Total current liabilities | 41,358 | | | 39,660 | |
| | Long-term debt | Long-term debt | 149,700 | | | 123,173 | | Long-term debt | 143,352 | | | 123,173 | |
| Employee benefit obligations | Employee benefit obligations | 18,252 | | | 18,657 | | Employee benefit obligations | 16,516 | | | 18,657 | |
| Deferred income taxes | Deferred income taxes | 36,747 | | | 35,711 | | Deferred income taxes | 38,481 | | | 35,711 | |
| Non-current operating lease liabilities | Non-current operating lease liabilities | 17,766 | | | 18,000 | | Non-current operating lease liabilities | 23,507 | | | 18,000 | |
| Other liabilities | Other liabilities | 11,695 | | | 12,008 | | Other liabilities | 11,754 | | | 12,008 | |
| Total long-term liabilities | Total long-term liabilities | 234,160 | | | 207,549 | | Total long-term liabilities | 233,610 | | | 207,549 | |
| | Commitments and Contingencies (Note 12) | Commitments and Contingencies (Note 12) | 0 | | 0 | Commitments and Contingencies (Note 12) | 0 | | 0 |
| | Equity | Equity | | Equity | |
| Series preferred stock ($0.10 par value; 250,000,000 shares authorized; NaN issued) | 0 | | | 0 | | |
| Series preferred stock ($0.10 par value; 250,000,000 shares authorized; none issued) | | Series preferred stock ($0.10 par value; 250,000,000 shares authorized; none issued) | — | | | — | |
| Common stock ($0.10 par value; 6,250,000,000 shares authorized in each period; 4,291,433,646 shares issued in each period) | Common stock ($0.10 par value; 6,250,000,000 shares authorized in each period; 4,291,433,646 shares issued in each period) | 429 | | | 429 | | Common stock ($0.10 par value; 6,250,000,000 shares authorized in each period; 4,291,433,646 shares issued in each period) | 429 | | | 429 | |
| Additional paid in capital | Additional paid in capital | 13,408 | | | 13,404 | | Additional paid in capital | 13,402 | | | 13,404 | |
| Retained earnings | Retained earnings | 63,107 | | | 60,464 | | Retained earnings | 70,062 | | | 60,464 | |
| Accumulated other comprehensive income (loss) | 640 | | | (71) | | |
| Common stock in treasury, at cost (151,366,013 and 153,304,088 shares outstanding) | (6,634) | | | (6,719) | | |
| Deferred compensation – employee stock ownership plans and other | 282 | | | 335 | | |
| Accumulated other comprehensive loss | | Accumulated other comprehensive loss | (709) | | | (71) | |
| Common stock in treasury, at cost (151,269,750 and 153,304,088 shares outstanding) | | Common stock in treasury, at cost (151,269,750 and 153,304,088 shares outstanding) | (6,630) | | | (6,719) | |
| Deferred compensation – employee stock ownership plans (ESOPs) and other | | Deferred compensation – employee stock ownership plans (ESOPs) and other | 490 | | | 335 | |
| Noncontrolling interests | Noncontrolling interests | 1,451 | | | 1,430 | | Noncontrolling interests | 1,445 | | | 1,430 | |
| Total equity | Total equity | 72,683 | | | 69,272 | | Total equity | 78,489 | | | 69,272 | |
| Total liabilities and equity | Total liabilities and equity | $ | 345,573 | | | $ | 316,481 | | Total liabilities and equity | $ | 353,457 | | | $ | 316,481 | |
See Notes to Condensed Consolidated Financial Statements
| | |
| Condensed Consolidated Statements of Cash Flows |
| Verizon Communications Inc. and Subsidiaries |
| | | Three Months Ended | | Nine Months Ended |
| | | March 31, | | September 30, |
| (dollars in millions) (unaudited) | (dollars in millions) (unaudited) | 2021 | | 2020 | (dollars in millions) (unaudited) | 2021 | | 2020 |
| | Cash Flows from Operating Activities | Cash Flows from Operating Activities | | Cash Flows from Operating Activities | |
| Net Income | Net Income | $ | 5,378 | | | $ | 4,287 | | Net Income | $ | 17,881 | | | $ | 13,630 | |
| Adjustments to reconcile net income to net cash provided by operating activities: | Adjustments to reconcile net income to net cash provided by operating activities: | | Adjustments to reconcile net income to net cash provided by operating activities: | |
| Depreciation and amortization expense | Depreciation and amortization expense | 4,174 | | | 4,150 | | Depreciation and amortization expense | 12,155 | | | 12,523 | |
| Employee retirement benefits | Employee retirement benefits | (253) | | | (1) | | Employee retirement benefits | (1,928) | | | 867 | |
| Deferred income taxes | Deferred income taxes | 762 | | | (87) | | Deferred income taxes | 2,970 | | | 530 | |
| Provision for expected credit losses | Provision for expected credit losses | 224 | | | 553 | | Provision for expected credit losses | 604 | | | 1,100 | |
| Equity in losses of unconsolidated businesses, net of dividends received | Equity in losses of unconsolidated businesses, net of dividends received | 19 | | | 26 | | Equity in losses of unconsolidated businesses, net of dividends received | 32 | | | 67 | |
| | Changes in current assets and liabilities, net of effects from acquisition/disposition of businesses | Changes in current assets and liabilities, net of effects from acquisition/disposition of businesses | (41) | | | (1,208) | | Changes in current assets and liabilities, net of effects from acquisition/disposition of businesses | 603 | | | 1,345 | |
| | Other, net | Other, net | (569) | | | 1,104 | | Other, net | (1,155) | | | 2,410 | |
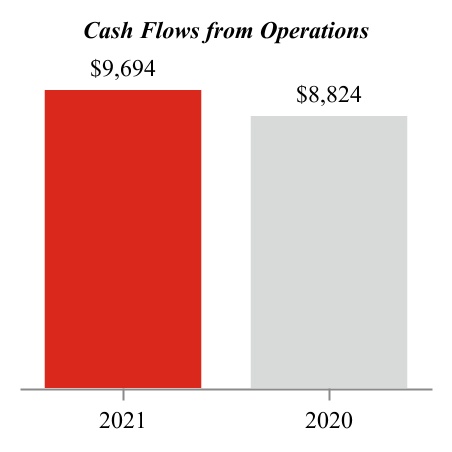
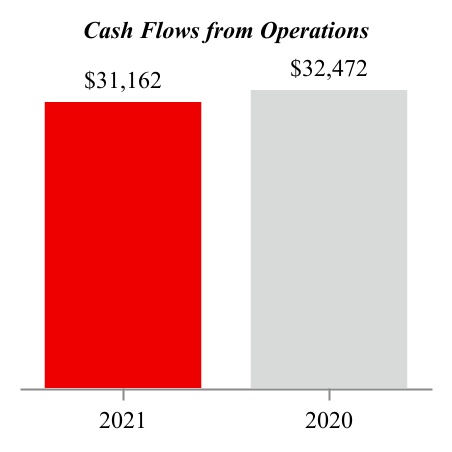
| Net cash provided by operating activities | Net cash provided by operating activities | 9,694 | | | 8,824 | | Net cash provided by operating activities | 31,162 | | | 32,472 | |
| | Cash Flows from Investing Activities | Cash Flows from Investing Activities | | Cash Flows from Investing Activities | |
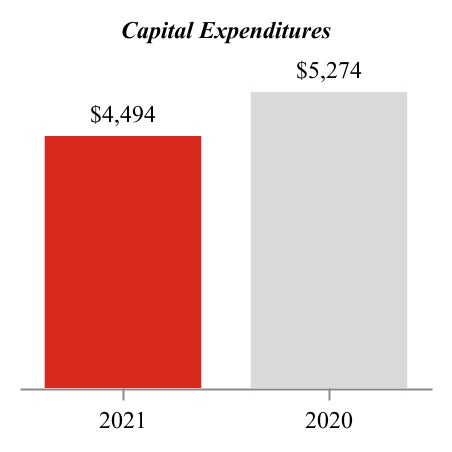
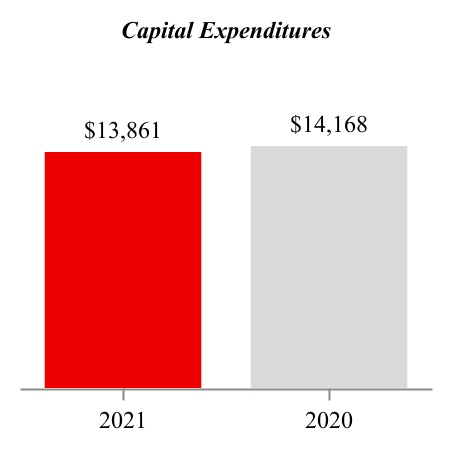
| Capital expenditures (including capitalized software) | Capital expenditures (including capitalized software) | (4,494) | | | (5,274) | | Capital expenditures (including capitalized software) | (13,861) | | | (14,168) | |
| Acquisitions of businesses, net of cash acquired | Acquisitions of businesses, net of cash acquired | (408) | | | 0 | | Acquisitions of businesses, net of cash acquired | (459) | | | (507) | |
| Acquisitions of wireless licenses | Acquisitions of wireless licenses | (44,783) | | | (434) | | Acquisitions of wireless licenses | (47,027) | | | (3,757) | |
| | Proceeds from disposition of business | | Proceeds from disposition of business | 4,122 | | | — | |
| Other, net | Other, net | 32 | | | (1,272) | | Other, net | 207 | | | (37) | |
| Net cash used in investing activities | Net cash used in investing activities | (49,653) | | | (6,980) | | Net cash used in investing activities | (57,018) | | | (18,469) | |
| | Cash Flows from Financing Activities | Cash Flows from Financing Activities | | Cash Flows from Financing Activities | |
| Proceeds from long-term borrowings | Proceeds from long-term borrowings | 31,383 | | | 5,848 | | Proceeds from long-term borrowings | 32,482 | | | 12,387 | |
| Proceeds from asset-backed long-term borrowings | Proceeds from asset-backed long-term borrowings | 1,000 | | | 2,844 | | Proceeds from asset-backed long-term borrowings | 2,695 | | | 4,439 | |
| Repayments of long-term borrowings and finance lease obligations | Repayments of long-term borrowings and finance lease obligations | (302) | | | (1,700) | | Repayments of long-term borrowings and finance lease obligations | (7,904) | | | (8,853) | |
| Repayments of asset-backed long-term borrowings | Repayments of asset-backed long-term borrowings | (732) | | | (2,229) | | Repayments of asset-backed long-term borrowings | (3,887) | | | (6,726) | |
| Dividends paid | Dividends paid | (2,601) | | | (2,547) | | Dividends paid | (7,797) | | | (7,636) | |
| Other, net | Other, net | (792) | | | 347 | | Other, net | (2,120) | | | (1,348) | |
| Net cash provided by financing activities | 27,956 | | | 2,563 | | |
| Net cash provided by (used in) financing activities | | Net cash provided by (used in) financing activities | 13,469 | | | (7,737) | |
| | Increase (decrease) in cash, cash equivalents and restricted cash | Increase (decrease) in cash, cash equivalents and restricted cash | (12,003) | | | 4,407 | | Increase (decrease) in cash, cash equivalents and restricted cash | (12,387) | | | 6,266 | |
| Cash, cash equivalents and restricted cash, beginning of period | Cash, cash equivalents and restricted cash, beginning of period | 23,498 | | | 3,917 | | Cash, cash equivalents and restricted cash, beginning of period | 23,498 | | | 3,917 | |
| Cash, cash equivalents and restricted cash, end of period (Note 1) | Cash, cash equivalents and restricted cash, end of period (Note 1) | $ | 11,495 | | | $ | 8,324 | | Cash, cash equivalents and restricted cash, end of period (Note 1) | $ | 11,111 | | | $ | 10,183 | |
See Notes to Condensed Consolidated Financial Statements
| | |
Notes to Condensed Consolidated Financial Statements (Unaudited) |
| Verizon Communications Inc. and Subsidiaries |
| | |
| Note 1. Basis of Presentation |
The accompanying unaudited condensed consolidated financial statements have been prepared in accordance with generally accepted accounting principles (GAAP) in the United States (U.S.) and based upon Securities and Exchange Commission rules that permit reduced disclosure for interim periods. For a more complete discussion of significant accounting policies and certain other information, you should refer to the financial statements included in Verizon Communications Inc.'s (Verizon or the Company) Annual Report on Form 10-K for the year ended December 31, 2020. These financial statements reflect all adjustments that are necessary for a fair presentation of results of operations and financial condition for the interim periods shown, including normal recurring accruals and other items. The results for the interim periods are not necessarily indicative of results for the full year.
Certain amounts have been reclassified to conform to the current period’s presentation.
Earnings Per Common Share
There were a total of approximately 2 million outstanding dilutive securities, primarily consisting of restricted stock units, included in the computation of diluted earnings per common share for the three and nine months ended March 31,September 30, 2021 and March 31,September 30, 2020.
Cash, Cash Equivalents and Restricted Cash
We consider all highly liquid investments with an original maturity of 90 days or less when purchased to be cash equivalents. Cash equivalents are stated at cost, which approximates quoted market value and includes amounts held in money market funds.
Cash collections on the device payment plan agreement receivables collateralizing our asset-backed debt securities are required at certain specified times to be placed into segregated accounts. Deposits to the segregated accounts are considered restricted cash and are included in Prepaid expenses and other and Other assets in our condensed consolidated balance sheets.
Cash, cash equivalents and restricted cash are included in the following line items in the condensed consolidated balance sheets:
| | | At March 31, | | At December 31, | | Decrease | | At September 30, | | At December 31, | | Decrease |
| (dollars in millions) | (dollars in millions) | 2021 | | 2020 | | (dollars in millions) | 2021 | | 2020 | |
| Cash and cash equivalents | Cash and cash equivalents | $ | 10,205 | | | $ | 22,171 | | | $ | (11,966) | | Cash and cash equivalents | $ | 9,936 | | | $ | 22,171 | | | $ | (12,235) | |
| Restricted cash: | Restricted cash: | | Restricted cash: | |
| Prepaid expenses and other | Prepaid expenses and other | 1,180 | | | 1,195 | | | (15) | | Prepaid expenses and other | 1,074 | | | 1,195 | | | (121) | |
| Other assets | Other assets | 110 | | | 132 | | | (22) | | Other assets | 101 | | | 132 | | | (31) | |
| | Cash, cash equivalents and restricted cash | Cash, cash equivalents and restricted cash | $ | 11,495 | | | $ | 23,498 | | | $ | (12,003) | | Cash, cash equivalents and restricted cash | $ | 11,111 | | | $ | 23,498 | | | $ | (12,387) | |
| | |
| Note 2. Revenues and Contract Costs |
We earn revenue from contracts with customers, primarily through the provision of telecommunications and other services and through the sale of wireless equipment.
Revenue by Category
We have 2 reportable segments that we operate and manage as strategic business units - Consumer and Business. Revenue is disaggregated by products and services withinwithin Consumer and customer groups (Small and Medium Business, Global Enterprise, Public Sector and Other, and Wholesale) within Business. See Note 11 for additional information on revenue by segment.
Corporate and other primarily includes insurance captives as well as the historical results of our media business,the divested Verizon Media Group (Verizon Media), and other businesses. On September 1, 2021, we completed the sale of Verizon Media to an affiliate of Apollo Global Management Inc. Under our ownership, Verizon Media generated revenues from contracts with customers under Accounting Standards Updated (ASU) 2014-09, "Revenue from Contracts with Customers" (Topic 606) of approximately $1.9$1.4 billion and $1.7$5.3 billion during the three and nine months ended March 31,September 30, 2021, respectively. Under our ownership, Verizon Media generated revenues from contracts with customers under Topic 606 of approximately $1.7 billion and March 31,$4.7 billion during the three and nine months ended September 30, 2020, respectively. Refer to Note 3 for additional information on the sale of Verizon Media.
We also earn revenues that are not accounted for under Topic 606 from leasing arrangements (such as those for towers and equipment), captive reinsurance arrangements primarily related to wireless device insurance and the interest on equipment financed under a device payment plan agreement when sold to the customer by an authorized agent. As allowed by the practical expedient within ASU 2016-02, "Leases" (Topic 842), we have elected to combine the lease and non-lease components for those arrangements of customer premise equipment where we are the lessor as components accounted for under Topic 606. During the three and nine months ended March 31,September 30, 2021, revenues from arrangements that were not accounted for under Topic 606 were approximately $803 million and March 31,$2.3 billion, respectively. During the three and nine months ended September 30, 2020, revenues from arrangements that were not accounted for under Topic 606 were approximately $735$715 million and $812 million,$2.3 billion, respectively.
Remaining Performance Obligations
When allocating the total contract transaction price to identified performance obligations, a portion of the total transaction price may relate to service performance obligations which were not satisfied or are partially satisfied as of the end of the reporting period. Below we disclose
information relating to these unsatisfied performance obligations. We apply the practical expedient available under Topic 606 that provides the option to exclude the expected revenues arising from unsatisfied performance obligations related to contracts that have an original expected duration of one year or less. This situation primarily arises with respect to certain month-to-month service contracts. At March 31,September 30, 2021, month-to-month service contracts represented approximately 91%93% of our wireless postpaid contracts and approximately 78%83% of our wireline Consumer and Small and Medium Business contracts, compared to March 31,September 30, 2020, for which month-to-month service contracts represented approximately 88%90% of our wireless postpaid contracts and 64%70% of our wireline Consumer and Small and Medium Business contracts.
Additionally, certain contracts provide customers the option to purchase additional services. The fees related to these additional services are recognized when the customer exercises the option (typically on a month-to-month basis).
Contracts for wireless services are generally either month-to-month and cancellable at any time (typically under a device payment plan) or contain terms ranging from greater than one month to up to two years (typically under a fixed-term plan). Additionally, customers may incur charges based on usage or additional optional services purchased in conjunction with entering into a contract that can be cancelledcanceled at any time and therefore are not included in the transaction price. The transaction price allocated to service performance obligations, which are not satisfied or are partially satisfied as of the end of the reporting period, are generally related to contracts that are not accounted for as month-to-month contracts.
Our Consumer group customers also include traditional wholesale resellers that purchase and resell wireless service under their own brands to their respective customers. Reseller arrangements generally include a stated contract term, which typically extends longer than two years and, in some cases, include a periodic minimum revenue commitment over the contract term for which revenues will be recognized in future periods.
Consumer customer contracts for wireline services are generally month-to-month; however, they may have a service term of two years or shorter than twelve months. Certain contracts with Business customers for wireline services extend into future periods, contain fixed monthly fees and usage-based fees, and can include annual commitments in each year of the contract or commitments over the entire specified contract term; however, a significant number of contracts for wireline services with our Business customers have a contract term that is twelve months or less.
Additionally, there are certain contracts with Business customers for wireline and telematics services and certain Verizon Media contracts with customers that have a contractual minimum fee over the total contract term. We cannot predict the time period when revenue will be recognized related to those contracts; thus, they are excluded from the time bands below. These contracts have varying terms spanning over approximately seven years ending in January 2029 and have aggregate contract minimum payments totaling $2.7 billion.
At March 31,September 30, 2021, the transaction price related to unsatisfied performance obligations for total Verizon that isare expected to be recognized for the remainder of 2021, 2022 and thereafter was $13.3$4.7 billion, $9.1$14.5 billion and $2.0$6.3 billion, respectively. Remaining performance obligation estimates are subject to change and are affected by several factors, including terminations and changes in the timing and scope of contracts, arising from contract modifications.
Accounts Receivable and Contract Balances
The timing of revenue recognition may differ from the time of billing to our customers. Receivables presented in our condensed consolidated balance sheets represent an unconditional right to consideration. Contract balances represent amounts from an arrangement when either Verizon has performed, by transferring goods or services to the customer in advance of receiving all or partial consideration for such goods and services from the customer, or the customer has made payment to Verizon in advance of obtaining control of the goods and/or services promised to the customer in the contract.
Contract assets primarily relate to our rights to consideration for goods or services provided to customers but for which we do not have an unconditional right at the reporting date. Under a fixed-term plan, total contract revenue is allocated between wireless service and equipment revenues. In conjunction with these arrangements, a contract asset is created, which represents the difference between the amount of equipment revenue recognized upon sale and the amount of consideration received from the customer when the performance obligation related to the transfer of control of the equipment is satisfied. The contract asset is reclassified to accounts receivable as wireless services are provided and billed. We have the right to bill the customer as service is provided over time, which results in our right to the payment being unconditional. The contract asset balances are presented in our condensed consolidated balance sheets as Prepaid expenses and other and Other assets. We recognize the allowance for credit losses at inception and reassess quarterly based on management’s expectation of the asset’s collectability.
Contract liabilities arise when we bill our customers and receive consideration in advance of providing the goods or services promised in the contract. We typically bill service one month in advance, which is the primary component of the contract liability balance. Contract liabilities are recognized as revenue when services are provided to the customer. The contract liability balances are presented in our condensed consolidated balance sheets as Other current liabilities and Other liabilities.
The following table presents information about receivables from contracts with customers:
| | | At March 31, | | At January 1, | | At March 31, | | At January 1, | | At September 30, | | At January 1, | | At September 30, | | At January 1, |
| (dollars in millions) | (dollars in millions) | 2021 | | 2021 | | 2020 | | 2020 | (dollars in millions) | 2021 | | 2021 | | 2020 | | 2020 |
Receivables(1) | Receivables(1) | $ | 10,821 | | | $ | 12,029 | | | $ | 11,273 | | | $ | 12,078 | | Receivables(1) | $ | 10,088 | | | $ | 12,029 | | | $ | 11,094 | | | $ | 12,078 | |
Device payment plan agreement receivables(2) | Device payment plan agreement receivables(2) | 10,409 | | | 10,358 | | | 10,955 | | | 11,741 | | Device payment plan agreement receivables(2) | 11,178 | | | 10,358 | | | 9,559 | | | 11,741 | |
(1)Balances do not include receivables related to the following contracts: leasing arrangements (such as those for towers and equipment), captive reinsurance arrangements primarily related to wireless device insurance and the interest on equipment financed under a device payment plan agreement when sold to the customer by an authorized agent.
(2)Included in device payment plan agreement receivables presented in Note 7. Balances do not include receivables derived from the sale of equipment on a device payment plan through an authorized agent.
The following table presents information about contract balances:
| | | At March 31, | | At January 1, | | At March 31, | | At January 1, | | At September 30, | | At January 1, | | At September 30, | | At January 1, |
| (dollars in millions) | (dollars in millions) | 2021 | | 2021 | | 2020 | | 2020 | (dollars in millions) | 2021 | | 2021 | | 2020 | | 2020 |
| Contract asset | Contract asset | $ | 923 | | | $ | 937 | | | $ | 1,135 | | | $ | 1,150 | | Contract asset | $ | 878 | | | $ | 937 | | | $ | 923 | | | $ | 1,150 | |
Contract liability (1) | Contract liability (1) | 5,783 | | | 5,598 | | | 5,347 | | | 5,307 | | Contract liability (1) | 6,034 | | | 5,598 | | | 5,321 | | | 5,307 | |
(1) Revenue recognized related to contract liabilities existing at January 1, 2021 were $161 million and $4.2 billion for the three and nine months ended September 30, 2021, respectively. Revenue recognized related to contract liabilities existing at January 1, 2020 were $3.9 billion$124 million and $3.8$4.2 billion, for the three and nine months ended March 31, 2021 and March 31,September 30, 2020, respectively.
The balance of contract assets and contract liabilities recorded in our condensed consolidated balance sheets were as follows:
| | | At March 31, | | At December 31, | | At September 30, | | At December 31, |
| (dollars in millions) | (dollars in millions) | 2021 | | 2020 | (dollars in millions) | 2021 | | 2020 |
| Assets | Assets | | Assets | |
| Prepaid expenses and other | Prepaid expenses and other | $ | 729 | | | $ | 733 | | Prepaid expenses and other | $ | 701 | | | $ | 733 | |
| Other assets | Other assets | 194 | | | 204 | | Other assets | 177 | | | 204 | |
| Total | Total | $ | 923 | | | $ | 937 | | Total | $ | 878 | | | $ | 937 | |
| | Liabilities | Liabilities | | Liabilities | |
| Other current liabilities | Other current liabilities | $ | 4,979 | | | $ | 4,843 | | Other current liabilities | $ | 5,159 | | | $ | 4,843 | |
| Other liabilities | Other liabilities | 804 | | | 755 | | Other liabilities | 875 | | | 755 | |
| Total | Total | $ | 5,783 | | | $ | 5,598 | | Total | $ | 6,034 | | | $ | 5,598 | |
Contract Costs
Topic 606 requires the recognition of an asset for incremental costs to obtain a customer contract, which are then amortized to expense over the respective periods of expected benefit. We recognize an asset for incremental commission expenses paid to internal and external sales personnel and agents in conjunction with obtaining customer contracts. We only defer these costs when we have determined the commissions are incremental costs that would not have been incurred absent the customer contract and are expected to be recoverable. Costs to obtain a contract are amortized and recorded ratably as commission expense over the period representing the transfer of goods or services to which the assets relate. Costs to obtain wireless contracts are amortized over both of our Consumer and Business customers' estimated device upgrade cycles, as such costs are typically incurred each time a customer upgrades. Costs to obtain wireline contracts are amortized as expense over the estimated customer relationship period for our Consumer customers. Incremental costs to obtain wireline contracts for our Business customers are insignificant. Costs to obtain contracts are recorded in Selling, general and administrative expense.
We also defer costs incurred to fulfill contracts that: (1) relate directly to the contract; (2) are expected to generate resources that will be used to satisfy our performance obligation under the contract; and (3) are expected to be recovered through revenue generated under the contract. Contract fulfillment costs are expensed as we satisfy our performance obligations and recorded in Cost of services. These costs principally relate to direct costs that enhance our wireline business resources, such as costs incurred to install circuits.
We determine the amortization periods for our costs incurred to obtain or fulfill a customer contract at a portfolio level due to the similarities within these customer contract portfolios.
Other costs, such as general costs or costs related to past performance obligations, are expensed as incurred.
Collectively, costs to obtain a contract and costs to fulfill a contract are referred to as deferred contract costs, and amortized over a two-to five-yearsix-year period. Deferred contract costs are classified as current or non-current within Prepaid expenses and other and Other assets, respectively.
The balances of deferred contract costs included in our condensed consolidated balance sheets were as follows:
| | | At March 31, | | At December 31, | | At September 30, | | At December 31, |
| (dollars in millions) | (dollars in millions) | 2021 | | 2020 | (dollars in millions) | 2021 | | 2020 |
| Assets | Assets | | Assets | |
| Prepaid expenses and other | Prepaid expenses and other | $ | 2,426 | | | $ | 2,472 | | Prepaid expenses and other | $ | 2,366 | | | $ | 2,472 | |
| Other assets | Other assets | 2,068 | | | 2,070 | | Other assets | 2,151 | | | 2,070 | |
| Total | Total | $ | 4,494 | | | $ | 4,542 | | Total | $ | 4,517 | | | $ | 4,542 | |
For the three and nine months ended March 31,September 30, 2021, we recognized expense of $751 million and $2.3 billion, respectively, associated with the amortization of deferred contract costs, primarily within Selling, general and administrative expense in our condensed consolidated statements of income. For the three and nine months ended September 30, 2020, we recognized expense of $765$763 million and $778 million,$2.3 billion, respectively, associated with the amortization of deferred contract costs, primarily within Selling, general and administrative expense in our condensed consolidated statements of income.
We assess our deferred contract costs for impairment on a quarterly basis. We recognize an impairment charge to the extent the carrying amount of a deferred cost exceeds the remaining amount of consideration we expect to receive in exchange for the goods and services related to the cost, less the expected costs related directly to providing those goods and services that have not yet been recognized as expenses. There have been 0no impairment charges recognized for the three and nine months ended March 31,September 30, 2021 or March 31,September 30, 2020.
| | |
| Note 3. Acquisitions and Divestitures |
Spectrum License Transactions
In March 2020, the Federal Communications Commission's (FCC) incentive auction, Auction 103, for spectrum licenses in the upper 37 GHz,Gigahertz (GHz), 39 GHz, and 47 GHz bands concluded. Verizon participated in this incentive auction and was the high bidder on 4,940 licenses, which primarily consisted of 37 GHz and, to a lesser extent, 39 GHz spectrum. As an incumbent licensee, our 39 GHz licenses provided us with incentive payments that were applied towards the purchase price of spectrum in the auction. The value of the licenses won by Verizon amounted to $3.4 billion, of which $1.8 billion was settled with the relinquished 39 GHz licenses. The remaining balance was settled in cash of $1.6 billion, of which $101 million was paid in December 2019. In connection with the incentive auction, a pre-tax net loss of $1.2 billion ($914 million after-tax) was recorded in Selling, general and administrative expense in the condensed consolidated statement of income during the threenine months ended March 31,September 30, 2020 because the exchange of the previously held licenses for new licenses had commercial substance. See Note 4 for additional information. The new reconfigured licenses were received in the second quarter 2020 and are included in Wireless licenses in our condensed consolidated balance sheet.
In September 2020, the FCC completed Auction 105 for Priority Access Licenses. Verizon participated in the auction and was the high bidder on 557 licenses in the 3.5 GHz band valued at approximately $1.9 billion. Verizon made payments for these licenses in 2020 and received them from the FCC in March 2021. The average remaining renewal period for these acquired licenses was 10 years. The purchase cost for these licenses and related capitalized interest, to the extent qualifying activities have occurred, are included in Wireless licenses in our condensed consolidated balance sheet.
In February 2021, the FCC concluded Auction 107 for C-Band wireless spectrum. Verizon was the winning bidder on 3,511 licenses, consisting of contiguous C-Band spectrum bands ranging between 140 and 200 megahertz of C-Band spectrum in all 406 markets available in the auction. Verizon paid $45.5 billion for the licenses it won, of which $44.6 billion was paid in the first quarter of 2021. In accordance with the rules applicable to the auction, Verizon is required to make additional payments to acquire the licenses. The payments are for our allocable share of clearing costs incurred by, and incentive payments due to, the incumbent license holders associated with the auction, which are estimated to be $7.4$7.7 billion. In September 2021, we made a payment of $1.3 billion for certain obligations related to projected clearing costs associated with the auction. We expect to begin making thesemake payments related to accelerated clearing incentives later in 2021 for the topinitial 46 markets andmarkets. We expect to continue to do so for the remaining marketsmake payments related to clearing cost and incentive payment obligations through 2024. These payments are dependent on the incumbent license holders accelerated clearing of the spectrum for Verizon’s use and, therefore, the final timing and amounts could differ based on the incumbent holders’ execution of their clearing process. PerIn accordance with the FCC order, the clearing must be completed by December 2025.
The carrying value of ourthe wireless spectrum won in Auction 107 will consist of all payments required to participate and purchase licenses in the auction, including Verizon’s allocable share of clearing costs incurred by, and incentive payments due to, the incumbent license holders associated with the auction that we are obligated to pay in order to acquire the licenses. Carrying value will also include capitalized interest to the extent qualifying activities have occurred. These figuresThe licenses were received from the FCC in July 2021 and are recordedincluded within Deposits for wirelessWireless licenses in our condensed consolidated balance sheet. Reclassificationsheet as of September 30, 2021. The average remaining renewal period for these amounts to Wirelessacquired licenses is made upon receipt of the corresponding licenses. The timing of when the licenses will be issued will be determined by the FCC after all the payments have been made.was 15 years.
Refer to Note 6 for further details on significant debt transactions.
During the three and nine months ended March 31,September 30, 2021, we entered into and completed various other wireless license acquisitions for cash consideration of an insignificant amount and approximately $90 million. In addition, we reached 2 agreements to sell$95 million, respectively. We recognized a pre-tax loss in connection with the sale of certain wireless licenses for insignificant cash consideration. We reclassified these wireless licenses as assets held for sale within Other assets and recognized a pre-tax lossduring the nine months ended September 30, 2021 of $223 million ($167 million after-tax). The agreement is subject to regulatory approval and buyer financing conditions.
BlueJeansBlue Jeans Network, Inc.
In April 2020, we entered into a definitive purchase agreement to acquire BlueJeansBlue Jeans Network, Inc. (BlueJeans), an enterprise-grade video conferencing and event platform, whose services are sold to Business customers globally. The transaction closed in May 2020. The aggregate cash consideration paid by Verizon at the closing of the transaction was approximately $397 million, net of cash acquired.
The acquisition of BlueJeans was accounted for as a business combination. The consideration was allocated to the assets acquired and liabilities assumed based on their fair values as of the close of the acquisition. We recorded approximately $246 million of goodwill and $190 million of other intangible assets, which primarily consisted of customer lists and internally developed technology. Goodwill is calculated as the difference between the acquisition date fair value of the consideration transferred and the fair value of the net assets acquired. The goodwill represents future economic benefits that we expect to achieve as a result of the acquisition. The goodwill related to this acquisition is included within Business.
TracFone Wireless, Inc.
In September 2020, we entered into a purchase agreement (Tracfone Purchase Agreement) with América Móvil to acquire TracFone Wireless, Inc. (Tracfone), a provider of prepaid and value mobile services in the U.S. Under the terms of the Tracfone Purchase Agreement, we will acquire all of the stock of Tracfone for approximately $3.1 billion in cash and $3.1 billion in Verizon common stock, subject to customary adjustments, at closing. The number of shares issued will be based on an average trading price determined as of the closing date and is subject to a minimum number of shares issuable of 47,124,445 and a maximum number of shares issuable of 57,596,544. The Tracfone Purchase Agreement also includes up to an additional $650 million in future cash consideration related to the achievement of certain performance measures and other commercial arrangements. The transaction is subject to regulatory approvals and closing conditions and is expected to close in the second halffourth quarter of 2021.
Bluegrass Cellular
In October 2020, we entered into a definitive agreement to acquire certain assets of Bluegrass Cellular (Bluegrass), a rural wireless operator serving central Kentucky. Bluegrass provides wireless service to 210,000 customers in 34 counties in rural service areas 3, 4, and 5 in Central Kentucky. The transaction closed in March 2021. The aggregate cash consideration paid by Verizon at the closing of the transaction was approximately $405$412 million, net of cash acquired, which is subject to customary closing adjustments.
The financial results of Bluegrass are included in the consolidated results of Verizon from the date of acquisition. These amounts are insignificant forFor the three and nine months ended March 31, 2021.September 30, 2021, revenue related to Bluegrass was insignificant and approximately $88 million, respectively.
The acquisition of Bluegrass was accounted for as a business combination. We are currently assessing the identification and measurement of the assets acquired and liabilities assumed based on their fair values as of the close of the acquisition. Preliminarily, we recorded approximately $146$141 million of plant, property and equipment, $135 million of intangible assets and $80$92 million of goodwill. Goodwill is calculated as the difference between the acquisition date fair value of the consideration transferred and the fair value of the net assets acquired. The goodwill represents future economic benefits that we expect to achieve as a result of the acquisition. The goodwill related to this acquisition is included within Consumer.
OtherVerizon Media
In November 2020,On May 2, 2021, Verizon entered into a definitive agreement with an agreementaffiliate of Apollo Global Management Inc. (the Apollo Affiliate) pursuant to which we agreed to sell our Huffington Post business. In connection with thisVerizon Media in return for consideration of $4.3 billion in cash, subject to customary adjustments, $750 million in non-convertible preferred limited partnership units of the Apollo Affiliate, and 10% of the fully-diluted common limited partnership units of the Apollo Affiliate.
On September 1, 2021, we completed the sale of Verizon Media. As of the close of the transaction, wecash proceeds, the fair value of the non-convertible preferred limited partnership units of the Apollo Affiliate, and the fair value of 10% of the fully-diluted common limited partnership units of the Apollo Affiliate were $4.3 billion, $496 million, and $124 million, respectively. We recorded a pre-tax lossgain on sale of $126 millionapproximately $1.1 billion (after-tax $1.1 billion) in Selling general and administrative expense in our condensed consolidated statement of income for the yearthree and nine months ended December 31, 2020. The transaction closedSeptember 30, 2021. In addition, we incurred $346 million of various costs associated with this disposition which are primarily recorded in FebruarySelling general and administrative expense in our condensed consolidated statement of income for the three and nine months ended September 30, 2021.
Upon the closing of the transaction, Verizon’s preferred limited partnership interest in the Apollo Affiliate and 10% common interest in the Apollo Affiliate were recognized at their initial fair value of $496 million and $124 million, respectively. The fair values were both estimated using a combination of the market approach and the income approach. The valuations are both considered Level 3 fair value measurements due to the use of significant judgment and unobservable inputs, which include the amount and timing of future cash flows, and a discount rate reflecting risks inherent in the future cash flows and market prices. Verizon’s preferred limited partnership interest is accounted for at cost, and is subject to impairment and other changes resulting from observable price changes in orderly transactions for identical or similar investments of the issuer. On September 28, 2021, the Apollo Affiliate redeemed $100 million of Verizon’s preferred limited partnership interest reducing the carrying value of our preferred interest at September 30, 2021 to $396 million. The redemption is reflected within Net cash used in investing activities in our condensed consolidated statement of cash flows for the nine months ended September 30, 2021. Verizon’s 10% common interest in the Apollo Affiliate is accounted for as an equity method investment. The post-sale results of Verizon’s common ownership interest in the Apollo Affiliate are recorded through the equity method of accounting, within our Corporate and other segment.
The following table summarizes the assets and liabilities which were disposed as a result of the closing of the transaction:
| | | | | | | |
| September 1, | | |
| (dollars in millions) | 2021 | | |
| Assets: | | | |
| Cash, cash equivalents and restricted cash | $ | 168 | | | |
| | | |
| Accounts receivable | 1,597 | | | |
| Prepaid expenses and other | 134 | | | |
| | | |
| | | |
| Property, plant and equipment, net | 1,235 | | | |
| Other intangible assets, net | 2,579 | | | |
| Other assets | 221 | | | |
| Total assets | $ | 5,934 | | | |
| Liabilities: | | | |
| Accounts payable and accrued liabilities | $ | 1,411 | | | |
| Other current liabilities | 315 | | | |
| Other liabilities | 310 | | | |
| Total liabilities | $ | 2,036 | | | |
| | | |
| | | |
| | | |
| | | |
The operating results of Verizon Media are included within our Corporate and other segment for all periods presented through the date of the sale. Refer to Note 2 for further details on revenues generated by Verizon Media under Topic 606.
In connection with the closing of the transaction, we entered into Transition Services Agreements with the Apollo Affiliate, under which Verizon will continue to provide and receive specified administrative and technical services to support operations for up to 12 months and 18 months, respectively.
Other
During the three and nine months ended September 30, 2021, we completed other acquisitions for cash consideration of an insignificant amount and $51 million, respectively.
| | |
| Note 4. Wireless Licenses, Goodwill, and Other Intangible Assets |
Wireless Licenses
The carrying amounts of our Wireless licenses, as well as wireless spectrum for which licenses havehad not yet been received, are as follows:
| | | At March 31, | At December 31, | | At September 30, | At December 31, |
| (dollars in millions) | (dollars in millions) | 2021 | 2020 | (dollars in millions) | 2021 | 2020 |
| Wireless licenses | Wireless licenses | $ | 98,012 | | $ | 96,097 | | Wireless licenses | $ | 145,767 | | $ | 96,097 | |
| Deposits for wireless licenses | Deposits for wireless licenses | 45,490 | | 2,772 | | Deposits for wireless licenses | — | | 2,772 | |
At March 31,September 30, 2021 and 2020, approximately $53.5$54.8 billion and $3.5$6.9 billion, respectively, of wireless licenses were under development for commercial service for which we were capitalizing interest costs. At March 31, 2021, the $53.5 billion was comprised of $8.0 billion recorded in Wireless licenses and $45.5 billion recorded in Deposits for wireless licenses. At March 31, 2020, $3.5 billion, was recorded in Wireless licenses. We recorded approximately $79 million$1.1 billion and $64$171 million of capitalized interest on wireless licenses for the threenine months ended March 31,September 30, 2021 and 2020, respectively. We recorded approximately $35 million of
In July 2021, we received the wireless licenses won in connection with the FCC's auction for C-Band wireless spectrum, Auction 107. As a result, these wireless licenses, including capitalized interest, onwere reclassified from Deposits for wireless licenses during the three months ended March 31, 2021.to Wireless licenses in our condensed consolidated balance sheet. Refer to Note 3 for additional information regarding spectrum license transactions.
In the first quarter of 2020, we reclassified substantially all of our 39 GHz wireless licenses, including capitalized interest, with a carrying value of $2.8 billion to assets held for sale in connection with the FCC's incentive auction, Auction 103. As a result, these wireless licenses
were adjusted down to their fair value of $1.6 billion resulting in a pre-tax loss of $1.2 billion ($914 million after-tax) in 2020. The new reconfigured licenses were received in the second quarter 2020 and had a value of $3.4 billion.
During the threenine months ended March 31,September 30, 2021, we renewed various wireless licenses in accordance with FCC regulations. The average renewal period for these licenses was 10 years.
Goodwill
Changes in the carrying amount of Goodwill are as follows:
| | (dollars in millions) | (dollars in millions) | Consumer | | Business | | Other | | Total | (dollars in millions) | Consumer | | Business | | Other | | Total |
Balance at January 1, 2021 (1) | Balance at January 1, 2021 (1) | $ | 17,222 | | | $ | 7,535 | | | $ | 16 | | | $ | 24,773 | | Balance at January 1, 2021 (1) | $ | 17,222 | | | $ | 7,535 | | | $ | 16 | | | $ | 24,773 | |
Acquisitions (2) | Acquisitions (2) | 80 | | | 0 | | | 0 | | | 80 | | Acquisitions (2) | 92 | | | — | | | 37 | | | 129 | |
| Reclassifications, adjustments and other | Reclassifications, adjustments and other | 3 | | | (19) | | | 0 | | | (16) | | Reclassifications, adjustments and other | 3 | | | (17) | | | (1) | | | (15) | |
Balance at March 31, 2021 (1) | $ | 17,305 | | | $ | 7,516 | | | $ | 16 | | | $ | 24,837 | | |
Balance at September 30, 2021 (1) | | Balance at September 30, 2021 (1) | $ | 17,317 | | | $ | 7,518 | | | $ | 52 | | | $ | 24,887 | |
(1) Goodwill is net of accumulated impairment charges of $4.8 billion, related to our historical Media reporting unit.unit, which included Verizon Media. On September 1, 2021, we completed the sale of Verizon Media. See Note 3 for additional information.
(2)The change in goodwill due to acquisitions is duerelated to Bluegrass.Bluegrass and other insignificant transactions. See Note 3 for additional information.
Other Intangible Assets
The following table displays the composition of Other intangible assets, net as well as the respective amortization period:
| | | | At March 31, 2021 | | At December 31, 2020 | | At September 30, 2021 | | At December 31, 2020 |
| (dollars in millions) | (dollars in millions) | Gross
Amount | | Accumulated
Amortization | | Net
Amount | | Gross
Amount | | Accumulated
Amortization | | Net
Amount | (dollars in millions) | Gross (1) Amount | | Accumulated
Amortization | | Net
Amount | | Gross
Amount | | Accumulated
Amortization | | Net
Amount |
| Customer lists (8 to 13 years) | Customer lists (8 to 13 years) | $ | 4,055 | | | $ | (2,058) | | | $ | 1,997 | | | $ | 4,021 | | | $ | (1,961) | | | $ | 2,060 | | Customer lists (8 to 13 years) | $ | 1,933 | | | $ | (1,033) | | | $ | 900 | | | $ | 4,021 | | | $ | (1,961) | | | $ | 2,060 | |
| Non-network internal-use software (5 to 7 years) | Non-network internal-use software (5 to 7 years) | 22,107 | | | (15,548) | | | 6,559 | | | 21,685 | | | (15,104) | | | 6,581 | | Non-network internal-use software (5 to 7 years) | 20,525 | | | (14,524) | | | 6,001 | | | 21,685 | | | (15,104) | | | 6,581 | |
| Other (4 to 25 years) | Other (4 to 25 years) | 1,770 | | | (1,022) | | | 748 | | | 1,771 | | | (999) | | | 772 | | Other (4 to 25 years) | 869 | | | (748) | | | 121 | | | 1,771 | | | (999) | | | 772 | |
| Total | Total | $ | 27,932 | | | $ | (18,628) | | | $ | 9,304 | | | $ | 27,477 | | | $ | (18,064) | | | $ | 9,413 | | Total | $ | 23,327 | | | $ | (16,305) | | | $ | 7,022 | | | $ | 27,477 | | | $ | (18,064) | | | $ | 9,413 | |
(1) Other intangible assets are net of assets disposed as a result of the closing of the Verizon Media sale on September 1, 2021. See Note 3 for additional information.
The amortization expense for Other intangible assets was as follows:
| | | Three Months Ended | | | Three Months Ended | | Nine Months Ended |
| (dollars in millions) | (dollars in millions) | March 31, | | (dollars in millions) | September 30, | | September 30, |
| 2021 | 2021 | $ | 629 | | | 2021 | $ | 430 | | | $ | 1,539 | |
| 2020 | 2020 | 592 | | | 2020 | 621 | | | 1,818 | |
The estimated future amortization expense for Other intangible assets for the remainder of the current year and next 5 years is as follows:
| | Years | Years | (dollars in millions) | Years | (dollars in millions) |
| Remainder of 2021 | Remainder of 2021 | $ | 1,804 | | Remainder of 2021 | $ | 440 | |
| 2022 | 2022 | 2,085 | | 2022 | 1,632 | |
| 2023 | 2023 | 1,712 | | 2023 | 1,426 | |
| 2024 | 2024 | 1,276 | | 2024 | 1,187 | |
| 2025 | 2025 | 906 | | 2025 | 994 | |
| 2026 | 2026 | 690 | | 2026 | 758 | |
| | |
| Note 5. Leasing Arrangements |
We enter into various lease arrangements for network equipment including towers, distributed antenna systems, small cells, real estate and connectivity mediums including dark fiber, equipment, and other various types of assets for use in our operations. Our leases have remaining lease terms ranging from 1 year to 30 years, some of which include options that we can elect to extend the leases term for up to 25 years, and some of which include options to terminate the leases. For the majority of leases entered into during the current period, we have concluded it is not reasonably certain that we would exercise the options to extend the lease or terminate the lease. Therefore, as of the lease commencement date, our lease terms generally do not include these options. We include options to extend the lease when it is reasonably certain that we will exercise that option.
In April 2021, Verizon executed agreements that modified the tenure and payment terms for certain existing cell tower operating leases to support the build-outbuild out of our fifth-generationfifth generation wireless network. Verizon expects these
The components of net lease modifications will result in an increase to ourcost were as follows: | | | | | | | | | | | | | | | | | | | | | | | |
| | Three Months Ended | Nine Months Ended |
| | September 30, | September 30, |
| (dollars in millions) | Classification | 2021 | | 2020 | 2021 | | 2020 |
Operating lease cost (1) | Cost of services
Selling, general and administrative expense | $ | 1,332 | | | $ | 1,279 | | $ | 3,917 | | | $ | 3,766 | |
| Finance lease cost: | | | | | | | |
| Amortization of right-of-use assets | Depreciation and amortization expense | 65 | | | 9 | | 198 | | | 300 | |
| Interest on lease liabilities | Interest expense | 9 | | | 9 | | 26 | | | 29 | |
Short-term lease cost (1) | Cost of services
Selling, general and administrative expense | 7 | | | 5 | | 16 | | | 17 | |
Variable lease cost (1) | Cost of services
Selling, general and administrative expense | 75 | | | 74 | | 234 | | | 226 | |
| Sublease income | Service revenues and other | (47) | | | (72) | | (144) | | | (216) | |
| Total net lease cost | | $ | 1,441 | | | $ | 1,304 | | $ | 4,247 | | | $ | 4,122 | |
| | | | | | | |
| | | | | | | |
(1) All operating lease right-of-use assetscosts, including short-term and liabilitiesvariable lease costs, are split between Cost of approximately $7.0 billion to $7.5 billionservices and Selling, general and administrative expense in the second quartercondensed consolidated statements of 2021.income based on the use of the facility or equipment that the rent is being paid on. Refer to the consolidated financial statements included in Verizon's Annual Report on Form 10-K for the year ended December 31, 2020 for additional information. Variable lease costs represent payments that are dependent on a rate or index, or on usage of the asset.
The Company's maturity analysis of operating and finance lease liabilities as of September 30, 2021 were as follows: | | | | | | | | | | | |
| | | (dollars in millions) |
| Years | Operating Leases | | Finance Leases |
| Remainder of 2021 | $ | 1,085 | | | $ | 107 | |
| 2022 | 4,233 | | | 399 | |
| 2023 | 4,017 | | | 337 | |
| 2024 | 3,760 | | | 268 | |
| 2025 | 3,380 | | | 149 | |
| Thereafter | 14,661 | | | 111 | |
| Total lease payments | 31,136 | | | 1,371 | |
| Less interest | 4,023 | | | 70 | |
| Present value of lease liabilities | 27,113 | | | 1,301 | |
| Less current obligation | 3,606 | | | 393 | |
| Long-term obligation at September 30, 2021 | $ | 23,507 | | | $ | 908 | |
Significant Debt Transactions
Debt or equity financing may be needed to fund additional investments or development activities or to maintain an appropriate capital structure to ensure our financial flexibility.
The following table showstables show the significant transactions involving the senior unsecured debt securities of Verizon and its subsidiaries that occurred during the threenine months ended March 31,September 30, 2021.
Exchange Offers
| | | | | | | | | | | |
| (dollars in millions) | Principal Amount Exchanged | | Principal Amount Issued |
| | | |
| | | |
| | | |
| | | |
| | | |
| | | |
| | | |
| | | |
| | | |
| | | |
| Verizon 0.750% - 4.150% notes and floating rate notes, due 2024 - 2026 | $ | 4,480 | | | $ | — | |
Verizon 2.355% notes due 2032 (1) | — | | | 4,664 | |
Three and Nine Months Ended September 30, 2021 total (2) | $ | 4,480 | | | $ | 4,664 | |
(1) The principal amount issued in exchange does not include either an insignificant amount of cash paid in lieu of the issuance of fractional new notes or accrued and unpaid interest paid on the old notes accepted for exchange to the date of exchange.
(2) The debt exchange offers above meet the criteria to be accounted for as a modification of debt. As a result, the excess of the principal amount of new notes issued over the principal amount of notes exchanged of $184 million was recorded as a discount to Long-term debt in the condensed consolidated balance sheets.
Repayments, Redemptions and Repurchases
| | | | | | | | | | | |
| (dollars in millions) | Principal Repaid/ Redeemed/ Repurchased | | Amount Paid (1) |
| | | |
| | | |
| | | |
| | | |
| | | |
| | | |
| | | |
| | | |
| | | |
| | | |
| Three Months Ended June 30, 2021 | | | |
| Verizon 2.946% notes due 2022 | $ | 713 | | | $ | 730 | |
| Verizon 2.450% notes due 2022 | 794 | | | 819 | |
| Verizon 5.150% notes due 2023 | 3,190 | | | 3,519 | |
| Open market repurchases of various Verizon and subsidiary notes | 1,994 | | | 2,440 | |
| | | |
| Three Months Ended June 30, 2021 total | 6,691 | | | 7,508 | |
| Nine Months Ended September 30, 2021 total | $ | 6,691 | | | $ | 7,508 | |
| | | |
| | | |
| | | |
| | | |
| | | |
| | | |
| | | |
| | | |
(1) Represents amount paid to repay, redeem, or repurchase, excluding interest or dividend.
During October 2021, we notified investors of our intention to redeem in November 2021 all of the approximately $478 million outstanding aggregate principal amount of 4.150% notes due 2024.
Issuances
| | (amounts in millions) | (amounts in millions) | Principal Amount Issued | | Net Proceeds (1) | (amounts in millions) | Principal Amount Issued | | Net Proceeds (1) |
| | Three Months Ended March 31, 2021 | | Three Months Ended March 31, 2021 | |
| Verizon 0.750% notes due 2024 | Verizon 0.750% notes due 2024 | $ | 1,750 | | | $ | 1,746 | | Verizon 0.750% notes due 2024 | $ | 1,750 | | | $ | 1,746 | |
Verizon floating rate (Compounded SOFR(2) + 0.500%) notes due 2024 | Verizon floating rate (Compounded SOFR(2) + 0.500%) notes due 2024 | 750 | | | 748 | | Verizon floating rate (Compounded SOFR(2) + 0.500%) notes due 2024 | 750 | | | 748 | |
| Verizon 1.450% notes due 2026 | Verizon 1.450% notes due 2026 | 2,750 | | | 2,737 | | Verizon 1.450% notes due 2026 | 2,750 | | | 2,737 | |
Verizon floating rate (Compounded SOFR(2) + 0.790%) notes due 2026 | Verizon floating rate (Compounded SOFR(2) + 0.790%) notes due 2026 | 750 | | | 748 | | Verizon floating rate (Compounded SOFR(2) + 0.790%) notes due 2026 | 750 | | | 748 | |
| Verizon 2.100% notes due 2028 | Verizon 2.100% notes due 2028 | 3,000 | | | 2,988 | | Verizon 2.100% notes due 2028 | 3,000 | | | 2,988 | |
| Verizon 2.550% notes due 2031 | Verizon 2.550% notes due 2031 | 4,250 | | | 4,216 | | Verizon 2.550% notes due 2031 | 4,250 | | | 4,216 | |
| Verizon 3.400% notes due 2041 | Verizon 3.400% notes due 2041 | 3,750 | | | 3,726 | | Verizon 3.400% notes due 2041 | 3,750 | | | 3,726 | |
| Verizon 3.550% notes due 2051 | Verizon 3.550% notes due 2051 | 4,500 | | | 4,426 | | Verizon 3.550% notes due 2051 | 4,500 | | | 4,426 | |
| Verizon 3.700% notes due 2061 | Verizon 3.700% notes due 2061 | 3,500 | | | 3,439 | | Verizon 3.700% notes due 2061 | 3,500 | | | 3,439 | |
Verizon 0.375% notes due 2029 (3) | Verizon 0.375% notes due 2029 (3) | € | 1,000 | | | 1,186 | | Verizon 0.375% notes due 2029 (3) | € | 1,000 | | | 1,186 | |
Verizon 0.750% notes due 2032 (3) | Verizon 0.750% notes due 2032 (3) | € | 1,000 | | | 1,181 | | Verizon 0.750% notes due 2032 (3) | € | 1,000 | | | 1,181 | |
Verizon 1.125% notes due 2035 (3) | Verizon 1.125% notes due 2035 (3) | € | 750 | | | 878 | | Verizon 1.125% notes due 2035 (3) | € | 750 | | | 878 | |
Verizon 2.375% notes due 2028 (3) | Verizon 2.375% notes due 2028 (3) | C$ | 1,000 | | | 800 | | Verizon 2.375% notes due 2028 (3) | C$ | 1,000 | | | 800 | |
Verizon 4.050% notes due 2051 (3) | Verizon 4.050% notes due 2051 (3) | C$ | 500 | | | 399 | | Verizon 4.050% notes due 2051 (3) | C$ | 500 | | | 399 | |
Verizon 2.350% notes due 2028 (3) | Verizon 2.350% notes due 2028 (3) | A$ | 600 | | | 463 | | Verizon 2.350% notes due 2028 (3) | A$ | 600 | | | 463 | |
Verizon 3.000% notes due 2031 (3) | Verizon 3.000% notes due 2031 (3) | A$ | 500 | | | 385 | | Verizon 3.000% notes due 2031 (3) | A$ | 500 | | | 385 | |
Verizon 3.850% notes due 2041 (3) | Verizon 3.850% notes due 2041 (3) | A$ | 150 | | | 116 | | Verizon 3.850% notes due 2041 (3) | A$ | 150 | | | 116 | |
Verizon 0.193% bonds due 2028 (3) | Verizon 0.193% bonds due 2028 (3) | CHF | 375 | | | 403 | | Verizon 0.193% bonds due 2028 (3) | CHF | 375 | | | 403 | |
Verizon 0.555% bonds due 2031 (3) | Verizon 0.555% bonds due 2031 (3) | CHF | 325 | | | 349 | | Verizon 0.555% bonds due 2031 (3) | CHF | 325 | | | 349 | |
| Three Months Ended March 31, 2021 total | | Three Months Ended March 31, 2021 total | | $ | 30,934 | |
| | Total | | $ | 30,934 | | |
| Three Months Ended September 30, 2021 | | Three Months Ended September 30, 2021 | |
Verizon 2.850% notes due 2041 (4) | | Verizon 2.850% notes due 2041 (4) | $ | 1,000 | | | $ | 991 | |
| Three Months Ended September 30, 2021 total | | Three Months Ended September 30, 2021 total | $ | 1,000 | | | $ | 991 | |
| Nine Months Ended September 30, 2021 total | | Nine Months Ended September 30, 2021 total | | $ | 31,925 | |
| |
(1) Net proceeds were net of underwriting discounts and other issuance costs. In addition, for securities denominated in a currency other than the U.S. dollar, net proceeds are shown on a U.S. dollar equivalent.equivalent basis.
(2) Compounded Secured Overnight Financing Rate (SOFR) is calculated using the SOFR Index published by the Federal Reserve Bank of New York in accordance with the terms of the notes. The Compounded SOFR for the interest period ending in September 2021 was 0.050%.
(3) See Note 8 for information on derivative transactions related to the issuances.
Repayments, Redemptions An amount equal to the net proceeds from this green bond is expected to be used to fund, in whole or in part, certain renewable energy projects, including new and Repurchases
During April 2021, we notified investors of our intention to redeem in May 2021 allexisting investments made by us during the period from December 1, 2020 through the maturity date of the approximately $713 million outstanding aggregate principal amount of 2.946% notes due 2022.green bond.
Asset-Backed Debt
As of March 31,September 30, 2021, the carrying value of our asset-backed debt was $10.9$9.4 billion. Our asset-backed debt includes Asset-Backed Notes (ABS Notes) issued to third-party investors (Investors) and loans (ABS Financing Facilities) received from banks and their conduit facilities (collectively, the Banks). Our consolidated asset-backed debt bankruptcy remote legal entities (each, an ABS Entity or collectively, the ABS
Entities) issue the debt or are otherwise party to the transaction documentation in connection with our asset-backed debt transactions. Under the terms of our asset-backed debt, Cellco Partnership (Cellco), a wholly-owned subsidiary of Verizon, and certain other affiliates of Verizon (collectively, the Originators) transfer device payment plan agreement receivables to one of the ABS Entities, which in turn transfers such receivables to another ABS Entity that issues the debt. Verizon entities retain the equity interests and residual interests, as applicable, in the ABS Entities, which represent the rights to all funds not needed to make required payments on the asset-backed debt and other related payments and expenses.
Our asset-backed debt is secured by the transferred device payment plan agreement receivables and future collections on such receivables. The device payment plan agreement receivables transferred to the ABS Entities and related assets, consisting primarily of restricted cash, will only be available for payment of asset-backed debt and expenses related thereto, payments to the Originators in respect of additional transfers of device payment plan agreement receivables, and other obligations arising from our asset-backed debt transactions, and will not be available to pay other obligations or claims of Verizon’s creditors until the associated asset-backed debt and other obligations are satisfied. The Investors or Banks, as applicable, which hold our asset-backed debt have legal recourse to the assets securing the debt, but do not have any recourse to Verizon with respect to the payment of principal and interest on the debt. Under a parent support agreement, Verizon has agreed to guarantee certain of the payment obligations of Cellco and the Originators to the ABS Entities.
Cash collections on the device payment plan agreement receivables collateralizing our asset-backed debt securities are required at certain specified times to be placed into segregated accounts. Deposits to the segregated accounts are considered restricted cash and are included in Prepaid expenses and other and Other assets in our condensed consolidated balance sheets.
Proceeds from our asset-backed debt transactions are reflected in Cash flows from financing activities in our condensed consolidated statements of cash flows. The asset-backed debt issued and the assets securing this debt are included in our condensed consolidated balance sheets.
ABS Notes
During the nine months ended September 30, 2021, we completed the following ABS Notes transactions:
| | | | | | | | | | | | | | |
| (dollars in millions) | Interest Rates % | | Expected Weighted-average Life to Maturity (in years) | Principal Amount Issued |
| May 2021 | | | | |
| A Senior class notes | 0.500 | | 2.99 | $ | 1,500 | |
| B Junior class notes | 0.690 | | 2.99 | 119 | |
| C Junior class notes | 0.890 | | 2.99 | 81 | |
| Total | | | | $ | 1,700 | |
| | | | |
| | | | |
| | | | |
| | | | |
| | | | |
| | | | |
| | | | |
Under the terms of each series of ABS Notes, there is a two year revolving period that is two years or up to three years, as applicable, during which we may transfer additional receivables to the ABS Entity. During the three and nine months ended March 31,September 30, 2021, we made aggregate principal repayments of $732$894 million and $2.4 billion, respectively, on ABS notesNotes that have entered the amortization period, including principal payments made in connection with clean-up redemptions.
ABS Financing Facility
In March 2021, we borrowed an additional $1.0 billion under the loan agreement outstanding in connection with the ABS Financing Facility. TheIn May 2021, the aggregate outstanding balance of $1.5 billion was fully repaid and there was no outstanding balance under the ABS Financing Facility was $1.5 billion as of March 31,September 30, 2021.
Variable Interest Entities (VIEs)
The ABS Entities meet the definition of a VIE for which we have determined that we are the primary beneficiary as we have both the power to direct the activities of the entity that most significantly impact the entity’s performance and the obligation to absorb losses or the right to receive benefits of the entity. Therefore, the assets, liabilities and activities of the ABS Entities are consolidated in our financial results and are included in amounts presented on the face of our condensed consolidated balance sheets.
The assets and liabilities related to our asset-backed debt arrangements included in our condensed consolidated balance sheets were as follows:
| | | At March 31, | | At December 31, | | At September 30, | | At December 31, |
| (dollars in millions) | (dollars in millions) | 2021 | | 2020 | (dollars in millions) | 2021 | | 2020 |
| Assets | Assets | | Assets | |
| Account receivable, net | Account receivable, net | $ | 9,445 | | | $ | 9,257 | | Account receivable, net | $ | 8,845 | | | $ | 9,257 | |
| Prepaid expenses and other | Prepaid expenses and other | 1,133 | | | 1,128 | | Prepaid expenses and other | 1,073 | | | 1,128 | |
| Other assets | Other assets | 3,717 | | | 2,950 | | Other assets | 3,309 | | | 2,950 | |
| | Liabilities | Liabilities | | Liabilities | |
| Accounts payable and accrued liabilities | Accounts payable and accrued liabilities | 9 | | | 8 | | Accounts payable and accrued liabilities | 7 | | | 8 | |
| Debt maturing within one year | Debt maturing within one year | 5,407 | | | 4,191 | | Debt maturing within one year | 4,429 | | | 4,191 | |
| Long-term debt | Long-term debt | 5,469 | | | 6,413 | | Long-term debt | 4,996 | | | 6,413 | |
See Note 7 for additional information on device payment plan agreement receivables used to secure asset-backed debt.
Long-Term Credit Facilities
| | | At March 31, 2021 | | At September 30, 2021 |
| (dollars in millions) | (dollars in millions) | Maturities | | Facility Capacity | | Unused Capacity | | Principal Amount Outstanding | (dollars in millions) | Maturities | | Facility Capacity | | Unused Capacity | | Principal Amount Outstanding |
Verizon revolving credit facility (1) | Verizon revolving credit facility (1) | 2024 | | $ | 9,500 | | | $ | 9,392 | | | N/A | Verizon revolving credit facility (1) | 2024 | | $ | 9,500 | | | $ | 9,413 | | | N/A |
Various export credit facilities (2) | Various export credit facilities (2) | 2022 - 2028 | | 7,500 | | | 530 | | | $ | 5,205 | | Various export credit facilities (2) | 2022 - 2029 | | 7,500 | | | 530 | | | $ | 4,823 | |
| Total | Total | | $ | 17,000 | | | $ | 9,922 | | | $ | 5,205 | | Total | | $ | 17,000 | | | $ | 9,943 | | | $ | 4,823 | |
N/A - not applicable
(1) The revolving credit facility does not require us to comply with financial covenants or maintain specified credit ratings, and it permits us to borrow even if our business has incurred a material adverse change. The revolving credit facility provides for the issuance of letters of credit.
(2) During the threenine months ended March 31,September 30, 2021, we drew down $470 million from these facilities. These credit facilities are used to finance equipment-related purchases. Borrowings under certain of these facilities amortize semi-annually in equal installments up to the applicable maturity dates. Maturities reflect maturity dates of principal amounts outstanding. Any amounts borrowed under these facilities and subsequently repaid cannot be reborrowed.
In September 2021, Term Loan Credit Agreement
In February 2021, Verizon entered into a credit agreement that provided Verizon with the abilitywe submitted an irrevocable request to borrow up to $25.0 billion for general corporate purposes, including any potential acquisition of wireless spectrum. Verizon terminated this agreementthe remaining $530 million available under our export credit facilities in March 2021 without borrowing any of the available funds.November 2021.
Non-Cash Transactions
During the threenine months ended March 31,September 30, 2021 and 2020, we financed, primarily through alternative financing arrangements, the purchase of approximately $117$337 million and $502 million,$1.3 billion, respectively, of long-lived assets consisting primarily of network equipment. As of March 31,September 30, 2021 and December 31, 2020, $1.3 billion and $1.6 billion, respectively, relating to these financing arrangements, including those entered into in prior years and liabilities assumed through acquisitions, remained outstanding. These purchases are non-cash financing activities and therefore are not reflected within Capital expenditures in our condensed consolidated statements of cash flows.
Debt Extinguishment Losses
During both the three months ended September 30, 2021 and September 30, 2020, we did not record debt extinguishment losses. During the nine months ended September 30, 2021 and 2020, we recorded debt extinguishment losses of $1.1 billion and $102 million, respectively. The losses are recorded in Other income (expense), net in our condensed consolidated statements of income.
Guarantees
We guarantee the debentures of our operating telephone company subsidiaries. As of March 31,September 30, 2021, $765 million aggregate principal amount of these obligations remained outstanding. Each guarantee will remain in place for the life of the obligation unless terminated pursuant to its terms, including the operating telephone company no longer being a wholly-owned subsidiary of Verizon.
We also guarantee the debt obligations of GTE LLC as successor in interest to GTE Corporation that were issued and outstanding prior to July 1, 2003. As of March 31,September 30, 2021, $391 million aggregate principal amount of these obligations remained outstanding.
Covenants
We and our consolidated subsidiaries are in compliance with all of our restrictive covenants in our debt agreements.
| | |
| Note 7. Device Payment Plan Agreement and Wireless Service Receivables |
The following table presents information about accounts receivable, net of allowances, recorded in our condensed consolidated balance sheet:
| | | At March 31, 2021 | | At September 30, 2021 |
| (dollars in millions) | (dollars in millions) | Device payment plan agreement | | Wireless
service | | Other receivables(1) | | Total | (dollars in millions) | Device payment plan agreement | | Wireless
service | | Other receivables(1) | | Total |
| Accounts receivable | Accounts receivable | $ | 12,019 | | | $ | 4,857 | | | $ | 6,735 | | | $ | 23,611 | | Accounts receivable | $ | 12,370 | | | $ | 5,055 | | | $ | 5,740 | | | $ | 23,165 | |
| Less Allowance for credit losses | Less Allowance for credit losses | 627 | | | 183 | | | 294 | | | 1,104 | | Less Allowance for credit losses | 573 | | | 140 | | | 257 | | | 970 | |
| Accounts receivable, net of allowance | Accounts receivable, net of allowance | $ | 11,392 | | | $ | 4,674 | | | $ | 6,441 | | | $ | 22,507 | | Accounts receivable, net of allowance | $ | 11,797 | | | $ | 4,915 | | | $ | 5,483 | | | $ | 22,195 | |
(1) Other receivables primarily include wireline receivables, Verizon Media receivables and other receivables, the allowances for which are individually insignificant.
Under the Verizon device payment program, our eligible wireless customers purchase wireless devices under a device payment plan agreement. Customers that activate service on devices purchased under the device payment program pay lower service fees as compared to those under our fixed-term service plans, and their device payment plan charge is included on their wireless monthly bill. We no longer offer Consumer customers new fixed-term, subsidized service plans for devices; however, we continue to offer subsidized plans to our Business customers. We also continue to service existing plans for customers who have not yet purchased and activated devices under the Verizon device payment program.
The following table displays device payment plan agreement receivables, net, recognized in our condensed consolidated balance sheets:
| | | At March 31, | | At December 31, | | At September 30, | | At December 31, |
| (dollars in millions) | (dollars in millions) | 2021 | | 2020 | (dollars in millions) | 2021 | | 2020 |
| Device payment plan agreement receivables, gross | Device payment plan agreement receivables, gross | $ | 17,943 | | | $ | 17,959 | | Device payment plan agreement receivables, gross | $ | 18,991 | | | $ | 17,959 | |
| Unamortized imputed interest | Unamortized imputed interest | (427) | | | (453) | | Unamortized imputed interest | (365) | | | (453) | |
| Device payment plan agreement receivables, at amortized cost | Device payment plan agreement receivables, at amortized cost | 17,516 | | | 17,506 | | Device payment plan agreement receivables, at amortized cost | 18,626 | | | 17,506 | |
Allowance (1) | Allowance (1) | (880) | | | (940) | | Allowance (1) | (838) | | | (940) | |
| Device payment plan agreement receivables, net | Device payment plan agreement receivables, net | $ | 16,636 | | | $ | 16,566 | | Device payment plan agreement receivables, net | $ | 17,788 | | | $ | 16,566 | |
| | Classified in our condensed consolidated balance sheets: | Classified in our condensed consolidated balance sheets: | | Classified in our condensed consolidated balance sheets: | |
| Accounts receivable, net | Accounts receivable, net | $ | 11,392 | | | $ | 11,601 | | Accounts receivable, net | $ | 11,797 | | | $ | 11,601 | |
| Other assets | Other assets | 5,244 | | | 4,965 | | Other assets | 5,991 | | | 4,965 | |
| Device payment plan agreement receivables, net | Device payment plan agreement receivables, net | $ | 16,636 | | | $ | 16,566 | | Device payment plan agreement receivables, net | $ | 17,788 | | | $ | 16,566 | |
(1) Includes allowance for both short-term and long-term device payment plan agreement receivables.
Included in our device payment plan agreement receivables at March 31,both September 30, 2021 and December 31, 2020, are net device payment plan agreement receivables of $13.1 billion and $12.1 billion, respectively, which have been transferred to ABS Entities and continue to be reported in our condensed consolidated balance sheets. See Note 6 for additional information. We believe the carrying value of these receivables approximate their fair value using a Level 3 expected cash flow model.
For indirect channel wireless contracts with customers, we impute risk adjusted interest on the device payment plan agreement receivables. We record the imputed interest as a reduction to the related accounts receivable. Interest income, which is included within Service revenues and other in our condensed consolidated statements of income, is recognized over the financed device payment term.
Promotions
WeIn connection with certain device payment plan agreements, we may offer certain promotions that allow a customerpromotion to trade in their owned device in connection with the purchase of a new device. Under these types of promotions, the customer receives a credit for the value of the trade-in device. In addition, we may provide the customer with additional future credits that will be applied against the customer’s monthly bill as long as service is maintained. We recognize a liability measured at fair value, for the customer’s right to trade in the device which is determined by considering several factors, including the weighted-average selling prices obtained in recent resales of similar devices eligible for trade-in. Future credits are recognized when earned by the customer. Device payment plan agreement receivables, net, does not reflect the trade-in device liability. At March 31, 2021 and December 31, 2020, the amount of trade-in liability was $104 million and $70 million, respectively.
From time to time, we offer certain marketing promotions that allow our customers to upgrade to a new device after paying down a certain specified portion of the required device payment plan agreement amount as well as trading in their device in good working order. When a customer enters into a device payment plan agreement with the right to upgrade to a new device, we account for this trade-in right as a guarantee obligation. We recognize a liability measured at fair value for the customer’s right to trade in the device which is determined by considering several factors, including the weighted-average selling prices obtained in recent resales of similar devices eligible for trade-in. At September 30, 2021 and December 31, 2020, the amount of the guarantee liability was $66 million and insignificant, respectively.
We may offer certain promotions that allow a customer to trade in their owned device in connection with the purchase of a new device. Under these types of promotions, the customer receives a credit for the value of the trade-in device. At September 30, 2021 and December 31, 2020, the amount of trade-in liability was $192 million and $70 million, respectively.
In addition, we may provide the customer with additional future billing credits that will be applied against the customer’s monthly bill as long as service is maintained. These future billing credits are accounted for as consideration payable to a customer and are included in the determination of total transaction price, resulting in a contract liability.
Device payment plan agreement receivables, net, does not reflect the trade-in liability, additional future credits or the guarantee liability.
Origination of Device Payment Plan Agreements
When originating device payment plan agreements, we use internal and external data sources to create a credit risk score to measure the credit quality of a customer and to determine eligibility for the device payment program. Verizon’s experience has been that the payment attributes of longer tenured customers are highly predictive for estimating their reliability to make future payments. Customers with longer tenures tend to exhibit similar risk characteristics to other customers with longer tenures, and receivables due from customers with longer tenures tend to perform better than receivables from customers that have not previously been Verizon customers. As a result of this experience, we make initial lending decisions based upon whether the customers are "established customers" or "short-tenured customers." If a Consumer customer has been a customer for 45 days or more, or if a Business customer has been a customer for 12 months or more, the customer is considered an "established customer." For established customers, the credit decision and ongoing credit monitoring processes rely on a combination of internal and external data sources. If a Consumer customer has been a customer less than 45 days, or a Business customer has been a customer for less than 12 months, the customer is considered a "short-tenured customer." For short-tenured customers, the credit decision and credit monitoring processes rely more heavily on external data sources.
Internal data and/or external credit data are obtained from the credit reporting agencies, if available, to create a custom credit risk score for Consumer customers. The custom credit risk score is generated automatically from the applicant’s credit data using proprietary custom credit models. The credit risk score measures the likelihood that the potential customer will become severely delinquent and be disconnected for non-payment. For a small portion of short-tenured customer applications, a traditional credit report is not available from one of the national credit reporting agencies because the potential customer does not have sufficient credit history. In those instances, alternative credit data is used for the risk assessment. For Business customers, we also verify the existence of the business with external data sources.
Based on the custom credit risk score, we assign each customer to a credit class, each of which has specified offers of credit includingcredit. This includes an account level spending limit and either a maximum amount of credit allowed per device for Consumer customers or a required down payment percentage.percentage for Business customers.
Credit Quality Information
Subsequent to origination, we assess indicators for the quality of our wireless device payment plan agreement portfolio using two models, one for new customers and one for existing customers. The model for new customers pools all Consumer and Business wireless customers based on 210 days and 12 months or less respectively, as "new customers." The model for existing customers pools all Consumer and Business wireless customers based on 210 days and 12 months or more respectively, as "existing customers."
The following table presents device payment plan agreement receivables, at amortized cost, as of March 31,September 30, 2021, by credit quality indicator and year of origination:
| | | Year of Origination | | | Year of Origination | |
| (dollars in millions) | (dollars in millions) | 2021 | | 2020 | | Prior to 2020(1) | | | Total | (dollars in millions) | 2021 | | 2020 | | Prior to 2020(1) | | | Total |
| New customers | New customers | $ | 684 | | | $ | 1,532 | | | $ | 438 | | | | $ | 2,654 | | New customers | $ | 1,846 | | | $ | 869 | | | $ | 75 | | | | $ | 2,790 | |
| Existing customers | Existing customers | 3,561 | | | 8,847 | | | 2,454 | | | | 14,862 | | Existing customers | 9,980 | | | 5,388 | | | 468 | | | | 15,836 | |
| Total | Total | $ | 4,245 | | | $ | 10,379 | | | $ | 2,892 | | | | $ | 17,516 | | Total | $ | 11,826 | | | $ | 6,257 | | | $ | 543 | | | | $ | 18,626 | |
(1) Includes accounts that have been suspended at a point in time.
The data presented in the table above was last updated on March 31,September 30, 2021.
We assess indicators for the quality of our wireless service receivables portfolio as one overall pool. As of March 31,September 30, 2021, wireless service receivables, at amortized cost, originating in 2021 and 2020 were $4.7$5.0 billion and $187 million,an insignificant amount, respectively.
Allowance for Credit Losses
The credit quality indicators are used in determining the estimated amount and the timing of expected credit losses for the device payment plan agreement and wireless service receivables portfolios.
For device payment plan agreement receivables, we record bad debt expense based on a default and loss calculation using our proprietary loss model. The expected loss rate is determined based on customer credit scores and other qualitative factors as noted above. The loss rate is assigned individually on a customer by customer basis and the custom credit scores are then aggregated by vintage and used in our proprietary loss model to calculate the weighted-average loss rate used for determining the allowance balance.
We monitor the collectability of our wireless service receivables as one overall pool. Wireline service receivables are disaggregated and pooled by the following customer groups: consumer, small and medium business, global enterprise, public sector and wholesale. For wireless service receivables and wireline consumer and small and medium business receivables, the allowance is calculated based on a 12 month rolling average write-off balance multiplied by the average life-cycle of an account from billing to write-off. The risk of loss is assessed over the contractual life of the receivables and is adjusted based on the historical loss amounts for current and future conditions based on management’s qualitative considerations. For global enterprise, public sector and wholesale wireline receivables, the allowance for credit losses is based on historical write-off experience and individual customer credit risk, if applicable.
Activity in the allowance for credit losses by portfolio segment of receivables were as follows:
| | (dollars in millions) | (dollars in millions) | Device Payment Plan Agreement Receivables(1) | | Wireless Service Plan Receivables | (dollars in millions) | Device Payment Plan Agreement Receivables(1) | | Wireless Service Plan Receivables |
| Balance at January 1, 2021 | Balance at January 1, 2021 | $ | 940 | | | $ | 262 | | Balance at January 1, 2021 | $ | 940 | | | $ | 262 | |
| | Current period provision for expected credit losses | Current period provision for expected credit losses | 132 | | | 45 | | Current period provision for expected credit losses | 349 | | | 126 | |
| Write-offs charged against the allowance | Write-offs charged against the allowance | (204) | | | (139) | | Write-offs charged against the allowance | (482) | | | (296) | |
| Recoveries collected | Recoveries collected | 12 | | | 15 | | Recoveries collected | 31 | | | 48 | |
| Balance at March 31, 2021 | $ | 880 | | | $ | 183 | | |
| Balance at September 30, 2021 | | Balance at September 30, 2021 | $ | 838 | | | $ | 140 | |
(1) Includes allowance for both short-term and long-term device payment plan agreement receivables.
We monitor delinquency and write-off experience based on the quality of our device payment plan agreement and wireless service receivables portfolios. The extent of our collection efforts with respect to a particular customer are based on the results of our proprietary custom internal scoring models that analyze the customer’s past performance to predict the likelihood of the customer falling further delinquent. These custom scoring models assess a number of variables, including origination characteristics, customer account history and payment patterns. Since our customers’ behaviors may be impacted by general economic conditions, we analyzed whether changes in macroeconomic conditions impact our credit loss experience and have concluded that our credit loss estimates are generally not materially impacted by reasonable and supportable forecasts of future economic conditions. Based on the score derived from these models, accounts are grouped by risk category to determine the collection strategy to be applied to such accounts. For device payment plan agreement receivables and wireless service receivables, we consider an account to be delinquent and in default status if there are unpaid charges remaining on the account on the day after the bill’s due date. For wireless service receivables, an account is considered delinquent 34 days after the bill cycle date. The risk class determines the speed and severity of the collections effort including initiatives taken to facilitate customer payment.
The balance and aging of the device payment plan agreement receivables, at amortized cost, were as follows:
| | | | | | | |
| At March 31,September 30, | | |
| (dollars in millions) | 2021 | | |
| Unbilled | $ | 16,44917,473 | | | |
| Billed: | | | |
| Current | 893973 | | | |
| Past due | 174180 | | | |
| Device payment plan agreement receivables, at amortized cost | $ | 17,51618,626 | | | |
| | |
| Note 8. Fair Value Measurements |
Recurring Fair Value Measurements
The following table presents the balances of assets and liabilities measured at fair value on a recurring basis as of March 31,September 30, 2021:
| | (dollars in millions) | (dollars in millions) | Level 1(1) | | Level 2(2) | | Level 3(3) | | Total | (dollars in millions) | Level 1(1) | | Level 2(2) | | Level 3(3) | | Total |
| Assets: | Assets: | | Assets: | |
| Prepaid expenses and other: | | Prepaid expenses and other: | |
| Interest rate swaps | | Interest rate swaps | $ | — | | | $ | 217 | | | $ | — | | | $ | 217 | |
| | Cross currency swaps | | Cross currency swaps | — | | | 10 | | | — | | | 10 | |
| | Other assets: | Other assets: | | Other assets: | |
| | Fixed income securities | Fixed income securities | $ | 0 | | | $ | 460 | | | $ | 0 | | | $ | 460 | | Fixed income securities | — | | | 448 | | | — | | | 448 | |
| Interest rate swaps | Interest rate swaps | 0 | | | 254 | | | 0 | | | 254 | | Interest rate swaps | — | | | 283 | | | — | | | 283 | |
| Cross currency swaps | Cross currency swaps | 0 | | | 1,362 | | | 0 | | | 1,362 | | Cross currency swaps | — | | | 620 | | | — | | | 620 | |
| | Total | Total | $ | 0 | | | $ | 2,076 | | | $ | 0 | | | $ | 2,076 | | Total | $ | — | | | $ | 1,578 | | | $ | — | | | $ | 1,578 | |
| | Liabilities: | Liabilities: | | Liabilities: | |
| Other current liabilities: | Other current liabilities: | | Other current liabilities: | |
| Interest rate swaps | | Interest rate swaps | $ | — | | | $ | 4 | | | $ | — | | | $ | 4 | |
| Foreign exchange forwards | | Foreign exchange forwards | — | | | 12 | | | — | | | 12 | |
| Cross currency swaps | | Cross currency swaps | — | | | 197 | | | — | | | 197 | |
| | Foreign exchange forwards | $ | 0 | | | $ | 16 | | | $ | 0 | | | $ | 16 | | |
| | Forward starting interest rate swaps | | Forward starting interest rate swaps | — | | | 281 | | | — | | | 281 | |
| | Other liabilities: | Other liabilities: | | Other liabilities: | |
| Interest rate swaps | Interest rate swaps | 0 | | | 740 | | | 0 | | | 740 | | Interest rate swaps | — | | | 612 | | | — | | | 612 | |
| Cross currency swaps | Cross currency swaps | 0 | | | 337 | | | 0 | | | 337 | | Cross currency swaps | — | | | 1,165 | | | — | | | 1,165 | |
| Forward starting interest rate swaps | 0 | | | 160 | | | 0 | | | 160 | | |
| | | Total | Total | $ | 0 | | | $ | 1,253 | | | $ | 0 | | | $ | 1,253 | | Total | $ | — | | | $ | 2,271 | | | $ | — | | | $ | 2,271 | |
The following table presents the balances of assets and liabilities measured at fair value on a recurring basis as of December 31, 2020:
| | (dollars in millions) | (dollars in millions) | Level 1(1) | | Level 2(2) | | Level 3(3) | | Total | (dollars in millions) | Level 1(1) | | Level 2(2) | | Level 3(3) | | Total |
| Assets: | Assets: | | Assets: | |
| Prepaid expenses and other: | Prepaid expenses and other: | | Prepaid expenses and other: | |
| | Foreign exchange forwards | Foreign exchange forwards | $ | 0 | | | $ | 12 | | | $ | 0 | | | $ | 12 | | Foreign exchange forwards | $ | — | | | $ | 12 | | | $ | — | | | $ | 12 | |
| | Other assets: | Other assets: | | Other assets: | |
| | Fixed income securities | Fixed income securities | 0 | | | 459 | | | 0 | | | 459 | | Fixed income securities | — | | | 459 | | | — | | | 459 | |
| Interest rate swaps | Interest rate swaps | 0 | | | 787 | | | 0 | | | 787 | | Interest rate swaps | — | | | 787 | | | — | | | 787 | |
| Cross currency swaps | Cross currency swaps | 0 | | | 1,446 | | | 0 | | | 1,446 | | Cross currency swaps | — | | | 1,446 | | | — | | | 1,446 | |
| | Total | Total | $ | 0 | | | $ | 2,704 | | | $ | 0 | | | $ | 2,704 | | Total | $ | — | | | $ | 2,704 | | | $ | — | | | $ | 2,704 | |
| | Liabilities: | Liabilities: | | Liabilities: | |
| Other current liabilities: | Other current liabilities: | | Other current liabilities: | |
| | Forward interest rate swaps | $ | 0 | | | $ | 409 | | | $ | 0 | | | $ | 409 | | |
| Forward starting interest rate swaps | | Forward starting interest rate swaps | $ | — | | | $ | 409 | | | $ | — | | | $ | 409 | |
| | Foreign exchange forwards | Foreign exchange forwards | 0 | | | 2 | | | 0 | | | 2 | | Foreign exchange forwards | — | | | 2 | | | — | | | 2 | |
| | Other liabilities: | Other liabilities: | | Other liabilities: | |
| Interest rate swaps | Interest rate swaps | 0 | | | 303 | | | 0 | | | 303 | | Interest rate swaps | — | | | 303 | | | — | | | 303 | |
| Cross currency swaps | Cross currency swaps | 0 | | | 196 | | | 0 | | | 196 | | Cross currency swaps | — | | | 196 | | | — | | | 196 | |
| Forward starting interest rate swaps | Forward starting interest rate swaps | 0 | | | 388 | | | 0 | | | 388 | | Forward starting interest rate swaps | — | | | 388 | | | — | | | 388 | |
| | Total | Total | $ | 0 | | | $ | 1,298 | | | $ | 0 | | | $ | 1,298 | | Total | $ | — | | | $ | 1,298 | | | $ | — | | | $ | 1,298 | |
(1)Quoted prices in active markets for identical assets or liabilities.
(2)Observable inputs other than quoted prices in active markets for identical assets and liabilities.
(3)Unobservable pricing inputs in the market.
Certain of our equity investments do not have readily determinable fair values and are excluded from the tables above. Such investments are measured at cost, less any impairment, plus or minus changes resulting from observable price changes in orderly transactions for an identical or similar investment of the same issuer and are included in Investments in unconsolidated businesses in our condensed consolidated balance sheets. As of March 31,September 30, 2021 and December 31, 2020, the carrying amount of our investments without readily determinable fair values were $404$843 million and $402 million, respectively. During both the three and nine months ended March 31,September 30, 2021, there were insignificant adjustments due to observable price changes and there were 0insignificant impairment charges. Cumulative adjustments due to observable price changes and impairment charges were $87$115 million and insignificant,$50 million, respectively.
Fixed income securities consist primarily of investments in municipal bonds. ForThe valuation of the fixed income securities that do not haveare based on the quoted prices for similar assets in active markets we use alternative matrix pricing resultingor identical assets in inactive markets or models that apply inputs from observable market data. The valuation determines that these debt securities beingare classified as Level 2.
Derivative contracts are valued using models based on readily observable market parameters for all substantial terms of our derivative contracts and thus are classified within Level 2. We use mid-market pricing for fair value measurements of our derivative instruments. Our derivative instruments are recorded on a gross basis.
We recognize transfers between levels of the fair value hierarchy as of the end of the reporting period.
Fair Value of Short-term and Long-term Debt
The fair value of our debt is determined using various methods, including quoted prices for identical debt instruments, which is a Level 1 measurement, as well as quoted prices for similar debt instruments with comparable terms and maturities, which is a Level 2 measurement.
The fair value of our short-term and long-term debt, excluding finance leases, was as follows:
| | | | | Fair Value | | | Fair Value |
| (dollars in millions) | (dollars in millions) | Carrying
Amount | | Level 1 | | Level 2 | | Level 3 | | Total | (dollars in millions) | Carrying
Amount | | Level 1 | | Level 2 | | Level 3 | | Total |
| At December 31, 2020 | At December 31, 2020 | $ | 127,778 | | | $ | 103,967 | | | $ | 52,785 | | | $ | 0 | | | $ | 156,752 | | At December 31, 2020 | $ | 127,778 | | | $ | 103,967 | | | $ | 52,785 | | | $ | — | | | $ | 156,752 | |
| At March 31, 2021 | 157,198 | | | 120,566 | | | 57,325 | | | 0 | | | 177,891 | | |
| At September 30, 2021 | | At September 30, 2021 | 149,674 | | | 113,042 | | | 59,177 | | | — | | | 172,219 | |
Derivative Instruments
We enter into derivative transactions primarily to manage our exposure to fluctuations in foreign currency exchange rates and interest rates. We employ risk management strategies, which may include the use of a variety of derivatives including interest rate swaps, cross currency swaps, forward starting interest rate swaps, treasury rate locks, interest rate caps, swaptions and foreign exchange forwards. We do not hold derivatives for trading purposes.
The following table sets forth the notional amounts of our outstanding derivative instruments:
| | | At March 31, | | At December 31, | | At September 30, | | At December 31, |
| (dollars in millions) | (dollars in millions) | 2021 | | 2020 | (dollars in millions) | 2021 | | 2020 |
| Interest rate swaps | Interest rate swaps | $ | 17,852 | | | $ | 17,768 | | Interest rate swaps | $ | 17,756 | | | $ | 17,768 | |
| Cross currency swaps | Cross currency swaps | 32,502 | | | 26,288 | | Cross currency swaps | 32,502 | | | 26,288 | |
| Forward starting interest rate swaps | Forward starting interest rate swaps | 1,000 | | | 2,000 | | Forward starting interest rate swaps | 1,000 | | | 2,000 | |
| | Foreign exchange forwards | Foreign exchange forwards | 1,300 | | | 1,405 | | Foreign exchange forwards | 870 | | | 1,405 | |
|
Interest Rate Swaps
We enter into interest rate swaps to achieve a targeted mix of fixed and variable rate debt. We principally receive fixed rates and pay variable rates, resulting in a net increase or decrease to Interest expense. These swaps are designated as fair value hedges and hedge against interest rate risk exposure of designated debt issuances. We record the interest rate swaps at fair value in our condensed consolidated balance sheets as assets and liabilities. Changes in the fair value of the interest rate swaps are recorded to Interest expense, which are offset by changes in the fair value of the hedged debt due to changes in interest rates.
During the three months ended March 31,September 30, 2021, we did not enter into any interest rate swaps and we settled interest rate swaps with a total notional value of $851 million. During the nine months ended September 30, 2021, we entered into and settled interest rate swaps with a total notional value of $1.0$2.6 billion and $895 million,$3.5 billion, respectively. During the three months ended March 31,September 30, 2020, we entered into interest rate swaps with a total notional value of $1.1 billion and we did not settle any interest rate swaps. During the nine months ended September 30, 2020, we entered into and settled interest rate swaps with a total notional value of $2.4$3.5 billion and $1.5$2.4 billion, respectively.
The ineffective portion of these interest rate swaps were gains ofzero and an insignificant amount and $60 millionof gains for the three and nine months ended March 31,September 30, 2021, respectively. The ineffective portion of these interest rate swaps were insignificant losses and gains for the three and nine months ended September 30, 2020, respectively.
The following amounts were recorded in Long-term debt in our condensed consolidated balance sheets related to cumulative basis adjustments for fair value hedges:
| | | At March 31, | | At December 31, | | At September 30, | | At December 31, |
| (dollars in millions) | (dollars in millions) | 2021 | | 2020 | (dollars in millions) | 2021 | | 2020 |
| Carrying amount of hedged liabilities | Carrying amount of hedged liabilities | $ | 17,954 | | | $ | 18,849 | | Carrying amount of hedged liabilities | $ | 17,223 | | | $ | 18,849 | |
| Cumulative amount of fair value hedging adjustment included in the carrying amount of the hedged liabilities | Cumulative amount of fair value hedging adjustment included in the carrying amount of the hedged liabilities | (413) | | | 557 | | Cumulative amount of fair value hedging adjustment included in the carrying amount of the hedged liabilities | (29) | | | 557 | |
| Cumulative amount of fair value hedging adjustment remaining for which hedge accounting has been discontinued | Cumulative amount of fair value hedging adjustment remaining for which hedge accounting has been discontinued | 661 | | | 627 | | Cumulative amount of fair value hedging adjustment remaining for which hedge accounting has been discontinued | 603 | | | 627 | |
In April 2021, we entered into interest rate swaps with a total notional value of $675 million.
Cross Currency Swaps
We have entered into cross currency swaps designated as cash flow hedges to exchange our British Pound Sterling, Euro, Swiss Franc, Canadian Dollar and Australian Dollar-denominated cash flows into U.S. dollars and to fix our cash payments in U.S. dollars, as well as to mitigate the impact of foreign currency transaction gains or losses.
During the three months ended March 31,September 30, 2021, we did not enter into or settle any cross currency swaps. During the nine months ended September 30, 2021, we entered into cross currency swaps with a total notional value of $6.2 billion and we did 0tnot settle any cross currency swaps. During the three and nine months ended March 31,September 30, 2021, a pre-tax loss of $226 million$1.1 billion and $2.0 billion, respectively, was recognized in Other comprehensive income (loss). During the three months ended March 31,September 30, 2020, we did 0tnot enter into or settle any cross currency swaps. During the threenine months ended March 31,September 30, 2020, we entered into cross currency swaps with a total notional value of $3.3 billion and we settled cross currency swaps with a total notional value of $1.6 billion. During the three and nine months ended September 30, 2020, a pre-tax gain of $1.5 billion and a pre-tax loss of $3.0 billion was$420 million, respectively, were recognized in Other comprehensive income (loss). A portion of the gains recognized in Other comprehensive income (loss) was reclassified to Other income (expense), net to offset the related pre-tax foreign currency transaction gain or loss on the underlying hedged item. See Note 10 for additional information.
Forward Starting Interest Rate Swaps
We have entered into forward starting interest rate swaps designated as cash flow hedges in order to manage our exposure to interest rate changes on future forecasted transactions. We hedge our exposure to the variability in future cash flows based on the expected maturities of the related forecasted debt issuance.
During both the three and nine months ended March 31,September 30, 2021, and 2020, we did 0tnot enter into any new forward starting interest rate swaps. During the three months ended September 30, 2021, we did not settle any forward starting interest rate swaps. During the nine months ended September 30, 2021, we settled forward starting interest rate swaps with a total notional value of $1.0 billion. During both the three and nine months ended September 30, 2020, we did not enter into any new forward starting interest rate swaps. During the three months ended September 30, 2020, we did not settle any forward starting interest rate swaps. During the nine months ended September 30, 2020, we settled forward starting interest rate swaps with a total notional value of $1.0 billion. During the threenine months ended March 31,September 30, 2021 and 2020,
we paid $237 million and $293 million, respectively, for the settlement of forward starting interest rate swaps, which was recorded in Other, net within Cash Flow from Operating Activities. During the three and nine months ended March 31,September 30, 2021, an insignificant pre-tax gain and pre-tax gain of $279 million, respectively, were recognized in Other comprehensive income (loss), resulting from interest rate movements. During the three and nine months ended September 30, 2020, a pre-tax gain of $400$141 million and a pre-tax loss of $840$668 million, respectively, were recognized in Other comprehensive income (loss), resulting from interest rate movements.
Treasury Rate Locks
We enter into treasury rate locks to mitigate our future interest rate risk. During both the three months ended March 31,September 30, 2021 and 2020, we did not enter into or settle any treasury rate locks designated as cash flow hedges, and we did not recognize any amount in Other comprehensive income (loss). During the nine months ended September 30, 2021, we entered into and settled treasury rate locks designated as cash flow hedges with a total notional value of $4.7 billion, and we recognized $251 million in Other comprehensive income (loss). During the threenine months ended March 31,September 30, 2021, we received $251 million from the settlement of treasury rate locks designated as cash flow hedges, which was recorded in Other, net within Cash Flow from Operating Activities. During the threenine months ended March 31,September 30, 2020, we entered into and settled treasury rate locks designated as cash flow hedges with a total notional value of $500 million, and we recognized an insignificant pre-tax loss in Other comprehensive income (loss).
Net Investment Hedges
We have designated certain foreign currency debt instruments as net investment hedges to mitigate foreign exchange exposure related to non-U.S. dollar net investments in certain foreign subsidiaries against changes in foreign exchange rates. In March 2021, we de-designated the existing net investment hedge and designated a new net investment hedge using a different Euro-denominated note. The notional amount of Euro-denominated debt designated as a net investment hedge was €750 million as of both March 31,September 30, 2021 and December 31, 2020.
Undesignated Derivatives
We also have the following derivative contracts which we use as economic hedges but for which we have elected not to apply hedge accounting.
Foreign Exchange Forwards
We enter into British Pound Sterling and Euro foreign exchange forwards to mitigate our foreign exchange rate risk related to non-functional currency denominated monetary assets and liabilities of international subsidiaries, as well as foreign exchange risk related to debt settlements. During the three months ended March 31,September 30, 2021, we entered into and settled foreign exchange forwards with a total notional value of $3.5 billion and $3.6 billion, respectively. During the three months ended March 31, 2020, we entered into and settled foreign exchange forwards with a total notional value of $2.7 billion and $2.8$3.4 billion, respectively. During boththe nine months ended September 30, 2021, we entered into and settled foreign exchange forwards with a total notional value of $10.0 billion and $10.5 billion, respectively. During the three months ended March 31,September 30, 2020, we entered into and settled foreign exchange forwards with a total notional value of $3.4 billion and $3.1 billion, respectively. During the nine months ended September 30, 2020, we entered into and settled foreign exchange forwards with a total notional value of $10.3 billion and $10.2 billion, respectively. During the three and nine months ended September 30, 2021, and 2020, insignificant pre-tax losses of an insignificant amount and $51 million, respectively, were recognized in Other income (expense), net. During the three and nine months ended September 30, 2020, pre-tax gains of an insignificant amount and $89 million, respectively, were recognized in Other income (expense), net.
Treasury Rate Locks
We enter into treasury rate locks to mitigate our future interest rate risk. During both the three and nine months ended March 31,September 30, 2021, we did 0tnot enter into or settle any treasury rate locks that were not designated in hedging relationships, and we did 0tnot recognize any amount in our condensed consolidated financial statement.statements. During the three months ended March 31,September 30, 2020, we did not enter into or settle any treasury rate locks, and we did not recognize any amount in our condensed consolidated financial statements. During the nine months ended September 30, 2020, we entered into and settled treasury rate locks with a total notional value of $1.6 billion, and we recognized an insignificant amountpre-tax gain in Interest expense.
Swaptions
We enter into swaptions to achieve a targeted mix of fixed and variable rate debt. During both the three and nine months ended September 30, 2021, we sold payer swaptions with a notional amount of $1.0 billion to enter into future pay-floating interest rate swaps indexed to SOFR that were not designated in hedging relationships. Losses for both the three and nine months ended September 30, 2021 were insignificant.
In October 2021, we sold payer swaptions with a notional amount of $1.0 billion to enter into future pay-floating interest rate swaps indexed to SOFR that were not designated in hedging relationships.
Concentrations of Credit Risk
Financial instruments that subject us to concentrations of credit risk consist primarily of temporary cash investments, short-term and long-term investments, trade receivables, including device payment plan agreement receivables, certain notes receivable, including lease receivables, and derivative contracts.
Counterparties to our derivative contracts are major financial institutions with whom we have negotiated derivatives agreements (ISDA master agreements) and credit support annex (CSA) agreements which provide rules for collateral exchange. The CSA agreements contain rating based thresholds such that we or our counterparties may be required to hold or post collateral based upon changes in outstanding
positions as compared to established thresholds and changes in credit ratings. We do not offset fair value amounts recognized for derivative instruments and fair value amounts recognized for the right to reclaim cash collateral or the obligation to return cash collateral arising from derivative instruments recognized at fair value. At March 31,September 30, 2021, we held and posted an insignificant amount of collateral related to derivative contracts under collateral exchange agreements, which were recorded as Other current liabilities and Prepaid expenses and other, respectively, in our condensed consolidated balance sheet. At December 31, 2020, we held $0.2 billion of collateral related to derivative contracts under collateral exchange arrangements, which were recorded as Other current liabilities in our condensed consolidated balance sheet. While we may be exposed to credit losses due to the nonperformance of our counterparties, we consider the risk remote and do not expect that any such nonperformance would result in a significant effect on our results of operations or financial condition due to our diversified pool of counterparties.
| | |
| Note 9. Employee Benefits |
We maintain non-contributory defined benefit pension plans for certain employees. In addition, we maintain postretirement health care and life insurance plans for certain retirees and their dependents, which are both contributory and non-contributory, and include a limit on our share of the cost for certain current and future retirees. In accordance with our accounting policy for pension and other postretirement benefits, operating expenses include service costs associated with pension and other postretirement benefits while other credits and/or charges based on actuarial assumptions, including projected discount rates, an estimated return on plan assets, and impact from health care trend rates are reported in Other income (expense), net. These estimates are updated in the fourth quarter to reflect actual return on plan assets and updated actuarial assumptions or upon a remeasurement event. The adjustment is recognized in the income statement during the fourth quarter or upon a remeasurement event pursuant to our accounting policy for the recognition of actuarial gains and losses.
Net Periodic Benefit Cost (Income)
The following table summarizes the components of net periodic benefit cost (income) related to our pension and postretirement health care and life insurance plans:
| | | (dollars in millions) | | (dollars in millions) |
| | Pension | | Health Care and Life | | Pension | | Health Care and Life |
| Three Months Ended March 31, | 2021 | | 2020 | | 2021 | | 2020 | |
| Three Months Ended September 30, | | Three Months Ended September 30, | 2021 | | 2020 | | 2021 | | 2020 |
| Service cost - Cost of services | Service cost - Cost of services | $ | 65 | | | $ | 59 | | | $ | 24 | | | $ | 22 | | Service cost - Cost of services | $ | 59 | | | $ | 61 | | | $ | 24 | | | $ | 22 | |
| Service cost - Selling, general and administrative expense | Service cost - Selling, general and administrative expense | 9 | | | 14 | | | 5 | | | 5 | | Service cost - Selling, general and administrative expense | 8 | | | 15 | | | 4 | | | 5 | |
| Service cost | Service cost | $ | 74 | | | $ | 73 | | | $ | 29 | | | $ | 27 | | Service cost | $ | 67 | | | $ | 76 | | | $ | 28 | | | $ | 27 | |
| | Amortization of prior service cost (credit) | Amortization of prior service cost (credit) | $ | 15 | | | $ | 15 | | | $ | (223) | | | $ | (241) | | Amortization of prior service cost (credit) | $ | 16 | | | $ | 16 | | | $ | (223) | | | $ | (242) | |
| Expected return on plan assets | Expected return on plan assets | (309) | | | (297) | | | (6) | | | (7) | | Expected return on plan assets | (309) | | | (295) | | | (6) | | | (7) | |
| Interest cost | Interest cost | 95 | | | 140 | | | 72 | | | 107 | | Interest cost | 102 | | | 124 | | | 72 | | | 108 | |
| Remeasurement loss, net | Remeasurement loss, net | 0 | | | 182 | | | 0 | | | 0 | | Remeasurement loss, net | 144 | | | 1,092 | | | — | | | — | |
| | Other components | Other components | $ | (199) | | | $ | 40 | | | $ | (157) | | | $ | (141) | | Other components | $ | (47) | | | $ | 937 | | | $ | (157) | | | $ | (141) | |
| | Total | Total | $ | (125) | | | $ | 113 | | | $ | (128) | | | $ | (114) | | Total | $ | 20 | | | $ | 1,013 | | | $ | (129) | | | $ | (114) | |
| | | | | | | | | | | | | | | | | | | | | | | |
| (dollars in millions) |
| Pension | | Health Care and Life |
| Nine months ended September 30, | 2021 | | 2020 | | 2021 | | 2020 |
| Service cost - Cost of services | $ | 186 | | | $ | 179 | | | $ | 71 | | | $ | 67 | |
| Service cost - Selling, general and administrative expense | 26 | | | 43 | | | 14 | | | 15 | |
| Service cost | $ | 212 | | | $ | 222 | | | $ | 85 | | | $ | 82 | |
| | | | | | | |
| Amortization of prior service cost (credit) | $ | 46 | | | $ | 46 | | | $ | (670) | | | $ | (725) | |
| Expected return on plan assets | (927) | | | (888) | | | (17) | | | (20) | |
| Interest cost | 296 | | | 401 | | | 217 | | | 322 | |
| Remeasurement loss (gain), net | (1,170) | | | 1,427 | | | — | | | — | |
| | | | | | | |
| Other components | $ | (1,755) | | | $ | 986 | | | $ | (470) | | | $ | (423) | |
| | | | | | | |
| Total | $ | (1,543) | | | $ | 1,208 | | | $ | (385) | | | $ | (341) | |
The service cost component of net periodic benefit cost (income) is recorded in Cost of services and Selling, general and administrative expense in the condensed consolidated statements of income while the other components, including remeasurement adjustments, if any, are recorded in Other income (expense), net.
Severance Payments
During the three and nine months ended March 31,September 30, 2021, we paid severance benefits of $93 million.an insignificant amount and $169 million, respectively. During the three and nine months ended March 31,September 30, 2021, we recorded net pre-tax severance charges of an insignificant amount.$109 million and $124 million, respectively, both primarily due to a $103 million charge related to voluntary separations under our existing plans. At March 31,
September 30, 2021, we had a remaining severance liability of $515$529 million, a portion of which includes future contractual payments to separated employees.
Employer Contributions
During both the three and nine months ended March 31,September 30, 2021 and March 31,September 30, 2020, we made 0no contributions to our qualified pension plans and made insignificant contributions to our nonqualified pension plans. We do not expect mandatory pension funding through December 31, 2021. There have been no significant changes with respect to the nonqualified pension and other postretirement benefit plans contributions in 2021.
Remeasurement loss (gain), net
During the three and nine months ended September 30, 2021, we recorded a net pre-tax remeasurement loss of $144 million and a net pre-tax remeasurement gain of $1.2 billion, respectively in our pension plans triggered by settlements.
During the three months ended March 31,September 30, 2021, we did 0t record anyrecorded a pre-tax remeasurement loss of $144 million in our pension plans driven by a $667 million charge due to changes in our discount rate and other assumption changes, offset by a $523 million credit resulting from the difference between our estimated and our actual return on assets.
During the three months ended June 30, 2021, we recorded a pre-tax remeasurement gain of $1.3 billion in our pension plans triggered by settlements, primarily driven by a $1.2 billion credit mainly due to changes in our discount rate and changes in our lump sum interest rate assumptions used to determine the current year liabilities of our pension plans and a $122 million credit resulting from the difference between our estimated and our actual return on assets.
During the three and nine months ended September 30, 2020, we recorded net pre-tax gains orremeasurement losses of $1.1 billion and $1.4 billion, respectively, in our pension plans triggered by settlements.
During the three months ended September 30, 2020, we recorded a net pre-tax remeasurement loss of $1.1 billion primarily driven by a $1.8 billion charge due to remeasurement.changes in our discount rate and lump sum interest rate assumptions used to determine the current year liabilities of our pension plans, offset by a $689 million credit resulting from the difference between our estimated and our actual return on assets.
During the three months ended June 30, 2020, we recorded a net pre-tax remeasurement loss of $153 million primarily driven by a $163 million charge mainly resulting from the difference between our estimated and our actual return on assets and changes in our lump sum interest rate assumptions used to determine the current year liabilities of our pension plans, offset by a credit due to changes in our discount rate.
During the three months ended March 31, 2020, we recorded a net pre-tax remeasurement loss of $182 million in our pension plans triggered by settlements, primarily driven by a $196 million charge mainly due to changes in our discount rate and lump sum interest rate assumptions
used to determine the current year liabilities of our pension plans, offset by a credit due toresulting from the difference between our estimated return on assets and our actual return on assets.
| | |
| Note 10. Equity and Accumulated Other Comprehensive Income (Loss) |
Equity
Changes in the components of Total equity were as follows:
| | | (dollars in millions, except per share amounts, and shares in thousands) | (dollars in millions, except per share amounts, and shares in thousands) | (dollars in millions, except per share amounts, and shares in thousands) |
| Three months ended March 31, | 2021 | | 2020 | | |
| Three months ended September 30, | | Three months ended September 30, | 2021 | | 2020 | |
| | Shares | | Amount | | Shares | | Amount | | | Shares | | Amount | | Shares | | Amount | |
| Common Stock | Common Stock | | Common Stock | |
| Balance at beginning of period | Balance at beginning of period | 4,291,434 | | | $ | 429 | | | 4,291,434 | | | $ | 429 | | | Balance at beginning of period | 4,291,434 | | | $ | 429 | | | 4,291,434 | | | $ | 429 | | |
| | Balance at end of period | Balance at end of period | 4,291,434 | | | 429 | | | 4,291,434 | | | 429 | | | Balance at end of period | 4,291,434 | | | 429 | | | 4,291,434 | | | 429 | | |
| | Additional Paid In Capital | Additional Paid In Capital | | Additional Paid In Capital | |
| Balance at beginning of period | Balance at beginning of period | | 13,404 | | | 13,419 | | | Balance at beginning of period | | 13,403 | | | 13,281 | | |
| | Other | Other | | 4 | | | (117) | | | Other | | (1) | | | 123 | | |
| Balance at end of period | Balance at end of period | | 13,408 | | | 13,302 | | | Balance at end of period | | 13,402 | | | 13,404 | | |
| | Retained Earnings | Retained Earnings | | Retained Earnings | |
| Balance at beginning of period | Balance at beginning of period | | 60,464 | | | 53,147 | | | Balance at beginning of period | | 66,310 | | | 56,746 | | |
| Opening balance sheet adjustment | | 0 | | | (200) | | (1) | |
| Adjusted opening balance | | 60,464 | | | 52,947 | | | |
| | Net income attributable to Verizon | Net income attributable to Verizon | | 5,245 | | | 4,156 | | | Net income attributable to Verizon | | 6,407 | | | 4,357 | | |
| Dividends declared ($0.6275, $0.6150 per share) | | (2,602) | | | (2,546) | | | |
| | Dividends declared ($0.6400, $0.6275 per share) | | Dividends declared ($0.6400, $0.6275 per share) | | (2,651) | | | (2,597) | | |
| Other | | Other | | (4) | | | (33) | | |
| Balance at end of period | Balance at end of period | | 63,107 | | | 54,557 | | | Balance at end of period | | 70,062 | | | 58,473 | | |
| | Accumulated Other Comprehensive Income (Loss) | | |
| Accumulated Other Comprehensive Loss | | Accumulated Other Comprehensive Loss | |
| Balance at beginning of period attributable to Verizon | Balance at beginning of period attributable to Verizon | | (71) | | | 998 | | | Balance at beginning of period attributable to Verizon | | (234) | | | (1,274) | | |
| | Foreign currency translation adjustments | Foreign currency translation adjustments | | (38) | | | (120) | | | Foreign currency translation adjustments | | (146) | | | 124 | | |
| Unrealized gain (loss) on cash flow hedges | Unrealized gain (loss) on cash flow hedges | | 909 | | | (2,210) | | | Unrealized gain (loss) on cash flow hedges | | (174) | | | 505 | | |
| Unrealized loss on marketable securities | | (5) | | | (1) | | | |
| Unrealized gain on marketable securities | | Unrealized gain on marketable securities | | — | | | 2 | | |
| Defined benefit pension and postretirement plans | Defined benefit pension and postretirement plans | | (155) | | | (169) | | | Defined benefit pension and postretirement plans | | (155) | | | (169) | | |
| Other comprehensive income (loss) | Other comprehensive income (loss) | | 711 | | | (2,500) | | | Other comprehensive income (loss) | | (475) | | | 462 | | |
| Balance at end of period attributable to Verizon | Balance at end of period attributable to Verizon | | 640 | | | (1,502) | | | Balance at end of period attributable to Verizon | | (709) | | | (812) | | |
| | Treasury Stock | Treasury Stock | | Treasury Stock | |
| Balance at beginning of period | Balance at beginning of period | (153,304) | | | (6,719) | | | (155,606) | | | (6,820) | | | Balance at beginning of period | (151,318) | | | (6,632) | | | (153,380) | | | (6,722) | | |
| | Employee plans | Employee plans | 1,935 | | | 85 | | | 2,164 | | | 95 | | | Employee plans | 48 | | | 2 | | | 41 | | | 1 | | |
| Shareholder plans | 3 | | | 0 | | | 4 | | | 0 | | | |
| | | Balance at end of period | Balance at end of period | (151,366) | | | (6,634) | | | (153,438) | | | (6,725) | | | Balance at end of period | (151,270) | | | (6,630) | | | (153,339) | | | (6,721) | | |
| | Deferred Compensation-ESOPs and Other | Deferred Compensation-ESOPs and Other | | Deferred Compensation-ESOPs and Other | |
| Balance at beginning of period | Balance at beginning of period | | 335 | | | 222 | | | Balance at beginning of period | | 408 | | | 237 | | |
| Restricted stock equity grant | Restricted stock equity grant | | 99 | | | 15 | | | Restricted stock equity grant | | 85 | | | 62 | | |
| Amortization | Amortization | | (152) | | | (88) | | | Amortization | | (3) | | | (3) | | |
| Balance at end of period | Balance at end of period | | 282 | | | 149 | | | Balance at end of period | | 490 | | | 296 | | |
| | Noncontrolling Interests | Noncontrolling Interests | | Noncontrolling Interests | |
| Balance at beginning of period | Balance at beginning of period | | 1,430 | | | 1,440 | | | Balance at beginning of period | | 1,428 | | | 1,416 | | |
| | Total comprehensive income | Total comprehensive income | | 133 | | | 131 | | | Total comprehensive income | | 147 | | | 147 | | |
| Distributions and other | Distributions and other | | (112) | | | (128) | | | Distributions and other | | (130) | | | (102) | | |
| Balance at end of period | Balance at end of period | | 1,451 | | | 1,443 | | | Balance at end of period | | 1,445 | | | 1,461 | | |
| Total Equity | Total Equity | | $ | 72,683 | | | $ | 61,653 | | | Total Equity | | $ | 78,489 | | | $ | 66,530 | | |
| | | | | | | | | | | | | | | | | | | | | | | | | | |
| | | | | | | | |
| (dollars in millions, except per share amounts, and shares in thousands) |
| Nine months ended September 30, | 2021 | | | | 2020 | | | |
| Shares | | Amount | | Shares | | Amount | |
| Common Stock | | | | | | | | |
| Balance at beginning of year | 4,291,434 | | | $ | 429 | | | 4,291,434 | | | $ | 429 | | |
| | | | | | | | |
| Balance at end of period | 4,291,434 | | | 429 | | | 4,291,434 | | | 429 | | |
| | | | | | | | |
| Additional Paid In Capital | | | | | | | | |
| Balance at beginning of year | | | 13,404 | | | | | 13,419 | | |
| | | | | | | | |
| Other | | | (2) | | | | | (15) | | |
| Balance at end of period | | | 13,402 | | | | | 13,404 | | |
| | | | | | | | |
| Retained Earnings | | | | | | | | |
| Balance at beginning of year | | | 60,464 | | | | | 53,147 | | |
| Opening balance sheet adjustment | | | — | |
| | | (200) | | (1) |
| Adjusted opening balance | | | 60,464 | | | | | 52,947 | | |
| Net income attributable to Verizon | | | 17,452 | | | | | 13,213 | | |
| Dividends declared ($1.8950, $1.8575 per share) | | | (7,850) | | | | | (7,687) | | |
| Other | | | (4) | | | | | — | | |
| Balance at end of period | | | 70,062 | | | | | 58,473 | | |
| | | | | | | | |
| Accumulated Other Comprehensive Income (Loss) | | | | | | | | |
| Balance at beginning of year attributable to Verizon | | | (71) | | | | | 998 | | |
| | | | | | | | |
| | | | | | | | |
| Foreign currency translation adjustments | | | (126) | | | | | 81 | | |
| Unrealized loss on cash flow hedges | | | (42) | | | | | (1,391) | | |
| Unrealized gain (loss) on marketable securities | | | (5) | | | | | 7 | | |
| Defined benefit pension and postretirement plans | | | (465) | | | | | (507) | | |
| Other comprehensive loss | | | (638) | | | | | (1,810) | | |
| Balance at end of period attributable to Verizon | | | (709) | | | | | (812) | | |
| | | | | | | | |
| Treasury Stock | | | | | | | | |
| Balance at beginning of year | (153,304) | | | (6,719) | | | (155,606) | | | (6,820) | | |
| | | | | | | | |
| Employee plans | 2,031 | | | 89 | | | 2,263 | | | 99 | | |
| Shareholder plans | 3 | | | — | | | 4 | | | — | | |
| | | | | | | | |
| Balance at end of period | (151,270) | | | (6,630) | | | (153,339) | | | (6,721) | | |
| | | | | | | | |
| Deferred Compensation-ESOPs and Other | | | | | | | | |
| Balance at beginning of year | | | 335 | | | | | 222 | | |
| Restricted stock equity grant | | | 315 | | | | | 234 | | |
| Amortization | | | (160) | | | | | (160) | | |
| Balance at end of period | | | 490 | | | | | 296 | | |
| | | | | | | | |
| Noncontrolling Interests | | | | | | | | |
| Balance at beginning of year | | | 1,430 | | | | | 1,440 | | |
| | | | | | | | |
| | | | | | | | |
| | | | | | | | |
| | | | | | | | |
| | | | | | | | |
| Total comprehensive income | | | 429 | | | | | 417 | | |
| Distributions and other | | | (414) | | | | | (396) | | |
| Balance at end of period | | | 1,445 | | | | | 1,461 | | |
| Total Equity | | | $ | 78,489 | | | | | $ | 66,530 | | |
(1) Opening balance sheet adjustment for the threenine months ended March 31,September 30, 2020 is due to the adoption of Topic 326, ASU 2016-13, Financial Instruments-Credit Losses and other ASUs on January 1, 2020. Refer to the consolidated financial statements included in Verizon's Annual Report on Form 10-K for the year ended December 31, 2020 for additional information.
Common Stock
Verizon did not repurchase any shares of Verizon common stock through its previously authorized share buyback program during the threenine months ended March 31,September 30, 2021. At March 31,September 30, 2021, the maximum number of shares that could be purchased by or on behalf of Verizon under our share buyback program was 100 million.
Common stock has been used from time to time to satisfy some of the funding requirements of employee and shareowner plans, including 1.92.0 million common shares issued from Treasury stock during the threenine months ended March 31,September 30, 2021.
Accumulated Other Comprehensive Income (Loss)
The changes in the balances of Accumulated other comprehensive income (loss) by component were as follows:
| | (dollars in millions) | (dollars in millions) | Foreign
currency
translation
adjustments | | Unrealized gain (loss) on cash flow hedges | | Unrealized gain (loss) on marketable securities | | Defined
benefit
pension and
postretirement
plans | | Total | (dollars in millions) | Foreign
currency
translation
adjustments | | Unrealized loss on cash flow hedges | | Unrealized gain (loss) on marketable securities | | Defined
benefit
pension and
postretirement
plans | | Total |
| Balance at January 1, 2021 | Balance at January 1, 2021 | $ | (404) | | | $ | (1,387) | | | $ | 25 | | | $ | 1,695 | | | $ | (71) | | Balance at January 1, 2021 | $ | (404) | | | $ | (1,387) | | | $ | 25 | | | $ | 1,695 | | | $ | (71) | |
| | Other comprehensive income (loss) | (38) | | | 315 | | | (5) | | | 0 | | | 272 | | |
| Other comprehensive loss | | Other comprehensive loss | (126) | | | (1,077) | | | (5) | | | — | | | (1,208) | |
| Amounts reclassified to net income | Amounts reclassified to net income | 0 | | | 594 | | | 0 | | | (155) | | | 439 | | Amounts reclassified to net income | — | | | 1,035 | | | — | | | (465) | | | 570 | |
| Net other comprehensive income (loss) | (38) | | | 909 | | | (5) | | | (155) | | | 711 | | |
| Balance at March 31, 2021 | $ | (442) | | | $ | (478) | | | $ | 20 | | | $ | 1,540 | | | $ | 640 | | |
| Net other comprehensive loss | | Net other comprehensive loss | (126) | | | (42) | | | (5) | | | (465) | | | (638) | |
| Balance at September 30, 2021 | | Balance at September 30, 2021 | $ | (530) | | | $ | (1,429) | | | $ | 20 | | | $ | 1,230 | | | $ | (709) | |
The amounts presented above in netNet other comprehensive income (loss)loss are net of taxes. The amounts reclassified to net income related to unrealized loss on cash flow hedges in the table above are included in Other income (expense), net and Interest expense in our condensed consolidated statements of income. See Note 8 for additional information. The amounts reclassified to net income related to defined benefit pension and postretirement plans in the table above are included in Other income (expense), net in our condensed consolidated statements of income. See Note 9 for additional information.
| | |
| Note 11. Segment Information |
Reportable Segments
We have 2 reportable segments that we operate and manage as strategic business units - Consumer and Business. We measure and evaluate our reportable segments based on segment operating income, consistent with the chief operating decision maker’s assessment of segment performance.
Our segments and their principal activities consist of the following:
| | | | | | | | |
| Segment | | Description |
Verizon
Consumer Group | | Our Consumer segment provides consumer-focused wireless and wireline communications services and products. Our wireless services are provided across one of the most extensive wireless networks in the U.S. under the Verizon brand and through wholesale and other arrangements. Our wireline services are provided in nine states in the Mid-Atlantic and Northeastern U.S., as well as Washington D.C., over our 100% fiber-optic network through our Verizon Fios product portfolio and over a traditional copper-based network to customers who are not served by Fios. |
| | |
Verizon
Business Group | | Our Business segment provides wireless and wireline communications services and products, including data, video and conferencing services, corporate networking solutions, security and managed network services, local and long distance voice services and network access to deliver various IoT services and products. We provide these products and services to businesses, government customers and wireless and wireline carriers across the U.S. and select products and services to customers around the world. |
Our Consumer segment’s wireless and wireline products and services are available to our retail customers, as well as resellers that purchase wireless network access from us on a wholesale basis. Our Business segment’s wireless and wireline products and services are organized by the primary customer groups targeted by these offerings: Small and Medium Business, Global Enterprise, Public Sector and Other, and Wholesale.
Corporate and other primarily includes the results of our media business, Verizon Media, and other businesses,insurance captives, investments in unconsolidated businesses and development stage businesses that support our strategic initiatives, as well as unallocated corporate expenses, certain pension and other employee benefit related costs and interest and financing expenses. Corporate and other also includes the historical results of divested businesses including Verizon Media, and other adjustments and gains and losses that are not allocated in assessing segment performance due to their nature. Although such transactions are excluded from the business segment results, they are included in reported consolidated earnings. Gains and losses from these transactions that are not individually significant are included in segment results as these items are included in the chief operating decision maker’s assessment of segment performance.
We completed the sale of Verizon Media on September 1, 2021. Refer to Note 3 for additional information on the sale of Verizon Media.
The reconciliation of segment operating revenues and expenses to consolidated operating revenues and expenses below includes the effects of special items that the chief operating decision maker does not consider in assessing segment performance, primarily because of their nature.
The following table provides operating financial information for our two2 reportable segments:
| | | | | Three Months Ended | | Three Months Ended | | Nine Months Ended |
| | | March 31, | | September 30, | | September 30, |
| (dollars in millions) | (dollars in millions) | | 2021 | | 2020 | (dollars in millions) | 2021 | | 2020 | | 2021 | | 2020 |
| External Operating Revenues | External Operating Revenues | | | External Operating Revenues | |
| Consumer | Consumer | | | Consumer | |
| Service | Service | | $ | 16,566 | | | $ | 16,343 | | Service | $ | 16,889 | | | $ | 16,255 | | | $ | 50,159 | | | $ | 48,496 | |
| Wireless equipment | Wireless equipment | | 4,192 | | | 3,377 | | Wireless equipment | 4,530 | | | 3,403 | | | 13,461 | | | 9,989 | |
| Other | Other | | 1,982 | | | 1,986 | | Other | 1,852 | | | 2,014 | | | 5,807 | | | 5,946 | |
| Total Consumer | Total Consumer | | 22,740 | | | 21,706 | | Total Consumer | 23,271 | | | 21,672 | | | 69,427 | | | 64,431 | |
| | Business | Business | | | Business | |
| Small and Medium Business | Small and Medium Business | | 2,825 | | | 2,798 | | Small and Medium Business | 2,929 | | | 2,737 | | | 8,644 | | | 8,132 | |
| Global Enterprise | Global Enterprise | | 2,557 | | | 2,630 | | Global Enterprise | 2,551 | | | 2,594 | | | 7,690 | | | 7,811 | |
| | Public Sector and Other | Public Sector and Other | | 1,645 | | | 1,474 | | Public Sector and Other | 1,548 | | | 1,639 | | | 4,807 | | | 4,636 | |
| Wholesale | Wholesale | | 735 | | | 760 | | Wholesale | 645 | | | 763 | | | 2,038 | | | 2,279 | |
| Total Business | Total Business | | 7,762 | | | 7,662 | | Total Business | 7,673 | | | 7,733 | | | 23,179 | | | 22,858 | |
| Total reportable segments | Total reportable segments | | $ | 30,502 | | | $ | 29,368 | | Total reportable segments | $ | 30,944 | | | $ | 29,405 | | | $ | 92,606 | | | $ | 87,289 | |
| | Intersegment Revenues | Intersegment Revenues | | | Intersegment Revenues | |
| Consumer | Consumer | | $ | 58 | | | $ | 59 | | Consumer | $ | 57 | | | $ | 64 | | | $ | 176 | | | $ | 183 | |
| Business | Business | | 19 | | | 19 | | Business | 16 | | | 16 | | | 53 | | | 54 | |
| Total reportable segments | Total reportable segments | | $ | 77 | | | $ | 78 | | Total reportable segments | $ | 73 | | | $ | 80 | | | $ | 229 | | | $ | 237 | |
| | Total Operating Revenues | Total Operating Revenues | | | Total Operating Revenues | |
| Consumer | Consumer | | $ | 22,798 | | | $ | 21,765 | | Consumer | $ | 23,328 | | | $ | 21,736 | | | $ | 69,603 | | | $ | 64,614 | |
Business(1) | Business(1) | | 7,781 | | | 7,681 | | Business(1) | 7,689 | | | 7,749 | | | 23,232 | | | 22,912 | |
| Total reportable segments | Total reportable segments | | $ | 30,579 | | | $ | 29,446 | | Total reportable segments | $ | 31,017 | | | $ | 29,485 | | | $ | 92,835 | | | $ | 87,526 | |
| | Operating Income | Operating Income | | | Operating Income | |
| Consumer | Consumer | | $ | 7,519 | | | $ | 7,282 | | Consumer | $ | 7,590 | | | $ | 7,437 | | | $ | 22,606 | | | $ | 21,783 | |
| Business | Business | | 899 | | | 954 | | Business | 886 | | | 923 | | | 2,641 | | | 2,823 | |
| Total reportable segments | Total reportable segments | | $ | 8,418 | | | $ | 8,236 | | Total reportable segments | $ | 8,476 | | | $ | 8,360 | | | $ | 25,247 | | | $ | 24,606 | |
(1) Service and other revenues included in our Business segment amounted to approximately $6.9 billion and $7.0 billion for the three months ended September 30, 2021 and 2020, respectively. Service and other revenues included in our Business segment amounted to approximately $20.9 billion for both the nine months ended September 30, 2021 and 2020. Wireless equipment revenues included in our Business segment amounted to approximately $7.0 billion$820 million and $752$709 million respectively, for the three months ended March 31,September 30, 2021 and 2020, respectively. Wireless equipment revenues included in our Business segment amounted to approximately $6.9$2.4 billion and $752 million, respectively,$2.0 billion for the threenine months ended March 31, 2020.September 30, 2021 and 2020, respectively.
The following table provides Fios revenue for our 2 reportable segments:
| | | | Three Months Ended | | Three Months Ended | | Nine Months Ended |
| | | March 31, | | September 30, | | September 30, |
| (dollars in millions) | (dollars in millions) | | 2021 | | 2020 | (dollars in millions) | 2021 | | 2020 | | 2021 | | 2020 |
| Consumer | Consumer | | $ | 2,860 | | | $ | 2,799 | | Consumer | $ | 2,893 | | | $ | 2,773 | | | $ | 8,648 | | | $ | 8,326 | |
| Business | Business | | 276 | | | 262 | | Business | 287 | | | 263 | | | 844 | | | 785 | |
| Total Fios revenue | Total Fios revenue | | $ | 3,136 | | | $ | 3,061 | | Total Fios revenue | $ | 3,180 | | | $ | 3,036 | | | $ | 9,492 | | | $ | 9,111 | |
The following table provides Wireless service revenue for our reportable segments and includes intersegment activity:
| | | | Three Months Ended | | Three Months Ended | | Nine Months Ended |
| | | March 31, | | September 30, | | September 30, |
| (dollars in millions) | (dollars in millions) | | 2021 | | 2020 | (dollars in millions) | 2021 | | 2020 | | 2021 | | 2020 |
| Consumer | Consumer | | $ | 13,684 | | | $ | 13,476 | | Consumer | $ | 13,982 | | | $ | 13,442 | | | $ | 41,460 | | | $ | 40,005 | |
| Business | Business | | 3,060 | | | 2,881 | | Business | 3,097 | | | 2,990 | | | 9,247 | | | 8,732 | |
| Total Wireless service revenue | Total Wireless service revenue | | $ | 16,744 | | | $ | 16,357 | | Total Wireless service revenue | $ | 17,079 | | | $ | 16,432 | | | $ | 50,707 | | | $ | 48,737 | |
Reconciliation to Consolidated Financial Information
A reconciliation of the reportable segment operating revenues to consolidated operating revenues is as follows:
| | | | Three Months Ended | | Three Months Ended | | Nine Months Ended |
| | | | March 31, | | September 30, | | September 30, |
| (dollars in millions) | (dollars in millions) | | 2021 | | 2020 | (dollars in millions) | 2021 | | 2020 | | 2021 | | 2020 |
| Total reportable segment operating revenues | Total reportable segment operating revenues | | $ | 30,579 | | | $ | 29,446 | | Total reportable segment operating revenues | $ | 31,017 | | | $ | 29,485 | | | $ | 92,835 | | | $ | 87,526 | |
| Corporate and other | Corporate and other | | 2,422 | | | 2,272 | | Corporate and other | 2,009 | | | 2,203 | | | 7,093 | | | 6,442 | |
| Eliminations | Eliminations | | (134) | | | (108) | | Eliminations | (111) | | | (145) | | | (382) | | | (368) | |
| | Total consolidated operating revenues | Total consolidated operating revenues | | $ | 32,867 | | | $ | 31,610 | | Total consolidated operating revenues | $ | 32,915 | | | $ | 31,543 | | | $ | 99,546 | | | $ | 93,600 | |
A reconciliation of the total reportable segment's operating income to consolidated income before provision for income taxes is as follows:
| | | | | Three Months Ended | | Three Months Ended | | Nine Months Ended |
| | | March 31, | | September 30, | | September 30, |
| (dollars in millions) | (dollars in millions) | | 2021 | | 2020 | (dollars in millions) | 2021 | | 2020 | | 2021 | | 2020 |
| Total reportable segment operating income | Total reportable segment operating income | | $ | 8,418 | | | $ | 8,236 | | Total reportable segment operating income | $ | 8,476 | | | $ | 8,360 | | | $ | 25,247 | | | $ | 24,606 | |
| Corporate and other | Corporate and other | | (233) | | | (259) | | Corporate and other | 621 | | | (479) | | | 392 | | | (1,183) | |
| | Other components of net periodic benefit charges (Note 9) | Other components of net periodic benefit charges (Note 9) | | (192) | | | (203) | | Other components of net periodic benefit charges (Note 9) | (192) | | | (203) | | | (576) | | | (610) | |
| Loss on spectrum licenses (Note 3) | Loss on spectrum licenses (Note 3) | | (223) | | | (1,195) | | Loss on spectrum licenses (Note 3) | — | | | — | | | (223) | | | (1,195) | |
| | Total consolidated operating income | Total consolidated operating income | | 7,770 | | | 6,579 | | Total consolidated operating income | 8,905 | | | 7,678 | | | 24,840 | | | 21,618 | |
| | Equity in earnings (losses) of unconsolidated businesses | Equity in earnings (losses) of unconsolidated businesses | | 8 | | | (12) | | Equity in earnings (losses) of unconsolidated businesses | 1 | | | (9) | | | 10 | | | (34) | |
| Other income, net | | 401 | | | 143 | | |
| Other income (expense), net | | Other income (expense), net | 269 | | | (774) | | | 1,172 | | | (703) | |
| Interest expense | Interest expense | | (1,101) | | | (1,034) | | Interest expense | (801) | | | (1,044) | | | (2,746) | | | (3,167) | |
| Income Before Provision For Income Taxes | Income Before Provision For Income Taxes | | $ | 7,078 | | | $ | 5,676 | | Income Before Provision For Income Taxes | $ | 8,374 | | | $ | 5,851 | | | $ | 23,276 | | | $ | 17,714 | |
No single customer accounted for more than 10% of our total operating revenues during the three and nine months ended March 31,September 30, 2021 andor 2020.
The chief operating decision maker does not review disaggregated assets on a segment basis; therefore, such information is not presented. Depreciation included in the measure of segment profitability is primarily allocated based on proportional usage.
| | |
| Note 12. Commitments and Contingencies |
In the ordinary course of business, Verizon is involved in various commercial litigation and regulatory proceedings at the state and federal level. Where it is determined, in consultation with counsel based on litigation and settlement risks, that a loss is probable and estimable in a given matter, the Company establishes an accrual. In none of the currently pending matters is the amount of accrual material. An estimate of the reasonably possible loss or range of loss in excess of the amounts already accrued cannot be made at this time due to various factors typical in contested proceedings, including: (1) uncertain damage theories and demands; (2) a less than complete factual record; (3) uncertainty concerning legal theories and their resolution by courts or regulators; and (4) the unpredictable nature of the opposing party and its demands. We continuously monitor these proceedings as they develop and adjust any accrual or disclosure as needed. We do not expect that the ultimate resolution of any pending regulatory or legal matter in future periods will have a material effect on our financial condition, but it could have a material effect on our results of operations for a given reporting period.
Verizon is currently involved in approximately 2520 federal district court actions alleging that Verizon is infringing various patents. Most of these cases are brought by non-practicing entities and effectively seek only monetary damages; a small number are brought by companies that have sold products and could seek injunctive relief as well. These cases have progressed to various stages and a small number may go to trial in the coming 12 months if they are not otherwise resolved.
In connection with the execution of agreements for the sales of businesses and investments, Verizon ordinarily provides representations and warranties to the purchasers pertaining to a variety of nonfinancial matters, such as ownership of the securities being sold, as well as indemnity from certain financial losses. From time to time, counterparties may make claims under these provisions, and Verizon will seek to defend against those claims and resolve them in the ordinary course of business.
Subsequent to the sale of Verizon Information Services Canada in 2004, we continue to provide a guarantee to publish directories, which was issued when the directory business was purchased in 2001 and had a 30-year term (before extensions). The preexisting guarantee continues, without modification, despite the subsequent sale of Verizon Information Services Canada and the spin-off of our domestic print and internet yellow pages directories business. The possible financial impact of the guarantee, which is not expected to be adverse, cannot be reasonably estimated as a variety of the potential outcomes available under the guarantee result in costs and revenues or benefits that may offset each other. We do not believe performance under the guarantee is likely.
During the nine months ended September 30, 2021, Verizon entered into a renewable energy purchase agreement (REPA) with a third party. The REPA is based on the expected operation of a renewable energy-generating facility and has a fixed price term of 15 years from the commencement of the facility's entry into commercial operation, which is expected to occur in 2022. The REPA generally is expected to be financially settled based on the prevailing market price as energy is generated by the facility.
| | |
| Item 2. Management’s Discussion and Analysis of Financial Condition and Results of Operations |
Verizon Communications Inc. (Verizon or the Company) is a holding company that, acting through its subsidiaries, is one of the world’s leading providers of communications, technology, information and entertainment products and services to consumers, businesses and government entities. With a presence around the world, we offer data, video and voice services and solutions on our networks and platforms that are designed to meet customers’ demand for mobility, reliable network connectivity, security and control.
To compete effectively in today’s dynamic marketplace, we are focused on the capabilities of our high-performing networks to drive growth based on delivering what customers want and need in the new digital world. In 2021, we are focused on leveraging our network leadership; retaining and growing our high-quality customer base while balancing profitability; enhancing ecosystems in growth businesses; and driving monetization of our networks, platforms and solutions. We are creating business value by earning customers', employees' and shareholders' trust, limiting our environmental impact and continuing our customer base growth while creating social benefit through our products and services. Our strategy requires significant capital investments primarily to acquire wireless spectrum, put the spectrum into service, provide additional capacity for growth in our networks, invest in the fiber that supports our businesses, evolve and maintain our networks and develop and maintain significant advanced information technology systems and data system capabilities. We believe that steady and consistent investments in our networks and platforms will drive innovative products and services and fuel our growth.
We are consistently deploying new network architecture and technologies to secure our leadership in both fourth-generation (4G) and fifth-generation (5G) wireless networks. We expect that our next-generation multi-use platform, which we call the Intelligent Edge Network, will simplify operations by eliminating legacy network elements, speed the deployment of 5G wireless technology and create new opportunities in the business market in a cost efficient manner. Our network leadership is the hallmark of our brand and the foundation for the connectivity, platforms and solutions upon which we build our competitive advantage.
Highlights of Our Financial Results for the Three Months Ended March 31,September 30, 2021 and 2020
(dollars in millions)
Highlights of Our Financial Results for the Nine Months Ended September 30, 2021 and 2020
(dollars in millions)
Business Overview
We have two reportable segments that we operate and manage as strategic business units - Verizon Consumer Group (Consumer) and Verizon Business Group (Business).
Revenue by Segment for the Three Months Ended March 31,September 30, 2021 and 2020
———
Note: Excludes eliminations.
Revenue by Segment for the Nine Months Ended September 30, 2021 and 2020
———
Note: Excludes eliminations.
Verizon Consumer Group
Our Consumer segment provides consumer-focused wireless and wireline communications services and products. Our wireless services are provided across one of the most extensive wireless networks in the United States (U.S.) under the Verizon brand and through wholesale and other arrangements. Fixed wireless access (FWA) is also provided to consumers for broadband access through our wireless networks. Our wireline services are provided in nine states in the Mid-Atlantic and Northeastern U.S., as well as Washington D.C., over our 100% fiber-optic network through our Verizon Fios product portfolio and over a traditional copper-based network to customers who are not served by Fios. Our Consumer segment's wireless and wireline products and services are available to our retail customers, as well as resellers that purchase wireless network access from us on a wholesale basis.
Customers can obtain our wireless services on a postpaid or prepaid basis. Our postpaid service is generally billed one month in advance for a monthly access charge in return for access to and usage of network services. Our prepaid service is offered only to Consumer customers and enables individuals to obtain wireless services without credit verification by paying for all services in advance. The Consumer segment also offers several categories of wireless equipment to customers, including a variety of smartphones and other handsets, wireless-enabled internet devices, such as tablets and other wireless-enabled connected devices, such as smart watches.
In addition to the wireless services and equipment discussed above, Consumer sells residential fixed connectivity solutions, including internet, video and voice services, and wireless network access to resellers on a wholesale basis. The Consumer segment's operating revenues for the three and nine months ended March 31,September 30, 2021 totaled $22.8$23.3 billion and $69.6 billion, respectively, representing an increase of 4.7%7.3% and 7.7%, respectively, compared to the similar periodperiods in 2020. See "Segment Results of Operations" for additional information regarding our Consumer segment’s operating performance and selected operating statistics.
Verizon Business Group
Our Business segment provides wireless and wireline communications services and products, including data, video and conferencing services, corporate networking solutions, security and managed network services, local and long distance voice services and network access to deliver various Internet of Things (IoT) services and products, including solutions that support fleet tracking management, compliance management, field service management, asset tracking and other types of mobile resource management. FWA is also provided to business customers for broadband access through our wireless networks. We provide these products and services to businesses, government customers and wireless and wireline carriers across the U.S. and select products and services to customers around the world. The Business segment's operating revenues for the three and nine months ended March 31,September 30, 2021 totaled $7.8$7.7 billion and $23.2 billion, respectively, representing a decrease of 0.8% and an increase of 1.3%1.4%, respectively, compared to the similar periodperiods in 2020. See "Segment Results of Operations" for additional information regarding our Business segment’s operating performance and selected operating statistics.
Corporate and Other
Corporate and other primarily includes the results of our media business, Verizon Media, and other businesses,insurance captives, investments in unconsolidated businesses insurance captives,and development stage businesses that support our strategic initiatives, as well as unallocated corporate expenses, certain pension and other employee benefit related costs and interest and financing expenses. Corporate and other also includes the historical results of divested businesses including Verizon Media, and other adjustments and gains and losses that are not allocated in assessing segment performance due to their nature. Although such transactions are excluded from the business segment results, they are included in reported consolidated earnings. Gains and losses from these transactions that are not individually significant are included in segment results as these items are included in the chief operating decision maker’s assessment of segment performance.
On May 2, 2021, Verizon entered into a definitive agreement with an affiliate of Apollo Global Management Inc. (the Apollo Affiliate) pursuant to which we agreed to sell Verizon Media includes diverse media and technology brands that serve both consumers and businesses.to the affiliate. The transaction closed on September 1, 2021. See Note 3 to the condensed consolidated financial statements for additional information. Under our ownership, Verizon Media provides consumers with owned and operated and third-party search properties as well as mail, news, finance, sports and entertainment content, e-commerce andMedia's total operating revenues were $1.4 billion
subscription offerings, and provides other businesses and partners access to consumers through digital advertising, content delivery and video streaming platforms. Verizon Media's total operating revenues were $1.9$5.3 billion, respectively, for the three and nine months ended March 31,September 30, 2021, reflective of results through the date the transaction closed, which represents a decrease of 17.2% and an increase of 10.4%12.1%, respectively, compared to the similar periodperiods in 2020.
Capital Expenditures and Investments
We continue to invest in our wireless networks, high-speed fiber and other advanced technologies to position ourselves at the center of growth trends for the future. During the threenine months ended March 31,September 30, 2021, these investments included $4.5$13.9 billion for capital expenditures.expenditures, inclusive of the C-Band capital expenditures described below. See "Cash Flows Used in Investing Activities" for additional information. Capital expenditures for 2021 are currently expected to be in the range of $17.5 billion to $18.5 billion, including the further expansion of our 5G network in new and existing markets, the densification of our 4G Long-Term Evolution (LTE) wireless network to manage future traffic demands, and the continued deployment of our fiber infrastructure. Expenditures related to the deployment of our C-Band spectrum will be in addition to this amount, and are expected to be approximately $10 billion over three years, with $2 billion to $3 billion expected in 2021. As of September 30, 2021, our capital expenditures include approximately $1.0 billion related to our C-Band deployment. We believe that our investments aimed at expanding our portfolio of products and services will provide our customers with an efficient, reliable infrastructure for competing in the information economy.
Global Network and Technology
We are focusing our capital spending on adding capacity and density to our 4G LTE network, while also building our next generation 5G network. We are densifying our networks by utilizing small cell technology, in-building solutions and distributed antenna systems. Network densification enables us to add capacity to address increasing mobile video consumption and the growing demand for IoT products and services on our 4G LTE and 5G networks. Over the past several years, we have been leading the development of 5G wireless technology industry standards and the ecosystems for fixed and mobile 5G wireless services. We expect that 5G technology will provide higher throughput and lower latency than the current 4G LTE technologytechnology and enable our networks to handle more traffic as the number of internet-connected devices grows. As of March 31,September 30, 2021, 5G Ultra Wideband is available in 67parts of 82 U.S. cities and 5G Home is available in 28parts of 57 U.S. cities. 5G Nationwide is available in over 2,700 U.S. markets. 5G Nationwide uses low and mid-band spectrum and dynamic spectrum sharing (DSS) technology, which allows 5G service to run simultaneously with 4G LTE on multiple spectrum bands. With DSS, whenever customers move outside Verizon’s high-band Ultra Wideband coverage area, their 5G-enabled devices will remain on 5G technology using the lower spectrum bands where the 5G Nationwide network is available. This allows us to more fully and effectively utilize our current spectrum resources to serve both 4G and 5G customers.
To compensate for the shrinking market for traditional copper-based products, we continue to build fiber-based networks supporting data, video and advanced business services - areas where demand for reliable high-speed connections is growing. We are evolving the architecture of our networks to our Intelligent Edge Network, providing improved efficiency and virtualization, increased automation and opportunities for edge computing services that will support both our fiber-based and radio access network technologies. We expect that this new architecture will simplify operations by eliminating legacy network elements, speed the deployment of 5G wireless technology and create new opportunities in the business market in a cost efficient manner.
Impact of the Novel Coronavirus (COVID-19) Pandemic
For a discussion of the impacts on and the risks to our business from COVID-19, refer to Item 1A Risk Factors and "Impacts of the Novel Coronavirus (COVID-19) Pandemic" in Item 7 Management’s Discussion and Analysis of Financial Condition and Results of Operations included in our Annual Report on Form 10-K for the year ended December 31, 2020.
Recent Development
In April The impacts from the COVID-19 pandemic on our operations were significant during the second and third quarters of 2020, which affects the comparability of the results from both the three months ended and the nine months ended September 30, 2021 Verizon executed agreements that modifiedto September 30, 2020. The COVID-19 pandemic continues to be dynamic, and near-term challenges across the tenureeconomy remain, including the recent surge of the Delta variant across the U.S. We remain committed to caring for the health and payment terms for certain existing cell tower operating leases to support the build-outsafety of our 5G wireless network. Verizon expects these lease modifications will resultemployees and our customers through this challenge while supporting the communities in an increase towhich we operate. While we have not experienced a material impact on our operating lease right-of-use assets and liabilitiesbusiness from the Delta variant thus far in 2021, we cannot predict with certainty the ultimate impact it may have on our results of approximately $7.0 billion to $7.5 billionoperations in the second quarter of 2021.future, and will continue to monitor its daily evolution.
| | |
| Consolidated Results of Operations |
In this section, we discuss our overall results of operations and highlight special items that are not included in our segment results. In "Segment Results of Operations," we review the performance of our two reportable segments in more detail.
Consolidated Revenues
| | | | Three Months Ended | | | | | | | | Three Months Ended | | | | | | Nine Months Ended | | | | |
| | | March 31, | | Increase/ | | | | September 30, | | Increase/ | | September 30, | | Increase/ |
| (dollars in millions) | (dollars in millions) | 2021 | | 2020 | | (Decrease) | | | (dollars in millions) | 2021 | | 2020 | | (Decrease) | | 2021 | | 2020 | | (Decrease) |
| Consumer | Consumer | $ | 22,798 | | | $ | 21,765 | | | $ | 1,033 | | | 4.7 | % | | | Consumer | $ | 23,328 | | | $ | 21,736 | | | $ | 1,592 | | | 7.3 | % | | $ | 69,603 | | | $ | 64,614 | | | $ | 4,989 | | | 7.7 | % |
| Business | Business | 7,781 | | | 7,681 | | | 100 | | | 1.3 | | | | Business | 7,689 | | | 7,749 | | | (60) | | | (0.8) | | | 23,232 | | | 22,912 | | | 320 | | | 1.4 | |
| Corporate and other | Corporate and other | 2,422 | | | 2,272 | | | 150 | | | 6.6 | | | | Corporate and other | 2,009 | | | 2,203 | | | (194) | | | (8.8) | | | 7,093 | | | 6,442 | | | 651 | | | 10.1 | |
| Eliminations | Eliminations | (134) | | | (108) | | | (26) | | | 24.1 | | | | Eliminations | (111) | | | (145) | | | 34 | | | (23.4) | | | (382) | | | (368) | | | (14) | | | 3.8 | |
| Consolidated Revenues | Consolidated Revenues | $ | 32,867 | | | $ | 31,610 | | | $ | 1,257 | | | 4.0 | | | | Consolidated Revenues | $ | 32,915 | | | $ | 31,543 | | | $ | 1,372 | | | 4.3 | | | $ | 99,546 | | | $ | 93,600 | | | $ | 5,946 | | | 6.4 | |
Consolidated revenues increased during both the three and nine months ended March 31,September 30, 2021 compared to the similar periodperiods in 2020,2020. The increase in revenues during the three months ended September 30, 2021 was due to revenuean increase in our Consumer segment, partially offset by decreases in our Business segment and Corporate and other. The increase in revenues during the nine months ended September 30, 2021 was due to increases in our Consumer segment, Business segment and Corporate and other.
Revenues for our segments are discussed separately below under the heading "Segment Results of Operations."
Corporate and other revenues decreased and increased during the three and nine months ended September 30, 2021, respectively, compared to the similar periods in 2020. The decrease during the three months ended March 31,September 30, 2021 comparedwas primarily due to the similar periodfact that we completed the Verizon Media sale on September 1, 2021, and therefore had one less month of operating revenues from Verizon Media in 2020,the 2021 period. The increase during the nine months ended September 30, 2021 was primarily due to an increase of $175$573 million in revenues within Verizon Media. See Note 3 to the condensed consolidated financial statements for additional information on the Verizon Media Sale.
Consolidated Operating Expenses
| | | | Three Months Ended | | | | | | | | Three Months Ended | | | | | | Nine Months Ended | | | | |
| | | March 31, | | Increase/ | | | | September 30, | | Increase/ | | September 30, | | Increase/ |
| (dollars in millions) | (dollars in millions) | 2021 | | 2020 | | (Decrease) | | | (dollars in millions) | 2021 | | 2020 | | (Decrease) | | 2021 | | 2020 | | (Decrease) |
| Cost of services | Cost of services | $ | 8,020 | | | $ | 7,754 | | | $ | 266 | | | 3.4 | % | | | Cost of services | $ | 7,855 | | | $ | 7,955 | | | $ | (100) | | | (1.3) | % | | $ | 24,199 | | | $ | 23,348 | | | $ | 851 | | | 3.6 | % |
| Cost of wireless equipment | Cost of wireless equipment | 5,502 | | | 4,542 | | | 960 | | | 21.1 | | | | Cost of wireless equipment | 5,673 | | | 4,379 | | | 1,294 | | | 29.6 | | | 17,106 | | | 13,031 | | | 4,075 | | | 31.3 | |
| Selling, general and administrative expense | Selling, general and administrative expense | 7,401 | | | 8,585 | | | (1,184) | | | (13.8) | | | | Selling, general and administrative expense | 6,521 | | | 7,339 | | | (818) | | | (11.1) | | | 21,246 | | | 23,080 | | | (1,834) | | | (7.9) | |
| Depreciation and amortization expense | Depreciation and amortization expense | 4,174 | | | 4,150 | | | 24 | | | 0.6 | | | | Depreciation and amortization expense | 3,961 | | | 4,192 | | | (231) | | | (5.5) | | | 12,155 | | | 12,523 | | | (368) | | | (2.9) | |
| Consolidated Operating Expenses | Consolidated Operating Expenses | $ | 25,097 | | | $ | 25,031 | | | $ | 66 | | | 0.3 | | | | Consolidated Operating Expenses | $ | 24,010 | | | $ | 23,865 | | | $ | 145 | | | 0.6 | | | $ | 74,706 | | | $ | 71,982 | | | $ | 2,724 | | | 3.8 | |
Operating expenses for our segments are discussed separately below under the heading "Segment Results of Operations."
Cost of Services
Cost of services includes the following costs directly attributable to a service: salaries and wages, benefits, materials and supplies, content costs, contracted services, network access and transport costs, customer provisioning costs, computer systems support, costs to support our outsourcing contracts and technical facilities and traffic acquisition costs. Aggregate customer service costs, which include billing and service provisioning, are allocated between Cost of services and Selling, general and administrative expense.
CostThe decrease in cost of services increased during the three months ended March 31,September 30, 2021 compared to the similar period in 2020 was primarily due to:
•a decrease of $119 million in access costs primarily related to a decline in voice services;
•a decrease of $107 million in personnel costs primarily related to the sale of Verizon Media;
•a decrease of $57 million in traffic acquisition costs driven by the impact of one less month of costs from Verizon Media in 2021;
•an increase of $106 million in costsrent expense related to both adding capacity to the networks to support demand and lease modifications for certain existing cell towers including C-Band;
•an increase of $60 million related to the device protection offerings to our wireless retail postpaid customers, as well as increasescustomers; and
•an increase of $32 million in professionalbuildings and facilities costs primarily driven by higher utility rates.
The increase in cost of services during the nine months ended September 30, 2021 compared to the similar period in 2020 was primarily due to:
•an increase of $324 million in traffic acquisition costs regulatory fees as a result of driven by display and search advertising costs related to Verizon Media;
•an increase of $234 million in the Federal Universal Service Fund (FUSF) rate and rent expense as a result ofrelated to both adding capacity to the networks to support demand. These increases were partially offset by demand and lease modifications for certain existing cell towers;
•an increase of $180 million in regulatory fees related to a higher Federal Universal Service Fund (FUSF) rate;
•an increase of $165 million in direct costs related to professional services;
•an increase of $146 million related to the device protection offerings to our wireless retail postpaid customers; and
•a decrease in roaming costs primarily driven by an overall decrease in international travel and a decreaseof $240 million in access costs resulting fromprimarily related to a decline in voice services.
See Note 3 and Note 5 to the condensed consolidated financial statements for additional information on the sale of Verizon Media and lease modifications, respectively.
Cost of Wireless Equipment
Cost of wireless equipment increased during both the three and nine months ended March 31,September 30, 2021 compared to the similar periodperiods in 2020,2020.
The increase during the three months ended September 30, 2021 was primarily due to:
•an increase of $1.3 billion primarily related to a shift to higher priced devicesequipment in the mix of wireless devices sold, and accessories sold.
The increase during the nine months ended September 30, 2021 was primarily due to:
•an increase of $2.8 billion related to a shift to higher priced equipment in the numbermix of wireless devices sold, as well as expenses resulting fromand accessories sold; and
•an increase of $1.2 billion driven by a recall undertaken for certain jetpack units.higher volume of wireless devices sold.
Selling, General and Administrative Expense
Selling, general and administrative expense includes salaries and wages and benefits not directly attributable to a service or product, the provision for credit losses, taxes other than income taxes, advertising and sales commission costs, call center and information technology costs, regulatory fees, professional service fees and rent and utilities for administrative space. Also included is a portion of the aggregate customer care costs as discussed above in "Cost of Services."
Selling, general and administrative expense decreased during both the three and nine months ended March 31,September 30, 2021 compared to the similar periodperiods in 2020.
The decrease during the three months ended September 30, 2021 was primarily due to:
•the $706 million net gain related to the sale of Verizon Media. We recorded a pre-tax gain on sale of approximately $1.1 billion and $346 million of various costs associated with this disposition;
•a decrease in personnel expense of $145 million related to additional sales commission expense related to actions taken in 2020 in response to the COVID-19 pandemic, as well as the impact of one less month of expenses from Verizon Media in 2021; and
•an increase in advertising and promotion costs of $131 million related to brand messaging in 2021 as well as lower expenses in 2020 related to customer behavior during the COVID-19 pandemic.
The decrease during the nine months ended September 30, 2021 was primarily due to:
•the $706 million net gain related to the sale of Verizon Media. We recorded a pre-tax gain on sale of approximately $1.1 billion and $346 million of various costs associated with this disposition;
•the $1.2 billion loss during 2020 resulting from the spectrum license Auction 103, (see "Special Items") and decreases in the provision for credit losses and sales commission expense as a result of actions taken in responsecompared to the COVID-19 pandemic$223 million loss recognized during the three months ended March 31, 2020. The decreases were partially offset by an increase in advertising expense, as well as a loss2021 resulting from agreements we entered into to sell certain wireless licenseslicenses;
•a decrease of $496 million in provision for credit losses related to both improvement in payment trends in 2021 as well as actions taken in 2020 in response to the COVID-19 pandemic;
•a decrease in personnel expense of $374 million primarily related to additional sales commission expense related to actions taken in 2020 in response to the COVID-19 pandemic;
•an increase in advertising and promotion costs of $437 million related to brand messaging in 2021 as well as lower expenses in 2020 related to customer behavior during the three months ended March 31, 2021 (see "Special Items").COVID-19 pandemic; and
•an increase of $231 million in regulatory and compliance expense primarily related to insurance and regulatory settlements.
See Note 3 to the condensed consolidated financial statements for additional information on both the sale of Verizon Media and loss on spectrum licenses.
Depreciation and Amortization Expense
Depreciation and amortization expense increaseddecreased during both the three and nine months ended September 30, 2021, compared to the similar periods in 2020, primarily as a result of certain assets of Verizon Media reclassified as assets held for sale during the three months ended March 31,June 30, 2021 comparedand subsequently derecognized during the three months ended September 30, 2021, both as a result of the Verizon Media sale. See Note 3 to the similar period in 2020, primarily due to the change in the mix of net depreciable assets.condensed consolidated financial statements for additional information.
Other Consolidated Results
Other Income (Expense), Net
Additional information relating to Other income (expense), net is as follows:
| | | Three Months Ended | | | | Three Months Ended | | Nine Months Ended | |
| | | March 31, | | Increase/ | | | | September 30, | | Increase/ | | September 30, | | Increase/ |
| (dollars in millions) | (dollars in millions) | 2021 | | 2020 | | (Decrease) | | | (dollars in millions) | 2021 | | 2020 | | (Decrease) | | 2021 | | 2020 | | (Decrease) |
| Interest income | Interest income | $ | 15 | | | $ | 20 | | | $ | (5) | | | (25.0) | % | | | Interest income | $ | 11 | | | $ | 13 | | | $ | (2) | | | (15.4) | % | | $ | 37 | | | $ | 49 | | | $ | (12) | | | (24.5) | % |
| Other components of net periodic benefit income | Other components of net periodic benefit income | 356 | | | 101 | | | 255 | | | nm | | | Other components of net periodic benefit income | 204 | | | (796) | | | 1,000 | | | nm | | 2,225 | | | (563) | | | 2,788 | | | nm |
| Other, net | Other, net | 30 | | | 22 | | | 8 | | | 36.4 | | | | Other, net | 54 | | | 9 | | | 45 | | | nm | | (1,090) | | | (189) | | | (901) | | | nm |
| Total | Total | $ | 401 | | | $ | 143 | | | $ | 258 | | | nm | | | Total | $ | 269 | | | $ | (774) | | | $ | 1,043 | | | nm | | $ | 1,172 | | | $ | (703) | | | $ | 1,875 | | | nm |
nm - not meaningful
Other income (expense), net, reflects certain items not directly related to our core operations, including interest income, gains and losses from non-operating asset dispositions, debt extinguishment costs, components of net periodic pension and postretirement benefit cost and income and foreign exchange gains and losses. The change in
Other income (expense), net increased during both the three and nine months ended September 30, 2021 compared to the similar periods in 2020.
The increase during the three months ended March 31,September 30, 2021 compared to the similar period in 2020, was primarily attributable to due to:
•a decrease in net pension remeasurement loss of $182$948 million during 2021.
The increase during the nine months ended September 30, 2021 was primarily due to:
•a pension remeasurement gain of $1.2 billion recorded during 2021, compared with a net pension remeasurement loss of $1.4 billion recorded during 2020; and
•an increase of $1.0 billion in 2020 that did not repeat (Seeearly debt redemption costs during 2021.
See "Special Items"), as well as a decrease in interest cost related to our pension and postretirement health care and life insurance plans. See Note 9 to the condensed consolidated financial statements for additionalmore information.
Interest Expense
| | | Three Months Ended | | | | Three Months Ended | | Nine Months Ended | |
| | | March 31, | | Increase/ | | | | September 30, | | Increase/ | | September 30, | | Increase/ |
| (dollars in millions) | (dollars in millions) | 2021 | | 2020 | | (Decrease) | | | (dollars in millions) | 2021 | | 2020 | | (Decrease) | | 2021 | | 2020 | | (Decrease) |
| Total interest costs on debt balances | Total interest costs on debt balances | $ | 1,275 | | | $ | 1,187 | | | $ | 88 | | | 7.4 | % | | | Total interest costs on debt balances | $ | 1,348 | | | $ | 1,192 | | | $ | 156 | | | 13.1 | % | | $ | 4,020 | | | $ | 3,584 | | | $ | 436 | | | 12.2 | % |
| Less capitalized interest costs | Less capitalized interest costs | 174 | | | 153 | | | 21 | | | 13.7 | | | | Less capitalized interest costs | 547 | | | 148 | | | 399 | | | nm | | 1,274 | | | 417 | | | 857 | | | nm |
| Total | Total | $ | 1,101 | | | $ | 1,034 | | | $ | 67 | | | 6.5 | | | | Total | $ | 801 | | | $ | 1,044 | | | $ | (243) | | | (23.3) | | | $ | 2,746 | | | $ | 3,167 | | | $ | (421) | | | (13.3) | |
| Average debt outstanding (1) (3) | Average debt outstanding (1) (3) | $ | 135,967 | | | $ | 113,357 | | | | Average debt outstanding (1) (3) | $ | 151,347 | | | $ | 113,774 | | | $ | 145,984 | | | $ | 114,690 | | |
Effective interest rate (2) (3) | Effective interest rate (2) (3) | 3.8 | % | | 4.2 | % | | | Effective interest rate (2) (3) | 3.6 | % | | 4.2 | % | | 3.7 | % | | 4.2 | % | |
(1)The average debt outstanding is a financial measure and is calculated by applying a simple average of prior months end balances of total short-term and long-term debt, net of discounts, premiums and unamortized debt issuance costs.
(2)The effective interest rate is the rate of actual interest incurred on debt. It is calculated by dividing the total interest costs on debt balances by the average debt outstanding.
(3)We believe that this measure is useful to management, investors and other users of our financial information in evaluating our debt financing cost and trends in our debt leverage management.
nm - not meaningful
Total interest expense increaseddecreased during both the three and nine months ended March 31,September 30, 2021 compared to the similar periodperiods in 2020, primarily due toto:
•an increase in interest costs on debt balances as a result of higher average debt balances, partially offset by lower average interest rates as a result of our continuing focus on optimizing our debt footprint and highertotal borrowing costs; and
•an increase in capitalized interest costs. costs as a result of C-Band licenses won.
See Note 4 and Note 6 to the condensed consolidated financial statements for additional information.information on spectrum licenses and debt transactions, respectively.
Provision for Income Taxes
| | | Three Months Ended | | | | | | Three Months Ended | | | | Nine Months Ended | | |
| | | March 31, | | Increase/ | | | | September 30, | | Increase/ | | September 30, | | Increase/ |
| (dollars in millions) | (dollars in millions) | 2021 | | 2020 | | (Decrease) | | | (dollars in millions) | 2021 | | 2020 | | (Decrease) | | 2021 | | 2020 | | (Decrease) |
| Provision for income taxes | Provision for income taxes | $ | 1,700 | | | $ | 1,389 | | | $ | 311 | | | 22.4 | % | | | Provision for income taxes | $ | 1,820 | | | $ | 1,347 | | | $ | 473 | | | 35.1 | % | | $ | 5,395 | | | $ | 4,084 | | | $ | 1,311 | | | 32.1 | % |
| Effective income tax rate | Effective income tax rate | 24.0 | % | | 24.5 | % | | | Effective income tax rate | 21.7 | % | | 23.0 | % | | 23.2 | % | | 23.1 | % | |
The effective income tax rate is calculated by dividing the provision for income taxes by income before the provision for income taxes. The decrease in the effective income tax rate for the three months ended March 31, 2021 compared to the similar period in 2020, was primarily due to higher tax benefits resulting from the favorable resolution of various income tax matters in the current period. The increase in the provision for income taxes during the three months ended March 31,September 30, 2021 compared to the similar period in 2020 was primarily due to the impactsale of Verizon Media in the current period. The effective income tax rate for the nine months ended September 30, 2021 was comparable to the similar period in 2020. The increase in the provision for income taxes during both the three and nine months ended September 30, 2021 compared to the similar periods in 2020 was primarily due to the increase in income before income taxes in the current period.
Unrecognized Tax Benefits
Unrecognized tax benefits were $2.8$2.7 billion and $2.9 billion at March 31,September 30, 2021 and December 31, 2020, respectively. Interest and penalties related to unrecognized tax benefits were $345 million (after-tax) and $388 million (after-tax) at March 31,September 30, 2021 and December 31, 2020, respectively.
Verizon and/or its subsidiaries file income tax returns in the U.S. federal jurisdiction, and various state, local and foreign jurisdictions. As a large taxpayer, we are under audit by the Internal Revenue Service and multiple state and foreign jurisdictions for various open tax years. It is reasonably possible that the amount of the liability for unrecognized tax benefits could change by a significant amount in the next twelve months. An estimate of the range of the possible change cannot be made until these tax matters are further developed or resolved.
Consolidated Net Income, Consolidated EBITDA and Consolidated Adjusted EBITDA
Consolidated earnings before interest, taxes, depreciation and amortization expenses (Consolidated EBITDA) and Consolidated Adjusted EBITDA, which are presented below, are non-generally accepted accounting principles (GAAP) measures that we believe are useful to management, investors and other users of our financial information in evaluating operating profitability on a more variable cost basis as they exclude the depreciation and amortization expense related primarily to capital expenditures and acquisitions that occurred in prior years, as well as in evaluating operating performance in relation to Verizon’s competitors. Consolidated EBITDA is calculated by adding back interest, taxes, depreciation and amortization expenses to net income.
Consolidated Adjusted EBITDA is calculated by excluding from Consolidated EBITDA the effect of the following non-operational items: equity in losses of unconsolidated businesses and other income and expense, net, as well as the effect of special items. We believe that this measure is useful to management, investors and other users of our financial information in evaluating the effectiveness of our operations and underlying business trends in a manner that is consistent with management’s evaluation of business performance. We believe that Consolidated Adjusted EBITDA is widely used by investors to compare a company’s operating performance to its competitors by minimizing impacts caused by differences in capital structure, taxes, and depreciation and amortization policies. Further, the exclusion of non-operational items and special items enables comparability to prior period performance and trend analysis. See "Special Items" for additional information.
It is management’s intent to provide non-GAAP financial information to enhance the understanding of Verizon’s GAAP financial information, and it should be considered by the reader in addition to, but not instead of, the financial statements prepared in accordance with GAAP. Each non-GAAP financial measure is presented along with the corresponding GAAP measure so as not to imply that more emphasis should be placed on the non-GAAP measure. We believe that providing these non-GAAP measures in addition to the GAAP measures allows management, investors and other users of our financial information to more fully and accurately assess both consolidated and segment performance. The non-GAAP financial information presented may be determined or calculated differently by other companies and may not be directly comparable to that of other companies.
| | | | Three Months Ended | | | Three Months Ended | | Nine Months Ended |
| | March 31, | | | September 30, | | September 30, |
| (dollars in millions) | (dollars in millions) | 2021 | | 2020 | | (dollars in millions) | 2021 | | 2020 | | 2021 | | 2020 |
| Consolidated Net Income | Consolidated Net Income | $ | 5,378 | | | $ | 4,287 | | | Consolidated Net Income | $ | 6,554 | | | $ | 4,504 | | | $ | 17,881 | | | $ | 13,630 | |
| Add: | Add: | | | Add: | |
| Provision for income taxes | Provision for income taxes | 1,700 | | | 1,389 | | | Provision for income taxes | 1,820 | | | 1,347 | | | 5,395 | | | 4,084 | |
Interest expense | Interest expense | 1,101 | | | 1,034 | | | Interest expense | 801 | | | 1,044 | | | 2,746 | | | 3,167 | |
| Depreciation and amortization expense | Depreciation and amortization expense | 4,174 | | | 4,150 | | | Depreciation and amortization expense | 3,961 | | | 4,192 | | | 12,155 | | | 12,523 | |
| Consolidated EBITDA | Consolidated EBITDA | $ | 12,353 | | | $ | 10,860 | | | Consolidated EBITDA | $ | 13,136 | | | $ | 11,087 | | | $ | 38,177 | | | $ | 33,404 | |
| | Add (Less): | Add (Less): | | | Add (Less): | |
Other income, net (1) | $ | (401) | | | $ | (143) | | | |
| Equity in earnings (losses) of unconsolidated businesses | (8) | | | 12 | | | |
Other (income) expense, net (2) | | Other (income) expense, net (2) | $ | (269) | | | $ | 774 | | | $ | (1,172) | | | $ | 703 | |
| Equity in losses (earnings) of unconsolidated businesses | | Equity in losses (earnings) of unconsolidated businesses | (1) | | | 9 | | | (10) | | | 34 | |
| Loss on spectrum licenses | Loss on spectrum licenses | 223 | | | 1,195 | | | Loss on spectrum licenses | — | | | — | | | 223 | | | 1,195 | |
| | Severance charges | | Severance charges | 103 | | | — | | | 103 | | | — | |
| | Net gain from sale of Media | | Net gain from sale of Media | (706) | | | — | | | (706) | | | — | |
| Consolidated Adjusted EBITDA | Consolidated Adjusted EBITDA | $ | 12,167 | | | $ | 11,924 | | | Consolidated Adjusted EBITDA | $ | 12,263 | | | $ | 11,870 | | | $ | 36,615 | | | $ | 35,336 | |
(1) Includes Early debt redemption costs, where applicable. See "Special Items" for additional information.
(2) Includes Pension and benefits mark-to-market adjustments and Early debt redemption costs, where applicable. See "Special Items" for additional information.
The changes in Consolidated Net Income, Consolidated EBITDA and Consolidated Adjusted EBITDA in the table above during the three and nine months ended March 31,September 30, 2021, compared to the similar periodperiods in 2020, were primarily a result of the factors described in connection with operating revenues and operating expenses.
| | |
| Segment Results of Operations |
We have threetwo reportable segments that we operate and manage as strategic business units Consumer, Business and Media, of which- Consumer and Business are our reportable segments.Business. We measure and evaluate our segments based on segment operating income. The use of segment operating income is consistent with the chief operating decision maker’s assessment of segment performance.
To aid in the understanding of segment performance as it relates to segment operating income, management uses the following operating statistics to evaluate the overall effectiveness of our segments. We believe these operating statistics are useful to investors and other users of our financial information because they provide additional insight into drivers of our segments’ operating results, key trends and performance relative to our peers. These operating statistics may be determined or calculated differently by other companies and may not be directly comparable to those statistics of other companies.
Wireless retail connections are retail customer device postpaid and prepaid connections as of the end of the period. Retail connections under an account may include those from smartphones and basic phones (collectively, phones), as well as tablets and other internet devices,
including wearables and retail IoT devices. Wireless retail connections are calculated by adding total retail postpaid and prepaid new connections in the period to prior period retail connections, and subtracting total retail postpaid and prepaid disconnects in the period.
Wireless retail postpaid connections are retail postpaid customer device connections as of the end of the period. Retail connections under an account may include those from phones, as well as tablets and other internet devices, including wearables and retail IoT devices. Wireless retail postpaid connections are calculated by adding retail postpaid new connections in the period to prior period retail postpaid connections, and subtracting retail postpaid disconnects in the period.
Fios internet connections are the total number of connections to the internet using Fios internet services as of the end of the period. Fios internet connections are calculated by adding Fios internet new connections in the period to prior period Fios internet connections, and subtracting Fios internet disconnects in the period.
Fios video connections are the total number of connections to traditional linear video programming using Fios video services as of the end of the period. Fios video connections are calculated by adding Fios video net additions in the period to prior period Fios video connections. Fios video net additions are calculated by subtracting the Fios video disconnects from the Fios video new connections.
BroadbandWireline broadband connections are the total number of connections to the internet using Digital Subscriber Line (DSL) and Fios internet services as of the end of the period. BroadbandWireline broadband connections are calculated by adding wireline broadband net additions in the period to prior period wireline broadband connections. BroadbandWireline broadband net additions are calculated by subtracting the wireline broadband disconnects from the wireline broadband new connections.
Wireless retail connections, net additions are the total number of additional retail customer device postpaid and prepaid connections, less the number of device disconnects in the period. Wireless retail connections, net additions in each period presented are calculated by subtracting the total retail postpaid and prepaid disconnects, net of certain adjustments, from the total retail postpaid and prepaid new connections in the period.
Wireless retail postpaid connections, net additions are the total number of additional retail customer device postpaid connections, less the number of device disconnects in the period. Wireless retail postpaid connections, net additions in each period presented are calculated by subtracting the retail postpaid disconnects, net of certain adjustments, from the retail postpaid new connections in the period.
Wireless retail postpaid phone connections, net additions are the total number of additional retail customer postpaid phone connections, less the number of phone disconnects in the period. Wireless retail postpaid phone connections, net additions in each period presented are calculated by subtracting the retail postpaid phone disconnects, net of certain adjustments, from the retail postpaid phone new connections in the period.
Wireless Churn is the rate at which service to retail, retail postpaid, or retail postpaid phone connections is terminated on average in the period. The churn rate in each period presented is calculated by dividing retail disconnections, retail postpaid disconnections, or retail postpaid phone disconnections by the average retail connections, average retail postpaid connections, or average retail postpaid phone connections, respectively, in the period.
Wireless retail postpaid ARPA is the calculated average retail postpaid service revenue per account (ARPA) from retail postpaid accounts in the period. Wireless retail postpaid service revenue does not include recurring device payment plan billings related to the Verizon device payment program, plan billings related to Total Mobile Protection packagesdevice warranty and insurance or regulatory fees. Wireless retail postpaid ARPA in each period presented is calculated by dividing retail postpaid service revenue by the average retail postpaid accounts in the period.
Wireless retail postpaid accounts are wireless retail customers that are directly served and managed under the Verizon brand and use its services as of the end of the period. Accounts include unlimited plans, shared data plans and corporate accounts, as well as legacy single connection plans and multi-connection family plans. A single account may include monthly wireless services for a variety of connected devices. Wireless retail postpaid accounts are calculated by adding retail postpaid new accounts to the prior period retail postpaid accounts.
Wireless retail postpaid connections per account is the calculated average number of retail postpaid connections per retail postpaid account as of the end of the period. Wireless retail postpaid connections per account is calculated by dividing the total number of retail postpaid connections by the number of retail postpaid accounts as of the end of the period.
Segment operating income margin reflects the profitability of the segment as a percentage of revenue. Segment operating income margin is calculated by dividing total segment operating income by total segment operating revenues.
Segment earnings before interest, taxes, depreciation and amortization (Segment EBITDA), which is presented below, is a non-GAAP measure and does not purport to be an alternative to operating income (loss) as a measure of operating performance. We believe this measure is useful to management, investors and other users of our financial information in evaluating operating profitability on a more variable cost basis as it excludes the depreciation and amortization expenses related primarily to capital expenditures and acquisitions that occurred in prior years, as well as in evaluating operating performance in relation to our competitors. Segment EBITDA is calculated by adding back depreciation and amortization expense to segment operating income (loss). Segment EBITDA margin is calculated by dividing Segment
EBITDA by total segment operating revenues. You can find additional information about our segments in Note 11 to the condensed consolidated financial statements.
Verizon Consumer Group
Our Consumer segment provides consumer-focused wireless and wireline communications services and products. Our wireless services are provided across one of the most extensive wireless networks in the U.S. under the Verizon brand and through wholesale and other arrangements. Our wireline services are provided in nine states in the Mid-Atlantic and Northeastern U.S., as well as Washington D.C., over our 100% fiber-optic network through our Verizon Fios product portfolio and over a traditional copper-based network to customers who are not served by Fios.
Operating Revenues and Selected Operating Statistics
| | | | Three Months Ended | | | | Three Months Ended | | | | Nine Months Ended | | |
| | | March 31, | | Increase/ | | September 30, | | Increase/ | | September 30, | | Increase/ |
| (dollars in millions, except ARPA) | (dollars in millions, except ARPA) | | 2021 | | 2020 | | (Decrease) | (dollars in millions, except ARPA) | 2021 | | 2020 | | (Decrease) | | 2021 | | 2020 | | (Decrease) |
| Service | Service | | $ | 16,569 | | $ | 16,341 | | $ | 228 | | | 1.4% | Service | $ | 16,891 | | $ | 16,255 | | $ | 636 | | | 3.9% | | $ | 50,169 | | $ | 48,496 | | $ | 1,673 | | | 3.4% |
| Wireless equipment | Wireless equipment | | 4,192 | | 3,377 | | 815 | | | 24.1 | Wireless equipment | 4,530 | | 3,403 | | 1,127 | | | 33.1 | | 13,461 | | 9,989 | | 3,472 | | | 34.8 |
| Other | Other | | 2,037 | | 2,047 | | (10) | | | (0.5) | Other | 1,907 | | 2,078 | | (171) | | | (8.2) | | 5,973 | | 6,129 | | (156) | | | (2.5) |
| Total Operating Revenues | Total Operating Revenues | | $ | 22,798 | | $ | 21,765 | | $ | 1,033 | | | 4.7 | Total Operating Revenues | $ | 23,328 | | $ | 21,736 | | $ | 1,592 | | | 7.3 | | $ | 69,603 | | $ | 64,614 | | $ | 4,989 | | | 7.7 |
| Connections (‘000):(1) | Connections (‘000):(1) | | | Connections (‘000):(1) | |
| Wireless retail connections | Wireless retail connections | | 94,230 | | 93,894 | | 336 | | | 0.4 | Wireless retail connections | | 94,988 | | 94,101 | | 887 | | | 0.9 |
| Wireless retail postpaid connections | Wireless retail postpaid connections | | 90,172 | | 89,914 | | 258 | | | 0.3 | Wireless retail postpaid connections | | 90,916 | | 90,026 | | 890 | | | 1.0 |
| Fios internet connections | Fios internet connections | | 6,300 | | 5,961 | | 339 | | | 5.7 | Fios internet connections | | 6,490 | | 6,110 | | 380 | | | 6.2 |
| Fios video connections | Fios video connections | | 3,772 | | 4,068 | | (296) | | | (7.3) | Fios video connections | | 3,642 | | 3,926 | | (284) | | | (7.2) |
| Broadband connections | | 6,713 | | 6,481 | | 232 | | | 3.6 | |
| Wireline broadband connections | | Wireline broadband connections | | 6,858 | | 6,581 | | 277 | | | 4.2 |
| | | Net Additions in Period (‘000):(2) | Net Additions in Period (‘000):(2) | | | Net Additions in Period (‘000):(2) | |
| Wireless retail | Wireless retail | | (307) | | (609) | | 302 | | | 49.6 | Wireless retail | 419 | | | 213 | | | 206 | | | 96.7 | | 480 | | (312) | | 792 | | | nm |
| Wireless retail postpaid | Wireless retail postpaid | | (326) | | (525) | | 199 | | | 37.9 | Wireless retail postpaid | 423 | | | 136 | | | 287 | | | nm | | 447 | | (317) | | 764 | | | nm |
| Wireless retail postpaid phones | Wireless retail postpaid phones | | (225) | | (307) | | 82 | | | 26.7 | Wireless retail postpaid phones | 267 | | | 142 | | | 125 | | | 88.0 | | 239 | | (68) | | 307 | | | nm |
| | Churn Rate: | Churn Rate: | | | Churn Rate: | |
| Wireless retail | Wireless retail | | 1.11% | | 1.20% | | Wireless retail | 0.98 | % | | 0.95 | % | | 1.02 | % | | 1.00 | % | |
| Wireless retail postpaid | Wireless retail postpaid | | 0.97% | | 1.01% | | Wireless retail postpaid | 0.84 | % | | 0.80 | % | | 0.88 | % | | 0.84 | % | |
| Wireless retail postpaid phones | Wireless retail postpaid phones | | 0.77% | | 0.77% | | Wireless retail postpaid phones | 0.67 | % | | 0.63 | % | | 0.69 | % | | 0.64 | % | |
| | Account Statistics: | Account Statistics: | | | Account Statistics: | |
| Wireless retail postpaid ARPA | Wireless retail postpaid ARPA | | $ | 120.86 | | $ | 118.86 | | $ | 2.00 | | | 1.7 | Wireless retail postpaid ARPA | $ | 123.04 | | $ | 118.52 | | $ | 4.52 | | 3.8 | | $ | 121.71 | | $ | 117.80 | | $ | 3.91 | | | 3.3 |
| Wireless retail postpaid accounts (‘000) (1) | Wireless retail postpaid accounts (‘000) (1) | | 33,588 | | 33,669 | | (81) | | | (0.2) | Wireless retail postpaid accounts (‘000) (1) | | 33,640 | | 33,712 | | (72) | | | (0.2) |
Wireless retail postpaid connections per account (1) | Wireless retail postpaid connections per account (1) | | 2.68 | | 2.67 | | 0.01 | | | 0.4 | Wireless retail postpaid connections per account (1) | | 2.70 | | 2.67 | | 0.03 | | | 1.1 |
|
(1)As of end of period
(2)Includes certain adjustments
nm - not meaningful
Consumer’s total operating revenues increased during both the three and nine months ended March 31,September 30, 2021 compared to the similar periodperiods in 2020 as a result of increases in Service and Wireless equipment, partially offset by a decrease in Other revenues.
Service Revenue
Service revenue increased during both the three and nine months ended March 31,September 30, 2021 compared to the similar periodperiods in 2020. This increase wasThese increases were primarily driven by an increaseincreases in wireless and Fios service revenues.
Wireless service revenue increased $208$540 million or 1.5%, during the three months ended March 31,September 30, 2021 compared to the similar period in 2020. This increaseand was primarily due to:
•an increase of $365 million in access revenues related to our postpaid plans driven by additional subscribers and migrations to higher priced plans, as well as growth from reseller accounts, growth inrelated to content offerings, cloud services and mobile security products included in certain protection packages,packages;
•an increase of $112 million related to growth in revenuesnon-retail service revenue primarily driven by reseller accounts; and
•an increase of $64 million related to content offeringsa gradual recovery in TravelPass revenue in 2021 compared to 2020, primarily as a result of customer behavior during the COVID-19 pandemic.
Wireless service revenue increased $1.5 billion during the nine months ended September 30, 2021 and growthwas primarily due to:
•an increase of $917 million in access revenues related to our postpaid plans. These increases were partially offset by a decrease in TravelPass revenuesplans driven by a continued decreaseadditional subscribers and migrations to higher priced plans as well as growth related to content offerings, cloud services and mobile security products included in international travel duecertain protection packages; and
•an increase of $355 million related to the COVID-19 pandemic.growth in non-retail service revenue primarily driven by reseller accounts.
For the three months ended March 31,September 30, 2021, Fios service revenue totaled $2.7 billion, and increased $47representing an increase of $121 million or 1.8%, compared to the similar period in 2020. This2020 primarily resulting from an increase was duein Fios internet connections, reflecting increased demand for higher broadband speeds, partially offset by a decrease in Fios voice revenues.
For the nine months ended September 30, 2021, Fios service revenue totaled $8.1 billion, representing an increase of $292 million compared to the similar period in 2020, primarily resulting from an increase in Fios internet connections, reflecting increased demand for higher broadband speeds, partially offset by a decrease in Fios video revenues, reflecting the ongoing shift from traditional linear video to over-the-top offerings and decreasesa decrease in Fios voice revenues.
Wireless Equipment Revenue
Wireless equipment revenue increased during both the three and nine months ended March 31,September 30, 2021 compared to the similar periodperiods in 2020,2020.
The increase during the three months ended September 30, 2021 was primarily due to to:
•an increase in the number of wireless devices sold and$740 million related to a shift to higher priced devicesequipment in the mix of wireless devices and accessories sold; and
•an increase of $387 million driven by a higher volume of wireless devices and accessories sold, partially offset by related promotions.
The increase during the nine months ended September 30, 2021 was primarily due to:
•an increase of $2.0 billion related to a shift to higher priced equipment in the mix of wireless devices and accessories sold; and
•an increase of $1.5 billion driven by a higher volume of wireless devices and accessories sold, partially offset by related promotions.
Other Revenue
Other revenue includes non-service revenues such as regulatory fees, cost recovery surcharges, revenues associated with certain products included in our device protection offerings, leasing and interest on equipment financed under a device payment plan agreement when sold to the customer by an authorized agent.
Other revenue decreased during both the three and nine months ended September 30, 2021 compared to the similar periods in 2020.
The decrease during the three months ended September 30, 2021 was primarily due to:
•a decrease of $160 million that resulted from an update to our device protection offering which increased the price of the bundled offering and changed the product mix within the offering such that a smaller amount of the overall device protection revenue is recognized in Other revenue.
The decrease during the nine months ended September 30, 2021 was primarily due to:
•a decrease of $262 million that resulted from an update to our device protection offering which increased the price of the bundled offering and changed the product mix within the offering such that a smaller amount of the overall device protection revenue is recognized in Other revenue; and
•an increase of $120 million related to cost recovery surcharges.
Operating Expenses
| | | Three Months Ended | | | | | Three Months Ended | | | | Nine Months Ended | | |
| | | March 31, | | Increase/ | | | September 30, | | Increase/ | | September 30, | | Increase/ |
| (dollars in millions) | (dollars in millions) | 2021 | | 2020 | | (Decrease) | | (dollars in millions) | 2021 | | 2020 | | (Decrease) | | 2021 | | 2020 | | (Decrease) |
| Cost of services | Cost of services | $ | 4,000 | | | $ | 3,930 | | | $ | 70 | | | 1.8 | % | | Cost of services | $ | 4,149 | | | $ | 3,971 | | | $ | 178 | | | 4.5 | % | | $ | 12,330 | | | $ | 11,786 | | | $ | 544 | | | 4.6 | % |
| Cost of wireless equipment | Cost of wireless equipment | 4,392 | | | 3,451 | | | 941 | | | 27.3 | | | Cost of wireless equipment | 4,611 | | | 3,411 | | | 1,200 | | | 35.2 | | | 13,857 | | | 10,161 | | | 3,696 | | | 36.4 | |
| Selling, general and administrative expense | Selling, general and administrative expense | 4,026 | | | 4,282 | | | (256) | | | (6.0) | | | Selling, general and administrative expense | 4,060 | | | 4,055 | | | 5 | | | 0.1 | | | 12,131 | | | 12,353 | | | (222) | | | (1.8) | |
| Depreciation and amortization expense | Depreciation and amortization expense | 2,861 | | | 2,820 | | | 41 | | | 1.5 | | | Depreciation and amortization expense | 2,918 | | | 2,862 | | | 56 | | | 2.0 | | | 8,679 | | | 8,531 | | | 148 | | | 1.7 | |
| Total Operating Expenses | Total Operating Expenses | $ | 15,279 | | | $ | 14,483 | | | $ | 796 | | | 5.5 | | | Total Operating Expenses | $ | 15,738 | | | $ | 14,299 | | | $ | 1,439 | | | 10.1 | | | $ | 46,997 | | | $ | 42,831 | | | $ | 4,166 | | | 9.7 | |
Cost of Services
Cost of services increased during both the three and nine months ended March 31,September 30, 2021 compared to the similar periodperiods in 2020. This
The increase during the three months ended September 30, 2021 was primarily due to:
•an increase in rent expense of $95 million related to increases in costsadding capacity to the networks to support demand and lease modifications for certain existing cell towers;
•an increase of $57 million related to the device protection offerings to our wireless retail postpaid customers,customers; and
•an increase in digital content costs of $28 million driven by additional streaming service subscriptions, partially offset by a decline in traditional linear content costs.
The increase during the nine months ended September 30, 2021 was primarily due to:
•an increase in rent expense as a result of $218 million related to adding capacity to the networks to support demand and personnel costs. Thislease modifications for certain existing cell towers;
•an increase wasof $139 million related to the device protection offerings to our wireless retail postpaid customers;
•an increase in digital content costs of $76 million driven by additional streaming service subscriptions, partially offset by a decreasedecline in roaming costs primarily driven bytraditional linear content costs; and
•an increase in regulatory fees of $73 million related to a continued decrease in international travel duehigher FUSF rate.
See Note 5 to the COVID-19 pandemic.condensed consolidated financial statements for additional information on related lease modifications.
Cost of Wireless Equipment
Cost of wireless equipment increased during both the three and nine months ended March 31,September 30, 2021 compared to the similar periodperiods in 2020,2020.
The increase during the three months ended September 30, 2021 was primarily due to to:
•an increase in the number of wireless devices sold,$640 million related to a shift to higher priced devicesequipment in the mix of wireless devices sold and accessories sold; and
•an increase of $571 million driven by a higher volume of wireless devices and accessories sold.
The increase during the nine months ended September 30, 2021 was primarily due to:
•an increase of $1.9 billion driven by a higher volume of wireless devices and accessories sold; and
•an increase of $1.7 billion related to a shift to higher priced equipment in expenses as a resultthe mix of a recall undertaken for certain jetpack units.wireless devices and accessories sold.
Selling, General and Administrative Expense
Selling,The change in selling, general and administrative expense decreased during the three months ended March 31,September 30, 2021 compared to the similar period in 2020. This decrease2020 was primarily due to:
•an increase in advertising expenses of $120 million related to decreasesbrand messaging in 2021 as well as lower expenses in 2020 related to customer behavior during the COVID-19 pandemic; and
•a decrease in provision for credit losses and sales commission expenseof $104 million related to both improvement in payment trends in 2021 as a result ofwell as actions taken in 2020 in response to the COVID-19 pandemic, partially offset by pandemic.
The decrease in selling, general and administrative expense during the nine months ended September 30, 2021 compared to the similar period in 2020 was primarily due to:
•a decrease in provision for credit losses of $478 million related to both improvement in payment trends in 2021 as well as actions taken in 2020 in response to the COVID-19 pandemic;
•a decrease in personnel expense of $245 million primarily related to additional sales commission expense related to actions taken in 2020 in response to the COVID-19 pandemic;
•an increase in advertising expense.expenses of $386 million related to brand messaging in 2021 as well as lower expenses in 2020 related to customer behavior during the COVID-19 pandemic; and
•an increase in building and facilities of $102 million primarily related to a change in utility rates.
Depreciation and Amortization Expense
Depreciation and amortization expense increased during both the three and nine months ended March 31,September 30, 2021, compared to the similar periodperiods in 2020, driven by the change in the mix of total Verizon depreciable assets and Consumer's usage of those assets.
Segment Operating Income and EBITDA
| | | Three Months Ended | | | | | Three Months Ended | | | | Nine Months Ended | | |
| | | March 31, | | Increase/ | | | September 30, | | Increase/ | | September 30, | | Increase/ |
| (dollars in millions) | (dollars in millions) | 2021 | | 2020 | | (Decrease) | | (dollars in millions) | 2021 | | 2020 | | (Decrease) | | 2021 | | 2020 | | (Decrease) |
| Segment Operating Income | Segment Operating Income | $ | 7,519 | | | $ | 7,282 | | | $ | 237 | | | 3.3 | % | | Segment Operating Income | $ | 7,590 | | | $ | 7,437 | | | $ | 153 | | | 2.1 | % | | $ | 22,606 | | | $ | 21,783 | | | $ | 823 | | | 3.8 | % |
| Add Depreciation and amortization expense | Add Depreciation and amortization expense | 2,861 | | | 2,820 | | | 41 | | | 1.5 | | | Add Depreciation and amortization expense | 2,918 | | | 2,862 | | | 56 | | | 2.0 | | | 8,679 | | | 8,531 | | | 148 | | | 1.7 | |
| Segment EBITDA | Segment EBITDA | $ | 10,380 | | | $ | 10,102 | | | $ | 278 | | | 2.8 | | | Segment EBITDA | $ | 10,508 | | | $ | 10,299 | | | $ | 209 | | | 2.0 | | | $ | 31,285 | | | $ | 30,314 | | | $ | 971 | | | 3.2 | |
| | Segment operating income margin | Segment operating income margin | 33.0 | % | | 33.5 | % | | | | Segment operating income margin | 32.5 | % | | 34.2 | % | | | 32.5 | % | | 33.7 | % | | |
| Segment EBITDA margin | Segment EBITDA margin | 45.5 | % | | 46.4 | % | | | Segment EBITDA margin | 45.0 | % | | 47.4 | % | | 44.9 | % | | 46.9 | % | |
The changes in the table above during the three and nine months ended March 31,September 30, 2021, compared to the similar periodperiods in 2020, were primarily a result of the factors described in connection with operating revenues and operating expenses.
Verizon Business Group
Our Business segment provides wireless and wireline communications services and products, including data, video and conferencing services, corporate networking solutions, security and managed network services, local and long distance voice services and network access to deliver various IoT services and products. We provide these products and services to businesses, government customers and wireless and wireline carriers across the U.S. and select products and services to customers around the world. The Business segment is organized in four customer groups: Small and Medium Business, Global Enterprise, Public Sector and Other, and Wholesale.
Operating Revenues and Selected Operating Statistics
| | | | | Three Months Ended | | | Three Months Ended | | Nine Months Ended | |
| | | | | March 31, | | Increase/ | | September 30, | | Increase/ | | September 30, | | Increase/ |
| (dollars in millions) | (dollars in millions) | | | 2021 | | 2020 | | (Decrease) | (dollars in millions) | 2021 | | 2020 | | (Decrease) | | 2021 | | 2020 | | (Decrease) |
| Small and Medium Business | Small and Medium Business | | | $ | 2,830 | | $ | 2,804 | | $ | 26 | | | 0.9 | % | Small and Medium Business | $ | 2,937 | | | $ | 2,742 | | | $ | 195 | | | 7.1 | % | | $ | 8,662 | | $ | 8,147 | | $ | 515 | | | 6.3 | % |
| Global Enterprise | Global Enterprise | | | 2,559 | | 2,631 | | (72) | | | (2.7) | | Global Enterprise | 2,552 | | | 2,595 | | | (43) | | | (1.7) | | | 7,694 | | 7,815 | | (121) | | | (1.5) | |
| | Public Sector and Other | Public Sector and Other | | | 1,646 | | 1,474 | | 172 | | | 11.7 | | Public Sector and Other | 1,547 | | | 1,639 | | | (92) | | | (5.6) | | | 4,807 | | 4,636 | | 171 | | | 3.7 | |
| Wholesale | Wholesale | | | 746 | | 772 | | (26) | | | (3.4) | | Wholesale | 653 | | | 773 | | | (120) | | | (15.5) | | | 2,069 | | 2,314 | | (245) | | | (10.6) | |
Total Operating Revenues(1) | Total Operating Revenues(1) | | | $ | 7,781 | | $ | 7,681 | | $ | 100 | | | 1.3 | | Total Operating Revenues(1) | $ | 7,689 | | | $ | 7,749 | | | $ | (60) | | | (0.8) | | | $ | 23,232 | | $ | 22,912 | | $ | 320 | | | 1.4 | |
| Connections (‘000):(2) | Connections (‘000):(2) | | | Connections (‘000):(2) | |
| Wireless retail postpaid connections | Wireless retail postpaid connections | | | 26,621 | | 25,658 | | 963 | | | 3.8 | | Wireless retail postpaid connections | | 26,998 | | 26,223 | | 775 | | | 3.0 | |
| Fios internet connections | Fios internet connections | | | 339 | | 330 | | 9 | | | 2.7 | | Fios internet connections | | 352 | | 332 | | 20 | | | 6.0 | |
| Fios video connections | Fios video connections | | | 73 | | 77 | | (4) | | | (5.2) | | Fios video connections | | 72 | | 74 | | (2) | | | (2.7) | |
| Broadband connections | | | 480 | | 501 | | (21) | | | (4.2) | | |
| Wireline broadband connections | | Wireline broadband connections | | 479 | | 488 | | (9) | | | (1.8) | |
| | | Net Additions in Period (‘000):(3) | Net Additions in Period (‘000):(3) | | | Net Additions in Period (‘000):(3) | |
| Wireless retail postpaid | Wireless retail postpaid | | | 156 | | 475 | | (319) | | | (67.2) | | Wireless retail postpaid | 276 | | | 417 | | | (141) | | | (33.8) | | | 610 | | 1,172 | | (562) | | | (48.0) | |
| Wireless retail postpaid phones | Wireless retail postpaid phones | | | 47 | | 239 | | (192) | | | (80.3) | | Wireless retail postpaid phones | 162 | | | 141 | | | 21 | | | 14.9 | | | 287 | | 456 | | (169) | | | (37.1) | |
| | Churn Rate: | Churn Rate: | | | Churn Rate: | |
| Wireless retail postpaid | Wireless retail postpaid | | | 1.24% | | 1.30% | | Wireless retail postpaid | 1.29 | % | | 1.19 | % | | 1.28% | | 1.20% | |
| Wireless retail postpaid phones | Wireless retail postpaid phones | | | 1.01% | | 1.02% | | Wireless retail postpaid phones | 1.04 | % | | 0.96 | % | | 1.04% | | 0.96% | |
|
(1)Service and other revenues included in our Business segment amounted to approximately $7.0$6.9 billion and $6.9$7.0 billion for the three months ended March 31,September 30, 2021 and 2020, respectively. Service and other revenues included in our Business segment amounted to approximately $20.9 billion for both the nine months ended September 30, 2021 and 2020. Wireless equipment revenues included in our Business segment amounted to approximately $820 million and $709 million for the three months ended September 30, 2021 and 2020, respectively. Wireless equipment revenues included in our Business segment amounted to $752 millionapproximately $2.4 billion and $2.0 billion for both the threenine months ended March 31,September 30, 2021 and 2020.2020, respectively
(2)As of end of period
(3)Includes certain adjustments
Business’s total operating revenues decreased and increased during the three and nine months ended September 30, 2021, respectively, compared to the similar periods in 2020. The decrease during the three months ended March 31,September 30, 2021 compared towas a result of decreases in Wholesale, Public Sector and Other and Global Enterprise revenues, partially offset by an increase in Small and Medium Business revenues. The increase during the similar period in 2020. This is primarily asnine months ended September 30, 2021 was a result of increases in Public Sector and Other and Small and Medium Business revenues,and Public Sector and Other, partially offset by decreases in Wholesale and Global Enterprise and Wholesale revenues.
Small and Medium Business
Small and Medium Business offers wireless services and equipment, conferencing services, tailored voice and networking products, Fios services, Internet Protocol networking, advanced voice solutions and security and managed information technology services to our U.S.-based small and medium businesses that do not meet the requirements to be categorized as Global Enterprise, as described below.
Small and Medium Business revenues increased during both the three and nine months ended March 31,September 30, 2021 compared to the similar periodperiods in 2020,2020.
The increase during the three months ended September 30, 2021 was primarily due to to:
•an increase in wireless retail postpaidequipment revenue of $117 million related to a higher volume and a shift to higher priced equipment in the mix of devices and accessories sold, partially offset by an increase in promotions; and
•an increase in wireless service revenue as a result of increases$93 million driven by an increase in the amount of wireless retail postpaid connections.
The increases were further driven by increasedincrease during the nine months ended September 30, 2021 was primarily due to:
•an increase in wireless equipment revenue resulting fromof $323 million driven by a higher volume and a shift to higher priced unitsequipment in the mix of wireless devices sold. The increases wereand accessories sold, partially offset by declinesan increase in promotions;
•an increase in wireless service revenue of $262 million driven by an increase in the amount of wireless retail postpaid connections, as well as increases in usage and non-recurring fees related to the impacts of the COVID-19 pandemic in the prior year; and
•a decrease of $103 million related to the loss of voice and DSL service connections.
For the three and nine months ended March 31,September 30, 2021, Fios revenues totaled $239$248 million and $732 million, respectively, which represents an increase of 1.7%$18 million and $40 million, respectively, compared to the similar periodperiods in 2020, reflecting the increase2020. The increases were primarily related to increases in total connections, as well as increased demand for higher broadband speeds.
Global Enterprise
Global Enterprise offers services to large businesses, which are identified based on their size and volume of business with Verizon, as well as non-U.S. public sector customers.
Global Enterprise revenues decreased during both the three and nine months ended March 31,September 30, 2021 compared to the similar periodperiods in 2020,2020.
The decrease during the three months ended September 30, 2021 was primarily due to declinesto:
•a decrease of $115 million in both traditional data and voice communication services as a resultrelated to secular pressures in the marketplace;
•an increase of competitive price pressures, a decrease in access revenue partially due to a continued decrease in international travel due to the COVID-19 pandemic, as well as a decrease$35 million in wireless equipment revenue resulting from declinesprimarily related to a shift to higher priced equipment in activation volumes. The decreasesthe mix of wireless devices and accessories sold; and
•an increase of $30 million in revenue were partially offset by increases in professional services, customer premise equipment FUSF surcharges duerelated to a rate increase and an increase in advanced communication services revenue due to the BlueJeans Network, Inc. (BlueJeans) acquisition. See Note 3 to the condensed consolidated financial statements for additional information on the BlueJeans acquisition.volumes.
36The decrease during the nine months ended September 30, 2021 was primarily due to:
Table•a decrease of Contents$343 million in traditional data and voice communication services related to secular pressures in the marketplace;•an increase of $73 million related to a higher FUSF rate and resulting surcharges; and
•an increase of $80 million in customer premise equipment related to volumes.
Public Sector and Other
Public Sector and Other offers wireless products and services as well as wireline connectivity and managed solutions to U.S. federal, state and local governments and educational institutions. These services include business services and connectivity similar to the products and services offered by Global Enterprise, in each case, with features and pricing designed to address the needs of governments and educational institutions.
The decrease in Public Sector and Other revenues increased during the three months ended March 31,September 30, 2021 compared to the similar period in 2020 was primarily due to:
•a decrease of $42 million in wireless equipment revenue primarily driven by increasesa decrease in the number of wireless devices sold as a result of a reduction in activations partly related to COVID-19 impacts in the prior year. The decrease is partially offset by a shift to higher priced equipment in the mix of wireless devices and accessories sold;
•a decrease of $19 million in customer premise equipment due to volume; and
•a decrease of $18 million in networking revenue and traditional voice communication services.
The increase in Public Sector and Other during the nine months ended September 30, 2021 compared to the similar period in 2020 was primarily due to:
•an increase in wireless service revenue asof $251 million primarily related to a resulthigher volume of an increasewireless connections driven by shifting technology needs in connections due to distance learning programsremote business environments, particularly in response to the COVID-19 pandemic, professional services revenue and advanced communication services revenue. These increases were partially offset by a decrease in customer premise equipment revenue.education.
Wholesale
Wholesale offers wireline communications services including data, voice, local dial tone and broadband services primarily to local, long distance, and wireless carriers that use our facilities to provide services to their customers.
Wholesale revenues decreased during both the three and nine months ended September 30, 2021 compared to the similar periods in 2020.
The decrease during the three months ended March 31,September 30, 2021 was primarily due to:
•a decrease of $119 million related to declines in traditional voice communication and network connectivity as a result of technology substitution and rationalization of international traffic.
The decrease during the nine months ended September 30, 2021 was primarily due to:
•a decrease of $245 million related to declines in traditional voice communication and network connectivity as a result of technology substitution.
Operating Expenses
| | | | | | | | | | | | | | | | | | | | | | | | | | | | | | | | | | | | | | | | | | | | | | | |
| Three Months Ended | | | | Nine Months Ended | | |
| | September 30, | | Increase/ | | September 30, | | Increase/ |
| (dollars in millions) | 2021 | | 2020 | | (Decrease) | | 2021 | | 2020 | | (Decrease) |
| Cost of services | $ | 2,647 | | | $ | 2,739 | | | $ | (92) | | | (3.4) | % | | $ | 8,066 | | | $ | 7,969 | | | $ | 97 | | | 1.2 | % |
| Cost of wireless equipment | 1,061 | | | 968 | | | 93 | | | 9.6 | | | 3,248 | | | 2,870 | | | 378 | | | 13.2 | |
| Selling, general and administrative expense | 2,077 | | | 2,092 | | | (15) | | | (0.7) | | | 6,231 | | | 6,195 | | | 36 | | | 0.6 | |
| Depreciation and amortization expense | 1,018 | | | 1,027 | | | (9) | | | (0.9) | | | 3,046 | | | 3,055 | | | (9) | | | (0.3) | |
| Total Operating Expenses | $ | 6,803 | | | $ | 6,826 | | | $ | (23) | | | (0.3) | | | $ | 20,591 | | | $ | 20,089 | | | $ | 502 | | | 2.5 | |
Cost of Services
The decrease in cost of services during the three months ended September 30, 2021 compared to the similar period in 2020 was primarily due to decreasesto:
•a decrease in traditionalaccess costs of $117 million resulting from a decline in network and voice communication and network connectivity, partially offset by an increase in core data.services.
Operating Expenses
| | | | | | | | | | | | | | | | | | | | | | | | | | | | | | | | | |
| Three Months Ended | | | | | | |
| | March 31, | | Increase/ | | | | |
| (dollars in millions) | 2021 | | 2020 | | (Decrease) | | | | | | |
| Cost of services | $ | 2,690 | | | $ | 2,589 | | | $ | 101 | | | 3.9 | % | | | | | | | | |
| Cost of wireless equipment | 1,111 | | | 1,090 | | | 21 | | | 1.9 | | | | | | | | | |
| Selling, general and administrative expense | 2,068 | | | 2,034 | | | 34 | | | 1.7 | | | | | | | | | |
| Depreciation and amortization expense | 1,013 | | | 1,014 | | | (1) | | | (0.1) | | | | | | | | | |
| Total Operating Expenses | $ | 6,882 | | | $ | 6,727 | | | $ | 155 | | | 2.3 | | | | | | | | | |
Cost of Services
CostThe increase in cost of services increased during the threenine months ended March 31,September 30, 2021 compared to the similar period in 2020 was primarily driven by due to:
•an increase in direct costs of $144 million related to the increase in professional services and increased regulatory fees as a result of services;
•an increase in theregulatory fees of $107 million related to a higher FUSF rate. These increases were partially offset by rate;
•an increase in building and facilities costs of $80 million primarily related to a change in utility rates;
•a decrease in access costs resulting fromof $214 million related to a decline in network and voice services.services; and
•a decrease in personnel costs of $35 million related to lower consulting fees and employee travel.
Cost of Wireless Equipment
Cost of wireless equipment increased during both the three and nine months ended March 31,September 30, 2021 compared to the similar periodperiods in 2020,2020.
The increase during the than three months ended September 30, 2021 was primarily due to to:
•an increase of $407 million related to a shift to higher priced equipment in expenses as the mix of wireless devices and accessories sold; and
•a resultdecrease of $313 million driven by a lower volume of wireless devices sold.
The increase during the nine months ended September 30, 2021 was primarily due to:
•an increase of $728 million related to a shift to higher priced equipment in the mix of wireless devices and accessories sold;
•an increase of $68 million related to a recall undertaken for certain jetpack units, as well as units; and
•a shift to higher priced devices in the mixdecrease of $420 million driven by a lower volume of wireless devices sold. This increase was partially offset by a decrease in the number of wireless devices sold.
Selling, General and Administrative Expense
Selling, general and administrative expense increased during the three months ended March 31, 2021, compared to the similar period in 2020, primarily driven by increases in costs related to data and network systems and a one-time international tax benefit that did not repeat in 2021. These increases were partially offset by a decrease in personnel costs.
Segment Operating Income and EBITDA
| | | | Three Months Ended | | | | | | Three Months Ended | | | | Nine Months Ended | | |
| | March 31, | | Increase/ | | | | September 30, | | Increase/ | | September 30, | | Increase/ |
| (dollars in millions) | (dollars in millions) | 2021 | | 2020 | | (Decrease) | | | (dollars in millions) | 2021 | | 2020 | | (Decrease) | | 2021 | | 2020 | | (Decrease) |
| Segment Operating Income | Segment Operating Income | $ | 899 | | | $ | 954 | | | $ | (55) | | | (5.8) | % | | | Segment Operating Income | $ | 886 | | | $ | 923 | | | $ | (37) | | | (4.0) | % | | $ | 2,641 | | | $ | 2,823 | | | $ | (182) | | | (6.4) | % |
| Add Depreciation and amortization expense | Add Depreciation and amortization expense | 1,013 | | | 1,014 | | | (1) | | | (0.1) | | | | Add Depreciation and amortization expense | 1,018 | | | 1,027 | | | (9) | | | (0.9) | | | 3,046 | | | 3,055 | | | (9) | | | (0.3) | |
| Segment EBITDA | Segment EBITDA | $ | 1,912 | | | $ | 1,968 | | | $ | (56) | | | (2.8) | | | | Segment EBITDA | $ | 1,904 | | | $ | 1,950 | | | $ | (46) | | | (2.4) | | | $ | 5,687 | | | $ | 5,878 | | | $ | (191) | | | (3.2) | |
| | Segment operating income margin | Segment operating income margin | 11.6 | % | | 12.4 | % | | | Segment operating income margin | 11.5 | % | | 11.9 | % | | 11.4 | % | | 12.3 | % | |
| Segment EBITDA margin | Segment EBITDA margin | 24.6 | % | | 25.6 | % | | | Segment EBITDA margin | 24.8 | % | | 25.2 | % | | 24.5 | % | | 25.7 | % | |
The changes in the table above during the three and nine months ended March 31,September 30, 2021 compared to the similar period in 2020 were primarily a result of the factors described in connection with operating revenues and operating expenses.
Special items included in Income Before Provision For Income Taxes were as follows:
| | | | Three Months Ended | | | Three Months Ended | | Nine Months Ended |
| | March 31, | | | September 30, | | September 30, |
| (dollars in millions) | (dollars in millions) | 2021 | | 2020 | | (dollars in millions) | 2021 | | 2020 | | 2021 | | 2020 |
| | Loss on spectrum licenses | | | |
| | Severance, pension and benefits charges (credits) | | Severance, pension and benefits charges (credits) | |
| Selling, general and administrative expense | Selling, general and administrative expense | $ | 223 | | | $ | 1,195 | | | Selling, general and administrative expense | $ | 103 | | | $ | — | | | $ | 103 | | | $ | — | |
| Severance, pension and benefits charges | | | |
| | Other income, net | — | | | 182 | | | |
| Other income (expense), net | | Other income (expense), net | 144 | | | 1,092 | | | (1,170) | | | 1,427 | |
| | Net gain from sale of Media | | Net gain from sale of Media | |
| Selling, general and administrative expense | | Selling, general and administrative expense | (706) | | | — | | | (706) | | | — | |
| Early debt redemption costs | | Early debt redemption costs | |
| Other income (expense), net | | Other income (expense), net | — | | | — | | | 1,132 | | | 129 | |
| Interest expense | | Interest expense | — | | | — | | | — | | | (27) | |
| | Loss on spectrum licenses | | Loss on spectrum licenses | |
| Selling, general and administrative expense | | Selling, general and administrative expense | — | | | — | | | 223 | | | 1,195 | |
| Total | Total | $ | 223 | | | $ | 1,377 | | | Total | $ | (459) | | | $ | 1,092 | | | $ | (418) | | | $ | 2,724 | |
The Consolidated Adjusted EBITDA non-GAAP measure presented in the Consolidated Net Income, Consolidated EBITDA and Consolidated Adjusted EBITDA discussion (see "Consolidated Results of Operations") excludes all of the amounts included above, as described below.
The income and expenses related to special items included in our condensed consolidated results of operations were as follows:
| | | | Three Months Ended | | | Three Months Ended | | Nine Months Ended |
| | March 31, | | | September 30, | | September 30, |
| (dollars in millions) | (dollars in millions) | 2021 | | 2020 | | (dollars in millions) | 2021 | | 2020 | | 2021 | | 2020 |
| Within Total Operating Expenses | Within Total Operating Expenses | $ | 223 | | | $ | 1,195 | | | Within Total Operating Expenses | $ | (603) | | | $ | — | | | $ | (380) | | | $ | 1,195 | |
| | Within Other income, net | — | | | 182 | | | |
| | Within Other income (expense), net | | Within Other income (expense), net | 144 | | | 1,092 | | | (38) | | | 1,556 | |
| Within Interest expense | | Within Interest expense | — | | | — | | | — | | | (27) | |
| Total | Total | $ | 223 | | | $ | 1,377 | | | Total | $ | (459) | | | $ | 1,092 | | | $ | (418) | | | $ | 2,724 | |
Loss on Spectrum LicensesSeverance, Pension and Benefits Charges (Credits)
During the three and nine months ended March 31,September 30, 2021, we recorded net pre-tax remeasurement losses of $144 million and a net pre-tax remeasurement gain of $1.2 billion, respectively in our pension plans triggered by settlements. Pension and benefit activity is recognized in the income statement during the fourth quarter or upon a remeasurement event pursuant to our accounting policy for the recognition of actuarial gains and losses. During both the three and nine months ended September 30, 2021, we also recorded pre-tax lossseverance charges of $223$103 million as a resultrelated to voluntary separations under our existing plans in Selling, general and administrative expense in our consolidated statements of signing two agreements to sell certain wireless licenses. See Note 3 to the condensed consolidated financial statements for additional information.income.
During the three months ended March 31,September 30, 2021, we recorded a net pre-tax remeasurement loss of $144 million driven by a $667 million charge due to changes in our discount rate and other assumption changes, offset by a $523 million credit resulting from the difference between our estimated and our actual return on assets.
During the three months ended June 30, 2021, we recorded a pre-tax remeasurement gain of $1.3 billion primarily driven by a $1.2 billion credit mainly due to changes in our discount rate and changes in our lump sum interest rate assumptions used to determine the current year liabilities of our pension plans and a $122 million credit resulting from the difference between our estimated and our actual return on assets.
During the three and nine months ended September 30, 2020, we recorded net pre-tax remeasurement losses of $1.1 billion and $1.4 billion, respectively, in our pension plans triggered by settlements.
During the three months ended September 30, 2020, we recorded a net pre-tax netremeasurement loss of $1.2$1.1 billion asprimarily driven by a result$1.8 billion charge due to changes in our discount rate and lump sum interest rate assumptions used to determine the current year liabilities of the conclusion of the Federal Communications Commission (FCC) incentive auction, Auction 103, for spectrum licenses in the upper 37 GHz, 39 GHz and 47 GHz bands. See Note 3our pension plans, offset by a $689 million credit due to the condensed consolidated financial statements for additional information.difference between our estimated and our actual return on assets.
Severance, PensionDuring the three months ended June 30, 2020, we recorded a net pre-tax remeasurement loss of $153 million primarily driven by a $163 million charge mainly resulting from the difference between our estimated and Benefits Chargesour actual return on assets and changes in our lump sum interest rate assumptions used to determine the current year liabilities of our pension plans, offset by a credit due to changes in our discount rate.
During the three months ended March 31, 2020, we recorded a net pre-tax remeasurement loss of $182 million, in our pension plans triggered by settlements, primarily driven by a $196 million charge mainly due to changes in our discount rate and lump sum interest rate assumptions used to determine the current year liabilities of our pension plans, offset by a credit due toresulting from the difference between our estimated return on assets and our actual return on assets. Pension and benefit activity was recorded in accordance with our accounting policy to recognize actuarial gains and losses in the period in which they occur.
See Note 9 to the condensed consolidated financial statements for additional information related to our severance, pension and benefits charges.charges and credits.
Net Gain from Sale of Media
During both the three and nine months ended September 30, 2021, we recorded a net pre-tax gain of $706 million in connection with the sale of Verizon Media. See Note 3 to the condensed consolidated financial statements for additional information.
Early Debt Redemption Costs
During the nine months ended September 30, 2021, we recorded pre-tax early debt redemption costs of $1.1 billion in connection with the redemptions of securities issued by Verizon and open market repurchases of various Verizon and subsidiary notes.
During the nine months ended September 30, 2020, we recorded net pre-tax early debt redemption costs of $102 million in connection with the redemptions of securities issued by Verizon and open market repurchases.
See Note 6 to the condensed consolidated financial statements for additional information.
Loss on Spectrum Licenses
During the nine months ended September 30, 2021, we recognized a pre-tax loss of $223 million as a result of signing two agreements to sell certain wireless licenses.
During the nine months ended September 30, 2020, we recorded a pre-tax net loss of $1.2 billion as a result of the conclusion of the FCC incentive auction, Auction 103, for spectrum licenses in the upper 37 Gigahertz (GHz), 39 GHz and 47 GHz bands.
See Note 3 to the condensed consolidated financial statements for additional information.
| | |
| Consolidated Financial Condition |
| | | | Three Months Ended | | | | Nine Months Ended | | |
| | March 31, | | | September 30, | |
| (dollars in millions) | (dollars in millions) | 2021 | | 2020 | | Change | (dollars in millions) | 2021 | | 2020 | | Change |
| Cash Flows Provided By (Used In) | Cash Flows Provided By (Used In) | | Cash Flows Provided By (Used In) | |
| Operating activities | Operating activities | $ | 9,694 | | | $ | 8,824 | | | $ | 870 | | Operating activities | $ | 31,162 | | | $ | 32,472 | | | $ | (1,310) | |
| Investing activities | Investing activities | (49,653) | | | (6,980) | | | (42,673) | | Investing activities | (57,018) | | | (18,469) | | | (38,549) | |
| Financing activities | Financing activities | 27,956 | | | 2,563 | | | 25,393 | | Financing activities | 13,469 | | | (7,737) | | | 21,206 | |
| Increase (decrease) in cash, cash equivalents and restricted cash | Increase (decrease) in cash, cash equivalents and restricted cash | $ | (12,003) | | | $ | 4,407 | | | $ | (16,410) | | Increase (decrease) in cash, cash equivalents and restricted cash | $ | (12,387) | | | $ | 6,266 | | | $ | (18,653) | |
We use the net cash generated from our operations to fund expansion and modernization of our networks, service and repay external financing, pay dividends, invest in new businesses and spectrum and, when appropriate, buy back shares of our outstanding common stock. Our sources of funds, primarily from operations and, to the extent necessary, from external financing arrangements, are sufficient to meet ongoing operating and investing requirements. We expect that our capital spending requirements will continue to be financed primarily through internally generated funds. Debt or equity financing may be needed to fund additional investments or development activities or to maintain an appropriate capital structure to ensure our financial flexibility. Our cash and cash equivalents are held both domestically and internationally, and are invested to maintain principal and provide liquidity. See "Market Risk" for additional information regarding our foreign currency risk management strategies.
Our available external financing arrangements include an active commercial paper program, credit available under credit facilities and other bank lines of credit, vendor financing arrangements, issuances of registered debt or equity securities, U.S. retail medium-term notes and other capital market securities that are privately-placed or offered overseas. In addition, we monetize our device payment plan agreement receivables through asset-backed debt transactions.
We made the decision at the beginning of the COVID-19 pandemic to maintain a higher cash balance than our historical norm to further protect the Company against the economic uncertainties associated with the pandemic. We expect to continue to evaluate the need for that elevatedour cash balance throughout 2021 and may determine to adjust it further depending on economic conditions.
Cash Flows Provided By Operating Activities
Our primary source of funds continues to be cash generated from operations. Net cash provided by operating activities increased $870 milliondecreased $1.3 billion during the threenine months ended March 31,September 30, 2021, compared to the similar period in 2020, primarily due to changes in working capital, which includes higher volumes in 2021, as well as activity during 2020 including the receipt of a $2.2 billion cash tax benefit related to the
sale of preferred shares in a foreign affiliate which did not repeat in 2021. In addition, we made a payment of $237 million for the settlement of forward starting interest rate swaps in 2021. These decreases were partially offset by an increase in earnings of $4.3 billion and the receipt of $251 million from the settlement of treasury rate locks. These comparative increases were partially offset by the payment of $237 million for the settlement of forward starting interest rate swaps. As a result of prior years' discretionary contributions and the fact that actual asset returns have been higher than expected, we expect that there will be no required pension funding through 2030, subject to changes in market conditions.
Cash Flows Used In Investing Activities
Capital Expenditures
Capital expenditures continue to relate primarily to the use of capital resources to increase the operating efficiency and productivity of our networks, maintain our existing infrastructure, facilitate the introduction of new products and services and enhance responsiveness to competitive challenges.
Capital expenditures, including capitalized software, for the threenine months ended March 31,September 30, 2021 and 2020 were $4.5$13.9 billion and $5.3$14.2 billion, respectively. Capital expenditures decreased approximately $780$307 million, or 14.8%2.2%, during the threenine months ended March 31,September 30, 2021, compared to the similar period in 2020, primarily due to the timing of investments, as well as capital efficiencies from our business excellence initiatives. Our investments primarily relate to our network assets which support the business.
Acquisitions of Wireless Licenses
In February 2021, the FCC completed an auction, Auction 107, for mid-band spectrum known as C-Band. During the threenine months ended March 31,September 30, 2021, we paid approximately $44.6$45.9 billion for spectrum licenses in connection with this auction, of which $1.3 billion was paid for certain obligations related to projected clearing costs associated with the auction.
During the threenine months ended March 31,September 30, 2021, we entered into and completed various other wireless license acquisitions for cash consideration of $90$95 million.
During the nine months ended September 30, 2021, we recorded capitalized interest related to wireless licenses of $1.1 billion.
Acquisitions of Businesses, Net of Cash Acquired
In October 2020, we entered into a definitive agreement to acquire certain assets of Bluegrass Cellular, a rural wireless operator serving central Kentucky. The transaction closed in March 2021. The aggregate cash consideration paid by Verizon at the closing of the transaction was approximately $405$412 million, net of cash acquired, which is subject to customary closing adjustments.
Disposition of Business
During the nine months ended September 30, 2021, we received net cash proceeds of $4.1 billion in connection with the sale of Verizon Media. See Note 3 to the condensed consolidated financial statements for additional information.
Cash Flows Provided By (Used In) Financing Activities
We seek to maintain a mix of fixed and variable rate debt to lower borrowing costs within reasonable risk parameters and to protect against earnings and cash flow volatility resulting from changes in market conditions. During the threenine months ended March 31,September 30, 2021, net cash provided by financing activities was $28.0$13.5 billion. During the threenine months ended March 31,September 30, 2020, net cash provided byused in financing activities was $2.6$7.7 billion.
During the threenine months ended March 31,September 30, 2021, our net cash provided by financing activities of $28.0 billion was primarily driven by proceeds from long-term borrowings of $31.4$32.5 billion and proceeds from asset-backed long-term borrowings of $1.0$2.7 billion. These proceeds were partially offset by cash dividends of $2.6 billion, repayments of asset-backed long-term borrowings of $732 million and repayments, redemptions and repurchases of long-term borrowings and finance lease obligations of $302 million.$7.9 billion, cash dividends of $7.8 billion, and repayments of asset-backed long-term borrowings of $3.9 billion.
At March 31,September 30, 2021, our total debt of $158.5$151.0 billion included unsecured debt of $147.6$141.6 billion and secured debt of $10.9$9.4 billion. At December 31, 2020, our total debt of $129.1 billion included unsecured debt of $118.5 billion and secured debt of $10.6 billion. During the threenine months ended March 31,September 30, 2021 and 2020, our effective interest rate was 3.8%3.7% and 4.2%, respectively. See Note 6 to the condensed consolidated financial statements for additional information regarding our debt activity.
Verizon may acquire debt securities issued by Verizon and its affiliates through open market purchases, redemptions, privately negotiated transactions, tender offers, exchange offers, or otherwise, upon such terms and at such prices as Verizon may from time to time determine, for cash or other consideration.
Asset-Backed Debt
Cash collections on the device payment plan agreement receivables collateralizing our asset-backed debt securities are required at certain specified times to be placed into segregated accounts. Deposits to the segregated accounts are considered restricted cash and are included in Prepaid expenses and other and Other assets in our condensed consolidated balance sheets.
Proceeds from our asset-backed debt transactions are reflected in Cash flows from financing activities in our condensed consolidated statements of cash flows. The asset-backed debt issued and the assets securing this debt are included in our condensed consolidated balance sheets.
See Note 6 to the condensed consolidated financial statements for additional information.
Long-Term Credit Facilities
| | | At March 31, 2021 | | At September 30, 2021 |
| (dollars in millions) | (dollars in millions) | Maturities | | Facility Capacity | | Unused Capacity | | Principal Amount Outstanding | (dollars in millions) | Maturities | | Facility Capacity | | Unused Capacity | | Principal Amount Outstanding |
Verizon revolving credit facility (1) | Verizon revolving credit facility (1) | 2024 | | $ | 9,500 | | | $ | 9,392 | | | N/A | Verizon revolving credit facility (1) | 2024 | | $ | 9,500 | | | $ | 9,413 | | | N/A |
Various export credit facilities (2) | Various export credit facilities (2) | 2022 - 2028 | | 7,500 | | | 530 | | | 5,205 | | Various export credit facilities (2) | 2022 - 2029 | | 7,500 | | | 530 | | | $ | 4,823 | |
| Total | Total | | $ | 17,000 | | | $ | 9,922 | | | $ | 5,205 | | Total | | $ | 17,000 | | | $ | 9,943 | | | $ | 4,823 | |
N/A - not applicable
(1) The revolving credit facility does not require us to comply with financial covenants or maintain specified credit ratings, and it permits us to borrow even if our business has incurred a material adverse change. The revolving credit facility provides for the issuance of letters of credit.
(2) During the threenine months ended March 31,September 30, 2021, we drew down $470 million from these facilities. These credit facilities are used to finance equipment-related purchases. Borrowings under certain of these facilities amortize semi-annually in equal installments up to the applicable maturity dates. Maturities reflect maturity dates of principal amounts outstanding. Any amounts borrowed under these facilities and subsequently repaid cannot be reborrowed.
In September 2021, Term Loan Credit Agreement
In February 2021, Verizon entered into a credit agreement that provided Verizon with the abilitywe submitted an irrevocable request to borrow up to $25.0 billion for general corporate purposes, including any potential acquisition of wireless spectrum. Verizon terminated this agreementthe remaining $530 million available under our export credit facilities in March 2021 without borrowing any of the available funds.November 2021.
Other, Net
Other, net financing activities during the threenine months ended March 31,September 30, 2021 includes $295 million in payments related to vendor financing arrangements, and $165$167 million in postings of derivative collateral.collateral and early debt redemption costs. See "Special Items" for additional information on the early debt redemption costs.
Dividends
As in prior periods, dividend payments were a significant use of capital resources. We paid $2.6$7.8 billion and $2.5$7.6 billion in cash dividends during the threenine months ended March 31,September 30, 2021 and 2020, respectively.
Covenants
Our credit agreements contain covenants that are typical for large, investment grade companies. These covenants include requirements to pay interest and principal in a timely fashion, pay taxes, maintain insurance with responsible and reputable insurance companies, preserve our corporate existence, keep appropriate books and records of financial transactions, maintain our properties, provide financial and other reports to our lenders, limit pledging and disposition of assets and mergers and consolidations, and other similar covenants.
We and our consolidated subsidiaries are in compliance with all of our restrictive covenants in our debt agreements.
Change In Cash, Cash Equivalents and Restricted Cash
Our Cash and cash equivalents at March 31,September 30, 2021 totaled $10.2$9.9 billion, a $12.0$12.2 billion decrease compared to December 31, 2020, primarily as a result of the factors discussed above.
Restricted cash totaled $1.2 billion and $1.3 billion as of both March 31,September 30, 2021 and December 31, 2020, respectively, primarily related to cash collections on the device payment plan agreement receivables that are required at certain specified times to be placed into segregated accounts.
Free Cash Flow
Free cash flow is a non-GAAP financial measure that reflects an additional way of viewing our liquidity that, we believe, when viewed with our GAAP results, provides management, investors and other users of our financial information with a more complete understanding of
factors and trends affecting our cash flows. Free cash flow is calculated by subtracting capital expenditures (including capitalized software) from net cash provided by operating activities. We believe it is a more conservative measure of cash flow since purchases of fixed assets are necessary for ongoing operations. Free cash flow has limitations due to the fact that it does not represent the residual cash flow available for discretionary expenditures. For example, free cash flow does not incorporate payments made on finance lease obligations or cash payments for business acquisitions or wireless licenses. Therefore, we believe it is important to view free cash flow as a complement to our entire condensed consolidated statements of cash flows.
The following table reconciles net cash provided by operating activities to free cash flow:
| | | | Three Months Ended | | | | Nine Months Ended | | |
| | March 31, | | | September 30, | |
| (dollars in millions) | (dollars in millions) | 2021 | | 2020 | | Change | (dollars in millions) | 2021 | | 2020 | | Change |
| Net cash provided by operating activities | Net cash provided by operating activities | $ | 9,694 | | | $ | 8,824 | | | $ | 870 | | Net cash provided by operating activities | $ | 31,162 | | | $ | 32,472 | | | $ | (1,310) | |
| Less Capital expenditures (including capitalized software) | Less Capital expenditures (including capitalized software) | 4,494 | | | 5,274 | | | (780) | | Less Capital expenditures (including capitalized software) | 13,861 | | | 14,168 | | | (307) | |
| Free cash flow | Free cash flow | $ | 5,200 | | | $ | 3,550 | | | $ | 1,650 | | Free cash flow | $ | 17,301 | | | $ | 18,304 | | | $ | (1,003) | |
The increasedecrease in free cash flow during the threenine months ended March 31,September 30, 2021, compared to the similar period in 2020, is a reflection of the increasedecrease in operating cash flows, as well as the decrease in capital expenditures discussed above.
We are exposed to various types of market risk in the normal course of business, including the impact of interest rate changes, foreign currency exchange rate fluctuations, changes in investment, equity and commodity prices and changes in corporate tax rates. We employ risk management strategies, which may include the use of a variety of derivatives including cross currency swaps, forward starting interest rate swaps, interest rate swaps, interest rate caps, treasury rate locks and foreign exchange forwards. We do not hold derivatives for trading purposes.
It is our general policy to enter into interest rate, foreign currency and other derivative transactions only to the extent necessary to achieve our desired objectives in optimizing exposure to various market risks. Our objectives include maintaining a mix of fixed and variable rate debt to lower borrowing costs within reasonable risk parameters and to protect against earnings and cash flow volatility resulting from changes in market conditions. We do not hedge our market risk exposure in a manner that would completely eliminate the effect of changes in interest rates and foreign exchange rates on our earnings.
Counterparties to our derivative contracts are major financial institutions with whom we have negotiated derivatives agreements (ISDA master agreements) and credit support annex (CSA) agreements which provide rules for collateral exchange. The CSA agreements contain rating based thresholds such that we or our counterparties may be required to hold or post collateral based upon changes in outstanding positions as compared to established thresholds and changes in credit ratings. We do not offset fair value amounts recognized for derivative instruments and fair value amounts recognized for the right to reclaim cash collateral or the obligation to return cash collateral arising from derivative instruments recognized at fair value. At March 31,September 30, 2021, we held and posted an insignificant amount of collateral related to derivative contracts under collateral exchange agreements, which were recorded as Other current liabilities and Prepaid expenses and other, respectively, in our condensed consolidated balance sheet. At December 31, 2020, we held $0.2$0.2 billion of collateral related to derivative contracts under collateral exchange arrangements, which were recorded as Other current liabilities in our condensed consolidated balance sheet. While we may be exposed to credit losses due to the nonperformance of our counterparties, we consider the risk remote and do not expect that any such nonperformance would result in a significant effect on our results of operations or financial condition due to our diversified pool of counterparties. See Note 8 to the condensed consolidated financial statements for additional information regarding the derivative portfolio.
Interest Rate Risk
We are exposed to changes in interest rates, primarily on our short-term debt and the portion of long-term debt that carries floating interest rates. As of March 31,September 30, 2021, approximately 85%86% of the aggregate principal amount of our total debt portfolio consisted of fixed-rate indebtedness, including the effect of interest rate swap agreements designated as hedges. The impact of a 100-basis-point change in interest rates affecting our floating rate debt would result in a change in annual interest expense, including our interest rate swap agreements that are designated as hedges, of approximately $248$216 million. The interest rates on our existing long-term debt obligations are unaffected by changes to our credit ratings.
Certain of our floating rate debt and certain of our interest rate derivative transactions utilize interest rates that are linked to the London Inter-Bank Offered Rate (LIBOR) as the benchmark rate. LIBOR is the subject of recent U.S. and international regulatory guidance for reform. Regulators have announced that one-week and two-month U.S. dollar LIBOR rates will cease publication after December 31, 2021, and other U.S. dollar LIBOR rates will cease publication after June 30, 2023. The consequences of these developments cannot be entirely predicted but could include an increase in the cost of our floating rate debt or exposure under our interest rate derivative transactions. We do not anticipate a significant impact to our financial position given our current mix of variable and fixed-rate debt, taking into account the impact of our interest rate hedging. The floating rate senior unsecured notes issued in March 2021 and certain of our interest rate derivative transactions utilize interest rates that are linked to the Secured Overnight Financing Rate as the benchmark rate.
Interest Rate Swaps
We enter into interest rate swaps to achieve a targeted mix of fixed and variable rate debt. We principally receive fixed rates and pay variable rates, resulting in a net increase or decrease to Interest expense. These swaps are designated as fair value hedges and hedge against interest rate risk exposure of designated debt issuances. At March 31,September 30, 2021, the fair value of the asset and liability of these contracts were $254$500 million and $740$616 million, respectively. At December 31, 2020, the fair value of the asset and liability of these contracts were $787 million and $303 million, respectively. At March 31,both September 30, 2021 and December 31, 2020, the total notional amount of the interest rate swaps was $17.9 billion and $17.8 billion, respectively.billion.
Forward Starting Interest Rate Swaps
We have entered into forward starting interest rate swaps designated as cash flow hedges in order to manage our exposure to interest rate changes on future forecasted transactions. At March 31,September 30, 2021, the fair value of the liability of these contracts was $160$281 million. At December 31, 2020, the fair value of the liability of these contracts was $797 million. At March 31,September 30, 2021 and December 31, 2020, the total notional amount of the forward starting interest rate swaps was $1.0 billion and $2.0 billion, respectively.
Treasury Rate Locks
We enter into treasury rate locks to mitigate our future interest rate risk. There was no outstanding notional amount for treasury rate locks at March 31,September 30, 2021 or December 31, 2020.2020 .
Foreign Currency Risk
The functional currency for our foreign operations is primarily the local currency. The translation of income statement and balance sheet amounts of our foreign operations into U.S. dollars is recorded as cumulative translation adjustments, which are included in Accumulated other comprehensive income (loss)loss in our condensed consolidated balance sheets. Gains and losses on foreign currency transactions are recorded in the condensed consolidated statements of income in Other income (expense), net. At March 31,September 30, 2021, our primary translation exposure was to the British Pound Sterling, Euro, Australian Dollar Canadian Dollar and Japanese Yen.
Cross Currency Swaps
We have entered into cross currency swaps designated as cash flow hedges to exchange our British Pound Sterling, Euro, Swiss Franc, Canadian Dollar and Australian Dollar-denominated cash flows intoU.S.dollars and to fix our cash payments in U.S. dollars, as well as to mitigate the impact of foreign currency transaction gains or losses. At March 31,September 30, 2021, the fair value of the asset and liability of these contracts was $630 million and $1.4 billion, and $337 million, respectively. At December 31, 2020, the fair value of the asset and liability of these contracts was $1.4 billion and $196 million, respectively. At March 31,September 30, 2021 and December 31, 2020, the total notional amount of the cross currency swaps was $32.5 billion and $26.3 billion, respectively.
Foreign Exchange Forwards
We also have foreign exchange forwards which we use as an economic hedge but for which we have elected not to apply hedge accounting. We enter into British Pound Sterling and Euro foreign exchange forwards to mitigate our foreign exchange rate risk related to non-functional currency denominated monetary assets and liabilities of international subsidiaries, as well as foreign exchange risk related to debt settlements. At both March 31,September 30, 2021, the fair value of the asset and liability of these contracts was zero and insignificant, respectively. At December 31, 2020, the fair value of the asset and liability of these contracts was insignificant. At March 31,September 30, 2021 and December 31, 2020, the total notional amount of the foreign exchange forwards was $1.3 billion$870 million and $1.4 billion, respectively.
| | |
| Acquisitions and Divestitures |
Spectrum License Transactions
From time to time, we enter into agreements to buy, sell or exchange spectrum licenses. We believe these spectrum license transactions have allowed us to continue to enhance the reliability of our wireless network, while also resulting in a more efficient use of spectrum.
In March 2020, the FCC's incentive auction, Auction 103, for spectrum licenses in the upper 37 GHz, 39 GHz, and 47 GHz bands concluded. Verizon participated in this incentive auction and was the high bidder on 4,940 licenses, which primarily consisted of 37 GHz and, to a lesser extent, 39 GHz spectrum. As an incumbent licensee, our 39 GHz licenses provided us with incentive payments that were applied towards the purchase price of spectrum in the auction. The value of the licenses won by Verizon amounted to $3.4 billion, of which $1.8 billion was settled with the relinquished 39 GHz licenses. The new reconfigured licenses were received in the second quarter 2020 and are included in Wireless licenses in our condensed consolidated balance sheet.
In September 2020, the FCC completed Auction 105 for Priority Access Licenses. Verizon participated in the auction and was the high bidder on 557 licenses in the 3.5 GHz band valued at approximately $1.9 billion. Verizon made payments for these licenses in 2020 and received them from the FCC in March 2021. The purchase cost for these licenses and related capitalized interest, to the extent qualifying activities have occurred, are included in Wireless licenses in our condensed consolidated balance sheet.
In February 2021, the FCC concluded Auction 107 for C-Band wireless spectrum. Verizon was the winning bidder on 3,511 licenses, consisting of contiguous C-Band spectrum bands ranging between 140 and 200 megahertz of C-Band spectrum in all 406 markets available in the auction. Verizon paid $45.5 billion for the licenses it won, of which $44.6 billion was paid in the first quarter of 2021. The carrying value of ourthe wireless spectrum won in Auction 107 consistswill consist of all payments required to participate and purchase licenses in the auction, including
Verizon’s allocable share of clearing costs incurred by, and incentive payments due to, the incumbent license holders associated with the auction that we are obligated to pay in order to acquire the licenses. Carrying value will also includesinclude capitalized interest to the extent qualifying activities have occurred. These figuresThe licenses were received from the FCC in July 2021 and are recordedincluded within Deposits for wirelessWireless licenses in our condensed consolidated balance sheet. Reclassificationsheet as of these amounts to Wireless licenses is made upon receipt of the corresponding licenses. The timing of when the licenses will be issued will be determined by the FCC after all the payments have been made.September 30, 2021.
See Note 3 to the condensed consolidated financial statements for additional information regarding our spectrum license transactions.
Blue Jeans Network, Inc.
In April 2020, we entered into a definitive purchase agreement to acquire BlueJeans,Blue Jeans Network, Inc. (BlueJeans), an enterprise-grade video conferencing and event platform, whose services are sold to Business customers globally. The transaction closed in May 2020. The aggregate cash consideration paid by Verizon at the closing of the transaction was approximately $397 million, net of cash acquired. See Note 3 to the condensed consolidated financial statements for additional information.
TracFone Wireless, Inc.
In September 2020, we entered into a purchase agreement (Tracfone Purchase Agreement) with América Móvil to acquire Tracfone, a provider of prepaid and value mobile services in the U.S. Under the terms of the Tracfone Purchase Agreement, we will acquire all of the stock of Tracfone for approximately $3.1 billion in cash and $3.1 billion in Verizon common stock, subject to customary adjustments, at closing. The number of shares issued will be based on an average trading price determined as of the closing date and is subject to a minimum number of shares issuable of 47,124,445 and a maximum number of shares issuable of 57,596,544. The Tracfone Purchase Agreement also includes up to an additional $650 million in future cash consideration related to the achievement of certain performance measures and other commercial arrangements. The transaction is subject to regulatory approvals and closing conditions and is expected to close in the second halffourth quarter of 2021.
Bluegrass Cellular
In October 2020, we entered into a definitive agreement to acquire certain assets of Bluegrass Cellular (Bluegrass), a rural wireless operator serving central Kentucky. Bluegrass provides wireless service to 210,000 customers in 34 counties in rural service areas 3, 4, and 5 in Central Kentucky. The transaction closed in March 2021. The aggregate cash consideration paid by Verizon at the closing of the transaction was approximately $405$412 million, net of cash acquired, which is subject to customary closing adjustments. See Note 3 to the condensed consolidated financial statements for additional information.
Verizon Media
On May 2, 2021, Verizon entered into a definitive agreement with an affiliate of Apollo Global Management Inc. (the Apollo Affiliate) pursuant to which we agreed to sell Verizon Media in return for consideration of $4.3 billion in cash, subject to customary adjustments, $750 million in non-convertible preferred limited partnership units of the Apollo Affiliate, and 10% of the fully-diluted common limited partnership units of the Apollo Affiliate.
On September 1, 2021, we completed the sale of Verizon Media. As of the close of the transaction, cash proceeds, the fair value of the non-convertible preferred limited partnership units of the Apollo Affiliate, and the fair value of 10% of the fully-diluted common limited partnership units of the Apollo Affiliate were $4.3 billion, $496 million, and $124 million, respectively. We recorded a pre-tax gain on sale of approximately $1.1 billion (after-tax $1.1 billion) in Selling general and administrative expense in our condensed consolidated statement of income for the three and nine months ended September 30, 2021. In addition, we incurred various costs associated with this disposition amounting to approximately $346 million which are primarily recorded in Selling general and administrative expense in our condensed consolidated statement of income for the three and nine months ended September 30, 2021. See Note 3 to the condensed consolidated financial statements for additional information.
Other
From time to time, we enter into strategic agreements to acquire various other businesses and investments.
In November 2020, Verizon entered into an agreement See Note 3 to sell our Huffington Post business. In connection with this transaction, we recorded a pre-tax loss of $126 million in Selling, general and administrative expense in ourthe condensed consolidated statement of incomefinancial statements for the year ended December 31, 2020. The transaction closed in February 2021.additional information.
| | |
| Other Factors That May Affect Future Results |
Regulatory and Competitive Trends
There have been no material changes to Regulatory and Competitive Trends as previously disclosed in Part I, Item I. "Business" in our Annual Report on Form 10-K for the year ended December 31, 2020.
| | |
| Cautionary Statement Concerning Forward-Looking Statements |
In this report we have made forward-looking statements. These statements are based on our estimates and assumptions and are subject to risks and uncertainties. Forward-looking statements include the information concerning our possible or assumed future results of operations. Forward-looking statements also include those preceded or followed by the words "anticipates," "believes," "estimates," "expects," "hopes," "forecasts," "plans" or similar expressions. For those statements, we claim the protection of the safe harbor for forward-looking statements contained in the Private Securities Litigation Reform Act of 1995. We undertake no obligation to revise or publicly release the results of any revision to these forward-looking statements, except as required by law. Given these risks and uncertainties, readers are cautioned not to place undue reliance on such forward-looking statements.
The following important factors, along with those discussed elsewhere in this report and in other filings with the Securities and Exchange Commission (SEC), could affect future results and could cause those results to differ materially from those expressed in the forward-looking statements:
•cyber attacks impacting our networks or systems and any resulting financial or reputational impact;
•natural disasters, terrorist attacks or acts of war or significant litigation and any resulting financial or reputational impact;
•the impact of the COVID-19 pandemic on our operations, our employees and the ways in which our customers use our networks and other products and services;
•disruption of our key suppliers’ or vendors' provisioning of products or services, including as a result of the COVID-19 pandemic;
•material adverse changes in labor matters and any resulting financial or operational impact;
•the effects of competition in the markets in which we operate;
•failure to take advantage of developments in technology and address changes in consumer demand;
•performance issues or delays in the deployment of our 5G network resulting in significant costs or a reduction in the anticipated benefits of the enhancement to our networks;
•the inability to implement our business strategy;
•adverse conditions in the U.S. and international economies;
•changes in the regulatory environment in which we operate, including any increase in restrictions on our ability to operate our networks or businesses;
•our high level of indebtedness;
•an adverse change in the ratings afforded our debt securities by nationally accredited ratings organizations or adverse conditions in the credit markets affecting the cost, including interest rates, and/or availability of further financing;
•significant increases in benefit plan costs or lower investment returns on plan assets;
•changes in tax laws or treaties, or in their interpretation; and
•changes in accounting assumptions that regulatory agencies, including the SEC, may require or that result from changes in the accounting rules or their application, which could result in an impact on earnings.
| | |
| Item 3. Quantitative and Qualitative Disclosures About Market Risk |
Information relating to market risk is included in Item 2, Management’s Discussion and Analysis of Financial Condition and Results of Operations under the caption "Market Risk."
| | |
| Item 4. Controls and Procedures |
Our Chief Executive Officer and Chief Financial Officer have evaluated the effectiveness of the registrant’s disclosure controls and procedures (as defined in Rules 13a-15(e) and 15d-15(e) of the Securities Exchange Act of 1934), as of the end of the period covered by this quarterly report, that ensure that information relating to the registrant which is required to be disclosed in this report is recorded, processed, summarized and reported within required time periods using the criteria for effective internal control established in Internal Control–Integrated Framework issued by the Committee of Sponsoring Organizations of the Treadway Commission in 2013. Based on this evaluation, our Chief Executive Officer and Chief Financial Officer have concluded that the registrant’s disclosure controls and procedures were effective as of March 31,September 30, 2021.
In the ordinary course of business, we routinely review our system of internal control over financial reporting and make changes to our systems and processes that are intended to ensure an effective internal control environment. In the third quarter of 2020, we began a multi-year implementation of a new global enterprise resource planning (ERP) system, which will replace many of our existing core financial systems. The ERP system is designed to enhance the flow of financial information, facilitate data analysis and accelerate information reporting. The implementation is expected to occur in phases over the next several years.
As the phased implementation of the new ERP system continues, we could have changes to our processes and procedures which, in turn, could result in changes to our internal controls over financial reporting. As such changes occur, we will evaluate quarterly whether such changes materially affect our internal control over financial reporting.
There were no changes in the Company’s internal control over financial reporting during the firstthird quarter 2021 that have materially affected, or are reasonably likely to materially affect, our internal control over financial reporting.
| | |
| Part II – Other Information |
| | |
| Item 1. Legal Proceedings |
Verizon is not subject to any administrative or judicial proceeding arising under any Federal, State or local provisions that have been enacted or adopted regulating the discharge of materials into the environment or primarily for the purpose of protecting the environment that is likely to result in monetary sanctions of $1 million or more.
See Note 12 to the condensed consolidated financial statements for additional information regarding legal proceedings.
There have been no material changes to our risk factors as previously disclosed in Part I, Item 1A. included in our Annual Report on Form 10-K for the year ended December 31, 2020.
| | |
| Item 2. Unregistered Sales of Equity Securities and Use of Proceeds |
In February 2020, the Verizon Board of Directors authorized a share buyback program to repurchase up to 100 million shares of the Company's common stock. The program will terminate when the aggregate number of shares purchased reaches 100 million or a new share repurchase plan superseding the current plan is authorized, whichever is sooner. Under the program, shares may be repurchased in privately negotiated transactions, on the open market, or otherwise, including through plans complying with Rule 10b5-1 under the Exchange Act. The timing and number of shares purchased under the program, if any, will depend on market conditions and the Company's capital allocation priorities.
Verizon did not repurchase any shares of Verizon common stock during the three months ended March 31,September 30, 2021. At March 31,September 30, 2021, the maximum number of shares that could be purchased by or on behalf of Verizon under our share buyback program was 100 million.
| | | | | | | | |
Exhibit
Number | | Description |
| | |
10a | | Form of 2021 Performance Stock Unit Agreement pursuant to the 2017 Verizon Communications Inc. Long-Term Incentive Plan. |
| | |
10b | | Form of 2021 Restricted Stock Unit Agreement pursuant to the 2017 Verizon Communications Inc. Long-Term Incentive Plan.
|
| | |
10c | | 364-Day Term Loan Credit Agreement, dated as of February 24, 2021, among Verizon Communications Inc., the initial lenders listed therein, and JPMorgan Chase Bank, N.A. as administrative agent, and Morgan Stanley Senior Funding, Inc., as syndication agent. |
| | |
| 31.1 | | Certification of Chief Executive Officer pursuant to Section 302 of the Sarbanes-Oxley Act of 2002. |
| | |
| 31.2 | | Certification of Chief Financial Officer pursuant to Section 302 of the Sarbanes-Oxley Act of 2002. |
| |
| 32.1 | | Certification of Chief Executive Officer pursuant to Section 906 of the Sarbanes-Oxley Act of 2002. |
| |
| 32.2 | | Certification of Chief Financial Officer pursuant to Section 906 of the Sarbanes-Oxley Act of 2002. |
| |
| 101.INS | | XBRL Instance Document - the instance document does not appear in the interactive data file because its XBRL tags are embedded within the inline XBRL document. |
| |
| 101.SCH | | XBRL Taxonomy Extension Schema Document. |
| |
| 101.PRE | | XBRL Taxonomy Presentation Linkbase Document. |
| |
| 101.CAL | | XBRL Taxonomy Calculation Linkbase Document. |
| |
| 101.LAB | | XBRL Taxonomy Label Linkbase Document. |
| |
| 101.DEF | | XBRL Taxonomy Extension Definition Linkbase Document. |
| |
| 104 | | Cover Page Interactive Data File (formatted as inline XBRL with applicable taxonomy extension information contained in Exhibits 101). |
Pursuant to the requirements of the Securities Exchange Act of 1934, the registrant has duly caused this report to be signed on its behalf by the undersigned thereunto duly authorized.
| | | | | | | | | | | | | | |
| | VERIZON COMMUNICATIONS INC. |
| | |
Date: April 27,October 26, 2021 | | By | /s/ | Anthony T. Skiadas |
| | | | Anthony T. Skiadas |
| | | | Senior Vice President and Controller |
| | | | (Principal Accounting Officer) |
| | | | | | | | |
Exhibit
Number | | Description |
| | |
| | Form of 2021 Performance Stock Unit Agreement pursuant to the 2017 Verizon Communications Inc. Long-Term Incentive Plan. |
| | |
| | Form of 2021 Restricted Stock Unit Agreement pursuant to the 2017 Verizon Communications Inc. Long-Term Incentive Plan.
|
| | |
| | 364-Day Term Loan Credit Agreement, dated as of February 24, 2021, among Verizon Communications Inc., the initial lenders listed therein, and JPMorgan Chase Bank, N.A. as administrative agent, and Morgan Stanley Senior Funding, Inc., as syndication agent. |
| | |
| | Certification of Chief Executive Officer pursuant to Section 302 of the Sarbanes-Oxley Act of 2002. |
| |
| | Certification of Chief Financial Officer pursuant to Section 302 of the Sarbanes-Oxley Act of 2002. |
| |
| | Certification of Chief Executive Officer pursuant to Section 906 of the Sarbanes-Oxley Act of 2002. |
| |
| | Certification of Chief Financial Officer pursuant to Section 906 of the Sarbanes-Oxley Act of 2002. |
| |
| 101.INS | | XBRL Instance Document - the instance document does not appear in the interactive data file because its XBRL tags are embedded within the inline XBRL document. |
| |
| 101.SCH | | XBRL Taxonomy Extension Schema Document. |
| |
| 101.PRE | | XBRL Taxonomy Presentation Linkbase Document. |
| |
| 101.CAL | | XBRL Taxonomy Calculation Linkbase Document. |
| |
| 101.LAB | | XBRL Taxonomy Label Linkbase Document. |
| |
| 101.DEF | | XBRL Taxonomy Extension Definition Linkbase Document. |
| | |
| 104 | | Cover Page Interactive Data File (formatted as inline XBRL with applicable taxonomy extension information contained in Exhibits 101). |
| | |