UNITED STATES
SECURITIES AND EXCHANGE COMMISSION
Washington, D.C. 20549
FORM 10-Q
| | | | | | | | |
| (Mark one) | | |
| ☒ | QUARTERLY REPORT PURSUANT TO SECTION 13 OR 15(d)
OF THE SECURITIES EXCHANGE ACT OF 1934 | |
For the quarterly period ended June 30, 2023March 31, 2024
OR
| | | | | | | | |
| ☐ | TRANSITION REPORT PURSUANT TO SECTION 13 OR 15(d)
OF THE SECURITIES EXCHANGE ACT OF 1934 | |
| | |
| For the transition period from to | |
Commission file number: 1-8606
Verizon Communications Inc.
(Exact name of registrant as specified in its charter)
| | | | | | | | |
| Delaware | | 23-2259884 |
(State or other jurisdiction
of incorporation or organization) | | (I.R.S. Employer Identification No.) |
| | | | | | | | | | | |
| 1095 Avenue of the Americas | | 10036 |
| New York, | New York | | |
| (Address of principal executive offices) | | (Zip Code) |
Registrant’s telephone number, including area code: (212) 395-1000
Securities registered pursuant to Section 12(b) of the Act:
| | | | | | | | | | | | | | |
| Title of Each Class | | Trading Symbol(s) | | Name of Each Exchange on Which Registered |
| Common Stock, par value $0.10 | | VZ | | New York Stock Exchange |
| Common Stock, par value $0.10 | | VZ | | The Nasdaq Global Select Market |
1.625% Notes due 2024 | | VZ 24B | | New York Stock Exchange |
| 4.073% Notes due 2024 | | VZ 24C | | New York Stock Exchange |
| 0.875% Notes due 2025 | | VZ 25 | | New York Stock Exchange |
| 3.25% Notes due 2026 | | VZ 26 | | New York Stock Exchange |
| 1.375% Notes due 2026 | | VZ 26B | | New York Stock Exchange |
| 0.875% Notes due 2027 | | VZ 27E | | New York Stock Exchange |
| 1.375% Notes due 2028 | | VZ 28 | | New York Stock Exchange |
| 1.125% Notes due 2028 | | VZ 28A | | New York Stock Exchange |
| 2.350% Fixed Rate Notes due 2028 | | VZ 28C | | New York Stock Exchange |
| 1.875% Notes due 2029 | | VZ 29B | | New York Stock Exchange |
| 0.375% Notes due 2029 | | VZ 29D | | New York Stock Exchange |
| 1.250% Notes due 2030 | | VZ 30 | | New York Stock Exchange |
| 1.875% Notes due 2030 | | VZ 30A | | New York Stock Exchange |
| 4.250% Notes due 2030 | | VZ 30D | | New York Stock Exchange |
| 2.625% Notes due 2031 | | VZ 31 | | New York Stock Exchange |
| 2.500% Notes due 2031 | | VZ 31A | | New York Stock Exchange |
| 3.000% Fixed Rate Notes due 2031 | | VZ 31D | | New York Stock Exchange |
| 0.875% Notes due 2032 | | VZ 32 | | New York Stock Exchange |
| 0.750% Notes due 2032 | | VZ 32A | | New York Stock Exchange |
| 3.500% Notes due 2032 | | VZ 32B | | New York Stock Exchange |
| 1.300% Notes due 2033 | | VZ 33B | | New York Stock Exchange |
Securities registered pursuant to Section 12(b) of the Act (continued):
| | | | | | | | | | | | | | |
| Title of Each Class | | Trading Symbol(s) | | Name of Each Exchange on Which Registered |
| 4.75% Notes due 2034 | | VZ 34 | | New York Stock Exchange |
| 4.750% Notes due 2034 | | VZ 34C | | New York Stock Exchange |
| 3.125% Notes due 2035 | | VZ 35 | | New York Stock Exchange |
| 1.125% Notes due 2035 | | VZ 35A | | New York Stock Exchange |
| 3.375% Notes due 2036 | | VZ 36A | | New York Stock Exchange |
| 3.750% Notes due 2036 | | VZ 36B | | New York Stock Exchange |
| 2.875% Notes due 2038 | | VZ 38B | | New York Stock Exchange |
| 1.875% Notes due 2038 | | VZ 38C | | New York Stock Exchange |
| 1.500% Notes due 2039 | | VZ 39C | | New York Stock Exchange |
| 3.50% Fixed Rate Notes due 2039 | | VZ 39D | | New York Stock Exchange |
| 1.850% Notes due 2040 | | VZ 40 | | New York Stock Exchange |
| 3.850% Fixed Rate Notes due 2041 | | VZ 41C | | New York Stock Exchange |
Indicate by check mark whether the registrant (1) has filed all reports required to be filed by Section 13 or 15(d) of the Securities Exchange Act of 1934 during the preceding 12 months (or for such shorter period that the registrant was required to file such reports), and (2) has been subject to such filing requirements for the past 90 days. ☒ Yes ☐ No
Indicate by check mark whether the registrant has submitted electronically every Interactive Data File required to be submitted pursuant to Rule 405 of Regulation S-T (§232.405 of this chapter) during the preceding 12 months (or for such shorter period that the registrant was required to submit such files). ☒ Yes ☐ No
| | | | | | | | | | | | | | | | | |
| Indicate by check mark whether the registrant is a large accelerated filer, an accelerated filer, a non-accelerated filer, a smaller reporting company, or an emerging growth company. See the definitions of "large accelerated filer," "accelerated filer," "smaller reporting company," and "emerging growth company" in Rule 12b-2 of the Exchange Act. |
| | | | | |
| Large accelerated filer | ☒ | | Accelerated filer | ☐ |
| Non-accelerated filer | ☐ | | Smaller reporting company | ☐ |
| | | | Emerging growth company | ☐ |
If an emerging growth company, indicate by check mark if the registrant has elected not to use the extended transition period for complying with any new or revised financial accounting standards provided pursuant to Section 13(a) of the Exchange Act. ☐
Indicate by check mark whether the registrant is a shell company (as defined in Rule 12b-2 of the Exchange Act). ☐ Yes ☒ No
At June 30, 2023, 4,204,039,985March 31, 2024, 4,209,254,894 shares of the registrant’s common stock were outstanding, after deducting 87,393,66182,178,752 shares held in treasury.
| | | | | | | | |
| Item No. | | Page |
| | |
| |
| | |
| Item 1. | | |
| | |
| | |
| Three and six months ended June 30,March 31, 2024 and 2023 and 2022 | |
| | |
| | |
| Three and six months ended June 30,March 31, 2024 and 2023 and 2022 | |
| | |
| | |
| At June 30, 2023March 31, 2024 and December 31, 20222023 | |
| | |
| | |
| SixThree months ended June 30,March 31, 2024 and 2023 and 2022 | |
| | |
| | |
| | |
| Item 2. | | |
| | |
| Item 3. | | |
| | |
| Item 4. | | |
| |
| |
| | |
| Item 1. | | |
| | |
| Item 1A. | | |
| | |
| Item 2. | | |
| | |
| Item 5. | | |
| | |
| Item 6. | | |
| |
| |
| |
| |
| | |
| Part I - Financial Information |
| | |
| Item 1. Financial Statements (Unaudited) |
| | |
| Condensed Consolidated Statements of Income |
| Verizon Communications Inc. and Subsidiaries |
| | Three Months Ended | |
| Three Months Ended | |
| Three Months Ended | |
| | | Three Months Ended | | Six Months Ended |
| | | June 30, | | June 30, |
| (dollars in millions, except per share amounts) (unaudited) | (dollars in millions, except per share amounts) (unaudited) | 2023 | | 2022 | | 2023 | | 2022 |
| (dollars in millions, except per share amounts) (unaudited) | |
| (dollars in millions, except per share amounts) (unaudited) | |
| | Operating Revenues | |
| | Operating Revenues | |
| | Operating Revenues | Operating Revenues | |
| Service revenues and other | Service revenues and other | $ | 27,319 | | | $ | 27,115 | | | $ | 54,471 | | | $ | 54,333 | |
| Service revenues and other | |
| Service revenues and other | |
| Wireless equipment revenues | Wireless equipment revenues | 5,277 | | | 6,674 | | | 11,037 | | | 13,010 | |
| Wireless equipment revenues | |
| Wireless equipment revenues | |
| Total Operating Revenues | |
| Total Operating Revenues | |
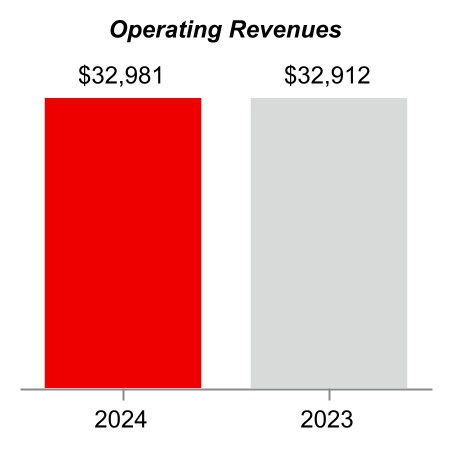
| Total Operating Revenues | Total Operating Revenues | 32,596 | | | 33,789 | | | 65,508 | | | 67,343 | |
| | Operating Expenses | Operating Expenses | |
| | Operating Expenses | |
| | Operating Expenses | |
| Cost of services (exclusive of items shown below) | |
| Cost of services (exclusive of items shown below) | |
| Cost of services (exclusive of items shown below) | Cost of services (exclusive of items shown below) | 6,986 | | | 6,932 | | | 14,064 | | | 14,159 | |
| Cost of wireless equipment | Cost of wireless equipment | 5,778 | | | 7,488 | | | 12,204 | | | 14,611 | |
| Cost of wireless equipment | |
| Cost of wireless equipment | |
| Selling, general and administrative expense | |
| Selling, general and administrative expense | |
| Selling, general and administrative expense | Selling, general and administrative expense | 8,253 | | | 7,496 | | | 15,759 | | | 14,668 | |
| Depreciation and amortization expense | Depreciation and amortization expense | 4,359 | | | 4,321 | | | 8,677 | | | 8,557 | |
| Depreciation and amortization expense | |
| Depreciation and amortization expense | |
| | Total Operating Expenses | |
| | Total Operating Expenses | |
| | Total Operating Expenses | Total Operating Expenses | 25,376 | | | 26,237 | | | 50,704 | | | 51,995 | |
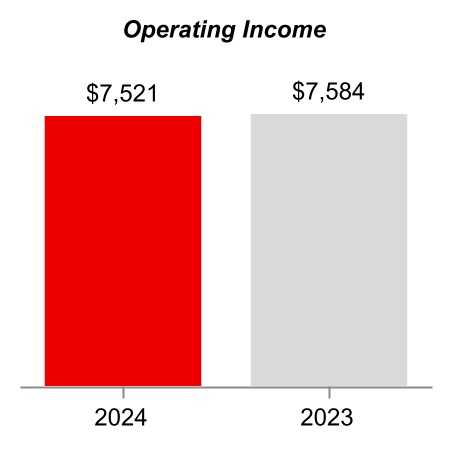
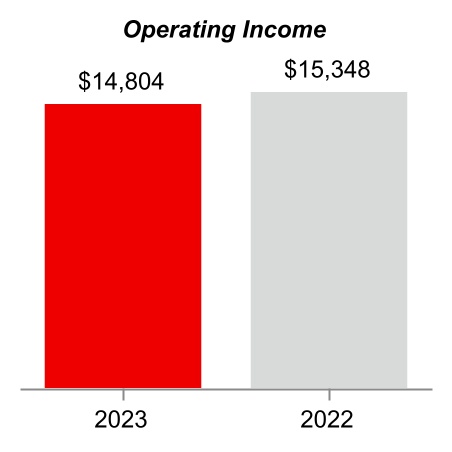
| | Operating Income | Operating Income | 7,220 | | | 7,552 | | | 14,804 | | | 15,348 | |
| | Operating Income | |
| | Operating Income | |
| Equity in earnings (losses) of unconsolidated businesses | Equity in earnings (losses) of unconsolidated businesses | (33) | | | 41 | | | (24) | | | 38 | |
| Other income (expense), net | 210 | | | 49 | | | 324 | | | (875) | |
| Equity in earnings (losses) of unconsolidated businesses | |
| Equity in earnings (losses) of unconsolidated businesses | |
| Other income, net | |
| Other income, net | |
| Other income, net | |
| Interest expense | |
| Interest expense | |
| Interest expense | Interest expense | (1,285) | | | (785) | | | (2,492) | | | (1,571) | |
| Income Before Provision For Income Taxes | Income Before Provision For Income Taxes | 6,112 | | | 6,857 | | | 12,612 | | | 12,940 | |
| Income Before Provision For Income Taxes | |
| Income Before Provision For Income Taxes | |
| Provision for income taxes | Provision for income taxes | (1,346) | | | (1,542) | | | (2,828) | | | (2,914) | |
| Provision for income taxes | |
| Provision for income taxes | |
| Net Income | |
| Net Income | |
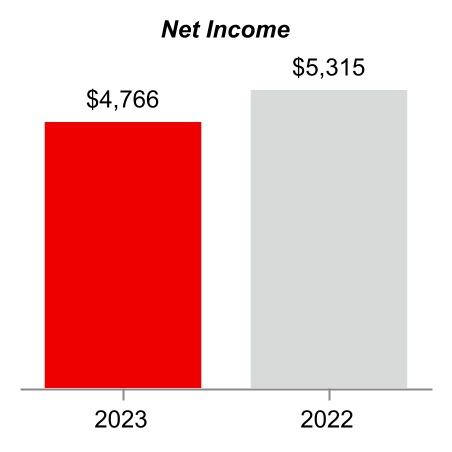
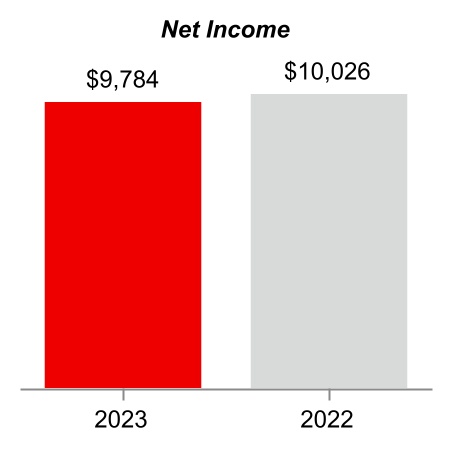
| Net Income | Net Income | $ | 4,766 | | | $ | 5,315 | | | $ | 9,784 | | | $ | 10,026 | |
| | Net income attributable to noncontrolling interests | Net income attributable to noncontrolling interests | $ | 118 | | | $ | 116 | | | $ | 227 | | | $ | 247 | |
| | Net income attributable to noncontrolling interests | |
| | Net income attributable to noncontrolling interests | |
| Net income attributable to Verizon | Net income attributable to Verizon | 4,648 | | | 5,199 | | | 9,557 | | | 9,779 | |
| Net income attributable to Verizon | |
| Net income attributable to Verizon | |
| Net Income | |
| Net Income | |
| Net Income | Net Income | $ | 4,766 | | | $ | 5,315 | | | $ | 9,784 | | | $ | 10,026 | |
| | Basic Earnings Per Common Share | Basic Earnings Per Common Share | |
| | Basic Earnings Per Common Share | |
| | Basic Earnings Per Common Share | |
| Net income attributable to Verizon | Net income attributable to Verizon | $ | 1.10 | | | $ | 1.24 | | | $ | 2.27 | | | $ | 2.33 | |
| Net income attributable to Verizon | |
| Net income attributable to Verizon | |
| Weighted-average shares outstanding (in millions) | |
| Weighted-average shares outstanding (in millions) | |
| Weighted-average shares outstanding (in millions) | Weighted-average shares outstanding (in millions) | 4,208 | | | 4,201 | | | 4,207 | | | 4,201 | |
| | Diluted Earnings Per Common Share | Diluted Earnings Per Common Share | |
| | Diluted Earnings Per Common Share | |
| | Diluted Earnings Per Common Share | |
| Net income attributable to Verizon | |
| Net income attributable to Verizon | |
| Net income attributable to Verizon | Net income attributable to Verizon | $ | 1.10 | | | $ | 1.24 | | | $ | 2.27 | | | $ | 2.33 | |
| Weighted-average shares outstanding (in millions) | Weighted-average shares outstanding (in millions) | 4,213 | | | 4,202 | | | 4,212 | | | 4,202 | |
| Weighted-average shares outstanding (in millions) | |
| Weighted-average shares outstanding (in millions) | |
See Notes to Condensed Consolidated Financial Statements
| | |
| Condensed Consolidated Statements of Comprehensive Income |
| Verizon Communications Inc. and Subsidiaries |
| | Three Months Ended | Six Months Ended |
| June 30, |
| Three Months Ended | |
| Three Months Ended | |
| Three Months Ended | |
| March 31, | |
| March 31, | |
| March 31, | |
| (dollars in millions) (unaudited) | |
| (dollars in millions) (unaudited) | |
| (dollars in millions) (unaudited) | (dollars in millions) (unaudited) | 2023 | | 2022 | 2023 | | 2022 |
| | Net Income | Net Income | $ | 4,766 | | | $ | 5,315 | | $ | 9,784 | | | $ | 10,026 | |
| | Net Income | |
| | Net Income | |
| Other Comprehensive Income (Loss), Net of Tax (Expense) Benefit | Other Comprehensive Income (Loss), Net of Tax (Expense) Benefit | |
| Foreign currency translation adjustments, net of tax of $1, $(11), $4 and $(17) | (6) | | | (136) | | 20 | | | (165) | |
| Unrealized gain on cash flow hedges, net of tax of $(8), $(19), $(15) and $(91) | 25 | | | 72 | | 46 | | | 279 | |
| Unrealized gain (loss) on fair value hedges, net of tax of $(100), $88, $3 and $88 | 293 | | | (272) | | (9) | | | (272) | |
| Unrealized gain (loss) on marketable securities, net of tax of $0, $2, $(1) and $7 | (2) | | | (6) | | 2 | | | (24) | |
| Defined benefit pension and postretirement plans, net of tax of $21, $24, $36 and $72 | (54) | | | (72) | | (115) | | | (211) | |
| Other Comprehensive Income (Loss), Net of Tax (Expense) Benefit | |
| Other Comprehensive Income (Loss), Net of Tax (Expense) Benefit | |
| Foreign currency translation adjustments, net of tax of $(5) and $3 | |
| Foreign currency translation adjustments, net of tax of $(5) and $3 | |
| Foreign currency translation adjustments, net of tax of $(5) and $3 | |
| Unrealized gain on cash flow hedges, net of tax of $(11) and $(7) | |
| Unrealized gain on cash flow hedges, net of tax of $(11) and $(7) | |
| Unrealized gain on cash flow hedges, net of tax of $(11) and $(7) | |
| Unrealized gain (loss) on fair value hedges, net of tax of $(68) and $103 | |
| Unrealized gain (loss) on fair value hedges, net of tax of $(68) and $103 | |
| Unrealized gain (loss) on fair value hedges, net of tax of $(68) and $103 | |
| Unrealized gain (loss) on marketable securities, net of tax of $0 and $(1) | |
| Unrealized gain (loss) on marketable securities, net of tax of $0 and $(1) | |
| Unrealized gain (loss) on marketable securities, net of tax of $0 and $(1) | |
| Defined benefit pension and postretirement plans, net of tax of $1 and $15 | |
| Defined benefit pension and postretirement plans, net of tax of $1 and $15 | |
| Defined benefit pension and postretirement plans, net of tax of $1 and $15 | |
| Other comprehensive income (loss) attributable to Verizon | Other comprehensive income (loss) attributable to Verizon | 256 | | | (414) | | (56) | | | (393) | |
| Other comprehensive income (loss) attributable to Verizon | |
| Other comprehensive income (loss) attributable to Verizon | |
| Total Comprehensive Income | |
| Total Comprehensive Income | |
| Total Comprehensive Income | Total Comprehensive Income | $ | 5,022 | | | $ | 4,901 | | $ | 9,728 | | | $ | 9,633 | |
| | Comprehensive income attributable to noncontrolling interests | Comprehensive income attributable to noncontrolling interests | $ | 118 | | | $ | 116 | | $ | 227 | | | $ | 247 | |
| | Comprehensive income attributable to noncontrolling interests | |
| | Comprehensive income attributable to noncontrolling interests | |
| Comprehensive income attributable to Verizon | |
| Comprehensive income attributable to Verizon | |
| Comprehensive income attributable to Verizon | Comprehensive income attributable to Verizon | 4,904 | | | 4,785 | | 9,501 | | | 9,386 | |
| Total Comprehensive Income | Total Comprehensive Income | $ | 5,022 | | | $ | 4,901 | | $ | 9,728 | | | $ | 9,633 | |
| Total Comprehensive Income | |
| Total Comprehensive Income | |
See Notes to Condensed Consolidated Financial Statements
| | |
| Condensed Consolidated Balance Sheets |
| Verizon Communications Inc. and Subsidiaries |
| | | At June 30, | | At December 31, |
| At March 31, | |
| At March 31, | |
| At March 31, | | | At December 31, |
| (dollars in millions, except per share amounts) (unaudited) | (dollars in millions, except per share amounts) (unaudited) | 2023 | | 2022 | (dollars in millions, except per share amounts) (unaudited) | 2024 | | 2023 |
| | Assets | Assets | |
| Assets | |
| Assets | |
| Current assets | Current assets | |
| Current assets | |
| Current assets | |
| Cash and cash equivalents | |
| Cash and cash equivalents | |
| Cash and cash equivalents | Cash and cash equivalents | $ | 4,803 | | | $ | 2,605 | |
| Accounts receivable | Accounts receivable | 24,108 | | | 25,332 | |
| Less Allowance for credit losses | Less Allowance for credit losses | 922 | | | 826 | |
| | Accounts receivable, net | |
| Accounts receivable, net | |
| Accounts receivable, net | Accounts receivable, net | 23,186 | | | 24,506 | |
| Inventories | Inventories | 1,896 | | | 2,388 | |
| Prepaid expenses and other | Prepaid expenses and other | 7,503 | | | 8,358 | |
| Total current assets | Total current assets | 37,388 | | | 37,857 | |
| | Property, plant and equipment | Property, plant and equipment | 313,424 | | | 307,689 | |
| Property, plant and equipment | |
| Property, plant and equipment | |
| Less Accumulated depreciation | Less Accumulated depreciation | 206,154 | | | 200,255 | |
| Property, plant and equipment, net | Property, plant and equipment, net | 107,270 | | | 107,434 | |
| | Investments in unconsolidated businesses | Investments in unconsolidated businesses | 1,015 | | | 1,071 | |
| Investments in unconsolidated businesses | |
| Investments in unconsolidated businesses | |
| Wireless licenses | Wireless licenses | 151,337 | | | 149,796 | |
| | Goodwill | |
| Goodwill | |
| Goodwill | Goodwill | 28,647 | | | 28,671 | |
| Other intangible assets, net | Other intangible assets, net | 11,097 | | | 11,461 | |
| Operating lease right-of-use assets | Operating lease right-of-use assets | 25,345 | | | 26,130 | |
| Other assets | Other assets | 17,856 | | | 17,260 | |
| Total assets | Total assets | $ | 379,955 | | | $ | 379,680 | |
| | Liabilities and Equity | Liabilities and Equity | |
| Liabilities and Equity | |
| Liabilities and Equity | |
| Current liabilities | Current liabilities | |
| Current liabilities | |
| Current liabilities | |
| Debt maturing within one year | |
| Debt maturing within one year | |
| Debt maturing within one year | Debt maturing within one year | $ | 14,827 | | | $ | 9,963 | |
| Accounts payable and accrued liabilities | Accounts payable and accrued liabilities | 20,067 | | | 23,977 | |
| Current operating lease liabilities | Current operating lease liabilities | 4,211 | | | 4,134 | |
| Other current liabilities | Other current liabilities | 12,299 | | | 12,097 | |
| Total current liabilities | Total current liabilities | 51,404 | | | 50,171 | |
| | Long-term debt | |
| Long-term debt | |
| Long-term debt | Long-term debt | 137,871 | | | 140,676 | |
| Employee benefit obligations | Employee benefit obligations | 12,357 | | | 12,974 | |
| Deferred income taxes | Deferred income taxes | 44,055 | | | 43,441 | |
| Non-current operating lease liabilities | Non-current operating lease liabilities | 20,745 | | | 21,558 | |
| Other liabilities | Other liabilities | 17,021 | | | 18,397 | |
| Total long-term liabilities | Total long-term liabilities | 232,049 | | | 237,046 | |
| | Commitments and Contingencies (Note 12) | Commitments and Contingencies (Note 12) | |
| Commitments and Contingencies (Note 12) | |
| Commitments and Contingencies (Note 12) | | | | |
| | Equity | Equity | |
| Equity | |
| Equity | |
| Series preferred stock ($0.10 par value; 250,000,000 shares authorized; none issued) | |
| Series preferred stock ($0.10 par value; 250,000,000 shares authorized; none issued) | |
| Series preferred stock ($0.10 par value; 250,000,000 shares authorized; none issued) | Series preferred stock ($0.10 par value; 250,000,000 shares authorized; none issued) | — | | | — | |
| Common stock ($0.10 par value; 6,250,000,000 shares authorized in each period; 4,291,433,646 shares issued in each period) | Common stock ($0.10 par value; 6,250,000,000 shares authorized in each period; 4,291,433,646 shares issued in each period) | 429 | | | 429 | |
| Additional paid in capital | Additional paid in capital | 13,523 | | | 13,420 | |
| Retained earnings | Retained earnings | 86,448 | | | 82,380 | |
| Accumulated other comprehensive loss | Accumulated other comprehensive loss | (1,921) | | | (1,865) | |
| Common stock in treasury, at cost (87,393,661 and 91,572,258 shares outstanding) | (3,830) | | | (4,013) | |
| Common stock in treasury, at cost (82,178,752 and 87,172,997 shares outstanding) | |
| Deferred compensation – employee stock ownership plans (ESOPs) and other | Deferred compensation – employee stock ownership plans (ESOPs) and other | 544 | | | 793 | |
| Noncontrolling interests | Noncontrolling interests | 1,309 | | | 1,319 | |
| Total equity | Total equity | 96,502 | | | 92,463 | |
| Total liabilities and equity | Total liabilities and equity | $ | 379,955 | | | $ | 379,680 | |
See Notes to Condensed Consolidated Financial Statements
| | |
| Condensed Consolidated Statements of Cash Flows |
| Verizon Communications Inc. and Subsidiaries |
| | Six Months Ended |
| Three Months Ended | | | Three Months Ended |
| | | June 30, | | March 31, |
| (dollars in millions) (unaudited) | (dollars in millions) (unaudited) | 2023 | | 2022 | (dollars in millions) (unaudited) | 2024 | | 2023 |
| | Cash Flows from Operating Activities | Cash Flows from Operating Activities | |
| Cash Flows from Operating Activities | |
| Cash Flows from Operating Activities | |
| Net Income | |
| Net Income | |
| Net Income | Net Income | $ | 9,784 | | | $ | 10,026 | |
| Adjustments to reconcile net income to net cash provided by operating activities: | Adjustments to reconcile net income to net cash provided by operating activities: | |
| Depreciation and amortization expense | |
| Depreciation and amortization expense | |
| Depreciation and amortization expense | Depreciation and amortization expense | 8,677 | | | 8,557 | |
| Employee retirement benefits | Employee retirement benefits | 108 | | | (121) | |
| Deferred income taxes | Deferred income taxes | 633 | | | 1,514 | |
| Provision for expected credit losses | Provision for expected credit losses | 1,061 | | | 665 | |
| Equity in losses (earnings) of unconsolidated businesses, net of dividends received | 49 | | | (18) | |
| Equity in losses of unconsolidated businesses, net of dividends received | |
| | Changes in current assets and liabilities, net of effects from acquisition/disposition of businesses | Changes in current assets and liabilities, net of effects from acquisition/disposition of businesses | (620) | | | (1,959) | |
| Changes in current assets and liabilities, net of effects from acquisition/disposition of businesses | |
| Changes in current assets and liabilities, net of effects from acquisition/disposition of businesses | |
| | Other, net | |
| Other, net | |
| Other, net | Other, net | (1,672) | | | (999) | |
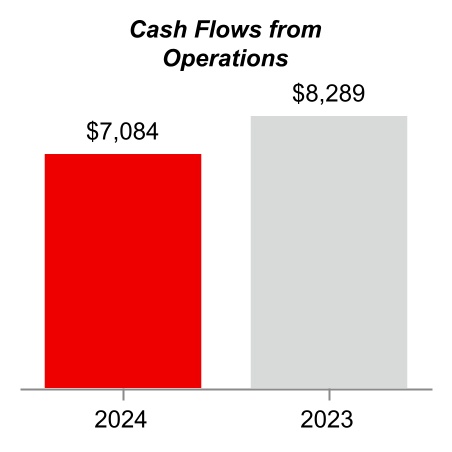
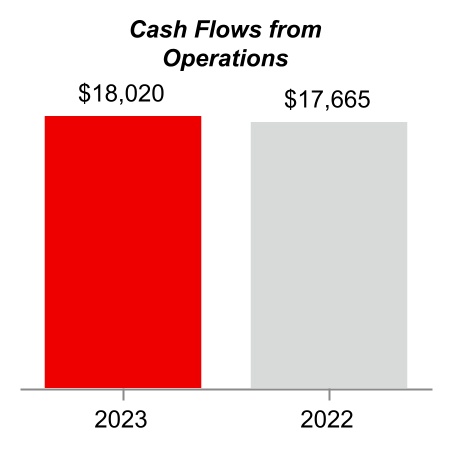
| Net cash provided by operating activities | Net cash provided by operating activities | 18,020 | | | 17,665 | |
| | Cash Flows from Investing Activities | Cash Flows from Investing Activities | |
| Cash Flows from Investing Activities | |
| Cash Flows from Investing Activities | |
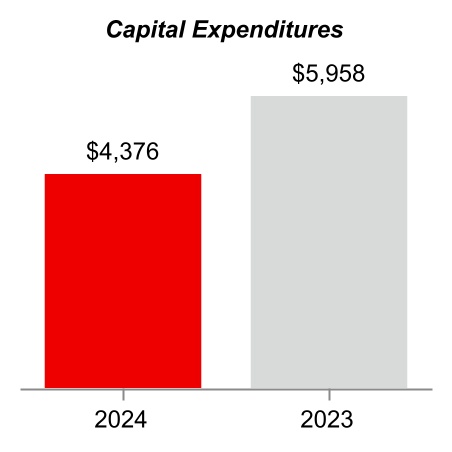
| Capital expenditures (including capitalized software) | Capital expenditures (including capitalized software) | (10,070) | | | (10,491) | |
| Cash received related to acquisitions of businesses, net | — | | | 247 | |
| Capital expenditures (including capitalized software) | |
| Capital expenditures (including capitalized software) | |
| | Acquisitions of wireless licenses | |
| Acquisitions of wireless licenses | |
| Acquisitions of wireless licenses | Acquisitions of wireless licenses | (1,085) | | | (2,275) | |
| Collateral receipts (payments) related to derivative contracts, net | Collateral receipts (payments) related to derivative contracts, net | 824 | | | (2,075) | |
| | Other, net | Other, net | 131 | | | (62) | |
| Other, net | |
| Other, net | |
| Net cash used in investing activities | Net cash used in investing activities | (10,200) | | | (14,656) | |
| | Cash Flows from Financing Activities | Cash Flows from Financing Activities | |
| Cash Flows from Financing Activities | |
| Cash Flows from Financing Activities | |
| Proceeds from long-term borrowings | |
| Proceeds from long-term borrowings | |
| Proceeds from long-term borrowings | Proceeds from long-term borrowings | 1,503 | | | 3,617 | |
| Proceeds from asset-backed long-term borrowings | Proceeds from asset-backed long-term borrowings | 3,705 | | | 5,053 | |
| Net proceeds from (repayments of) short-term commercial paper | (167) | | | 2,560 | |
| Net proceeds from short-term commercial paper | |
| Repayments of long-term borrowings and finance lease obligations | Repayments of long-term borrowings and finance lease obligations | (2,600) | | | (7,405) | |
| Repayments of asset-backed long-term borrowings | Repayments of asset-backed long-term borrowings | (2,383) | | | (2,695) | |
| Dividends paid | Dividends paid | (5,487) | | | (5,378) | |
| Other, net | Other, net | (157) | | | 411 | |
| Net cash used in financing activities | Net cash used in financing activities | (5,586) | | | (3,837) | |
| | Increase (decrease) in cash, cash equivalents and restricted cash | Increase (decrease) in cash, cash equivalents and restricted cash | 2,234 | | | (828) | |
| Increase (decrease) in cash, cash equivalents and restricted cash | |
| Increase (decrease) in cash, cash equivalents and restricted cash | |
| Cash, cash equivalents and restricted cash, beginning of period | Cash, cash equivalents and restricted cash, beginning of period | 4,111 | | | 4,161 | |
| Cash, cash equivalents and restricted cash, end of period (Note 1) | Cash, cash equivalents and restricted cash, end of period (Note 1) | $ | 6,345 | | | $ | 3,333 | |
See Notes to Condensed Consolidated Financial Statements
| | |
Notes to Condensed Consolidated Financial Statements (Unaudited) |
| Verizon Communications Inc. and Subsidiaries |
| | |
| Note 1. Basis of Presentation |
Verizon Communications Inc. (the Company) is a holding company that, acting through its subsidiaries (together with the Company, collectively, Verizon), is one of the world’s leading providers of communications, technology, information and entertainment products and services to consumers, businesses and government entities. With a presence around the world, we offer data, video and voice services and solutions on our networks and platforms that are designed to meet customers’ demand for mobility, reliable network connectivity security and control.security.
The accompanying unaudited condensed consolidated financial statements have been prepared in accordance with generally accepted accounting principles (GAAP) in the United States (U.S.) and based upon Securities and Exchange Commission rules that permit reduced disclosure for interim periods. For a more complete discussion of significant accounting policies and certain other information, you should refer to the financial statements included in the Company's Annual Report on Form 10-K for the year ended December 31, 2022.2023. These financial statements reflect all adjustments that are necessary for a fair presentation of results of operations and financial condition for the interim periods shown, including normal recurring accruals and other items. The results for the interim periods are not necessarily indicative of results for the full year.
During the first quarter of 2023, Verizon reorganized the customer groups within its Business segment. See Note 10 for additional information.
Certain amounts have been reclassified to conform to the current period’s presentation.
Earnings Per Common Share
There were a total of approximately 5.63.7 million and 4.63.6 million outstanding dilutive securities, primarily consisting of performance stock units and restricted stock units, included in the computation of diluted earnings per common share for the three and six months ended June 30, March 31, 2024 and 2023, respectively. There were a total of approximately 1.4 million and 1.5 million outstanding dilutive securities, primarily consisting of restricted stock units, included in the computation of diluted earnings per common share for the three and six months ended June 30, 2022, respectively.respectively.
Cash, Cash Equivalents and Restricted Cash
We consider all highly liquid investments with an original maturity of 90 days or less when purchased to be cash equivalents. Cash equivalents are stated at cost, which approximates quoted market value and includes amounts held in money market funds.
Cash collections on the receivablesand on the underlying receivables related to the participation interest collateralizing our asset-backed debt securities are required at certain specified times to be placed into segregated accounts. Deposits to the segregated accounts are considered restricted cash and are included in Prepaid expenses and other and Other assets in our condensed consolidated balance sheets.cash.
Cash, cash equivalents and restricted cash are included in the following line items in the condensed consolidated balance sheets:
| | At June 30, | | At December 31, | | Increase / (Decrease) |
| At March 31, | | | At March 31, | | At December 31, | | Increase |
| (dollars in millions) | (dollars in millions) | 2023 | | 2022 | | Increase / (Decrease) |
| Cash and cash equivalents | Cash and cash equivalents | $ | 4,803 | | | $ | 2,605 | | |
| Cash and cash equivalents | |
| Cash and cash equivalents | |
| Restricted cash: | Restricted cash: | |
| Prepaid expenses and other | |
| Prepaid expenses and other | |
| Prepaid expenses and other | Prepaid expenses and other | 1,387 | | | 1,343 | | | 44 | |
| Other assets | Other assets | 155 | | | 163 | | | (8) | |
| Cash, cash equivalents and restricted cash | Cash, cash equivalents and restricted cash | $ | 6,345 | | | $ | 4,111 | | | $ | 2,234 | |
|
| | |
| Note 2. Revenues and Contract Costs |
We earn revenue from contracts with customers, primarily through the provision of telecommunications and other services and through the sale of wireless equipment.
Revenue by Category
We have two reportable segments that we operate and manage as strategic business units, Consumer and Business. Revenue is disaggregated by products and services within Consumer, and customer groups (Enterprise and Public Sector, Business Markets and Other, and Wholesale) within Business. See Note 10 for additional information on revenue by segment, including Corporate and other.
We also earn revenues that are not accounted for under Accounting Standards Update (ASU) 2014-09, "Revenue from Contracts with Customers" (Topic 606)Topic 606 from leasing arrangements (such as those for towers and equipment), captive reinsurance
arrangements primarily related to wireless device insurance and the interest recognized when equipment is sold to the customer by an authorized agent under a device payment plan agreement. As allowed byWe have elected the practical expedient within ASU 2016-02, "Leases" (Topic 842), we have electedTopic 842, to combine the lease and non-lease components for those customer arrangements ofunder Topic 606 that involve customer premise equipment where we are the lessor as components accounted for under Topic 606.lessor. During the three and six months ended June 30,March 31, 2024 and March 31, 2023, revenues from arrangements that were not accounted for under Topic 606 were approximately $754$724 million and $1.5 billion, respectively. During the three and six months ended June 30, 2022, revenues from arrangements that were not accounted for under Topic 606 were approximately $775$749 million, and $1.6 billion, respectively.
Remaining Performance Obligations
When allocating the total contract transaction price to identified performance obligations, a portion of the total transaction price may relate to service performance obligations which were not satisfied or arewere partially satisfied as of the end of the reporting period. Below we disclose information relating to these unsatisfied performance obligations. We apply the practical expedient available under Topic 606 that provides the option to exclude the expected revenues arising from unsatisfied performance obligations related to contracts that have an original expected duration of one year or less. This situation primarily arises with respect to certain month-to-month service contracts. At June 30, 2023,March 31, 2024, month-to-month service contracts represented approximately 94%95% of our wireless postpaid contracts and approximately 94% of our wireline Consumer and our Business Markets and Other contracts, compared to June 30, 2022,March 31, 2023, for which month-to-month service contracts represented approximately 94% of our wireless postpaid contracts and 89%92% of our wireline Consumer and our Business Markets and Other contracts.
Additionally, certain contracts provide customers the option to purchase additional services. The fees related to these additional services are recognized when the customer exercises the option (typically on a month-to-month basis).
Contracts for wireless services, with or without promotional credits that require maintenance of service, are generally either month-to-month and cancellable at any time, or considered to contain terms ranging from greater than one month to up to thirty-six months (typically under a device payment plan), or contain terms ranging from greater than one month to up to twenty-four months (typically under a fixed-term plan). Additionally, customers may incur charges based on usage or additional optional services purchased in conjunction with entering into a contract that can be cancelled at any time and therefore are not included in the transaction price. The transaction price allocated to service performance obligations, which are not satisfied or are partially satisfied as of the end of the reporting period, are generally related to contracts that are not accounted for as month-to-month contracts.
Our Consumer group customers also include traditional wholesale resellers that purchase and resell wireless service under their own brands to their respective customers. Reseller arrangements generally include a stated contract term, which typically extends longer than two years and, in some cases, include a periodic minimum revenue commitment over the contract term for which revenues will be recognized in future periods.
Consumer customer contracts for wireline services are generally month-to-month; however, they may have a service term of two years or shorter than twelve months. Certain contracts with Business customers for wireline services extend into future periods, contain fixed monthly fees and usage-based fees, and can include annual commitments in each year of the contract or commitments over the entire specified contract term; however, a significant number of contracts for wireline services with our Business customers have a contract term that is twelve months or less.
Additionally, there are certain contracts with Business customers for wireline services that have a contractual minimum fee over the total contract term. We cannot predict the time period when revenue will be recognized related to those contracts; thus, they are excluded from the time bands below. These contracts have varying terms spanning over approximately sixteentwenty-nine years ending in February 2039September 2053 and have aggregate contract minimum payments totaling $1.4$2.0 billion.
At June 30, 2023,March 31, 2024, the transaction price related to unsatisfied performance obligations that are expected to be recognized for the remainder of 2023, 2024, 2025 and thereafter was $12.4$21.1 billion, $19.6$23.2 billion and $14.8$13.3 billion, respectively. Remaining performance obligation estimates are subject to change and are affected by several factors, including terminations and changes in the timing and scope of contracts, arising from contract modifications.
Accounts Receivable and Contract Balances
The timing of revenue recognition may differ from the time of billing to our customers. Receivables presented in our condensed consolidated balance sheets represent an unconditional right to consideration. Contract balances represent amounts from an arrangement when either Verizon has performed, by transferring goods or services to the customer in advance of receiving all or partial consideration for such goods and services from the customer, or the customer has made payment to Verizon in advance of obtaining control of the goods and/or services promised to the customer in the contract.
The following table presents information about receivables from contracts with customers:
| | | | | | | | | | | | | | | |
| At March 31, | | At December 31, | | | | |
| (dollars in millions) | 2024 | | 2023 | | | | |
Accounts Receivable(1) | $ | 9,401 | | | $ | 9,760 | | | | | |
Device payment plan agreement receivables(2) | 18,521 | | | 18,528 | | | | | |
(1)Balances do not include receivables related to the following: activity associated with certain vendor agreements, leasing arrangements (such as those for towers and equipment), captive reinsurance arrangements primarily related to wireless device insurance and device payment plan agreement receivables presented separately.
(2)Included in device payment plan agreement receivables presented in Note 6. Receivables derived from the sale of equipment on a device payment plan through an authorized agent are excluded.
Contract assets primarily relate to our rights to consideration for goods or services provided to customers but for which we do not have an unconditional right at the reporting date. Under a fixed-term plan, total contract revenue is allocated between wireless service and equipment revenues. In conjunction with these arrangements, a contract asset is created, which represents the difference between the amount of equipment revenue recognized upon sale and the amount of consideration received from the customer when the performance obligation related to the transfer of control of the equipment is satisfied. The contract asset is
reclassified to accounts receivable as wireless services are provided and billed. We have the right to bill the customer as service is provided over time, which results in our right to the payment being unconditional. The contract asset balances are presented in our condensed consolidated balance sheets as Prepaid expenses and other and Other assets. We recognize the allowance for credit losses at inception and reassess quarterly based on management’s expectation of the asset’s collectability.
Contract liabilities arise when we bill our customers and receive consideration in advance of providing the goods or services promised in the contract. We typically bill service one month in advance, which is the primary component of the contract liability balance. Contract liabilities are recognized as revenue when services are provided to the customer. The contract liability balances are presented in our condensed consolidated balance sheets as Other current liabilities and Other liabilities.
The following table presents information about receivables from contracts with customers:
| | | | | | | | | | | | | | | | | | | | | | | |
| At June 30, | | At January 1, | | At June 30, | | At January 1, |
| (dollars in millions) | 2023 | | 2023 | | 2022 | | 2022 |
Receivables(1) | $ | 10,573 | | | $ | 11,274 | | | $ | 10,620 | | | $ | 10,758 | |
Device payment plan agreement receivables(2) | 16,878 | | | 16,648 | | | 14,439 | | | 12,888 | |
(1)Balances do not include receivables related to the following contracts: leasing arrangements (such as those for towers and equipment), captive reinsurance arrangements primarily related to wireless device insurance and the interest when equipment is sold to the customer by an authorized agent under a device payment plan agreement.
(2)Included in device payment plan agreement receivables presented in Note 6. Receivables derived from the sale of equipment on a device payment plan through an authorized agent are excluded.
The following table presents information about contract balances:
| | | | | | | | | | | | | | | | | | | | | | | |
| At June 30, | | At January 1, | | At June 30, | | At January 1, |
| (dollars in millions) | 2023 | | 2023 | | 2022 | | 2022 |
| Contract asset | $ | 774 | | | $ | 863 | | | $ | 880 | | | $ | 934 | |
Contract liability(1) | 8,468 | | | 8,234 | | | 7,706 | | | 7,229 | |
(1) Revenue recognized related to contract liabilities existing at January 1, 2024 and January 1, 2023 were $258 million$4.4 billion and $4.6$4.3 billion for the three and six months ended June 30,March 31, 2024 and March 31, 2023, respectively. Revenue recognized related to contract liabilities existing at January 1, 2022 were $365 million and $4.7 billion for the three and six months ended June 30, 2022, respectively.
The balances of contract assets and contract liabilities recorded in our condensed consolidated balance sheets were as follows:
| | At June 30, | | At December 31, |
| At March 31, | | | At March 31, | | At December 31, |
| (dollars in millions) | (dollars in millions) | 2023 | | 2022 | (dollars in millions) | 2024 | | 2023 |
| Assets | Assets | |
| Prepaid expenses and other | Prepaid expenses and other | $ | 542 | | | $ | 656 | |
| Prepaid expenses and other | |
| Prepaid expenses and other | |
| Other assets | Other assets | 232 | | | 207 | |
| Total | $ | 774 | | | $ | 863 | |
| Total Contract Assets | |
| | Liabilities | Liabilities | |
| Liabilities | |
| Liabilities | |
| Other current liabilities | |
| Other current liabilities | |
| Other current liabilities | Other current liabilities | $ | 6,699 | | | $ | 6,583 | |
| Other liabilities | Other liabilities | 1,769 | | | 1,651 | |
| Total | $ | 8,468 | | | $ | 8,234 | |
| Total Contract Liabilities | |
Contract Costs
Topic 606 requires the recognition of an asset for incremental costs to obtain a customer contract, which are then amortized to expense over the respective periods of expected benefit. We recognize an asset for incremental commission expenses paid to internal and external sales personnel and agents in conjunction with obtaining customer contracts. We only defer these costs when we have determined the commissions are incremental costs that would not have been incurred absent the customer contract and are expected to be recoverable. Costs to obtain a contract are amortized and recorded ratably as commission expense over the period representing the transfer of goods or services to which the assets relate. Costs to obtain wireless contracts are amortized over both of our Consumer and Business customers' estimated upgrade cycles, as such costs are typically incurred each time a customer upgrades. Costs to obtain wireline contracts are amortized as expense over the estimated customer relationship period for our Consumer customers. Incremental costs to obtain wireline contracts for our Business customers are insignificant. Costs to obtain contracts are recorded in Selling, general and administrative expense.
We also defer costs incurred to fulfill contracts that: (1) relate directly to the contract; (2) are expected to generate resources that will be used to satisfy our performance obligation under the contract; and (3) are expected to be recovered through revenue generated under the contract. Contract fulfillment costs are expensed as we satisfy our performance obligations and recorded in Cost of services. These costs principally relate to direct costs that enhance our wireline business resources, such as costs incurred to install circuits.
We determine the amortization periods for our costs incurred to obtain or fulfill a customer contract at a portfolio level due to the similarities within these customer contract portfolios.
Other costs, such as general costs or costs related to past performance obligations, are expensed as incurred.
Collectively, costs to obtain a contract and costs to fulfill a contract are referred to as deferred contract costs, and amortized over a onetwo-to-seven year period. Deferred contract costs are classified as current or non-current within Prepaid expenses and other and Other assets, respectively.
The balances of deferred contract costs included in our condensed consolidated balance sheets were as follows:
| | At June 30, | | At December 31, |
| At March 31, | | | At March 31, | | At December 31, |
| (dollars in millions) | (dollars in millions) | 2023 | | 2022 | (dollars in millions) | 2024 | | 2023 |
| Assets | Assets | |
| Prepaid expenses and other | Prepaid expenses and other | $ | 2,629 | | | $ | 2,629 | |
| Prepaid expenses and other | |
| Prepaid expenses and other | |
| Other assets | Other assets | 2,436 | | | 2,475 | |
| Total | Total | $ | 5,065 | | | $ | 5,104 | |
For the three and six months ended June 30,March 31, 2024 and March 31, 2023, we recognized expense of $791$829 million and $1.6 billion, respectively, associated with the amortization of deferred contract costs, primarily within Selling, general and administrative expense in our condensed consolidated statements of income. For the three and six months ended June 30, 2022, we recognized expense of $735$795 million, and $1.5 billion, respectively, associated with the amortization of deferred contract costs, primarily within Selling, general and administrative expense in our condensed consolidated statements of income.
We assess our deferred contract costs for impairment on a quarterly basis. We recognize an impairment charge to the extent the carrying amount of a deferred cost exceeds the remaining amount of consideration we expect to receive in exchange for the goods and services related to the cost, less the expected costs related directly to providing those goods and services that have not yet been recognized as expenses. There have beenwere no impairment charges recognized for the three and six months ended June 30, 2023March 31, 2024 or June 30, 2022.March 31, 2023.
| | |
| Note 3. Acquisitions and Divestitures |
Spectrum License Transactions
In February 2021, the Federal Communications Commission (FCC) concluded Auction 107 for C-Band wireless spectrum. In accordance with the rules applicable to the auction, Verizon is required to make payments for our allocable share of clearing costs incurred by, and incentive payments due to, the incumbent license holders associated with the auction, which are estimated to be $7.6 billion. During the sixthree months ended June 30,March 31, 2024 and March 31, 2023, and June 30, 2022, we made payments of $114$269 million and $1.4 billion,$114 million, respectively, for obligations related to clearing costs and accelerated clearing incentives. In June 2023, we incurred costs of approximately $365 million for obligations related to accelerated clearing incentives, which were accrued for as of June 30, 2023. The majority of the remaining obligations related to clearing costs and incentive payments of approximately $4.2 billion, which is inclusive of the $365 million, are expected to be due by the end of the year. We expect to continue to make payments of approximately $4.6 billion$100 million for thesethe remaining obligations throughin 2024. These payments are dependent on the incumbent license holders' accelerated clearing of the spectrum for Verizon’s use and, therefore, theThe final timing and amounts of these payments could differ based on the actual amount of incumbent holders’ execution of their clearing process. In accordancereimbursement claims and the speed with the FCC order, the clearing must be completed by December 2025.which those claims are approved and processed. The carrying value of the wireless spectrum won in Auction 107 consists of all payments required to participate and purchase licenses in the auction, including Verizon’s allocable share of clearing costs incurred by, and incentive payments due to, the incumbent license holders associated with the auction that we are obligated to pay in order to acquire the licenses, as well as capitalized interest to the extent qualifying activities have occurred.
TracFone Wireless, Inc.
On November 23, 2021 (the Acquisition Date), we completed the acquisition of TracFone Wireless, Inc. (TracFone), a provider of prepaid and value mobile services in the U.S.. Verizon acquired all of TracFone's outstanding stock in exchange for approximately $3.5 billion in cash, net of cash acquired and working capital and other adjustments, 57,596,544 shares of Verizon common stock of the Company valued at approximately $3.0 billion, and up to an additional $650 million in future cash contingent consideration related to the achievement of certain performance measures and other commercial arrangements. The fair value of the Verizon common stock was determined on the basis of its closing market price on the Acquisition Date. The estimated fair value of the contingent consideration as of the Acquisition Date was approximately $560 million and representsrepresented a Level 3 measurement as defined in ASC 820, Fair Value Measurements and Disclosures. See Note 7 for additional information. The contingent consideration payable iswas based on the achievement of certain revenue and operational targets, measured over a two-year earn out period. Contingent consideration payments were completed in January of 2024.
During the sixthree months ended June 30,March 31, 2024 and March 31, 2023, Verizon made a paymentpayments of $52 million and $102 million, respectively, related to the contingent consideration, which is reflected in Cash flows from financing activities in our condensed consolidated statements of cash flows. Contingent consideration payments are expected to continue through 2024.
During the six months ended June 30, 2022, Verizon received net cash proceeds of $248 million for the final settlement of working capital, which was included in our consideration as of the Acquisition Date.
| | |
| Note 4. Wireless Licenses, Goodwill, and Other Intangible Assets |
Wireless Licenses
The carrying amounts of our Wireless licenses are as follows:
| | At June 30, | At December 31, |
| At March 31, | | | At March 31, | At December 31, |
| (dollars in millions) | (dollars in millions) | 2023 | 2022 | (dollars in millions) | 2024 | 2023 |
| Wireless licenses | Wireless licenses | $ | 151,337 | | $ | 149,796 | |
|
During the three months ended March 31, 2024 and March 31, 2023, we made payments of $269 million and $114 million, respectively, for obligations related to clearing costs and accelerated clearing incentives for wireless licenses in connection with Auction 107. See Note 3 for additional information.
At June 30,March 31, 2024 and 2023, and 2022, approximately $38.4$13.9 billion and $49.1$38.9 billion, respectively, of wireless licenses were under development for commercial service for which we were capitalizing interest costs. We recorded approximately $905$180 million and $880$449 million of capitalized interest on wireless licenses for the sixthree months ended June 30,March 31, 2024 and 2023, and 2022, respectively.
During the sixthree months ended June 30, 2023,March 31, 2024, we renewed various wireless licenses in accordance with FCC regulations. The average renewal period for these licenses was 1110 years.
Goodwill
Changes in the carrying amount of Goodwill are as follows:
| | | | | | | | | | | | | | | | | | | | | | | |
| (dollars in millions) | Consumer | | Business | | Other | | Total |
| Balance at January 1, 2023 | $ | 21,142 | | | $ | 7,502 | | | $ | 27 | | | $ | 28,671 | |
| | | | | | | |
Reclassifications, adjustments and other (1) | — | | | 3 | | | (27) | | | (24) | |
| Balance at June 30, 2023 | $ | 21,142 | | | $ | 7,505 | | | $ | — | | | $ | 28,647 | |
| | | | | | | | | | | | | | | | | | | |
| (dollars in millions) | Consumer | | Business | | | | Total |
Balance at January 1, 2024(1) | $ | 21,177 | | | $ | 1,666 | | | | | $ | 22,843 | |
| | | | | | | |
| Reclassifications, adjustments and other | — | | | (1) | | | | | (1) | |
| Balance at March 31, 2024 | $ | 21,177 | | | $ | 1,665 | | | | | $ | 22,842 | |
(1) Includes goodwillGoodwill is net of accumulated impairment charges of $27 million,$5.8 billion related to non-strategic businesses presented within Other, recorded in Selling, general and administrative expense in our condensed consolidated statements of income for the three and six months ended June 30, 2023.Business reporting unit.
Other Intangible Assets
The following table displays the composition of Other intangible assets, net as well as the respective amortization periods:
| | | | At June 30, 2023 | | At December 31, 2022 | | At March 31, 2024 | | At December 31, 2023 |
| (dollars in millions) | (dollars in millions) | Gross
Amount | | Accumulated
Amortization | | Net
Amount | | Gross
Amount | | Accumulated
Amortization | | Net
Amount | (dollars in millions) | Gross
Amount | | Accumulated
Amortization | | Net
Amount | | Gross
Amount | | Accumulated
Amortization | | Net
Amount |
| Customer lists (5 to 13 years) | Customer lists (5 to 13 years) | $ | 4,335 | | | $ | (1,907) | | | $ | 2,428 | | | $ | 4,335 | | | $ | (1,646) | | | $ | 2,689 | |
| Non-network internal-use software (7 years) | Non-network internal-use software (7 years) | 24,247 | | | (17,210) | | | 7,037 | | | 23,421 | | | (16,397) | | | 7,024 | |
| Other (4 to 25 years) | Other (4 to 25 years) | 2,839 | | | (1,207) | | | 1,632 | | | 2,806 | | | (1,058) | | | 1,748 | |
| Total | Total | $ | 31,421 | | | $ | (20,324) | | | $ | 11,097 | | | $ | 30,562 | | | $ | (19,101) | | | $ | 11,461 | |
The amortization expense for Other intangible assets was as follows:
| | Three Months Ended | | Six Months Ended |
| | | Three Months Ended | |
| | | Three Months Ended | |
| | | Three Months Ended | |
| (dollars in millions) | (dollars in millions) | June 30, | | June 30, | (dollars in millions) | | | March 31, |
| 2024 | |
| 2023 | 2023 | $ | 653 | | | $ | 1,300 | |
| 2022 | 651 | | | 1,286 | |
The estimated future amortization expense for Other intangible assets for the remainder of the current year and next 5 years is as follows:
| | Years | Years | (dollars in millions) | Years | (dollars in millions) |
| Remainder of 2023 | $ | 1,299 | |
| 2024 | 2,398 | |
| Remainder of 2024 | |
| 2025 | 2025 | 2,198 | |
| 2026 | 2026 | 1,951 | |
| 2027 | 2027 | 1,392 | |
| 2028 | 2028 | 979 | |
| 2029 | |
Significant Debt Transactions
Debt or equity financing may be needed to fund additional investments or development activities or to maintain an appropriate capital structure to ensure our financial flexibility.
The following tables show the significant transactions involving the senior unsecured debt securities of Verizonthe Company and its subsidiaries that occurred during the three and six months ended June 30, 2023.March 31, 2024.
Tender Offers
| | | | | | | | | | | |
| (dollars in millions) | Principal Amount Purchased | | Cash Consideration(1) |
| | | |
| | | |
| | | |
| | | |
| | | |
| | | |
| | | |
| | | |
| | | |
| | | |
| | | |
| | | |
| | | |
| | | |
| | | |
| | | |
| Verizon 0.875% - 3.250% notes due 2025 - 2028 | € | 1,981 | | | $ | 2,237 | |
| | | |
| | | |
(1) The total cash consideration includes the tender offer consideration, plus any accrued and unpaid interest to the date of purchase. In addition, for securities denominated in a currency other than the U.S. dollar, cash consideration is shown on a U.S. dollar equivalent basis and includes the amount payable per the derivatives entered into in connection with the transaction. See Note 7 for additional information on cross currency swap transactions related to the transaction.
Repayments and Repurchases
| | | | | | | | | | | |
| (dollars in millions) | Principal Repaid/ Repurchased | | Amount Paid (1) |
| | | |
| | | |
| | | |
| | | |
| | | |
| | | |
| | | |
| | | |
| | | |
| | | |
| | | |
| | | |
| | | |
| | | |
| | | |
| Three Months Ended March 30, 2023 | | | |
Verizon 3.500% notes and floating rate notes due 2023 (2) | A$ | 1,050 | | | $ | 850 | |
| Open market repurchases of various Verizon notes | $ | 260 | | | 190 | |
| Three Months Ended March 30, 2023 total | | | 1,040 | |
| | | |
| Three Months Ended June 30, 2023 | | | |
Verizon 0.375% bonds due 2023 (2) | CHF | 600 | | | $ | 633 | |
| Open market repurchases of various Verizon notes | $ | 247 | | | 177 | |
| Three Months Ended June 30, 2023 total | | | 810 | |
| Six Months Ended June 30, 2023 total | | | $ | 1,850 | |
| | | |
| | | |
| | | |
| | | |
| | | |
| | | |
| | | |
| | | |
| | | |
| | | |
| | | |
| | | |
| | | |
| | | | | | | | | | | |
| (dollars in millions) | Principal Repaid/ Repurchased | | Amount Paid(1) |
| | | |
| Verizon 1.625% notes due 2024 | € | 685 | | | $ | 840 | |
| Verizon 0.750% notes due 2024 | $ | 999 | | | 1,003 | |
| Verizon floating rate notes due 2024 | 95 | | | 96 | |
| | | |
| Open market repurchases of various Verizon notes | 117 | | | 89 | |
| Total | | | $ | 2,028 | |
| | | |
| | | |
| | | |
| | | |
| | | |
| | | |
| | | |
| | | |
| | | |
| | | |
| | | |
| | | |
| | | |
(1)Represents amount paid to repay or repurchase, including any accrued interest. In addition, for securities denominated in a currency other than the U.S. dollar, amount paid is shown on a U.S. dollar equivalent basis.
(2) U.S. dollar amount paid representsbasis and includes the amount payable at maturity per the derivatives entered into in connection with the transaction. See Note 7 for additional information on cross currency swap transactions related to the repayment.transaction.
Issuances
| | | | | | | | | | | |
| (dollars in millions) | Principal Amount Issued | | Net Proceeds (1) |
| | | |
| | | |
| | | |
| | | |
| | | |
| | | |
| | | |
| | | |
| | | |
| | | |
| | | |
| | | |
| | | |
| | | |
| | | |
| Three Months Ended June 30, 2023 | | | |
Verizon 5.050% notes due 2033 (2) | $ | 1,000 | | | $ | 994 | |
| | | |
| Three and Six Months Ended June 30, 2023 total | $ | 1,000 | | | $ | 994 | |
| | | | | | | | | | | |
| (dollars in millions) | Principal Amount Issued | | Net Proceeds(1) |
| | | |
| | | |
| | | |
| | | |
| | | |
| | | |
| | | |
| | | |
| | | |
| | | |
| | | |
| | | |
| | | |
| | | |
| | | |
| | | |
| Verizon 3.500% notes due 2032 | € | 1,000 | | | $ | 1,062 | |
| Verizon 3.750% notes due 2036 | € | 1,000 | | | 1,061 | |
Verizon 5.500% notes due 2054(2) | $ | 1,000 | | | 980 | |
| Total | | | $ | 3,103 | |
(1) Net proceeds were net of underwriting discounts and other issuance costs. In addition, for securities denominated in a currency other than the U.S. dollar, net proceeds are shown on a U.S. dollar equivalent basis. See Note 7 for additional information on cross currency swap transactions related to the issuances.
(2) An amount equal to the net proceeds from these notes is expected to be used to fund, in whole or in part, certain renewable energy projects, including new and existing investments made by us during the period from JanuaryMay 1, 2023 through the maturity date of the notes.
Short-Term Borrowing and Commercial Paper Program
In March 2023, we entered into and fully drew from a $500 million short-term revolving credit facility. As of June 30, 2023, the $500 million borrowed under the facility remains outstanding.
During the sixthree months ended June 30, 2023,March 31, 2024, we issued $8.4$9.6 billion in commercial paper and we repaid $8.5$7.2 billion of commercial paper. As of June 30, 2023,March 31, 2024, we had no$2.4 billion of commercial paper outstanding. These transactions are reflected within Cash flows from financing activities in our condensed consolidated statements of cash flows.flows on a net basis.
Asset-Backed Debt
As of June 30, 2023March 31, 2024, the carrying value of our asset-backed debt was $21.3$23.3 billion. Our asset-backed debt includes Asset-Backed Notes (ABS Notes) issued to third-party investors (Investors) and loans (ABS Financing Facilities) received from banks and their conduit facilities (collectively, the Banks). Our consolidated asset-backed debt bankruptcy remote legal entities (each, an ABS Entity, or collectively, the ABS Entities) issue the debt or are otherwise party to the transaction documentation in connection with our asset-backed debt transactions. Under the terms of our asset-backed debt, Cellco Partnership (Cellco), a wholly-owned subsidiary of the Company, and certain other Company affiliates (collectively, the Originators) transfer device payment plan agreement receivables and certain other receivables (collectively referred to as certain receivables) or a participation interest in certain other receivables to one of the ABS Entities, which in turn transfers such receivables and participation interest to another ABS Entity that issues the debt. Verizon entities retain the equity interests and residual interests, as applicable, in the ABS Entities, which represent the rights to all funds not needed to make required payments on the asset-backed debt and other related payments and expenses.
Our asset-backed debt is secured by the transferred receivables and participation interest, and future collections on such receivables.receivables and underlying receivables related to such participation interest. These receivables and participation interest transferred to the ABS Entities and related assets, consisting primarily of restricted cash, will only be available for payment of asset-backed debt and expenses related thereto, payments to the Originators in respect of additional transfers of certain
receivables and participation interest, and other obligations arising from our asset-backed debt transactions, and will not be available to pay other obligations or claims of Verizon’s creditors until the associated asset-backed debt and other obligations are
satisfied. The Investors or Banks, as applicable, which hold our asset-backed debt have legal recourse to the assets securing the debt, but do not have any recourse to Verizon with respect to the payment of principal and interest on the debt. Under a parent support agreement, the Company has agreed to guarantee certain of the payment obligations of Cellco and the Originators to the ABS Entities.
Cash collections on the receivables and on the underlying receivables related to the participation interest collateralizing our asset-backed debt securities are required at certain specified times to be placed into segregated accounts. Deposits to the segregated accounts are considered restricted cash and are included in Prepaid expenses and other and Other assets in our condensed consolidated balance sheets.
Proceeds from our asset-backed debt transactions are reflected in Cash flows from financing activities in our condensed consolidated statements of cash flows. The asset-backed debt issued is included in Debt maturing within one year and Long-term debt in our condensed consolidated balance sheets.
ABS Notes
During the sixthree months ended June 30, 2023March 31, 2024, we completed the following ABS Notes transactions:
| | (dollars in millions) | (dollars in millions) | Interest Rates % | | Expected Weighted-average Life to Maturity (in years) | Principal Amount Issued | (dollars in millions) | Interest Rates % | | Expected Weighted-average Life to Maturity (in years) | Principal Amount Issued |
| January 2023 | |
| Series 2023-1 | |
| January 2024 | |
| Series 2024-1 | |
| Series 2024-1 | |
| Series 2024-1 | |
| A-1a Senior class notes | |
| A-1a Senior class notes | |
| A-1a Senior class notes | |
| A-1b Senior class notes | |
| B Junior class notes | |
| C Junior class notes | |
| | Series 2024-2 | |
| Series 2024-2 | |
| Series 2024-2 | |
| A Senior class notes | |
| A Senior class notes | |
| A Senior class notes | A Senior class notes | 4.490 | | 2.98 | $ | 891 | |
| B Junior class notes | B Junior class notes | 4.740 | | 2.98 | — | |
| C Junior class notes | C Junior class notes | 4.980 | | 2.98 | 41 | |
| January 2023 total | | 932 | |
| | April 2023 | |
| Series 2023-2 | |
| A Senior class notes | 4.890 | | 1.99 | 891 | |
| B Junior class notes | 5.130 | | 1.99 | — | |
| C Junior class notes | 5.380 | | 1.99 | 41 | |
| | Series 2023-3 | |
| A Senior class notes | 4.730 | | 4.99 | 268 | |
| B Junior class notes | 4.970 | | 4.99 | — | |
| C Junior class notes | 5.220 | | 4.99 | 12 | |
| April 2023 total | | 1,212 | |
| | June 2023 | |
| Series 2023-4 | |
| A-1a Senior fixed rate class notes | 5.160 | | 2.97 | 538 | |
| A-1b Senior floating rate class notes | Compounded SOFR + 0.850 | | 2.97 | 175 | |
| B Junior class notes | 5.400 | | 2.97 | — | |
| C Junior class notes | 5.650 | | 2.97 | 33 | |
| June 2023 total | | 746 | |
| Total | Total | | $ | 2,890 | |
|
(1) Compounded Secured Overnight Financing Rate (SOFR) is calculated using SOFR as published by the Federal Reserve Bank of New York in accordance with the terms of such notes. Compounded SOFR for the interest payment made in March 2024 was 5.319%.
Under the terms of each series of ABS Notes outstanding as of June 30, 2023,March 31, 2024, there is a revolving period of up to 18 months, two years, three years, or five years, as applicable, during which we may transfer additional receivables to the ABS Entity. During the sixthree months ended June 30, 2023March 31, 2024, we made aggregate principal repayments of $1.7 billion on$508 million in connection with an anticipated redemption of ABS Notes and notes that have entered the amortization period, including payments in connection with any note redemptions.
In July 2023, in connection with an anticipated redemptionApril 2024, we issued $875 million aggregate principal amount of senior and junior ABS Notes, we madewith a principal payment, in whole, for $900 million.blended interest rate of approximately 5.370%, through an ABS Entity.
ABS Financing Facilities
Under the two loan agreements outstanding in connection with the ABS Financing Facility originally entered into in December 2021 and previouslymost recently renewed in 20222023 (2021 ABS Financing Facility), we borrowed an additional $325 million in March 2023 andprepaid an aggregate of $700$900 million in April 2023.January 2024 and borrowed an additional $600 million in March 2024. The aggregate outstanding balance under the 2021 ABS Financing Facility was $7.6$8.2 billion as of June 30, 2023.March 31, 2024. In April 2024, we prepaid an aggregate of $900 million under a loan agreement outstanding in connection with the 2021 ABS Financing Facility.
In March 2023, we borrowed an additional $500 million underUnder the loan agreement outstanding in connection with the ABS Financing Facility that we originally entered into in 2022 and most recently renewed in 2023 (2022 ABS Financing Facility).T, the aggregate outstanding balance under the 2022 ABS Financing Facility was $2.5$3.0 billion as of June 30, 2023March 31, 2024.
Variable Interest Entities (VIEs)
The ABS Entities meet the definition of a VIE for which we have determined that we are the primary beneficiary as we have both the power to direct the activities of the entity that most significantly impact the entity’s performance and the obligation to absorb losses or the right to receive benefits of the entity. Therefore, the assets, liabilities and activities of the ABS Entities are
consolidated in our financial results and are included in amounts presented on the face of our condensed consolidated balance sheets.
The assets and liabilities related to our asset-backed debt arrangements included in our condensed consolidated balance sheets were as follows:
| | At June 30, | | At December 31, |
| At March 31, | | | At March 31, | | At December 31, |
| (dollars in millions) | (dollars in millions) | 2023 | | 2022 | (dollars in millions) | 2024 | | 2023 |
| Assets | Assets | |
| Accounts receivable, net | |
| Accounts receivable, net | |
| Accounts receivable, net | Accounts receivable, net | $ | 14,143 | | | $ | 13,906 | |
| Prepaid expenses and other | Prepaid expenses and other | 1,469 | | | 1,409 | |
| Other assets | Other assets | 11,468 | | | 9,894 | |
| | Liabilities | Liabilities | |
| Liabilities | |
| Liabilities | |
| Accounts payable and accrued liabilities | |
| Accounts payable and accrued liabilities | |
| Accounts payable and accrued liabilities | Accounts payable and accrued liabilities | 24 | | | 22 | |
| Debt maturing within one year | Debt maturing within one year | 9,593 | | | 6,809 | |
| Long-term debt | Long-term debt | 11,749 | | | 13,199 | |
The Accounts receivable, net amounts above does not include underlying receivables for which a participation interest has been transferred to the ABS Entities. See Note 6 for for additional information on certain receivables and participation interest used to secure asset-backed debt.
Long-Term Credit Facilities
| | At June 30, 2023 | |
| | | | | At March 31, 2024 | |
| | | | | At March 31, 2024 | |
| | | | | At March 31, 2024 | |
| (dollars in millions) | |
| (dollars in millions) | |
| (dollars in millions) | (dollars in millions) | Maturities | | Facility Capacity | | Unused Capacity | | Principal Amount Outstanding | |
Verizon revolving credit facility (1) | Verizon revolving credit facility (1) | 2026 | | $ | 9,500 | | | $ | 9,455 | | | $ | — | | |
Verizon revolving credit facility(1) | |
Verizon revolving credit facility(1) | |
Various export credit facilities(2) | |
Various export credit facilities(2) | |
Various export credit facilities (2) | Various export credit facilities (2) | 2024 - 2031 | | 11,000 | | | 486 | | | 6,720 | | |
| Total | Total | | $ | 20,500 | | | $ | 9,941 | | | $ | 6,720 | | |
| Total | |
| Total | |
(1)The revolving credit facility does not require us to comply with financial covenants or maintain specified credit ratings, and it permits us to borrow even if our business has incurred a material adverse change. The revolving credit facility provides for the issuance of letters of credit. As of June 30, 2023, March 31, 2024, there have been no drawings against the $9.5 billion revolving credit facility since its inception.
(2) During the sixthree months ended June 30,March 31, 2024, there were no drawings from these facilities. During the three months ended March 31, 2023, and 2022, we drew down $515 million and $2.0 billion, respectively, from these facilities. Borrowings under certain of these facilities are amortizedrepaid semi-annually in equal installments up to the applicable maturity dates. Maturities reflect maturity dates of principal amounts outstanding. Any amounts borrowed under these facilities and subsequently repaid cannot be reborrowed.
In March 2024, we amended our $9.5 billion revolving credit facility to increase the capacity to $12.0 billion and extended its maturity to 2028.
Non-Cash Transactions
During the sixthree months ended June 30, 2023March 31, 2024 and 2022,2023, we financed, primarily through alternative financing arrangements, the purchase of approximately $719$463 million and $321$284 million, respectively, of long-lived assets consisting primarily of network equipment. As of June 30, 2023March 31, 2024 and December 31, 2022, $2.22023, $2.4 billion and $1.7$2.2 billion, respectively, relating to these financing arrangements, including those entered into in prior years and liabilities assumed through acquisitions, remained outstanding. These purchases are non-cash financing activities and therefore are not reflected within Capital expenditures in our condensed consolidated statements of cash flows.
Net Debt Extinguishment Gains (Losses)
During the three and six months ended June 30,March 31, 2024 and 2023 we recorded debt extinguishment gains of $69 million and $139 million, respectively. During the three months ended June 30, 2022, we recorded debt extinguishment gains of $50 million. During the six months ended June 30, 2022,, we recorded net debt extinguishment lossesgains of $1.2 billion.$110 million and $70 million, respectively. The net gains and losses are recorded in Other income, (expense), net in our condensed consolidated statements of income. Additionally, during the three months ended March 31, 2024 and 2023, we recorded insignificant transaction fees and interest expense as a result of the debt extinguishments. The total debt extinguishmentgains and losses are reflected within Other, net cash flow from operating activities, and the portion ofcash payments to extinguish the gains and losses representing cash paymentsdebt are reflected within Other, net cash flow from financing activities in our condensed consolidated statements of cash flows.
Guarantees
We guarantee the debentures of our operating telephone company subsidiaries. As of June 30, 2023March 31, 2024, $614 million aggregate principal amount of these obligations remained outstanding. Each guarantee will remain in place for the life of the obligation
unless terminated pursuant to its terms, including the operating telephone company no longer being a wholly-owned subsidiary of the Company.
Debt Covenants
We and our consolidated subsidiaries are in compliance with all of our restrictive covenants in our debt agreements.
| | |
| Note 6. Device Payment Plan Agreement and Wireless Service Receivables |
The following table presents information about accounts receivable, net of allowances, recorded in our condensed consolidated balance sheet:
| | At June 30, 2023 |
| At March 31, 2024 | | | At March 31, 2024 |
| (dollars in millions) | (dollars in millions) | Device payment plan agreement | | Wireless
service | | Other receivables(1) | | Total | (dollars in millions) | Device payment plan agreement | | Wireless
service | | Other receivables(1) | | Total |
| Accounts receivable | Accounts receivable | $ | 12,810 | | | $ | 5,202 | | | $ | 6,096 | | | $ | 24,108 | |
| Less Allowance for credit losses | Less Allowance for credit losses | 502 | | | 188 | | | 232 | | | 922 | |
| Accounts receivable, net of allowance | Accounts receivable, net of allowance | $ | 12,308 | | | $ | 5,014 | | | $ | 5,864 | | | $ | 23,186 | |
(1) Other receivables primarily include wireline and other receivables, of which the allowances are individually insignificant.
Included in Other assets and Accounts receivable, net at June 30, 2023March 31, 2024 and December 31, 2022,2023, are net device payment plan agreement receivables and net wireless service receivables of $25.4$27.6 billion and $23.6$26.1 billion, respectively, which have been transferred to ABS Entities and continue to be reported in our condensed consolidated balance sheets. Included in Accounts receivable, net at March 31, 2024 and December 31, 2023, are net other receivables of $767 million and $911 million, respectively, on which a participation interest has been transferred to ABS Entities and continue to be reported in our condensed consolidated balance sheets. See Note 5 for additional information. We believe the carrying value of these receivables approximate their fair value using a Level 3 expected cash flow model.
Under the Verizon device payment program, our eligible wireless customers purchase wireless devices under a device payment plan agreement. Customers that activate service on devices purchased under the device payment program pay lower service fees as compared to those under our fixed-term service plans, and their device payment plan charge is included on their wireless monthly bill. WeWhile we no longer offer Consumer customers new fixed-term subsidized service plans for devices; however,devices, we continue to offer subsidized plans to our Business customers. We also continue to service existing plans for customers who have not yet purchased and activated devices under the Verizon device payment program.
Wireless Device Payment Plan Agreement Receivables
The following table displays both the current and non-current portions of device payment plan agreement receivables, net, recognized in our condensed consolidated balance sheets:
| | At June 30, | | At December 31, |
| At March 31, | | | At March 31, | | At December 31, |
| (dollars in millions) | (dollars in millions) | 2023 | | 2022 | (dollars in millions) | 2024 | | 2023 |
| Device payment plan agreement receivables, gross | Device payment plan agreement receivables, gross | $ | 26,521 | | | $ | 26,188 | |
| Unamortized imputed interest | Unamortized imputed interest | (579) | | | (479) | |
| Device payment plan agreement receivables, at amortized cost | Device payment plan agreement receivables, at amortized cost | 25,942 | | | 25,709 | |
Allowance (1) | Allowance (1) | (1,007) | | | (881) | |
| Device payment plan agreement receivables, net | Device payment plan agreement receivables, net | $ | 24,935 | | | $ | 24,828 | |
| | Classified in our condensed consolidated balance sheets: | Classified in our condensed consolidated balance sheets: | |
| Classified in our condensed consolidated balance sheets: | |
| Classified in our condensed consolidated balance sheets: | |
| Accounts receivable, net | |
| Accounts receivable, net | |
| Accounts receivable, net | Accounts receivable, net | $ | 12,308 | | | $ | 12,929 | |
| Other assets | Other assets | 12,627 | | | 11,899 | |
| Device payment plan agreement receivables, net | Device payment plan agreement receivables, net | $ | 24,935 | | | $ | 24,828 | |
(1) Includes allowance for both short-term and long-term device payment plan agreement receivables.
For indirect channel wireless contracts with customers, we impute risk adjusted interest on the device payment plan agreement receivables. We record the imputed interest as a reduction to the related accounts receivable. The associated interest income, which is included within Service revenues and other in our condensed consolidated statements of income, is recognized over the financed device payment term.
Promotions
In connection with certain device payment plan agreements, we may offer a promotion to allow our customers to upgrade to a new device after paying down a certain specified portion of the required device payment plan agreement amount as well as trading in their device in good working order. When a customer enters into a device payment plan agreement with the right to upgrade to a new device, we account for this trade-in right as a guarantee obligation. We recognize a liability measured at fair value for the customer’s right to trade in the device which is determined by considering several factors, including the weighted-average selling prices obtained in recent resales of similar devices eligible for trade-in. At June 30, 2023 and December 31, 2022, the amount of the guarantee liability was insignificant and $54 million, respectively.
We may offer certain promotions that allow a customer to trade in their owned device in connection with the purchase of a new device. Under these types of promotions, the customer receives a credit for the value of the trade-in device. At June 30, 2023March 31, 2024 and December 31, 2022,2023, the amount of trade-in liability was $449$522 million and $562$566 million, respectively.
In addition, we may provide the customer with additional future billing credits that will be applied against the customer’s monthly bill as long as service is maintained. These future billing credits are accounted for as consideration payable to a customer and are included in the determination of total transaction price, resulting in a contract liability.
Device payment plan agreement receivables, net, disclosed in the table above, does not reflect the trade-in liability, additional future credits or the guarantee liability.
Origination of Device Payment Plan Agreements
When originating device payment plan agreements, we use internal and external data sources to create a credit risk score to measure the credit quality of a customer and to determine eligibility for the device payment program. Verizon’s experience has been that the payment attributes of longer tenured customers are highly predictive for estimating their reliability to make future payments. Customers with longer tenures tend to exhibit similar risk characteristics to other customers with longer tenures, and receivables due from customers with longer tenures tend to perform better than receivables from customers that have not previously been Verizon customers. As a result of this experience, we make initial lending decisions based upon whether the customers are "established customers" or "short-tenured customers." If a Consumer customer has been a customer for 45 days or more, or if a Business customer has been a customer for 12 months or more, the customer is considered an "established customer." For established customers, the credit decision and ongoing credit monitoring processes rely on a combination of internal and external data sources. If a Consumer customer has been a customer less than 45 days, or a Business customer has been a customer for less than 12 months, the customer is considered a "short-tenured customer." For short-tenured customers, the credit decision and credit monitoring processes rely more heavily on external data sources.
Available external credit data from credit reporting agencies along with internal data are used to create custom credit risk scores for Consumer customers. The custom credit risk score is generated automatically from the applicant’s credit data using proprietary custom credit models. The credit risk score measures the likelihood that the potential customer will become severely delinquent and be disconnected for non-payment. For a small portion of short-tenured customer applications, a traditional credit report is not available from one of the national credit reporting agencies because the potential customer does not have sufficient credit history. In those instances, alternative credit data is used for the risk assessment. For Business customers, we also verify the existence of the business with external data sources.
Based on the custom credit risk score, we assign each customer a credit class, each of which has specified offers of credit. This includes an account level spending limit and a maximum amount of credit allowed per device for Consumer customers or a required down payment percentage for Business customers.
Credit Quality Information
Subsequent to origination, we assess indicators for the quality of our wireless device payment plan agreement portfolio using two models, one for new customers and one for existing customers. The model for new customers pools all Consumer and Business wireless customers based on less than 210 days as "new customers." The model for existing customers pools all Consumer and Business wireless customers based on 210 days or more as "existing customers."
The following table presents device payment plan agreement receivables, at amortized cost, and gross write-offs recorded, as of and for the sixthree months ended June 30, 2023,March 31, 2024, by credit quality indicator and year of origination:
| | Year of Origination(1) | |
| Year of Origination(1) | |
| Year of Origination(1) | |
| Year of Origination(1) | |
| (dollars in millions) | |
| (dollars in millions) | |
| (dollars in millions) | (dollars in millions) | 2023 | | 2022 | | 2021 and prior | | | Total | 2024 | | 2023 | | 2022 and prior | | | | Total |
| Device payment plan agreement receivables, at amortized cost | Device payment plan agreement receivables, at amortized cost | | | |
| New customers | |
| New customers | |
| New customers | New customers | $ | 1,573 | | | $ | 1,964 | | | $ | 360 | | | | $ | 3,897 | |
| Existing customers | Existing customers | 7,087 | | | 12,656 | | | 2,302 | | | | 22,045 | |
| Total | Total | $ | 8,660 | | | $ | 14,620 | | | $ | 2,662 | | | | $ | 25,942 | |
| Gross write-offs | Gross write-offs | | | |
| New customers | New customers | $ | 61 | | | $ | 269 | | | $ | 42 | | | | $ | 372 | |
| New customers | |
| New customers | |
| Existing customers | Existing customers | 3 | | | 116 | | | 69 | | | | 188 | |
| Total | Total | $ | 64 | | | $ | 385 | | | $ | 111 | | | | $ | 560 | |
(1) Includes accounts that have been suspended at a point in time.
The data presented in the table above was last updated on June 30, 2023.March 31, 2024.
We assess indicators for the quality of our wireless service receivables portfolio as one overall pool. The following table presents wireless service receivables, at amortized cost, and gross write-offs recorded, as of and for the sixthree months ended June 30, 2023,March 31, 2024, by year of origination:
| | Year of Origination | |
| Year of Origination | |
| Year of Origination | |
| Year of Origination | |
| (dollars in millions) | |
| (dollars in millions) | |
| (dollars in millions) | (dollars in millions) | 2023 | | 2022 and prior | | | Total | 2024 | | 2023 and prior | | | | Total |
| | Wireless service receivables, at amortized cost | Wireless service receivables, at amortized cost | $ | 5,078 | | | $ | 124 | | | | $ | 5,202 | |
| Wireless service receivables, at amortized cost | |
| Wireless service receivables, at amortized cost | |
| Gross write-offs | Gross write-offs | 74 | | | 150 | | | | 224 | |
The data presented in the table above was last updated on June 30, 2023.March 31, 2024.
Allowance for Credit Losses
The credit quality indicators are used in determining the estimated amount and the timing of expected credit losses for the device payment plan agreement and wireless service receivables portfolios.
For device payment plan agreement receivables, we record bad debt expense based on a default and loss calculation using our proprietary loss model. The expected loss rate is determined based on customer credit scores and other qualitative factors as noted above. The loss rate is assigned individually on a customer by customer basis and the custom credit scores are then aggregated by vintage and used in our proprietary loss model to calculate the weighted-average loss rate used for determining the allowance balance.
We monitor the collectability of our wireless service receivables as one overall pool. Wireline service receivables are disaggregated and pooled by the following types of customers and related contracts: consumer, small and medium business, enterprise, public sector and wholesale. For wireless service receivables and wireline consumer and small and medium business receivables, the allowance is calculated based on a 12 month rolling average write-off balance multiplied by the average life-cycle of an account from billing to write-off. The risk of loss is assessed over the contractual life of the receivables and is adjusted based on the historical loss amounts for current and future conditions based on management’s qualitative considerations. For enterprise, public sector and wholesale wireline receivables, the allowance for credit losses is based on historical write-off experience and individual customer credit risk, if applicable.
Activity in the allowance for credit losses by portfolio segment of receivables was as follows:
| | (dollars in millions) | (dollars in millions) | Device Payment Plan Agreement Receivables(1) | | Wireless Service Plan Receivables | (dollars in millions) | Device Payment Plan Agreement Receivables(1) | | Wireless Service Plan Receivables |
| Balance at January 1, 2023 | $ | 881 | | | $ | 143 | |
| Balance at January 1, 2024 | |
| | | Current period provision for expected credit losses | |
| | Current period provision for expected credit losses | |
| | Current period provision for expected credit losses | Current period provision for expected credit losses | 669 | | | 250 | |
| Write-offs charged against the allowance | Write-offs charged against the allowance | (560) | | | (224) | |
| Recoveries collected | Recoveries collected | 17 | | | 19 | |
| Balance at June 30, 2023 | $ | 1,007 | | | $ | 188 | |
| Balance at March 31, 2024 | |
(1) Includes allowance for both short-term and long-term device payment plan agreement receivables.
We monitor delinquency and write-off experience based on the quality of our device payment plan agreement and wireless service receivables portfolios. The extent of our collection efforts with respect to a particular customer are based on the results of our proprietary custom internal scoring models that analyze the customer’s past performance to predict the likelihood of the customer falling further delinquent. These custom scoring models assess a number of variables, including origination
characteristics, customer account history and payment patterns. Since our customers’ behaviors may be impacted by general economic conditions, we analyzed whether changes in macroeconomic conditions impact our credit loss experience and have concluded that our credit loss estimates are generally not materially impacted by reasonable and supportable forecasts of future economic conditions. Based on the score derived from these models, accounts are grouped by risk category to determine the collection strategy to be applied to such accounts. For device payment plan agreement receivables and wireless service receivables, we consider an account to be delinquent and in default status if there are unpaid charges remaining on the account on the day after the bill’s due date. The risk class determines the speed and severity of the collections effort including initiatives taken to facilitate customer payment.
The balance and aging of the device payment plan agreement receivables, at amortized cost, were as follows:
| | | | | | | |
| At June 30,March 31, | | |
| (dollars in millions) | 20232024 | | |
| Unbilled | $ | 24,71227,199 | | | |
| Billed: | | | |
| Current | 1,0071,014 | | | |
| Past due | 223284 | | | |
| Device payment plan agreement receivables, at amortized cost | $ | 25,94228,497 | | | |
| | |
| Note 7. Fair Value Measurements and Financial Instruments |
Recurring Fair Value Measurements
The following table presents the balances of assets and liabilities measured at fair value on a recurring basis as of June 30, 2023:March 31, 2024:
| | (dollars in millions) | (dollars in millions) | Level 1(1) | | Level 2(2) | | Level 3(3) | | Total | (dollars in millions) | Level 1(1) | | Level 2(2) | | Level 3(3) | | Total |
| Assets: | Assets: | |
| Prepaid expenses and other: | Prepaid expenses and other: | |
| Prepaid expenses and other: | |
| Prepaid expenses and other: | |
| Fixed income securities | |
| Fixed income securities | |
| Fixed income securities | Fixed income securities | $ | — | | | $ | 41 | | | $ | — | | | $ | 41 | |
| | Cross currency swaps | Cross currency swaps | — | | | 4 | | | — | | | 4 | |
| Foreign exchange forwards | — | | | 1 | | | — | | | 1 | |
| | Cross currency swaps | |
| | Cross currency swaps | |
| | Interest rate caps | |
| Interest rate caps | |
| Interest rate caps | Interest rate caps | — | | | 76 | | | — | | | 76 | |
| | Other assets: | Other assets: | |
| | Other assets: | |
| | Other assets: | |
| | Fixed income securities | |
| | Fixed income securities | |
| | Fixed income securities | Fixed income securities | — | | | 269 | | | — | | | 269 | |
| | Cross currency swaps | Cross currency swaps | — | | | 455 | | | — | | | 455 | |
| Cross currency swaps | |
| Cross currency swaps | |
| | Interest rate caps | |
| Interest rate caps | |
| Interest rate caps | Interest rate caps | — | | | 21 | | | — | | | 21 | |
| | Total | Total | $ | — | | | $ | 867 | | | $ | — | | | $ | 867 | |
| | | Total | |
| | Total | |
| | Liabilities: | |
| Liabilities: | |
| Liabilities: | Liabilities: | |
| Other current liabilities: | Other current liabilities: | |
| Other current liabilities: | |
| Other current liabilities: | |
| Interest rate swaps | |
| Interest rate swaps | |
| Interest rate swaps | Interest rate swaps | $ | — | | | $ | 885 | | | $ | — | | | $ | 885 | |
| Cross currency swaps | Cross currency swaps | — | | | 354 | | | — | | | 354 | |
| Foreign exchange forwards | Foreign exchange forwards | — | | | 5 | | | — | | | 5 | |
| Interest rate caps | Interest rate caps | — | | | 76 | | | — | | | 76 | |
| | Contingent consideration | — | | | — | | | 202 | | | 202 | |
| | Other liabilities: | Other liabilities: | |
| | Other liabilities: | |
| | Other liabilities: | |
| Interest rate swaps | |
| Interest rate swaps | |
| Interest rate swaps | Interest rate swaps | — | | | 3,666 | | | — | | | 3,666 | |
| Cross currency swaps | Cross currency swaps | — | | | 2,607 | | | — | | | 2,607 | |
| | Interest rate caps | |
| Interest rate caps | |
| Interest rate caps | Interest rate caps | — | | | 21 | | | — | | | 21 | |
| | Total | Total | $ | — | | | $ | 7,614 | | | $ | 202 | | | $ | 7,816 | |
| | Total | |
| | Total | |
(1)Quoted prices in active markets for identical assets or liabilities.
(2)Observable inputs other than quoted prices in active markets for identical assets and liabilities.
(3)Unobservable pricing inputs in the market.
The following table presents the balances of assets and liabilities measured at fair value on a recurring basis as of December 31, 2022:2023:
| | (dollars in millions) | (dollars in millions) | Level 1(1) | | Level 2(2) | | Level 3(3) | | Total | (dollars in millions) | Level 1(1) | | Level 2(2) | | Level 3(3) | | Total |
| Assets: | Assets: | |
| Prepaid expenses and other: | Prepaid expenses and other: | |
| Prepaid expenses and other: | |
| Prepaid expenses and other: | |
| Fixed income securities | |
| Fixed income securities | |
| Fixed income securities | Fixed income securities | $ | — | | | $ | 37 | | | $ | — | | | $ | 37 | |
| | | Cross currency swaps | |
| | Cross currency swaps | |
| | Cross currency swaps | Cross currency swaps | — | | | 42 | | | — | | | 42 | |
| Foreign exchange forwards | Foreign exchange forwards | — | | | 6 | | | — | | | 6 | |
| Interest rate caps | Interest rate caps | — | | | 63 | | | — | | | 63 | |
| | Other assets: | Other assets: | |
| | Other assets: | |
| | Other assets: | |
| | Fixed income securities | Fixed income securities | — | | | 349 | | | — | | | 349 | |
| | Fixed income securities | |
| | Fixed income securities | |
| | Cross currency swaps | |
| Cross currency swaps | |
| Cross currency swaps | Cross currency swaps | — | | | 263 | | | — | | | 263 | |
| Interest rate caps | Interest rate caps | — | | | 30 | | | — | | | 30 | |
| | Total | Total | $ | — | | | $ | 790 | | | $ | — | | | $ | 790 | |
| | | Total | |
| | Total | |
| | Liabilities: | |
| Liabilities: | |
| Liabilities: | Liabilities: | |
| Other current liabilities: | Other current liabilities: | |
| Other current liabilities: | |
| Other current liabilities: | |
| Interest rate swaps | |
| Interest rate swaps | |
| Interest rate swaps | Interest rate swaps | $ | — | | | $ | 731 | | | $ | — | | | $ | 731 | |
| | Cross currency swaps | Cross currency swaps | — | | | 346 | | | — | | | 346 | |
| Cross currency swaps | |
| Cross currency swaps | |
| Foreign exchange forwards | |
| Interest rate caps | Interest rate caps | — | | | 63 | | | — | | | 63 | |
| Foreign exchange forwards | — | | | 1 | | | — | | | 1 | |
| | Contingent consideration | |
| | Contingent consideration | |
| | Contingent consideration | Contingent consideration | — | | | — | | | 274 | | | 274 | |
| Other liabilities: | Other liabilities: | |
| Interest rate swaps | Interest rate swaps | — | | | 3,902 | | | — | | | 3,902 | |
| Interest rate swaps | |
| Interest rate swaps | |
| Cross currency swaps | Cross currency swaps | — | | | 3,295 | | | — | | | 3,295 | |
| | Interest rate caps | |
| Interest rate caps | |
| Interest rate caps | Interest rate caps | — | | | 30 | | | — | | | 30 | |
| | Contingent consideration | — | | | — | | | 43 | | | 43 | |
| | Total | Total | $ | — | | | $ | 8,368 | | | $ | 317 | | | $ | 8,685 | |
| | Total | |
| | Total | |
(1)Quoted prices in active markets for identical assets or liabilities.
(2)Observable inputs other than quoted prices in active markets for identical assets and liabilities.
(3)Unobservable pricing inputs in the market.
Certain of our equity investments do not have readily determinable fair values and are excluded from the tables above. Such investments are measured at cost, less any impairment, plus or minus changes resulting from observable price changes in orderly transactions for an identical or similar investment of the same issuer and are included in Investments in unconsolidated businesses in our condensed consolidated balance sheets. As of June 30, 2023both March 31, 2024 and December 31, 2022,2023, the carrying amount of our investments without readily determinable fair values was $796 million and $804 million, respectively.$764 million. During both the three and six months ended June 30, 2023,March 31, 2024, there were insignificant adjustments due to observable price changes. During the threechanges and six months ended June 30, 2023, there were no and an insignificant amountamounts of impairment charges, respectively.charges. As of June 30, 2023,March 31, 2024, cumulative adjustments due to observable price changes and impairment charges were approximately $165$209 million and $88$99 million, respectively.
Verizon hashad a liability for contingent consideration related to its acquisition of TracFone, completed in November 2021. The fair value iswas calculated using a probability-weighted discounted cash flow model and representsrepresented a Level 3 measurement. Level 3 instruments include valuation based on unobservable inputs reflecting our own assumptions, consistent with reasonably available assumptions made by other market participants. Subsequent to the Acquisition Date, at each reporting date, the contingent consideration liability iswas remeasured to fair value. Contingent consideration payments were completed in January of 2024. During the sixthree months ended June 30,March 31, 2024 and March 31, 2023, we made a paymentpayments of $52 million $102and $102 million, respectively, related to the contingent consideration. See Note 3 for additional information.
Fixed income securities consist primarily of investments in municipal bonds. The valuation of the fixed income securities is based on the quoted prices for similar assets in active markets or identical assets in inactive markets or models that apply inputs from observable market data. The valuation determines that these securities are classified as Level 2.
Derivative contracts are valued using models based on readily observable market parameters for all substantial terms of our derivative contracts and thus are classified within Level 2. We use mid-market pricing for fair value measurements of our derivative instruments. Our derivative instruments are recorded on a gross basis.
We recognize transfers between levels of the fair value hierarchy as of the end of the reporting period.
Fair Value of Short-term and Long-term Debt
The fair value of our debt is determined using various methods, including quoted prices for identical debt instruments, which is a Level 1 measurement, as well as quoted prices for similar debt instruments with comparable terms and maturities, which is a Level 2 measurement.
The fair value of our short-term and long-term debt, excluding finance leases, was as follows:
| | | | | | | | | | | | | | | | | | | | | | | | | | | | | |
| | | | Fair Value |
| (dollars in millions) | Carrying
Amount | | Level 1 | | Level 2 | | Level 3 | | Total |
| At December 31, 2022 | $ | 148,906 | | | $ | 84,385 | | | $ | 54,656 | | | $ | — | | | $ | 139,041 | |
| At June 30, 2023 | 150,756 | | | 86,843 | | | 55,667 | | | — | | | 142,510 | |
| | | | | | | | | | | | | | | | | | | | | | | | | | | | | |
| | | | Fair Value |
| (dollars in millions) | Carrying
Amount | | Level 1 | | Level 2 | | Level 3 | | Total |
| At March 31, 2024 | $ | 149,515 | | | $ | 86,574 | | | $ | 58,724 | | | $ | — | | | $ | 145,298 | |
| At December 31, 2023 | 148,583 | | | 86,806 | | | 58,804 | | | — | | | 145,610 | |
| | | | | | | | | |
Derivative Instruments
We enter into derivative transactions primarily to manage our exposure to fluctuations in foreign currency exchange rates and interest rates. We employ risk management strategies, which may include the use of a variety of derivatives including interest rate swaps, cross currency swaps, forward starting interest rate swaps, treasury rate locks, interest rate caps, swaptions and foreign exchange forwards. We do not hold derivatives for trading purposes.
The following table sets forth the notional amounts of our outstanding derivative instruments:
| | At June 30, | | At December 31, |
| At March 31, | | | At March 31, | | At December 31, |
| (dollars in millions) | (dollars in millions) | 2023 | | 2022 | (dollars in millions) | 2024 | | 2023 |
| Interest rate swaps | Interest rate swaps | $ | 26,071 | | | $ | 26,071 | |
| Cross currency swaps | Cross currency swaps | 33,526 | | | 34,976 | |
| | Foreign exchange forwards | Foreign exchange forwards | 980 | | | 920 | |
| | Foreign exchange forwards | |
| | | Foreign exchange forwards | |
|
The following tables summarize the activities of our designated derivatives:
| | | | | | | | | | | | | | | | | | | | | | | |
| Three Months Ended | | Six Months Ended |
| June 30, | | June 30, |
| (dollars in millions) | 2023 | | 2022 | | 2023 | | 2022 |
| Interest Rate Swaps: | | | | | | | |
| Notional value entered into | $ | — | | | $ | 500 | | | $ | — | | | $ | 7,155 | |
| Notional value settled | — | | | — | | | — | | | 863 | |
| | | | | | | |
| | | | | | | |
| Pre-tax gain recognized in Interest expense | 2 | | | — | | | 1 | | | — | |
| Cross Currency Swaps: | | | | | | | |
| Notional value entered into | — | | | — | | | — | | | — | |
| Notional value settled | 612 | | | — | | | 1,450 | | | — | |
Pre-tax loss recognized in Other comprehensive income (loss) (1) | N/A | | N/A | | N/A | | (430) | |
| Pre-tax gain (loss) on cross currency swaps recognized in Interest expense | 370 | | | (1,808) | | | 725 | | | (1,808) | |
| Pre-tax gain (loss) on hedged debt recognized in Interest expense | (370) | | | 1,808 | | | (725) | | | 1,808 | |
| Excluded components recognized in Other comprehensive income (loss) | 420 | | | (340) | | | 42 | | | (340) | |
| Initial value of the excluded component amortized into Interest expense | 27 | | | 27 | | | 54 | | | 27 | |
| Forward Starting Interest Rate Swaps: | | | | | | | |
| Notional value entered into | — | | | — | | | — | | | — | |
| Notional value settled | — | | | 600 | | | — | | | 1,000 | |
| Pre-tax gain recognized in Other comprehensive income (loss) | — | | | 68 | | | — | | | 196 | |
| Treasury Rate Locks: | | | | | | | |
| Notional value entered into | 500 | | | — | | | 500 | | | — | |
| | | | | | | |
| | | | | | | |
| Notional value settled | 500 | | | — | | | 500 | | | — | |
| Pre-tax gain recognized in Other comprehensive income (loss) | 5 | | | — | | | 5 | | | — | |
N/A - not applicable
(1) Represents amounts recorded under the cash flow hedge model. These instruments were re-designated as fair value hedges on March 31, 2022. | | | | | | | | | | | | | | | |
| Three Months Ended | | |
| March 31, | | |
| (dollars in millions) | 2024 | | 2023 | | | | |
| Interest Rate Swaps: | | | | | | | |
| Notional value entered into | $ | — | | | $ | — | | | | | |
| Notional value settled | — | | | — | | | | | |
| | | | | | | |
| | | | | | | |
| Pre-tax gain (loss) recognized in Interest expense | 2 | | | (1) | | | | | |
| Cross Currency Swaps: | | | | | | | |
| Notional value entered into | 2,146 | | | — | | | | | |
| Notional value settled | 3,067 | | | 838 | | | | | |
| | | | | | | |
| Pre-tax gain (loss) on cross currency swaps recognized in Interest expense | (742) | | | 355 | | | | | |
| Pre-tax gain (loss) on hedged debt recognized in Interest expense | 742 | | | (355) | | | | | |
| Excluded components recognized in Other comprehensive income (loss) | 282 | | | (378) | | | | | |
| Initial value of the excluded component amortized into Interest expense | 26 | | | 27 | | | | | |
| | | | | | | |
| | | | | | | |
| | | | | | | |
| | | | | | | |
| | | | | | | |
| | | | | | | |
| | | | | | | |
| | | | | | | |
| | | | | | | |
| | | | | | | |
| | | | | | | | | | | |
| Six Months Ended |
| June 30, |
| (dollars in millions) | 2023 | | 2022 |
| Other, net Cash Flows from Operating Activities: | | | |
| Cash received for settlement of interest rate swaps | $ | — | | | $ | 40 | |
| Cash paid for settlement of forward starting interest rate swaps | — | | | (107) | |
| Cash received for settlement of treasury rate locks | 5 | | | — | |
| Other, net Cash Flows from Financing Activities: | | | |
| Cash paid for settlement of cross currency swaps, net | (67) | | | — | |
| | | | | | | | | | | |
| Three Months Ended |
| March 31, |
| (dollars in millions) | 2024 | | 2023 |
| | | |
| | | |
| | | |
| | | |
| Other, net Cash Flows from Financing Activities: | | | |
| Cash paid for settlement of cross currency swaps, net | $ | (216) | | | $ | (117) | |
The following table displays the amounts recorded in Long-term debt in our condensed consolidated balance sheets related to cumulative basis adjustments for our interest rate swaps designated as fair value hedges. The cumulative amounts exclude cumulative basis adjustments related to foreign exchange risk.
| | At June 30, | | At December 31, |
| At March 31, | | | At March 31, | | At December 31, |
| (dollars in millions) | (dollars in millions) | 2023 | | 2022 | (dollars in millions) | 2024 | | 2023 |
| Carrying amount of hedged liabilities | Carrying amount of hedged liabilities | $ | 21,790 | | | $ | 21,741 | |
| Cumulative amount of fair value hedging adjustment included in the carrying amount of the hedged liabilities | Cumulative amount of fair value hedging adjustment included in the carrying amount of the hedged liabilities | (4,433) | | | (4,512) | |
| Cumulative amount of fair value hedging adjustment remaining for which hedge accounting has been discontinued | Cumulative amount of fair value hedging adjustment remaining for which hedge accounting has been discontinued | 444 | | | 488 | |
Interest Rate Swaps
We enter into interest rate swaps to achieve a targeted mix of fixed and variable rate debt. We principally receive fixed rates and pay variable rates, resulting in a net increase or decrease to Interest expense. These swaps are designated as fair value hedges and hedge against interest rate risk exposure of designated debt issuances. We record the interest rate swaps at fair value in our condensed consolidated balance sheets as assets and liabilities. Changes in the fair value of the interest rate swaps are recorded to Interest expense, which are primarily offset by changes in the fair value of the hedged debt due to changes in interest rates.
Cross Currency Swaps
We have entered into cross currency swaps previously designated as cash flow hedges through March 31, 2022 to exchange our British Pound Sterling, Euro, Swiss Franc, Canadian Dollar and Australian Dollar-denominated cash flows into U.S. dollars and to fix our cash payments in U.S. dollars, as well as to mitigate the impact of foreign currency transaction gains or losses. A portion of the loss recognized in Other comprehensive income (loss) was reclassified to Interest expense to offset the related pre-tax foreign currency transaction gain or loss on the underlying hedged item.
On March 31, 2022, we elected to de-designate our cross currency swaps as cash flow hedges and re-designated these swaps as fair value hedges. For these hedges, we have elected to exclude the change in fair value of the cross currency swaps related to both time value and cross currency basis spread from the assessment of hedge effectiveness (the excluded components). The initial value of the excluded components of $1.0 billion as of March 31, 2022 will continue to be amortized into Interest expense over the remaining life of the hedging instruments. We estimate that $108 million will be amortized into Interest expense within the next 12 months.
In addition to the previously mentioned cross currency swaps, we have executed additional cross currency swaps to exchange Euro-denominated cash flows into U.S. dollars to fix our cash payments in U.S. dollars. These swaps are designated as fair value hedges. We record the cross currency swaps at fair value in our condensed consolidated balance sheets as assets and liabilities. Changes in the fair value of the cross currency swaps attributable to changes in the spot rate of the hedged item and changes in the recorded value of the hedged debt due to changes in spot rates are recorded in the same income statement line item. We present exchange gains and losses from the conversion of foreign currency denominated debt as a part of Interest expense. During both the three and six months ended June 30,March 31, 2024 and March 31, 2023 and June 30, 2022, these amounts completely offset each other and no net gain or loss was recorded.
Changes in the fair value of cross currency swaps attributable to time value and cross currency basis spread are initially recorded to Other comprehensive income (loss). Unrealized gains or losses on excluded components are recorded in Other comprehensive income (loss) and are recognized into Interest expense on a systematic and rational basis through the swap accrual over the life of the hedging instrument. The amount remaining in Accumulated other comprehensive loss related to cash flow hedges on the date of transition will be reclassified to earnings when the hedged item is recognized in earnings or when it becomes probable that the forecasted transactions will not occur.
On March 31, 2022, we elected to de-designate our cross currency swaps previously designated as cash flow hedges and re-designated these swaps as fair value hedges. For these hedges, we elected to exclude the change in fair value of the cross currency swaps related to both time value and cross currency basis spread from the assessment of hedge effectiveness (the excluded components). The initial value of the excluded components of $1.0 billion as of March 31, 2022 will continue to be amortized into Interest expense over the remaining life of the hedging instruments. During both the three and six months ended June 30,March 31, 2024 and March 31, 2023 and June 30, 2022, the amortization of the initial value of the excluded component completely offset the amortization related to the amount remaining in Other comprehensive income (loss) related to cash flow hedges. See Note 9 for additional information.
Forward Starting We estimate that $93 million will be amortized into Interest Rate Swaps
From time to time we enter into forward starting interest rate swaps designated as cash flow hedges in order to manage our exposure to interest rate changes on future forecasted transactions. We hedge our exposure toexpense within the variability in future cash flows based on the expected maturities of the related forecasted debt issuance. We recognize gains and losses resulting from interest rate movements in next 12 months.Other comprehensive income (loss).
Treasury Rate Locks
We have entered into treasury rate locks designated as cash flow hedges to mitigate our interest rate risk on future transactions. We recognize gains and losses resulting from interest rate movements in Other comprehensive income (loss).
Net Investment Hedges
We have designated certain foreign currency debt instruments as net investment hedges to mitigate foreign exchange exposure related to non-U.S. dollar net investments in certain foreign subsidiaries against changes in foreign exchange rates. The notional amount of Euro-denominated debt designated as a net investment hedge was €750 million as of both June 30, 2023March 31, 2024 and December 31, 2022.2023.
Undesignated Derivatives
We also have the following derivative contracts which we use as economic hedges but for which we have elected not to apply hedge accounting.
The following table summarizes the activity of our derivatives not designated in hedging relationships:
| | Three Months Ended | Six Months Ended |
| June 30, | June 30, |
| Three Months Ended | |
| Three Months Ended | |
| Three Months Ended | |
| March 31, | |
| March 31, | |
| March 31, | |
| (dollars in millions) | |
| (dollars in millions) | |
| (dollars in millions) | (dollars in millions) | 2023 | | 2022 | | 2023 | | 2022 |
| Foreign Exchange Forwards: | Foreign Exchange Forwards: | |
| Foreign Exchange Forwards: | |
| Foreign Exchange Forwards: | |
| Notional value entered into | |
| Notional value entered into | |
| Notional value entered into | Notional value entered into | $ | 2,770 | | | $ | 2,856 | | | $ | 5,425 | | | $ | 5,502 | |
| Notional value settled | Notional value settled | 2,770 | | | 2,830 | | | 5,365 | | | 5,433 | |
| Pre-tax gain (loss) recognized in Other income (expense), net | 12 | | | (66) | | | 22 | | | (94) | |
| Notional value settled | |
| Notional value settled | |
| Pre-tax gain (loss) recognized in Other income, net | |
| Pre-tax gain (loss) recognized in Other income, net | |
| Pre-tax gain (loss) recognized in Other income, net | |
| | Swaptions: | |
| Notional value sold | — | | | — | | | — | | | 1,000 | |
| Notional value settled | — | | | — | | | — | | | 1,000 | |
| Pre-tax loss recognized in Interest expense | — | | | — | | | — | | | (33) | |
|
Foreign Exchange Forwards
We enter into British Pound Sterling and Euro foreign exchange forwards to mitigate our foreign exchange rate risk related to non-functional currency denominated monetary assets and liabilities of international subsidiaries.
We enter into swaptions to achieve a targeted mix
Concentrations of Credit Risk
Financial instruments that subject us to concentrations of credit risk consist primarily of temporary cash investments, short-term and long-term investments, trade receivables, including device payment plan agreement receivables, certain notes receivable, including lease receivables, and derivative contracts.
Counterparties to our derivative contracts are major financial institutions with whom we have negotiated derivatives agreements (ISDA master agreements) and credit support annex (CSA) agreements which provide rules for collateral exchange. The CSA agreements contain fixed cap amounts or rating based thresholds such that we or our counterparties may be required to hold or post collateral based upon changes in outstanding positions as compared to established thresholds or caps and changes in credit ratings. We do not offset fair value amounts recognized for derivative instruments and fair value amounts recognized for the right to reclaim cash collateral or the obligation to return cash collateral arising from derivative instruments recognized at fair value. At June 30, 2023,March 31, 2024, we did not hold any collateral. At June 30, 2023,March 31, 2024, we posted $1.5$1.8 billion of collateral related to derivative contracts under collateral exchange agreements, which was recorded as Prepaid expenses and other in our condensed consolidated balance sheet. At December 31, 2022,2023, we did not hold any collateral. At December 31, 2022,2023, we posted $2.3$1.4 billion of collateral related to derivative contracts under collateral exchange arrangements, which was recorded as Prepaid expenses and other in our condensed consolidated balance sheet. While we may be exposed to credit losses due to the nonperformance of our counterparties, we consider the risk remote and do not expect that any such nonperformance would result in a significant effect on our results of operations or financial condition due to our diversified pool of counterparties.
| | |
| Note 8. Employee Benefits |
We maintain non-contributory defined benefit pension plans for certain employees. In addition, we maintain postretirement health care and life insurance plans for certain retirees and their dependents, which are both contributory and non-contributory, and include a limit on our share of the cost for certain current and future retirees. In accordance with our accounting policy for pension and other postretirement benefits, operating expenses include service costs associated with pension and other postretirement benefits while other credits and/or charges based on actuarial assumptions, including projected discount rates, an estimated return on plan assets, and impact from health care trend rates are reported in Other income, (expense), net. These estimates are updated in the fourth quarter or upon a remeasurement event, to reflect actual return on plan assets and updated actuarial assumptions. The adjustment is recognized in the income statement during the fourth quarter orand upon a remeasurement event pursuant to our accounting policy for the recognition of actuarial gains and losses.
Net Periodic Benefit Cost (Income)
The following table summarizes the components of net periodic benefit cost (income) related to our pension and postretirement health care and life insurance plans:
| | (dollars in millions) |
| Pension | | Health Care and Life |
| Three Months Ended June 30, | 2023 | | 2022 | | 2023 | | 2022 |
| (dollars in millions) | | | (dollars in millions) |
| Pension | | | Pension | | Health Care and Life |
| Three Months Ended March 31, | | Three Months Ended March 31, | 2024 | | 2023 | | 2024 | | 2023 |
| Service cost - Cost of services | Service cost - Cost of services | $ | 45 | | | $ | 58 | | | $ | 12 | | | $ | 20 | |
| Service cost - Selling, general and administrative expense | Service cost - Selling, general and administrative expense | 7 | | | 8 | | | 2 | | | 4 | |
| Service cost | Service cost | $ | 52 | | | $ | 66 | | | $ | 14 | | | $ | 24 | |
| | Amortization of prior service cost (credit) | Amortization of prior service cost (credit) | $ | 28 | | | $ | 15 | | | $ | (104) | | | $ | (110) | |
| Amortization of prior service cost (credit) | |
| Amortization of prior service cost (credit) | |
| Expected return on plan assets | Expected return on plan assets | (253) | | | (294) | | | (8) | | | (7) | |
| Interest cost | Interest cost | 188 | | | 114 | | | 136 | | | 83 | |
| Remeasurement loss, net | — | | | 198 | | | — | | | — | |
| Remeasurement gain, net | |
| | Other components | |
| Other components | |
| Other components | Other components | $ | (37) | | | $ | 33 | | | $ | 24 | | | $ | (34) | |
| | Total | Total | $ | 15 | | | $ | 99 | | | $ | 38 | | | $ | (10) | |
| Total | |
| Total | |
| | | | | | | | | | | | | | | | | | | | | | | |
| (dollars in millions) |
| Pension | | Health Care and Life |
| Six Months Ended June 30, | 2023 | | 2022 | | 2023 | | 2022 |
| Service cost - Cost of services | $ | 91 | | | $ | 116 | | | $ | 23 | | | $ | 40 | |
| Service cost - Selling, general and administrative expense | 14 | | | 16 | | | 4 | | | 7 | |
| Service cost | $ | 105 | | | $ | 132 | | | $ | 27 | | | $ | 47 | |
| | | | | | | |
| Amortization of prior service cost (credit) | $ | 56 | | | $ | 30 | | | $ | (209) | | | $ | (313) | |
| Expected return on plan assets | (506) | | | (591) | | | (15) | | | (14) | |
| Interest cost | 376 | | | 224 | | | 272 | | | 166 | |
| Remeasurement loss, net | — | | | 198 | | | — | | | — | |
| | | | | | | |
| Other components | $ | (74) | | | $ | (139) | | | $ | 48 | | | $ | (161) | |
| | | | | | | |
| Total | $ | 31 | | | $ | (7) | | | $ | 75 | | | $ | (114) | |
The service cost component of net periodic benefit cost (income) is recorded in Cost of services and Selling, general and administrative expense in the condensed consolidated statements of income while the other components, including mark-to-market adjustments, if any, are recorded in Other income, (expense)net.
During the three months ended March 31, 2024, we updated the expected return on plan assets assumption for our pension plans from 7.50% at December 31, 2023 to 8.00% based upon the expected market returns from the March 31, 2024 asset allocation.
Pension Annuitization
On February 29, 2024, we entered into two separate commitment agreements, one by and between the Company, State Street Global Advisors Trust Company (“State Street”), net.as independent fiduciary of the Verizon Management Pension Plan and Verizon Pension Plan for Associates (the “Pension Plans”), and The Prudential Insurance Company of America (“Prudential”), and one by and between the Company, State Street and RGA Reinsurance Company (“RGA”), under which the Pension Plans purchased
nonparticipating single premium group annuity contracts from Prudential and RGA, respectively, to settle approximately $5.9 billion of benefit liabilities of the Pension Plans.
The purchase of the group annuity contracts closed on March 6, 2024. The group annuity contracts primarily cover a population that includes 56,000 retirees who commenced benefit payments from the Pension Plans prior to January 1, 2023 (“Transferred Participants”). Prudential and RGA each irrevocably guarantee and assume the sole obligation to make future payments to the Transferred Participants as provided under their respective group annuity contracts, with direct payments beginning July 1, 2024. The aggregate amount of each Transferred Participant’s payment under the group annuity contracts will be equal to the amount of each individual’s payment under the Pension Plans.
The purchase of the group annuity contracts was funded directly by transferring $5.7 billion of assets of the Pension Plans. The Company made additional contributions to the Pension Plans prior to the closing date of the transaction, as discussed below. With these contributions, the funded ratio of each of the Pension Plans does not change as a result of this transaction. During the three months ended March 31, 2024, we recorded a net pre-tax settlement gain as a result of this transaction, as discussed below.
Pension plan assets and liabilities are primarily presented within Employee benefit obligations in our condensed consolidated balance sheets.
Severance Payments
During the three and six months ended June 30, 2023,March 31, 2024, we paid severance benefits of $86 million and $226 million, respectively. During the three and six months ended June 30, 2023, we recorded pre-tax severance charges of $241 million and $249 million, respectively, related to involuntary separations under our existing plans.$118 million. At June 30, 2023,March 31, 2024, we had a remaining severance liability of $623$456 million, a portion of which includes future contractual payments to separated employees.
Employer Contributions
During both the three and six months ended June 30,March 31, 2024, we made discretionary contributions to the Pension Plans in the aggregate amount of $365 million. During the three months ended March 31, 2023, we made a discretionary contribution of $200 millionno contributions to one of our qualified pension plansplans. During the three months ended March 31, 2024 and March 31, 2023, we made insignificant contributions to our nonqualified pension plans. No mandatory qualified pension plans contributions are expected or required through December 31, 2023. There have been no2024. No significant changes are expected with respect to the nonqualified pension and other postretirement benefit plans contributions in 2023.2024.
Remeasurement loss,gain, net
During both the three and six months ended June 30, 2022,March 31, 2024, we recorded a net pre-tax remeasurement lossgain of $198$73 million in our pension plans due to a net pre-tax settlement gain of $200 million resulting from the pension annuitization transaction discussed above, partially offset by a net pre-tax remeasurement loss of $127 million triggered by settlements,settlements.
The net pre-tax remeasurement loss recorded for the three months ended March 31, 2024, was primarily driven by a $654$613 million charge resulting from the difference between our estimated and actual return on assets, partially offset by a credit of $456$486 million mainly due to changes in our discount rate and changes in our lump sum interest rate assumptionsassumption used to determine the current year liabilities of our pension plans.
| | |
| Note 9. Equity and Accumulated Other Comprehensive Loss |
Equity
Changes in the components of Total equity were as follows:
| | | Three Months Ended June 30, | |
| 2023 | | 2022 | |
| Three Months Ended March 31, | |
| Three Months Ended March 31, | |
| Three Months Ended March 31, | |
| Three Months Ended March 31, | |
| Three Months Ended March 31, | |
| Three Months Ended March 31, | |
| Three Months Ended March 31, | |
| Three Months Ended March 31, | |
| Three Months Ended March 31, | |
| Three Months Ended March 31, | |
| Three Months Ended March 31, | |
| Three Months Ended March 31, | |
| Three Months Ended March 31, | |
| Three Months Ended March 31, | |
| Three Months Ended March 31, | |
| Three Months Ended March 31, | |
| Three Months Ended March 31, | |
| Three Months Ended March 31, | |
| Three Months Ended March 31, | |
| Three Months Ended March 31, | |
| Three Months Ended March 31, | |
| Three Months Ended March 31, | |
| Three Months Ended March 31, | |
| Three Months Ended March 31, | |
| Three Months Ended March 31, | |
| Three Months Ended March 31, | |
| Three Months Ended March 31, | |
| | | 2024 | |
| | | 2024 | |
| | | 2024 | |
| (dollars in millions, except per share amounts, and shares in thousands) | |
| (dollars in millions, except per share amounts, and shares in thousands) | |
| (dollars in millions, except per share amounts, and shares in thousands) | (dollars in millions, except per share amounts, and shares in thousands) | Shares | | Amount | | Shares | | Amount | |
| Common Stock | Common Stock | |
| Common Stock | |
| Common Stock | |
| Balance at beginning of period | |
| Balance at beginning of period | |
| Balance at beginning of period | Balance at beginning of period | 4,291,434 | | | $ | 429 | | | 4,291,434 | | | $ | 429 | | |
| | Balance at end of period | Balance at end of period | 4,291,434 | | | 429 | | | 4,291,434 | | | 429 | | |
| | Balance at end of period | |
| | Balance at end of period | |
| | Additional Paid In Capital | Additional Paid In Capital | |
| | Additional Paid In Capital | |
| | Additional Paid In Capital | |
| Balance at beginning of period | |
| Balance at beginning of period | |
| Balance at beginning of period | Balance at beginning of period | | 13,523 | | | 13,874 | | |
| | Other | Other | | — | | | (2) | | |
| | Other | |
| | Other | |
| Balance at end of period | |
| Balance at end of period | |
| Balance at end of period | Balance at end of period | | 13,523 | | | 13,872 | | |
| | Retained Earnings | Retained Earnings | |
| | Retained Earnings | |
| | Retained Earnings | |
| Balance at beginning of period | |
| Balance at beginning of period | |
| Balance at beginning of period | Balance at beginning of period | | 84,543 | | | 73,891 | | |
| | Net income attributable to Verizon | Net income attributable to Verizon | | 4,648 | | | 5,199 | | |
| Dividends declared ($0.6525, $0.6400 per share) | | (2,743) | | | (2,687) | | |
| | Net income attributable to Verizon | |
| | Net income attributable to Verizon | |
| Dividends declared ($0.6650, $0.6525 per share) | |
| Dividends declared ($0.6650, $0.6525 per share) | |
| Dividends declared ($0.6650, $0.6525 per share) | |
| Other | Other | | — | | | (2) | | |
| Other | |
| Other | |
| Balance at end of period | |
| Balance at end of period | |
| Balance at end of period | Balance at end of period | | 86,448 | | | 76,401 | | |
| | Accumulated Other Comprehensive Loss | Accumulated Other Comprehensive Loss | |
| | Accumulated Other Comprehensive Loss | |
| | Accumulated Other Comprehensive Loss | |
| Balance at beginning of period attributable to Verizon | |
| Balance at beginning of period attributable to Verizon | |
| Balance at beginning of period attributable to Verizon | Balance at beginning of period attributable to Verizon | | (2,177) | | | (906) | | |
| | Foreign currency translation adjustments | Foreign currency translation adjustments | | (6) | | | (136) | | |
| | Foreign currency translation adjustments | |
| | Foreign currency translation adjustments | |
| Unrealized gain on cash flow hedges | |
| Unrealized gain on cash flow hedges | |
| Unrealized gain on cash flow hedges | Unrealized gain on cash flow hedges | | 25 | | | 72 | | |
| Unrealized gain (loss) on fair value hedges | Unrealized gain (loss) on fair value hedges | | 293 | | | (272) | | |
| Unrealized loss on marketable securities | | (2) | | | (6) | | |
| Unrealized gain (loss) on fair value hedges | |
| Unrealized gain (loss) on fair value hedges | |
| Unrealized gain (loss) on marketable securities | |
| Unrealized gain (loss) on marketable securities | |
| Unrealized gain (loss) on marketable securities | |
| Defined benefit pension and postretirement plans | |
| Defined benefit pension and postretirement plans | |
| Defined benefit pension and postretirement plans | Defined benefit pension and postretirement plans | | (54) | | | (72) | | |
| Other comprehensive income (loss) | Other comprehensive income (loss) | | 256 | | | (414) | | |
| Other comprehensive income (loss) | |
| Other comprehensive income (loss) | |
| Balance at end of period attributable to Verizon | |
| Balance at end of period attributable to Verizon | |
| Balance at end of period attributable to Verizon | Balance at end of period attributable to Verizon | | (1,921) | | | (1,320) | | |
| | Treasury Stock | Treasury Stock | |
| | Treasury Stock | |
| | Treasury Stock | |
| Balance at beginning of period | |
| Balance at beginning of period | |
| Balance at beginning of period | Balance at beginning of period | (87,442) | | | (3,832) | | | (91,790) | | | (4,023) | | |
| | Employee plans | Employee plans | 48 | | | 2 | | | 71 | | | 3 | | |
| | Employee plans | |
| | Employee plans | |
| Shareholder plans | |
| Shareholder plans | |
| Shareholder plans | |
| | Balance at end of period | |
| | Balance at end of period | |
| | Balance at end of period | Balance at end of period | (87,394) | | | (3,830) | | | (91,719) | | | (4,020) | | |
| | Deferred Compensation-ESOPs and Other | Deferred Compensation-ESOPs and Other | |
| | Deferred Compensation-ESOPs and Other | |
| | Deferred Compensation-ESOPs and Other | |
| Balance at beginning of period | |
| Balance at beginning of period | |
| Balance at beginning of period | Balance at beginning of period | | 397 | | | 497 | | |
| Restricted stock equity grant | Restricted stock equity grant | | 150 | | | 160 | | |
| Restricted stock equity grant | |
| Restricted stock equity grant | |
| Amortization | Amortization | | (3) | | | (3) | | |
| Amortization | |
| Amortization | |
| Balance at end of period | |
| Balance at end of period | |
| Balance at end of period | Balance at end of period | | 544 | | | 654 | | |
| | Noncontrolling Interests | Noncontrolling Interests | |
| | Noncontrolling Interests | |
| | Noncontrolling Interests | |
| Balance at beginning of period | |
| Balance at beginning of period | |
| Balance at beginning of period | Balance at beginning of period | | 1,336 | | | 1,413 | | |
| | Total comprehensive income | Total comprehensive income | | 118 | | | 116 | | |
| | Total comprehensive income | |
| | Total comprehensive income | |
| Distributions and other | |
| Distributions and other | |
| Distributions and other | Distributions and other | | (145) | | | (188) | | |
| Balance at end of period | Balance at end of period | | 1,309 | | | 1,341 | | |
| Balance at end of period | |
| Balance at end of period | |
| Total Equity | Total Equity | | $ | 96,502 | | | $ | 87,357 | | |
| Total Equity | |
| Total Equity | |
| | | | | | | | | | | | | | | | | | | | | | | | | | |
| Six Months Ended June 30, | |
| 2023 | | | | 2022 | | | |
| (dollars in millions, except per share amounts, and shares in thousands) | Shares | | Amount | | Shares | | Amount | |
| Common Stock | | | | | | | | |
| Balance at beginning of period | 4,291,434 | | | $ | 429 | | | 4,291,434 | | | $ | 429 | | |
| | | | | | | | |
| Balance at end of period | 4,291,434 | | | 429 | | | 4,291,434 | | | 429 | | |
| | | | | | | | |
| Additional Paid In Capital | | | | | | | | |
| Balance at beginning of period | | | 13,420 | | | | | 13,861 | | |
| | | | | | | | |
| Other | | | 103 | | | | | 11 | | |
| Balance at end of period | | | 13,523 | | | | | 13,872 | | |
| | | | | | | | |
| Retained Earnings | | | | | | | | |
| Balance at beginning of period | | | 82,380 | | | | | 71,993 | | |
| | | | | | | | |
| | | | | | | | |
| Net income attributable to Verizon | | | 9,557 | | | | | 9,779 | | |
| Dividends declared ($1.3050, $1.2800 per share) | | | (5,489) | | | | | (5,379) | | |
| Other | | | — | | | | | 8 | | |
| Balance at end of period | | | 86,448 | | | | | 76,401 | | |
| | | | | | | | |
| Accumulated Other Comprehensive Loss | | | | | | | | |
| Balance at beginning of period attributable to Verizon | | | (1,865) | | | | | (927) | | |
| | | | | | | | |
| | | | | | | | |
| Foreign currency translation adjustments | | | 20 | | | | | (165) | | |
| Unrealized gain on cash flow hedges | | | 46 | | | | | 279 | | |
| Unrealized loss on fair value hedges | | | (9) | | | | | (272) | | |
| Unrealized gain (loss) on marketable securities | | | 2 | | | | | (24) | | |
| Defined benefit pension and postretirement plans | | | (115) | | | | | (211) | | |
| Other comprehensive loss | | | (56) | | | | | (393) | | |
| Balance at end of period attributable to Verizon | | | (1,921) | | | | | (1,320) | | |
| | | | | | | | |
| Treasury Stock | | | | | | | | |
| Balance at beginning of period | (91,572) | | | (4,013) | | | (93,635) | | | (4,104) | | |
| | | | | | | | |
| Employee plans | 4,175 | | | 183 | | | 1,913 | | | 84 | | |
| Shareholder plans | 3 | | | — | | | 3 | | | — | | |
| | | | | | | | |
| Balance at end of period | (87,394) | | | (3,830) | | | (91,719) | | | (4,020) | | |
| | | | | | | | |
| Deferred Compensation-ESOPs and Other | | | | | | | | |
| Balance at beginning of period | | | 793 | | | | | 538 | | |
| Restricted stock equity grant | | | 136 | | | | | 269 | | |
| Amortization | | | (385) | | | | | (153) | | |
| Balance at end of period | | | 544 | | | | | 654 | | |
| | | | | | | | |
| Noncontrolling Interests | | | | | | | | |
| Balance at beginning of period | | | 1,319 | | | | | 1,410 | | |
| | | | | | | | |
| | | | | | | | |
| | | | | | | | |
| | | | | | | | |
| | | | | | | | |
| Total comprehensive income | | | 227 | | | | | 247 | | |
| Distributions and other | | | (237) | | | | | (316) | | |
| Balance at end of period | | | 1,309 | | | | | 1,341 | | |
| Total Equity | | | $ | 96,502 | | | | | $ | 87,357 | | |
Common Stock
Verizon did not repurchase any shares of the Company's common stock through its previously authorized share buyback program during the sixthree months ended June 30, 2023.March 31, 2024. At June 30, 2023,March 31, 2024, the maximum number of shares that could be purchased by or on behalf of Verizon under our share buyback program was 100 million.
Common stock has been used from time to time to satisfy some of the funding requirements of employee and shareownershareholder plans, including 4.25 million shares of common stock issued from Treasurytreasury stock during the sixthree months ended June 30, 2023.March 31, 2024.
Accumulated Other Comprehensive Loss
The changes in the balances of Accumulated other comprehensive loss by component were as follows:
| | (dollars in millions) | (dollars in millions) | Foreign
currency
translation
adjustments | | Unrealized gain (loss) on cash flow hedges | | | Unrealized gain (loss) on fair value hedges | | Unrealized gain (loss) on marketable securities | | Defined benefit pension and postretirement plans | | Total |
| Balance at January 1, 2023 | $ | (698) | | | $ | (1,150) | | | | $ | (431) | | | $ | (9) | | | $ | 423 | | | $ | (1,865) | |
| (dollars in millions) | |
| (dollars in millions) | | Foreign
currency
translation
adjustments | | Unrealized gain (loss) on cash flow hedges | | | | Unrealized gain (loss) on fair value hedges | | Unrealized loss on marketable securities | | Defined benefit pension and postretirement plans | | Total |
| Balance at January 1, 2024 | |
| | Excluded components recognized in other comprehensive income | Excluded components recognized in other comprehensive income | — | | | — | | | | 31 | | | — | | | — | | | 31 | |
| Other comprehensive income | 20 | | | 4 | | | | — | | | 1 | | | — | | | 25 | |
| | Excluded components recognized in other comprehensive income | |
| | Excluded components recognized in other comprehensive income | |
| Other comprehensive loss | |
| Amounts reclassified to net income | Amounts reclassified to net income | — | | | 42 | | | | (40) | | | 1 | | | (115) | | | (112) | |
| Net other comprehensive income (loss) | Net other comprehensive income (loss) | 20 | | | 46 | | | | (9) | | | 2 | | | (115) | | | (56) | |
| Balance at June 30, 2023 | $ | (678) | | | $ | (1,104) | | | | $ | (440) | | | $ | (7) | | | $ | 308 | | | $ | (1,921) | |
| Balance at March 31, 2024 | |
The amounts presented above in Net other comprehensive income (loss) are net of taxes. The amounts reclassified to net income related to unrealized gain (loss) on cash flow hedges and unrealized gain (loss) on fair value hedges in the table above are included in Other income, (expense), net and Interest expense in our condensed consolidated statements of income. See Note 7 for additional information. The amounts reclassified to net income related to unrealized gain (loss)loss on marketable securities in the table above are included in Other income (expense), net in our condensed consolidated statements of income. The amounts reclassified to net income related toand defined benefit pension and postretirement plans in the table above are included in Other income, (expense), net in our condensed consolidated statements of income. See Note 8 for additional information.
| | |
| Note 10. Segment Information |
Reportable Segments
We have two reportable segments that we operate and manage as strategic business units - Consumer and Business. We measure and evaluate our reportable segments based on segment operating income, consistent with the chief operating decision maker’s assessment of segment performance.
Our segments and their principal activities consist of the following:
| | | | | | | | |
| Segment | | Description |
Verizon
Consumer Group | | Our Consumer segment provides consumer-focused wireless and wireline communications services and products. Our wireless services are provided across one of the most extensive wireless networks in the U.S. under the Verizon family of brands and through wholesale and other arrangements. We also provide fixed wireless access (FWA) broadband through our wireless networks.5G or 4G LTE networks as an alternative to traditional landline internet access. Our wireline services are provided in nine states in the Mid-Atlantic and Northeastern U.S., as well as Washington D.C., over our 100% fiber-optic network through our Verizon Fios product portfolio and over a traditional copper-based network to customers who are not served by Fios. |
| | |
Verizon
Business Group | | Our Business segment provides wireless and wireline communications services and products, including FWA broadband, data, video and conferencing services, corporate networking solutions, security and managed network services, local and long distance voice services and network access to deliver various IoT services and products. We also provide FWA broadband through our wireless networks. We provide these products and services to businesses, government customers and wireless and wireline carriers across the U.S. and selecta subset of these products and services to customers around the world. |
Our Consumer segment’ssegment's wireless and wireline products and services are available to our retail customers, as well as resellers that purchase wireless network access from us on a wholesale basis.
Our Business segment’ssegment's wireless and wireline products and services are organized by the primary customer groups targeted by these offerings. During the first quarter of 2023, Verizon reorganized the customer groups within its Business segment. Previously, this segment was comprised of four customer groups: Small and Medium Business, Global Enterprise, Public Sector and Other, and Wholesale. Following the reorganization, there are now three customer groups:offerings: Enterprise and Public Sector, Business Markets and Other, and Wholesale. Enterprise and Public Sector combines the customers previously included in Global Enterprise and Public Sector and Other (excluding BlueJeans and Connect customers) as well as the commercial wireline customers previously included in Small and Medium Business. Business Markets and Other combines the customers previously included in Small and Medium Business (excluding commercial wireline customers), the BlueJeans customers previously included in Global Enterprise and Public Sector and Other, and the Connect customers previously included in Public Sector and Other. The Wholesale customer group remained unchanged. Prior period operating revenue results within the Business segment
have been recast for these reorganized customer groups. There was no change to the composition of our reportable segments and total segment results, nor the determination of segment profit.
Corporate and other primarily includes device insurance programs, investments in unconsolidated businesses and development stage businesses that support our strategic initiatives, as well as unallocated corporate expenses, certain pension and other employee benefit related costs and interest and financing expenses. Corporate and other also includes the historical results of divested businesses and other adjustments and gains and losses that are not allocated or used in assessing segment performance due to their nature. Although such transactions are excluded from the business segment results, they are included in reported consolidated earnings. Gains and losses from these transactions that are not individually significant are included in segment results as these items areand therefore included in the chief operating decision maker’s assessment of segment performance.
The following table provides operating financial information for our two reportable segments:
| | | | Three Months Ended | | Six Months Ended |
| | June 30, | | June 30, |
| | |
| March 31, | |
| March 31, | |
| March 31, | |
| (dollars in millions) | |
| (dollars in millions) | |
| (dollars in millions) | (dollars in millions) | 2023 | | 2022 | | 2023 | | 2022 |
| External Operating Revenues | External Operating Revenues | |
| External Operating Revenues | |
| External Operating Revenues | |
| Consumer | |
| Consumer | |
| Consumer | Consumer | |
| Service | Service | $ | 18,641 | | | $ | 18,149 | | | $ | 37,097 | | | $ | 36,275 | |
| Service | |
| Service | |
| Wireless equipment | |
| Wireless equipment | |
| Wireless equipment | Wireless equipment | 4,430 | | | 5,708 | | | 9,308 | | | 11,082 | |
Other(1) | Other(1) | 1,435 | | | 1,696 | | | 2,909 | | | 3,438 | |
Other(1) | |
Other(1) | |
| Total Consumer | |
| Total Consumer | |
| Total Consumer | Total Consumer | 24,506 | | | 25,553 | | | 49,314 | | | 50,795 | |
| | Business | Business | |
| | Business | |
| | Business | |
| Enterprise and Public Sector | Enterprise and Public Sector | 3,784 | | | 3,867 | | | 7,571 | | | 7,844 | |
Business Markets and Other(2) | 3,104 | | | 3,125 | | | 6,203 | | | 6,197 | |
| Enterprise and Public Sector | |
| Enterprise and Public Sector | |
| Business Markets and Other | |
| Business Markets and Other | |
| Business Markets and Other | |
| Wholesale | |
| Wholesale | |
| Wholesale | Wholesale | 587 | | | 623 | | | 1,186 | | | 1,270 | |
| Total Business | Total Business | 7,475 | | | 7,615 | | | 14,960 | | | 15,311 | |
| Total Business | |
| Total Business | |
| Total reportable segments | |
| Total reportable segments | |
| Total reportable segments | Total reportable segments | $ | 31,981 | | | $ | 33,168 | | | $ | 64,274 | | | $ | 66,106 | |
| | Intersegment Revenues | Intersegment Revenues | |
| | Intersegment Revenues | |
| | Intersegment Revenues | |
| Consumer | |
| Consumer | |
| Consumer | Consumer | $ | 52 | | | $ | 51 | | | $ | 101 | | | $ | 101 | |
| Business | Business | 8 | | | 11 | | | 17 | | | 24 | |
| Business | |
| Business | |
| Total reportable segments | |
| Total reportable segments | |
| Total reportable segments | Total reportable segments | $ | 60 | | | $ | 62 | | | $ | 118 | | | $ | 125 | |
| | Total Operating Revenues | Total Operating Revenues | |
| | Total Operating Revenues | |
| | Total Operating Revenues | |
| Consumer | Consumer | $ | 24,558 | | | $ | 25,604 | | | $ | 49,415 | | | $ | 50,896 | |
Business(3) | 7,483 | | | 7,626 | | | 14,977 | | | 15,335 | |
| Consumer | |
| Consumer | |
Business(2) | |
Business(2) | |
Business(2) | |
| Total reportable segments | |
| Total reportable segments | |
| Total reportable segments | Total reportable segments | $ | 32,041 | | | $ | 33,230 | | | $ | 64,392 | | | $ | 66,231 | |
| | Operating Income | Operating Income | |
| | Operating Income | |
| | Operating Income | |
| Consumer | |
| Consumer | |
| Consumer | Consumer | $ | 7,330 | | | $ | 7,150 | | | $ | 14,429 | | | $ | 14,469 | |
| Business | Business | 533 | | | 675 | | | 1,084 | | | 1,348 | |
| Business | |
| Business | |
| Total reportable segments | Total reportable segments | $ | 7,863 | | | $ | 7,825 | | | $ | 15,513 | | | $ | 15,817 | |
| Total reportable segments | |
| Total reportable segments | |
(1) Other revenue includes fees that partially recover the direct and indirect costs of complying with regulatory and industry obligations and programs, revenues associated with certain products included in our device protection offerings, leasing and interest recognized when equipment is sold to the customer by an authorized agent under a device payment plan agreement.
(2) Referred to as Business Markets and SaaS in the first quarter of 2023.
(3) Service and other revenues included in our Business segment were approximately $6.6 billion and $6.7 billion for the three months ended June 30, 2023 and 2022, respectively, and $13.2 billion and $13.4 billion for the six months ended June 30, 2023 and 2022, respectively. Wireless equipment revenues included in our Business segment were $847approximately $6.5 billion and $871 million, and $966 millionrespectively, for the three months ended June 30, 2023March 31, 2024, and 2022, respectively, and $1.7were approximately $6.6 billion and $1.9 billion$882 million, respectively, for the sixthree months ended June 30, 2023 and 2022, respectively.March 31, 2023.
The following table provides Fios revenue for our two reportable segments:
| | | | | | | | | | | | | | | | | | | | | | | |
| Three Months Ended | | Six Months Ended |
| June 30, | | June 30, |
| (dollars in millions) | 2023 | | 2022 | | 2023 | | 2022 |
| Consumer | $ | 2,886 | | | $ | 2,895 | | | $ | 5,775 | | | $ | 5,806 | |
| Business | 308 | | | 298 | | | 615 | | | 593 | |
| Total Fios revenue | $ | 3,194 | | | $ | 3,193 | | | $ | 6,390 | | | $ | 6,399 | |
| | | | | | | | | | | | | | | |
| Three Months Ended | | |
| March 31, | | |
| (dollars in millions) | 2024 | | 2023 | | | | |
| Consumer | $ | 2,896 | | | $ | 2,889 | | | | | |
| Business | 311 | | | 307 | | | | | |
| Total Fios revenue | $ | 3,207 | | | $ | 3,196 | | | | | |
The following table provides Wireless service revenue for our reportable segments and includes intersegment activity:
| | | | | | | | | | | | | | | |
| Three Months Ended | | |
| March 31, | | |
| (dollars in millions) | 2024 | | 2023 | | | | |
| Consumer | $ | 16,134 | | | $ | 15,599 | | | | | |
| Business | 3,379 | | | 3,290 | | | | | |
| Total Wireless service revenue | $ | 19,513 | | | $ | 18,889 | | | | | |
| | | | | | | | | | | | | | | | | | | | | | | |
| Three Months Ended | | Six Months Ended |
| June 30, | | June 30, |
| (dollars in millions) | 2023 | | 2022 | | 2023 | | 2022 |
| Consumer | $ | 15,762 | | | $ | 15,236 | | | $ | 31,361 | | | $ | 30,453 | |
| Business | 3,351 | | | 3,182 | | | 6,641 | | | 6,307 | |
| Total Wireless service revenue | $ | 19,113 | | | $ | 18,418 | | | $ | 38,002 | | | $ | 36,760 | |
Reconciliation to Consolidated Financial Information
The reconciliation of segment operating revenues and operating income to consolidated operating revenues and operating income below includes the effects of special items that the chief operating decision maker does not consider in assessing segment performance, primarily because of their nature.
A reconciliation of the reportable segmentsegments' operating revenues to consolidated operating revenues is as follows:
| | Three Months Ended | |
| Three Months Ended | |
| Three Months Ended | |
| | | Three Months Ended | | Six Months Ended |
| | | June 30, | | June 30, |
| (dollars in millions) | (dollars in millions) | 2023 | | 2022 | | 2023 | | 2022 |
| Total reportable segment operating revenues | $ | 32,041 | | | $ | 33,230 | | | $ | 64,392 | | | $ | 66,231 | |
| (dollars in millions) | |
| (dollars in millions) | |
| Total reportable segments operating revenues | |
| Total reportable segments operating revenues | |
| Total reportable segments operating revenues | |
| Corporate and other | Corporate and other | 621 | | | 623 | | | 1,238 | | | 1,241 | |
| Corporate and other | |
| Corporate and other | |
| Eliminations | |
| Eliminations | |
| Eliminations | Eliminations | (66) | | | (64) | | | (122) | | | (129) | |
| | Total consolidated operating revenues | Total consolidated operating revenues | $ | 32,596 | | | $ | 33,789 | | | $ | 65,508 | | | $ | 67,343 | |
| | Total consolidated operating revenues | |
| | Total consolidated operating revenues | |
A reconciliation of the total reportable segment'ssegments' operating income to consolidated income before provision for income taxes is as follows:
| | | | Three Months Ended | | Six Months Ended |
| | June 30, | | June 30, |
| | |
| March 31, | |
| March 31, | |
| March 31, | |
| (dollars in millions) | (dollars in millions) | 2023 | | 2022 | | 2023 | | 2022 |
| Total reportable segment operating income | $ | 7,863 | | | $ | 7,825 | | | $ | 15,513 | | | $ | 15,817 | |
| (dollars in millions) | |
| (dollars in millions) | |
| Total reportable segments operating income | |
| Total reportable segments operating income | |
| Total reportable segments operating income | |
| Corporate and other | Corporate and other | (344) | | | (190) | | | (348) | | | (214) | |
| Severance charges | (237) | | | — | | | (237) | | | — | |
| Corporate and other | |
| Corporate and other | |
| | Other components of net periodic benefit charges (Note 8) | |
| | Other components of net periodic benefit charges (Note 8) | |
| | | Other components of net periodic benefit charges (Note 8) | Other components of net periodic benefit charges (Note 8) | (62) | | | (83) | | | (124) | | | (255) | |
| | Legacy legal matter | |
| | Legacy legal matter | |
| | Legacy legal matter | |
| Total consolidated operating income | |
| Total consolidated operating income | |
| Total consolidated operating income | Total consolidated operating income | 7,220 | | | 7,552 | | | 14,804 | | | 15,348 | |
| | Equity in earnings (losses) of unconsolidated businesses | Equity in earnings (losses) of unconsolidated businesses | (33) | | | 41 | | | (24) | | | 38 | |
| Other income (expense), net | 210 | | | 49 | | | 324 | | | (875) | |
| | Equity in earnings (losses) of unconsolidated businesses | |
| | Equity in earnings (losses) of unconsolidated businesses | |
| Other income, net | |
| Other income, net | |
| Other income, net | |
| Interest expense | |
| Interest expense | |
| Interest expense | Interest expense | (1,285) | | | (785) | | | (2,492) | | | (1,571) | |
| Income Before Provision For Income Taxes | Income Before Provision For Income Taxes | $ | 6,112 | | | $ | 6,857 | | | $ | 12,612 | | | $ | 12,940 | |
| Income Before Provision For Income Taxes | |
| Income Before Provision For Income Taxes | |
No single customer accounted for more than 10% of our total operating revenues during the three and six months ended June 30, 2023March 31, 2024 or 2022.2023.
The chief operating decision maker does not review disaggregated assets on a segment basis; therefore, such information is not presented. Depreciation and amortization included in the measure of segment profitability is primarily allocated based on proportional usage, and is included within Total reportable segmentsegments operating income.
| | |
| Note 11. Additional Financial Information |
We maintain a voluntary supplier finance program (SFP) with a financial institution which provides certain suppliers the option, at their sole discretion, to participate in the program and sell their receivables due from Verizon to the financial institution on a non-recourse basis. The eligible suppliers negotiate the terms directly with the financial institution and we have no involvement in establishing those terms nor are we a party to these agreements.
Our payments associated with the invoices from the suppliers participating in the SFP are made to the financial institution according to the original invoice terms generally at 90 days from the invoice date and for the original invoice amount. No additional payments are exchanged between Verizon and the financial institution related to the SFP. Verizon does not pledge any assets nor provide any guarantees to the financial institution in connection with the SFP. The SFP can be terminated by Verizon or the financial institution with a 60-day notice period.
Confirmed obligations outstanding related to suppliers participating in the SFP are recorded within Accounts payable and accrued liabilities in our condensed consolidated balance sheets and the associated payments are reflected in the operating activities section of our condensed consolidated statements of cash flows. As of June 30, 2023March 31, 2024 and December 31, 2022, $6972023, $654 million and $1.0 billion,$817 million, respectively, remained as confirmed obligations outstanding related to suppliers participating in the SFP.supplier finance program.
| | |
| Note 12. Commitments and Contingencies |
In the ordinary course of business, Verizon is involved in various commercial litigation and regulatory proceedings at the state and federal level. Where it is determined, in consultation with counsel based on litigation and settlement risks, that a loss is probable and estimable in a given matter, Verizon establishes an accrual. In none of the currently pending matters is the amount of accrual material. An estimate of the reasonably possible loss or range of loss in excess of the amounts already accrued cannot be made at this time due to various factors typical in contested proceedings, including: (1) uncertain damage theories and demands; (2) a less than complete factual record; (3) uncertainty concerning legal theories and their resolution by courts or regulators; and (4) the unpredictable nature of the opposing party and its demands. We continuously monitor these proceedings as they develop and adjust any accrual or disclosure as needed. We do not expect that the ultimate resolution of any pending regulatory or legal matter in future periods will have a material effect on our financial condition, but it could have a material effect on our results of operations for a given reporting period.
Verizon is currently involved in approximately 2530 federal district court actions alleging that Verizon is infringing various patents. Most of these cases are brought by non-practicing entities and effectively seek only monetary damages; a small number are brought by companies that have sold products and could seek injunctive relief as well. These cases have progressed to various stages and a small number may go to trial in the coming 12 months if they are not otherwise resolved.
In connection with the execution of agreements for the sales of businesses and investments, Verizon ordinarily provides representations and warranties to the purchasers pertaining to a variety of nonfinancial matters, such as ownership of the securities being sold, as well as indemnity from certain financial losses. From time to time, counterparties may make claims under these provisions, and Verizon will seek to defend against those claims and resolve them in the ordinary course of business.
As of June 30, 2023,March 31, 2024, Verizon had 2527 renewable energy purchase agreements (REPAs) with third parties. Each of the REPAs is based on the expected operation of a renewable energy-generating facility and has a fixed price term of 12 to 20 years from the commencement of the facility's entry into commercial operation. Fifteen of the facilities have entered into commercial operation, and the remainder are under development. The REPAs generally are expected to be financially settled based on the prevailing market price as energy is generated by the facilities.
| | |
| Item 2. Management’s Discussion and Analysis of Financial Condition and Results of Operations |
Verizon Communications Inc. (the Company) is a holding company that, acting through its subsidiaries (together with the Company, collectively, Verizon), is one of the world’s leading providers of communications, technology, information and entertainment products and services to consumers, businesses and government entities. With a presence around the world, we offer data, video and voice services and solutions on our networks and platforms that are designed to meet customers’ demand for mobility, reliable network connectivity security and control.security.
To compete effectively in today’s dynamic marketplace, we are focused on the capabilities of our high-performing networks to drive growth based on delivering what customers want and need in the digital world. We are consistently deploying new network architecture and technologies to secure our leadership in both fourth-generation (4G) and fifth-generation (5G) wireless networks. Our network quality is the hallmark of our brand and the foundation for the connectivity, platforms and solutions upon which we build our competitive advantage. In 2023,2024, we are focused on maintainingenhancing and driving the reliability and resiliencemonetization of our network,networks, platforms and solutions, retaining and growing our high-quality customer base while balancing profitability in challenging market conditions,and driving monetization offurther improving our networks, platformsfinancial and solutions. We are creating business value by earning operating performance.
the trust of our stakeholders, limiting our environmental impact and supporting our customer base growth while creating social benefit through our products and services.
Our strategy requires significant capital investments primarily to acquire wireless spectrum, put the spectrum into service, provide additional capacity for growth in our networks, invest in the fiber that supports our businesses, evolve and maintain our networks and develop and maintain significant advanced information technology systems and data system capabilities. We believe that our C-Band spectrum, together with our industry leading millimeter wave spectrum holding, fourth-generation (4G)holdings and our 4G Long-Term Evolution (LTE) network and fiber infrastructure, will drive innovative products and services and fuel our growth.
We are consistently deploying new network architecture and technologies to secure our leadership in both 4G and fifth-generation (5G) wireless networks. We expect that our next-generation multi-use platform, which we call the Intelligent Edge Network, will simplify operations by eliminating legacy network elements, speed the deployment of 5G wireless technology and create new opportunities in the business market in a cost efficient manner. Our network quality is the hallmark of our brand and the foundation for the connectivity, platforms and solutions upon which we build our competitive advantage.
Highlights of Our Financial Results for the Three Months Ended June 30,March 31, 2024 and 2023 and 2022
(dollars in millions)
Highlights of Our Financial Results for the Six Months Ended June 30, 2023 and 2022
(dollars in millions)
Business Overview
We have two reportable segments that we operate and manage as strategic business units - Verizon Consumer Group (Consumer) and Verizon Business Group (Business).
Revenue by Segment for the Three Months Ended June 30, 2023 and 2022
———
Note: Excludes eliminations.
Revenue by Segment for the SixThree Months Ended June 30,March 31, 2024 and 2023 and 2022
———
Note: Excludes eliminations.
Verizon Consumer Group
Our Consumer segment provides consumer-focused wireless and wireline communications services and products. Our wireless services are provided across one of the most extensive wireless networks in the United States (U.S.) under the Verizon family of brands and through wholesale and other arrangements. We also provide fixed wireless access (FWA) broadband through our wireless networks.5G or 4G LTE networks as an alternative to traditional landline internet access. Our wireline services are provided in nine states in the Mid-Atlantic and Northeastern U.S., as well as Washington D.C., over our 100% fiber-optic network through our Verizon Fios product portfolio and over a traditional copper-based network to customers who are not served by Fios. Our Consumer segment's wireless and wireline products and services are available to our retail customers, as well as resellers that purchase wireless network access from us on a wholesale basis.
Customers can obtain our wireless services on a postpaid or prepaid basis. Our postpaid service is generally billed one month in advance for a monthly access charge in return for access to and usage of network services. Our prepaid service is offered only to Consumer customers and enables individuals to obtain wireless services without credit verification by paying for all services in advance. The Consumer segment also offers several categories of wireless equipment to customers, including a variety of smartphones and other handsets, wireless-enabled internet devices, such as tablets, and other wireless-enabled connected devices, such as smart watches.
In addition to the wireless services and equipment discussed above, the Consumer segment sells residential fixed connectivity solutions, including internet, video and voice services, and wireless network access to resellers on a wholesale basis. The Consumer segment's operating revenues for the three and six months ended June 30, 2023March 31, 2024 totaled $24.6$25.1 billion, and $49.4 billion, respectively, representing a decreasean increase of 4.1% and 2.9%, respectively,0.8% compared to the similar periodsperiod in 2022.2023. See "Segment Results of Operations" for additional information regarding our Consumer segment’s operating performance and selected operating statistics.
Verizon Business Group
Our Business segment provides wireless and wireline communications services and products, including FWA broadband, data, video and conferencing services, corporate networking solutions, security and managed network services, local and long distance voice services and network access to deliver various Internet of Things (IoT) services and products, including solutions that support fleet tracking management, compliance management, field service management, asset tracking and other types of mobile resource management. We also provide FWA broadband through our wireless networks. We provide these products and services to businesses, government customers and wireless and wireline carriers across the U.S. and selecta subset of these products and services to customers around the world. The Business segment's operating revenues for the three and six months ended June 30, 2023March 31, 2024 totaled $7.5$7.4 billion, and $15.0 billion, respectively, representing a decrease of 1.9% and 2.3%, respectively,1.6% compared to the similar periodsperiod in 2022.2023. See "Segment Results of Operations" for additional information regarding our Business segment’s operating performance and selected operating statistics.
Corporate and Other
Corporate and other primarily includes device insurance programs, investments in unconsolidated businesses and development stage businesses that support our strategic initiatives, as well as unallocated corporate expenses, certain pension and other employee benefit related costs and interest and financing expenses. Corporate and other also includes the historical results of
divested businesses and other adjustments and gains and losses that are not allocated or used in assessing segment performance due to their nature. Although such transactions are excluded from the business segment results, they are included in reported
consolidated earnings. Gains and losses from these transactions that are not individually significant are included in segment results as these itemsand therefore are included in the chief operating decision maker’s assessment of segment performance. See "Consolidated Results of Operations" for additional information regarding Corporate and other results.
Capital Expenditures and Investments
We continue to invest in our wireless networks, high-speed fiber and other advanced technologies to position ourselves at the center of growth trends for the future. During the sixthree months ended June 30, 2023,March 31, 2024, these investments included $10.1$4.4 billion for capital expenditures. See "Cash Flows Used in Investing Activities" for additional information. In the second quarter of 2023, we completed our accelerated $10 billion capital program related to C-Band spectrum deployment. Our ongoing C-Band spectrum deployment will be funded through our general capital expenditure program. Capital expenditures for 20232024 are expected to be in the range of $18.25$17.0 billion to $19.25$17.5 billion. We believe that our investments aimed at expanding our portfolio of products and services will provide our customers with an efficient, reliable infrastructure for participating in the information economy.
Global Network and Technology
Over the past several years, we have been leading the development of 5G wireless technology industry standards and the ecosystems for fixed and mobile 5G wireless services. 5G technology enables higher throughput and lower latency than 4G LTE technology and allows our networks to handle more traffic as the number of internet-connected devices grows.
We are focusing our capital investment on building our next generation 5G network, while also adding capacity and density to our 4G LTE network. We are densifying our networks by utilizing macro and small cell technology, in-building solutions and distributed antenna systems. Network densification enables us to add capacity to address increasing mobile video consumption and the growing demand for IoT products and services on our 5G and 4G LTE and 5G networks. Over the past several years, we have been leading the development of 5G wireless technology industry standards and the ecosystems for fixed and mobile 5G wireless services. 5G technology enables higher throughput and lower latency than 4G LTE technology and allows our networksWe obtained full access to handle more traffic as the number of internet-connected devices grows. In January 2022, we began rapidly deploying our C-Band spectrum which, as of June 30,in August 2023, covers approximately 220 million people in the U.S. We expect toand will continue deploying C-Bandthis spectrum across the continental U.S. as more and more of the spectrum becomes available for our use. We use low and mid-band spectrum and dynamic spectrum sharing (DSS) technology to allow 5G service to run simultaneously with 4G LTE on multiple spectrum bands. With DSS, whenever customers move outside Verizon’s millimeter wave and C-Band coverage areas, their 5G-enabled devices will remain on 5G technology using the lower spectrum bands where this network is available. This allows us to more fully and effectively utilize our current spectrum resources to serve both 4G and 5G customers.
To compensate for the shrinking market for traditional copper-based products, weWe continue to build fiber-based networks supporting data, video and advanced business services - areas where demand for reliable high-speed connections is growing. In addition, we leverage our 5G and 4G LTE networks for our FWA broadband service. We are transforming the architecture of our networks into our Intelligent Edge Network, providing improved efficiency and virtualization, increased automation and opportunities for edge computing services that will support our fiber-based and radio access network technologies. We expect that this new architecture will simplify operations by eliminating legacy network elements, speed the deployment of 5G wireless technology and create new opportunities in the business market in a cost-efficient manner.
There have been recent media reports alleging that certain lead sheathed copper cables that are part of our copper network may present general health or environmental risks in areas where those facilities are deployed. We have not been given access to the test methodology or the test results on which those reports are based, so we are unable to assess the accuracy or implications of those reports. We believe that the likelihood of exposure to lead from undisturbed lead sheathed telecommunications cables is low; however, we are currently working with a third-party expert to conduct our own testing at our sites that were identified in the media reports. Once we have the results of our testing, we will be able to better assess the situation. Until that time, we cannot predict what actions, if any, we may ultimately take with respect to the lead sheathed cable in our network or the potential financial, operational, regulatory or reputational impacts of the situation on us.
| | |
| Consolidated Results of Operations |
In this section, we discuss our overall results of operations and highlight special items, some of which are not included in our segment results. In "Segment Results of Operations" we review the performance of our two reportable segments in more detail.
Consolidated Operating Revenues
| | | |
| | |
| | |
| | | | Three Months Ended | | | | | | Six Months Ended | | | | |
| | | June 30, | | Increase/ | | June 30, | | Increase/ |
| (dollars in millions) | (dollars in millions) | 2023 | | 2022 | | (Decrease) | | 2023 | | 2022 | | (Decrease) |
| (dollars in millions) | |
| (dollars in millions) | |
| Consumer | |
| Consumer | |
| Consumer | Consumer | $ | 24,558 | | | $ | 25,604 | | | $ | (1,046) | | | (4.1) | % | | $ | 49,415 | | | $ | 50,896 | | | $ | (1,481) | | | (2.9) | % |
| Business | Business | 7,483 | | | 7,626 | | | (143) | | | (1.9) | | | 14,977 | | | 15,335 | | | (358) | | | (2.3) | |
| Business | |
| Business | |
| Corporate and other | |
| Corporate and other | |
| Corporate and other | Corporate and other | 621 | | | 623 | | | (2) | | | (0.3) | | | 1,238 | | | 1,241 | | | (3) | | | (0.2) | |
| Eliminations | Eliminations | (66) | | | (64) | | | (2) | | | 3.1 | | | (122) | | | (129) | | | 7 | | | (5.4) | |
| Eliminations | |
| Eliminations | |
| Consolidated Operating Revenues | Consolidated Operating Revenues | $ | 32,596 | | | $ | 33,789 | | | $ | (1,193) | | | (3.5) | | | $ | 65,508 | | | $ | 67,343 | | | $ | (1,835) | | | (2.7) | |
| Consolidated Operating Revenues | |
| Consolidated Operating Revenues | |
Consolidated operating revenues decreasedincreased during both the three and six months ended June 30, 2023March 31, 2024 compared to the similar periodsperiod in 20222023 primarily due to revenue increases in our Consumer segment, partially offset by revenue decreases in our Consumer and Business segments.
Revenues for our segments are discussed separately below under the heading "Segment Results of Operations."
Consolidated Operating Expenses
| | | |
| | |
| | |
| | | | Three Months Ended | | | | | | Six Months Ended | | | | |
| | | June 30, | | Increase/ | | June 30, | | Increase/ |
| (dollars in millions) | (dollars in millions) | 2023 | | 2022 | | (Decrease) | | 2023 | | 2022 | | (Decrease) |
| (dollars in millions) | |
| (dollars in millions) | |
| Cost of services | |
| Cost of services | |
| Cost of services | Cost of services | $ | 6,986 | | | $ | 6,932 | | | $ | 54 | | | 0.8 | % | | $ | 14,064 | | | $ | 14,159 | | | $ | (95) | | | (0.7) | % |
| Cost of wireless equipment | Cost of wireless equipment | 5,778 | | | 7,488 | | | (1,710) | | | (22.8) | | | 12,204 | | | 14,611 | | | (2,407) | | | (16.5) | |
| Cost of wireless equipment | |
| Cost of wireless equipment | |
| Selling, general and administrative expense | |
| Selling, general and administrative expense | |
| Selling, general and administrative expense | Selling, general and administrative expense | 8,253 | | | 7,496 | | | 757 | | | 10.1 | | | 15,759 | | | 14,668 | | | 1,091 | | | 7.4 | |
| Depreciation and amortization expense | Depreciation and amortization expense | 4,359 | | | 4,321 | | | 38 | | | 0.9 | | | 8,677 | | | 8,557 | | | 120 | | | 1.4 | |
| Depreciation and amortization expense | |
| Depreciation and amortization expense | |
| Consolidated Operating Expenses | Consolidated Operating Expenses | $ | 25,376 | | | $ | 26,237 | | | $ | (861) | | | (3.3) | | | $ | 50,704 | | | $ | 51,995 | | | $ | (1,291) | | | (2.5) | |
| Consolidated Operating Expenses | |
| Consolidated Operating Expenses | |
Operating expenses for our segments are discussed separately below under the heading "Segment Results of Operations."
Cost of Services
Cost of services includes the following costs directly attributable to a service: salaries and wages, benefits, materials and supplies, content costs, contracted services, network access and transport costs, customer provisioning costs, computer systems support and costs to support our outsourcing contracts and technical facilities and traffic acquisition costs.facilities. Aggregate customer service costs, which include billing and service provisioning, are allocated between Cost of services and Selling, general and administrative expense.
Cost of services increaseddecreased during the three months ended June 30, 2023March 31, 2024 compared to the similar period in 2022. The increase was2023 primarily theas result of:
•an increase of $81 million in regulatory costs primarily related to a higher Federal Universal Service Fund (FUSF) rate;
•an increase of $59 million in rent and lease expense primarily driven by new leases and lease modifications related to the deployment of the C-Band spectrum;
•an increase of $50 million in personnel costs primarily related to a decrease in capitalized labor in connection with the completion of our incremental C-Band capital spending program and a return to our routine capital spending trends; and
•a decrease of $148$130 million in access costs primarily as a result of the shutdown of our competitors' third-generation (3G) network and ongoing efforts to migrate off networkdecreases in prepaid subscribers, to the Verizon network.
Cost of services decreased during the six months ended June 30, 2023 compared to the similar period in 2022. The decrease was primarily the result of:circuit disconnections and pricing changes;
•a decrease of $268$102 million in accesspersonnel costs primarily as a result of the shutdown of our competitors' 3G network and ongoing efforts to migrate off network prepaid subscribersrelated to the Verizon network;
•a decreaseimpact of $112 million in other direct costs related to professional services;
•a decrease of $94 million in digital content costs primarily due to offerings that occurred in 2022 that did not reoccur;workforce changes;
•an increase of $218$49 million in regulatorydirect costs primarily related to a higher FUSF rate;driven by vendor and service provider promotions and discounts received in 2023 that did not reoccur in 2024; and
•an increase of $99$48 million in rent and lease expense primarily driven by new leases and lease modifications related to the continued deployment of the C-Band spectrum.
Cost of Wireless Equipment
Cost of wireless equipment decreased during both the three and six months ended June 30, 2023March 31, 2024 compared to the similar periodsperiod in 2022.2023 primarily as a result of:
The decrease during the three months ended June 30, 2023 was primarily due to •a decrease of $1.7 billion$852 million driven by a lower volume of wireless devices sold primarily related to a decrease of 34% in upgrades.
The decrease during the six months ended June 30, 2023 was primarily the result of:
•a decrease of $2.6 billion driven by a lower volume of wireless devices sold primarily related to a decrease of 26%19% in upgrades; and
•an increase of $191$331 million due to a shift to higher priced equipment in the mix of wireless devices sold.
Selling, General and Administrative Expense
Selling, general and administrative expense includes salaries and wages and benefits not directly attributable to a service or product, the provision for credit losses, taxes other than income taxes, advertising and sales commission costs, call center and information technology costs, regulatory fees, professional service fees and rent and utilities for administrative space. Also included is a portion of the aggregate customer care costs as discussed above in "Cost of Services."
Selling, general and administrative expense increased during both the three and six months ended June 30, 2023March 31, 2024 compared to the similar periodsperiod in 2022.
The increase during the three months ended June 30, 2023was primarily due to:
•an increase of $312 million in personnel costs primarily related to an increase in costs associated with the transition to third-party contracted resources along with the impacts of a prior year compensation plan assumption change that did not reoccur and increased sales commission expense;
•an increase of $237$136 million in personnel costs primarily driven by severance charges;
•an increase of $194 million in the provision for credit losses resulting from additional bad debt reserves as collections return to pre-pandemic levels;
•an increase of $157 million primarily related to an asset rationalization charge and gains recognized in connection with a non-strategic divestiture and other activity in 2022 that did not reoccur;
•an increase of $90 million primarily related to higher handsetcosts for device insurance claims;programs due to an increase in claims; and
•an increase of $69$106 million in advertising costs primarily related to the myPlan launch.
The increase during the six months ended June 30, 2023 was primarily due to:
•an increase of $396 million in the provision for credit losses resulting from additional bad debt reserves as collections return to pre-pandemic levels;
•an increase of $282 million in personnel costs primarily driven by severance charges and third-party contracted resource costs;
•an increase of $142 million primarily related to an asset rationalization charge and gains recognized in connection with a non-strategic divestiture and other activity in 2022 that did not reoccur; and
•an increase of $124 million in advertising costs, including the myPlan launch.legacy legal matter.
See "Special Items" for additional information on the severance and asset rationalization charges.legacy legal matter.
Depreciation and Amortization Expense
Depreciation and amortization expense increased during both the three and six months ended June 30, 2023March 31, 2024 compared to the similar periodsperiod in 20222023 primarily due to the change in the mix of net depreciable and amortizable assets, including the amortization period of certain acquisition-related intangible assets, as well asand the continued deployment of the C-Band spectrum.network assets.
Other Consolidated Results
Other Income, (Expense), Net
Additional information relating to Other income, (expense), net is as follows:
| | Three Months Ended | |
| Three Months Ended | |
| Three Months Ended | |
| | | Three Months Ended | | Six Months Ended | |
| | | June 30, | | | | June 30, | | Increase/ |
| (dollars in millions) | (dollars in millions) | 2023 | | 2022 | | Increase | | 2023 | | 2022 | | (Decrease) |
| (dollars in millions) | |
| (dollars in millions) | |
| Interest income | |
| Interest income | |
| Interest income | Interest income | $ | 92 | | | $ | 21 | | | $ | 71 | | | nm | | $ | 167 | | | $ | 31 | | | $ | 136 | | | nm |
| Other components of net periodic benefit income | Other components of net periodic benefit income | 13 | | | 1 | | | 12 | | | nm | | 26 | | | 300 | | | (274) | | | (91.3) | % |
| Net debt extinguishment gains (losses) | 69 | | | 50 | | | 19 | | | 38.0 | % | | 139 | | | (1,181) | | | 1,320 | | | nm |
| Other components of net periodic benefit income | |
| Other components of net periodic benefit income | |
| Net debt extinguishment gains | |
| Net debt extinguishment gains | |
| Net debt extinguishment gains | |
| Other, net | Other, net | 36 | | | (23) | | | 59 | | | nm | | (8) | | | (25) | | | 17 | | | (68.0) | |
| Total | $ | 210 | | | $ | 49 | | | $ | 161 | | | nm | | $ | 324 | | | $ | (875) | | | $ | 1,199 | | | nm |
| Other, net | |
| Other, net | |
| Other Income, Net | |
| Other Income, Net | |
| Other Income, Net | |
nm - not meaningful
Other income, (expense), net, reflects certain items not directly related to our core operations, including interest income, gains and losses from non-operating asset dispositions, debt extinguishment costs, components of net periodic pension and postretirement benefit cost and income and certain foreign exchange gains and losses.
Other income, (expense), net increased during the three and six months ended June 30, 2023March 31, 2024 compared to the similar periodsperiod in 2022.
The increase during the three months ended June 30, 2023 was primarily due to an increase in interest income due to higher interest rates.
The increase during the six months ended June 30, 2023 was primarily due to:
•an increase of $54 million primarily related to the remeasurement of our foreign currency denominated assets and liabilities resulting in a foreign currency adjustment gain in 2024 compared with a loss in 2023; and
•net debt extinguishment gains of $139$110 million related to tender offers and open market repurchases of various Company notes in 2024, compared with gains of $70 million related to open market repurchases of various Company notes in 2023, compared with losses of $1.2 billion primarily related to tender offers in 2022;
•a pension remeasurement loss of $198 million in 2022 that did not reoccur; and
•an increase in interest income due to higher interest rates.2023.
Interest Expense
| | Three Months Ended | |
| Three Months Ended | |
| Three Months Ended | |
| | | Three Months Ended | | Six Months Ended | |
| | | June 30, | | | | June 30, | | |
| (dollars in millions) | (dollars in millions) | 2023 | | 2022 | | Increase | | 2023 | | 2022 | | Increase |
| (dollars in millions) | |
| (dollars in millions) | |
| Total interest costs on debt balances | |
| Total interest costs on debt balances | |
| Total interest costs on debt balances | Total interest costs on debt balances | $ | 1,843 | | | $ | 1,282 | | | $ | 561 | | | 43.8 | % | | $ | 3,591 | | | $ | 2,590 | | | $ | 1,001 | | | 38.6 | % |
| Less capitalized interest costs | Less capitalized interest costs | 558 | | | 497 | | | 61 | | | 12.3 | | | 1,099 | | | 1,019 | | | 80 | | | 7.9 | |
| Total | $ | 1,285 | | | $ | 785 | | | $ | 500 | | | 63.7 | | | $ | 2,492 | | | $ | 1,571 | | | $ | 921 | | | 58.6 | |
| Less capitalized interest costs | |
| Less capitalized interest costs | |
| Interest Expense | |
| Interest Expense | |
| Interest Expense | |
| Average debt outstanding (1) (3) | $ | 153,348 | | | $ | 152,783 | | | $ | 152,359 | | | $ | 153,108 | | |
Effective interest rate (2) (3) | 4.8 | % | | 3.4 | % | | 4.7 | % | | 3.4 | % | |
Average debt outstanding(1)(3) | |
| Average debt outstanding(1)(3) | |
| Average debt outstanding(1)(3) | |
Effective interest rate(2)(3) | |
Effective interest rate(2)(3) | |
Effective interest rate(2)(3) | |
(1)The average debt outstanding is a financial measure and is calculated by applying a simple average of prior months end balances of total short-term and long-term debt, net of discounts, premiums and unamortized debt issuance costs.
(2)The effective interest rate is the rate of actual interest incurred on debt. It is calculated by dividing the total interest costs on debt balances by the average debt outstanding.
(3)We believe that this measure is useful to management, investors and other users of our financial information in evaluating our debt financing cost and trends in our debt leverage management.
Total interest expense increased during both the three and six months ended June 30, 2023March 31, 2024 compared to the similar periodsperiod in 2022.
The increase during the three months ended June 30, 2023 was primarily as a result of a decrease in capitalized interest costs due to additional C-Band spectrum licenses being placed into service, an increase in interest costs due to a higher average interest rate along withand higher average debt balances, which was partially offset by an increase in capitalized interest costs due to higher average interest rates.
The increase during the six months ended June 30, 2023 was primarily due to an increase in interest costs due to a higher average interest rate, which was partially offset by lower average debt balances and an increase in capitalized interest costs due to higher average interest rates.balances.
Provision for Income TaxesVerizon Consumer Group
| | | | | | | | | | | | | | | | | | | | | | | | | | | | | | | | | | | | | | | | | | | | | | | |
| Three Months Ended | | | | Six Months Ended | | |
| | June 30, | | | | June 30, | | |
| (dollars in millions) | 2023 | | 2022 | | Decrease | | 2023 | | 2022 | | Decrease |
| Provision for income taxes | $ | 1,346 | | | $ | 1,542 | | | $ | (196) | | | (12.7) | % | | $ | 2,828 | | | $ | 2,914 | | | $ | (86) | | | (3.0) | % |
| Effective income tax rate | 22.0 | % | | 22.5 | % | | | | | | 22.4 | % | | 22.5 | % | | | | |
Customers can obtain our wireless services on a postpaid or prepaid basis. Our postpaid service is generally billed one month in advance for a monthly access charge in return for access to and usage of network services. Our prepaid service is offered only to Consumer customers and enables individuals to obtain wireless services without credit verification by paying for all services in advance. The effective income tax rate is calculated by dividing the provision for income taxes by income before the provision for income taxes. The decrease in the provision for income taxes during both the threeConsumer segment also offers several categories of wireless equipment to customers, including a variety of smartphones and six months ended June 30, 2023 comparedother handsets, wireless-enabled internet devices, such as tablets, and other wireless-enabled connected devices, such as smart watches.
In addition to the similar periods in 2022 was primarily duewireless services and equipment discussed above, the Consumer segment sells residential fixed connectivity solutions, including internet, video and voice services, and wireless network access to the decrease in income before income taxes in each of the current periods.resellers on a wholesale basis. The decrease in the effective income tax rate duringConsumer segment's operating revenues for the three months ended June 30, 2023March 31, 2024 totaled $25.1 billion, representing an increase of 0.8% compared to the similar period in 2022 was primarily due2023. See "Segment Results of Operations" for additional information regarding our Consumer segment’s operating performance and selected operating statistics.
Verizon Business Group
Our Business segment provides wireless and wireline communications services and products, including FWA broadband, data, video and conferencing services, corporate networking solutions, security and managed network services, local and long distance voice services and network access to deliver various Internet of Things (IoT) services and products, including solutions that support mobile resource management. We provide these products and services to businesses, government customers and wireless and wireline carriers across the effective income tax rate impactU.S. and a subset of lower income before income taxes inthese products and services to customers around the current period.world. The effective income tax rate duringBusiness segment's operating revenues for the sixthree months ended June 30, 2023 is comparableMarch 31, 2024 totaled $7.4 billion, representing a decrease of 1.6% compared to the similar period in 2022.2023. See "Segment Results of Operations" for additional information regarding our Business segment’s operating performance and selected operating statistics.
Unrecognized Tax BenefitsCorporate and Other
Unrecognized tax benefits were $2.8 billion at both June 30, 2023 and December 31, 2022. Interest and penalties related to unrecognized tax benefits were $577 million (after-tax) and $544 million (after-tax) at June 30, 2023 and December 31, 2022, respectively.
Verizon and/or its subsidiaries file income tax returns in the U.S. federal jurisdiction, and various state, local and foreign jurisdictions. As a large taxpayer, we are under audit by the Internal Revenue Service and multiple state and foreign jurisdictions for various open tax years. It is reasonably possible that the amount of the liability for unrecognized tax benefits could change by a significant amount in the next twelve months. An estimate of the range of the possible change cannot be made until these tax matters are further developed or resolved.
Consolidated Net Income, Consolidated EBITDA and Consolidated Adjusted EBITDA
Consolidated earnings before interest, taxes, depreciation and amortization expense (Consolidated EBITDA) and Consolidated Adjusted EBITDA, which are presented below, are non-GAAP financial measures that we believe are useful to management, investorsCorporate and other usersprimarily includes device insurance programs, investments in unconsolidated businesses and development stage businesses that support our strategic initiatives, as well as unallocated corporate expenses, certain pension and other employee benefit related costs and interest and financing expenses. Corporate and other also includes the historical results of our financial information in evaluating operating profitability on a more variable cost basis as they exclude the depreciation and amortization expense related primarily to capital expenditures and acquisitions that occurred in
priordivested businesses and other adjustments and gains and losses that are not allocated or used in assessing segment performance due to their nature. Although such transactions are excluded from the business segment results, they are included in reported consolidated earnings. Gains and losses from these transactions that are not individually significant are included in segment results and therefore are included in the chief operating decision maker’s assessment of segment performance. See "Consolidated Results of Operations" for additional information regarding Corporate and other results.
Capital Expenditures and Investments
We continue to invest in our wireless networks, high-speed fiber and other advanced technologies to position ourselves at the center of growth trends for the future. During the three months ended March 31, 2024, these investments included $4.4 billion for capital expenditures. See "Cash Flows Used in Investing Activities" for additional information. Capital expenditures for 2024 are expected to be in the range of $17.0 billion to $17.5 billion.
Global Network and Technology
Over the past several years, we have been leading the development of 5G wireless technology industry standards and the ecosystems for fixed and mobile 5G wireless services. 5G technology enables higher throughput and lower latency than 4G LTE technology and allows our networks to handle more traffic as well asthe number of internet-connected devices grows.
We are focusing our capital investment on building our next generation 5G network, while also adding capacity and density to our 4G LTE network. We are densifying our networks by utilizing macro and small cell technology, in-building solutions and distributed antenna systems. Network densification enables us to add capacity to address increasing mobile video consumption and the growing demand for IoT products and services on our 5G and 4G LTE networks. We obtained full access to our C-Band spectrum in evaluating operatingAugust 2023, and will continue deploying this spectrum across the continental U.S.
We continue to build fiber-based networks supporting data, video and advanced business services - areas where demand for reliable high-speed connections is growing. In addition, we leverage our 5G and 4G LTE networks for our FWA broadband service.
| | |
| Consolidated Results of Operations |
In this section, we discuss our overall results of operations and highlight special items, some of which are not included in our segment results. In "Segment Results of Operations" we review the performance of our two reportable segments in relation to Verizon’s competitors. Consolidated EBITDA is calculated by adding back interest, taxes, depreciation and amortization expense to net income.more detail.
Consolidated Adjusted EBITDAOperating Revenues
| | | | | | | | | | | | | | | | | | | | | | | | | | | | | | | |
| | Three Months Ended | | | | | | | | | | |
| | March 31, | | Increase/ | | | | |
| (dollars in millions) | 2024 | | 2023 | | (Decrease) | | | | | | |
| Consumer | $ | 25,057 | | | $ | 24,857 | | | $ | 200 | | | 0.8 | % | | | | | | | | |
| Business | 7,376 | | | 7,494 | | | (118) | | | (1.6) | | | | | | | | | |
| Corporate and other | 611 | | | 617 | | | (6) | | | (1.0) | | | | | | | | | |
| Eliminations | (63) | | | (56) | | | (7) | | | 12.5 | | | | | | | | | |
| Consolidated Operating Revenues | $ | 32,981 | | | $ | 32,912 | | | $ | 69 | | | 0.2 | | | | | | | | | |
Consolidated operating revenues increased during the three months ended March 31, 2024 compared to the similar period in 2023 primarily due to revenue increases in our Consumer segment, partially offset by revenue decreases in our Business segment.
Revenues for our segments are discussed separately below under the heading "Segment Results of Operations."
Consolidated Operating Expenses
| | | | | | | | | | | | | | | | | | | | | | | | | | | | | | | |
| | Three Months Ended | | | | | | | | | | |
| | March 31, | | Increase/ | | | | |
| (dollars in millions) | 2024 | | 2023 | | (Decrease) | | | | | | |
| Cost of services | $ | 6,967 | | | $ | 7,078 | | | $ | (111) | | | (1.6) | % | | | | | | | | |
| Cost of wireless equipment | 5,905 | | | 6,426 | | | (521) | | | (8.1) | | | | | | | | | |
| Selling, general and administrative expense | 8,143 | | | 7,506 | | | 637 | | | 8.5 | | | | | | | | | |
| Depreciation and amortization expense | 4,445 | | | 4,318 | | | 127 | | | 2.9 | | | | | | | | | |
| Consolidated Operating Expenses | $ | 25,460 | | | $ | 25,328 | | | $ | 132 | | | 0.5 | | | | | | | | | |
Operating expenses for our segments are discussed separately below under the heading "Segment Results of Operations."
Cost of Services
Cost of services includes the following costs directly attributable to a service: salaries and wages, benefits, materials and supplies, content costs, contracted services, network access and transport costs, customer provisioning costs, computer systems support and costs to support our outsourcing contracts and technical facilities. Aggregate customer service costs, which include billing and service provisioning, are allocated between Cost of services and Selling, general and administrative expense.
Cost of services decreasedduring the three months ended March 31, 2024 compared to the similar period in 2023 primarily as result of:
•a decrease of $130 million in access costs primarily as a result of decreases in prepaid subscribers, circuit disconnections and pricing changes;
•a decrease of $102 million in personnel costs primarily related to the impact of workforce changes;
•an increase of $49 million in direct costs driven by vendor and service provider promotions and discounts received in 2023 that did not reoccur in 2024; and
•an increase of $48 million in rent and lease expense primarily driven by new leases and lease modifications related to the continued deployment of the C-Band spectrum.
Cost of Wireless Equipment
Cost of wireless equipment decreased during the three months ended March 31, 2024 compared to the similar period in 2023 primarily as a result of:
•a decrease of $852 million driven by a lower volume of wireless devices sold primarily related to a decrease of 19% in upgrades; and
•an increase of $331 million due to a shift to higher priced equipment in the mix of wireless devices sold.
Selling, General and Administrative Expense
Selling, general and administrative expense includes salaries and wages and benefits not directly attributable to a service or product, the provision for credit losses, taxes other than income taxes, advertising and sales commission costs, call center and information technology costs, regulatory fees, professional service fees and rent and utilities for administrative space. Also included is a portion of the aggregate customer care costs as discussed above in "Cost of Services."
Selling, general and administrative expense increased during the three months ended March 31, 2024 compared to the similar period in 2023 primarily due to:
•an increase of $312 million in personnel costs primarily related to an increase in costs associated with the transition to third-party contracted resources along with the impacts of a prior year compensation plan assumption change that did not reoccur and increased sales commission expense;
•an increase of $136 million related to higher costs for device insurance programs due to an increase in claims; and
•an increase of $106 million related to a legacy legal matter.
See "Special Items" for additional information on the legacy legal matter.
Depreciation and Amortization Expense
Depreciation and amortization expense increased during the three months ended March 31, 2024 compared to the similar period in 2023 primarily due to the change in the mix of net depreciable and amortizable assets, including the amortization period of certain acquisition-related intangible assets, and the continued deployment of C-Band network assets.
Other Consolidated Results
Other Income, Net
Additional information relating to Other income, net is as follows:
| | | | | | | | | | | | | | | | | | | | | | | | | | | | | | | |
| Three Months Ended | | | | | | | | | | |
| | March 31, | | Increase/ | | | | |
| (dollars in millions) | 2024 | | 2023 | | (Decrease) | | | | | | |
| Interest income | $ | 78 | | | $ | 75 | | | $ | 3 | | | 4.0 | % | | | | | | | | |
| Other components of net periodic benefit income | — | | | 13 | | | (13) | | | nm | | | | | | | | |
| Net debt extinguishment gains | 110 | | | 70 | | | 40 | | | 57.1 | | | | | | | | | |
| Other, net | 10 | | | (44) | | | 54 | | | nm | | | | | | | | |
| Other Income, Net | $ | 198 | | | $ | 114 | | | $ | 84 | | | 73.7 | | | | | | | | | |
nm - not meaningful
Other income, net, reflects certain items not directly related to our core operations, including interest income, debt extinguishment costs, components of net periodic pension and postretirement benefit cost and income and certain foreign exchange gains and losses.
Other income, net increased during the three months ended March 31, 2024 compared to the similar period in 2023 primarily due to:
•an increase of $54 million primarily related to the remeasurement of our foreign currency denominated assets and liabilities resulting in a foreign currency adjustment gain in 2024 compared with a loss in 2023; and
•net debt extinguishment gains of $110 million related to tender offers and open market repurchases of various Company notes in 2024, compared with gains of $70 million related to open market repurchases of various Company notes in 2023.
Interest Expense
| | | | | | | | | | | | | | | | | | | | | | | | | | | | | | | |
| Three Months Ended | | | | | | | | | | |
| | March 31, | | Increase/ | | | | |
| (dollars in millions) | 2024 | | 2023 | | (Decrease) | | | | | | |
| Total interest costs on debt balances | $ | 1,909 | | | $ | 1,748 | | | $ | 161 | | | 9.2 | % | | | | | | | | |
| Less capitalized interest costs | 274 | | | 541 | | | (267) | | | (49.4) | | | | | | | | | |
| Interest Expense | $ | 1,635 | | | $ | 1,207 | | | $ | 428 | | | 35.5 | | | | | | | | | |
| | | | | | | | | | | | | | | |
Average debt outstanding(1)(3) | $ | 152,754 | | | $ | 151,493 | | | | | | | | | | | | | |
Effective interest rate(2)(3) | 5.0 | % | | 4.6 | % | | | | | | | | | | | | |
(1)The average debt outstanding is a financial measure and is calculated by excluding from Consolidated EBITDAapplying a simple average of prior months end balances of total short-term and long-term debt, net of discounts, premiums and unamortized debt issuance costs.
(2)The effective interest rate is the effectrate of actual interest incurred on debt. It is calculated by dividing the following non-operational items: equity in earnings and losses of unconsolidated businesses and other income and expense, net, as well astotal interest costs on debt balances by the effect of certain special items. average debt outstanding.
(3)We believe that this measure is useful to management, investors and other users of our financial information in evaluating the effectiveness of our operationsdebt financing cost and underlying business trends in a manner that is consistent with management’s evaluation of business performance. We believe that Consolidated Adjusted EBITDA is widely used by investors to compare a company’s operating performance to its competitors by minimizing impacts caused by differences in capital structure, taxes, and depreciation and amortization policies. Further, the exclusion of non-operational items and special items enables comparability to prior period performance and trend analysis. See "Special Items" for additional information.
It is management’s intent to provide non-GAAP financial information to enhance the understanding of Verizon’s GAAP financial information, and it should be considered by the reader in addition to, but not instead of, the financial statements prepared in accordance with GAAP. Each non-GAAP financial measure is presented along with the corresponding GAAP measure so as not to imply that more emphasis should be placed on the non-GAAP measure. We believe that providing these non-GAAP measures in addition to the GAAP measures allows management, investors and other users of our financial information to more fully and accurately assess both consolidated and segment performance. The non-GAAP financial information presented may be determined or calculated differently by other companies and may not be directly comparable to that of other companies.
| | | | | | | | | | | | | | | | | | | | | | | |
| | Three Months Ended | | Six Months Ended |
| June 30, | | June 30, |
| (dollars in millions) | 2023 | | 2022 | | 2023 | | 2022 |
| Consolidated Net Income | $ | 4,766 | | | $ | 5,315 | | | $ | 9,784 | | | $ | 10,026 | |
| Add: | | | | | | | |
| Provision for income taxes | 1,346 | | | 1,542 | | | 2,828 | | | 2,914 | |
| Interest expense | 1,285 | | | 785 | | | 2,492 | | | 1,571 | |
Depreciation and amortization expense (1) | 4,359 | | | 4,321 | | | 8,677 | | | 8,557 | |
| Consolidated EBITDA | $ | 11,756 | | | $ | 11,963 | | | $ | 23,781 | | | $ | 23,068 | |
| | | | | | | |
| Add (Less): | | | | | | | |
Other (income) expense, net (2)(3) | $ | (210) | | | $ | (49) | | | $ | (324) | | | $ | 875 | |
| Equity in (earnings) losses of unconsolidated businesses | 33 | | | (41) | | | 24 | | | (38) | |
| | | | | | | |
| | | | | | | |
| Severance charges | 237 | | | — | | | 237 | | | — | |
| Asset rationalization | 155 | | | — | | | 155 | | | — | |
| | | | | | | |
| | | | | | | |
| | | | | | | |
| | | | | | | |
| Consolidated Adjusted EBITDA | $ | 11,971 | | | $ | 11,873 | | | $ | 23,873 | | | $ | 23,905 | |
(1) Includes Amortization of acquisition-related intangible assets, which were $206 million and $414 million during the three and six months ended June 30, 2023, respectively, and $237 million and $475 million during the three and six months ended June 30, 2022, respectively. See "Special Items" for additional information.
(2) Includes Pension and benefits mark-to-market charges of $198 million during both three and six months ended June 30, 2022. See "Special Items" and "Other Income (Expense), Net" for additional information.
(3) Includes Early debt redemption costs, which were $1.2 billion during the six months ended June 30, 2022. See "Special Items" and "Other Income (Expense), Net" for additional information.leverage management.
The changes in Consolidated Net Income, Consolidated EBITDA and Consolidated Adjusted EBITDA in the table aboveTotal interest expense increased during the three and six months ended June 30, 2023March 31, 2024 compared to the similar periodsperiod in 2022 were2023 primarily as a result of the factors describeda decrease in connection with operating revenuescapitalized interest costs due to additional C-Band spectrum licenses being placed into service, an increase in interest costs due to a higher average interest rate and operating expenses.higher average debt balances.
| | |
Segment Results of Operations |
We have two reportable segments that we operate and manage as strategic business units - Consumer and Business. We measure and evaluate our segments based on segment operating income. The use of segment operating income is consistent with the chief operating decision maker’s assessment of segment performance.
To aid in the understanding of segment performance as it relates to segment operating income, management uses the following operating statistics to evaluate the overall effectiveness of our segments. We believe these operating statistics are useful to investors and other users of our financial information because they provide additional insight into drivers of our segments’ operating results, key trends and performance relative to our peers. These operating statistics may be determined or calculated differently by other companies and may not be directly comparable to those statistics of other companies.
Wireless retail connections are retail customer device postpaid and prepaid connections as of the end of the period. Retail connections under an account may include those from smartphones and basic phones (collectively, phones), postpaid and prepaid FWA, as well as tablets and other internet devices, wearables and retail IoT devices. Wireless retail connections are
calculated by adding total retail postpaid and prepaid new connections in the period to prior period retail connections, and subtracting total retail postpaid and prepaid disconnects in the period.
Wireless retail postpaid connections are retail postpaid customer device connections as of the end of the period. Retail postpaid connections under an account may include those from phones, postpaid FWA, as well as tablets and other internet devices, wearables and retail IoT devices. Wireless retail postpaid connections are calculated by adding retail postpaid new connections in the period to prior period retail postpaid connections, and subtracting retail postpaid disconnects in the period.
Wireless retail prepaid connections are retail prepaid customer device connections as of the end of the period. Retail prepaid connections may include those from phones, prepaid FWA, as well as tablets and other internet devices, and wearables. Wireless retail prepaid connections are calculated by adding retail prepaid new connections in the period to prior period retail prepaid connections, and subtracting retail prepaid disconnects in the period.
Fios internet connections are the total number of connections to the internet using Fios internet services as of the end of the period. Fios internet connections are calculated by adding Fios internet new connections in the period to prior period Fios internet connections, and subtracting Fios internet disconnects in the period.
Fios video connections are the total number of connections to traditional linear video programming using Fios video services as of the end of the period. Fios video connections are calculated by adding Fios video net additions in the period to prior period Fios video connections. Fios video net additions are calculated by subtracting the Fios video disconnects from the Fios video new connections.
Total broadband connections are the total number of connections to the internet using Fios internet services, Digital Subscriber Line (DSL), and postpaid, prepaid and IoT FWA as of the end of the period. Total broadband connections are calculated by adding total broadband connections, net additions in the period to prior period total broadband connections.
Wireless retail connections, net additions are thetotal number of additional retail customer device postpaid and prepaid connections, less the number of device disconnects in the period. Wireless retail connections, net additions in each period presented are calculated by subtracting the total retail postpaid and prepaid disconnects, net of certain adjustments, from the total retail postpaid and prepaid new connections in the period.
Wireless retail postpaid connections, net additions are the total number of additional retail customer device postpaid connections, less the number of device disconnects in the period. Wireless retail postpaid connections, net additions in each period presented are calculated by subtracting the retail postpaid disconnects, net of certain adjustments, from the retail postpaid new connections in the period.
Wireless retail prepaid connections, net additions are the total number of additional retail customer device prepaid connections, less the number of device disconnects in the period. Wireless retail prepaid connections, net additions in each period presented are calculated by subtracting the retail prepaid disconnects, net of certain adjustments, from the retail prepaid new connections in the period.
Wireless retail postpaid phone connections, net additions are the total number of additional retail customer postpaid phone connections, less the number of phone disconnects in the period. Wireless retail postpaid phone connections, net additions in each period presented are calculated by subtracting the retail postpaid phone disconnects, net of certain adjustments, from the retail postpaid phone new connections in the period.
Total broadband connections, net additions are the total number of additional total broadband connections, less the number of total broadband disconnects in the period. Total broadband connections, net additions in each period presented are calculated by subtracting the total broadband disconnects, net of certain adjustments, from the total broadband new connections in the period.
Wireless Churn is the rate at which service to retail, retail postpaid, or retail postpaid phone connections is terminated on average in the period. The churn rate in each period presented is calculated by dividing retail disconnects, retail postpaid disconnects, or retail postpaid phone disconnects by the average retail connections, average retail postpaid connections, or average retail postpaid phone connections, respectively, in the period.
Wireless retail postpaid ARPA is the calculated average retail postpaid service revenue per account (ARPA) from retail postpaid accounts in the period. Wireless retail postpaid service revenue does not include recurring device payment plan billings related to the Verizon device payment program, plan billings related to device warranty and insurance or regulatory fees. Wireless retail postpaid ARPA in each period presented is calculated by dividing retail postpaid service revenue by the average retail postpaid accounts in the period.
Wireless retail postpaid accounts are wireless retailcustomers that are directly served and managed under the Verizon brand and use its services as of the end of the period. Accounts include unlimited plans, shared data plans and corporate accounts, as well as legacy single connection plans and multi-connection family plans. A single account may include monthly wireless services for a variety of connected devices. Wireless retail postpaid accounts are calculated by adding retail postpaid new accounts to the prior period retail postpaid accounts.
Wireless retail postpaid connections per account is the calculated average number of retail postpaid connections per retail postpaid account as of the end of the period. Wireless retail postpaid connections per accountis calculated by dividing the total number of retail postpaid connections by the number of retail postpaid accounts as of the end of the period.
Segment operating income margin reflects the profitability of the segment as a percentage of revenue. Segment operating income margin is calculated by dividing total segment operating income by total segment operating revenues.
Segment earnings before interest, taxes, depreciation and amortization (Segment EBITDA), which is presented below, is a non-GAAP measure and does not purport to be an alternative to operating income (loss) as a measure of operating performance. We believe this measure is useful to management, investors and other users of our financial information in evaluating operating profitability on a more variable cost basis as it excludes the depreciation and amortization expense related primarily to capital expenditures and acquisitions that occurred in prior years, as well as in evaluating operating performance in relation to our competitors. Segment EBITDA is calculated by adding back depreciation and amortization expense to segment operating income (loss). Segment EBITDA margin is calculated by dividing Segment EBITDA by total segment operating revenues. See Note 10 to the condensed consolidated financial statements for additional information.
Verizon Consumer Group
Our Consumer segment provides consumer-focused wireless and wireline communications services and products. Our wireless services are provided across one of the most extensive wireless networks in the United States (U.S.) under the Verizon family of brands and through wholesale and other arrangements. We also provide fixed wireless access (FWA) broadband through our 5G or 4G LTE networks as an alternative to traditional landline internet access. Our wireline services are provided in nine states in the Mid-Atlantic and Northeastern U.S., as well as Washington D.C., over our 100% fiber-optic network through our Verizon Fios product portfolio and over a traditional copper-based network to customers who are not served by Fios. Our Consumer segment's wireless and wireline products and services are available to our retail customers, as well as resellers that purchase wireless network access from us on a wholesale basis.
Customers can obtain our wireless services on a postpaid or prepaid basis. Our postpaid service is generally billed one month in advance for a monthly access charge in return for access to and usage of network services. Our prepaid service is offered only to Consumer customers and enables individuals to obtain wireless services without credit verification by paying for all services in advance. The Consumer segment also offers several categories of wireless equipment to customers, including a variety of smartphones and other handsets, wireless-enabled internet devices, such as tablets, and other wireless-enabled connected devices, such as smart watches.
In addition to the wireless services and equipment discussed above, the Consumer segment sells residential fixed connectivity solutions, including internet, video and voice services, and wireless network access to resellers on a wholesale basis. The Consumer segment's operating revenues for the three months ended March 31, 2024 totaled $25.1 billion, representing an increase of 0.8% compared to the similar period in 2023. See "Segment Results of Operations" for additional information regarding our Consumer segment’s operating performance and selected operating statistics.
Verizon Business Group
Our Business segment provides wireless and wireline communications services and products, including FWA broadband, data, video and conferencing services, corporate networking solutions, security and managed network services, local and long distance voice services and network access to deliver various Internet of Things (IoT) services and products, including solutions that support mobile resource management. We provide these products and services to businesses, government customers and wireless and wireline carriers across the U.S. and a subset of these products and services to customers around the world. The Business segment's operating revenues for the three months ended March 31, 2024 totaled $7.4 billion, representing a decrease of 1.6% compared to the similar period in 2023. See "Segment Results of Operations" for additional information regarding our Business segment’s operating performance and selected operating statistics.
Corporate and Other
Corporate and other primarily includes device insurance programs, investments in unconsolidated businesses and development stage businesses that support our strategic initiatives, as well as unallocated corporate expenses, certain pension and other employee benefit related costs and interest and financing expenses. Corporate and other also includes the historical results of
divested businesses and other adjustments and gains and losses that are not allocated or used in assessing segment performance due to their nature. Although such transactions are excluded from the business segment results, they are included in reported consolidated earnings. Gains and losses from these transactions that are not individually significant are included in segment results and therefore are included in the chief operating decision maker’s assessment of segment performance. See "Consolidated Results of Operations" for additional information regarding Corporate and other results.
Capital Expenditures and Investments
We continue to invest in our wireless networks, high-speed fiber and other advanced technologies to position ourselves at the center of growth trends for the future. During the three months ended March 31, 2024, these investments included $4.4 billion for capital expenditures. See "Cash Flows Used in Investing Activities" for additional information. Capital expenditures for 2024 are expected to be in the range of $17.0 billion to $17.5 billion.
Global Network and Technology
Over the past several years, we have been leading the development of 5G wireless technology industry standards and the ecosystems for fixed and mobile 5G wireless services. 5G technology enables higher throughput and lower latency than 4G LTE technology and allows our networks to handle more traffic as the number of internet-connected devices grows.
We are focusing our capital investment on building our next generation 5G network, while also adding capacity and density to our 4G LTE network. We are densifying our networks by utilizing macro and small cell technology, in-building solutions and distributed antenna systems. Network densification enables us to add capacity to address increasing mobile video consumption and the growing demand for IoT products and services on our 5G and 4G LTE networks. We obtained full access to our C-Band spectrum in August 2023, and will continue deploying this spectrum across the continental U.S.
We continue to build fiber-based networks supporting data, video and advanced business services - areas where demand for reliable high-speed connections is growing. In addition, we leverage our 5G and 4G LTE networks for our FWA broadband service.
| | |
| Consolidated Results of Operations |
In this section, we discuss our overall results of operations and highlight special items, some of which are not included in our segment results. In "Segment Results of Operations" we review the performance of our two reportable segments in more detail.
Consolidated Operating Revenues
| | | | | | | | | | | | | | | | | | | | | | | | | | | | | | | |
| | Three Months Ended | | | | | | | | | | |
| | March 31, | | Increase/ | | | | |
| (dollars in millions) | 2024 | | 2023 | | (Decrease) | | | | | | |
| Consumer | $ | 25,057 | | | $ | 24,857 | | | $ | 200 | | | 0.8 | % | | | | | | | | |
| Business | 7,376 | | | 7,494 | | | (118) | | | (1.6) | | | | | | | | | |
| Corporate and other | 611 | | | 617 | | | (6) | | | (1.0) | | | | | | | | | |
| Eliminations | (63) | | | (56) | | | (7) | | | 12.5 | | | | | | | | | |
| Consolidated Operating Revenues | $ | 32,981 | | | $ | 32,912 | | | $ | 69 | | | 0.2 | | | | | | | | | |
Consolidated operating revenues increased during the three months ended March 31, 2024 compared to the similar period in 2023 primarily due to revenue increases in our Consumer segment, partially offset by revenue decreases in our Business segment.
Revenues for our segments are discussed separately below under the heading "Segment Results of Operations."
Consolidated Operating Expenses
| | | | | | | | | | | | | | | | | | | | | | | | | | | | | | | |
| | Three Months Ended | | | | | | | | | | |
| | March 31, | | Increase/ | | | | |
| (dollars in millions) | 2024 | | 2023 | | (Decrease) | | | | | | |
| Cost of services | $ | 6,967 | | | $ | 7,078 | | | $ | (111) | | | (1.6) | % | | | | | | | | |
| Cost of wireless equipment | 5,905 | | | 6,426 | | | (521) | | | (8.1) | | | | | | | | | |
| Selling, general and administrative expense | 8,143 | | | 7,506 | | | 637 | | | 8.5 | | | | | | | | | |
| Depreciation and amortization expense | 4,445 | | | 4,318 | | | 127 | | | 2.9 | | | | | | | | | |
| Consolidated Operating Expenses | $ | 25,460 | | | $ | 25,328 | | | $ | 132 | | | 0.5 | | | | | | | | | |
Operating expenses for our segments are discussed separately below under the heading "Segment Results of Operations."
Cost of Services
Cost of services includes the following costs directly attributable to a service: salaries and wages, benefits, materials and supplies, content costs, contracted services, network access and transport costs, customer provisioning costs, computer systems support and costs to support our outsourcing contracts and technical facilities. Aggregate customer service costs, which include billing and service provisioning, are allocated between Cost of services and Selling, general and administrative expense.
Cost of services decreasedduring the three months ended March 31, 2024 compared to the similar period in 2023 primarily as result of:
•a decrease of $130 million in access costs primarily as a result of decreases in prepaid subscribers, circuit disconnections and pricing changes;
•a decrease of $102 million in personnel costs primarily related to the impact of workforce changes;
•an increase of $49 million in direct costs driven by vendor and service provider promotions and discounts received in 2023 that did not reoccur in 2024; and
•an increase of $48 million in rent and lease expense primarily driven by new leases and lease modifications related to the continued deployment of the C-Band spectrum.
Cost of Wireless Equipment
Cost of wireless equipment decreased during the three months ended March 31, 2024 compared to the similar period in 2023 primarily as a result of:
•a decrease of $852 million driven by a lower volume of wireless devices sold primarily related to a decrease of 19% in upgrades; and
•an increase of $331 million due to a shift to higher priced equipment in the mix of wireless devices sold.
Selling, General and Administrative Expense
Selling, general and administrative expense includes salaries and wages and benefits not directly attributable to a service or product, the provision for credit losses, taxes other than income taxes, advertising and sales commission costs, call center and information technology costs, regulatory fees, professional service fees and rent and utilities for administrative space. Also included is a portion of the aggregate customer care costs as discussed above in "Cost of Services."
Selling, general and administrative expense increased during the three months ended March 31, 2024 compared to the similar period in 2023 primarily due to:
•an increase of $312 million in personnel costs primarily related to an increase in costs associated with the transition to third-party contracted resources along with the impacts of a prior year compensation plan assumption change that did not reoccur and increased sales commission expense;
•an increase of $136 million related to higher costs for device insurance programs due to an increase in claims; and
•an increase of $106 million related to a legacy legal matter.
See "Special Items" for additional information on the legacy legal matter.
Depreciation and Amortization Expense
Depreciation and amortization expense increased during the three months ended March 31, 2024 compared to the similar period in 2023 primarily due to the change in the mix of net depreciable and amortizable assets, including the amortization period of certain acquisition-related intangible assets, and the continued deployment of C-Band network assets.
Other Consolidated Results
Other Income, Net
Additional information relating to Other income, net is as follows:
| | | | | | | | | | | | | | | | | | | | | | | | | | | | | | | |
| Three Months Ended | | | | | | | | | | |
| | March 31, | | Increase/ | | | | |
| (dollars in millions) | 2024 | | 2023 | | (Decrease) | | | | | | |
| Interest income | $ | 78 | | | $ | 75 | | | $ | 3 | | | 4.0 | % | | | | | | | | |
| Other components of net periodic benefit income | — | | | 13 | | | (13) | | | nm | | | | | | | | |
| Net debt extinguishment gains | 110 | | | 70 | | | 40 | | | 57.1 | | | | | | | | | |
| Other, net | 10 | | | (44) | | | 54 | | | nm | | | | | | | | |
| Other Income, Net | $ | 198 | | | $ | 114 | | | $ | 84 | | | 73.7 | | | | | | | | | |
nm - not meaningful
Other income, net, reflects certain items not directly related to our core operations, including interest income, debt extinguishment costs, components of net periodic pension and postretirement benefit cost and income and certain foreign exchange gains and losses.
Other income, net increased during the three months ended March 31, 2024 compared to the similar period in 2023 primarily due to:
•an increase of $54 million primarily related to the remeasurement of our foreign currency denominated assets and liabilities resulting in a foreign currency adjustment gain in 2024 compared with a loss in 2023; and
•net debt extinguishment gains of $110 million related to tender offers and open market repurchases of various Company notes in 2024, compared with gains of $70 million related to open market repurchases of various Company notes in 2023.
Interest Expense
| | | | | | | | | | | | | | | | | | | | | | | | | | | | | | | |
| Three Months Ended | | | | | | | | | | |
| | March 31, | | Increase/ | | | | |
| (dollars in millions) | 2024 | | 2023 | | (Decrease) | | | | | | |
| Total interest costs on debt balances | $ | 1,909 | | | $ | 1,748 | | | $ | 161 | | | 9.2 | % | | | | | | | | |
| Less capitalized interest costs | 274 | | | 541 | | | (267) | | | (49.4) | | | | | | | | | |
| Interest Expense | $ | 1,635 | | | $ | 1,207 | | | $ | 428 | | | 35.5 | | | | | | | | | |
| | | | | | | | | | | | | | | |
Average debt outstanding(1)(3) | $ | 152,754 | | | $ | 151,493 | | | | | | | | | | | | | |
Effective interest rate(2)(3) | 5.0 | % | | 4.6 | % | | | | | | | | | | | | |
(1)The average debt outstanding is a financial measure and is calculated by applying a simple average of prior months end balances of total short-term and long-term debt, net of discounts, premiums and unamortized debt issuance costs.
(2)The effective interest rate is the rate of actual interest incurred on debt. It is calculated by dividing the total interest costs on debt balances by the average debt outstanding.
(3)We believe that this measure is useful to management, investors and other users of our financial information in evaluating our debt financing cost and trends in our debt leverage management.
Total interest expense increased during the three months ended March 31, 2024 compared to the similar period in 2023 primarily as a result of a decrease in capitalized interest costs due to additional C-Band spectrum licenses being placed into service, an increase in interest costs due to a higher average interest rate and higher average debt balances.
Provision for Income Taxes
| | | | | | | | | | | | | | | | | | | | | | | | | | | | | | | |
| Three Months Ended | | | | | | |
| | March 31, | | | | | | |
| (dollars in millions) | 2024 | | 2023 | | Decrease | | | | | | |
| Provision for income taxes | $ | 1,353 | | | $ | 1,482 | | | $ | (129) | | | (8.7) | % | | | | | | | | |
| Effective income tax rate | 22.3 | % | | 22.8 | % | | | | | | | | | | | | |
The effective income tax rate is calculated by dividing the provision for income taxes by income before the provision for income taxes. During the three months ended March 31, 2024, both the provision for income taxes and the effective income tax rate decreased compared to the similar period in 2023 due to lower income before taxes in the current period.
Unrecognized Tax Benefits
Unrecognized tax benefits were $2.7 billion at both March 31, 2024 and December 31, 2023. Interest and penalties related to unrecognized tax benefits were $650 million (after-tax) and $630 million (after-tax) at March 31, 2024 and December 31, 2023, respectively.
Verizon and/or its subsidiaries file income tax returns in the U.S. federal jurisdiction, and various state, local and foreign jurisdictions. As a large taxpayer, we are under audit by the Internal Revenue Service and multiple state and foreign jurisdictions for various open tax years. It is reasonably possible that the amount of the liability for unrecognized tax benefits could change by a significant amount in the next twelve months. An estimate of the range of the possible change cannot be made until these tax matters are further developed or resolved.
Consolidated Net Income, Consolidated EBITDA and Consolidated Adjusted EBITDA
Consolidated earnings before interest, taxes, depreciation and amortization expense (Consolidated EBITDA) and Consolidated Adjusted EBITDA, which are presented below, are non-GAAP financial measures that we believe are useful to management, investors and other users of our financial information in evaluating operating profitability on a more variable cost basis as they exclude the depreciation and amortization expense related primarily to capital expenditures and acquisitions that occurred in prior years, as well as in evaluating operating performance in relation to Verizon’s competitors. Consolidated EBITDA is calculated by adding back interest, taxes, depreciation and amortization expense to net income.
Consolidated Adjusted EBITDA is calculated by excluding from Consolidated EBITDA the effect of the following non-operational items: equity in earnings and losses of unconsolidated businesses and other income and expense, net, as well as the effect of certain special items. We believe that this measure is useful to management, investors and other users of our financial information in evaluating the effectiveness of our operations and underlying business trends. We believe that Consolidated Adjusted EBITDA is widely used by investors to compare a company’s operating performance to its competitors by minimizing impacts caused by differences in capital structure, taxes, and depreciation and amortization policies. Further, the exclusion of non-operational items and special items enables comparability to prior period performance and trend analysis. See "Special Items" for additional information.
It is management’s intent to provide non-GAAP financial information to enhance the understanding of Verizon’s GAAP financial information, and it should be considered by the reader in addition to, but not instead of, the financial statements prepared in accordance with GAAP. Each non-GAAP financial measure is presented along with the corresponding GAAP measure so as not to imply that more emphasis should be placed on the non-GAAP measure. We believe that providing these non-GAAP measures in addition to the GAAP measures allows management, investors and other users of our financial information to more fully and accurately assess both consolidated and segment performance. The non-GAAP financial information presented may be determined or calculated differently by other companies and may not be directly comparable to that of other companies.
| | | | | | | | | | | | | | | |
| | Three Months Ended | | |
| March 31, | | |
| (dollars in millions) | 2024 | | 2023 | | | | |
| Consolidated Net Income | $ | 4,722 | | | $ | 5,018 | | | | | |
| Add: | | | | | | | |
| Provision for income taxes | 1,353 | | | 1,482 | | | | | |
| Interest expense | 1,635 | | | 1,207 | | | | | |
Depreciation and amortization expense(1) | 4,445 | | | 4,318 | | | | | |
| Consolidated EBITDA | $ | 12,155 | | | $ | 12,025 | | | | | |
| | | | | | | |
| Add (Less): | | | | | | | |
| Other income, net | $ | (198) | | | $ | (114) | | | | | |
| Equity in (earnings) losses of unconsolidated businesses | 9 | | | (9) | | | | | |
| | | | | | | |
| | | | | | | |
| | | | | | | |
| | | | | | | |
| | | | | | | |
| | | | | | | |
| | | | | | | |
| | | | | | | |
| | | | | | | |
| | | | | | | |
| Legacy legal matter | 106 | | | — | | | | | |
| Consolidated Adjusted EBITDA | $ | 12,072 | | | $ | 11,902 | | | | | |
(1) Includes Amortization of acquisition-related intangible assets, which were $221 million and $208 million during the three months ended March 31, 2024 and 2023, respectively. See "Special Items" for additional information.
The changes in Consolidated Net Income, Consolidated EBITDA and Consolidated Adjusted EBITDA in the table above during the three months ended March 31, 2024 compared to the similar period in 2023 were primarily a result of the factors described in connection with consolidated operating revenues and consolidated operating expenses.
| | |
| Segment Results of Operations |
We have two reportable segments that we operate and manage as strategic business units - Consumer and Business. We measure and evaluate our segments based on segment operating income. The use of segment operating income is consistent with the chief operating decision maker’s assessment of segment performance.
To aid in the understanding of segment performance as it relates to segment operating income, management uses the following operating statistics to evaluate the overall effectiveness of our segments. We believe these operating statistics are useful to investors and other users of our financial information because they provide additional insight into drivers of our segments’ operating results, key trends and performance relative to our peers. These operating statistics may be determined or calculated differently by other companies and may not be directly comparable to those statistics of other companies.
Wireless retail connections are retail customer device postpaid and prepaid connections as of the end of the period. Retail connections under an account may include those from smartphones and basic phones (collectively, phones), postpaid and prepaid FWA, as well as tablets and other internet devices, wearables and retail IoT devices. Wireless retail connections are calculated by adding total retail postpaid and prepaid new connections in the period to prior period retail connections, and subtracting total retail postpaid and prepaid disconnects in the period.
Wireless retail postpaid connections are retail postpaid customer device connections as of the end of the period. Retail postpaid connections under an account may include those from phones, postpaid FWA, as well as tablets and other internet devices, wearables and retail IoT devices. Wireless retail postpaid connections are calculated by adding retail postpaid new connections in the period to prior period retail postpaid connections, and subtracting retail postpaid disconnects in the period.
Wireless retail prepaid connections are retail prepaid customer device connections as of the end of the period. Retail prepaid connections may include those from phones, prepaid FWA, as well as tablets and other internet devices, and wearables. Wireless retail prepaid connections are calculated by adding retail prepaid new connections in the period to prior period retail prepaid connections, and subtracting retail prepaid disconnects in the period.
Fios internet connections are the total number of connections to the internet using Fios internet services as of the end of the period. Fios internet connections are calculated by adding Fios internet new connections in the period to prior period Fios internet connections, and subtracting Fios internet disconnects in the period.
Fios video connections are the total number of connections to traditional linear video programming using Fios video services as of the end of the period. Fios video connections are calculated by adding Fios video net additions in the period to prior period Fios video connections. Fios video net additions are calculated by subtracting the Fios video disconnects from the Fios video new connections.
Total broadband connections are the total number of connections to the internet using Fios internet services, Digital Subscriber Line (DSL), and postpaid, prepaid and IoT FWA as of the end of the period. Total broadband connections are calculated by adding total broadband connections, net additions in the period to prior period total broadband connections.
Wireless retail connections, net additions are thetotal number of additional retail customer device postpaid and prepaid connections, less the number of device disconnects in the period. Wireless retail connections, net additions in each period presented are calculated by subtracting the total retail postpaid and prepaid disconnects, net of certain adjustments, from the total retail postpaid and prepaid new connections in the period.
Wireless retail postpaid connections, net additions are the total number of additional retail customer device postpaid connections, less the number of device disconnects in the period. Wireless retail postpaid connections, net additions in each period presented are calculated by subtracting the retail postpaid disconnects, net of certain adjustments, from the retail postpaid new connections in the period.
Wireless retail prepaid connections, net additions are the total number of additional retail customer device prepaid connections, less the number of device disconnects in the period. Wireless retail prepaid connections, net additions in each period presented are calculated by subtracting the retail prepaid disconnects, net of certain adjustments, from the retail prepaid new connections in the period.
Wireless retail postpaid phone connections, net additions are the total number of additional retail customer postpaid phone connections, less the number of phone disconnects in the period. Wireless retail postpaid phone connections, net additions in each period presented are calculated by subtracting the retail postpaid phone disconnects, net of certain adjustments, from the retail postpaid phone new connections in the period.
Total broadband connections, net additions are the total number of additional total broadband connections, less the number of total broadband disconnects in the period. Total broadband connections, net additions in each period presented are calculated by subtracting the total broadband disconnects, net of certain adjustments, from the total broadband new connections in the period.
Wireless churn is the rate at which service to retail, retail postpaid, or retail postpaid phone connections is terminated on average in the period. The churn rate in each period presented is calculated by dividing retail disconnects, retail postpaid disconnects, or retail postpaid phone disconnects by the average retail connections, average retail postpaid connections, or average retail postpaid phone connections, respectively, in the period.
Wireless retail postpaid ARPA is the calculated average retail postpaid service revenue per account (ARPA) from retail postpaid accounts in the period. Wireless retail postpaid service revenue does not include recurring device payment plan billings related to the Verizon device payment program, plan billings related to device warranty and insurance or regulatory fees. Wireless retail postpaid ARPA in each period presented is calculated by dividing retail postpaid service revenue by the average retail postpaid accounts in the period.
Wireless retail postpaid accounts are wireless retailcustomers that are directly served and managed under the Verizon brand and use its services as of the end of the period. Accounts include unlimited plans, shared data plans and corporate accounts, as well as legacy single connection plans and multi-connection family plans. A single account may include monthly wireless services for a variety of connected devices. Wireless retail postpaid accounts are calculated by adding retail postpaid new accounts to the prior period retail postpaid accounts.
Wireless retail postpaid connections per account is the calculated average number of retail postpaid connections per retail postpaid account as of the end of the period. Wireless retail postpaid connections per accountis calculated by dividing the total number of retail postpaid connections by the number of retail postpaid accounts as of the end of the period.
Segment operating income margin reflects the profitability of the segment as a percentage of revenue. Segment operating income margin is calculated by dividing total segment operating income by total segment operating revenues.
Segment earnings before interest, taxes, depreciation and amortization (Segment EBITDA), which is presented below, is a non-GAAP measure and does not purport to be an alternative to operating income (loss) as a measure of operating performance. We believe this measure is useful to management, investors and other users of our financial information in evaluating operating profitability on a more variable cost basis as it excludes the depreciation and amortization expense related primarily to capital expenditures and acquisitions that occurred in prior years, as well as in evaluating operating performance in relation to our competitors. Segment EBITDA is calculated by adding back depreciation and amortization expense to segment operating income (loss). Segment EBITDA margin is calculated by dividing Segment EBITDA by total segment operating revenues.
See Note 10 to the condensed consolidated financial statements for additional information.
Verizon Consumer Group
Our Consumer segment provides consumer-focused wireless and wireline communications services and products. Our wireless services are provided across one of the most extensive wireless networks in the U.S. under the Verizon family of brands and through wholesale and other arrangements. We also provide FWA broadband through our wireless networks.5G or 4G LTE networks as an alternative to traditional landline internet access. Our wireline services are provided in nine states in the Mid-Atlantic and Northeastern U.S., as well as Washington D.C., over our 100% fiber-optic network through our Verizon Fios product portfolio and over a traditional copper-based network to customers who are not served by Fios.
Operating Revenues and Selected Operating Statistics
| | Three Months Ended | | | | Six Months Ended | | |
| June 30, | | Increase/ | | June 30, | | Increase/ |
| | | | | Three Months Ended | |
| | | | | Three Months Ended | |
| | | | | Three Months Ended | |
| | | | | March 31, | |
| | | | | March 31, | |
| | | | | March 31, | | | Increase/ |
| (dollars in millions, except ARPA) | (dollars in millions, except ARPA) | 2023 | | 2022 | | (Decrease) | | 2023 | | 2022 | | (Decrease) | (dollars in millions, except ARPA) | | | | | | | 2024 | | 2023 | | (Decrease) |
| Service | Service | $ | 18,641 | | $ | 18,149 | | $ | 492 | | | 2.7% | | $ | 37,097 | | $ | 36,275 | | $ | 822 | | | 2.3% | Service | | | | | | | | | $ | 18,998 | | $ | 18,456 | | $ | 542 | | | 2.9% | | 2.9% |
| Wireless equipment | Wireless equipment | 4,430 | | 5,708 | | (1,278) | | | (22.4) | | 9,308 | | 11,082 | | (1,774) | | | (16.0) | Wireless equipment | | | | | | | | | 4,490 | | 4,878 | | (388) | | | (8.0) | | (8.0) |
| Other | Other | 1,487 | | 1,747 | | (260) | | | (14.9) | | 3,010 | | 3,539 | | (529) | | | (14.9) | Other | | | | | | | | | 1,569 | | 1,523 | | 46 | | | 3.0 | | 3.0 |
| Total Operating Revenues | Total Operating Revenues | $ | 24,558 | | $ | 25,604 | | $ | (1,046) | | | (4.1) | | $ | 49,415 | | $ | 50,896 | | $ | (1,481) | | | (2.9) | Total Operating Revenues | | | | | | | | | $ | 25,057 | | $ | 24,857 | | $ | 200 | | | 0.8 | | 0.8 |
| | Revenue Statistics: | |
| Revenue Statistics: | |
| Revenue Statistics: | |
| Wireless service revenue | |
| Wireless service revenue | |
| Wireless service revenue | | | | | | | | | | $ | 16,134 | | $ | 15,599 | | $ | 535 | | | 3.4 |
| Fios revenue | | Fios revenue | | | | | | | | | $ | 2,896 | | $ | 2,889 | | $ | 7 | | | 0.2 |
| Connections (‘000):(1) | Connections (‘000):(1) | |
Connections (‘000):(1) | |
Connections (‘000):(1) | |
Wireless retail postpaid | |
Wireless retail postpaid | |
Wireless retail postpaid | Wireless retail postpaid | | 92,474 | | 91,475 | | 999 | | | 1.1 | | | | | | | | | 93,905 | | 92,192 | | 1,713 | | | 1.9 | | 1.9 |
| Wireless retail prepaid | Wireless retail prepaid | | 21,646 | | 23,138 | | (1,492) | | | (6.4) | Wireless retail prepaid | | | | | | | | | 20,904 | | 22,331 | | (1,427) | | | (6.4) | | (6.4) |
| Total wireless retail | Total wireless retail | | 114,120 | | 114,613 | | (493) | | | (0.4) | Total wireless retail | | | | | | | | | 114,809 | | 114,523 | | 286 | | | 0.2 | | 0.2 |
| Fios internet | Fios internet | | 6,854 | | 6,626 | | 228 | | | 3.4 | Fios internet | | | | | | | | | 7,025 | | 6,803 | | 222 | | | 3.3 | | 3.3 |
| Fios video | Fios video | | 3,091 | | 3,409 | | (318) | | | (9.3) | Fios video | | | | | | | | | 2,883 | | 3,160 | | (277) | | | (8.8) | | (8.8) |
| | Total broadband | Total broadband | | 8,488 | | 7,322 | | 1,166 | | | 15.9 |
| | Total broadband | |
| | Total broadband | | | | | | | | | | 9,297 | | 8,202 | | 1,095 | | | 13.4 |
| | Net Additions in Period (‘000): | |
| | Net Additions in Period (‘000): | |
| | | Net Additions in Period (‘000): | Net Additions in Period (‘000): | |
| Wireless retail postpaid | Wireless retail postpaid | 304 | | | 84 | | | 220 | | | nm | | 625 | | (42) | | 667 | | | nm |
| Wireless retail postpaid | |
| Wireless retail postpaid | | | | | | | | | | 75 | | 321 | | (246) | | | (76.6) |
| Wireless retail prepaid | Wireless retail prepaid | (304) | | | (229) | | | (75) | | | (32.8) | | (655) | | (309) | | (346) | | | nm | Wireless retail prepaid | | | | | | | | | (216) | | (351) | | 135 | | | 38.5 | | 38.5 |
| Total wireless retail | Total wireless retail | — | | | (145) | | | 145 | | | nm | | (30) | | (351) | | 321 | | | 91.5 | Total wireless retail | | | | | | | | | (141) | | (30) | | (111) | | | nm | | nm |
| | Wireless retail postpaid phones | (136) | | | (215) | | | 79 | | | 36.7 | | (399) | | (507) | | 108 | | | 21.3 |
| Wireless retail postpaid phone | |
| Wireless retail postpaid phone | |
| Wireless retail postpaid phone | | | | | | | | | | (158) | | (263) | | 105 | | | 39.9 |
| | | Total broadband | Total broadband | 287 | | | 181 | | | 106 | | | 58.6 | | 589 | | 330 | | 259 | | | 78.5 |
| | | Total broadband | |
| | Total broadband | | | | | | | | | | 239 | | 302 | | (63) | | | (20.9) |
| | Churn Rate: | |
| Churn Rate: | |
| Churn Rate: | Churn Rate: | |
| Wireless retail | Wireless retail | 1.58 | % | | 1.53 | % | | 1.63 | % | | 1.52 | % | |
| Wireless retail | |
| Wireless retail | |
| Wireless retail postpaid | Wireless retail postpaid | 0.95 | % | | 0.93 | % | | 1.00 | % | | 0.94 | % | |
| Wireless retail postpaid phones | 0.76 | % | | 0.75 | % | | 0.80 | % | | 0.76 | % | |
| Wireless retail postpaid | |
| Wireless retail postpaid | |
| Wireless retail postpaid phone | |
| Wireless retail postpaid phone | |
| Wireless retail postpaid phone | |
| | Account Statistics: | |
| | Account Statistics: | |
| | Account Statistics: | Account Statistics: | |
| Wireless retail postpaid ARPA | Wireless retail postpaid ARPA | $ | 131.83 | | $ | 124.16 | | $ | 7.67 | | 6.2 | | $ | 130.95 | | $ | 124.06 | | $ | 6.89 | | | 5.6 |
| Wireless retail postpaid ARPA | |
| Wireless retail postpaid ARPA | | | | | | | | | | $ | 135.75 | | $ | 130.06 | | $ | 5.69 | | | 4.4 |
| Wireless retail postpaid accounts (‘000)(1) | |
Wireless retail postpaid accounts (‘000)(1) | |
Wireless retail postpaid accounts (‘000) (1) | Wireless retail postpaid accounts (‘000) (1) | | 32,976 | | 33,386 | | (410) | | | (1.2) | | | | | | | | | 32,876 | | 33,034 | | (158) | | | (0.5) | | (0.5) |
Wireless retail postpaid connections per account (1) | Wireless retail postpaid connections per account (1) | | 2.80 | | 2.74 | | 0.06 | | | 2.2 | Wireless retail postpaid connections per account(1) | | | | | | | | | 2.86 | | 2.79 | | 0.07 | | | 2.5 | | 2.5 |
|
(1)As of end of period
Where applicable, the operating results reflect certain adjustments, including those related to the 3G network shutdowns, migration activity among different types of devices and plans, customer profile changes, and adjustments in connection with mergers, acquisitions and divestitures.
nm - not meaningful
Consumer’s total operating revenues decreasedincreased during both the three and six months ended June 30, 2023March 31, 2024 compared to the similar periodsperiod in 20222023 as a result of decreasesincreases in Wireless equipmentService and Other revenues, partially offset by increasesa decrease in Service revenues.Wireless equipment revenue.
Service Revenue
Service revenue increased during both the three and six months ended June 30, 2023March 31, 2024 compared to the similar periodsperiod in 20222023 primarily driven by an increase in Wireless service revenue.
Wireless service revenue increased $526 million during the three months ended June 30, 2023March 31, 2024 compared to the similar period in 20222023 primarily as a result of:
•an increase of $502$409 million in access revenues related to our postpaid plans primarily driven by recentdue to pricing actions; a larger allocation of administrative and telco recovery charges, which partly recover network operating costs, to Wireless service revenue from Other revenue; an increase in our FWA subscriber base; and an update to the device protection offering which changed the product mix such that a larger amount of the overall device protection revenue is recognized in Service revenue in addition to an increase in the price of the bundled offering.subscriptions through MyPlan offerings. These increases were partially offset by the amortization of wireless equipment sales promotions;
•an increase of $97$149 million related to growth in non-retail service revenue;
•an increase of $64 million in TravelPass revenue related to an increase inthrough increased customer international travel; and
•an increase of $61 million related to growth in non-retail service revenue; and
•a decrease of $128$106 million in prepaid revenue primarily due to a decrease in the prepaid subscriber base of base.TracFone Wireless, Inc. (TracFone).
Wireless service revenue increased $908 million during the six months ended June 30, 2023 compared to the similar period in 2022 primarily as a result of:
•an increase of $871 million in access revenues related to our postpaid plans primarily driven by recent pricing actions; a larger allocation of administrative and telco recovery charges, which partly recover network operating costs, to Wireless service revenue from Other revenue; an increase in our FWA subscriber base; an update to the device protection offering which changed the product mix such that a larger amount of the overall device protection revenue is recognized in Service revenue in addition to an increase in the price of the bundled offering. These increases were partially offset by the amortization of wireless equipment sales promotions;
•an increase of $168 million in TravelPass revenue related to an increase in customer international travel;
•an increase of $133 million related to growth in non-retail service revenue; and
•a decrease of $253 million in prepaid revenue primarily due to a decrease in the subscriber base of TracFone.
For the three and six months ended June 30, 2023, Fios service revenue totaled $2.7 billion and $5.4 billion, respectively, and remained relatively flat for both periods compared to the similar periods in 2022.
Wireless Equipment Revenue
Wireless equipment revenue decreased during both the three and six months ended June 30, 2023March 31, 2024 compared to the similar periodsperiod in 2022.
The decrease during the three months ended June 30, 2023 was primarily theas a result of:
•a decrease of $1.5 billion$722 million driven by a lower volume of wireless devices sold primarily related to a decrease of 38%21% in upgrades; and
•an increase of $159 million related to a shift to higher priced equipment in the mix of wireless devices sold.
The decrease during the six months ended June 30, 2023 was primarily the result of:
•a decrease of $2.3 billion driven by a lower volume of wireless devices sold primarily related to a decrease of 28% in upgrades; and
•an increase of $415$365 million related to a shift to higher priced equipment in the mix of wireless devices sold.
Other Revenue
Other revenue includes fees that partially recover the direct and indirect costs of complying with regulatory and industry obligations and programs, revenues associated with certain products included in our device protection offerings, leasing and interest recognized when equipment is sold to the customer by an authorized agent under a device payment plan agreement.
Other revenue decreased during bothremained relatively flat for the three and six months ended June 30, 2023March 31, 2024 compared to the similar periodsperiod in 2022.2023.
The decrease during the three months ended June 30, 2023 was primarily the result of:
•a decrease of $287 million in revenue primarily related to a larger allocation of administrative and telco recovery charges, which partly recover network operating costs, to Wireless service revenue from Other revenue;
•a decrease of $23 million in device protection revenue primarily related to an update to the device protection offering which changed the product mix such that a smaller amount of the overall device protection revenue is recognized in Other revenue, partially offset by an increase in the price of the bundled offering; and
•an increase of $65 million in revenue from regulatory surcharges, primarily related to FUSF surcharges driven by a higher rate, partially offset by a decrease related to other regulatory surcharges.
The decrease during the six months ended June 30, 2023 was primarily the result of:
•a decrease of $574 million in revenue primarily related to a larger allocation of administrative and telco recovery charges, which partly recover network operating costs, to Wireless service revenue from Other revenue;
•a decrease of $73 million in device protection revenue primarily related to an update to the device protection offering which changed the product mix such that a smaller amount of the overall device protection revenue is recognized in Other revenue, partially offset by an increase in the price of the bundled offering; and
•an increase of $144 million in revenue from regulatory surcharges, primarily related to FUSF surcharges driven by a higher rate, partially offset by a decrease related to other regulatory surcharges.
Operating Expenses
| | Three Months Ended | |
| Three Months Ended | |
| Three Months Ended | |
| | | Three Months Ended | | | | Six Months Ended | | |
| | | June 30, | | Increase/ | | June 30, | | Increase/ |
| (dollars in millions) | (dollars in millions) | 2023 | | 2022 | | (Decrease) | | 2023 | | 2022 | | (Decrease) |
| (dollars in millions) | |
| (dollars in millions) | |
| Cost of services | |
| Cost of services | |
| Cost of services | Cost of services | $ | 4,367 | | | $ | 4,284 | | | $ | 83 | | | 1.9 | % | | $ | 8,799 | | | $ | 8,730 | | | $ | 69 | | | 0.8 | % |
| Cost of wireless equipment | Cost of wireless equipment | 4,626 | | | 6,221 | | | (1,595) | | | (25.6) | | | 9,817 | | | 12,034 | | | (2,217) | | | (18.4) | |
| Cost of wireless equipment | |
| Cost of wireless equipment | |
| Selling, general and administrative expense | |
| Selling, general and administrative expense | |
| Selling, general and administrative expense | Selling, general and administrative expense | 4,988 | | | 4,738 | | | 250 | | | 5.3 | | | 9,909 | | | 9,290 | | | 619 | | | 6.7 | |
| Depreciation and amortization expense | Depreciation and amortization expense | 3,247 | | | 3,211 | | | 36 | | | 1.1 | | | 6,461 | | | 6,373 | | | 88 | | | 1.4 | |
| Depreciation and amortization expense | |
| Depreciation and amortization expense | |
| Total Operating Expenses | Total Operating Expenses | $ | 17,228 | | | $ | 18,454 | | | $ | (1,226) | | | (6.6) | | | $ | 34,986 | | | $ | 36,427 | | | $ | (1,441) | | | (4.0) | |
| Total Operating Expenses | |
| Total Operating Expenses | |
Cost of Services
Cost of services increased during both the three and six months ended June 30, 2023March 31, 2024 compared to the similar periodsperiod in 2022.
The increase during the three months ended June 30, 2023 was primarily theas a result of:
•an increase of $96 million in personnel costs mainly driven by a decrease in capitalized labor in connection with the completion of our incremental C-Band capital spending program and a return to our routine capital spending trends and an increase in third-party contracted resource costs;
•an increase of $61 million in regulatory costs primarily related to a higher FUSF rate;
•an increase of $41$59 million in rent and lease expense primarily driven by new leases and lease modifications related to the continued deployment of the C-Band spectrum;
•an increase of $42 million in personnel costs mainly driven by certain other post-employment benefit credits in 2023 that did not reoccur in 2024;
•an increase of $40 million in direct costs driven by vendor and service provider promotions and discounts received in 2023 that did not reoccur in 2024;
•an increase of $29 million in digital content costs primarily associated with an increase in subscriptions through MyPlan offerings, partially offset by a decrease in traditional linear content costs due to a decline in Fios video subscribers; and
•a decrease of $128$84 million in access costs primarily as a result of the shutdown of our competitors' 3G network and ongoing efforts to migrate off networkdecreases in prepaid subscribers, to the Verizon network.
The increase during the six months ended June 30, 2023 was primarily the result of:
•an increase of $159 million in regulatory costs primarily related to a higher FUSF rate;
•an increase of $150 million in personnel costs mainly driven by a decrease in capitalized labor in connection with the completion of our incremental C-Band capital spending programcircuit disconnections and a return to our routine capital spending trends and valuation assumption changes in connection with certain post-employment benefits;
•an increase of $71 million in rent and lease expense primarily driven by new leases and lease modifications related to the deployment of the C-Band spectrum;
•a decrease of $259 million in access costs primarily as a result of the shutdown of our competitors' 3G network and ongoing efforts to migrate off network prepaid subscribers to the Verizon network; and
•a decrease of $75 million in digital content costs primarily due to offerings that occurred in 2022 that did not reoccur.pricing changes.
Cost of Wireless Equipment
Cost of wireless equipment decreased during both the three and six months ended June 30, 2023March 31, 2024 compared to the similar periodsperiod in 2022.
The decrease during the three months ended June 30, 2023 was primarily theas a result of:
•a decrease of $1.6 billion$719 million driven by a lower volume of wireless devices sold primarily related to a decrease of 38%21% in upgrades; and
•an increase of $33 million related to a shift to higher priced equipment in the mix of wireless devices sold.
The decrease during the six months ended June 30, 2023 was primarily the result of:
•a decrease of $2.3 billion driven by a lower volume of wireless devices sold primarily related to a decrease of 28% in upgrades; and
•an increase of $189$278 million related to a shift to higher priced equipment in the mix of wireless devices sold.
Selling, General and Administrative Expense
Selling, general and administrative expense increased during both the three and six months ended June 30, 2023March 31, 2024 compared to the similar periodsperiod in 2022.
The increase during the three months ended June 30, 2023was primarily due to:
•an increase of $146$80 million in personnel costs mainly driven by the provision for credit losses resulting from additional bad debt reserves as collections return to pre-pandemic levels;impacts of a prior year compensation plan assumption change that did not reoccur and increased sales commission expense; and
•an increase of $74$50 million in advertising costs primarily related to the myPlan launch.
The increase during the six months ended June 30, 2023 was primarily due to:
•an increase of $325 million in the provision for credit losses resulting from additional bad debt reserves as collections return to pre-pandemic levels;
•an increase of $149 million in advertising costs, including the myPlan launch; and
•an increase of $112 million in personnel costsregulatory fees mainly driven by an increase in third-party contracted resource costs, partially offset by valuation assumption changes in connection with certain employee benefits.rates.
Depreciation and Amortization Expense
Depreciation and amortization expense increased during both the three and six months ended June 30, 2023March 31, 2024 compared to the similar periodsperiod in 20222023 driven by the change in the mix of total Verizon depreciable and amortizable assets and Consumer's usage of those assets.
Segment Operating Income and EBITDA
| | Three Months Ended | |
| Three Months Ended | |
| Three Months Ended | |
| | | Three Months Ended | | | | Six Months Ended | | |
| | | June 30, | | | | June 30, | | Increase/ |
| (dollars in millions) | (dollars in millions) | 2023 | | 2022 | | Increase | | 2023 | | 2022 | | (Decrease) |
| (dollars in millions) | |
| (dollars in millions) | |
| Segment Operating Income | |
| Segment Operating Income | |
| Segment Operating Income | Segment Operating Income | $ | 7,330 | | | $ | 7,150 | | | $ | 180 | | | 2.5 | % | | $ | 14,429 | | | $ | 14,469 | | | $ | (40) | | | (0.3) | % |
| Add Depreciation and amortization expense | Add Depreciation and amortization expense | 3,247 | | | 3,211 | | | 36 | | | 1.1 | | | 6,461 | | | 6,373 | | | 88 | | | 1.4 | |
| Add Depreciation and amortization expense | |
| Add Depreciation and amortization expense | |
| Segment EBITDA | |
| Segment EBITDA | |
| Segment EBITDA | Segment EBITDA | $ | 10,577 | | | $ | 10,361 | | | $ | 216 | | | 2.1 | | | $ | 20,890 | | | $ | 20,842 | | | $ | 48 | | | 0.2 | |
| | Segment operating income margin | Segment operating income margin | 29.8 | % | | 27.9 | % | | | 29.2 | % | | 28.4 | % | | |
| | Segment operating income margin | |
| | Segment operating income margin | |
| Segment EBITDA margin | Segment EBITDA margin | 43.1 | % | | 40.5 | % | | 42.3 | % | | 41.0 | % | |
| Segment EBITDA margin | |
| Segment EBITDA margin | |
The changes in the table above during the three and six months ended June 30, 2023March 31, 2024 compared to the similar periodsperiod in 20222023 were primarily a result of the factors described in connection with Consumer operating revenues and operating expenses.
Verizon Business Group
Our Business segment provides wireless and wireline communications services and products, including FWA broadband, data, video and conferencing services, corporate networking solutions, security and managed network services, local and long distance voice services and network access to deliver various IoT services and products. We also provide FWA broadband through our wireless networks. We provide these products and services to businesses, government customers and wireless and wireline carriers across the U.S. and selecta subset of these products and services to customers around the world.
During the first quarter of 2023, Verizon reorganized the customer groups within its The Business segment. Previously, this segment was comprised of four customer groups: Small and Medium Business, Global Enterprise, Public Sector and Other, and Wholesale. Following the reorganization, there are nowis organized in three customer groups: Enterprise and Public Sector, Business Markets and Other, and Wholesale. Enterprise and Public Sector combines the customers previously included in Global Enterprise and Public Sector and Other (excluding BlueJeans and Connect) as well as the commercial wireline customers previously included in Small and Medium Business. Business Markets and Other combines the customers previously included in Small and Medium Business (excluding commercial wireline customers), the BlueJeans customers previously included in Global Enterprise and Public Sector and Other, and the Connect customers previously included in Public Sector and Other. The Wholesale customer group remained unchanged. Prior period operating revenue results within the Business segment have been recast for these reorganized customer groups. There was no change to the composition of our reportable segments and total segment results, nor the determination of segment profit.
Operating Revenues and Selected Operating Statistics
| | | | | | | | Three Months Ended | |
| | | | | | | Three Months Ended | |
| | | | | | | Three Months Ended | |
| | | Three Months Ended | | Six Months Ended | |
| | | June 30, | | Increase/ | | June 30, | | Increase/ | | | | | March 31, | | Increase/ |
| (dollars in millions) | (dollars in millions) | 2023 | | 2022 | | (Decrease) | | 2023 | | 2022 | | (Decrease) | (dollars in millions) | | | | | | | 2024 | | 2023 | | (Decrease) |
| Enterprise and Public Sector | Enterprise and Public Sector | $ | 3,784 | | | $ | 3,867 | | | $ | (83) | | | (2.1) | % | | $ | 7,571 | | $ | 7,845 | | $ | (274) | | | (3.5) | % | Enterprise and Public Sector | | | | | | | | | $ | 3,587 | | $ | 3,787 | | $ | (200) | | | (5.3) | | (5.3) | % |
| Business Markets and Other(1) | 3,109 | | | 3,130 | | | (21) | | | (0.7) | | | 6,213 | | 6,206 | | 7 | | | 0.1 | |
| Business Markets and Other | |
| Business Markets and Other | |
| Business Markets and Other | |
| Wholesale | Wholesale | 590 | | | 629 | | | (39) | | | (6.2) | | | 1,193 | | 1,284 | | (91) | | | (7.1) | |
Total Operating Revenues(2) | $ | 7,483 | | | $ | 7,626 | | | $ | (143) | | | (1.9) | | | $ | 14,977 | | $ | 15,335 | | $ | (358) | | | (2.3) | |
Total Operating Revenues(1) | |
| | Revenue Statistics: | |
| Revenue Statistics: | |
| Revenue Statistics: | |
| Wireless service revenue | |
| Wireless service revenue | |
| Wireless service revenue | |
| Fios revenue | |
Connections (‘000):(3)(2) | Connections (‘000):(3)(2) | |
| Wireless retail postpaid | |
| Wireless retail postpaid | |
| Wireless retail postpaid | Wireless retail postpaid | | 29,105 | | 28,208 | | 897 | | | 3.2 | |
| Fios internet | Fios internet | | 380 | | 367 | | 13 | | | 3.5 | |
| Fios video | Fios video | | 64 | | 70 | | (6) | | | (8.6) | |
| | | Total broadband | |
| | Total broadband | |
| | Total broadband | Total broadband | | 1,334 | | 790 | | 544 | | | 68.9 | |
| | | | Net Additions in Period (‘000): | Net Additions in Period (‘000): | |
| | Net Additions in Period (‘000): | |
| | Net Additions in Period (‘000): | |
| Wireless retail postpaid | Wireless retail postpaid | 308 | | | 430 | | | (122) | | | (28.4) | | | 620 | | 825 | | (205) | | | (24.8) | |
| Wireless retail postpaid phones | 144 | | | 227 | | | (83) | | | (36.6) | | | 280 | | 483 | | (203) | | | (42.0) | |
| Wireless retail postpaid | |
| Wireless retail postpaid | |
| Wireless retail postpaid phone | |
| | Total broadband | Total broadband | 131 | | | 87 | | | 44 | | | 50.6 | | | 266 | | 167 | | 99 | | | 59.3 | |
| | Total broadband | |
| | Total broadband | |
| | Churn Rate: | |
| Churn Rate: | |
| Churn Rate: | Churn Rate: | |
| Wireless retail postpaid | Wireless retail postpaid | 1.48 | % | | 1.37 | % | | 1.49% | | 1.35% | |
| Wireless retail postpaid phones | 1.10 | % | | 1.07 | % | | 1.13% | | 1.07% | |
| Wireless retail postpaid | |
| Wireless retail postpaid | |
| Wireless retail postpaid phone | |
| Wireless retail postpaid phone | |
| Wireless retail postpaid phone | |
|
(1)Referred to as Business Markets and SaaS in the first quarter of 2023.
(2) Service and other revenues included in our Business segment were approximately $6.6$6.5 billion and $6.7$6.6 billion for the three months ended June 30,March 31, 2024 and 2023, and 2022, respectively. Service and other revenues included in our Business segment were $13.2 billion and $13.4 billion for the six months ended June 30, 2023 and 2022, respectively. Wireless equipment revenues included in our Business segment were $847$871 million and $966$882 million for the three months ended June 30,March 31, 2024 and 2023, and 2022, respectively, and $1.7 billion and $1.9 billion for the six months ended June 30, 2023 and 2022, respectively.
(3)(2) As of end of period
Where applicable, the operating results reflect certain adjustments, including those related to the 3G network shutdowns, migration activity among different types of devices and plans, customer profile changes, and adjustments in connection with mergers, acquisitions and divestitures.
Business’s total operating revenues decreased during both the three and six months ended June 30, 2023March 31, 2024 compared to the similar periodsperiod in 2022. The decrease during the three months ended June 30, 2023 was a result of decreases in Enterprise and Public Sector, Business Markets and Other and Wholesale revenues. The decrease during the six months ended June 30, 2023 wasas a result of decreases in Enterprise and Public Sector and Wholesale revenues, partially offset by an increase in Business Markets and Other revenue.
Enterprise and Public Sector
Enterprise and Public Sector offers wireless products and services as well as wireline connectivity and managed solutions to our large business and government customers. Large businesses are identified based on their size and volume of business with Verizon. Public sector offers these services with features and pricing designed to address the needs of U.S. federal, state and local governments and educational institutions.
Enterprise and Public Sector revenues decreased during both the three and six months ended June 30, 2023March 31, 2024 compared to the similar periodsperiod in 2022.
The decrease during the three months ended June 30, 2023 was primarily the result of:due to:
•a decrease of $89$150 million in networkingwireline revenue andprimarily driven by decreases in networking, traditional data and voice communication services relateddue to secular pressures in the marketplace;market pressure, coupled with lower customer premise equipment sales volumes; and
•a decrease of $21$20 million in Wireless equipment revenue driven by a lower volumedecrease in the number of wireless devices sold primarily due to fewer upgrades, partially offset by a shift to higher priced equipment in the mix of devices sold; and
•an increase of $31 million in customer premise equipment primarily due to higher volumes.
The decrease during the six months ended June 30, 2023 was primarily the result of:
•a decrease of $310 million in networking revenue and traditional data and voice communication services along with related professional services, driven by secular pressures in the marketplace;
•a decrease of $45 million in Wireless equipment revenue driven by a lower volume of devices sold, partially offset by a shift to higher priced equipment in the mix of devices sold;
•an increase of $67 million in customer premise equipment primarily due to higher volumes; and
•an increase of $45 million primarily related to a higher FUSF rate.sold.
Business Markets and Other
Business Markets and Other offers wireless services and equipment, conferencing services, tailored voice and networking products, Fios services, Internet Protocol networking, advanced voice solutions and security and managed information technology services to our businessesbusiness customers that ordinarily do not meet the requirements to be categorized as Enterprise and Public Sector, as described above. Business Markets and Other also includes solutions that support fleet tracking management, compliance management, field service management, asset tracking and other types of mobile resource management.
Business Markets and Other revenue decreasedincreased during the three months ended June 30, 2023March 31, 2024 compared to the similar period in 2022. The decrease was2023 primarily the result of:
•a decrease of $99 million in Wireless equipment revenue primarily driven by a lower volume of devices sold;
•a decrease of $42 million in Other revenue primarily relateddue to a larger allocation of administrative and telco recovery charges, which partly recover network operating costs, to Wireless service revenue from Other revenue;
•a decrease of $20 million related to the loss of voice and DSL service connections; and
•an increase of $146$114 million in Wireless service revenue primarily driven mainly by an increase in the number of wireless retail postpaid connections as well as the economic adjustment charge that took effect late in the second quarter of 2022; a larger allocation of administrative and telco recovery charges, which partly recover network operating costs, to Wireless service revenue from Other revenue; and an increase in our FWA subscriber base.base and our pricing actions.
Business Markets and Other increased duringFios revenues remained flat for the sixthree months ended June 30, 2023March 31, 2024 compared to the similar period in 2022. The increase was primarily the result of:
•an increase of $289 million in Wireless service revenue primarily driven by an increase in the number of wireless retail postpaid connections as well as the economic adjustment charge that took effect late in the second quarter of 2022; a larger allocation of administrative and telco recovery charges, which partly recover network operating costs, to Wireless service revenue from Other revenue; and an increase in our FWA subscriber base;
•a decrease of $154 million in Wireless equipment revenue primarily driven by a lower volume of devices sold;
•a decrease of $65 million in Other revenue primarily related to a larger allocation of administrative and telco recovery charges, which partly recover network operating costs, to Wireless service revenue from Other revenue; and
•a decrease of $41 million related to the loss of voice and DSL service connections.
For the three and six months ended June 30, 2023, Fios revenues totaled $230 million and $460 million, respectively, and remained relatively flat for both periods compared to the similar periods in 2022.2023.
Wholesale
Wholesale offers wireline communications services including data, voice, local dial tone and broadband services primarily to local, long distance, and wireless carriers that use our facilities to provide services to their customers.
ForWholesale revenue remained relatively flat for the three and six months ended June 30, 2023, Wholesale revenues decreased $39 million and $91 million, respectively,March 31, 2024 compared to the similar periodsperiod in 2022 primarily due to declines in traditional voice communication and network connectivity as a result of technology substitution, as well as a decrease in core data.2023.
Operating Expenses
| | Three Months Ended | |
| Three Months Ended | |
| Three Months Ended | |
| | | Three Months Ended | | | | Six Months Ended | | |
| | | June 30, | | Increase/ | | June 30, | | Increase/ |
| (dollars in millions) | (dollars in millions) | 2023 | | 2022 | | (Decrease) | | 2023 | | 2022 | | (Decrease) |
| (dollars in millions) | |
| (dollars in millions) | |
| Cost of services | |
| Cost of services | |
| Cost of services | Cost of services | $ | 2,543 | | | $ | 2,559 | | | $ | (16) | | | (0.6) | % | | $ | 5,125 | | | $ | 5,165 | | | $ | (40) | | | (0.8) | % |
| Cost of wireless equipment | Cost of wireless equipment | 1,152 | | | 1,268 | | | (116) | | | (9.1) | | | 2,386 | | | 2,578 | | | (192) | | | (7.4) | |
| Cost of wireless equipment | |
| Cost of wireless equipment | |
| Selling, general and administrative expense | |
| Selling, general and administrative expense | |
| Selling, general and administrative expense | Selling, general and administrative expense | 2,152 | | | 2,050 | | | 102 | | | 5.0 | | | 4,185 | | | 4,109 | | | 76 | | | 1.8 | |
| Depreciation and amortization expense | Depreciation and amortization expense | 1,103 | | | 1,074 | | | 29 | | | 2.7 | | | 2,197 | | | 2,135 | | | 62 | | | 2.9 | |
| Depreciation and amortization expense | |
| Depreciation and amortization expense | |
| Total Operating Expenses | Total Operating Expenses | $ | 6,950 | | | $ | 6,951 | | | $ | (1) | | | — | | | $ | 13,893 | | | $ | 13,987 | | | $ | (94) | | | (0.7) | |
| Total Operating Expenses | |
| Total Operating Expenses | |
Cost of Services
Cost of services remained relatively flatdecreased during the three months ended June 30, 2023 and decreased during the six months ended June 30, 2023March 31, 2024 compared to the similar periodsperiod in 2022.
The decrease during the six months ended June 30, 2023 was primarily the result of:due to:
•a decrease of $94$77 million in other directpersonnel costs related to professional services;the impact of workforce changes, partially offset by certain other post-employment benefit credits in 2023 that did not reoccur in 2024;
•a decrease of $46 million in access costs related to changes in usage, partially offset by changes in circuit access prices; and
•an increasea decrease of $59$29 million in regulatorycustomer premise equipment costs primarily relateddue to a higher FUSF rate.lower volumes sold.
Cost of Wireless Equipment
Cost of wireless equipment decreased during both the three and six months ended June 30, 2023March 31, 2024 compared to the similar periodsperiod in 2022.
The decrease during the three months ended June 30, 2023 was primarily theas a result of:
•a decrease of $160$132 million driven by a lower volume of wireless devices sold primarily related to fewer phone upgrades;sold; and
•an increase of $44$53 million driven byrelated to a shift to higher priced equipment in the mix of wireless devices sold.
The decrease during the six months ended June 30, 2023 was primarily the result of:
•an increase of $95 million driven by a shift to higher priced equipment in the mix of wireless devices sold.Contents
Selling, General and Administrative Expense
Selling, general and administrative expense increased during both the three and six months ended June 30, 2023March 31, 2024 compared to the similar periodsperiod in 2022.
The increase during the three months ended June 30, 2023 was primarily due to:
•to an increase of $50$209 million in the provision for credit losses resulting from additional bad debt reserves as collections return to pre-pandemic levels; and
•an increase of $63 millionpersonnel costs primarily related to gains recognizedan increase in connectioncosts associated with the transition to third-party contracted resources along with the impacts of a non-strategic divestiture and other activity in 2022prior year compensation plan assumption change that did not reoccur.
The increase during the six months ended June 30, 2023 was primarily the result of:
•an increase of $76 million in the provision for credit losses resulting from additional bad debt reserves as collections return to pre-pandemic levels;
•an increase of $61 million primarily related to gains recognized in connection with a non-strategic divestiturereoccur and other activity in 2022 that did not reoccur; and
•a decrease of $36 million in regulatory fees related to a decrease in rates.increased sales commission expense.
Depreciation and Amortization Expense
Depreciation and amortization expense increased during both the three and six months ended June 30, 2023March 31, 2024 compared to the similar periodsperiod in 20222023 driven by the change in the mix of total Verizon depreciable and amortizable assets and Business's usage of those assets.
Segment Operating Income and EBITDA
| | | | Three Months Ended | | | | Six Months Ended | | |
| | June 30, | | Increase/ | | June 30, | | Increase/ |
| | |
| March 31, | |
| March 31, | |
| March 31, | |
| (dollars in millions) | |
| (dollars in millions) | |
| (dollars in millions) | (dollars in millions) | 2023 | | 2022 | | (Decrease) | | 2023 | | 2022 | | (Decrease) |
| Segment Operating Income | Segment Operating Income | $ | 533 | | | $ | 675 | | | $ | (142) | | | (21.0) | % | | $ | 1,084 | | | $ | 1,348 | | | $ | (264) | | | (19.6) | % |
| Segment Operating Income | |
| Segment Operating Income | |
| Add Depreciation and amortization expense | Add Depreciation and amortization expense | 1,103 | | | 1,074 | | | 29 | | | 2.7 | | | 2,197 | | | 2,135 | | | 62 | | | 2.9 | |
| Add Depreciation and amortization expense | |
| Add Depreciation and amortization expense | |
| Segment EBITDA | |
| Segment EBITDA | |
| Segment EBITDA | Segment EBITDA | $ | 1,636 | | | $ | 1,749 | | | $ | (113) | | | (6.5) | | | $ | 3,281 | | | $ | 3,483 | | | $ | (202) | | | (5.8) | |
| | Segment operating income margin | Segment operating income margin | 7.1 | % | | 8.9 | % | | 7.2 | % | | 8.8 | % | |
| | Segment operating income margin | |
| | Segment operating income margin | |
| Segment EBITDA margin | Segment EBITDA margin | 21.9 | % | | 22.9 | % | | 21.9 | % | | 22.7 | % | |
| Segment EBITDA margin | |
| Segment EBITDA margin | |
The changes in the table above during the three and six months ended June 30, 2023March 31, 2024 compared to the similar period in 20222023 were primarily a result of the factors described in connection with Business operating revenues and operating expenses.
Special items included in Income Before Provision For Income Taxes were as follows:
| | | | Three Months Ended | | Six Months Ended |
| | June 30, | | June 30, |
| | |
| March 31, | |
| March 31, | |
| March 31, | |
| (dollars in millions) | |
| (dollars in millions) | |
| (dollars in millions) | (dollars in millions) | 2023 | | 2022 | | 2023 | | 2022 |
| Amortization of acquisition-related intangible assets(1) | Amortization of acquisition-related intangible assets(1) | |
| Depreciation and amortization expense | $ | 206 | | | $ | 237 | | | $ | 414 | | | $ | 475 | |
| Severance, pension and benefits charges | |
| Selling, general and administrative expense | 237 | | | — | | | 237 | | | — | |
| Other (income) expense, net | — | | | 198 | | | — | | | 198 | |
| Asset rationalization | |
| Cost of services | 14 | | | — | | | 14 | | | — | |
| Selling, general and administrative expense | 141 | | | — | | | 141 | | | — | |
| Early debt redemption costs | |
| Other (income) expense, net | — | | | — | | | — | | | 1,241 | |
| | Amortization of acquisition-related intangible assets(1) | |
| Amortization of acquisition-related intangible assets(1) | |
| Depreciation and amortization expense | |
| Depreciation and amortization expense | |
| Depreciation and amortization expense | |
| | Legacy legal matter | |
| | Legacy legal matter | |
| | Legacy legal matter | |
| Selling, general and administrative expense | |
| Selling, general and administrative expense | |
| Selling, general and administrative expense | |
| Total | Total | $ | 598 | | | $ | 435 | | | $ | 806 | | | $ | 1,914 | |
| Total | |
| Total | |
(1) Amounts are included in segment results of operations.
Consolidated Adjusted EBITDA, a non-GAAP measure discussed in the section titled "Consolidated Net Income, Consolidated EBITDA and Consolidated Adjusted EBITDA" as part of Consolidated Results of Operations, excludes all of the amounts listed in the tableincluded above.
The income and expenses related to special items included in our condensed consolidated results of operations were as follows:
| | | | | | | | | | | | | | | | | | | | | | | |
| | Three Months Ended | | Six Months Ended |
| June 30, | | June 30, |
| (dollars in millions) | 2023 | | 2022 | | 2023 | | 2022 |
| Within Total Operating Expenses | $ | 598 | | | $ | 237 | | | $ | 806 | | | $ | 475 | |
| | | | | | | |
| Within Other (income) expense, net | — | | | 198 | | | — | | | 1,439 | |
| | | | | | | |
| Total | $ | 598 | | | $ | 435 | | | $ | 806 | | | $ | 1,914 | |
| | | | | | | | | | | | | | | |
| | Three Months Ended | | |
| March 31, | | |
| (dollars in millions) | 2024 | | 2023 | | | | |
| Within Total Operating Expenses | $ | 327 | | | $ | 208 | | | | | |
| | | | | | | |
| | | | | | | |
| | | | | | | |
| Total | $ | 327 | | | $ | 208 | | | | | |
Amortization of Acquisition-Related Intangible Assets
During the three and six months ended June 30,March 31, 2024 and 2023, we recorded pre-tax amortization expense of $206$221 million and $414$208 million, respectively, related to acquired intangible assets.
Legacy Legal Matter
During the three and six months ended June 30, 2022, we recorded pre-tax amortization expense of $237 million and $475 million, respectively, related to acquired intangible assets.
Severance, Pension and Benefits Charges
During both the three and six months ended June 30, 2023, we recorded pre-tax severance charges of $237 million related to involuntary separations under our existing plans.
During both the three and six months ended June 30, 2022, we recorded a net pre-tax remeasurement loss of $198 million in our pension plans triggered by settlements, primarily driven by a $654 million charge resulting from the difference between our estimated and actual return on assets, partially offset by a credit of $456 million mainly due to changes in our discount rate and changes in our lump sum interest rate assumptions used to determine the liabilities of our pension plans for the year.
See Note 8 to the condensed consolidated financial statements for additional information.
Asset Rationalization
During both the three and six months ended June 30, 2023,March 31, 2024, we recorded a pre-tax asset rationalization charge of $155$106 million drivenassociated with a litigation matter related to a legacy contract for the production of telephone directories in Costa Rica by certain real estate and non-strategic assets that we have made a decision to cease usesubsidiary of as part of our transformation initiatives.
Early Debt Redemption Costs
During the six months ended June 30, 2022, we recorded pre-tax early debt redemption costs of $1.2 billion primarily in connection with tender offers. See Note 5 to the condensed consolidated financial statements for additional information.Company.
| | |
| Consolidated Financial Condition |
| | | | Six Months Ended | | | | Three Months Ended | | |
| June 30, | |
| March 31, | |
| (dollars in millions) | |
| (dollars in millions) | |
| (dollars in millions) | (dollars in millions) | 2023 | | 2022 | | Change | 2024 | | 2023 | | Change |
| Cash Flows Provided By (Used In) | Cash Flows Provided By (Used In) | |
| Operating activities | |
| Operating activities | |
| Operating activities | Operating activities | $ | 18,020 | | | $ | 17,665 | | | $ | 355 | |
| Investing activities | Investing activities | (10,200) | | | (14,656) | | | 4,456 | |
| Financing activities | Financing activities | (5,586) | | | (3,837) | | | (1,749) | |
| Increase (decrease) in cash, cash equivalents and restricted cash | Increase (decrease) in cash, cash equivalents and restricted cash | $ | 2,234 | | | $ | (828) | | | $ | 3,062 | |
We use the net cash generated from our operations to fund expansion and modernization of our networks, service and repay external financing, pay dividends, invest in new businesses and spectrum and, when appropriate, buy back shares of our outstanding common stock. Our sources of funds, primarily from operations and, to the extent necessary, from external financing arrangements, are sufficient to meet ongoing operating and investing requirements over the next 12 months and beyond.
Our cash and cash equivalents are held both domestically and internationally, and are invested to maintain principal and provide liquidity. See "Market Risk" for additional information regarding our foreign currency risk management strategies.
We expect that our capital spending requirements will continue to be financed primarily through internally generated funds. Debt or equity financing may be needed to fund additional investments or development activities, or to maintain an appropriate capital structure to ensure our financial flexibility. Our external financing arrangements include credit facilities and other bank lines of credit, an active commercial paper program, vendor financing arrangements, issuances of registered debt or equity securities, U.S. retail medium-term notes and other securities that are privately-placed or offered overseas. In addition, we monetize certain receivables through asset-backed debt transactions.
Cash Flows Provided By Operating Activities
Our primary source of funds continues to be cash generated from operations. Net cash provided by operating activities increased $355 milliondecreased $1.2 billion during the sixthree months ended June 30, 2023March 31, 2024 compared to the similar period in 20222023 primarily due to an improvement in working capital. The improvementhigher interest expense due to higher average interest rates, a discretionary pension plan contribution of $365 million and changes in working capital was driven byrelated to timing. As a change in receivables resulting primarily from fewer phone upgrades compared toresult of the prior year. Further driving the working capital improvement were lower inventory levels. This increase was partially offset by higher cash income taxes paid and a decrease in earnings. During the six months ended June 30, 2023, we made ayear discretionary contribution of $200 million to one of our qualified pension plans. As a result,plans and the additional $365 million contribution made in 2024, we expect that there will be no required pension funding through 2026,the end of 2024, subject to changes in market conditions.
Cash Flows Used In Investing Activities
Capital Expenditures
Capital expenditures continue to relate primarily to the use of capital resources to enhance the operating efficiency and productivity of our networks, maintain our existing infrastructure, facilitate the introduction of new products and services and enhance responsiveness to competitive challenges.
Capital expenditures, including capitalized software, for the sixthree months ended June 30,March 31, 2024 and 2023 and 2022 were $10.1$4.4 billion and $10.5$6.0 billion, respectively. Capital expenditures decreased approximately $421 million$1.6 billion during the sixthree months ended June 30, 2023March 31, 2024 compared to the similar period in 20222023 primarily due to the completion of our accelerated $10 billion capital program related to our C-Band deployment. See "Global Network and Technology" for more details.deployment in the first half of 2023.
Acquisitions of Wireless Licenses
During the sixthree months ended June 30,March 31, 2024 and 2023, and 2022, we made payments of $114$269 million and $1.4 billion,$114 million, respectively, for obligations related to clearing costs and accelerated clearing incentives associated with Auction 107.
During the sixthree months ended June 30,March 31, 2024 and 2023, and 2022, we recorded capitalized interest related to wireless licenses of $905$180 million and $880$449 million, respectively.
Collateral Receipts (Payments) Related to Derivative Contracts, Net
During the sixthree months ended June 30,March 31, 2024, we made collateral payments of $432 million related to derivative contracts, net of receipts. During the three months ended March 31, 2023, we received return of collateral posted of $824$367 million related to derivative contracts, net of payments. During the six months ended June 30, 2022, we made collateral payments of $2.1 billion related to derivative contracts, net of receipts. See Note 7 to the condensed consolidated financial statements for additional information.
Cash Received Related to Acquisitions of Businesses, Net
On November 23, 2021 (the Acquisition Date), we completed the acquisition of TracFone, a provider of prepaid and value mobile services in the U.S. During the six months ended June 30, 2022, Verizon received net cash proceeds of $248 million for the final
settlement of working capital, which was included in our consideration as of the Acquisition Date. See Note 3 to the condensed consolidated financial statements for additional information.
Cash Flows Used In Financing Activities
We seek to maintain a mix of fixed and variable rate debt to lower borrowing costs within reasonable risk parameters and to protect against earnings and cash flow volatility resulting from changes in market conditions. During the sixthree months ended June 30,
March 31, 2024, net cash used in financing activities was $1.4 billion. During the three months ended March 31, 2023, net cash used in financing activities was $5.6 billion. During the six months ended June 30, 2022, net cash used in financing activities was $3.8$2.4 billion.
During the sixthree months ended June 30, 2023,March 31, 2024, our net cash used in financing activities was primarily driven by cash dividends paid of $5.5 billion, repayments and repurchases of long-term borrowings and finance lease obligations of $2.6$4.5 billion, cash dividends paid of $2.8 billion, and repayments of asset-backed long-term borrowings of $2.4 billion and net repayments of short-term commercial paper of $167 million.1.4 billion. These payments were partially offset by proceeds from long-term borrowings of $3.1 billion, proceeds from asset-backed long-term borrowings of $3.7$2.5 billion and net proceeds from long-term borrowings of $1.5short-term commercial paper of $2.3 billion.
At June 30,March 31, 2024, our total debt of $151.7 billion included unsecured debt of $128.4 billion and secured debt of $23.3 billion. At December 31, 2023, our total debt of $152.7$150.7 billion included unsecured debt of $131.4$128.5 billion and secured debt of $21.3 billion. At December 31, 2022, our total debt of $150.6 billion included unsecured debt of $130.6 billion and secured debt of $20.0$22.2 billion. During the sixthree months ended June 30,March 31, 2024 and 2023, and 2022, our effective interest rate was 4.7%5.0% and 3.4%4.6%, respectively. See Note 5 to the condensed consolidated financial statements for additional information regarding our debt activity, which excludes the impact from mark-to-market adjustments on foreign currency denominated debt.
Verizon may acquire debt securities issued by Verizon and its affiliates through open market purchases, redemptions, privately negotiated transactions, tender offers, exchange offers, or otherwise, upon such terms and at such prices as Verizon may from time to time determine, for cash or other consideration.
Asset-Backed Debt
Cash collections on the receivables and on the underlying receivables related to the participation interest collateralizing our asset-backed debt securities are required at certain specified times to be placed into segregated accounts. Deposits to the segregated accounts are considered restricted cash and are included in Prepaid expenses and other and Other assets in our condensed consolidated balance sheets.
Proceeds from our asset-backed debt transactions are reflected in Cash flows from financing activities in our condensed consolidated statements of cash flows. The asset-backed debt issued is included in Debt maturing within one year and Long-term debt in our condensed consolidated balance sheets.
See Note 5 to the condensed consolidated financial statements for additional information.
Long-Term Credit Facilities
| | At June 30, 2023 |
| | | | | At March 31, 2024 | | | | | | | At March 31, 2024 |
| (dollars in millions) | (dollars in millions) | Maturities | | Facility Capacity | | Unused Capacity | | Principal Amount Outstanding | (dollars in millions) | Maturities | | Facility Capacity | | Unused Capacity | | Principal Amount Outstanding |
Verizon revolving credit facility (1) | Verizon revolving credit facility (1) | 2026 | | $ | 9,500 | | | $ | 9,455 | | | $ | — | |
Various export credit facilities (2) | Various export credit facilities (2) | 2024 - 2031 | | 11,000 | | | 486 | | | 6,720 | |
| Total | Total | | $ | 20,500 | | | $ | 9,941 | | | $ | 6,720 | |
(1) The revolving credit facility does not require us to comply with financial covenants or maintain specified credit ratings, and it permits us to borrow even if our business has incurred a material adverse change. The revolving credit facility provides for the issuance of letters of credit. As of June 30, 2023,March 31, 2024, there have been no drawings against the $9.5 billion revolving credit facility since its inception.
(2) During the sixthree months ended March 31, 2024, there were no drawings from these facilities. During the three months ended June 30,March 31, 2023, and 2022, we drew down $515 million and $2.0 billion, respectively, from these facilities. Borrowings under certain of these facilities are amortizedrepaid semi-annually in equal installments up to the applicable maturity dates. Maturities reflect maturity dates of principal amounts outstanding. Any amounts borrowed under these facilities and subsequently repaid cannot be reborrowed.
In March 2024, we amended our $9.5 billion revolving credit facility to increase the capacity to $12.0 billion and extended its maturity to 2028.
Other, Net
Other, net financing activities during the sixthree months ended June 30, 2023March 31, 2024 includes $151$216 million in payments for settlement of cross currency swaps, $117 million in payments made under the sublease arrangement for our cell towers, a $102 million payment for TracFone contingent considerationtax withholding of employee share based arrangements and $500$98 million in proceeds fromcash consideration payment to acquire additional interest in a short-term revolving credit facility.certain controlled wireless partnership.
Dividends
As in prior periods, dividend payments were a significant use of capital resources. We paid $5.5$2.8 billion and $5.4$2.7 billion in cash dividends during the sixthree months ended June 30,March 31, 2024 and 2023, and 2022, respectively.
Covenants
Our credit agreements contain covenants that are typical for large, investment grade companies. These covenants include requirements to pay interest and principal in a timely fashion, pay taxes, maintain insurance with responsible and reputable insurance companies, preserve our corporate existence, keep appropriate books and records of financial transactions, maintain our properties, provide financial and other reports to our lenders, limit pledging and disposition of assets and mergers and consolidations, and other similar covenants.
We and our consolidated subsidiaries are in compliance with all of our restrictive covenants in our debt agreements.
Change In Cash, Cash Equivalents and Restricted Cash
Our Cash and cash equivalents at June 30, 2023March 31, 2024 totaled $4.8$2.4 billion, a $2.2 billion$300 million increase compared to December 31, 2022,2023, primarily as a result of the factors discussed above.
Restricted cash totaled $1.5 billion and $1.4 billion as of both June 30, 2023March 31, 2024 and December 31, 2022,2023, respectively, primarily related to cash collections on certain receivables and on the underlying receivables related to the participation interest that are required at certain specified times to be placed into segregated accounts.
Free Cash Flow
Free cash flow is a non-GAAP financial measure that reflects an additional way of viewing our liquidity that, we believe, when viewed with our GAAP results, provides management, investors and other users of our financial information with a more complete understanding of factors and trends affecting our cash flows. Free cash flow is calculated by subtracting capital expenditures (including capitalized software) from net cash provided by operating activities. We believe it is a more conservative measure of cash flow since capital expenditures are necessary for ongoing operations. Free cash flow has limitations due to the fact that it does not represent the residual cash flow available for discretionary expenditures. For example, free cash flow does not incorporate payments made on finance lease obligations or cash payments for business acquisitions or wireless licenses. Therefore, we believe it is important to view free cash flow as a complement to our entire condensed consolidated statements of cash flows.
The following table reconciles net cash provided by operating activities to free cash flow:
| | | | Six Months Ended | | | | Three Months Ended | | |
| June 30, | |
| March 31, | |
| (dollars in millions) | |
| (dollars in millions) | |
| (dollars in millions) | (dollars in millions) | 2023 | | 2022 | | Change | 2024 | | 2023 | | Change |
| Net cash provided by operating activities | Net cash provided by operating activities | $ | 18,020 | | | $ | 17,665 | | | $ | 355 | |
| Less Capital expenditures (including capitalized software) | Less Capital expenditures (including capitalized software) | 10,070 | | | 10,491 | | | (421) | |
| Free cash flow | Free cash flow | $ | 7,950 | | | $ | 7,174 | | | $ | 776 | |
The increase in free cash flow during the sixthree months ended June 30, 2023March 31, 2024 compared to the similar period in 20222023 is a reflection of the increasedecrease in capital expenditures, partially offset by the decrease in operating cash flows, as well as the decrease in capital expenditures, both of which are discussed above.
Other Future Obligations
As of June 30, 2023,March 31, 2024, Verizon had 2527 renewable energy purchase agreements (REPAs) with third parties. See Note 12 to the condensed consolidated financial statements for additional information. Under the REPAs, we plan to purchase up to an aggregate of approximately 3.23.6 gigawatts of capacity across multiple states, including Arizona, Illinois, Indiana, Iowa, Maine, Maryland, Nebraska, New York, North Carolina, Ohio, Oklahoma, Pennsylvania, Texas and West Virginia.states.
We are exposed to various types of market risk in the normal course of business, including the impact of interest rate changes, foreign currency exchange rate fluctuations, changes in investment, equity and commodity prices and changes in corporate tax rates. We employ risk management strategies, which may include the use of a variety of derivatives including cross currency swaps, forward starting interest rate swaps, interest rate swaps, interest rate caps, treasury rate locks and foreign exchange forwards. We do not hold derivatives for trading purposes.
It is our general policy to enter into interest rate, foreign currency and other derivative transactions only to the extent necessary to achieve our desired objectives in optimizing exposure to various market risks. Our objectives include maintaining a mix of fixed and variable rate debt to lower borrowing costs within reasonable risk parameters and to protect against earnings and cash flow volatility resulting from changes in market conditions. We do not hedge our market risk exposure in a manner that would completely eliminate the effect of changes in interest rates and foreign exchange rates on our earnings.
Counterparties to our derivative contracts are major financial institutions with whom we have negotiated derivatives agreements (ISDA master agreements) and credit support annex (CSA) agreements which provide rules for collateral exchange. The CSA agreements contain fixed cap amounts or rating based thresholds such that we or our counterparties may be required to hold or
post collateral based upon changes in outstanding positions as compared to established thresholds or caps and changes in credit ratings. We do not offset fair
value amounts recognized for derivative instruments and fair value amounts recognized for the right to reclaim cash collateral or the obligation to return cash collateral arising from derivative instruments recognized at fair value. At June 30, 2023,March 31, 2024, we did not hold any collateral. At June 30, 2023,March 31, 2024, we posted $1.51.8 billion of collateral related to derivative contracts under collateral exchange agreements, which was recorded as Prepaid expenses and other in our condensed consolidated balance sheet. At December 31, 2022,2023, we did not hold any collateral. At December 31, 2022,2023, we posted $2.3$1.4 billion of collateral related to derivative contracts under collateral exchange arrangements, which was recorded as Prepaid expenses and other in our condensed consolidated balance sheet. While we may be exposed to credit losses due to the nonperformance of our counterparties, we consider the risk remote and do not expect that any such nonperformance would result in a significant effect on our results of operations or financial condition due to our diversified pool of counterparties. See Note 7 to the condensed consolidated financial statements for additional information regarding the derivative portfolio.
Interest Rate Risk
We are exposed to changes in interest rates, primarily on our short-term debt and the portion of long-term debt that carries floating interest rates. As of June 30, 2023,March 31, 2024, approximately 74%75% of the aggregate principal amount of our total debt portfolio consisted of fixed-rate indebtedness, including the effect of interest rate swap agreements designated as hedges. The impact of a 100-basis-point change in interest rates affecting our floating rate debt would result in a change in annual interest expense, including our interest rate swap agreements that are designated as hedges, of approximately $424$399 million. The interest rates on our existing long-term debt obligations are unaffected by changes to our credit ratings.
U.S. dollar London Inter-Bank Offered Rate (LIBOR) rates ceased publication on June 30, 2023. Outstanding debt and derivative transactions that were benchmarked to LIBOR have been repaid or transitioned to interest rates that are linked to the Secured Overnight Financing Rate (SOFR) as the benchmark rate on or before June 30, 2023. There was not a significant impact to our financial position given our current mix of variable and fixed-rate debt and taking into account the impact of our interest rate hedging.
Interest Rate Swaps
We enter into interest rate swaps to achieve a targeted mix of fixed and variable rate debt. We principally receive fixed rates and pay variable rates, resulting in a net increase or decrease to Interest expense. These swaps are designated as fair value hedges and hedge against interest rate risk exposure of designated debt issuances. At both June 30, 2023 and DecemberMarch 31, 2022, there was no amount related to the fair value of the asset and2024, the fair value of the liability of these contracts was $4.6$5.1 billion. At December 31, 2023, the fair value of the liability of these contracts was $4.5 billion. At both June 30, 2023March 31, 2024 and December 31, 2022,2023, the total notional amount of the interest rate swaps was $26.1 billion.
Forward Starting Interest Rate Swaps
From time to time we enter into forward starting interest rate swaps designated as cash flow hedges in order to manage our exposure to interest rate changes on future forecasted transactions. At both June 30, 2023 and December 31, 2022, there was no amount related to the fair value of the asset or liability of these contracts. There was no outstanding notional amount for forward starting interest rate swaps at June 30, 2023 or December 31, 2022.
Treasury Rate Locks
From time to time we enter into treasury rate locks to mitigate our future interest rate risk. There was no outstanding notional amount for treasury rate locks at June 30, 2023 or December 31, 2022.
Foreign Currency Risk
The functional currency for our foreign operations is primarily the local currency. The translation of income statement and balance sheet amounts of our foreign operations into U.S. dollars is recorded as cumulative translation adjustments, which are included in Accumulated other comprehensive loss in our condensed consolidated balance sheets. Gains and losses on foreign currency transactions are recorded in the condensed consolidated statements of income. At June 30, 2023,March 31, 2024, our primary translation exposure was to the British Pound Sterling, Euro, Australian Dollar and Swedish Krona.
Cross Currency Swaps
We have entered into cross currency swaps to exchange our British Pound Sterling, Euro, Swiss Franc, Canadian Dollar and Australian Dollar-denominated cash flows into U.S. dollars and to fix our cash payments in U.S. dollars, as well as to mitigate the impact of foreign currency transaction gains or losses. On March 31, 2022, we voluntarily elected to de-designate our cross currency swaps previously designated as cash flow hedges and re-designated the swaps as fair value hedges. Subsequently executed cross currency swaps are also designated as fair value hedges. The fair value of the asset of these contracts was $459$600 million and $305$762 million at June 30, 2023March 31, 2024 and December 31, 2022,2023, respectively. At June 30, 2023March 31, 2024 and December 31, 2022,2023, the fair value of the liability of these contracts was $3.0$2.2 billion and $3.6$2.1 billion, respectively. At June 30, 2023March 31, 2024 and December 31, 2022,2023, the total notional amount of the cross currency swaps was $33.5$32.6 billion and $35.0$33.5 billion, respectively.
Foreign Exchange Forwards
We also have foreign exchange forwards which we use as an economic hedge but for which we have elected not to apply hedge accounting. We enter into British Pound Sterling and Euro foreign exchange forwards to mitigate our foreign exchange rate risk related to non-functional currency denominated monetary assets and liabilities of international subsidiaries.
At both June 30, 2023March 31, 2024 and December 31, 2022,2023, the fair value of the asset and liability of these contracts was insignificant. At June 30, 2023both March 31, 2024 and December 31, 2022,2023, the total notional amount of the foreign exchange forwards was $980 million and $920 million, respectively.$1.1 billion.
| | |
| Acquisitions and Divestitures |
Spectrum License Transactions
From time to time, we enter into agreements to buy, sell or exchange spectrum licenses. We believe these spectrum license transactions have allowed us to continue to enhance the reliability of our wireless network while also resulting in a more efficient use of spectrum.
In February 2021, the Federal Communications Commission (FCC) concluded Auction 107 for C-Band wireless spectrum. In accordance with the rules applicable to the auction, Verizon is required to make payments for our allocable share of clearing costs incurred by, and incentive payments due to, the incumbent license holders associated with the auction, which are estimated to be $7.6 billion. During the sixthree months ended June 30,March 31, 2024 and March 31, 2023, and June 30, 2022, we made payments of $114$269 million and $1.4 billion,$114 million, respectively, for obligations related to clearing costs and accelerated clearing incentives. In June 2023, we incurred costs of approximately $365 million for obligations related to accelerated clearing incentives, which were accrued for as of June 30, 2023. The majority of the remaining obligations related to clearing costs and incentive payments of approximately $4.2 billion, which is inclusive of the $365 million, are expected to be due by the end of the year. We expect to continue to make payments of approximately $4.6 billion$100 million for thesethe remaining obligations throughin 2024. These payments are dependent on the incumbent license holders' accelerated clearing of the spectrum for Verizon’s use and, therefore, theThe final timing and
amounts of these payments could differ based on the actual amount of incumbent holders’ execution of their clearing process. In accordancereimbursement claims and the speed with the FCC order, the clearing must be completed by December 2025.which those claims are approved and processed. The carrying value of the wireless spectrum won in Auction 107 consists of all payments required to participate and purchase licenses in the auction, including Verizon’s allocable share of clearing costs incurred by, and incentive payments due to, the incumbent license holders associated with the auction that we are obligated to pay in order to acquire the licenses. The carrying value also includeslicenses, as well as capitalized interest to the extent qualifying activities have occurred.
See Note 3 to the condensed consolidated financial statements for additional information regarding our spectrum license transactions.
TracFone Wireless, Inc.
In November 2021, we completed the acquisition of TracFone.TracFone Wireless, Inc. (TracFone). Verizon acquired all of TracFone's outstanding stock in exchange for approximately $3.5 billion in cash, net of cash acquired and working capital and other adjustments, 57,596,544 shares of Verizon common stock of the Company valued at approximately $3.0 billion, and up to an additional $650 million in future cash contingent consideration related to the achievement of certain performance measures and other commercial arrangements. The fair value of the Verizon common stock was determined on the basis of its closing market price on the Acquisition Date. The estimated fair value of the contingent consideration as of the Acquisition Date was approximately $560 million and representsrepresented a Level 3 measurement. The contingent consideration payable iswas based on the achievement of certain revenue and operational targets, measured over a two-year earn out period. Contingent consideration payments were completed in January of 2024.
During the sixthree months ended June 30,March 31, 2024 and March 31, 2023, Verizon made a paymentpayments of $52 million and $102 million, respectively, related to the contingent consideration, which is reflected in Cash flows from financing activities in our condensed consolidated statements of cash flows. Contingent consideration payments are expected to continue through 2024. See Note 3 and Note 7 to the condensed consolidated financial statements for additional information.
| | |
Other Factors That May Affect Future Results |
Regulatory and Competitive Trends
There have been no material changes to regulatory and competitive trends as previously disclosed in "Competition and Related Trends" and "Regulatory Trends" in Part I, Item 1. "Business" and "Operating Environment and Trends" in Part II, Item 7. "Management's Discussion and Analysis of Financial Condition and Results of Operations" in our Annual Report on Form 10-K for the year ended December 31, 2022.
| | |
| Cautionary Statement Concerning Forward-Looking Statements |
In this report we have made forward-looking statements. These statements are based on our estimates and assumptions and are subject to risks and uncertainties. Forward-looking statements include the information concerning our possible or assumed future results of operations. Forward-looking statements also include those preceded or followed by the words "anticipates," "assumes," "believes," "estimates," "expects," "forecasts," "hopes," "plans""intends," "plans," "targets" or similar expressions. For those statements, we claim the protection of the safe harbor for forward-looking statements contained in the Private Securities Litigation Reform Act of 1995. We undertake no
obligation to revise or publicly release the results of any revision to these forward-looking statements, except as required by law. Given these risks and uncertainties, readers are cautioned not to place undue reliance on such forward-looking statements.
The following important factors, along with those discussed elsewhere in this report and in other filings with the Securities and Exchange Commission (SEC), could affect future results and could cause those results to differ materially from those expressed in the forward-looking statements:
•the effects of competition in the markets in which we operate, including anythe inability to successfully respond to
competitive factors such as prices, promotional incentives and evolving consumer preferences;
•failure to take advantage of, or respond to competitors' use of, developments in technology and address changes in
consumer demand;
•performance issues or delays in the deployment of our 5G network resulting in significant costs or a reduction in the
anticipated benefits of the enhancement to our networks;
•the inability to implement our business strategy;
•adverse conditions in the U.S. and international economies, including inflation and changing interest rates in the markets in which we operate;
•cyber attacks impacting our networks or systems and any resulting financial or reputational impact;
•damage to our infrastructure or disruption of our operations from natural disasters, extreme weather conditions, acts of war, terrorist attacks or other hostile acts and any resulting financial or reputational impact;
•the impact of public health crises on our operations, our employees and the ways in which our customers use our networks and other products and services;
•disruption of our key suppliers’ or vendors' provisioning of products or services, including as a result of geopolitical factors public health crises or the potential impacts of global climate change;
•material adverse changes in labor matters and any resulting financial or operational impact;
•damage to our reputation or brands;
•the impact of public health crises on our operations, our employees and the ways in which our customers use our networks and other products and services;
•changes in the regulatory environment in which we operate, including any increase in restrictions on our ability to operate our networks or businesses;
•allegations regarding the release of hazardous materials or pollutants into the environment from our, or our predecessors', network assets and any related government investigations, regulatory developments, litigation, penalties and other liability, remediation and compliance costs, penalties, operational impacts or reputational damage;
•our high level of indebtedness;
•significant litigation and any resulting material expenses incurred in defending against lawsuits or paying awards or settlements;
•an adverse change in the ratings afforded our debt securities by nationally accredited ratings organizations or adverse conditions in the credit markets affecting the cost, including interest rates, and/or availability of further financing;
•significant increases in benefit plan costs or lower investment returns on plan assets;
•changes in tax laws or treaties,regulations, or in their interpretation; or challenges to our tax positions, resulting in additional tax expense or liabilities; and
•changes in accounting assumptions that regulatory agencies, including the SEC, may require or that result from changes in the accounting rules or their application, which could result in an impact on earnings.
| | |
| Item 3. Quantitative and Qualitative Disclosures About Market Risk |
Information relating to market risk is included in Item 2, Management’s Discussion and Analysis of Financial Condition and Results of Operations under the caption "Market Risk."
| | |
| Item 4. Controls and Procedures |
Our Chief Executive Officer and Chief Financial Officer have evaluated the effectiveness of the registrant’s disclosure controls and procedures (as defined in Rules 13a-15(e) and 15d-15(e) of the Securities Exchange Act of 1934), as of the end of the period covered by this quarterly report, that ensure that information relating to the registrant which is required to be disclosed in this report is recorded, processed, summarized and reported within required time periods using the criteria for effective internal control established in Internal Control–Integrated Framework issued by the Committee of Sponsoring Organizations of the Treadway Commission in 2013. Based on this evaluation, our Chief Executive Officer and Chief Financial Officer have concluded that the registrant’s disclosure controls and procedures were effective as of June 30, 2023.March 31, 2024.
In the ordinary course of business, we routinely review our system of internal control over financial reporting and make changes to our systems and processes that are intended to ensure an effective internal control environment. In the third quarter of 2020, we began a multi-year implementation of a new global enterprise resource planning (ERP) system, which will replace many of our existing core financial systems. The ERP system is designed to enhance the flow of financial information, facilitate data analysis and accelerate information reporting. The implementation is expected to occur in phases over the next several years.
As the phased implementation of the new ERP system continues, we could have changes to our processes and procedures which, in turn, could result in changes to our internal controls over financial reporting. As such changes occur, we will evaluate quarterly whether such changes materially affect our internal control over financial reporting.
There were no changes in the Company’s internal control over financial reporting during the secondfirst quarter 20232024 that have materially affected, or are reasonably likely to materially affect, our internal control over financial reporting.
| | |
| Part II – Other Information |
| | |
| Item 1. Legal Proceedings |
In the ordinary course of business, Verizon is involved in various litigation and regulatory proceedings at the state and federal level. As of the date of this report, we do not believe that any pending legal proceedings to which we or our subsidiaries are subject are required to be disclosed as material legal proceedings pursuant to this item. Verizon is not subject to any administrative or judicial proceeding arising under any federal, state or local provisions that have been enacted or adopted
regulating the discharge of materials into the environment or primarily for the purpose of protecting the environment that is likely to result in monetary sanctions of $1 million or more.
See Note 12 to the condensed consolidated financial statements for additional information regarding legal proceedings.
There have been no material changes to our risk factors as previously disclosed in Part I, Item 1A.1A included in our Annual Report on Form 10-K for the year ended December 31, 2022.2023.
| | |
| Item 2. Unregistered Sales of Equity Securities and Use of Proceeds |
In February 2020, the Board of Directors of the Company authorized a share buyback program to repurchase up to 100 million shares of the Company's common stock. The program will terminate when the aggregate number of shares purchased reaches 100 million or a new share repurchase plan superseding the current plan is authorized, whichever is sooner. Under the program, shares may be repurchased in privately negotiated transactions, on the open market, or otherwise, including through plans complying with Rule 10b5-1 under the Exchange Act. The timing and number of shares purchased under the program, if any, will depend on market conditions and our capital allocation priorities.
Verizon did not repurchase any shares of the Company's common stock during the three months ended June 30, 2023.March 31, 2024. At June 30, 2023,March 31, 2024, the maximum number of shares that could be purchased by or on behalf of Verizon under our share buyback program was 100 million.
| | |
| Item 5. Other Information |
During the three months ended March 31, 2024, none of our directors or officers (as defined in Rule 16a-1(f) under the Exchange Act) adopted or terminated a "Rule 10b5-1 trading arrangement" or "non-Rule 10b5-1 trading arrangement," as each term is defined in Item 408 of Regulation S-K.
| | | | | | | | | | |
Exhibit
Number | | Description | | |
| | | | |
| | | | |
| | Form of 2024 Performance Stock Unit Agreement pursuant to the 2017 Verizon Communications Inc. Long-Term Incentive Plan. | | |
| | | | |
| | Form of 2024 Restricted Stock Unit Agreement pursuant to the 2017 Verizon Communications Inc. Long-Term Incentive Plan. | | |
| | | | |
| | Certification of Chief Executive Officer pursuant to Section 302 of the Sarbanes-Oxley Act of 2002.2002, filed herewith. | | |
| | | | |
| | Certification of Chief Financial Officer pursuant to Section 302 of the Sarbanes-Oxley Act of 2002.2002, filed herewith. | | |
| | | |
| | Certification of Chief Executive Officer pursuant to Section 906 of the Sarbanes-Oxley Act of 2002.2002, filed herewith. | | |
| | | |
| | Certification of Chief Financial Officer pursuant to Section 906 of the Sarbanes-Oxley Act of 2002.2002, filed herewith. | | |
| | | |
| 101.INS | | XBRL Instance Document - the instance document does not appear in the interactive data file because its XBRL
tags are embedded within the inline XBRL document. | | |
| | | |
| 101.SCH | | XBRL Taxonomy Extension Schema Document. | | |
| | | |
| 101.PRE | | XBRL Taxonomy Presentation Linkbase Document. | | |
| | | |
| 101.CAL | | XBRL Taxonomy Calculation Linkbase Document. | | |
| | | |
| 101.LAB | | XBRL Taxonomy Label Linkbase Document. | | |
| | | |
| 101.DEF | | XBRL Taxonomy Extension Definition Linkbase Document. | | |
| | | |
| 104 | | Cover Page Interactive Data File (formatted as inline XBRL with applicable taxonomy extension information
contained in Exhibits 101). | | |
Pursuant to Regulation S-K, Item 601(b)(4)(iii)(A), certain instruments which define the rights of holders of long-term debt of Verizon Communications Inc. and its consolidated subsidiaries are not filed herewith, and Verizonthe Company hereby agrees to furnish a copy of any such instrument to the SEC upon request.
Pursuant to the requirements of the Securities Exchange Act of 1934, the registrant has duly caused this report to be signed on its behalf by the undersigned thereunto duly authorized.
| | | | | | | | | | | | | | |
| | VERIZON COMMUNICATIONS INC. |
| | |
Date: July 28, 2023April 25, 2024 | | By | /s/ | Mary-Lee Stillwell |
| | | | Mary-Lee Stillwell |
| | | | Senior Vice President and Controller |
| | | | (Principal Accounting Officer) |