
SECURITIES AND EXCHANGE COMMISSION
WASHINGTON, D.C. 20549
FORM 10-Q
For the quarterly period ended:
September 30,
For the transition period from to
Commission File Number:
001-13349
BAR HARBOR BANKSHARES
(Exact name of registrant as specified in its charter)
| | |
Maine | | 01-0393663 |
(State or other jurisdiction of incorporation or organization) | | (I.R.S. Employer Identification No.) |
| | |
PO Box 400 | | |
82 Main Street, Bar Harbor, ME | | 04609-0400 |
(Address of principal executive offices) | | (Zip Code) |
Registrant’s telephone number, including area code:
Securities registered pursuant to Section 12(b) of the Act:
Title of each class | | Trading Symbol | | Name of each exchange on which registered |
Common Stock, par value $2.00 per share | | BHB | | NYSE American |
Indicate by check mark whether the registrant (1) has filed all reports required to be filed by Section 13 or 15(d) of the Securities Exchange Act of 1934 during the preceding 12 months (or for such shorter period that the registrant was required to file such reports), and (2) has been subject to such filing requirements for the past 90 days. Yes
Indicate by check mark whether the registrant has submitted electronically every Interactive Data File required to be submitted pursuant to Rule 405 of Regulation S-T (§232.405 of this chapter) during the preceding 12 months (or for such shorter period that the registrant was required to submit such files). Yes
Indicate by check mark whether the registrant is a large accelerated filer, an accelerated filer, a non-accelerated filer, a smaller reporting company or an emerging growth company. See the definition of "large accelerated filer," "accelerated filer", "smaller reporting company", or "emerging growth company" in Rule 12b-2 of the Exchange Act.
Large Accelerated Filer
If an emerging growth company, indicate by check mark if the registrant has elected not to use the extended transition period for complying with any new or revised financial accounting standards provided pursuant to Section 13(a) of the Exchange Act.
Indicate by check mark whether the registrant is a shell company (as defined in Rule 12b-2 of the Exchange Act) Yes
The Registrant had 15,552,29714,928,565 shares of common stock, par value $2.00 per share, outstanding as of October 31, 2019.30, 2020.
BAR HARBOR BANKSHARES AND SUBSIDIARIES
FORM 10-Q
| | Page | ||||
| ||||||
| | | ||||
| ||||||
| | | ||||
| ||||||
| | | ||||
| 6 | |||||
| | | ||||
| 7 | |||||
| | | ||||
| 8 | |||||
| | | ||||
| 9 | |||||
| | | ||||
| | |||||
| | 11 | ||||
| | 15 | ||||
| | 18 | ||||
| | 36 | ||||
| | 42 | ||||
| | 44 | ||||
| | 45 | ||||
| | 49 | ||||
| | 50 | ||||
| | 56 | ||||
| | 62 | ||||
| | 64 | ||||
| | | | | ||
| | | | | ||
66 | ||||||
| | 67 | ||||
| | 68 | ||||
| | 69 | ||||
| | 71 | ||||
| | 72 | ||||
| | 74 | ||||
| | | ||||
80 | ||||||
| | | ||||
Bar Harbor Bankshares conducts business operations principally through Bar Harbor Bank & Trust, which may be referred to as the Bank“the Bank” and which is a subsidiary of Bar Harbor Bankshares. Unless the context requires otherwise, references in this report to “the Company” "our company, "our," "us," "we" and similar terms refer to Bar Harbor Bankshares and its subsidiaries, including the Bank, collectively.
FORWARD-LOOKING STATEMENTS
Certain statements contained in this document that are not historical facts may constitute forward-looking statements within the meaning of Section 27A of the Securities Act of 1933, as amended ("Securities Act"), and Section 21E of the Securities Exchange Act of 1934, as amended ("Exchange Act"), and are intended to be covered by the safe harbor provisions of the Private Securities Litigation Reform Act of 1995. When used in this Form 10-Q the words "may," "will," "should," "could," "would," "plan," "potential," "estimate," "project," "believe," "intend," "anticipate," "expect," "target" and similar expressions are intended to identify forward-looking statements, but these terms are not the exclusive means of identifying forward-looking statements. These forward-looking statements are subject to significant risks, assumptions and uncertainties, including among other things, changes in general economic and business conditions, increased competitive pressures, changes in the interest rate environment, legislative and regulatory change, changes in the financial markets, and other risks and uncertainties disclosed from time to time in documents that the Company files with the Securities and Exchange Commission, including but not limited to those discussed in the section titled "Risk Factors" in the Company's Annual Report on Form 10-K for the fiscal year ended December 31, 2018.2019 and Part II, Item 1A. of the Company’s Quarterly Report on Form 10-Q for the quarter ended March 31, 2020. Because of these and other uncertainties, the Company’s actual results, performance or achievements, or industry results, may be materially different from the results indicated by these forward-looking statements. In addition, the Company’s past results of operations do not necessarily indicate future results. You should not place undue reliance on any of the forward-looking statements, which speak only as of the dates on which they were made. The Company is not undertaking an obligation to update forward-looking statements, even though its situation may change in the future, except as required under federal securities law. The Company qualifies all of its forward-looking statements by these cautionary statements.
3
ITEM 1. CONSOLIDATED FINANCIAL STATEMENTS (UNAUDITED)
BAR HARBOR BANKSHARES AND SUBSIDIARIES
CONSOLIDATED BALANCE SHEETS
| | | | | | |
(in thousands, except share data) |
| September 30, 2020 |
| December 31, 2019 | ||
Assets |
| |
|
| |
|
Cash and cash equivalents: | | | | | | |
Cash and due from banks | | $ | 53,173 | | $ | 37,261 |
Interest-bearing deposits with the Federal Reserve Bank | |
| 162,484 | |
| 19,649 |
Total cash and cash equivalents | |
| 215,657 | |
| 56,910 |
| | | | | | |
Securities: | | | | | | |
Securities available for sale, at fair value | |
| 604,529 | |
| 663,230 |
Federal Home Loan Bank stock | |
| 13,975 | |
| 20,679 |
Total securities | |
| 618,504 | |
| 683,909 |
| | | | | | |
Loans: | |
|
| |
|
|
Commercial real estate | |
| 1,045,635 | |
| 930,661 |
Commercial and industrial | |
| 522,510 | |
| 423,291 |
Residential real estate | |
| 1,021,206 | |
| 1,151,857 |
Consumer | |
| 119,340 | |
| 135,283 |
Total loans | |
| 2,708,691 | |
| 2,641,092 |
Less: Allowance for loan losses | |
| (17,907) | |
| (15,353) |
Net loans | |
| 2,690,784 | |
| 2,625,739 |
| | | | | | |
Premises and equipment, net | |
| 51,424 | |
| 51,205 |
Other real estate owned | |
| 1,983 | |
| 2,236 |
Goodwill | |
| 119,477 | |
| 118,649 |
Other intangible assets | |
| 7,913 | |
| 8,641 |
Cash surrender value of bank-owned life insurance | |
| 77,388 | |
| 75,863 |
Deferred tax assets, net | |
| 2,180 | |
| 3,865 |
Other assets | |
| 74,400 | |
| 42,111 |
Total assets | | $ | 3,859,710 | | $ | 3,669,128 |
| | | | | | |
Liabilities | |
|
| |
|
|
Deposits: | |
|
| |
|
|
Demand | | $ | 515,064 | | $ | 414,534 |
NOW | |
| 706,048 | |
| 575,809 |
Savings | |
| 511,938 | |
| 388,683 |
Money market | |
| 388,356 | |
| 384,090 |
Time | |
| 813,509 | |
| 932,635 |
Total deposits | |
| 2,934,915 | |
| 2,695,751 |
| | | | | | |
Borrowings: | |
|
| |
|
|
Senior | |
| 385,472 | |
| 471,396 |
Subordinated | |
| 59,920 | |
| 59,920 |
Total borrowings | |
| 445,392 | |
| 531,316 |
| | | | | | |
Other liabilities | |
| 74,958 | |
| 45,654 |
Total liabilities | |
| 3,455,265 | |
| 3,272,721 |
(continued)
4
| (in thousands, except share data) | September 30, 2019 | December 31, 2018 | |||||||
| Assets | |||||||||
| Cash and due from banks | $ | 50,032 | $ | 35,208 | |||||
| Interest-bearing deposit with the Federal Reserve Bank | 21,561 | 63,546 | |||||||
| Total cash and cash equivalents | 71,593 | 98,754 | |||||||
| Securities available for sale, at fair value | 675,675 | 725,837 | |||||||
| Federal Home Loan Bank stock | 27,469 | 35,659 | |||||||
| Total securities | 703,144 | 761,496 | |||||||
| Loans: | |||||||||
| Commercial real estate | 923,773 | 826,699 | |||||||
| Commercial and industrial | 402,706 | 404,870 | |||||||
| Residential real estate | 1,143,452 | 1,144,698 | |||||||
| Consumer | 107,375 | 113,960 | |||||||
| Total loans | 2,577,306 | 2,490,227 | |||||||
| Less: Allowance for loan losses | (15,353 | ) | (13,866 | ) | |||||
| Net loans | 2,561,953 | 2,476,361 | |||||||
| Premises and equipment, net | 47,644 | 48,804 | |||||||
| Other real estate owned | 2,455 | 2,351 | |||||||
| Goodwill | 100,085 | 100,085 | |||||||
| Other intangible assets | 6,879 | 7,459 | |||||||
| Cash surrender value of bank-owned life insurance | 75,368 | 73,810 | |||||||
| Deferred tax assets, net | 4,988 | 9,514 | |||||||
| Other assets | 38,365 | 29,853 | |||||||
| Total assets | $ | 3,612,474 | $ | 3,608,487 | |||||
| Liabilities | |||||||||
| Deposits: | |||||||||
| Demand | $ | 380,707 | $ | 370,889 | |||||
| NOW | 490,315 | 484,717 | |||||||
| Savings | 360,570 | 358,888 | |||||||
| Money market | 359,328 | 335,951 | |||||||
| Time | 902,665 | 932,793 | |||||||
| Total deposits | 2,493,585 | 2,483,238 | |||||||
| Borrowings: | |||||||||
| Senior | 641,819 | 680,823 | |||||||
| Subordinated | 42,928 | 42,973 | |||||||
| Total borrowings | 684,747 | 723,796 | |||||||
| Other liabilities | 39,683 | 30,874 | |||||||
| Total liabilities | 3,218,015 | 3,237,908 | |||||||
| (continued) | |||||||||
| Shareholders’ equity | |||||||||
| Capital stock, par value $2.00; authorized 20,000,000 shares; issued 16,428,388 and 16,428,388 shares at September 30, 2019 and December 31, 2018, respectively | 32,857 | 32,857 | |||||||
| Additional paid-in capital | 188,283 | 187,653 | |||||||
| Retained earnings | 174,994 | 166,526 | |||||||
| Accumulated other comprehensive income (loss) | 3,045 | (11,802 | ) | ||||||
| Less: 879,785 and 905,201 shares of treasury stock at September 30, 2019 and December 31, 2018, respectively | (4,720 | ) | (4,655 | ) | |||||
| Total shareholders’ equity | 394,459 | 370,579 | |||||||
| Total liabilities and shareholders’ equity | $ | 3,612,474 | $ | 3,608,487 | |||||
BAR HARBOR BANKSHARES AND SUBSIDIARIES
CONSOLIDATED BALANCE SHEETS (continued)
| | | | | | |
(in thousands, except share data) |
| September 30, 2020 |
| December 31, 2019 | ||
Shareholders’ equity |
| | |
| | |
Capital stock, par value $2.00; authorized 20,000,000 shares; issued 16,428,388 shares at September 30, 2020 and December 31, 2019 |
| | 32,857 |
| | 32,857 |
Additional paid-in capital |
| | 189,606 |
| | 188,536 |
Retained earnings |
| | 190,249 |
| | 175,780 |
Accumulated other comprehensive income |
| | 9,405 |
| | 3,911 |
Less: 1,499,823 and 870,257 shares of treasury stock at September 30, 2020 and December 31, 2019, respectively |
| | (17,672) |
| | (4,677) |
Total shareholders’ equity |
| | 404,445 |
| | 396,407 |
Total liabilities and shareholders’ equity | | $ | 3,859,710 | | $ | 3,669,128 |
The accompanying notes are an integral part of these consolidated financial statements.
5
BAR HARBOR BANKSHARES AND SUBSIDIARIES
| Three Months Ended September 30, | Nine Months Ended September 30, | |||||||||||||||
| (in thousands, except per share data) | 2019 | 2018 | 2019 | 2018 | ||||||||||||
| Interest and dividend income | ||||||||||||||||
| Loans | $ | 28,157 | $ | 26,212 | $ | 82,681 | $ | 77,272 | ||||||||
| Securities and other | 6,105 | 5,972 | 18,593 | 17,407 | ||||||||||||
| Total interest and dividend income | 34,262 | 32,184 | 101,274 | 94,679 | ||||||||||||
| Interest expense | ||||||||||||||||
| Deposits | 7,143 | 5,478 | 20,336 | 13,868 | ||||||||||||
| Borrowings | 4,674 | 4,237 | 15,232 | 12,192 | ||||||||||||
| Total interest expense | 11,817 | 9,715 | 35,568 | 26,060 | ||||||||||||
| Net interest income | 22,445 | 22,469 | 65,706 | 68,619 | ||||||||||||
| Provision for loan losses | 893 | 643 | 1,779 | 2,208 | ||||||||||||
| Net interest income after provision for loan losses | 21,552 | 21,826 | 63,927 | 66,411 | ||||||||||||
| Non-interest income | ||||||||||||||||
| Trust and investment management fee income | 3,013 | 2,952 | 8,836 | 9,036 | ||||||||||||
| Customer service fees | 2,553 | 2,490 | 7,336 | 7,061 | ||||||||||||
| Gain on sales of securities, net | 157 | — | 157 | — | ||||||||||||
| Bank-owned life insurance income | 497 | 505 | 1,558 | 1,328 | ||||||||||||
| Customer derivative income | 828 | — | 1,553 | 545 | ||||||||||||
| Other income | 595 | 1,179 | 1,823 | 2,515 | ||||||||||||
| Total non-interest income | 7,643 | 7,126 | 21,263 | 20,485 | ||||||||||||
| Non-interest expense | ||||||||||||||||
| Salaries and employee benefits | 11,364 | 10,331 | 33,568 | 31,695 | ||||||||||||
| Occupancy and equipment | 3,415 | 3,366 | 10,101 | 9,364 | ||||||||||||
| Loss on premises and equipment, net | — | — | 21 | — | ||||||||||||
| Outside services | 424 | 456 | 1,278 | 1,597 | ||||||||||||
| Professional services | 707 | 223 | 1,821 | 1,016 | ||||||||||||
| Communication | 189 | 217 | 707 | 701 | ||||||||||||
| Marketing | 613 | 293 | 1,419 | 1,207 | ||||||||||||
| Amortization of intangible assets | 207 | 207 | 621 | 621 | ||||||||||||
| Acquisition, restructuring and other expenses | 3,039 | 70 | 3,319 | 619 | ||||||||||||
| Other expenses | 3,442 | 2,743 | 10,075 | 8,623 | ||||||||||||
| Total non-interest expense | 23,400 | 17,906 | 62,930 | 55,443 | ||||||||||||
| Income before income taxes | 5,795 | 11,046 | 22,260 | 31,453 | ||||||||||||
| Income tax expense | 780 | 2,076 | 3,847 | 6,136 | ||||||||||||
| Net income | $ | 5,015 | $ | 8,970 | $ | 18,413 | $ | 25,317 | ||||||||
| Earnings per share: | ||||||||||||||||
| Basic | $ | 0.32 | $ | 0.58 | $ | 1.19 | $ | 1.64 | ||||||||
| Diluted | $ | 0.32 | $ | 0.58 | $ | 1.18 | $ | 1.63 | ||||||||
| Weighted average common shares outstanding: | ||||||||||||||||
| Basic | 15,547 | 15,503 | 15,536 | 15,478 | ||||||||||||
| Diluted | 15,581 | 15,580 | 15,582 | 15,564 | ||||||||||||
| | | | | | | | | | | | |
| | Three Months Ended | | Nine Months Ended | ||||||||
| | September 30, | | September 30, | ||||||||
(in thousands, except earnings per share data) |
| 2020 |
| 2019 |
| 2020 |
| 2019 | ||||
Interest and dividend income | | | | | | | | | | | | |
Loans | | $ | 25,918 | | $ | 28,157 | | $ | 80,398 | | $ | 82,681 |
Securities and other | |
| 4,557 | |
| 6,105 | |
| 15,006 | |
| 18,593 |
Total interest and dividend income | |
| 30,475 | |
| 34,262 | |
| 95,404 | |
| 101,274 |
Interest expense | |
|
| |
|
| |
|
| |
|
|
Deposits | |
| 3,869 | |
| 7,143 | |
| 14,437 | |
| 20,336 |
Borrowings | |
| 1,941 | |
| 4,674 | |
| 7,149 | |
| 15,232 |
Total interest expense | |
| 5,810 | |
| 11,817 | |
| 21,586 | |
| 35,568 |
Net interest income | |
| 24,665 | |
| 22,445 | |
| 73,818 | |
| 65,706 |
Provision for loan losses | |
| 1,800 | |
| 893 | |
| 4,265 | |
| 1,779 |
Net interest income after provision for loan losses | |
| 22,865 | |
| 21,552 | |
| 69,553 | |
| 63,927 |
| | | | | | | | | | | | |
Non-interest income | |
|
| |
|
| |
|
| |
|
|
Trust and investment management fee income | |
| 3,532 | |
| 3,013 | |
| 10,060 | |
| 8,836 |
Customer service fees | |
| 2,886 | |
| 2,553 | |
| 8,437 | |
| 7,336 |
Gain on sales of securities, net | |
| — | |
| 157 | |
| 1,486 | |
| 157 |
Mortgage banking income | | | 2,649 | | | 452 | | | 4,230 | | | 1,094 |
Bank-owned life insurance income | |
| 492 | |
| 497 | |
| 1,525 | |
| 1,558 |
Customer derivative income | |
| 316 | |
| 828 | |
| 1,417 | |
| 1,553 |
Other income | |
| 227 | |
| 143 | |
| 1,078 | |
| 729 |
Total non-interest income | |
| 10,102 | |
| 7,643 | |
| 28,233 | |
| 21,263 |
| | | | | | | | | | | | |
Non-interest expense | |
|
| |
|
| |
|
| |
|
|
Salaries and employee benefits | |
| 11,809 | |
| 11,364 | |
| 35,602 | |
| 33,568 |
Occupancy and equipment | |
| 4,279 | |
| 3,415 | |
| 12,559 | |
| 10,101 |
Loss on premises and equipment, net | |
| — | |
| — | |
| 90 | |
| 21 |
Outside services | |
| 438 | |
| 424 | |
| 1,414 | |
| 1,278 |
Professional services | |
| 479 | |
| 707 | |
| 1,488 | |
| 1,821 |
Communication | |
| 215 | |
| 189 | |
| 698 | |
| 707 |
Marketing | |
| 300 | |
| 613 | |
| 970 | |
| 1,419 |
Amortization of intangible assets | |
| 256 | |
| 207 | |
| 768 | |
| 621 |
Loss on debt extinguishment | | | — | | | — | | | 1,351 | | | 0 |
Acquisition, conversion and other expenses | |
| 691 | |
| 3,039 | |
| 952 | |
| 3,319 |
Other expenses | |
| 3,952 | |
| 3,442 | |
| 11,152 | |
| 10,075 |
Total non-interest expense | |
| 22,419 | |
| 23,400 | |
| 67,044 | |
| 62,930 |
| | | | | | | | | | | | |
Income before income taxes | |
| 10,548 | |
| 5,795 | |
| 30,742 | |
| 22,260 |
Income tax expense | |
| 2,146 | |
| 780 | |
| 6,138 | |
| 3,847 |
Net income | | $ | 8,402 | | $ | 5,015 | | $ | 24,604 | | $ | 18,413 |
| | | | | | | | | | | | |
Earnings per share: | |
|
| |
|
| |
|
| |
|
|
Basic | | $ | 0.56 | | $ | 0.32 | | $ | 1.60 | | $ | 1.19 |
Diluted | | $ | 0.56 | | $ | 0.32 | | $ | 1.60 | | $ | 1.18 |
| | | | | | | | | | | | |
Weighted average common shares outstanding: | |
|
| |
|
| |
|
| |
|
|
Basic | |
| 15,079 | |
| 15,547 | |
| 15,359 | |
| 15,536 |
Diluted | |
| 15,103 | |
| 15,581 | |
| 15,382 | |
| 15,582 |
The accompanying notes are an integral part of these consolidated financial statements.
6
BAR HARBOR BANKSHARES AND SUBSIDIARIES
| Three Months Ended September 30, | Nine Months Ended September 30, | |||||||||||||||
| (in thousands) | 2019 | 2018 | 2019 | 2018 | ||||||||||||
| Net income | $ | 5,015 | $ | 8,970 | $ | 18,413 | $ | 25,317 | ||||||||
| Other comprehensive income, before tax: | ||||||||||||||||
| Changes in unrealized gain (loss) on securities available-for-sale | 3,200 | (5,850 | ) | 21,746 | (19,639 | ) | ||||||||||
| Changes in unrealized (loss) gain on cash flow hedging derivatives | (370 | ) | 299 | (2,372 | ) | 1,179 | ||||||||||
| Changes in unrealized gain on pension | — | — | — | 41 | ||||||||||||
| Income taxes related to other comprehensive income: | ||||||||||||||||
| Changes in unrealized (gain) loss on securities available-for-sale | (747 | ) | 1,291 | (5,081 | ) | 4,565 | ||||||||||
| Changes in unrealized loss (gain) on cash flow hedging derivatives | 85 | (81 | ) | 554 | (290 | ) | ||||||||||
| Changes in unrealized loss on pension | — | — | — | (10 | ) | |||||||||||
| Total other comprehensive income (loss) | 2,168 | (4,341 | ) | 14,847 | (14,154 | ) | ||||||||||
| Total comprehensive income | $ | 7,183 | $ | 4,629 | $ | 33,260 | $ | 11,163 | ||||||||
| | | | | | | | | | | | |
|
| Three Months Ended |
| Nine Months Ended | ||||||||
| | September 30, | | September 30, | ||||||||
(in thousands) |
| 2020 |
| 2019 |
| 2020 |
| 2019 | ||||
Net income | | $ | 8,402 | | $ | 5,015 | | $ | 24,604 | | $ | 18,413 |
Other comprehensive income, before tax: | |
|
| |
|
| |
|
| |
|
|
Changes in unrealized gain on securities available for sale | |
| 351 | |
| 3,200 | |
| 7,922 | |
| 21,746 |
Changes in unrealized gain (loss) on hedging derivatives | |
| 805 | |
| (370) | |
| (833) | |
| (2,372) |
Changes in unrealized loss on pension | |
| 0 | |
| 0 | |
| 0 | |
| 0 |
| | | | | | | | | | | | |
Income taxes related to other comprehensive income: | |
|
| |
|
| |
|
| |
|
|
Changes in unrealized gain on securities available for sale | |
| (82) | |
| (747) | |
| (1,791) | |
| (5,081) |
Changes in unrealized (gain) loss on hedging derivatives | |
| (190) | |
| 85 | |
| 196 | |
| 554 |
Changes in unrealized loss on pension | |
| 0 | |
| 0 | |
| 0 | |
| 0 |
Total other comprehensive income | |
| 884 | |
| 2,168 | |
| 5,494 | |
| 14,847 |
Total comprehensive income | | $ | 9,286 | | $ | 7,183 | | $ | 30,098 | | $ | 33,260 |
The accompanying notes are an integral part of these consolidated financial statements.
7
BAR HARBOR BANKSHARES AND SUBSIDIARIES
| (in thousands, except per share data) | Common stock amount | Additional paid-in capital | Retained earnings | Accumulated other comprehensive income (loss) | Treasury stock | Total | ||||||||||||||||||
| Balance at December 31, 2017 | $ | 32,857 | $ | 186,702 | $ | 144,977 | $ | (4,554 | ) | $ | (5,341 | ) | $ | 354,641 | ||||||||||
| Net income | — | — | 16,347 | — | — | 16,347 | ||||||||||||||||||
| Other comprehensive loss | — | — | — | (9,813 | ) | — | (9,813 | ) | ||||||||||||||||
| Cash dividends declared ($0.39 per share) | — | — | (5,981 | ) | — | — | (5,981 | ) | ||||||||||||||||
| Treasury stock purchased (9,294 shares) | — | — | — | — | (278 | ) | (278 | ) | ||||||||||||||||
| Net issuance (62,782 shares) to employee stock plans, including related tax effects | — | (131 | ) | — | — | 735 | 604 | |||||||||||||||||
| Modified retrospective basis adoption of Revenue Recognition Accounting Codification Standard 606 | — | — | (184 | ) | — | — | (184 | ) | ||||||||||||||||
| Reclassification of the income tax effects of the Tax Cuts and Jobs Act from accumulated other comprehensive income for adoption of ASU 2018-02 | — | — | 980 | (980 | ) | — | — | |||||||||||||||||
| Recognition of stock based compensation | — | 627 | — | — | — | 627 | ||||||||||||||||||
| Balance at June 30, 2018 | 32,857 | 187,198 | 156,139 | (15,347 | ) | (4,884 | ) | 355,963 | ||||||||||||||||
| Net income | — | — | 8,970 | — | — | 8,970 | ||||||||||||||||||
| Other comprehensive loss | — | — | — | (4,341 | ) | — | (4,341 | ) | ||||||||||||||||
| Cash dividends declared ($0.20 per share) | — | — | (3,101 | ) | — | — | (3,101 | ) | ||||||||||||||||
| Treasury stock purchased (1,605 shares) | — | — | — | — | (46 | ) | (46 | ) | ||||||||||||||||
| Net issuance (11,869 shares) to employee stock plans, including related tax effects | — | (123 | ) | — | — | 154 | 31 | |||||||||||||||||
| Recognition of stock based compensation | — | 209 | — | — | — | 209 | ||||||||||||||||||
| Balance at September 30, 2018 | $ | 32,857 | $ | 187,284 | $ | 162,008 | $ | (19,688 | ) | $ | (4,776 | ) | $ | 357,685 | ||||||||||
| Balance at December 31, 2018 | $ | 32,857 | $ | 187,653 | $ | 166,526 | $ | (11,802 | ) | $ | (4,655 | ) | $ | 370,579 | ||||||||||
| Net income | — | — | 13,398 | — | — | 13,398 | ||||||||||||||||||
| Other comprehensive income | — | — | — | 12,679 | — | 12,679 | ||||||||||||||||||
| Cash dividends declared ($0.42 per share) | — | — | (6,524 | ) | — | — | (6,524 | ) | ||||||||||||||||
| Treasury stock purchased (8,010 shares) | — | — | — | — | (210 | ) | (210 | ) | ||||||||||||||||
| Net issuance (21,119 shares) to employee stock plans, including related tax effects | — | (69 | ) | — | — | 149 | 80 | |||||||||||||||||
| Recognition of stock based compensation | — | 560 | — | — | — | 560 | ||||||||||||||||||
| Balance at June 30, 2019 | 32,857 | 188,144 | 173,400 | 877 | (4,716 | ) | 390,562 | |||||||||||||||||
| Net income | — | — | 5,015 | — | — | 5,015 | ||||||||||||||||||
| Other comprehensive income | — | — | — | 2,168 | — | 2,168 | ||||||||||||||||||
| Cash dividends declared ($0.22 per share) | — | — | (3,421 | ) | — | — | (3,421 | ) | ||||||||||||||||
| Treasury stock purchased (5,482 shares) | — | — | — | — | (136 | ) | (136 | ) | ||||||||||||||||
| Net issuance (4,297 shares) to employee stock plans, including related tax effects | — | (17 | ) | — | — | 132 | 115 | |||||||||||||||||
| Recognition of stock based compensation | — | 156 | — | — | — | 156 | ||||||||||||||||||
| Balance at September 30, 2019 | $ | 32,857 | $ | 188,283 | $ | 174,994 | $ | 3,045 | $ | (4,720 | ) | $ | 394,459 | |||||||||||
| | | | | | | | | | | | | | | | | | |
|
| |
| | | |
| | | | Accumulated |
| | |
| | | |
| | Common | | Additional | | | | | other | | | | | | | |||
| | stock | | paid-in | | Retained | | comprehensive | | Treasury | | | | |||||
(in thousands, except per share data) |
| amount |
| capital |
| earnings |
| income (loss) |
| stock |
| Total | ||||||
Balance at December 31, 2018 |
| $ | 32,857 | | $ | 187,653 | | $ | 166,526 | | $ | (11,802) | | $ | (4,655) | | $ | 370,579 |
| |
| | | | | | | | | | | | | | | | |
Net income | |
| 0 | |
| 0 | |
| 13,398 | |
| 0 | |
| 0 | |
| 13,398 |
Other comprehensive income | |
| 0 | |
| 0 | |
| 0 | |
| 12,679 | |
| 0 | |
| 12,679 |
Cash dividends declared ($0.42 per share) | |
| 0 | |
| 0 | |
| (6,524) | |
| 0 | |
| 0 | |
| (6,524) |
Common stock purchased (8,010 shares) | |
| 0 | |
| 0 | |
| 0 | |
| 0 | |
| (210) | |
| (210) |
Net issuance (21,119 shares) to employee stock plans, including related tax effects | |
| 0 | |
| (69) | |
| 0 | |
| 0 | |
| 149 | |
| 80 |
Recognition of stock based compensation | |
| 0 | |
| 560 | |
| 0 | |
| 0 | |
| 0 | |
| 560 |
Balance at June 30, 2019 | |
| 32,857 | |
| 188,144 | |
| 173,400 | |
| 877 | |
| (4,716) | |
| 390,562 |
| | | | | | | | | | | | | | | | | | |
Net income | |
| 0 | |
| 0 | |
| 5,015 | |
| 0 | |
| 0 | |
| 5,015 |
Other comprehensive income | |
| 0 | |
| 0 | |
| 0 | |
| 2,168 | |
| 0 | |
| 2,168 |
Cash dividends declared ($0.22 per share) | |
| 0 | |
| 0 | |
| (3,421) | |
| 0 | |
| 0 | |
| (3,421) |
Common stock purchased (5,482 shares) | |
| 0 | |
| 0 | |
| 0 | |
| 0 | |
| (136) | |
| (136) |
Net issuance (4,297 shares) to employee stock plans, including related tax effects | |
| 0 | |
| (17) | |
| 0 | |
| 0 | |
| 132 | |
| 115 |
Recognition of stock based compensation | |
| 0 | |
| 156 | |
| 0 | |
| 0 | |
| 0 | |
| 156 |
Balance at September 30, 2019 | | $ | 32,857 | | $ | 188,283 | | $ | 174,994 | | $ | 3,045 | | $ | (4,720) | | $ | 394,459 |
| | | | | | | | | | | | | | | | | | |
Balance at December 31, 2019 | | $ | 32,857 | | $ | 188,536 | | $ | 175,780 | | $ | 3,911 | | $ | (4,677) | | $ | 396,407 |
| | | | | | | | | | | | | | | | | | |
Net income | |
| 0 | |
| 0 | |
| 16,202 | |
| 0 | |
| 0 | |
| 16,202 |
Other comprehensive income | |
| 0 | |
| 0 | |
| 0 | |
| 4,610 | |
| 0 | |
| 4,610 |
Cash dividends declared ($0.44 per share) | |
| 0 | |
| 0 | |
| (6,819) | |
| 0 | |
| 0 | |
| (6,819) |
Common stock purchased (405,208 shares) | |
| 0 | |
| 0 | |
| 0 | |
| 0 | |
| (7,467) | |
| (7,467) |
Net issuance (61,025 shares) to employee stock plans, including related tax effects | |
| 0 | |
| 406 | |
| 0 | |
| 0 | |
| 251 | |
| 657 |
Recognition of stock based compensation | |
| 0 | |
| 584 | |
| 0 | |
| 0 | |
| 0 | |
| 584 |
Balance at June 30, 2020 | | | 32,857 | | | 189,526 | | | 185,163 | | | 8,521 | | | (11,893) | | | 404,174 |
| | | | | | | | | | | | | | | | | | |
Net income | |
| 0 | |
| 0 | |
| 8,402 | |
| 0 | |
| 0 | |
| 8,402 |
Other comprehensive income | |
| 0 | |
| 0 | |
| 0 | |
| 884 | |
| 0 | |
| 884 |
Cash dividends declared ($0.22 per share) | |
| 0 | |
| 0 | |
| (3,316) | |
| 0 | |
| 0 | |
| (3,316) |
Common stock purchased (297,658 shares) | | | 0 | | | 0 | | | 0 | | | 0 | | | (6,003) | | | (6,003) |
Net issuance (12,275 shares) to employee stock plans, including related tax effects | |
| 0 | |
| (199) | |
| 0 | |
| 0 | |
| 224 | |
| 25 |
Recognition of stock based compensation | |
| 0 | |
| 279 | |
| 0 | |
| 0 | |
| 0 | |
| 279 |
Balance at September 30, 2020 | | $ | 32,857 | | $ | 189,606 | | $ | 190,249 | | $ | 9,405 | | $ | (17,672) | | $ | 404,445 |
The accompanying notes are an integral part of these consolidated financial statements.
8
BAR HARBOR BANKSHARES AND SUBSIDIARIES
CONSOLIDATED STATEMENTS OF CASH FLOWS
| | | | | | |
| | Nine Months Ended September 30, | ||||
(in thousands) |
| 2020 |
| 2019 | ||
Cash flows from operating activities: |
|
|
| | |
|
Net income |
| $ | 24,604 | | $ | 18,413 |
Adjustments to reconcile net income to net cash provided by operating activities: | |
|
| |
|
|
Provision for loan losses | |
| 4,265 | |
| 1,779 |
Net amortization of securities | |
| 2,472 | |
| 2,535 |
Change in unamortized net loan costs and premiums | |
| 3,149 | |
| (278) |
Premises and equipment depreciation | |
| 3,571 | |
| 2,942 |
Stock-based compensation expense | |
| 863 | |
| 716 |
Accretion of purchase accounting entries, net | |
| (1,219) | |
| (2,613) |
Amortization of other intangibles | |
| 768 | |
| 621 |
Income from cash surrender value of bank-owned life insurance policies | |
| (1,525) | |
| (1,558) |
Gain on sales of securities, net | |
| (1,486) | |
| (157) |
Increase in right-of-use lease assets | | | (578) | | | — |
Increase in lease liabilities | | | 625 | | | — |
Loss on other real estate owned | |
| 366 | |
| 146 |
Loss on premises and equipment, net | |
| 90 | |
| 21 |
Net change in other assets and liabilities | |
| (3,978) | |
| (1,722) |
Net cash provided by operating activities | |
| 31,987 | |
| 20,845 |
| | | | | | |
Cash flows from investing activities: | |
|
| |
|
|
Proceeds from sales of securities available for sale | |
| 87,521 | |
| 67,983 |
Proceeds from maturities, calls and prepayments of securities available for sale | |
| 109,314 | |
| 77,812 |
Purchases of securities available for sale | |
| (131,107) | |
| (76,620) |
Net change in loans | |
| (71,233) | |
| (85,483) |
Purchase of FHLB stock | |
| (4,044) | |
| (10,471) |
Proceeds from sale of FHLB stock | |
| 10,748 | |
| 18,661 |
Purchase of premises and equipment, net | |
| (4,449) | |
| (1,803) |
Acquisitions, net of cash acquired | | | (340) | | | — |
Proceeds from sale of other real estate | | | (113) | | | — |
Net cash used in investing activities | |
| (3,703) | |
| (9,921) |
| | | | | | |
Cash flows from financing activities: | |
|
| |
|
|
Net change in deposits | |
| 239,164 | |
| 10,968 |
Net change in short-term senior borrowings | | | (273,268) | | | (111,400) |
Proceeds from long-term senior borrowings | | | 273,342 | | | 174,000 |
Repayments of long-term senior borrowings | |
| (71,187) | |
| (106,605) |
Net change in short-term other borrowings | |
| (14,784) | |
| 5,048 |
Net change in subordinated debt issuance costs | | | 119 | | | — |
Exercise of stock options | | | 682 | | | 195 |
Purchase of treasury and common stock | | | (13,470) | | | (346) |
Cash dividends paid on common stock | |
| (10,135) | |
| (9,945) |
Net cash provided by (used in) financing activities | |
| 130,463 | |
| (38,085) |
| | | | | | |
Net change in cash and cash equivalents | |
| 158,747 | |
| (27,161) |
Cash and cash equivalents at beginning of year | |
| 56,910 | |
| 98,754 |
Cash and cash equivalents at end of year | | $ | 215,657 | | $ | 71,593 |
(continued)
9
BAR HARBOR BANKSHARES AND SUBSIDIARIES
CONSOLIDATED STATEMENTS OF CASH FLOWS
| Nine Months Ended September 30, | ||||||||
| (in thousands) | 2019 | 2018 | ||||||
| Cash flows from operating activities: | ||||||||
| Net income | $ | 18,413 | $ | 25,317 | ||||
| Adjustments to reconcile net income to net cash provided by operating activities: | ||||||||
| Provision for loan losses | 1,779 | 2,208 | ||||||
| Net amortization of securities | 2,535 | 3,066 | ||||||
| Change in unamortized net loan costs and premiums | (278 | ) | 46 | |||||
| Premises and equipment depreciation | 2,942 | 2,821 | ||||||
| Stock-based compensation expense | 716 | 836 | ||||||
| Accretion of purchase accounting entries, net | (2,613 | ) | (2,780 | ) | ||||
| Amortization of other intangibles | 621 | 621 | ||||||
| Income from cash surrender value of bank-owned life insurance policies | (1,558 | ) | (1,328 | ) | ||||
| Gain on sales of securities, net | (157 | ) | — | |||||
| Loss on other real estate owned | 146 | — | ||||||
| Loss on premises and equipment, net | 21 | — | ||||||
| Net change in other assets and liabilities | (1,722 | ) | (3,644 | ) | ||||
| Net cash provided by operating activities | 20,845 | 27,163 | ||||||
| Cash flows from investing activities: | ||||||||
| Proceeds from sales of securities available for sale | 67,983 | — | ||||||
| Proceeds from maturities, calls and prepayments of securities available for sale | 77,812 | 72,278 | ||||||
| Purchases of securities available for sale | (76,620 | ) | (90,399 | ) | ||||
| Net change in loans | (85,483 | ) | 2,852 | |||||
| Purchase of Federal Home Loan Bank stock | (10,471 | ) | (1,172 | ) | ||||
| Proceeds from sale of Federal Home Loan Bank stock | 18,661 | 5,123 | ||||||
| Purchase of premises and equipment, net | (1,803 | ) | (2,675 | ) | ||||
| Purchase of bank-owned life insurance | — | (14,000 | ) | |||||
| Proceeds from sale of other real estate owned | — | 69 | ||||||
| Net cash used in investing activities | (9,921 | ) | (27,924 | ) | ||||
| Cash flows from financing activities: | ||||||||
| Net increase in deposits | 10,968 | 38,885 | ||||||
| Proceeds from advances from the Federal Home Loan Bank | 9,722,907 | 7,276,306 | ||||||
| Repayments of advances from the Federal Home Loan Bank | (9,766,912 | ) | (7,320,515 | ) | ||||
| Net change in short-term other borrowings | 5,048 | (3,255 | ) | |||||
| Exercise of stock options | 195 | 635 | ||||||
| Treasury stock purchased | (346 | ) | (324 | ) | ||||
| Cash dividends paid on common stock | (9,945 | ) | (9,082 | ) | ||||
| Net cash used in financing activities | (38,085 | ) | (17,350 | ) | ||||
| Net change in cash and cash equivalents | (27,161 | ) | (18,111 | ) | ||||
| Cash and cash equivalents at beginning of year | 98,754 | 90,685 | ||||||
| Cash and cash equivalents at end of year | $ | 71,593 | $ | 72,574 | ||||
| Supplemental cash flow information: | ||||||||
| Interest paid | $ | 34,394 | $ | 25,537 | ||||
| Income taxes paid, net | 2,479 | 9,927 | ||||||
| Other non-cash changes: | ||||||||
| Real estate owned acquired in settlement of loans | 250 | 30 | ||||||
| | | | | | |
| | Nine Months Ended September 30, | ||||
(in thousands) |
| 2020 |
| 2019 | ||
Supplemental cash flow information: | |
|
| |
|
|
Interest paid | | $ | 22,085 | | $ | 34,394 |
Income taxes paid, net | |
| 4,806 | |
| 2,479 |
| | | | | | |
Acquisition of non-cash assets and liabilities: | | | | | | |
Assets acquired | | | 1,171 | | | — |
Liabilities acquired | | | (343) | | | — |
| | | | | | |
Other non-cash changes: | |
|
| |
|
|
Real estate owned acquired in settlement of loans | |
| — | |
| 250 |
The accompanying notes are an integral part of these consolidated financial statements.
10
BAR HARBOR BANKSHARES AND SUBSIDIARIES
The consolidated financial statements (the “financial statements”) of Bar Harbor Bankshares and its subsidiaries (the “Company” or “Bar Harbor”) have been prepared in conformity with accounting principles generally accepted in the United States of America (“GAAP”). Bar Harbor Bankshares is a Maine Financial Institution Holding Company for the purposes of the laws of the state of Maine, and as such is subject to the jurisdiction of the Superintendent of the Maine Bureau of Financial Institutions. These financial statements include the accounts of the Company, its wholly owned subsidiary Bar Harbor Bank & Trust (the "Bank") and the Bank’s consolidated subsidiaries. The results of operations of companies or assets acquired are included only from the dates of acquisition. All material wholly-ownedwholly owned and majority owned subsidiaries are consolidated unless GAAP requires otherwise.
In addition, these interim financial statements have been prepared in accordance with the instructions to Form 10-Q and Article 10 of Regulation S-X, and accordingly, certain information and footnote disclosures normally included in financial statements prepared according to GAAP have been omitted.
The results for any interim period are not necessarily indicative of results for the full year. These consolidated financial statements should be read in conjunction with the audited financial statements and note disclosures for the Company's Annual Report on Form 10-K for the year ended December 31, 20182019 previously filed with the Securities and Exchange Commission (the "SEC"). In management's opinion, all adjustments necessary for a fair statement are reflected in the interim periods presented.
Reclassifications:
Whenever necessary, amounts in the prior years’ financial statements are reclassified to conform to current presentation. The reclassifications had no impact on net income in the Company’s consolidated income statement.
Summary of Significant Accounting Policies
The disclosures below supplement the accounting policies previously disclosed in NOTE 1 – Summary of Significant Accounting Policies of the Company’s Annual Report on Form 10-K for the year ended December 31, 2019.
Operating, Accounting and Reporting Considerations related to COVID-19:
The COVID-19 pandemic has negatively impacted the global economy. In response to this crisis, the Coronavirus Aid, Relief, and Economic Security (“CARES”) Act was passed by Congress and signed into law on March 27, 2020. The CARES Act provides an estimated $2.2 trillion to fight the COVID-19 pandemic and stimulate the economy by supporting individuals and businesses through loans, grants, tax changes, and other types of relief. Some of the provisions applicable to the Company include, but are not limited to:
| ● | Accounting for Loan Modifications - The CARES Act provides that a financial institution may elect to suspend (1) the requirements under GAAP for certain loan modifications that may otherwise be categorized as a troubled debt restructuring (“TDR”) and (2) any determination that such loan modifications would be considered a TDR, including the related impairment for accounting purposes. |
| ● | Paycheck Protection Program - The CARES Act established the Paycheck Protection Program (“PPP”), an expansion of the Small Business Administration’s 7(a) loan program and the Economic Injury Disaster Loan Program, administered directly by the SBA. |
| ● | Mortgage Forbearance - Under the CARES Act, through the earlier of December 31, 2020, or the termination date of the COVID-19 national emergency, a borrower with a federally backed mortgage loan that is experiencing financial hardship due to COVID-19 may request a forbearance. A multifamily borrower with a federally backed multifamily mortgage loan that was current as of February 1, 2020, and is experiencing financial hardship due to COVID-19 may request forbearance on the loan for up to 30 days, with up to two additional 30-day periods at the borrower’s request. |
11
Also in response to the COVID-19 pandemic, the Board of Governors of the Federal Reserve Board (“FRB”), the Federal Deposit Insurance Corporation (“FDIC”), the National Credit Union Administration, the Office of the Comptroller of the Currency, and the Consumer Financial Protection Bureau, in consultation with the state financial regulators (collectively, the “agencies”) issued a joint interagency statement (issued March 22, 2020; revised statement issued April 7, 2020). Some of the provisions applicable to the Company include, but are not limited to:
| ● | Accounting for Loan Modifications - Loan modifications that do not meet the conditions of the CARES Act may still qualify as a modification that does not need to be accounted for as a TDR. The agencies confirmed with FASB staff that short-term modifications made on a good faith basis in response to COVID-19 to borrowers who were current prior to any relief are not TDRs. This includes short-term (e.g., six months) modifications such as payment deferrals, fee waivers, extensions of repayment terms, or insignificant delays in payment. |
| ● | Past Due Reporting - With regard to loans not otherwise reportable as past due, financial institutions are not expected to designate loans with deferrals granted due to COVID-19 as past due because of the deferral. A loan’s payment date is governed by the due date stipulated in the legal agreement. If a financial institution agrees to a payment deferral, these loans would not be considered past due during the period of the deferral. |
| ● | Nonaccrual Status and Risk Rating - For short-term COVID-19 modifications, these loans generally should not be reported as nonaccrual or as having a classified risk rating. |
Recent Accounting Pronouncements
The following table provides a brief description of recent accounting standards updates ("ASU") that could have a material impact to the Company’s consolidated financial statements upon adoption:
| | | | | | | | | | |
Standard | ||||||||||
Description | Required Date | Effect on financial statements | ||||||||
Standards Adopted in | | | | |||||||
ASU | | | ||||||||
This ASU amends | | | January 1, | | | The Company has adopted | ||||
ASU | ||||||||||
| | This ASU | | | January 1, | | | The Company has adopted | ||
12
| ||||||||||
Standard | ||||||||||
Description | Required Date | Effect on financial statements | ||||||||
Standards Not Yet Adopted | | | | |||||||
ASU 2016-13, Measurement of Credit Losses on Financial Instruments ASU 2018‑19, Codification Improvements to ASU 2016-13 | | | This ASU amends Topic 326, Financial Instruments- Credit Losses to replace the current incurred loss accounting model with a current expected credit loss approach | |||||||
While the CECL model does not apply to available for sale debt securities, the ASU does require entities to record an allowance when recognizing credit losses for available for sale securities with unrealized losses, rather than reduce the amortized cost of the securities by direct write-offs. The guidance will require companies to recognize improvements to estimated credit losses immediately in earnings rather than interest income over time. | ||||||||||
The ASU should be adopted on a modified retrospective basis. Entities that have loans accounted for under ASC 310-30 at the time of adoption should prospectively apply the guidance in this amendment for purchase credit deteriorated assets. | ||||||||||
| | January 1, 2020 | | | Adoption of this ASU is | |||||
ASU 2018-14 Compensation- Disclosure Requirements for Defined Pension Plans Topic 715-20 | | | This ASU makes minor changes to the disclosure requirements for employers that sponsor defined benefit pension and/or other post-retirement benefit plans. | | | January 1, 2021 | | | Adoption of this ASU is not expected to have a material impact on the Company's consolidated financial statements. | |
13
| ||||||||||
Standard | Description | Required Date | Effect on financial statements | |||||||
Standards Not Yet Adopted (continued) | | | | |||||||
ASU 2020-04 Facilitation of the Effects of Reference Rate Reform, Topic 848 | | | This ASU provides temporary optional expedients and exceptions to GAAP guidance on contract modifications and hedge accounting to ease the financial reporting burdens of the expected market transition from the London Interbank Offered Rate ("LIBOR") and other interbank offered rates to alternative reference rates, such as the Secured Overnight Financing Rate ("SOFR"). For instance, companies can (1) elect not to apply certain modification accounting requirements to contracts affected by reference rate reform, if certain criteria are met. A company that makes this election would not have to re-measure the contracts at the modification date or reassess a previous accounting determination. Companies can also (2) elect various optional expedients that would allow them to continue applying hedge accounting for hedging relationships affected by reference rate reform, if certain criteria are met. Finally, companies can (3) make a one-time election to sell and/or reclassify held-to-maturity debt securities that reference an interest rate affected by reference rate reform. | | | May be elected through December 31, 2022. | | | The Company is currently evaluating all of its contracts, hedging relationships and other transactions that will be effected by reference rates that are being discontinued and determining which elections need to be made. | |
14
The following is a summary of securities available for sale:
| (in thousands) | Amortized Cost | Gross Unrealized Gains | Gross Unrealized Losses | Fair Value | ||||||||||||
| September 30, 2019 | ||||||||||||||||
| Debt securities: | ||||||||||||||||
| Mortgage-backed securities: | ||||||||||||||||
| US Government-sponsored enterprises | $ | 344,547 | $ | 5,924 | $ | 1,328 | $ | 349,143 | ||||||||
| US Government agency | 116,912 | 2,130 | 217 | 118,825 | ||||||||||||
| Private label | 20,268 | 75 | 389 | 19,954 | ||||||||||||
| Obligations of states and political subdivisions thereof | 107,854 | 3,519 | 147 | 111,226 | ||||||||||||
| Corporate bonds | 75,652 | 1,554 | 679 | 76,527 | ||||||||||||
| Total securities available for sale | $ | 665,233 | $ | 13,202 | $ | 2,760 | $ | 675,675 | ||||||||
| December 31, 2018 | ||||||||||||||||
| Debt securities: | ||||||||||||||||
| Mortgage-backed securities: | ||||||||||||||||
| US Government-sponsored enterprises | $ | 413,492 | $ | 904 | $ | 9,444 | $ | 404,952 | ||||||||
| US Government agency | 111,938 | 509 | 1,935 | 110,512 | ||||||||||||
| Private label | 20,353 | 113 | 84 | 20,382 | ||||||||||||
| Obligations of states and political subdivisions thereof | 133,260 | 1,081 | 2,076 | 132,265 | ||||||||||||
| Corporate bonds | 58,098 | 264 | 636 | 57,726 | ||||||||||||
| Total securities available for sale | $ | 737,141 | $ | 2,871 | $ | 14,175 | $ | 725,837 | ||||||||
| | | | | | | | | | | | |
| | | | | Gross | | Gross | | | | ||
| | | | | Unrealized | | Unrealized | | | | ||
(in thousands) |
| Amortized Cost |
| Gains |
| Losses |
| Fair Value | ||||
September 30, 2020 |
| |
|
| |
|
| |
|
| |
|
Debt securities: |
| |
|
| |
|
| |
|
| |
|
Mortgage-backed securities: |
| |
|
| |
|
| |
|
| |
|
US Government-sponsored enterprises | | $ | 226,930 | | $ | 8,683 | | $ | (441) | | $ | 235,172 |
US Government agency | |
| 92,517 | |
| 3,413 | |
| (145) | |
| 95,785 |
Private label | |
| 20,142 | |
| 40 | |
| (579) | |
| 19,603 |
Obligations of states and political subdivisions thereof | |
| 149,890 | |
| 4,267 | |
| — | |
| 154,157 |
Corporate bonds | |
| 99,786 | |
| 1,713 | |
| (1,687) | |
| 99,812 |
Total securities available for sale | | $ | 589,265 | | $ | 18,116 | | $ | (2,852) | | $ | 604,529 |
| | | | | | | | | | | | |
| | | | | Gross | | Gross | | | | ||
| | | | | Unrealized | | Unrealized | | | | ||
(in thousands) |
| Amortized Cost |
| Gains |
| Losses |
| Fair Value | ||||
December 31, 2019 | |
|
| |
|
| |
|
| |
|
|
Debt securities: | |
|
| |
|
| |
|
| |
|
|
Mortgage-backed securities: | |
|
| |
|
| |
|
| |
|
|
US Government-sponsored enterprises | | $ | 319,064 | | $ | 4,985 | | $ | (2,080) | | $ | 321,969 |
US Government agency | |
| 98,568 | |
| 1,640 | |
| (547) | |
| 99,661 |
Private label | |
| 20,212 | |
| 68 | |
| (747) | |
| 19,533 |
Obligations of states and political subdivisions thereof | |
| 139,240 | |
| 3,034 | |
| (268) | |
| 142,006 |
Corporate bonds | |
| 78,804 | |
| 1,478 | |
| (221) | |
| 80,061 |
Total securities available for sale | | $ | 655,888 | | $ | 11,205 | | $ | (3,863) | | $ | 663,230 |
The amortized cost and estimated fair value of available for sale (“AFS”) securities segregated by contractual maturity at September 30, 20192020 are presented below. Expected maturities may differ from contractual maturities because issuers may have the right to call or prepay obligations. Mortgage-backed securities are shown in total, as their maturities are highly variable.
| | | | | | |
| | Available for sale | ||||
(in thousands) |
| Amortized Cost |
| Fair Value | ||
Within 1 year |
| $ | — | | $ | — |
Over 1 year to 5 years | |
| 25,596 | |
| 25,849 |
Over 5 years to 10 years | |
| 81,687 | |
| 79,979 |
Over 10 years | |
| 142,393 | |
| 148,141 |
Total bonds and obligations | |
| 249,676 | |
| 253,969 |
Mortgage-backed securities | |
| 339,589 | |
| 350,560 |
Total securities available for sale | | $ | 589,265 | | $ | 604,529 |
The following table presents the gains and losses from the sale of AFS securities for the periods presented:
| | | | | | | | | | | | |
| | Three Months Ended | | Nine Months Ended | ||||||||
| | September 30, | | September 30, | ||||||||
(In thousands) |
| 2020 |
| 2019 |
| 2020 |
| 2019 | ||||
Gross gains on sales of available for sale securities | | $ | — | | $ | 716 | | $ | 1,508 | | $ | 716 |
Gross losses on sales of available for sale securities | |
| — | |
| (559) | |
| (22) | |
| (559) |
Net gains on sale of available for sale securities | | $ | — | | $ | 157 | | $ | 1,486 | | $ | 157 |
15
| Available for sale | ||||||||
| (in thousands) | Amortized Cost | Fair Value | ||||||
| Within 1 year | $ | 190 | $ | 191 | ||||
| Over 1 year to 5 years | 33,984 | 34,856 | ||||||
| Over 5 years to 10 years | 56,882 | 57,482 | ||||||
| Over 10 years | 92,451 | 95,224 | ||||||
| Total bonds and obligations | 183,507 | 187,753 | ||||||
| Mortgage-backed securities | 481,726 | 487,922 | ||||||
| Total securities available for sale | $ | 665,233 | $ | 675,675 | ||||
Securities with unrealized losses, segregated by the duration of their continuous unrealized loss positions, are summarized as follows:
| Less Than Twelve Months | Over Twelve Months | Total | ||||||||||||||||||||||
| (In thousands) | Gross Unrealized Losses | Fair Value | Gross Unrealized Losses | Fair Value | Gross Unrealized Losses | Fair Value | ||||||||||||||||||
| September 30, 2019 | ||||||||||||||||||||||||
| Debt securities: | ||||||||||||||||||||||||
| Mortgage-backed securities: | ||||||||||||||||||||||||
| US Government-sponsored enterprises | $ | 140 | $ | 30,711 | $ | 1,188 | $ | 60,174 | $ | 1,328 | $ | 90,885 | ||||||||||||
| US Government agency | 117 | 10,691 | 100 | 9,767 | 217 | 20,458 | ||||||||||||||||||
| Private label | 385 | 19,573 | 4 | 39 | 389 | 19,612 | ||||||||||||||||||
| Obligations of states and political subdivisions thereof | 20 | 4,138 | 127 | 1,692 | 147 | 5,830 | ||||||||||||||||||
| Corporate bonds | 493 | 14,506 | 186 | 7,186 | 679 | 21,692 | ||||||||||||||||||
| Total securities available for sale | $ | 1,155 | $ | 79,619 | $ | 1,605 | $ | 78,858 | $ | 2,760 | $ | 158,477 | ||||||||||||
| December 31, 2018 | ||||||||||||||||||||||||
| Debt securities: | ||||||||||||||||||||||||
| Mortgage-backed securities: | ||||||||||||||||||||||||
| US Government-sponsored enterprises | $ | 155 | $ | 19,367 | $ | 9,289 | $ | 297,569 | $ | 9,444 | $ | 316,936 | ||||||||||||
| US Government agency | 16 | 2,570 | 1,919 | 68,266 | 1,935 | 70,836 | ||||||||||||||||||
| Private label | 79 | 10,393 | 5 | 47 | 84 | 10,440 | ||||||||||||||||||
| Obligations of states and political subdivisions thereof | 43 | 6,784 | 2,033 | 47,930 | 2,076 | 54,714 | ||||||||||||||||||
| Corporate bonds | 224 | 11,759 | 412 | 14,460 | 636 | 26,219 | ||||||||||||||||||
| Total securities available for sale | $ | 517 | $ | 50,873 | $ | 13,658 | $ | 428,272 | $ | 14,175 | $ | 479,145 | ||||||||||||
| | | | | | | | | | | | | | | | | | |
| | Less Than Twelve Months | | Over Twelve Months | | Total | ||||||||||||
| | Gross |
| | |
| Gross |
| | |
| Gross |
| | | |||
| | Unrealized | | Fair | | Unrealized | | Fair | | Unrealized | | Fair | ||||||
(In thousands) |
| Losses |
| Value |
| Losses |
| Value |
| Losses |
| Value | ||||||
September 30, 2020 |
| |
|
| |
|
| |
|
| |
|
| |
|
| |
|
Debt securities: |
| |
|
| |
|
| |
|
| |
|
| |
|
| |
|
Mortgage-backed securities: |
| |
|
| |
|
| |
|
| |
|
| |
|
| |
|
US Government-sponsored enterprises | | $ | 193 | | $ | 35,087 | | $ | 248 | | $ | 4,027 | | $ | 441 | | $ | 39,114 |
US Government agency | |
| 68 | |
| 8,671 | |
| 77 | |
| 3,458 | |
| 145 | |
| 12,129 |
Private label | |
| 1 | |
| 108 | |
| 578 | |
| 19,398 | |
| 579 | |
| 19,506 |
Obligations of states and political subdivisions thereof | |
| — | |
| 247 | |
| — | |
| — | |
| — | |
| 247 |
Corporate bonds | |
| 1,687 | |
| 41,260 | |
| — | |
| — | |
| 1,687 | |
| 41,260 |
Total securities available for sale | | $ | 1,949 | | $ | 85,373 | �� | $ | 903 | | $ | 26,883 | | $ | 2,852 | | $ | 112,256 |
| | | | | | | | | | | | | | | | | | |
| | | | | | | | | | | | | | | | | | |
| | Less Than Twelve Months | | Over Twelve Months | | Total | ||||||||||||
|
| Gross |
| | |
| Gross |
| | |
| Gross |
| | | |||
| | Unrealized | | Fair | | Unrealized | | Fair | | Unrealized | | Fair | ||||||
(In thousands) | | Losses | | Value | | Losses | | Value | | Losses | | Value | ||||||
December 31, 2019 |
| |
|
| |
|
| |
|
| |
|
| |
|
| |
|
Debt securities: |
| |
|
| |
|
| |
|
| |
|
| |
|
| |
|
Mortgage-backed securities: |
| |
|
| |
|
| |
|
| |
|
| |
|
| |
|
US Government-sponsored enterprises | | $ | 1,074 | | $ | 43,429 | | $ | 1,006 | | $ | 49,712 | | $ | 2,080 | | $ | 93,141 |
US Government agency | |
| 432 | |
| 19,717 | |
| 115 | |
| 9,120 | |
| 547 | |
| 28,837 |
Private label | |
| 380 | |
| 9,843 | |
| 367 | |
| 9,411 | |
| 747 | |
| 19,254 |
Obligations of states and political subdivisions thereof | |
| 137 | |
| 29,355 | |
| 131 | |
| 1,682 | |
| 268 | |
| 31,037 |
Corporate bonds | |
| 142 | |
| 9,888 | |
| 79 | |
| 12,276 | |
| 221 | |
| 22,164 |
Total securities available for sale | | $ | 2,165 | | $ | 112,232 | | $ | 1,698 | | $ | 82,201 | | $ | 3,863 | | $ | 194,433 |
Securities Impairment:
As a part of the Company’s ongoing security monitoring process, the Company identifies securities in an unrealized loss position that could potentially be other-than-temporarily impaired. For the three and nine months ended September 30,| Three Months Ended September 30, | Nine Months Ended September 30, | |||||||||||||||
| 2019 | 2018 | 2019 | 2018 | |||||||||||||
| Estimated credit losses as of prior year-end | $ | 1,697 | $ | 1,697 | $ | 1,697 | $ | 1,697 | ||||||||
| Reductions for securities paid off during the period | — | — | — | — | ||||||||||||
| Estimated credit losses at end of the period | $ | 1,697 | $ | 1,697 | $ | 1,697 | $ | 1,697 | ||||||||
The following table presents the changes in estimated credit losses recognized by the Company for the periods presented:
| | | | | | | | | | | | |
| | Three Months Ended | | Nine Months Ended | ||||||||
| | September 30, | | September 30, | ||||||||
|
| 2020 |
| 2019 |
| 2020 |
| 2019 | ||||
Estimated credit losses as of prior year-end | | $ | 1,697 | | $ | 1,697 | | $ | 1,697 | | $ | 1,697 |
Reductions for securities paid off during the period | |
| — | |
| — | |
| 0 | |
| 0 |
Estimated credit losses at end of the period | | $ | 1,697 | | $ | 1,697 | | $ | 1,697 | | $ | 1,697 |
The Company expects to recover its amortized cost basis on all securities in its AFS portfolio. Furthermore, the Company does not intend to sell nor does it anticipate that it will be required to sell any of its securities in an unrealized loss position as of September 30, 2019,2020, prior to this recovery. The Company’s ability and intent to hold these securities until recovery is supported by the Company’s strong capital and liquidity positions as well as its historically low portfolio turnover.
16
The following summarizes, by investment security type, the basis for the conclusion that securities in an unrealized loss position were not other-than-temporarily impairedOTTI at September 30, 2019:
US Government-sponsored enterprises
36 out of the total 702611 securities in the Company’s portfolios of AFS US Government-sponsored enterprises were in unrealized loss positions. Aggregate unrealized losses represented 1.4%1.12% of the amortized cost of securities in unrealized loss positions. The FNMAFederal National Mortgage Association and FHLMCFederal Home Loan Mortgage Corporation guarantee the contractual cash flows of all of the Company’s US Government-sponsored enterprises. The securities are investment grade rated and there were no material underlying credit downgrades during the quarter. All securities are performing.
US Government agency
14 out of the total 190166 securities in the Company’s portfolios of AFS US Government agency securities were in unrealized loss positions. Aggregate unrealized losses represented 1.0%1.18% of the amortized cost of securities in unrealized loss positions. The Government National Mortgage Association (“GNMA”) guarantees the contractual cash flows of all of the Company’s US Government agency securities. The securities are investment grade rated and there were no material underlying credit downgrades during the quarter. All securities are performing.
Private label
11 of the total 2016 securities in the Company’s portfolio of AFS private label mortgage-backed securities were in unrealized loss positions. Aggregate unrealized losses represented 1.9%2.88% of the amortized cost of securities in unrealized loss positions. Based upon the expectation that the Company will receive all of the future contractual cash flows related to the amortized cost on these securities, the Company does not consider there to be any additional other-than-temporary impairment with respect to these securities.
Obligations of states and political subdivisions thereof
1 of the total 219177 securities in the Company’s portfolio of AFS municipal bonds and obligations were in unrealized loss positions. Aggregate unrealized losses represented 2.5%0.08% of the amortized cost of securities in unrealized loss positions. The Company continually monitors the municipal bond sector of the market carefully and periodically evaluates the appropriate level of exposure to the market. At this time, the Company feels the bonds in this portfolio carry minimal risk of default and the Company is appropriately compensated for the risk. There were no material underlying credit downgrades during the quarter. All securities are performing.
Corporate bonds
13 out of the total 2634 securities in the Company’s portfolio of AFS corporate bonds were in an unrealized loss position. The aggregate unrealized loss represents 3.0%3.97% of the amortized cost of bonds in unrealized loss positions. The Company reviews the financial strength of all of these bonds and has concluded that the amortized cost remains supported by the expected future cash flows of these securities. The most recent review includes all bond issuers and their current credit ratings, financial performance and capitalization.
17
The Company’s loan portfolio is comprised of the following segments: commercial real estate, commercial and industrial, residential real estate, and consumer loans. Commercial real estate loans include multi-family, commercial construction and land development, and other commercial real estate classes. Commercial and industrial loans include loans to commercial and agricultural businesses and tax exempt entities. Residential real estate loans consist of mortgages for 1-to-4 family housing. Consumer loans include home equity loans, auto and other installment loans.
The Company’s lending activities are principally conducted in Maine, New Hampshire, and Vermont.
Total loans include business activity loans and acquired loans. Acquired loans are those loans previously acquired from other institutions. The following is a summary of total loans:
| September 30, 2019 | December 31, 2018 | |||||||||||||||||||||||
| (in thousands) | Business Activities Loans | Acquired Loans | Total | Business Activities Loans | Acquired Loans | Total | ||||||||||||||||||
| Commercial real estate: | ||||||||||||||||||||||||
| Construction and land development | $ | 28,802 | $ | 2,064 | $ | 30,866 | $ | 23,754 | $ | 2,890 | $ | 26,644 | ||||||||||||
| Other commercial real estate | 672,885 | 220,022 | 892,907 | 555,980 | 244,075 | 800,055 | ||||||||||||||||||
| Total commercial real estate | 701,687 | 222,086 | 923,773 | 579,734 | 246,965 | 826,699 | ||||||||||||||||||
| Commercial and industrial: | ||||||||||||||||||||||||
| Commercial | 239,894 | 40,490 | 280,384 | 234,757 | 52,470 | 287,227 | ||||||||||||||||||
| Agricultural | 21,206 | — | 21,206 | 22,317 | — | 22,317 | ||||||||||||||||||
| Tax exempt | 66,043 | 35,073 | 101,116 | 56,588 | 38,738 | 95,326 | ||||||||||||||||||
| Total commercial and industrial | 327,143 | 75,563 | 402,706 | 313,662 | 91,208 | 404,870 | ||||||||||||||||||
| Total commercial loans | 1,028,830 | 297,649 | 1,326,479 | 893,396 | 338,173 | 1,231,569 | ||||||||||||||||||
| Residential real estate: | ||||||||||||||||||||||||
| Residential mortgages | 730,516 | 412,936 | 1,143,452 | 670,189 | 474,509 | 1,144,698 | ||||||||||||||||||
| Total residential real estate | 730,516 | 412,936 | 1,143,452 | 670,189 | 474,509 | 1,144,698 | ||||||||||||||||||
| Consumer: | ||||||||||||||||||||||||
| Home equity | 58,556 | 37,600 | 96,156 | 57,898 | 45,291 | 103,189 | ||||||||||||||||||
| Other consumer | 10,234 | 985 | 11,219 | 9,414 | 1,357 | 10,771 | ||||||||||||||||||
| Total consumer | 68,790 | 38,585 | 107,375 | 67,312 | 46,648 | 113,960 | ||||||||||||||||||
| Total loans | $ | 1,828,136 | $ | 749,170 | $ | 2,577,306 | $ | 1,630,897 | $ | 859,330 | $ | 2,490,227 | ||||||||||||
| | | | | | | | | | | | | | | | | | |
| | September 30, 2020 | | December 31, 2019 | ||||||||||||||
| | Business | | | | | | | | Business | | | | | | | ||
| | Activities | | Acquired | | | | | Activities | | Acquired | | | | ||||
(in thousands) |
| Loans |
| Loans |
| Total |
| Loans |
| Loans |
| Total | ||||||
Commercial real estate: |
| |
|
| |
|
| |
|
| |
|
| |
|
| |
|
Construction and land development | | $ | 86,927 | | $ | 2,191 | | $ | 89,118 | | $ | 31,387 | | $ | 2,903 | | $ | 34,290 |
Other commercial real estate | |
| 765,471 | |
| 191,046 | |
| 956,517 | |
| 666,051 | |
| 230,320 | |
| 896,371 |
Total commercial real estate | |
| 852,398 | |
| 193,237 | |
| 1,045,635 | |
| 697,438 | |
| 233,223 | |
| 930,661 |
| | | | | | | | | | | | | | | | | | |
Commercial and industrial: | |
|
| |
|
| |
| | |
|
| |
|
| |
| |
Commercial | |
| 381,512 | |
| 56,858 | |
| 438,370 | |
| 239,692 | |
| 59,072 | |
| 298,764 |
Agricultural | |
| 17,658 | |
| 156 | |
| 17,814 | |
| 20,018 | |
| 206 | |
| 20,224 |
Tax exempt | |
| 41,951 | |
| 24,375 | |
| 66,326 | |
| 66,860 | |
| 37,443 | |
| 104,303 |
Total commercial and industrial | |
| 441,121 | |
| 81,389 | |
| 522,510 | |
| 326,570 | |
| 96,721 | |
| 423,291 |
| | | | | | | | | | | | | | | | | | |
Total commercial loans | |
| 1,293,519 | |
| 274,626 | |
| 1,568,145 | |
| 1,024,008 | |
| 329,944 | |
| 1,353,952 |
| | | | | | | | | | | | | | | | | | |
Residential real estate: | |
|
| |
|
| |
| | |
|
| |
|
| |
| |
Residential mortgages | |
| 695,766 | |
| 325,440 | |
| 1,021,206 | |
| 740,687 | |
| 411,170 | |
| 1,151,857 |
Total residential real estate | |
| 695,766 | |
| 325,440 | |
| 1,021,206 | |
| 740,687 | |
| 411,170 | |
| 1,151,857 |
| | | | | | | | | | | | | | | | | | |
Consumer: | |
|
| |
|
| |
| | |
|
| |
|
| |
| |
Home equity | |
| 58,344 | |
| 50,530 | |
| 108,874 | |
| 59,368 | |
| 63,033 | |
| 122,401 |
Other consumer | |
| 9,217 | |
| 1,249 | |
| 10,466 | |
| 11,167 | |
| 1,715 | |
| 12,882 |
Total consumer | |
| 67,561 | |
| 51,779 | |
| 119,340 | |
| 70,535 | |
| 64,748 | |
| 135,283 |
| | | | | | | | | | | | | | | | | | |
Total loans | | $ | 2,056,846 | | $ | 651,845 | | $ | 2,708,691 | | $ | 1,835,230 | | $ | 805,862 | | $ | 2,641,092 |
The carrying amount of the acquired loans at September 30, 20192020 totaled $749.2$651.8 million. A subset of these loans was determined to have evidence of credit deterioration at acquisition date, which is accounted for in accordance with ASC 310-30.310-30, Accounting for Certain Loans or Debt Securities Acquired in a Transfer. These purchased credit-impaired loans presently maintain a carrying value of $8.4$14.2 million (and total note balances of $11.5$18.1 million). These loans are evaluated for impairment through the periodic reforecasting of expected cash flows. Acquired loans considered not impaired at the acquisition date had a carrying amount of $740.8$637.6 million as of September 30, 2019.2020.
18
The following table summarizes activity in the accretable yield for the acquired loan portfolio that falls under the purview of ASC 310-30,
Accounting for Certain Loans or Debt Securities Acquired in a Transfer:| Three Months Ended September 30, | ||||||||
| (in thousands) | 2019 | 2018 | ||||||
| Balance at beginning of period | $ | 4,195 | $ | 2,807 | ||||
| Reclassification from non-accretable difference for loans with (decreased) improved cash flows | (126 | ) | 1,985 | |||||
| Accretion | (581 | ) | (315 | ) | ||||
| Balance at end of period | $ | 3,488 | $ | 4,477 | ||||
| Nine Months Ended September 30, | ||||||||
| (in thousands) | 2019 | 2018 | ||||||
| Balance at beginning of period | $ | 4,377 | $ | 3,509 | ||||
| Reclassification from non-accretable difference for loans with improved cash flows | 498 | 2,031 | ||||||
| Accretion | (1,387 | ) | (1,063 | ) | ||||
| Balance at end of period | $ | 3,488 | $ | 4,477 | ||||
| | | | | | |
| | Three Months Ended September 30, | ||||
(in thousands) |
| 2020 |
| 2019 | ||
Balance at beginning of period | | $ | 6,227 | | $ | 4,195 |
Net reclassifications from (to) nonaccretable difference | |
| 53 | |
| (126) |
Accretion | |
| (455) | |
| (581) |
Balance at end of period | | $ | 5,825 | | $ | 3,488 |
| | | | | | |
| | Nine Months Ended September 30, | ||||
(in thousands) |
| 2020 |
| 2019 | ||
Balance at beginning of period | | $ | 7,367 | | $ | 4,377 |
Net reclassifications from (to) nonaccretable difference | |
| 1,004 | |
| 498 |
Accretion | |
| (2,546) | |
| (1,387) |
Balance at end of period | | $ | 5,825 | | $ | 3,488 |
The following is a summary of past due loans at September 30, 20192020 and December 31, 2018:
Business Activities Loans
| | | | | | | | | | | | | | | | | | | | | |
| | | | | | | | 90 Days or | | | | | | | | | | | Past Due > | ||
|
| 30-59 Days |
| 60-89 Days |
| Greater |
| Total Past |
| | |
| | |
| 90 days and | |||||
(in thousands) | | Past Due | | Past Due | | Past Due | | Due | | Current | | Total Loans | | Accruing | |||||||
September 30, 2020 |
| |
|
| |
|
| |
|
| |
|
| |
|
| |
|
| |
|
Commercial real estate: |
| |
|
| |
|
| |
|
| |
|
| |
|
| |
|
| |
|
Construction and land development | | $ | 0 | | $ | 0 | | $ | 212 | | $ | 212 | | $ | 86,715 | | $ | 86,927 | | $ | 0 |
Other commercial real estate | |
| 200 | |
| 1,119 | |
| 725 | |
| 2,044 | |
| 763,427 | |
| 765,471 | |
| 0 |
Total commercial real estate | |
| 200 | |
| 1,119 | |
| 937 | |
| 2,256 | |
| 850,142 | |
| 852,398 | |
| 0 |
| | | | | | | | | | | | | | | | | | | | | |
Commercial and industrial: | |
|
| |
|
| |
|
| |
|
| |
|
| |
|
| |
|
|
Commercial | |
| 92 | |
| 310 | |
| 2,193 | |
| 2,595 | |
| 378,917 | |
| 381,512 | |
| 1,932 |
Agricultural | |
| 122 | |
| 0 | |
| 109 | |
| 231 | |
| 17,427 | |
| 17,658 | |
| 0 |
Tax exempt | |
| 0 | |
| 0 | |
| 0 | |
| 0 | |
| 41,951 | |
| 41,951 | |
| 0 |
Total commercial and industrial | |
| 214 | |
| 310 | |
| 2,302 | |
| 2,826 | |
| 438,295 | |
| 441,121 | |
| 1,932 |
| | | | | | | | | | | | | | | | | | | | | |
Total commercial loans | |
| 414 | |
| 1,429 | |
| 3,239 | |
| 5,082 | |
| 1,288,437 | |
| 1,293,519 | |
| 1,932 |
| | | | | | | | | | | | | | | | | | | | | |
Residential real estate: | |
|
| |
|
| |
|
| |
|
| |
|
| |
|
| |
|
|
Residential mortgages | |
| 217 | |
| 112 | |
| 1,369 | |
| 1,698 | |
| 694,068 | |
| 695,766 | |
| 0 |
Total residential real estate | |
| 217 | |
| 112 | |
| 1,369 | |
| 1,698 | |
| 694,068 | |
| 695,766 | |
| 0 |
| | | | | | | | | | | | | | | | | | | | | |
Consumer: | |
|
| |
|
| |
|
| |
|
| |
|
| |
|
| |
|
|
Home equity | |
| 39 | |
| 36 | |
| 171 | |
| 246 | |
| 58,098 | |
| 58,344 | |
| 0 |
Other consumer | |
| 12 | |
| 0 | |
| 2 | |
| 14 | |
| 9,203 | |
| 9,217 | |
| 0 |
Total consumer | |
| 51 | |
| 36 | |
| 173 | |
| 260 | |
| 67,301 | |
| 67,561 | |
| 0 |
| | | | | | | | | | | | | | | | | | | | | |
Total loans | | $ | 682 | | $ | 1,577 | | $ | 4,781 | | $ | 7,040 | | $ | 2,049,806 | | $ | 2,056,846 | | $ | 1,932 |
19
| (in thousands) | 30-59 Days Past Due | 60-89 Days Past Due | 90 Days or Greater Past Due | Total Past Due | Current | Total Loans | Past Due > 90 days and Accruing | |||||||||||||||||||||
| September 30, 2019 | ||||||||||||||||||||||||||||
| Commercial real estate: | ||||||||||||||||||||||||||||
| Construction and land development | $ | — | $ | — | $ | 73 | $ | 73 | $ | 28,729 | $ | 28,802 | $ | 73 | ||||||||||||||
| Other commercial real estate | 985 | 56 | 6,773 | 7,814 | 665,071 | 672,885 | — | |||||||||||||||||||||
| Total commercial real estate | 985 | 56 | 6,846 | 7,887 | 693,800 | 701,687 | 73 | |||||||||||||||||||||
| Commercial and industrial: | ||||||||||||||||||||||||||||
| Commercial | 772 | 64 | 1,145 | 1,981 | 237,913 | 239,894 | — | |||||||||||||||||||||
| Agricultural | 121 | 72 | 25 | 218 | 20,988 | 21,206 | — | |||||||||||||||||||||
| Tax exempt | — | — | — | — | 66,043 | 66,043 | — | |||||||||||||||||||||
| Total commercial and industrial | 893 | 136 | 1,170 | 2,199 | 324,944 | 327,143 | — | |||||||||||||||||||||
| Total commercial loans | 1,878 | 192 | 8,016 | 10,086 | 1,018,744 | 1,028,830 | 73 | |||||||||||||||||||||
| Residential real estate: | ||||||||||||||||||||||||||||
| Residential mortgages | 399 | 345 | 871 | 1,615 | 728,901 | 730,516 | 71 | |||||||||||||||||||||
| Total residential real estate | 399 | 345 | 871 | 1,615 | 728,901 | 730,516 | 71 | |||||||||||||||||||||
| Consumer: | ||||||||||||||||||||||||||||
| Home equity | 131 | 65 | 315 | 511 | 58,045 | 58,556 | — | |||||||||||||||||||||
| Other consumer | 2 | 7 | — | 9 | 10,225 | 10,234 | — | |||||||||||||||||||||
| Total consumer | 133 | 72 | 315 | 520 | 68,270 | 68,790 | — | |||||||||||||||||||||
| Total loans | $ | 2,410 | $ | 609 | $ | 9,202 | $ | 12,221 | $ | 1,815,915 | $ | 1,828,136 | $ | 144 | ||||||||||||||
Acquired Loans
| | | | | | | | | | | | | | | | | | | | | |
|
| | |
| | |
| 90 Days or |
| | |
| Acquired |
| | |
| Past Due > | |||
| | 30-59 Days | | 60-89 Days | | Greater | | Total Past | | Credit | | | | | 90 days and | ||||||
(in thousands) | | Past Due | | Past Due | | Past Due | | Due |
| Impaired | | Total Loans |
| Accruing | |||||||
September 30, 2020 |
| |
|
| |
|
| |
|
| |
|
| |
|
| |
|
| |
|
Commercial real estate: |
| |
|
| |
|
| |
|
| |
|
| |
|
| |
|
| |
|
Construction and land development | | $ | — | | $ | — | | $ | — | | $ | — | | $ | 221 | | $ | 2,191 | | $ | — |
Other commercial real estate | |
| 169 | |
| 156 | |
| 678 | |
| 1,003 | |
| 7,227 | |
| 191,046 | |
| — |
Total commercial real estate | |
| 169 | |
| 156 | |
| 678 | |
| 1,003 | |
| 7,448 | |
| 193,237 | |
| — |
| | | | | | | | | | | | | | | | | | | | | |
Commercial and industrial: | |
|
| |
|
| |
|
| |
|
| |
|
| |
|
| |
|
|
Commercial | |
| 450 | |
| 65 | |
| 18 | |
| 533 | |
| 1,182 | |
| 56,858 | |
| — |
Agricultural | |
| — | |
| — | |
| — | |
| — | |
| 156 | |
| 156 | |
| — |
Tax exempt | |
| — | |
| — | |
| — | |
| — | |
| — | |
| 24,375 | |
| — |
Total commercial and industrial | |
| 450 | |
| 65 | |
| 18 | |
| 533 | |
| 1,338 | |
| 81,389 | |
| — |
| | | | | | | | | | | | | | | | | | | | | |
Total commercial loans | |
| 619 | |
| 221 | |
| 696 | |
| 1,536 | |
| 8,786 | |
| 274,626 | |
| — |
| | | | | | | | | | | | | | | | | | | | | |
Residential real estate: | |
|
| |
|
| |
|
| |
|
| |
|
| |
|
| |
| |
Residential mortgages | |
| 291 | |
| 441 | |
| 2,006 | |
| 2,738 | |
| 4,657 | |
| 325,440 | |
| 215 |
Total residential real estate | |
| 291 | |
| 441 | |
| 2,006 | |
| 2,738 | |
| 4,657 | |
| 325,440 | |
| 215 |
| | | | | | | | | | | | | | | | | | | | | |
Consumer: | |
|
| |
|
| |
|
| |
|
| |
|
| |
|
| |
|
|
Home equity | |
| 291 | |
| 133 | |
| 170 | |
| 594 | |
| 711 | |
| 50,530 | |
| 69 |
Other consumer | |
| — | |
| — | |
| — | |
| — | |
| 44 | |
| 1,249 | |
| — |
Total consumer | |
| 291 | |
| 133 | |
| 170 | |
| 594 | |
| 755 | |
| 51,779 | |
| 69 |
| | | | | | | | | | | | | | | | | | | | | |
Total loans | | $ | 1,201 | | $ | 795 | | $ | 2,872 | | $ | 4,868 | | $ | 14,198 | | $ | 651,845 | | $ | 284 |
20
| (in thousands) | 30-59 Days Past Due | 60-89 Days Past Due | 90 Days or Greater Past Due | Total Past Due | Acquired Credit Impaired | Total Loans | Past Due > 90 days and Accruing | |||||||||||||||||||||
| September 30, 2019 | ||||||||||||||||||||||||||||
| Commercial real estate: | ||||||||||||||||||||||||||||
| Construction and land development | $ | 12 | $ | — | $ | — | $ | 12 | $ | 190 | $ | 2,064 | $ | — | ||||||||||||||
| Other commercial real estate | 434 | — | 240 | 674 | 4,859 | 220,022 | 72 | |||||||||||||||||||||
| Total commercial real estate | 446 | — | 240 | 686 | 5,049 | 222,086 | 72 | |||||||||||||||||||||
| Commercial and industrial: | ||||||||||||||||||||||||||||
| Commercial | — | 41 | 750 | 791 | 249 | 40,490 | 387 | |||||||||||||||||||||
| Agricultural | — | — | — | — | — | — | — | |||||||||||||||||||||
| Tax exempt | — | — | — | — | — | 35,073 | — | |||||||||||||||||||||
| Total commercial and industrial | — | 41 | 750 | 791 | 249 | 75,563 | 387 | |||||||||||||||||||||
| Total commercial loans | 446 | 41 | 990 | 1,477 | 5,298 | 297,649 | 459 | |||||||||||||||||||||
| Residential real estate: | ||||||||||||||||||||||||||||
| Residential mortgages | 245 | 519 | 874 | 1,638 | 3,093 | 412,936 | 47 | |||||||||||||||||||||
| Total residential real estate | 245 | 519 | 874 | 1,638 | 3,093 | 412,936 | 47 | |||||||||||||||||||||
| Consumer: | ||||||||||||||||||||||||||||
| Home equity | 356 | 133 | 180 | 669 | 19 | 37,600 | 37 | |||||||||||||||||||||
| Other consumer | — | — | — | — | — | 985 | — | |||||||||||||||||||||
| Total consumer | 356 | 133 | 180 | 669 | 19 | 38,585 | 37 | |||||||||||||||||||||
| Total loans | $ | 1,047 | $ | 693 | $ | 2,044 | $ | 3,784 | $ | 8,410 | $ | 749,170 | $ | 543 | ||||||||||||||
Business Activities Loans
| | | | | | | | | | | | | | | | | | | | | |
| ` | | | | | 90 Days or | | | | | | | | | | Past Due > | |||||
|
| 30-59 Days |
| 60-89 Days |
| Greater |
| Total Past |
| | |
| | |
| 90 days and | |||||
(in thousands) | | Past Due | | Past Due | | Past Due | | Due | | Current | | Total Loans | | Accruing | |||||||
December 31, 2019 |
| |
|
| |
|
| |
|
| |
|
| |
|
| |
|
| |
|
Commercial real estate: |
| |
|
| |
|
| |
|
| |
|
| |
|
| |
|
| |
|
Construction and land development | | $ | 205 | | $ | 53 | | $ | — | | $ | 258 | | $ | 31,129 | | $ | 31,387 | | $ | — |
Other commercial real estate | |
| 40 | |
| 1,534 | |
| 1,810 | |
| 3,384 | |
| 662,667 | |
| 666,051 | |
| — |
Total commercial real estate | |
| 245 | |
| 1,587 | |
| 1,810 | |
| 3,642 | |
| 693,796 | |
| 697,438 | |
| — |
| | | | | | | | | | | | | | | | | | | | | |
Commercial and industrial: | |
|
| |
|
| |
|
| |
|
| |
|
| |
|
| |
|
|
Commercial | |
| 452 | |
| 50 | |
| 894 | |
| 1,396 | |
| 238,296 | |
| 239,692 | |
| — |
Agricultural | |
| 62 | |
| 34 | |
| 96 | |
| 192 | |
| 19,826 | |
| 20,018 | |
| — |
Tax exempt | |
| — | |
| — | |
| — | |
| — | |
| 66,860 | |
| 66,860 | |
| — |
Total commercial and industrial | |
| 514 | |
| 84 | |
| 990 | |
| 1,588 | |
| 324,982 | |
| 326,570 | |
| — |
| | | | | | | | | | | | | | | | | | | | | |
Total commercial loans | |
| 759 | |
| 1,671 | |
| 2,800 | |
| 5,230 | |
| 1,018,778 | |
| 1,024,008 | |
| — |
| | | | | | | | | | | | | | | | | | | | | |
Residential real estate: | |
|
| |
|
| |
|
| |
|
| |
|
| |
|
| |
|
|
Residential mortgages | |
| 7,293 | |
| 1,243 | |
| 668 | |
| 9,204 | |
| 731,483 | |
| 740,687 | |
| — |
Total residential real estate | |
| 7,293 | |
| 1,243 | |
| 668 | |
| 9,204 | |
| 731,483 | |
| 740,687 | |
| — |
| | | | | | | | | | | | | | | | | | | | | |
Consumer: | |
|
| |
|
| |
|
| |
|
| |
|
| |
|
| |
|
|
Home equity | |
| 597 | |
| 43 | |
| 429 | |
| 1,069 | |
| 58,299 | |
| 59,368 | |
| 50 |
Other consumer | |
| 36 | |
| 12 | |
| — | |
| 48 | |
| 11,119 | |
| 11,167 | |
| — |
Total consumer | |
| 633 | |
| 55 | |
| 429 | |
| 1,117 | |
| 69,418 | |
| 70,535 | ��� |
| 50 |
| | | | | | | | | | | | | | | | | | | | | |
Total loans | | $ | 8,685 | | $ | 2,969 | | $ | 3,897 | | $ | 15,551 | | $ | 1,819,679 | | $ | 1,835,230 | | $ | 50 |
21
| (in thousands) | 30-59 Days Past Due | 60-89 Days Past Due | 90 Days or Greater Past Due | Total Past Due | Current | Total Loans | Past Due > 90 days and Accruing | |||||||||||||||||||||
| December 31, 2018 | ||||||||||||||||||||||||||||
| Commercial real estate: | ||||||||||||||||||||||||||||
| Construction and land development | $ | — | $ | — | $ | — | $ | — | $ | 23,754 | $ | 23,754 | $ | — | ||||||||||||||
| Other commercial real estate | 1,146 | — | 6,725 | 7,871 | 548,109 | 555,980 | — | |||||||||||||||||||||
| Total commercial real estate | 1,146 | — | 6,725 | 7,871 | 571,863 | 579,734 | — | |||||||||||||||||||||
| Commercial and industrial: | ||||||||||||||||||||||||||||
| Commercial | 395 | 60 | 402 | 857 | 233,900 | 234,757 | 50 | |||||||||||||||||||||
| Agricultural | 65 | 6 | 25 | 96 | 22,221 | 22,317 | — | |||||||||||||||||||||
| Tax exempt | — | — | — | — | 56,588 | 56,588 | — | |||||||||||||||||||||
| Total commercial and industrial | 460 | 66 | 427 | 953 | 312,709 | 313,662 | 50 | |||||||||||||||||||||
| Total commercial loans | 1,606 | 66 | 7,152 | 8,824 | 884,572 | 893,396 | 50 | |||||||||||||||||||||
| Residential real estate: | ||||||||||||||||||||||||||||
| Residential mortgages | 3,565 | 641 | 1,309 | 5,515 | 664,674 | 670,189 | — | |||||||||||||||||||||
| Total residential real estate | 3,565 | 641 | 1,309 | 5,515 | 664,674 | 670,189 | — | |||||||||||||||||||||
| Consumer: | ||||||||||||||||||||||||||||
| Home equity | 72 | — | — | 72 | 57,826 | 57,898 | — | |||||||||||||||||||||
| Other consumer | 17 | — | 11 | 28 | 9,386 | 9,414 | — | |||||||||||||||||||||
| Total consumer | 89 | — | 11 | 100 | 67,212 | 67,312 | — | |||||||||||||||||||||
| Total loans | $ | 5,260 | $ | 707 | $ | 8,472 | $ | 14,439 | $ | 1,616,458 | $ | 1,630,897 | $ | 50 | ||||||||||||||
Acquired Loans
| | | | | | | | | | | | | | | | | | | | | |
|
| | |
| | |
| 90 Days or |
| | |
| Acquired |
| | |
| Past Due > | |||
| | 30-59 Days | | 60-89 Days | | Greater | | Total Past | | Credit | | | | | 90 days and | ||||||
(in thousands) | | Past Due | | Past Due | | Past Due | | Due | | Impaired | | Total Loans | | Accruing | |||||||
December 31, 2019 |
| |
|
| |
|
| |
|
| |
|
| |
|
| |
|
| |
|
Commercial real estate: |
| |
|
| |
|
| |
|
| |
|
| |
|
| |
|
| |
|
Construction and land development | | $ | — | | $ | 12 | | $ | — | | $ | 12 | | $ | 384 | | $ | 2,903 | | $ | — |
Other commercial real estate | |
| 2,029 | |
| 245 | |
| 231 | |
| 2,505 | |
| 8,289 | |
| 230,320 | |
| — |
Total commercial real estate | |
| 2,029 | |
| 257 | |
| 231 | |
| 2,517 | |
| 8,673 | |
| 233,223 | |
| — |
| | | | | | | | | | | | | | | | | | | | | |
Commercial and industrial: | |
|
| |
|
| |
|
| |
|
| |
|
| |
|
| |
|
|
Commercial | |
| 440 | |
| 335 | |
| 140 | |
| 915 | |
| 2,723 | |
| 59,072 | |
| — |
Agricultural | |
| — | |
| — | |
| — | |
| — | |
| 173 | |
| 206 | |
| — |
Tax exempt | |
| — | |
| — | |
| — | |
| — | |
| 36 | |
| 37,443 | |
| — |
Total commercial and industrial | |
| 440 | |
| 335 | |
| 140 | |
| 915 | |
| 2,932 | |
| 96,721 | |
| — |
| | | | | | | | | | | | | | | | | | | | | |
Total commercial loans | |
| 2,469 | |
| 592 | |
| 371 | |
| 3,432 | |
| 11,605 | |
| 329,944 | |
| — |
| | | | | | | | | | | | | | | | | | | | | |
Residential real estate: | |
|
| |
|
| |
|
| |
|
| |
|
| |
|
| |
|
|
Residential mortgages | |
| 3,185 | |
| 864 | |
| 1,015 | |
| 5,064 | |
| 5,591 | |
| 411,170 | |
| — |
Total residential real estate | |
| 3,185 | |
| 864 | |
| 1,015 | |
| 5,064 | |
| 5,591 | |
| 411,170 | |
| — |
| | | | | | | | | | | | | | | | | | | | | |
Consumer: | |
|
| |
|
| |
|
| |
|
| |
|
| |
|
| |
|
|
Home equity | |
| 208 | |
| 548 | |
| 217 | |
| 973 | |
| 1,291 | |
| 63,033 | |
| 217 |
Other consumer | |
| 2 | |
| 9 | |
| — | |
| 11 | |
| 66 | |
| 1,715 | |
| — |
Total consumer | |
| 210 | |
| 557 | |
| 217 | |
| 984 | |
| 1,357 | |
| 64,748 | |
| 217 |
| | | | | | | | | | | | | | | | | | | | | |
Total loans | | $ | 5,864 | | $ | 2,013 | | $ | 1,603 | | $ | 9,480 | | $ | 18,553 | | $ | 805,862 | | $ | 217 |
22
| (in thousands) | 30-59 Days Past Due | 60-89 Days Past Due | 90 Days or Greater Past Due | Total Past Due | Acquired Credit Impaired | Total Loans | Past Due > 90 days and Accruing | |||||||||||||||||||||
| December 31, 2018 | ||||||||||||||||||||||||||||
| Commercial real estate: | ||||||||||||||||||||||||||||
| Construction and land development | $ | — | $ | — | $ | — | $ | — | $ | 164 | $ | 2,890 | $ | — | ||||||||||||||
| Other commercial real estate | 631 | 99 | 211 | 941 | 6,143 | 244,075 | — | |||||||||||||||||||||
| Total commercial real estate | 631 | 99 | 211 | 941 | 6,307 | 246,965 | — | |||||||||||||||||||||
| Commercial and industrial: | ||||||||||||||||||||||||||||
| Commercial | 149 | 26 | 494 | 669 | 679 | 52,470 | — | |||||||||||||||||||||
| Agricultural | — | — | — | — | — | — | — | |||||||||||||||||||||
| Tax exempt | — | — | — | — | — | 38,738 | — | |||||||||||||||||||||
| Total commercial and industrial | 149 | 26 | 494 | 669 | 679 | 91,208 | — | |||||||||||||||||||||
| Total commercial loans | 780 | 125 | 705 | 1,610 | 6,986 | 338,173 | — | |||||||||||||||||||||
| Residential real estate: | ||||||||||||||||||||||||||||
| Residential mortgages | 3,419 | 254 | 1,792 | 5,465 | 3,095 | 474,509 | — | |||||||||||||||||||||
| Total residential real estate | 3,419 | 254 | 1,792 | 5,465 | 3,095 | 474,509 | — | |||||||||||||||||||||
| Consumer: | ||||||||||||||||||||||||||||
| Home equity | 198 | — | 66 | 264 | 22 | 45,291 | 7 | |||||||||||||||||||||
| Other consumer | 17 | — | — | 17 | 3 | 1,357 | 189 | |||||||||||||||||||||
| Total consumer | 215 | — | 66 | 281 | 25 | 46,648 | 196 | |||||||||||||||||||||
| Total loans | $ | 4,414 | $ | 379 | $ | 2,563 | $ | 7,356 | $ | 10,106 | $ | 859,330 | $ | 196 | ||||||||||||||
The following is summary information pertaining to non-accrual loans at September 30, 20192020 and December 31, 2018:
| | | | | | | | | | | | | | | | | | |
| | September 30, 2020 | | December 31, 2019 | ||||||||||||||
|
| Business |
| | |
| | |
| Business |
| | |
| | | ||
| | Activities | | Acquired | | | | | Activities | | Acquired | | | | ||||
(in thousands) |
| Loans |
| Loans | | Total |
| Loans |
| Loans | | Total | ||||||
Commercial real estate: |
| |
|
| |
|
| |
|
| |
|
| |
|
| |
|
Construction and land development | | $ | 212 | | $ | 0 | | $ | 212 | | $ | 258 | | $ | 0 | | $ | 258 |
Other commercial real estate | |
| 1,818 | |
| 2,684 | |
| 4,502 | |
| 2,888 | |
| 343 | |
| 3,231 |
Total commercial real estate | |
| 2,030 | |
| 2,684 | |
| 4,714 | |
| 3,146 | |
| 343 | |
| 3,489 |
| | | | | | | | | | | | | | | | | | |
Commercial and industrial: | |
|
| |
|
| |
|
| |
|
| |
|
| |
|
|
Commercial | |
| 918 | |
| 416 | |
| 1,334 | |
| 932 | |
| 626 | |
| 1,558 |
Agricultural | |
| 486 | |
| 0 | |
| 486 | |
| 278 | |
| 0 | |
| 278 |
Tax exempt | |
| 0 | |
| 0 | |
| 0 | |
| 0 | |
| 0 | |
| 0 |
Total commercial and industrial | |
| 1,404 | |
| 416 | |
| 1,820 | |
| 1,210 | |
| 626 | |
| 1,836 |
| | | | | | | | | | | | | | | | | | |
Total commercial loans | |
| 3,434 | |
| 3,100 | |
| 6,534 | |
| 4,356 | |
| 969 | |
| 5,325 |
| | | | | | | | | | | | | | | | | | |
Residential real estate: | |
|
| |
|
| |
|
| |
|
| |
|
| |
|
|
Residential mortgages | |
| 3,864 | |
| 3,290 | |
| 7,154 | |
| 3,362 | |
| 1,973 | |
| 5,335 |
Total residential real estate | |
| 3,864 | |
| 3,290 | |
| 7,154 | |
| 3,362 | |
| 1,973 | |
| 5,335 |
| | | | | | | | | | | | | | | | | | |
Consumer: | |
|
| |
|
| |
|
| |
|
| |
|
| |
|
|
Home equity | |
| 450 | |
| 255 | |
| 705 | |
| 615 | |
| 254 | |
| 869 |
Other consumer | |
| 15 | |
| 0 | |
| 15 | |
| 21 | |
| 0 | |
| 21 |
Total consumer | |
| 465 | |
| 255 | |
| 720 | |
| 636 | |
| 254 | |
| 890 |
| | | | | | | | | | | | | | | | | | |
Total loans | | $ | 7,763 | | $ | 6,645 | | $ | 14,408 | | $ | 8,354 | | $ | 3,196 | | $ | 11,550 |
23
| September 30, 2019 | December 31, 2018 | |||||||||||||||||||||||
| (in thousands) | Business Activities Loans | Acquired Loans | Total | Business Activities Loans | Acquired Loans | Total | ||||||||||||||||||
| Commercial real estate: | ||||||||||||||||||||||||
| Construction and land development | $ | 1 | $ | — | $ | 1 | $ | 1 | $ | — | $ | 1 | ||||||||||||
| Other commercial real estate | 8,172 | 346 | 8,518 | 7,873 | 282 | 8,155 | ||||||||||||||||||
| Total commercial real estate | 8,173 | 346 | 8,519 | 7,874 | 282 | 8,156 | ||||||||||||||||||
| Commercial and industrial: | ||||||||||||||||||||||||
| Commercial | 1,268 | 575 | 1,843 | 1,423 | 643 | 2,066 | ||||||||||||||||||
| Agricultural | 234 | — | 234 | 265 | — | 265 | ||||||||||||||||||
| Tax exempt | — | — | — | — | — | — | ||||||||||||||||||
| Total commercial and industrial | 1,502 | 575 | 2,077 | 1,688 | 643 | 2,331 | ||||||||||||||||||
| Total commercial loans | 9,675 | 921 | 10,596 | 9,562 | 925 | 10,487 | ||||||||||||||||||
| Residential real estate: | ||||||||||||||||||||||||
| Residential mortgages | 3,277 | 2,063 | 5,340 | 4,213 | 2,997 | 7,210 | ||||||||||||||||||
| Total residential real estate | 3,277 | 2,063 | 5,340 | 4,213 | 2,997 | 7,210 | ||||||||||||||||||
| Consumer: | ||||||||||||||||||||||||
| Home equity | 564 | 154 | 718 | 246 | 201 | 447 | ||||||||||||||||||
| Other consumer | 25 | — | 25 | 90 | 1 | 91 | ||||||||||||||||||
| Total consumer | 589 | 154 | 743 | 336 | 202 | 538 | ||||||||||||||||||
| Total loans | $ | 13,541 | $ | 3,138 | $ | 16,679 | $ | 14,111 | $ | 4,124 | $ | 18,235 | ||||||||||||
Loans evaluated for impairment as of September 30, 20192020 and December 31, 20182019 are, as follows:
Business Activities Loans
| (in thousands) | Commercial real estate | Commercial and industrial | Residential real estate | Consumer | Total | |||||||||||||||
| September 30, 2019 | ||||||||||||||||||||
| Balance at end of period | ||||||||||||||||||||
| Individually evaluated for impairment | $ | 8,759 | $ | 1,323 | $ | 2,643 | $ | 13 | $ | 12,738 | ||||||||||
| Collectively evaluated | 692,928 | 325,820 | 727,873 | 68,777 | 1,815,398 | |||||||||||||||
| Total | $ | 701,687 | $ | 327,143 | $ | 730,516 | $ | 68,790 | $ | 1,828,136 | ||||||||||
| | | | | | | | | | | | | | | |
| | Commercial | | Commercial | | Residential | | | | | | | |||
(in thousands) |
| real estate |
| and industrial |
| real estate |
| Consumer |
| Total | |||||
September 30, 2020 |
| |
|
| |
|
| |
|
| |
|
| |
|
Balance at end of period |
| |
|
| |
|
| |
|
| |
|
| |
|
Individually evaluated for impairment | | $ | 2,586 | | $ | 1,274 | | $ | 2,233 | | $ | 12 | | $ | 6,105 |
Collectively evaluated | |
| 849,812 | |
| 439,847 | |
| 693,533 | |
| 67,549 | |
| 2,050,741 |
Total | | $ | 852,398 | | $ | 441,121 | | $ | 695,766 | | $ | 67,561 | | $ | 2,056,846 |
Acquired Loans
| (in thousands) | Commercial real estate | Commercial and industrial | Residential real estate | Consumer | Total | |||||||||||||||
| September 30, 2019 | ||||||||||||||||||||
| Balance at end of period | ||||||||||||||||||||
| Individually evaluated for impairment | $ | 257 | $ | 414 | $ | 973 | $ | — | $ | 1,644 | ||||||||||
| Purchased credit impaired | 5,049 | 249 | 3,093 | 19 | 8,410 | |||||||||||||||
| Collectively evaluated | 216,780 | 74,900 | 408,870 | 38,566 | 739,116 | |||||||||||||||
| Total | $ | 222,086 | $ | 75,563 | $ | 412,936 | $ | 38,585 | $ | 749,170 | ||||||||||
| | | | | | | | | | | | | | | |
|
| Commercial |
| Commercial |
| Residential |
| | |
| | | |||
(in thousands) | | real estate | | and industrial | | real estate | | Consumer | | Total | |||||
September 30, 2020 |
| |
|
| |
|
| |
|
| |
|
| |
|
Balance at end of period |
| |
|
| |
|
| |
|
| |
|
| |
|
Individually evaluated for impairment | | $ | 2,358 | | $ | 322 | | $ | 832 | | $ | — | | $ | 3,512 |
Purchased credit impaired | |
| 7,448 | |
| 1,338 | |
| 4,657 | |
| 755 | |
| 14,198 |
Collectively evaluated | |
| 183,431 | |
| 79,729 | |
| 319,951 | |
| 51,024 | |
| 634,135 |
Total | | $ | 193,237 | | $ | 81,389 | | $ | 325,440 | | $ | 51,779 | | $ | 651,845 |
Business Activities Loans
| | | | | | | | | | | | | | | |
|
| Commercial |
| Commercial |
| Residential |
| | |
| | | |||
(in thousands) | | real estate | | and industrial | | real estate | | Consumer | | Total | |||||
December 31, 2019 |
| |
|
| |
|
| |
|
| |
|
| |
|
Balance at end of period |
| |
|
| |
|
| |
|
| |
|
| |
|
Individually evaluated for impairment | | $ | 3,964 | | $ | 1,353 | | $ | 2,620 | | $ | 13 | | $ | 7,950 |
Collectively evaluated | |
| 693,474 | |
| 325,217 | |
| 738,067 | |
| 70,522 | |
| 1,827,280 |
Total | | $ | 697,438 | | $ | 326,570 | | $ | 740,687 | | $ | 70,535 | | $ | 1,835,230 |
Acquired Loans
| | | | | | | | | | | | | | | |
|
| Commercial |
| Commercial |
| Residential |
| | |
| | | |||
(in thousands) | | real estate | | and industrial | | real estate | | Consumer | | Total | |||||
December 31, 2019 |
| |
|
| |
|
| |
|
| |
|
| |
|
Balance at end of period |
| |
|
| |
|
| |
|
| |
|
| |
|
Individually evaluated for impairment | | $ | 258 | | $ | 385 | | $ | 1,032 | | $ | — | | $ | 1,675 |
Purchased credit impaired | |
| 8,673 | |
| 2,932 | |
| 5,591 | |
| 1,357 | |
| 18,553 |
Collectively evaluated | |
| 224,292 | |
| 93,404 | |
| 404,547 | |
| 63,391 | |
| 785,634 |
Total | | $ | 233,223 | | $ | 96,721 | | $ | 411,170 | | $ | 64,748 | | $ | 805,862 |
24
| (in thousands) | Commercial real estate | Commercial and industrial | Residential real estate | Consumer | Total | |||||||||||||||
| December 31, 2018 | ||||||||||||||||||||
| Balance at end of period | ||||||||||||||||||||
| Individually evaluated for impairment | $ | 9,835 | $ | 1,445 | $ | 2,562 | $ | 13 | $ | 13,855 | ||||||||||
| Collectively evaluated | 569,899 | 312,217 | 667,627 | 67,299 | 1,617,042 | |||||||||||||||
| Total | $ | 579,734 | $ | 313,662 | $ | 670,189 | $ | 67,312 | $ | 1,630,897 | ||||||||||
| (in thousands) | Commercial real estate | Commercial and industrial | Residential real estate | Consumer | Total | |||||||||||||||
| December 31, 2018 | ||||||||||||||||||||
| Balance at end of period | ||||||||||||||||||||
| Individually evaluated for impairment | $ | 188 | $ | 426 | $ | 744 | $ | — | $ | 1,358 | ||||||||||
| Purchased credit impaired | 6,307 | 679 | 3,095 | 25 | 10,106 | |||||||||||||||
| Collectively evaluated | 240,470 | 90,103 | 470,670 | 46,623 | 847,866 | |||||||||||||||
| Total | $ | 246,965 | $ | 91,208 | $ | 474,509 | $ | 46,648 | $ | 859,330 | ||||||||||
Business Activities Loans
| | | | | | | | | |
| | September 30, 2020 | |||||||
|
| Recorded |
| Unpaid Principal |
| Related | |||
(in thousands) | | Investment |
| Balance | | Allowance | |||
With no related allowance: |
| |
|
| |
|
| |
|
Construction and land development | | $ | 0 | | $ | 0 | | $ | 0 |
Other commercial real estate | |
| 1,941 | |
| 2,020 | |
| 0 |
Commercial | |
| 678 | |
| 773 | |
| 0 |
Agricultural | |
| 155 | |
| 158 | |
| 0 |
Tax exempt loans | |
| 0 | |
| 0 | |
| 0 |
Residential real estate | |
| 1,555 | |
| 1,649 | |
| 0 |
Home equity | |
| 0 | |
| 0 | |
| 0 |
Other consumer | |
| 0 | |
| 0 | |
| 0 |
| | | | | | | | | |
With an allowance recorded: | |
|
| |
|
| |
|
|
Construction and land development | | | 210 | | | 210 | | | 158 |
Other commercial real estate | | | 435 | | | 503 | | | 185 |
Commercial | | | 216 | | | 216 | | | 18 |
Agricultural | | | 225 | | | 361 | | | 225 |
Tax exempt loans | | | 0 | | | 0 | | | 0 |
Residential real estate | | | 678 | | | 725 | | | 45 |
Home equity | | | 12 | | | 12 | | | 1 |
Other consumer | | | 0 | | | 0 | | | 0 |
| | | | | | | | | |
Total | | |
| | |
| | |
|
Commercial real estate | | | 2,586 | | | 2,733 | | | 343 |
Commercial and industrial | |
| 1,274 | |
| 1,508 | |
| 243 |
Residential real estate | |
| 2,233 | |
| 2,374 | |
| 45 |
Consumer | |
| 12 | |
| 12 | |
| 1 |
Total impaired loans | | $ | 6,105 | | $ | 6,627 | | $ | 632 |
25
Acquired Loans
| | | | | | | | | |
| | September 30, 2020 | |||||||
|
| Recorded |
| Unpaid Principal |
| Related | |||
(in thousands) | | Investment |
| Balance | | Allowance | |||
With no related allowance: |
| |
|
| |
|
| |
|
Construction and land development | | $ | — | | $ | — | | $ | — |
Other commercial real estate | |
| 1,584 | |
| 1,605 | |
| — |
Commercial | |
| 257 | |
| 353 | |
| — |
Agricultural | |
| — | |
| — | |
| — |
Tax exempt loans | |
| — | |
| — | |
| — |
Residential real estate | |
| 403 | |
| 683 | |
| — |
Home equity | |
| — | |
| — | |
| — |
Other consumer | |
| — | |
| — | |
| — |
| | | | | | | | | |
With an allowance recorded: | |
|
| |
|
| |
|
|
Construction and land development | | | — | | | — | | | — |
Other commercial real estate | | | 774 | | | 793 | | | 297 |
Commercial | | | 65 | | | 67 | | | 7 |
Agricultural | | | — | | | — | | | — |
Tax exempt loans | | | — | | | — | | | — |
Residential real estate | | | 429 | | | 522 | | | 52 |
Home equity | | | — | | | — | | | — |
Other consumer | | | — | | | — | | | — |
| | | | | | | | | |
Total | | |
| | |
| | |
|
Commercial real estate | | | 2,358 | | | 2,398 | | | 297 |
Commercial and industrial | |
| 322 | |
| 420 | |
| 7 |
Residential real estate | |
| 832 | |
| 1,205 | |
| 52 |
Consumer | |
| — | |
| — | |
| — |
Total impaired loans | | $ | 3,512 | | $ | 4,023 | | $ | 356 |
26
| September 30, 2019 | ||||||||||||
| (in thousands) | Recorded Investment | Unpaid Principal Balance | Related Allowance | |||||||||
| With no related allowance: | ||||||||||||
| Construction and land development | $ | — | $ | — | $ | — | ||||||
| Other commercial real estate | 5,634 | 5,675 | — | |||||||||
| Commercial | 657 | 713 | — | |||||||||
| Agricultural | — | — | — | |||||||||
| Tax exempt loans | — | — | — | |||||||||
| Residential real estate | 2,082 | 2,236 | — | |||||||||
| Home equity | — | — | — | |||||||||
| Other consumer | — | — | — | |||||||||
| With an allowance recorded: | ||||||||||||
| Construction and land development | $ | 1 | $ | 1 | $ | 1 | ||||||
| Other commercial real estate | 3,124 | 3,262 | 989 | |||||||||
| Commercial | 666 | 694 | 240 | |||||||||
| Agricultural | — | — | — | |||||||||
| Tax exempt loans | — | — | — | |||||||||
| Residential real estate | 561 | 594 | 66 | |||||||||
| Home equity | 13 | 13 | 1 | |||||||||
| Other consumer | — | — | — | |||||||||
| Total | ||||||||||||
| Commercial real estate | $ | 8,759 | $ | 8,938 | $ | 990 | ||||||
| Commercial and industrial | 1,323 | 1,407 | 240 | |||||||||
| Residential real estate | 2,643 | 2,830 | 66 | |||||||||
| Consumer | 13 | 13 | 1 | |||||||||
| Total impaired loans | $ | 12,738 | $ | 13,188 | $ | 1,297 | ||||||
| September 30, 2019 | ||||||||||||
| (in thousands) | Recorded Investment | Unpaid Principal Balance | Related Allowance | |||||||||
| With no related allowance: | ||||||||||||
| Construction and land development | $ | — | $ | — | $ | — | ||||||
| Other commercial real estate | 90 | 90 | — | |||||||||
| Commercial | 414 | 508 | — | |||||||||
| Agricultural | — | — | — | |||||||||
| Tax exempt loans | — | — | — | |||||||||
| Residential real estate | 616 | 852 | — | |||||||||
| Home equity | — | — | — | |||||||||
| Other consumer | — | — | — | |||||||||
| With an allowance recorded: | ||||||||||||
| Construction and land development | $ | — | $ | — | $ | — | ||||||
| Other commercial real estate | 167 | 168 | 12 | |||||||||
| Commercial | — | — | — | |||||||||
| Agricultural | — | — | — | |||||||||
| Tax exempt loans | — | — | — | |||||||||
| Residential real estate | 357 | 376 | 32 | |||||||||
| Home equity | — | — | — | |||||||||
| Other consumer | — | — | — | |||||||||
| Total | ||||||||||||
| Commercial real estate | $ | 257 | $ | 258 | $ | 12 | ||||||
| Commercial and industrial | 414 | 508 | — | |||||||||
| Residential real estate | 973 | 1,228 | 32 | |||||||||
| Consumer | — | — | — | |||||||||
| Total impaired loans | $ | 1,644 | $ | 1,994 | $ | 44 | ||||||
Business Activities Loans
| | | | | | | | | |
| | December 31, 2019 | |||||||
|
| Recorded |
| Unpaid Principal |
| Related | |||
(in thousands) |
| Investment |
| Balance |
| Allowance | |||
With no related allowance: |
| |
|
| |
|
| |
|
Construction and land development | | $ | — | | $ | — | | $ | — |
Other commercial real estate | |
| 1,911 | |
| 1,957 | |
| — |
Commercial | |
| 710 | |
| 773 | |
| — |
Agricultural | |
| 361 | |
| 361 | |
| — |
Tax exempt loans | |
| — | |
| — | |
| — |
Residential real estate | |
| 2,067 | |
| 2,227 | |
| — |
Home equity | |
| — | |
| — | |
| — |
Other consumer | |
| — | |
| — | |
| — |
| | | | | | | | | |
With an allowance recorded: | |
|
| |
|
| |
|
|
Construction and land development | | | 258 | | | 258 | | | 205 |
Other commercial real estate | | | 1,795 | | | 1,940 | | | 1,026 |
Commercial | | | 282 | | | 289 | | | 164 |
Agricultural | | | — | | | — | | | — |
Tax exempt loans | | | — | | | — | | | — |
Residential real estate | | | 553 | | | 590 | | | 57 |
Home equity | | | 13 | | | 13 | | | — |
Other consumer | | | — | | | — | | | — |
| | | | | | | | | |
Total | | |
| | |
| | |
|
Commercial real estate | | | 3,964 | | | 4,155 | | | 1,231 |
Commercial and industrial | |
| 1,353 | |
| 1,423 | | | 164 |
Residential real estate | |
| 2,620 | |
| 2,817 | |
| 57 |
Consumer | |
| 13 | |
| 13 | |
| — |
Total impaired loans | | $ | 7,950 | | $ | 8,408 | | $ | 1,452 |
27
Acquired Loans
| | | | | | | | | |
| | December 31, 2019 | |||||||
|
| Recorded |
| Unpaid Principal |
| Related | |||
(in thousands) |
| Investment |
| Balance |
| Allowance | |||
With no related allowance: |
| |
|
| |
|
| |
|
Construction and land development | | $ | — | | $ | — | | $ | — |
Other commercial real estate | |
| 90 | |
| 90 | |
| — |
Commercial | |
| 385 | |
| 481 | |
| — |
Agricultural | |
| — | |
| — | |
| — |
Tax exempt | |
| — | |
| — | |
| — |
Residential mortgages | |
| 678 | |
| 938 | |
| — |
Home equity | |
| — | |
| — | |
| — |
Other consumer | |
| — | |
| — | |
| — |
| | | | | | | | | |
With an allowance recorded: | |
|
| |
|
| |
|
|
Construction and land development | | | — | | | — | | | — |
Other commercial real estate | | | 168 | | | 168 | | | 12 |
Commercial | | | — | | | — | | | — |
Agricultural | | | — | | | — | | | — |
Tax exempt | | | — | | | — | | | — |
Residential mortgages | | | 354 | | | 376 | | | 49 |
Home equity | | | — | | | — | | | — |
Other consumer | | | — | | | — | | | — |
| | | | | | | | | |
Total | | |
| | |
| | |
|
Commercial real estate | | | 258 | | | 258 | | | 12 |
Commercial and industrial | |
| 385 | |
| 481 | |
| — |
Residential real estate | |
| 1,032 | |
| 1,314 | |
| 49 |
Consumer | |
| — | |
| — | |
| — |
Total impaired loans | | $ | 1,675 | | $ | 2,053 | | $ | 61 |
28
| December 31, 2018 | ||||||||||||
| (in thousands) | Recorded Investment | Unpaid Principal Balance | Related Allowance | |||||||||
| With no related allowance: | ||||||||||||
| Construction and land development | $ | — | $ | — | $ | — | ||||||
| Other commercial real estate | 8,209 | 8,301 | — | |||||||||
| Commercial | 649 | 669 | — | |||||||||
| Agricultural | — | — | — | |||||||||
| Tax exempt loans | — | — | — | |||||||||
| Residential real estate | 1,671 | 1,709 | — | |||||||||
| Home equity | — | — | — | |||||||||
| Other consumer | — | — | — | |||||||||
| With an allowance recorded: | ||||||||||||
| Construction and land development | $ | 1 | $ | 1 | $ | 1 | ||||||
| Other commercial real estate | 1,625 | 1,660 | 421 | |||||||||
| Commercial | 796 | 855 | 78 | |||||||||
| Agricultural | — | — | — | |||||||||
| Tax exempt loans | — | — | — | |||||||||
| Residential real estate | 891 | 916 | 111 | |||||||||
| Home equity | 13 | 13 | — | |||||||||
| Other consumer | — | — | — | |||||||||
| Total | ||||||||||||
| Commercial real estate | $ | 9,835 | $ | 9,962 | $ | 422 | ||||||
| Commercial and industrial | 1,445 | 1,524 | 78 | |||||||||
| Residential real estate | 2,562 | 2,625 | 111 | |||||||||
| Consumer | 13 | 13 | — | |||||||||
| Total impaired loans | $ | 13,855 | $ | 14,124 | $ | 611 | ||||||
| December 31, 2018 | ||||||||||||
| (in thousands) | Recorded Investment | Unpaid Principal Balance | Related Allowance | |||||||||
| With no related allowance: | ||||||||||||
| Construction and land development | $ | — | $ | — | $ | — | ||||||
| Other commercial real estate | 188 | 187 | — | |||||||||
| Commercial | 426 | 510 | — | |||||||||
| Agricultural | — | — | — | |||||||||
| Tax exempt | — | — | — | |||||||||
| Residential mortgages | 375 | 524 | — | |||||||||
| Home equity | — | — | — | |||||||||
| Other consumer | — | — | — | |||||||||
| With an allowance recorded: | ||||||||||||
| Construction and land development | $ | — | $ | — | $ | — | ||||||
| Other commercial real estate | — | — | — | |||||||||
| Commercial | — | — | — | |||||||||
| Agricultural | — | — | — | |||||||||
| Tax exempt | — | — | — | |||||||||
| Residential mortgages | 369 | 379 | 41 | |||||||||
| Home equity | — | — | — | |||||||||
| Other consumer | — | — | — | |||||||||
| Total | ||||||||||||
| Commercial real estate | $ | 188 | $ | 187 | $ | — | ||||||
| Commercial and industrial | 426 | 510 | — | |||||||||
| Residential real estate | 744 | 903 | 41 | |||||||||
| Consumer | — | — | — | |||||||||
| Total impaired loans | $ | 1,358 | $ | 1,600 | $ | 41 | ||||||
The following is a summary of the average recorded investment and interest income recognized on impaired loans for the three and nine months ended September 30, 20192020 and 2018:
Business Activities Loans
| | | | | | | | | | | | |
| | Three Months Ended September 30, 2020 | | Three Months Ended September 30, 2019 | ||||||||
|
| Average Recorded |
| Interest |
| Average Recorded |
| Interest | ||||
(in thousands) |
| Investment |
| Income Recognized |
| Investment |
| Income Recognized | ||||
With no related allowance: |
| |
|
| |
|
| |
|
| |
|
Construction and land development | | $ | — | | $ | — | | $ | — | | $ | — |
Other commercial real estate | |
| 1,899 | |
| 14 | |
| 5,528 | |
| 63 |
Commercial | |
| 692 | |
| 1 | |
| 747 | |
| 4 |
Agricultural | |
| 157 | |
| — | |
| — | |
| — |
Tax exempt loans | |
| — | |
| — | |
| — | |
| — |
Residential real estate | |
| 1,547 | |
| 12 | |
| 2,041 | |
| 16 |
Home equity | |
| — | |
| — | |
| — | |
| — |
Other consumer | |
| — | |
| — | |
| — | |
| — |
| | | | | | | | | | | | |
With an allowance recorded: | |
|
| |
|
| |
|
| |
|
|
Construction and land development | | | 205 | | | — | | | 1 | | | — |
Other commercial real estate | | | 429 | | | — | | | 3,217 | | | — |
Commercial | | | 212 | | | 1 | | | 654 | | | — |
Agricultural | | | — | | | — | | | — | | | — |
Tax exempt loans | | | — | | | — | | | — | | | — |
Residential real estate | | | 665 | | | 3 | | | 551 | | | 2 |
Home equity | | | 12 | | | — | | | 12 | | | — |
Other consumer | | | — | | | — | | | — | | | — |
| | | | | | | | | | | | |
Total | | |
| | |
| | |
| | |
|
Commercial real estate | | | 2,533 | | | 14 | | | 8,746 | | | 52 |
Commercial and industrial | | | 1,061 | |
| 2 | | | 1,401 | | | 4 |
Residential real estate | |
| 2,212 | |
| 15 | |
| 2,592 | |
| 18 |
Consumer | |
| 12 | |
| — | |
| 12 | |
| — |
Total impaired loans | | $ | 5,818 | | $ | 31 | | $ | 12,751 | | $ | 74 |
29
Business Activities Loans
| | | | | | | | | | | | |
| | Nine Months Ended September 30, 2020 | | Nine Months Ended September 30, 2019 | ||||||||
|
| Average Recorded |
| Interest |
| Average Recorded |
| Interest | ||||
(in thousands) |
| Investment |
| Income Recognized |
| Investment |
| Income Recognized | ||||
With no related allowance: |
| |
|
| |
|
| |
|
| |
|
Construction and land development | | $ | — | | $ | — | | $ | — | | $ | — |
Other commercial real estate | |
| 1,427 | |
| 14 | |
| 5,466 | |
| 56 |
Commercial | |
| 732 | |
| 2 | |
| 792 | |
| 7 |
Agricultural | |
| 101 | |
| — | |
| — | |
| — |
Tax exempt loans | |
| — | |
| — | |
| — | |
| — |
Residential real estate | |
| 1,581 | |
| 25 | |
| 2,089 | |
| 47 |
Home equity | |
| — | |
| — | |
| — | |
| — |
Other consumer | |
| — | |
| — | |
| — | |
| — |
| | | | | | | | | | | | |
With an allowance recorded: | |
|
| |
|
| |
|
| |
|
|
Construction and land development | | | 208 | | | — | | | 2 | | | — |
Other commercial real estate | | | 452 | | | — | | | 2,972 | | | 29 |
Commercial | | | 97 | | | 2 | | | 497 | | | — |
Agricultural | | | — | | | — | | | — | | | — |
Tax exempt loans | | | — | | | — | | | — | | | — |
Residential real estate | | | 681 | | | 9 | | | 540 | | | 7 |
Home equity | | | 12 | | | — | | | 13 | | | — |
Other consumer | | | — | | | — | | | — | | | — |
| | | | | | | | | | | | |
Total | | |
| | |
| | |
| | |
|
Commercial real estate | | | 2,087 | | | 14 | | | 8,440 | | | 85 |
Commercial and industrial | |
| 930 | | | 4 | | | 1,289 | |
| 7 |
Residential real estate | |
| 2,262 | |
| 34 | | | 2,629 | |
| 54 |
Consumer | |
| 12 | |
| — | | | 13 | |
| — |
Total impaired loans | | $ | 5,291 | | $ | 52 | | $ | 12,371 | | $ | 146 |
30
| Three Months Ended September 30, 2019 | Three Months Ended September 30, 2018 | |||||||||||||||
| (in thousands) | Average Recorded Investment | Interest Income Recognized | Average Recorded Investment | Interest Income Recognized | ||||||||||||
| With no related allowance: | ||||||||||||||||
| Construction and land development | $ | — | $ | — | $ | — | $ | — | ||||||||
| Other commercial real estate | 5,528 | 52 | 6,639 | 31 | ||||||||||||
| Commercial | 747 | 4 | 625 | 2 | ||||||||||||
| Agricultural | — | — | — | — | ||||||||||||
| Tax exempt loans | — | — | — | — | ||||||||||||
| Residential real estate | 2,041 | 16 | 3,955 | 9 | ||||||||||||
| Home equity | — | — | 158 | — | ||||||||||||
| Other consumer | — | — | — | — | ||||||||||||
| With an allowance recorded: | ||||||||||||||||
| Construction and land development | $ | 1 | $ | — | $ | 1 | $ | — | ||||||||
| Other commercial real estate | 3,217 | — | 2,214 | — | ||||||||||||
| Commercial | 654 | — | 788 | — | ||||||||||||
| Agricultural | — | — | — | — | ||||||||||||
| Tax exempt loans | — | — | — | — | ||||||||||||
| Residential real estate | 551 | 2 | 888 | 3 | ||||||||||||
| Home equity | 12 | — | 13 | — | ||||||||||||
| Other consumer | — | — | — | — | ||||||||||||
| Total | ||||||||||||||||
| Commercial real estate | $ | 8,746 | $ | 52 | $ | 8,854 | $ | 31 | ||||||||
| Commercial and industrial | 1,401 | 4 | 1,413 | 2 | ||||||||||||
| Residential real estate | 2,592 | 18 | 4,843 | 12 | ||||||||||||
| Consumer | 12 | — | 171 | — | ||||||||||||
| Total impaired loans | $ | 12,751 | $ | 74 | $ | 15,281 | $ | 45 | ||||||||
Acquired Loans
| | | | | | | | | | | | |
| | Three Months Ended September 30, 2020 | | Three Months Ended September 30, 2019 | ||||||||
| | Average Recorded |
| Interest |
| Average Recorded |
| Interest | ||||
(in thousands) |
| Investment |
| Income Recognized |
| Investment |
| Income Recognized | ||||
With no related allowance: | | |
| | |
| | |
| | |
|
Construction and land development | | $ | — | | $ | — | | $ | — | | $ | — |
Other commercial real estate | |
| 1,566 | |
| — | |
| 88 | |
| — |
Commercial | |
| 264 | |
| — | |
| 395 | |
| — |
Agricultural | |
| — | |
| — | |
| — | |
| — |
Tax exempt loans | |
| — | |
| — | |
| — | |
| — |
Residential real estate | |
| 519 | |
| — | |
| 702 | |
| — |
Home equity | |
| — | |
| — | |
| — | |
| — |
Other consumer | |
| — | |
| — | |
| — | |
| — |
| | | | | | | | | | | | |
With an allowance recorded: | |
|
| |
|
| |
|
| |
|
|
Construction and land development | | | — | | | — | | | — | | | — |
Other commercial real estate | | | 782 | | | 3 | | | 165 | | | — |
Commercial | | | 67 | | | — | | | — | | | — |
Agricultural | | | — | | | — | | | — | | | — |
Tax exempt loans | | | — | | | — | | | — | | | — |
Residential real estate | | | 420 | | | — | | | 352 | | | — |
Home equity | | | — | | | — | | | — | | | — |
Other consumer | | | — | | | — | | | — | | | — |
| | | | | | | | | | | | |
Total | | |
| | |
| | |
| | |
|
Commercial real estate | | | 2,348 | | | 3 | | | 253 | | | — |
Commercial and industrial | |
| 331 | | | — | |
| 395 | |
| — |
Residential real estate | |
| 939 | | | — | |
| 1,054 | |
| — |
Consumer | |
| — | | | — | |
| — | |
| — |
Total impaired loans | | $ | 3,618 | | $ | 3 | | $ | 1,702 | | $ | — |
31
| Nine Months Ended September 30, 2019 | Nine Months Ended September 30, 2018 | |||||||||||||||
| (in thousands) | Average Recorded Investment | Interest Income Recognized | Average Recorded Investment | Interest Income Recognized | ||||||||||||
| With no related allowance: | ||||||||||||||||
| Construction and land development | $ | — | $ | — | $ | — | $ | — | ||||||||
| Other commercial real estate | 5,466 | 56 | 6,204 | 46 | ||||||||||||
| Commercial | 792 | 7 | 628 | 7 | ||||||||||||
| Agricultural | — | — | — | — | ||||||||||||
| Tax exempt loans | — | — | — | — | ||||||||||||
| Residential real estate | 2,089 | 47 | 4,027 | 28 | ||||||||||||
| Home equity | — | — | 236 | — | ||||||||||||
| Other consumer | — | — | — | — | ||||||||||||
| With an allowance recorded: | ||||||||||||||||
| Construction and land development | $ | 2 | $ | — | $ | 1 | $ | — | ||||||||
| Other commercial real estate | 2,972 | 29 | 1,600 | 6 | ||||||||||||
| Commercial | 497 | — | 716 | — | ||||||||||||
| Agricultural | — | — | — | — | ||||||||||||
| Tax exempt loans | — | — | — | — | ||||||||||||
| Residential real estate | 540 | 7 | 800 | 7 | ||||||||||||
| Home equity | 13 | — | 13 | — | ||||||||||||
| Other consumer | — | — | — | — | ||||||||||||
| Total | ||||||||||||||||
| Commercial real estate | $ | 8,440 | $ | 85 | $ | 7,805 | $ | 52 | ||||||||
| Commercial and industrial | 1,289 | 7 | 1,344 | 7 | ||||||||||||
| Residential real estate | 2,629 | 54 | 4,827 | 35 | ||||||||||||
| Consumer | 13 | — | 249 | — | ||||||||||||
| Total impaired loans | $ | 12,371 | $ | 146 | $ | 14,225 | $ | 94 | ||||||||
Acquired Loans
| | | | | | | | | | | | |
| | Nine Months Ended September 30, 2020 | | Nine Months Ended September 30, 2019 | ||||||||
|
| Average Recorded |
| Interest |
| Average Recorded |
| Interest | ||||
(in thousands) |
| Investment |
| Income Recognized |
| Investment |
| Income Recognized | ||||
With no related allowance: |
| |
|
| |
|
| |
|
| |
|
Construction and land development | | $ | — | | $ | — | | $ | — | | $ | — |
Other commercial real estate | |
| 1,097 | |
| — | |
| 89 | |
| — |
Commercial | |
| 318 | |
| — | |
| 429 | |
| — |
Agricultural | |
| — | |
| — | |
| — | |
| — |
Tax exempt loans | |
| — | |
| — | |
| — | |
| — |
Residential real estate | |
| 541 | |
| — | |
| 593 | |
| — |
Home equity | |
| — | |
| — | |
| — | |
| — |
Other consumer | |
| — | |
| — | |
| — | |
| — |
| | | | | | | | | | | | |
With an allowance recorded: | |
|
| |
|
| |
|
| |
|
|
Construction and land development | | | — | | | — | | | — | | | — |
Other commercial real estate | | | 639 | | | 3 | | | 123 | | | — |
Commercial | | | 75 | | | — | | | — | | | — |
Agricultural | | | — | | | — | | | — | | | — |
Tax exempt loans | | | — | | | — | | | — | | | — |
Residential real estate | | | 432 | | | — | | | 361 | | | — |
Home equity | | | — | | | — | | | — | | | — |
Other consumer | | | — | | | — | | | — | | | — |
| | | | | | | | | | | | |
Total | | |
| | |
| | |
| | |
|
Commercial real estate | | | 1,736 | | | 3 | | | 212 | | | — |
Commercial and industrial | |
| 393 | |
| — | | | 429 | | | — |
Residential real estate | |
| 973 | |
| — | | | 954 | |
| — |
Consumer | |
| — | |
| — | |
| — | |
| — |
Total impaired loans | | $ | 3,102 | | $ | 3 | | $ | 1,595 | | $ | — |
32
| Three Months Ended September 30, 2019 | Three Months Ended September 30, 2018 | |||||||||||||||
| (in thousands) | Average Recorded Investment | Interest Income Recognized | Average Recorded Investment | Interest Income Recognized | ||||||||||||
| With no related allowance: | ||||||||||||||||
| Construction and land development | $ | — | $ | — | $ | — | $ | — | ||||||||
| Other commercial real estate | 88 | — | 95 | — | ||||||||||||
| Commercial | 395 | — | 469 | — | ||||||||||||
| Agricultural | — | — | — | — | ||||||||||||
| Tax exempt loans | — | — | — | — | ||||||||||||
| Residential real estate | 702 | — | 276 | — | ||||||||||||
| Home equity | — | — | — | — | ||||||||||||
| Other consumer | — | — | — | — | ||||||||||||
| With an allowance recorded: | ||||||||||||||||
| Construction and land development | $ | — | $ | — | $ | — | $ | — | ||||||||
| Other commercial real estate | 165 | — | — | — | ||||||||||||
| Commercial | — | — | — | — | ||||||||||||
| Agricultural | — | — | — | — | ||||||||||||
| Tax exempt loans | — | — | — | — | ||||||||||||
| Residential real estate | 352 | — | 181 | — | ||||||||||||
| Home equity | — | — | — | — | ||||||||||||
| Other consumer | — | — | — | — | ||||||||||||
| Total | ||||||||||||||||
| Commercial real estate | $ | 253 | $ | — | $ | 95 | $ | — | ||||||||
| Commercial and industrial | 395 | — | 469 | — | ||||||||||||
| Residential real estate | 1,054 | — | 457 | — | ||||||||||||
| Consumer | — | — | — | — | ||||||||||||
| Total impaired loans | $ | 1,702 | $ | — | $ | 1,021 | $ | — | ||||||||
| Nine Months Ended September 30, 2019 | Nine Months Ended September 30, 2018 | |||||||||||||||
| (in thousands) | Average Recorded Investment | Interest Income Recognized | Average Recorded Investment | Interest Income Recognized | ||||||||||||
| With no related allowance: | ||||||||||||||||
| Construction and land development | $ | — | $ | — | $ | — | $ | — | ||||||||
| Other commercial real estate | 89 | — | 97 | 1 | ||||||||||||
| Commercial | 429 | — | 445 | 1 | ||||||||||||
| Agricultural | — | — | — | — | ||||||||||||
| Tax exempt loans | — | — | — | — | ||||||||||||
| Residential real estate | 593 | — | 124 | — | ||||||||||||
| Home equity | — | — | — | — | ||||||||||||
| Other consumer | — | — | — | — | ||||||||||||
| With an allowance recorded: | ||||||||||||||||
| Construction and land development | $ | — | $ | — | $ | — | $ | — | ||||||||
| Other commercial real estate | 123 | — | — | — | ||||||||||||
| Commercial | — | — | — | — | ||||||||||||
| Agricultural | — | — | — | — | ||||||||||||
| Tax exempt loans | — | — | — | — | ||||||||||||
| Residential real estate | 361 | — | 186 | — | ||||||||||||
| Home equity | — | — | — | — | ||||||||||||
| Other consumer | — | — | — | — | ||||||||||||
| Total | ||||||||||||||||
| Commercial real estate | $ | 212 | $ | — | $ | 97 | $ | 1 | ||||||||
| Commercial and industrial | 429 | — | 445 | 1 | ||||||||||||
| Residential real estate | 954 | — | 310 | — | ||||||||||||
| Consumer | — | — | — | — | ||||||||||||
| Total impaired loans | $ | 1,595 | $ | — | $ | 852 | $ | 2 | ||||||||
The Company’s loan portfolio also includes certain loans that have been modified in a Troubled Debt Restructuring ("TDR"), where economic concessions have been granted to borrowers who have experienced or are expected to experience financial difficulties. These concessions typically result from the Company’s loss mitigation activities and could include reductions in the interest rate, payment extensions, forgiveness of principal, forbearance, or other actions. Certain TDRs are classified as non-performing at the time of restructure and may only be returned to performing status after considering the borrower’s sustained repayment performance for a reasonable period, generally six months. TDRs are evaluated individually for impairment and may result in a specific allowance amount allocated to an individual loan.
The following tables include the recorded investment and number of modifications identified during the three and nine months ended September 30, 20192020 and 2018,2019, respectively. The table includes the recorded investment in the loans prior to a modification and also the recorded investment in the loans after the loans were restructured. Modifications may include adjustments to interest rates, payment amounts, extensions of maturity, court ordered concessions or other actions intended to minimize economic loss and avoid foreclosure or repossession of collateral.
| | | | | | | | |
| | Three Months Ended September 30, 2020 | ||||||
| | | | Pre-Modification | | Post-Modification | ||
| | Number of | | Outstanding Recorded | | Outstanding Recorded | ||
(in thousands, except modifications) |
| Modifications |
| Investment |
| Investment | ||
Troubled Debt Restructurings |
|
|
| |
|
| |
|
Agricultural |
| 1 | | $ | 86 | | $ | 86 |
Total |
| 1 | | $ | 86 | | $ | 86 |
| | | | | | | | |
| | Three Months Ended September 30, 2019 | ||||||
| | | | Pre-Modification | | Post-Modification | ||
| | Number of | | Outstanding Recorded | | Outstanding Recorded | ||
(in thousands, except modifications) |
| Modifications |
| Investment |
| Investment | ||
Troubled Debt Restructurings |
|
|
| |
|
| |
|
Other commercial real estate |
| 4 | | $ | 268 | | $ | 267 |
Agricultural |
| 1 | |
| 141 | |
| 141 |
Residential mortgages |
| 2 | |
| 399 | |
| 342 |
Total |
| 7 | | $ | 808 | | $ | 750 |
| | | | | | | | |
| | Nine Months Ended September 30, 2020 | ||||||
| | | | Pre-Modification | | Post-Modification | ||
| | Number of | | Outstanding Recorded | | Outstanding Recorded | ||
(in thousands, except modifications) |
| Modifications |
| Investment |
| Investment | ||
Troubled Debt Restructurings |
|
|
| |
|
| |
|
Other commercial real estate |
| 1 | | $ | 54 | | $ | 247 |
Other commercial |
| 3 | |
| 41 | |
| 162 |
Agricultural | | 1 | | | 86 | | | 86 |
Home equity | | 1 | | | 26 | | | 24 |
Other consumer | | 1 | | | 9 | | | 9 |
Total |
| 7 | | $ | 216 | | $ | 528 |
| | | | | | | | |
| | Nine Months Ended September 30, 2019 | ||||||
| | | | Pre-Modification | | | Post-Modification | |
| | Number of | | Outstanding Recorded | | Outstanding Recorded | ||
(in thousands, except modifications) |
| Modifications |
| Investment |
| Investment | ||
Troubled Debt Restructurings |
|
|
| |
|
| |
|
Other commercial real estate |
| 9 | | $ | 543 | | $ | 529 |
Other commercial |
| 4 | |
| 168 | |
| 91 |
Agricultural |
| 1 | |
| 141 | |
| 141 |
Residential mortgages |
| 11 | |
| 1,133 | |
| 1,034 |
Total |
| 25 | | $ | 1,985 | | $ | 1,795 |
33
| Three Months Ended September 30, 2019 | |||||||||||
| (in thousands, except modifications) | Number of Modifications | Pre-Modification Outstanding Recorded Investment | Post-Modification Outstanding Recorded Investment | ||||||||
| Troubled Debt Restructurings | |||||||||||
| Other commercial real estate | 4 | $ | 268 | $ | 267 | ||||||
| Agricultural | 1 | 141 | 141 | ||||||||
| Residential mortgages | 2 | 399 | 342 | ||||||||
| Total | 7 | $ | 808 | $ | 750 | ||||||
| Three Months Ended September 30, 2018 | |||||||||||
| (in thousands, except modifications) | Number of Modifications | Pre-Modification Outstanding Recorded Investment | Post-Modification Outstanding Recorded Investment | ||||||||
| Troubled Debt Restructurings | |||||||||||
| Construction and land development | 1 | $ | 2 | $ | 1 | ||||||
| Other commercial real estate | 1 | 72 | 72 | ||||||||
| Commercial | 5 | 104 | 60 | ||||||||
| Residential mortgages | 2 | 228 | 225 | ||||||||
| Total | 9 | $ | 406 | $ | 358 | ||||||
| Nine Months Ended September 30, 2019 | |||||||||||
| (in thousands) | Number of Modifications | Pre-Modification Outstanding Recorded Investment | Post-Modification Outstanding Recorded Investment | ||||||||
| Troubled Debt Restructurings | |||||||||||
| Other commercial real estate | 9 | $ | 543 | $ | 529 | ||||||
| Other commercial | 4 | 168 | 91 | ||||||||
| Agricultural | 1 | 141 | 141 | ||||||||
| Residential mortgages | 11 | 1,133 | 1,034 | ||||||||
| Total | 25 | $ | 1,985 | $ | 1,795 | ||||||
| Nine Months Ended September 30, 2018 | |||||||||||
| (in thousands) | Number of Modifications | Pre-Modification Outstanding Recorded Investment | Post-Modification Outstanding Recorded Investment | ||||||||
| Troubled Debt Restructurings | |||||||||||
| Construction and land development | 1 | $ | 2 | $ | 1 | ||||||
| Other commercial real estate | 9 | 1,896 | 1,564 | ||||||||
| Other commercial | 7 | 556 | 486 | ||||||||
| Agricultural | 1 | 167 | — | ||||||||
| Residential mortgages | 15 | 2,752 | 2,168 | ||||||||
| Home equity | 1 | 100 | 100 | ||||||||
| Other consumer | 2 | 5 | 4 | ||||||||
| Total | 36 | $ | 5,478 | $ | 4,323 | ||||||
| Three Months Ended September 30, | ||||||||||||||
| 2019 | 2018 | |||||||||||||
| (in thousands, except modifications) | Number of Modifications | Post-Modification Outstanding Recorded Investment | Number of Modifications | Post-Modification Outstanding Recorded Investment | ||||||||||
| Interest only payments | 2 | $ | 90 | — | $ | — | ||||||||
| Forbearance | 1 | 141 | 1 | 115 | ||||||||||
| Forbearance and interest only payments | 2 | 176 | 3 | 72 | ||||||||||
| Forbearance and maturity concession | — | — | 4 | 143 | ||||||||||
| Forbearance, amortization and maturity concession | 2 | 343 | — | — | ||||||||||
| Maturity concession | — | — | 1 | 28 | ||||||||||
| Total | 7 | $ | 750 | 9 | $ | 358 | ||||||||
| Nine Months Ended September 30, | ||||||||||||||
| 2019 | 2018 | |||||||||||||
| (in thousands, except modifications) | Number of Modifications | Post-Modification Outstanding Recorded Investment | Number of Modifications | Post-Modification Outstanding Recorded Investment | ||||||||||
| Interest rate and maturity concession | — | $ | — | 1 | $ | 16 | ||||||||
| Interest only payments | 2 | 90 | — | — | ||||||||||
| Interest only payments and maturity concession | 2 | 73 | — | — | ||||||||||
| Amortization and maturity concession | 4 | 273 | — | — | ||||||||||
| Amortization, interest rate and maturity concession | 1 | 77 | — | — | ||||||||||
| Forbearance | 3 | 253 | 3 | 271 | ||||||||||
| Forbearance and interest only payments | 5 | 331 | 6 | 121 | ||||||||||
| Forbearance and maturity concession | — | — | 17 | 1,774 | ||||||||||
| Forbearance, amortization and maturity concession | 7 | 640 | — | — | ||||||||||
| Maturity concession | — | — | 2 | 440 | ||||||||||
| Restructure with maturity concession | — | — | 5 | 1,419 | ||||||||||
| Other | 1 | 58 | 2 | 282 | ||||||||||
| Total | 25 | $ | 1,795 | 36 | $ | 4,323 | ||||||||
| | | | | | | | | | |
| | Three Months Ended September 30, | ||||||||
| | 2020 | | 2019 | ||||||
| | | | Post-Modification | | | | Post-Modification | ||
| | | | Outstanding | | | | Outstanding | ||
| | Number of | | Recorded | | Number of | | Recorded | ||
(in thousands, except modifications) |
| Modifications |
| Investment |
| Modifications |
| Investment | ||
Troubled Debt Restructurings | | | | | | | | | | |
Interest only payments |
| — | | $ | — |
| 2 | | $ | 90 |
Forbearance |
| — | | | — |
| 1 | | | 141 |
Forbearance and interest only payments |
| — | |
| — |
| 2 | |
| 176 |
Forbearance, amortization and maturity concession |
| — | |
| — |
| 2 | |
| 343 |
Maturity concession | | 1 | | | 86 | | — | | | — |
Total |
| 1 | | $ | 86 |
| 7 | | $ | 750 |
| | | | | | | | | | |
| | Nine Months Ended September 30, | ||||||||
| | 2020 | | 2019 | ||||||
|
| |
| Post-Modification |
| |
| Post-Modification | ||
| | | | Outstanding | | | | outstanding | ||
| | Number of | | Recorded | | Number of | | Recorded | ||
(in thousands, except modifications) |
| Modifications |
| Investment |
| Modifications |
| Investment | ||
Troubled Debt Restructurings | | | | | | | | | | |
Interest only payments |
| 0 | | $ | 0 | | 2 | | $ | 90 |
Interest only payments and maturity concession |
| 0 | |
| 0 | | 2 | |
| 73 |
Interest rate, forbearance and maturity concession | | 4 | | | 409 | | 0 | | | 0 |
Amortization and maturity concession |
| 0 | |
| 0 | | 4 | |
| 273 |
Amortization, interest rate and maturity concession | | 0 | | | 0 | | 1 | | | 77 |
Forbearance |
| 0 | |
| 0 | | 3 | |
| 253 |
Forbearance and interest only payments | | 1 | | | 24 | | 5 | | | 331 |
Forbearance, amortization and maturity concession |
| 0 | |
| 0 | | 7 | |
| 640 |
Maturity concession |
| 2 | |
| 95 | | 0 | |
| 0 |
Other | | 0 | | | 0 | | 1 | | | 58 |
Total |
| 7 | | $ | 528 | | 25 | | $ | 1,795 |
For the three and nine months ended September 30, 2019,2020, there were no0 loans that were restructured that had subsequently defaulted during the period. The evaluation of certain loans individually for specific impairment includes loans that were previously classified as TDRs or continue to be classified as TDRs.
Modifications in response to COVID-19
The Company began offering short-term loan modifications to assist borrowers during the COVID-19 national emergency. The CARES Act along with a joint agency statement issued by banking agencies, provides that short-term modifications made in response to COVID-19 do not need to be accounted for as a TDR. Accordingly, the Company does not account for such loan modifications as TDRs. See Note 1 - Basis of Presentation for more information.
The Company modified 588 commercial loans totaling $375.0 million and 564 residential loans totaling $98.5 million. As of September 30, 20192020 total outstanding deferrals were $78.7 million, which primarily consist of interest only forbearance. Outstanding deferrals consisted of 110 commercial loans totaling $74.1 million and 86 residential loans totaling $4.6 million.
Foreclosure
As of September 30, 2020 and December 31, 2018,2019, the Company maintained bank-owned residential real estate property with a fair value of $2.5$1.9 million. Additionally, residential mortgage loans collateralized by real estate property that are in the process of foreclosure as of September 30, 20192020 and December 31, 20182019 totaled $931$917 thousand and $1.5 million,$810 thousand, respectively.
34
The Bank sells loans in the secondary market and retains the ability to service many of these loans. The Bank earns fees for the servicing provided. Loans serviced for others are not included in the accompanying consolidated balance sheets. The risks inherent in servicing assets relate primarily to changes in prepayments that result from shifts in interest rates.
Servicing rights activity during the three and nine months ended September 30, 2020 and 2019, included in other assets, was as follows:
| | | | | | | | | | | | |
| | At or for the Three Months Ended September 30, | | At or for the Nine Months Ended September 30, | ||||||||
(in thousands) |
| 2020 |
| 2019 | | 2020 |
| 2019 | ||||
Balance at beginning of year | | $ | 2,939 | | $ | 2,941 | | $ | 3,001 | | $ | 3,086 |
Acquired | |
| — | |
| — | |
| — | |
| — |
Additions | |
| 515 | |
| 106 | |
| 796 | |
| 213 |
Amortization | |
| (220) | |
| (138) | |
| (563) | |
| (390) |
Balance at end of year | | $ | 3,234 | | $ | 2,909 | | $ | 3,234 | | $ | 2,909 |
Total residential loans included held for sale loans of $4.0$23.7 million and $168 thousand$6.5 million at September 30, 20192020 and December 31, 2018,2019, respectively.
35
The allowance for loan losses is maintained at a level considered adequate to provide for an estimate of probable credit losses inherent in the loan portfolio. The allowance is increased by the provision charged to operating expense and reduced by net charge-offs. Loans are charged against the allowance for loan losses when the Company believes collectability has declined to a point where there is a distinct possibility of some loss of principal and interest. While the Company uses the best information available to make the evaluation, future adjustments may be necessary if there are significant changes in conditions.
The allowance is comprised of four4 distinct reserve components: (1) specific reserves related to loans individually evaluated; (2) quantitative reserves related to loans collectively evaluated; (3) qualitative reserves related to loans collectively evaluated; and (4) a temporal estimate is made for incurred loss emergence period for each loan category within the collectively evaluated pools.
A summary of the methodology employed on a quarterly basis with respect to each of these components in order to evaluate the overall adequacy of the Company's allowance for loan losses is as follows:
Specific Reserve for Loans Individually Evaluated
First, the Company identifies loan relationships having aggregate balances in excess of $150 thousand with potential credit weaknesses. Such loan relationships are identified primarily through the Company's analysis of internal loan evaluations, past due loan reports, TDRs and loans adversely classified. Each loan so identified is then individually evaluated for impairment. Loans are considered impaired when, based on current information and events, it is probable that the Company will be unable to collect all amounts due according to the contractual terms of the original loan agreement. Substantially all impaired loans have historically been collateral dependent, meaning repayment of the loan is expected or is considered to be provided solely from the sale of the loan's underlying collateral. For such loans, the Company measures impairment based on the fair value of the loan's collateral, which is generally determined utilizing current appraisals. A specific reserve is established in an amount equal to the excess, if any, of the recorded investment in each impaired loan over the fair value of its underlying collateral, less estimated costs to sell. The Company's policy is to re-evaluate the fair value of collateral dependent loans at least every twelve months unless there is a known deterioration in the collateral's value, in which case a new appraisal is obtained.
Purchase credit impaired (“PCI”) loans are collectively evaluated, but are not included in the general reserve as described below. The evaluation of the PCI loans requires continued quarterly assessment of key assumptions and estimates similar to the initial fair value estimate, including changes in the severity of loss, timing and speed of payments, collateral value changes, expected cash flows and other relevant factors. The quarterly assessment is compared to the initial fair value estimate and a determination is made if an adjustment to the allowance for loan loss is deemed necessary.
Quantitative Reserve for Loans Collectively Evaluated
Second, the Company stratifies the loan portfolio into two2 general business loan pools: substandard (7 risk-rated) and pass-rated (0 to 6 risk-rated) by loan type. Substandard rated loans are subject to higher credit loss rates in the allowance for loan loss calculation. The Company utilizes historical loss rates for commercial real estate and commercial and industrial loans assessed by internal risk rating. Historical loss rates on residential real estate and consumer loans are not risk graded. Residential real estate and consumer loans are considered as part of the pass-rated portfolio unless removed due to specific reserve evaluation based on past due status and/or other indications of credit deterioration. Quantitative reserves relative to each loan pool are established as follows: for all loan segments an allocation equaling 100% of the respective pool's average 3-year historical net loan charge-off rate (determined based upon the most recent 12 quarters) is applied to the aggregate recorded investment in the pool of loans. Purchased performing loans are collectively evaluated as their own separate category within each loan pool.
36
Third, the Company considers the necessity to adjust the average historical net loan charge-off rates relative to each of the above two2 loan pools for potential risks factors that could result in actual losses deviating from prior loss experience. Such qualitative risk factors considered are: (1) lending policies and procedures, (2) business conditions, (3) volume and nature of the loan portfolio, (4) experience, ability and depth of lending management, (5) problem loan trends, (6) quality of the Company’s loan review system, (7) concentrations in the loan portfolio, (8) competition, legal, and regulatory environment and (9) collateral coverage and loan-to-value.
Loss Emergence Period for Loans Collectively Evaluated
Fourth, the general allowance related to loans collectively evaluated includes an estimate of incurred losses over an estimated loss emergence period ("LEP"). The LEP is generated utilizing a charge-off look-back analysis, which evaluates the time from the first indication of elevated risk of repayment (or other early event indicating a problem) to eventual charge-off to support the LEP considered in the allowance calculation. This reserving methodology establishes the approximate number of months of LEP that represents incurred losses for each loan portfolio within each portfolio segment in addition to the qualitative reserves.
Activity in the allowance for loan losses for the three and nine months ended September 30, 20192020 and 20182019 are, as follows:
| | | | | | | | | | | | | | | |
Business Activities Loans | | At or for the Three Months Ended September 30, 2020 | |||||||||||||
|
| Commercial |
| Commercial |
| Residential |
| | |
| | | |||
(in thousands) | | real estate | | and industrial | | real estate | | Consumer | | Total | |||||
Balance at beginning of period | | $ | 8,416 | | $ | 3,241 | | $ | 3,945 | | $ | 376 | | $ | 15,978 |
Charged-off loans | |
| (266) | |
| (4) | |
| — | |
| (146) | |
| (416) |
Recoveries on charged-off loans | |
| 12 | |
| 14 | |
| — | |
| 6 | |
| 32 |
Provision for loan losses | |
| 1,265 | |
| 269 | |
| 104 | |
| 143 | |
| 1,781 |
Balance at end of period | | $ | 9,427 | | $ | 3,520 | | $ | 4,049 | | $ | 379 | | $ | 17,375 |
Individually evaluated for impairment | |
| 343 | |
| 243 | |
| 45 | |
| 1 | |
| 632 |
Collectively evaluated | |
| 9,084 | |
| 3,277 | |
| 4,004 | |
| 378 | |
| 16,743 |
Total | | $ | 9,427 | | $ | 3,520 | | $ | 4,049 | | $ | 379 | | $ | 17,375 |
| | | | | | | | | | | | | | | |
Business Activities Loans | | At or for the Nine Months Ended September 30, 2020 | |||||||||||||
|
| Commercial |
| Commercial |
| Residential |
| | |
| | | |||
(in thousands) | | real estate | | and industrial | | real estate | | Consumer | | Total | |||||
Balance at beginning of period | | $ | 7,668 | | $ | 3,608 | | $ | 3,402 | | $ | 379 | | $ | 15,057 |
Charged-off loans | |
| (1,036) | |
| (307) | |
| (21) | |
| (335) | |
| (1,699) |
Recoveries on charged-off loans | |
| 90 | |
| 16 | |
| — | |
| 5 | |
| 111 |
Provision for loan losses | |
| 2,705 | |
| 203 | |
| 668 | |
| 330 | |
| 3,906 |
Balance at end of period | | $ | 9,427 | | $ | 3,520 | | $ | 4,049 | | $ | 379 | | $ | 17,375 |
Individually evaluated for impairment | |
| 343 | |
| 243 | |
| 45 | |
| 1 | |
| 632 |
Collectively evaluated | |
| 9,084 | |
| 3,277 | |
| 4,004 | |
| 378 | |
| 16,743 |
Total | | $ | 9,427 | | $ | 3,520 | | $ | 4,049 | | $ | 379 | | $ | 17,375 |
| | | | | | | | | | | | | | | |
Acquired Loans | | At or for the Three Months Ended September 30, 2020 | |||||||||||||
|
| Commercial |
| Commercial |
| Residential |
| | |
| | | |||
(in thousands) | | real estate | | and industrial | | real estate | | Consumer | | Total | |||||
Balance at beginning of period | | $ | 401 | | $ | 12 | | $ | 118 | | $ | — | | $ | 531 |
Charged-off loans | |
| — | |
| (20) | |
| — | |
| (3) | |
| (23) |
Recoveries on charged-off loans | |
| 2 | |
| — | |
| 1 | |
| 2 | |
| 5 |
Provision (release) for loan losses | |
| (3) | |
| 20 | |
| 1 | |
| 1 | |
| 19 |
Balance at end of period | | $ | 400 | | $ | 12 | | $ | 120 | | $ | — | | $ | 532 |
Individually evaluated for impairment | |
| 297 | |
| 7 | |
| 52 | |
| — | |
| 356 |
Collectively evaluated | |
| 103 | |
| 5 | |
| 68 | |
| — | |
| 176 |
Total | | $ | 400 | | $ | 12 | | $ | 120 | | $ | — | | $ | 532 |
37
| | | | | | | | | | | | | | | |
Acquired Loans | | At or for the Nine Months Ended September 30, 2020 | |||||||||||||
|
| Commercial |
| Commercial |
| Residential |
| | |
| | | |||
(in thousands) | | real estate | | and industrial | | real estate | | Consumer | | Total | |||||
Balance at beginning of period | | $ | 147 | | $ | 6 | | $ | 143 | | $ | — | | $ | 296 |
Charged-off loans | |
| (101) | |
| (53) | |
| (11) | |
| (6) | |
| (171) |
Recoveries on charged-off loans | |
| 19 | |
| 9 | |
| 12 | |
| 8 | |
| 48 |
Provision (release) for loan losses | |
| 335 | |
| 50 | |
| (24) | |
| (2) | |
| 359 |
Balance at end of period | | $ | 400 | | $ | 12 | | $ | 120 | | $ | — | | $ | 532 |
Individually evaluated for impairment | |
| 297 | |
| 7 | |
| 52 | |
| — | |
| 356 |
Collectively evaluated | |
| 103 | |
| 5 | |
| 68 | |
| — | |
| 176 |
Total | | $ | 400 | | $ | 12 | | $ | 120 | | $ | — | | $ | 532 |
| | | | | | | | | | | | | | | |
Business Activities Loans | | At or for the Three Months Ended September 30, 2019 | |||||||||||||
|
| Commercial |
| Commercial |
| Residential |
| | |
| | | |||
(in thousands) | | real estate | | and industrial | | real estate | | Consumer | | Total | |||||
Balance at beginning of period | | $ | 7,206 | | $ | 2,748 | | $ | 3,942 | | $ | 394 | | $ | 14,290 |
Charged-off loans | |
| — | |
| — | |
| (108) | |
| (55) | |
| (163) |
Recoveries on charged-off loans | |
| 1 | |
| 62 | |
| 36 | |
| 1 | |
| 100 |
Provision (release) for loan losses | |
| 956 | |
| 63 | |
| (111) | |
| (94) | |
| 814 |
Balance at end of period | | $ | 8,163 | | $ | 2,873 | | $ | 3,759 | | $ | 246 | | $ | 15,041 |
Individually evaluated for impairment | |
| 990 | |
| 240 | |
| 66 | |
| 1 | |
| 1,297 |
Collectively evaluated | |
| 7,173 | |
| 2,633 | |
| 3,693 | |
| 245 | |
| 13,744 |
Total | | $ | 8,163 | | $ | 2,873 | | $ | 3,759 | | $ | 246 | | $ | 15,041 |
| | | | | | | | | | | | | | | |
Business Activities Loans | | At or for the Nine Months Ended September 30, 2019 | |||||||||||||
|
| Commercial |
| Commercial |
| Residential |
| | |
| | | |||
(in thousands) | | real estate | | and industrial | | real estate | | Consumer | | Total | |||||
Balance at beginning of period | | $ | 6,811 | | $ | 2,380 | | $ | 3,982 | | $ | 408 | | $ | 13,581 |
Charged-off loans | |
| (57) | |
| (13) | |
| (110) | |
| (129) | |
| (309) |
Recoveries on charged-off loans | |
| 131 | |
| 62 | |
| 55 | |
| 8 | |
| 256 |
Provision (release) for loan losses | |
| 1,278 | |
| 444 | |
| (168) | |
| (41) | |
| 1,513 |
Balance at end of period | | $ | 8,163 | | $ | 2,873 | | $ | 3,759 | | $ | 246 | | $ | 15,041 |
Individually evaluated for impairment | |
| 990 | |
| 240 | |
| 66 | |
| 1 | |
| 1,297 |
Collectively evaluated | |
| 7,173 | |
| 2,633 | |
| 3,693 | |
| 245 | |
| 13,744 |
Total | | $ | 8,163 | | $ | 2,873 | | $ | 3,759 | | $ | 246 | | $ | 15,041 |
| | | | | | | | | | | | | | | |
Acquired Loans | | At or for the Three Months Ended September 30, 2019 | |||||||||||||
|
| Commercial |
| Commercial |
| Residential |
| | |
| | | |||
(in thousands) | | real estate | | and industrial | | real estate | | Consumer | | Total | |||||
Balance at beginning of period | | $ | 159 | | $ | 22 | | $ | 101 | | $ | — | | $ | 282 |
Charged-off loans |
| | — |
| | — |
| | (52) |
| | — |
| | (52) |
Recoveries on charged-off loans |
| | — |
| | — |
| | — |
| | 3 |
| | 3 |
Provision (release) for loan losses |
| | (2) |
| | (15) |
| | 99 |
| | (3) |
| | 79 |
Balance at end of period | | $ | 157 | | $ | 7 | | $ | 148 | | $ | — | | $ | 312 |
Individually evaluated for impairment | |
| 12 | |
| — | |
| 32 | |
| — | |
| 44 |
Collectively evaluated | |
| 145 | |
| 7 | |
| 116 | |
| — | |
| 268 |
Total | | $ | 157 | | $ | 7 | | $ | 148 | | $ | — | | $ | 312 |
38
| Business Activities Loans | At or for the Three Months Ended September 30, 2019 | |||||||||||||||||||
| (in thousands) | Commercial real estate | Commercial and industrial | Residential real estate | Consumer | Total | |||||||||||||||
| Balance at beginning of period | $ | 7,206 | $ | 2,748 | $ | 3,942 | $ | 394 | $ | 14,290 | ||||||||||
| Charged-off loans | — | — | (108 | ) | (55 | ) | (163 | ) | ||||||||||||
| Recoveries on charged-off loans | 1 | 62 | 36 | 1 | 100 | |||||||||||||||
| (Releases) provision for loan losses | 956 | 63 | (111 | ) | (94 | ) | 814 | |||||||||||||
| Balance at end of period | $ | 8,163 | $ | 2,873 | $ | 3,759 | $ | 246 | $ | 15,041 | ||||||||||
| Individually evaluated for impairment | 990 | 240 | 66 | 1 | 1,297 | |||||||||||||||
| Collectively evaluated | 7,173 | 2,633 | 3,693 | 245 | 13,744 | |||||||||||||||
| Total | $ | 8,163 | $ | 2,873 | $ | 3,759 | $ | 246 | $ | 15,041 | ||||||||||
| Acquired Loans | At or for the Three Months Ended September 30, 2019 | |||||||||||||||||||
| (in thousands) | Commercial real estate | Commercial and industrial | Residential real estate | Consumer | Total | |||||||||||||||
| Balance at beginning of period | $ | 159 | $ | 22 | $ | 101 | $ | — | $ | 282 | ||||||||||
| Charged-off loans | — | — | (52 | ) | — | (52 | ) | |||||||||||||
| Recoveries on charged-off loans | — | — | — | 3 | 3 | |||||||||||||||
| (Releases) provision for loan losses | (2 | ) | (15 | ) | 99 | (3 | ) | 79 | ||||||||||||
| Balance at end of period | $ | 157 | $ | 7 | $ | 148 | $ | — | $ | 312 | ||||||||||
| Individually evaluated for impairment | 12 | — | 32 | — | 44 | |||||||||||||||
| Collectively evaluated | 145 | 7 | 116 | — | 268 | |||||||||||||||
| Total | $ | 157 | $ | 7 | $ | 148 | $ | — | $ | 312 | ||||||||||
| Business Activities Loans | At or for the Nine Months Ended September 30, 2019 | |||||||||||||||||||
| (in thousands) | Commercial real estate | Commercial and industrial | Residential real estate | Consumer | Total | |||||||||||||||
| Balance at beginning of period | $ | 6,811 | $ | 2,380 | $ | 3,982 | $ | 408 | $ | 13,581 | ||||||||||
| Charged-off loans | (57 | ) | (13 | ) | (110 | ) | (129 | ) | (309 | ) | ||||||||||
| Recoveries on charged-off loans | 131 | 62 | 55 | 8 | 256 | |||||||||||||||
| (Releases) provision for loan losses | 1,278 | 444 | (168 | ) | (41 | ) | 1,513 | |||||||||||||
| Balance at end of period | $ | 8,163 | $ | 2,873 | $ | 3,759 | $ | 246 | $ | 15,041 | ||||||||||
| Individually evaluated for impairment | 990 | 240 | 66 | 1 | 1,297 | |||||||||||||||
| Collectively evaluated | 7,173 | 2,633 | 3,693 | 245 | 13,744 | |||||||||||||||
| Total | $ | 8,163 | $ | 2,873 | $ | 3,759 | $ | 246 | $ | 15,041 | ||||||||||
| Acquired Loans | At or for the Nine Months Ended September 30, 2019 | |||||||||||||||||||
| (in thousands) | Commercial real estate | Commercial and industrial | Residential real estate | Consumer | Total | |||||||||||||||
| Balance at beginning of period | $ | 173 | $ | 35 | $ | 77 | $ | — | $ | 285 | ||||||||||
| Charged-off loans | — | (15 | ) | (222 | ) | (5 | ) | (242 | ) | |||||||||||
| Recoveries on charged-off loans | — | — | — | 3 | 3 | |||||||||||||||
| (Releases) provision for loan losses | (16 | ) | (13 | ) | 293 | 2 | 266 | |||||||||||||
| Balance at end of period | $ | 157 | $ | 7 | $ | 148 | $ | — | $ | 312 | ||||||||||
| Individually evaluated for impairment | 12 | — | 32 | — | 44 | |||||||||||||||
| Collectively evaluated | 145 | 7 | 116 | — | 268 | |||||||||||||||
| Total | $ | 157 | $ | 7 | $ | 148 | $ | — | $ | 312 | ||||||||||
| Business Activities Loans | At or for the Three Months Ended September 30, 2018 | |||||||||||||||||||
| (in thousands) | Commercial real estate | Commercial and industrial | Residential real estate | Consumer | Total | |||||||||||||||
| Balance at beginning of period | $ | 6,367 | $ | 2,509 | $ | 3,454 | $ | 393 | $ | 12,723 | ||||||||||
| Charged-off loans | (29 | ) | — | (61 | ) | (40 | ) | (130 | ) | |||||||||||
| Recoveries on charged-off loans | 7 | 18 | — | 2 | 27 | |||||||||||||||
| Provision (releases) for loan losses | 291 | (31 | ) | 258 | 66 | 584 | ||||||||||||||
| Balance at end of period | $ | 6,636 | $ | 2,496 | $ | 3,651 | $ | 421 | $ | 13,204 | ||||||||||
| Individually evaluated for impairment | 688 | 62 | 92 | — | 842 | |||||||||||||||
| Collectively evaluated | 5,948 | 2,434 | 3,559 | 421 | 12,362 | |||||||||||||||
| Total | $ | 6,636 | $ | 2,496 | $ | 3,651 | $ | 421 | $ | 13,204 | ||||||||||
| Acquired Loans | At or for the Three Months Ended September 30, 2018 | |||||||||||||||||||
| (in thousands) | Commercial real estate | Commercial and industrial | Residential real estate | Consumer | Total | |||||||||||||||
| Balance at beginning of period | $ | 200 | $ | 82 | $ | 85 | $ | — | $ | 367 | ||||||||||
| Charged-off loans | (30 | ) | (71 | ) | (62 | ) | (5 | ) | (168 | ) | ||||||||||
| Recoveries on charged-off loans | 25 | — | — | — | 25 | |||||||||||||||
| Provision (releases) for loan losses | (23 | ) | 33 | 44 | 5 | 59 | ||||||||||||||
| Balance at end of period | $ | 172 | $ | 44 | $ | 67 | $ | — | $ | 283 | ||||||||||
| Individually evaluated for impairment | — | — | 20 | — | 20 | |||||||||||||||
| Collectively evaluated | 172 | 44 | 47 | — | 263 | |||||||||||||||
| Total | $ | 172 | $ | 44 | $ | 67 | $ | — | $ | 283 | ||||||||||
| Business Activities Loans | At or for the Nine Months Ended September 30, 2018 | |||||||||||||||||||
| (in thousands) | Commercial real estate | Commercial and industrial | Residential real estate | Consumer | Total | |||||||||||||||
| Balance at beginning of period | $ | 6,037 | $ | 2,373 | $ | 3,357 | $ | 386 | $ | 12,153 | ||||||||||
| Charged-off loans | (186 | ) | (111 | ) | (61 | ) | (426 | ) | (784 | ) | ||||||||||
| Recoveries on charged-off loans | 68 | 23 | 2 | 5 | 98 | |||||||||||||||
| Provision for loan losses | 717 | 211 | 353 | 456 | 1,737 | |||||||||||||||
| Balance at end of period | $ | 6,636 | $ | 2,496 | $ | 3,651 | $ | 421 | $ | 13,204 | ||||||||||
| Individually evaluated for impairment | 688 | 62 | 92 | — | 842 | |||||||||||||||
| Collectively evaluated | 5,948 | 2,434 | 3,559 | 421 | 12,362 | |||||||||||||||
| Total | $ | 6,636 | $ | 2,496 | $ | 3,651 | $ | 421 | $ | 13,204 | ||||||||||
| Acquired Loans | At or for the Nine Months Ended September 30, 2018 | |||||||||||||||||||
| (in thousands) | Commercial real estate | Commercial and industrial | Residential real estate | Consumer | Total | |||||||||||||||
| Balance at beginning of period | $ | 97 | $ | 16 | $ | 59 | $ | — | $ | 172 | ||||||||||
| Charged-off loans | (136 | ) | (166 | ) | (126 | ) | (64 | ) | (492 | ) | ||||||||||
| Recoveries on charged-off loans | 43 | 7 | — | 82 | 132 | |||||||||||||||
| Provision (releases) for loan losses | 168 | 187 | 134 | (18 | ) | 471 | ||||||||||||||
| Balance at end of period | $ | 172 | $ | 44 | $ | 67 | $ | — | $ | 283 | ||||||||||
| Individually evaluated for impairment | — | — | 20 | — | 20 | |||||||||||||||
| Collectively evaluated | 172 | 44 | 47 | — | 263 | |||||||||||||||
| Total | $ | 172 | $ | 44 | $ | 67 | $ | — | $ | 283 | ||||||||||
| | | | | | | | | | | | | | | |
Acquired Loans | | At or for the Nine Months Ended September 30, 2019 | |||||||||||||
|
| Commercial |
| Commercial |
| Residential |
| | |
| | | |||
(in thousands) | | real estate | | and industrial | | real estate | | Consumer | | Total | |||||
Balance at beginning of period | | $ | 173 | | $ | 35 | | $ | 77 | | $ | — | | $ | 285 |
Charged-off loans |
| | — |
| | (15) |
| | (222) |
| | (5) |
| | (242) |
Recoveries on charged-off loans |
| | — |
| | — |
| | — |
| | 3 |
| | 3 |
Provision (releases) for loan losses |
| | (16) |
| | (13) |
| | 293 |
| | 2 |
| | 266 |
Balance at end of period | | $ | 157 | | $ | 7 | | $ | 148 | | $ | — | | $ | 312 |
Individually evaluated for impairment | |
| 12 | |
| — | |
| 32 | |
| — | |
| 44 |
Collectively evaluated | |
| 145 | |
| 7 | |
| 116 | |
| — | |
| 268 |
Total | | $ | 157 | | $ | 7 | | $ | 148 | | $ | — | | $ | 312 |
Loan Origination/Risk Management:
The Company has certain lending policies and procedures in place designed to maximize loan income within an acceptable level of risk. The Company’s Board of Directors reviews and approves these policies and procedures on a regular basis. A reporting system supplements the review process by providing management and the Company's Board of Directors with frequent reports related to loan production, loan quality, concentration of credit, loan delinquencies, non-performing loans and potential problem loans. The Company seeks to diversify the loan portfolio as a means of managing risk associated with fluctuations in economic conditions.
Credit Quality Indicators/Classified Loans:
In monitoring the credit quality of the portfolio, management applies a credit quality indicator and uses an internal risk rating system to categorize commercial loans. These credit quality indicators range from one through nine, with a higher number correlating to increasing risk of loss. These ratings are used as inputs to the calculation of the allowance for loan losses. Consistent with regulatory guidelines, the Company provides for the classification of loans which are considered to be of lesser quality as special mention, substandard, doubtful, or loss (i.e. risk-rated 6, 7, 8 and 9, respectively).
The following are the definitions of the Company’s credit quality indicators:
Pass:
Loans the Company considers in the commercial portfolio segments that are not adversely rated, are contractually current as to principal and interest, and are otherwise in compliance with the contractual terms of the loan agreement. Management believes there is a low risk of loss related to these loans considered pass-rated.
Special Mention:
Loans the Company considers having some potential weaknesses, but are deemed to not carry levels of risk inherent in one of the subsequent categories, are designated as special mention. A special mention loan has potential weaknesses that deserve management’s close attention. If left uncorrected, these potential weaknesses may result in deterioration of the repayment prospects for the asset or in the institution’s credit position at some future date. This might include loans which may require a higher level of supervision or internal reporting because of: (i) declining industry trends; (ii) increasing reliance on secondary sources of repayment; (iii) the poor condition of or lack of control
Substandard:
Loans theCompany considers as substandard are inadequately protected by the current net worth and paying capacity of the borrower or of the collateral pledged, if any. Substandard loans have a well-defined weakness that jeopardizes liquidation of the debt. Substandard loans include those loans where there is the distinct possibility of some loss of principal, if the deficiencies are not corrected.
Doubtful:
Loans the Company considers as doubtful have all of the weaknesses inherent in those loans that are classified as substandard. These loans have the added characteristic of a well-defined weakness which is inadequately protected by the current sound worth and paying capacity of borrower or of the collateral pledged, if any, and calls into question the collectability of the full balance of the loan. The possibility of loss is high but because of certain important and reasonably specific pending factors which may work to the advantage and strengthening of the loan, its classification as loss is deferred39
until its more exact status is determined. Pending factors include proposed merger, acquisition, or liquidation procedures, capital injection, perfecting liens on additional collateral and refinancing plans. The entire amount of the loan might not be classified as doubtful when collection of a specific portion appears highly probable. Loans are generally not classified doubtful for an extended period of time (i.e., over a year).
Loss:
Loans the Company considers as losses are those considered uncollectible and of such little value that their continuance as an asset is not warranted and the uncollectible amounts are charged-off. This classification does not mean the asset has absolutely no recovery or salvage value, but rather it is not practical or desirable to defer writing off this worthless asset even though partial recovery may be affected in the future. Losses are taken in the period in which they are determined to be uncollectible.
The following tables present the Company’s loans by risk rating at September 30, 20192020 and December 31, 2018:
Business Activities Loans
Commercial Real Estate
| Commercial construction and land development | Commercial real estate other | Total commercial real estate | ||||||||||||||||||||||
| (in thousands) | Sep 30, 2019 | Dec 31, 2018 | Sep 30, 2019 | Dec 31, 2018 | Sep 30, 2019 | Dec 31, 2018 | ||||||||||||||||||
| Grade: | ||||||||||||||||||||||||
| Pass | $ | 28,728 | $ | 23,680 | $ | 647,075 | $ | 532,386 | $ | 675,803 | $ | 556,066 | ||||||||||||
| Special mention | — | 73 | 12,474 | 8,319 | 12,474 | 8,392 | ||||||||||||||||||
| Substandard | 73 | — | 10,212 | 13,914 | 10,285 | 13,914 | ||||||||||||||||||
| Doubtful | 1 | 1 | 3,124 | 1,361 | 3,125 | 1,362 | ||||||||||||||||||
| Total | $ | 28,802 | $ | 23,754 | $ | 672,885 | $ | 555,980 | $ | 701,687 | $ | 579,734 | ||||||||||||
| | | | | | | | | | | | | | | | | | |
| | Commercial construction | | | | | | | | | | | | | ||||
| | and land development | | Commercial real estate other | | Total commercial real estate | ||||||||||||
(in thousands) |
| Sep 30, 2020 |
| Dec 31, 2019 |
| Sep 30, 2020 |
| Dec 31, 2019 |
| Sep 30, 2020 |
| Dec 31, 2019 | ||||||
Grade: | |
| | |
| | |
| | |
| | |
| | |
| |
Pass | | $ | 86,716 | | $ | 31,057 | | $ | 742,214 | | $ | 646,886 | | $ | 828,930 | | $ | 677,943 |
Special mention | |
| 0 | |
| 0 | |
| 6,722 | |
| 5,483 | |
| 6,722 | |
| 5,483 |
Substandard | |
| — | |
| 330 | |
| 15,981 | |
| 11,974 | |
| 15,981 | |
| 12,304 |
Doubtful | |
| 211 | |
| 0 | |
| 554 | |
| 1,708 | |
| 765 | |
| 1,708 |
Total | | $ | 86,927 | | $ | 31,387 | | $ | 765,471 | | $ | 666,051 | | $ | 852,398 | | $ | 697,438 |
Acquired Loans
Commercial Real Estate
| Commercial construction and land development | Commercial real estate other | Total commercial real estate | ||||||||||||||||||||||
| (in thousands) | Sep 30, 2019 | Dec 31, 2018 | Sep 30, 2019 | Dec 31, 2018 | Sep 30, 2019 | Dec 31, 2018 | ||||||||||||||||||
| Grade: | ||||||||||||||||||||||||
| Pass | $ | 1,765 | $ | 2,626 | $ | 212,859 | $ | 236,393 | $ | 214,624 | $ | 239,019 | ||||||||||||
| Special mention | 12 | — | 1,962 | 1,574 | 1,974 | 1,574 | ||||||||||||||||||
| Substandard | 287 | 264 | 5,033 | 6,009 | 5,320 | 6,273 | ||||||||||||||||||
| Doubtful | — | — | 168 | 99 | 168 | 99 | ||||||||||||||||||
| Total | $ | 2,064 | $ | 2,890 | $ | 220,022 | $ | 244,075 | $ | 222,086 | $ | 246,965 | ||||||||||||
| | | | | | | | | | | | | | | | | | |
| | Commercial construction | | | | | | | | | | | | | ||||
| | and land development | | Commercial real estate other | | Total commercial real estate | ||||||||||||
(in thousands) |
| Sep 30, 2020 |
| Dec 31, 2019 |
| Sep 30, 2020 |
| Dec 31, 2019 |
| Sep 30, 2020 |
| Dec 31, 2019 | ||||||
Grade: | |
| | |
| | |
| | |
| | |
| | |
| |
Pass | | $ | 1,878 | | $ | 2,412 | | $ | 180,602 | | $ | 218,491 | | $ | 182,480 | | $ | 220,903 |
Special mention | |
| — | |
| 12 | |
| 1,508 | |
| 2,261 | |
| 1,508 | |
| 2,273 |
Substandard | |
| 313 | |
| 479 | |
| 7,411 | |
| 9,400 | |
| 7,724 | |
| 9,879 |
Doubtful | |
| — | |
| — | |
| 1,525 | |
| 168 | |
| 1,525 | |
| 168 |
Total | | $ | 2,191 | | $ | 2,903 | | $ | 191,046 | | $ | 230,320 | | $ | 193,237 | | $ | 233,223 |
Business Activities Loans
Commercial and Industrial
| | | | | | | | | | | | | | | | | | | | | | | | |
| | Commercial | | Agricultural | | Tax exempt loans | | Total commercial | ||||||||||||||||
(in thousands) |
| Sep 30, 2020 |
| Dec 31, 2019 |
| Sep 30, 2020 |
| Dec 31, 2019 |
| Sep 30, 2020 |
| Dec 31, 2019 |
| Sep 30, 2020 |
| Dec 31, 2019 | ||||||||
Grade: | |
| | |
| | |
| | |
| | |
| | |
| | |
| | |
| |
Pass | | $ | 362,351 | | $ | 221,329 | | $ | 16,744 | | $ | 18,940 | | $ | 41,951 | | $ | 66,860 | | $ | 421,046 | | $ | 307,129 |
Special mention | |
| 4,066 | |
| 2,744 | |
| 200 | |
| 298 | |
| 0 | |
| 0 | |
| 4,266 | |
| 3,042 |
Substandard | |
| 14,430 | |
| 14,866 | |
| 489 | |
| 780 | |
| 0 | |
| 0 | |
| 14,919 | |
| 15,646 |
Doubtful | |
| 665 | |
| 753 | |
| 225 | |
| 0 | |
| 0 | |
| 0 | |
| 890 | |
| 753 |
Total | | $ | 381,512 | | $ | 239,692 | | $ | 17,658 | | $ | 20,018 | | $ | 41,951 | | $ | 66,860 | | $ | 441,121 | | $ | 326,570 |
40
| Commercial | Agricultural | Tax exempt loans | Total commercial and industrial | |||||||||||||||||||||||||||||
| (in thousands) | Sep 30, 2019 | Dec 31, 2018 | Sep 30, 2019 | Dec 31, 2018 | Sep 30, 2019 | Dec 31, 2018 | Sep 30, 2019 | Dec 31, 2018 | ||||||||||||||||||||||||
| Grade: | ||||||||||||||||||||||||||||||||
| Pass | $ | 219,962 | $ | 226,353 | $ | 20,413 | $ | 21,680 | $ | 66,043 | $ | 56,588 | $ | 306,418 | $ | 304,621 | ||||||||||||||||
| Special mention | 14,000 | 6,730 | 346 | 215 | — | — | 14,346 | 6,945 | ||||||||||||||||||||||||
| Substandard | 4,922 | 924 | 447 | 422 | — | — | 5,369 | 1,346 | ||||||||||||||||||||||||
| Doubtful | 1,010 | 750 | — | — | — | — | 1,010 | 750 | ||||||||||||||||||||||||
| Total | $ | 239,894 | $ | 234,757 | $ | 21,206 | $ | 22,317 | $ | 66,043 | $ | 56,588 | $ | 327,143 | $ | 313,662 | ||||||||||||||||
Commercial and Industrial
| Commercial | Agricultural | Tax exempt loans | Total commercial and industrial | |||||||||||||||||||||||||||||
| (in thousands) | Sep 30, 2019 | Dec 31, 2018 | Sep 30, 2019 | Dec 31, 2018 | Sep 30, 2019 | Dec 31, 2018 | Sep 30, 2019 | Dec 31, 2018 | ||||||||||||||||||||||||
| Grade: | ||||||||||||||||||||||||||||||||
| Pass | $ | 37,111 | $ | 46,120 | $ | — | $ | — | $ | 35,073 | $ | 38,738 | $ | 72,184 | $ | 84,858 | ||||||||||||||||
| Special mention | 2,511 | 4,825 | — | — | — | — | 2,511 | 4,825 | ||||||||||||||||||||||||
| Substandard | 527 | 1,222 | — | — | — | — | 527 | 1,222 | ||||||||||||||||||||||||
| Doubtful | 341 | 303 | — | — | — | — | 341 | 303 | ||||||||||||||||||||||||
| Total | $ | 40,490 | $ | 52,470 | $ | — | $ | — | $ | 35,073 | $ | 38,738 | $ | 75,563 | $ | 91,208 | ||||||||||||||||
| | | | | | | | | | | | | | | | | | | | | | | | |
| | Commercial | | Agricultural | | Tax exempt loans | | Total commercial | ||||||||||||||||
(in thousands) |
| Sep 30, 2020 |
| Dec 31, 2019 |
| Sep 30, 2020 |
| Dec 31, 2019 |
| Sep 30, 2020 |
| Dec 31, 2019 |
| Sep 30, 2020 |
| Dec 31, 2019 | ||||||||
Grade: | |
| | |
| | |
| | |
| | |
| | |
| | |
| | |
| |
Pass | | $ | 54,667 | | $ | 51,184 | | $ | 21 | | $ | 58 | | $ | 24,375 | | $ | 37,407 | | $ | 79,063 | | $ | 88,649 |
Special mention | |
| 421 | |
| 5,432 | |
| — | |
| — | |
| — | |
| — | |
| 421 | |
| 5,432 |
Substandard | |
| 1,255 | |
| 2,115 | |
| 135 | |
| 148 | |
| — | |
| 36 | |
| 1,390 | |
| 2,299 |
Doubtful | |
| 515 | |
| 341 | |
| — | |
| — | |
| — | |
| — | |
| 515 | |
| 341 |
Total | | $ | 56,858 | | $ | 59,072 | | $ | 156 | | $ | 206 | | $ | 24,375 | | $ | 37,443 | | $ | 81,389 | | $ | 96,721 |
Business Activities Loans
Residential Real Estate and Consumer Loans
| Residential real estate | Home equity | Other consumer | Total residential real estate and consumer | |||||||||||||||||||||||||||||
| (in thousands) | Sep 30, 2019 | Dec 31, 2018 | Sep 30, 2019 | Dec 31, 2018 | Sep 30, 2019 | Dec 31, 2018 | Sep 30, 2019 | Dec 31, 2018 | ||||||||||||||||||||||||
| Performing | $ | 727,239 | $ | 665,976 | $ | 57,992 | $ | 57,652 | $ | 10,209 | $ | 9,324 | $ | 795,440 | $ | 732,952 | ||||||||||||||||
| Nonperforming | 3,277 | 4,213 | 564 | 246 | 25 | 90 | 3,866 | 4,549 | ||||||||||||||||||||||||
| Total | $ | 730,516 | $ | 670,189 | $ | 58,556 | $ | 57,898 | $ | 10,234 | $ | 9,414 | $ | 799,306 | $ | 737,501 | ||||||||||||||||
| | | | | | | | | | | | | | | | | | | | | | | | |
| | Residential real estate | | Home equity | | Other consumer | | Total residential real estate and consumer | ||||||||||||||||
(in thousands) |
| Sep 30, 2020 |
| Dec 31, 2019 |
| Sep 30, 2020 |
| Dec 31, 2019 |
| Sep 30, 2020 |
| Dec 31, 2019 |
| Sep 30, 2020 |
| Dec 31, 2019 | ||||||||
Performing | | $ | 691,902 | | $ | 737,325 | | $ | 57,894 | | $ | 58,753 | | $ | 9,202 | | $ | 11,146 | | $ | 758,998 | | $ | 807,224 |
Nonperforming |
| | 3,864 |
| | 3,362 |
| | 450 |
| | 615 |
| | 15 |
| | 21 |
| | 4,329 |
| | 3,998 |
Total | | $ | 695,766 | | $ | 740,687 | | $ | 58,344 | | $ | 59,368 | | $ | 9,217 | | $ | 11,167 | | $ | 763,327 | | $ | 811,222 |
Acquired Loans
Residential Real Estate and Consumer Loans
| Residential real estate | Home equity | Other consumer | Total residential real estate and consumer | |||||||||||||||||||||||||||||
| (in thousands) | Sep 30, 2019 | Dec 31, 2018 | Sep 30, 2019 | Dec 31, 2018 | Sep 30, 2019 | Dec 31, 2018 | Sep 30, 2019 | Dec 31, 2018 | ||||||||||||||||||||||||
| Performing | $ | 409,830 | $ | 470,497 | $ | 37,446 | $ | 45,090 | $ | 985 | $ | 1,356 | $ | 448,261 | $ | 516,943 | ||||||||||||||||
| Nonperforming | 3,106 | 4,012 | 154 | 201 | — | 1 | 3,260 | 4,214 | ||||||||||||||||||||||||
| Total | $ | 412,936 | $ | 474,509 | $ | 37,600 | $ | 45,291 | $ | 985 | $ | 1,357 | $ | 451,521 | $ | 521,157 | ||||||||||||||||
| | | | | | | | | | | | | | | | | | | | | | | | |
| | Residential real estate | | Home equity | | Other consumer | | Total residential real estate and consumer | ||||||||||||||||
(in thousands) |
| Sep 30, 2020 |
| Dec 31, 2019 |
| Sep 30, 2020 |
| Dec 31, 2019 |
| Sep 30, 2020 |
| Dec 31, 2019 |
| Sep 30, 2020 |
| Dec 31, 2019 | ||||||||
Performing | | $ | 320,772 | | $ | 407,811 | | $ | 50,059 | | $ | 62,504 | | $ | 1,249 | | $ | 1,707 | | $ | 372,080 | | $ | 472,022 |
Nonperforming |
| | 4,668 |
| | 3,359 |
| | 471 |
| | 529 |
| | — |
| | 8 |
| | 5,139 |
| | 3,896 |
Total | | $ | 325,440 | | $ | 411,170 | | $ | 50,530 | | $ | 63,033 | | $ | 1,249 | | $ | 1,715 | | $ | 377,219 | | $ | 475,918 |
The following table summarizes total classified and criticized loans as of September 30, 20192020 and December 31, 2018:2019:
| | | | | | | | | | | | | | | | | | |
| | September 30, 2020 | | December 31, 2019 | ||||||||||||||
| | Business | | | | | | | | Business | | | | | | | ||
(in thousands) |
| Activities Loans |
| Acquired Loans |
| Total |
| Activities Loans |
| Acquired Loans |
| Total | ||||||
Non-accrual | | $ | 7,763 | | $ | 6,645 | | $ | 14,408 | | $ | 8,354 | | $ | 3,196 | | $ | 11,550 |
Substandard accruing |
| | 29,121 |
| | 9,648 |
| | 38,769 |
| | 26,055 |
| | 13,387 |
| | 39,442 |
Total classified |
| | 36,884 |
| | 16,293 |
| | 53,177 |
| | 34,409 |
| | 16,583 |
| | 50,992 |
Special mention |
| | 10,988 |
| | 1,929 |
| | 12,917 |
| | 8,525 |
| | 7,705 |
| | 16,230 |
Total Criticized | | $ | 47,872 | | $ | 18,222 | | $ | 66,094 | | $ | 42,934 | | $ | 24,288 | | $ | 67,222 |
41
| September 30, 2019 | December 31, 2018 | |||||||||||||||||||||||
| (in thousands) | Business Activities Loans | Acquired Loans | Total | Business Activities Loans | Acquired Loans | Total | ||||||||||||||||||
| Non-accrual | $ | 13,541 | $ | 3,138 | $ | 16,679 | $ | 14,111 | $ | 4,124 | $ | 18,235 | ||||||||||||
| Substandard accruing | 10,114 | 6,478 | 16,592 | 7,810 | 7,987 | 15,797 | ||||||||||||||||||
| Doubtful accruing | — | — | — | — | — | — | ||||||||||||||||||
| Total classified | 23,655 | 9,616 | 33,271 | 21,921 | 12,111 | 34,032 | ||||||||||||||||||
| Special mention | 26,820 | 4,485 | 31,305 | 15,337 | 6,399 | 21,736 | ||||||||||||||||||
| Total Criticized | $ | 50,475 | $ | 14,101 | $ | 64,576 | $ | 37,258 | $ | 18,510 | $ | 55,768 | ||||||||||||
Borrowed funds at September 30, 20192020 and December 31, 20182019 are summarized, as follows:
| September 30, 2019 | December 31, 2018 | |||||||||||||
| (dollars in thousands) | Carrying Value | Weighted Average Rate | Carrying Value | Weighted Average Rate | ||||||||||
| Short-term borrowings | ||||||||||||||
| Advances from the FHLB | $ | 422,583 | 2.24 | % | $ | 611,683 | 2.47 | % | ||||||
| Other borrowings | 41,259 | 1.24 | 36,211 | 1.09 | ||||||||||
| Total short-term borrowings | 463,842 | 2.15 | 647,894 | 2.39 | ||||||||||
| Long-term borrowings | ||||||||||||||
| Advances from the FHLB | 177,977 | 2.25 | 32,929 | 1.86 | ||||||||||
| Subordinated borrowings | 37,928 | 5.69 | 37,973 | 5.58 | ||||||||||
| Junior subordinated borrowings | 5,000 | 6.15 | 5,000 | 5.96 | ||||||||||
| Total long-term borrowings | 220,905 | 2.93 | 75,902 | 3.99 | ||||||||||
| Total | $ | 684,747 | 2.40 | % | $ | 723,796 | 2.56 | % | ||||||
| | | | | | | | | | | |
| | September 30, 2020 | | December 31, 2019 |
| ||||||
| | | | | Weighted | | | | | Weighted | |
(dollars in thousands) |
| Carrying Value |
| Average Rate |
| Carrying Value |
| Average Rate |
| ||
Short-term borrowings | |
| | |
| |
| | |
|
|
Advances from the FHLB | | $ | 41,672 |
| 1.69 | % | $ | 303,286 |
| 1.83 | % |
Other borrowings | |
| 30,048 |
| 0.60 | |
| 44,832 |
| 0.99 | |
Total short-term borrowings | |
| 71,720 |
| 1.20 | |
| 348,118 |
| 1.73 | |
Long-term borrowings | |
|
|
|
| |
|
|
|
| |
Advances from the FHLB | |
| 182,609 |
| 1.73 | |
| 123,278 |
| 1.93 | |
Advances from the FRB PPPLF | | | 131,143 | | 0.35 | | | — | | — | |
Subordinated borrowings | |
| 59,920 |
| 4.48 | |
| 59,920 |
| 5.53 | |
Total long-term borrowings | |
| 373,672 |
| 1.69 | |
| 183,198 |
| 2.87 | |
Total | | $ | 445,392 |
| 1.60 | % | $ | 531,316 |
| 2.11 | % |
Short-term debt includes Federal Home Loan Bank of Boston (“FHLB”) advances with a maturity of less than one year. The Company also maintains a $1.0 million secured line of credit with the FHLB that bears a daily adjustable rate calculated by the FHLB. There was no0 outstanding balance on the FHLB line of credit for the periods ended September 30, 20192020 and December 31, 2018.
The Company has the capacity to borrow funds on a secured basis utilizing the Borrower in Custody program and the Discount Window at the Federal Reserve Bank of Boston (the “FRB”). At September 30, 2019,2020, the Company’s available secured line of credit at the FRB was $107.7$81.1 million. The Company has pledged certain loans and securities to the FRB to support this arrangement. There were no borrowings0 outstanding advances with the FRB for the periods ended September 30, 2019 and2020 December 31, 2018.
On April 15, 2020, the FRB provided a Paycheck Protection Program Lending Facility (“PPPLF”) that the Company used to fund most of its PPP loans totaling $131.1 million as of September 30, 2020.
The Company maintains, with a correspondent bank, an unused unsecured federal funds line of credit that has an aggregate overnight borrowing capacity of $50$50.0 million as of September 30, 20192020 and December 31, 2018.2019. There was no0 outstanding balance on the line of credit as of September 30, 20192020 and December 31, 2018.
Long-term FHLB advances consist of advances with a maturity of more than one year. TheCallable advances outstanding atas of September 30, 2020 were $2.0 million, as of December 31, 2019 there were 0 callable advances. As of September 30, 2020 and December 31, 2018 include no callable advances2019 there were $309 thousand and $319$316 thousand of amortizing advances.advances, respectively. All FHLB borrowings, including the line of credit, are secured by a blanket security agreement on certain qualified collateral, principally all residential first mortgage loans and certain securities.
A summary of maturities of FHLB advances as of September 30, 20192020 is, as follows:
| | | | | | |
| | September 30, 2020 |
| |||
|
| | |
| Weighted Average |
|
(in thousands, except rates) | | Carrying Value | | Rate |
| |
Fixed rate advances maturing: |
| |
|
|
| |
2020 | | $ | 1,000 |
| 1.65 | % |
2021 | |
| 40,672 |
| 1.69 | |
2022 | |
| 75,000 |
| 1.87 | |
2023 | |
| 80,000 |
| 1.77 | |
2024 | |
| 7,300 |
| 1.16 | |
2025 and thereafter | |
| 20,309 |
| 1.25 | |
Total FHLB advances | | $ | 224,281 |
| 1.72 | % |
42
| September 30, 2019 | |||||||
| (in thousands, except rates) | Carrying Value | Weighted Average Rate | |||||
| Fixed rate advances maturing: | |||||||
| 2019 | $ | 393,601 | 2.27 | % | |||
| 2020 | 54,982 | 2.14 | |||||
| 2021 | 11,658 | 2.19 | |||||
| 2022 | 134,000 | 2.25 | |||||
| 2023 | 1,000 | — | |||||
| 2024 and thereafter | 5,319 | 1.79 | |||||
| Total FHLB advances | $ | 600,560 | 2.24 | % | |||
On November 26, 2019, the Company issued fifteen year junior subordinated notes in the amount of $5.0 million. These debt securities qualify as Tier 2 capital for the Company and the Bank. The subordinated debt securities are callable by the Bank after five years without penalty, the next date on which the securities can be redeemed is December 15, 2019. The interest rate is three-month LIBOR plus 3.45%. At September 30, 2019 and December 31, 2018 the interest rate was 5.57% and 6.24%, respectively.
The Company also has $20.6 million in floating Junior Subordinated Deferrable Interest Debentures ("Debentures") issued by NHTB Capital Trust II ("Trust II") and NHTB Capital Trust III ("Trust III"), which are both Connecticut statutory trusts. The Debentures were issued on March 30, 2014,2004, carry a variable interest rate of 3-month LIBOR plus 2.79%, and mature in 2034. The debt is callable by the Company at the time when any interest payment is made. Trust II and Trust III are considered variable interest entities for which the Company is not the primary beneficiary. Accordingly, Trust II and Trust III are not consolidated into the Company’s financial statements.
43
A summary of time deposits is, as follows:
| (in thousands) | September 30, 2019 | December 31, 2018 | ||||||
| Time less than $100,000 | $ | 659,610 | $ | 622,478 | ||||
| Time $100,000 through $250,000 | 151,995 | 193,535 | ||||||
| Time $250,000 or more | 91,060 | 116,780 | ||||||
| Total time deposits | $ | 902,665 | $ | 932,793 | ||||
| | | | | | |
(in thousands) |
| September 30, 2020 |
| December 31, 2019 | ||
Time less than $100,000 | | $ | 497,403 | | $ | 600,747 |
Time $100,000 through $250,000 | |
| 192,243 | |
| 225,505 |
Time $250,000 or more | |
| 123,863 | |
| 106,383 |
Total time deposits | | $ | 813,509 | | $ | 932,635 |
At September 30, 20192020 and December 31, 2018,2019, the scheduled maturities by year for time deposits are, as follows:
| (in thousands) | September 30, 2019 | December 31, 2018 | ||||||
| Within 1 year | $ | 416,591 | $ | 505,313 | ||||
| Over 1 year to 2 years | 365,372 | 258,176 | ||||||
| Over 2 years to 3 years | 70,050 | 123,337 | ||||||
| Over 3 years to 4 years | 25,603 | 14,494 | ||||||
| Over 4 years to 5 years | 22,597 | 31,353 | ||||||
| Over 5 years | 2,452 | 120 | ||||||
| Total | $ | 902,665 | $ | 932,793 | ||||
| | | | | | |
(in thousands) |
| September 30, 2020 | | December 31, 2019 | ||
Within 1 year | | $ | 635,798 | | $ | 555,074 |
Over 1 year to 2 years | |
| 111,500 | |
| 287,934 |
Over 2 years to 3 years | |
| 29,392 | |
| 51,444 |
Over 3 years to 4 years | |
| 27,598 | |
| 31,262 |
Over 4 years to 5 years | |
| 9,216 | |
| 6,883 |
Over 5 years | |
| 5 | |
| 38 |
Total | | $ | 813,509 | | $ | 932,635 |
Included in time deposits are brokered deposits of $554.3$327.2 million and $466.9$526.9 million at September 30, 20192020 and December 31, 2018,2019, respectively. Also included in time deposits are reciprocal deposits of $69.7$127.4 million and $52.4$64.1 million at September 30, 20192020 and December 31, 2018,2019, respectively.
44
The actual and required capital ratios are, as follows:
| September 30, 2019 | Regulatory Minimum to be "Well Capitalized" | December 31, 2018 | Regulatory Minimum to be "Well Capitalized" | |||||||||
| Company (consolidated) | ||||||||||||
| Total capital to risk-weighted assets | 14.01 | % | N/A | 14.23 | % | N/A | ||||||
| Common equity tier 1 capital to risk-weighted assets | 11.63 | N/A | 11.80 | N/A | ||||||||
| Tier 1 capital to risk-weighted assets | 12.47 | N/A | 12.68 | N/A | ||||||||
| Tier 1 capital to average assets | 8.65 | N/A | 8.53 | N/A | ||||||||
| Bank | ||||||||||||
| Total capital to risk-weighted assets | 13.45 | % | 10.00 | % | 13.82 | % | 10.00 | % | ||||
| Common equity tier 1 capital to risk-weighted assets | 12.60 | 6.50 | 12.99 | 6.50 | ||||||||
| Tier 1 capital to risk-weighted assets | 12.60 | 8.00 | 12.99 | 8.00 | ||||||||
| Tier 1 capital to average assets | 8.74 | 5.00 | 8.74 | 5.00 | ||||||||
| | | | | | | | | |
|
| |
| Regulatory |
| |
| Regulatory |
|
| | September 30, | | Minimum to be | | December 31, | | Minimum to be |
|
| | 2020 | | "Well-Capitalized" | | 2019 | | "Well-Capitalized" |
|
Company (consolidated) |
|
|
|
|
|
|
|
| |
Total capital to risk-weighted assets |
| 13.32 | % | 10.50 | % | 13.61 | % | 10.50 | % |
Common equity tier 1 capital to risk-weighted assets |
| 10.29 |
| 7.00 |
| 10.57 |
| 7.00 | |
Tier 1 capital to risk-weighted assets |
| 11.08 |
| 8.50 |
| 11.39 |
| 8.50 | |
Tier 1 capital to average assets |
| 8.14 |
| 5.00 |
| 8.13 |
| 5.00 | |
| | | | | | | | | |
Bank |
|
|
|
|
|
|
|
| |
Total capital to risk-weighted assets |
| 13.03 | % | 10.50 | % | 12.42 | % | 10.50 | % |
Common equity tier 1 capital to risk-weighted assets |
| 12.33 |
| 7.00 |
| 11.79 |
| 7.00 | |
Tier 1 capital to risk-weighted assets |
| 12.33 |
| 8.50 |
| 11.79 |
| 8.50 | |
Tier 1 capital to average assets |
| 9.06 |
| 5.00 |
| 8.39 |
| 5.00 | |
At each date shown, the Company and the Bank met the conditions to be classified as “well-capitalized” under the relevant regulatory framework. To be categorized as "well-capitalized," an institution must maintain minimum total risk-based, Tier 1 risk-based, and Tier 1 leverage ratios as set forth in the table above.
The Company and the Bank are subject to the Basel III rule that requires the Company and the Bank to assess their Common equity tier 1 capital to risk-weighted assets and the Company and the Bank each exceed the minimum to be "well-capitalized." Effective January 1, 2019 all banking organizations must maintain a minimum Common equity tier 1 risk-based capital ratio of 7.0%, a minimum Tier 1 risk-based capital ratio of 8.5% and a minimum Total risk-based capital ratio of 10.5%.
Accumulated other comprehensive income (loss)
Components of accumulated other comprehensive income (loss) is, as follows:
| | | | | | |
(in thousands) |
| September 30, 2020 |
| December 31, 2019 | ||
Other accumulated comprehensive income, before tax: |
| |
|
| |
|
Net unrealized gain on AFS securities | | $ | 15,264 | | $ | 7,342 |
Net unrealized loss on hedging derivatives | |
| (1,461) | |
| (718) |
Net unrealized loss on post-retirement plans | |
| (1,512) | |
| (1,512) |
| | | | | | |
Income taxes related to items of accumulated other comprehensive income: | |
|
| |
|
|
Net unrealized gain on AFS securities | |
| (3,583) | |
| (1,793) |
Net unrealized loss on hedging derivatives | |
| 342 | |
| 237 |
Net unrealized loss on post-retirement plans | |
| 355 | |
| 355 |
Accumulated other comprehensive income | | $ | 9,405 | | $ | 3,911 |
45
| (in thousands) | September 30, 2019 | December 31, 2018 | ||||||
| Other accumulated comprehensive income (loss), before tax: | ||||||||
| Net unrealized gain (loss) on AFS securities | $ | 10,442 | $ | (11,304 | ) | |||
| Net unrealized loss on effective cash flow hedging derivatives | (5,306 | ) | (2,934 | ) | ||||
| Net unrealized loss on post-retirement plans | (1,162 | ) | (1,162 | ) | ||||
| Income taxes related to items of accumulated other comprehensive (income) loss: | ||||||||
| Net unrealized (gain) loss on AFS securities | (2,440 | ) | 2,641 | |||||
| Net unrealized loss on effective cash flow hedging derivatives | 1,239 | 685 | ||||||
| Net unrealized loss on post-retirement plans | 272 | 272 | ||||||
| Accumulated other comprehensive income (loss) | $ | 3,045 | $ | (11,802 | ) | |||
The following table presents the components of other comprehensive income (loss) for the three and nine months ended September 30, 20192020 and 2018:
| | | | | | | | | |
(in thousands) |
| Before Tax |
| Tax Effect |
| Net of Tax | |||
Three Months Ended September 30, 2020 |
| |
|
| |
|
| |
|
Net unrealized gain on AFS securities: |
| |
|
| |
|
| |
|
Net unrealized gain arising during the period | | $ | 351 | | $ | (82) | | $ | 269 |
Less: reclassification adjustment for gains (losses) realized in net income | |
| — | |
| — | |
| — |
Net unrealized gain on AFS securities | |
| 351 | |
| (82) | |
| 269 |
| | | | | | | | | |
Net unrealized gain on cash flow hedging derivatives: | |
|
| |
|
| |
| |
Net unrealized gain arising during the period | |
| 805 | |
| (190) | |
| 615 |
Less: reclassification adjustment for gains (losses) realized in net income | |
| — | |
| — | |
| — |
Net unrealized gain on cash flow hedging derivatives | |
| 805 | |
| (190) | |
| 615 |
| | | | | | | | | |
Net unrealized gain on post-retirement plans: | |
|
| |
|
| |
| |
Net unrealized gain arising during the period | |
| — | |
| — | |
| — |
Less: reclassification adjustment for gains (losses) realized in net income | |
| — | |
| — | |
| — |
Net unrealized gain on post-retirement plans | |
| — | |
| — | |
| — |
Other comprehensive income | | $ | 1,156 | | $ | (272) | | $ | 884 |
| | | | | | | | | |
Three Months Ended September 30, 2019 | |
|
| |
|
| |
|
|
Net unrealized gain on AFS securities: | |
|
| |
|
| |
|
|
Net unrealized gain arising during the period | | $ | 3,357 | | $ | (784) | | $ | 2,573 |
Less: reclassification adjustment for gains (losses) realized in net income | |
| 157 | |
| (37) | |
| 120 |
Net unrealized gain on AFS securities | |
| 3,200 | |
| (747) | |
| 2,453 |
| | | | | | | | | |
Net unrealized loss on cash flow hedging derivatives: | |
|
| |
|
| |
| |
Net unrealized loss arising during the period | |
| (370) | |
| 85 | |
| (285) |
Less: reclassification adjustment for gains (losses) realized in net income | |
| — | |
| — | |
| — |
Net unrealized loss on cash flow hedging derivatives | |
| (370) | |
| 85 | |
| (285) |
| | | | | | | | | |
Net unrealized gain on post-retirement plans: | |
|
| |
|
| |
| |
Net unrealized gain arising during the period | |
| — | |
| — | |
| — |
Less: reclassification adjustment for gains (losses) realized in net income | |
| — | |
| — | |
| — |
Net unrealized gain on post-retirement plans | |
| — | |
| — | |
| — |
Other comprehensive income | | $ | 2,830 | | $ | (662) | | $ | 2,168 |
46
| (in thousands) | Before Tax | Tax Effect | Net of Tax | |||||||||
| Three Months Ended September 30, 2019 | ||||||||||||
| Net unrealized gain on AFS securities: | ||||||||||||
| Net unrealized gain arising during the period | $ | 3,357 | $ | (784 | ) | $ | 2,573 | |||||
| Less: reclassification adjustment for gains (losses) realized in net income | 157 | (37 | ) | 120 | ||||||||
| Net unrealized gain on AFS securities | 3,200 | (747 | ) | 2,453 | ||||||||
| Net unrealized loss on cash flow hedging derivatives: | ||||||||||||
| Net unrealized loss arising during the period | (370 | ) | 85 | (285 | ) | |||||||
| Less: reclassification adjustment for gains (losses) realized in net income | — | — | — | |||||||||
| Net unrealized loss on cash flow hedging derivatives | (370 | ) | 85 | (285 | ) | |||||||
| Net unrealized gain on post-retirement plans: | ||||||||||||
| Net unrealized gain arising during the period | — | — | — | |||||||||
| Less: reclassification adjustment for gains (losses) realized in net income | — | — | — | |||||||||
| Net unrealized gain on post-retirement plans | — | — | — | |||||||||
| Other comprehensive income | $ | 2,830 | $ | (662 | ) | $ | 2,168 | |||||
| Three Months Ended September 30, 2018 | ||||||||||||
| Net unrealized loss on AFS securities: | ||||||||||||
| Net unrealized loss arising during the period | $ | (5,850 | ) | $ | 1,291 | $ | (4,559 | ) | ||||
| Less: reclassification adjustment for gains (losses) realized in net income | — | — | — | |||||||||
| Net unrealized loss on AFS securities | (5,850 | ) | 1,291 | (4,559 | ) | |||||||
| Net unrealized gain on cash flow hedging derivatives: | ||||||||||||
| Net unrealized gain arising during the period | 299 | (81 | ) | 218 | ||||||||
| Less: reclassification adjustment for gains (losses) realized in net income | — | — | — | |||||||||
| Net unrealized gain on cash flow hedging derivatives | 299 | (81 | ) | 218 | ||||||||
| Net unrealized gain on post-retirement plans: | ||||||||||||
| Net unrealized gain arising during the period | — | — | — | |||||||||
| Less: reclassification adjustment for gains (losses) realized in net income | — | — | — | |||||||||
| Net unrealized gain on post-retirement plans | — | — | — | |||||||||
| Other comprehensive loss | $ | (5,551 | ) | $ | 1,210 | $ | (4,341 | ) | ||||
| | | | | | | | | |
(in thousands) |
| Before Tax |
| Tax Effect |
| Net of Tax | |||
Nine Months Ended September 30, 2020 |
| |
|
| |
|
| |
|
Net unrealized gain on AFS securities: |
| |
|
| |
|
| |
|
Net unrealized gain arising during the period | | $ | 9,408 | | $ | (2,146) | | $ | 7,262 |
Less: reclassification adjustment for gains (losses) realized in net income | |
| 1,486 | |
| (355) | |
| 1,131 |
Net unrealized gain on AFS securities | |
| 7,922 | |
| (1,791) | |
| 6,131 |
| | | | | | | | | |
Net unrealized loss on derivative hedges: | |
|
| |
|
| |
|
|
Net unrealized loss arising during the period | |
| (833) | |
| 196 | |
| (637) |
Less: reclassification adjustment for gains (losses) realized in net income | |
| — | |
| — | |
| — |
Net unrealized loss on derivative hedges | |
| (833) | |
| 196 | |
| (637) |
| | | | | | | | | |
Net unrealized gain on post-retirement plans: | |
|
| |
|
| |
|
|
Net unrealized gain arising during the period | |
| — | |
| — | |
| — |
Less: reclassification adjustment for gains (losses) realized in net income | |
| — | |
| — | |
| — |
Net unrealized gain on post-retirement plans | |
| — | |
| — | |
| — |
Other comprehensive income | | $ | 7,089 | | $ | (1,595) | | $ | 5,494 |
| | | | | | | | | |
Nine Months Ended September 30, 2019 | |
|
| |
|
| |
|
|
Net unrealized gain on AFS securities: | |
|
| |
|
| |
|
|
Net unrealized gain arising during the period | | $ | 21,903 | | $ | (5,118) | | $ | 16,785 |
Less: reclassification adjustment for gains realized in net income | |
| 157 | |
| (37) | |
| 120 |
Net unrealized gain on AFS securities | |
| 21,746 | |
| (5,081) | |
| 16,665 |
| | | | | | | | | |
Net unrealized loss on cash flow hedging derivatives: | |
|
| |
|
| |
|
|
Net unrealized loss arising during the period | |
| (2,372) | |
| 554 | |
| (1,818) |
Less: reclassification adjustment for gains (losses) realized in net income | |
| — | |
| — | |
| — |
Net unrealized loss on cash flow hedging derivatives | |
| (2,372) | |
| 554 | |
| (1,818) |
| | | | | | | | | |
Net unrealized gain on post-retirement plans: | |
|
| |
|
| |
|
|
Net unrealized gain arising during the period | |
| — | |
| — | |
| — |
Less: reclassification adjustment for gains (losses) realized in net income | |
| — | |
| — | |
| — |
Net unrealized gain on post-retirement plans | |
| — | |
| — | |
| — |
Other comprehensive income | | $ | 19,374 | | $ | (4,527) | | $ | 14,847 |
47
| (in thousands) | Before Tax | Tax Effect | Net of Tax | |||||||||
| Nine Months Ended September 30, 2019 | ||||||||||||
| Net unrealized gain on AFS securities: | ||||||||||||
| Net unrealized gain arising during the period | $ | 21,903 | $ | (5,118 | ) | $ | 16,785 | |||||
| Less: reclassification adjustment for gains (losses) realized in net income | 157 | (37 | ) | 120 | ||||||||
| Net unrealized gain on AFS securities | 21,746 | (5,081 | ) | 16,665 | ||||||||
| Net unrealized loss on derivative hedges: | ||||||||||||
| Net unrealized loss arising during the period | (2,372 | ) | 554 | (1,818 | ) | |||||||
| Less: reclassification adjustment for gains (losses) realized in net income | — | — | — | |||||||||
| Net unrealized loss on derivative hedges | (2,372 | ) | 554 | (1,818 | ) | |||||||
| Net unrealized gain on post-retirement plans: | ||||||||||||
| Net unrealized gain arising during the period | — | — | — | |||||||||
| Less: reclassification adjustment for gains (losses) realized in net income | — | — | — | |||||||||
| Net unrealized gain on post-retirement plans | — | — | — | |||||||||
| Other comprehensive income | $ | 19,374 | $ | (4,527 | ) | $ | 14,847 | |||||
| Nine Months Ended September 30, 2018 | ||||||||||||
| Net unrealized loss on AFS securities: | ||||||||||||
| Net unrealized loss arising during the period | $ | (19,639 | ) | $ | 4,565 | $ | (15,074 | ) | ||||
| Less: reclassification adjustment for gains (losses) realized in net income | — | — | — | |||||||||
| Net unrealized loss on AFS securities | (19,639 | ) | 4,565 | (15,074 | ) | |||||||
| Net unrealized gain on cash flow hedging derivatives: | ||||||||||||
| Net unrealized gain arising during the period | 1,179 | (290 | ) | 889 | ||||||||
| Less: reclassification adjustment for gains (losses) realized in net income | — | — | — | |||||||||
| Net unrealized gain on cash flow hedging derivatives | 1,179 | (290 | ) | 889 | ||||||||
| Net unrealized gain on post-retirement plans: | ||||||||||||
| Net unrealized gain arising during the period | 41 | (10 | ) | 31 | ||||||||
| Less: reclassification adjustment for gains (losses) realized in net income | — | — | — | |||||||||
| Net unrealized gain on post-retirement plans | 41 | (10 | ) | 31 | ||||||||
| Other comprehensive loss | $ | (18,419 | ) | $ | 4,265 | $ | (14,154 | ) | ||||
The following table presents the changes in each component of accumulated other comprehensive income (loss), net of tax impacts, for the three and nine months ended September 30, 20192020 and 2018:
| (in thousands) | Net unrealized (loss) gain on AFS Securities | Net loss on effective cash flow hedging derivatives | Net unrealized loss on pension plans | Total | ||||||||||||
| Three Months Ended September 30, 2019 | ||||||||||||||||
| Balance at beginning of period | $ | 5,547 | $ | (3,782 | ) | $ | (888 | ) | $ | 877 | ||||||
| Other comprehensive gain (loss) before reclassifications | 2,573 | (285 | ) | — | 2,288 | |||||||||||
| Less: amounts reclassified from accumulated other comprehensive income | 120 | — | — | 120 | ||||||||||||
| Total other comprehensive income (loss) | 2,453 | (285 | ) | — | 2,168 | |||||||||||
| Balance at end of period | $ | 8,000 | $ | (4,067 | ) | $ | (888 | ) | $ | 3,045 | ||||||
| Three Months Ended September 30, 2018 | ||||||||||||||||
| Balance at beginning of period | $ | (12,595 | ) | $ | (2,064 | ) | $ | (688 | ) | $ | (15,347 | ) | ||||
| Other comprehensive (loss) gain before reclassifications | (4,559 | ) | 218 | — | (4,341 | ) | ||||||||||
| Less: amounts reclassified from accumulated other comprehensive income | — | — | — | — | ||||||||||||
| Total other comprehensive (loss) income | (4,559 | ) | 218 | — | (4,341 | ) | ||||||||||
| Balance at end of period | $ | (17,154 | ) | $ | (1,846 | ) | $ | (688 | ) | $ | (19,688 | ) | ||||
| Nine Months Ended September 30, 2019 | ||||||||||||||||
| Balance at beginning of period | $ | (8,665 | ) | $ | (2,249 | ) | $ | (888 | ) | $ | (11,802 | ) | ||||
| Other comprehensive gain (loss) before reclassifications | 16,785 | (1,818 | ) | — | 14,967 | |||||||||||
| Less: amounts reclassified from accumulated other comprehensive income | 120 | — | — | 120 | ||||||||||||
| Total other comprehensive income (loss) | 16,665 | (1,818 | ) | — | 14,847 | |||||||||||
| Balance at end of period | $ | 8,000 | $ | (4,067 | ) | $ | (888 | ) | $ | 3,045 | ||||||
| Nine Months Ended September 30, 2018 | ||||||||||||||||
| Balance at beginning of period | $ | (1,713 | ) | $ | (2,250 | ) | $ | (591 | ) | $ | (4,554 | ) | ||||
| Other comprehensive (loss) gain before reclassifications | (15,074 | ) | 889 | 31 | (14,154 | ) | ||||||||||
| Less: amounts reclassified from accumulated other comprehensive income | — | — | — | — | ||||||||||||
| Total other comprehensive (loss) income | (15,074 | ) | 889 | 31 | (14,154 | ) | ||||||||||
| Less: amounts reclassified from accumulated other comprehensive income for ASU 2018-02 | (367 | ) | (485 | ) | (128 | ) | (980 | ) | ||||||||
| Balance at end of period | $ | (17,154 | ) | $ | (1,846 | ) | $ | (688 | ) | $ | (19,688 | ) | ||||
| | | | | | | | | | | | |
|
| Net unrealized |
| Net loss on |
| Net unrealized |
| | | |||
| | gain (loss) | | effective cash | | loss | | | | |||
| | on AFS | | flow hedging | | on pension | | | | |||
(in thousands) | | Securities | | derivatives | | plans | | Total | ||||
Three Months Ended September 30, 2020 | |
| | |
| | |
| | |
| |
Balance at beginning of period | | $ | 11,412 | | $ | (1,734) | | $ | (1,157) | | $ | 8,521 |
Other comprehensive gain before reclassifications | |
| 269 | |
| 615 | |
| 0 | |
| 884 |
Less: amounts reclassified from accumulated other comprehensive income | |
| 0 | |
| 0 | |
| 0 | |
| 0 |
Total other comprehensive income | |
| 269 | |
| 615 | |
| 0 | |
| 884 |
Balance at end of period | | $ | 11,681 | | $ | (1,119) | | $ | (1,157) | | $ | 9,405 |
| | | | | | | | | | | | |
Three Months Ended September 30, 2019 | |
|
| |
|
| |
|
| |
| |
Balance at beginning of period | | $ | 5,547 | | $ | (3,782) | | $ | (888) | | $ | (5,628) |
Other comprehensive gain (loss) before reclassifications | |
| 2,573 | |
| (285) | |
| 0 | |
| 2,288 |
Less: amounts reclassified from accumulated other comprehensive income | |
| 120 | |
| 0 | |
| 0 | |
| 120 |
Total other comprehensive income (loss) | |
| 2,453 | |
| (285) | |
| 0 | |
| 2,168 |
Balance at end of period | | $ | 8,000 | | $ | (4,067) | | $ | (888) | | $ | 3,045 |
| | | | | | | | | | | | |
Nine Months Ended September 30, 2020 | |
|
| |
|
| |
|
| |
| |
Balance at beginning of period | | $ | 5,550 | | $ | (482) | | $ | (1,157) | | $ | 3,911 |
Other comprehensive gain (loss) before reclassifications | |
| 7,262 | |
| (637) | |
| 0 | |
| 6,625 |
Less: amounts reclassified from accumulated other comprehensive income | |
| 1,131 | |
| 0 | |
| 0 | |
| 1,131 |
Total other comprehensive income (loss) | |
| 6,131 | |
| (637) | |
| 0 | |
| 5,494 |
Balance at end of period | | $ | 11,681 | | $ | (1,119) | | $ | (1,157) | | $ | 9,405 |
| | | | | | | | | | | | |
Nine Months Ended September 30, 2019 | | | | | | | | | | | | |
Balance at beginning of period | | $ | (8,665) | | $ | (2,249) | | $ | (888) | | $ | (11,802) |
Other comprehensive gain (loss) before reclassifications | |
| 16,785 | |
| (1,818) | |
| 0 | |
| 14,967 |
Less: amounts reclassified from accumulated other comprehensive income | |
| 120 | |
| 0 | |
| 0 | |
| 120 |
Total other comprehensive income (loss) | |
| 16,665 | |
| (1,818) | |
| 0 | |
| 14,847 |
Balance at end of period | | $ | 8,000 | | $ | (4,067) | | $ | (888) | | $ | 3,045 |
The following tables presents the amounts reclassified out of each component of accumulated other comprehensive income (loss) for the three and nine months ended September 30, 20192020 and 2018:
| | | | | | | | | | | | | | | |
| | Three Months Ended September 30, | | Nine Months Ended September 30, | | | Affected Line Item where | ||||||||
(in thousands) |
| 2020 |
| 2019 |
| 2020 |
| 2019 |
|
| Net Income is Presented | ||||
Net realized gains on AFS securities: | |
| | |
| | |
| | |
| | | |
|
Before tax(1) | | $ | — | | $ | 157 | | $ | 1,486 | | $ | 157 | |
| Non-interest income |
Tax effect | |
| — | |
| (37) | |
| (355) | |
| (37) | |
| Tax expense |
Total reclassifications for the period | | $ | — | | $ | 120 | | $ | 1,131 | | $ | 120 | |
| Net of tax |
| Three Months Ended September 30, | Nine Months Ended September 30, | Affected Line Item where Net Income is Presented | ||||||||||||||||
| (in thousands) | 2019 | 2018 | 2019 | 2018 | ||||||||||||||
| Net realized gains on AFS securities: | ||||||||||||||||||
Before tax(1) | $ | 157 | $ | — | $ | 157 | $ | — | Non-interest income | |||||||||
| Tax effect | (37 | ) | — | (37 | ) | — | Tax expense | |||||||||||
| Total reclassifications for the period | $ | 120 | $ | — | $ | 120 | $ | — | Net of tax | |||||||||
| (1) | Net realized gains before tax include gross realized gains $1.5 million and realized losses of $22 thousand for the nine months ended September 30, 2020 and gross realized gains of $716 thousand and realized losses of $559 thousand for the three and nine months ended September 30, 2019. |
..
48
The following table presents the calculation of earnings per share:
| | | | | | | | | | | | |
| | Three Months Ended | | Nine Months Ended | ||||||||
| | September 30, | | September 30, | ||||||||
(in thousands, except per share and share data) |
| 2020 |
| 2019 |
| 2020 |
| 2019 | ||||
Net income | | $ | 8,402 | | $ | 5,015 | | $ | 24,604 | | $ | 18,413 |
| | | | | | | | | | | | |
Average number of basic common shares outstanding | |
| 15,079,413 | |
| 15,547,276 | |
| 15,358,803 | |
| 15,536,414 |
Plus: dilutive effect of stock options and awards outstanding(1) | |
| 23,421 | |
| 34,027 | |
| 23,063 | |
| 45,282 |
Average number of diluted common shares outstanding | |
| 15,102,834 | |
| 15,581,303 | |
| 15,381,866 | |
| 15,581,696 |
| | | | | | | | | | | | |
Earnings per share: | |
|
| |
|
| |
|
| |
|
|
Basic | | $ | 0.56 | | $ | 0.32 | | $ | 1.60 | | $ | 1.19 |
Diluted | | $ | 0.56 | | $ | 0.32 | | $ | 1.60 | | $ | 1.18 |
| (1) | Average diluted shares outstanding are computed using the treasury stock method. |
| Three Months Ended September 30, | Nine Months Ended September 30, | |||||||||||||||
| (in thousands, except per share and share data) | 2019 | 2018 | 2019 | 2018 | ||||||||||||
| Net income | $ | 5,015 | $ | 8,970 | $ | 18,413 | $ | 25,317 | ||||||||
| Average number of basic common shares outstanding | 15,547,276 | 15,503,488 | 15,536,414 | 15,478,207 | ||||||||||||
Plus: dilutive effect of stock options and awards outstanding (1) | 34,027 | 76,575 | 45,282 | 85,559 | ||||||||||||
Average number of diluted common shares outstanding (1) | 15,581,303 | 15,580,063 | 15,581,696 | 15,563,766 | ||||||||||||
| Anti-dilutive options excluded from earnings calculation | — | — | — | 14,394 | ||||||||||||
| Earnings per share: | ||||||||||||||||
| Basic | $ | 0.32 | $ | 0.58 | $ | 1.19 | $ | 1.64 | ||||||||
| Diluted | $ | 0.32 | $ | 0.58 | $ | 1.18 | $ | 1.63 | ||||||||
49
The Company periodically uses derivative instruments to minimize significant unplanned fluctuations in earnings and cash flows caused by interest rate volatility. The Company’s interest rate risk management strategy involves modifying the re-pricing characteristics of certain assets or liabilities so the changes in interest rates do not have a significant effect on net interest income.
The Company recognizes its derivative instruments on the consolidated balance sheet at fair value. On the date the derivative instrument is entered into, the Company designates whether the derivative is part of a hedging relationship (i.e., cash flow or fair value hedge). The Company formally documents relationships between hedging instruments and hedged items, as well as its risk management objective and strategy for undertaking hedge transactions. The Company also assesses, both at the hedge’s inception and on an ongoing basis, whether the derivatives used in hedging transactions are highly effective in offsetting the changes in cash flows or fair values of hedged items.
The Company discontinues hedge accounting when it is determinedoffers derivative products in the form of interest rate swaps, to commercial loan customers to facilitate their risk management strategies. These instruments are executed through Master Netting Arrangements ("MNA") with financial institution counterparties or Risk Participation Agreements ("RPA") with commercial bank counterparties, for which the Company assumes a pro rata share of the credit exposure associated with a borrower's performance related to the derivative is no longer effective in offsetting changes ofcontract with the hedged risk on the hedged item, or management determines the designation of the derivative as a hedging instrument is no longer appropriate.
The following tables present information about derivative assets and liabilities at September 30, 20192020 and December 31, 2018:2019:
| | | | | | | | | | | |
| | September 30, 2020 | |||||||||
| | | | Weighted | | |
| | |||
| | Notional | | Average | | Fair Value | | Location Fair | |||
| | Amount | | Maturity | | Asset (Liability) |
| Value Asset | |||
|
| (in thousands) |
| (in years) |
| (in thousands) |
| (Liability) | |||
Cash flow hedges: | | | | | | | | | | | |
Interest rate swap on wholesale fundings | | $ | 125,000 |
| | 4.1 | | $ | (6,835) | | Other liabilities |
Total cash flow hedges | |
| 125,000 |
| | 4.1 | | | (6,835) | | |
| | | | | | | | | | | |
Fair value hedges: | | | | | | | | | | | |
Interest rate swap on securities | |
| 37,190 |
| | 8.7 | |
| 3,445 | | Other assets |
Total fair value hedges | |
| 37,190 |
| | 8.7 | | | 3,445 | | |
| | | | | | | | | | | |
Economic hedges: | | | | | | | | | | | |
Forward sale commitments | |
| 47,739 |
| | 0.2 | |
| (87) | | Other liabilities |
Customer Loan Swaps-MNA Counterparty | | | 189,244 | | | 7.1 | | | (16,965) | | Other liabilities |
Customer Loan Swaps-RPA Counterparty | | | 103,391 | | | 7.8 | | | (11,071) | | Other liabilities |
Customer Loan Swaps-Customer | | | 292,635 | | | 7.4 | | | 28,036 | | Other assets |
Total economic hedges | |
| 633,009 |
| | | | | (87) | | |
| | | | | | | | | | | |
Non-hedging derivatives: | | | | | | | | | | | |
Interest rate lock commitments | |
| 27,730 |
| | 0.1 | |
| 24 | | Other assets |
Total non-hedging derivatives | |
| 27,730 |
| | 0.1 | | | 24 | | |
| | | | | | | | | | | |
Total | | $ | 822,929 | | | | | $ | (3,453) | | |
50
| | | | | | | | | | | |
| | December 31, 2019 | |||||||||
| | | | Weighted | | |
| | |||
| | Notional | | Average | | Fair Value | | Location Fair | |||
| | Amount | | Maturity | | Asset (Liability) |
| Value Asset | |||
|
| (in thousands) |
| (in years) |
| (in thousands) |
| (Liability) | |||
Cash flow hedges: |
| |
|
| |
|
| |
| | |
Interest rate swap on wholesale fundings | | $ | 100,000 |
| | 4.6 | | $ | (1,311) | | Other liabilities |
Total cash flow hedges | |
| 100,000 |
| | | |
| (1,311) | | |
| | | | | | | | | | | |
Fair value hedges: | | | | | | | | | | | |
Interest rate swap on securities | |
| 37,190 |
| | 9.6 | |
| 593 | | Other liabilities |
Total fair value hedges | |
| 37,190 |
| | | | | 593 | | |
| | | | | | | | | | | |
Economic hedges: | | | | | | | | | | | |
Forward sale commitments | | | 11,228 |
| | 0.1 | |
| (84) | | Other liabilities |
Customer Loan Swaps-MNA Counterparty | | | 135,598 |
| | 7.5 | |
| (4,669) | | (1) |
Customer Loan Swaps-RPA Counterparty | | | 69,505 |
| | 8.8 | |
| (3,377) | | (1) |
Customer Loan Swaps-Customer | | | 205,103 |
| | 8.1 | |
| 8,046 | | (1) |
Total economic hedges | |
| 421,434 |
| | | | | (84) | | |
| | | | | | | | | | | |
Non-hedging derivatives: | |
|
|
| |
| |
|
| | |
Interest rate lock commitments | |
| 21,748 |
| | 0.1 | |
| 59 | | Other assets |
Total non-hedging derivatives | |
| 21,748 |
| | | |
| 59 | | |
| | | | | | | | | | | |
Total | | $ | 580,372 | | | | | $ | (743) | | |
| September 30, 2019 | ||||||||||
Notional Amount | Weighted Average Maturity | Estimated Fair Value Asset (Liability) | ||||||||
| (in thousands) | (in years) | (in thousands) | ||||||||
| Cash flow hedges: | ||||||||||
| Interest rate cap agreements | $ | 90,000 | 3.4 | $ | 89 | |||||
| Interest rate swap on deposits | 50,000 | 4.5 | (2,179 | ) | ||||||
| Total cash flow hedges | 140,000 | (2,090 | ) | |||||||
| Economic hedges: | ||||||||||
| Forward sale commitments | 7,762 | 0.1 | (61 | ) | ||||||
| Total economic hedges | 7,762 | (61 | ) | |||||||
| Non-hedging derivatives: | ||||||||||
| Interest rate lock commitments | 12,242 | 0.1 | 78 | |||||||
| Customer loan derivative liability | 169,569 | 9.8 | (10,923 | ) | ||||||
| Customer loan derivative asset | 169,569 | 9.8 | 10,923 | |||||||
| Total non-hedging derivatives | 351,380 | 78 | ||||||||
| Total | $ | 499,142 | $ | (2,073 | ) | |||||
| (1) | Customer loan derivatives are subject to MNA or RPA arrangements with financial institution counterparties, thus assets and liabilities with the counterparty were previously netted for financial statement presentation. |
Asof September 30, 2020 and December 31, 2019,thefollowingamountswererecordedonthebalancesheetrelatedtocumulative basis adjustments for fair valuehedges:
| | | | | | | | |
|
| |
| | |
| Cumulative Amount of Fair | |
| | Location of Hedged Item on | | Carrying Amount of Hedged | | Value Hedging Adjustment in | ||
|
| Balance Sheet |
| Assets (Liabilities) |
| Carrying Amount | ||
September 30, 2020 |
|
|
| |
|
| |
|
Fair value hedges: |
|
|
| |
|
| |
|
Interest rate swap on securities |
| Securities Available for Sale | | $ | 42,564 | | $ | 5,374 |
| | | | | | | | |
December 31, 2019 |
|
| |
|
| |
|
|
Fair value hedges: |
|
| |
|
| |
|
|
Interest rate swap on securities |
| Securities Available for Sale | | $ | 39,026 | | $ | 523 |
51
| December 31, 2018 | ||||||||||
Notional Amount | Weighted Average Maturity | Estimated Fair Value Asset (Liability) | ||||||||
| (in thousands) | (in years) | (in thousands) | ||||||||
| Cash flow hedges: | ||||||||||
| Interest rate cap agreements | $ | 90,000 | 4.1 | $ | 803 | |||||
| Total cash flow hedges | 90,000 | 803 | ||||||||
| Non-hedging derivatives: | ||||||||||
| Interest rate lock commitments | 957 | 0.1 | 8 | |||||||
| Customer loan derivative liability | 45,641 | 9.9 | (1,353 | ) | ||||||
| Customer loan derivative asset | 45,641 | 9.9 | 1,353 | |||||||
| Total non-hedging derivatives | 92,239 | 8 | ||||||||
| Total | $ | 182,239 | $ | 811 | ||||||
Information about derivative assets and liabilities for the three and nine months ended September 30, 2020 and December 31, 2019, and 2018 is, as follows:
| | | | | | | | | | | | | |
| | Nine Months Ended September 30, 2020 | |||||||||||
|
| Amount of |
| |
| Amount of |
| |
| | |||
| | Gain (Loss) | | | | Gain (Loss) | | | | | |||
| | Recognized in | | | | Reclassified | | Location of | | Amount of | |||
| | Other | | Location of Gain (Loss) | | from Other | | Gain (Loss) | | Gain (Loss) | |||
| | Comprehensive | | Reclassified from Other | | Comprehensive | | Recognized in | | Recognized | |||
(in thousands) |
| Income |
| Comprehensive Income |
| Income |
| Income |
| in Income | |||
Cash flow hedges: |
| |
|
|
|
| |
|
|
|
| |
|
Interest rate swap on wholesale funding | | $ | (5,231) | | Interest expense | | $ | — |
| Interest expense | | $ | (642) |
Total cash flow hedges | |
| (5,231) |
| | |
| — |
|
| |
| (642) |
| | | | | | | | | | | | | |
Fair value hedges: | |
|
|
|
| |
|
|
|
| |
|
|
Interest rate swap on securities | |
| 4,113 |
| Interest income | |
| — |
| Interest income | |
| (145) |
Total fair value hedges | |
| 4,113 |
| | |
| — |
|
| |
| (145) |
| | | | | | | | | | | | | |
Economic hedges: | |
|
|
|
| |
|
|
|
| |
|
|
Forward commitments | |
| — |
| Other income | |
| — |
| Other income | |
| (3) |
Total economic hedges | |
| — |
| | |
| — |
|
| |
| (3) |
| | | | | | | | | | | | | |
Non-hedging derivatives: | |
|
|
|
| |
|
|
|
| |
|
|
Interest rate lock commitments | |
| — |
| Other income | |
| — |
| Other income | |
| (35) |
Total non-hedging derivatives | |
| — |
| | |
| — |
|
| |
| (35) |
| | | | | | | | | | | | | |
Total | | $ | (1,118) | | | | $ | — |
|
| | $ | (825) |
52
| Three Months Ended September 30, | Nine Months Ended September 30, | |||||||||||||||
| (in thousands) | 2019 | 2018 | 2019 | 2018 | ||||||||||||
| Cash flow hedges: | ||||||||||||||||
| Interest rate cap agreements | ||||||||||||||||
| Realized loss in interest expense | $ | (183 | ) | $ | (137 | ) | $ | (521 | ) | $ | (367 | ) | ||||
| Interest rate swap on deposits | ||||||||||||||||
| Realized gain in interest expense | 17 | — | 17 | — | ||||||||||||
| Economic hedges: | ||||||||||||||||
| Forward commitments | ||||||||||||||||
| Realized (loss) gain in other non-interest income | (31 | ) | 43 | (61 | ) | 190 | ||||||||||
| Non-hedging derivatives: | ||||||||||||||||
| Interest rate lock commitments | ||||||||||||||||
| Realized gain in other non-interest income | 7 | — | 70 | 9 | ||||||||||||
| | | | | | | | | | | | | |
| | Years Ended December 31, 2019 | |||||||||||
|
| Amount of |
| |
| Amount of |
| |
| | |||
| | Gain (Loss) | | | | Gain (Loss) | | | | Amount of | |||
| | Recognized in | | | | Reclassified | | Location of | | Gain (Loss) | |||
| | Other | | Location of Gain (Loss) | | from Other | | Gain (Loss) | | Recognized | |||
| | Comprehensive | | Reclassified from Other | | Comprehensive | | Recognized in | | Recognized | |||
(in thousands) | | Income | | Comprehensive Income | | Income | | Income | | in Income | |||
Cash flow hedges: |
| |
|
|
| |
|
|
|
|
| |
|
Interest rate swap on wholesale funding | | $ | — |
| Acquisition, restructuring, and other expenses | | $ | 3,156 |
| Interest expense | | $ | (603) |
Interest rate cap agreements | | | 2,291 | | Interest expense | | | — | | Interest expense | | | (2) |
Total cash flow hedges | | | 2,291 | | | |
| 3,156 |
| | |
| (605) |
| |
| | | | | | | | | | | |
Fair value hedges: | | |
|
|
| |
|
|
|
| |
|
|
Interest rate swap on securities | |
| (523) |
| Interest income | |
| — |
| Interest expense | |
| 7 |
Total economic hedges | | | (523) | | | |
| — |
|
| |
| 7 |
| | | | | | | | | | | | | |
Economic hedges: | | |
|
|
| |
|
|
|
| |
|
|
Forward commitments | |
| — |
| Other income | |
| — |
| Other income | |
| (84) |
Total economic hedges | | | — | | | |
| — |
|
| |
| (84) |
| |
| | | | | | | | | | | |
Non-hedging derivatives: | |
|
|
|
| |
|
|
|
| |
|
|
Interest rate lock commitments | |
| — |
| Other income | |
| — |
| Other Income | |
| 52 |
Total non-hedging derivatives | | | — | | | |
| — |
|
| |
| 52 |
| | | | | | | | | | | | | |
Total | | $ | 1,768 |
|
| | $ | 3,156 |
|
| | $ | (630) |
Cash flow hedges
Interest rate swaps on wholesale funding
In March and November 2019 and April 2020, the Company entered into interest rate swaps on wholesale borrowings (the "SWAPS") to limit its exposure to rising interest rates over a five year term on 3-month FHLB borrowings or brokered certificates, or a combination thereof at each maturity date. Under the terms of the agreement, the Company has 2 swaps each with a $50.0 million notional amount and pays a fixed interest rate of 2.46% and 1.53% respectively and 1 swap with a $25.0 million notional amount and pays a fixed rate of 0.59%. The financial institution counterparty pays the Company interest on the three-month LIBOR rate. The Company designated the swap as a cash flow hedge.
Interest rate cap agreements
In 2014, interest rate cap agreements were purchased to limit the Company’s exposure to rising interest rates on four4 rolling, three-month borrowings indexed to three-month LIBOR. Under the terms of the agreements, the Company paid total premiums of $4.6 million for the right to receive cash flow payments if three-month LIBOR rises above the caps of 3.00%, thus effectively ensuring interest expense on the borrowings at maximum rates of 3.00% for the duration of the agreements. The interest rate cap agreements were designated as cash flow hedges. The fair values ofhedges; however, the interest rate cap agreements are included in other assets on the Company’s consolidated balance sheets. Changescaps were terminated in the fairfourth quarter of 2019 and the unamortized premium totaling $3.2 million was recognized in acquisition, restructuring and other expenses.
Fair value representing unrealized gains or losses, are recorded in accumulated other comprehensive income, net of tax. The premiums paid on the interest rate cap agreements are being recognized as increases in interest expense over the duration of the agreements using the caplet method.
Interest rate swap on depositssecurities
For derivative instruments that are designated and qualify as a fair value hedge, the gain or loss on the derivative instrument as well as the offsetting loss or gain on the hedged asset or liability attributable to the hedged risk are recognized in current earnings. The Company utilizes interest rate swaps designated as fair value hedges to mitigate the effect of changing interest rates on the fair values of fixed rate callable securities available-for-sale. The hedging strategy on securities
53
converts the fixed interest rates to LIBOR-based variable interest rates. These derivatives are designated as partial term hedges of selected cash flows covering specified periods of time prior to the call dates of the hedged securities. During 2019, the Company entered into an interest rate8 swap on brokered deposits (the "SWAP") to limit its exposure to rising interest rates over a five year term. Under the terms of the agreement, the Company pays a fixed rate of 2.461% fortransactions with a notional amount of $50.0$37.2 million anddesignated as fair value hedges. These derivatives are intended to protect against the financial institution counterparty payseffects of changing interest rates on the three-month LIBOR rate.fair values of fixed rate securities. The Company designated the SWAP as a cash flow hedge and the fair value is included in other liabilitiesfixed rates on the Company's consolidated balance sheets. Changes in the fair value, representing unrealized gains or losses, are recorded in accumulated other comprehensive income, nettransactions have a weighted average of tax.
Economic hedges
Forward sale commitments
The Company utilizes forward sale commitments on residential mortgage loans to hedge interest rate risk and the associated effects on the fair value of interest rate lock commitments and loans originated for sale. The forward sale commitments are accounted for as derivatives with changes in fair value recorded in current period earnings.derivatives. The Company typically uses a combination of best efforts and mandatory delivery contracts. The contracts which are loan sale agreements where the Company commits to deliver a certain principal amount of mortgage loans to an investor at a specified price on or before a specified date. Generally, the Company may enter into mandatory delivery contracts shortly afterjust prior to the loan closesclosing with a customer.
Customer loan derivatives
The Company enters into customer loan derivatives to facilitate the risk management strategies for commercial banking customers. The Company mitigates this risk by entering into equal and offsetting loan swap agreements with highly rated third-party financial institutions. The loan swap agreements are free-standingfree standing derivatives and are recorded at fair value in the Company's consolidated balance sheet. The Company is party to master netting arrangements with its financial institutional counterparties; however, the Company does not offset assets and liabilities under these arrangements for financial statement presentation purposes.
The master netting arrangements provide for a single net settlement of all loan swap agreements, as well as collateral or cash funds, in the event of default on, or termination of, any one contract. Collateral is provided by cash or securities received or posted by the counterparty with net liability positions, respectively, in accordance with contract thresholds. Currently, the Company has posted cash of $10.7$30.5 million with counterparties.
| | | | | | | | | | | | |
| | Gross Amounts Offset in the Consolidated Balance Sheet | ||||||||||
| | Derivative | | | | Cash Collateral | | | | |||
(in thousands) |
| Liabilities |
| Derivative Assets |
| Pledged |
| Net Amount | ||||
As of September 30, 2020 | |
| | |
| | |
| | |
| |
Customer Loan Derivatives: |
| |
|
| |
|
| |
|
| |
|
MNA counterparty | | $ | (16,965) | | $ | 16,965 | | $ | 30,450 | | $ | — |
RPA counterparty | |
| (11,071) | |
| 11,071 | |
| — | |
| — |
Total | | $ | (28,036) | | $ | 28,036 | | $ | 30,450 | | $ | — |
| | | | | | | | | | | | |
| | Gross Amounts Offset in the Consolidated Balance Sheet | ||||||||||
| | Derivative | | | | Cash Collateral | | | | |||
(in thousands) |
| Liabilities |
| Derivative Assets |
| Pledged |
| Net Amount | ||||
As of December 31, 2019 | |
| | |
| | |
| | |
| |
Customer Loan Derivatives: |
| |
|
| |
|
| |
|
| |
|
MNA counterparty | | $ | (4,669) | | $ | 4,669 | | $ | 10,700 | | $ | — |
RPA counterparty | |
| (3,377) | |
| 3,377 | |
| — | |
| — |
Total | | $ | (8,046) | | $ | 8,046 | | $ | 10,700 | | $ | — |
54
Non-hedging derivatives
Interest rate lock commitments
The Company enters into interest rate lock commitments (“IRLCs”) for residential mortgage loans, which commit the counterparty.Company to lend funds to a potential borrower at a specific interest rate and within a specified period of time. IRLCs relate to the origination of residential mortgage loans that are held for sale are considered derivative financial instruments under applicable accounting guidance. Outstanding IRLCs expose the Company to the risk that the price of the mortgage loans underlying the commitments may decline due to increases in mortgage interest rates from inception of the rate lock to the funding of the loan. The IRLCs are free standing derivatives which are carried at fair value with changes recorded in non-interest income in the Company’s Consolidated Statements of Income. Changes in the fair value of IRLCs subsequent to inception are based on; (i) changes in the fair value of the underlying loan resulting from the fulfillment of the commitment and (ii) changes in the probability when the loan will fund within the terms of the commitment, which is affected primarily by changes in interest rates and the passage of time.
55
A description of the valuation methodologies used for assets and liabilities measured at fair value, as well as the general classification of such instruments pursuant to the valuation hierarchy, is set forth below. These valuation methodologies were applied to all of the Company’s financial assets and financial liabilities that are carried at fair value.
Recurring Fair Value Measurements
The following table summarizes financial assets and financial liabilities measured at fair value on a recurring basis as of September 30, 20192020 and December 31, 2018,2019, segregated by the level of the valuation inputs within the fair value hierarchy utilized to measure fair value:
| September 30, 2019 | ||||||||||||||||
| (in thousands) | Level 1 Inputs | Level 2 Inputs | Level 3 Inputs | Total Fair Value | ||||||||||||
| Available for sale securities: | ||||||||||||||||
| Mortgage-backed securities: | ||||||||||||||||
| US Government-sponsored enterprises | $ | — | $ | 349,143 | $ | — | $ | 349,143 | ||||||||
| US Government agency | — | 118,825 | — | 118,825 | ||||||||||||
| Private label | — | 19,954 | — | 19,954 | ||||||||||||
| Obligations of states and political subdivisions thereof | — | 111,226 | — | 111,226 | ||||||||||||
| Corporate bonds | — | 76,527 | — | 76,527 | ||||||||||||
| Derivative assets | — | 11,012 | 78 | 11,090 | ||||||||||||
| Derivative liabilities | — | (13,102 | ) | (61 | ) | (13,163 | ) | |||||||||
| December 31, 2018 | ||||||||||||||||
| (in thousands) | Level 1 Inputs | Level 2 Inputs | Level 3 Inputs | Total Fair Value | ||||||||||||
| Available for sale securities: | ||||||||||||||||
| Mortgage-backed securities: | ||||||||||||||||
| US Government-sponsored enterprises | $ | — | $ | 404,952 | $ | — | $ | 404,952 | ||||||||
| US Government agency | — | 110,512 | — | 110,512 | ||||||||||||
| Private label | — | 20,382 | — | 20,382 | ||||||||||||
| Obligations of states and political subdivisions thereof | — | 132,265 | — | 132,265 | ||||||||||||
| Corporate bonds | — | 57,726 | — | 57,726 | ||||||||||||
| Derivative assets | — | 2,156 | 8 | 2,164 | ||||||||||||
| Derivative liabilities | — | (1,353 | ) | — | (1,353 | ) | ||||||||||
| | | | | | | | | | | | |
| | September 30, 2020 | ||||||||||
|
| Level 1 |
| Level 2 |
| Level 3 |
| Total | ||||
(in thousands) | | Inputs | | Inputs | | Inputs | | Fair Value | ||||
Available for sale securities: | | | | |
| | |
| | |
| |
Mortgage-backed securities: |
| |
|
| |
|
| |
|
| |
|
US Government-sponsored enterprises | | $ | 0 | | $ | 235,172 | | $ | 0 | | $ | 235,172 |
US Government agency | |
| 0 | |
| 95,785 | |
| 0 | |
| 95,785 |
Private label | |
| 0 | |
| 19,603 | |
| 0 | |
| 19,603 |
Obligations of states and political subdivisions thereof | |
| 0 | |
| 154,157 | |
| 0 | |
| 154,157 |
Corporate bonds | |
| 0 | |
| 99,812 | |
| 0 | |
| 99,812 |
Derivative assets | |
| 0 | |
| 31,481 | |
| 24 | |
| 31,505 |
Derivative liabilities | |
| 0 | |
| (34,871) | |
| (87) | |
| (34,958) |
| | | | | | | | | | | | |
| | December 31, 2019 | ||||||||||
|
| Level 1 |
| Level 2 |
| Level 3 |
| Total | ||||
(in thousands) | | Inputs | | Inputs | | Inputs | | Fair Value | ||||
Available for sale securities: | |
| | |
| | |
| | |
| |
Mortgage-backed securities: |
| |
|
| |
|
| |
|
| |
|
US Government-sponsored enterprises | | $ | — | | $ | 321,969 | | $ | — | | $ | 321,969 |
US Government agency | |
| — | |
| 99,661 | |
| — | |
| 99,661 |
Private label | |
| — | |
| 19,533 | |
| — | |
| 19,533 |
Obligations of states and political subdivisions thereof | |
| — | |
| 142,006 | |
| — | |
| 142,006 |
Corporate bonds | |
| — | |
| 80,061 | |
| — | |
| 80,061 |
Derivative assets | |
| — | |
| 6,791 | |
| 59 | |
| 6,850 |
Derivative liabilities | |
| — | |
| (8,102) | |
| (84) | |
| (8,186) |
Securities Available for Sale:
All securities and major categories of securities classified as available for sale are reported at fair value utilizing Level 2 inputs. For these securities, the Company obtains fair value measurements from independent pricing providers. The fair value measurements used by the pricing providers consider observable data that may include dealer quotes, market maker quotes and live trading systems. If quoted prices are not readily available, fair values are determined using matrix pricing models, or other model-based valuation techniques requiring observable inputs other than quoted prices such as market pricing spreads, credit information, callable features, cash flows, the U.S. Treasury yield curve, trade execution data, market consensus prepayment speeds, default rates, and the securities’ terms and conditions, among other things.
Derivative Assets and Liabilities
Cash Flow and Fair Value Hedges.
The valuation of the Company's cash flow hedges are obtained from a third party. The pricing analysis is based on observable inputs for the contractual terms of the derivatives, including the period to maturity and interest rate curves. The inputs used to value the Company's cash flow hedges are all classified as Level 2 measurements.
56
Interest Rate Lock Commitments. The Company enters into IRLCs for residential mortgage loans, which commit the Company to lend funds to a potential borrower at a specific interest rate and within a specified period of time. The estimated fair value of commitments to originate residential mortgage loans for sale is based on quoted prices for similar loans in active markets. However, this value is adjusted by a factor which considers the likelihood of a loan in a lock position will ultimately close. The closing ratio is derived from the Company’s internal data and is adjusted using significant management judgment. As such, IRLCs are classified as Level 3 measurements.
Forward Sale Commitments
. The Company utilizes forward sale commitments as economic hedges against potential changes in the values of the IRLCs and loans originated for sale. The fair values of the Company’s mandatory delivery loan sale commitments are determined similarly to the IRLCs using quoted prices in the market place that are observable. However, closing ratios included in the calculation are internally generated and are based on management’s judgment and prior experience, which are not considered observable factors. As such, mandatory delivery forward commitments are classified as Level 3 measurements.
Customer Loan Derivatives.
The valuation of the Company’s customer loan derivatives is obtained from a third-party pricing service and is determined using a discounted cash flow analysis on the expected cash flows of each derivative. The pricing analysis is based on observable inputs for the contractual terms of the derivatives, including the period to maturity and interest rate curves. The Company incorporates credit valuation adjustments to appropriately reflect both its own nonperformance risk and the respective counterparty’s nonperformance risk in the fair value measurements. In adjusting the fair value of its derivative contracts for the effect of nonperformance risk, the Company has considered the impact of master netting arrangements and any applicable credit enhancements, such as collateral postings.
Although the Company has determined that the majority of the inputs used to value its customer loan derivatives fall within Level 2 of the fair value hierarchy, the credit valuation adjustments associated with its derivatives utilize Level 3 inputs, such as estimates of current credit spreads to evaluate the likelihood of default by itself and its counterparties. However, as of September 30, 2019,2020, the Company assessed the significance of the impact of the credit valuation adjustments on the overall valuation of its derivative positions and determined that the credit valuation adjustments are not significant to the overall valuation of its derivatives. As a result, the Company determined that its derivative valuations in their entirety are classified in Level 2 of the fair value hierarchy.
The table below presents the changes in Level 3 assets and liabilities that were measured at fair value on a recurring basis for the three and nine months ended September 30, 2019:2020:
| | | | | | |
| | Assets (Liabilities) | ||||
| | Interest Rate Lock | | Forward | ||
(in thousands) |
| Commitments |
| Commitments | ||
Three Months Ended September 30, 2020 | |
| | |
| |
Balance at beginning of period | | $ | 63 | | $ | (126) |
Realized (loss) gain recognized in non-interest income | |
| (39) | |
| 39 |
Balance at end of period | | $ | 24 | | $ | (87) |
| | | | | | |
Nine Months Ended September 30, 2020 | |
|
| |
|
|
Balance at beginning of period | | $ | 59 | | $ | (84) |
Realized loss recognized in non-interest income | |
| (35) | |
| (3) |
Balance at end of period | | $ | 24 | | $ | (87) |
57
| Assets (Liabilities) | ||||||||
| (in thousands) | Interest Rate Lock Commitments | Forward Commitments | ||||||
| Three Months Ended September 30, 2019 | ||||||||
| Balance at beginning of period | $ | 71 | $ | (30 | ) | |||
| Realized gain recognized in non-interest income | 7 | (31 | ) | |||||
| Balance at end of period | $ | 78 | $ | (61 | ) | |||
| Nine Months Ended September 30, 2019 | ||||||||
| Balance at beginning of period | $ | 8 | $ | — | ||||
| Realized gain (loss) recognized in non-interest income | 70 | (61 | ) | |||||
| Balance at end of period | $ | 78 | $ | (61 | ) | |||
Quantitative information about the significant unobservable inputs within Level 3 recurring assets and liabilities is, as follows:
| (in thousands, except ratios) | Fair Value September 30, 2019 | Valuation Techniques | Unobservable Inputs | Unobservable Input Value | ||||||||
| Assets (Liabilities) | ||||||||||||
| Interest Rate Lock Commitment | $ | 78 | Historical trend | Closing Ratio | 90 | % | ||||||
| Pricing Model | Origination Costs, per loan | $ | 1.7 | |||||||||
| Forward Commitments | (61 | ) | Quoted prices for similar loans in active markets. | Freddie Mac pricing system | Pair-off contract price | |||||||
| Total | $ | 17 | ||||||||||
| | | | | | | | | | | | | | |
| | Fair Value | | Fair Value | | | | | | | | | ||
(in thousands, | | September 30, | | December 31, | | Valuation | | Unobservable | | Unobservable | | |||
except ratios) |
| 2020 |
| 2019 |
| Techniques |
| Inputs |
| Input Value |
| |||
Assets (Liabilities) | |
| | |
| | |
| |
| |
| |
|
Interest Rate Lock Commitment |
| $ | 24 | | $ | 59 | | Historical trend |
| Closing Ratio |
| | 90 | % |
| |
| | |
| | | Pricing Model | | Origination Costs, per loan | | $ | 1.7 | |
| | | | | | | | |
| | | | | |
Forward Commitments | |
| (87) | |
| (84) | | Quoted prices for similar loans in active markets. |
| Freddie Mac pricing system | |
| Pair-off contract price | |
Total | | $ | (63) | | $ | (25) | |
|
|
| |
|
| |
Non-Recurring Fair Value Measurements
The Company is required, on a non-recurring basis, to adjust the carrying value or provide valuation allowances for certain assets using fair value measurements in accordance with GAAP. The following is a summary of applicable non-recurring fair value measurements:
| September 30, 2019 | December 31, 2018 | Three Months Ended September 30, 2019 | Nine Months Ended September 30, 2019 | Fair Value Measurement Date as of September 30, 2019 | ||||||||||||||
| (in thousands) | Level 3 Inputs | Level 3 Inputs | Total Gains (Losses) | Total Gains (Losses) | Level 3 Inputs | |||||||||||||
| Assets | ||||||||||||||||||
| Impaired loans | $ | 14,382 | $ | 15,213 | $ | (182 | ) | $ | 831 | September 2019 | ||||||||
| Capitalized servicing rights | 4,108 | 4,882 | — | — | September 2019 | |||||||||||||
| Other real estate owned | 2,455 | 2,351 | (146 | ) | (146 | ) | August 2019 | |||||||||||
| Assets held for sale | 1,901 | — | — | — | September 2019 | |||||||||||||
| Total | $ | 22,846 | $ | 22,446 | $ | (328 | ) | $ | 685 | |||||||||
| | | | | | | | | | | | | | |
| | | | | | | | | | | | | | Fair Value |
| | | | | | | | Three Months Ended | | Nine Months Ended | | Measurement Date as of | ||
| | Sep 30, 2020 | | Dec 31, 2019 | | September 30, 2020 | | September 30, 2020 | | September 30, 2020 | ||||
| | Level 3 | | Level 3 | | Total | | Total | | Level 3 | ||||
(in thousands) |
| Inputs |
| Inputs |
| Gains (Losses) |
| Gains (Losses) |
| Inputs | ||||
Assets | |
| | |
| | |
| | |
| | |
|
Impaired loans | | $ | 9,617 | | $ | 9,625 | | $ | (6) | | $ | (8) | | September 2020 |
Capitalized servicing rights | |
| 3,234 | | | 4,301 |
| | 323 |
| | (1,067) |
| September 2020 |
Other real estate owned | |
| 1,983 | | | 2,236 |
| | (335) |
| | (253) |
| September 2020 |
Premises held for sale | |
| 1,764 | | | 1,764 |
| | — |
| | — |
| September 2019 |
Total | | $ | 16,598 | | $ | 17,926 | | $ | (18) | | $ | (1,328) |
|
|
There are no liabilities measured at fair value on a non-recurring basis.basis in 2020 and 2019.
58
Quantitative information about the significant unobservable inputs within Level 3 non-recurring assets is, as follows:
| | | | | | | | | | | |
(in thousands, | | Fair Value | | | | | | Range |
| ||
except ratios) |
| Sep 30, 2020 |
| Valuation Techniques |
| Unobservable Inputs |
| (Weighted Average)(a) |
| ||
Assets |
| |
|
|
|
|
| | |
| |
Impaired loans | | $ | 7,071 |
| Fair value of collateral-appraised value |
| Loss severity | | | 0% to 53% | |
| | | | | |
| Appraised value | | | $0 to $1,730 | |
| | | | | | | | | | | |
Impaired loans | |
| 2,546 |
| Discount cash flow |
| Discount rate |
| | 3.50% to 9.50% | |
| | | | | |
| Cash flows | | | $21 to $1,002 | |
| | | | | | | | | | | |
Capitalized servicing rights | |
| 3,234 |
| Discounted cash flow |
| Constant prepayment rate (CPR) |
| | 16.73% | |
| |
|
|
|
|
| Discount rate |
| | 10.05% | |
| | | | | | | | | | | |
Other real estate owned | |
| 1,983 |
| Fair value of collateral less selling costs |
| Appraised value |
| | $2,000 | |
| |
|
|
|
|
| Selling Costs |
| | 6% | |
| | | | | | | | | | | |
Premises held for sale(b) | |
| 1,764 |
| Fair value of asset less selling costs |
| Appraised value | | | $136 to $527 | |
| |
|
|
|
|
| Selling Costs |
| | 6% | |
Total | | $ | 16,598 |
|
|
|
|
| |
| |
| Fair Value | Range | |||||||||||
| (in thousands, except ratios) | September 30, 2019 | Valuation Techniques | Unobservable Inputs | (Weighted Average)(a) | ||||||||
| Assets | ||||||||||||
| Impaired loans | $ | 11,419 | Fair value of collateral -appraised value | Loss severity | 0% to 61% | |||||||
| Appraised value | $0 to $6,915 | |||||||||||
| Impaired loans | 2,963 | Discount cash flow | Discount rate | 2.88% to 9.50% | ||||||||
| Cash flows | $22 to $1,019 | |||||||||||
| Capitalized servicing rights | 4,108 | Discounted cash flow | Constant prepayment rate (CPR) | 10.21 | % | |||||||
| Discount rate | 10.08 | % | ||||||||||
| Other real estate owned | 2,455 | Fair value of collateral less selling costs | Appraised value | $2,695 | ||||||||
| Selling Costs | 6% to 10% | |||||||||||
Assets held for sale(b) | 1,901 | Fair value of asset less selling costs | Appraised value | $136 to $527 | ||||||||
| Selling Costs | 6 | % | ||||||||||
| Total | $ | 22,846 | ||||||||||
| (a) | Where dollar amounts are disclosed, the amounts represent the lowest and highest fair value of the respective assets in the population except for adjustments for market/property conditions, which represents the range of adjustments to |
| (b) | The carrying value of |
| | | | | | | | | | | |
(in thousands, | | Fair Value | | | | | | Range | | ||
except ratios) |
| Dec 31, 2019 |
| Valuation Techniques |
| Unobservable Inputs |
| (Weighted Average)(a) | | ||
Assets | | | | | | | | | | | |
Impaired loans | | $ | 6,137 | | Fair value of collateral-appraised value | | Loss severity | | | 0% to 55.00% | |
| | | | | | | Appraised value | | | $0 to $6,915 | |
| | | | | | | | | | | |
Impaired loans | |
| 3,488 | | Discount cash flow | | Discount rate |
| | 2.88% to 9.50% | |
| | | | | | | Cash flows | | | $22 to $1,002 | |
| | | | | | | | | | | |
Capitalized servicing rights | |
| 4,301 | | Discounted cash flow | | Constant prepayment rate (CPR) |
| | 9.95% | |
| | | | | | | Discount rate |
| | 10.07% | |
| | | | | | | | | | | |
Other real estate owned | |
| 2,236 | | Fair value of collateral less selling costs | | Appraised value |
| | $2,695 | |
| | | | | | | Selling Costs | | | 10% to 20% | |
| | | | | | | | | | | |
Premises held for sale(b) | |
| 1,764 | | Fair value of asset less selling costs | | Appraised value |
| | $136 to $527 | |
| | | | | | | Selling Costs |
| | 6% | |
Total | | $ | 17,926 | | | | | | | | |
| Fair Value | Range | |||||||||||
| (in thousands, except ratios) | December 31, 2018 | Valuation Techniques | Unobservable Inputs | (Weighted Average)(a) | ||||||||
| Assets | ||||||||||||
| Impaired loans | $ | 11,676 | Fair value of collateral -appraised value | Loss severity | 0% to 55.00% | |||||||
| Appraised value | $0 to $6,915 | |||||||||||
| Impaired loans | 3,537 | Discount cash flow | Discount rate | 2.88% to 9.50% | ||||||||
| Cash flows | $22 to $1,072 | |||||||||||
| Capitalized servicing rights | 4,882 | Discounted cash flow | Constant prepayment rate (CPR) | 8.19 | % | |||||||
| Discount rate | 10.08 | % | ||||||||||
| Other real estate owned | 2,351 | Fair value of collateral less selling costs | Appraised value | $2,700 | ||||||||
| Selling Costs | 12.93 | % | ||||||||||
| Total | $ | 22,446 | ||||||||||
| (a) | Where dollar amounts are disclosed, the amounts represent the lowest and highest fair value of the respective assets in the population except for adjustments for market/property conditions, which represents the range of adjustments to |
| (b) | The carrying value of premises held for sale was $1.8 million as of December 31, 2019. |
There were no Level 1 or Level 2 non-recurring fair value measurements for the periods ended September 30, 20192020 and December 31, 2018.2019.
59
Impaired loans. Loans are generally not recorded at fair value on a recurring basis. Periodically, the Company records non-recurring adjustments to the carrying value of loans based on fair value measurements for partial charge-offs of the uncollectible portions of those loans. Non-recurring adjustments can also include certain impairment amounts for collateral-dependent loans calculated when establishing the allowance for credit losses. Such amounts are generally based on the fair value of the underlying collateral supporting the loan and, as a result, the carrying value of the loan less the calculated valuation amount does not necessarily represent the fair value of the loan. Real estate collateral is typically valued using appraisals or other indications of value based on recent comparable sales of similar properties or assumptions generally observable in the marketplace. However, the choice of observable data is subject to significant judgment, and there are often adjustments based on judgment in order to make observable data comparable and to consider the impact of time, the condition of properties, interest rates, and other market factors on current values. Additionally, commercial real estate appraisals frequently involve discounting of projected cash flows, which relies inherently on unobservable data. Therefore, non-recurring fair value measurement adjustments relating to real estate collateral have generally been classified as Level 3. Estimates of fair value for other collateral supporting commercial loans are generally based on assumptions not observable in the marketplace and therefore such valuations have been classified as Level 3.
Capitalized loan servicing rights
.A loan servicing right asset represents the amount by which the present value of the estimated future net cash flows to be received from servicing loans exceed adequate compensation for performing the servicing. The fair value of loan servicing rights is estimated using a present value cash flow model. The most important assumptions used in the valuation model are the anticipated rate of the loan prepayments and discount rates. Adjustments are only recorded when the discounted cash flows derived from the valuation model are less than the carrying value of the asset. Although some assumptions in determining fair value are based on standards used by market participants, some are based on unobservable inputs and therefore are classified in Level 3 of the valuation hierarchy.
Other real estate owned (“OREO”).
OREO results from the foreclosure process on residential or commercial loans issued by the Company. Upon assuming the real estate, the Company records the property at the fair value of the asset less the estimated sales costs. Thereafter, OREO properties are recorded at the lower of cost or fair value less the estimated sales costs. OREO fair values are primarily determined based on Level 3 data including sales comparables and appraisals.
Premises held for sale.
Assets held for sale, identified as part of the Company’s strategic review and branch optimization exercise, were transferred from premises and equipment at the lower of amortized cost or fair value less the estimated sales costs. Assets held for sale fair values are primarily determined based on Level 3 data including sales comparables and appraisals.
60
The estimated fair values, and related carrying amounts, of the Company’s financial instruments are included in the table below. Certain financial instruments and all non-financial instruments are excluded from disclosure requirements. Accordingly, the aggregate fair value amounts presented herein may not necessarily represent the underlying fair value of the Company.
| | | | | | | | | | | | | | | |
| | September 30, 2020 | |||||||||||||
| | Carrying | | Fair | | | | | | | | | | ||
(in thousands) |
| Amount |
| Value |
| Level 1 |
| Level 2 |
| Level 3 | |||||
Financial Assets |
| |
|
| |
|
| |
|
| |
|
| |
|
Cash and cash equivalents | | $ | 215,657 | | $ | 215,657 | | $ | 215,657 | | $ | 0 | | $ | 0 |
Securities available for sale | |
| 604,529 | |
| 604,529 | |
| 0 | |
| 604,529 | |
| 0 |
FHLB stock | |
| 13,975 | |
| 13,975 | |
| 0 | |
| 13,975 | |
| 0 |
Net loans | |
| 2,690,784 | |
| 2,672,882 | |
| 0 | |
| 0 | |
| 2,672,882 |
Accrued interest receivable | |
| 3,171 | |
| 3,171 | |
| 0 | |
| 3,171 | |
| 0 |
Cash surrender value of bank-owned life insurance policies | |
| 77,388 | |
| 77,388 | |
| 0 | |
| 77,388 | |
| 0 |
Derivative assets | |
| 31,505 | |
| 31,505 | |
| 0 | |
| 31,481 | |
| 24 |
| | | | | | | | | | | | | | | |
Financial Liabilities | |
|
| |
|
| |
|
| |
|
| |
|
|
Non-maturity deposits | | $ | 2,121,406 | | $ | 2,037,099 | | $ | 0 | | $ | 2,037,099 | | $ | 0 |
Time deposits | | | 813,509 | | | 805,783 | | | 0 | | | 805,783 | | | 0 |
Securities sold under agreements to repurchase | | | 30,048 | | | 30,048 | | | 0 | | | 30,048 | | | 0 |
FHLB advances | |
| 224,282 | |
| 229,413 | |
| 0 | |
| 229,413 | |
| 0 |
FRB PPPLF | | | 131,236 | | | 131,141 | | | 0 | | | 131,141 | | | 0 |
Subordinated borrowings | |
| 59,920 | |
| 59,920 | |
| 0 | |
| 59,920 | |
| 0 |
Derivative liabilities | |
| 34,958 | |
| 34,958 | |
| 0 | |
| 34,871 | |
| 87 |
| | | | | | | | | | | | | | | |
| | December 31, 2019 | |||||||||||||
| | Carrying | | Fair | | | | | | | | | | ||
(in thousands) |
| Amount |
| Value |
| Level 1 |
| Level 2 |
| Level 3 | |||||
Financial Assets |
| |
|
| |
|
| |
|
| |
|
| |
|
Cash and cash equivalents | | $ | 56,910 | | $ | 56,910 | | $ | 56,910 | | $ | — | | $ | — |
Securities available for sale | |
| 663,230 | |
| 663,230 | |
| — | |
| 663,230 | |
| — |
FHLB stock | |
| 20,679 | |
| 20,679 | |
| — | |
| 20,679 | |
| — |
Net loans | |
| 2,625,739 | |
| 2,634,147 | |
| — | |
| — | |
| 2,634,147 |
Accrued interest receivable | |
| 3,294 | |
| 3,294 | |
| — | |
| 3,294 | |
| — |
Cash surrender value of bank-owned life insurance policies | |
| 75,863 | |
| 75,863 | |
| — | |
| 75,863 | |
| — |
Derivative assets | |
| 6,850 | |
| 6,850 | |
| — | |
| 6,791 | |
| 59 |
| | | | | | | | | | | | | | | |
Financial Liabilities | |
|
| |
|
| |
|
| |
|
| |
|
|
Non-maturity deposits | | $ | 1,763,116 | | $ | 1,751,481 | | $ | — | | $ | 1,751,481 | | $ | — |
Time deposits | | | 932,635 | | | 932,886 | | | — | | | 932,886 | | | — |
Short-term other borrowings | |
| 44,832 | |
| 44,831 | |
| — | |
| 44,831 | |
| — |
FHLB advances | |
| 426,564 | |
| 425,989 | |
| — | |
| 425,989 | |
| — |
Subordinated borrowings | |
| 59,920 | |
| 59,920 | |
| — | |
| 59,920 | |
| — |
Derivative liabilities | |
| 8,186 | |
| 8,186 | |
| — | |
| 8,102 | |
| 84 |
61
| September 30, 2019 | ||||||||||||||||||||
| (in thousands) | Carrying Amount | Fair Value | Level 1 | Level 2 | Level 3 | |||||||||||||||
| Financial Assets | ||||||||||||||||||||
| Cash and cash equivalents | $ | 71,593 | $ | 71,593 | $ | 71,593 | $ | — | $ | — | ||||||||||
| Securities available for sale | 675,675 | 675,675 | — | 675,675 | — | |||||||||||||||
| FHLB stock | 27,469 | 27,469 | — | 27,469 | — | |||||||||||||||
| Net loans | 2,561,953 | 2,567,331 | — | — | 2,567,331 | |||||||||||||||
| Accrued interest receivable | 3,218 | 3,218 | — | 3,218 | — | |||||||||||||||
| Cash surrender value of bank-owned life insurance policies | 75,368 | 75,368 | — | 75,368 | — | |||||||||||||||
| Derivative assets | 11,090 | 11,090 | — | 11,012 | 78 | |||||||||||||||
| Financial Liabilities | ||||||||||||||||||||
| Total deposits | $ | 2,493,585 | $ | 2,491,023 | $ | — | $ | 2,491,023 | $ | — | ||||||||||
| Short-term other borrowings | 41,259 | 41,258 | — | 41,258 | — | |||||||||||||||
| FHLB advances | 600,559 | 601,377 | — | 601,377 | — | |||||||||||||||
| Subordinated borrowings | 37,928 | 37,928 | — | 37,928 | — | |||||||||||||||
| Junior subordinated borrowings | 5,000 | 4,556 | — | 4,556 | — | |||||||||||||||
| Derivative liabilities | (13,163 | ) | (13,163 | ) | — | (13,102 | ) | (61 | ) | |||||||||||
| December 31, 2018 | ||||||||||||||||||||
| (in thousands) | Carrying Amount | Fair Value | Level 1 | Level 2 | Level 3 | |||||||||||||||
| Financial Assets | ||||||||||||||||||||
| Cash and cash equivalents | $ | 98,754 | $ | 98,754 | $ | 98,754 | $ | — | $ | — | ||||||||||
| Securities available for sale | 725,837 | 725,837 | — | 725,837 | — | |||||||||||||||
| FHLB stock | 35,659 | 35,659 | — | 35,659 | — | |||||||||||||||
| Net loans | 2,476,361 | 2,415,863 | — | — | 2,415,863 | |||||||||||||||
| Accrued interest receivable | 3,533 | 3,533 | — | 3,533 | — | |||||||||||||||
| Cash surrender value of bank-owned life insurance policies | 73,810 | 73,810 | — | 73,810 | — | |||||||||||||||
| Derivative assets | 2,164 | 2,164 | — | 2,156 | 8 | |||||||||||||||
| Financial Liabilities | ||||||||||||||||||||
| Total deposits | $ | 2,483,238 | $ | 2,404,250 | $ | — | $ | 2,404,250 | $ | — | ||||||||||
| Short-term other borrowings | 36,211 | 36,171 | — | 36,171 | — | |||||||||||||||
| FHLB advances | 644,611 | 643,065 | — | 643,065 | — | |||||||||||||||
| Subordinated borrowings | 37,973 | 37,973 | — | 37,973 | — | |||||||||||||||
| Junior subordinated borrowings | 5,000 | 3,923 | — | 3,923 | — | |||||||||||||||
| Derivative liabilities | (1,353 | ) | (1,353 | ) | — | — | (1,353 | ) | ||||||||||||
The Company has accounted for the various non-interest revenue streams and related contracts under ASC 606.
Disaggregation of Revenue
The following tables present disaggregation of the Company’s non-interest revenue by major business line and timing of revenue recognition for the transfer of products or services:
| Three Months Ended September 30, | Nine Months Ended September 30, | |||||||||||||||
| (in thousands) | 2019 | 2018 | 2019 | 2018 | ||||||||||||
| Major Products/Service Lines | ||||||||||||||||
| Trust management fees | $ | 2,737 | $ | 2,720 | $ | 8,055 | $ | 8,268 | ||||||||
| Financial services fees | 276 | 232 | 781 | 768 | ||||||||||||
| Interchange fees | 1,323 | 1,146 | 3,567 | 3,277 | ||||||||||||
| Customer deposit fees | 1,112 | 1,095 | 3,046 | 3,093 | ||||||||||||
| Other customer service fees | 118 | 249 | 723 | 691 | ||||||||||||
| Total | $ | 5,566 | $ | 5,442 | $ | 16,172 | $ | 16,097 | ||||||||
| Three Months Ended September 30, | Nine Months Ended September 30, | |||||||||||||||
| (in thousands) | 2019 | 2018 | 2019 | 2018 | ||||||||||||
| Timing of Revenue Recognition | ||||||||||||||||
| Products and services transferred at a point in time | $ | 2,839 | $ | 2,583 | $ | 7,874 | $ | 7,576 | ||||||||
| Products and services transferred over time | 2,727 | 2,859 | 8,298 | 8,521 | ||||||||||||
| Total | $ | 5,566 | $ | 5,442 | $ | 16,172 | $ | 16,097 | ||||||||
| | | | | | | | | | | | |
| | Three Months Ended | | Nine Months Ended | ||||||||
| | September 30, | | September 30, | ||||||||
(in thousands) |
| 2020 |
| 2019 |
| 2020 |
| 2019 | ||||
Major Products/Service Lines |
| |
|
| |
|
| |
|
| |
|
Trust management fees | | $ | 3,256 | | $ | 2,737 | | $ | 9,194 | | $ | 8,055 |
Financial services fees | |
| 276 | |
| 276 | |
| 867 | |
| 781 |
Interchange fees | |
| 1,709 | |
| 1,323 | |
| 4,910 | |
| 3,567 |
Customer deposit fees | |
| 937 | |
| 1,112 | |
| 2,836 | |
| 3,046 |
Other customer service fees | |
| 240 | |
| 118 | |
| 691 | |
| 723 |
Total | | $ | 6,418 | | $ | 5,566 | | $ | 18,497 | | $ | 16,172 |
| | | | | | | | | | | | |
| | Three Months Ended | | Nine Months Ended | ||||||||
| | September 30, | | September 30, | ||||||||
(in thousands) |
| 2020 |
| 2019 |
| 2020 |
| 2019 | ||||
Timing of Revenue Recognition |
| |
|
| |
|
| |
|
| |
|
Products and services transferred at a point in time | | $ | 3,133 | | $ | 2,839 | | $ | 9,026 | | $ | 7,874 |
Products and services transferred over time | |
| 3,285 | |
| 2,727 | |
| 9,471 | |
| 8,298 |
Total | | $ | 6,418 | | $ | 5,566 | | $ | 18,497 | | $ | 16,172 |
Trust Management Fees.
The trust management business generates revenue through a range of fiduciary services including trust and estate administration, wealth advisory, and investment management to individuals, businesses, not-for-profit organizations, and municipalities. Revenue from these services are generally recognized over time and is typically based on a time elapsed measure of progress.service. Certain fees, such as bill paying fees, distribution fees, real estate sale fees, and supplemental tax service fees, are recorded as revenue at a point in time upon the completion of the service.
Financial Services Fees.
Bar Harbor Financial Services is a branch office of Infinex, an independent registered broker dealer offering securities and insurance products not affiliated with the Company or its subsidiaries. The Company has a revenue sharing agreement with Infinex for any financial service fee income generated. Financial services fees are recognized at a point in time upon the completion of monthly service requirements.
Interchange Fees.
The Company earns interchange fees from transaction fees that merchants pay whenever a customer uses a debit card to make a purchase from their store. The fees are paid to the card-issuing bank to cover handling costs, fraud, bad debt costs and the risk involved in approving the payment. Interchange fees are generally recognized as revenue at a point in time upon the completion of a debit card transaction.
Customer Deposit Fees.
The Customer Deposit business offers a variety of deposit accounts with a range of interest rates, fee schedules and other terms, which are designed to meet the customer's financial needs. Additional depositor-related services provided to customers include ATM, bank-by-phone, internet banking, internet bill pay, mobile banking, and other cash management
62
services which include remote deposit capture, ACH origination, and wire transfers. These customer deposit fees are generally recognized by the Company at a point in time upon the completion of the service.
Other Customer Service Fees.
The Company has certain incentive and referral fee arrangements with independent third parties in which fees are earned for new account activity, product sales, or transaction volume generated for the respective third parties. The Company also earns a percentage of the fees generated from third-party credit card plans promoted through the Bank. Revenue from these incentive and referral fee arrangements are recognized over time using the right to invoice measure of progress.
Contract Balances from Contracts with Customers
The following table provides information about contract assets or receivables and contract liabilities or deferred revenues from contracts with customers:
| (in thousands) | Balance at September 30, 2019 | Balance at December 31, 2018 | ||||||
| Balances from contracts with customers only: | ||||||||
| Other Assets | $ | 1,898 | $ | 2,866 | ||||
| Other Liabilities | 3,179 | 4,923 | ||||||
| | | | | | |
|
| Balance at |
| Balance at | ||
(in thousands) | | September 30, 2020 | | December 31, 2019 | ||
Balances from contracts with customers only: |
| |
|
| |
|
Other Assets | | $ | 1,311 | | $ | 1,236 |
Other Liabilities | |
| 2,918 | |
| 3,114 |
The timing of revenue recognition, billings and cash collections results in contract assets or receivables and contract liabilities or deferred revenue on the consolidated balance sheets. For most customer contracts, fees are deducted directly from customer accounts and, therefore, there is no associated impact on the accounts receivable balance. For certain types of service contracts, the Company has an unconditional right to consideration under the service contract and an accounts receivable balance is recorded for services completed. When consideration is received, or such consideration is unconditionally due, from a customer prior to transferring goods or services to the customer under the terms of a contract, a contract liability is recorded. Contract liabilities are recognized as revenue after control of the products or services is transferred to the customer and all revenue recognition criteria have been met.
Costs to Obtain and Fulfill a Contract
The Company currently expenses contract costs for processing and administrative fees for debit card transactions. The Company also expenses custody fees and transactional costs associated with securities transactions as well as third party tax preparation fees. The Company has elected the practical expedient in ASC 340-40-25-4, whereby the Company recognizes the incremental costs of obtaining contracts as an expense when incurred if the amortization period of the assets the Company otherwise would have recognized is one year or less.
63
A lease is defined as a contract, or part of a contract, that conveys the right to control the use of identified property, plant or equipment for a period of time in exchange for consideration. On January 1, 2019, the Company adopted ASU No. 2016-02
“Leases” and all subsequent ASUs modifying ASC 842.
The Company has elected the following practical expedients in conjunction with implementation of ASC 842 as follows:
| ● | Package of practical expedients: |
| Lease classification as an operating lease under the prior standards is grandfathered. |
| Re-evaluation of embedded leases evaluated under the prior standards is not required. |
| No re-assessment of previously recorded initial direct lease costs. |
| ● | Election to exclude short-term leases (i.e., leases with initial terms of twelve months or less), from capitalization on the consolidated balance sheets. |
The following table presents the consolidated statements of condition classification of the Company’s ROU assets and lease liabilities as of September 30, 2019:
| (in thousands) | September 30, 2019 | |||||
| Lease Right-of-Use Assets | Classification | |||||
| Operating lease right-of-use assets | Other assets | $ | 8,447 | |||
| Lease Liabilities | ||||||
| Operating lease liabilities | Other liabilities | 8,524 | ||||
| | | | | | | | |
(in thousands) |
| |
| September 30, 2020 |
| December 31, 2019 | ||
Lease Right-of-Use Assets |
| Classification | | |
| | |
|
Operating lease right-of-use assets |
| Other assets | | $ | 10,617 | | $ | 9,623 |
| | | | | | | | |
Lease Liabilities |
|
| |
|
| |
|
|
Operating lease liabilities |
| Other liabilities | |
| 10,881 | |
| 9,651 |
The calculated amount of the ROU assets and lease liabilities in the table above are impacted by the length of the lease term and the discount rate used for the present value of the minimum lease payments. The Company’s lease agreements often include one or more options to renew at the Company’s discretion. If at lease inception, the Company considers the exercising of a renewal option to be reasonably certain, the Company will include the extended term in the calculation of the ROU asset and lease liability. If there are multiple renewals typically only the next lease renewal is considered. Regarding the discount rate, ASC 842 requires the use of the rate implicit in the lease whenever this rate is readily determinable. As this rate is rarely determinable, the Company utilizes its incremental borrowing rate at lease inception, on a collateralized basis, over a similar term. For operating leases existing prior to January 1, 2019,
The following table presents the rate for the originalweighted average lease term asand discount rate of January 1, 2019 was used.the Company’s leases:
| | | | | | |
|
| September 30, 2020 |
| December 31, 2019 | ||
Weighted-average remaining lease term (in years) | |
| | |
| |
Operating leases | | 9.04 | | | 8.96 | |
| | | | | | |
Weighted-average discount rate | |
| | |
| |
Operating leases | | 3.15 | % | | 3.27 | % |
64
The following table represents lease costs and other lease information. As the Company elected, for all classes of underlying assets, not to separate lease and non-lease components and instead to account for them as a single lease component, the variable lease cost primarily represents variable payments such as real estate taxes, common area maintenance and utilities.
| (in thousands) | Three Months Ended September 30, 2019 | Nine Months Ended September 30, 2019 | ||||||
| Lease Costs | ||||||||
| Operating lease cost | $ | 234 | $ | 698 | ||||
| Variable lease cost | 69 | 277 | ||||||
| Total lease cost | $ | 303 | $ | 975 | ||||
| | | | | | |
| | Three Months Ended | | Nine Months Ended | ||
(in thousands) |
| September 30, 2020 |
| September 30, 2020 | ||
Lease Costs |
| |
|
| |
|
Operating lease cost | | $ | 344 | | $ | 988 |
Variable lease cost | |
| 59 | |
| 177 |
Total lease cost | | $ | 403 | | $ | 1,165 |
Future minimum payments for operating leases with initial or remaining terms of one year or more as of September 30, 20192020 are, as follows:
| | | |
(in thousands) |
| Operating Leases | |
Twelve Months Ended: |
| |
|
September 30, 2021 | | $ | 1,375 |
September 30, 2022 | |
| 1,404 |
September 30, 2023 | |
| 1,410 |
September 30, 2024 | |
| 1,413 |
September 30, 2025 | |
| 1,221 |
Thereafter | |
| 7,444 |
Total future minimum lease payments | |
| 14,267 |
Amounts representing interest | |
| (3,386) |
Present value of net future minimum lease payments | | $ | 10,881 |
65
| (in thousands) | Operating Leases | |||
| Twelve Months Ended: | ||||
| September 30, 2020 | $ | 911 | ||
| September 30, 2021 | 896 | |||
| September 30, 2022 | 912 | |||
| September 30, 2023 | 908 | |||
| September 30, 2024 | 917 | |||
| Thereafter | 6,065 | |||
| Total future minimum lease payments | 10,609 | |||
| Amounts representing interest | (2,085 | ) | ||
| Present value of net future minimum lease payments | $ | 8,524 | ||
GENERAL
Management’s discussion and analysis of financial condition and results of operations is intended to assist in understanding the financial condition and results of operations of the Company. The following discussion and analysis should be read in conjunction with the Company’s consolidated financial statements and the notes thereto appearing in Part I, Item 1 of this document and with the Company’s consolidated financial statements and the notes thereto and Management’s Discussion and Analysis of Financial Condition and Results of Operations included in the Company's Annual Report on Form 10-K for the year ended December 31, 2018.2019. In the following discussion, income statement comparisons are against the same period of the previous year and balance sheet comparisons are against the previous fiscal year-end, unless otherwise noted. Operating results discussed herein are not necessarily indicative of the results for the full year 20192020 or any future period. In management’s discussion and analysis of financial condition and results of operations, certain reclassifications have been made to make prior periods comparable.
Bar Harbor Bankshares
| ● | Employee and customer experience is the foundation of superior performance, which leads to significant financial benefit to shareholders |
| ● | Geography, heritage and performance are key while remaining true to a community culture |
| ● | Strong commitment to risk management while balancing growth and earnings |
| ● | Service and sales driven culture with a focus on core business growth |
| ● | Fee income is fundamental to the Company's profitability through trust and treasury management services, customer derivatives and secondary market mortgage banking |
| ● | Investment in processes, products, technology, training, leadership and infrastructure |
| ● | Expansion of the Company’s brand and business to deepen market presence |
| ● | Opportunity and growth for existing employees while adding catalyst recruits across all levels of the Company |
Shown below is a profile of the Company as of September 30, 2019:2020:
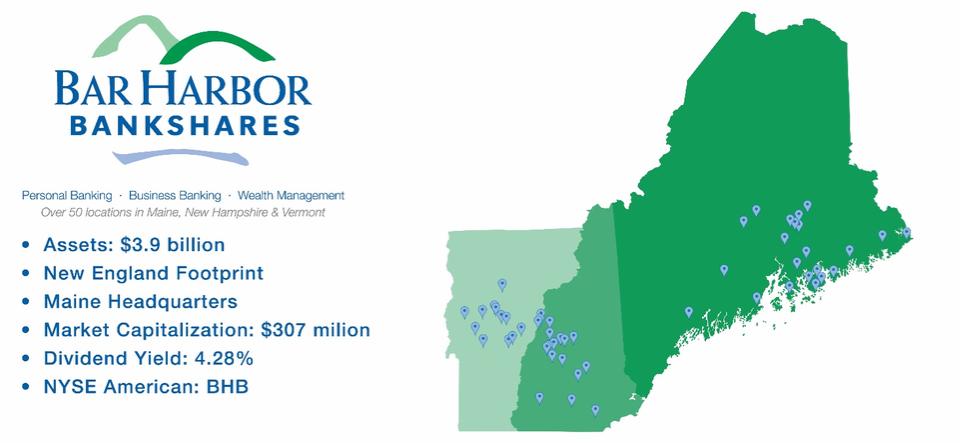
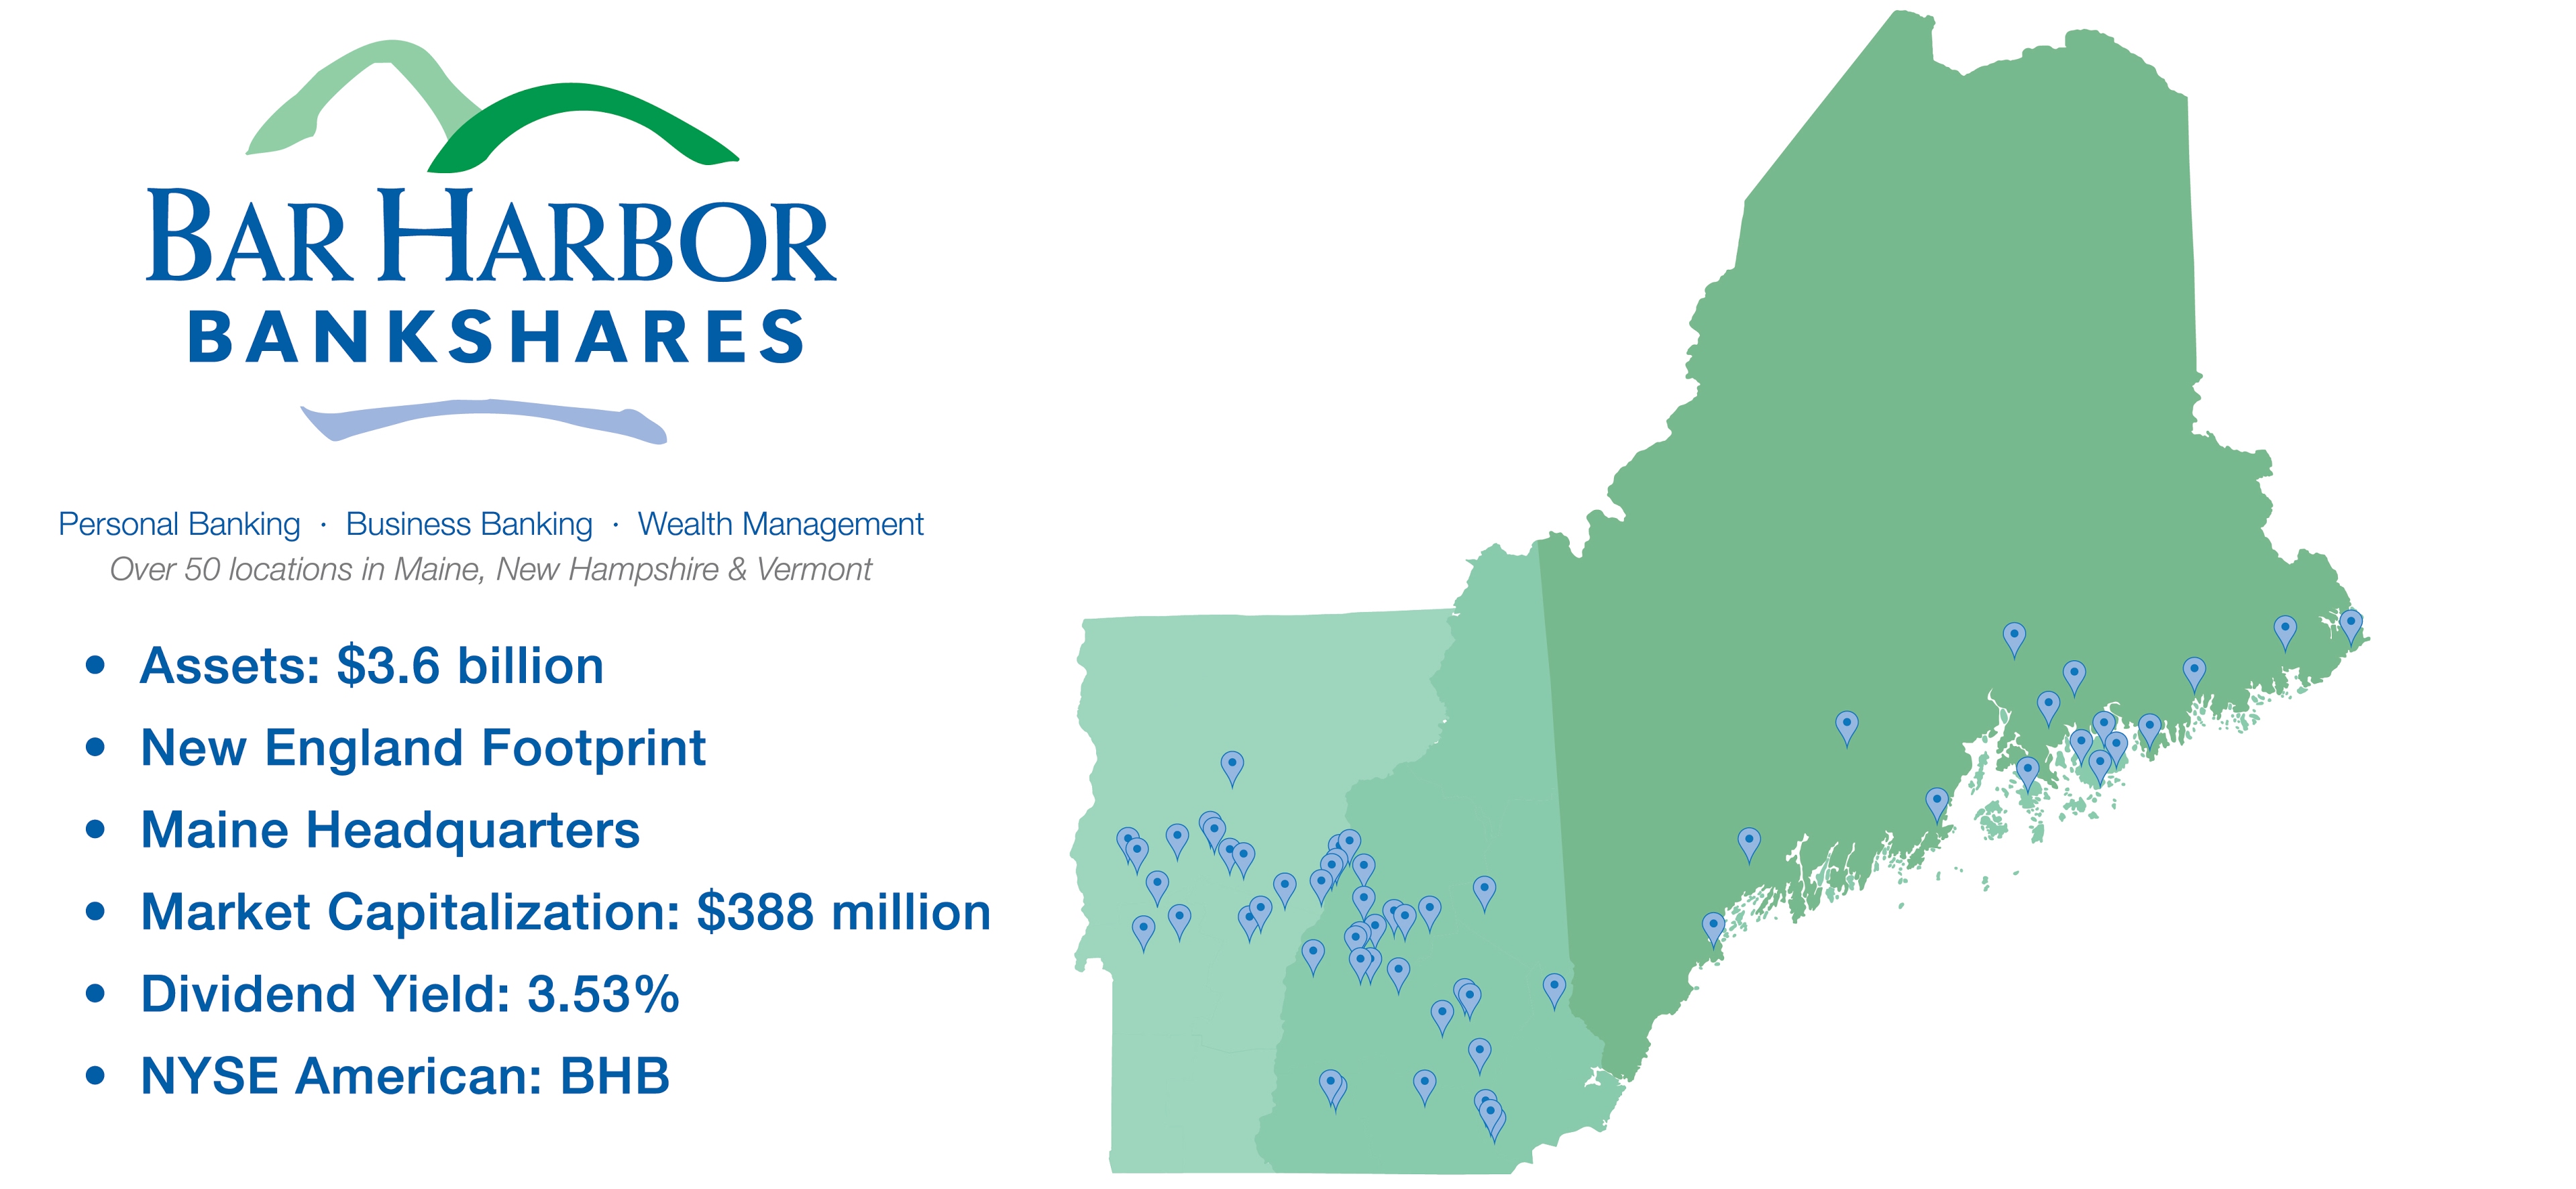
66
The following summary data is based in part on the consolidated financial statements and accompanying notes and other information appearing elsewhere in this or prior Forms 10-Q.
| | | | | | | | | | | | | |
| | Three Months Ended | | Nine Months Ended |
| ||||||||
| | September 30, | | September 30, |
| ||||||||
|
| 2020 |
| 2019 |
| 2020 |
| 2019 |
| ||||
PER SHARE DATA | | | | | | | | | | | | | |
Net earnings, diluted | | $ | 0.56 | | $ | 0.32 | | $ | 1.60 | | $ | 1.18 | |
Adjusted earnings, diluted(1) | |
| 0.61 | |
| 0.47 | |
| 1.66 | |
| 1.35 | |
Total book value | |
| 27.09 | |
| 25.37 | |
| 27.09 | |
| 25.37 | |
Tangible book value(1) | |
| 18.56 | |
| 18.49 | |
| 18.56 | |
| 18.49 | |
Market price at period end | |
| 20.55 | |
| 24.93 | |
| 20.55 | |
| 24.93 | |
Dividends | |
| 0.22 | |
| 0.22 | |
| 0.66 | |
| 0.64 | |
| | | | | | | | | | | | | |
PERFORMANCE RATIOS(2) | | | | | | | | | | | | | |
Return on assets | |
| 0.88 | % |
| 0.55 | % |
| 0.87 | % |
| 0.68 | % |
Adjusted return on assets(1) | |
| 0.96 | |
| 0.80 | |
| 0.91 | |
| 0.77 | |
Return on equity | |
| 8.22 | |
| 5.04 | |
| 8.09 | |
| 6.37 | |
Adjusted return on equity(1) | |
| 8.98 | |
| 7.36 | |
| 8.41 | |
| 7.25 | |
Adjusted return on tangible equity(1) | |
| 13.36 | |
| 10.31 | |
| 12.54 | |
| 10.25 | |
Net interest margin, fully taxable equivalent (FTE)(1) (3) | |
| 2.98 | |
| 2.75 | |
| 3.01 | |
| 2.72 | |
Net interest margin (FTE), excluding purchased loan accretion(3) | |
| 2.92 | |
| 2.65 | |
| 2.93 | |
| 2.63 | |
Efficiency ratio(1) | |
| 59.47 | |
| 65.02 | |
| 61.62 | |
| 65.83 | |
| | | | | | | | | | | | | |
GROWTH (Year-to-date)(1) | | | | | | | | | | | | | |
Total commercial loans | |
| 27 | % |
| 11 | % |
| 27 | % |
| 11 | % |
Total loans | |
| 3 | |
| 5 | |
| 3 | |
| 5 | |
Total deposits | |
| 12 | |
| 1 | |
| 12 | |
| 1 | |
| | | | | | | | | | | | | |
FINANCIAL DATA (In millions) | | | | | | | | | | | | | |
Total assets | | $ | 3,860 | | $ | 3,612 | | $ | 3,860 | | $ | 3,612 | |
Total earning assets(4) | |
| 3,312 | |
| 3,270 | |
| 3,312 | |
| 3,270 | |
Total investments | |
| 619 | |
| 703 | |
| 619 | |
| 703 | |
Total loans | |
| 2,709 | |
| 2,577 | |
| 2,709 | |
| 2,577 | |
Allowance for loan losses | |
| 18 | |
| 15 | |
| 18 | |
| 15 | |
Total goodwill and intangible assets | |
| 127 | |
| 107 | |
| 127 | |
| 107 | |
Total deposits | |
| 2,935 | |
| 2,494 | |
| 2,935 | |
| 2,494 | |
Total shareholders' equity | |
| 404 | |
| 394 | |
| 404 | |
| 394 | |
Net income | |
| 8 | |
| 5 | |
| 25 | |
| 18 | |
Adjusted income(1) | |
| 9 | |
| 7 | |
| 26 | |
| 21 | |
| | | | | | | | | | | | | |
ASSET QUALITY AND CONDITION RATIOS | | | | | | | | | | | | | |
Net charge-offs (annualized)/average loans | |
| 0.06 | % |
| 0.02 | % |
| 0.08 | % |
| 0.02 | % |
Allowance for loan losses/total loans | |
| 0.66 | |
| 0.60 | |
| 0.66 | |
| 0.60 | |
Loans/deposits | |
| 92 | |
| 103 | |
| 92 | |
| 103 | |
Shareholders' equity to total assets | |
| 10.48 | |
| 10.92 | |
| 10.48 | |
| 10.92 | |
Tangible shareholders' equity to tangible assets(1) | |
| 7.42 | |
| 8.20 | |
| 7.42 | |
| 8.20 | |
| Three Months Ended September 30, | Nine Months Ended September 30, | |||||||||||||||
| 2019 | 2018 | 2019 | 2018 | |||||||||||||
| PER SHARE DATA | ||||||||||||||||
| Net earnings, diluted | $ | 0.32 | $ | 0.58 | $ | 1.18 | $ | 1.63 | ||||||||
Adjusted earnings, diluted(1) | 0.47 | 0.58 | 1.35 | 1.66 | ||||||||||||
| Total book value | 25.37 | 23.06 | 25.37 | 23.06 | ||||||||||||
Tangible book value(1) | 18.49 | 16.11 | 18.49 | 16.11 | ||||||||||||
| Market price at period end | 24.93 | 28.72 | 24.93 | 28.72 | ||||||||||||
| Dividends | 0.22 | 0.20 | 0.64 | 0.59 | ||||||||||||
PERFORMANCE RATIOS(2) | ||||||||||||||||
| Return on assets | 0.55 | % | 1.01 | % | 0.68 | % | 0.96 | % | ||||||||
Adjusted return on assets(1) | 0.80 | 1.01 | 0.77 | 0.98 | ||||||||||||
| Return on equity | 5.04 | 9.92 | 6.37 | 9.54 | ||||||||||||
Adjusted return on equity(1) | 7.36 | 9.98 | 7.25 | 9.72 | ||||||||||||
Adjusted return on tangible equity(1) | 10.31 | 14.52 | 10.25 | 14.23 | ||||||||||||
Net interest margin, fully taxable equivalent (FTE)(1) (3) | 2.75 | 2.81 | 2.72 | 2.90 | ||||||||||||
Net interest margin (FTE), excluding purchased loan accretion((3) | 2.65 | 2.71 | 2.63 | 2.79 | ||||||||||||
Efficiency ratio(1) | 65.02 | 57.88 | 65.83 | 59.05 | ||||||||||||
GROWTH (Year-to-date)(1) | ||||||||||||||||
| Total commercial loans | 10.5 | % | 2.8 | % | 10.5 | % | 2.8 | % | ||||||||
| Total loans | 4.7 | (0.1 | ) | 4.7 | (0.1 | ) | ||||||||||
| Total deposits | 0.6 | 2.2 | 0.6 | 2.2 | ||||||||||||
FINANCIAL DATA (In millions) | ||||||||||||||||
| Total assets | $ | 3,612 | $ | 3,561 | $ | 3,612 | $ | 3,561 | ||||||||
Total earning assets(4) | 3,270 | 3,253 | 3,270 | 3,253 | ||||||||||||
| Total investments | 703 | 747 | 703 | 747 | ||||||||||||
| Total loans | 2,577 | 2,484 | 2,577 | 2,484 | ||||||||||||
| Allowance for loan losses | 15 | 13 | 15 | 13 | ||||||||||||
| Total goodwill and intangible assets | 107 | 108 | 107 | 108 | ||||||||||||
| Total deposits | 2,494 | 2,390 | 2,494 | 2,390 | ||||||||||||
| Total shareholders' equity | 394 | 358 | 394 | 358 | ||||||||||||
| Net income | 5 | 9 | 18 | 25 | ||||||||||||
Adjusted income(1) | 7 | 9 | 21 | 26 | ||||||||||||
| ASSET QUALITY AND CONDITION RATIOS | ||||||||||||||||
| Net charge-offs (current quarter annualized)/average loans | 0.02 | % | 0.04 | % | 0.02 | % | 0.06 | % | ||||||||
| Allowance for loan losses/total loans | 0.60 | 0.54 | 0.60 | 0.54 | ||||||||||||
| Loans/deposits | 103 | 104 | 103 | 104 | ||||||||||||
| Shareholders' equity to total assets | 10.92 | 10.04 | 10.92 | 10.04 | ||||||||||||
Tangible shareholders' equity to tangible assets(1) | 8.20 | 7.24 | 8.20 | 7.24 | ||||||||||||
| (1) | Non-GAAP financial measure. Refer to the Reconciliation of Non-GAAP Financial Measures section of Management's Discussion and Analysis for additional information. |
| (2) | All performance ratios are annualized and are based on average balance sheet amounts, where applicable. |
| (3) | Fully taxable equivalent considers the impact of tax-advantaged investment securities and loans. |
| (4) | Earning assets includes non-accruing loans and securities are valued at amortized cost. |
67
The following tables present the quarterly trend in loan and deposit data and accompanying quarterly and year-to-date growth rates as of September 30, 20192020 on an annualized basis:
LOAN ANALYSIS
| | | | | | | | | | | | | | | | | | | | | |
| | | | | | | | | | | | | | | | | Annualized Growth % |
| |||
| | | | | | | | | | | | | | | | | September 30, 2020 |
| |||
(in thousands, except ratios) |
| Sep 30, 2020 |
| Jun 30, 2020 |
| Mar 31, 2020 |
| Dec 31, 2019 |
| Sep 30, 2019 |
| Quarter To Date | | Year To Date | |||||||
Commercial real estate | | $ | 1,045,635 | | $ | 982,070 | | $ | 948,178 | | $ | 930,661 | | $ | 923,773 |
| 26 | % | | 16 | % |
Commercial and industrial | |
| 456,184 | |
| 472,524 | |
| 321,605 | |
| 318,988 | |
| 301,590 |
| (14) |
| | 57 | |
Total commercial loans | |
| 1,501,819 | |
| 1,454,594 | |
| 1,269,783 | |
| 1,249,649 | |
| 1,225,363 |
| 13 |
| | 27 | |
Residential real estate | |
| 1,021,206 | |
| 1,083,708 | |
| 1,132,328 | |
| 1,151,857 | |
| 1,143,452 |
| (23) |
| | (15) | |
Consumer | |
| 119,340 | |
| 124,197 | |
| 128,120 | |
| 135,283 | |
| 107,375 |
| (16) |
| | (16) | |
Tax exempt and other | |
| 66,326 | |
| 66,918 | |
| 104,752 | |
| 104,303 | |
| 101,116 |
| (4) |
| | (49) | |
Total loans | | $ | 2,708,691 | | $ | 2,729,417 | | $ | 2,634,983 | | $ | 2,641,092 | | $ | 2,577,306 |
| (3) | % | | 3 | % |
DEPOSIT ANALYSIS
| | | | | | | | | | | | | | | | | | | | | |
| | | | | | | | | | | | | | | | | Annualized Growth % | | |||
| | | | | | | | | | | | | | | | | September 30, 2020 |
| |||
(in thousands, except ratios) |
| Sep 30, 2020 |
| Jun 30, 2020 |
| Mar 31, 2020 |
| Dec 31, 2019 |
| Sep 30, 2019 |
| Quarter To Date | | Year To Date |
| ||||||
Demand | | $ | 515,064 | | $ | 504,325 | | $ | 400,410 | | $ | 414,534 | | $ | 380,707 |
| 9 | % | | 32 | % |
NOW | |
| 706,048 | |
| 642,908 | |
| 578,320 | |
| 575,809 | |
| 490,315 |
| 39 |
| | 30 | |
Savings | |
| 511,938 | |
| 466,668 | |
| 423,345 | |
| 388,683 | |
| 360,570 |
| 39 |
| | 42 | |
Money market | |
| 388,356 | |
| 402,835 | |
| 404,385 | |
| 384,090 | |
| 359,328 |
| (14) |
| | 1 | |
Total non-maturity deposits | |
| 2,121,406 | |
| 2,016,736 | |
| 1,806,460 | |
| 1,763,116 | |
| 1,590,920 |
| 21 |
| | 27 | |
Total time deposits | |
| 813,509 | |
| 678,126 | |
| 844,097 | |
| 932,635 | |
| 902,665 |
| 80 |
| | (17) | |
Total deposits | | $ | 2,934,915 | | $ | 2,694,862 | | $ | 2,650,557 | | $ | 2,695,751 | | $ | 2,493,585 |
| 36 | % | | 12 | % |
68
| LOAN ANALYSIS | ||||||||||||||||||||||||||
| September 30, 2019 Annualized Growth % | ||||||||||||||||||||||||||
| (in thousands, except ratios) | Sep 30, 2019 | Jun 30, 2019 | Mar 31, 2019 | Dec 31, 2018 | Sep 30, 2018 | Quarter End | Year to Date | |||||||||||||||||||
| Commercial real estate | $ | 923,773 | $ | 881,479 | $ | 821,567 | $ | 826,699 | $ | 840,018 | 19.2 | % | 15.7 | % | ||||||||||||
| Commercial and industrial | 301,590 | 312,029 | 305,185 | 309,544 | 303,984 | (13.4 | ) | (3.4 | ) | |||||||||||||||||
| Total commercial loans | 1,225,363 | 1,193,508 | 1,126,752 | 1,136,243 | 1,144,002 | 10.7 | 10.5 | |||||||||||||||||||
| Residential real estate | 1,143,452 | 1,167,759 | 1,184,053 | 1,144,698 | 1,140,519 | (8.3 | ) | (0.1 | ) | |||||||||||||||||
| Consumer | 107,375 | 112,275 | 111,402 | 113,960 | 117,239 | (17.5 | ) | (7.7 | ) | |||||||||||||||||
| Tax exempt and other | 101,116 | 104,696 | 104,752 | 95,326 | 81,830 | (13.7 | ) | 8.1 | ||||||||||||||||||
| Total loans | $ | 2,577,306 | $ | 2,578,238 | $ | 2,526,959 | $ | 2,490,227 | $ | 2,483,590 | (0.1 | )% | 4.7 | % | ||||||||||||
| DEPOSIT ANALYSIS | ||||||||||||||||||||||||||
| September 30, 2019 Annualized Growth % | ||||||||||||||||||||||||||
| (in thousands, except ratios) | Sep 30, 2019 | Jun 30, 2019 | Mar 31, 2019 | Dec 31, 2018 | Sep 30, 2018 | Quarter End | Year to Date | |||||||||||||||||||
| Demand | $ | 380,707 | $ | 354,125 | $ | 342,030 | $ | 370,889 | $ | 372,358 | 30.0 | % | 3.5 | % | ||||||||||||
| NOW | 490,315 | 472,576 | 470,277 | 484,717 | 471,326 | 15.0 | 1.5 | |||||||||||||||||||
| Savings | 360,570 | 352,657 | 346,813 | 358,888 | 354,908 | 9.0 | 0.6 | |||||||||||||||||||
| Money market | 359,328 | 305,506 | 349,833 | 335,951 | 254,142 | 70.5 | 9.3 | |||||||||||||||||||
| Total non-maturity deposits | 1,590,920 | 1,484,864 | 1,508,953 | 1,550,445 | 1,452,734 | 28.6 | 3.5 | |||||||||||||||||||
| Total time deposits | 902,665 | 996,512 | 956,818 | 932,793 | 937,615 | (37.7 | ) | (4.3 | ) | |||||||||||||||||
| Total deposits | $ | 2,493,585 | $ | 2,481,376 | $ | 2,465,771 | $ | 2,483,238 | $ | 2,390,349 | 2.0 | % | 0.6 | % | ||||||||||||
The following tables present average balances and average yields and rates on an annualized fully taxable equivalent basis for the periods included:
| | | | | | | | | | | | | | | | | |
|
| Three Months Ended September 30, |
| ||||||||||||||
| | 2020 | | 2019 |
| ||||||||||||
| | Average | | | | | | | Average | | | | | |
| ||
(in thousands, except ratios) |
| Balance |
| Interest(3) |
| Yield/Rate(3) |
| Balance |
| Interest(3) |
| Yield/Rate(3) |
| ||||
Assets |
| |
|
| |
|
|
|
| |
|
| |
|
|
| |
Commercial real estate | | $ | 1,012,194 | | $ | 9,691 |
| 3.81 | % | $ | 900,568 | | $ | 10,750 |
| 4.74 | % |
Commercial and industrial | |
| 531,339 | |
| 5,463 |
| 4.09 | |
| 410,453 | |
| 4,947 |
| 4.78 | |
Residential | |
| 1,060,084 | |
| 9,886 |
| 3.71 | |
| 1,154,552 | |
| 11,293 |
| 3.88 | |
Consumer | |
| 121,248 | |
| 1,042 |
| 3.42 | |
| 109,562 | |
| 1,418 |
| 5.13 | |
Total loans (1) | |
| 2,724,865 | |
| 26,082 |
| 3.81 | |
| 2,575,135 | |
| 28,408 |
| 4.38 | |
Securities and other (2) | |
| 627,162 | |
| 4,808 |
| 3.05 | |
| 732,925 | |
| 6,356 |
| 3.44 | |
Total earning assets | |
| 3,352,027 | |
| 30,890 |
| 3.67 | % |
| 3,308,060 | |
| 34,764 |
| 4.17 | % |
Other assets | |
| 462,383 | | | |
|
| |
| 333,896 | |
|
|
| | |
Total assets | | $ | 3,814,410 | | | |
|
| | $ | 3,641,956 | |
|
|
| | |
| | | | | | | | | | | | | | | | | |
Liabilities | |
|
| |
|
|
|
| |
|
| |
|
|
|
| |
NOW | | $ | 677,706 | | $ | 243 |
| 0.14 | % | $ | 487,506 | | $ | 621 |
| 0.51 | % |
Savings | |
| 488,508 | |
| 157 |
| 0.13 | |
| 359,242 | |
| 193 |
| 0.21 | |
Money market | |
| 396,351 | |
| 163 |
| 0.16 | |
| 338,013 | |
| 1,168 |
| 1.37 | |
Time deposits | |
| 777,424 | |
| 3,307 |
| 1.69 | |
| 947,949 | |
| 5,161 |
| 2.16 | |
Total interest bearing deposits | |
| 2,339,989 | |
| 3,870 |
| 0.66 | |
| 2,132,710 | |
| 7,143 |
| 1.33 | |
Borrowings | |
| 481,687 | |
| 1,941 |
| 1.60 | |
| 708,222 | |
| 4,674 |
| 2.62 | |
Total interest bearing liabilities | |
| 2,821,676 | |
| 5,811 |
| 0.82 | % |
| 2,840,932 | |
| 11,817 |
| 1.65 | % |
Non-interest bearing demand deposits | |
| 507,844 | |
|
|
|
| |
| 368,100 | |
|
|
| | |
Other liabilities | |
| 78,072 | |
|
|
|
| |
| 37,975 | |
|
|
| | |
Total liabilities | |
| 3,407,592 | |
|
|
|
| |
| 3,247,007 | |
|
|
| | |
| | | | | | | | | | | | | | | | | |
Total shareholders' equity | |
| 406,818 | |
|
|
|
| |
| 394,949 | |
|
|
| | |
| | | | | | | | | | | | | | | | | |
Total liabilities and shareholders' equity | | $ | 3,814,410 | |
|
|
|
| | $ | 3,641,956 | |
|
|
|
| |
| | | | | | | | | | | | | | | | | |
Net interest spread | |
|
| |
|
|
| 2.85 | % |
|
| |
|
|
| 2.52 | % |
Net interest margin | |
|
| |
|
|
| 2.98 | |
|
| |
|
|
| 2.75 | |
| Three Months Ended September 30, | ||||||||||||||||||||||
| 2019 | 2018 | |||||||||||||||||||||
| (in thousands, except ratios) | Average Balance | Interest (3) | Yield/Rate (3) | Average Balance | Interest (3) | Yield/Rate (3) | ||||||||||||||||
| Assets | ||||||||||||||||||||||
| Commercial real estate | $ | 900,568 | $ | 10,750 | 4.74 | % | $ | 837,058 | $ | 9,646 | 4.57 | % | ||||||||||
| Commercial and industrial | 410,453 | 4,947 | 4.78 | 388,831 | 4,497 | 4.59 | ||||||||||||||||
| Residential | 1,154,552 | 11,293 | 3.88 | 1,120,336 | 10,828 | 3.83 | ||||||||||||||||
| Consumer | 109,562 | 1,418 | 5.13 | 117,735 | 1,438 | 4.85 | ||||||||||||||||
Total loans (1) | 2,575,135 | 28,408 | 4.38 | 2,463,960 | 26,409 | 4.25 | ||||||||||||||||
Securities and other (2) | 732,925 | 6,356 | 3.44 | 773,562 | 6,267 | 3.21 | ||||||||||||||||
| Total earning assets | 3,308,060 | 34,764 | 4.17 | % | 3,237,522 | 32,676 | 4.00 | % | ||||||||||||||
| Other assets | 333,896 | 295,162 | ||||||||||||||||||||
| Total assets | $ | 3,641,956 | $ | 3,532,684 | ||||||||||||||||||
| Liabilities | ||||||||||||||||||||||
| NOW | $ | 487,506 | $ | 621 | 0.51 | % | $ | 461,875 | $ | 501 | 0.43 | % | ||||||||||
| Savings | 359,242 | 193 | 0.21 | 356,834 | 151 | 0.17 | ||||||||||||||||
| Money market | 338,013 | 1,168 | 1.37 | 259,738 | 500 | 0.76 | ||||||||||||||||
| Time deposits | 947,949 | 5,161 | 2.16 | 964,108 | 4,325 | 1.78 | ||||||||||||||||
| Total interest bearing deposits | 2,132,710 | 7,143 | 1.33 | 2,042,555 | 5,477 | 1.06 | ||||||||||||||||
| Borrowings | 708,222 | 4,674 | 2.62 | 744,632 | 4,237 | 2.26 | ||||||||||||||||
| Total interest bearing liabilities | 2,840,932 | 11,817 | 1.65 | % | 2,787,187 | 9,714 | 1.38 | % | ||||||||||||||
| Non-interest bearing demand deposits | 368,100 | 357,856 | ||||||||||||||||||||
| Other liabilities | 37,975 | 28,943 | ||||||||||||||||||||
| Total liabilities | 3,247,007 | 3,173,986 | ||||||||||||||||||||
| Total shareholders' equity | 394,949 | 358,698 | ||||||||||||||||||||
| Total liabilities and shareholders' equity | $ | 3,641,956 | $ | 3,532,684 | ||||||||||||||||||
| Net interest spread | 2.52 | % | 2.62 | % | ||||||||||||||||||
| Net interest margin | 2.75 | 2.81 | ||||||||||||||||||||
| (1) | The average balances of loans include non-accrual loans and unamortized deferred fees and costs. |
| (2) | The average balance for securities available for sale is based on amortized cost. |
| (3) | Fully taxable equivalent considers the impact of tax-advantaged securities and loans. |
69
| | | | | | | | | | | | | | | | | |
|
| Nine Months Ended September 30, |
| ||||||||||||||
| | 2020 | | 2019 |
| ||||||||||||
| | Average | | | | | | | Average | | | | | |
| ||
(in thousands, except ratios) |
| Balance |
| Interest (3) |
| Yield/Rate (3) |
| Balance |
| Interest (3) |
| Yield/Rate (3) |
| ||||
Assets | | | | | | | | | | | | | | | | | |
Commercial real estate | | $ | 972,330 | | $ | 29,895 |
| 4.11 | % | $ | 859,613 | | $ | 30,480 |
| 4.74 | % |
Commercial and industrial | |
| 493,314 | |
| 15,768 |
| 4.27 | |
| 410,350 | |
| 14,662 |
| 4.78 | |
Residential | |
| 1,103,442 | |
| 31,386 |
| 3.80 | |
| 1,157,923 | |
| 33,941 |
| 3.92 | |
Consumer | |
| 126,189 | |
| 3,929 |
| 4.16 | |
| 111,274 | |
| 4,333 |
| 5.21 | |
Total loans (1) | |
| 2,695,275 | |
| 80,978 |
| 4.01 | |
| 2,539,160 | |
| 83,416 |
| 4.39 | |
Securities and other (2) | |
| 643,978 | |
| 15,882 |
| 3.29 | |
| 761,234 | |
| 19,389 |
| 3.41 | |
Total earning assets | |
| 3,339,253 | |
| 96,860 |
| 3.87 | % |
| 3,300,394 | |
| 102,805 |
| 4.16 | % |
Other assets | |
| 424,118 | | | |
|
| |
| 335,883 | |
|
|
|
| |
Total assets | | $ | 3,763,371 | | | |
|
| | $ | 3,636,277 | |
|
|
|
| |
| | | | | | | | | | | | | | | | | |
Liabilities | |
|
| |
|
|
|
| |
|
| |
|
|
|
| |
NOW | | $ | 622,702 | | $ | 1,021 |
| 0.22 | % | $ | 472,542 | | $ | 1,764 |
| 0.50 | % |
Savings | |
| 451,952 | |
| 587 |
| 0.17 | |
| 353,117 | |
| 545 |
| 0.21 | |
Money market | |
| 393,702 | |
| 1,511 |
| 0.51 | |
| 337,822 | |
| 3,521 |
| 1.39 | |
Time deposits | |
| 813,442 | |
| 11,318 |
| 1.86 | |
| 925,508 | |
| 14,505 |
| 2.10 | |
Total interest bearing deposits | |
| 2,281,798 | |
| 14,437 |
| 0.85 | |
| 2,088,989 | |
| 20,335 |
| 1.30 | |
Borrowings | |
| 547,557 | |
| 7,149 |
| 1.74 | |
| 751,016 | |
| 15,232 |
| 2.71 | |
Total interest bearing liabilities | |
| 2,829,355 | |
| 21,586 |
| 1.02 | % |
| 2,840,005 | |
| 35,567 |
| 1.67 | % |
Non-interest bearing demand deposits | |
| 464,476 | |
|
|
|
| |
| 377,014 | |
|
|
|
| |
Other liabilities | |
| 63,226 | |
|
|
|
| |
| 32,676 | |
|
|
|
| |
Total liabilities | |
| 3,357,057 | |
|
|
|
| |
| 3,249,695 | |
|
|
|
| |
| | | | | | | | | | | | | | | | | |
Total shareholders' equity | |
| 406,314 | |
|
|
|
| |
| 386,582 | |
|
|
|
| |
| | | | | | | | | | | | | | | | | |
Total liabilities and shareholders' equity | | $ | 3,763,371 | |
|
|
|
| | $ | 3,636,277 | |
|
|
|
| |
| | | | | | | | | | | | | | | | | |
Net interest spread | |
|
| |
|
|
| 2.86 | % |
|
| |
|
|
| 2.49 | % |
Net interest margin | |
|
| |
|
|
| 3.01 | |
|
| |
|
|
| 2.72 | |
| Nine Months Ended September 30, | ||||||||||||||||||||||
| 2019 | 2018 | |||||||||||||||||||||
| (in thousands, except ratios) | Average Balance | Interest (3) | Yield/Rate (3) | Average Balance | Interest (3) | Yield/Rate (3) | ||||||||||||||||
| Assets | ||||||||||||||||||||||
| Commercial real estate | $ | 859,613 | $ | 30,480 | 4.74 | % | $ | 827,499 | $ | 27,772 | 4.49 | % | ||||||||||
| Commercial and industrial | 410,350 | 14,662 | 4.78 | 388,627 | 13,268 | 4.56 | ||||||||||||||||
| Residential | 1,157,923 | 33,941 | 3.92 | 1,131,509 | 32,669 | 3.86 | ||||||||||||||||
| Consumer | 111,274 | 4,333 | 5.21 | 119,504 | 4,163 | 4.66 | ||||||||||||||||
Total loans (1) | 2,539,160 | 83,416 | 4.39 | 2,467,139 | 77,872 | 4.22 | ||||||||||||||||
Securities and other (2) | 761,234 | 19,389 | 3.41 | 768,812 | 18,304 | 3.18 | ||||||||||||||||
| Total earning assets | 3,300,394 | 102,805 | 4.16 | % | 3,235,951 | 96,176 | 3.97 | % | ||||||||||||||
| Other assets | 335,883 | 279,192 | ||||||||||||||||||||
| Total assets | $ | 3,636,277 | $ | 3,515,143 | ||||||||||||||||||
| Liabilities | ||||||||||||||||||||||
| NOW | $ | 472,542 | $ | 1,764 | 0.50 | % | $ | 451,178 | $ | 1,285 | 0.38 | % | ||||||||||
| Savings | 353,117 | 545 | 0.21 | 356,859 | 456 | 0.17 | ||||||||||||||||
| Money market | 337,822 | 3,521 | 1.39 | 283,356 | 1,580 | 0.75 | ||||||||||||||||
| Time deposits | 925,508 | 14,505 | 2.10 | 900,315 | 10,545 | 1.57 | ||||||||||||||||
| Total interest bearing deposits | 2,088,989 | 20,335 | 1.30 | 1,991,708 | 13,866 | 0.93 | ||||||||||||||||
| Borrowings | 751,016 | 15,232 | 2.71 | 797,913 | 12,192 | 2.04 | ||||||||||||||||
| Total interest bearing liabilities | 2,840,005 | 35,567 | 1.67 | % | 2,789,621 | 26,058 | 1.25 | % | ||||||||||||||
| Non-interest bearing demand deposits | 377,014 | 341,656 | ||||||||||||||||||||
| Other liabilities | 32,676 | 28,926 | ||||||||||||||||||||
| Total liabilities | 3,249,695 | 3,160,203 | ||||||||||||||||||||
| Total shareholders' equity | 386,582 | 354,940 | ||||||||||||||||||||
| Total liabilities and shareholders' equity | $ | 3,636,277 | $ | 3,515,143 | ||||||||||||||||||
| Net interest spread | 2.49 | % | 2.72 | % | ||||||||||||||||||
| Net interest margin | 2.72 | 2.90 | ||||||||||||||||||||
(1) The average balances of loans include non-accrual loans and unamortized deferred fees and costs.
(2) The average balance for securities available for sale is based on amortized cost.
(3) Fully taxable equivalent considers the impact of tax-advantaged securities and loans.
70
This document contains certain non-GAAP financial measures in addition to results presented in accordance with accounting principles generally accepted in the United States of America ("GAAP"). These non-GAAP measures are intended to provide the reader with additional supplemental perspectives on operating results, performance trends, and financial condition. Non-GAAP financial measures are not a substitute for GAAP measures; they should be read and used in conjunction with the Company's GAAP financial information. A reconciliation of non-GAAP financial measures to GAAP measures is provided below. In all cases, it should be understood that non-GAAP measures do not depict amounts that accrue directly to the benefit of shareholders. An item that management excludes when computing non-GAAP adjusted earnings can be of substantial importance to the Company's results for any particular quarter or year. The Company's non-GAAP adjusted earnings information set forth is not necessarily comparable to non- GAAPnon-GAAP information that may be presented by other companies. Each non-GAAP measure used by the Company in this report as supplemental financial data should be considered in conjunction with the Company's GAAP financial information.
The Company utilizes the non-GAAP measure of adjusted earnings in evaluating operating trends, including components for adjusted revenue and expense. These measures exclude amounts that the Company views as unrelated to its normalized operations, including gains/losses on securities, premises, equipment and other real estate owned, acquisition costs, restructuring costs, legal settlements, and systems conversion costs. Non-GAAP adjustments are presented net of an adjustment for income tax expense.
The Company also calculates adjusted earnings per share based on its measure of adjusted earnings. The Company views these amounts as important to understanding its operating trends, particularly due to the impact of accounting standards related to acquisition activity. Analysts also rely on these measures in estimating and evaluating the Company's performance. Management also believes that the computation of non-GAAP adjusted earnings and adjusted earnings per share may facilitate the comparison of the Company to other companies in the financial services industry. The Company also adjusts certain equity related measures to exclude intangible assets due to the importance of these measures to the investment community.
71
The following table summarizes the reconciliation of non-GAAP items for the time periods presented:
| | | | | | | | | | | | | | |
| | | | Three Months Ended September 30, |
| Nine Months Ended September 30, | ||||||||
(in thousands) |
| Calculations |
| 2020 |
| 2019 | | 2020 |
| 2019 | ||||
GAAP net income |
|
| | $ | 8,402 | | $ | 5,015 | | $ | 24,604 | | $ | 18,413 |
Plus (less): |
|
| |
|
| |
|
| |
|
| |
|
|
Gain on sale of securities, net |
|
| |
| — | |
| (157) | |
| (1,486) | |
| (157) |
Loss on sale of premises and equipment, net |
|
| |
| — | |
| — | |
| 90 | |
| 21 |
Loss on other real estate owned |
|
| |
| 335 | |
| 146 | |
| 366 | |
| 146 |
Loss on debt extinguishment | | | | | — | | | — | | | 1,351 | | | — |
Acquisition, restructuring and other expenses |
|
| |
| 691 | |
| 3,039 | |
| 952 | |
| 3,319 |
Income tax expense(1) |
|
| |
| (245) | |
| (720) | |
| (304) | |
| (792) |
Total adjusted income(2) |
| (A) | | $ | 9,183 | | $ | 7,323 | | $ | 25,573 | | $ | 20,950 |
| | | | | | | | | | | | | | |
GAAP net interest income |
| (B) | | $ | 24,665 | | $ | 22,445 | | $ | 73,818 | | $ | 65,706 |
Plus: Non-interest income |
|
| |
| 10,102 | |
| 7,643 | |
| 28,233 | |
| 21,263 |
Total Revenue |
|
| |
| 34,767 | |
| 30,088 | |
| 102,051 | |
| 86,969 |
Less: Gain on sale of securities, net |
|
| |
| — | |
| (157) | |
| (1,486) | |
| (157) |
Total adjusted revenue(2) |
| (C) | | $ | 34,767 | | $ | 29,931 | | $ | 100,565 | | $ | 86,812 |
| | | | | | | | | | | | | | |
GAAP total non-interest expense |
|
| | $ | 22,419 | | $ | 23,400 | | $ | 67,044 | | $ | 62,930 |
Less: Loss on sale of premises and equipment, net |
|
| |
| — | |
| — | |
| (90) | |
| (21) |
Less: Loss on other real estate owned |
|
| |
| (335) | |
| (146) | |
| (366) | |
| (146) |
Less: Loss on debt extinguishment | | | | | — | | | — | | | (1,351) | | | — |
Less: Acquisition, restructuring and other expenses |
|
| |
| (691) | |
| (3,039) | |
| (952) | |
| (3,319) |
Adjusted non-interest expense(2) |
| (D) | | $ | 21,393 | | $ | 20,215 | | $ | 64,285 | | $ | 59,444 |
| | | | | | | | | | | | | | |
(in millions) |
|
| |
|
| |
|
| |
|
| |
|
|
Total average earning assets |
| (E) | | $ | 3,352 | | $ | 3,308 | | $ | 3,339 | | $ | 3,300 |
Total average assets |
| (F) | |
| 3,814 | |
| 3,642 | |
| 3,763 | |
| 3,636 |
Total average shareholders' equity |
| (G) | |
| 407 | |
| 395 | |
| 406 | |
| 387 |
Total average tangible shareholders' equity(2)(3) |
| (H) | |
| 279 | |
| 288 | |
| 279 | |
| 279 |
Total tangible shareholders' equity, period-end(2)(3) |
| (I) | |
| 277 | |
| 287 | |
| 277 | |
| 287 |
Total tangible assets, period-end(2)(3) |
| (J) | |
| 3,732 | |
| 3,506 | |
| 3,732 | |
| 3,506 |
| | | | | | | | | | | | | | |
(in thousands) |
|
| |
|
| |
|
| |
|
| |
|
|
Total common shares outstanding, period-end |
| (K) | |
| 14,929 | |
| 15,549 | |
| 14,929 | |
| 15,549 |
Average diluted shares outstanding |
| (L) | |
| 15,103 | |
| 15,581 | |
| 15,382 | |
| 15,582 |
| | | | | | | | | | | | | | |
Adjusted earnings per share, diluted |
| (A/L) | | $ | 0.61 | | $ | 0.47 | | $ | 1.66 | | $ | 1.35 |
Tangible book value per share, period-end(2) |
| (I/K) | |
| 18.56 | |
| 18.49 | |
| 18.56 | |
| 18.49 |
Securities adjustment, net of tax(1)(4) |
| (M) | |
| 11,681 | |
| 8,002 | |
| 11,681 | |
| 8,002 |
Tangible book value per share, excluding securities adjustment(2)(4) |
| (I+M)/K | |
| 17.78 | |
| 17.98 | |
| 17.78 | |
| 17.98 |
Total tangible shareholders' equity/total tangible assets(2) |
| (I/J) | |
| 7.42 | |
| 8.20 | |
| 7.42 | |
| 8.20 |
72
| At or for the Three Months Ended September 30, | At or for the Nine Months Ended September 30, | ||||||||||||||||
| (in thousands) | 2019 | 2018 | 2019 | 2018 | |||||||||||||
| GAAP net income | $ | 5,015 | $ | 8,970 | $ | 18,413 | $ | 25,317 | |||||||||
| Plus (less): | |||||||||||||||||
| Gain on sale of securities, net | (157 | ) | — | (157 | ) | — | |||||||||||
| Loss on sale of premises and equipment, net | — | — | 21 | — | |||||||||||||
| Loss on other real estate owned | 146 | (8 | ) | 146 | 15 | ||||||||||||
| Acquisition, restructuring and other expenses | 3,039 | 70 | 3,319 | 619 | |||||||||||||
Income tax (expense) benefit(1) | (720 | ) | (12 | ) | (792 | ) | (150 | ) | |||||||||
Total adjusted income(2) | (A) | $ | 7,323 | $ | 9,020 | $ | 20,950 | $ | 25,801 | ||||||||
| GAAP net interest income | (B) | $ | 22,445 | $ | 22,469 | $ | 65,706 | $ | 68,619 | ||||||||
| Plus: Non-interest income | 7,643 | 7,126 | 21,263 | 20,485 | |||||||||||||
Total Revenue(2) | 30,088 | 29,595 | 86,969 | 89,104 | |||||||||||||
| Less: Gain on sale of securities, net | (157 | ) | — | (157 | ) | — | |||||||||||
Total adjusted revenue(2) | (C) | $ | 29,931 | $ | 29,595 | $ | 86,812 | $ | 89,104 | ||||||||
| GAAP total non-interest expense | $ | 23,400 | $ | 17,906 | $ | 62,930 | $ | 55,443 | |||||||||
| Less: Loss on sale of premises and equipment, net | — | — | (21 | ) | — | ||||||||||||
| Less: Loss on other real estate owned | (146 | ) | 8 | (146 | ) | (15 | ) | ||||||||||
| Less: Acquisition, restructuring and other expenses | (3,039 | ) | (70 | ) | (3,319 | ) | (619 | ) | |||||||||
Adjusted non-interest expense(2) | (D) | $ | 20,215 | $ | 17,844 | $ | 59,444 | $ | 54,809 | ||||||||
| (in millions) | |||||||||||||||||
| Total average earning assets | (E) | $ | 3,308 | $ | 3,238 | $ | 3,300 | $ | 3,236 | ||||||||
| Total average assets | (F) | 3,642 | 3,533 | 3,636 | 3,515 | ||||||||||||
| Total average shareholders' equity | (G) | 395 | 359 | 387 | 355 | ||||||||||||
Total average tangible shareholders' equity(2)(3) | (H) | 288 | 251 | 279 | 247 | ||||||||||||
Total tangible shareholders' equity, period-end(2)(3) | (I) | 287 | 250 | 287 | 250 | ||||||||||||
Total tangible assets, period-end(2)(3) | (J) | 3,506 | 3,453 | 3,506 | 3,453 | ||||||||||||
| (in thousands) | |||||||||||||||||
| Total common shares outstanding, period-end | (K) | 15,549 | 15,509 | 15,549 | 15,509 | ||||||||||||
| Average diluted shares outstanding | (L) | 15,581 | 15,580 | 15,582 | 15,564 | ||||||||||||
| Adjusted earnings per share, diluted | (A/L) | $ | 0.47 | $ | 0.58 | $ | 1.35 | $ | 1.66 | ||||||||
Tangible book value per share, period-end(2) | (I/K) | 18.49 | 16.11 | 18.49 | 16.11 | ||||||||||||
Securities adjustment, net of tax(4) | (M) | 8,002 | (17,152 | ) | 8,002 | (17,152 | ) | ||||||||||
Tangible book value per share, excluding securities adjustment(4) | (I+M)/K | 17.98 | 17.22 | 17.98 | 17.22 | ||||||||||||
Total tangible shareholders' equity/total tangible assets(2) | (I/J) | 8.20 | 7.24 | 8.20 | 7.24 | ||||||||||||
| | | | | | | | | | | | | | |
|
| |
| Three Months Ended September 30, | | Nine Months Ended September 30, | ||||||||
| | Calculations | | 2020 | | 2019 | | 2020 | | 2019 | ||||
Performance ratios(5) | | | | | | | | | | | | | | |
Return on assets | |
| | | 0.88 | % | | 0.55 | % | | 0.87 | % | | 0.68 |
Adjusted return on assets(2) | | (A/F) | | | 0.96 | | | 0.80 | | | 0.91 | | | 0.77 |
Return on equity | |
| | | 8.22 | | | 5.04 | | | 8.09 | | | 6.37 |
Adjusted return on equity(2) | | (A/G) | | | 8.98 | | | 7.36 | | | 8.41 | | | 7.25 |
Adjusted return on tangible equity(2)(6) | | (A+Q)/H | | | 13.36 | | | 10.31 | | | 12.54 | | | 10.25 |
Efficiency ratio(2)(7) | | (D-O-Q)/(C+N) | | | 59.47 | | | 65.02 | | | 61.62 | | | 65.83 |
Net interest margin(2) | | (B+P)/E | | | 2.98 | | | 2.75 | | | 3.01 | | | 2.72 |
| | | | | | | | | | | | | | |
Supplementary data (in thousands) | |
| | |
| | |
| | |
| | |
|
Taxable equivalent adjustment for efficiency ratio | | (N) | | $ | 570 | | $ | 658 | | $ | 1,935 | | $ | 2,018 |
Franchise taxes included in non-interest expense | | (O) | | | 121 | | | 119 | | | 360 | | | 350 |
Tax equivalent adjustment for net interest margin | | (P) | | | 416 | | | 503 | | | 1,457 | | | 1,532 |
Intangible amortization | | (Q) | | | 256 | | | 207 | | | 768 | | | 621 |
| At or for the Three Months Ended September 30, | At or for the Nine Months Ended September 30, | ||||||||||||||||
| 2019 | 2018 | 2019 | 2018 | ||||||||||||||
Performance ratios(5) | |||||||||||||||||
| Return on assets | 0.55 | % | 1.01 | % | 0.68 | % | 0.96 | % | |||||||||
Adjusted return on assets(2) | (A/F) | 0.80 | 1.01 | 0.77 | 0.98 | ||||||||||||
| Return on equity | 5.04 | 9.92 | 6.37 | 9.54 | |||||||||||||
Adjusted return on equity(2) | (A/G) | 7.36 | 9.98 | 7.25 | 9.72 | ||||||||||||
Adjusted return on tangible equity(2)(6) | (A+Q)/H | 10.31 | 14.52 | 10.25 | 14.23 | ||||||||||||
Efficiency ratio(2)(7) | (D-O-Q)/(C+N) | 65.02 | 57.88 | 65.83 | 59.05 | ||||||||||||
Net interest margin(2) | (B+P)/E | 2.75 | 2.81 | 2.72 | 2.90 | ||||||||||||
Supplementary data (in thousands) | |||||||||||||||||
| Taxable equivalent adjustment for efficiency ratio | (N) | $ | 658 | $ | 654 | $ | 2,018 | $ | 1,921 | ||||||||
| Franchise taxes included in non-interest expense | (O) | 119 | 129 | 350 | 440 | ||||||||||||
| Tax equivalent adjustment for net interest margin | (P) | 503 | 493 | 1,532 | 1,498 | ||||||||||||
| Intangible amortization | (Q) | 207 | 207 | 621 | 621 | ||||||||||||
| (1) | Assumes a marginal tax rate of |
| (2) | Non-GAAP financial measure. |
| (3) | Tangible shareholders' equity is computed by taking total shareholders' equity less the intangible assets at period-end. Tangible assets is computed by taking total assets less the intangible assets at period-end. |
| (4) | Securities adjustment, net of tax represents the total unrealized loss on available-for-sale securities recorded on the Company's consolidated balance sheets within total common shareholders' equity. |
| (5) | All performance ratios are based on average balance sheet amounts, where applicable. |
| (6) | Adjusted return on tangible equity is computed by |
| (7) | Efficiency ratio is computed by dividing adjusted non-interest expense net of franchise taxes and intangible amortization divided by |
73
The Company reported third quarter 20192020 net income of $8.4 million or $0.56 per share compared to $5.0 million or $0.32 diluted earnings per share. Net incomeshare in the same quarter of 2018 totaled $9.0 million, or $0.58 diluted earnings per share.2019. Adjusted earnings (non-GAAP measure) increased 30% to $9.2 million, or $0.61 per share in the third quarter 2019 totaled2020 compared to $7.3 million or $0.47 diluted earnings per share a 15% increase fromin the priorthird quarter of $6.3 million or $0.41 diluted earnings per share. 2019.
Financial highlights for the third quarter 20192020 include the following:
| ● | 13% annualized growth in total commercial loans |
| ● | 92% loan to deposit ratio |
| ● | 2.98% net interest margin compared to 2.75% |
| ● | 32% increase in non-interest income |
| ● | 0.56% non-accruing loans to total loans, excluding Paycheck Protection Program (PPP) loans |
| ● | 0.88% return on assets compared to 0.55%; 0.96% core return on assets compared to 0.80% (non-GAAP) |
| ● | 59.5% efficiency ratio compared to 65.0% |
As a planned deleveraging strategy was executed resulting in decreasing the securities portfolio by nearly $73.0 million and using the proceeds to pay off higher cost borrowings. This resulted in yields from securities expanding 15 basis points and borrowings costs decreasing 12 basis points compared to the prior quarter. The commercial team delivered another quarter of strong double digit growth across the Company’s three state footprint including its loan production office in Portland, Maine, which also contributed to significant customer derivative income. Loan quality continues to be strong with net charge-offs close to zero, indicative of a disciplined approach to credit quality, risk mitigation, and an effort focused on proven operators with appropriate loan structures. Growth in non-maturity deposits was up during the quarter, 29% on an annualized basis. That improvement is the direct result of the sales culture, whichwell executed strategies, the Company has been cultivating over the past year under new leadership. All of these efforts in theexpanded all key performance metrics on a year-over-year and prior quarter resulted in a 6% annualized increasebasis. These strategies not only entailed expense and deleveraging initiatives, but also focused on increasing core deposits thus reducing overall funding costs, and expanding fee income. Adjusted return on assets increased to tangible book value per share.
The Company’s wealth management business continues to be a significant contributor to fee income, as well as a keystone for deepening customer relationships with $2.1 billion in assets under management. Recently, the leadership and operations of the wealth management businesses was combined onto a common platform, which led to increase efficiency while improving customer service. These strategic decisions alongunified policies and best practices. The Company is now working with regulators to bring both of its wealth management companies and brokerage teams under one name Bar Harbor Wealth Management. Bringing this business together under one brand was the elimination of other redundancieslogical next step as talent, engagement and implemented efficiencies are expectedculture is aligned.
The Company’s allowance for loan losses is well established to be accretive to earningsabsorb any inherent losses in the firstportfolio and increased during the quarter on higher commercial loan growth. Steady allowance levels coupled with an extensive stress testing process reflects the quality of 2020 thereby allowingthe Company’s credit culture as net charge-offs and past due accounts remain low. Third quarter stress testing resulted in no significant risk-rating downgrades or changes to reserves. While the hotel industry is a platformlarge credit exposure for profitable growth with positive operating leverage.
The Company has supported its customers during the COVID-19 pandemic by originating approximately 1,900 PPP loans totaling $131.5 million. Net unearned fees remaining on PPP loans at the end of the third quarter 2019.was $3.8 million and accretion will accelerate as the loans are reimbursed by the Small Business Administration (“SBA”). Despite the significant challenges posed by the pandemic and related market conditions, the Company continues to maintain high levels of capital and liquidity, diversified revenue streams, strong credit performance and an exceptional core deposit base.
74
COMPARISON OF FINANCIAL CONDITION AT SEPTEMBER 30, 20192020 AND DECEMBER 31, 2018
Total assets increased $4.0 million to $3.6were $3.9 billion at the end of the third quarter 20192020 compared with year-end 2018. Loans increased to $2.6 billion from $2.5$3.7 billion at year-end 2018 on growth from commercial loans offset in part by lower residential loans primarily due to higher secondary market sales. Securities decreased $58.4 to $703.1 million at the end of the third quarter from year-end 2018 which includes the impact of the executed deleveraging strategy in the third quarter.2019. Asset quality metrics remain strong with an allowance for loan losses to total loans ratio of 0.60% with a coverage ratio0.66% compared to non-accruing loans at 92%, up from 76%0.58% as of year-end 2018.2019. The loan to deposit ratio
Securities
Securities totaled $703.1$618.5 million in the third quarter 20192020 and $761.5$683.9 million at year-end 20182019 representing 19%16% and 21%19% of total assets, respectfully. Those ratios are within the tolerance range ofrespectively. The decrease in security holdings reflects the Company’s investment policy and the decrease is the result of the balance sheet deleveraging strategy with opportunistic salesto reduce borrowings and allow for the natural run-off.run-off of amortizing and maturing fixed rate investments. Securities purchased in 2019the first nine months of 2020 included $52.6$66.0 million of mortgage-backed securities guaranteed by US Government-sponsored enterprises, $24.0$31.2 million of tax exempt municipal bonds, $32.0 million of corporate bonds and $1.9 million in community investments, in addition to a net $8.2$6.7 million decrease in FHLB stock. The purchases were offset by sales$199.3 million of $68.0 million,sales, maturities, calls and pay-downs of amortizing securities of $80.5securities. Fair value adjustments increased the security portfolio by $11.7 million and a $21.7 million increase in fair value. The increase in fair value was primarily caused by lower long-term interest rates at the end of the third quarter 2019 as compared2020 and $5.5 million at year-end 2019. The improvement in fair value continues to year-end 2018.be the result of lower long-term interest rates. The weighted average yield on the Company’s security profileCompany's securities portfolio as of September 30, 20192020 was 3.44% for the quarter3.05% compared to 3.28%3.42% at year-end 2018.2019. At the end of the third quarter 2019,2020, securities held by the Company had a weightedan average life of 4.34.0 years and a duration of 2.9 years compared to a weighted average life of 5.25.0 years and a duration of 3.93.6 years at the end of 2018,2019, respectively.
Loans
Loan balances in the third quarter 2020 were $2.7 billion compared to $2.6 billion year-end 2019. The increase is primarily due to commercial real estate growth and PPP originations offset by secondary market sales and prepayments of residential mortgages. In the first nine months of 2020, commercial real estate increased $115.0 million during at an increaseannualized rate of $87.116% and commercial and industrial (“C&I”) loans increased $9.5 million or 4.7%4% on an annualized basis excluding PPP loans. The increase in C&I was tempered by one customer with loans totaling $39.8 million that were refinanced to a lower principal of $25.0 million along with an open line of credit with no current advances. Mortgage loan originations totaled $86.5 million from year-end 2018. Commercial real estate grew significantly during 2019new and refinancing activity given the lower interest rate environment. Most residential originations were sold in the secondary market to generate fee income.
Asset Quality
The allowance for loan losses totaled $17.9 million at a rate of 15.7% due to executionthe end of the Company’s growing pipeline across New Hampshire, Vermont,third quarter 2020 and Maine$15.4 million at year-end 2019. The $2.6 million increase reflects a provision for loan loss of $4.3 million offset by net charge offs of $1.7 million. Excluding PPP loans the allowance for loan losses to total loans ratio for the third quarter was 0.69% from 0.58% at year-end 2019. Delinquent and loan production office centered in Portland, Maine. Residentialnon-accrual loans were flatas a percentage of total loans decreased to 0.77% from 1.19% at the end of 2019. Commercial non-accrual loans in the first nine months of 2019increased $1.2 million primarily due to higher sales intwo commercial loan relationships totaling $1.4 million, one was written down by $349 thousand and the secondaryother has subsequently settled at its carrying value.
In March 2020, the Company elected to defer implementation of CECL as allowed under the CARES Act. As result, the Company continues to operate its incurred loss model. While the impact of COVID-19 and other market givenconditions remain uncertain, the overall rate environment and initiatives around profit as fee income is central toCompany believes the Company’s strategic focus. Yields also increased among all product lines as variable rate loans repriced to higher levels benefiting from the Federal Reserve Bank (“FRB”) rate hikes in 2018.
The Company performed third quarter stress testing of the commercial loan portfolio including the top 50 relationships, all criticized loans greater than $1.0 million, hospitality loans over $250 thousand with loan to values in excess of 65%, and any seasonal payment, restaurant, or term loans maturing within a year that are greater than $500 thousand. Results of the testing led to no significant risk-rating downgrades or changes to reserves or any other meaningful deterioration in the overall quality of the commercial portfolio. Any impact from $13.9 millionthe stress testing was considered in the adequacy of the allowance for loan losses as of September 30, 2020.
75
Goodwill
The Company completed its 2020 annual goodwill impairment test using balance sheet and market data as of September 30, 2020. The Company’s models suggest that the fair value of the business is greater than the book value or market capitalization based on the price at year-end 2018 due to loan growth offset by lower specific reserves on fewer non-accruing loans. Non-accruing loans decreased $1.6 million in 2019 aswhich the stock is currently trading. While the Company benefited from favorable settlements of several credit relationships that approximated the carrying values of the loans. These improvements decreased the ratio of non-accruing loansconcluded there is no goodwill impairment, it will continue to total loans to 0.65% from 0.73%evaluate its position as economic conditions change.
Deposits and Borrowings
Total deposits were $2.9 billion at the end of 2018the third quarter 2020 and decreased the ratio of non-performing assets to total assets to 0.53% from 0.57%$2.7 billion at the end of 2018.
Derivative Financial Instruments
The notional balance of derivative financial instruments increased to $499.1$822.9 million at the end of the third quarter 20192020 from $182.2$580.4 million at year-end 2018.2019. The increase includesis principally due to a $50.0$175.0 million notional amount related to an interest rate swap on brokered certificate of deposits to limit the Company’s exposure to rising interest rates over a five-year term. Additionally, as a result of commercial loan growth, the Company increasedincrease in customer loan derivatives by $247.9 millionsold on commercial loans with matching hedges using a national bank counterparty.counterparties and a $36.5 million increase in forward commitments to sell mortgages in the secondary market. The net fair value of totalall derivatives was a liability of $2.1$3.5 million at the end of the third quarter 20192020 compared to asset of $811$743 thousand at year-end 2018.
Equity
Total equity was $394.5$404.4 million, compared with $370.6$396.4 million at year-end 2018. The Company’s book value per share increased $1.50 to $25.37 from year-end 2018.2019. The increase was primarily due toincludes a $14.9$6.1 million improvement in the Company’s securities fair value adjustment,of securities, net of tax, along with strong net income of $18.4$24.6 million offset by $9.9$10.1 million in dividends.dividends and common stock repurchases of $13.3 million. Stock repurchases totaled 297 thousand shares during the third quarter 2020 and 689 thousand shares on a year-to-date basis. An additional 92 thousand shares are available to be repurchased before the end of March in 2021. The Company's book value per share increased to $27.09 at the end of the third quarter 2020 from $25.48 at year-end 2019. Tangible book value per share (non-GAAP measure) increased to $18.49$18.56 per share at September 30, 2020 up from $16.94$17.30 per share at year-end 2018. Additionally, tangible book value per share excluding the impact2019, an increase of securities fair value adjustments (non-GAAP measure) increased to $17.98, up from $17.50 at year-end 2018. The Company evaluates changes in tangible book value excluding securities adjustment, a non-GAAP financial measure, which is a commonly considered valuation metric used by the investment community and which parallels some regulatory capital measures. The Company and the Bank remained "well capitalized" under regulatory guidelines at period-end.
COMPARISON OF OPERATING RESULTS FOR THE THREE AND NINE MONTHS ENDED SEPTEMBER 30, 20192020 AND 2018
Summary
Net income in the third quarter 2019 net income2020 was $8.4 million, or $0.56 per share, compared with $5.0 million, or $0.32 per share, compared to $9.0 million, or $0.58 per share, in the same quarter of 2018. Net income in the third quarter 2019 included acquisition, restructuring, and other expense activity totaling $3.0 million.2019. The non-GAAP measure of adjusted earnings in the third quarter 20192020 totaled $9.2 million, or $0.61 per share, compared to $7.3 million or $0.47 diluted earnings per share and $9.0 million or $0.58 diluted earnings per share, in the same periodquarter of 2018. Both2019. The improvement in net income is driven by expanded net interest margin and adjusted earnings inhigher non-interest income. The Company's return on assets ratio was 0.88% during the third quarter of 2020 and 0.55% in the same quarter of 2019. The ratio for adjusted return on assets increased to 0.96% from 0.88% in third quarter of 2019 benefited fromon higher yields on earning assets and non-interest income growth, offset by a higher cost of funds.
The Company reported year to date net income of $18.4$24.6 million or $1.18$1.60 per share, compared with $25.3$18.4 million or $1.63$1.18 per share in the same period of 2018.2019. Adjusted earnings decreasedincreased to $20.9 million, or $1.35 per share compared with $25.8$25.6 million, or $1.66 per share comparedwith$21.0million,or$1.35pershare,for these therespectiveperiods.Thesechangeslargelyreflectthesame factors and trends discussed above that drove quarterlythird quarter net income. The return on assets ratio during the first nine months of 2019 was 0.68% compared to 0.96% in the prior year due to lower net income and a higher average asset base. Adjusted return on assets (non-GAAP measure) was 0.77% for the first nine months of 2019 compared to 0.98% in the prior year. Return on equity in the first nine months of 2019 decreased to 6.37% from 9.54% in the prior year due to lower net income and growth in the average equity balance. Correspondingly, adjusted return on equity (non-GAAP measure) was 7.25% for the first nine months of 2019 compared to 9.72% in the prior year.
Net Interest Income
Net interest income was $22.4$24.7 million in the third quarter 2020 compared with $22.5$22.4 million in the same quarter of 2018. Interest income was $34.3 million, up 6% from $32.2 million2019. Net interest margin in the third quarter 2020 increased to 2.98% from 2.75% in the same period of 2018 as average2019 primarily due to a lower cost of funds. Costs of funds decreased to 0.82% compared to 1.65% in the third quarter 2019 due to a shift in funding sources from borrowings to non-maturity deposits. Cost of deposits and borrowings also benefited from the
76
Federal Reserve rate cuts in 2020 and other key indexes in response to COVID-19. Costs of interest-bearing deposits decreased to 0.66% compared to 1.33% in the third quarter 2019 and cost of borrowings improved to 1.60% from 2.62% in same quarter of 2019. Additionally, excess liquidity was used to pay off $239.4 million of borrowings since the third quarter of 2019 in connection with deleveraging strategies that further reduced interest expense. Yields from earning assets grew $70.5 million net. The net interest margin forwere 3.67% compared to 4.17% in the three months ended decreased 6 basis points over third quarter 2018 to 2.75%. Yields expanded across all2019 reflecting loan categories asoriginations and repricing of variable rate products repricedin a lower interest rate environment. Purchased loan accretion contributed 0.06% to higher rates driven by the 2018 short-term hikes. The yield on securities improved 23 basis points while the cost of interest bearing liabilities increased 27 basis points. The year over year increase in interest bearing liabilities was primarily due to higher short-term interest rates and the flattening of the yield curve in 2019. However, net interest margin in the third quarter 2019 included2020 compared to 0.10% in the benefitthird quarter 2019. Excluding the effects of PPP loans, the deleveraging strategy to remove $72.9 million of securities yielding an average of 2.1% and pay-off of wholesale borrowings with an average cost of 2.4%third quarter yield on total earning assets was 3.72%.
For the first nine months of 2019the year, net interest income decreased to $65.7was $69.6 million from $68.6compared with $63.9 million in the same periodmonths of 2018. Interest income from earning assets increased to $101.3 million with a yield of 4.16% compared to $94.7 million with a yield of 3.97% in the same period of 2018. The2019 and net interest margin was 3.01% from 2.72% compared to 2.90% in the prior year. The yield on total loans for the nine months ended expanded 17 basis points,same respective periods. The increase is primarily driven by the yield on commercial real estate loans expanding 25 basis pointsreduced borrowing levels and the yield on commercial and industrial loans expanding 22 basis points. Improvement in interest income was offset by interest expense increasinghigher non-maturity deposits. The average borrowing levels decreased to $35.6$481.7 million in the first nine months of 20192020 from $26.1$708.2 million in the same period of 2018. The year-to-date effect,2019 and management’s response, on net interest marginborrowing costs were 1.74% from interest-bearing liabilities is2.71% for the same asrespective periods. Costs of interest-bearing deposits also decreased in the first nine months of 2020 to 0.85% compared to 1.30% in the same period of 2019. Yields from earning assets were 3.87% in the first nine months of 2020 compared to 4.16% in the first nine months of 2019.Theyear-to-dateeffect onnetinterestmarginfromearning assets and interest bearing liabilitiesisthesameasthequarterlydiscussion.
Loan Loss Provision
The third quarter non-interest income grew 7%2020 provision for loan losses increased to $7.6$1.8 million from $7.1 million$893 thousand in the same quarter of 2019. While overall credit quality in 2018. Thethe loan portfolio remains strong, the increase was driven by $828 thousandin the reserve is indicative of customer derivative income associated withthe continued commercial loan growth and $157 thousand net gain on sales of securities associated withhigher economic adjustments reflecting elevated risk from COVID-19. As previously noted, the balance sheet deleverage strategy. Company has maintained its incurred loss model for calculating the allowance for loan losses.
Non-Interest Income
Non-interest income in the third quarter 2018 included2020 was $10.1 million compared to $7.6 million in the same quarter of 2019. The increase is primarily due to a $685 thousand gain$2.2 million increase in mortgage banking income associated with secondary market sales of $86.2 million compared to $20.7 million in the salesame period of Visa B shares.
Non-interest income for the first nine months of 2019 increased year over year by 4%2020 was $28.2 million compared to $21.3 million compared to $20.5 million forin the same period of 2018.in 2019. The increase in non-interest income for the nine-month period is driven by the same reasons as the quarterly period.
Non-Interest Expense
Non-interest expense increased to $23.4was $22.4 million in the third quarter 20192020 compared to $17.9$23.4 million in the same quarter of 2018.2019. The increase in partdecrease is a result of higher salaries and benefits attributableprincipally due to previously announced strategic hires and an increase in professional service fees. Third quarterlower acquisition, restructuringconversion and other expenses, which totaled $691 thousand in 2020 compared to $3.0 million in 2019 related2019. Salary and benefit expense and occupancy costs were higher during the third quarter 2020 to support the Company’s expanded branch acquisitionmodel and restructuringwealth management business. Total operating expenses associated with our previously announced strategic review.
For the first nine months of 20192020, non-interest expense increased to $67.0 million from $55.4$62.9 million in the same period of 2018.2019. The increase in non-interest expense for the nine-month period is driven by the same reasons as the quarterly period.
Income Tax Expense
The third quarter effective tax rate decreasedincreased to 13.5%20.3% in 20192020 compared with 18.8%13.5% in the same quarter of 2018,2019, reflecting the higher level of taxable income and the rate for the nine months 2019 and 2018 was 17.3% and 19.5%, respectively. The decrease in the quarterly and year-to-date rates is due to lower pre-taxlevel of non-tax advantaged income in the respective periods2020.
77
Liquidity and Cash Flows
Liquidity is measured by the Company’sCompany's ability to meet short-term cash needs at a reasonable cost or minimal loss. The Company seeks to obtain favorable sources of liabilities and to maintain prudent levels of liquid assets in order to satisfy varied liquidity demands. Besides serving as a funding source for maturing obligations, liquidity provides flexibility in responding to customer-initiated needs. Many factors affect the Company’sCompany's ability to meet liquidity needs, including variations in the markets served by its network of offices, its mix of assets and liabilities, reputation and credit standing in the marketplace, and general economic conditions.
The Bank actively manages its liquidity position through target ratios established under its Asset-Liability Management Policy. Continual monitoring of these ratios, by using historical data and through forecasts under multiple rate and stress scenarios, allows the Bank to employ strategies necessary to maintain adequate liquidity. The Bank’sBank's policy is to maintain a liquidity position of at least 4% of total assets. A portion of the Bank’sBank's deposit base has been historically seasonal in nature, with balances typically declining in the winter months through late spring, during which period the Bank’sBank's liquidity position tightens.
The Bank also had capacityCompany’s liquidity position remains strong. During the quarter we initiated pandemic-specific liquidity stress tests to borrow fundsanalyze potential impacts from payment deferrals, unanticipated use of committed lines of credit, as well as the possibility of required servicer advances on a secured basis utilizing the Borrower-in-Custody program and the Discount Window at the FRB.sold loans. At September 30, 2019,2020, available same-day liquidity totaled approximately $1.5 billion, including cash, borrowing capacity at FHLB and the Bank’s available secured lineFederal Reserve Discount Window and various lines of credit. Additional sources of liquidity include cash flows from operations, wholesale deposits, cash flow from the Company's amortizing securities and loan portfolios. The Company had unused borrowing capacity at the FHLB of $634.0 million, unused borrowing capacity at the Federal Reserve of $81.1 million and unused lines of credit at the FRB stood at $107.7totaling $51.0 million, or 2.98% of the Bank’s totalin addition to over $200.0 million in unencumbered, liquid investment portfolio assets. The BankCompany has also has accessutilized the Federal Reserve's Paycheck Protection Program Liquidity Facility to the national brokered deposit market, and has used this funding sourceprovide liquidity to bolster its on balance sheet liquidity position.
The Bank maintains a liquidity contingency plan approved by the Bank’sBank's Board of Directors. This plan addresses the steps that would be taken in the event of a liquidity crisis, and identifies other sources of liquidity available to the Company. Company management believes the level of liquidity is sufficient to meet current and future funding requirements. However, changes in economic conditions, including consumer savings habits and availability or access to the brokered deposit market could potentially have a significant impact on the Company’sCompany's liquidity position.
Off-Balance Sheet Arrangements
The Company is, from time to time, a party to certain off-balance sheet arrangements that have or are reasonably likely to have a current or future effect on the Company's financial condition, changes in financial condition, revenues or expenses, results of operations, liquidity, capital expenditures or capital resources, that may be material to investors.
The Company’s off-balance sheet arrangements are limited to standby letters of credit whereby the Bank guarantees the obligations or performance of certain customers. These letters of credit are sometimes issued in support of third-party debt. The risk involved in issuing standby letters of credit is essentially the same as the credit risk involved in extending loan facilities to customers, and they are subject to the same origination, portfolio maintenance and management procedures in effect to monitor other credit products. The amount of collateral obtained, if deemed necessary by the Bank upon issuance of a standby letter of credit, is based upon management's credit evaluation of the customer.
The Company’s off-balance sheet arrangements have not changed materially since previously reported in our Annual Report on Form 10-K for the year ended December 31, 2018 or our Quarterly Report on Form 10-Q for the quarter ended June 30, 2019.
APPLICATION OF CRITICAL ACCOUNTING POLICIES AND ACCOUNTING ESTIMATES, AND RECENT ACCOUNTING PRONOUNCEMENTS
The Company’s significant accounting policies are described in Note 1 to the consolidated financial statements in this Form 10-Q and in the most recent Form 10-K. Please see those policies in conjunction with this discussion. The accounting and reporting policies followed by the Company conform, in all material respects, to accounting principles generally accepted in the United States and to general practices within the financial services industry. The preparation of financial
78
statements in conformity with accounting principles generally accepted in the United States requires management to make estimates and assumptions that affect the amounts reported in the financial statements and accompanying notes. While the Company bases estimates on historical experience, current information and other factors deemed to be relevant, actual results could differ from those estimates.
Management believes that the following policies would be considered critical under the SEC’s definition:
| • | Allowance for Loan Losses |
| • | Acquired Loans |
| • | Income Taxes |
| • | Goodwill and Identifiable Intangible Assets |
| • | Determination of Other-Than-Temporary Impairment of Securities |
| • | Fair Value of Financial Instruments |
79
Market Risk
Market risk is the risk of loss in a financial instrument arising from adverse changes in market rates/prices, such as interest rates, foreign currency exchange rates, commodity prices and equity prices. Interest rate risk is the most significant market risk affecting the Company. Other types of market risk do not arise in the normal course of the Company’s business activities.
The responsibility for interest rate risk management oversight is the function of the Bank’s Asset and Liability Committee (“ALCO”), chaired by the Chief Financial Officer and composed of various members of senior management. ALCO meets regularly to review balance sheet structure, formulate strategies in light of current and expected economic conditions, adjust product prices as necessary, implement policy, monitor liquidity, and review performance against guidelines established to control exposure to the various types of inherent risk.
Interest Rate Risk:
The Bank's interest rate risk measurement and management techniques incorporate the re-pricing and cash flow attributes of balance sheet and off-balance sheet instruments as each relate to current and potential changes in interest rates. The level of interest rate risk, measured in terms of the potential future effect on net interest income, is determined through the use of modeling and other techniques under multiple interest rate scenarios. Interest rate risk is evaluated in depth on a quarterly basis and reviewed by ALCO and the Company’s Board of Directors.
The Bank's Asset Liability Management Policy, approved annually by the Bank’s Board of Directors, establishes interest rate risk limits in terms of variability of net interest income under rising, flat, and decreasing rate scenarios. It is the role of the ALCO to evaluate the overall risk profile and to determine actions to maintain and achieve a posture consistent with policy guidelines.
Interest Rate Sensitivity Modeling:
The Bank utilizes an interest rate risk model widely recognized in the financial industry to monitor and measure interest rate risk. The model simulates the behavior of interest income and expense for all balance sheet and off-balance sheet instruments, under different interest rate scenarios together with a dynamic future balance sheet. Interest rate risk is measured in terms of potential changes in net interest income based upon shifts in the yield curve.
The interest rate risk sensitivity model requires that assets and liabilities be broken down into components as to fixed, variable, and adjustable interest rates, as well as other homogeneous groupings, which are segregated as to maturity and type of instrument. The model includes assumptions about how the balance sheet is likely to evolve through time and in different interest rate environments. The model uses contractual re-pricing dates for variable products, contractual maturities for fixed rate products, and product-specific assumptions for deposit accounts, such as money market accounts, that are subject to re-pricing based on current market conditions. Re-pricing margins are also determined for adjustable rate assets and incorporated in the model. Investment securities and borrowings with call provisions are examined on an individual basis in each rate environment to estimate the likelihood of a call.exercise. Prepayment assumptions for mortgage loans and mortgage-backed securities are developed from industry median estimates of prepayment speeds, based upon similar coupon ranges and degree of seasoning. Cash flows and maturities are then determined, and for certain assets, prepayment assumptions are estimated under different interest rate scenarios. Interest income and interest expense are then simulated under several hypothetical interest rate conditions including:
A flat interest rate scenario in which current prevailing rates are locked in and the only balance sheet fluctuations that occur are due to cash flows, maturities, new volumes, and re-pricing volumes consistent with this flat rate assumption;
80
A 200 basis point rise or decline in interest rates (or as appropriate given the absolute level of market rates) applied against a parallel shift in the yield curve over a twelve-month horizon together with a dynamic balance sheet anticipated to be consistent with such interest rate changes;
Various non-parallel shifts in the yield curve, including changes in either short-term or long-term rates over a twelve-month horizon, together with a dynamic balance sheet anticipated to be consistent with such interest rate changes; and
An extension of the foregoing simulations to each of two, three, four and five year horizons to determine the interest rate risk with the level of interest rates stabilizing in years two through five. Even though rates remain stable during this two to five year time period, re-pricing opportunities driven by maturities, cash flow, and adjustable rate products will continue to change the balance sheet profile for each of the interest rate conditions.
Changes in net interest income based upon the foregoing simulations are measured against the flat interest rate scenario and actions are taken to maintain the balance sheet interest rate risk within established policy guidelines.
As of September 30, 20192020 interest rate sensitivity modeling results indicate that the Bank’s balance sheet in yearyears 1 was slightly liability sensitive and in year 2 waswere modestly asset sensitive.
Assuming short-term and long-term interest rates decline 200100 basis points from current levels (i.e., a parallel yield curve shift) and the Bank’s balance sheet structure and size remain at current levels, management believes net interest income will deteriorate over the one year horizon (-0.8%(-0.4% versus the base case) while deteriorating further from that level over the two-year horizon (-7.3%(-9.0% versus the base case).
Assuming the Bank’s balance sheet structure and size remain at current levels and the Federal Reserve increases short-term interest rates by 200 basis points with the balance of the yield curve shifting in parallel with these increases, management believes net interest income will remain relatively unchangedimprove slightly over the one and two-year horizons (-1.1%(1.8% and -0.6%5.1%, respectively).
As compared to December 31, 2018,2019, the year-one sensitivity in the down 100 basis points scenario was downup slightly for the nine months ended September 30, 2019 (+1.7%2020 (-1.0% prior, versus -.1%-0.4% current). The year-two sensitivities in the down 100 basis points scenario changed going from +0.7%-3.7% to -3.0%-9.0%. In the year-one up 200 basis points scenario, results declinedimproved going from -3.7%0.7% to -1.1%1.8%. Year-two, up 200 basis points declined (-8.3%was up (3.3% prior, versus -.6%5.1% current).
The preceding sensitivity analysis does not represent a Company forecast and should not be relied upon as being indicative of expected operating results. These hypothetical estimates are based upon numerous assumptions including: the nature and timing of interest rate levels and yield curve shape, prepayment speeds on loans and securities, deposit rates, pricing decisions on loans and deposits, reinvestment or replacement of asset and liability cash flows, and renegotiated loan terms with borrowers. While assumptions are developed based upon current economic and local market conditions, the Company cannot make any assurances as to the predictive nature of these assumptions including how customer preferences or competitor influences might change.
As market conditions vary from those assumed in the sensitivity analysis, actual results may also differ due to: prepayment and refinancing levels deviating from those assumed; the impact of interest rate changes, caps or floors on adjustable rate assets; the potential effect of changing debt service levels on customers with adjustable rate loans; depositor early withdrawals and product preference changes; and other such variables. The sensitivity analysis also does not reflect additional actions that the Bank’s Senior Executive Team and Board of Directors might take in responding to or anticipating changes in interest rates, and the anticipated impact on the Bank’s net interest income.
81
| (a) | Disclosure controls and procedures. |
Under the supervision and with the participation of our senior management, consisting of the Company’s principal executive officer and our principal financial officer, the Company conducted an evaluation of the effectiveness of the design and operation of its disclosure controls and procedures, as defined in Rules 13a-15(e) and 15d-15(e) under the Securities Exchange Act of 1934, as amended (the “Exchange Act”) as of the end of the period covered by this Quarterly Report on Form 10-Q. Based on this evaluation, the Company’s management, including its principal executive officer and principal financial officer, concluded that as of September 30, 20192020 the Company’s disclosure controls and procedures were effective to ensure that information required to be disclosed by the Company in the reports that it files under the Exchange Act is recorded, processed, summarized and reported within the time periods specified in SEC rules and forms. The Company’s disclosure controls and procedures include, without limitation, controls and procedures designed to ensure that information required to be disclosed by the Company in its Exchange Act reports is accumulated and communicated to the Company’s management, including its principal executive officer and principal financial officer, as appropriate to allow timely decisions regarding required disclosure. Management recognizes that any controls and procedures, no matter how well designed and operated, can provide only reasonable assurance of achieving their objectives, and management necessarily applies its judgment in evaluating the cost-benefit relationship of possible controls and procedures.
| (b) | Changes in internal control over financial reporting. |
There were no changes in the Company’s internal control over financial reporting that occurred during the last fiscal quarter that have materially affected, or are reasonably likely to materially affect, the Company’s internal control over financial reporting.
ITEM 1. LEGAL PROCEEDINGS
The Company and its subsidiaries are parties to certain ordinary routine litigation incidental to the normal conduct of their respective businesses, which in the opinion of management based upon currently available information will have no material effect on the Company's consolidated financial statements.
There have beenwere no material changes to the risk factors discussed in Part I, Item 1A, “Risk Factors,” in our1A. of the Company’s Annual Report on Form 10-K for the year ended December 31, 2018. 2019 and Part II, Item 1A. of the Company’s Quarterly Report on Form 10-Q for the quarter ended March 31, 2020. In addition to the other information set forth in this report, you should carefully consider those risk factors, which could materially affect our business, financial condition and future operating results. Those risk factors are not the only risks facing our company. Additional risks and uncertainties not currently known to us or that we currently deem to be immaterial also may have a material adverse effect on our business, financial condition and operating results.
82
| (c) | The following table provides certain information with regard to shares repurchased by the Company in the third quarter of 2020: |
| | | | | | | | | |
|
| | | | | | Total number of shares | | Maximum number of |
| | | | | | | purchased as a part of | | shares that may yet be |
| | Total number of | | Average price |
| publicly announced |
| purchased under | |
Period |
| shares purchased |
| paid per share |
| plans or programs |
| the plans or programs(1) | |
July 1-31, 2020 |
| 108,178 | | $ | 20.38 |
| 500,501 |
| 280,499 |
August 1-31, 2020 |
| 77,767 | |
| 20.35 |
| 578,268 |
| 202,732 |
September 1-30, 2020 |
| 111,074 | |
| 19.83 |
| 689,342 |
| 91,658 |
Total |
| 297,019 | | $ | 20.19 |
| 689,342 |
| 91,658 |
| Period | Total number of shares purchased | Average price paid per share | Total number of shares purchased as a part of publicly announced plans or programs | Maximum number of shares that may yet be purchased under the plans or programs(1) | |||||||||
| July 1-31, 2019 | — | $ | — | — | 767,990 | ||||||||
| August 1-30, 2019 | 1,185 | 24.52 | 1,185 | 766,805 | |||||||||
| September 1-30, 2019 | — | — | — | 766,805 | |||||||||
| Total | 1,185 | $ | 24.52 | 1,185 | 766,805 | ||||||||
| (1) | On March 12, 2020, the Company's Board of Directors approved a twelve-month plan to repurchase up to 5% of its outstanding common stock, representing 781,000 shares and expires on March 20, 2021. |
83
| | | ||
10.1* | ||||
| ||||
| | | ||
31.1 | Certification of Chief Executive Officer under Rule 13a-14(a)/15d-14(a) | |||
| | | ||
31.2 | Certification of Chief Financial Officer under Rule 13a-14(a)/15d-14(a) | |||
| | | ||
32.1 | Certification of Chief Executive Officer under 18 U.S.C. Sec. 1350. | |||
| | | ||
32.2 | Certification of Chief Financial Officer under 18 U.S.C. Sec. 1350. | |||
| | |||
101 | The following financial information from the Company’s Quarterly Report on Form 10-Q for the quarter ended September 30, | |||
| | |||
104 * | Cover Page Interactive Data File (the cover page XBRL tags are embedded within the Inline XBRL document). Indicates management contract or compensatory plan | |||
84
Pursuant to the requirements of the Securities Exchange Act of 1934, the registrant has duly caused this report to be signed on its behalf by the undersigned thereunto duly authorized.
| | | |
| |||
BAR HARBOR BANKSHARES | |||
| | ||
| | | |
Dated: November | By: | /s/ Curtis C. Simard | |
| | Curtis C. Simard | |
| | President & Chief Executive Officer | |
| | ||
| | ||
Dated: November | By: | /s/ Josephine Iannelli | |
| | Josephine Iannelli | |
| | Executive Vice President & Chief Financial Officer | |
85