0000759944 us-gaap:FederalHomeLoanBankAdvancesMember 2019-12-310000759944us-gaap:SeriesFPreferredStockMember2020-04-012020-06-30
UNITED STATES
SECURITIES AND EXCHANGE COMMISSION
Washington, D.C. 20549
FORM 10-Q
☒ QUARTERLY REPORT PURSUANT TO SECTION 13 OR 15(d)
OF THE SECURITIES EXCHANGE ACT OF 1934
For the Quarterly Period Ended
SeptemberJune 30, 20202021
☐ TRANSITION REPORT PURSUANT TO SECTION 13 OR 15(d)
OF THE SECURITIES EXCHANGE ACT OF 1934
For the Transition Period From
(Not Applicable)
Commission File Number 001-36636
(Exact name of the registrant as specified in its charter)
|
| | | | | | | |
| Delaware | | 05-0412693 |
(State or Other Jurisdiction of
Incorporation or Organization)
| | (I.R.S. Employer
Identification Number)
|
One Citizens Plaza,, Providence,, RI02903
(Address of principal executive offices, including zip code)
(401) (401) 456-7000
(Registrant’s telephone number, including area code)
Securities registered pursuant to Section 12(b) of the Act:
|
| | | | | | | |
| Title of each class | Trading symbol(s) | Name of each exchange on which registered |
| Common stock, $0.01 par value per share | CFG | New York Stock Exchange |
Depositary Shares, each representing a 1/40th interest in a share of 6.350% Fixed-to-Floating Rate Non-Cumulative Perpetual Preferred Stock, Series D
| CFG PrD | New York Stock Exchange |
Depositary Shares, each representing a 1/40th interest in a share of 5.000% Fixed-Rate Non-Cumulative Perpetual Preferred Stock, Series E
| CFG PrE | New York Stock Exchange |
Indicate by check mark whether the Registrant (1) has filed all reports required to be filed by Section 13 or 15(d) of the Securities Exchange Act of 1934 during the preceding 12 months and (2) has been subject to such filing requirements for the past 90 days.
☑ Yes ☐ No
Indicate by check mark whether the registrant has submitted electronically every Interactive Data File required to be submitted pursuant to Rule 405 of Regulation S-T (§232.405 of this chapter) during the preceding 12 months (or for such shorter period that the registrant was required to submit such files).
☑ Yes ☐ No
Indicate by check mark whether the registrant is a large accelerated filer, an accelerated filer, a non-accelerated filer, a smaller reporting company, or an emerging growth company. See the definitions of “large accelerated filer,” “accelerated filer,” “smaller reporting company,” and “emerging growth company” in Rule 12b-2 of the Exchange Act:
|
| | | | | | | | | | |
| Large accelerated filer | ☑ | Accelerated filer | ☐ |
| Non-accelerated filer | ☐ | Smaller reporting company | ☐ |
| | Emerging growth company | ☐ |
If an emerging growth company, indicate by check mark if the registrant has elected not to use the extended transition period for complying with any new or revised financial accounting standards provided pursuant to Section 13(a) of the Exchange Act. ☐
Indicate by check mark whether the registrant is a shell company (as defined in Rule 12b-2 of the Exchange Act). ☐ Yes ☑ No
There were 427,073,084426,083,147 shares of Registrant’s common stock ($0.01 par value) outstanding on October 30, 2020.July 23, 2021.
| | | | | | | | | | | | | | |
| | | | |
| | | | |
| | | |
| | Table of Contents | | |
| | | | |
| | | |
| | | |
| | | |
| | | |
| | | |
| | | | |
| | | |
| | | |
| | | |
| | | |
| | | |
| | | |
| | | | |
| | | |
| | | |
| | | |
| | | | |
| | | |
| | | | |
| | | |
| | | |
| | | | |
| | | |
| | | | |
| | | | |
| | | | |
| | | |
| Item 6. Exhibits | | | |
| | | |
| | | |
| Signature | | | |
| | | |
| | | |
| | | |
Citizens Financial Group, Inc. | 2
GLOSSARY OF ACRONYMS AND TERMS
The following is a list of common acronyms and terms we regularly use in our financial reporting:
|
| | | | | | | |
AACL2020 Form 10-K | | Annual Report on Form 10-K for the year ended December 31, 2020 |
| AACL | | Adjusted Allowance for Credit Losses |
| ACL | | Allowance for Credit Losses: Allowance for Loan and Lease Losses plus ReserveAllowance for Unfunded Lending Commitments |
| AFS | | Available for Sale |
| ALLL | | Allowance for Loan and Lease Losses |
| ALM | | Asset and Liability Management |
| AOCI | | Accumulated Other Comprehensive Income (Loss) |
ATMARRC | | Alternative Reference Rate Committee |
| ASU | | Accounting Standards Update |
| ATM | | Automated Teller Machine |
| | |
| Board or Board of Directors | | The Board of Directors of Citizens Financial Group, Inc. |
| bps | | Basis Points |
| | |
| Capital Plan Rule | | Federal Reserve’s Regulation Y Capital Plan Rule |
| CARES Act | | Coronavirus Aid, Relief, and Economic Security Act |
| CBNA | | Citizens Bank, National Association |
| CCAR | | Comprehensive Capital Analysis and Review |
| CCB | | Capital Conservation Buffer |
| CCMI | | Citizens Capital Markets, Inc. |
| CECL | | Current Expected Credit Losses (ASU 2016-13, Financial Instruments-Credit Losses (Topic 326): Measurement of Credit Losses on Financial Instruments) |
| CET1 | | Common Equity Tier 1 |
| | |
| | |
| CET1 capital ratio | | Common Equity Tier 1 capital divided by total risk-weighted assets as defined under the U.S. Basel III Standardized approach |
CFPB | | Consumer Financial Protection Bureau |
| | |
| Citizens, CFG, the Company, we, us, or our | | Citizens Financial Group, Inc. and its Subsidiaries |
CLTVCLO | | Combined Loan-to-ValueCollateralized Loan Obligation |
CRECLTV | | Combined Loan-to-Value |
| | |
| COVID-19 pandemic | | Coronavirus Disease 2019 Pandemic |
| | |
| CRE | | Commercial Real Estate |
| | |
| | |
| | |
| Dodd-Frank Act | | The Dodd-Frank Wall Street Reform and Consumer Protection Act of 2010 |
EAD | | Exposure at Default |
EGRRCPA | | Economic Growth, Regulatory Relief and Consumer Protection Act |
EPS | | |
| Elevated cash | | Cash above targeted operating levels |
| EPS | | Earnings Per Share |
| | |
| | |
| EVE | | Economic Value of Equity |
| Exchange Act | | The Securities Exchange Act of 1934 |
| | |
| | |
| Fannie Mae (FNMA) | | Federal National Mortgage Association |
FDIC | | |
| FCA | | Financial Conduct Authority |
| FDIC | | Federal Deposit Insurance Corporation |
FHLBFHA | | Federal Housing Administration |
| FHLB | | Federal Home Loan Bank |
| FICO | | Fair Isaac Corporation (credit rating) |
| | |
| FRB or Federal Reserve | | Board of Governors of the Federal Reserve System and, as applicable, Federal Reserve Bank(s) |
| Freddie Mac (FHLMC) | | Federal Home Loan Mortgage Corporation |
FTE | | |
| FTE | | Fully Taxable Equivalent |
GAAP | | |
| GAAP | | Accounting Principles Generally Accepted in the United States of America |
| GDP | | Gross Domestic Product |
| | |
| Ginnie Mae (GNMA) | | Government National Mortgage Association |
Citizens Financial Group, Inc. | 3
| | | | | | | | |
| GSE | | Government Sponsored Entity |
HTM | | Held To Maturity |
LCR | | Liquidity Coverage Ratio |
LDR | | Loans-to-Deposits Ratio |
LGD | | Loss Given Default |
LHFS | | Loans Held for Sale |
LIBOR | | London Interbank Offered Rate |
|
| | |
LIHTCHSBC | | HSBC Bank U.S.A., N.A. |
| HTM | | Held To Maturity |
| | |
| | |
| ICE | | Intercontinental Exchange |
| Investors | | Investors Bancorp, Inc. |
| Last-of-Layer | | Last-of-layer is a fair value hedge of the interest rate risk of a portfolio of similar prepayable assets whereby the last dollar amount within the portfolio of assets is identified as the hedged item |
| | |
| | |
| | |
| LHFS | | Loans Held for Sale |
| LIBOR | | London Interbank Offered Rate |
| LIHTC | | Low Income Housing Tax Credit |
| LTV | | Loan to Value |
| MBS | | Mortgage-Backed Securities |
Mid-AtlanticMD&A | | Management’s Discussion and Analysis of Financial Condition and Results of Operations |
| Mid-Atlantic | | District of Columbia, Delaware, Maryland, New Jersey, New York, Pennsylvania, Virginia, and West Virginia |
| Midwest | | Illinois, Indiana, Michigan, and Ohio |
MD&A | | Management’s Discussion and Analysis of Financial Condition and Results of Operations |
| Modified CECL Transition | | The Day-1 CECL adoption entry booked to retained earnings plus 25% of subsequent CECL ACL reserve build |
| Modified AACL Transition | | The Day-1 CECL adoption entry booked to ACL plus 25% of subsequent CECL ACL reserve build |
| MSRs | | Mortgage Servicing Rights |
NCONCOs | | Net charge-offs |
| New England | | Connecticut, Maine, Massachusetts, New Hampshire, Rhode Island, and Vermont |
NM | | Not meaningful |
NPLs | | |
| | |
| NPLs | | Nonaccrual loans and leases |
| OCC | | Office of the Comptroller of the Currency |
| OCI | | Other Comprehensive Income (Loss) |
| | |
| Operating Leverage | | Period-over-period percent change in total revenue, less the period-over-period percent change in noninterest expense |
| | |
| Parent Company | | Citizens Financial Group, Inc. (the Parent Company of Citizens Bank, National Association and other subsidiaries) |
PD | | Probability of Default |
PPP | | |
| PPP | | Paycheck Protection Program |
REIT | | Real estate investment trust |
| ROTCE | | Return on Average Tangible Common Equity |
| RPA | | Risk Participation Agreement |
SBARWA | | Risk-Weighted Assets |
| SBA | | United States Small Business Administration |
SCB | | |
| | |
| SCB | | Stress Capital Buffer |
| SEC | | United States Securities and Exchange Commission |
SVaRSOFR | | Secured Overnight Financing Rate |
| SVaR | | Stressed Value at Risk |
TBAsTailoring Rules | | Rules establishing risk-based categories for determining prudential standards for large U.S. and foreign banking organizations, consistent with the Dodd-Frank Act, as amended by the Economic Growth, Regulatory Relief and Consumer Protection Act |
| TBAs | | To-Be-Announced Mortgage Securities |
| TDR | | Troubled Debt Restructuring |
| Tier 1 capital ratio | | Tier 1 capital, which includes Common Equity Tier 1 capital plus non-cumulative perpetual preferred equity that qualifies as additional tier 1 capital, divided by total risk-weighted assets as defined under the U.S. Basel III Standardized approach |
| Tier 1 leverage ratio | | Tier 1 capital, which includes Common Equity Tier 1 capital plus non-cumulative perpetual preferred equity that qualifies as additional tier 1 capital, divided by quarterly adjusted average assets as defined under the U.S. Basel III Standardized approach |
Citizens Financial Group, Inc. | 4
| | | | | | | | |
| Total capital ratio | | Total capital, which includes Common Equity Tier 1 capital, tier 1 capital and allowance for credit losses and qualifying subordinated debt that qualifies as tier 2 capital, divided by total risk-weighted assets as defined under the U.S. Basel III Standardized approach |
VaRUSDA | | United States Department of Agriculture |
| VA | | United States Department of Veterans Affairs |
| VaR | | Value at Risk |
| VIE | | Variable Interest Entities |
| | |
Citizens Financial Group, Inc. | 5
PART I. FINANCIAL INFORMATION
ITEM 2. MANAGEMENT’S DISCUSSION AND ANALYSIS OF FINANCIAL CONDITION AND RESULTS OF OPERATIONS
| | | | | | | | |
| | Page |
| Forward-Looking Statements | | |
| | |
| | |
| | Page |
Forward-Looking Statements | | |
| | |
| | |
| Selected Consolidated Financial Data | | |
| Results of Operations | | |
| | |
| | |
| | |
| | |
| | |
| | |
| | |
| | |
| | |
| | |
| Analysis of Financial Condition | | |
| | |
| | |
| | |
| | |
| | |
| | |
| | |
| | |
| | |
| | |
| | |
| | |
| | |
| | |
Citizens Financial Group, Inc. | 6
FORWARD-LOOKING STATEMENTS
This document contains forward-looking statements within the meaning of the Private Securities Litigation Reform Act of 1995. Statements regarding potential future share repurchases and future dividends as well as the potential effects of the COVID-19 pandemic and associated lockdowns on our business, operations, financial performance and prospects, are forward-looking statements. Also, any statement that does not describe historical or current facts is a forward-looking statement. These statements often include the words “believes,” “expects,” “anticipates,” “estimates,” “intends,” “plans,” “goals,” “targets,” “initiatives,” “potentially,” “probably,” “projects,” “outlook”“outlook,” “guidance” or similar expressions or future conditional verbs such as “may,” “will,” “should,” “would,” and “could.”
Forward-looking statements are based upon the current beliefs and expectations of management, and on information currently available to management. Our statements speak as of the date hereof, and we do not assume any obligation to update these statements or to update the reasons why actual results could differ from those contained in such statements in light of new information or future events. We caution you, therefore, against relying on any of these forward-looking statements. They are neither statements of historical fact nor guarantees or assurances of future performance. While there is no assurance that any list of risks and uncertainties or risk factors is complete, important factors that could cause actual results to differ materially from those in the forward-looking statements include the following, without limitation:
•Negative economic and political conditions that adversely affect the general economy, housing prices, the job market, consumer confidence and spending habits which may affect, among other things, the level of nonperforming assets, charge-offs and provision expense;
| |
• | Negative economic and political conditions that adversely affect the general economy, housing prices, the job market, consumer confidence and spending habits which may affect, among other things, the level of nonperforming assets, charge-offs and provision expense;
|
| |
• | The rate of growth in the economy and employment levels, as well as general business and economic conditions, and changes in the competitive environment;
|
| |
• | Our ability to implement our business strategy, including the cost savings and efficiency components, and achieve our financial performance goals;
|
| |
• | The COVID-19 pandemic and associated lockdowns and their effects on the economic and business environments in which we operate;
|
| |
• | Our ability to meet heightened supervisory requirements and expectations;
|
| |
• | Liabilities and business restrictions resulting from litigation and regulatory investigations;
|
| |
• | Our capital and liquidity requirements under regulatory capital standards and our ability to generate capital internally or raise capital on favorable terms;
|
| |
• | The effect of changes in interest rates on our net interest income, net interest margin and our mortgage originations, mortgage servicing rights and mortgages held for sale;
|
| |
• | Changes in interest rates and market liquidity, as well as the magnitude of such changes, which may reduce interest margins, impact funding sources and affect the ability to originate and distribute financial products in the primary and secondary markets;
|
| |
• | The effect of changes in the level of checking or savings account deposits on our funding costs and net interest margin;
|
| |
• | Financial services reform and other current, pending or future legislation or regulation that could have a negative effect on our revenue and businesses;
|
| |
• | A failure in or breach of our operational or security systems or infrastructure, or those of our third party vendors or other service providers, including as a result of cyber-attacks; and
|
| |
• | Management’s ability to identify and manage these and other risks.
|
•The rate of growth in the economy and employment levels, as well as general business and economic conditions, and changes in the competitive environment;
•Our ability to implement our business strategy, including the cost savings and efficiency components, and achieve our financial performance goals, including through the integration of Investors and the HSBC branches;
•The COVID-19 pandemic and associated lockdowns and their effects on the economic and business environments in which we operate;
•Our ability to meet heightened supervisory requirements and expectations;
•Liabilities and business restrictions resulting from litigation and regulatory investigations;
•Our capital and liquidity requirements under regulatory capital standards and our ability to generate capital internally or raise capital on favorable terms;
•The effect of changes in interest rates on our net interest income, net interest margin and our mortgage originations, mortgage servicing rights and mortgages held for sale;
•Changes in interest rates and market liquidity, as well as the magnitude of such changes, which may reduce interest margins, impact funding sources and affect the ability to originate and distribute financial products in the primary and secondary markets;
•The effect of changes in the level of checking or savings account deposits on our funding costs and net interest margin;
•Financial services reform and other current, pending or future legislation or regulation that could have a negative effect on our revenue and businesses;
•A failure in or breach of our operational or security systems or infrastructure, or those of our third party vendors or other service providers, including as a result of cyber-attacks;
•An inability to complete the acquisitions of Investors or the HSBC branches, or changes in the current anticipated timeframe, terms or manner of such acquisitions;
•Greater than expected costs or other difficulties related to the integration of our business and that of Investors and the relevant HSBC branches;
•The inability to retain existing Investors or HSBC clients and employees following the closings of the Investors and HSBC branch acquisitions;
Citizens Financial Group, Inc. | 7
•The occurrence of any event change or other circumstance that could give rise to the right of one or both parties to terminate (i) the agreement to acquire Investors or (ii) the agreement to acquire branches from HSBC; and
•Management’s ability to identify and manage these and other risks.
In addition to the above factors, we also caution that the actual amounts and timing of any future common stock dividends or share repurchases will be subject to various factors, including our capital position, financial performance, risk-weighted assets, capital impacts of strategic initiatives, market conditions and regulatory and accounting considerations, as well as any other factors that our Board of Directors deems relevant in making such a determination. Therefore, there can be no assurance that we will repurchase shares from or pay any dividends to holders of our common stock, or as to the amount of any such repurchases or dividends. Further, statements about the effects of the COVID-19 pandemic and associated lockdowns on our business, operations, financial performance and prospects may constitute forward-looking statements and are subject to the risk that the actual impacts may differ, possibly
materially, from what is reflected in those forward-looking statements due to factors and future developments that are uncertain, unpredictable and in many cases beyond our control, including the scope and duration of the pandemic, actions taken by governmental authorities in response to the pandemic, and the direct and indirect impact of the pandemic on our customers, third parties and us. In addition, statements about our net charge-off guidance constitute forward-looking statements and are subject to the risk that the actual charge-offs may differ, possibly materially, from what is reflected in those statements due to, among other potential factors, the impact of the COVID-19 pandemic and the effectiveness of stimulus and forbearance programs in response, changes in economic conditions, and idiosyncratic events affecting our commercial loans. Statements about Citizens’ agreement and plan of merger, dated July 28, 2021 (the “Investors acquisition agreement”) with Investors Bancorp, Inc. and CBNA’s agreement dated May 26, 2021 (“HSBC branch acquisition agreement”) with HSBC to acquire certain branches from HSBC also constitute forward-looking statements and are subject to the risk that actual results could be materially different from those expressed in those statements, including if either of both transactions are not consummated in a timely manner or at all, or if integration is more costly or difficult than expected.
More information about factors that could cause actual results to differ materially from those described in the forward-looking statements can be found in the “Risk Factors” section in Part II, Item 1A of this report and Part I, Item 1A of our Annual Report on2020 Form 10-K for the year ended December 31, 2019 and Part II, Item 1A of our Quarterly Report on Form 10-Q for the period ended June 30, 2020.10-K.
INTRODUCTION
Citizens Financial Group, Inc. is one of the nation’s oldest and largest financial institutions with $179.2$185.1 billion in assets as of SeptemberJune 30, 2020. 2021. Our mission is to help customers, colleagues and communities each reach their potential by listening to them and understanding their needs in order to offer tailored advice, ideas and solutions. Headquartered in Providence, Rhode Island, we offer a broad range of retail and commercial banking products and services to individuals, small businesses, middle-market companies, large corporations and institutions. In Consumer Banking, we provide an integrated experience that includes mobile and online banking, a 24/7 customer contact center as well as the convenience of approximately 2,700 3,000 ATMs and 1,000 branches in 11 states in the New England, Mid-Atlantic, and Midwest regions. Consumer Banking products and services include a full range of banking, lending, savings, wealth management and small business offerings. In Commercial Banking, we offer corporate, institutional and not-for-profit clients a full range of wholesale banking products and services including lending and deposits, capital markets, treasury services, foreign exchange and interest rate products, and asset finance. More information is available at www.citizensbank.com.
On May 26, 2021, CBNA entered into an agreement to acquire 80 East Coast branches and the national online deposit business from HSBC. The acquisition provides an attractive entry into important metro markets and supports our national expansion strategy. Under the agreement, CBNA will acquire approximately $9.0 billion in deposits and approximately $2.2 billion in loans for a 2.0 percent premium paid on deposits at closing. The 80 branch purchase includes 66 locations in the New York City Metro area, 9 locations in the Mid-Atlantic/Washington D.C. area, and 5 locations in Southeast Florida. The transaction is expected to close in the first quarter of 2022, subject to customary closing terms and conditions and regulatory approvals.
On July 28, 2021 Citizens entered into a definitive agreement and a plan of merger under which Citizens will acquire Investors for a combination of stock and cash. The acquisition of Investors enhances Citizens’ banking franchise, adding an attractive middle market/small business and consumer customer base while building its physical presence in the northeast with the addition of 154 branches located in the greater New York City and Philadelphia metropolitan areas and across New Jersey. See Note 17 in Item 1 for further information.
Citizens Financial Group, Inc. | 8
The following MD&A is intended to assist readers in their analysis of the accompanying unaudited interim Consolidated Financial Statements and supplemental financial information. It should be read in conjunction with the unaudited interim Consolidated Financial Statements and Notes to the unaudited interim Consolidated Financial Statements in Part I, Item 1, as well as other information contained in this document and our 20192020 Form 10-K.
Non-GAAP Financial Measures
This document contains non-GAAP financial measures denoted as “Underlying” results., “excluding elevated cash”, “excluding PPP loans”, as well as other results excluding the impact of certain items. Underlying results for any given reporting period exclude certain items that may occur in that period which management does not consider indicative of our on-going financial performance. We believe these non-GAAP financial measures provide useful information to investors because they are used by management to evaluate our operating performance and make day-to-day operating decisions. In addition, we believe our Underlying results or results excluding the impact of certain items in any given reporting period reflect our on-going financial performance and increase comparability of period-to-period results, and accordingly, are useful to consider in addition to our GAAP financial results.
Other companies may use similarly titled non-GAAP financial measures that are calculated differently from the way we calculate such measures. Accordingly, our non-GAAP financial measures may not be comparable to similar measures used by such companies. We caution investors not to place undue reliance on such non-GAAP financial measures, but to consider them with the most directly comparable GAAP measures. Non-GAAP financial measures have limitations as analytical tools and should not be considered in isolation or as a substitute for our results reported under GAAP.
Non-GAAP measures are denoted throughout our MD&A by the use of the term Non-GAAPUnderlying or Underlyingidentified as excluding the impact of certain items and where there is a reference to Non-GAAP or Underlying resultsthese metrics in that paragraph, all measures that follow that reference are on the same basis when applicable. For more information on the computation of non-GAAP financial measures, see “—Non-GAAP Financial Measures and Reconciliations.”
FINANCIAL PERFORMANCE
Quarterly Results - Key Highlights
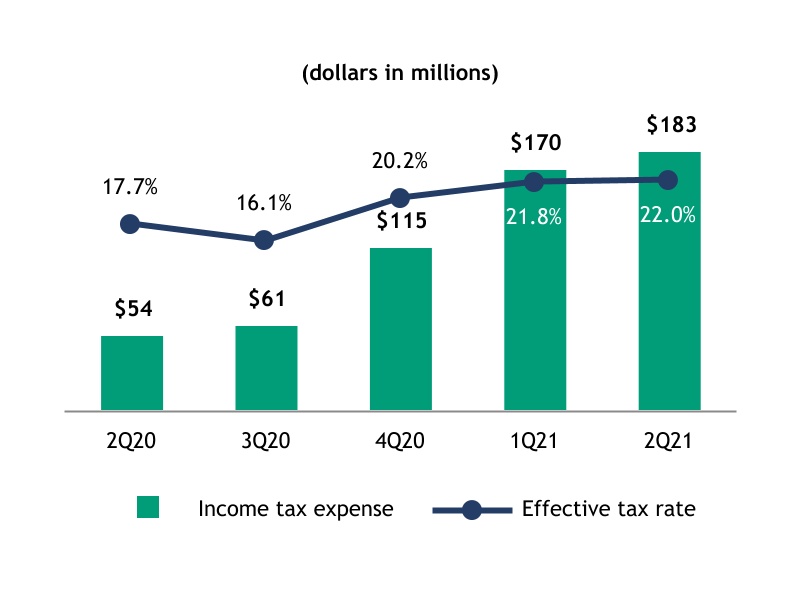
Third Second quarter 20202021 net income of $314$648 million decreased 30%increased 156% from $449$253 million in the thirdsecond quarter of 2019,2020, with earnings per diluted common share of $0.68, down $0.29$1.44, up $0.91 from $0.97$0.53 per diluted common share in thirdthe second quarter 2019. Thirdof 2020. Second quarter 20202021 ROTCE of 8.3%17.5% compared to 12.4%6.6% in thirdthe second quarter 2019.of 2020.
Third Second quarter 2021 results reflected $8 million of expenses, net of tax benefit, or $0.02 per diluted common share, from notable items largely tied to TOP 6 transformational and revenue and efficiency initiatives as well as integration costs. Second quarter 2020 results reflected $24$10 million after-tax,of expenses, net of tax benefit, or $0.05$0.02 per diluted common share, of notable items largely tied to TOP 6 transformational and revenue and efficiency initiatives.initiatives as well as integration costs. On an Underlying basis, which excludes notable items, thirdsecond quarter 20202021 net income available to common stockholders of $313$624 million compared with $436$235 million in the thirdsecond quarter of 2019.2020. Underlying EPS of $0.73$1.46 compared to $0.98$0.55 in the thirdsecond quarter of 2019.2020. Underlying thirdsecond quarter 20202021 ROTCE of 9.0%17.7% compared with 12.6%6.9% in the thirdsecond quarter of 2019. Tangible2020. Second quarter 2021 tangible book value per common share of $32.24$33.95 increased 2%6% from thirdthe second quarter 2019.of 2020.
| | | Table 1: Notable Items | | Table 1: Notable Items | | | | | | | | |
| | Three Months Ended September 30, | | | Three Months Ended June 30, |
| | 2020 | | 2019 | | | 2021 | | | 2020 |
| (in millions) | Noninterest expense | | Income tax expense | | Net Income | | Noninterest expense | | Income tax expense | | Net Income | (in millions) | | Noninterest expense | | | Income tax expense | | Net Income | | | Noninterest expense | | | Income tax expense | | Net Income |
| Reported results (GAAP): |
| $988 |
| |
| $61 |
| |
| $314 |
| |
| $973 |
| |
| $115 |
| |
| $449 |
| Reported results (GAAP): | | $991 | | | | $183 | | | $648 | | | | $979 | | | | $54 | | | $253 | |
| Less notable items: | | | | | | | | | | | | Less notable items: | | | | | | | | |
| Total integration costs | 2 |
| | — |
| | (2 | ) | | 4 |
| | (1 | ) | | (3 | ) | Total integration costs | | 2 | | | | (1) | | | (1) | | | | 2 | | | | (1) | | | (1) | |
Other notable items(1) | 29 |
| | (7 | ) | | (22 | ) | | 15 |
| | (14 | ) | | (1 | ) | Other notable items(1) | | 9 | | | | (2) | | | (7) | | | | 17 | | | | (8) | | | (9) | |
| Total notable items | 31 |
| | (7 | ) | | (24 | ) | | 19 |
| | (15 | ) | | (4 | ) | Total notable items | | 11 | | | | (3) | | | (8) | | | | 19 | | | | (9) | | | (10) | |
| Underlying results* (non-GAAP) |
| $957 |
| |
| $68 |
| |
| $338 |
| |
| $954 |
| |
| $130 |
| |
| $453 |
| |
| Underlying results (non-GAAP) | | Underlying results (non-GAAP) | | $980 | | | | $186 | | | $656 | | | | $960 | | | | $63 | | | $263 | |
(1) Other notable items for the second quarter of 2021 and 2020 include noninterest expense of $29$9 million and $17 million, respectively, related to our TOP 6
Citizens Financial Group, Inc. | 9
transformational and revenue and efficiency initiatives.
* Where there is a reference•Total revenue of $1.6 billion decreased $141 million, or 8%, from the second quarter of 2020, driven by declines of 18% and 3% in noninterest income and net interest income, respectively.
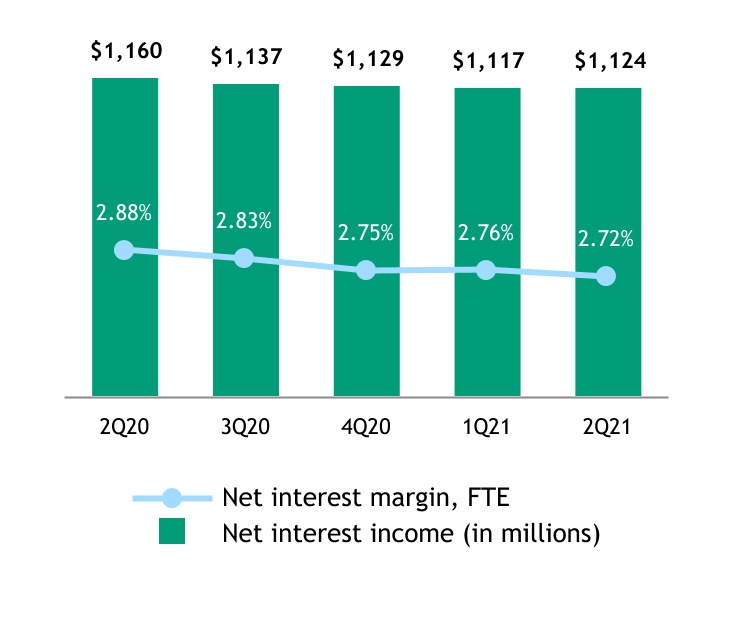
•Net interest income of $1.1 billion decreased 3% compared to Non-GAAP or “Underlying” results in a paragraph, all measures that follow that reference are on the same basis when applicable. For more information on the computationsecond quarter of non-GAAP financial measures, see “—Introduction — Non-GAAP Financial Measures” and “—Non-GAAP Financial Measures and Reconciliations.”
| |
• | Total revenue of2020 given lower net interest margin, $1.8 billionincreased $153 million, or 9%, from the third quarter2019, reflecting increased noninterest income and a slight decrease in net interest income.
|
| |
◦ | Net interest income of $1.1 billion was down 1% compared to the third quarter2019, as lower net interest margin was only partially offset by growth in average interest-earning assets of 9%.
|
| |
◦ | Net interest margin of 2.82%decreased 28 basis points compared to 3.10% in third quarter2019, reflecting the impact of lower interest rates and higher cash balances given strong deposit flows, partially offset by improved funding mix and lower funding costs.
|
| |
– | Net interest margin on a fully taxable-equivalent basis of 2.83%decreased by 29 basis points, compared to 3.12% in third quarter2019.
|
| |
– | Average loans and leases of $124.9 billionincreased $7.7 billion, or 7%, from $117.3 billion in the third quarter2019, reflecting a $6.9 billionincrease in commercial loans and leases, which includes $4.7 billion of PPP loans, and a $777 millionincrease in retail loans.
|
| |
– | Average deposits of $141.4 billionincreased $17.4 billion, or 14%, from $123.9 billion in the third quarter2019, reflecting growth in demand deposits, money market accounts, regular savings, and checking with interest, partially offset by lower term deposits.
|
| |
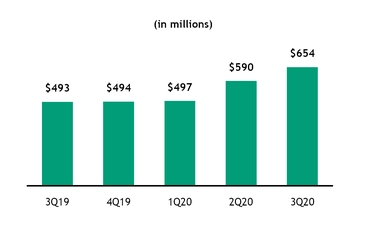
◦ | Noninterest income of $654 millionincreased $161 million, or 33%, from the third quarter2019, driven by higher mortgage banking fees and strength in capital markets fees and trust and investment services fees, partially offset by lower services charges and fees, card fees, and foreign exchange and interest rate products reflecting the impact of COVID-19 and associated lockdowns. Other income reflected the gain on sale of education loans and increased from third quarter 2019, which included a benefit related to a lease restructuring.
|
| |
• | Noninterest expense of $988 millionincreased $15 million, or 2%, compared to $973 million in third quarter2019.
|
| |
◦ | On an Underlying basis, noninterest expense was stable with third quarter2019, reflecting higher equipment and software, salaries and employee benefits and outside services expense, almost wholly
|
offset by 2% growth in interest-earning assets.
◦Net interest margin of 2.71% decreased 16 basis points compared to 2.87% in the second quarter of 2020, primarily reflecting the impact of a lower rate environment, lower interest-earning asset yields and elevated cash balances given strong deposit flows, partially offset by improved funding mix and deposit pricing.
–Net interest margin on a fully taxable-equivalent basis of 2.72% decreased 16 basis points compared to 2.88% in the second quarter of 2020.
–Average loans and leases of $123.5 billion decreased $5.3 billion, or 4%, from $128.8 billion in the second quarter of 2020, driven by a $6.8 billion decrease in commercial reflecting line of credit repayments and net payoffs partially offset by a $1.2 billion increase in PPP loans. The overall decrease in commercial was partially offset by a $1.5 billion increase in retail driven by growth in education and residential mortgage, which reflects the exercise of the early buyout option of loans previously sold to GNMA, partially offset by decreases in home equity and other retail given run-off of personal unsecured installment loans.
–Average deposits of $150.3 billion increased $8.8 billion, or 6%, from $141.6 billion in the second quarter of 2020, reflecting an increase in demand deposits, money market accounts, savings and checking with interest, partially offset by a decrease in term deposits.
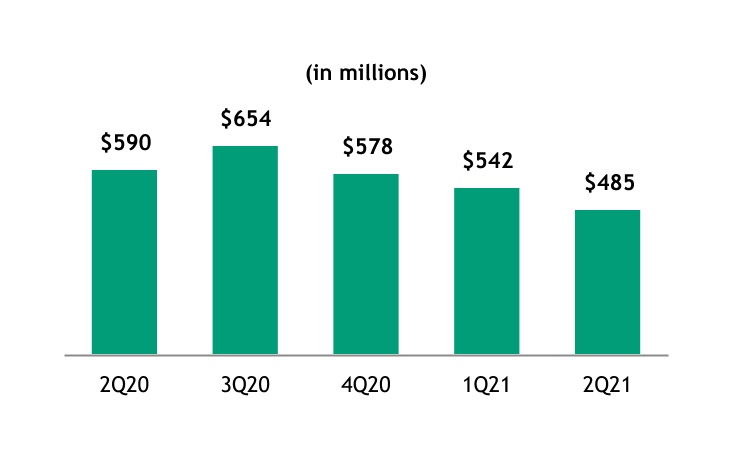
◦Noninterest income of $485 million decreased $105 million, or 18%, from the second quarter of 2020, driven by a decline in mortgage banking fees, partially offset by higher capital markets fees, trust and investment services fees, services charges and fees, and card fees.
•Noninterest expense of $991 millionwas stable compared to the second quarter of 2020.
◦On an Underlying basis, noninterest expense of $980 million increased $20 million, or 2%, from the second quarter of 2020, reflecting higher outside services, equipment and software expense and salaries and employee benefits, partially offset by a decrease in other operating expense given lower travel and advertising expenses, as well as a $10 million charge relatedexpense.
•The efficiency ratio of 61.6% compared to a lease restructuring55.9% in the prior year.second quarter of 2020.
| |
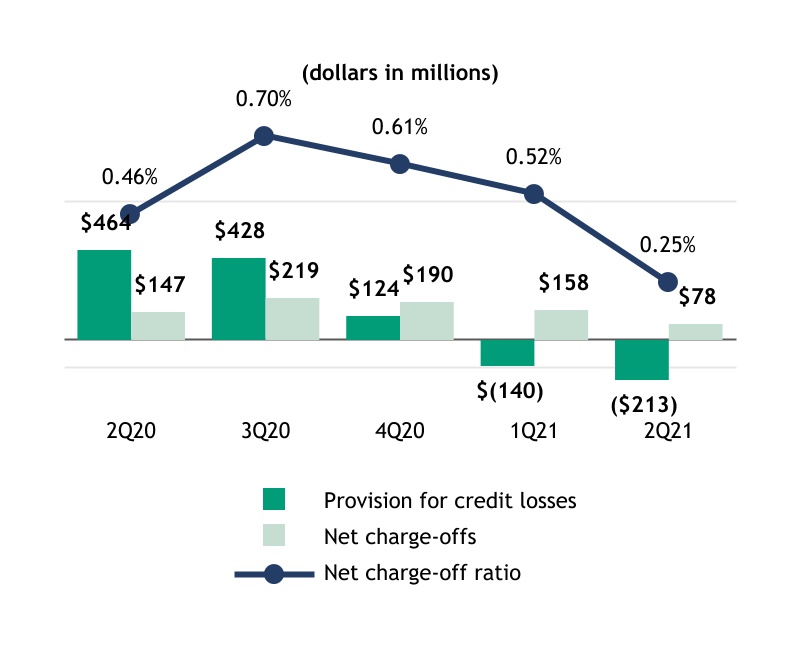
• | The efficiency ratio of 55.2% compared to 59.4% in third quarter2019.◦On an Underlying basis, the efficiency ratio of 60.9% compared to 54.9% in the second quarter of 2020. •Credit provision benefit of $213 million compares with a $464 million credit provision expense in the second quarter of 2020, reflecting strong credit performance across the retail and commercial loan portfolios and improvement in the macroeconomic outlook. |
| |
◦ | On an Underlying basis, the efficiency ratio of 53.4% compared to 58.2% in the third quarter2019.
|
| |
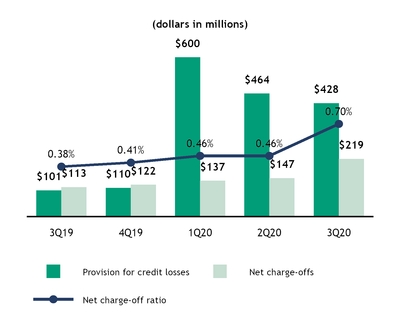
• | Provision for credit losses of $428 millionincreased $327 million from $101 million in the third quarter2019, primarily driven by a $209 million reserve build largely associated with commercial.
|
Year to Date and Period End - Key Highlights
Net income of $601$1.3 billion increased $972 million decreased 55% from the first nine monthshalf of 2019,2020, with earnings per diluted common share of $1.23, down $1.60$2.81, up $2.26 from $2.83$0.55 per diluted common share in the first nine monthshalf of 2019.2020. ROTCE of 5.1% declined17.3% increased from 12.7%3.5% in the first nine monthshalf of 2019.2020. Improved results primarily reflect the impact of the COVID-19 pandemic and associated lockdowns in the first half of 2020, resulting in a significant ACL reserve build in the first half of 2020.
In the first nine monthshalf of 2020,2021, results reflected a $59$23 million after-tax reduction,of expenses, net of tax benefit, or $0.14$0.06 per diluted common share, from notable items, largely tied to TOP 6 transformational and revenue and efficiency initiatives.initiatives as well as integration costs. In the first nine monthshalf of 2019,2020, there were $13$35 million of expenses, net of tax benefit, or $0.03$0.09 per diluted common share, after-tax offrom notable items, largely tied to integration costs associated with acquisitions and TOP 6 transformational and revenue and efficiency initiatives. initiatives as well as integration costs.
Citizens Financial Group, Inc. | 10
| | | Table 2: Notable Items | | Table 2: Notable Items | | | | | | | | |
| | Nine Months Ended September 30, | | | Six Months Ended June 30, |
| | 2020 | | 2019 | | | 2021 | | | 2020 |
| (in millions) | Noninterest expense | | Income tax expense | | Net Income | | Noninterest expense | | Income tax expense | | Net Income | (in millions) | | Noninterest expense | | | Income tax expense | | Net Income | | | Noninterest expense | | | Income tax expense | | Net Income |
| Reported results (GAAP) |
| $2,979 |
| |
| $126 |
| |
| $601 |
| |
| $2,861 |
| |
| $369 |
| |
| $1,341 |
| Reported results (GAAP) | | $2,009 | | | | $353 | | | $1,259 | | | | $1,991 | | | | $65 | | | $287 | |
| Less notable items: | | | | | | | | | | | | Less notable items: | | | | | | | | |
| Total integration costs | 8 |
| | (2 | ) | | (6 | ) | | 16 |
| | (4 | ) | | (12 | ) | Total integration costs | | 2 | | | | (1) | | | (1) | | | | 6 | | | | (2) | | | (4) | |
Other notable items(1) | 75 |
| | (22 | ) | | (53 | ) | | 15 |
| | (14 | ) | | (1 | ) | Other notable items (1) | | 29 | | | | (7) | | | (22) | | | | 46 | | | | (15) | | | (31) | |
| Total notable items | 83 |
| | (24 | ) | | (59 | ) | | 31 |
| | (18 | ) | | (13 | ) | Total notable items | | 31 | | | | (8) | | | (23) | | | | 52 | | | | (17) | | | (35) | |
| Underlying results* (non-GAAP) |
| $2,896 |
| |
| $150 |
| |
| $660 |
| |
| $2,830 |
| |
| $387 |
| |
| $1,354 |
| |
| Underlying results (non-GAAP) | | Underlying results (non-GAAP) | | $1,978 | | | | $361 | | | $1,282 | | | | $1,939 | | | | $82 | | | $322 | |
(1) For the six months ended June 30, 2021 and 2020, Other notable items include noninterest expense of $75of $29 million and $46 million, respectively, related to our TOP 6 transformational and revenue and efficiency initiatives and aninitiatives. Other notable items for the six months ended June 30, 2020 also included a $4 million income tax benefit of $4 million related to legacy tax matters.
| |
• | •Net income available to common stockholders of $1.2 billion increased $967 million, compared to $237 million in the first half of 2020.$526 milliondecreased $765 million, or 59%, compared to $1.3 billion in the first nine months of 2019. |
| |
◦ | On an Underlying basis, which excludes notable items, first nine months2020 net income available to common stockholders of $585 million compared with $1.3 billion in the first nine months of 2019.
|
| |
◦ | On an Underlying basis, EPS of $1.37 per share compared to $2.86 in the first nine months of 2019.
|
| |
• | Total revenue of $5.2 billionincreased $344 million, or 7%, from the first nine months of 2019, reflecting a 26%increase in noninterest income and stable net interest income.
|
| |
◦ | Net interest income of $3.5 billion was stable, reflecting 8% growth in average interest-earning assets offset by the impact of the lower rate and challenging yield-curve environment.
|
| |
◦ | Net interest margin of 2.93%decreased 25 basis points from 3.18% in the first nine months of 2019, reflecting the impact of lower interest rates, partially offset by lower funding costs and improved funding mix, as well as continued mix shift towards higher yielding assets.
|
| |
– | Net interest margin on a fully taxable-equivalent basis of 2.93%decreased by 26 basis points, compared to 3.19% in the first nine months of 2019.
|
| |
– | Average loans and leases of $124.9 billionincreased $7.3 billion, or 6%, from $117.6 billion in the first nine months of 2019, reflecting a $6.1 billionincrease in commercial loans and leases primarily driven by $2.7 billion of PPP loans and growth in commercial real estate loans as well as a $1.3 billionincrease in retail loans.
|
| |
– | Period-end loan growth of $5.0 billion, or 4%, from the fourth quarter of 2019, reflected 8% growth in total commercial loans and leases driven by $4.7 billion of PPP loans.
|
| |
– | Average deposits of $136.5 billionincreased $14.0 billion, or 11%, from $122.5 billion in the first nine months of 2019, reflecting growth in money market accounts, demand deposits, savings and checking with interest, partially offset by a decrease in term deposits.
|
| |
– | Period-end deposit growth of $17.6 billion, or 14%, from the fourth quarter of 2019, outpacing loan growth.
|
| |
◦ | Noninterest income of $1.7 billionincreased $358 million, or 26%, from the first nine months of 2019, driven by mortgage banking, partially offset by lower service charges and fees, card fees, foreign exchange and interest rate products revenue, and other income.
|
| |
• | Noninterest expense of $3.0 billionincreased $118 million, or 4%, from $2.9 billion in the first nine months of 2019, driven by higher salaries and employee benefits, outside services, and equipment and software expense, partially offset by lower other operating expense given lower travel and advertising expenses.
|
| |
◦ | On an Underlying basis, noninterest expense increased 2% from the first nine months of 2019.
|
| |
• | The efficiency ratio of 57.3% compared to 58.9% for the first nine months of 2019, and ROTCE of 5.1% compared to 12.7%.
|
| |
◦ | On an Underlying basis, the efficiency ratio of 55.7% compared to 58.3% for the first nine months of 2019 and ROTCE of 5.7%compared to12.9%, reflecting the challenging environment presented by COVID-19, in particular, provision impact.
|
| |
• | Provision for credit losses of $1.5 billionincreased $1.2 billion from $283 million for the first nine months of 2019, reflecting our adoption of CECL and its reliance on forecasts of expected future losses, combined with the approximate $990 million impact from COVID-19 and associated lockdowns and the resulting sudden rise in unemployment and drop in GDP.
|
| |
• | Tangible book value per common share of $32.24 increased 2% from the first nine months of 2019. Fully diluted average common shares outstanding decreased 28.1 million shares, or 6%, over the same period.
|
◦On an Underlying basis, which excludes notable items, first half 2021 net income available to common stockholders of $1.2 billion compared with $272 million in the first half of 2020.
◦On an Underlying basis, EPS of $2.87 compared to $0.64 in the first half of 2020.
•Total revenue of $3.3 billion decreased $139 million, or 4%, from the first half of 2020, driven by declines of 6% and 3% in noninterest income and net interest income, respectively.
◦Net interest income of $2.2 billion decreased 3% given lower net interest margin, partially offset by 6% growth in interest-earning assets.
◦Net interest margin of 2.73% decreased 25 basis points from 2.98% in the first half of 2020, primarily reflecting the impact of a lower rate environment, lower interest-earning asset yields and elevated cash balances given strong deposit flows, partially offset by improved funding mix and deposit pricing.
–Net interest margin on a FTE basis of 2.74% decreased by 25 basis points, compared to 2.99% in the first half of 2020.
–Average loans and leases of $123.2 billion decreased $1.7 billion, or 1%, from $124.9 billion in the first half of 2020, driven by a $2.7 billion decrease in commercial reflecting line of credit repayments and net payoffs, partially offset by a $960 million increase in retail driven by growth in education and residential mortgage, which reflects the exercise of the early buyout option of loans previously sold to GNMA, partially offset by decreases in home equity and other retail given run-off of personal unsecured installment loans.
–Period-end loans declined $509 million from the fourth quarter of 2020, reflecting a 3% decline in commercial, partially offset by 2% growth in retail.
–Average deposits of $148.5 billion increased $14.4 billion, or 11%, from $134.1 billion in the first half of 2020, reflecting an increase in demand deposits, money market accounts, savings and checking with interest, partially offset by a decrease in term deposits.
–Period-end deposit growth of $3.5 billion, or 2%, from the fourth quarter of 2020, reflecting growth in demand deposits, savings and checking with interest, partially offset by a decline in term deposits and money market accounts.
◦Noninterest income of $1.0 billion decreased $60 million, or 6%, from the first half of 2020, driven by by a decline in mortgage banking fees, partially offset by higher capital markets fees, trust and investment services fees, card fees, and letter of credit and loan fees.
•Noninterest expense of $2.0 billion was stable compared to the first half of 2020.
◦On an Underlying basis, noninterest expense increased 2% from the first half of 2020, reflecting higher outside services, equipment and software expense, and salaries and employee benefits, partially offset by a decrease in other operating expense.
Citizens Financial Group, Inc. | 11
•The efficiency ratio of 61.5% compared to 58.4% for the first half of 2020, and ROTCE of 17.3% compared to 3.5%.
◦On an Underlying basis, the efficiency ratio of 60.6% compared to 56.9% for the first half of 2020, and ROTCE of 17.7%compared to4.0%.
•Credit provision benefit of $353 million compares with a $1.1 billion credit provision expense for the first half of 2020, reflecting strong credit performance across the retail and commercial loan portfolios and improvement in the macroeconomic outlook.
•Tangible book value per common share of $33.95 increased 6% from the first half of 2020. Fully diluted average common shares outstanding was stable over the same period.
Citizens Financial Group, Inc. | 12
SELECTED CONSOLIDATED FINANCIAL DATA
The summary of the Consolidated Operating Data for the for the three and ninesix months ended SeptemberJune 30, 20202021 and 20192020 and the summary Consolidated Balance Sheet data as of SeptemberJune 30, 20202021 and December 31, 20192020 are derived from our unaudited interim Consolidated Financial Statements, included in Part I, Item 1. Our historical results are not necessarily indicative of the results expected for any future period.
| | | Table 3: Summary of Consolidated Operating Data | | Table 3: Summary of Consolidated Operating Data | |
| | Three Months Ended September 30, | | Nine Months Ended September 30, | | Three Months Ended June 30, | | Six Months Ended June 30, |
| (dollars in millions, except per share amounts) | 2020 |
| | 2019 |
| | 2020 | | 2019 | (dollars in millions, except per share amounts) | 2021 | | 2020 | | 2021 | | 2020 |
| OPERATING DATA: | | | | | | | | OPERATING DATA: | | | | | | | |
| Net interest income |
| $1,137 |
| |
| $1,145 |
| |
| $3,457 |
| |
| $3,471 |
| Net interest income | $1,124 | | | $1,160 | | | $2,241 | | | $2,320 | |
| Noninterest income | 654 |
| | 493 |
| | 1,741 |
| | 1,383 |
| Noninterest income | 485 | | | 590 | | | 1,027 | | | 1,087 | |
| Total revenue | 1,791 |
| | 1,638 |
| | 5,198 |
| | 4,854 |
| Total revenue | 1,609 | | | 1,750 | | | 3,268 | | | 3,407 | |
| Provision for credit losses | 428 |
| | 101 |
| | 1,492 |
| | 283 |
| Provision for credit losses | (213) | | | 464 | | | (353) | | | 1,064 | |
| Noninterest expense | 988 |
| | 973 |
| | 2,979 |
| | 2,861 |
| Noninterest expense | 991 | | | 979 | | | 2,009 | | | 1,991 | |
| Income before income tax expense | 375 |
| | 564 |
| | 727 |
| | 1,710 |
| Income before income tax expense | 831 | | | 307 | | | 1,612 | | | 352 | |
| Income tax expense | 61 |
| | 115 |
| | 126 |
| | 369 |
| Income tax expense | 183 | | | 54 | | | 353 | | | 65 | |
| Net income |
| $314 |
| |
| $449 |
| |
| $601 |
| |
| $1,341 |
| Net income | $648 | | | $253 | | | $1,259 | | | $287 | |
| Net income available to common stockholders |
| $289 |
| |
| $432 |
| |
| $526 |
| |
| $1,291 |
| Net income available to common stockholders | $616 | | | $225 | | | $1,204 | | | $237 | |
| Net income per common share - basic |
| $0.68 |
| |
| $0.97 |
| |
| $1.23 |
| |
| $2.84 |
| Net income per common share - basic | $1.45 | | | $0.53 | | | $2.83 | | | $0.56 | |
| Net income per common share - diluted |
| $0.68 |
| |
| $0.97 |
| |
| $1.23 |
| |
| $2.83 |
| Net income per common share - diluted | $1.44 | | | $0.53 | | | $2.81 | | | $0.55 | |
| OTHER OPERATING DATA: | | | | | | | | OTHER OPERATING DATA: | |
| Return on average common equity | 5.60 | % | | 8.35 | % | | 3.45 | % | | 8.50 | % | Return on average common equity | 11.85 | % | | 4.44 | % | | 11.71 | % | | 2.35 | % |
| Return on average tangible common equity | 8.33 |
| | 12.44 |
| | 5.15 |
| | 12.72 |
| Return on average tangible common equity | 17.50 | | | 6.62 | | | 17.34 | | | 3.51 | |
| Return on average total assets | 0.70 |
| | 1.10 |
| | 0.46 |
| | 1.11 |
| Return on average total assets | 1.41 | | | 0.57 | | | 1.38 | | | 0.33 | |
| Return on average total tangible assets | 0.73 |
| | 1.15 |
| | 0.48 |
| | 1.16 |
| Return on average total tangible assets | 1.46 | | | 0.59 | | | 1.44 | | | 0.35 | |
| Efficiency ratio | 55.18 |
| | 59.40 |
| | 57.31 |
| | 58.94 |
| Efficiency ratio | 61.63 | | | 55.91 | | | 61.49 | | | 58.43 | |
Operating leverage(1) | 7.77 |
| | (2.16 | ) | | 2.95 |
| | (0.18 | ) | (9.42) | | | 4.60 | | | (5.02) | | | 0.48 | |
Net interest margin, FTE(2)(1) | 2.83 |
| | 3.12 |
| | 2.93 |
| | 3.19 |
| 2.72 | | | 2.88 | | | 2.74 | | | 2.99 | |
| Effective income tax rate | 16.10 |
| | 20.46 |
| | 17.27 |
| | 21.58 |
| Effective income tax rate | 21.96 | | | 17.69 | | | 21.86 | | | 18.51 | |
(1)“Operating leverage” represents the period-over-period percent change in total revenue, less the period-over-period percent change in noninterest expense.
(2) Net interest margin is presented on ana FTE basis using the federal statutory tax rate of 21%.
Citizens Financial Group, Inc. | 13
| | | Table 4: Summary of Consolidated Balance Sheet data | | Table 4: Summary of Consolidated Balance Sheet data | |
| (dollars in millions) | September 30,
2020 | | December 31,
2019 | (dollars in millions) | June 30, 2021 | | December 31, 2020 |
| BALANCE SHEET DATA: | | | | BALANCE SHEET DATA: | | | |
| Total assets |
| $179,228 |
| |
| $165,733 |
| Total assets | $185,104 | | | $183,349 | |
| Loans held for sale, at fair value | 3,587 |
| | 1,946 |
| Loans held for sale, at fair value | 3,616 | | | 3,564 | |
| Other loans held for sale | 127 |
| | 1,384 |
| Other loans held for sale | 82 | | | 439 | |
| Loans and leases | 124,071 |
| | 119,088 |
| Loans and leases | 122,581 | | | 123,090 | |
| Allowance for loan and lease losses | (2,542 | ) | | (1,252 | ) | Allowance for loan and lease losses | (1,947) | | | (2,443) | |
| Total securities | 26,124 |
| | 24,669 |
| Total securities | 27,976 | | | 26,847 | |
| Goodwill | 7,050 |
| | 7,044 |
| Goodwill | 7,050 | | | 7,050 | |
| Total liabilities | 156,759 |
| | 143,532 |
| Total liabilities | 161,905 | | | 160,676 | |
| Total deposits | 142,921 |
| | 125,313 |
| Total deposits | 150,636 | | | 147,164 | |
| Short-term borrowed funds | 252 |
| | 274 |
| Short-term borrowed funds | 62 | | | 243 | |
| Long-term borrowed funds | 9,109 |
| | 14,047 |
| Long-term borrowed funds | 6,957 | | | 8,346 | |
| Total stockholders’ equity | 22,469 |
| | 22,201 |
| Total stockholders’ equity | 23,199 | | | 22,673 | |
| OTHER BALANCE SHEET DATA: | | | | OTHER BALANCE SHEET DATA: | |
| Asset Quality Ratios: | | | | Asset Quality Ratios: | |
| Allowance for loan and lease losses to loans and leases | 2.05 | % | | 1.05 | % | Allowance for loan and lease losses to loans and leases | 1.59 | % | | 1.98 | % |
| Allowance for credit losses to loans and leases | 2.21 |
| | 1.09 |
| Allowance for credit losses to loans and leases | 1.70 | | | 2.17 | |
Allowance for credit losses to loans and leases, excluding the impact of PPP loans(1) | 2.29 |
| | 1.09 |
| Allowance for credit losses to loans and leases, excluding the impact of PPP loans(1) | 1.75 | | | 2.24 | |
| Allowance for loan and lease losses to nonaccruing loans and leases | 199.04 |
| | 177.99 |
| Allowance for loan and lease losses to nonaccruing loans and leases | 250 | | | 240 | |
| Allowance for credit losses to nonaccruing loans and leases | 214.22 |
| | 184.31 |
| Allowance for credit losses to nonaccruing loans and leases | 267 | | | 262 | |
| Nonaccruing loans and leases to loans and leases | 1.03 |
| | 0.59 |
| Nonaccruing loans and leases to loans and leases | 0.64 | | | 0.83 | |
| Capital Ratios: | | | | Capital Ratios: | |
| CET1 capital ratio | 9.8 | % | | 10.0 | % | CET1 capital ratio | 10.3 | % | | 10.0 | % |
| Tier 1 capital ratio | 11.2 |
| | 11.1 |
| Tier 1 capital ratio | 11.6 | | | 11.3 | |
| Total capital ratio | 13.3 |
| | 13.0 |
| Total capital ratio | 13.5 | | | 13.4 | |
| Tier 1 leverage ratio | 9.5 |
| | 10.0 |
| Tier 1 leverage ratio | 9.7 | | | 9.4 | |
(1) For more information on the computation of non-GAAP financial measures, see “—Introduction — Non-GAAP Financial Measures” and “—Non-GAAP Financial Measures and Reconciliations.”
Citizens Financial Group, Inc. | 14
RESULTS OF OPERATIONS
Net Interest Income
Net interest income is our largest source of revenue andrevenue. It is the difference between the interest earned on interest-earning assets, (generallygenerally loans, leases and investment securities)securities, and the interest expense incurred in connection with interest-bearing liabilities, (generallygenerally deposits and borrowed funds).funds. The level of net interest income is primarily a function of the difference between the effective yield on our average interest-earning assets and the effective cost of our interest-bearing liabilities. These factors are influenced by the pricing and mix of interest-earning assets and interest-bearing liabilities which, in turn, are impacted by external factors such as local economic conditions, competition for loans and deposits, the monetary policy of the FRB and market interest rates. For further discussion, refer to “—Market Risk — Non-Trading Risk,” and “—Risk Governance” as described in our 20192020 Form 10-K.
Third
Second quarter 20202021 versus secondfirst quarter 2020:2021: Net interest income of $1.1 billion was down 2%up 1% given the impact of lower interest ratesinterest-earning asset growth, higher day count and a 1% decrease in interest-earning assets as commercial line draws were repaid,improved funding mix, partially offset by an improvement in funding mix and disciplined deposit pricing actions.lower net interest margin. Net interest margin (FTE)on a FTE basis of 2.83%2.72% was down 54 basis points, reflecting the impact of lower rates, higher cash balances and day count, which wereearning asset yields, partially offset by improved funding mix and disciplined deposit pricing actions.pricing. Interest-bearing depositsdeposit costs of 0.16% decreased 134 basis points.
The following table presents the major components of net interest income and net interest margin:
Citizens Financial Group, Inc. | 15
| | | Table 5: Major Components of Net Interest Income, Quarter-to-Date | | Table 5: Major Components of Net Interest Income, Quarter-to-Date | |
| | Three Months Ended September 30, | | | | Three Months Ended June 30, | | |
| 2020 | | 2019 | | Change | 2021 | | 2020 | | Change |
| (dollars in millions) | Average
Balances | Income/
Expense | Yields/
Rates | | Average
Balances | Income/
Expense | Yields/
Rates | | Average
Balances | Yields/
Rates (bps) | (dollars in millions) | Average
Balances | Income/
Expense | Yields/
Rates | | Average
Balances | Income/
Expense | Yields/
Rates | | Average
Balances | Yields/
Rates (bps) |
| Assets | | | | | | | | | Assets | | | | | |
| Interest-bearing cash and due from banks and deposits in banks |
| $6,250 |
|
| $2 |
| 0.10 | % | |
| $1,474 |
|
| $8 |
| 2.09 | % | |
| $4,776 |
| (199) bps | Interest-bearing cash and due from banks and deposits in banks | $11,259 | | $3 | | 0.12 | % | | $5,231 | | $1 | | 0.09 | % | | $6,028 | | 3 bps |
| Taxable investment securities | 24,654 |
| 121 |
| 1.95 |
| | 25,635 |
| 153 |
| 2.38 |
| | (981 | ) | (43 | ) | Taxable investment securities | 27,597 | | 124 | | 1.80 | | | 25,180 | | 130 | | 2.15 | | | 2,417 | | (35) |
| Non-taxable investment securities | 4 |
| — |
| 2.60 |
| | 5 |
| — |
| 2.60 |
| | (1 | ) | — |
| Non-taxable investment securities | 3 | | — | | 2.60 | | | 4 | | — | | 2.60 | | | (1) | | — |
| Total investment securities | 24,658 |
| 121 |
| 1.95 |
| | 25,640 |
| 153 |
| 2.38 |
| | (982 | ) | (43 | ) | Total investment securities | 27,600 | | 124 | | 1.80 | | | 25,184 | | 130 | | 2.15 | | | 2,416 | | (35) |
| Commercial | 46,844 |
| 383 |
| 3.20 |
| | 41,476 |
| 442 |
| 4.17 |
| | 5,368 |
| (97 | ) | |
| Commercial and industrial | | Commercial and industrial | 44,388 | | 345 | | 3.08 | | | 50,443 | | 412 | | 3.23 | | | (6,055) | | (15) |
| Commercial real estate | 14,644 |
| 96 |
| 2.57 |
| | 12,892 |
| 155 |
| 4.70 |
| | 1,752 |
| (213 | ) | Commercial real estate | 14,473 | | 95 | | 2.58 | | | 14,540 | | 106 | | 2.87 | | | (67) | | (29) |
| Leases | 2,373 |
| 16 |
| 2.65 |
| | 2,615 |
| 19 |
| 2.85 |
| | (242 | ) | (20 | ) | Leases | 1,792 | | 12 | | 2.76 | | | 2,426 | | 16 | | 2.75 | | | (634) | | 1 |
| Total commercial loans and leases | 63,861 |
| 495 |
| 3.03 |
| | 56,983 |
| 616 |
| 4.23 |
| | 6,878 |
| (120 | ) | Total commercial loans and leases | 60,653 | | 452 | | 2.96 | | | 67,409 | | 534 | | 3.14 | | | (6,756) | | (18) |
| Residential mortgages | 19,427 |
| 153 |
| 3.15 |
| | 19,405 |
| 171 |
| 3.53 |
| | 22 |
| (38 | ) | Residential mortgages | 20,242 | | 154 | | 3.04 | | | 18,872 | | 150 | | 3.19 | | | 1,370 | | (15) |
| Home equity | 12,416 |
| 100 |
| 3.21 |
| | 13,501 |
| 178 |
| 5.24 |
| | (1,085 | ) | (203 | ) | Home equity | 11,825 | | 92 | | 3.13 | | | 12,736 | | 111 | | 3.50 | | | (911) | | (37) |
| Automobile | 12,019 |
| 128 |
| 4.23 |
| | 12,036 |
| 129 |
| 4.25 |
| | (17 | ) | (2 | ) | Automobile | 12,526 | | 125 | | 4.00 | | | 11,998 | | 129 | | 4.33 | | | 528 | | (33) |
| Education | 10,929 |
| 130 |
| 4.74 |
| | 9,459 |
| 141 |
| 5.89 |
| | 1,470 |
| (115 | ) | Education | 12,632 | | 135 | | 4.26 | | | 11,183 | | 145 | | 5.21 | | | 1,449 | | (95) |
| | Other retail | 6,260 |
| 114 |
| 7.22 |
| | 5,873 |
| 121 |
| 8.21 |
| | 387 |
| (99 | ) | Other retail | 5,612 | | 100 | | 7.13 | | | 6,557 | | 123 | | 7.52 | | | (945) | | (39) |
| Total retail loans | 61,051 |
| 625 |
| 4.08 |
| | 60,274 |
| 740 |
| 4.88 |
| | 777 |
| (80 | ) | Total retail loans | 62,837 | | 606 | | 3.86 | | | 61,346 | | 658 | | 4.31 | | | 1,491 | | (45) |
| Total loans and leases | 124,912 |
| 1,120 |
| 3.54 |
| | 117,257 |
| 1,356 |
| 4.56 |
| | 7,655 |
| (102 | ) | Total loans and leases | 123,490 | | 1,058 | | 3.42 | | | 128,755 | | 1,192 | | 3.69 | | | (5,265) | | (27) |
| Loans held for sale, at fair value | 3,295 |
| 21 |
| 2.60 |
| | 1,970 |
| 19 |
| 3.71 |
| | 1,325 |
| (111 | ) | Loans held for sale, at fair value | 3,751 | | 24 | | 2.55 | | | 2,710 | | 20 | | 2.85 | | | 1,041 | | (30) |
| Other loans held for sale | 1,061 |
| 16 |
| 6.02 |
| | 134 |
| 2 |
| 6.42 |
| | 927 |
| (40 | ) | Other loans held for sale | 233 | | 2 | | 2.99 | | | 510 | | 7 | | 4.66 | | | (277) | | (167) |
| Interest-earning assets | 160,176 |
| 1,280 |
| 3.15 |
| | 146,475 |
| 1,538 |
| 4.15 |
| | 13,701 |
| (100 | ) | Interest-earning assets | 166,333 | | 1,211 | | 2.90 | | | 162,390 | | 1,350 | | 3.33 | | | 3,943 | | (43) |
| Allowance for loan and lease losses | (2,444 | ) | | | | (1,226 | ) | | | | (1,218 | ) | | |
| Goodwill | 7,050 |
| | | | 7,044 |
| | | | 6 |
| | |
| Other noninterest-earning assets | 12,893 |
| | | | 9,817 |
| | | | 3,076 |
| | |
| | Noninterest-earning assets | | Noninterest-earning assets | 18,123 | | | 17,403 | | | 720 | | |
| Total assets |
| $177,675 |
| | | |
| $162,110 |
| | | |
| $15,565 |
| | Total assets | $184,456 | | | $179,793 | | | $4,663 | | |
| Liabilities and Stockholders’ Equity | | | | | | | | | Liabilities and Stockholders’ Equity | | | | | | |
| Checking with interest |
| $26,638 |
|
| $8 |
| 0.13 | % | |
| $23,422 |
|
| $52 |
| 0.88 | % | |
| $3,216 |
| (75) | Checking with interest | $27,278 | | $5 | | 0.08 | % | | $26,312 | | $11 | | 0.17 | % | | $966 | | (9) |
| Money market accounts | 45,187 |
| 33 |
| 0.28 |
| | 37,161 |
| 116 |
| 1.24 |
| | 8,026 |
| (96) | Money market accounts | 49,394 | | 21 | | 0.17 | | | 45,187 | | 39 | | 0.35 | | | 4,207 | | (18) |
| Regular savings | 16,902 |
| 10 |
| 0.24 |
| | 13,442 |
| 20 |
| 0.59 |
| | 3,460 |
| (35) | Regular savings | 20,077 | | 5 | | 0.10 | | | 15,883 | | 15 | | 0.39 | | | 4,194 | | (29) |
| Term deposits | 12,032 |
| 38 |
| 1.25 |
| | 20,951 |
| 109 |
| 2.05 |
| | (8,919 | ) | (80) | Term deposits | 6,970 | | 11 | | 0.61 | | | 16,470 | | 59 | | 1.44 | | | (9,500) | | (83) |
| Total interest-bearing deposits | 100,759 |
| 89 |
| 0.35 |
| | 94,976 |
| 297 |
| 1.24 |
| | 5,783 |
| (89) | Total interest-bearing deposits | 103,719 | | 42 | | 0.16 | | | 103,852 | | 124 | | 0.48 | | | (133) | | (32) |
| | Short-term borrowed funds | 240 |
| — |
| 0.13 |
| | 600 |
| 2 |
| 1.43 |
| | (360 | ) | (130) | Short-term borrowed funds | 69 | | — | | 0.87 | | | 222 | | — | | 0.29 | | | (153) | | 58 |
| Long-term borrowed funds | 9,196 |
| 54 |
| 2.35 |
| | 12,134 |
| 94 |
| 3.07 |
| | (2,938 | ) | (72) | Long-term borrowed funds | 7,434 | | 45 | | 2.41 | | | 11,755 | | 66 | | 2.22 | | | (4,321) | | 19 |
| Total borrowed funds | 9,436 |
| 54 |
| 2.30 |
| | 12,734 |
| 96 |
| 3.00 |
| | (3,298 | ) | (70) | Total borrowed funds | 7,503 | | 45 | | 2.40 | | | 11,977 | | 66 | | 2.18 | | | (4,474) | | 22 |
| Total interest-bearing liabilities | 110,195 |
| 143 |
| 0.52 |
| | 107,710 |
| 393 |
| 1.45 |
| | 2,485 |
| (93) | Total interest-bearing liabilities | 111,222 | | 87 | | 0.31 | | | 115,829 | | 190 | | 0.66 | | | (4,607) | | (35) |
| Demand deposits | 40,608 |
| | | | 28,945 |
| | | | 11,663 |
| | Demand deposits | 46,630 | | | 37,745 | | | 8,885 | | |
| Other liabilities | 4,374 |
| | | | 3,789 |
| | | | 585 |
| | Other liabilities | 3,741 | | | 4,086 | | | (345) | | |
| Total liabilities | 155,177 |
| | | | 140,444 |
| | | | 14,733 |
| | Total liabilities | 161,593 | | | 157,660 | | | 3,933 | | |
| Stockholders’ equity | 22,498 |
| | | | 21,666 |
| | | | 832 |
| | Stockholders’ equity | 22,863 | | | 22,133 | | | 730 | | |
| Total liabilities and stockholders’ equity |
| $177,675 |
| | | |
| $162,110 |
| | | |
| $15,565 |
| | Total liabilities and stockholders’ equity | $184,456 | | | $179,793 | | | $4,663 | | |
| Interest rate spread | | 2.63 | % | | | 2.70 | % | | | (7) | Interest rate spread | | | 2.59 | % | | | | 2.67 | % | | | (8) |
| Net interest income and net interest margin | |
| $1,137 |
| 2.82 | % | | |
| $1,145 |
| 3.10 | % | | | (28) | Net interest income and net interest margin | | $1,124 | | 2.71 | % | | $1,160 | | 2.87 | % | | (16) |
Net interest income and net interest margin, FTE(1) | |
| $1,140 |
| 2.83 | % | | |
| $1,150 |
| 3.12 | % | | | (29) | Net interest income and net interest margin, FTE(1) | | $1,126 | | 2.72 | % | | $1,163 | | 2.88 | % | | (16) |
| Memo: Total deposits (interest-bearing and demand) |
| $141,367 |
|
| $89 |
| 0.25 | % | |
| $123,921 |
|
| $297 |
| 0.95 | % | |
| $17,446 |
| (70) bps | Memo: Total deposits (interest-bearing and demand) | $150,349 | | $42 | | 0.11 | % | | $141,597 | | $124 | | 0.35 | % | | $8,752 | | (24) bps |
(1) Net interest income and net interest margin is presented on a fully taxable-equivalent (“FTE”) basis using the federal statutory tax rate of 21%. The FTE impact is predominantly attributable to commercial loans for the periods presented.
Quarterly Results:Net interest income of $1.1 billion was stable with third quarter 2019, despite the lower rate and challenging yield curve environment, given 9% growth in interest-earning assets.
Net interest margin on an FTE basis of 2.83% decreased 29 basis points compared to 3.12% in third quarter 2019, reflecting the impact of lower interest rates and higher cash balances given strong deposit flows, partially offset by improved funding mix and lower funding costs. Interest-bearing deposit costs decreased 89 basis points, reflecting strong pricing discipline. Average interest-earning asset yields of 3.15% decreased 100 basis points from 4.15% in third quarter 2019, while average interest-bearing liability costs of 0.52% decreased 93 basis points from 1.45% in third quarter 2019.
Average interest-earning assets of $160.2 billion increased $13.7 billion, or 9%, from third quarter 2019, driven by a $9.9 billion, or 8% increase in average loans and leases and LHFS. Results reflected a $6.9 billion increase
in average commercial loans and leases, a $4.8 billion increase in average interest-bearing cash and due from banks and deposits in banksand a $777 million increase in average retail loans. Commercial loan and lease growth was driven by the impact of PPP loans. Interest-bearing cash and due from banks and deposits in banks growth was driven by strong deposit flows. Retail loan growth was driven by education, partially offset by loan sales, and other retail, partially offset by lower home equity.
Average deposits of $141.4 billion increased $17.4 billion, or 14%, from third quarter 2019, reflecting growth in demand deposits, money market accounts, checking with interest, and savings resulting from the impact of government stimulus as well as corporate clients building liquidity. These results were partially offset by a decline in term deposits. Average total borrowed funds of $9.4 billion decreased $3.3 billion from third quarter 2019, reflecting a decrease in long-term and short-term borrowed funds, resulting from deposit growth. Total borrowed funds costs of $54 million decreased $42 million from third quarter 2019. The total borrowed funds cost of 2.30% decreased 70 basis points from 3.00% in third quarter 2019 due to a decrease in the rate environment and decreased use of FHLB advances as a funding source resulting from improved deposit mix.
The following table presents the major components of net interest income and net interest margin:
|
| | | | | | | | | | | | | | | | | | | | | | | |
| | Nine Months Ended September 30, | | |
| 2020 | | 2019 | | Change |
| (dollars in millions) | Average
Balances | Income/
Expense | Yields/
Rates | | Average
Balances | Income/
Expense | Yields/
Rates | | Average
Balances | Yields/
Rates (bps) |
| Assets: | | | | | | | | | | |
| Interest-bearing cash and due from banks and deposits in banks |
| $4,453 |
|
| $8 |
| 0.24 | % | |
| $1,400 |
|
| $23 |
| 2.15 | % | �� |
| $3,053 |
| (191) bps |
| Taxable investment securities | 25,056 |
| 398 |
| 2.12 |
| | 25,466 |
| 483 |
| 2.53 |
| | (410 | ) | (41 | ) |
| Non-taxable investment securities | 4 |
| — |
| 2.60 |
| | 5 |
| — |
| 2.60 |
| | (1 | ) | — |
|
| Total investment securities | 25,060 |
| 398 |
| 2.12 |
| | 25,471 |
| 483 |
| 2.53 |
| | (411 | ) | (41 | ) |
| Commercial | 46,813 |
| 1,212 |
| 3.40 |
| | 41,597 |
| 1,373 |
| 4.35 |
| | 5,216 |
| (95 | ) |
| Commercial real estate | 14,354 |
| 341 |
| 3.12 |
| | 13,179 |
| 486 |
| 4.86 |
| | 1,175 |
| (174 | ) |
| Leases | 2,427 |
| 50 |
| 2.74 |
| | 2,744 |
| 59 |
| 2.86 |
| | (317 | ) | (12 | ) |
| Total commercial loans and leases | 63,594 |
| 1,603 |
| 3.31 |
| | 57,520 |
| 1,918 |
| 4.40 |
| | 6,074 |
| (109 | ) |
| Residential mortgages | 19,056 |
| 467 |
| 3.27 |
| | 19,245 |
| 522 |
| 3.61 |
| | (189 | ) | (34 | ) |
| Home equity | 12,730 |
| 363 |
| 3.81 |
| | 13,774 |
| 541 |
| 5.26 |
| | (1,044 | ) | (145 | ) |
| Automobile | 12,063 |
| 388 |
| 4.30 |
| | 12,030 |
| 374 |
| 4.16 |
| | 33 |
| 14 |
|
| Education | 10,908 |
| 424 |
| 5.19 |
| | 9,256 |
| 412 |
| 5.94 |
| | 1,652 |
| (75 | ) |
| Other retail | 6,556 |
| 369 |
| 7.51 |
| | 5,736 |
| 362 |
| 8.43 |
| | 820 |
| (92 | ) |
| Total retail loans | 61,313 |
| 2,011 |
| 4.38 |
| | 60,041 |
| 2,211 |
| 4.92 |
| | 1,272 |
| (54 | ) |
| Total loans and leases | 124,907 |
| 3,614 |
| 3.84 |
| | 117,561 |
| 4,129 |
| 4.67 |
| | 7,346 |
| (83 | ) |
| Loans held for sale, at fair value | 2,635 |
| 56 |
| 2.85 |
| | 1,514 |
| 45 |
| 3.92 |
| | 1,121 |
| (107 | ) |
| Other loans held for sale | 791 |
| 32 |
| 5.32 |
| | 161 |
| 8 |
| 6.41 |
| | 630 |
| (109 | ) |
| Interest-earning assets | 157,846 |
| 4,108 |
| 3.45 |
| | 146,107 |
| 4,688 |
| 4.26 |
| | 11,739 |
| (81 | ) |
| Allowance for loan and lease losses | (2,109 | ) | | | | (1,239 | ) | | | | (870 | ) | |
| Goodwill | 7,049 |
| | | | 7,034 |
| | | | 15 |
| |
| Other noninterest-earning assets | 12,106 |
| | | | 9,442 |
| | | | 2,664 |
| |
| Total assets |
| $174,892 |
| | | |
| $161,344 |
|
|
| | |
| $13,548 |
| |
| Liabilities and Stockholders’ Equity: | | | | | | | | | | |
| Checking with interest |
| $25,857 |
|
| $56 |
| 0.29 | % | |
| $23,444 |
|
| $161 |
| 0.92 | % | |
| $2,413 |
| (63) |
| Money market accounts | 43,411 |
| 165 |
| 0.51 |
| | 35,873 |
| 340 |
| 1.27 |
| | 7,538 |
| (76) |
| Regular savings | 15,667 |
| 43 |
| 0.37 |
| | 13,134 |
| 58 |
| 0.59 |
| | 2,533 |
| (22) |
| Term deposits | 15,692 |
| 176 |
| 1.49 |
| | 21,456 |
| 333 |
| 2.07 |
| | (5,764 | ) | (58) |
| Total interest-bearing deposits | 100,627 |
| 440 |
| 0.58 |
| | 93,907 |
| 892 |
| 1.27 |
| | 6,720 |
| (69) |
| Short-term borrowed funds | 368 |
| 1 |
| 0.53 |
| | 720 |
| 8 |
| 1.56 |
| | (352 | ) | (103) |
| Long-term borrowed funds | 11,660 |
| 210 |
| 2.39 |
| | 13,076 |
| 317 |
| 3.22 |
| | (1,416 | ) | (83) |
| Total borrowed funds | 12,028 |
| 211 |
| 2.33 |
| | 13,796 |
| 325 |
| 3.13 |
| | (1,768 | ) | (80) |
| Total interest-bearing liabilities | 112,655 |
| 651 |
| 0.77 |
| | 107,703 |
| 1,217 |
| 1.51 |
| | 4,952 |
| (74) |
| Demand deposits | 35,922 |
| | | | 28,601 |
| | | | 7,321 |
|
|
| Other liabilities | 4,172 |
| | | | 3,637 |
| | | | 535 |
|
|
| Total liabilities | 152,749 |
| | | | 139,941 |
| | | | 12,808 |
|
|
| Stockholders’ equity | 22,143 |
| | | | 21,403 |
| | | | 740 |
|
|
| Total liabilities and stockholders’ equity |
| $174,892 |
| | | |
| $161,344 |
| | | |
| $13,548 |
|
|
| Interest rate spread | | | 2.68 | % | | | | 2.75 | % | | | (7) |
| Net interest income and net interest margin | |
| $3,457 |
| 2.93 | % | | |
| $3,471 |
| 3.18 | % | | | (25) |
Net interest income and net interest margin, FTE(1) | |
| $3,467 |
| 2.93 | % | | |
| $3,488 |
| 3.19 | % | | | (26) |
| Memo: Total deposits (interest-bearing and demand) |
| $136,549 |
|
| $440 |
| 0.43 | % | |
| $122,508 |
|
| $892 |
| 0.97 | % | |
| $14,041 |
| (54) bps |
(1) Net interest income and net interest margin is presented on an FTE basis using the federal statutory tax rate of 21%. The FTE impact is predominantly attributable to commercial and industrial loans for the periods presented.
Second quarter 2021 vs second quarter 2020:Year-To-Date Results: Net interest income of $3.5$1.1 billion was stable withdecreased 3% from the first nine months 2019, despite thesecond quarter of 2020 given lower rate and challenging yield-curve environment, given 8%net interest margin, partially offset by 2% growth in interest-earning assets.
Net interest margin on ana FTE basis of 2.93%2.72% decreased 2616 basis points compared to 3.19%2.88% in the first nine monthssecond quarter of 2019, as2020, primarily reflecting the impact of a lower interest rates wasrate environment, lower interest-earning asset yields andelevated cash balances given strong deposit flows, partially offset by lowerimproved funding mix and deposit pricing. Interest-bearing deposit costs and improved deposit mix, as well as continued mix shift towards higher yielding assets.decreased 32 basis points. Average interest-earning asset yields of 3.45%2.90% decreased 8143 basis points from 4.26%3.33% in the first nine monthssecond quarter of 2019,2020, while average interest-bearing liability costs of 0.77%0.31% decreased 7435 basis points from 1.51%0.66% in the second quarter of 2020.
Average interest-earning assets of $166.3 billion increased $3.9 billion, or 2%, from the second quarter of 2020, driven by a $6.0 billion increase in cash held in interest-bearing deposits, and a $2.4 billion increase in
Citizens Financial Group, Inc. | 16
investments. Loans and loans held for sale decreased $4.5 billion, or 3%, with a $6.8 billion decrease in average commercial loans and leases reflecting line of credit repayments and net payoffs, partially offset by $4.6 billion of PPP loans. Retail loans increased $1.5 billion driven by growth in education, residential mortgage, and automobile, partially offset by decreases in home equity and other retail given planned run-off of personal unsecured installment loans. Loans held for sale increased $764 million reflecting mortgage originations.
Average deposits of $150.3 billion increased $8.8 billion, or 6%, from the second quarter of 2020, reflecting an increase in demand deposits, money market accounts, savings, and checking with interest, partially offset by a decrease in term deposits. Average total borrowed funds of $7.5 billion decreased $4.5 billion from the second quarter of 2020, as strong customer deposit inflows allowed for significantly lower levels of FHLB advances and the pay down of senior debt and short-term borrowings. Total borrowed funds costs of $45 million decreased $21 million from the second quarter of 2020. The total borrowed funds cost of 2.40% increased 22 basis points from 2.18% in the second quarter of 2020.
| | | | | | | | | | | | | | | | | | | | | | | | | | | | | | | | |
| Table 6: Major Components of Net Interest Income, Year-to-Date | | | | | |
| Six Months Ended June 30, | | |
| 2021 | | 2020 | | Change |
| (dollars in millions) | Average
Balances | Income/
Expense | Yields/
Rates | | Average
Balances | Income/
Expense | Yields/
Rates | | Average
Balances | Yields/
Rates (bps) |
| Assets: | | | | | | | | | | |
| Interest-bearing cash and due from banks and deposits in banks | $11,061 | | $6 | | 0.11 | % | | $3,545 | | $6 | | 0.36 | % | | $7,516 | | (25) bps |
| Taxable investment securities | 27,316 | | 252 | | 1.84 | | | 25,259 | | 277 | | 2.24 | | | 2,057 | | (40) |
| Non-taxable investment securities | 3 | | — | | 2.60 | | | 4 | | — | | 2.60 | | | (1) | | — |
| Total investment securities | 27,319 | | 252 | | 1.84 | | | 25,263 | | 277 | | 2.24 | | | 2,056 | | (40) |
| Commercial and industrial | 44,338 | | 692 | | 3.10 | | | 46,797 | | 829 | | 3.50 | | | (2,459) | | (40) |
| Commercial real estate | 14,574 | | 189 | | 2.58 | | | 14,208 | | 245 | | 3.40 | | | 366 | | (82) |
| Leases | 1,852 | | 25 | | 2.73 | | | 2,454 | | 34 | | 2.79 | | | (602) | | (6) |
| Total commercial loans and leases | 60,764 | | 906 | | 2.97 | | | 63,459 | | 1,108 | | 3.45 | | | (2,695) | | (48) |
| Residential mortgages | 19,817 | | 302 | | 3.05 | | | 18,869 | | 314 | | 3.33 | | | 948 | | (28) |
| Home equity | 11,912 | | 187 | | 3.16 | | | 12,889 | | 263 | | 4.10 | | | (977) | | (94) |
| Automobile | 12,378 | | 250 | | 4.07 | | | 12,085 | | 260 | | 4.33 | | | 293 | | (26) |
| Education | 12,534 | | 269 | | 4.32 | | | 10,897 | | 294 | | 5.42 | | | 1,637 | | (110) |
| | | | | | | | | | |
| | | | | | | | | | |
| Other retail | 5,765 | | 205 | | 7.19 | | | 6,706 | | 255 | | 7.65 | | | (941) | | (46) |
| Total retail loans | 62,406 | | 1,213 | | 3.91 | | | 61,446 | | 1,386 | | 4.53 | | | 960 | | (62) |
| Total loans and leases | 123,170 | | 2,119 | | 3.44 | | | 124,905 | | 2,494 | | 3.98 | | | (1,735) | | (54) |
| Loans held for sale, at fair value | 3,535 | | 42 | | 2.40 | | | 2,300 | | 35 | | 3.03 | | | 1,235 | | (63) |
| Other loans held for sale | 348 | | 8 | | 4.48 | | | 655 | | 16 | | 4.45 | | | (307) | | 3 |
| Interest-earning assets | 165,433 | | 2,427 | | 2.94 | | | 156,668 | | 2,828 | | 3.61 | | | 8,765 | | (67) |
| | | | | | | | | | |
| | | | | | | | | | |
| | | | | | | | | | |
| Noninterest-earning assets | 18,085 | | | | | 16,817 | | | | | 1,268 | | |
| Total assets | $183,518 | | | | | $173,485 | | | | | $10,033 | | |
| Liabilities and Stockholders’ Equity: | | | | | | | | | | |
| Checking with interest | $26,700 | | $11 | | 0.09 | % | | $25,462 | | $48 | | 0.38 | % | | $1,238 | | (29) |
| Money market accounts | 49,465 | | 43 | | 0.17 | | | 42,513 | | 132 | | 0.63 | | | 6,952 | | (46) |
| Regular savings | 19,348 | | 10 | | 0.10 | | | 15,042 | | 33 | | 0.44 | | | 4,306 | | (34) |
| Term deposits | 7,767 | | 28 | | 0.73 | | | 17,543 | | 138 | | 1.58 | | | (9,776) | | (85) |
| Total interest-bearing deposits | 103,280 | | 92 | | 0.18 | | | 100,560 | | 351 | | 0.70 | | | 2,720 | | (52) |
| | | | | | | | | | |
| | | | | | | | | | |
| Short-term borrowed funds | 109 | | — | | 0.59 | | | 433 | | 1 | | 0.64 | | | (324) | | (5) |
| Long-term borrowed funds | 7,882 | | 94 | | 2.38 | | | 12,906 | | 156 | | 2.40 | | | (5,024) | | (2) |
| Total borrowed funds | 7,991 | | 94 | | 2.36 | | | 13,339 | | 157 | | 2.35 | | | (5,348) | | 1 |
| Total interest-bearing liabilities | 111,271 | | 186 | | 0.34 | | | 113,899 | | 508 | | 0.90 | | | (2,628) | | (56) |
| Demand deposits | 45,230 | | | | | 33,553 | | | | | 11,677 | | |
| Other liabilities | 4,297 | | | | | 4,070 | | | | | 227 | | |
| Total liabilities | 160,798 | | | | | 151,522 | | | | | 9,276 | | |
| Stockholders’ equity | 22,720 | | | | | 21,963 | | | | | 757 | | |
| Total liabilities and stockholders’ equity | $183,518 | | | | | $173,485 | | | | | $10,033 | | |
| Interest rate spread | | | 2.60 | % | | | | 2.71 | % | | | (11) |
| Net interest income and net interest margin | | $2,241 | | 2.73 | % | | | $2,320 | | 2.98 | % | | | (25) |
Net interest income and net interest margin, FTE(1) | | $2,246 | | 2.74 | % | | | $2,327 | | 2.99 | % | | | (25) |
| Memo: Total deposits (interest-bearing and demand) | $148,510 | | $92 | | 0.12 | % | | $134,113 | | $351 | | 0.53 | % | | $14,397 | | (41) bps |
| | | | | | | | | | |
| | | | | | | | | | |
| | | | | | | | | | |
| | | | | | | | | | |
(1) Net interest income and net interest margin is presented on a FTE basis using the federal statutory tax rate of 21%. The FTE impact is predominantly attributable to commercial and industrial loans for the periods presented.
Citizens Financial Group, Inc. | 17
First half 2021 versus first half of 2020: Net interest income of $2.2 billion decreased 3% from the first half of 2020, with 6% growth in interest-earning assets, including the addition of PPP loans, which was more than offset by lower net interest margin.
Net interest margin on a FTE basis of 2.74% decreased 25 basis points compared to 2.99% in the first nine monthshalf of 2019.2020, primarily reflecting the impact of a lower rate environment, lower interest-earning asset yields, and elevated cash balances given strong deposit flows, partially offset by improved funding mix and deposit pricing. Average interest-earning asset yields of 2.94% decreased 67 basis points from 3.61% in the first half of 2020, while average interest-bearing liability costs of 0.34% decreased 56 basis points from 0.90% in the first half of 2020.
Average interest-earning assets of $157.8$165.4 billion increased $11.7$8.8 billion, or 8%6%, from the first nine monthshalf of 2019, driven by an $9.12020, as increased liquidity allowed for a $5.3 billion, or 40%, decrease in borrowed funds, and drove a $7.5 billion increase in cash held in interest-bearing deposits, and a $2.1 billion, or 8%, increase in investments. Results also reflected a $807 million, or 1%, decrease in average loans and leases and LHFS. Results reflectedLHFS with a $6.1
$2.7 billion increasedecrease in average commercial loans and leases a $3.1 billion increase in average interest-bearing cash and due from banks and deposits in banks and a $1.3 billion increase in average retail loans. Commercial loan growth was driven by the impact of higher COVID-19-relatedreflecting line of credit utilization and PPP loans. Interest-bearing cashrepayments and due from banks and deposits in banks growth was driven by strong deposit flows. Retail loan growth was driven by education,net payoffs, partially offset by loan sales,$4.70 billion of PPP loans. Furthermore, average retail loans increased $960 million, driven by growth in education and residential mortgage, partially offset by decreases in home equity and other retail partially offset by lower home equity.given run-off of personal unsecured installment loans. Loans held for sale increased $928 million, reflecting mortgage originations.
Average deposits of $136.5$148.5 billion increased $14.0$14.4 billion, or 11%, from the first nine monthshalf of 2019,2020, reflecting growth in demand deposits, money market accounts, demand deposits,savings and checking with interest, and savings resulting from the impact of government stimulus as well as corporate clients building liquidity. These results were partially offset by a decline in term deposits. Average total borrowed funds of $12.0$8.0 billion decreased $1.8$5.3 billion from the first nine monthshalf of 2019, reflecting a decrease in long-term2020, as strong customer deposit inflows allowed for significantly lower levels of FHLB advances and the pay down of senior debt and short-term borrowed funds resulting from deposit growth.borrowings. Total borrowed funds costs of $211$94 million decreased $114$63 million from the first nine monthshalf of 2019.2020. The total borrowed funds cost of 2.33% decreased 802.36% increased 1 basis pointspoint from 3.13%2.35% in the first nine monthshalf of 2019 due to lower interest cost on long-term senior debt and decreased use of FHLB advances as a funding source resulting from improved deposit mix.2020.
Citizens Financial Group, Inc. | 18
Noninterest Income
The following table presents a five quarter trend of our total noninterest income:
ThirdSecond quarter 20202021 versus secondfirst quarter 2020:2021: Noninterest income of $654$485 million upwas down 11%, reflecting increasedlower mortgage banking fees higher service changes and fees, trust and investment service fees,given lower gain-on-sale margins as well as card fees and higher letter of credit and loan fees given increased customer activity. Other income includes the gain on sale of education loans.lower mortgage servicing rights hedging results. These resultsdecreases were partially offset by a decrease in foreign exchangehigher card fees, capital markets fees, and interest rate products given lower customer hedging activity.trust and investment services fees.
The following table presents the significant components of our noninterest income:
| | | Table 7: Noninterest Income | | Table 7: Noninterest Income | |
| | Three Months Ended September 30, | | | | | | Nine Months Ended September 30, | | | | | | Three Months Ended June 30, | | Six Months Ended June 30, | |
| (in millions) | 2020 |
| | 2019 |
| | Change |
| | Percent |
| | 2020 |
| | 2019 |
| | Change |
| | Percent |
| (in millions) | 2021 | | 2020 | | Change | | Percent | | 2021 | | 2020 | | Change | | Percent |
| Mortgage banking fees | | Mortgage banking fees | $85 | | | $276 | | | ($191) | | | (69 | %) | | $250 | | | $435 | | | ($185) | | | (43 | %) |
| Service charges and fees |
| $97 |
| |
| $128 |
| |
| ($31 | ) | | (24 | %) | |
| $299 |
| |
| $377 |
| |
| ($78 | ) | | (21 | %) | Service charges and fees | 100 | | | 84 | | | 16 | | | 19 | | | 199 | | | 202 | | | (3) | | | (1) | |
| Mortgage banking fees | 287 |
| | 117 |
| | 170 |
| | 145 |
| | 722 |
| | 222 |
| | 500 |
| | 225 |
| |
| Capital markets fees | | Capital markets fees | 91 | | | 61 | | | 30 | | | 49 | | | 172 | | | 104 | | | 68 | | | 65 | |
| Card fees | 57 |
| | 67 |
| | (10 | ) | | (15 | ) | | 161 |
| | 190 |
| | (29 | ) | | (15 | ) | Card fees | 64 | | | 48 | | | 16 | | | 33 | | | 119 | | | 104 | | | 15 | | | 14 | |
| Capital markets fees | 58 |
| | 39 |
| | 19 |
| | 49 |
| | 162 |
| | 150 |
| | 12 |
| | 8 |
| |
| Trust and investment services fees | 53 |
| | 50 |
| | 3 |
| | 6 |
| | 151 |
| | 150 |
| | 1 |
| | 1 |
| Trust and investment services fees | 60 | | | 45 | | | 15 | | | 33 | | | 118 | | | 98 | | | 20 | | | 20 | |
| Letter of credit and loan fees | | Letter of credit and loan fees | 38 | | | 31 | | | 7 | | | 23 | | | 76 | | | 65 | | | 11 | | | 17 | |
| Foreign exchange and interest rate products | 27 |
| | 35 |
| | (8 | ) | | (23 | ) | | 85 |
| | 106 |
| | (21 | ) | | (20 | ) | Foreign exchange and interest rate products | 28 | | | 34 | | | (6) | | | (18) | | | 56 | | | 58 | | | (2) | | | (3) | |
| Letter of credit and loan fees | 37 |
| | 34 |
| | 3 |
| | 9 |
| | 102 |
| | 100 |
| | 2 |
| | 2 |
| |
| Securities gains, net | 1 |
| | 3 |
| | (2 | ) | | (67 | ) | | 4 |
| | 15 |
| | (11 | ) | | (73 | ) | Securities gains, net | 3 | | | 3 | | | — | | | — | | | 6 | | | 3 | | | 3 | | | 100 | |
Other income (1) | 37 |
| | 20 |
| | 17 |
| | 85 |
| | 55 |
| | 73 |
| | (18 | ) | | (25 | ) | Other income (1) | 16 | | | 8 | | | 8 | | | 100 | | | 31 | | | 18 | | | 13 | | | 72 | |
| Noninterest income |
| $654 |
| |
| $493 |
| |
| $161 |
| | 33 | % | |
| $1,741 |
| |
| $1,383 |
| |
| $358 |
| | 26 | % | Noninterest income | $485 | | | $590 | | | ($105) | | | (18 | %) | | $1,027 | | | $1,087 | | | ($60) | | | (6 | %) |
(1) Includes bank-owned life insurance income and other miscellaneous income for all periods presented, and net impairment losses recognized in earnings on available for sale debt securities for the 2019 periods presented.
Quarterly Results:Second quarter 2021 versus second quarter 2020: Noninterest income increased $161decreased $105 million, from third quarter 2019, and reflected increased mortgage banking fees and capital markets fees. Mortgage banking fees of $287 million reflected higher origination volumes and gain on sale margins while growth in capital markets fees was driven by an increase in advisory fees and a recovery on loan and bond trading. Other income increased from third quarter 2019 levels given the third quarter 2020 gain on sale of education loans associated with balance sheet optimization initiatives, partially offset by lower leasing income related to the benefit of a lease restructuring in 2019. Current results were partially offset by lower service charges and fees, card fees, and lower foreign exchange and interest rate products fees given the impact of COVID-19 and associated lockdowns.
Year-To-Date Results: Noninterest income increased $358 millionor 18% from the first nine monthssecond quarter of 2019, as third quarter 2020 results2020. Results reflected increasedlower mortgage banking fees resulting from higher refinancing activity caused by lower rates were partially offset by the impact of COVID-19 and associated lockdowns on service charges and fees, card fees and foreign exchange and interest rate products. Mortgageproducts revenue partially offset by improved capital markets fees, service charges and fees, card fees, trust and investment services fees, and letter of credit and loan fees.
•Lower mortgage banking fees of $722 million reflected increasedwere driven by lower gain-on-sale margins despite higher origination volumes and improved gain on sale margins. The decline involumes.
•Lower foreign exchange and interest rate products was primarily drivenrevenue reflects lower client interest rate hedging activity partly offset by a lower rate environmentstrong client foreign exchange and commodities hedging results.
•Improved capital markets fees reflects higher loan syndication and mergers and acquisition advisory fees.
•Higher card fees reflect increased debit and credit card volumes given the economic recovery.
•Higher trust and investment services fees reflect an increase in 2020. Otherassets under management from higher equity market levels and strong inflows, as well as higher annuity sales.
First half 2021 versus first half 2020: Noninterest income decreased $60 million, or 6%, from the first nine monthshalf of 20192020. Results reflected lower mortgage banking fees partially offset by improved capital markets fees, trust and investment fees, letter of credit and loan fees, and card fees.
•Lower mortgage banking fees reflected lower gain-on-sale margins given increased industry capacity and
Citizens Financial Group, Inc. | 19
heightened competition as well as lower mortgage servicing rights hedging results.
•Higher loan syndication, underwriting, and mergers and acquisition advisory fees drove improvement in capital markets fees.
•Higher trust and investment services fees reflected an increase in assets under management from higher equity market levels given lower leasing income and lower gains related to asset dispositions in the current period.strong inflows.
•Increased letter of credit and loan fees reflected higher commitment fees. Noninterest Expense
The following table presents a five quarter trend of our total noninterest expense:
ThirdSecond quarter 20202021 versus secondfirst quarter 2020:2021: Noninterest expense of $988$991 million increased 1%decreased 3% and included the impact of notable items. On aan Underlying basis, noninterest expense of $957$980 million was down slightly given2%, reflecting seasonally lower salaries and employee benefits, along with strong expense discipline, as well as lower other operating expense.discipline.
The following table presents the significant components of our noninterest expense:
| | | Table 8: Noninterest Expense | | Table 8: Noninterest Expense | |
| | Three Months Ended September 30, | | | | | | Nine Months Ended September 30, | | | | | | Three Months Ended June 30, | | Six Months Ended June 30, | |
| (in millions) | 2020 |
| | 2019 |
| | Change |
| | Percent |
| | 2020 |
| | 2019 |
| | Change |
| | Percent |
| (in millions) | 2021 | | 2020 | | Change | | Percent | | 2021 | | 2020 | | Change | | Percent |
| Salaries and employee benefits |
| $524 |
| |
| $508 |
| |
| $16 |
| | 3 | % | |
| $1,586 |
| |
| $1,524 |
| |
| $62 |
| | 4 | % | Salaries and employee benefits | $524 | | | $513 | | | $11 | | | 2 | % | | $1,072 | | | $1,062 | | | $10 | | | 1 | % |
| Equipment and software expense | 149 |
| | 130 |
| | 19 |
| | 15 |
| | 424 |
| | 381 |
| | 43 |
| | 11 |
| |
| Equipment and software | | Equipment and software | 155 | | | 142 | | | 13 | | | 9 | | | 307 | | | 275 | | | 32 | | | 12 | |
| Outside services | 139 |
| | 128 |
| | 11 |
| | 9 |
| | 405 |
| | 356 |
| | 49 |
| | 14 |
| Outside services | 137 | | | 131 | | | 6 | | | 5 | | | 276 | | | 266 | | | 10 | | | 4 | |
| Occupancy | 81 |
| | 80 |
| | 1 |
| | 1 |
| | 247 |
| | 245 |
| | 2 |
| | 1 |
| Occupancy | 82 | | | 82 | | | — | | | — | | | 170 | | | 166 | | | 4 | | | 2 | |
| Other operating expense | 95 |
| | 127 |
| | (32 | ) | | (25 | ) | | 317 |
| | 355 |
| | (38 | ) | | (11 | ) | Other operating expense | 93 | | | 111 | | | (18) | | | (16) | | | 184 | | | 222 | | | (38) | | | (17) | |
| Noninterest expense |
| $988 |
| |
| $973 |
| |
| $15 |
| | 2 | % | |
| $2,979 |
| |
| $2,861 |
| |
| $118 |
| | 4 | % | Noninterest expense | $991 | | | $979 | | | $12 | | | 1 | % | | $2,009 | | | $1,991 | | | $18 | | | 1 | % |
Quarterly Results:Second quarter 2021 versus second quarter 2020: Noninterest expense increased $1512 million, or 1%, and underlying noninterest expense of $957$980 million was stable with thirdincreased 2% compared to the second quarter 2019.of 2020. Higher equipment and software, expense reflected continued investment in technology, and higher salaries and employee benefits, expense reflected revenue-based compensation tied to increased mortgage originations. Higherand outside services were tied to growth initiatives. Lower other operating expense reflected lower travel and advertising expenses and a $10 million charge related to a lease restructuring in the prior year.
Year-To-Date Results: Noninterest expense increased $118 million, or 4%, from the first nine months of 2019, largely reflecting higher salaries and employee benefits given the impact of annual merit increases and revenue-based compensation tied to increased mortgage originations. Results also reflected higher equipment and software expense given continued investments in technology as well as higher outside services largely tied to growth initiatives. These results were partially offset by lower other operating results givenexpense.
•Higher equipment and software expense reflected increased technology spend.
•Salaries and employee benefits increased, reflecting higher revenue-based compensation.
•Higher outside services were largely tied to growth initiatives.
First half 2021 versus first half 2020: Noninterest expense increased $18 million, or 1%, from the first half of 2020, largely reflecting higher equipment and software expense, salaries and employee benefits and outside services partially offset by lower travel and advertising expenses.other operating expense due to the reasons stated above. Underlying noninterest expense of $2.9$2.0 billion increased $66$39 million, or 2%., as a result of the items stated above.
Citizens Financial Group, Inc. | 20
Provision for Credit Losses
The following table presents a five quarter trend of our provision for credit losses, net charge-offs and net charge-off ratio:
The provision for credit losses is the result of a detailed analysis performed to estimate our ACL. The total provision for credit losses includes the provision for loan and lease losses and the provision for unfunded commitments. Refer to “—Analysis of Financial Condition — Allowance for Credit Losses and Nonaccruing Loans and Leases” for more information.
Quarterly Results:Second quarter 2021 versus first quarter 2021: In the second quarter of 2021, strong credit performance across the retail and commercial loan portfolios and improvement in the macroeconomic outlook resulted in a credit provision benefit of $213 million. This compared to a credit provision benefit of $140 million in the first quarter of 2021.
Second quarter 2021 versus second quarter 2020: The credit provision for credit lossesbenefit was $213 million in the second quarter of $428 million, which includes a $209 million reserve build,2021, compared with $101a $464 million credit provision expense in third quarter 2019. Net charge-offs of $219 million increased $106 million from the thirdsecond quarter of 2019, primarily due to one2020. The credit to a mall real estate investment trust and one commercial creditprovision expense in metals and mining, and a decrease in retail reflecting2020 reflects the impact of U.S. Government economic stimulus programs and forbearance.
Year-To-Date Results: The provision for credit losses of $1.5 billion, which includes a $989 million reserve build primarily associated with theadverse impacts from the COVID-19 pandemic and associated lockdowns, on our loan portfolio resulting from a sudden risewhile the credit provision benefit in unemployment2021 reflects strong credit performance and drop in GDP, compared with $283improving macroeconomic outlook.
First half 2021 versus first half 2020: The credit provision benefit was $353 million in the first nine months 2019. Net charge-offshalf of $503 million increased $195 million2021. This compared to a credit provision expense of $1.1 billion in the first half of 2020, which reflected the adverse impacts from the first nine months of 2019, driven by a $196 million increase in commercial loanCOVID-19 pandemic and lease net charge-offs.associated lockdowns.
Citizens Financial Group, Inc. | 21
Income Tax Expense
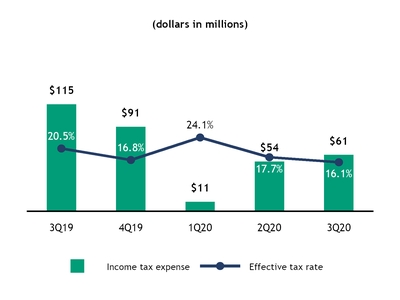
Quarterly Results:Second quarter 2021 versus second quarter 2020: Income tax expense decreased $54increased $129 million from thirdthe second quarter 2019.of 2020 due to increased taxable income. The effective income tax rate decreasedincreased to 16.1%22.0% from 20.5%17.7% in thirdthe second quarter 2019,of 2020, driven by the increaseddecreased benefit of tax advantaged investments on lowerhigher pre-tax income.
Year-To-Date Results:First half 2021 versus first half 2020: Income tax expense decreased $243for the first half of 2021 was $353 million compared to $65 million in the first half of 2020. Income tax expense increased $288 million from the first nine monthshalf of 2019.2020 due to increased taxable income. The effective income tax rate decreasedincreased to 17.3%21.9% from 21.6%18.5% in the first nine monthshalf of 2019,2020 driven by the increaseddecreased benefit of tax-advantaged investmentstax advantaged investment on lowerhigher pre-tax income.
Business Operating Segments
We have two business operating segments: Consumer Banking and Commercial Banking. Segment results are derived by specifically attributing managed assets, liabilities, capital and related revenues, provision for credit losses, which, at the segment level, is equal to net charge-offs, and other expenses. Non-segment operations are classified as Other, which includes corporate functions, the Treasury function, the securities portfolio, wholesale funding activities, intangible assets not directly allocated to a business operating segment, community development, non-core assets and other unallocated assets, liabilities, capital, revenues, provision for credit losses, expenses and income tax expense.expense not attributed to our Consumer or Commercial Banking segments as well as treasury and community development. In addition, Other includes goodwill not directly allocated to a business operating segment and any associated goodwill impairment charges. For impairment testing purposes, we allocate all goodwill to our Consumer Banking and/or Commercial Banking reporting units. There have been no significant changes in our methodologies used to allocate items to our business operating segments as described in “—Results of Operations — Business Operating Segments” in our 20192020 Form 10-K.
Quarterly Results: The following table presents certain financial data of our business operating segments. Total business operating segment financial results differ from total consolidated financial results. These differences are reflected in Other non-segment operations. See Note 1716 in Item 1 for further information.
Citizens Financial Group, Inc. | 22
| | | Table 9: Selected Financial Data for Business Operating Segments, Quarter-to-Date | | Table 9: Selected Financial Data for Business Operating Segments, Quarter-to-Date | |
| | Consumer Banking | | Commercial Banking | | Consumer Banking | | Commercial Banking |
| | Three Months Ended September 30, | | Three Months Ended September 30, | | Three Months Ended June 30, | | Three Months Ended June 30, |
| (dollars in millions) | 2020 |
| | 2019 |
| | 2020 |
| | 2019 |
| (dollars in millions) | 2021 | | 2020 | | 2021 | | 2020 |
| Net interest income |
| $845 |
| |
| $799 |
| |
| $421 |
| |
| $360 |
| Net interest income | $897 | | | $814 | | | $419 | | | $419 | |
| Noninterest income | 495 |
| | 336 |
| | 144 |
| | 133 |
| Noninterest income | 283 | | | 428 | | | 178 | | | 144 | |
| Total revenue | 1,340 |
| | 1,135 |
| | 565 |
| | 493 |
| Total revenue | 1,180 | | | 1,242 | | | 597 | | | 563 | |
| Noninterest expense | 742 |
| | 718 |
| | 210 |
| | 213 |
| Noninterest expense | 751 | | | 735 | | | 226 | | | 213 | |
| Profit before credit losses | 598 |
| | 417 |
| | 355 |
| | 280 |
| Profit before credit losses | 429 | | | 507 | | | 371 | | | 350 | |
| Charge-offs | 55 |
| | 83 |
| | 161 |
| | 27 |
| |
| Net charge-offs | | Net charge-offs | 45 | | | 80 | | | 34 | | | 70 | |
| Income before income tax expense | 543 |
| | 334 |
| | 194 |
| | 253 |
| Income before income tax expense | 384 | | | 427 | | | 337 | | | 280 | |
| Income tax expense | 136 |
| | 83 |
| | 41 |
| | 57 |
| Income tax expense | 98 | | | 107 | | | 72 | | | 59 | |
| Net income |
| $407 |
| |
| $251 |
| |
| $153 |
| |
| $196 |
| Net income | $286 | | | $320 | | | $265 | | | $221 | |
| Average Balances: | | | | | | | | Average Balances: | | | |
| Total assets |
| $73,605 |
| |
| $66,365 |
| |
| $60,889 |
| |
| $55,614 |
| Total assets | $75,600 | | | $71,634 | | | $57,527 | | | $65,280 | |
Total loans and leases(1)(2) | 69,719 |
| | 63,553 |
| | 57,796 |
| | 53,814 |
| Total loans and leases(1)(2) | 71,389 | | | 68,205 | | | 54,758 | | | 62,011 | |
| Deposits | 94,212 |
| | 85,595 |
| | 41,393 |
| | 31,491 |
| Deposits | 100,933 | | | 91,648 | | | 44,049 | | | 41,750 | |
| Interest-earning assets | 69,925 |
| | 63,605 |
| | 58,177 |
| | 54,087 |
| Interest-earning assets | 72,308 | | | 68,256 | | | 55,143 | | | 62,422 | |
(1)Includes LHFS.
(2) The majority of PPP loans are reflected in Consumer Banking in accordance with how they are managed.
Consumer Banking
Net interest income increased $46 million, or 6%, from the third quarter of 2019, driven by the benefit of a $6.2 billion increase in average loans led by education, other retail and the impact of the PPP loan program, and a $8.6 billion increase in average deposits, partially offset by lower deposit margins driven by the low rate environment. Noninterest income increased $159 million, or 47%, from the third quarter of 2019, driven by mortgage banking fees (reflecting origination volumes and gain on sale margins), partially offset by lower service charges and fees and card fees due to continuing COVID-19-related impacts on customer transaction volume. Noninterest expense increased $24 million, or 3%, from the third quarter of 2019, reflecting higher salaries and benefits costs tied to higher mortgage origination volumes. Provision for credit losses of $55 million decreased $28 million, or 34%, driven by the impact of COVID-19-related stimulus and forbearance programs.
Commercial Banking
Net interest income of $421 million increased $61 million, or 17%, from $360 million in the third quarter of 2019, primarily due to higher loan volume and favorable interest-bearing deposits cost of funds pricing. Noninterest income of $144 million increased $11 million, or 8%, from $133 million in the third quarter of 2019, driven by capital markets fees and letter of credit and loan fees. Noninterest expense of $210 million decreased $3 million, or 1%, from $213 million in the third quarter of 2019, driven by lower travel costs. Provision for credit losses of $161 millionincreased $134 million from the third quarter of 2019, driven primarily by one credit in a mall real estate investment trust and one commercial credit in metals and mining.
Year-To-Date Results: The following table presents certain financial data of our business operating segments. Total business operating segment financial results differ from total consolidated financial results. These differences are reflected in Other non-segment operations. See Note 17 in Item 1 for further information.
|
| | | | | | | | | | | | | | | |
| | Consumer Banking | | Commercial Banking |
| | Nine Months Ended September 30, | | Nine Months Ended September 30, |
| (dollars in millions) | 2020 |
| | 2019 |
| | 2020 |
| | 2019 |
|
| Net interest income |
| $2,452 |
| |
| $2,386 |
| |
| $1,205 |
| |
| $1,103 |
|
| Noninterest income | 1,280 |
| | 860 |
| | 413 |
| | 432 |
|
| Total revenue | 3,732 |
| | 3,246 |
| | 1,618 |
| | 1,535 |
|
| Noninterest expense | 2,215 |
| | 2,133 |
| | 644 |
| | 639 |
|
| Profit before credit losses | 1,517 |
| | 1,113 |
| | 974 |
| | 896 |
|
| Charge-offs | 232 |
| | 228 |
| | 274 |
| | 73 |
|
| Income before income tax expense | 1,285 |
| | 885 |
| | 700 |
| | 823 |
|
| Income tax expense | 322 |
| | 219 |
| | 147 |
| | 184 |
|
| Net income |
| $963 |
| |
| $666 |
| |
| $553 |
| |
| $639 |
|
| Average Balances: | | | | | | | |
| Total assets |
| $71,227 |
| |
| $65,624 |
| |
| $61,722 |
| |
| $55,793 |
|
Total loans and leases(1)(2) | 67,763 |
| | 62,803 |
| | 58,784 |
| | 54,299 |
|
| Deposits | 90,377 |
| | 84,619 |
| | 38,905 |
| | 30,535 |
|
| Interest-earning assets | 67,866 |
| | 62,856 |
| | 59,201 |
| | 54,585 |
|
(1) Includes LHFS.
(2) The majority of PPP loans are reflected in Consumer Banking in accordance with how they are managed.
Consumer Banking
Net interest income increased $66$83 million, or 3%10%, from the first nine monthssecond quarter of 2019,2020, driven by the benefit of a $5.0$3.2 billion increase in average loans led by growth in education, residential mortgage, automobile, and the impact of the PPP loans program, andloan program. In addition, a $5.8$9.3 billion increase in average deposits driven by government stimulus programs also contributed to higher net interest income. Noninterest income decreased $145 million, or 34%, from the second quarter of 2020, driven by lower mortgage banking fees as increased industry capacity and heightened competition resulted in lower gain-on-sale margins, partially offset by lower deposit marginsrecovery in service charges and fees, card fees, and trust and investment services fees, reflecting an increase in assets under management from higher equity market levels as well as higher annuity sales. Noninterest expense increased $16 million, or 2%, from the second quarter of 2020, as higher revenue-based compensation drove increased salaries and employee benefits expense. Higher outside services and equipment and software expense was driven by growth initiatives and increased technology spend. Net charge-offs of $45 million decreased $35 million, or 44%, driven by the low rate environment.impact of government stimulus and forbearance programs, as well as strong collateral values in residential real estate and automobile.
Commercial Banking
Net interest income of $419 million was flat to the second quarter of 2020. Noninterest income of $178 million increased $420$34 million, or 49%24%, from $144 million in the second quarter of 2020, driven by an increase in capital markets fees from higher loan syndication fees and mergers and acquisition advisory fees, as well as an increase in letter of credit and loan fees from higher commitment fees. Noninterest expense of $226 million increased $13 million, or 6%, from $213 million in the second quarter of 2020, largely tied to increased technology spend as well as higher salaries and employee benefits. Net charge-offs of $34 milliondecreased $36 million from the second quarter of 2020, which was a result of stabilization from the effects of the COVID-19 pandemic and associated lockdowns.
Citizens Financial Group, Inc. | 23
| | | | | | | | | | | | | | | | | | | | | | | |
| Table 10: Selected Financial Data for Business Operating Segments, Year-to-Date | | |
| Consumer Banking | | Commercial Banking |
| Six Months Ended June 30, | | Six Months Ended June 30, |
| (dollars in millions) | 2021 | | 2020 | | 2021 | | 2020 |
| Net interest income | $1,760 | | | $1,607 | | | $840 | | | $784 | |
| Noninterest income | 634 | | | 785 | | | 348 | | | 269 | |
| Total revenue | 2,394 | | | 2,392 | | | 1,188 | | | 1,053 | |
| Noninterest expense | 1,501 | | | 1,473 | | | 453 | | | 434 | |
| Profit before credit losses | 893 | | | 919 | | | 735 | | | 619 | |
| Net charge-offs | 104 | | | 177 | | | 135 | | | 113 | |
| Income before income tax expense | 789 | | | 742 | | | 600 | | | 506 | |
| Income tax expense | 201 | | | 186 | | | 124 | | | 106 | |
| Net income | $588 | | | $556 | | | $476 | | | $400 | |
| Average Balances: | | | | | | | |
| Total assets | $75,443 | | | $70,024 | | | $57,632 | | | $62,142 | |
Total loans and leases(1)(2) | 70,792 | | | 66,774 | | | 54,786 | | | 59,283 | |
| Deposits | 99,067 | | | 88,438 | | | 44,012 | | | 37,647 | |
| Interest-earning assets | 71,725 | | | 66,825 | | | 55,159 | | | 59,719 | |
(1) Includes LHFS.
(2) The majority of PPP loans are reflected in Consumer Banking in accordance with how they are managed.
Consumer Banking
Net interest income of $1.8 billion increased $153 million, or 10%, from the first nine monthshalf of 2019,2020, driven by higherthe benefit of loan and deposit growth. Average loans grew $4.0 billion led by education, residential mortgage, banking fees, partially offsetand the impact of the PPP loan program. Deposits grew $11 billion, or 12%, driven by lower service charges and fees and card fees.government stimulus programs. Noninterest expense increased $82income decreased $151 million, or 4%19%, from the first nine monthshalf of 2019,2020, driven by lower mortgage banking fees as increased industry capacity and heightened competition resulted in lower gain-on-sale margins. This decrease was partially offset by higher trust and investment services fees driven by higher assets under management from higher equity market levels. In addition to higher card fee driven by higher debit and credit card volumes driven by the economic recovery. Noninterest expense increased $28 million, or 2%, from the first half of 2020, reflecting higher salaries and employee benefits tied to higher revenue-based compensation, combined with higher equipment and software expense and outside services tied to strong mortgage volume,expense resulting from increased technology spend and growth initiatives. This increase was partially offset by lower other expense. Provision for credit lossesoperating expense related to lower travel. Net charge-offs of $232$104 million increased $4decreased $73 million, or 2%41%, remaining relatively stable.driven by the impact of government stimulus and forbearance programs, as well as strong collateral values in residential real estate and automobile.
Commercial Banking
Net interest income of $1.2 billion$840 million increased $102$56 million, or 9%7%, from $1.1 billion$784 million in the first nine monthshalf of 2019, primarily2020, driven by higher deposit volumes reflecting improved funding mix and deposit pricing. Noninterest income of $348 million increased $79 million, or 29%, from $269 million in the first half of 2020, driven by strength in capital markets fees due to higher loan syndication fees, mergers and lower-costing deposit volume.acquisition advisory fees, and letter of credit and loan fees, reflecting higher commitment fees. Noninterest incomeexpense of $413$453 million decreasedincreased $19 million, or 4%, from $432$434 million in the first nine monthshalf of 2019, driven by a decrease in foreign exchange2020, largely tied to growth initiatives and interest rate products and other income. Noninterest expenseincreased technology spend. Net charge-offs of $644 million increased $5 million, or 1%, from $639 million in the first nine months of 2019, driven by higher salaries and employee benefit expenses, partly offset by lower travel. Provision for credit losses of $274 $135 million increased $201 $22 million, or 19%, from the first nine monthshalf of 2019,2020, primarily driven by COVID-19-related charge-offs in CRE, metals and mining, oil and gas, casual dining and education industry sectors.CRE.
Citizens Financial Group, Inc. | 24
ANALYSIS OF FINANCIAL CONDITION
Securities
| | | | | | | | | | | | | | | | | | | | | | | | | | | |
| Table 11: Amortized Cost and Fair Value of AFS and HTM Securities | | | | | | | | | | |
| June 30, 2021 | | December 31, 2020 | | |
| (in millions) | Amortized
Cost | | Fair Value | | Amortized
Cost | | Fair Value | | |
| U.S. Treasury and other | $11 | | | $11 | | | $11 | | | $11 | | | | | |
| State and political subdivisions | 3 | | | 3 | | | 3 | | | 3 | | | | | |
| Mortgage-backed securities, at fair value: | | | | | | | | | | | |
| Federal agencies and U.S. government sponsored entities | 23,960 | | | 24,112 | | | 21,954 | | | 22,506 | | | | | |
| Other/non-agency | 267 | | | 280 | | | 396 | | | 422 | | | | | |
| Total mortgage-backed securities, at fair value | 24,227 | | | 24,392 | | | 22,350 | | | 22,928 | | | | | |
| | | | | | | | | | | |
| Collateralized loan obligations, at fair value | 177 | | | 177 | | | — | | | — | | | | | |
| Total debt securities available for sale, at fair value | $24,418 | | | $24,583 | | | $22,364 | | | $22,942 | | | | | |
| Mortgage-backed securities, at cost: | | | | | | | | | | | |
| Federal agencies and U.S. government sponsored entities | $1,887 | | | $1,964 | | | $2,342 | | | $2,464 | | | | | |
| | | | | | | | | | | |
| Total mortgage-backed securities, at cost | 1,887 | | | 1,964 | | | 2,342 | | | 2,464 | | | | | |
| Asset-backed securities, at cost | 824 | | | 826 | | | 893 | | | 893 | | | | | |
| Total debt securities held to maturity | $2,711 | | | $2,790 | | | $3,235 | | | $3,357 | | | | | |
| Total debt securities available for sale and held to maturity | $27,129 | | | $27,373 | | | $25,599 | | | $26,299 | | | | | |
| Equity securities, at cost | $602 | | | $602 | | | $604 | | | $604 | | | | | |
| Equity securities, at fair value | 80 | | | 80 | | | 66 | | | 66 | | | | | |
| | | | | | | | | | | |
Our securities portfolio is managed to maintain prudent levels of liquidity, credit quality and market risk while achieving appropriate returns that align with our overall portfolio management strategy. The following table presentsportfolio primarily includes high quality, highly liquid investments reflecting our ongoing commitment to maintain appropriate contingent liquidity levels and pledging capacity. U.S. government-guaranteed notes and GSE-issued mortgage-backed securities AFSrepresent 95% of the fair value of our debt securities portfolio holdings. Holdings backed by mortgages dominate our portfolio and HTM:
|
| | | | | | | | | | | | | | | |
| | September 30, 2020 | | December 31, 2019 |
| (in millions) | Amortized Cost | | Fair Value | | Amortized Cost | | Fair Value |
| U.S. Treasury and other |
| $11 |
| |
| $11 |
| |
| $71 |
| |
| $71 |
|
| State and political subdivisions | 4 |
| | 4 |
| | 5 |
| | 5 |
|
| Mortgage-backed securities, at fair value: | | | | | | | |
| Federal agencies and U.S. government sponsored entities | 20,962 |
| | 21,541 |
| | 19,803 |
| | 19,875 |
|
| Other/non-agency | 482 |
| | 515 |
| | 638 |
| | 662 |
|
| Total mortgage-backed securities, at fair value | 21,444 |
| | 22,056 |
| | 20,441 |
| | 20,537 |
|
| Asset-backed securities, at fair value | 813 |
| | 813 |
| | — |
| | — |
|
| Total debt securities available for sale, at fair value |
| $22,272 |
| |
| $22,884 |
| |
| $20,517 |
| |
| $20,613 |
|
| Mortgage-backed securities, at cost: | | | | | | | |
| Federal agencies and U.S. government sponsored entities |
| $2,578 |
| |
| $2,709 |
| |
| $3,202 |
| |
| $3,242 |
|
| Total debt securities held to maturity, at cost |
| $2,578 |
| |
| $2,709 |
| |
| $3,202 |
| |
| $3,242 |
|
| Total debt securities available for sale and held to maturity |
| $24,850 |
| |
| $25,593 |
| |
| $23,719 |
| |
| $23,855 |
|
| Equity securities, at fair value |
| $57 |
| |
| $57 |
| |
| $47 |
| |
| $47 |
|
| Equity securities, at cost | 605 |
| | 605 |
| | 807 |
| | 807 |
|
| Total equity securities |
| $662 |
| |
| $662 |
| |
| $854 |
| |
| $854 |
|
facilitate our ability to pledge those securities to the FHLB for collateral purposes. For further discussion of the liquidity coverage ratios, see “Regulation and Supervision — Liquidity Requirements” in our 2020 Form 10-K.
The fair value of the AFS debt securities portfolio of $22.9$24.6 billion at SeptemberJune 30, 20202021 increased $2.3$1.6 billion from $20.6$22.9 billion at December 31, 2019 due to an increase of $1.82020, including $2.0 billion related to reinvestment timing and an asset-backed securitization transaction related to the sale of certain education loans, which is further described in Note 7. There was alsonew investments, offset by a $516$413 million increasereduction in value due to lower long-term rates.unrealized gains driven by a steepening yield curve. The decline in the fair value of the HTM debt securities portfolio of $533$567 million was primarily attributable to portfolio runoff.run-off. For further information, see Note 1.2.
As of SeptemberJune 30, 2020,2021, the portfolio’s average effective duration was 2.83.6 years compared with 3.72.7 years as of December 31, 2019,2020, as lowerhigher long-term rates drove an increasea decrease in both actual and projected securities prepayment speeds. We manage our securities portfolio duration and convexity risk through asset selection and securities structure, and maintain duration levels within our risk appetite in the context of the broader interest rate risk in the banking book framework and limits.
The securities portfolio is primarily comprised of high quality, highly liquid investments reflecting our ongoing commitment to maintaining appropriate contingent liquidity levels and pledging capacity. U.S. government-guaranteed notes and GSE-issued mortgage-backed securities represent 95% of the fair value of the debt securities portfolio holdings. Holdings backed by mortgages dominate our portfolio and facilitate our ability to pledge them to the FHLB for collateral purposes. For further discussion of the liquidity coverage ratios, see “Regulation and Supervision — Liquidity Requirements” in our 2019 Form 10-K. The securities portfolio also includes asset-backed securities, which were acquired in conjunction with the sale of certain education loans. For further information, see Note 2 and Note 7.Citizens Financial Group, Inc. | 25
Loans and Leases
The following table presents our loans and leases in portfolio segments and classes:
| | | Table 12: Composition of Loans and Leases, Excluding LHFS | | Table 12: Composition of Loans and Leases, Excluding LHFS | |
| (in millions) | September 30, 2020 | | December 31, 2019 | | Change |
| | Percent |
| (in millions) | June 30, 2021 | | December 31, 2020 | | Change | | Percent |
Commercial(1) |
| $45,185 |
| |
| $41,479 |
| |
| $3,706 |
| | 9 | % | |
Commercial and industrial (1) | | Commercial and industrial (1) | $42,842 | | | $44,173 | | | ($1,331) | | | (3) | % |
| Commercial real estate | 14,889 |
| | 13,522 |
| | 1,367 |
| | 10 |
| Commercial real estate | 14,412 | | | 14,652 | | | (240) | | | (2) | |
| Leases | 2,288 |
| | 2,537 |
| | (249 | ) | | (10 | ) | Leases | 1,829 | | | 1,968 | | | (139) | | | (7) | |
| Total commercial loans and leases | 62,362 |
| | 57,538 |
| | 4,824 |
| | 8 |
| |
| Total commercial | | Total commercial | 59,083 | | | 60,793 | | | (1,710) | | | (3) | |
Residential mortgages | 19,633 |
| | 19,083 |
| | 550 |
| | 3 |
| 20,538 | | | 19,539 | | | 999 | | | 5 | |
| Home equity | 12,322 |
| | 13,154 |
| | (832 | ) | | (6 | ) | Home equity | 11,841 | | | 12,149 | | | (308) | | | (3) | |
| Automobile | 12,035 |
| | 12,120 |
| | (85 | ) | | (1 | ) | Automobile | 12,780 | | | 12,153 | | | 627 | | | 5 | |
| Education | 11,631 |
| | 10,347 |
| | 1,284 |
| | 12 |
| Education | 12,800 | | | 12,308 | | | 492 | | | 4 | |
| Other retail | 6,088 |
| | 6,846 |
| | (758 | ) | | (11 | ) | Other retail | 5,539 | | | 6,148 | | | (609) | | | (10) | |
| Total retail loans | 61,709 |
| | 61,550 |
| | 159 |
| | — |
| |
| Total retail | | Total retail | 63,498 | | | 62,297 | | | 1,201 | | | 2 | |
Total loans and leases(2) |
| $124,071 |
| |
| $119,088 |
| |
| $4,983 |
| | 4 | % | $122,581 | | | $123,090 | | | ($509) | | | — | % |
|
(1) Includes PPP loans fully guaranteed by the SBA of $4.7$3.5 billion as of Septemberat June 30, 2021 and $4.2 billion at December 31, 2020.
(2) LHFS, at fair valueIncludes fully or partially guaranteed FHA, VA and USDA loans of $3.6 billion and $1.9 billion at September 30, 2020 and December 31, 2019, respectively, and other LHFS of $127 million and $1.4 billion at SeptemberJune 30, 20202021 and $249 million at December 31, 2019, respectively, are not included above.2020, including loans acquired through an exercise of the GNMA early buyout option.
Total loans and leases increased $5.0 billiondecreased $509 million from $119.1$123.1 billion as of December 31, 2019, largely driven by $4.72020, reflecting a $1.7 billion ofdecrease in commercial PPP loans to small business customers. Growth in retail loans, driven by education, was muted in part by the sale in September 2020 of $973 million of education loans, inclusive of accrued interest, capitalized interest and fees, and a decline$1.2 billion increase in home equity. For further information, see Note 7.retail.
As of September 30, 2020, under our COVID-19-related forbearance programs that are guided by the CARES Act as well as banking regulator interagency guidance, we have deferred payments on:
Approximately $2.4 billion, or 3.8%, of our retail portfolio,
| |
• | Approximately $795 million, or 1.4%, of our commercial portfolio, and
|
Approximately $464 million, or 8.1%, of our Business Banking portfolio.
As of October 31, 2020, we have deferred payments on:
Approximately $1.7 billion, or 2.8%, of our retail portfolio,
Approximately $608 million, or 1.1%, of our commercial portfolio, and
Approximately $61 million, or 1.1%, of our Business Banking portfolio.
The vast majority of these deferrals are not classified as TDRs.
Allowance for Credit Losses and Nonaccruing Loans and Leases
The ACL is created through charges to the provision for credit losses in order to provide appropriate reserves to absorb estimated future estimated credit losses in accordance with GAAP. For furtheradditional information on our processes to determine ourregarding the ACL, see “—CriticalNote 4 of this report, and “Critical Accounting Estimates — Allowance for Credit Losses.”Estimates” and Note 5 in the Company’s 2020 Form 10-K.
The ACL of $2.1 billion as of June 30, 2021 compared with the ACL of $2.7 billion as of September 30, 2020 included the $451 million increase from the adoption of CECL on January 1, 2020, as well as the $989 million increase due to the impacts of the COVID-19 pandemic and associated lockdowns on the national economy from March to September 2020. This compared with the ACL of $1.3 billion as of December 31, 2019.2020, reflecting a reserve release of $589 million. For further information, see Note 4.
The following table presents ratios related to our ALLL and ACL:
|
| | | | | | | |
| (dollars in millions) | September 30, 2020 | | December 31, 2019 |
| Allowance for loan and lease losses |
| $2,542 |
| |
| $1,252 |
|
| Allowance for credit losses | 2,736 |
| | 1,296 |
|
| Allowance for loan and lease losses to loans and leases | 2.05 | % | | 1.05 | % |
| Allowance for credit losses to loans and leases | 2.21 |
| | 1.09 |
|
Allowance for credit losses to loans and leases, excluding the impact of PPP loans(1) | 2.29 |
| | 1.09 |
|
| Allowance for loan and lease losses to nonaccruing loans and leases | 199.04 |
| | 177.99 |
|
| Allowance for credit losses to nonaccruing loans and leases | 214.22 |
| | 184.31 |
|
| | | | | | | | | | | | | | | | | | | | | | | |
| Table 13: ACL and Related Coverage Ratios by Portfolio | | | | | | |
| June 30, 2021 | | December 31, 2020 |
| (in millions) | Loans and Leases | Allowance | Coverage | | Loans and Leases | Allowance | Coverage |
| Allowance for Loan and Lease Losses | | | | | | | |
| Commercial and industrial | $42,842 | | $674 | | 1.57 | % | | $44,173 | | $821 | | 1.86 | % |
| Commercial real estate | 14,412 | | 218 | | 1.51 | | | 14,652 | | 360 | | 2.46 | |
| Leases | 1,829 | | 61 | | 3.36 | | | 1,968 | | 52 | | 2.67 | |
| Total commercial | 59,083 | | 953 | | 1.61 | | | 60,793 | | 1,233 | | 2.03 | |
| Residential mortgages | 20,538 | | 140 | | 0.68 | | | 19,539 | | 141 | | 0.72 | |
| Home equity | 11,841 | | 102 | | 0.86 | | | 12,149 | | 134 | | 1.10 | |
| Automobile | 12,780 | | 168 | | 1.31 | | | 12,153 | | 200 | | 1.65 | |
| Education | 12,800 | | 322 | | 2.51 | | | 12,308 | | 361 | | 2.93 | |
| Other retail | 5,539 | | 262 | | 4.74 | | | 6,148 | | 374 | | 6.07 | |
| Total retail | 63,498 | | 994 | | 1.57 | | | 62,297 | | 1,210 | | 1.94 | |
| Total loans and leases | $122,581 | | $1,947 | | 1.59 | % | | $123,090 | | $2,443 | | 1.98 | % |
| Allowance for Unfunded Lending Commitments | | | | | | | |
Commercial(1) | | $121 | | 1.82 | % | | | $186 | | 2.33 | % |
Retail(2) | | 13 | | 1.59 | | | | 41 | | 2.01 | |
| Total allowance for unfunded lending commitments | | 134 | | | | | 227 | | |
Allowance for credit losses(3) | $122,581 | | $2,081 | | 1.70 | % | | $123,090 | | $2,670 | | 2.17 | % |
(1) Coverage ratio includes total commercial allowance for unfunded lending commitments and total commercial allowance for loan and lease losses in the numerator and total commercial loans and leases in the denominator.
(2) Coverage ratio includes total retail allowance for unfunded lending commitments and total retail allowance for loan losses in the numerator and total retail loans in the denominator.
(3) Excluding the impact of PPP loans, the ACL Coverage Ratio would have been 1.75% and 2.24% for June 30, 2021 and December 31, 2020, respectively. For more information on the computation of non-GAAP financial measures, see “—Introduction — Non-GAAP Financial Measures” and “—Non-GAAP Financial Measures and Reconciliations.”
Citizens Financial Group, Inc. | 26
The following table presents our nonaccrual loans
| | | | | | | | | | | | | | | | | | | | | | | |
| Table 14: Nonaccrual Loans and Leases | | | | | | | |
| (dollars in millions) | June 30, 2021 | | December 31, 2020 | | Change | | Percent |
| Commercial and industrial | $163 | | | $280 | | | ($117) | | | (42 | %) |
| Commercial real estate | 102 | | | 176 | | | (74) | | | (42) | |
| Leases | 1 | | | 2 | | | (1) | | | (50) | |
| Total commercial loans and leases | 266 | | | 458 | | | (192) | | | (42) | |
Residential mortgages(1) | 174 | | | 167 | | | 7 | | | 4 | |
| Home equity | 234 | | | 276 | | | (42) | | | (15) | |
| Automobile | 62 | | | 72 | | | (10) | | | (14) | |
| Education | 21 | | | 18 | | | 3 | | | 17 | |
| Other retail | 22 | | | 28 | | | (6) | | | (21) | |
| Total retail loans | 513 | | | 561 | | | (48) | | | (9) | |
| Nonaccrual loans and leases | $779 | | | $1,019 | | | ($240) | | | (24 | %) |
| Nonaccrual loans and leases to total loans and leases | 0.64 | % | | 0.83 | % | | (19 | bps) | | |
| Allowance for loan and lease losses to nonaccruing loans and leases | 250 | | | 240 | | | 10 | % | | |
| Allowance for credit losses to nonaccruing loans and leases | 267 | | | 262 | | | 5 | % | | |
(1) Loans fully or partially guaranteed by the FHA, VA and leases:USDA are classified as accruing. |
| | | | | | | | | | | | | | |
| (dollars in millions) | September 30, 2020 | | December 31, 2019 | | Change |
| | Percent |
|
| Commercial |
| $435 |
| |
| $240 |
| |
| $195 |
| | 81 | % |
| Commercial real estate | 323 |
| | 2 |
| | 321 |
| | NM |
|
| Leases | 2 |
| | 3 |
| | (1 | ) | | (33 | ) |
| Total commercial loans and leases | 760 |
| | 245 |
| | 515 |
| | 210 |
|
| Residential mortgages | 131 |
| | 93 |
| | 38 |
| | 41 |
|
| Home equity | 265 |
| | 246 |
| | 19 |
| | 8 |
|
| Automobile | 80 |
| | 67 |
| | 13 |
| | 19 |
|
| Education | 16 |
| | 18 |
| | (2 | ) | | (11 | ) |
| Other retail | 25 |
| | 34 |
| | (9 | ) | | (26 | ) |
| Total retail loans | 517 |
| | 458 |
| | 59 |
| | 13 |
|
| Nonaccrual loans and leases |
| $1,277 |
| |
| $703 |
| |
| $574 |
| | 82 | % |
NPLs of $1.3 billion$779 million as of SeptemberJune 30, 2020 increased $5742021 decreased $240 million, or 82%24%, from December 31, 2019,2020, reflecting a $515$192 million increasedecrease in total commercial and a $59$48 million increasedecrease in retail. The increaseCommercial NPLs decreased through loan sale activity, repayments and charge-offs.
| | | | | | | | | | | | | | | | | | | | | | | | | | | | | | | | | | | | | | | | | | | | | |
| Table 15: Net Charge-offs and Charge-Off Ratios, Quarter-to-Date | | | | | | | | | | |
| | | | | | | Three Months Ended June 30, | | | | | | Three Months Ended June 30, | | |
| (dollars in millions) | | | | | | | | | 2021 | | 2020 | | Change | | | | 2021 | | 2020 | | Change |
| Commercial and industrial | | | | | | | | | $28 | | | $65 | | | ($37) | | | | | 0.25 | % | | 0.52 | % | | (27 | bps) |
| Commercial real estate | | | | | | | | | — | | | — | | | — | | | | | — | | | — | | | — | |
| Leases | | | | | | | | | 13 | | | 6 | | | 7 | | | | | 2.97 | | | 1.03 | | | 194 | |
| Total commercial | | | | | | | | | 41 | | | 71 | | | (30) | | | | | 0.27 | | | 0.42 | | | (15) | |
| Residential mortgages | | | | | | | | | (1) | | | 1 | | | (2) | | | | | (0.03) | | | 0.02 | | | (5) | |
| Home equity | | | | | | | | | (10) | | | (2) | | | (8) | | | | | (0.33) | | | (0.05) | | | (28) | |
| Automobile | | | | | | | | | (2) | | | 20 | | | (22) | | | | | (0.04) | | | 0.68 | | | (72) | |
| Education | | | | | | | | | 13 | | | 10 | | | 3 | | | | | 0.40 | | | 0.34 | | | 6 | |
| Other retail | | | | | | | | | 37 | | | 47 | | | (10) | | | | | 2.63 | | | 2.93 | | | (30) | |
| Total retail loans | | | | | | | | | 37 | | | 76 | | | (39) | | | | | 0.24 | | | 0.50 | | | (26) | |
| Total net charge-offs | | | | | | | | | $78 | | | $147 | | | ($69) | | | | | 0.25 | % | | 0.46 | % | | (21 | bps) |
Second quarter 2021 NCOs of $78 million decreased $69 million, or 47%, from $147 million in NPLs wasthe second quarter of 2020, driven by downgrades in CRE, including two large mall-based REITs, as well as loans in the casual dining, and oil and gas industry sectors.
The following table presents our net charge-offs: |
| | | | | | | | | | | | | | | | | | | | | | | | | | | | | |
| | Three Months Ended September 30, | | | | | | Nine Months Ended September 30, | | | | |
| (dollars in millions) | 2020 |
| | 2019 |
| | Change | | Percent | | 2020 |
| | 2019 |
| | Change |
| | Percent |
|
| Commercial |
| $80 |
| |
| $17 |
| |
| $63 |
| | NM |
| |
| $189 |
| |
| $46 |
| |
| $143 |
| | NM |
|
| Commercial real estate | 42 |
| | 10 |
| | 32 |
| | NM |
| | 42 |
| | 30 |
| | 12 |
| | 40 |
|
| Leases | 48 |
| | 5 |
| | 43 |
| | NM |
| | 54 |
| | 13 |
| | 41 |
| | NM |
|
| Total commercial loans and leases | 170 |
| | 32 |
| | 138 |
| | NM |
| | 285 |
| | 89 |
| | 196 |
| | 220 |
|
| Residential mortgages | — |
| | 1 |
| | (1 | ) | | (100 | ) | | 1 |
| | (2 | ) | | 3 |
| | NM |
|
| Home equity | (2 | ) | | (1 | ) | | (1 | ) | | (100 | ) | | (7 | ) | | (10 | ) | | 3 |
| | 30 |
|
| Automobile | 7 |
| | 22 |
| | (15 | ) | | (68 | ) | | 54 |
| | 59 |
| | (5 | ) | | (8 | ) |
| Education | 5 |
| | 14 |
| | (9 | ) | | (64 | ) | | 29 |
| | 40 |
| | (11 | ) | | (28 | ) |
| Other retail | 39 |
| | 45 |
| | (6 | ) | | (13 | ) | | 141 |
| | 132 |
| | 9 |
| | 7 |
|
| Total retail loans | 49 |
| | 81 |
| | (32 | ) | | (40 | ) | | 218 |
| | 219 |
| | (1 | ) | | — |
|
| Total net charge-offs |
| $219 |
| |
| $113 |
| |
| $106 |
| | 94 | % | |
| $503 |
| |
| $308 |
| |
| $195 |
| | 63 | % |
Third quarter 2020 NCOs of $219 million increased $106 million, or 94%, from $113 million in third quarter 2019, driven by an increasea decrease in total commercial of $138$30 million and partially offset by a $32$39 million reduction in retail. ThirdSecond quarter 20202021 annualized net charge-offs of 0.70%0.25% of average loans and leases were up 32down 21 basis points from thirdthe second quarter 2019.of 2020.
First nine monthsThe decrease in commercial NCOs in the second quarter of 2021 as compared to the second quarter of 2020 were a result of stabilization from effects of the COVID-19 pandemic and associated lockdowns. Retail NCOs were down in the second quarter of 2021 as compared to the second quarter of 2020 primarily due to U.S. Government stimulus programs and strong collateral values in automobile and residential real estate.
Citizens Financial Group, Inc. | 27
| | | | | | | | | | | | | | | | | | | | | | | | | | | | | | | | | | | | | | | | | | | | | |
| Table 16: Net Charge-offs and Charge-Off Ratios, Year-to-Date | | | | | | | | | | |
| | | | | | | Six Months Ended June 30, | | | | | | Six Months Ended June 30, | | |
| (dollars in millions) | | | | | | | | | 2021 | | 2020 | | Change | | | | 2021 | | 2020 | | Change |
| Commercial and industrial | | | | | | | | | $105 | | | $109 | | | ($4) | | | | | 0.48 | % | | 0.47 | % | | 1 | bps |
| Commercial real estate | | | | | | | | | 26 | | | — | | | 26 | | | | | 0.36 | | | — | | | 36 | |
| Leases | | | | | | | | | 14 | | | 6 | | | 8 | | | | | 1.58 | | | 0.55 | | | 103 | |
| Total commercial | | | | | | | | | 145 | | | 115 | | | 30 | | | | | 0.48 | | | 0.37 | | | 11 | |
| Residential mortgages | | | | | | | | | (2) | | | 1 | | | (3) | | | | | (0.02) | | | 0.01 | | | (3) | |
| Home equity | | | | | | | | | (17) | | | (5) | | | (12) | | | | | (0.29) | | | (0.08) | | | (21) | |
| Automobile | | | | | | | | | 9 | | | 47 | | | (38) | | | | | 0.15 | | | 0.78 | | | (63) | |
| Education | | | | | | | | | 20 | | | 24 | | | (4) | | | | | 0.32 | | | 0.44 | | | (12) | |
| Other retail | | | | | | | | | 81 | | | 102 | | | (21) | | | | | 2.82 | | | 3.07 | | | (25) | |
| Total retail loans | | | | | | | | | 91 | | | 169 | | | (78) | | | | | 0.29 | | | 0.56 | | | (27) | |
| Total net charge-offs | | | | | | | | | $236 | | | $284 | | | ($48) | | | | | 0.39 | % | | 0.46 | % | | (7 | bps) |
First half 2021 NCOs of $503$236 million increased $195decreased $48 million, or 63%17%, from $308$284 million in the first nine monthshalf of 2019,2020, driven by a decrease in retail of $78 million, partially offset by an increase in commercial of $196 million and retail remaining flat.$30 million. First nine monthshalf of 20202021 annualized net charge-offs of 0.54%0.39% of average loans and leases were up 19down 7 basis points from first nine monthshalf of 2019.2020.
Retail NCOs were down in the first half of 2021 as compared to the first half of 2020 primarily due to U.S. Government stimulus programs, forbearance, as well as strong collateral values in automobile and residential real estate. The increase in commercial NCOs in the third quarterfirst half of 2020 and first nine months of 2020 as compared to 2019 were driven by charge-offs in CRE, metals and mining, oil and gas, and casual dining. Retail NCOs were down in the third quarter of 2020 due to U.S. Government stimulus programs and forbearance, and were flat in the first nine months of 20202021 as compared to the first nine monthshalf of 2019.
2020 were contributed to by COVID-19-related charge-offs in CRE. We continue to assess the impact of the COVID-19 pandemic and associated lockdowns and have instituted a variety of measures to identify and monitor areas of potential risk, including direct outreach to commercial clients and close monitoring of retail credit metrics.
Commercial Loan Asset Quality
Our commercial loan and lease portfolio consists of traditional commercial and industrial loans, commercial leases and commercial real estate loans. The portfolio is predominantly focused on customers in our footprint and adjacent states in which we have a physical presence where our local delivery model provides for strong client connectivity. Additionally, we also do business in certain specialized industry sectors on a national basis.
As of September 30,discussed in our 2020 total commercial NPLs of $760 million increased $515 million from $245 million as of December 31, 2019, representing 1.2% and 0.4% of the total commercial loan and lease portfolio as of September 30, 2020 and December 31, 2019, respectively.
Third quarter 2020 total commercial NCOs of $170 million compared to $32 million in third quarter 2019, representing an 84 basis points increase in the NCO rate. Total commercial loan and lease NCOs of $285 millionForm 10-K, for the first nine months of 2020 compared to NCOs of $89 million for the first nine months of 2019, representing a 39 basis point increase.
The increases in commercial NPLs and NCOs were driven largely by a deterioration in certain industry sectors, including retail real estate, casual dining, and energy related, resulting from the impacts of COVID-19 and associated lockdowns.
For commercial loans and leases, we utilize regulatory classification ratings to monitor credit quality. Loans with a “pass” rating are those that we believe will be fully repaid in accordance with the contractual loan terms. Commercial loans
As of June 30, 2021, commercial NPLs of $266 million decreased $192 million from $458 million as of December 31, 2020, representing 0.5% and leases that are “criticized” are those that have some weakness, or potential weakness, that indicate an increased probability of future loss. “Criticized” loans are grouped into three categories, “special mention,” “substandard” and “doubtful.” Special mention loans have potential weaknesses that, if left uncorrected, may result in deterioration of our credit position at some future date. Substandard loans are inadequately protected loans; these loans have well-defined weaknesses that could hinder normal repayment or collection0.8% of the debt. Doubtful loans have the same weaknessescommercial loan and lease portfolio as substandard, with the added characteristics that the possibility of loss is highJune 30, 2021 and collection of the full amount of the loan is improbable.December 31, 2020, respectively.
The recorded investment in commercial loans and leases based on regulatory classification ratings is presented below: | | | | | | | | | | | | | | | | | |
| Table 17: Commercial Loans and Leases by Regulatory Classification | | | |
| June 30, 2021 |
| | Criticized | |
| (in millions) | Pass | Special Mention | Substandard | Doubtful | Total |
Commercial and industrial(1) | $39,945 | | $1,145 | | $1,631 | | $121 | | $42,842 | |
| Commercial real estate | 13,115 | | 666 | | 604 | | 27 | | 14,412 | |
| Leases | 1,776 | | 29 | | 23 | | 1 | | 1,829 | |
| Total commercial | $54,836 | | $1,840 | | $2,258 | | $149 | | $59,083 | |
Citizens Financial Group, Inc. | 28
| | | | September 30, 2020 | | December 31, 2020 |
| | | Criticized | | | | Criticized | |
| (in millions) | Pass |
| Special Mention | Substandard |
| Doubtful |
| Total |
| (in millions) | Pass | Special Mention | Substandard | Doubtful | Total |
Commercial(1) |
| $41,151 |
|
| $2,050 |
|
| $1,580 |
|
| $404 |
|
| $45,185 |
| |
Commercial and industrial(1) | | Commercial and industrial(1) | $40,878 | | $1,583 | | $1,464 | | $248 | | $44,173 | |
| Commercial real estate | 13,351 |
| 849 |
| 468 |
| 221 |
| 14,889 |
| Commercial real estate | 13,356 | | 804 | | 416 | | 76 | | 14,652 | |
| Leases | 2,210 |
| 41 |
| 13 |
| 24 |
| 2,288 |
| Leases | 1,922 | | 33 | | 12 | | 1 | | 1,968 | |
| Total commercial loans and leases |
| $56,712 |
|
| $2,940 |
|
| $2,061 |
|
| $649 |
|
| $62,362 |
| |
| Total commercial | | Total commercial | $56,156 | | $2,420 | | $1,892 | | $325 | | $60,793 | |
(1) Includes $4.7$3.5 billion and $4.2 billion of PPP loans designated as pass that are fully guaranteed by the SBA as of SeptemberJune 30, 2020.2021 and December 31, 2020, respectively.
|
| | | | | | | | | | | | | | | |
| | December 31, 2019 |
| | | Criticized | |
| (in millions) | Pass |
| Special Mention | Substandard |
| Doubtful |
| Total |
|
| Commercial |
| $38,950 |
|
| $1,351 |
|
| $934 |
|
| $244 |
|
| $41,479 |
|
| Commercial real estate | 13,169 |
| 318 |
| 33 |
| 2 |
| 13,522 |
|
| Leases | 2,383 |
| 109 |
| 42 |
| 3 |
| 2,537 |
|
| Total commercial loans and leases |
| $54,502 |
|
| $1,778 |
|
| $1,009 |
|
| $249 |
|
| $57,538 |
|
Total commercial criticized loans and leases were $5.7balances of $4.2 billion as of SeptemberJune 30, 2020, representing 9.1%2021 decreased $390 million compared with December 31, 2020. Commercial criticized as a percent of total commercial loans and leases. The increase of $2.6 billion,7.2% at June 30, 2021 decreased from 7.6% at December 31, 2019 was largely due to COVID-19-related deterioration in certain industry sectors across commercial2020.
Commercial and commercial real estate, including accommodation and food services, real estate (REITs and entertainment properties), energy and related, and automotive rental.
Commercialindustrial criticized loans totaled $4.0balances of $2.9 billion, or 6.8% of the total commercial and industrial loan portfolio and increased $1.5as of June 30, 2021, decreased from $3.3 billion, or 60%7.5%, fromas of December 31, 2019, due to the migration to2020. The decrease was primarily driven by net repayments and charge-offs. Commercial and industrial criticized loans for hospitality, automotive rental, casual dining. Commercial accounted for 71%represented 68% of total criticized loans as of SeptemberJune 30, 2020,2021 compared to 83%71% as of December 31, 2019.2020.
Commercial real estate criticized loans totaled $1.5balances of $1.3 billion, or 9.0% of the commercial real estate portfolio, and increased from $353 million, or 2.6%, as ofwas stable compared to December 31, 2019, due to the migration to criticized loans for a few sizable borrowers in the hospitality, multifamily and retail industry sectors.2020 at $1.3 billion, or 8.8%. Commercial real estate accounted for 27%31% of total criticized loans as of SeptemberJune 30, 2020,2021 compared to 12%28% as of December 31, 2019.2020.
Citizens Financial Group, Inc. | 29
| | | | | | | | | | | | | | | | | |
| Table 18: Commercial Loans and Leases by Industry Sector | | | |
| June 30, 2021 | | December 31, 2020 |
| (dollars in millions) | Balance | % of
Total Loans and Leases | | Balance | % of
Total Loans and Leases |
| Finance and insurance | $6,693 | | 5 | % | | $6,473 | | 5 | % |
| Health, pharma, and social assistance | 3,078 | | 3 | | | 3,253 | | 3 | |
| Accommodation and food services | 3,127 | | 3 | | | 3,159 | | 3 | |
| Professional, scientific, and technical services | 2,644 | | 2 | | | 2,804 | | 2 | |
| Other manufacturing | 3,705 | | 3 | | | 3,686 | | 3 | |
| Technology | 3,765 | | 3 | | | 3,546 | | 3 | |
| Retail trade | 2,224 | | 2 | | | 2,312 | | 2 | |
| Energy and related | 1,936 | | 2 | | | 2,237 | | 2 | |
| Wholesale trade | 2,226 | | 2 | | | 1,976 | | 2 | |
| Arts, entertainment, and recreation | 1,131 | | 1 | | | 1,383 | | 1 | |
| Other services | 1,758 | | 1 | | | 1,360 | | 1 | |
| Administrative and waste management services | 1,261 | | 1 | | | 1,327 | | 1 | |
| Transportation and warehousing | 1,196 | | 1 | | | 1,169 | | 1 | |
| Consumer products manufacturing | 1,075 | | 1 | | | 1,078 | | 1 | |
| Automotive | 1,066 | | 1 | | | 1,057 | | 1 | |
| Educational services | 693 | | — | | | 844 | | — | |
| Chemicals | 726 | | — | | | 736 | | — | |
| Real estate and rental and leasing | 949 | | 1 | | | 734 | | — | |
All other (2) | 110 | | — | | | 884 | | 1 | |
| Total commercial and industrial | 39,363 | | 32 | | | 40,018 | | 32 | |
| Real estate and rental and leasing | 12,907 | | 11 | | | 13,167 | | 11 | |
| Accommodation and food services | 814 | | 1 | | | 749 | | 1 | |
| Finance and insurance | 498 | | — | | | 498 | | — | |
All other (2) | 193 | | — | | | 238 | | — | |
| Total commercial real estate | 14,412 | | 12 | | | 14,652 | | 12 | |
| Total leases | 1,829 | | 1 | | | 1,968 | | 2 | |
Total commercial (1,3) | $55,604 | | 45 | % | | $56,638 | | 46 | % |
(1) In the second quarter of 2021, our industry sectors were re-aligned to better reflect sector management and associated risks. Prior period has been adjusted to conform with the current period presentation.
(2) Deferred fees and costs are reported in All other.
(3) Excludes PPP loans of $3.5 billion and $4.2 billion as of June 30, 2021 and December 31, 2020, respectively.
Retail Loan Asset Quality
For retail loans, we utilize credit scores provided by FICO, which are generally refreshedrefresh on a quarterly basis and thea loan’s payment and delinquency status to monitor credit quality. Management believes FICO credit scores are considered the strongest indicator of credit losses over the contractual life of thea loan as the scores are based on current and historical national industry-wide consumer level credit performance data, and assist management in predicting the borrower’s future payment performance. The largest portion of the retail portfolio is represented by borrowers located in the New England, Mid-Atlantic and Midwest regions, although we have continued to lend selectively in areas outside the footprint primarily in the auto financeautomobile, education and education lending.
The following table presents an analysis of the aging of retail loans as a percentage of loan class:point-of-sale financing.
Citizens Financial Group, Inc. | 30
| | Table 19: Aging of Retail Loans as a Percentage of Loan Class | | Table 19: Aging of Retail Loans as a Percentage of Loan Class | | | |
| | | June 30, 2021 | | | December 31, 2020 |
| | | | | | | | | | | | | | | | | | | | | | | | | | | | Days Past Due | | | Days Past Due |
| | September 30, 2020 | | June 30, 2020 | | December 31, 2019 | | Current-29 | 30-59 | 60-89 | 90+ | | | Current-29 | 30-59 | 60-89 | 90+ | |
| | Days Past Due | | Days Past Due | | Days Past Due | |
| | Current-29 | 30-59 | 60-89 | 90 or More | | Current-29 | 30-59 | 60-89 | 90 or More | | Current-29 | 30-59 | 60-89 | 90 or More | |
| Residential mortgages | 98.96 | % | 0.33 | % | 0.08 | % | 0.63 | % | | 98.95 | % | 0.34 | % | 0.17 | % | 0.54 | % | | 99.29 | % | 0.18 | % | 0.09 | % | 0.44 | % | |
| Residential mortgages(1) | | Residential mortgages(1) | 96.83 | % | 0.86 | % | 0.30 | % | 2.03 | % | | | 98.73 | % | 0.30 | % | 0.11 | % | 0.86 | % | |
| Home equity | 97.44 |
| 0.41 |
| 0.24 |
| 1.91 |
| | 97.37 |
| 0.57 |
| 0.33 |
| 1.73 |
| | 97.57 |
| 0.69 |
| 0.30 |
| 1.44 |
| Home equity | 98.03 | | 0.27 | | 0.14 | | 1.56 | | | | 97.53 | | 0.50 | | 0.23 | | 1.74 | | |
| Automobile | 98.26 |
| 1.22 |
| 0.43 |
| 0.09 |
| | 97.97 |
| 1.35 |
| 0.55 |
| 0.13 |
| | 97.26 |
| 1.87 |
| 0.67 |
| 0.20 |
| Automobile | 98.69 | | 0.89 | | 0.34 | | 0.08 | | | | 97.93 | | 1.40 | | 0.53 | | 0.14 | | |
| Education | 99.61 |
| 0.24 |
| 0.10 |
| 0.05 |
| | 99.59 |
| 0.24 |
| 0.11 |
| 0.06 |
| | 99.45 |
| 0.29 |
| 0.14 |
| 0.12 |
| Education | 99.58 | | 0.23 | | 0.10 | | 0.09 | | | | 99.56 | | 0.27 | | 0.11 | | 0.06 | | |
| Other retail | 98.64 |
| 0.54 |
| 0.36 |
| 0.46 |
| | 98.54 |
| 0.49 |
| 0.39 |
| 0.58 |
| | 98.29 |
| 0.66 |
| 0.45 |
| 0.60 |
| Other retail | 98.47 | | 0.67 | | 0.36 | | 0.51 | | | | 98.36 | | 0.62 | | 0.47 | | 0.55 | | |
| Total retail loans | 98.62 | % | 0.52 | % | 0.21 | % | 0.65 | % | | 98.51 | % | 0.58 | % | 0.29 | % | 0.62 | % | | 98.43 | % | 0.70 | % | 0.30 | % | 0.57 | % | |
| Total retail | | Total retail | 98.12 | % | 0.61 | % | 0.24 | % | 1.02 | % | | | 98.47 | % | 0.58 | % | 0.25 | % | 0.70 | % | |
|
(1) 90+ day past due includes $266 million and $44 million of loans fully or partially guaranteed by the FHA, VA, and USDA at June 30, 2021 and December 31, 2020, respectively.
For more information on the aging of accruing and nonaccruing retail loans, see Note 4.
The following tables present asset quality metrics for the retail loan portfolio:
| | | Table 20: Retail Asset Quality Metrics | | Table 20: Retail Asset Quality Metrics | |
| | September 30, 2020 | | December 31, 2019 | | June 30, 2021 | | December 31, 2020 |
| Average refreshed FICO for total portfolio | 769 |
| | 764 |
| Average refreshed FICO for total portfolio | 769 | | | 771 | |
CLTV ratio for secured real estate(1) | 60 | % | | 59 | % | CLTV ratio for secured real estate(1) | 58 | % | | 60 | % |
| Nonaccruing retail loans to total retail | 0.84 |
| | 0.74 |
| Nonaccruing retail loans to total retail | 0.81 | | | 0.90 | |
(1) The real estate secured portfolio CLTV is calculated as the mortgage and second lien loan balance divided by the most recently available value of the property.
| | | | | | | | | | | | | | | | | | | | | | | | | | | | | | | | | | | | | | | | | | | | | | | |
| Three Months Ended June 30, | | | | | | Six Months Ended June 30, | | | | |
| (dollars in millions) | 2021 | | 2020 | | Change | | Percent | | 2021 | | 2020 | | Change | | Percent |
| Net charge-offs | $37 | | | $76 | | | ($39) | | | (51 | %) | | $91 | | | $169 | | | ($78) | | | (46 | %) |
| Annualized net charge-off rate | 0.24 | % | | 0.50 | % | | (26) | bps | | | 0.29 | % | | 0.56 | % | | (27) | bps | | |
|
| | | | | | | | | | | | | | | | | | | | | | | | | | | | | |
| | Three Months Ended September 30, | | | | | | Nine Months Ended September 30, | | | | |
| (dollars in millions) | 2020 |
| | 2019 |
| | Change |
| | Percent |
| | 2020 |
| | 2019 |
| | Change | | Percent |
|
| Net charge-offs |
| $49 |
| |
| $81 |
| |
| ($32 | ) | | (40 | %) | |
| $218 |
| |
| $219 |
| |
| ($1 | ) | | — | % |
| Annualized net charge-off rate | 0.32 | % | | 0.53 | % | | (21 | ) bps | | | 0.48 | % | | 0.49 | % | | (1 | ) bps | | |
Troubled Debt Restructurings
In the first quarter of 2020, we adopted the CARES Act and interagency guidance issued by the bank regulatory agencies which provide that COVID-19-related modifications to retail and commercial loans that met certain eligibility criteria are exempt from classification as a TDR. PaymentWe generally do not consider payment deferrals and forbearance plans entered into as a result ofestablished due to the COVID-19 pandemic were generally not consideredto be TDRs.
As of September 30, 2020, $715 million of retail loans were classified as TDRs, compared with $667 million as of December 31, 2019. As of September 30, 2020, $180 million of retail TDRs were in nonaccrual status with 44% current with payments compared to $143 million in nonaccrual status with 38% current on payments at December 31, 2019. TDRs generally return to accrual status once repayment capacity and appropriate payment history can be established. TDRs are individually evaluated to estimate ACL, and loans, once classified as TDRs, remain classified as TDRs until paid off, sold or refinanced at market terms. For additional information regarding TDRs, see Note 5 in our 20192020 Form 10-K.
The following tables present retail TDRsCitizens Financial Group, Inc. | 31
| | | | | | | | | | | | | | | | | | | | | | | | | | | | | |
| Table 21: Accruing and Nonaccruing Troubled Debt Restructurings | | | | |
| June 30, 2021 |
| | | As a % of Accruing TDRs | | | | |
| (dollars in millions) | Accruing | | 30-89 Days
Past Due | | 90+ Days Past Due | | Nonaccruing | | Total |
| Commercial and industrial | 150 | | | 0.3 | % | | — | % | | 70 | | | 220 | |
| Commercial real estate | — | | | — | | | — | | | 9 | | | 9 | |
| Total commercial | 150 | | | 0.3 | | | — | | | 79 | | | 229 | |
Residential mortgages(1) | 343 | | | 3.9 | | | 9.5 | | | 34 | | | 377 | |
| Home equity | 211 | | | 0.5 | | | — | | | 81 | | | 292 | |
| Automobile | 3 | | | 0.1 | | | — | | | 39 | | | 42 | |
| Education | 113 | | | 0.4 | | | 0.2 | | | 11 | | | 124 | |
| Other retail | 22 | | | 0.2 | | | — | | | 3 | | | 25 | |
| Total retail | 692 | | | 5.1 | | | 9.6 | | | 168 | | | 860 | |
| Total | $842 | | | 5.4 | % | | 9.6 | % | | $247 | | | $1,089 | |
| | | | | | | | | | | | | | | | | | | | | | | | | | | | | |
| December 31, 2020 |
| | | As a % of Accruing TDRs | | | | |
| (dollars in millions) | Accruing | | 30-89 Days
Past Due | | 90+ Days Past Due | | Nonaccruing | | Total |
| Commercial and industrial | $134 | | | 0.1 | % | | — | % | | $97 | | | $231 | |
| Commercial real estate | $26 | | | — | | | — | | | — | | | $26 | |
| Total commercial | $160 | | | 0.1 | | | — | | | 97 | | | $257 | |
Residential mortgages(1) | 172 | | | 2.1 | | | 2.0 | | | 43 | | | 215 | |
| Home equity | 221 | | | 1.0 | | | — | | | 83 | | | 304 | |
| Automobile | 13 | | | 0.4 | | | — | | | 33 | | | 46 | |
| Education | 116 | | | 0.5 | | | 0.3 | | | 10 | | | 126 | |
| Other retail | 25 | | | 0.2 | | | — | | | 2 | | | 27 | |
| Total retail | 547 | | | 4.2 | | | 2.3 | | | 171 | | | 718 | |
| Total | $707 | | | 4.3 | % | | 2.3 | % | | $268 | | | $975 | |
(1) Includes $75 million and $14million in 90+ days past due and accruing that are fully or partially guaranteed by loan class, including delinquency status for accruing TDRsthe FHA, VA, and TDRs in nonaccrual:
|
| | | | | | | | | | | | | | | | | |
| | September 30, 2020 |
| | | | As a % of Accruing Retail TDRs | | | | |
| (dollars in millions) | Accruing | | 30-89 Days
Past Due | | 90+ Days Past Due | | Nonaccruing |
| | Total |
|
| Residential mortgages |
| $151 |
| | 2.3 | % | | 1.1 | % | |
| $49 |
| |
| $200 |
|
| Home equity | 234 |
| | 1.1 |
| | — |
| | 82 |
| | 316 |
|
| Automobile | 3 |
| | 0.1 |
| | — |
| | 38 |
| | 41 |
|
| Education | 120 |
| | 0.7 |
| | 0.3 |
| | 9 |
| | 129 |
|
| Other retail | 27 |
| | 0.3 |
| | — |
| | 2 |
| | 29 |
|
| Total |
| $535 |
| | 4.5 | % | | 1.4 | % | |
| $180 |
| |
| $715 |
|
|
| | | | | | | | | | | | | | | | | |
| | December 31, 2019 |
| | | | As a % of Accruing Retail TDRs | | | | |
| (dollars in millions) | Accruing | | 30-89 Days
Past Due | | 90+ Days Past Due | | Nonaccruing |
| | Total |
|
| Residential mortgages |
| $113 |
| | 3.8 | % | | 2.1 | % | |
| $41 |
| |
| $154 |
|
| Home equity | 240 |
| | 1.9 |
| | — |
| | 84 |
| | 324 |
|
| Automobile | 13 |
| | 0.2 |
| | — |
| | 8 |
| | 21 |
|
| Education | 127 |
| | 0.9 |
| | 0.3 |
| | 7 |
| | 134 |
|
| Other retail | 31 |
| | 0.6 |
| | — |
| | 3 |
| | 34 |
|
| Total |
| $524 |
| | 7.4 | % | | 2.4 | % | |
| $143 |
| |
| $667 |
|
Non-Core Assets
|
| | | | | | | | | | | | | | |
| (in millions) | September 30, 2020 | | December 31, 2019 | | Change |
| | Percent |
|
| Commercial |
| $41 |
| |
| $6 |
| |
| $35 |
| | 583 | % |
| Commercial real estate | 10 |
| | 11 |
| | (1 | ) | | (9 | ) |
| Leases | 405 |
| | 444 |
| | (39 | ) | | (9 | ) |
| Total commercial loans and leases | 456 |
| | 461 |
| | (5 | ) | | (1 | ) |
| Residential mortgages | 77 |
| | 91 |
| | (14 | ) | | (15 | ) |
| Home equity | 299 |
| | 400 |
| | (101 | ) | | (25 | ) |
| Education | 147 |
| | 166 |
| | (19 | ) | | (11 | ) |
| Total retail loans | 523 |
| | 657 |
| | (134 | ) | | (20 | ) |
| Total non-core loans and leases | 979 |
| | 1,118 |
| | (139 | ) | | (12 | ) |
| Other assets | 105 |
| | 122 |
| | (17 | ) | | (14 | ) |
| Total non-core assets |
| $1,084 |
| |
| $1,240 |
| |
| ($156 | ) | | (13 | %) |
Non-core assets are primarily liquidating loanUSDA at June 30, 2021 and lease portfolios inconsistent with our strategic priorities, generally as a result of geographic location, industry, product type or risk level and are included in Other.December 31, 2020, respectively.
Deposits
The following table presents the major components of our deposits:
| | | Table 22: Composition of Deposits | | Table 22: Composition of Deposits | |
| (in millions) | September 30, 2020 | | December 31, 2019 | | Change |
| | Percent |
| (in millions) | June 30, 2021 | | December 31, 2020 | | Change | | Percent |
| Demand |
| $41,249 |
| |
| $29,233 |
| |
| $12,016 |
| | 41 | % | Demand | $47,480 | | | $43,831 | | | $3,649 | | | 8 | % |
| Checking with interest | 27,141 |
| | 24,840 |
| | 2,301 |
| | 9 |
| Checking with interest | 28,074 | | | 27,204 | | | 870 | | | 3 | |
| Regular savings | 17,237 |
| | 13,779 |
| | 3,458 |
| | 25 |
| Regular savings | 20,382 | | | 18,044 | | | 2,338 | | | 13 | |
| Money market accounts | 46,400 |
| | 38,725 |
| | 7,675 |
| | 20 |
| Money market accounts | 48,150 | | | 48,569 | | | (419) | | | (1) | |
| Term deposits | 10,894 |
| | 18,736 |
| | (7,842 | ) | | (42 | ) | Term deposits | 6,550 | | | 9,516 | | | (2,966) | | | (31) | |
| Total deposits |
| $142,921 |
| |
| $125,313 |
| |
| $17,608 |
| | 14 | % | Total deposits | $150,636 | | | $147,164 | | | $3,472 | | | 2 | % |
Total deposits as of SeptemberJune 30, 20202021 increased $17.6$3.5 billion, or 14%2%, to $142.9$150.6 billion, from $125.3$147.2 billion as of December 31, 2019,2020, reflecting the impact ofstrong deposit flows from consumer-oriented government stimulus as well as corporate clients building liquidity.stimulus. Citizens Access®, our national digital platform, ended the quarter with $6.2$4.9 billion of deposits, updown from $5.8$5.9 billion as of December 31, 2019.2020, primarily due to rate reduction strategies that resulted in a decrease in term deposits.
Citizens Financial Group, Inc. | 32
Borrowed Funds
Total borrowed funds as of SeptemberJune 30, 20202021 decreased $5.0$1.6 billion from December 31, 2019,2020, driven by a $22$181 million and $4.9$1.4 billion decrease in short-term and long-term borrowed funds, respectively. Strong deposit growth enabled the paydown of senior debt.
Long-term borrowed funds
The following table presents a summary of our long-term borrowed funds: | | | Table 23: Summary of Long-Term Borrowed Funds | | Table 23: Summary of Long-Term Borrowed Funds | |
| (in millions) | September 30, 2020 | | December 31, 2019 | (in millions) | June 30, 2021 | | December 31, 2020 |
| Parent Company: | | | | Parent Company: | | | |
2.375% fixed-rate senior unsecured debt, due July 2021 |
| $350 |
| |
| $349 |
| $— | | | $350 | |
4.150% fixed-rate subordinated debt, due September 2022 (1)(2) | 181 |
| | 348 |
| 168 | | | 182 | |
3.750% fixed-rate subordinated debt, due July 2024 (1)(2) | 159 |
| | 250 |
| 90 | | | 159 | |
4.023% fixed-rate subordinated debt, due October 2024 (1)(2) | 25 |
| | 42 |
| 17 | | | 25 | |
4.350% fixed-rate subordinated debt, due August 2025 (1)(2) | 193 |
| | 249 |
| 133 | | | 193 | |
4.300% fixed-rate subordinated debt, due December 2025 (1)(2) | 450 |
| | 750 |
| 336 | | | 450 | |
| 2.850% fixed-rate senior unsecured notes, due July 2026 | 497 |
| | 496 |
| 2.850% fixed-rate senior unsecured notes, due July 2026 | 497 | | | 497 | |
| 2.500% fixed-rate senior unsecured notes, due February 2030 | 297 |
| | — |
| 2.500% fixed-rate senior unsecured notes, due February 2030 | 298 | | | 297 | |
| 3.250% fixed-rate senior unsecured notes, due April 2030 | 745 |
| | — |
| 3.250% fixed-rate senior unsecured notes, due April 2030 | 745 | | | 745 | |
2.638% fixed-rate subordinated debt, due September 2032 (1) | 542 |
| | — |
| |
3.750% fixed-rate reset subordinated debt, due February 2031 (2) | | 3.750% fixed-rate reset subordinated debt, due February 2031 (2) | 69 | | | — | |
4.300% fixed-rate reset subordinated debt, due February 2031 (2) | | 4.300% fixed-rate reset subordinated debt, due February 2031 (2) | 135 | | | — | |
4.350% fixed-rate reset subordinated debt, due February 2031 (2) | | 4.350% fixed-rate reset subordinated debt, due February 2031 (2) | 60 | | | — | |
| 2.638% fixed-rate subordinated debt, due September 2032 | | 2.638% fixed-rate subordinated debt, due September 2032 | 547 | | | 543 | |
| CBNA’s Global Note Program: | | | | CBNA’s Global Note Program: | |
| 2.250% senior unsecured notes, due March 2020 | — |
| | 700 |
| |
2.678% floating-rate senior unsecured notes, due March 2020 (2) | — |
| | 300 |
| |
2.217% floating-rate senior unsecured notes, due May 2020 (2) | — |
| | 250 |
| |
| 2.200% senior unsecured notes, due May 2020 | — |
| | 500 |
| |
| 2.250% senior unsecured notes, due October 2020 | 750 |
| | 750 |
| |
| | 2.550% senior unsecured notes, due May 2021 | 1,005 |
| | 991 |
| 2.550% senior unsecured notes, due May 2021 | — | | | 1,003 | |
| 3.250% senior unsecured notes, due February 2022 | 720 |
| | 711 |
| 3.250% senior unsecured notes, due February 2022 | 708 | | | 716 | |
0.985% floating-rate senior unsecured notes, due February 2022 (2) | 299 |
| | 299 |
| |
1.044% floating-rate senior unsecured notes, due May 2022 (2) | 250 |
| | 250 |
| |
0.874% floating-rate senior unsecured notes, due February 2022 (3) | | 0.874% floating-rate senior unsecured notes, due February 2022 (3) | 300 | | | 299 | |
0.951% floating-rate senior unsecured notes, due May 2022 (3) | | 0.951% floating-rate senior unsecured notes, due May 2022 (3) | 250 | | | 250 | |
| 2.650% senior unsecured notes, due May 2022 | 512 |
| | 501 |
| 2.650% senior unsecured notes, due May 2022 | 507 | | | 510 | |
| 3.700% senior unsecured notes, due March 2023 | 530 |
| | 515 |
| 3.700% senior unsecured notes, due March 2023 | 520 | | | 527 | |
1.168% floating-rate senior unsecured notes, due March 2023 (2) | 249 |
| | 249 |
| |
1.096% floating-rate senior unsecured notes, due March 2023 (3) | | 1.096% floating-rate senior unsecured notes, due March 2023 (3) | 250 | | | 249 | |
| 2.250% senior unsecured notes, due April 2025 | 745 |
| | — |
| 2.250% senior unsecured notes, due April 2025 | 746 | | | 746 | |
| 3.750% senior unsecured notes, due February 2026 | 555 |
| | 521 |
| 3.750% senior unsecured notes, due February 2026 | 536 | | | 551 | |
| Additional Borrowings by CBNA and Other Subsidiaries: | | | | Additional Borrowings by CBNA and Other Subsidiaries: | |
| Federal Home Loan Bank advances, 0.943% weighted average rate, due through 2038 | 19 |
| | 5,008 |
| |
| Federal Home Loan Bank advances, 0.909% weighted average rate, due through 2038 | | Federal Home Loan Bank advances, 0.909% weighted average rate, due through 2038 | 18 | | | 19 | |
| Other | 36 |
| | 18 |
| Other | 27 | | | 35 | |
| Total long-term borrowed funds |
| $9,109 |
| |
| $14,047 |
| Total long-term borrowed funds | $6,957 | | | $8,346 | |
(1) Notes were redeemed on June 28, 2021.
(2) The SeptemberJune 30, 20202021 balances reflect the results of the September 2020February 2021 subordinated debt private exchange offers and related cash tender offers. See “Capital and Regulatory Matters-Regulatory Capital Ratios and Capital Composition” for additional information.
(2) (3) Rate disclosed reflects the floating rate as of SeptemberJune 30, 2020 or final floating rate, as applicable.2021.
Long-term borrowed funds as of September 30, 2020 decreased $4.9 billion from December 31, 2019, reflecting a decrease of $5.0 billion in FHLB advances, which was partially offset by hedging adjustments. The reduction in FHLB advances was the result of lower funding needs due to higher deposit inflows.
The Parent Company’s long-term borrowed funds as of SeptemberJune 30, 20202021 and December 31, 20192020 included principal balances of $3.5$3.2 billion and $2.5$3.5 billion, respectively, and unamortized deferred issuance costs and/or discounts of ($92)$84 million and ($8)$90 million, respectively. CBNA and other subsidiaries’ long-term borrowed funds as of SeptemberJune 30, 20202021 and December 31, 20192020 included principal balances of $5.6$3.8 billion and $11.5$4.8 billion, respectively, with unamortized deferred issuance costs and/or discounts of ($13)$9 million and ($13)$11 million, respectively, and hedging basis adjustments of $128$76 million and $50$112 million, respectively. See Note 98 for further information about our hedging of certain long-term borrowed funds. For information regarding our liquidity and available borrowing capacity, see “—Liquidity” and Note 8.7.
CAPITAL AND REGULATORY MATTERS
As a bank holding company and a financial holding company, we are subject to regulation and supervision by the FRB. Our banking subsidiary, CBNA, is a national banking association whose primary federal regulator is the OCC. Our regulation and supervision continues to evolve as the legal and regulatory frameworks governing our operations continue to change. For more information, see “Regulation and Supervision” in our 20192020 Form 10-K.
Citizens Financial Group, Inc. | 33
Tailoring of Prudential Requirements
In October 2019, the FRB and the other federal banking regulators finalized rules that tailor the application of the enhanced prudential standards to bank holding companies and depository institutions to implement the EGRRCPA amendments to the Dodd-Frank Act (“Tailoring Rules”). Under the FRB’s Tailoring Rules, Category IV firms, such as us, are subject to biennial supervisory stress testing and are exempt from company-run stress testing and related disclosure requirements. Category IV firms are also no longer required to submit resolution plans. The FRB continues to supervisesupervises Category IV firms on an ongoing basis, including evaluation of the capital adequacy and capital planning processes during off-cycle years. We remain subject to the requirementare also required to develop, maintain and submit to the FRB an annual capital plan, for reviewwhich must be reviewed and approvalapproved by our Boardboard of Directors (ordirectors or one of its committees).committees. On April 6, 2020,2, 2021, we submitted our 20202021 Capital Plan to the FRB under the FRB’s 20202021 CCAR process. For more information, see the “Tailoring of Prudential Requirements” section in item 1 of our 2020 Form 10-K.
On March 4, 2020,Under the FRB finalized a stress capital buffer (“SCB”) requirement that integrates regulatory capital requirements with the results of the FRB’s supervisory stress tests by replacing the CCB of 2.5% with a dynamic SCB requirement. The new SCB requirement is based on the projected losses under the supervisory severely adverse scenario of each firm subject to CCAR plus four quarters of planned common stock dividends, subject to a floor of 2.5%. Under the SCB framework, the FRB will no longernot object to capital plans on quantitative grounds and each firm will beis required to maintain capital ratios above the sum of its minimum requirements and the SCB requirements to avoid restrictions on capital distributions and discretionary bonus payments. ForOn October 1, 2020, our SCB of 3.4% became effective and applies to our capital actions through September 30, 2021.
On February 3, 2021, the FRB adopted a final rule effective April 5, 2021 to tailor the requirements of its Capital Plan Rule, specifically modifying capital planning, regulatory reporting and stress capital buffer requirements to be consistent with the Tailoring Rules framework. Under the final rule, for Category IV firms, like us, the FRB has stated that the SCB will be re-calibrated with each biennial supervisory stress test and updated annually to reflect our planned common stock dividends. On October 1, 2020 our SCB of 3.4% became effective and will apply to our capital actions through September 30, 2021.
On September 30, 2020, the FRB issued a proposed rule to make conforming changes to its capital plan rule, stress capital buffer requirements, and capital planning requirements to be consistent with the Tailoring Rules framework. Under the proposal,In addition, Category IV firms like us, would have the ability to elect to participate in the supervisory stress test and receive an updated SCB requirement in a year in which they are not subject to the supervisory stress test. For purposes of calculating the SCB in 2021, the proposed rule would require us to notify the FRB of our intentionWe did not elect to participate in the 2021 supervisory stress test by February 15, 2021. In addition,and our SCB effective for the proposal would maintain the requirement for firms like us to submit capital plans annually but would generally remove the capital plan rule requirement to calculate forward-looking projections of capital under supervisory scenarios and also reduce compliance burden related to reporting requirements.period October 1, 2021 through September 30, 2022 will remain unchanged at 3.4%.
On June 29, 2020, we announced key aspects of our 2020 Capital Plan, which includes maintaining quarterly common dividends at the current level of $0.39 per share through the SCB window period ending third quarter 2021. We previously announced our intention to cease stock repurchases through December 31, 2020. We will continue to evaluate our distributions on a quarterly basis going forward.
In light of the heightened uncertainty related to the COVID-19 pandemic and associated lockdowns, the FRB has also takentook certain actions to preserve capital at banks. Among those actions, the FRB imposed certain limitations on firms for the third quarterand fourth quarters of 2020, including mandatory suspension of share repurchases and cappinglimiting common stock dividends atto existing rates and the average quarterly net income over the precedingprior four quarters. On September 30, 2020,The FRB modified its limitations on capital distributions for the FRB extended these limitations throughfirst and second quarters of 2021 such that firms that participate in CCAR, like us, may resume share repurchases provided that the fourthaggregate of share repurchases and common stock dividends for the applicable quarter did not exceed average quarterly net income for the trailing four quarters. In January 2021, our board of directors authorized us to repurchase up to $750 million of our common stock beginning in the first quarter of 2020, and these limitations may be extended by the FRB quarter-by-quarter. Further,2021. At June 30, 2021, we had $655 million of this share repurchase authorization remaining. In March 2021, the FRB announced that it requires CCARthe temporary restrictions on capital distribution will end after June 30, 2021 for firms, like us, that are on a two-year cycle and not subject to conduct an additional roundsupervisory stress testing this year. The timing and amount of stress testsfuture dividends and resubmit updated capital plans to reflect changes in the macroeconomic environment due to the COVID-19 pandemic. Consistent with the FRB’s mandate, we resubmittedshare repurchases will depend on various factors, including our capital plan on November 2, 2020. position, financial performance, risk-weighted assets, capital impacts of strategic initiatives, market conditions and regulatory considerations. In addition, we suspended share repurchases, until the Investors shareholder vote, in connection with our entry into the agreement to acquire Investors. See Note 17 for more details regarding the Investors acquisition. All future capital distributions are subject to consideration and approval by our board of directors prior to execution.
Regulations relating to capital planning, regulatory reporting and stress capital bufferSCB requirements applicable to firms like us are presently subject to rulemakingongoing rule-making and potential further guidance and interpretation by the applicable federal regulators. We will continue to evaluate the impact of these and any other prudential regulatory changes, including their potential resultant changes in our regulatory and compliance costs and expenses.
For more information, see “Regulation and Supervision” and “—Capital and Regulatory Matters” in our 20192020 Form 10-K.
Capital Framework
Under the current U.S. Basel III capital framework, we and our banking subsidiary, CBNA, must meet the following specific minimum requirements: CET1 capital ratio of 4.5%, tier 1 capital ratio of 6.0%, total capital ratio of 8.0%, and tier 1 leverage ratio of 4.0%. AAs a bank holding company, our SCB of 3.4% is imposed on top of the three minimum risk-based capital ratios listed above and a CCB of 2.5% is imposed on top of the three minimum risk-based capital ratios listed above.above for our banking subsidiary.
Effective for us on April 1, 2020,Under the U.S. Basel III rules, the CET1 deduction threshold for MSRs, certain deferred tax assets and significant investments in the capital of unconsolidated institutions is 25%. As of SeptemberJune 30, 2020,2021, we did not meet the threshold for these additional capital deductions. MSRs or deferred tax assets not deducted from CET1 capital
Citizens Financial Group, Inc. | 34
are assigned a 250% risk weight and significant investments in the capital of unconsolidated financial institutions not deducted from CET1 capital are assigned an exposure category risk weight.
In reaction to the COVID-19 pandemic, on September 30, 2020 the FRB and the other federal banking regulators adopted a final rule relative to regulatory capital treatment of ACL under CECL. This rule allowed electing banking organizations to delay the estimated impact of CECL on regulatory capital for a two-year period ending January 1, 2022, followed by a three-year transition period ending January 1, 2025 to phase-in the aggregate amount of the capital benefit provided during the initial two-year delay. As of SeptemberJune 30, 2020, $5842021, $420 million of the capital benefit has been accumulated for application to the three-year transition period.
For additional discussion of the U.S. Basel III capital framework and its related application, see Regulation“Regulation and Supervision” in our 20192020 Form 10-K. The table below presents our actual regulatory capital ratios under the U.S. Basel III Standardized rules:
| | | Table 24: Regulatory Capital Ratios Under the U.S. Basel III Standardized Rules | | Table 24: Regulatory Capital Ratios Under the U.S. Basel III Standardized Rules | |
| | September 30, 2020 | | December 31, 2019 | Required Minimum plus Required CCB for Non-Leverage Ratios(1) | | June 30, 2021 | | December 31, 2020 | Required Minimum plus Required CCB for Non-Leverage Ratios(1) |
| (in millions, except ratio data) | Amount | Ratio | | Amount | Ratio | (in millions, except ratio data) | Amount | Ratio | | Amount | Ratio |
| CET1 capital |
| $14,345 |
| 9.8 | % | |
| $14,304 |
| 10.0 | % | 7.0 | % | CET1 capital | $15,266 | | 10.3 | % | | $14,607 | | 10.0 | % | 7.9 | % |
| Tier 1 capital | 16,310 |
| 11.2 |
| | 15,874 |
| 11.1 |
| 8.5 |
| Tier 1 capital | 17,280 | | 11.6 | | | 16,572 | | 11.3 | | 9.4 | |
| Total capital | 19,427 |
| 13.3 |
| | 18,542 |
| 13.0 |
| 10.5 |
| Total capital | 20,111 | | 13.5 | | | 19,602 | | 13.4 | | 11.4 | |
| Tier 1 leverage | 16,310 |
| 9.5 |
| | 15,874 |
| 10.0 |
| 4.0 |
| Tier 1 leverage | 17,280 | | 9.7 | | | 16,572 | | 9.4 | | 4.0 | |
| Risk-weighted assets | 146,131 |
| | | 142,915 |
| | Risk-weighted assets | 148,563 | | | 146,781 | | |
| Quarterly adjusted average assets | 171,938 |
| | | 158,782 |
| | Quarterly adjusted average assets | 178,929 | | | 175,370 | | |
(1) Required “Minimum Capital ratios” are: CET1 capital of 4.5%; Tier 1 capital of 6.0%; Total capital of 8.0%; and Tier 1 leverage of 4.0%. “Minimum Capital ratios” also include a CCBSCB of 2.5%3.4%; N/A to Tier 1 leverage.
At SeptemberJune 30, 2020,2021, our CET1 capital, tier 1 capital and total capital ratios were 9.8%10.3%, 11.2%11.6% and 13.3%13.5%, respectively, as compared with 10.0%, 11.1%11.3%, and 13.0%13.4%, respectively, as of December 31, 2019.2020. The CET1 capital ratio decreasedincreased as $3.2net income for the six months ended June 30, 2021 was partially offset by dividends and common share repurchases as described in “—Capital Transactions” below, $1.8 billion of risk-weighted asset (“RWA”) growth and a decrease in the impact of the capital actions described in “—Capital Transactions” below were partially offset by net income for the nine months ended September 30, 2020 and 25% of the increase in AACL subsequent tomodified CECL adoption.transitional amount. The tier 1 capital ratio increased asdue to the changes in the CET1 capital were more than offset byratio described above and the issuance of Series F preferred stockG Preferred Stock, partially offset by the announced redemption of Series A Preferred Stock as described in “—Capital Transactions” below. The total capital ratio increased due toas the changes in the CET1 and tier 1 capital and the net change in AACL attributable to CECL adoption and the modified transition amount partially offset byratios described above combined with the subordinated debt exchange offersoffer in the first quarter of 2021, as described in “—Regulatorythe “Regulatory Capital Ratios and Capital Composition” below.section below, were partially offset by the reduction in the net AACL impact. At SeptemberJune 30, 2020,2021, our CET1 capital, tier 1 capital and total capital ratios were approximately 280240 basis points, 270220 basis points and 280210 basis points, respectively, above their regulatory minimums plus the capital conservation buffer.our SCB. All ratios remained well above the U.S. Basel III minimums.
Regulatory Capital Ratios and Capital Composition
CET1 capital under U.S. Basel III Standardized rules totaled $14.3$15.3 billion at SeptemberJune 30, 2020,2021, an increase of $41$659 million from $14.3$14.6 billion at December 31, 2019,2020, largely driven by net income for the ninesix months ended SeptemberJune 30, 2020 and 25% of the increase in AACL subsequent to CECL adoption,2021, partially offset by dividends, a decrease in the modified CECL transitional amount and common share repurchases and dividends.repurchases. Tier 1 capital at SeptemberJune 30, 20202021 totaled $16.3$17.3 billion, reflecting a $436$708 million increase from $15.9$16.6 billion at December 31, 2019,2020, driven by the changes in CET1 capital and the issuance of Series F preferred stock.G Preferred Stock, partially offset by the announced redemption of Series A Preferred Stock. Total capital of $19.4$20.1 billion at SeptemberJune 30, 2020,2021 increased $885$509 million from December 31, 2019,2020, driven by the changes in CET1 and Tiertier 1 capital and the net changea decrease in AACL attributable to the adoption of CECL and the modified transition amount,non-qualifying subordinated debt, partially offset by a decreasethe reduction in qualifying subordinated debt.
the net AACL impact.
RWA totaled $146.1$148.6 billion at SeptemberJune 30, 2020,2021, based on U.S. Basel III Standardized rules, up $3.2$1.8 billion from December 31, 2019.2020. This increase in RWA was driven by higher derivative valuations, increases incommercial commitments, agency securities, automobile loans, MSRs, bank-owned life insurance and education loans, commercial real estate loans, commercial past due loans, MSR RWA, resulting from the finalization of the simplification rules which increased risk weight from 100% to 250%, and an increase in residential mortgages.loans. These RWA increases were partially offset by lower high volatilitycommercial loans, other retail loans and commercial real estate and home equity loans.commitments.
As of SeptemberJune 30, 2020,2021, the tier 1 leverage ratio was 9.5%9.7%, decreasingup from 10.0%9.4% at December 31, 20192020, driven by higher tier 1 capital, partially offset by the $13.2$3.6 billion increase in quarterly adjusted average assets and higher tier 1 capital.
The following table presents our capital composition under the U.S. Basel III capital framework:assets.
Citizens Financial Group, Inc. | 35
|
| | | | | | | | |
| (in millions) | September 30, 2020 | | December 31, 2019 |
| Total common shareholders' equity | 20,504 |
| | 20,631 |
|
| Exclusions: | | | |
| Modified CECL transitional amount | 584 |
| | — |
|
| Net unrealized (gains)/losses recorded in accumulated other comprehensive income (loss), net of tax: | | | |
| Debt and equity securities | (403 | ) | | (1 | ) |
| Derivatives | (12 | ) | | (3 | ) |
| Unamortized net periodic benefit costs | 405 |
| | 415 |
|
| Deductions: | | | |
| Goodwill | (7,050 | ) | | (7,044 | ) |
| Deferred tax liability associated with goodwill | 377 |
| | 374 |
|
| Other intangible assets | (60 | ) | | (68 | ) |
| Total common equity tier 1 | 14,345 |
| | 14,304 |
|
| Qualifying preferred stock | 1,965 |
| | 1,570 |
|
| Total tier 1 capital | 16,310 |
| | 15,874 |
|
Qualifying subordinated debt(1) | 1,298 |
| | 1,372 |
|
| Allowance for credit losses | 2,736 |
| | 1,296 |
| Exclusions from tier 2 capital: | | | |
| Modified AACL transitional amount | (698 | ) | | — |
|
Excess allowance for credit losses(2) | (219 | ) | | — |
|
| Adjusted allowance for credit losses | 1,819 |
| | 1,296 |
|
| Total capital |
| $19,427 |
| 18,542 |
|
| $18,542 |
|
| | | | | | | | | | | |
| Table 25: Capital Composition Under the U.S. Basel III Capital Framework | | | |
| (in millions) | June 30, 2021 | | December 31, 2020 |
| Total common shareholders' equity | $21,185 | | | $20,708 | |
| Exclusions: | | | |
| Modified CECL transitional amount | 420 | | | 568 | |
| Net unrealized (gains)/losses recorded in accumulated other comprehensive income (loss), net of tax: | | | |
| Debt and equity securities | (78) | | | (380) | |
| Derivatives | 38 | | | 11 | |
| Unamortized net periodic benefit costs | 421 | | | 429 | |
| Deductions: | | | |
| Goodwill | (7,050) | | | (7,050) | |
| Deferred tax liability associated with goodwill | 383 | | | 379 | |
| Other intangible assets | (53) | | | (58) | |
| Total common equity tier 1 | 15,266 | | | 14,607 | |
| Qualifying preferred stock | 2,014 | | | 1,965 | |
| Total tier 1 capital | 17,280 | | | 16,572 | |
Qualifying subordinated debt(1) | 1,284 | | | 1,204 | |
| Allowance for credit losses | 2,081 | | | 2,670 | |
| Exclusions from tier 2 capital: | | | |
| Modified AACL transitional amount | (534) | | | (682) | |
Excess allowance for credit losses(2) | — | | | (162) | |
| Adjusted allowance for credit losses | 1,547 | | | 1,826 | |
| Total capital | $20,111 | | | $19,602 | |
(1)As of SeptemberJune 30, 20202021 and December 31, 2019,2020, the amount of non-qualifying subordinated debt excluded from regulatory capital was $252$271 million and $267$348 million, respectively.
(2) Excess allowance represents the amount excluded from tier 2 capital that is in excess of 1.25% of risk weighted assets, excluding market risk.
In September 2020,On February 11, 2021, we completed $621$265 million in private exchange offers for five series of outstanding subordinated notes. Exchange offer participants received a combination of our newly issuednewly-issued fixed-rate reset subordinated notes due 2032 and an additional cash payment. We also completed related cash tender offers2031 which result in $11 million of subordinated notes being validly tendered and accepted for purchaseare redeemable by us and subsequently cancelled. The completion of thefive years prior to their maturity. These subordinated debt exchange offers will benefit our tier 2 and total capital going forward by increasing the amount of subordinated debt eligible for inclusion in tier 2 capital and reducingwithout increasing the totalaggregate principal amount of related interest payments.subordinated debt outstanding. See Note 7 for more details on our outstanding subordinated debt.
Capital Adequacy Process
Our assessment of capital adequacy begins with our board-approved risk appetite and risk management framework. This framework provides for the identification, measurement and management of material risks. There have been no significant changes to our capital adequacy risk appetite and risk management framework as described in “—Capital and Regulatory Matters” in our 20192020 Form 10-K.
Capital Transactions
We completed the following capital actions during the ninesix months ended SeptemberJune 30, 2020:2021:
•Issued 300,000 shares of CFG 4.000% fixed-rate reset non-cumulative perpetual Series G Preferred Stock at an aggregate offering price of $300 million;
•Issued a notice to redeem all outstanding shares of CFG Series A Non-Cumulative Perpetual Preferred Stock which settled on July 6, 2021;
•Completed $621$265 million of subordinated debt private exchange offers in September 2020;February 2021;
Issued $400 million, or 400,000 shares,•Declared and paid quarterly common stock dividends of $0.39 per share in the first and second quarters of 2021, aggregating to $335 million;
•Declared a quarterly dividend of $10.49 per share in first quarter of 2021 and $10.50 per share in the second quarter of 2021 on the 5.500% fixed-to-floating rate non-cumulative perpetual Series A Preferred Stock, aggregating to $5 million;
Citizens Financial Group, Inc. | 36
•Declared a semi-annual dividend of $30.00 per share on the 6.000% fixed-to-floating rate non-cumulative perpetual Series B Preferred Stock, aggregating to $9 million;
•Declared quarterly dividends of $15.94 per share on the 6.375% fixed-to-floating rate non-cumulative perpetual Series C Preferred Stock, aggregating to $10 million;
•Declared quarterly dividends of $15.88 per share on the 6.350% fixed-to-floating rate non-cumulative perpetual Series D Preferred Stock, aggregating to $9 million;
•Declared quarterly dividends of $12.50 per share on the 5.000% fixed-rate non-cumulative perpetual Series E Preferred Stock, aggregating to $11 million;
•Declared quarterly dividends of $14.13 per share on the 5.650% fixed-rate reset non-cumulative perpetual Series F Preferred Stock;Stock, aggregating to $11 million; and
•Repurchased $95 million of our outstanding common stock at a weighted-average price per share of $42.32.
| |
• | Declared and paid quarterly common stock dividends of $0.39 per share for first, second, and third quarters of
2020, aggregating to $504 million;
|
| |
• | Declared a semi-annual dividend of $27.50 per share in first quarter 2020, a quarterly dividend of $13.48 per share in second quarter of 2020 and a quarterly dividend of $10.90 in the third quarter 2020 on the 5.500% fixed-to-floating rate non-cumulative perpetual Series A Preferred Stock, aggregating to $13 million;
|
| |
• | Declared a semi-annual dividend of $30.00 per share on the 6.000% fixed-to-floating rate non-cumulative perpetual Series B Preferred Stock, aggregating to $9 million;
|
| |
• | Declared quarterly dividends of $15.94 per share for first, second, and third quarters of 2020 on the 6.375% fixed-to-floating rate non-cumulative perpetual Series C Preferred Stock, aggregating to $14 million;
|
| |
• | Declared quarterly dividends of $15.88 per share for first, second, and third quarters of 2020 on the 6.350% fixed-to-floating rate non-cumulative perpetual Series D Preferred Stock, aggregating to $14 million;
|
| |
• | Declared quarterly dividends of $12.50 per share for first, second, and third quarters of 2020 on the 5.000% fixed-rate non-cumulative perpetual Series E Preferred Stock, aggregating to $17 million;
|
| |
• | Declared quarterly dividends of $19.15 per share for the third quarter of 2020 on the 5.650% fixed-rate non-cumulative perpetual Series F Preferred Stock, aggregating to $8 million; and
|
| |
• | Repurchased $270 million of our outstanding common stock.
|
Banking Subsidiary’s Capital
The following table presents CBNA’s capital ratios under U.S. Basel III Standardized rules: | | | | | | | | | | | | | | | | | |
| Table 26: CBNA's Capital Ratios Under the U.S. Basel III Standardized Rules | | | |
| June 30, 2021 | | December 31, 2020 |
| (dollars in millions, except ratio data) | Amount | Ratio | | Amount | Ratio |
| CET1 capital | $16,545 | | 11.2 | % | | $16,032 | | 10.9 | % |
| Tier 1 capital | 16,545 | | 11.2 | | | 16,032 | | 10.9 | |
| Total capital | 19,217 | | 13.0 | | | 18,980 | | 13.0 | |
| Tier 1 leverage | 16,545 | | 9.3 | | | 16,032 | | 9.2 | |
| Risk-weighted assets | 148,105 | | | | 146,558 | | |
| Quarterly adjusted average assets | 178,441 | | | | 174,954 | | |
|
| | | | | | | | | | | |
| | September 30, 2020 | | December 31, 2019 |
| (dollars in millions, except ratio data) | Amount |
| Ratio |
| | Amount |
| Ratio |
|
| CET1 capital |
| $15,890 |
| 10.9 | % | |
| $15,610 |
| 11.0 | % |
| Tier 1 capital | 15,890 |
| 10.9 |
| | 15,610 |
| 11.0 |
|
| Total capital | 18,831 |
| 12.9 |
| | 17,937 |
| 12.6 |
|
| Tier 1 leverage | 15,890 |
| 9.3 |
| | 15,610 |
| 9.9 |
|
| Risk-weighted assets | 145,788 |
| | | 142,555 |
| |
| Quarterly adjusted average assets | 171,519 |
| | | 158,391 |
| |
CBNA’s CET1 and tier 1 capital totaled $15.9$16.5 billion at SeptemberJune 30, 2020,2021, up $280$513 million from $15.6$16.0 billion at December 31, 2019. The2020. This increase was primarily driven by net income for the ninesix months ended SeptemberJune 30, 2020 and 25% of the increase in AACL subsequent to CECL adoption,2021, partially offset by dividends paid to the Parent Company.Company and a decrease in the modified CECL transitional amount. Total capital was $18.8$19.2 billion at SeptemberJune 30, 2020,2021, an increase of $894$237 million from $17.9$19.0 billion at December 31, 2019,2020, driven by the change in CET1 capital andpartially offset by the reduction in the net change in AACL attributable to the adoption of CECL and the modified transition amount and an increase in qualifying subordinated debt.impact.
CBNA’s RWA totaled $145.8$148.1 billion at SeptemberJune 30, 2020,2021, up $3.2$1.5 billion from December 31, 2019,2020, driven by higher derivative valuations, increases incommercial commitments, agency securities, automobile loans, MSRs, bank-owned life insurance and education loans, commercial real estate loans, commercial past due loans, MSR RWA given the finalization of the simplification rules which increased the MSR risk weight from 100% to 250% and an increase in residential mortgages.loans. These RWA increases were partially offset by lower high volatilitycommercial loans, other retail loans and commercial real estate and home equity loans.commitments.
As of SeptemberJune 30, 2020,2021, CBNA’s tier 1 leverage ratio decreased toof 9.3% from 9.9% at December 31, 2019, drivenincreased as the increase in tier 1 capital was mostly offset by the $13.1$3.5 billion increase in quarterly adjusted average assets and higher tier 1 capital.assets.
LIQUIDITY
Liquidity is defined as our ability to meet our cash-flow and collateral obligations in a timely manner, at a reasonable cost. An institution must maintain operating liquidity to meet its expected daily and forecasted cash-flow requirements, as well as contingent liquidity to meet unexpected (stress scenario) funding requirements. As noted earlier, reflecting the importance of meeting all unexpected and stress-scenario funding requirements, we identify and manage contingent liquidity, (consistingconsisting of cash balances at the FRB, unencumbered high-quality and liquid securities, and unused FHLB borrowing capacity).capacity. Separately, we also identify and manage asset liquidity as a subset of contingent liquidity, (consistingconsisting of cash balances at the FRB and unencumbered high-quality securities).
securities. We consider the effective and prudent management of liquidity fundamental to our health and strength. We manage liquidity at the consolidated enterprise level and at each material legal entity, including at the Parent Company and CBNA level.
Citizens Financial Group, Inc. | 37
Parent Company Liquidity
Our Parent Company’s primary sources of cash are dividends and interest received from CBNA as a result of investing in bank equity and subordinated debt andas well as externally issued preferred stock, as well as senior and subordinated debt. Uses of cash include the routine cash flow requirements as a bank holding company, including periodic share repurchases and payments of dividends, interest and expenses; the needs of subsidiaries, including CBNA for additional equity and, as required, its need for debt financing; and the support for extraordinary funding requirements when necessary. To the extent the Parent Company has relied on wholesale borrowings, uses also include payments of related principal and interest.
During the ninesix months ended SeptemberJune 30, 2020,2021, the Parent Company completed the following transactions:
•Issued $400 million, or 400,000300,000 shares of 5.650%4.00% fixed-rate reset non-cumulative perpetual Series FG Preferred Stock at an aggregate offering price of $300 million;
•Issued a notice to redeem all outstanding shares of CFG Series A Non-Cumulative Perpetual Preferred Stock which settled on June 4, 2020;July 6, 2021; and
Issued $750•Redeemed $350 million in ten-year 3.250%of 2.375% fixed-rate senior notes on April 30, 2020; and
Issued $300 million in ten-year 2.500% fixed-rate senior notes on February 6, 2020.unsecured debt due July 2021.
During the three months ended SeptemberJune 30, 20202021 and 2019,2020, the Parent Company declared dividends on common stock of $168 million, and $162declared dividends on preferred stock of $32 and $28 million, respectively.
During the six months ended June 30, 2021 and 2020, the Parent Company declared dividends on common stock of $335 million and $336 million, respectively, and declared dividends on preferred stock of $25 million and $17 million, respectively. During the nine months ended September 30, 2020 and 2019, the Parent Company declared dividends on common stock of $504 million and $459 million, respectively, and declared dividends on preferred stock of $75 million$55 and $50 million, respectively.
Our Parent Company’s cash and cash equivalents represent a source of liquidity that can be used to meet various needs and totaled $2.5$2.7 billion as of SeptemberJune 30, 2020 compared with $1.4 billion as of2021 and December 31, 2019.2020. The Parent Company’s double-leverage ratio, (thethe combined equity investment in Parent Company subsidiaries divided by Parent Company equity)equity, is a measure of reliance on equity cash flows from subsidiaries to fund Parent Company obligations. At SeptemberJune 30, 2020,2021, the Parent Company’s double-leverage ratio was 98.7%97.6%.
CBNA Liquidity
In the ordinary course of business, the liquidity of CBNA is managed by matching sources and uses of cash. The primary sources of bank liquidity include deposits from our consumer and commercial customers; payments of principal and interest on loans and debt securities; and wholesale borrowings, as needed, and as described under “—Liquidity Risk Management and Governance.” The primary uses of bank liquidity include withdrawals and maturities of deposits; payment of interest on deposits; (iii) funding of loans and related commitments; and (iv) funding of securities purchases. To the extent that CBNA has relied on wholesale borrowings, uses also include payments of related principal and interest. For further information on CBNA’s outstanding debt, see Note 8.7.
As CBNA’s primary business involves taking deposits and making loans, a key role of liquidity management is to ensure that customers have timely access to funds from deposits and for loans. Liquidity management also involves maintaining sufficient liquidity to repay wholesale borrowings, pay operating expenses and support extraordinary funding requirements when necessary.
On April 30, 2020, CBNA issued $750 million in five-year 2.250% fixed-rate senior notes.
Liquidity Risk
We define liquidity risk as the risk that an entity will be unable to meet its payment obligations in a timely manner, at a reasonable cost. Liquidity risk can arise due to contingent liquidity risk and/or funding liquidity risk.
Contingent liquidity risk is the risk that market conditions may reduce an entity’s ability to liquidate, pledge and/or finance certain assets and thereby substantially reduce the liquidity value of such assets. Drivers of contingent liquidity risk include general market disruptions as well as specific issues regarding the credit quality and/or valuation of a security or loan, issuer or borrower and/or asset class.
Funding liquidity risk is the risk that market conditions and/or entity-specific events may reduce an entity’s ability to raise funds from depositors and/or wholesale market counterparties. Drivers of funding liquidity risk may be idiosyncratic or systemic, reflecting impediments to operations and/or damaged market confidence.
Citizens Financial Group, Inc. | 38
Factors Affecting Liquidity
Given the composition of assets and borrowing sources, contingent liquidity risk at CBNA would be materially affected by events such events as deterioration of financing markets for high-quality securities (e.g., mortgage-backed securities and other instruments issued by the GNMA, FNMA and the FHLMC), by any inability of the FHLBs to provide collateralized advances and/or by a refusal of the FRB to act as a lender of last resort in systemic stress.
Similarly, given the structure of its balance sheet, the funding liquidity risk of CBNA would be materially affected by an adverse idiosyncratic event (e.g., a major loss, causing a perceived or actual deterioration in its financial condition), an adverse systemic event (e.g., default or bankruptcy of a significant capital markets participant), or a combination of both. Consequently, and despite ongoing exposure to a variety of idiosyncratic and systemic events, we view our contingent liquidity risk and our funding liquidity risk to be relatively modest.
An additional variable affecting our access to unsecured wholesale market funds and to large denomination (i.e., uninsured) customer deposits is the credit ratings assigned by such agencies as Moody’s, Standard &and Poor’s, and Fitch. The following table presents our credit ratings:
|
| | | | | | | | | | | | | | | | |
| Table 27: Credit Ratings | | September 30, 2020 | | | |
| June 30, 2021 |
| Moody’s | | Standard and
Poor’s
| | Fitch |
|
| Citizens Financial Group, Inc.: | | | | | |
| Long-term issuer | NR | | BBB+ | | BBB+ |
| Short-term issuer | NR | | A-2 | | F1 |
| Subordinated debt | NR | | BBB | | BBB |
| Preferred Stock | NR | | BB+ | | BB |
| Citizens Bank, National Association: | | | | | |
| Long-term issuer | Baa1 | | A- | | BBB+ |
| Short-term issuer | NR | | A-2 | | F1 |
| Long-term deposits | A1 | | NR | | A- |
| Short-term deposits | P-1 | | NR | | F1 |
| NR = Not rated | | | | | |
Changes in our public credit ratings could affect both the cost and availability of our wholesale funding. As a result, and in order to maintain a conservative funding profile, CBNA continues to minimize reliance on unsecured wholesale funding. At SeptemberJune 30, 2020,2021, our wholesale funding consisted primarily of term debt issued by the Parent Company and CBNA.
Existing and evolving regulatory liquidity requirements represent another key driver of systemic liquidity conditions and liquidity management practices. The FRB, the OCC, and the FDIC regularly evaluate our liquidity as part of the overall supervisory process. In addition, we are subject to existing and evolving regulatory liquidity requirements, some of which are subject to further rulemaking, guidance and interpretation by the applicable federal regulators. For further discussion, see “Regulation and Supervision — Tailoring of Prudential Requirements” and “—Liquidity Requirements” in our 20192020 Form 10-K.
Liquidity Risk Management and Governance
Liquidity risk is measured and managed by the Funding and Liquidity unit within our Treasury unit in accordance with policy guidelines promulgated by our Board and the Asset Liability Committee. In managing liquidity risk, the Funding and Liquidity unit delivers regular and comprehensive reporting, including current levels versus threshold limits for a broad set of liquidity metrics and early warning indicators, explanatory commentary relating to emerging risk trends and, as appropriate, recommended remedial strategies.
Citizens Financial Group, Inc. | 39
Our Funding and Liquidity unit’s primary goal is to deliver and otherwise maintain prudent levels of operating liquidity (toto support expected and projected funding requirements), andrequirements, as well as contingent liquidity (toto support unexpected funding requirements resulting from idiosyncratic, systemic, and combination stress events, and regulatory liquidity requirements)requirements in a timely manner from stable and cost-efficient funding sources.
We seek to accomplish this goal by funding loans with stable deposits; by prudently controlling dependence on wholesale funding, particularly short-term unsecured funding; and by maintaining ample available liquidity, including a contingent liquidity buffer of unencumbered high-quality loans and securities. As of SeptemberJune 30, 2020 total available liquidity was $70.0 billion, comprised of:2021:
| |
• | $8.3 billion in cash (defined as cash balance held at the FRB);
|
| |
• | $20.4 billion in unencumbered high-quality liquid securities;
|
| |
• | $13.2 billion in unused FHLB capacity; and
|
| |
• | $28.1 billion in available discount window capacity (defined as available total borrowing capacity from the FRB based on identified non-mortgage commercial and retail loans collateral).
|
Core•Organically generated deposits continuedcontinue to be our primary source of funding, and ourresulting in a consolidated period end LDR,loan-to-deposits ratio, excluding LHFS, of 81.4%;
•Our cash position, which excludes LHFS,is defined as cash balance held at the FRB, totaled $11.5 billion;
•Our total available liquidity, comprised of contingent liquidity and available discount window capacity, was 86.8%. The LDR calculation included $4.7approximately $75.8 billion;
•Contingent liquidity was $46.9 billion, consisting of PPPunencumbered high-quality liquid securities of $21.0 billion, unused FHLB capacity of $14.4 billion, and our cash position of $11.5 billion. Asset liquidity, a component of contingent liquidity, was $32.5 billion, consisting of our cash position of $11.5 billion and unencumbered high-quality liquid securities of $21.0 billion;
•Available discount window capacity, defined as available total borrowing capacity from the FRB based on identified collateral, is secured by non-mortgage commercial and retail loans and the impact was an increase in the LDRtotaled $28.9 billion. Use of 325 basis points as of September 30, 2020.this borrowing capacity would be considered only during exigent circumstances; and
•For a summary of our sources and uses of cash by type of activity for the ninesix months ended SeptemberJune 30, 20202021 and 2019,2020, see the Consolidated Statements of Cash Flows.
The Funding and Liquidity unit monitors a variety of liquidity and funding metrics and early warning indicators and metrics, including specific risk thresholds limits. These monitoring tools are broadly classified as follows:
•Current liquidity sources and capacities, includinginclude cash at the FRBs, free and liquid securities available and secured FHLB borrowing capacity, available discount window capacity, and undrawn capacity at the PPP Liquidity Facility;capacity;
•Liquidity stress sources, including idiosyncratic, systemic and combined stresses, in addition to evolving regulatory requirements; and
•Current and prospective exposures, including secured and unsecured wholesale funding and spot and cumulative cash-flow gaps across a variety of horizons.
Further, certain of these metrics are monitored individually for CBNA and for our consolidated enterprise on a daily basis, including cash position, unencumbered securities, asset liquidity, and available FHLB borrowing capacity. In order to identify emerging trends and risks and inform funding decisions, specific metrics are also forecasted over a one-year horizon.
OFF-BALANCE SHEET ARRANGEMENTS
The following table presents our outstanding off-balance sheet arrangements. For further information, see Note 12.11.
| | | | | | | | | | | | | | | | | | | | | | | |
| Table 28: Outstanding Off-Balance Sheet Arrangements | | | | |
| (in millions) | June 30, 2021 | | December 31, 2020 | | Change | | Percent |
| Commitments to extend credit | $76,761 | | | $74,160 | | | $2,601 | | | 4 | % |
| Letters of credit | 1,926 | | | 2,239 | | | (313) | | | (14) | |
| Risk participation agreements | 68 | | | 98 | | | (30) | | | (31) | |
| Loans sold with recourse | 64 | | | 54 | | | 10 | | | 19 | |
| Marketing rights | 26 | | | 29 | | | (3) | | | (10) | |
| Total | $78,845 | | | $76,580 | | | $2,265 | | | 3 | % |
Citizens Financial Group, Inc. | 40
|
| | | | | | | | | | | | | | |
| (in millions) | September 30, 2020 | | December 31, 2019 | | Change |
| | Percent |
|
| Commitments to extend credit |
| $73,173 |
| |
| $72,743 |
| |
| $430 |
| | 1 | % |
| Letters of credit | 2,132 |
| | 2,190 |
| | (58 | ) | | (3 | ) |
| Risk participation agreements | 103 |
| | 37 |
| | 66 |
| | 178 |
|
| Loans sold with recourse | 48 |
| | 37 |
| | 11 |
| | 30 |
|
| Marketing rights | 29 |
| | 33 |
| | (4 | ) | | (12 | ) |
| Total |
| $75,485 |
| |
| $75,040 |
| |
| $445 |
| | 1 | % |
CRITICAL ACCOUNTING ESTIMATES
Our unaudited interim Consolidated Financial Statements, which are included in this Report, are prepared in accordance with GAAP. The preparation of financial statements in conformity with GAAP requires us to establish accounting policies and make estimates that affect amounts reported in our audited Consolidated Financial Statements.
An accounting estimate requires assumptions and judgments about uncertain matters that could have a material effect on our unaudited interim Consolidated Financial Statements. Estimates are made using facts and circumstances known at a point in time. Changes in those facts and circumstances could produce results substantially different from those estimates. Our most significant accounting policies and estimates relate to the determination of the ACL
and the fair value of MSRs.their related application are discussed below. For additional information regarding the fair value of MSRs,measurements, see “—Critical Accounting Estimates” in our 20192020 Form 10-K.
Allowance for Credit Losses
We reserve for expected credit losses on our loan and lease portfolio through the ALLL and for expected credit losses in our unfunded lending commitments through other liabilities. Collectively, the ALLL and reserves for expected credit losses in unfunded lending commitments are referred to as the ACL.
Changes in the ACL are reflected in net income through provision for credit losses. Changes in the credit risk profile of our loans and leases result in changes in provision expense with a resulting change, net of charge-offs and recoveries, in the ACL balance.
The ACL is often the most critical of all the accounting estimates for banking institutions like us. The ACL is maintaineddecreased from $2.7 billion at a level we believe to be appropriate to absorb expected lifetime credit losses over the contractual life of the loan and lease portfolios and on the unfunded lending commitments. Our determination of the ACL is based on periodic evaluation of the loan and lease portfolios and unfunded lending commitments that are not unconditionally cancelable considering a number of relevant underlying factors, including key assumptions and evaluation of quantitative and qualitative information.
Key assumptions used in our ACL measurement process include the use of a two-year reasonable and supportable economic forecast period followed by a one-year period during which the expected credit losses revert to long-term historical macroeconomic inputs.
The evaluation of quantitative and qualitative information is performed through assessments of groups of assets that share similar risk characteristics and certain individual loans and leases that do not share similar risk characteristics with the collective group. Loans are grouped generally by product type (e.g., commercial, commercial real estate, residential mortgage, etc.), and significant loan portfolios are assessed for credit losses using econometric models. The evaluation process is inherently imprecise and subjective as it requires significant management judgment based on underlying factors that are susceptible to change, sometimes materially and rapidly.
The quantitative evaluation of the adequacy of the ACL utilizes a single economic forecast as its foundation, and is primarily based on econometric models that use known or estimated data as of the balance sheet date and forecasted data over the reasonable and supportable period. Known and estimated data include current PD, LGD and EAD (for commercial loans and leases), timing and amount of expected draws (for unfunded lending commitments), FICO, LTV, term and time on books (for retail loans), mix and level of loan balances, delinquency levels, assigned risk ratings, previous loss experience, current business conditions, amounts and timing of expected future cash flows, and factors particular to a specific commercial credit such as competition, business and management performance. Forward-looking economic assumptions include real gross domestic product, unemployment rate, interest rate curve, and changes in collateral values. This data is aggregated to estimate expected credit losses over the contractual life of the loans and leases, adjusted for expected prepayments. In highly volatile economic environments historical information, such as commercial customer financial statements or consumer credit ratings, may not be as important to estimating future expected losses as forecasted inputs to the models.
The ACL may also be affected materially by a variety of qualitative factors that we consider to reflect our current judgment of various events and risks that are not measured in our statistical procedures including uncertainty related to the economic forecasts used in the modeled credit loss estimates, loan growth, back testing results, credit underwriting policy exceptions, regulatory and audit findings, and peer comparisons. The qualitative allowance is further informed by multiple alternative scenarios to support the period-end ACL balance. We recognize that this approach may not be suitable in certain economic environments and differing analysis may be requested at management’s discretion. Due in part to its subjectivity, the qualitative evaluation may be materially impacted during periods of economic uncertainty and late breaking events could lead to revision of reserves to reflect management’s best estimate of expected credit losses.
The measurement process results in specific or pooled allowances for loans, leases and unfunded lending commitments, and qualitative allowances that are judgmentally determined and applied across the portfolio.
There are certain loan portfolios that may not need an econometric model to enable us to calculate management’s best estimate of the expected credit losses. Less data intensive, non-modeled approaches to estimating losses are considered more efficient and practical for portfolios that have lower levels of outstanding balances (e.g., runoff or closed portfolios, and new products or products that are not significant to our overall credit risk exposure).
The ACL is established in accordance with our credit reserve policies, as approved by the Audit Committee of the Board of Directors. The Chief Financial Officer and Chief Risk Officer review the adequacy of the ACL each quarter, together with our risk management team. In addition, various regulatory agencies, as an integral part of their examination process, periodically review the ACL.
The difference in ACL as of September 30, 2020 as compared to December 31, 2019 continues2020 to be driven by the COVID-19 and associated lockdowns and the resulting economic impacts from March to September 2020, as well as our adoption$2.1 billion at June 30, 2021, reflecting a reserve release of CECL on January 1, 2020. We added $451 million in ACL upon adoption of CECL, and have since added an additional $989 million over the first nine months of 2020, resulting in an ending ACL balance of $2.7 billion. $589 million.
To determine the ACL as of SeptemberJune 30, 2020,2021, we utilized an economic scenarioforecast that generally reflects real GDP growth of 4.5%approximately 5.7% over 2021, returning to fourth quarter 2019 real GDP levels by the first quarter of 2022.2021. The scenarioforecast also projects the fourth quarter 2020 unemployment rate to be in the range of 9%5.9% to 9.5%, and falling6.6% throughout 2021. This forecast reflects an overall improved macroeconomic outlook as compared to 7%December 31, 2020. In addition to 7.5% by the fourth quarter of 2021. While the macroeconomic forecast was slightly improved relativejudgment applied to the second quarter 2020 forecast,commercial portfolio as a whole, we continued to apply management judgment to adjust the modeled reserves in the commercial industry sectors most impacted by the COVID-19 pandemic and associated lockdowns, including CRE retail and hospitality and casual dining, retail trade, price-sensitive energydining.
Our determination of the ACL is sensitive to changes in forecasted macroeconomic conditions during the reasonable and related,supportable period. To illustrate, we applied a more pessimistic scenario than that described above which assumes that challenges in acceptance of vaccines cause COVID-19-related infections to abet later than in our base case scenario, with concerns rising about resistant strains. Consumer spending is slower to rebound, with businesses reopening more slowly and educational services, as well asvacation spending muted. This pessimistic scenario reflects real GDP growth of approximately 3.25% and unemployment in certain retail products.the range of 6.5% to 7.0% over 2021. Excluding consideration of qualitative adjustments, this scenario would result in a quantitative lifetime loss estimate of approximately 1.15x our modeled period-end ACL, or an increase of approximately $175 million. This analysis relates only to the modeled credit loss estimate and not to the overall period-end ACL, which includes qualitative adjustments.
Because several quantitative and qualitative factors are considered in determining the ACL, this sensitivity analysis does not necessarily reflect the nature and extent of future changes in the ACL or even what the ACL would be under these economic circumstances. The sensitivity is intended to provide insights into the impact of adverse changes in the macroeconomic environment and the corresponding impact to modeled loss estimates. The hypothetical determination does not incorporate the impact of management judgment or other qualitative factors that could be applied in the actual estimation of the ACL and does not imply any expectation of future deterioration in our loss rates.
To provide additional context regarding sensitivity to more pessimistic scenarios, our ACL balance of $2.7$2.1 billion represents 41%24% of the $6.7$8.6 billion of nine-quarternine-quarter losses projected in the Federal Reserve run of the December 2020 DFAST Supervisory Severely Adverse scenario, (the “DFAST scenario”), which forecasted more protracted unemployment and GDP declines compared with our ACL calculation. Our ACL calculation whichalso included the impacts of government stimulus.
Comparatively, our ACL represents 56%41% of the $4.9$5.1 billion of projected losses in the Company run DFASTresults of the Supervisory Severely Adverse scenario. Losses projected under the Company run DFASTSupervisory Severely Adverse scenario are lower than the Federal Reserve run scenarioresults due to methodology and modeling differences. As an example, the Federal Reserve’s models did not recognize contractual loss sharing arrangements in the merchant loan portfolio. In addition, both DFAST scenariosBoth the Company and Federal Reserve results include incremental losses associated with an assumption that balance sheet levels remain flat due to loan originations post-Septemberassumed post-June 30, 2020. In contrast, our SeptemberJune 30, 20202021 ACL balance considers only existing loans and lines of credit as of the reporting date.
While the recovery path is clearer than it was at the end of the secondfourth quarter 2020, significant future uncertainty still exists, including size and timing of further monetary and fiscal stimulus, and timingprogress in the rollout, acceptance, and effectiveness of a vaccine.COVID-19 vaccines. It remains difficult to estimate how changes in economic forecasts might affect our ACL because such forecasts
Citizens Financial Group, Inc. | 41
consider a wide variety of variables and inputs, and changes in the variables and inputs may not occur at the same time or in the same direction, and such changes may have differing impacts by product types. Further, theThe variables and inputs may be idiosyncratically affected by existing or future monetary and fiscal stimulus programs and forbearance and other customer accommodation efforts. Nevertheless, changesChanges in one or multiple of the key variables may have a material impact to our estimation of expected credit losses.
We continue to monitor the impact of the COVID-19, pandemicvaccination efforts, and related policy measures on the economy and if the depth ofresulting potentially material effects on the recession or pace and vigor of the expected recovery is worse than expected, further building of our ACL could be required.ACL.
For additional information regarding the ALLL and reserve for unfunded lending commitments,ACL, see Note 14 of this report, and “Critical Accounting Estimates” and Note 4.
Goodwill
Goodwill is initially recorded as the excess of the purchase price over the fair value of net assets acquired in a business combination and is assigned to our reporting units at the acquisition date. Our reporting units align to our operating segments identified in Note 17. We have identified and assigned goodwill totaling $7.1 billion at September 30, 2020, to our reporting units as follows: $2.3 billion to Consumer Banking and $4.8 billion to Commercial Banking.
Goodwill is not amortized but is subject to annual impairment tests. We review goodwill for impairment annually as of October 31 and in interim periods when events or changes indicate the carrying value of one or more reporting units may not be recoverable. Impairment indicators are evaluated considering a number of external factors including local economic conditions, competition for loans and deposits, the monetary policy of the FRB and market interest rates, COVID-19 pandemic-related government stimulus efforts, and the banking regulatory environment, as well as internal factors including our credit performance, interest rate margin and operating costs,
and then impacts of those factors on the performance of Citizens’ stock. We have the option of performing a qualitative assessment of goodwill to determine whether it is more likely than not that the fair value of each reporting unit is less than the carrying value. Additionally, we evaluate goodwill impairment on an interim basis if events or changes in circumstances between annual tests indicate additional testing may be warranted to determine if goodwill might be impaired. If it is more likely than not that the fair value exceeds the carrying value, no further testing is necessary, otherwise a quantitative assessment of goodwill is required.
The quantitative assessment, used to identify potential impairment, involves comparing each reporting unit’s fair value to its carrying value, including goodwill. If the fair value of a reporting unit exceeds its carrying value inclusive of goodwill, the applicable goodwill is not considered impaired. If the carrying value of the reporting unit inclusive of goodwill exceeds its fair value, an impairment charge against net income is recorded equal to the excess amount. Under the quantitative impairment assessment, the fair values of our reporting units are determined using a combination of income and market-based approaches. We rely on the income approach (discounted cash flow method, or “DCF”) as our primary method to determine a range of values for each reporting unit, with the market and transaction approaches used to inform management of the best estimate of value within that range.
Significant management judgment is necessary5 in the determination of the fair value of a reporting unit as the income approach requires an estimation of future cash flows, considering the after-tax results of operations, the extent and timing of credit losses, and appropriate discount and capital retention rates. The determination of fair value is a highly subjective process, and actual future cash flows may differ from forecasted results.Company’s 2020 Form 10-K.
Cash flow projections rely upon multi-year financial forecasts developed for each reporting unit that consider key business drivers such as new business initiatives, customer retention standards, market share changes, anticipated loan and deposit growth, fees and expenses, forward interest rates, historical performance, credit performance, and industry and economic trends, among other considerations. The long-term growth rate used in determining the terminal value of each reporting unit is estimated based on management’s assessment of the minimum expected terminal growth rate of each reporting unit, as well as broader economic considerations such as GDP, unemployment and inflation.
Our discount rate was based on the estimated cost of equity under the Capital Asset Pricing Model, which considers the risk-free interest rate, market risk premium, and beta specific to a particular reporting unit. The discount rates are also calibrated on the assessment of the risks related to the projected cash flows of each reporting unit.
Under the market approach, valuation of our reporting units considers a combination of earnings and equity multiples from companies with characteristics similar to the reporting unit. Since the fair values determined under the market approach are representative of non-controlling interests, the valuations incorporate a control premium.
In the first quarter of 2020, U.S. economic conditions deteriorated significantly with the spread of the COVID-19 pandemic and associated lockdowns. In response to the crises and the ongoing impacts to the banking industry and markets in which we operate, we performed a quantitative goodwill impairment assessment in the third quarter 2020. When calculating the fair value of our reporting units under the income approach, short and medium-term forecasts incorporated current economic conditions and ongoing impacts of the COVID-19 pandemic, including a federal funds target near zero and near-term elevated ACL, offset by significant monetary and fiscal stimulus. Long-term cash flow projections reflected normalized rate and credit environments, as well as a long-term rate of return for each reporting unit. At the conclusion of the quantitative assessment it was determined that the estimated fair value of the Commercial Banking reporting unit did not substantially exceed its carrying value, and that of the Consumer Banking reporting unit did substantially exceed its carrying value.
The interim quantitative assessment of goodwill impairment included evaluation of various factors that continue to rapidly evolve and for which significant uncertainty remains, including future growth rates and operating margins, the impact of the COVID-19 pandemic to the economy and ongoing government intervention to mitigate that impact. The result of our quantitative goodwill impairment assessment for our Commercial Banking reporting unit is sensitive to certain key factors and, therefore, further weakening in the national economic environment, including worsening of real gross domestic product, unemployment rate, interest rate curve or collateral values, or a more protracted economic recovery than is currently forecasted may impact our discount rate and/or adversely impact our estimation of expected future cash flows for the reporting units, driven by adverse impacts to the amount and/or timing of credit losses, and thereby cause the fair value of the Commercial Banking reporting unit to fall
below its carrying value, resulting in impairment. Any impairment charge would not affect our regulatory capital ratios, tangible common equity ratio or liquidity position.
When performing the quantitative goodwill impairment assessment in the third quarter of 2020, we corroborated the fair value of our reporting units determined by the DCF method by adding the aggregated sum of these fair value measurements to the fair value of our Other non-segment operations and compared this total to our observed market capitalization. Since none of our reporting units are publicly traded, individual reporting unit fair value determinations cannot be directly correlated to our common stock price. The sum of the fair values of the reporting units exceeded by a larger amount than observed in recent years the overall market capitalization of Citizens as of September 30, 2020.
RISK GOVERNANCE
We are committed to maintaining a strong, integrated, and proactive approach to the management of all risks to which we are exposed in pursuit of our business objectives. A key aspect of our Board’s responsibility as the main decision making body is setting our risk appetite to ensure that the levels of risk that we are willing to accept in the attainment of our strategic business and financial objectives are clearly understood.
To enable our Board to carry out its objectives, it has delegated authority for risk management activities, as well as governance and oversight of those activities, to a number of Board and executive management level risk committees. The Executive Risk Committee (“ERC”), chaired by the Chief Risk Officer, is responsible for oversight of risk across the enterprise and actively considers our inherent material risks, analyzes our overall risk profile and seeks confirmation that the risks are being appropriately identified, assessed and mitigated. Reporting to the ERC are the following additional committees covering specific areas of risk: Compliance and Operational Risk Committee, Model Risk Committee, Credit Policy Committee, Asset Liability Committee, Business Initiatives Review Committee, and the Conduct and Ethics Committee.
There have been no significant changes in our risk governance practices, risk framework, risk appetite, or credit risk as described in “—Risk Governance” in our 20192020 Form 10-K.
MARKET RISK
Market risk refers to potential losses arising from changes in interest rates, foreign exchange rates, equity prices, commodity prices and/or other relevant market rates or prices. Modest market risk arises from trading activities that serve customer needs, including hedging of interest rate and foreign exchange risk. As described below, more material market risk arises from our non-trading banking activities, such as loan origination and deposit-gathering. We have established enterprise-wide policies and methodologies to identify, measure, monitor and report market risk. We actively manage market risk for both non-trading and trading activities.
Non-Trading Risk
We are exposed to market risk as a result of non-trading banking activities. This market risk is substantially composed of interest rate risk, as we have no commodity risk and de minimis direct currency and equity risk. We also have market risk related to capital markets loan originations, as well as the valuation of our MSRs. There have been no significant changes in our sources of interest rate risk, interest rate risk practices, risk framework, metrics or assumptions as described in “—Market Risk — Non-Trading Risk” in our 20192020 Form 10-K.
The table below reports net interest income exposures against a variety of interest rate scenarios. Our policies involve measuring exposures as a percentage change in net interest income over the next year due to either instantaneous or gradual parallel changes in rates relative to the market implied forward yield curve. As the following table illustrates, our balance sheet is asset sensitive; net interest income would benefit from an increase in interest rates, while exposure to a decline in interest rates is within netlimit. While an instantaneous and severe shift in interest income sensitivity limits. Thisrates is included in this analysis, we believe that any actual shift in interest rates would typically includelikely be more gradual and therefore have a negative 100 basis point shock and gradual decreases; however, the table has been changed to a negative 25 basis points due to the current low interest rate environment.more modest impact.
Citizens Financial Group, Inc. | 42
The table below presents the sensitivity of net interest income to various parallel yield curve shifts from the market implied forward yield curve:
| | | | | | | | | | | |
| Table 29: Sensitivity of Net Interest Income | | | |
| Estimated % Change in Net Interest Income over 12 Months |
| Basis points | June 30, 2021 | | December 31, 2020 |
| Instantaneous Change in Interest Rates | | | |
| 200 | 21.7 | % | | 21.2 | % |
| 100 | 11.3 | | | 11.2 | |
| -25 | (2.2) | | | (2.7) | |
| Gradual Change in Interest Rates | | | |
| 200 | 10.7 | | | 10.8 | |
| 100 | 5.4 | | | 5.5 | |
| -25 | (1.2) | | | (1.5) | |
|
| | | | | |
| | Estimated % Change in Net Interest Income over 12 Months |
| Basis points | September 30, 2020 | | December 31, 2019 |
| Instantaneous Change in Interest Rates | | | |
| +200 | 17.3 | % | | 6.9 | % |
| +100 | 9.8 |
| | 3.6 |
|
| -25 | (1.8 | ) | | (1.3 | ) |
| Gradual Change in Interest Rates | | | |
| +200 | 8.4 |
| | 3.2 |
|
| +100 | 4.5 |
| | 1.5 |
|
| -25 | (1.1 | ) | | (0.5 | ) |
We continue to manage asset sensitivity within the scope of our policy and changing market conditions. Asset sensitivity against a 200 basis point gradual increase in rates was 8.4%remained fairly steady at September10.7% as of June 30, 2020,2021 as compared with 3.2%to 10.8% at December 31, 2019.2020, resulting from the addition of $8.0 billion of receive-fixed/pay-variable interest rate swaps. Current levels of asset sensitivity are elevated relative to our core sensitivity profile due to meaningful increases in cash and deposit balances as a result of monetary and fiscal stimulus programs. Core sensitivity is a recognition of the current level of historically low interest rates and is consistent with our positioning in prior periods of policy rates between zero and 25 basis points. The risk position can be affected by changesChanges in interest rates can also affect the risk positions, which impactimpacts the repricing sensitivity or beta of the deposit base as well as the cash flows on assets that allow for early payoff without a penalty. The risk position is managed within our risk limits, and long termlong-term view of interest rates through occasional adjustments to securities investments, interest rate swaps and mix of funding.
We use a valuation measure of exposure to structural interest rate risk, Economic Value of Equity (“EVE”), as a supplement to net interest income simulations. EVE complements net interest income simulation analysis as it estimates risk exposure over a long-term horizon. EVE measures the extent to which the economic value of assets, liabilities and off-balance sheet instruments may change in response to fluctuations in interest rates. This analysis is highly dependent upon assumptions applied to assets and liabilities with non-contractual maturities. The change in value is expressed as a percentage of regulatory capital.
We use interest rate swap contracts to manage the interest rate exposure to variability in the interest cash flows on our floating-rate assets and floating-rate wholesale funding, and to hedge market risk on fixed-rate capital markets debt issuances and AFS securities.issuances.
| | | | | | | | | | | | | | | | | | | | | | | | | | | | | | | |
| Table 30: Interest Rate Swap Contracts Used to Manage Non-Trading Interest Rate Exposure | |
| June 30, 2021 | | December 31, 2020 |
| | | Weighted Average | | | Weighted Average |
| (dollars in millions) | Notional Amount | | Maturity (Years) | Receive Rate | Pay Rate | | Notional Amount | | Maturity (Years) | Receive Rate | Pay Rate |
Cash flow - receive-fixed/pay-variable - conventional ALM(1) | $18,100 | | | 2.5 | | 1.1 | % | 0.1 | % | | $12,350 | | | 1.0 | | 1.5 | % | 0.2 | % |
| Fair value - receive-fixed/pay-variable - conventional debt | 2,200 | | | 1.8 | | 2.5 | | 0.2 | | | 3,200 | | | 1.7 | | 2.1 | | 0.2 | |
Cash flow - pay-fixed/receive-variable - conventional ALM(1)(2) | 3,000 | | | 3.0 | | 0.1 | | 1.7 | | | 4,750 | | | 3.9 | | 0.2 | | 1.4 | |
Fair value - pay-fixed/receive-variable - conventional ALM(1) | 2,000 | | | 3.2 | | 0.1 | | 1.5 | | | 2,000 | | | 3.7 | | 0.2 | | 1.5 | |
| Total portfolio swaps | $25,300 | | | 2.5 | | 1.0 | % | 0.4 | % | | $22,300 | | | 2.0 | | 1.2 | % | 0.6 | % |
| | | | | | | | | | | |
Using the(1) Asset Liability Management (“ALM”) strategies used to manage interest rate curve at September 30, 2020, the estimated net contribution to net interest income related to theexposures include interest rate swap contracts we useused to manage the interest rate exposure to the variability in the interest cash flows on our floating-rate commercial loans and floating-rate wholesale funding, as well as the variability in the fair value of AFS securitiessecurities.
(2) December 31, 2020 includes $1.8 billion of forward-starting, pay-fixed interest rate swaps that were terminated in the first quarter of 2021.
Using the interest rate curve at June 30, 2021, the estimated net contribution to net interest income related to our ALM hedge strategies is approximately $132 million for the full-year 2020 and $56$99 million for the full-year 2021 representing a decline of $76compared to $133 million year-over-year. These amountsfor the full-year 2020. The estimated net contribution could differ from amounts actually recognized due to changes in interest rates, hedge de-designations, and the addition of other hedges subsequent to SeptemberJune 30, 2020.2021.
Citizens Financial Group, Inc. | 43
The following table presents the pre-tax net gains (losses) recorded in the Consolidated Statements of Operations and in the Consolidated Statements of Comprehensive Income relating to derivative instruments designated as cash flow hedges:
|
| | | | | | | | | | | | | | | |
| | Three Months Ended September 30, | | Nine Months Ended September 30, |
| (in millions) | 2020 |
| | 2019 |
| | 2020 |
| | 2019 |
|
| Amount of pre-tax net (losses) gains recognized in OCI |
| $— |
| |
| ($5 | ) | |
| $118 |
| |
| $138 |
|
| Amount of pre-tax net gains (losses) reclassified from OCI into interest income | 68 |
| | (22 | ) | | 128 |
| | (62 | ) |
| Amount of pre-tax net (losses) gains reclassified from OCI into interest expense | (11 | ) | | 8 |
| | (22 | ) | | 9 |
|
Capital Markets | | | | | | | | | | | | | | | | | | | | | | | |
Table 27: Pre-Tax Gains (Losses) Recorded in the Consolidated Statements of Operations and the Consolidated Statements of Comprehensive Income(1) |
| Three Months Ended June 30, | | Six Months Ended June 30, |
| (in millions) | 2021 | | 2020 | | 2021 | | 2020 |
| Amount of pre-tax net gains (losses) recognized in OCI | $62 | | | ($11) | | | $34 | | | $118 | |
| Amount of pre-tax net gains (losses) reclassified from OCI into interest income | 49 | | | 55 | | | 95 | | | 60 | |
| Amount of pre-tax net gains (losses) reclassified from OCI into interest expense | (12) | | | (10) | | | (24) | | | (11) | |
(1) Using the interest rate curve at June 30, 2021, with respect to cash flow hedge strategies, we estimate that approximately $86 million will be reclassified from AOCI to net interest income over the next 12 months.
LIBOR Transition
As previously disclosed, many of our lending products, securities, derivatives, and other financial transactions utilize the LIBOR benchmark rate and will be impacted by its planned discontinuance. In late 2018, we formed a LIBOR Transition Program designed to guide the organization through the planned discontinuation of LIBOR. The Program, with direction and oversight from our Chief Financial Officer, is responsible for developing, maintaining and executing against a coordinated strategy to ensure a timely and orderly transition from LIBOR. The Program is structured to address various initiatives including program governance, transition management, communications, exposure management, new alternative reference rate product delivery, risk management, contract remediation, operations and technology readiness, accounting and reporting, as well as tax and regulation impacts. We have identified and are monitoring the risks associated with the LIBOR transition on a quarterly basis.
The ARRC recommended that banks be systemically and operationally capable of supporting transactions in alternative reference rates, such as SOFR, by the end of September 2020. Guided by this milestone, we are systemically and operationally prepared to support alternative reference rate transactions. On March 5, 2021, the Financial Conduct Authority (“FCA”) formally announced the future cessation or loss of representation of the LIBOR benchmark settings currently published by the Intercontinental Exchange (“ICE”) Benchmark Administration. Further, the FCA stated that the 1-week and 2-month U.S. Dollar LIBOR rates will cease as of December 31, 2021 and all other U.S. Dollar LIBOR tenors will cease as of June 30, 2023. With the FRB, OCC, and FDIC (collectively, the agencies) supporting this announcement, the LIBOR Transition Program adjusted LIBOR transition activities accordingly. The agencies are still urging market participants to stop entering into new U.S. Dollar LIBOR contracts as soon as practicable, but no later than the end of 2021. We are continuing all efforts to move new originations to alternative reference rates over the course of 2021. However, our plans for legacy contract remediation now extend through mid-2023. More broadly, program governance remains robust, and progress has been made in the above-outlined initiatives as management continues to closely monitor industry and regulatory developments pertaining to the transition.
Capital Markets
A key component of our capital markets activities is the underwriting and distribution of corporate credit facilities to partially finance mergersmerger and acquisitionsacquisition transactions for our clients. We have a rigorous risk management process around these activities, including a limit structure capping our underwriting risk, our potential
loss, and sub limits for specific asset classes. Further, the ability to approve underwriting exposure is delegated only to senior level individuals in the credit risk management and capital markets organizations with each transaction adjudicated in the Loan Underwriting Approval Committee.
Mortgage Servicing Rights
We have market risk associated with the value of residential MSRs, which are impacted by various types of inherent risks, including duration, basis, convexity, volatility and yield curve. Effective January 1, 2020, we elected to account for all MSRs under the fair value method.
As part of our overall risk management strategy relative to the fair market value of the MSRs, we enter into various free-standing derivatives, such as interest rate swaps, interest rate swaptions, interest rate futures, and forward contracts to purchase mortgage-backed securities to economically hedge the changes in fair value. As of SeptemberJune 30, 20202021 and December 31, 2019,2020, the fair value of our MSRs was $606$902 million and $642$658 million, respectively, and the total notional amount of related derivative contracts was $12.4$13.9 billion and $8.6$11.4 billion,
Citizens Financial Group, Inc. | 44
respectively. Gains and losses on MSRs and the related derivatives used for hedging are included in mortgage banking fees onin the Consolidated Statements of Operations.
As with our traded market risk-based activities, earnings at-risk excludes the impact of MSRs. MSRs are captured under our single price risk management framework that is used for calculating a management VaRvalue at risk that is consistent with the definition used by banking regulators, as defined below.regulators.
Trading Risk
We are exposed to market risk primarily through client facilitation activities including derivatives and foreign exchange products as well as underwriting and market making activities. Exposure is created as a result of changes in interest rates and related basis spreads and volatility, foreign exchange rates, and credit spreads on a select range of interest rates, foreign exchange, commodities, corporate bonds and secondary loan instruments. These trading activities are conducted through CBNA and CCMI. There have been no significant changes in our market risk governance, market risk measurement, or market risk practices including VaR, stressed VaR, sensitivity analysis, stress testing, or VaR model review and validation as described in “—Market Risk — Trading Risk” in our 20192020 Form 10-K.
Market Risk Regulatory Capital
The U.S. banking regulators’ “Market Risk Rule” covers the calculation of market risk capital. For the purposes of the Market Risk Rule, all of our client facing trades and associated hedges maintain a net low risk and do qualify as “covered positions.” For the three months ended September 30, 2020 and 2019, we were subject to the reporting threshold under the Market Risk Rule, which resulted in the inclusion of $834 million and $662 million of calculated risk-weighted assets, respectively. The internal management VaR measure is calculated based on the same population of trades that is utilized for regulatory VaR.
The following table presents the results of our modeled and non-modeled measures for regulatory capital calculations:
|
| | | | | | | | | | | | | | | | | | | | | | | | | | | | | | | | |
| (in millions) | | For the Three Months Ended September 30, 2020 | | For the Three Months Ended September 30, 2019 |
Market Risk Category | | Period End | | Average | | High | | Low | | Period End | | Average | | High | | Low |
| Interest Rate | |
| $1 |
| |
| $1 |
| |
| $4 |
| |
| $1 |
| |
| $1 |
| |
| $1 |
| |
| $1 |
| |
| $— |
|
| Foreign Exchange Currency Rate | | — |
| | — |
| | 4 |
| | — |
| | — |
| | — |
| | — |
| | — |
|
| Credit Spread | | 11 |
| | 10 |
| | 12 |
| | 7 |
| | 4 |
| | 4 |
| | 5 |
| | 3 |
|
| Commodity | | — |
| | — |
| | — |
| | — |
| | — |
| | — |
| | — |
| | — |
|
| General VaR | | 11 |
| | 8 |
| | 15 |
| | 6 |
| | 4 |
| | 4 |
| | 5 |
| | 3 |
|
| Specific Risk VaR | | — |
| | — |
| | — |
| | — |
| | — |
| | — |
| | — |
| | — |
|
| Total VaR | |
| $11 |
| |
| $8 |
| |
| $15 |
| |
| $6 |
| |
| $4 |
| |
| $4 |
| |
| $5 |
| |
| $3 |
|
| Stressed General VaR | |
| $13 |
| |
| $10 |
| |
| $20 |
| |
| $7 |
| |
| $11 |
| |
| $9 |
| |
| $12 |
| |
| $6 |
|
| Stressed Specific Risk VaR | | — |
| | — |
| | — |
| | — |
| | — |
| | — |
| | — |
| | — |
|
| Total Stressed VaR | |
| $13 |
| |
| $10 |
| |
| $20 |
| |
| $7 |
| |
| $11 |
| |
| $9 |
| |
| $12 |
| |
| $6 |
|
| Market Risk Regulatory Capital | |
| $55 |
| | | | | | | |
| $39 |
| | | | | | |
| Specific Risk Not Modeled Add-on | | 12 |
| | | | | | | | 14 |
| | | | | | |
| de Minimis Exposure Add-on | | — |
| | | | | | | | — |
| | | | | | |
| Total Market Risk Regulatory Capital | |
| $67 |
| | | | | | | |
| $53 |
| | | | | | |
| Market Risk-Weighted Assets | |
| $834 |
| | | | | | | |
| $662 |
| | | | | | |
| Market Risk-Weighted Assets (included in our FR Y-9C regulatory filing) | |
| $834 |
| | | | | | | |
| $662 |
| | | | | | |
| | | | | | | | | | | | | | | | | | | | | | | | | | | | | | | | | | | | | | | | | | | | | | | | | | |
| Table 32: Results of Modeled and Non-Modeled Measures for Regulatory Capital Calculations |
| (in millions) | | For the Three Months Ended June 30, 2021 | | For the Three Months Ended June 30, 2020 |
Market Risk Category | | Period End | | Average | | High | | Low | | Period End | | Average | | High | | Low |
| Interest Rate | | $2 | | | $2 | | | $5 | | | $— | | | $1 | | | $2 | | | $5 | | | $1 | |
| Foreign Exchange Currency Rate | | 1 | | | — | | | 1 | | | — | | | — | | | — | | | — | | | — | |
| Credit Spread | | 13 | | | 13 | | | 17 | | | 10 | | | 13 | | | 8 | | | 15 | | | 4 | |
| Commodity | | — | | | — | | | — | | | — | | | — | | | — | | | — | | | — | |
| General VaR | | 14 | | | 12 | | | 16 | | | 9 | | | 12 | | | 11 | | | 13 | | | 9 | |
| Specific Risk VaR | | — | | | — | | | — | | | — | | | — | | | — | | | — | | | — | |
| Total VaR | | $14 | | | $12 | | | $17 | | | $9 | | | $12 | | | $11 | | | $13 | | | $9 | |
| Stressed General VaR | | $16 | | | $16 | | | $19 | | | $13 | | | $14 | | | $13 | | | $15 | | | $11 | |
| Stressed Specific Risk VaR | | — | | | — | | | — | | | — | | | — | | | — | | | — | | | — | |
| Total Stressed VaR | | $16 | | | $16 | | | $19 | | | $13 | | | $14 | | | $13 | | | $15 | | | $11 | |
| Market Risk Regulatory Capital | | $89 | | | | | | | | | $73 | | | | | | | |
| Specific Risk Not Modeled Add-on | | 19 | | | | | | | | | 13 | | | | | | | |
| | | | | | | | | | | | | | | | |
| Total Market Risk Regulatory Capital | | $108 | | | | | | | | | $86 | | | | | | | |
| Market Risk-Weighted Assets | | $1,350 | | | | | | | | | $1,078 | | | | | | | |
VaR Backtesting
Backtesting is one form of validation of the VaR model and is run daily. The Market Risk Rule requires a comparison of our internal VaR measure to the actual net trading revenue (excluding fees, commissions, reserves, intra-day trading and net interest income) for each day over the preceding year (the most recent 250 business days). Any observed loss in excess of the VaR number is taken as an exception. The level of exceptions determines the multiplication factor used to derive the VaR and SVaR-based capital requirement for regulatory reporting purposes, when applicable. We perform sub-portfolio backtesting as required under the Market Risk Rule, using models approved by our banking regulators, for interest rate, credit spread, commodity, and foreign exchange positions.
Citizens Financial Group, Inc. | 45
The magnitude of the financial markets sudden dislocation caused by the COVID-19 pandemic resulted in several backtesting exceptions during first quarter 2020. The following graph shows our daily net trading revenue and total internal, modeled VaR for the twelve months ended SeptemberJune 30, 2020.2021.
Daily VaR Backtesting
Citizens Financial Group, Inc. | 46
NON-GAAP FINANCIAL MEASURES AND RECONCILIATIONS
For more information on the computation of our non-GAAP financial measures, see “—Introduction — Non-GAAP Financial Measures,” included in this Report. The following tables present computations of non-GAAP financial measures representing our Underlying results used throughout the MD&A:
| | | | | | | | | | | | | | | | | | | | | | | | | | |
| Table 33: Reconciliations of Non-GAAP Measures | | | | | | | | |
| | | As of and for the Three Months Ended June 30, | | As of and for the Six Months Ended June 30, |
| (in millions, except share, per share and ratio data) | Ref. | 2021 | | 2020 | | 2021 | | 2020 |
| | | | | | | | |
| | | | | | | | |
| | | | | | | | |
| | | | | | | | |
| | | | | | | | |
| | | | | | | | |
| | | | | | | | |
| | | | | | | | |
| | | | | | | | |
| Total revenue, Underlying: | | | | | | | | |
| Total revenue (GAAP) | A | $1,609 | | | $1,750 | | | $3,268 | | | $3,407 | |
| Less: Notable items | | — | | | — | | | — | | | — | |
| | | | | | | | |
| | | | | | | | |
| | | | | | | | |
| | | | | | | | |
| | | | | | | | |
| Total revenue, Underlying (non-GAAP) | B | $1,609 | | | $1,750 | | | $3,268 | | | $3,407 | |
| Noninterest expense, Underlying: | | | | | | | | |
| Noninterest expense (GAAP) | C | $991 | | | $979 | | | $2,009 | | | $1,991 | |
| Less: Notable items | | 11 | | | 19 | | | 31 | | | 52 | |
| | | | | | | | |
| | | | | | | | |
| | | | | | | | |
| | | | | | | | |
| | | | | | | | |
| | | | | | | | |
| Noninterest expense, Underlying (non-GAAP) | D | $980 | | | $960 | | | $1,978 | | | $1,939 | |
| Pre-provision profit: | | | | | | | | |
| Total revenue (GAAP) | A | $1,609 | | | $1,750 | | | $3,268 | | | $3,407 | |
| Less: Noninterest expense (GAAP) | C | 991 | | | 979 | | | 2,009 | | | 1,991 | |
| Pre-provision profit (GAAP) | | $618 | | | $771 | | | $1,259 | | | $1,416 | |
| Pre-provision profit, Underlying | | | | | | | | |
| Total revenue, Underlying (non-GAAP) | B | $1,609 | | | $1,750 | | | $3,268 | | | $3,407 | |
| Less: Noninterest expense, Underlying (non-GAAP) | D | 980 | | | 960 | | | 1,978 | | | 1,939 | |
| Pre-provision profit, Underlying (non-GAAP) | | $629 | | | $790 | | | $1,290 | | | $1,468 | |
| | | | | | | | |
| | | | | | | | |
| | | | | | | | |
| | | | | | | | |
| Income before income tax expense, Underlying: | | | | | | | | |
| Income before income tax expense (GAAP) | E | $831 | | | $307 | | | $1,612 | | | $352 | |
| Less: Income (loss) before income tax expense (benefit) related to notable items | | (11) | | | (19) | | | (31) | | | (52) | |
| Income before income tax expense, Underlying (non-GAAP) | F | $842 | | | $326 | | | $1,643 | | | $404 | |
| Income tax expense and effective income tax rate, Underlying: | | | | | | | | |
| Income tax expense (GAAP) | G | $183 | | | $54 | | | $353 | | | $65 | |
| Less: Income tax expense (benefit) related to notable items | | (3) | | | (9) | | | (8) | | | (17) | |
| | | | | | | | |
| | | | | | | | |
| | | | | | | | |
| | | | | | | | |
| | | | | | | | |
| | | | | | | | |
| Income tax expense, Underlying (non-GAAP) | H | $186 | | | $54 | | | $361 | | | $82 | |
| Effective income tax rate (GAAP) | G/E | 21.96 | % | | 17.69 | % | | 21.86 | % | | 18.51 | % |
| Effective income tax rate, Underlying (non-GAAP) | H/F | 22.01 | | | 19.36 | | | 21.93 | | | 20.36 | |
| Net income, Underlying: | | | | | | | | |
| Net income (GAAP) | I | $648 | | | $253 | | | $1,259 | | | $287 | |
| Add: Notable items, net of income tax benefit | | 8 | | | 10 | | | 23 | | | 35 | |
| | | | | | | | |
| | | | | | | | |
| | | | | | | | |
| | | | | | | | |
| | | | | | | | |
| | | | | | | | |
| Net income, Underlying (non-GAAP) | J | $656 | | | $253 | | | $1,282 | | | $322 | |
| Net income available to common stockholders, Underlying: | | | | | | | | |
| Net income available to common stockholders (GAAP) | K | 616 | | | 225 | | | $1,204 | | | $237 | |
| Add: Notable items, net of income tax benefit | | 8 | | | 10 | | | 23 | | | 35 | |
| | | | | | | | |
| | | | | | | | |
| | | | | | | | |
| | | | | | | | |
| | | | | | | | |
| | | | | | | | |
| Net income available to common stockholders, Underlying (non-GAAP) | L | $624 | | | $235 | | | $1,227 | | | $272 | |
| Return on average common equity and return on average common equity, Underlying: | | | | | | | | |
| Average common equity (GAAP) | M | $20,833 | | | $20,446 | | | $20,723 | | | $20,335 | |
| Return on average common equity | K/M | 11.85 | % | | 4.44 | % | | 11.71 | % | | 2.35 | % |
Return on average common equity, Underlying (non-GAAP) | L/M | 12.02 | | | 4.63 | | | 11.93 | | | 2.69 | |
| | | | | | | | |
| | | | | | | | |
Citizens Financial Group, Inc. | 47
|
| | | | | | | | | | | | | | | | |
| | | As of and for the Three Months Ended September 30, | | As of and for the Nine Months Ended September 30, |
| (in millions, except share, per share and ratio data) | Ref. | 2020 |
| | 2019 |
| | 2020 |
| | 2019 |
|
| Total revenue, Underlying: | | | | | | | | |
| Total revenue (GAAP) | A |
| $1,791 |
| |
| $1,638 |
| |
| $5,198 |
| |
| $4,854 |
|
| Less: Notable items | | — |
| | — |
| | — |
| | — |
|
| Total revenue, Underlying (non-GAAP) | B |
| $1,791 |
| |
| $1,638 |
| |
| $5,198 |
| |
| $4,854 |
|
| Noninterest expense, Underlying: | | | | | | | | |
| Noninterest expense (GAAP) | C |
| $988 |
| |
| $973 |
| |
| $2,979 |
| |
| $2,861 |
|
| Less: Notable items | | 31 |
| | 19 |
| | 83 |
| | 31 |
|
| Noninterest expense, Underlying (non-GAAP) | D |
| $957 |
| |
| $954 |
| |
| $2,896 |
| |
| $2,830 |
|
| Pre-provision profit: | | | | | | | | |
| Total revenue (GAAP) | A |
| $1,791 |
| |
| $1,638 |
| |
| $5,198 |
| |
| $4,854 |
|
| Less: Noninterest expense (GAAP) | C | 988 |
| | 973 |
| | 2,979 |
| | 2,861 |
|
| Pre-provision profit (GAAP) | |
| $803 |
| |
| $665 |
| |
| $2,219 |
| |
| $1,993 |
|
| Pre-provision profit, Underlying | | | | | | | | |
| Total revenue, Underlying (non-GAAP) | B |
| $1,791 |
| |
| $1,638 |
| |
| $5,198 |
| |
| $4,854 |
|
| Less: Noninterest expense, Underlying (non-GAAP) | D | 957 |
| | 954 |
| | 2,896 |
| | 2,830 |
|
| Pre-provision profit, Underlying (non-GAAP) | |
| $834 |
| |
| $684 |
| |
| $2,302 |
| |
| $2,024 |
|
| Income before income tax expense, Underlying: | | | | | | | | |
| Income before income tax expense (GAAP) | E |
| $375 |
| |
| $564 |
| |
| $727 |
| |
| $1,710 |
|
| Less: Expense before income tax benefit related to notable items | | (31 | ) | | (19 | ) | | (83 | ) | | (31 | ) |
| Income before income tax expense, Underlying (non-GAAP) | F |
| $406 |
| |
| $583 |
| |
| $810 |
| |
| $1,741 |
|
| Income tax expense and effective income tax rate, Underlying: | | | | | | | | |
| Income tax expense (GAAP) | G |
| $61 |
| |
| $115 |
| |
| $126 |
| |
| $369 |
|
| Less: Income tax benefit related to notable items | | (7 | ) | | (15 | ) | | (24 | ) | | (18 | ) |
| Income tax expense, Underlying (non-GAAP) | H |
| $68 |
| |
| $130 |
| |
| $150 |
| |
| $387 |
|
| Effective income tax rate (GAAP) | G/E | 16.10 | % | | 20.46 | % | | 17.27 | % | | 21.58 | % |
| Effective income tax rate, Underlying (non-GAAP) | H/F | 16.79 |
| | 22.29 |
| | 18.57 |
| | 22.20 |
|
| Net income, Underlying: | | | | | | | | |
| Net income (GAAP) | I |
| $314 |
| |
| $449 |
| |
| $601 |
| |
| $1,341 |
|
| Add: Notable items, net of income tax benefit | | 24 |
| | 4 |
| | 59 |
| | 13 |
|
| Net income, Underlying (non-GAAP) | J |
| $338 |
| |
| $453 |
| |
| $660 |
| |
| $1,354 |
|
| Net income available to common stockholders, Underlying: | | | | | | | | |
| Net income available to common stockholders (GAAP) | K | 289 |
| | 432 |
| |
| $526 |
| |
| $1,291 |
|
| Add: Notable items, net of income tax benefit | | 24 |
| | 4 |
| | 59 |
| | 13 |
|
| Net income available to common stockholders, Underlying (non-GAAP) | L |
| $313 |
| |
| $436 |
| |
| $585 |
| |
| $1,304 |
|
| Return on average common equity and return on average common equity, Underlying: | | | | | | | | |
| Average common equity (GAAP) | M |
| $20,534 |
| |
| $20,533 |
| |
| $20,401 |
| |
| $20,300 |
|
| Return on average common equity | K/M | 5.60 | % | | 8.35 | % | | 3.45 | % | | 8.50 | % |
Return on average common equity, Underlying (non-GAAP) | L/M | 6.05 |
| | 8.45 |
| | 3.83 |
| | 8.59 |
|
| | | | | | | | | |
| | | | | | | | | |
| | | | | | | | | | | | | | | | | | | | | | | | | | |
| | | As of and for the Three Months Ended June 30, | | As of and for the Six Months Ended June 30, |
| (in millions, except share, per share and ratio data) | Ref. | 2021 | | 2020 | | 2021 | | 2020 |
| Return on average tangible common equity and return on average tangible common equity, Underlying: | | | | | | | | |
| Average common equity (GAAP) | M | $20,833 | | | $20,446 | | | $20,723 | | | $20,335 | |
| Less: Average goodwill (GAAP) | | 7,050 | | | 7,050 | | | 7,050 | | | 7,048 | |
| Less: Average other intangibles (GAAP) | | 53 | | | 65 | | | 55 | | | 66 | |
| Add: Average deferred tax liabilities related to goodwill (GAAP) | | 381 | | | 375 | | | 380 | | | 374 | |
| Average tangible common equity | N | $14,111 | | | $13,706 | | | $13,998 | | | $13,595 | |
| Return on average tangible common equity | K/N | 17.50 | % | | 6.62 | % | | 17.34 | % | | 3.51 | % |
| Return on average tangible common equity, Underlying (non-GAAP) | L/N | 17.74 | | | 6.90 | | | 17.67 | | | 4.03 | |
| Return on average total assets and return on average total assets, Underlying: | | | | | | | | |
| Average total assets (GAAP) | O | $184,456 | | | $179,793 | | | $183,518 | | | $173,485 | |
| Return on average total assets | I/O | 1.41 | % | | 0.57 | % | | 1.38 | % | | 0.33 | % |
| Return on average total assets, Underlying (non-GAAP) | J/O | 1.43 | | | 0.59 | | | 1.41 | | | 0.37 | |
| Return on average total tangible assets and return on average total tangible assets, Underlying: | | | | | | | | |
| Average total assets (GAAP) | O | $184,456 | | | $179,793 | | | $183,518 | | | $173,485 | |
| Less: Average goodwill (GAAP) | | 7,050 | | | 7,050 | | | 7,050 | | | 7,048 | |
| Less: Average other intangibles (GAAP) | | 53 | | | 65 | | | 55 | | | 66 | |
| Add: Average deferred tax liabilities related to goodwill (GAAP) | | 381 | | | 375 | | | 380 | | | 374 | |
| Average tangible assets | P | $177,734 | | | $173,053 | | | $176,793 | | | $166,745 | |
| Return on average total tangible assets | I/P | 1.46 | % | | 0.59 | % | | 1.44 | % | | 0.35 | % |
| Return on average total tangible assets, Underlying (non-GAAP) | J/P | 1.48 | | | 0.61 | | | 1.46 | | | 0.39 | |
| Efficiency ratio and efficiency ratio, Underlying: | | | | | | | | |
| Efficiency ratio | C/A | 61.63 | % | | 55.91 | % | | 61.49 | % | | 58.43 | % |
| Efficiency ratio, Underlying (non-GAAP) | D/B | 60.92 | | | 54.85 | | | 60.55 | | | 56.91 | |
| Operating leverage and operating leverage, Underlying: | | | | | | | | |
| (Decrease) increase in total revenue | | (8.00) | % | | 7.49 | % | | (4.08) | % | | 5.94 | % |
| Increase in noninterest expense | | 1.42 | | | 2.89 | | | 0.94 | | | 5.46 | |
| Operating leverage | | (9.42) | % | | 4.60 | % | | (5.02 | %) | | 0.48 | % |
| (Decrease) increase in total revenue, Underlying (non-GAAP) | | (8.00) | % | | 7.49 | % | | (4.08) | % | | 5.94 | % |
| Increase in noninterest expense, Underlying (non-GAAP) | | 2.18 | | | 1.62 | | | 2.05 | | | 5.46 | |
| Operating leverage, Underlying (non-GAAP) | | (10.18) | % | | 5.87 | % | | (6.13 | %) | | 2.60 | % |
| Tangible book value per common share: | | | | | | | | |
| Common shares - at period end (GAAP) | Q | 426,083,143 | | | 426,824,594 | | | 426,083,143 | | | 426,824,594 | |
| Common stockholders' equity (GAAP) | | $21,185 | | | $20,453 | | | $21,185 | | | $20,453 | |
| Less: Goodwill (GAAP) | | 7,050 | | | 7,050 | | | 7,050 | | | 7,050 | |
| Less: Other intangible assets (GAAP) | | 52 | | | 63 | | | 52 | | | 63 | |
| Add: Deferred tax liabilities related to goodwill (GAAP) | | 383 | | | 376 | | | 383 | | | 376 | |
| Tangible common equity | R | $14,466 | | | $13,716 | | | $14,466 | | | $13,716 | |
| Tangible book value per common share | R/Q | $33.95 | | | $32.13 | | | $33.95 | | | $32.13 | |
| Net income per average common share - basic and diluted and net income per average common share - basic and diluted, Underlying: | | | | | | | | |
| Average common shares outstanding - basic (GAAP) | S | 425,948,706 | | | 426,613,053 | | | 425,951,197 | | | 427,165,737 | |
| Average common shares outstanding - diluted (GAAP) | T | 427,561,572 | | | 427,566,920 | | | 427,668,242 | | | 428,292,580 | |
| Net income per average common share - basic (GAAP) | K/S | $1.45 | | | $0.53 | | | $2.83 | | | $0.56 | |
| Net income per average common share - diluted (GAAP) | K/T | 1.44 | | | 0.53 | | | 2.81 | | | 0.55 | |
| Net income per average common share - basic, Underlying (non-GAAP) | L/S | 1.47 | | | 0.55 | | | 2.88 | | | 0.64 | |
| Net income per average common share - diluted, Underlying (non-GAAP) | L/T | 1.46 | | | 0.55 | | | 2.87 | | | 0.64 | |
| Dividend payout ratio and dividend payout ratio, Underlying: | | | | | | | | |
| Cash dividends declared and paid per common share | U | $0.39 | | | $0.39 | | | $0.78 | | | $0.78 | |
| Dividend payout ratio | U/(K/S) | 27 | % | | 74 | % | | 28 | % | | 140 | % |
| Dividend payout ratio, Underlying (non-GAAP) | U/(L/S) | 27 | | | 71 | | | 27 | | | 122 | |
Citizens Financial Group, Inc. | 48
|
| | | | | | | | | | | | | | | | |
| | | As of and for the Three Months Ended September 30, | | As of and for the Nine Months Ended September 30, |
| (in millions, except share, per share and ratio data) | Ref. | 2020 |
| | 2019 |
| | 2020 |
| | 2019 |
|
| Return on average tangible common equity and return on average tangible common equity, Underlying: | | | | | | | | |
| Average common equity (GAAP) | M |
| $20,534 |
| |
| $20,533 |
| |
| $20,401 |
| |
| $20,300 |
|
| Less: Average goodwill (GAAP) | | 7,050 |
| | 7,044 |
| | 7,049 |
| | 7,034 |
|
| Less: Average other intangibles (GAAP) | | 62 |
| | 73 |
| | 65 |
| | 71 |
|
| Add: Average deferred tax liabilities related to goodwill (GAAP) | | 375 |
| | 372 |
| | 375 |
| | 371 |
|
| Average tangible common equity | N |
| $13,797 |
| |
| $13,788 |
| |
| $13,662 |
| |
| $13,566 |
|
| Return on average tangible common equity | K/N | 8.33 | % | | 12.44 | % | | 5.15 | % | | 12.72 | % |
| Return on average tangible common equity, Underlying (non-GAAP) | L/N | 9.00 |
| | 12.58 |
| | 5.71 |
| | 12.86 |
|
| Return on average total assets and return on average total assets, Underlying: | | | | | | | | |
| Average total assets (GAAP) | O |
| $177,675 |
| |
| $162,110 |
| |
| $174,892 |
| |
| $161,344 |
|
| Return on average total assets | I/O | 0.70 | % | | 1.10 | % | | 0.46 | % | | 1.11 | % |
| Return on average total assets, Underlying (non-GAAP) | J/O | 0.76 |
| | 1.11 |
| | 0.50 |
| | 1.12 |
|
| Return on average total tangible assets and return on average total tangible assets, Underlying: | | | | | | | | |
| Average total assets (GAAP) | O |
| $177,675 |
| |
| $162,110 |
| |
| $174,892 |
| |
| $161,344 |
|
| Less: Average goodwill (GAAP) | | 7,050 |
| | 7,044 |
| | 7,049 |
| | 7,034 |
|
| Less: Average other intangibles (GAAP) | | 62 |
| | 73 |
| | 65 |
| | 71 |
|
| Add: Average deferred tax liabilities related to goodwill (GAAP) | | 375 |
| | 372 |
| | 375 |
| | 371 |
|
| Average tangible assets | P |
| $170,938 |
| |
| $155,365 |
| |
| $168,153 |
| |
| $154,610 |
|
| Return on average total tangible assets | I/P | 0.73 | % | | 1.15 | % | | 0.48 | % | | 1.16 | % |
| Return on average total tangible assets, Underlying (non-GAAP) | J/P | 0.79 |
| | 1.16 |
| | 0.52 |
| | 1.17 |
|
| Efficiency ratio and efficiency ratio, Underlying: | | | | | | | | |
| Efficiency ratio | C/A | 55.18 | % | | 59.40 | % | | 57.31 | % | | 58.94 | % |
| Efficiency ratio, Underlying (non-GAAP) | D/B | 53.44 |
| | 58.22 |
| | 55.72 |
| | 58.30 |
|
| Operating leverage and operating leverage, Underlying: | | | | | | | | |
| Increase in total revenue | | 9.29 | % | | 4.72 | % | | 7.07 | % | | 7.03 | % |
| Increase in noninterest expense | | 1.52 |
| | 6.88 |
| | 4.12 |
| | 7.21 |
|
| Operating leverage | | 7.77 | % | | (2.16 | )% | | 2.95 | % | | (0.18 | )% |
| Increase in total revenue, Underlying (non-GAAP) | | 9.29 | % | | 4.70 | % | | 7.07 | % | | 7.03 | % |
| Increase in noninterest expense, Underlying (non-GAAP) | | 0.32 |
| | 5.78 |
| | 2.32 |
| | 6.41 |
|
| Operating leverage, Underlying (non-GAAP) | | 8.97 | % | | (1.08 | )% | | 4.75 | % | | 0.62 | % |
| Tangible book value per common share: | | | | | | | | |
| Common shares - at period end (GAAP) | Q | 427,073,084 |
| | 443,913,525 |
| | 427,073,084 |
| | 443,913,525 |
|
| Common stockholders' equity (GAAP) | |
| $20,504 |
| |
| $20,718 |
| |
| $20,504 |
| |
| $20,718 |
|
| Less: Goodwill (GAAP) | | 7,050 |
| | 7,044 |
| | 7,050 |
| | 7,044 |
|
| Less: Other intangible assets (GAAP) | | 60 |
| | 71 |
| | 60 |
| | 71 |
|
| Add: Deferred tax liabilities related to goodwill (GAAP) | | 377 |
| | 373 |
| | 377 |
| | 373 |
|
| Tangible common equity | R |
| $13,771 |
| |
| $13,976 |
| |
| $13,771 |
| |
| $13,976 |
|
| Tangible book value per common share | R/Q |
| $32.24 |
| |
| $31.48 |
| |
| $32.24 |
| |
| $31.48 |
|
| Net income per average common share - basic and diluted and net income per average common share - basic and diluted, Underlying: | | | | | | | | |
| Average common shares outstanding - basic (GAAP) | S | 426,846,096 |
| | 445,703,987 |
| | 427,058,412 |
| | 454,802,186 |
|
| Average common shares outstanding - diluted (GAAP) | T | 427,992,349 |
| | 447,134,595 |
| | 428,142,358 |
| | 456,218,755 |
|
| Net income per average common share - basic (GAAP) | K/S |
| $0.68 |
| |
| $0.97 |
| |
| $1.23 |
| |
| $2.84 |
|
| Net income per average common share - diluted (GAAP) | K/T | 0.68 |
| | 0.97 |
| | 1.23 |
| | 2.83 |
|
| Net income per average common share - basic, Underlying (non-GAAP) | L/S | 0.73 |
| | 0.98 |
| | 1.37 |
| | 2.87 |
|
| Net income per average common share - diluted, Underlying (non-GAAP) | L/T | 0.73 |
| | 0.98 |
| | 1.37 |
| | 2.86 |
|
| Dividend payout ratio and dividend payout ratio, Underlying: | | | | | | | | |
| Cash dividends declared and paid per common share | U |
| $0.39 |
| |
| $0.36 |
| |
| $1.17 |
| |
| $1.00 |
|
| Dividend payout ratio | U/(K/S) | 58 | % | | 37 | % | | 95 | % | | 35 | % |
| Dividend payout ratio, Underlying (non-GAAP) | U/(L/S) | 53 |
| | 37 |
| | 85 |
| | 35 |
|
The following table presents computations of non-GAAP financial measures representing certain metrics excluding the impact of PPP loans used throughout the MD&A:
| | | | | | | | | | | | | | |
| Table 34: Reconciliations of Non-GAAP Measures - Excluding PPP | | | | |
| (in millions, except share, per share and ratio data) | Ref. | June 30, 2021 | | December 31, 2020 |
| Allowance for credit losses to total loans and leases, excluding the impact of PPP loans: | | | | |
| Total loans and leases (GAAP) | A | $122,581 | | | $123,090 | |
| Less: PPP loans | | 3,479 | | | 4,155 | |
| Total loans and leases, excluding the impact of PPP loans (non-GAAP) | B | $119,102 | | | $118,935 | |
| Allowance for credit losses (GAAP) | C | $2,081 | | | $2,670 | |
| Allowance for credit losses to total loans and leases (GAAP) | C/A | 1.70 | % | | 2.17 | % |
| Allowance for credit losses to total loans and leases, excluding the impact of PPP loans (non-GAAP) | C/B | 1.75 | % | | 2.24 | % |
| | | | |
| | | | |
| | | | |
| | | | |
| | | | |
| | | | |
| | | | |
| | | | |
| | | | |
The following table presents computations of non-GAAP financial measures representing certain metrics
excluding the impact of elevated cash levels used in “—Net Interest Income”:
| | | | | | | | | | | | | | | | | | | | |
| Table 35: Reconciliations of Non-GAAP Measures - Excluding Elevated Cash | | | |
| | As of and for the Three Months Ended June 30, | | As of and for the Six Months Ended June 30, |
| (in millions, except ratio data) | Ref. | 2021 | 2020 | | 2021 | 2020 |
| Net interest income, FTE, excluding the impact of elevated cash: | | | | | | |
| Net interest income, FTE (GAAP) | A | $1,126 | | $1,163 | | | $2,246 | | $2,327 | |
| Less: Net interest income associated with elevated cash | | — | | — | | | — | | — | |
| Net interest income, FTE, excluding the impact of elevated cash (non-GAAP) | B | $1,126 | | $1,163 | | | $2,246 | | $2,327 | |
| Average interest-earning assets, excluding the impact of elevated cash: | | | | | | |
| Total interest-earning assets (GAAP) | C | $166,333 | | $162,390 | | | $165,433 | | $156,668 | |
| Less: Elevated cash | | 9,363 | | 3,416 | | | 9,175 | | 1,707 | |
| Total average interest-earning assets, excluding the impact of elevated cash (non-GAAP) | D | $156,970 | | $158,974 | | | $156,258 | | $154,961 | |
| Day count | E | 91 | | 91 | | | 181 | | 182 | |
| Day count (year) | F | 365 | | 366 | | | 365 | | 366 | |
| Ratios: | | | | | | |
| Net interest margin, FTE (GAAP) | A / C / E * F | 2.72 | % | 2.88 | % | | 2.74 | % | 2.99 | % |
| Net interest margin, FTE, excluding the impact of elevated cash (non-GAAP) | B / D / E * F | 2.88 | % | 2.94 | % | | 2.90 | % | 3.02 | % |
Citizens Financial Group, Inc. | 49
|
| | | | | | | | |
| (in millions, except share, per share and ratio data) | Ref. | September 30, 2020 | | December 31, 2019 |
| Allowance for credit losses to total loans and leases, excluding the impact of PPP loans: | | | | |
| Total loans and leases (GAAP) | A |
| $124,071 |
| |
| $119,088 |
|
| Less: PPP loans | | 4,653 |
| | — |
|
| Total loans and leases, excluding the impact of PPP loans (non-GAAP) | B |
| $119,418 |
| |
| $119,088 |
|
| Allowance for credit losses (GAAP) | C |
| $2,736 |
| |
| $1,296 |
|
| Allowance for credit losses to total loans and leases (GAAP) | C/A | 2.21 | % | | 1.09 | % |
| Allowance for credit losses to total loans and leases, excluding the impact of PPP loans (non-GAAP) | C/B | 2.29 | % | | 1.09 | % |
ITEM 1. FINANCIAL STATEMENTS
Citizens Financial Group, Inc. | 50
CONSOLIDATED BALANCE SHEETS (UNAUDITED)
| | | (in millions, except share data) | September 30, 2020 | | December 31, 2019 | (in millions, except share data) | June 30, 2021 | | December 31, 2020 |
| ASSETS: | | | | ASSETS: | | | |
| Cash and due from banks |
| $904 |
| |
| $1,175 |
| Cash and due from banks | $1,035 | | | $1,037 | |
| Interest-bearing cash and due from banks | 8,312 |
| | 2,211 |
| Interest-bearing cash and due from banks | 11,606 | | | 11,696 | |
| Interest-bearing deposits in banks | 328 |
| | 297 |
| Interest-bearing deposits in banks | 401 | | | 306 | |
Debt securities available for sale, at fair value (including $577 and $359 pledged to creditors, respectively)(1) | 22,884 |
| | 20,613 |
| |
Debt securities held to maturity (fair value of $2,709 and $3,242 respectively, and including $159 and $249 pledged to creditors, respectively)(1) | 2,578 |
| | 3,202 |
| |
| Equity investment securities, at fair value | 57 |
| | 47 |
| |
| Equity investment securities, at cost | 605 |
| | 807 |
| |
Debt securities available for sale, at fair value (including $568 and $549 pledged to creditors, respectively)(1) | | Debt securities available for sale, at fair value (including $568 and $549 pledged to creditors, respectively)(1) | 24,583 | | | 22,942 | |
Debt securities held to maturity (fair value of $2,790 and $3,357 respectively, and including $124 and $144 pledged to creditors, respectively)(1) | | Debt securities held to maturity (fair value of $2,790 and $3,357 respectively, and including $124 and $144 pledged to creditors, respectively)(1) | 2,711 | | | 3,235 | |
| Loans held for sale, at fair value | 3,587 |
| | 1,946 |
| Loans held for sale, at fair value | 3,616 | | | 3,564 | |
| Other loans held for sale | 127 |
| | 1,384 |
| Other loans held for sale | 82 | | | 439 | |
| Loans and leases | 124,071 |
| | 119,088 |
| Loans and leases | 122,581 | | | 123,090 | |
| Less: Allowance for loan and lease losses | (2,542 | ) | | (1,252 | ) | Less: Allowance for loan and lease losses | (1,947) | | | (2,443) | |
| Net loans and leases | 121,529 |
| | 117,836 |
| Net loans and leases | 120,634 | | | 120,647 | |
| Derivative assets | 2,030 |
| | 807 |
| Derivative assets | 1,655 | | | 1,915 | |
| Premises and equipment, net | 747 |
| | 761 |
| Premises and equipment, net | 735 | | | 759 | |
| Bank-owned life insurance | 1,751 |
| | 1,725 |
| Bank-owned life insurance | 2,268 | | | 1,756 | |
| Goodwill | 7,050 |
| | 7,044 |
| Goodwill | 7,050 | | | 7,050 | |
| Other assets | 6,739 |
| | 5,878 |
| Other assets | 8,728 | | | 8,003 | |
| TOTAL ASSETS |
| $179,228 |
| |
| $165,733 |
| TOTAL ASSETS | $185,104 | | | $183,349 | |
| LIABILITIES AND STOCKHOLDERS’ EQUITY: | | | | LIABILITIES AND STOCKHOLDERS’ EQUITY: | |
| LIABILITIES: | | | | LIABILITIES: | |
| Deposits: | | | | Deposits: | |
| Noninterest-bearing |
| $41,249 |
| |
| $29,233 |
| Noninterest-bearing | $47,480 | | | $43,831 | |
| Interest-bearing | 101,672 |
| | 96,080 |
| Interest-bearing | 103,156 | | | 103,333 | |
| Total deposits | 142,921 |
| | 125,313 |
| Total deposits | 150,636 | | | 147,164 | |
| Short-term borrowed funds | 252 |
| | 274 |
| Short-term borrowed funds | 62 | | | 243 | |
| Derivative liabilities | 100 |
| | 120 |
| Derivative liabilities | 144 | | | 128 | |
| Deferred taxes, net | 638 |
| | 866 |
| Deferred taxes, net | 720 | | | 629 | |
| Long-term borrowed funds | 9,109 |
| | 14,047 |
| Long-term borrowed funds | 6,957 | | | 8,346 | |
| Other liabilities | 3,739 |
| | 2,912 |
| Other liabilities | 3,386 | | | 4,166 | |
| TOTAL LIABILITIES | 156,759 |
| | 143,532 |
| TOTAL LIABILITIES | 161,905 | | | 160,676 | |
| Contingencies (refer to Note 12) |
|
| |
|
| |
| Contingencies (refer to Note 11) | | Contingencies (refer to Note 11) | 0 | | 0 |
| STOCKHOLDERS’ EQUITY: | | | | STOCKHOLDERS’ EQUITY: | |
| Preferred stock: | | | | Preferred stock: | |
| $25.00 par value,100,000,000 shares authorized; 2,000,000 and 1,600,000 shares issued and outstanding at September 30, 2020 and December 31, 2019, respectively | 1,965 |
| | 1,570 |
| |
| $25.00 par value,100,000,000 shares authorized; 2,050,000 and 2,000,000 shares issued and outstanding at June 30, 2021 and December 31, 2020, respectively | | $25.00 par value,100,000,000 shares authorized; 2,050,000 and 2,000,000 shares issued and outstanding at June 30, 2021 and December 31, 2020, respectively | 2,014 | | | 1,965 | |
| Common stock: | | | | Common stock: | |
| $0.01 par value, 1,000,000,000 shares authorized; 569,739,386 shares issued and 427,073,084 shares outstanding at September 30, 2020 and 568,238,730 shares issued and 433,121,083 shares outstanding at December 31, 2019 | 6 |
| | 6 |
| |
| $0.01 par value, 1,000,000,000 shares authorized; 570,994,369 shares issued and 426,083,143 shares outstanding at June 30, 2021 and 569,876,133 shares issued and 427,209,831 shares outstanding at December 31, 2020 | | $0.01 par value, 1,000,000,000 shares authorized; 570,994,369 shares issued and 426,083,143 shares outstanding at June 30, 2021 and 569,876,133 shares issued and 427,209,831 shares outstanding at December 31, 2020 | 6 | | | 6 | |
| Additional paid-in capital | 18,922 |
| | 18,891 |
| Additional paid-in capital | 18,964 | | | 18,940 | |
| Retained earnings | 6,189 |
| | 6,498 |
| Retained earnings | 7,314 | | | 6,445 | |
| Treasury stock, at cost, 142,666,302 and 135,117,647 shares at September 30, 2020 and December 31, 2019, respectively | (4,623 | ) | | (4,353 | ) | |
| Treasury stock, at cost, 144,911,226 and 142,666,302 shares at June 30, 2021 and December 31, 2020, respectively | | Treasury stock, at cost, 144,911,226 and 142,666,302 shares at June 30, 2021 and December 31, 2020, respectively | (4,718) | | | (4,623) | |
| Accumulated other comprehensive income (loss) | 10 |
| | (411 | ) | Accumulated other comprehensive income (loss) | (381) | | | (60) | |
| TOTAL STOCKHOLDERS’ EQUITY |
| $22,469 |
| |
| $22,201 |
| TOTAL STOCKHOLDERS’ EQUITY | $23,199 | | | $22,673 | |
| TOTAL LIABILITIES AND STOCKHOLDERS’ EQUITY |
| $179,228 |
| |
| $165,733 |
| TOTAL LIABILITIES AND STOCKHOLDERS’ EQUITY | $185,104 | | | $183,349 | |
(1) Includes only collateral pledged by the Company where counterparties have the right to sell or pledge the collateral.
The accompanying Notes to Consolidated Financial Statements are an integral part of these statements.
Citizens Financial Group, Inc. | 51
CONSOLIDATED STATEMENTS OF OPERATIONS (UNAUDITED)
| | | | | | | | | | | | | | | | | | | | | | | |
| Three Months Ended June 30, | | Six Months Ended June 30, |
| (in millions, except share and per share data) | 2021 | | 2020 | | 2021 | | 2020 |
| INTEREST INCOME: | | | | | | | |
| Interest and fees on loans and leases | $1,058 | | | $1,192 | | | $2,119 | | | $2,494 | |
| Interest and fees on loans held for sale, at fair value | 24 | | | 20 | | | 42 | | | 35 | |
| Interest and fees on other loans held for sale | 2 | | | 7 | | | 8 | | | 16 | |
| Investment securities | 124 | | | 130 | | | 252 | | | 277 | |
| Interest-bearing deposits in banks | 3 | | | 1 | | | 6 | | | 6 | |
| Total interest income | 1,211 | | | 1,350 | | | 2,427 | | | 2,828 | |
| INTEREST EXPENSE: | | | | | | | |
| Deposits | 42 | | | 124 | | | 92 | | | 351 | |
| Short-term borrowed funds | 0 | | | 0 | | | 0 | | | 1 | |
| Long-term borrowed funds | 45 | | | 66 | | | 94 | | | 156 | |
| Total interest expense | 87 | | | 190 | | | 186 | | | 508 | |
| Net interest income | 1,124 | | | 1,160 | | | 2,241 | | | 2,320 | |
| Provision for credit losses | (213) | | | 464 | | | (353) | | | 1,064 | |
| Net interest income after provision for credit losses | 1,337 | | | 696 | | | 2,594 | | | 1,256 | |
| NONINTEREST INCOME: | | | | | | | |
| Mortgage banking fees | 85 | | | 276 | | | 250 | | | 435 | |
| Service charges and fees | 100 | | | 84 | | | 199 | | | 202 | |
| Capital markets fees | 91 | | | 61 | | | 172 | | | 104 | |
| Card fees | 64 | | | 48 | | | 119 | | | 104 | |
| Trust and investment services fees | 60 | | | 45 | | | 118 | | | 98 | |
| Letter of credit and loan fees | 38 | | | 31 | | | 76 | | | 65 | |
| Foreign exchange and interest rate products | 28 | | | 34 | | | 56 | | | 58 | |
| Securities gains, net | 3 | | | 3 | | | 6 | | | 3 | |
| | | | | | | |
| Other income | 16 | | | 8 | | | 31 | | | 18 | |
| Total noninterest income | 485 | | | 590 | | | 1,027 | | | 1,087 | |
| NONINTEREST EXPENSE: | | | | | | | |
| Salaries and employee benefits | 524 | | | 513 | | | 1,072 | | | 1,062 | |
| Equipment and software | 155 | | | 142 | | | 307 | | | 275 | |
| Outside services | 137 | | | 131 | | | 276 | | | 266 | |
| Occupancy | 82 | | | 82 | | | 170 | | | 166 | |
| Other operating expense | 93 | | | 111 | | | 184 | | | 222 | |
| Total noninterest expense | 991 | | | 979 | | | 2,009 | | | 1,991 | |
| Income before income tax expense | 831 | | | 307 | | | 1,612 | | | 352 | |
| Income tax expense | 183 | | | 54 | | | 353 | | | 65 | |
| NET INCOME | $648 | | | $253 | | | $1,259 | | | $287 | |
| Net income available to common stockholders | $616 | | | $225 | | | $1,204 | | | $237 | |
| Weighted-average common shares outstanding: | | | | | | | |
| Basic | 425,948,706 | | | 426,613,053 | | | 425,951,197 | | | 427,165,737 | |
| Diluted | 427,561,572 | | | 427,566,920 | | | 427,668,242 | | | 428,292,580 | |
| Per common share information: | | | | | | | |
| Basic earnings | $1.45 | | | $0.53 | | | $2.83 | | | $0.56 | |
| Diluted earnings | 1.44 | | | 0.53 | | | 2.81 | | | 0.55 | |
|
| | | | | | | | | | | | | | | |
| | Three Months Ended September 30, | | Nine Months Ended September 30, |
| (in millions, except share and per share data) | 2020 |
| | 2019 |
| | 2020 |
| | 2019 |
|
| INTEREST INCOME: | | | | | | | |
| Interest and fees on loans and leases |
| $1,120 |
| |
| $1,356 |
| |
| $3,614 |
| |
| $4,129 |
|
| Interest and fees on loans held for sale, at fair value | 21 |
| | 19 |
| | 56 |
| | 45 |
|
| Interest and fees on other loans held for sale | 16 |
| | 2 |
| | 32 |
| | 8 |
|
| Investment securities | 121 |
| | 153 |
| | 398 |
| | 483 |
|
| Interest-bearing deposits in banks | 2 |
| | 8 |
| | 8 |
| | 23 |
|
| Total interest income | 1,280 |
| | 1,538 |
| | 4,108 |
| | 4,688 |
|
| INTEREST EXPENSE: | | | | | | | |
| Deposits | 89 |
| | 297 |
| | 440 |
| | 892 |
|
| Short-term borrowed funds | 0 |
| | 2 |
| | 1 |
| | 8 |
|
| Long-term borrowed funds | 54 |
| | 94 |
| | 210 |
| | 317 |
|
| Total interest expense | 143 |
| | 393 |
| | 651 |
| | 1,217 |
|
| Net interest income | 1,137 |
| | 1,145 |
| | 3,457 |
| | 3,471 |
|
| Provision for credit losses | 428 |
| | 101 |
| | 1,492 |
| | 283 |
|
| Net interest income after provision for credit losses | 709 |
| | 1,044 |
| | 1,965 |
| | 3,188 |
|
| NONINTEREST INCOME: | | | | | | | |
| Service charges and fees | 97 |
| | 128 |
| | 299 |
| | 377 |
|
| Mortgage banking fees | 287 |
| | 117 |
| | 722 |
| | 222 |
|
| Card fees | 57 |
| | 67 |
| | 161 |
| | 190 |
|
| Capital markets fees | 58 |
| | 39 |
| | 162 |
| | 150 |
|
| Trust and investment services fees | 53 |
| | 50 |
| | 151 |
| | 150 |
|
| Foreign exchange and interest rate products | 27 |
| | 35 |
| | 85 |
| | 106 |
|
| Letter of credit and loan fees | 37 |
| | 34 |
| | 102 |
| | 100 |
|
| Securities gains, net | 1 |
| | 3 |
| | 4 |
| | 15 |
|
| Net impairment losses recognized in earnings on debt securities | 0 |
| | (1 | ) | | 0 |
| | (2 | ) |
| Other income | 37 |
| | 21 |
| | 55 |
| | 75 |
|
| Total noninterest income | 654 |
| | 493 |
| | 1,741 |
| | 1,383 |
|
| NONINTEREST EXPENSE: | | | | | | | |
| Salaries and employee benefits | 524 |
| | 508 |
| | 1,586 |
| | 1,524 |
|
| Equipment and software expense | 149 |
| | 130 |
| | 424 |
| | 381 |
|
| Outside services | 139 |
| | 128 |
| | 405 |
| | 356 |
|
| Occupancy | 81 |
| | 80 |
| | 247 |
| | 245 |
|
| Other operating expense | 95 |
| | 127 |
| | 317 |
| | 355 |
|
| Total noninterest expense | 988 |
| | 973 |
| | 2,979 |
| | 2,861 |
|
| Income before income tax expense | 375 |
| | 564 |
| | 727 |
| | 1,710 |
|
| Income tax expense | 61 |
| | 115 |
| | 126 |
| | 369 |
|
| NET INCOME |
| $314 |
| |
| $449 |
| |
| $601 |
| |
| $1,341 |
|
| Net income available to common stockholders |
| $289 |
| |
| $432 |
| |
| $526 |
| |
| $1,291 |
|
| Weighted-average common shares outstanding: | | | | | | | |
| Basic | 426,846,096 |
| | 445,703,987 |
| | 427,058,412 |
| | 454,802,186 |
|
| Diluted | 427,992,349 |
| | 447,134,595 |
| | 428,142,358 |
| | 456,218,755 |
|
| Per common share information: | | | | | | | |
| Basic earnings |
| $0.68 |
| |
| $0.97 |
| |
| $1.23 |
| |
| $2.84 |
|
| Diluted earnings | 0.68 |
| | 0.97 |
| | 1.23 |
| | 2.83 |
|
The accompanying Notes to unaudited interim Consolidated Financial Statements are an integral part of these statements.
Citizens Financial Group, Inc. | 52
CONSOLIDATED STATEMENTS OF COMPREHENSIVE INCOME (UNAUDITED)
| | | | | | | | | | | | | | | | | | | | | | | |
| Three Months Ended June 30, | | Six Months Ended June 30, |
| (in millions) | 2021 | | 2020 | | 2021 | | 2020 |
| Net income | $648 | | | $253 | | | $1,259 | | | $287 | |
| Other comprehensive income (loss): | | | | | | | |
| Net unrealized derivative instruments gains (losses) arising during the periods, net of income taxes of $16, $(3), $9 and $30, respectively | 46 | | | (8) | | | 25 | | | 88 | |
| Reclassification of net derivative (gains) losses included in net income, net of income taxes of $(10), $(11), $(19) and $(12), respectively | (27) | | | (34) | | | (52) | | | (37) | |
| Net unrealized debt securities gains (losses) arising during the periods, net of income taxes of $3, $16, $(97) and $145, respectively | 10 | | | 49 | | | (297) | | | 449 | |
| Reclassification of net debt securities (gains) losses to net income, net of income taxes of $0, $(1), $(1) and $(1), respectively | (3) | | | (2) | | | (5) | | | (2) | |
| Amortization of actuarial loss, net of income taxes of $1, $0, $1 and $1, respectively | 4 | | | 4 | | | 8 | | | 7 | |
| Total other comprehensive income (loss), net of income taxes | 30 | | | 9 | | | (321) | | | 505 | |
| Total comprehensive income (loss) | $678 | | | $262 | | | $938 | | | $792 | |
|
| | | | | | | | | | | | | | | |
| | Three Months Ended September 30, | | Nine Months Ended September 30, |
| (in millions) | 2020 |
| | 2019 |
| | 2020 |
| | 2019 |
|
| Net income |
| $314 |
| |
| $449 |
| |
| $601 |
| |
| $1,341 |
|
| Other comprehensive income (loss): | | | | | | | |
| Net unrealized derivative instruments (losses) gains arising during the periods, net of income taxes of $0, ($1), $30 and $35, respectively | 0 |
| | (4 | ) | | 88 |
| | 103 |
|
| Reclassification adjustment for net derivative (gains) losses included in net income, net of income taxes of ($15), $4, ($27) and $13, respectively | (42 | ) | | 10 |
| | (79 | ) | | 40 |
|
| Net unrealized debt securities (losses) gains arising during the periods, net of income taxes of ($14), $13, $131 and $165, respectively | (44 | ) | | 42 |
| | 405 |
| | 509 |
|
| Other-than-temporary impairment not recognized in earnings on debt securities, net of income taxes of $0, $0, $0 and $0, respectively | 0 |
| | (1 | ) | | 0 |
| | 0 |
|
| Reclassification of net debt securities gains to net income, net of income taxes of $0, $0, ($1) and ($3), respectively | (1 | ) | | (2 | ) | | (3 | ) | | (10 | ) |
| Amortization of actuarial loss, net of income taxes of $1, $2, $2 and $5, respectively | 3 |
| | 3 |
| | 10 |
| | 9 |
|
| Total other comprehensive income, net of income taxes | (84 | ) | | 48 |
| | 421 |
| | 651 |
|
| Total comprehensive income |
| $230 |
| |
| $497 |
| |
| $1,022 |
| |
| $1,992 |
|
The accompanying Notes to unaudited interim Consolidated Financial Statements are an integral part of these statements.
Citizens Financial Group, Inc. | 53
CONSOLIDATED STATEMENTS OF CHANGES IN STOCKHOLDERS’ EQUITY (UNAUDITED)
| | | | | | | | | | | | | | | | | | | | | | | | | | | | | | | | |
| Preferred
Stock | | Common
Stock | Additional Paid-in Capital | Retained Earnings | Treasury Stock, at Cost | Accumulated Other Comprehensive Income (Loss) | Total |
| (in millions) | Shares | Amount | | Shares | Amount |
| Balance at April 1, 2020 | 2 | | $1,570 | | | 427 | | $6 | | $18,901 | | $6,011 | | ($4,623) | | $85 | | $21,950 | |
| Dividends to common stockholders | — | | — | | | — | | — | | — | | (168) | | — | | — | | (168) | |
| Dividends to preferred stockholders | — | | — | | | — | | — | | — | | (28) | | — | | — | | (28) | |
| Preferred stock issued | — | | 395 | | | — | | — | | — | | — | | — | | — | | 395 | |
| Treasury stock purchased | — | | — | | | — | | — | | — | | — | | — | | — | | 0 | |
| Share-based compensation plans | — | | — | | | — | | — | | 1 | | — | | — | | — | | 1 | |
| Employee stock purchase plan purchased | — | | — | | | — | | — | | 6 | | — | | — | | — | | 6 | |
| | | | | | | | | | |
| Total comprehensive income (loss): | | | | | | | | | | |
| Net income | — | | — | | | — | | — | | — | | 253 | | — | | — | | 253 | |
| Other comprehensive income (loss) | — | | — | | | — | | — | | — | | — | | — | | 9 | | 9 | |
| Total comprehensive income (loss) | — | | — | | | — | | — | | — | | 253 | | — | | 9 | | 262 | |
| Balance at June 30, 2020 | 2 | | $1,965 | | | 427 | | $6 | | $18,908 | | $6,068 | | ($4,623) | | $94 | | $22,418 | |
| Balance at April 1, 2021 | 2 | | $1,965 | | | 426 | | $6 | | $18,945 | | $6,866 | | ($4,718) | | ($411) | | $22,653 | |
| Dividends to common stockholders | — | | — | | | — | | — | | — | | (168) | | — | | — | | (168) | |
| Dividends to preferred stockholders | — | | — | | | — | | — | | — | | (32) | | — | | — | | (32) | |
| Preferred stock issued | — | | 296 | | | — | | — | | — | | — | | — | | — | | 296 | |
| | | | | | | | | | |
| Preferred stock called | — | | (247) | | | — | | — | | — | | — | | — | | — | | (247) | |
| Share-based compensation plans | — | | — | | | — | | — | | 13 | | — | | — | | — | | 13 | |
| Employee stock purchase plan purchased | — | | — | | | — | | — | | 6 | | — | | — | | — | | 6 | |
| | | | | | | | | | |
| Total comprehensive income (loss): | | | | | | | | | | |
| Net income | — | | — | | | — | | — | | — | | 648 | | — | | — | | 648 | |
| Other comprehensive income (loss) | — | | — | | | — | | — | | — | | — | | — | | 30 | | 30 | |
| Total comprehensive income (loss) | — | | — | | | — | | — | | — | | 648 | | — | | 30 | | 678 | |
| Balance at Balance at June 30, 2021 | 2 | | $2,014 | | | 426 | | $6 | | $18,964 | | $7,314 | | ($4,718) | | ($381) | | $23,199 | |
|
| | | | | | | | | | | | | | | | | | | | | | | | | | |
| | Preferred Stock | | Common Stock | Additional Paid-in Capital | Retained Earnings | Treasury Stock, at Cost | Accumulated Other Comprehensive Income (Loss) | Total |
| (in millions) | Shares | Amount | | Shares | Amount |
| Balance at Balance at July 1, 2019 | 1 |
|
| $1,133 |
| | 458 |
|
| $6 |
|
| $18,860 |
|
| $5,959 |
|
| ($3,453 | ) |
| ($488 | ) |
| $22,017 |
|
| Dividends to common stockholders | — |
| — |
| | — |
| — |
| — |
| (162 | ) | — |
| — |
| (162 | ) |
| Dividends to preferred stockholders | — |
| — |
| | — |
| — |
| — |
| (17 | ) | — |
| — |
| (17 | ) |
| Treasury stock purchased | — |
| — |
| | (14 | ) | — |
| — |
| — |
| (500 | ) | — |
| (500 | ) |
| Share-based compensation plans | — |
| — |
| | 0 |
| — |
| 11 |
| — |
| 0 |
| — |
| 11 |
|
| Employee stock purchase plan shares purchased | — |
| — |
| | — |
| — |
| 5 |
| — |
| — |
| — |
| 5 |
|
| Total comprehensive income: | | | | | | | | | | |
| Net income | — |
| — |
| | — |
| — |
| — |
| 449 |
| — |
| — |
| 449 |
|
| Other comprehensive loss | — |
| — |
| | — |
| — |
| — |
| — |
| — |
| 48 |
| 48 |
|
| Total comprehensive income | — |
| — |
| | — |
| — |
| — |
| 449 |
| — |
| 48 |
| 497 |
|
| Balance at September 30, 2019 | 1 |
|
| $1,133 |
| | 444 |
|
| $6 |
|
| $18,876 |
|
| $6,229 |
|
| ($3,953 | ) |
| ($440 | ) |
| $21,851 |
|
| Balance at July 1, 2020 | 2 |
|
| $1,965 |
| | 427 |
|
| $6 |
|
| $18,908 |
|
| $6,068 |
|
| ($4,623 | ) |
| $94 |
|
| $22,418 |
|
| Dividends to common stockholders | — |
| — |
| | — |
| — |
| — |
| (168 | ) | — |
| — |
| (168 | ) |
| Dividends to preferred stockholders | — |
| — |
| | — |
| — |
| — |
| (25 | ) | — |
| — |
| (25 | ) |
| Preferred stock issued | 0 |
| 0 |
| | — |
| — |
| — |
| — |
| — |
| — |
| 0 |
|
| Treasury stock purchased | — |
| — |
| | 0 |
| — |
| — |
| — |
| 0 |
| — |
| 0 |
|
| Share-based compensation plans | — |
| — |
| | 0 |
| — |
| 10 |
| — |
| 0 |
| — |
| 10 |
|
| Employee stock purchase plan shares purchased | — |
| — |
| | — |
| — |
| 4 |
| — |
| — |
| — |
| 4 |
|
| Total comprehensive income: | | | | | | | | | | |
| Net income | — |
| — |
| | — |
| — |
| — |
| 314 |
| — |
| — |
| 314 |
|
| Other comprehensive income | — |
| — |
| | — |
| — |
| — |
| — |
| — |
| (84 | ) | (84 | ) |
| Total comprehensive income | — |
| — |
| | — |
| — |
| — |
| 314 |
| — |
| (84 | ) | 230 |
|
| Balance at September 30, 2020 | 2 |
|
| $1,965 |
| | 427 |
|
| $6 |
|
| $18,922 |
|
| $6,189 |
|
| ($4,623 | ) |
| $10 |
|
| $22,469 |
|
The accompanying Notes to unaudited interim Consolidated Financial Statements are an integral part of these statements.
Citizens Financial Group, Inc. | 54
CONSOLIDATED STATEMENTS OF CHANGES IN STOCKHOLDERS’ EQUITY (UNAUDITED) | | | | | | | | | | | | | | | | | | | | | | | | | | | | | | | | |
| Preferred
Stock | | Common
Stock | Additional Paid-in Capital | Retained Earnings | Treasury Stock, at Cost | Accumulated Other Comprehensive Income (Loss) | Total |
| (in millions) | Shares | Amount | | Shares | Amount |
| Balance at January 1, 2020 | 2 | | 1,570 | | | 433 | | 6 | | 18,891 | | 6,498 | | (4,353) | | (411) | | 22,201 | |
| Dividends to common stockholders | — | | — | | | — | | — | | — | | (336) | | — | | — | | (336) | |
| Dividends to preferred stockholders | — | | — | | | — | | — | | — | | (50) | | — | | — | | (50) | |
| Preferred stock issued | — | | 395 | | | — | | — | | — | | — | | — | | — | | 395 | |
| Treasury stock purchased | — | | — | | | (7) | | — | | — | | — | | (270) | | — | | (270) | |
| Share-based compensation plans | — | | — | | | 1 | | — | | 7 | | — | | 0 | | — | | 7 | |
| Employee stock purchase plan purchased | — | | — | | | — | | — | | 10 | | — | | — | | — | | 10 | |
| Cumulative effect of change in accounting principle | — | | — | | | — | | — | | — | | (331) | | — | | — | | (331) | |
| Total comprehensive income (loss): | | | | | | | | | | |
| Net income | — | | — | | | — | | — | | — | | 287 | | — | | — | | 287 | |
| Other comprehensive income (loss) | — | | — | | | — | | — | | — | | — | | — | | 505 | | 505 | |
| Total comprehensive income (loss) | — | | — | | | — | | — | | — | | 287 | | — | | 505 | | 792 | |
| Balance at June 30, 2020 | 2 | | 1,965 | | | 427 | | 6 | | 18,908 | | 6,068 | | (4,623) | | 94 | | 22,418 | |
| Balance at January 1, 2021 | 2 | | $1,965 | | | 427 | | $6 | | $18,940 | | $6,445 | | ($4,623) | | ($60) | | $22,673 | |
| Dividends to common stockholders | — | | — | | | — | | — | | — | | (335) | | — | | — | | (335) | |
| Dividends to preferred stockholders | — | | — | | | — | | — | | — | | (55) | | — | | — | | (55) | |
| Preferred stock issued | — | | 296 | | | — | | — | | — | | — | | — | | — | | 296 | |
| Preferred stock called | — | | (247) | | | — | | — | | — | | — | | — | | — | | (247) | |
| Treasury stock purchased | — | | — | | | (2) | | — | | — | | — | | (95) | | — | | (95) | |
| Share-based compensation plans | — | | — | | | 1 | | — | | 13 | | — | | 0 | | — | | 13 | |
| Employee stock purchase plan purchased | — | | — | | | — | | — | | 11 | | — | | — | | — | | 11 | |
| | | | | | | | | | |
| Total comprehensive income (loss): | | | | | | | | | | |
| Net income | — | | — | | | — | | — | | — | | 1,259 | | — | | — | | 1,259 | |
| Other comprehensive income (loss) | — | | — | | | — | | — | | — | | — | | — | | (321) | | (321) | |
| Total comprehensive income (loss) | — | | — | | | — | | — | | — | | 1,259 | | — | | (321) | | 938 | |
| Balance at June 30, 2021 | 2 | | $2,014 | | | 426 | | $6 | | $18,964 | | $7,314 | | ($4,718) | | ($381) | | $23,199 | |
|
| | | | | | | | | | | | | | | | | | | | | | | | | | |
| | Preferred Stock | | Common Stock | Additional Paid-in Capital | Retained Earnings | Treasury Stock, at Cost | Accumulated Other Comprehensive Income (Loss) | Total |
| (in millions) | Shares | Amount | | Shares | Amount |
| Balance at January 1, 2019 | 1 |
|
| $840 |
| | 466 |
|
| $6 |
|
| $18,815 |
|
| $5,385 |
|
| ($3,133 | ) |
| ($1,096 | ) |
| $20,817 |
|
| Dividends to common stockholders | — |
| — |
| | — |
| — |
| — |
| (459 | ) | — |
| — |
| (459 | ) |
| Dividends to preferred stockholders | — |
| — |
| | — |
| — |
| — |
| (50 | ) | — |
| — |
| (50 | ) |
| Preferred stock issued | 0 |
| 293 |
| | — |
| — |
| — |
| — |
| — |
| — |
| 293 |
|
| Treasury stock purchased | — |
| — |
| | (23 | ) | — |
| — |
| — |
| (820 | ) | — |
| (820 | ) |
| Share-based compensation plans | — |
| — |
| | 1 |
| — |
| 48 |
| — |
| 0 |
| — |
| 48 |
|
| Employee stock purchase plan shares purchased | — |
| — |
| | — |
| — |
| 13 |
| — |
| — |
| — |
| 13 |
|
| Cumulative effect of change in accounting principle | — |
| — |
| | — |
| — |
| — |
| 12 |
| — |
| 5 |
| 17 |
|
| Total comprehensive income: | | | | | | | | | | |
| Net income | — |
| — |
| | — |
| — |
| — |
| 1,341 |
| — |
| — |
| 1,341 |
|
| Other comprehensive income | — |
| — |
| | — |
| — |
| — |
| — |
| — |
| 651 |
| 651 |
|
| Total comprehensive income | — |
| — |
| | — |
| — |
| — |
| 1,341 |
| — |
| 651 |
| 1,992 |
|
| Balance at September 30, 2019 | 1 |
|
| $1,133 |
| | 444 |
|
| $6 |
|
| $18,876 |
|
| $6,229 |
|
| ($3,953 | ) |
| ($440 | ) |
| $21,851 |
|
| Balance at January 1, 2020 | 2 |
|
| $1,570 |
| | 433 |
|
| $6 |
|
| $18,891 |
|
| $6,498 |
|
| ($4,353 | ) |
| ($411 | ) |
| $22,201 |
|
| Dividends to common stockholders | — |
| — |
| | — |
| — |
| — |
| (504 | ) | — |
| — |
| (504 | ) |
| Dividends to preferred stockholders | — |
| — |
| | — |
| — |
| — |
| (75 | ) | — |
| — |
| (75 | ) |
| Preferred stock issued | 0 |
| 395 |
| | — |
| — |
| — |
| — |
| — |
| — |
| 395 |
|
| Treasury stock purchased | — |
| — |
| | (7 | ) | — |
| 0 |
| — |
| (270 | ) | — |
| (270 | ) |
| Share-based compensation plans | — |
| — |
| | 1 |
| — |
| 17 |
| — |
| 0 |
| — |
| 17 |
|
| Employee stock purchase plan shares purchased | — |
| — |
| |
|
| — |
| 14 |
| — |
| — |
| — |
| 14 |
|
| Cumulative effect of change in accounting principle | — |
| — |
| | — |
| — |
| — |
| (331 | ) | — |
| 0 |
| (331 | ) |
| Total comprehensive income: | | | | | | | | | | |
| Net income | — |
| — |
| | — |
| — |
| — |
| 601 |
| — |
| — |
| 601 |
|
| Other comprehensive income | — |
| — |
| | — |
| — |
| — |
| — |
| — |
| 421 |
| 421 |
|
| Total comprehensive income | — |
| — |
| | — |
| — |
| — |
| 601 |
| — |
| 421 |
| 1,022 |
|
| Balance at September 30, 2020 | 2 |
|
| $1,965 |
| | 427 |
|
| $6 |
|
| $18,922 |
|
| $6,189 |
|
| ($4,623 | ) |
| $10 |
|
| $22,469 |
|
The accompanying Notes to unaudited interim Consolidated Financial Statements are an integral part of these statements.
Citizens Financial Group, Inc. | 55
CONSOLIDATED STATEMENTS OF CASH FLOWS (UNAUDITED)
| | | | Nine Months Ended September 30, | | Six Months Ended June 30, | |
| (in millions) | 2020 |
| | 2019 |
| (in millions) | 2021 | | 2020 | |
| OPERATING ACTIVITIES | | | | OPERATING ACTIVITIES | | | | |
| Net income |
| $601 |
| |
| $1,341 |
| Net income | $1,259 | | | $287 | | |
| Adjustments to reconcile net income to net cash provided by operating activities: | | | | |
| Adjustments to reconcile net income to net change in cash due to operating activities: | | Adjustments to reconcile net income to net change in cash due to operating activities: | | |
| Provision for credit losses | 1,492 |
| | 283 |
| Provision for credit losses | (353) | | | 1,064 | | |
| Net change in loans held for sale | (655 | ) | | (697 | ) | Net change in loans held for sale | 322 | | | (737) | | |
| Depreciation, amortization and accretion | 413 |
| | 432 |
| Depreciation, amortization and accretion | 317 | | | 316 | | |
| Amortization of intangibles | 6 |
| | 8 |
| |
| Deferred income taxes | (251 | ) | | (41 | ) | Deferred income taxes | 199 | | | (208) | | |
| Share-based compensation | 34 |
| | 44 |
| Share-based compensation | 35 | | | 23 | | |
| Net gain on sales of: | | | | Net gain on sales of: | | |
| Debt securities | (4 | ) | | (21 | ) | Debt securities | (6) | | | (3) | | |
| | Premises and equipment | 0 |
| | (6 | ) | Premises and equipment | (1) | | | 0 | | |
| Increase in other assets | (2,960 | ) | | (506 | ) | |
| Increase in other liabilities | 569 |
| | 133 |
| |
| Net cash (used in) provided by operating activities | (755 | ) | | 970 |
| |
| | Net (increase) decrease in other assets | | Net (increase) decrease in other assets | (2,129) | | | (2,454) | | |
| Net increase (decrease) in other liabilities | | Net increase (decrease) in other liabilities | 247 | | | 299 | | |
| Net change due to operating activities | | Net change due to operating activities | (110) | | | (1,413) | | |
| INVESTING ACTIVITIES | | | | INVESTING ACTIVITIES | | | | |
| Investment securities: | | | | Investment securities: | | |
| Purchases of debt securities available for sale | (5,547 | ) | | (4,633 | ) | Purchases of debt securities available for sale | (6,413) | | | (3,308) | | |
| Proceeds from maturities and paydowns of debt securities available for sale | 4,583 |
| | 2,728 |
| Proceeds from maturities and paydowns of debt securities available for sale | 4,321 | | | 2,521 | | |
| Proceeds from sales of debt securities available for sale | 48 |
| | 1,495 |
| Proceeds from sales of debt securities available for sale | 104 | | | 0 | | |
| | Proceeds from maturities and paydowns of debt securities held to maturity | 629 |
| | 280 |
| Proceeds from maturities and paydowns of debt securities held to maturity | 530 | | | 349 | | |
| Net decrease in equity securities, at fair value | 0 |
| | 136 |
| |
| Net decrease in equity securities, at cost | 202 |
| | 100 |
| |
| Net increase in interest-bearing deposits in banks | (31 | ) | | (10 | ) | |
| | Net (increase) decrease in interest-bearing deposits in banks | | Net (increase) decrease in interest-bearing deposits in banks | (95) | | | (178) | | |
| | Acquisitions, net of cash acquired | (3 | ) | | (129 | ) | Acquisitions, net of cash acquired | 0 | | | (3) | | |
| Net increase in loans and leases | (5,303 | ) | | (1,534 | ) | |
| Net (increase) decrease in loans and leases | | Net (increase) decrease in loans and leases | 497 | | | (7,014) | | |
| Capital expenditures, net | 1 |
| | (47 | ) | Capital expenditures, net | (32) | | | (53) | | |
| Purchase of bank-owned life insurance | | Purchase of bank-owned life insurance | (500) | | | 0 | | |
| Other | (78 | ) | | (172 | ) | Other | (115) | | | 87 | | |
| Net cash used in investing activities | (5,499 | ) | | (1,786 | ) | |
| Net change due to investing activities | | Net change due to investing activities | (1,703) | | | (7,599) | | |
| FINANCING ACTIVITIES | | | | FINANCING ACTIVITIES | | | | |
| Net increase in deposits | 17,608 |
| | 5,139 |
| |
| Net decrease in short-term borrowed funds | (43 | ) | | (244 | ) | |
| Net increase (decrease) in deposits | | Net increase (decrease) in deposits | 3,472 | | | 18,305 | | |
| Net increase (decrease) in short-term borrowed funds | | Net increase (decrease) in short-term borrowed funds | (183) | | | (18) | | |
| Proceeds from issuance of long-term borrowed funds | 8,323 |
| | 7,300 |
| Proceeds from issuance of long-term borrowed funds | 0 | | | 8,309 | | |
| Repayments of long-term borrowed funds | (13,258 | ) | | (10,556 | ) | Repayments of long-term borrowed funds | (1,357) | | | (13,253) | | |
| Treasury stock purchased | (270 | ) | | (820 | ) | Treasury stock purchased | (95) | | | (270) | | |
| Net proceeds from issuance of preferred stock | 395 |
| | 293 |
| Net proceeds from issuance of preferred stock | 296 | | | 395 | | |
| Dividends declared and paid to common stockholders | (504 | ) | | (459 | ) | |
| Dividends declared and paid to preferred stockholders | (73 | ) | | (48 | ) | |
| Dividends paid to common stockholders | | Dividends paid to common stockholders | (335) | | | (336) | | |
| Dividends paid to preferred stockholders | | Dividends paid to preferred stockholders | (55) | | | (45) | | |
| Premium paid to exchange subordinated debt | (80 | ) | | 0 |
| Premium paid to exchange subordinated debt | (1) | | | 0 | | |
| Payments of employee tax withholding for share-based compensation | (14 | ) | | (21 | ) | Payments of employee tax withholding for share-based compensation | (21) | | | (15) | | |
| Net cash provided by financing activities | 12,084 |
| | 584 |
| |
Increase (decrease) in cash and cash equivalents (1) | 5,830 |
| | (232 | ) | |
| Net change due to financing activities | | Net change due to financing activities | 1,721 | | | 13,072 | | |
Net change in cash and cash equivalents (1) | | Net change in cash and cash equivalents (1) | (92) | | | 4,060 | | |
Cash and cash equivalents at beginning of period (1) | 3,386 |
| | 4,074 |
| Cash and cash equivalents at beginning of period (1) | 12,733 | | | 3,386 | | |
Cash and cash equivalents at end of period (1) |
| $9,216 |
| |
| $3,842 |
| Cash and cash equivalents at end of period (1) | $12,641 | | | $7,446 | | |
(1) Cash and cash equivalents includes cash and due from banks and interest-bearing cash and due from banks as reflected onin the Consolidated Balance Sheets.
The accompanying Notes to unaudited interim Consolidated Financial Statements are an integral part of these statements.
Citizens Financial Group, Inc. | 56
NOTES TO CONSOLIDATED FINANCIAL STATEMENTS (UNAUDITED)
NOTE 1 - BASIS OF PRESENTATION
Basis of Presentation
The unaudited interim Consolidated Financial Statements, including the Notes presented in this document of Citizens Financial Group, Inc., have been prepared in accordance with GAAP interim reporting requirements, and therefore do not include all information and Notes included in the audited Consolidated Financial Statements in conformity with GAAP. These unaudited interim Consolidated Financial Statements and Notes presented in this document should be read in conjunction with the Company’s audited Consolidated Financial Statements and accompanying Notes included in the Company’s 20192020 Form 10-K. The Company’s principal business activity is banking, conducted through its banking subsidiary, CBNA.
The unaudited interim Consolidated Financial Statements include the accounts of the Company and subsidiaries in which the Company has a controlling financial interest. All intercompany transactions and balances have been eliminated. The Company has evaluated its unconsolidated entities and does not believe that any entity in which it has an interest, but does not currently consolidate, meets the requirements to be consolidated as a variable interest entity. The unaudited interim Consolidated Financial Statements include all adjustments, consisting of normal recurring adjustments, necessary for a fair presentation of the results for the interim periods. The results for interim periods are not necessarily indicative of results for a full year.
The preparation of financial statements in conformity with GAAP requires management to make estimates and assumptions that affect the reported amounts of assets and liabilities at the date of the financial statements and the reported amounts of revenues and expenses during the reporting period. Actual results could differ from those estimates. Material estimates that are particularly susceptible to significant change in the near-term relate to the determination of the ACL, the fair value of MSRs, and the evaluation and measurement of impairment of goodwill.ACL.
Significant Accounting Policies
For further information regarding the Company’s significant accounting policies, see Note 1 in the Company’s 20192020 Form 10-K.
Accounting Pronouncements Adopted in 2020
|
| | |
Pronouncement | Summary of Guidance | Effects on Financial Statements |
Financial Instruments - Credit Losses
Issued June 2016
| •
Required effective date: January 1, 2020.
•
Establishes a single allowance framework for financial assets carried at amortized cost (including securities HTM), which reflects management’s estimate of credit losses over the full remaining expected life of the financial assets.
•
Amends impairment guidance for securities AFS to incorporate an allowance, which allows for reversals of impairment losses in the event that the credit of an issuer improves.
•
Requires a cumulative-effect adjustment to retained earnings, net of taxes, as of the beginning of the reporting period of adoption.
•
Requires enhanced credit quality disclosures including disaggregation of credit quality indicators by vintage.
| •
The Company adopted the new standard on January 1, 2020, retrospectively for loans and leases and HTM securities and prospectively for AFS securities. Refer to Note 4 for discussion of the significant accounting policy for the allowance for credit losses following adoption.
•
Adoption resulted in a cumulative-effect reduction of $337 million, net of taxes of $114 million, to retained earnings and a corresponding increase to the ACL of $451 million. Refer to Note 4 for the impact of the adoption to the ALLL and reserve for unfunded commitments.
•
Adoption of the new standard could produce higher volatility in the quarterly provision for credit losses than the prior incurred loss reserve process and could adversely impact the Company’s ongoing earnings.
•
Based on the credit quality of the Company’s existing debt securities portfolio, the Company did not recognize an allowance for HTM and AFS debt securities upon adoption.
|
Goodwill
Issued January 2017
| •
Requires an impairment loss to be recognized when the estimated fair value of a reporting unit falls below its carrying value.
•
Eliminates the second condition in the current guidance that requires an impairment loss to be recognized only if the estimated implied fair value of the goodwill is below its carrying value.
•
Applied prospectively to all goodwill impairment tests performed after the adoption date. | •
The Company adopted the new standard on January 1, 2020. Refer to Note 6 for discussion of the significant accounting policy for goodwill impairment following adoption.
•
Adoption did not have a material impact on the Company’s Consolidated Financial Statements.
|
Disclosure Requirements - Fair Value Measurements
Issued August 2018
| •
Amends disclosure requirements on fair value measurements.
•
Eliminates requirements for certain disclosures that are no longer considered relevant or cost beneficial, requires new disclosures and modifies existing disclosures that are expected to enhance the usefulness of the financial statements.
•
Prospective application is required for new disclosures.
•
Retrospective application is required for all other amendments for all periods presented.
| •
The Company adopted the new standard on January 1, 2020.
•
Adoption did not have a material impact on the Company’s Consolidated Financial Statements. Required fair value measurement disclosures are included in Note 13. |
Simplifying the Accounting for Income Taxes
Issued December 2019
| •
Simplifies the accounting for income taxes by eliminating certain exceptions related to the approach for intraperiod tax allocation, the methodology for calculating income taxes in an interim period and the recognition of deferred tax liabilities for outside basis differences.
•
Simplifies aspects of the accounting for franchise taxes and enacted changes in tax laws or rates.
•
Clarifies the accounting for transactions that result in a step-up in the tax basis of goodwill.
| • The Company adopted the new standard on January 1, 2020.
• Adoption did not have an impact on the Company’s Consolidated Financial Statements.
|
|
| | |
Pronouncement | Summary of Guidance | Effects on Financial Statements |
Facilitation of the Effects of Reference Rate Reform on Financial Reporting
Issued March 2020
| •
Provides the option to apply a number of practical expedients when evaluating if a contract modification as the result of reference rate reform is considered a new contract or a continuation of an existing contract.
•
Provides optional expedients to the evaluation of, and accounting for, fair value and cash flow hedges affected by reference rate reform.
•
Provides an optional one-time election to sell or transfer debt securities classified as HTM that reference a rate affected by reference rate reform | •
The Company adopted the new standard in the first quarter of 2020 upon issuance and is effective through December 31, 2022.
•
Adoption did not have a material impact on the Company’s Consolidated Financial Statements. |
NOTE 2 - SECURITIES
The following table presents the major components of securities at amortized cost and fair value:
| | | | | | | | | | | | | | | | | | | | | | | | | | | | | |
| June 30, 2021 | | December 31, 2020 |
| (in millions) | Amortized Cost | Gross Unrealized Gains | Gross Unrealized Losses | Fair Value | | Amortized Cost | Gross Unrealized Gains | Gross Unrealized Losses | Fair Value |
| U.S. Treasury and other | $11 | | $0 | | $0 | | $11 | | | $11 | | $0 | | $0 | | $11 | |
| State and political subdivisions | 3 | | 0 | | 0 | | 3 | | | 3 | | 0 | | 0 | | 3 | |
| Mortgage-backed securities, at fair value: | | | | | | | | | |
| Federal agencies and U.S. government sponsored entities | 23,960 | | 354 | | (202) | | 24,112 | | | 21,954 | | 571 | | (19) | | 22,506 | |
| Other/non-agency | 267 | | 13 | | 0 | | 280 | | | 396 | | 26 | | 0 | | 422 | |
| Total mortgage-backed securities, at fair value | 24,227 | | 367 | | (202) | | 24,392 | | | 22,350 | | 597 | | (19) | | 22,928 | |
| Collateralized loan obligations, at fair value | 177 | | 0 | | 0 | | 177 | | | 0 | | 0 | | 0 | | 0 | |
| Total debt securities available for sale, at fair value | $24,418 | | $367 | | ($202) | | $24,583 | | | $22,364 | | $597 | | ($19) | | $22,942 | |
| Federal agencies and U.S. government sponsored entities | $1,887 | | $77 | | $0 | | $1,964 | | | $2,342 | | $122 | | $0 | | $2,464 | |
| Total mortgage-backed securities, at cost | 1,887 | | 77 | | 0 | | 1,964 | | | 2,342 | | 122 | | 0 | | 2,464 | |
| Asset-backed securities, at cost | 824 | | 2 | | 0 | | 826 | | | 893 | | 0 | | 0 | | 893 | |
| Total debt securities held to maturity | $2,711 | | $79 | | $0 | | $2,790 | | | $3,235 | | $122 | | $0 | | $3,357 | |
| Equity securities, at cost | $602 | | $— | | $— | | $602 | | | $604 | | $— | | $— | | $604 | |
| Equity securities, at fair value | 80 | | — | | — | | 80 | | | 66 | | — | | — | | 66 | |
|
| | | | | | | | | | | | | | | | | | | | | | | | | |
| | September 30, 2020 | | December 31, 2019 |
| (in millions) | Amortized Cost | Gross Unrealized Gains | Gross Unrealized Losses | Fair Value | | Amortized Cost | Gross Unrealized Gains | Gross Unrealized Losses | Fair Value |
| U.S. Treasury and other |
| $11 |
|
| $0 |
|
| $0 |
|
| $11 |
| |
| $71 |
|
| $0 |
|
| $0 |
|
| $71 |
|
| State and political subdivisions | 4 |
| 0 |
| 0 |
| 4 |
| | 5 |
| 0 |
| 0 |
| 5 |
|
| Mortgage-backed securities, at fair value: | | | | | | | | | |
| Federal agencies and U.S. government sponsored entities | 20,962 |
| 617 |
| (38 | ) | 21,541 |
| | 19,803 |
| 143 |
| (71 | ) | 19,875 |
|
| Other/non-agency | 482 |
| 33 |
| 0 |
| 515 |
| | 638 |
| 24 |
| 0 |
| 662 |
|
| Total mortgage-backed securities, at fair value | 21,444 |
| 650 |
| (38 | ) | 22,056 |
| | 20,441 |
| 167 |
| (71 | ) | 20,537 |
|
Asset-backed securities, at fair value(1) | 813 |
| 0 |
| 0 |
| 813 |
| | 0 |
| 0 |
| 0 |
| 0 |
|
| Total debt securities available for sale, at fair value |
| $22,272 |
|
| $650 |
|
| ($38 | ) |
| $22,884 |
| |
| $20,517 |
|
| $167 |
|
| ($71 | ) |
| $20,613 |
|
| Mortgage-backed securities, at cost: | | | | | | | | | |
| Federal agencies and U.S. government sponsored entities |
| $2,578 |
|
| $131 |
|
| $0 |
|
| $2,709 |
| |
| $3,202 |
|
| $45 |
|
| ($5 | ) |
| $3,242 |
|
| Total debt securities held to maturity, at cost |
| $2,578 |
|
| $131 |
|
| $0 |
|
| $2,709 |
| |
| $3,202 |
|
| $45 |
|
| ($5 | ) |
| $3,242 |
|
| Money market mutual fund investments |
| $57 |
|
| $— |
|
| $— |
|
| $57 |
| |
| $47 |
|
| $— |
|
| $— |
|
| $47 |
|
| Total equity securities, at fair value |
| $57 |
|
| $— |
|
| $— |
|
| $57 |
| |
| $47 |
|
| $— |
|
| $— |
|
| $47 |
|
| Federal Reserve Bank stock |
| $577 |
|
| $— |
|
| $— |
|
| $577 |
| |
| $577 |
|
| $— |
|
| $— |
|
| $577 |
|
| Federal Home Loan Bank stock | 20 |
| — |
| — |
| 20 |
| | 222 |
| — |
| — |
| 222 |
|
| Other equity securities | 8 |
| — |
| — |
| 8 |
| | 8 |
| — |
| — |
| 8 |
|
| Total equity securities, at cost |
| $605 |
|
| $— |
|
| $— |
|
| $605 |
| |
| $807 |
|
| $— |
|
| $— |
|
| $807 |
|
Citizens Financial Group, Inc. | 57
(1) In September 2020, Citizens sold $973 million of private in-school education loans, inclusive of accrued interest, capitalized interest and fees. Additionally, the Company provided financing to the purchaser for a portion of the sale price in the form of $813 million of asset-backed securities, collateralized by the sold assets, which are classified as AFS. Refer to Note 7 for additional information.
Accrued interest receivable on debt securities totaled $57$54 million and $58$55 million as of SeptemberJune 30, 20202021 and December 31, 2019,2020, respectively, and is included in other assets onin the Consolidated Balance Sheets.
The following table presents the amortized cost and fair value of debt securities by contractual maturity as of SeptemberJune 30, 2020.2021. Expected maturities may differ from contractual maturities because issuers may have the right to call or prepay obligations with or without incurring penalties.
| | | | September 30, 2020 | | June 30, 2021 |
| | Distribution of Maturities | | Distribution of Maturities |
| (in millions) | 1 Year or Less | After 1 Year through 5 Years | After 5 Years through 10 Years | After 10 Years | Total | (in millions) | 1 Year or Less | After 1 Year through 5 Years | After 5 Years through 10 Years | After 10 Years | Total |
| Amortized cost: | | | Amortized cost: | |
| U.S. Treasury and other |
| $11 |
|
| $0 |
|
| $0 |
|
| $0 |
|
| $11 |
| U.S. Treasury and other | $11 | | $0 | | $0 | | $0 | | $11 | |
| State and political subdivisions | 0 |
| 0 |
| 0 |
| 4 |
| 4 |
| State and political subdivisions | 0 | | 0 | | 0 | | 3 | | 3 | |
| Mortgage-backed securities: | | Mortgage-backed securities: | |
| Federal agencies and U.S. government sponsored entities | 4 |
| 147 |
| 1,591 |
| 19,220 |
| 20,962 |
| Federal agencies and U.S. government sponsored entities | 6 | | 42 | | 1,861 | | 22,051 | | 23,960 | |
| Other/non-agency | 0 |
| 0 |
| 0 |
| 482 |
| 482 |
| Other/non-agency | 0 | | 0 | | 0 | | 267 | | 267 | |
| Asset-backed securities | 0 |
| 0 |
| 813 |
| 0 |
| 813 |
| |
| Collateralized loan obligations | | Collateralized loan obligations | 0 | | 0 | | 0 | | 177 | | 177 | |
| Total debt securities available for sale | 15 |
| 147 |
| 2,404 |
| 19,706 |
| 22,272 |
| Total debt securities available for sale | 17 | | 42 | | 1,861 | | 22,498 | | 24,418 | |
| Mortgage-backed securities: | | Mortgage-backed securities: | |
| Federal agencies and U.S. government sponsored entities | 0 |
| 0 |
| 0 |
| 2,578 |
| 2,578 |
| Federal agencies and U.S. government sponsored entities | 0 | | 0 | | 0 | | 1,887 | | 1,887 | |
| Asset-backed securities | | Asset-backed securities | 0 | | 0 | | 824 | | 0 | | 824 | |
| Total debt securities held to maturity | 0 |
| 0 |
| 0 |
| 2,578 |
| 2,578 |
| Total debt securities held to maturity | 0 | | 0 | | 824 | | 1,887 | | 2,711 | |
| Total amortized cost of debt securities |
| $15 |
|
| $147 |
|
| $2,404 |
|
| $22,284 |
|
| $24,850 |
| Total amortized cost of debt securities | $17 | | $42 | | $2,685 | | $24,385 | | $27,129 | |
| | | |
| Fair value: | | Fair value: | |
| U.S. Treasury and other |
| $11 |
|
| $0 |
|
| $0 |
|
| $0 |
|
| $11 |
| U.S. Treasury and other | $11 | | $0 | | $0 | | $0 | | $11 | |
| State and political subdivisions | 0 |
| 0 |
| 0 |
| 4 |
| 4 |
| State and political subdivisions | 0 | | 0 | | 0 | | 3 | | 3 | |
| Mortgage-backed securities: | | Mortgage-backed securities: | |
| Federal agencies and U.S. government sponsored entities | 4 |
| 153 |
| 1,647 |
| 19,737 |
| 21,541 |
| Federal agencies and U.S. government sponsored entities | 6 | | 44 | | 1,916 | | 22,146 | | 24,112 | |
| Other/non-agency | 0 |
| 0 |
| 0 |
| 515 |
| 515 |
| Other/non-agency | 0 | | 0 | | 0 | | 280 | | 280 | |
| Asset-backed securities | 0 |
| 0 |
| 813 |
| 0 |
| 813 |
| |
| Collateralized loan obligations | | Collateralized loan obligations | 0 | | 0 | | 0 | | 177 | | 177 | |
| Total debt securities available for sale | 15 |
| 153 |
| 2,460 |
| 20,256 |
| 22,884 |
| Total debt securities available for sale | 17 | | 44 | | 1,916 | | 22,606 | | 24,583 | |
| Mortgage-backed securities: | | Mortgage-backed securities: | |
| Federal agencies and U.S. government sponsored entities | 0 |
| 0 |
| 0 |
| 2,709 |
| 2,709 |
| Federal agencies and U.S. government sponsored entities | 0 | | 0 | | 0 | | 1,964 | | 1,964 | |
| Asset-backed securities | | Asset-backed securities | 0 | | 0 | | 826 | | 0 | | 826 | |
| Total debt securities held to maturity | 0 |
| 0 |
| 0 |
| 2,709 |
| 2,709 |
| Total debt securities held to maturity | 0 | | 0 | | 826 | | 1,964 | | 2,790 | |
| Total fair value of debt securities |
| $15 |
|
| $153 |
|
| $2,460 |
|
| $22,965 |
|
| $25,593 |
| Total fair value of debt securities | $17 | | $44 | | $2,742 | | $24,570 | | $27,373 | |
Taxable interest income from investment securities as presented onin the Consolidated Statements of Operations was $121$124 million and $153$130 million for the three months ended SeptemberJune 30, 20202021 and 2019,2020, respectively, and $398$252 million and $483$277 million for the ninesix months ended SeptemberJune 30, 2021 and 2020, and 2019, respectively.
The following table presents realized gains and losses on securities:
| | | | | | | | | | | | | | | | | | | | | | | |
| Three Months Ended June 30, | | Six Months Ended June 30, |
| (in millions) | 2021 | | 2020 | | 2021 | | 2020 |
| Gains on sale of debt securities | $3 | | | $3 | | | $6 | | | $3 | |
| Losses on sale of debt securities | 0 | | | 0 | | | 0 | | | 0 | |
| Debt securities gains, net | $3 | | | $3 | | | $6 | | | $3 | |
| | | | | | | |
|
| | | | | | | | | | | | | | | |
| | Three Months Ended September 30, | | Nine Months Ended September 30, |
| (in millions) | 2020 |
| | 2019 |
| | 2020 |
| | 2019 |
|
Gains on sale of debt securities(1) |
| $1 |
| |
| $5 |
| |
| $4 |
| |
| $21 |
|
| Losses on sale of debt securities | 0 |
| | 0 |
| | 0 |
| | 0 |
|
| Debt securities gains, net |
| $1 |
| |
| $5 |
| |
| $4 |
| |
| $21 |
|
Citizens Financial Group, Inc. | 58
(1) For the three and nine months ended September 30, 2019, $2 millionand$6 million, respectively, of gains on sale of debt securities were recognized in mortgage banking fees in the Consolidated Statement of Operations as they related to AFS securities held as economic hedges of the value of the MSR portfolio recognized using the amortization method.
The following table presents the amortized cost and fair value of debt securities pledged:
| | | | | | | | | | | | | | | | | |
| June 30, 2021 | | December 31, 2020 |
| (in millions) | Amortized Cost | Fair Value | | Amortized Cost | Fair Value |
| Pledged against derivatives, to qualify for fiduciary powers, and to secure public and other deposits as required by law | $4,996 | | $5,028 | | | $3,818 | | $3,937 | |
| Pledged against FHLB borrowed funds | 266 | | 280 | | | 394 | | 423 | |
| Pledged against repurchase agreements | 49 | | 52 | | | 224 | | 231 | |
|
| | | | | | | | | | | | | |
| | September 30, 2020 | | December 31, 2019 |
| (in millions) | Amortized Cost | Fair Value | | Amortized Cost | Fair Value |
| Pledged against repurchase agreements |
| $227 |
|
| $234 |
| |
| $265 |
|
| $266 |
|
| Pledged against FHLB borrowed funds | 478 |
| 515 |
| | 638 |
| 662 |
|
| Pledged against derivatives, to qualify for fiduciary powers, and to secure public and other deposits as required by law | 3,506 |
| 3,620 |
| | 3,670 |
| 3,672 |
|
CitizensThe Company regularly enters into security repurchase agreements with unrelated counterparties, which involve the transfer of a security from one party to another, and a subsequent transfer of substantially the same security back to the original party. The Company’sThese repurchase agreements are typically short-term in nature and are accounted for as secured borrowed funds onin the Company’s Consolidated Balance Sheets. CitizensThe Company recognized no0 offsetting of short-term receivables or payables as of SeptemberJune 30, 20202021 or December 31, 2019. Citizens2020. The Company offsets certain derivative assets and derivative liabilities onin the Consolidated Balance Sheets. For further information, see Note 9.8.
Securitizations of mortgage loans retained in the investment portfolio were $34$82 million and $163 million for the three and ninesix months ended SeptemberJune 30, 2020. Securitizations2021, respectively. There were 0 securitizations of mortgage loans retained in the investment portfolio were $28 million and $72 million for the three and ninesix months ended SeptemberJune 30, 2019, respectively.2020. These securitizations include a substantive guarantee by a third party. In 2020, the guarantors were FNMA and FHLMC. In 2019,2021, the guarantors were FNMA, FHLMC, and GNMA. The debt securities received from the guarantors are classified as AFS.
Impairment
Upon purchaseAs of HTM investment securities and at each subsequent measurement date, Citizens is required to evaluate the securities for risk of loss over their life and, if necessary, establish an associated reserve. Recognition of a reserve for expected credit losses is not required if the amountJune 30, 2021, the Company expects to realize is zero (commonly referred to as “zero expected credit losses”). The Company evaluated its existing HTM portfolio and concluded that all70% of theHTM securities met the zero expected credit loss criteria, andcriteria; therefore, no CECL reserveACL was booked for HTM securities as ofrecognized. For the balance sheet date.
Citizens reviews its AFS debt securities for impairment atremaining 30%, the individual security level on a quarterly basis, or more frequently if a potential loss triggering event occurs. The initial indicator of impairment for debt securities classified as AFS is a decline in fair value below its amortized cost basis. For any security that has declined in fair value below the amortized cost basis, the Company recognizes an impairment loss in current period earnings if management has the intent to sell the security or if it is more likely than not it will be required to sell the security before recovery of its amortized cost basis.
Estimating the recovery of the amortized cost basis of a debt security is based upon an assessment of the cash flowslifetime expected credit losses were determined to be collected. Ifinsignificant based on the present value of cash flows expected to be collected, discounted at the security’s original effective yield, is less than the amortized cost basis, impairment equal to the shortfall in cash flows has occurred. Citizens evaluates whether any portion of the impairment is attributable to credit-related factors or various other market factors affecting the fair value of the security (e.g., interest rates, spread levels, liquidity in the sector, etc.), and the public credit rating of the security. If credit-related factors exist, credit-related impairment has occurred regardlessmodeling of the Company’s intent to holdcredit loss position in the security until it recovers.
security. The credit-related portion of impairment is recognized in current period earnings as provision expenseCompany monitors the credit exposure through the establishmentuse of an allowance for AFScredit quality indicators. For these securities, to the extent the allowance does not reduce the value of the AFS security below its current fair value. The remaining non-credit related portion of impairment is recognized in OCI. Improvement in credit losses in subsequent periods results in a reversal of the allowance for AFS securities and a corresponding decrease to provision expense, to the extent the allowance does not become negative. Accrued interest receivable on AFS debt securities is excluded from the balances used to calculate the allowance for AFS securities. All accrued and uncollected interest is immediately reversed against interest income when it is deemed uncollectible. The Company has evaluated any AFS securities in an unrealized loss position at September 30, 2020 and concluded that all unrealized losses are due to non-credit related factors. As such, the Company doesuses external credit ratings or an internally derived credit rating when an external rating is not have an allowance for AFSavailable. All securities as of Septemberwere determined to be investment grade at June 30, 2020.
2021.
The following table presentstables present AFS mortgage-backed debt securities with fair values below their respective carrying values, separated by the duration the securities have been in a continuous unrealized loss position:
| | | | | | | | | | | | | | | | | | | | | | | | | | |
| June 30, 2021 |
| Less than 12 Months | | 12 Months or Longer | | Total |
| (dollars in millions) | Fair Value | Gross Unrealized Losses | | Fair Value | Gross Unrealized Losses | | Fair Value | Gross Unrealized Losses |
| Federal agencies and U.S. government sponsored entities | $10,916 | | ($200) | | | $92 | | ($2) | | | $11,008 | | ($202) | |
| | | | | | | | |
| | | | | | | | |
|
| | | | | | | | | | | | | | | | | | | | |
| | September 30, 2020 |
| | Less than 12 Months | | 12 Months or Longer | | Total |
| (dollars in millions) | Fair Value | Gross Unrealized Losses | | Fair Value | Gross Unrealized Losses | | Fair Value | Gross Unrealized Losses |
| Federal agencies and U.S. government sponsored entities |
| $2,524 |
|
| ($38 | ) | |
| $0 |
|
| $0 |
| |
| $2,524 |
|
| ($38 | ) |
The following table present AFS and HTM mortgage-backed debt securities with fair values below their respective carrying values, separated by the duration the securities have been in a continuous unrealized loss position:
|
| | | | | | | | | | | | | | | | | | | | |
| | December 31, 2019 |
| | Less than 12 Months | | 12 Months or Longer | | Total |
| (dollars in millions) | Fair Value | Gross Unrealized Losses | | Fair Value | Gross Unrealized Losses | | Fair Value | Gross Unrealized Losses |
| Federal agencies and U.S. government sponsored entities |
| $5,135 |
|
| ($24 | ) | |
| $3,748 |
|
| ($52 | ) | |
| $8,883 |
|
| ($76 | ) |
| | | | | | | | | | | | | | | | | | | | | | | | | | |
| December 31, 2020 |
| Less than 12 Months | | 12 Months or Longer | | Total |
| (dollars in millions) | Fair Value | Gross Unrealized Losses | | Fair Value | Gross Unrealized Losses | | Fair Value | Gross Unrealized Losses |
| Federal agencies and U.S. government sponsored entities | $1,991 | | ($19) | | | $0 | | $0 | | | $1,991 | | ($19) | |
| | | | | | | | |
Citizens does not currently have the intent to sell these impaired debt securities, and it is not more likely than not that the Company will be required to sell these debt securities prior to recovery of their amortized cost bases. Citizens has determined that credit losses are not expected to be incurred on the remaining agency and non-agency MBS identified with unrealized losses as of SeptemberJune 30, 2020.2021. The unrealized losses on these debt securities reflect non-credit-related factors such as changingdriven by changes in interest rates and market liquidity.rates. Therefore, Citizensthe Company has determined that these debt securities are not other-than-temporarily impaired. Any subsequent increases in the valuation of impaired debt securities will not impact their recorded cost bases.
Citizens Financial Group, Inc. | 59
NOTE 3 - LOANS AND LEASES
Loans held for investment are reported at the amount of their outstanding principal, net of charge-offs, unearned income, deferred loan origination fees and costs, and unamortized premiums or discounts on purchased loans.
Loans and leases are disclosed in portfolio segments and classes. The Company’s loan and lease portfolio segments are commercial and retail. The classes of loans and leases are: commercial, commercial real estate, leases, residential mortgages, home equity, automobile, education and other retail.
The following table presents the Company’s loans and leases, excluding LHFS, disclosed in portfolio segmentsLHFS.
| | | | | | | | | | | |
| (in millions) | June 30, 2021 | | December 31, 2020 |
Commercial and industrial (1) | $42,842 | | | $44,173 | |
| Commercial real estate | 14,412 | | | 14,652 | |
| Leases | 1,829 | | | 1,968 | |
| Total commercial | 59,083 | | | 60,793 | |
Residential mortgages (2) | 20,538 | | | 19,539 | |
| Home equity | 11,841 | | | 12,149 | |
| Automobile | 12,780 | | | 12,153 | |
| Education | 12,800 | | | 12,308 | |
| Other retail | 5,539 | | | 6,148 | |
| Total retail | 63,498 | | | 62,297 | |
| Total loans and leases | $122,581 | | | $123,090 | |
(1) Includes $3.5 billion and classes:
|
| | | | | | | |
| (in millions) | September 30, 2020 | | December 31, 2019 |
Commercial(1) |
| $45,185 |
| |
| $41,479 |
|
| Commercial real estate | 14,889 |
| | 13,522 |
|
| Leases | 2,288 |
| | 2,537 |
|
| Total commercial loans and leases | 62,362 |
| | 57,538 |
|
| Residential mortgages | 19,633 |
| | 19,083 |
|
| Home equity | 12,322 |
| | 13,154 |
|
| Automobile | 12,035 |
| | 12,120 |
|
| Education | 11,631 |
| | 10,347 |
|
| Other retail | 6,088 |
| | 6,846 |
|
| Total retail loans | 61,709 |
| | 61,550 |
|
| Total loans and leases |
| $124,071 |
| |
| $119,088 |
|
(1) Includes$4.2 billion of PPP loans fully guaranteed by the SBA of $4.7 billion as of SeptemberJune 30, 2020.2021 and December 31, 2020, respectively.
(2) Includes fully or partially guaranteed FHA, VA and USDA loans of $1.4 billion at June 30, 2021 and $249 million at December 31, 2020, including loans acquired through an exercise of the GNMA early buyout option.
AccruedIncluded in other assets is accrued interest receivable on loans and leases held for investment totaled $470totaling $467 million and $495$449 million as of SeptemberJune 30, 20202021 and December 31, 2019,2020, respectively.
During the three months ended June 30, 2021 and 2020, the Company purchased $351 million and $691 million of education loans, and $176 million and $255 million of other retail loans. During the six months ended June 30, 2021 and 2020, the Company purchased $652 million and $909 million of education loans, and $353 million and $527 million of other retail loans, respectively.
During the three months ended June 30, 2021 and 2020, the Company sold $237 million and $71 million of commercial loans, respectively. During the six months ended June 30, 2021 and 2020, the Company sold $563 million and $262 million of commercial loans, respectively. During the six months ended June 30, 2020, the company sold $1.5 billion of residential mortgage loans as compared to NaN in the same period of 2021.
Loans pledged as collateral for FHLB borrowed funds, primarily residential mortgages and home equity products, totaled $24.7 billion and $25.5 billion at June 30, 2021 and December 31, 2020, respectively. Loans pledged as collateral to support the contingent ability to borrow at the FRB discount window, if necessary, were primarily comprised of education, automobile, commercial and industrial, and commercial real estate loans, and totaled $39.7 billion and $40.0 billion at June 30, 2021 and December 31, 2020, respectively.
Interest income on direct financing and sales-type leases was $12 millionand $19 millionfor the three months ended June 30, 2021 and 2020, respectively, and is included in other assetsreported within interest and fees on loans and leases in the Consolidated Balance Sheets.Statements of Operations. For the six months ended June 30, 2021 and 2020, this interest income was $25 million and $37 million, respectively.
The following table presents the composition of LHFS.
| | | | September 30, 2020 | | December 31, 2019 | | June 30, 2021 | | December 31, 2020 |
| (in millions) | Residential Mortgages(1) | Commercial(2) | Total | | Residential Mortgages(1) | Commercial(2) | Total | (in millions) | Residential Mortgages(1) | Commercial(2) | | Total | | Residential Mortgages(1) | Commercial(2) | Total |
| Loans held for sale at fair value |
| $3,425 |
|
| $162 |
|
| $3,587 |
| |
| $1,778 |
|
| $168 |
|
| $1,946 |
| Loans held for sale at fair value | $3,499 | | $117 | | | $3,616 | | | $3,416 | | $148 | | $3,564 | |
| Other loans held for sale | 0 |
| 127 |
| 127 |
| | 1,101 |
| 283 |
| 1,384 |
| Other loans held for sale | 0 | | 82 | | | 82 | | | 0 | | 439 | | 439 | |
(1) Residential mortgage LHFS are originated for sale.
(2) Commercial LHFS at fair value consist of loans managed by the Company’s commercial secondary loan desk. Other commercial LHFS generally consist of loans associated with the Company’s syndication business.
Citizens Financial Group, Inc. | 60
Loans pledged as collateral for FHLB borrowed funds, primarily residential mortgages and home equity loans, totaled $25.2 billion and $25.3 billion at September 30, 2020 and December 31, 2019, respectively. Loans pledged as collateral to support the contingent ability to borrow at the FRB discount window were primarily comprised of auto, commercial, commercial real estate, and education loans, and totaled $39.2 billion and $17.4 billion at September 30, 2020 and December 31, 2019, respectively.
During the three months ended September 30, 2020, the Company purchased $801 million of education loans and $101 million of other retail loans. During the three months ended September 30, 2019, the Company purchased $164 million of education loans and $66 million of other retail loans. During the nine months ended September 30, 2020, the Company purchased $1.7 billion of education loans and $628 million of other retail loans. During the nine months ended September 30, 2019, the Company purchased $464 million of education loans and $66 million of other retail loans.
During the three months ended September 30, 2020, the Company sold $94 million of commercial loans and $879 million of education loans. For further information, see Note 2 and Note 7. During the three months ended September 30, 2019, the Company sold $109 million of commercial loans. During the nine months ended September 30, 2020, the Company sold $356 million of commercial loans, $879 million of education loans and $1.5 billion of residential mortgage loans. During the nine months ended September 30, 2019, the Company sold $291 million of commercial loans and $628 million of retail loans, including $22 million of retail TDRs.
Interest income on direct financing and sales-type leases was $17 millionand $18 millionfor the three months ended September 30, 2020 and 2019, respectively, and was $54 million and $58 million for the nine months ended September 30, 2020 and 2019, respectively, and is reported within interest and fees on loans and leases in the Consolidated Statements of Operations.
NOTE 4 - ALLOWANCE FOR CREDIT LOSSES, NONACCRUING LOANS AND LEASES, AND CONCENTRATIONS OF CREDIT RISK
Allowance for Credit Losses
Management’sRecorded in the ACL is management’s estimate of expected credit losses in the Company’s loan and lease portfolios is recorded in the ALLL and the reserve for unfunded lending commitments (collectively the ACL).portfolios. See Note 5 in the Company’s 20192020 Form 10-K for a detailed discussion of the ACL reserve methodology and estimation techniques as of December 31, 2019. Upon adoption of CECL effective January 1, 2020,2020. There were no significant changes to the Company’s ACL reserve methodology changed to estimate expected credit losses over the contractual life of loans and leases.
The ACL is maintained at a level the Company believes to be appropriate to absorb expected lifetime credit losses over the contractual life of the loan and lease portfolios and on the unfunded lending commitments. The determination of the ACL is based on periodic evaluation of the loan and lease portfolios and unfunded lending commitments that are not unconditionally cancelable considering a number of relevant underlying factors, including key assumptions and evaluation of quantitative and qualitative information.
Key assumptions used in the ACL measurement process include the use of a two-year reasonable and supportable economic forecast period followed by a one-year period during which the expected credit losses revert to long-term historical macroeconomic inputs.
The evaluation of quantitative and qualitative information is performed through assessments of groups of assets that share similar risk characteristics and certain individual loans and leases that do not share similar risk characteristics with the collective group. Loans are grouped generally by product type (e.g., commercial, commercial real estate, residential mortgage, etc.), and significant loan portfolios are assessed for credit losses using econometric models.
The quantitative evaluation of the adequacy of the ACL utilizes a single economic forecast as its foundation, and is primarily based on econometric models that use known or estimated data as of the balance sheet date and forecasted data over the reasonable and supportable period. Known and estimated data include current PD, LGD and EAD (for commercial loans and leases), timing and amount of expected draws (for unfunded lending commitments), FICO, LTV, term and time on books (for retail loans), mix and level of loan balances, delinquency levels, assigned risk ratings, previous loss experience, current business conditions, amounts and timing of expected future cash flows, and factors particular to a specific commercial credit such as competition, business and management performance. Forward-looking economic assumptions include real gross domestic product, unemployment rate, interest rate curve, and changes in collateral values. This data is aggregated to estimate expected credit losses over the contractual life of the loans and leases, adjusted for expected prepayments. In highly volatile economic environments historical information, such as commercial customer financial statements or consumer credit ratings, may not be as important to estimating future expected losses as forecasted inputs to the models.
The ACL may also be affected materially by a variety of qualitative factors that the Company considers to reflect current judgment of various events and risks that are not measured in the statistical procedures including uncertainty related to the economic forecasts used in the modeled credit loss estimates, loan growth, back testing results, credit underwriting policy exceptions, regulatory and audit findings, and peer comparisons. The qualitative allowance is further informed by multiple alternative scenarios to support the period-end ACL balance.
The measurement process results in specific or pooled allowances for loans, leases and unfunded lending commitments, and qualitative allowances that are judgmentally determined and applied across the portfolio.
There are certain loan portfolios that may not need an econometric model to enable the Company to calculate management’s best estimate of the expected credit losses. Less data intensive, non-modeled approaches to estimating losses are considered more efficient and practical for portfolios that have lower levels of outstanding balances (e.g., runoff or closed portfolios, new products or products that are not significant to the Company’s overall credit risk exposure).
Loans and leases that do not share similar risk characteristics are individually assessed for expected credit losses. Nonaccruing commercial and commercial real estate loans with an outstanding balance of $5 million or greater and all commercial and commercial real estate TDRs (regardless of size) are assessed on an individual loan level basis. Generally, the measurement of ACL on individual loans and leases is the present value of its future cash flows or the fair value of its underlying collateral, if the loan or lease is collateral dependent. Loans that are deemed
to be collateral dependent are written down to the fair value, less costs to sell, if sale of the collateral is expected as of the evaluation date and are reassessed each subsequent period to determine if a change to the ACL is required. Subsequent evaluations may result in an increase or decrease to the ACL, based on a corresponding change in the fair value of the collateral during the period. Any subsequent decrease to the ACL (because of an increase to the collateral-dependent loan’s fair value) is limited to the total amount previously written off for that loan. For retail TDRs that are not collateral dependent, the ACL is developed using the present value of expected future cash flows compared to the amortized cost basis in the loans. Expected re-default factors are considered in this analysis. Retail TDRs that are deemed collateral dependent are written down to fair market value less cost to sell.
Expected recoveries are considered in management’s estimate of the ACL and may result in a negative adjustment (i.e., reduction) to the ACL balance. A loan is collateral dependent if repayment is expected to be provided substantially through the operation or sale of the collateral when the borrower is experiencing financial difficulty as of the evaluation date. Generally, repayment would be expected to be provided substantially by the sale or continued operation of the underlying collateral if cash flows to repay the loan from all other available sources (including guarantors) are expected to be no more than nominal. If repayment is dependent only on the operation of the collateral, the fair value of the collateral would not be adjusted for estimated costs to sell. If a loan is considered collateral dependent, the ACL is calculated as the difference between the fair value of collateral (adjusted for the costs to sell if the sale of the collateral is expected) and the amortized cost basis as of the evaluation date. It is possible to have a negative ACL for a collateral dependent loan if the fair value of the collateral increases in a subsequent reporting period. The negative ACL cannot exceed the total amount previously charged off.
Accrued interest receivable on loans and leases is excluded from asset balances used to calculate the ACL. All accrued and uncollected interest is immediately reversed against interest income when a loan or lease is placed on nonaccrual status. Uncollectible interest is written off timely in accordance with regulatory guidelines. Generally, loans and leases are placed on nonaccrual status when contractually past due 90 days or more, or earlier if management believes that the probability of collection is insufficient to warrant further accrual. Residential mortgages are placed on nonaccrual status when contractually past due 120 days or more, or sooner if deemed collateral dependent, unless guaranteed by the Federal Housing Administration. Loans in COVID-19 pandemic-related forbearance programs continue to accrue interest during the forbearance period; a reserve is established for interest income expected to be uncollectible following forbearance. The amount of accrued interest receivable reversed against interest income for the threesix months ended SeptemberJune 30, 2020 was $4 million for total commercial and retail, respectively. Accrued interest reversed against interest income for the nine months ended September 30, 2020 was $7 million and $13 million for total commercial and retail, respectively.
The Company estimates expected credit losses associated with off-balance sheet financial instruments such as standby letters of credit, financial guarantees and unfunded loan commitments that are not unconditionally cancelable. Off-balance sheet financial instruments are subject to individual reviews and are analyzed and segregated by risk according to the Company’s internal risk rating scale. These risk classifications, in conjunction with historical loss experience, current and future economic conditions, timing and amount of expected draws, and performance trends within specific portfolio segments, result in the estimate of the reserve for unfunded lending commitments. The Company does not recognize a reserve for future draws from credit lines that are unconditionally cancelable (e.g., credit cards).
The ALLL and the reserve for unfunded lending commitments are reported on the Consolidated Balance Sheets in the allowance for loan and lease losses and in other liabilities, respectively. Provision for credit losses related to the loan and lease portfolios and the unfunded lending commitments are reported in the Consolidated Statements of Operations as provision for credit losses.
2021.
The following table presents a summary of changes in the ALLL and the reserveallowance for unfunded lending commitments for the three and nine months ended Septemberand six months ended June 30, 2020:2021:
|
| | | | | | | | | | | | | | | | | | | |
| Three Months Ended September 30, 2020 |
| Nine Months Ended September 30, 2020 |
| (in millions) | Commercial |
| Retail |
| Total |
|
| Commercial |
| Retail |
| Total |
|
| Allowance for loan and lease losses, beginning of period |
| $1,235 |
|
| $1,213 |
|
| $2,448 |
|
|
| $674 |
|
| $578 |
|
| $1,252 |
|
| Cumulative effect of change in accounting principle | 0 |
| 0 |
| 0 |
|
| (176 | ) | 629 |
| 453 |
|
| Allowance for loan and lease losses, beginning of period, adjusted | 1,235 |
| 1,213 |
| 2,448 |
|
| 498 |
| 1,207 |
| 1,705 |
|
| Charge-offs | (171 | ) | (86 | ) | (257 | ) |
| (292 | ) | (319 | ) | (611 | ) |
| Recoveries | 1 |
| 37 |
| 38 |
|
| 7 |
| 101 |
| 108 |
|
| Net charge-offs | (170 | ) | (49 | ) | (219 | ) |
| (285 | ) | (218 | ) | (503 | ) |
| Provision charged to income | 224 |
| 89 |
| 313 |
|
| 1,076 |
| 264 |
| 1,340 |
|
| Allowance for loan and lease losses, end of period |
| $1,289 |
|
| $1,253 |
|
| $2,542 |
|
|
| $1,289 |
|
| $1,253 |
|
| $2,542 |
|
|
|
|
|
|
|
|
|
|
|
|
|
| Reserve for unfunded lending commitments, beginning of period |
| $69 |
|
| $10 |
|
| $79 |
|
|
| $44 |
|
| $0 |
|
| $44 |
|
| Cumulative effective of change in accounting principle | 0 |
| 0 |
| 0 |
|
| (3 | ) | 1 |
| (2 | ) |
| Reserve for unfunded lending commitments, beginning of period, adjusted | 69 |
| 10 |
| 79 |
|
| 41 |
| 1 |
| 42 |
|
| Provision for unfunded lending commitments | 83 |
| 32 |
| 115 |
|
| 111 |
| 41 |
| 152 |
|
| Reserve for unfunded lending commitments, end of period |
| $152 |
|
| $42 |
|
| $194 |
|
|
| $152 |
|
| $42 |
|
| $194 |
|
| | | | | | | | | | | | | | | | | | | | | | | |
| Three Months Ended June 30, 2021 | | Six Months Ended June 30, 2021 |
| (in millions) | Commercial | Retail | Total | | Commercial | Retail | Total |
| Allowance for loan and lease losses, beginning of period | $1,146 | | $1,048 | | $2,194 | | | $1,233 | | $1,210 | | $2,443 | |
| | | | | | | |
| | | | | | | |
| Charge-offs | (45) | | (80) | | (125) | | | (179) | | (173) | | (352) | |
| Recoveries | 4 | | 43 | | 47 | | | 34 | | 82 | | 116 | |
| Net charge-offs | (41) | | (37) | | (78) | | | (145) | | (91) | | (236) | |
| | | | | | | |
| Provision charged to income | (152) | | (17) | | (169) | | | (135) | | (125) | | (260) | |
| Allowance for loan and lease losses, end of period | $953 | | $994 | | $1,947 | | | $953 | | $994 | | $1,947 | |
| | | | | | | |
| Allowance for unfunded lending commitments, beginning of period | $165 | | $13 | | $178 | | | $186 | | $41 | | $227 | |
| | | | | | | |
| | | | | | | |
| Provision for unfunded lending commitments | (44) | | 0 | | (44) | | | (65) | | (28) | | (93) | |
| Allowance for unfunded lending commitments, end of period | $121 | | $13 | | $134 | | | $121 | | $13 | | $134 | |
The following table provides additional detail on the cumulative effectOverall, an ending ACL balance of change in accounting principle on the ACL and related coverage ratios:
|
| | | | | | | | | | | | | | | | | | | | | | | | | | |
| | December 31, 2019 | | January 1, 2020 | | September 30, 2020 |
| (in millions) | Amortized Cost Basis | ACL Balance | Coverage | | Impact of Adoption of CECL | ACL Balance | Coverage | | Amortized Cost Basis | ACL Balance | Coverage |
Commercial(1) |
| $41,479 |
|
| $575 |
| 1.4 | % | |
| ($199 | ) |
| $376 |
| 0.9 | % | |
| $45,185 |
|
| $826 |
| 1.8 | % |
| Commercial real estate | 13,522 |
| 124 |
| 0.9 |
| | (57 | ) | 67 |
| 0.5 |
| | 14,889 |
| 548 |
| 3.7 |
|
| Leases | 2,537 |
| 19 |
| 0.7 |
| | 77 |
| 96 |
| 3.8 |
| | 2,288 |
| 67 |
| 2.9 |
|
| Total commercial loans and leases | 57,538 |
| 718 |
| 1.2 |
| | (179 | ) | 539 |
| 0.9 |
| | 62,362 |
| 1,441 |
| 2.3 |
|
| Residential | 19,083 |
| 35 |
| 0.2 |
| | 95 |
| 130 |
| 0.7 |
| | 19,633 |
| 133 |
| 0.7 |
|
| Home equity | 13,154 |
| 83 |
| 0.6 |
| | 73 |
| 156 |
| 1.2 |
| | 12,322 |
| 156 |
| 1.3 |
|
| Automobile | 12,120 |
| 123 |
| 1.0 |
| | 83 |
| 206 |
| 1.7 |
| | 12,035 |
| 221 |
| 1.8 |
|
| Education | 10,347 |
| 116 |
| 1.1 |
| | 298 |
| 414 |
| 4.0 |
| | 11,631 |
| 386 |
| 3.3 |
|
| Other retail | 6,846 |
| 221 |
| 3.2 |
| | 81 |
| 302 |
| 4.4 |
| | 6,088 |
| 399 |
| 6.6 |
|
| Total retail loans | 61,550 |
| 578 |
| 0.9 |
| | 630 |
| 1,208 |
| 2.0 |
| | 61,709 |
| 1,295 |
| 2.1 |
|
| Total loans and leases |
| $119,088 |
|
| $1,296 |
| 1.1 | % | |
| $451 |
|
| $1,747 |
| 1.5 | % | |
| $124,071 |
|
| $2,736 |
| 2.2 | % |
(1) The commercial coverage ratio includes a 21 basis point reduction associated with PPP loans as of September$2.1 billion at June 30, 2021 compared to $2.7 billion at December 31, 2020.
The difference in ACL as of SeptemberJune 30, 20202021 as compared to December 31, 2019 continues2020 was due to be driven bynet charge-offs of $236 million, as detailed below, coupled with a credit provision benefit of $353 million. This reflected strong credit performance across the COVID-19 pandemicretail and associated lockdownscommercial loan portfolios, and the resulting economic impacts from March to September 2020, as well as the Company’s adoption of CECL on January 1, 2020. Citizens added $451 million in ACL upon adoption of CECL, and has since added an additional $989 millionimprovement in the nine months ended September 30, 2020, resulting in an ending ACL balance of $2.7 billion.macroeconomic outlook.
The increase in commercial net charge-offs inof $30 million for the ninesix months ended SeptemberJune 30, 20202021 as compared to the ninesix months ended SeptemberJune 30, 20192020 was driven by COVID-19-related charge-offs in CRE, metals and mining, oil and gas, and casual dining industry sectors.CRE. Retail net charge-offs were flatdown $78 million in the ninesix months ended September 20, 2020June 30, 2021 as compared to the ninesix months ended SeptemberJune 30, 2019.
2020 as a result of government stimulus and forbearance programs as well as strong collateral values in automobile and residential real estate.
To determine the ACL as of SeptemberJune 30, 2020,2021, Citizens utilized an economic scenarioforecast that generally reflects real GDP growth of 4.5%approximately 5.7% over 2021, returning to fourth quarter 2019 real GDP levels by the first quarter of 2022.2021. The scenarioforecast also projects the fourth quarter 2020 unemployment rate to be in the range of 9%5.9% to 9.5%, and falling6.6% throughout 2021. This forecast reflects an overall improved macroeconomic outlook as compared to 7%December 31, 2020. In addition to 7.5% by the fourth quarter of 2021. While the macroeconomic forecast was slightly improved relativejudgment applied to the second quarter 2020 forecast,commercial portfolio as a whole, Citizens continued to apply management judgment to adjust the modeled reserves in the commercial industry sectors most impacted by the COVID-19-relatedCOVID-19 pandemic and associated lockdowns, including inCRE retail and hospitality and casual dining, retail trade, price-sensitive energy and related, and educational services, as well as in certain retail products.dining.
Citizens Financial Group, Inc. | 61
The following table presents a summary of changes in the ALLL and the reserveallowance for unfunded lending commitments for the three months and ninesix months ended SeptemberJune 30, 2019:2020:
|
| | | | | | | | | | | | | | | | | | | |
| | Three Months Ended September 30, 2019 | | Nine Months Ended September 30, 2019 |
| (in millions) | Commercial |
| Retail |
| Total |
| | Commercial |
| Retail |
| Total |
|
| Allowance for loan and lease losses, beginning of period |
| $680 |
|
| $547 |
|
| $1,227 |
| |
| $690 |
|
| $552 |
|
| $1,242 |
|
| Charge-offs | (35 | ) | (124 | ) | (159 | ) | | (106 | ) | (347 | ) | (453 | ) |
| Recoveries | 3 |
| 43 |
| 46 |
| | 17 |
| 128 |
| 145 |
|
| Net charge-offs | (32 | ) | (81 | ) | (113 | ) | | (89 | ) | (219 | ) | (308 | ) |
| Provision charged to income | 64 |
| 85 |
| 149 |
| | 111 |
| 218 |
| 329 |
|
| Allowance for loan and lease losses, end of period |
| $712 |
|
| $551 |
|
| $1,263 |
| |
| $712 |
|
| $551 |
|
| $1,263 |
|
| | | | | | | | |
| Reserve for unfunded lending commitments, beginning of period |
| $93 |
|
| $0 |
|
| $93 |
| |
| $91 |
|
| $0 |
|
| $91 |
|
| Provision for unfunded lending commitments | (48 | ) | 0 |
| (48 | ) | | (46 | ) | 0 |
| (46 | ) |
| Reserve for unfunded lending commitments, end of period |
| $45 |
|
| $0 |
|
| $45 |
| |
| $45 |
|
| $0 |
|
| $45 |
|
| | | | | | | | | | | | | | | | | | | | | | | |
| Three Months Ended June 30, 2020 | | Six Months Ended June 30, 2020 |
| (in millions) | Commercial | Retail | Total | | Commercial | Retail | Total |
| Allowance for loan and lease losses, beginning of period | $752 | | $1,419 | | $2,171 | | | $674 | | $578 | | $1,252 | |
| Cumulative effect of change in accounting principle | 0 | | 0 | | 0 | | | (176) | | 629 | | 453 | |
| Allowance for loan and lease losses, beginning of period, adjusted | 752 | | 1,419 | | 2,171 | | | 498 | | 1,207 | | 1,705 | |
| Charge-offs | (74) | | (106) | | (180) | | | (121) | | (233) | | (354) | |
| Recoveries | 3 | | 30 | | 33 | | | 6 | | 64 | | 70 | |
| Net charge-offs | (71) | | (76) | | (147) | | | (115) | | (169) | | (284) | |
| | | | | | | |
| Provision charged to income | 554 | | (130) | | 424 | | | 852 | | 175 | | 1,027 | |
| Allowance for loan and lease losses, end of period | $1,235 | | $1,213 | | $2,448 | | | $1,235 | | $1,213 | | $2,448 | |
| | | | | | | |
| Allowance for unfunded lending commitments, beginning of period | $38 | | $1 | | $39 | | | $44 | | $0 | | $44 | |
| Cumulative effect of change in accounting principle | 0 | | 0 | | 0 | | | (3) | | 1 | | (2) | |
| Allowance for unfunded lending commitments, beginning of period, adjusted | 38 | | 1 | | 39 | | | 41 | | 1 | | 42 | |
| Provision for unfunded lending commitments | 31 | | 9 | | 40 | | | 28 | | 9 | | 37 | |
| Allowance for unfunded lending commitments, end of period | $69 | | $10 | | $79 | | | $69 | | $10 | | $79 | |
Credit Quality Indicators
LoanThe Company presents loan and lease portfolio segments and classes excluding LHFS, are presented by credit quality indicator and vintage year. Citizens defines the vintage date for the purpose of this disclosure as the date of the most recent credit decision. In general, renewals are categorized as new credit decisions and reflect the renewal date as the vintage date. Loans modified in a TDR are considered to be a continuation of the original loan and vintage date corresponds with the initial loan origination date.most recent credit decision.
For commercial loans and leases, Citizens utilizes regulatory classification ratings to monitor credit quality. RegulatoryThe assignment of regulatory classification ratings are assignedoccurs at loan origination and are periodically re-evaluated by Citizens utilizing a risk-based approach, or atincluding any time management becomes aware of information affecting the borrowers' ability to fulfill their obligations. BothThe review process considers both quantitative and qualitative factors are considered in this review process.factors. Loans with a “pass” rating are those that the Company believes will be fully repaidrepay in accordance with the contractual loan terms. Commercial loans and leases that areidentified as “criticized” are those that have some weakness or potential weakness that indicate an increased probability of future loss. “Criticized”Citizens groups “criticized” loans are grouped into three categories, “special mention,” “substandard”“substandard,” and “doubtful.” Special mention loans have potential weaknesses that, if left uncorrected, may result in deterioration of the Company’s credit position at some future date. Substandard loans are inadequately protected loans; these loans have well-defined weaknesses that could hinder normal repayment or collection of the debt. Doubtful loans have the same weaknesses as substandard, with the added characteristicscharacteristic that the possibility of loss is high and collection of the full amount of the loan is improbable.
Citizens Financial Group, Inc. | 62
The following table presents the amortized cost basis of commercial loans and leases, by vintage date and regulatory classification rating, as of SeptemberJune 30, 2020:2021:
| | | | Term Loans by Origination Year | | Revolving Loans | | | | Term Loans by Origination Year | | Revolving Loans | |
| (in millions) | 2020 | | 2019 | | 2018 | | 2017 | | 2016 | | Prior to 2016 | | Within the Revolving Period | Converted to Term | | Total |
| (in millions) | 2021 | | 2020 | | 2019 | | 2018 | | 2017 | | Prior to 2017 | | Within the Revolving Period | Converted to Term | | Total |
| Commercial | | | | | | | | | | | | | | | | |
| Commercial and industrial | | Commercial and industrial | | | | | | | | | | | | | | | |
Pass(1) |
| $7,478 |
| |
| $6,823 |
| |
| $4,838 |
| |
| $2,747 |
| |
| $1,515 |
| |
| $2,453 |
| |
| $15,115 |
|
| $182 |
| |
| $41,151 |
| Pass(1) | $5,146 | | | $5,140 | | | $5,260 | | | $3,623 | | | $1,975 | | | $2,797 | | | $15,853 | | $151 | | | $39,945 | |
| Special Mention | 58 |
| | 275 |
| | 237 |
| | 149 |
| | 92 |
| | 222 |
| | 892 |
| 125 |
| | 2,050 |
| Special Mention | 3 | | | 41 | | | 196 | | | 196 | | | 74 | | | 181 | | | 454 | | 0 | | | 1,145 | |
| Substandard | 60 |
| | 220 |
| | 326 |
| | 100 |
| | 85 |
| | 140 |
| | 630 |
| 19 |
| | 1,580 |
| Substandard | 32 | | | 125 | | | 263 | | | 267 | | | 114 | | | 226 | | | 583 | | 21 | | | 1,631 | |
| Doubtful | 52 |
| | 22 |
| | 35 |
| | 43 |
| | 20 |
| | 42 |
| | 186 |
| 4 |
| | 404 |
| Doubtful | 27 | | | 16 | | | 16 | | | 22 | | | 12 | | | 18 | | | 7 | | 3 | | | 121 | |
| Total commercial | 7,648 |
| | 7,340 |
| | 5,436 |
| | 3,039 |
| | 1,712 |
| | 2,857 |
| | 16,823 |
| 330 |
| | 45,185 |
| |
| Total commercial and industrial | | Total commercial and industrial | 5,208 | | | 5,322 | | | 5,735 | | | 4,108 | | | 2,175 | | | 3,222 | | | 16,897 | | 175 | | | 42,842 | |
| Commercial real estate | | | | | | | | | | | | | | |
| Commercial real estate | | | | | | | | | | | | | | | |
| Pass | 1,774 |
| | 3,406 |
| | 3,608 |
| | 1,553 |
| | 825 |
| | 1,112 |
| | 1,073 |
| 0 |
| | 13,351 |
| Pass | 462 | | | 2,572 | | | 3,726 | | | 3,013 | | | 1,026 | | | 1,507 | | | 809 | | 0 | | | 13,115 | |
| Special Mention | 11 |
| | 216 |
| | 128 |
| | 237 |
| | 171 |
| | 9 |
| | 77 |
| 0 |
| | 849 |
| Special Mention | 73 | | | 7 | | | 193 | | | 102 | | | 155 | | | 122 | | | 14 | | 0 | | | 666 | |
| Substandard | 68 |
| | 1 |
| | 170 |
| | 50 |
| | 53 |
| | 66 |
| | 60 |
| 0 |
| | 468 |
| Substandard | 1 | | | 39 | | | 210 | | | 135 | | | 146 | | | 73 | | | 0 | | 0 | | | 604 | |
| Doubtful | 20 |
| | 38 |
| | 53 |
| | 0 |
| | 36 |
| | 3 |
| | 24 |
| 47 |
| | 221 |
| Doubtful | 0 | | | 9 | | | 16 | | | 0 | | | 0 | | | 2 | | | 0 | | 0 | | | 27 | |
| Total commercial real estate | 1,873 |
| | 3,661 |
| | 3,959 |
| | 1,840 |
| | 1,085 |
| | 1,190 |
| | 1,234 |
| 47 |
| | 14,889 |
| Total commercial real estate | 536 | | | 2,627 | | | 4,145 | | | 3,250 | | | 1,327 | | | 1,704 | | | 823 | | 0 | | | 14,412 | |
| Leases | | | | | | | | | | | | | | |
| Leases | | | | | | | | | | | | | | | |
| Pass | 332 |
| | 327 |
| | 265 |
| | 169 |
| | 200 |
| | 917 |
| | 0 |
| 0 |
| | 2,210 |
| Pass | 269 | | | 368 | | | 216 | | | 203 | | | 98 | | | 622 | | | 0 | | 0 | | | 1,776 | |
| Special Mention | 0 |
| | 2 |
| | 3 |
| | 6 |
| | 5 |
| | 25 |
| | 0 |
| 0 |
| | 41 |
| Special Mention | 1 | | | 2 | | | 1 | | | 2 | | | 5 | | | 18 | | | 0 | | 0 | | | 29 | |
| Substandard | 0 |
| | 2 |
| | 2 |
| | 5 |
| | 4 |
| | 0 |
| | 0 |
| 0 |
| | 13 |
| Substandard | 0 | | | 16 | | | 5 | | | 1 | | | 0 | | | 1 | | | 0 | | 0 | | | 23 | |
| Doubtful | 0 |
| | 0 |
| | 9 |
| | 1 |
| | 3 |
| | 11 |
| | 0 |
| 0 |
| | 24 |
| Doubtful | 0 | | | 0 | | | 0 | | | 0 | | | 0 | | | 1 | | | 0 | | 0 | | | 1 | |
| Total leases | 332 |
| | 331 |
| | 279 |
| | 181 |
| | 212 |
| | 953 |
| | 0 |
| 0 |
| | 2,288 |
| Total leases | 270 | | | 386 | | | 222 | | | 206 | | | 103 | | | 642 | | | 0 | | 0 | | | 1,829 | |
| Total commercial loans and leases | | | | | | | | | | | | | | | | |
| Total commercial | | Total commercial | | | | | | | | | | | | | | | |
Pass(1) | 9,584 |
| | 10,556 |
| | 8,711 |
| | 4,469 |
| | 2,540 |
| | 4,482 |
| | 16,188 |
| 182 |
| | 56,712 |
| Pass(1) | 5,877 | | | 8,080 | | | 9,202 | | | 6,839 | | | 3,099 | | | 4,926 | | | 16,662 | | 151 | | | 54,836 | |
| Special Mention | 69 |
| | 493 |
| | 368 |
| | 392 |
| | 268 |
| | 256 |
| | 969 |
| 125 |
| | 2,940 |
| Special Mention | 77 | | | 50 | | | 390 | | | 300 | | | 234 | | | 321 | | | 468 | | 0 | | | 1,840 | |
| Substandard | 128 |
| | 223 |
| | 498 |
| | 155 |
| | 142 |
| | 206 |
| | 690 |
| 19 |
| | 2,061 |
| Substandard | 33 | | | 180 | | | 478 | | | 403 | | | 260 | | | 300 | | | 583 | | 21 | | | 2,258 | |
| Doubtful | 72 |
| | 60 |
| | 97 |
| | 44 |
| | 59 |
| | 56 |
| | 210 |
| 51 |
| | 649 |
| Doubtful | 27 | | | 25 | | | 32 | | | 22 | | | 12 | | | 21 | | | 7 | | 3 | | | 149 | |
| Total commercial loans and leases |
| $9,853 |
| |
| $11,332 |
| |
| $9,674 |
| |
| $5,060 |
| |
| $3,009 |
| |
| $5,000 |
| |
| $18,057 |
|
| $377 |
| |
| $62,362 |
| |
| Total commercial | | Total commercial | $6,014 | | | $8,335 | | | $10,102 | | | $7,564 | | | $3,605 | | | $5,568 | | | $17,720 | | $175 | | | $59,083 | |
(1) Includes $4.7$3.5 billion of PPP loans designated as pass that are fully guaranteed by the SBA originating in 2021 and 2020.
Citizens Financial Group, Inc. | 63
The following table presents the amortized cost basis of commercial loans and leases, by vintage date and regulatory classification rating, as of December 31, 2020:
| | | | | | | | | | | | | | | | | | | | | | | | | | | | | | | | | | | | | | | | | | | | | | | | | | |
| Term Loans by Origination Year | | Revolving Loans | | |
| (in millions) | 2020 | | 2019 | | 2018 | | 2017 | | 2016 | | Prior to 2016 | | Within the Revolving Period | Converted to Term | | Total |
| Commercial and industrial | | | | | | | | | | | | | | | | |
Pass(1) | $8,036 | | | $5,730 | | | $4,180 | | | $2,174 | | | $1,157 | | | $1,980 | | | $17,281 | | $340 | | | $40,878 | |
| Special Mention | 34 | | | 264 | | | 163 | | | 84 | | | 60 | | | 173 | | | 771 | | 34 | | | 1,583 | |
| Substandard | 91 | | | 195 | | | 248�� | | | 100 | | | 81 | | | 127 | | | 600 | | 22 | | | 1,464 | |
| Doubtful | 65 | | | 10 | | | 34 | | | 38 | | | 3 | | | 31 | | | 63 | | 4 | | | 248 | |
| Total commercial and industrial | 8,226 | | | 6,199 | | | 4,625 | | | 2,396 | | | 1,301 | | | 2,311 | | | 18,715 | | 400 | | | 44,173 | |
| Commercial real estate | | | | | | | | | | | | | | | | |
| Pass | 1,848 | | | 2,836 | | | 2,810 | | | 1,106 | | | 566 | | | 919 | | | 3,271 | | 0 | | | 13,356 | |
| Special Mention | 19 | | | 130 | | | 121 | | | 92 | | | 94 | | | 48 | | | 300 | | 0 | | | 804 | |
| Substandard | 116 | | | 2 | | | 65 | | | 5 | | | 53 | | | 26 | | | 149 | | 0 | | | 416 | |
| Doubtful | 16 | | | 26 | | | 8 | | | 0 | | | 0 | | | 2 | | | 24 | | 0 | | | 76 | |
| Total commercial real estate | 1,999 | | | 2,994 | | | 3,004 | | | 1,203 | | | 713 | | | 995 | | | 3,744 | | 0 | | | 14,652 | |
| Leases | | | | | | | | | | | | | | | | |
| Pass | 455 | | | 246 | | | 229 | | | 139 | | | 180 | | | 673 | | | 0 | | 0 | | | 1,922 | |
| Special Mention | 3 | | | 4 | | | 2 | | | 4 | | | 2 | | | 18 | | | 0 | | 0 | | | 33 | |
| Substandard | 0 | | | 2 | | | 2 | | | 4 | | | 4 | | | 0 | | | 0 | | 0 | | | 12 | |
| Doubtful | 0 | | | 0 | | | 0 | | | 0 | | | 0 | | | 1 | | | 0 | | 0 | | | 1 | |
| Total leases | 458 | | | 252 | | | 233 | | | 147 | | | 186 | | | 692 | | | 0 | | 0 | | | 1,968 | |
| Total commercial | | | | | | | | | | | | | | | | |
Pass(1) | 10,339 | | | 8,812 | | | 7,219 | | | 3,419 | | | 1,903 | | | 3,572 | | | 20,552 | | 340 | | | 56,156 | |
| Special Mention | 56 | | | 398 | | | 286 | | | 180 | | | 156 | | | 239 | | | 1,071 | | 34 | | | 2,420 | |
| Substandard | 207 | | | 199 | | | 315 | | | 109 | | | 138 | | | 153 | | | 749 | | 22 | | | 1,892 | |
| Doubtful | 81 | | | 36 | | | 42 | | | 38 | | | 3 | | | 34 | | | 87 | | 4 | | | 325 | |
| Total commercial | $10,683 | | | $9,445 | | | $7,862 | | | $3,746 | | | $2,200 | | | $3,998 | | | $22,459 | | $400 | | | $60,793 | |
(1) Includes $4.2 billion PPP loans designated as pass that are fully guaranteed by the SBA originating in 2020.
For retail loans, Citizens utilizes FICO credit scores provided by FICO which are generally refreshed on a quarterly basis and the loan’s payment and delinquency status to monitor credit quality. Management believes FICO credit scores are considered the strongest indicator of credit losses over the contractual life of the loan asand assist management in predicting the scoresborrower’s future payment performance. Scores are based on current and historical national industry-wide consumer level credit performance data, and assist management in predicting the borrower’s future payment performance.data.
Citizens Financial Group, Inc. | 64
The following table presents the amortized cost basis of retail loans, by vintage date and FICO scores, as of SeptemberJune 30, 2020:2021:
| | | | Term Loans by Origination Year | | Revolving Loans | | | | Term Loans by Origination Year | | Revolving Loans | |
| (in millions) | 2020 | | 2019 | | 2018 | | 2017 | | 2016 | | Prior to 2016 | | Within the Revolving Period | Converted to Term | | Total |
| (in millions) | 2021 | | 2020 | | 2019 | | 2018 | | 2017 | | Prior to 2017 | | Within the Revolving Period | Converted to Term | | Total |
| Residential mortgages | | | | | | | | | | | | | | | | Residential mortgages | | | | | | | | | | | | | | | |
| 800+ |
| $1,971 |
| |
| $1,983 |
| |
| $751 |
| |
| $1,297 |
| |
| $1,833 |
| |
| $2,061 |
| |
| $0 |
|
| $0 |
| |
| $9,896 |
| 800+ | $851 | | | $3,079 | | | $1,574 | | | $454 | | | $897 | | | $2,697 | | | $0 | | $0 | | | $9,552 | |
| 740-799 | 2,351 |
| | 1,341 |
| | 463 |
| | 612 |
| | 776 |
| | 977 |
| | 0 |
| 0 |
| | 6,520 |
| 740-799 | 1,619 | | | 2,261 | | | 890 | | | 311 | | | 448 | | | 1,335 | | | 0 | | 0 | | | 6,864 | |
| 680-739 | 596 |
| | 408 |
| | 193 |
| | 207 |
| | 317 |
| | 500 |
| | 0 |
| 0 |
| | 2,221 |
| 680-739 | 377 | | | 653 | | | 360 | | | 178 | | | 169 | | | 660 | | | 0 | | 0 | | | 2,397 | |
| 620-679 | 101 |
| | 97 |
| | 44 |
| | 51 |
| | 69 |
| | 235 |
| | 0 |
| 0 |
| | 597 |
| 620-679 | 42 | | | 112 | | | 180 | | | 103 | | | 117 | | | 328 | | | 0 | | 0 | | | 882 | |
| <620 | 17 |
| | 23 |
| | 34 |
| | 56 |
| | 54 |
| | 197 |
| | 0 |
| 0 |
| | 381 |
| <620 | 2 | | | 49 | | | 153 | | | 162 | | | 167 | | | 293 | | | 0 | | 0 | | | 826 | |
No FICO available(1) | 4 |
| | 1 |
| | 0 |
| | 1 |
| | 0 |
| | 12 |
| | 0 |
| 0 |
| | 18 |
| No FICO available(1) | 2 | | | 3 | | | 1 | | | 0 | | | 0 | | | 11 | | | 0 | | 0 | | | 17 | |
| Total residential mortgages | 5,040 |
| | 3,853 |
| | 1,485 |
| | 2,224 |
| | 3,049 |
| | 3,982 |
| | 0 |
| 0 |
| | 19,633 |
| Total residential mortgages | 2,893 | | | 6,157 | | | 3,158 | | | 1,208 | | | 1,798 | | | 5,324 | | | 0 | | 0 | | | 20,538 | |
| Home equity | | | | | | | | | | | | | | | | Home equity | | | | | | | | | | | | | | | |
| 800+ | 3 |
| | 9 |
| | 11 |
| | 7 |
| | 5 |
| | 245 |
| | 4,319 |
| 360 |
| | 4,959 |
| 800+ | 1 | | | 2 | | | 6 | | | 6 | | | 5 | | | 170 | | | 4,292 | | 318 | | | 4,800 | |
| 740-799 | 1 |
| | 7 |
| | 7 |
| | 7 |
| | 4 |
| | 204 |
| | 3,224 |
| 340 |
| | 3,794 |
| 740-799 | 0 | | | 1 | | | 5 | | | 6 | | | 6 | | | 146 | | | 3,333 | | 306 | | | 3,803 | |
| 680-739 | 0 |
| | 4 |
| | 9 |
| | 14 |
| | 8 |
| | 197 |
| | 1,671 |
| 293 |
| | 2,196 |
| 680-739 | 0 | | | 1 | | | 8 | | | 13 | | | 18 | | | 162 | | | 1,608 | | 274 | | | 2,084 | |
| 620-679 | 0 |
| | 8 |
| | 16 |
| | 19 |
| | 12 |
| | 146 |
| | 420 |
| 201 |
| | 822 |
| 620-679 | 0 | | | 3 | | | 13 | | | 24 | | | 20 | | | 133 | | | 336 | | 182 | | | 711 | |
| <620 | 1 |
| | 15 |
| | 27 |
| | 30 |
| | 18 |
| | 129 |
| | 117 |
| 213 |
| | 550 |
| <620 | 0 | | | 3 | | | 20 | | | 25 | | | 23 | | | 106 | | | 79 | | 187 | | | 443 | |
No FICO available(1) | 0 |
| | 0 |
| | 0 |
| | 0 |
| | 0 |
| | 0 |
| | 1 |
| 0 |
| | 1 |
| No FICO available(1) | 0 | | | 0 | | | 0 | | | 0 | | | 0 | | | 0 | | | 0 | | 0 | | | 0 | |
| Total home equity | 5 |
| | 43 |
| | 70 |
| | 77 |
| | 47 |
| | 921 |
| | 9,752 |
| 1,407 |
| | 12,322 |
| Total home equity | 1 | | | 10 | | | 52 | | | 74 | | | 72 | | | 717 | | | 9,648 | | 1,267 | | | 11,841 | |
| Automobile | | | | | | | | | | | | | | | | Automobile | | | | | | | | | | | | | | | |
| 800+ | 780 |
| | 862 |
| | 472 |
| | 358 |
| | 209 |
| | 91 |
| | 0 |
| 0 |
| | 2,772 |
| 800+ | 756 | | | 951 | | | 681 | | | 333 | | | 223 | | | 122 | | | 0 | | 0 | | | 3,066 | |
| 740-799 | 1,130 |
| | 1,127 |
| | 606 |
| | 406 |
| | 214 |
| | 87 |
| | 0 |
| 0 |
| | 3,570 |
| 740-799 | 1,096 | | | 1,320 | | | 813 | | | 401 | | | 242 | | | 122 | | | 0 | | 0 | | | 3,994 | |
| 680-739 | 1,028 |
| | 1,012 |
| | 527 |
| | 327 |
| | 170 |
| | 69 |
| | 0 |
| 0 |
| | 3,133 |
| 680-739 | 969 | | | 1,109 | | | 690 | | | 335 | | | 190 | | | 98 | | | 0 | | 0 | | | 3,391 | |
| 620-679 | 523 |
| | 557 |
| | 300 |
| | 185 |
| | 102 |
| | 46 |
| | 0 |
| 0 |
| | 1,713 |
| 620-679 | 458 | | | 506 | | | 345 | | | 184 | | | 108 | | | 63 | | | 0 | | 0 | | | 1,664 | |
| <620 | 90 |
| | 245 |
| | 202 |
| | 157 |
| | 96 |
| | 48 |
| | 0 |
| 0 |
| | 838 |
| <620 | 59 | | | 138 | | | 180 | | | 133 | | | 90 | | | 61 | | | 0 | | 0 | | | 661 | |
No FICO available(1) | 1 |
| | 1 |
| | 0 |
| | 0 |
| | 0 |
| | 7 |
| | 0 |
| 0 |
| | 9 |
| No FICO available(1) | 3 | | | 0 | | | 0 | | | 0 | | | 0 | | | 1 | | | 0 | | 0 | | | 4 | |
| Total automobile | 3,552 |
| | 3,804 |
| | 2,107 |
| | 1,433 |
| | 791 |
| | 348 |
| | 0 |
| 0 |
| | 12,035 |
| Total automobile | 3,341 | | | 4,024 | | | 2,709 | | | 1,386 | | | 853 | | | 467 | | | 0 | | 0 | | | 12,780 | |
| Education | | | | | | | | | | | | | | | | Education | | | | | | | | | | | | | | | |
| 800+ | 1,191 |
| | 1,276 |
| | 810 |
| | 772 |
| | 586 |
| | 776 |
| | 0 |
| 0 |
| | 5,411 |
| 800+ | 564 | | | 1,843 | | | 1,103 | | | 662 | | | 590 | | | 1,066 | | | 0 | | — | | | 5,828 | |
| 740-799 | 1,307 |
| | 1,151 |
| | 621 |
| | 449 |
| | 292 |
| | 443 |
| | 0 |
| 0 |
| | 4,263 |
| 740-799 | 759 | | | 1,831 | | | 892 | | | 480 | | | 338 | | | 614 | | | 0 | | 0 | | | 4,914 | |
| 680-739 | 385 |
| | 378 |
| | 217 |
| | 160 |
| | 110 |
| | 239 |
| | 0 |
| 0 |
| | 1,489 |
| 680-739 | 204 | | | 536 | | | 289 | | | 172 | | | 123 | | | 300 | | | 0 | | 0 | | | 1,624 | |
| 620-679 | 27 |
| | 52 |
| | 42 |
| | 36 |
| | 31 |
| | 108 |
| | 0 |
| 0 |
| | 296 |
| 620-679 | 14 | | | 54 | | | 45 | | | 37 | | | 29 | | | 110 | | | 0 | | 0 | | | 289 | |
| <620 | 2 |
| | 7 |
| | 13 |
| | 14 |
| | 12 |
| | 56 |
| | 0 |
| 0 |
| | 104 |
| <620 | 1 | | | 6 | | | 10 | | | 12 | | | 10 | | | 49 | | | 0 | | 0 | | | 88 | |
No FICO available(1) | 6 |
| | 0 |
| | 0 |
| | 0 |
| | 0 |
| | 62 |
| | 0 |
| 0 |
| | 68 |
| No FICO available(1) | 2 | | | 0 | | | 0 | | | 0 | | | 0 | | | 55 | | | 0 | | 0 | | | 57 | |
| Total education | 2,918 |
| | 2,864 |
| | 1,703 |
| | 1,431 |
| | 1,031 |
| | 1,684 |
| | 0 |
| 0 |
| | 11,631 |
| Total education | 1,544 | | | 4,270 | | | 2,339 | | | 1,363 | | | 1,090 | | | 2,194 | | | 0 | | 0 | | | 12,800 | |
| Other retail | | | | | | | | | | | | | | | | Other retail | | | | | | | | | | | | | | | |
| 800+ | 286 |
| | 474 |
| | 174 |
| | 79 |
| | 17 |
| | 49 |
| | 313 |
| 0 |
| | 1,392 |
| 800+ | 107 | | | 343 | | | 209 | | | 100 | | | 48 | | | 42 | | | 357 | | 0 | | | 1,206 | |
| 740-799 | 419 |
| | 611 |
| | 217 |
| | 97 |
| | 23 |
| | 33 |
| | 621 |
| 2 |
| | 2,023 |
| 740-799 | 169 | | | 479 | | | 285 | | | 128 | | | 58 | | | 36 | | | 662 | | 2 | | | 1,819 | |
| 680-739 | 356 |
| | 409 |
| | 141 |
| | 60 |
| | 13 |
| | 17 |
| | 555 |
| 6 |
| | 1,557 |
| 680-739 | 150 | | | 372 | | | 190 | | | 85 | | | 37 | | | 18 | | | 593 | | 5 | | | 1,450 | |
| 620-679 | 195 |
| | 156 |
| | 51 |
| | 19 |
| | 3 |
| | 6 |
| | 181 |
| 7 |
| | 618 |
| 620-679 | 94 | | | 181 | | | 65 | | | 28 | | | 10 | | | 6 | | | 208 | | 6 | | | 598 | |
| <620 | 18 |
| | 45 |
| | 24 |
| | 9 |
| | 2 |
| | 4 |
| | 81 |
| 9 |
| | 192 |
| <620 | 11 | | | 39 | | | 23 | | | 13 | | | 4 | | | 2 | | | 66 | | 7 | | | 165 | |
No FICO available(1) | 36 |
| | 1 |
| | 0 |
| | 0 |
| | 0 |
| | 0 |
| | 267 |
| 2 |
| | 306 |
| No FICO available(1) | 6 | | | 8 | | | 0 | | | 0 | | | 0 | | | 0 | | | 285 | | 2 | | | 301 | |
| Total other retail | 1,310 |
| | 1,696 |
| | 607 |
| | 264 |
| | 58 |
| | 109 |
| | 2,018 |
| 26 |
| | 6,088 |
| Total other retail | 537 | | | 1,422 | | | 772 | | | 354 | | | 157 | | | 104 | | | 2,171 | | 22 | | | 5,539 | |
| Retail | | | | | | | | | | | | | | | | |
| Total retail | | Total retail | | | | | | | | | | | | | | | |
| 800+ | 4,231 |
| | 4,604 |
| | 2,218 |
| | 2,513 |
| | 2,650 |
| | 3,222 |
| | 4,632 |
| 360 |
| | 24,430 |
| 800+ | 2,279 | | | 6,218 | | | 3,573 | | | 1,555 | | | 1,763 | | | 4,097 | | | 4,649 | | 318 | | | 24,452 | |
| 740-799 | 5,208 |
| | 4,237 |
| | 1,914 |
| | 1,571 |
| | 1,309 |
| | 1,744 |
| | 3,845 |
| 342 |
| | 20,170 |
| 740-799 | 3,643 | | | 5,892 | | | 2,885 | | | 1,326 | | | 1,092 | | | 2,253 | | | 3,995 | | 308 | | | 21,394 | |
| 680-739 | 2,365 |
| | 2,211 |
| | 1,087 |
| | 768 |
| | 618 |
| | 1,022 |
| | 2,226 |
| 299 |
| | 10,596 |
| 680-739 | 1,700 | | | 2,671 | | | 1,537 | | | 783 | | | 537 | | | 1,238 | | | 2,201 | | 279 | | | 10,946 | |
| 620-679 | 846 |
| | 870 |
| | 453 |
| | 310 |
| | 217 |
| | 541 |
| | 601 |
| 208 |
| | 4,046 |
| 620-679 | 608 | | | 856 | | | 648 | | | 376 | | | 284 | | | 640 | | | 544 | | 188 | | | 4,144 | |
| <620 | 128 |
| | 335 |
| | 300 |
| | 266 |
| | 182 |
| | 434 |
| | 198 |
| 222 |
| | 2,065 |
| <620 | 73 | | | 235 | | | 386 | | | 345 | | | 294 | | | 511 | | | 145 | | 194 | | | 2,183 | |
No FICO available(1) | 47 |
| | 3 |
| | 0 |
| | 1 |
| | 0 |
| | 81 |
| | 268 |
| 2 |
| | 402 |
| No FICO available(1) | 13 | | | 11 | | | 1 | | | 0 | | | 0 | | | 67 | | | 285 | | 2 | | | 379 | |
| Total retail |
| $12,825 |
| |
| $12,260 |
| |
| $5,972 |
| |
| $5,429 |
| |
| $4,976 |
| |
| $7,044 |
| |
| $11,770 |
|
| $1,433 |
| |
| $61,709 |
| Total retail | $8,316 | | | $15,883 | | | $9,030 | | | $4,385 | | | $3,970 | | | $8,806 | | | $11,819 | | $1,289 | | | $63,498 | |
(1) Represents loans for which an updated FICO score was unavailable (e.g., due to recent profile changes).
Citizens Financial Group, Inc. | 65
The following table presents the amortized cost basis of retail loans, by vintage date and FICO scores, as of December 31, 2020:
| | | | | | | | | | | | | | | | | | | | | | | | | | | | | | | | | | | | | | | | | | | | | | | | | | |
| Term Loans by Origination Year | | Revolving Loans | | |
| (in millions) | 2020 | | 2019 | | 2018 | | 2017 | | 2016 | | Prior to 2016 | | Within the Revolving Period | Converted to Term | | Total |
| Residential mortgages | | | | | | | | | | | | | | | | |
| 800+ | $2,687 | | | $1,885 | | | $638 | | | $1,129 | | | $1,615 | | | $1,755 | | | $0 | | $0 | | | $9,709 | |
| 740-799 | 2,931 | | | 1,133 | | | 398 | | | 527 | | | 743 | | | 904 | | | 0 | | 0 | | | 6,636 | |
| 680-739 | 784 | | | 351 | | | 162 | | | 172 | | | 295 | | | 458 | | | 0 | | 0 | | | 2,222 | |
| 620-679 | 97 | | | 94 | | | 44 | | | 56 | | | 66 | | | 223 | | | 0 | | 0 | | | 580 | |
| <620 | 12 | | | 28 | | | 35 | | | 58 | | | 50 | | | 185 | | | 0 | | 0 | | | 368 | |
No FICO available(1) | 1 | | | 2 | | | 1 | | | 5 | | | 1 | | | 14 | | | 0 | | 0 | | | 24 | |
| Total residential mortgages | 6,512 | | | 3,493 | | | 1,278 | | | 1,947 | | | 2,770 | | | 3,539 | | | 0 | | 0 | | | 19,539 | |
| Home equity | | | | | | | | | | | | | | | | |
| 800+ | 2 | | | 8 | | | 10 | | | 7 | | | 5 | | | 216 | | | 4,319 | | 344 | | | 4,911 | |
| 740-799 | 2 | | | 6 | | | 7 | | | 6 | | | 5 | | | 180 | | | 3,234 | | 331 | | | 3,771 | |
| 680-739 | 1 | | | 6 | | | 10 | | | 15 | | | 8 | | | 179 | | | 1,632 | | 284 | | | 2,135 | |
| 620-679 | 0 | | | 10 | | | 18 | | | 21 | | | 14 | | | 136 | | | 402 | | 195 | | | 796 | |
| <620 | 1 | | | 17 | | | 30 | | | 29 | | | 18 | | | 122 | | | 105 | | 214 | | | 536 | |
| | | | | | | | | | | | | | | | |
| Total home equity | 6 | | | 47 | | | 75 | | | 78 | | | 50 | | | 833 | | | 9,692 | | 1,368 | | | 12,149 | |
| Automobile | | | | | | | | | | | | | | | | |
| 800+ | 1,056 | | | 812 | | | 424 | | | 312 | | | 169 | | | 62 | | | 0 | | 0 | | | 2,835 | |
| 740-799 | 1,514 | | | 1,022 | | | 531 | | | 344 | | | 172 | | | 59 | | | 0 | | 0 | | | 3,642 | |
| 680-739 | 1,347 | | | 889 | | | 461 | | | 282 | | | 138 | | | 47 | | | 0 | | 0 | | | 3,164 | |
| 620-679 | 669 | | | 484 | | | 259 | | | 157 | | | 84 | | | 32 | | | 0 | | 0 | | | 1,685 | |
| <620 | 140 | | | 242 | | | 189 | | | 137 | | | 79 | | | 34 | | | 0 | | 0 | | | 821 | |
No FICO available(1) | 2 | | | 0 | | | 0 | | | 0 | | | 0 | | | 4 | | | 0 | | 0 | | | 6 | |
| Total automobile | 4,728 | | | 3,449 | | | 1,864 | | | 1,232 | | | 642 | | | 238 | | | 0 | | 0 | | | 12,153 | |
| Education | | | | | | | | | | | | | | | | |
| 800+ | 1,817 | | | 1,363 | | | 849 | | | 781 | | | 578 | | | 777 | | | 0 | | 0 | | | 6,165 | |
| 740-799 | 1,797 | | | 1,009 | | | 541 | | | 387 | | | 251 | | | 423 | | | 0 | | 0 | | | 4,408 | |
| 680-739 | 450 | | | 294 | | | 173 | | | 127 | | | 90 | | | 221 | | | 0 | | 0 | | | 1,355 | |
| 620-679 | 26 | | | 35 | | | 33 | | | 28 | | | 25 | | | 95 | | | 0 | | 0 | | | 242 | |
| <620 | 2 | | | 5 | | | 10 | | | 10 | | | 8 | | | 41 | | | 0 | | 0 | | | 76 | |
No FICO available(1) | 2 | | | 0 | | | 0 | | | 0 | | | 0 | | | 60 | | | 0 | | 0 | | | 62 | |
| Total education | 4,094 | | | 2,706 | | | 1,606 | | | 1,333 | | | 952 | | | 1,617 | | | 0 | | 0 | | | 12,308 | |
| Other retail | | | | | | | | | | | | | | | | |
| 800+ | 461 | | | 380 | | | 163 | | | 77 | | | 15 | | | 44 | | | 341 | | 0 | | | 1,481 | |
| 740-799 | 620 | | | 460 | | | 184 | | | 81 | | | 19 | | | 31 | | | 638 | | 2 | | | 2,035 | |
| 680-739 | 495 | | | 302 | | | 111 | | | 48 | | | 10 | | | 13 | | | 561 | | 5 | | | 1,545 | |
| 620-679 | 248 | | | 104 | | | 37 | | | 14 | | | 3 | | | 5 | | | 174 | | 7 | | | 592 | |
| <620 | 24 | | | 30 | | | 17 | | | 6 | | | 1 | | | 3 | | | 77 | | 8 | | | 166 | |
No FICO available(1) | 54 | | | 1 | | | 0 | | | 0 | | | 0 | | | 0 | | | 272 | | 2 | | | 329 | |
| Total other retail | 1,902 | | | 1,277 | | | 512 | | | 226 | | | 48 | | | 96 | | | 2,063 | | 24 | | | 6,148 | |
| Total retail | | | | | | | | | | | | | | | | |
| 800+ | 6,023 | | | 4,448 | | | 2,084 | | | 2,306 | | | 2,382 | | | 2,854 | | | 4,660 | | 344 | | | 25,101 | |
| 740-799 | 6,864 | | | 3,630 | | | 1,661 | | | 1,345 | | | 1,190 | | | 1,597 | | | 3,872 | | 333 | | | 20,492 | |
| 680-739 | 3,077 | | | 1,842 | | | 917 | | | 644 | | | 541 | | | 918 | | | 2,193 | | 289 | | | 10,421 | |
| 620-679 | 1,040 | | | 727 | | | 391 | | | 276 | | | 192 | | | 491 | | | 576 | | 202 | | | 3,895 | |
| <620 | 179 | | | 322 | | | 281 | | | 240 | | | 156 | | | 385 | | | 182 | | 222 | | | 1,967 | |
No FICO available(1) | 59 | | | 3 | | | 1 | | | 5 | | | 1 | | | 78 | | | 272 | | 2 | | | 421 | |
| Total retail | $17,242 | | | $10,972 | | | $5,335 | | | $4,816 | | | $4,462 | | | $6,323 | | | $11,755 | | $1,392 | | | $62,297 | |
(1) Represents loans for which an updated FICO score was unavailable (e.g., due to recent profile changes).
Citizens Financial Group, Inc. | 66
Nonaccrual and Past Due Assets
The following table presents nonaccrual loans and leases and loans accruing and 90 days or more past due:
| | | | | | | | | | | | | | | | | | | | | | | |
| As of June 30, 2021 | | As of December 31, 2020 |
| (in millions) | Nonaccrual loans and leases | 90+ days past due and accruing | Nonaccrual with no related ACL | | Nonaccrual loans and leases | 90+ days past due and accruing | Nonaccrual with no related ACL |
| Commercial and industrial | $163 | | $0 | | $40 | | | $280 | | $20 | | $56 | |
| Commercial real estate | 102 | | 0 | | 37 | | | 176 | | 0 | | 2 | |
| Leases | 1 | | 1 | | 0 | | | 2 | | 1 | | 0 | |
| Total commercial | 266 | | 1 | | 77 | | | 458 | | 21 | | 58 | |
Residential mortgages(1) | 174 | | 270 | | 138 | | | 167 | | 30 | | 96 | |
| Home equity | 234 | | 0 | | 189 | | | 276 | | 0 | | 207 | |
| Automobile | 62 | | 0 | | 34 | | | 72 | | 0 | | 17 | |
| Education | 21 | | 2 | | 2 | | | 18 | | 2 | | 2 | |
| Other retail | 22 | | 7 | | 2 | | | 28 | | 9 | | 0 | |
| Total retail | 513 | | 279 | | 365 | | | 561 | | 41 | | 322 | |
| Total loans and leases | $779 | | $280 | | $442 | | | $1,019 | | $62 | | $380 | |
|
| | | | | | | | | | | | | |
| | As of September 30, 2020 | | As of December 31, 2019 |
| (in millions) | Nonaccrual loans and leases | 90+ days past due and accruing | Nonaccrual with no related ACL | | Nonaccrual loans and leases |
| Commercial |
| $435 |
|
| $3 |
|
| $33 |
| |
| $240 |
|
| Commercial real estate | 323 |
| 0 |
| 3 |
| | 2 |
|
| Leases | 2 |
| 0 |
| 0 |
| | 3 |
|
| Total commercial loans and leases | 760 |
| 3 |
| 36 |
| | 245 |
|
| Residential mortgages | 131 |
| 17 |
| 101 |
| | 93 |
|
| Home equity | 265 |
| 0 |
| 192 |
| | 246 |
|
| Automobile | 80 |
| 0 |
| 18 |
| | 67 |
|
| Education | 16 |
| 2 |
| 5 |
| | 18 |
|
| Other retail | 25 |
| 6 |
| 1 |
| | 34 |
|
| Total retail | 517 |
| 25 |
| 317 |
| | 458 |
|
| Total loans and leases |
| $1,277 |
|
| $28 |
|
| $353 |
| |
| $703 |
|
Interest income is generally not recognized for loans and leases that are on nonaccrual status. The Company reverses accrued interest receivable with a charge to interest income upon classifying the loan or lease as nonaccrual.
The following table presents an analysis of the age of both accruing and nonaccruing loan and lease past due amounts:
|
| | | | | | | | | | | | | | | | | | | | | | | | | | | | | | | |
| | September 30, 2020 | | December 31, 2019 |
| | Days Past Due | | Days Past Due |
| (in millions) | Current-29 | 30-59 | 60-89 | 90 or More | Total |
| | Current-29 | 30-59 | 60-89 | 90 or More | Total |
|
| Commercial |
| $44,845 |
|
| $105 |
|
| $129 |
|
| $106 |
|
| $45,185 |
| |
| $41,340 |
|
| $45 |
|
| $27 |
|
| $67 |
|
| $41,479 |
|
| Commercial real estate | 14,743 |
| 90 |
| 0 |
| 56 |
| 14,889 |
| | 13,520 |
| 1 |
| 1 |
| 0 |
| 13,522 |
|
| Leases | 2,284 |
| 1 |
| 1 |
| 2 |
| 2,288 |
| | 2,498 |
| 37 |
| 0 |
| 2 |
| 2,537 |
|
| Total commercial loans and leases | 61,872 |
| 196 |
| 130 |
| 164 |
| 62,362 |
| | 57,358 |
| 83 |
| 28 |
| 69 |
| 57,538 |
|
| Residential mortgages | 19,430 |
| 64 |
| 16 |
| 123 |
| 19,633 |
| | 18,947 |
| 35 |
| 17 |
| 84 |
| 19,083 |
|
| Home equity | 12,007 |
| 51 |
| 29 |
| 235 |
| 12,322 |
|
| 12,834 |
| 91 |
| 40 |
| 189 |
| 13,154 |
|
| Automobile | 11,825 |
| 147 |
| 52 |
| 11 |
| 12,035 |
| | 11,788 |
| 227 |
| 81 |
| 24 |
| 12,120 |
|
| Education | 11,585 |
| 28 |
| 12 |
| 6 |
| 11,631 |
| | 10,290 |
| 30 |
| 15 |
| 12 |
| 10,347 |
|
| Other retail | 6,005 |
| 33 |
| 22 |
| 28 |
| 6,088 |
|
| 6,729 |
| 45 |
| 31 |
| 41 |
| 6,846 |
|
| Total retail loans | 60,852 |
| 323 |
| 131 |
| 403 |
| 61,709 |
| | 60,588 |
| 428 |
| 184 |
| 350 |
| 61,550 |
|
| Total |
| $122,724 |
|
| $519 |
|
| $261 |
|
| $567 |
|
| $124,071 |
| |
| $117,946 |
|
| $511 |
|
| $212 |
|
| $419 |
|
| $119,088 |
|
| | | | | | | | | | | | | | | | | | | | | | | | | | | | | | | | | | | |
| June 30, 2021 | | December 31, 2020 |
| Days Past Due | | Days Past Due |
| (in millions) | Current-29 | 30-59 | 60-89 | 90+ | Total | | Current-29 | 30-59 | 60-89 | 90+ | Total |
| Commercial and industrial | $42,769 | | $24 | | $7 | | $42 | | $42,842 | | | $43,817 | | $223 | | $16 | | $117 | | $44,173 | |
| Commercial real estate | 14,310 | | 1 | | 0 | | 101 | | 14,412 | | | 14,531 | | 1 | | 85 | | 35 | | 14,652 | |
| Leases | 1,827 | | 0 | | 0 | | 2 | | 1,829 | | | 1,956 | | 9 | | 0 | | 3 | | 1,968 | |
| Total commercial | 58,906 | | 25 | | 7 | | 145 | | 59,083 | | | 60,304 | | 233 | | 101 | | 155 | | 60,793 | |
Residential mortgages(1) | 19,885 | | 176 | | 61 | | 416 | | 20,538 | | | 19,291 | | 59 | | 21 | | 168 | | 19,539 | |
| Home equity | 11,607 | | 32 | | 17 | | 185 | | 11,841 | | | 11,848 | | 61 | | 28 | | 212 | | 12,149 | |
| Automobile | 12,613 | | 114 | | 43 | | 10 | | 12,780 | | | 11,901 | | 170 | | 65 | | 17 | | 12,153 | |
| Education | 12,747 | | 29 | | 13 | | 11 | | 12,800 | | | 12,255 | | 33 | | 13 | | 7 | | 12,308 | |
| Other retail | 5,454 | | 37 | | 20 | | 28 | | 5,539 | | | 6,047 | | 38 | | 29 | | 34 | | 6,148 | |
| Total retail | 62,306 | | 388 | | 154 | | 650 | | 63,498 | | | 61,342 | | 361 | | 156 | | 438 | | 62,297 | |
| Total | $121,212 | | $413 | | $161 | | $795 | | $122,581 | | | $121,646 | | $594 | | $257 | | $593 | | $123,090 | |
The Company estimates expected credit losses based on(1) 90+ days past due includes $266 million and $44 million of loans fully or partially guaranteed by the fair value of collateral for collateralized loans that management believes will not be paid under the terms of the original loan contract. These loans are considered to be collateral dependent,FHA, VA, and the estimated credit loss is calculated as the difference between the loan’s amortized cost basis and the fair value of the collateral as of each evaluation date.
Collateral values for residential mortgage and home equity loans are based on refreshed valuations which are updatedUSDA at least every 90 days less estimated costs to sell. At SeptemberJune 30, 20202021 and December 31, 2019,2020, respectively.
At June 30, 2021 and December 31, 2020, the Company had collateral-dependent residential mortgage and home equity loans totaling $489$554 million and $227$552 million, respectively.
For collateral-dependent commercial loans, the ACL is individually assessed based on the fair value of the collateral. Various types of collateral are used, including real estate, inventory, equipment, accounts receivable, securities and cash, among others. For commercial real estate loans, collateral values are generally based on
appraisals which are updated based on management judgment under the specific circumstances on a case-by-case basis. At SeptemberJune 30, 20202021 and December 31, 2019,2020, the Company had collateral-dependent commercial loans totaling $144$66 million and $85$206 million, respectively.
The amortized cost basis of mortgage loans collateralized by residential real estate property for which formal foreclosure proceedings were in process was $129$152 million and $152$119 million as of SeptemberJune 30, 20202021 and December 31, 2019,2020, respectively.
Citizens Financial Group, Inc. | 67
Troubled Debt Restructurings
TDR is the classification given to a loan that has been restructured in a manner that grants a concession to a borrower experiencing financial hardship that the Company would not otherwise make. Citizens implemented various retail and commercial loan modification programs to provide borrowers relief from the economic impacts of COVID-19. The CARES Act and bank regulatory agencies provided guidance stating certain loan modifications to borrowers experiencing financial distress as a result of COVID-19 may not be accounted for as TDRs under U.S. GAAP. In accordance with the CARES Act, Citizens has elected to not apply TDR classification to any COVID-19 related loan modifications performed after March 1, 2020 for borrowers who were current as of December 31, 2019. In addition, for loans modified in response to the COVID-19 pandemic that are not eligible for relief from TDR classification under the CARES Act, the Company elected to apply the guidance issued by the bank regulatory agencies. Under this guidance, deferral of principal and interest for up to six months to borrowers who were current as of March 1, 2020 and impacted by COVID-19 are not classified as TDRs.
For loan modifications that include a payment deferral and are not TDRs, the borrower’s past due and nonaccrual status will not be impacted during the deferral period. Interest income will continue to be recognized over the contractual life of the loan. The following table summarizes TDRs by class and total unfunded commitments:
|
| | | | | | | |
| (in millions) | September 30, 2020 | | December 31, 2019 |
| Commercial |
| $294 |
| |
| $297 |
|
| Retail | 715 |
| | 667 |
|
| Unfunded commitments related to TDRs | 49 |
| | 42 |
|
The following tables below summarize how loans were modified during the three and ninesix months ended SeptemberJune 30, 20202021 and 2019.June 30, 2020. The reported balances represent the post-modification outstanding amortized cost basis and canmay include loans that became TDRs during the period and were subsequently paid off in full, charged off, or sold prior to period end. Pre-modification balances for modified loans approximate the post-modification balances shown.
| | | | | | | | | | | | | | | | | | | | | | | | | | | | | | | | |
| | | Three Months Ended June 30, 2021 |
| | | Amortized Cost Basis |
| (dollars in millions) | Number of Contracts | | | Interest Rate Reduction(1) | Maturity Extension(2) | | Other(3) | Total |
| Commercial and industrial | 15 | | | | $0 | | | | $3 | | | | $54 | | | $57 | |
| Commercial real estate | 0 | | | | 0 | | | | 0 | | | | 0 | | | 0 | |
| Total commercial | 15 | | | | 0 | | | | 3 | | | | 54 | | | 57 | |
| Residential mortgages | 671 | | | | 8 | | | | 120 | | | | 44 | | | 172 | |
| Home equity | 102 | | | | 1 | | | | 3 | | | | 3 | | | 7 | |
| Automobile | 379 | | | | 1 | | | | 0 | | | | 5 | | | 6 | |
| Education | 265 | | | | 0 | | | | 0 | | | | 9 | | | 9 | |
| Other retail | 585 | | | | 1 | | | | 0 | | | | 0 | | | 1 | |
| Total retail | 2,002 | | | | 11 | | | | 123 | | | | 61 | | | 195 | |
| Total | 2,017 | | | | $11 | | | | $126 | | | | $115 | | | $252 | |
| | | | | | | | | | | | | | | | | | | | | | | | | | | | | | | | |
| | | | Three Months Ended June 30, 2020 |
| | | | Amortized Cost Basis |
| (dollars in millions) | Number of Contracts | | | Interest Rate Reduction(1) | | Maturity Extension(2) | | Other(3) | Total |
| Commercial and industrial | 19 | | | | $0 | | | | $3 | | | | $53 | | | $56 | |
| Commercial real estate | 0 | | | | 0 | | | | 0 | | | | 0 | | | 0 | |
| Total commercial | 19 | | | | 0 | | | | 3 | | | | 53 | | | 56 | |
| Residential mortgages | 145 | | | | 11 | | | | 14 | | | | 3 | | | 28 | |
| Home equity | 266 | | | | 2 | | | | 4 | | | | 11 | | | 17 | |
| Automobile | 947 | | | | 0 | | | | 0 | | | | 15 | | | 15 | |
| Education | 142 | | | | 0 | | | | 0 | | | | 4 | | | 4 | |
| Other retail | 710 | | | | 3 | | | | 0 | | | | 1 | | | 4 | |
| Total retail | 2,210 | | | | 16 | | | | 18 | | | | 34 | | | 68 | |
| Total | 2,229 | | | | $16 | | | | $21 | | | | $87 | | | $124 | |
| | | | | | | | | | | | | | | | | | | | | | | | | | | | | | | | |
| | | | Six Months Ended June 30, 2021 |
| | | | Amortized Cost Basis |
| (dollars in millions) | Number of Contracts | | | Interest Rate Reduction(1) | | Maturity Extension(2) | | Other(3) | Total |
| Commercial and industrial | 22 | | | | $0 | | | | $6 | | | | $54 | | | $60 | |
| Commercial real estate | 0 | | | | 0 | | | | 0 | | | | 0 | | | 0 | |
| Total commercial | 22 | | | | 0 | | | | 6 | | | | 54 | | | 60 | |
| Residential mortgages | 713 | | | | 12 | | | | 126 | | | | 47 | | | 185 | |
| Home equity | 249 | | | | 3 | | | | 8 | | | | 7 | | | 18 | |
| Automobile | 1,048 | | | | 1 | | | | 0 | | | | 13 | | | 14 | |
| Education | 412 | | | | 0 | | | | 0 | | | | 13 | | | 13 | |
| Other retail | 1,215 | | | | 4 | | | | 0 | | | | 1 | | | 5 | |
| Total retail | 3,637 | | | | 20 | | | | 134 | | | | 81 | | | 235 | |
| Total | 3,659 | | | | $20 | | | | $140 | | | | $135 | | | $295 | |
Citizens Financial Group, Inc. | 68
|
| | | | | | | | | | | | | | | | | |
| | Three Months Ended September 30, 2020 |
| | Primary Modification Types |
| | Interest Rate Reduction(1) | | Maturity Extension(2) | | Other(3) |
| (dollars in millions) | Number of Contracts | Recorded Investment | | Number of Contracts | Recorded Investment | | Number of Contracts | Recorded Investment |
| Commercial | 0 |
|
| $0 |
| | 12 |
|
| $103 |
| | 2 |
|
| $1 |
|
| Commercial real estate | 0 |
| 0 |
| | 0 |
| 0 |
| | 0 |
| 0 |
|
| Total commercial loans | 0 |
| 0 |
| | 12 |
| 103 |
| | 2 |
| 1 |
|
| Residential mortgages | 47 |
| 9 |
| | 41 |
| 6 |
| | 19 |
| 4 |
|
| Home equity | 23 |
| 2 |
| | 52 |
| 4 |
| | 104 |
| 6 |
|
| Automobile | 25 |
| 1 |
| | 47 |
| 0 |
| | 1,119 |
| 18 |
|
| Education | 0 |
| 0 |
| | 0 |
| 0 |
| | 140 |
| 3 |
|
| Other retail | 410 |
| 1 |
| | 0 |
| 0 |
| | 74 |
| 0 |
|
| Total retail loans | 505 |
| 13 |
| | 140 |
| 10 |
| | 1,456 |
| 31 |
|
| Total | 505 |
|
| $13 |
| | 152 |
|
| $113 |
| | 1,458 |
|
| $32 |
|
|
| | | | | | | | | | | | | | | | | |
| | Three Months Ended September 30, 2019 |
| | Primary Modification Types |
| | Interest Rate Reduction(1) | | Maturity Extension(2) | | Other(3) |
| (dollars in millions) | Number of Contracts | Amortized Cost | | Number of Contracts | Amortized Cost | | Number of Contracts | Amortized Cost |
| Commercial | 2 |
|
| $0 |
| | 6 |
|
| $1 |
| | 6 |
|
| $15 |
|
| Commercial real estate | 0 |
| 0 |
| | 0 |
| 0 |
| | 0 |
| 0 |
|
| Total commercial loans | 2 |
| 0 |
| | 6 |
| 1 |
| | 6 |
| 15 |
|
| Residential mortgages | 12 |
| 2 |
| | 8 |
| 2 |
| | 25 |
| 4 |
|
| Home equity | 63 |
| 6 |
| | 16 |
| 1 |
| | 120 |
| 6 |
|
| Automobile | 46 |
| 1 |
| | 4 |
| 0 |
| | 309 |
| 4 |
|
| Education | 0 |
| 0 |
| | 0 |
| 0 |
| | 131 |
| 2 |
|
| Other retail | 805 |
| 5 |
| | 0 |
| 0 |
| | 218 |
| 0 |
|
| Total retail loans | 926 |
| 14 |
| | 28 |
| 3 |
| | 803 |
| 16 |
|
| Total | 928 |
|
| $14 |
| | 34 |
|
| $4 |
| | 809 |
|
| $31 |
|
|
| | | | | | | | | | | | | | | | | |
| | Nine Months Ended September 30, 2020 |
| | Primary Modification Types |
| | Interest Rate Reduction(1) | | Maturity Extension(2) | | Other(3) |
| (dollars in millions) | Number of Contracts | Amortized Cost | | Number of Contracts | Amortized Cost | | Number of Contracts | Amortized Cost |
| Commercial | 0 |
|
| $0 |
| | 18 |
|
| $106 |
| | 34 |
|
| $95 |
|
| Commercial real estate | 0 |
| 0 |
| | 0 |
| 0 |
| | 0 |
| 0 |
|
| Total commercial loans | 0 |
| 0 |
| | 18 |
| 106 |
| | 34 |
| 95 |
|
| Residential mortgages | 139 |
| 26 |
| | 149 |
| 27 |
| | 60 |
| 11 |
|
| Home equity | 96 |
| 8 |
| | 107 |
| 8 |
| | 365 |
| 21 |
|
| Automobile | 108 |
| 2 |
| | 48 |
| 0 |
| | 2,212 |
| 35 |
|
| Education | 0 |
| 0 |
| | 0 |
| 0 |
| | 373 |
| 9 |
|
| Other retail | 1,916 |
| 8 |
| | 0 |
| 0 |
| | 251 |
| 2 |
|
| Total retail loans | 2,259 |
| 44 |
| | 304 |
| 35 |
| | 3,261 |
| 78 |
|
| Total | 2,259 |
|
| $44 |
| | 322 |
|
| $141 |
| | 3,295 |
|
| $173 |
|
| | | | Nine Months Ended September 30, 2019 | | | | | | | | | | | | | | | | | | | | | | | | | | | | |
| | Primary Modification Types | | | Six Months Ended June 30, 2020 |
| | Interest Rate Reduction(1) | | Maturity Extension(2) | | Other(3) | | | Amortized Cost Basis |
| (dollars in millions) | Number of Contracts | Amortized Cost | | Number of Contracts | Amortized Cost | | Number of Contracts | Amortized Cost | (dollars in millions) | Number of Contracts | | | Interest Rate Reduction(1) | | Maturity Extension(2) | | Other(3) | Total |
| Commercial | 3 |
|
| $0 |
| | 18 |
|
| $2 |
| | 24 |
|
| $102 |
| |
| Commercial and industrial | | Commercial and industrial | 38 | | | | $0 | | | | $3 | | | | $94 | | | $97 | |
| Commercial real estate | 0 |
| 0 |
| | 1 |
| 0 |
| | 0 |
| 0 |
| Commercial real estate | 0 | | | | 0 | | | | 0 | | | | 0 | | | 0 | |
| Total commercial loans | 3 |
| 0 |
| | 19 |
| 2 |
| | 24 |
| 102 |
| |
| Total commercial | | Total commercial | 38 | | | | 0 | | | | 3 | | | | 94 | | | 97 | |
| Residential mortgages | 25 |
| 6 |
| | 29 |
| 5 |
| | 87 |
| 13 |
| Residential mortgages | 241 | | | | 17 | | | | 21 | | | | 7 | | | 45 | |
| Home equity | 148 |
| 15 |
| | 66 |
| 10 |
| | 358 |
| 21 |
| Home equity | 389 | | | | 6 | | | | 4 | | | | 15 | | | 25 | |
| Automobile | 111 |
| 2 |
| | 16 |
| 0 |
| | 933 |
| 13 |
| Automobile | 1,177 | | | | 1 | | | | 0 | | | | 17 | | | 18 | |
| Education | 0 |
| 0 |
| | 0 |
| 0 |
| | 211 |
| 5 |
| Education | 233 | | | | 0 | | | | 0 | | | | 6 | | | 6 | |
| Other retail | 2,362 |
| 14 |
| | 0 |
| 0 |
| | 362 |
| 0 |
| Other retail | 1,683 | | | | 7 | | | | 0 | | | | 2 | | | 9 | |
| Total retail loans | 2,646 |
| 37 |
| | 111 |
| 15 |
| | 1,951 |
| 52 |
| |
| Total retail | | Total retail | 3,723 | | | | 31 | | | | 25 | | | | 47 | | | 103 | |
| Total | 2,649 |
|
| $37 |
| | 130 |
|
| $17 |
| | 1,975 |
|
| $154 |
| Total | 3,761 | | | | $31 | | | | $28 | | | | $141 | | | $200 | |
(1) Includes modifications that consist of multiple concessions, one of which is an interest rate reduction.
(2) Includes modifications that consist of multiple concessions, one of which is a maturity extension (unless one of the other concessions was an interest rate reduction).
(3) Includes modifications other than interest rate reductions or maturity extensions, such as lowering scheduled payments for a specified period of time, principal forgiveness, and capitalizing arrearages. Also included are the following: deferrals, trial modifications, certain bankruptcies, loans in forbearance and prepayment plans. Modifications can include the deferral of accrued interest resulting in post modificationpost-modification balances being higher than pre-modification.
The net change to ALLL resulting from modificationModified TDRs resulted in charge-offs of loans$2 million and $4 million for the three months ended SeptemberJune 30, 2021 and 2020, and 2019 was ($30)respectively. Citizens recorded $4 million and $3 million, respectively. The net change to ALLL resulting from modifications of loans for the nine months ended September 30, 2020 and 2019 was ($21) million and $7 million, respectively. Charge-offs
may also be recorded on TDRs. Citizens recorded $43 million and $1$6 million of charge-offs resulting from modificationrelated to TDRs for each of loans in the threesix months ended SeptemberJune 30, 2021 and 2020, respectively.
Unfunded commitments related to TDRs were $45 million and 2019, respectively. Citizens recorded $49 million at June 30, 2021 and $3 million for the nine months ended September 30,December 31, 2020, and 2019, respectively.
A payment default refers to a loan that becomes 90 days or more past due under the modified terms. Loan data includes loans meeting the criteria that were paid off in full, charged off, or sold prior to SeptemberJune 30, 20202021 and 2019.2020. For commercial loans, recorded investment in TDRs that defaulted within 12 months of their modification date for the three months ended SeptemberJune 30, 20202021 were $14$1 million and there were NaN$26 million for the three months ended SeptemberJune 30, 2019. There were $532020. The amortized cost basis of commercial TDRs that defaulted within 12 months of their modification date was $23 million and $1$39 million in the ninesix months ended SeptemberJune 30, 2021 and 2020, and 2019.respectively. For retail loans, there were $22$14 million and $9$14 million of loans which defaulted within their restructuring date for the three months ended SeptemberJune 30, 2021 and 2020, and 2019, respectively, and $47respectively. There were $29 million and $28$25 million of loans which defaulted within 12 months of their restructuring date for the ninesix months ended SeptemberJune 30, 20202021 and 2019,2020, respectively.
Concentrations of Credit Risk
As of September 30, 2020, under the Company’s COVID-19-related forbearance and other customer accommodation programs that are guided by the CARES Act as well as banking regulator interagency guidance, Citizens deferred payments on approximately $2.4 billion, or 3.8%, of the retail portfolio, approximately $795 million, or 1.4%, of the commercial portfolio, and approximately $464 million, or 8.1%, of the Business Banking portfolio. The vast majority of these deferrals are not classified as TDRs.
Most of the Company’s lending activity is with customers located in the New England, Mid-Atlantic and Midwest regions. Generally, loans are collateralized by assets including real estate, inventory, accounts receivable, other personal property and investment securities. As of SeptemberJune 30, 20202021 and December 31, 2019,2020, Citizens had a significant amount of loans collateralized by residential and commercial real estate. There were no significant concentration risks within the commercial loan or retail loan portfolios. Exposure to credit losses arising from lending transactions may fluctuate with fair values of collateral supporting loans, which may not perform according to contractual agreements. The Company’s policy is to collateralize loans to the extent necessary; however, unsecured loans are also granted based on the basis of the financial strength of the applicant and the facts surrounding the transaction.
Citizens Financial Group, Inc. | 69
Certain loan products, including residential mortgages, home equity loans and lines of credit, and credit cards, have contractual features that may increase credit exposure to the Company in the event of an increase in interest rates or a decline in housing values. These products include loans that exceed 90% of the value of the underlying collateral (high LTV loans), interest-only and negative amortization residential mortgages, and loans with low introductory rates. The following tables present balances of loans with these characteristics:
| | | | | | | | | | | | | | | | | | | |
| June 30, 2021 |
| (in millions) | Residential Mortgages | | | Home Equity | Other Retail | Education | Total |
| High loan-to-value | $235 | | | | $27 | | $0 | | $0 | | $262 | |
| Interest-only | 3,143 | | | | 0 | | 0 | | 1 | | 3,144 | |
| Low introductory rate | 0 | | | | 0 | | 135 | | 0 | | 135 | |
| | | | | | | |
| Total | $3,378 | | | | $27 | | $135 | | $1 | | $3,541 | |
| | | | | | | | | | | | | | | | | | | |
| December 31, 2020 |
| (in millions) | Residential Mortgages | | | Home Equity | Other Retail | Education | Total |
| High loan-to-value | $289 | | | | $64 | | $0 | | $0 | | $353 | |
| Interest-only | 2,801 | | | | 0 | | 0 | | 0 | | 2,801 | |
| Low introductory rate | 0 | | | | 0 | | 170 | | 0 | | 170 | |
| | | | | | | |
| Total | $3,090 | | | | $64 | | $170 | | $1 | | $3,324 | |
|
| | | | | | | | | | | | |
| | September 30, 2020 |
| (in millions) | Residential Mortgages |
| Home Equity |
| Other Retail |
| Total |
|
| High loan-to-value |
| $408 |
|
| $95 |
|
| $0 |
|
| $503 |
|
| Interest-only/negative amortization | 2,594 |
| 0 |
| 0 |
| 2,594 |
|
| Low introductory rate | 0 |
| 0 |
| 183 |
| 183 |
|
| Multiple characteristics and other | 4 |
| 0 |
| 0 |
| 4 |
|
| Total |
| $3,006 |
|
| $95 |
|
| $183 |
|
| $3,284 |
|
|
| | | | | | | | | | | | |
| | December 31, 2019 |
| (in millions) | Residential Mortgages |
| Home Equity |
| Other Retail |
| Total |
|
| High loan-to-value |
| $402 |
|
| $151 |
|
| $0 |
|
| $553 |
|
| Interest-only/negative amortization | 2,043 |
| 0 |
| 0 |
| 2,043 |
|
| Low introductory rate | 0 |
| 0 |
| 235 |
| 235 |
|
| Total |
| $2,445 |
|
| $151 |
|
| $235 |
|
| $2,831 |
|
NOTE 5 - MORTGAGE BANKING AND OTHER
The Company sells residential mortgages to GSEs and other parties, who may issue securities backed by pools of such loans. The Company retains no beneficial interests in these sales, but may retain the servicing rights for the loans sold. The Company is obligated to subsequently repurchase a loan if the purchaser discovers a
representation or warranty violation such as noncompliance with eligibility or servicing requirements, or customer fraud that should have been identified in a loan file review.
The Company recognizes the right to service residential mortgage loans for others, or MSRs, as separate assets, which are presented in other assets on the Consolidated Balance Sheets, when purchased or when servicing is contractually separated from the underlying mortgage loans by sale with servicing rights retained. The following table summarizes activity related to residential mortgage loans sold with servicing rights retained:
| | | | Three Months Ended September 30, | | Nine Months Ended September 30, | | Three Months Ended June 30, | | Six Months Ended June 30, |
| (in millions) | 2020 |
| | 2019 |
| | 2020 |
| | 2019 |
| (in millions) | 2021 | | 2020 | | 2021 | | 2020 |
| Cash proceeds from residential mortgage loans sold with servicing retained |
| $9,504 |
| |
| $6,117 |
| |
| $23,668 |
| |
| $13,265 |
| Cash proceeds from residential mortgage loans sold with servicing retained | $10,540 | | | $8,797 | | | $19,577 | | | $14,164 | |
Gain on sales (1) | 273 |
| | 88 |
| | 699 |
| | 180 |
| Gain on sales (1) | 85 | | | 283 | | | 225 | | | 426 | |
Contractually specified servicing, late and other ancillary fees (1) | 56 |
| | 53 |
| | 169 |
| | 152 |
| Contractually specified servicing, late and other ancillary fees (1) | 60 | | | 55 | | | 118 | | | 113 | |
(1) Reported in mortgage banking fees on the Consolidated Statements of Operations.
Effective January 1, 2020, the Company elected to account for all MSRs previously accounted for under the amortization method under the fair value method. Under the fair value method, MSRs are recorded at fair value at each reporting date with any changes in fair value during the period recorded in mortgage banking fees in the Consolidated Statements of Operations.
The unpaid principal balance of the related residential mortgage loans was $80.7$84.6 billion and $77.5$81.2 billion as of Septemberat June 30, 20202021 and December 31, 2019,2020, respectively. The Company manages an active hedging strategy to manage the risk associated with changes in the value of the MSR portfolio, which includes the purchase of freestanding derivatives.
Citizens Financial Group, Inc. | 70
The following table summarizes changes in MSRs recorded using the fair value method:
| | | | As of and for the Three Months Ended September 30, | | As of and for the Nine Months Ended September 30, | | As of and for the Three Months Ended June 30, | | As of and for the Six Months Ended June 30, |
| (in millions) | 2020 |
| | 2019 |
| | 2020 |
| | 2019 |
| (in millions) | 2021 | | 2020 | | 2021 | | 2020 |
| Fair value as of beginning of the period |
| $568 |
| |
| $531 |
| |
| $642 |
| |
| $600 |
| Fair value as of beginning of the period | $893 | | | $577 | | | $658 | | | $642 | |
| Transfers upon election of fair value method | 0 |
| | 0 |
| | 190 |
| | 0 |
| |
Transfers upon election of fair value method (1) | | Transfers upon election of fair value method (1) | 0 | | | 0 | | | 0 | | | 190 | |
| Fair value as of beginning of the period, adjusted | 568 |
| | 531 |
| | 832 |
| | 600 |
| Fair value as of beginning of the period, adjusted | 893 | | | 577 | | | 658 | | | 832 | |
| Amounts capitalized | 85 |
| | 78 |
| | 238 |
| | 170 |
| Amounts capitalized | 122 | | | 86 | | | 209 | | | 153 | |
Changes in unpaid principal balance during the period (1) | (55 | ) | | (31 | ) | | (141 | ) | | (88 | ) | |
Changes in fair value during the period (2) | 8 |
| | (68 | ) | | (323 | ) | | (172 | ) | |
Changes in unpaid principal balance during the period (2) | | Changes in unpaid principal balance during the period (2) | (47) | | | (46) | | | (105) | | | (86) | |
Changes in fair value during the period (3) | | Changes in fair value during the period (3) | (66) | | | (49) | | | 140 | | | (331) | |
| Fair value at end of the period |
| $606 |
| |
| $510 |
| |
| $606 |
| |
| $510 |
| Fair value at end of the period | $902 | | | $568 | | | $902 | | | $568 | |
(1) Effective January 1, 2020, the Company elected to account for all MSRs previously accounted for under the amortization method under the fair value method.
(2) Represents changes in value of the MSRs due to i) passage of time including the impact from both regularly scheduled loan principal payments and partial
paydowns, and ii)
loans that paid off during the period.
(2)(3) Represents changes in value primarily due todriven by market drivenconditions. These changes are recorded in interest rates and prepayment speeds.mortgage banking fees in the Consolidated Statements of Operations.
The fair value of MSRs is estimated by using the present value of estimated future net servicing cash flows, taking into consideration actual and expected mortgage loan prepayment rates, discount rates, contractual servicing fee income, servicing costs, default rates, ancillary income, and other economic factors, which are determined based on current market interest rates. The valuation does not attempt to forecast or predict the future direction of interest rates.
The sensitivity analysis below presents the impact to current fair value of an immediate 50 basis point and 100 basis point adverse change in key economic assumptions and the decline in fair value if the respective adverse change was realized. These sensitivities are hypothetical, with the effect of a variation in a particular assumption on the fair value of the MSRs calculated independently without changing any other assumption. In reality, changes in one factor may result in changes in another (e.g., changes in interest rates, which drive changes in prepayment rates, could result in changes in the discount rates), which may amplify or counteract the sensitivities. The primary risk inherent in the Company’s MSRs is an increase in prepayments of the underlying mortgage loans serviced, which is largely dependent upon movements in market interest rates.
|
| | | | | | | |
| | September 30, 2020 | | December 31, 2019 |
| | Actual | Decline in fair value due to | | Actual | Decline in fair value due to |
| (dollars in millions) | |
| Fair value | $606 | 50 bps adverse change | 100 bps adverse change | | $642 | 50 bps adverse change | 100 bps adverse change |
| Weighted average life (in years) | 3.8 | | 5.5 |
| Weighted average constant prepayment rate | 19.4% | $116 | $169 | | 13.9% | $116 | $222 |
| Weighted average option adjusted spread | 608 bps | 10 | 21 | | 440 bps | 12 | 25 |
| | | | | | | | | | | | | | | | | | | | | | | |
| June 30, 2021 | | December 31, 2020 |
| Actual | Decline in fair value due to | | Actual | Decline in fair value due to |
| (dollars in millions) | |
| Fair value | $902 | 50 bps adverse change | 100 bps adverse change | | $658 | 50 bps adverse change | 100 bps adverse change |
| Weighted average life (in years) | 5.7 | | 4.2 |
Weighted average constant prepayment rate (1) | 11.9% | $129 | $273 | | 17.3% | $122 | $202 |
| Weighted average option adjusted spread | 581 bps | 18 | 36 | | 595 bps | 12 | 24 |
(1)Citizens accounts Estimated adverse change for derivativesthe weighted average constant prepayment rate based on an adverse change in its mortgage banking operations at fair value on the Consolidated Balance Sheets as derivative assets or derivative liabilities, depending on whether the derivative had a positive (asset) or negative (liability) fair value as of the balance sheet date. The Company’s mortgage banking derivatives include commitments to originate mortgages held for sale, certain loan sale agreements, and other financial instruments that meet the definition of a derivative. Refer to Note 9 for additional information.market interest rates.
Other Serviced Loans
From time to time, Citizens engages in other servicing relationships. The following table presents the unpaid principal balance of other serviced loans:
|
| | | | | | | |
| (in millions) | September 30, 2020 | | December 31, 2019 |
Education(1) |
| $866 |
| |
| $0 |
|
Commercial(2) | 44 |
| | 33 |
|
| | | | | | | | | | | |
| (in millions) | June 30, 2021 | | December 31, 2020 |
| Education | $867 | | | $974 | |
Commercial (1) | 61 | | | 51 | |
| | | |
(1) Represents the servicing associated with education loans sold. See Note 7 for further information.
(2) Represents the government guaranteed portion of SBA loans sold to outside investors.
NOTE 6 - GOODWILL
Goodwill is the purchase premium associated with the acquisition of a business and is assigned to the Company’s reporting units at the acquisition date. A reporting unit is a business operating segment or a component of a business operating segment. Citizens has identified and assigned goodwill to 2 reporting units - Consumer Banking and Commercial Banking - based upon reviews of the structure of the Company’s executive team and supporting functions, resource allocations and financial reporting processes. Once goodwill has been assigned to reporting units, it no longer retains its association with a particular acquisition, and all of the activities within a reporting unit, whether acquired or organically grown, are available to support the value of the goodwill.
Goodwill is not amortized, but is subject to annual impairment tests. Citizens reviews goodwill for impairment annually as of October 31st and in interim periods when events or changes indicate the carrying value of one or more reporting units may not be recoverable. The Company has the option of performing a qualitative assessment of goodwill to determine whether it is more likely than not that the fair value of each reporting unit is less than the carrying value. If it is more likely than not that the fair value exceeds the carrying value, then no further testing is necessary; otherwise, Citizens must perform a quantitative assessment of goodwill.
Citizens may elect to bypass the qualitative assessment and perform a quantitative assessment. The quantitative assessment, used to identify potential impairment, involves comparing each reporting unit’s fair value to its carrying value, including goodwill. If the fair value of a reporting unit exceeds its carrying value inclusive of goodwill, applicable goodwill is deemed to be not impaired. If the carrying value of the reporting unit inclusive of goodwill exceeds its fair value, an impairment charge is recorded for the excess. The impairment loss recognized cannot exceed the amount of goodwill assigned to the reporting unit, and the loss establishes a new basis in the goodwill. Subsequent reversal of goodwill impairment losses is not permitted.Financial Group, Inc. | 71
Under the quantitative impairment assessment, the fair values of the Company’s reporting units are determined using a combination of income and market-based approaches. Citizens relies on the income approach (discounted cash flow method) for determining fair value. Market and transaction approaches are used as benchmarks only to corroborate the value determined by the discounted cash flow method. Citizens relies on several assumptions when estimating the fair value of its reporting units using the discounted cash flow method. These assumptions include the discount rate, as well as projected loan loss, income tax and capital retention rates.
In the first quarter of 2020, U.S. economic conditions deteriorated significantly with the spread of the COVID-19 pandemic and associated lockdowns. In response to the crises and the ongoing impacts to the banking industry and markets in which Citizens operates, the Company performed a quantitative goodwill impairment assessment in the third quarter 2020. When calculating the fair value of the Company’s reporting units under the income approach, short and medium-term forecasts incorporated current economic conditions and ongoing impacts of the COVID-19 pandemic, including a federal funds target near zero and near-term elevated ACL, offset by significant monetary and fiscal stimulus. Long-term cash flow projections reflected normalized rate and credit environments, as well as a long-term rate of return for each reporting unit. At the conclusion of the quantitative assessment it was determined that the estimated fair value of the Commercial Banking reporting unit exceeded its carrying amount by approximately 5%, and that of the Consumer Banking reporting unit substantially exceeded its carrying value.
The change in the carrying value of goodwill for the nine months ended September 30, 2020 is presented below:
|
| | | | | | | | | | | |
| (in millions) | Consumer Banking | | Commercial Banking | | Total |
|
| Balance at December 31, 2019 |
| $2,258 |
| |
| $4,786 |
| |
| $7,044 |
|
| Business acquisitions | 0 |
| | 6 |
| | 6 |
|
| Balance at September 30, 2020 |
| $2,258 |
| |
| $4,792 |
| |
| $7,050 |
|
Accumulated impairment losses related to the Consumer Banking reporting unit totaled $5.9 billion at September 30, 2020 and December 31, 2019. The accumulated impairment losses related to the Commercial Banking reporting unit totaled $50 million at September 30, 2020 and December 31, 2019. NaN impairment was recorded for the three and nine months ended September 30, 2020 or 2019.
NOTE 76 - VARIABLE INTEREST ENTITIES
Citizens is involved in various entities that are considered VIEs, including investments in limited partnerships that sponsor affordable housing projects, limited liability companies that sponsor renewable energy projects or asset-backed securities, and lending to special purpose entities. Citizens’ maximum exposure to loss as a result of its involvement with these entities is limited to the balance sheet carrying amount of its investment in equity and asset-backed securities, unfunded commitments, and outstanding principal balance of loans to special purpose entities. The Company does not consolidate any of its investments in these entities. These investments are included in other assets in the Consolidated Balance Sheets. For more details see Note 10 in the 2020 Form 10-K.
A summary of these investments is presented below:
|
| | | | | | | |
| (in millions) | September 30, 2020 | | December 31, 2019 |
| Lending to special purpose entities included in loans and leases |
| $1,173 |
| |
| $1,101 |
|
| LIHTC investment included in other assets | 1,543 |
| | 1,401 |
|
| LIHTC unfunded commitments included in other liabilities | 810 |
| | 716 |
|
| Investment in asset-backed securities included in AFS securities | 813 |
| | 0 |
|
| Renewable energy investments included in other assets | 410 |
| | 355 |
|
| | | | | | | | | | | |
| (in millions) | June 30, 2021 | | December 31, 2020 |
| Lending to special purpose entities included in loans and leases | $1,520 | | | $1,295 | |
| LIHTC investment included in other assets | 1,926 | | | 1,687 | |
| LIHTC unfunded commitments included in other liabilities | 974 | | | 875 | |
| Investment in asset-backed securities included in HTM securities | 826 | | | 893 | |
| Renewable energy investments included in other assets | 448 | | | 403 | |
Lending to Special Purpose Entities
Citizens provides lending facilities to third-party sponsored special purpose entities. Because the sponsor for each respective entity has the power to direct how proceeds from the Company are utilized, as well as maintains responsibility for any associated servicing commitments, Citizens is not the primary beneficiary of these entities. Accordingly, Citizens does not consolidate these VIEs on the Consolidated Balance Sheets. As of SeptemberJune 30, 20202021 and December 31, 2019,2020, the lending facilities had aggregate unpaid principal balances of $1.2$1.5 billion and $1.1$1.3 billion, respectively, and undrawn commitments to extend credit of $1.3$1.7 billion and $1.2$1.5 billion, respectively.
Low Income Housing Tax Credit Partnerships
The purpose of the Company’s equity investments is to assist in achieving the goals of the Community Reinvestment Act and to earn an adequate return of capital. LIHTC partnerships are managed by unrelated general partners that have the power to direct the activities which most significantly affect the performance of the partnerships. Citizens is therefore not the primary beneficiary of any LIHTC partnerships. Accordingly, Citizens does not consolidate these VIEs and accounts for these investments in other assets on the Consolidated Balance Sheets.
Citizens applies the proportional amortization method to account for its LIHTC investments. Under the proportional amortization method, the Company applies a practical expedient and amortizes the initial cost of the investment in proportion to the tax credits received in the current period as compared to the total tax credits expected to be received over the life of the investment. The amortization and tax benefits are included as a component of income tax expense. The tax credits received are reported as a reduction of income tax expense (or an increase to income tax benefit) related to these transactions.
The following table presents other information related to the Company’s affordable housing tax credit investments:
|
| | | | | | | | | | | | | | | |
| | Three Months Ended September 30, | | Nine Months Ended September 30, |
| (in millions) | 2020 |
| | 2019 |
| | 2020 |
| | 2019 |
|
| Tax credits included in income tax expense |
| $40 |
| |
| $30 |
| |
| $120 |
| |
| $99 |
|
| Amortization expense included in income tax expense | 42 |
| | 33 |
| | 127 |
| | 105 |
|
| Other tax benefits included in income tax expense | 10 |
| | 8 |
| | 30 |
| | 24 |
|
| | | | | | | | | | | | | | | | | | | | | | | |
| Three Months Ended June 30, | | Six Months Ended June 30, |
| (in millions) | 2021 | | 2020 | | 2021 | | 2020 |
| Tax credits included in income tax expense | $51 | | | $39 | | | $102 | | | $80 | |
| Other tax benefits included in income tax expense | 13 | | | 10 | | | 25 | | | 20 | |
| Total tax benefits included in income tax expense | 64 | | | 49 | | | 127 | | | 100 | |
| Less: Amortization included in income tax expense | 53 | | | 42 | | | 106 | | | 85 | |
| Net benefits from affordable housing tax credit investments included in income tax expense | $11 | | | $7 | | | $21 | | | $15 | |
NaN LIHTC investment impairment losses were recognized three and ninesix months ended SeptemberJune 30, 2021 and 2020, and 2019, respectively.
Asset-backed securities
In September 2020, Citizens sold $973 million of education loans, inclusive of accrued interest, capitalized interest and fees, to a third-party sponsored VIE. As part of this sale, the Company recognized a gain on sale of $32 million in other income. The Company provided financing to the purchaser for a portion of the sale price in the form of $813 million of asset-backed securities collateralized by the sold assets. Citizens will continue to act as primary servicer for the sold educational loans, and will receive a servicing fee. A third-party special servicer will be responsible for servicing for all loans that become significantly delinquent, as discussed below.
At the time of the sale, and at each subsequent reporting period, Citizens is required to evaluate its involvement with the VIE to determine if it holds a variable interest in the VIE and, if so, if the Company is the primary beneficiary of the VIE. If Citizens is both a variable interest holder and the primary beneficiary of the VIE it would be required to consolidate the VIE. As of September 30, 2020, the Company concluded that both their investment in asset-backed securities as well as the primary servicing fee are considered variable interests in the VIE as there is a possibility, even if remote, that would result in either the Company’s interest in the asset-backed securities or the primary servicing fee absorbing some of the losses of the VIE.
After concluding that the Company has one or more variable interests in the VIE, the Company must determine if the Company is the primary beneficiary of the VIE. GAAP defines the primary beneficiary as the entity that has both an economic exposure to the VIE as well as the power to direct the activities that are determined to be most significant to the economic performance of the VIE. In order to make this determination, the Company needed to first establish which activities are the most significant to the economic performance of the VIE. Based on a review of the historical performance of the types of education loans sold to the VIE, as well as consideration of which activities performed by the owner or servicer of the loans contribute most significantly to the ultimate performance of the loans, the Company concluded that the determination of the assets to be purchased by the VIE and the servicing activities that are performed for significantly delinquent loans are the activities that most significantly impact the performance of the loans, and thus the performance of the VIE holding these assets. As a result, the Company concluded that the entity that controls the determination of the assets to be purchased by the VIE and the servicing activities on significantly delinquent loans controls the activities that most significantly impact the economic performance of the VIE. As part of the sale process, the equity holder in the VIE had the ability to remove loans from the proposed sale pool, demonstrating control over the determination of the assets to be purchased. In addition, as a holder of asset-backed securities and the primary servicer of the loans, Citizens does not have the power to direct servicing of significantly delinquent loans. These rights are reserved for the third-party special servicer of the loans, who is controlled through a contractual relationship with the equity investor in the VIE. As the activities which most significantly affect the performance of the VIE are controlled by the equity holder in the VIE, and not by Citizens, the Company has concluded that Citizens is therefore not the primary beneficiary. Accordingly, Citizens does not consolidate the VIE and accounts for its investment in AFS asset-backed securities on the Consolidated Balance Sheets.
Renewable Energy Entities
The Company’s investments in renewable energy entities provide benefits from a return generated by government incentives plus other tax attributes that are associated with tax ownership (e.g., tax depreciation). As a tax equity investor, Citizens does not have the power to direct the activities which most significantly affect the performance of these entities and therefore is not the primary beneficiary of any renewable energy entities. Accordingly, Citizens does not consolidate these VIEs and accounts for these investments in other assets on the Consolidated Balance Sheets.
NOTE 87 - BORROWED FUNDS
Short-term borrowed funds
Short-term borrowed funds were $252$62 million and $274$243 million as of SeptemberJune 30, 20202021 and December 31, 2019,2020, respectively.
Citizens Financial Group, Inc. | 72
Long-term borrowed funds
The following table presents a summary of the Company’s long-term borrowed funds:
| | | | | | | | | | | |
| (in millions) | June 30, 2021 | | December 31, 2020 |
| Parent Company: | | | |
2.375% fixed-rate senior unsecured debt, due July 2021 (1) | $0 | | | $350 | |
4.150% fixed-rate subordinated debt, due September 2022 (2) | 168 | | | 182 | |
3.750% fixed-rate subordinated debt, due July 2024 (2) | 90 | | | 159 | |
4.023% fixed-rate subordinated debt, due October 2024 (2) | 17 | | | 25 | |
4.350% fixed-rate subordinated debt, due August 2025 (2) | 133 | | | 193 | |
4.300% fixed-rate subordinated debt, due December 2025 (2) | 336 | | | 450 | |
| 2.850% fixed-rate senior unsecured notes, due July 2026 | 497 | | | 497 | |
| 2.500% fixed-rate senior unsecured notes, due February 2030 | 298 | | | 297 | |
| 3.250% fixed-rate senior unsecured notes, due April 2030 | 745 | | | 745 | |
3.750% fixed-rate reset subordinated debt, due February 2031 (2) | 69 | | | 0 | |
4.300% fixed-rate reset subordinated debt, due February 2031 (2) | 135 | | | 0 | |
4.350% fixed-rate reset subordinated debt, due February 2031 (2) | 60 | | | 0 | |
| 2.638% fixed-rate subordinated debt, due September 2032 | 547 | | | 543 | |
| CBNA’s Global Note Program: | | | |
| | | |
| | | |
| | | |
| | | |
| | | |
| 2.550% senior unsecured notes, due May 2021 | 0 | | | 1,003 | |
| 3.250% senior unsecured notes, due February 2022 | 708 | | | 716 | |
0.874% floating-rate senior unsecured notes, due February 2022 (3) | 300 | | | 299 | |
0.951% floating-rate senior unsecured notes, due May 2022 (3) | 250 | | | 250 | |
| 2.650% senior unsecured notes, due May 2022 | 507 | | | 510 | |
| 3.700% senior unsecured notes, due March 2023 | 520 | | | 527 | |
1.096% floating-rate senior unsecured notes, due March 2023 (3) | 250 | | | 249 | |
| 2.250% senior unsecured notes, due April 2025 | 746 | | | 746 | |
| 3.750% senior unsecured notes, due February 2026 | 536 | | | 551 | |
Additional Borrowings by CBNA and Other Subsidiaries:
| | | |
| Federal Home Loan Bank advances, 0.909% weighted average rate, due through 2038 | 18 | | | 19 | |
| Other | 27 | | | 35 | |
| Total long-term borrowed funds | $6,957 | | | $8,346 | |
|
| | | | | | | |
| (in millions) | September 30, 2020 | | December 31, 2019 |
| Parent Company: | | | |
| 2.375% fixed-rate senior unsecured debt, due July 2021 |
| $350 |
| |
| $349 |
|
4.150% fixed-rate subordinated debt, due September 2022 (1) | 181 |
| | 348 |
|
3.750% fixed-rate subordinated debt, due July 2024 (1) | 159 |
| | 250 |
|
4.023% fixed-rate subordinated debt, due October 2024 (1) | 25 |
| | 42 |
|
4.350% fixed-rate subordinated debt, due August 2025 (1) | 193 |
| | 249 |
|
4.300% fixed-rate subordinated debt, due December 2025 (1) | 450 |
| | 750 |
|
| 2.850% fixed-rate senior unsecured notes, due July 2026 | 497 |
| | 496 |
|
| 2.500% fixed-rate senior unsecured notes, due February 2030 | 297 |
| | 0 |
|
| 3.250% fixed-rate senior unsecured notes, due April 2030 | 745 |
| | 0 |
|
2.638% fixed-rate subordinated debt, due September 2032 (1) | 542 |
| | 0 |
|
| CBNA’s Global Note Program: | | | |
| 2.250% senior unsecured notes, due March 2020 | 0 |
| | 700 |
|
2.678% floating-rate senior unsecured notes, due March 2020 (2) | 0 |
| | 300 |
|
2.217% floating-rate senior unsecured notes, due May 2020 (2) | 0 |
| | 250 |
|
| 2.200% senior unsecured notes, due May 2020 | 0 |
| | 500 |
|
| 2.250% senior unsecured notes, due October 2020 | 750 |
| | 750 |
|
| 2.550% senior unsecured notes, due May 2021 | 1,005 |
| | 991 |
|
| 3.250% senior unsecured notes, due February 2022 | 720 |
| | 711 |
|
0.985% floating-rate senior unsecured notes, due February 2022 (2) | 299 |
| | 299 |
|
1.044% floating-rate senior unsecured notes, due May 2022 (2) | 250 |
| | 250 |
|
| 2.650% senior unsecured notes, due May 2022 | 512 |
| | 501 |
|
| 3.700% senior unsecured notes, due March 2023 | 530 |
| | 515 |
|
1.168% floating-rate senior unsecured notes, due March 2023 (2) | 249 |
| | 249 |
|
| 2.250% senior unsecured notes, due April 2025 | 745 |
| | 0 |
|
| 3.750% senior unsecured notes, due February 2026 | 555 |
| | 521 |
|
Additional Borrowings by CBNA and Other Subsidiaries:
| | | |
| Federal Home Loan Bank advances, 0.943% weighted average rate, due through 2038 | 19 |
| | 5,008 |
|
| Other | 36 |
| | 18 |
|
| Total long-term borrowed funds |
| $9,109 |
| |
| $14,047 |
|
(1) (2) SeptemberJune 30, 20202021 balances reflect the September 2020February 2021 completion of (i) $621$265 million in private exchange offers for 5 series of outstanding subordinated notes whereby participants received a combination of the Company’s newly issued 2.638%3.750%, 4.300%, and 4.350% fixed-rate reset subordinated notes due 2032 and an additional cash payment and (ii) $11 million in related cash tender offers whereby validly tendered and accepted subordinated notes were purchased2031 which are redeemable by Citizens and subsequently cancelled.the Company five years prior to their maturity.
(2) (3) Rate disclosed reflects the floating rate as of SeptemberJune 30, 2020 or final rate, as applicable.2021.
The Parent Company’s long-term borrowed funds as of SeptemberJune 30, 20202021 and December 31, 20192020 included principal balances of $3.5$3.2 billion and $2.5$3.5 billion, respectively, and unamortized deferred issuance costs and/or discounts of ($92)$84 million and ($8)$90 million, respectively. CBNA and other subsidiaries’ long-term borrowed funds as of SeptemberJune 30, 20202021 and December 31, 20192020 included principal balances of $5.6$3.8 billion and $11.5$4.8 billion, respectively, with unamortized deferred issuance costs and/or discounts of ($13)$9 million and ($13)$11 million, respectively, and hedging basis adjustments of $128$76 million and $50$112 million, respectively. See Note 98 for further information about the Company’s hedging of certain long-term borrowed funds.
Advances, lines of credit, and letters of credit from the FHLB are collateralized primarily by pledgedresidential mortgages and pledged securitieshome equity products at least sufficient to satisfy the collateral maintenance level established by the FHLB. The utilized borrowing capacity for FHLB advances and letters of credit was $3.7$2.5 billion and $9.8$3.2 billion at SeptemberJune 30, 20202021 and December 31, 2019,2020, respectively. The Company’s available FHLB borrowing capacity was $13.2$14.4 billion and $7.2$13.9 billion at SeptemberJune 30, 20202021 and December 31, 2019,2020, respectively. Citizens can also borrow from the FRB discount window to meet short-term liquidity requirements. Collateral, including certain loans, is pledged to support this borrowing capacity. At SeptemberJune 30, 2020,2021, the Company’s unused secured borrowing capacity was approximately $61.7$64.3 billion, which includes unencumbered securities, FHLB borrowing capacity, and FRB discount window capacity.
Citizens Financial Group, Inc. | 73
The following table presents a summary of maturities for the Company’s long-term borrowed funds at SeptemberJune 30, 2020:2021:
|
| | | | | | | | | |
| (in millions) | Parent Company | CBNA and Other Subsidiaries | Consolidated |
|
| Year | | | |
| 2020 |
| $0 |
|
| $752 |
|
| $752 |
|
| 2021 | 350 |
| 1,014 |
| 1,364 |
|
| 2022 | 181 |
| 1,790 |
| 1,971 |
|
| 2023 | 0 |
| 780 |
| 780 |
|
| 2024 | 184 |
| 0 |
| 184 |
|
| 2025 and thereafter | 2,724 |
| 1,334 |
| 4,058 |
|
| Total |
| $3,439 |
|
| $5,670 |
|
| $9,109 |
|
| | | | | | | | | | | |
| (in millions) | Parent Company | CBNA and Other Subsidiaries | Consolidated |
| Year | | | |
| 2021 | $0 | | $4 | | $4 | |
| 2022 | 168 | | 1,771 | | 1,939 | |
| 2023 | 0 | | 771 | | 771 | |
| 2024 | 107 | | 0 | | 107 | |
| 2025 | 469 | | 760 | | 1,229 | |
| 2026 and thereafter | 2,351 | | 556 | | 2,907 | |
| Total | $3,095 | | $3,862 | | $6,957 | |
NOTE 98 - DERIVATIVES
In the normal course of business, Citizens enters into a variety of derivative transactions to meet the financing needs of its customers and to reduce its own exposure to fluctuations in interest rates and foreign currency exchange rates. These transactions include interest rate swap contracts, interest rate options, foreign exchange contracts, residential loan commitment rate locks, interest rate future contracts, swaptions, certain commodities, forward commitments to sell TBAs, forward sale contracts and purchase options. The Company does not use derivatives for speculative purposes.
The Company’s derivative instruments are recognized on the Consolidated Balance Sheets in derivative assets and derivative liabilities at fair value. Information regarding the valuation methodology and inputs used to estimate the fair value of the Company’s derivative instruments is described in Note 19 in the Company’s 20192020 Form 10-K.
Derivative assets and derivative liabilities are netted by counterparty on the Consolidated Balance Sheets if a “right of setoff” has been established in a master netting agreement between the Company and the counterparty. This netted derivative asset or liability position is also netted against the fair value of any cash collateral that has been pledged or received in accordance with a master netting agreement.
The following table presents derivative instruments included onin the Consolidated Balance Sheets:
| | | | September 30, 2020 | | December 31, 2019 | | June 30, 2021 | | December 31, 2020 |
| (in millions) | Notional Amount(1) | Derivative Assets | Derivative Liabilities | | Notional Amount(1) | Derivative Assets | Derivative Liabilities | (in millions) | Notional Amount(1) | Derivative Assets | Derivative Liabilities | | Notional Amount(1) | Derivative Assets | Derivative Liabilities |
| Derivatives designated as hedging instruments: | | | | Derivatives designated as hedging instruments: | | | |
| Interest rate contracts |
| $26,800 |
|
| $4 |
|
| $1 |
| |
| $29,846 |
|
| $1 |
|
| $0 |
| Interest rate contracts | $25,300 | | $16 | | $7 | | | $22,300 | | $1 | | $3 | |
| Derivatives not designated as hedging instruments: | | | | Derivatives not designated as hedging instruments: | |
| Interest rate contracts | 148,161 |
| 1,761 |
| 216 |
| | 142,386 |
| 772 |
| 133 |
| Interest rate contracts | 144,982 | | 1,118 | | 190 | | | 149,021 | | 1,565 | | 214 | |
| Foreign exchange contracts | 16,448 |
| 239 |
| 189 |
| | 15,101 |
| 174 |
| 166 |
| Foreign exchange contracts | 20,289 | | 273 | | 209 | | | 16,789 | | 320 | | 291 | |
| Commodities contracts | | Commodities contracts | 431 | | 424 | | 427 | | | 246 | | 62 | | 61 | |
| TBA contracts | 13,161 |
| 7 |
| 34 |
| | 0 |
| 0 |
| 0 |
| TBA contracts | 10,924 | | 5 | | 28 | | | 11,149 | | 8 | | 65 | |
| Other contracts | 8,011 |
| 275 |
| 66 |
| | 6,868 |
| 37 |
| 23 |
| Other contracts | 6,717 | | 89 | | 0 | | | 8,051 | | 197 | | 0 | |
| Total derivatives not designated as hedging instruments | | 2,282 |
| 505 |
| | | 983 |
| 322 |
| Total derivatives not designated as hedging instruments | | 1,909 | | 854 | | | 2,152 | | 631 | |
| Gross derivative fair values | | 2,286 |
| 506 |
| | | 984 |
| 322 |
| Gross derivative fair values | | 1,925 | | 861 | | | 2,153 | | 634 | |
Less: Gross amounts offset in the Consolidated Balance Sheets (2) | | (187 | ) | (187 | ) | | | (107 | ) | (107 | ) | Less: Gross amounts offset in the Consolidated Balance Sheets (2) | | (207) | | (207) | | | (182) | | (182) | |
Less: Cash collateral applied (2) | | (69 | ) | (219 | ) | | | (70 | ) | (95 | ) | Less: Cash collateral applied (2) | | (63) | | (510) | | | (56) | | (324) | |
| Total net derivative fair values presented in the Consolidated Balance Sheets | |
| $2,030 |
|
| $100 |
| | |
| $807 |
|
| $120 |
| Total net derivative fair values presented in the Consolidated Balance Sheets | | $1,655 | | $144 | | | $1,915 | | $128 | |
(1) The notional or contractual amount of interest rate derivatives and foreign exchange contracts is the amount upon which interest and other payments under the contract are based. For interest rate contracts, the notional amount is typically not exchanged. Therefore, notional amounts should not be taken as the measure of credit or market risk, as they do not measure the true economic risk of these contracts.
(2) Amounts represent the impact of enforceable master netting agreements that allow the Company to net settle positive and negative positions.positions as well as collateral paid and received.
The Company’s derivative transactions are internally divided into three sub-groups: institutional, customer and residential loan. Certain derivative transactions within these sub-groups are designated as fair value or cash flow hedges, as described below:
Derivatives Designated As Hedging Instruments
The Company’s institutional derivatives qualify for hedge accounting treatment. The net interest accruals on interest rate swaps designated in a fair value or cash flow hedge relationship are treated as an adjustment to interest income or interest expense of the item being hedged. The Company formally documents at inception all hedging relationships, as well as risk management objectives and strategies for undertaking various accounting
Citizens Financial Group, Inc. | 74
hedges. Additionally, the Company monitors the effectiveness of its hedge relationships during the duration of the hedge period. The methods utilized to assess hedge effectiveness vary based on hedge relationship and the Company monitors each relationship to ensure that management’s initial intent continues to be satisfied. The Company discontinues hedge accounting treatment when it is determined that a derivative is not expected to be, or has ceased to be, effective as a hedge and subsequently reflects changes in the fair value of the derivative in earnings after termination of the hedge relationship.
Fair Value Hedges
In a fair value hedge, changes in the fair value of both the derivative instrument and the hedged asset or liability attributable to the risk being hedged are recognized in the same income statement line item in the Consolidated Statements of Operations when the changes in fair value occur.
Citizens has outstanding interest rate swap agreements utilized to manage the interest rate exposure on its long-term borrowings and AFS debt securities. In March 2020 the fair value hedge of certain fixed rate residential mortgages was terminated due to a portion of the hedged item being sold. Certain fair value hedges have been designated as a last-of-layer hedge, which affords the Company the ability to execute a fair value hedge of the interest rate risk associated with a portfolio of similar pre-payableprepayable assets whereby the last dollar amount estimated to remain in the portfolio of assets is identified as the hedged item.
The following table presents the change in fair value of interest rate contracts designated as fair value hedges, as well as the change in fair value of the related hedged items attributable to the risk being hedged, included in the Consolidated Statements of Operations:
| | | | | | | | | | | | | | | | | | | | | | | | | | |
| Three Months Ended June 30, | | Six Months Ended June 30, | |
| (in millions) | 2021 | | 2020 | | 2021 | | 2020 | Affected Line Item in the Consolidated Statements of Operations |
| Interest rate swaps hedging borrowed funds | ($10) | | | $5 | | | ($38) | | | $98 | | Interest expense - long-term borrowed funds |
| Hedged long-term debt attributable to the risk being hedged | 9 | | | (3) | | | 37 | | | (95) | | Interest expense - long-term borrowed funds |
| Interest rate swaps hedging fixed rate loans | 0 | | | 0 | | | 0 | | | 17 | | Interest and fees on loans and leases |
| Hedged fixed rate loans attributable to the risk being hedged | 0 | | | 0 | | | 0 | | | (17) | | Interest and fees on loans and leases |
| Interest rate swaps hedging debt securities available for sale | 4 | | | (14) | | | 32 | | | (121) | | Interest income - investment securities |
| Hedged debt securities available for sale attributable to risk being hedged | (4) | | | 14 | | | (32) | | | 121 | | Interest income - investment securities |
|
| | | | | | | | | | | | | | | | |
| | Three Months Ended September 30, | | Nine Months Ended September 30, | |
| (in millions) | 2020 |
| | 2019 |
| | 2020 |
| | 2019 |
| Affected Line Item in the Consolidated Statements of Operations |
| Interest rate swaps hedging borrowed funds |
| ($16 | ) | |
| $18 |
| |
| $82 |
| |
| $122 |
| Interest expense - borrowed funds |
| Hedged long-term debt attributable to the risk being hedged | 17 |
| | (18 | ) | | (78 | ) | | (121 | ) | Interest expense - borrowed funds |
| Interest rate swaps hedging fixed rate loans | 0 |
| | (10 | ) | | 17 |
| | (26 | ) | Interest and fees on loans and leases |
| Hedged fixed rate loans attributable to the risk being hedged | 0 |
| | 10 |
| | (17 | ) | | 26 |
| Interest and fees on loans and leases |
| Interest rate swaps hedging debt securities available for sale | 7 |
| | (13 | ) | | (114 | ) | | (13 | ) | Interest income - investment securities |
| Hedged debt securities available for sale attributable to risk being hedged | (7 | ) | | 13 |
| | 114 |
| | 13 |
| Interest income - investment securities |
The following table reflects amounts recorded onin the Consolidated Balance Sheets related to cumulative basis adjustments for fair value hedges:
| | | | September 30, 2020 | | December 31, 2019 | | June 30, 2021 | | December 31, 2020 |
| (in millions) | Debt securities available for sale(1) | Long-term borrowed funds | | Debt securities available for sale(1) | Residential mortgages | Long-term borrowed funds | (in millions) | Debt securities available for sale(1) | Long-term borrowed funds | | Debt securities available for sale(1) | Long-term borrowed funds |
| Carrying amount of hedged assets |
| $12,314 |
|
| $0 |
| |
| $15,798 |
|
| $976 |
|
| $0 |
| Carrying amount of hedged assets | $8,287 | | $0 | | | $10,869 | | $0 | |
| Carrying amount of hedged liabilities | 0 |
| 4,072 |
| | 0 |
| 0 |
| 4,689 |
| Carrying amount of hedged liabilities | 0 | | 2,272 | | | 0 | | 3,307 | |
| Cumulative amount of fair value hedging adjustments included in the carrying amount of the hedged items | 107 |
| 128 |
| | (8 | ) | 17 |
| 50 |
| Cumulative amount of fair value hedging adjustments included in the carrying amount of the hedged items | 64 | | 76 | | | 96 | | 112 | |
(1) The Company designated $2.0 billion as the hedged amount (from a closed portfolio of prepayable financial assets with a carrying valuean amortized cost basis of $12.3$8.3 billion and $15.8$10.9 billion at Septemberas of June 30, 20202021 and December 31, 2019,2020, respectively) in a last-of-layer hedging relationship, which commenced in the third quarter of 2019.
Cash Flow Hedges
In a cash flow hedge, the entire change in the fair value of the interest rate swap included in the assessment of hedge effectiveness is initially recorded in OCI and is subsequently reclassified from OCI to current period earnings (interest income or interest expense) in the same period that the hedged item affects earnings.
Citizens has outstanding interest rate swap agreements designed to hedge a portion of the Company’s floating ratefloating-rate assets, and liabilities. All of these swaps have been deemed highly effective cash flow hedges. During the next 12 months, there are $2$86 million in pre-tax net gains on derivative instruments included in OCI expected to be reclassified to net interest income in the Consolidated Statements of Operations. This amount could differ from amounts actually recognized due to changes in interest rates, hedge de-designations, and the addition of other hedges subsequent to SeptemberJune 30, 2020.2021.
The following table presents the pre-tax net gains (losses) recorded in the Consolidated Statements of Operations and in the Consolidated Statements of Comprehensive Income relating to derivative instruments designated as cash flow hedges:
|
| | | | | | | | | | | | | | | |
| | Three Months Ended September 30, | | Nine Months Ended September 30, |
| (in millions) | 2020 |
| | 2019 |
| | 2020 |
| | 2019 |
|
| Amount of pre-tax net (losses) gains recognized in OCI |
| $0 |
| |
| ($5 | ) | |
| $118 |
| |
| $138 |
|
| Amount of pre-tax net gains (losses) reclassified from OCI into interest income | 68 |
| | (22 | ) | | 128 |
| | (62 | ) |
| Amount of pre-tax net (losses) gains reclassified from OCI into interest expense | (11 | ) | | 8 |
| | (22 | ) | | 9 |
|
Citizens Financial Group, Inc. | 75
| | | | | | | | | | | | | | | | | | | | | | | |
| Three Months Ended June 30, | | Six Months Ended June 30, |
| (in millions) | 2021 | | 2020 | | 2021 | | 2020 |
| Amount of pre-tax net gains (losses) recognized in OCI | $62 | | | ($11) | | | $34 | | | $118 | |
| Amount of pre-tax net gains (losses) reclassified from OCI into interest income | 49 | | | 55 | | | 95 | | | 60 | |
| Amount of pre-tax net gains (losses) reclassified from OCI into interest expense | (12) | | | (10) | | | (24) | | | (11) | |
Derivatives Not Designated As Hedging Instruments
Economic Hedges
The Company’s economic hedges include those related to offsetting customer derivatives, residential mortgage loan derivatives (including interest rate lock commitments and forward sales commitments) and derivatives to hedge its residential MSR portfolio. Customer derivatives include interest rate, and foreign exchange and commodity derivative contracts designed to meet the hedging and financing needs of the Company’s customers, and are economically hedged by the Company to offset its market exposure. Interest rate lock commitments on residential mortgage loans that will be held for sale are considered derivative instruments, and are economically hedged by entering into forward sale commitments to manage changes in fair value due to interest rate risk. Residential MSR portfolio derivatives are entered to hedge the risk of changes in the fair value of the Company’s MSR asset.
MSRs.
The following table presents the effect of economic hedges on noninterest income:
| | | | | | | | | | | | | | | | | | | | | | | | | | |
| Amounts Recognized in
Noninterest Income for the | |
| Three Months Ended June 30, | | Six Months Ended June 30, | Affected Line Item in the Consolidated Statements of Operations |
| (in millions) | 2021 | | 2020 | | 2021 | | 2020 |
| Economic hedge type: | | | | | | | | |
| Customer interest rate contracts | $133 | | | $180 | | | ($215) | | | $1,269 | | Foreign exchange and interest rate products |
| Derivatives hedging interest rate risk | (129) | | | (161) | | | 227 | | | (1,246) | | Foreign exchange and interest rate products |
| Customer foreign exchange contracts | 19 | | | 23 | | | (97) | | | (7) | | Foreign exchange and interest rate products |
| Derivatives hedging foreign exchange risk | (11) | | | (50) | | | 139 | | | 49 | | Foreign exchange and interest rate products |
| Customer commodity contracts | 319 | | | 7 | | | 413 | | | (56) | | Foreign exchange and interest rate products |
| Derivatives hedging commodity price risk | (317) | | | (7) | | | (409) | | | 57 | | Foreign exchange and interest rate products |
| Residential loan commitments | 67 | | | 14 | | | (171) | | | 154 | | Mortgage banking fees |
| Derivatives hedging residential loan commitments and mortgage loans held for sale, at fair value | (141) | | | 110 | | | 134 | | | (19) | | Mortgage banking fees |
| Derivative contracts used to hedge residential MSRs | 53 | | | 62 | | | (129) | | | 333 | | Mortgage banking fees |
| Total | ($7) | | | $178 | | | ($108) | | | $534 | | |
|
| | | | | | | | | | | | | | | | |
| | Amounts Recognized in Noninterest Income for the | |
| | Three Months Ended September 30, | | Nine Months Ended September 30, | Affected Line Item in the Consolidated Statements of Operations |
| (in millions) | 2020 |
| | 2019 |
| | 2020 |
| | 2019 |
|
| Economic hedge type: | | | | | | | | |
| Customer interest rate contracts |
| $7 |
| |
| $196 |
| |
| $1,276 |
| |
| $850 |
| Foreign exchange and interest rate products |
| Customer foreign exchange contracts | 80 |
| | (81 | ) | | 73 |
| | (162 | ) | Foreign exchange and interest rate products |
| Derivative transactions to hedge interest rate risk | 1 |
| | (182 | ) | | (1,245 | ) | | (809 | ) | Foreign exchange and interest rate products |
| Derivative transactions to hedge foreign exchange risk | (126 | ) | | 130 |
| | (77 | ) | | 224 |
| Foreign exchange and interest rate products |
| Residential loan commitments | 36 |
| | 6 |
| | 190 |
| | 22 |
| Mortgage banking fees |
| Derivative contracts used to hedge residential loan commitments | 6 |
| | 29 |
| | (13 | ) | | 24 |
| Mortgage banking fees |
| Derivative contracts used to hedge residential MSRs | 2 |
| | 92 |
| | 335 |
| | 208 |
| Mortgage banking fees |
| Other derivative contracts | 26 |
| | 0 |
| | (30 | ) | | 0 |
| Foreign exchange and interest rate products |
| Derivative transactions to hedge other derivative risk | (25 | ) | | 0 |
| | 32 |
| | 0 |
| Foreign exchange and interest rate products |
| Total |
| $7 |
| |
| $190 |
| |
| $541 |
| |
| $357 |
| |
Citizens Financial Group, Inc. | 76
NOTE 109 - ACCUMULATED OTHER COMPREHENSIVE INCOME (LOSS)
The following table presents the changes in the balances, net of income taxes, of each component of AOCI:
| | | | | | | | | | | | | | | | | | | | | | | | | | |
| | As of and for the Three Months Ended June 30, |
| (in millions) | Net Unrealized Gains (Losses) on Derivatives | | Net Unrealized Gains (Losses) on Debt Securities | | Employee Benefit Plans | | Total AOCI |
| Balance at April 1, 2020 | $96 | | | $401 | | | ($412) | | | $85 | |
| Other comprehensive income (loss) before reclassifications | (8) | | | 49 | | | 0 | | | 41 | |
| Amounts reclassified to the Consolidated Statements of Operations | (34) | | | (2) | | | 4 | | | (32) | |
| Net other comprehensive income (loss) | (42) | | | 47 | | | 4 | | | 9 | |
| Balance at June 30, 2020 | $54 | | | $448 | | | ($408) | | | $94 | |
| Balance at April 1, 2021 | ($57) | | | $71 | | | ($425) | | | ($411) | |
| Other comprehensive income (loss) before reclassifications | 46 | | | 10 | | | 0 | | | 56 | |
| | | | | | | |
| Amounts reclassified to the Consolidated Statements of Operations | (27) | | | (3) | | | 4 | | | (26) | |
| Net other comprehensive income (loss) | 19 | | | 7 | | | 4 | | | 30 | |
| Balance at June 30, 2021 | ($38) | | | $78 | | | ($421) | | | ($381) | |
| Primary location of amounts reclassified to the Consolidated Statements of Operations | Net interest income | | Securities gains, net | | Other operating expense | | |
|
| | | | | | | | | | | | | | | | |
| | | As of and for the Three Months Ended September 30, |
| (in millions) | Net Unrealized (Losses) Gains on Derivatives | | Net Unrealized (Losses) Gains on Debt Securities | | Employee Benefit Plans | | Total AOCI |
| Balance at July 1, 2019 |
| ($6 | ) | |
| ($25 | ) | |
| ($457 | ) | |
| ($488 | ) |
| Other comprehensive income before reclassifications | (4 | ) | | 42 |
| | 0 |
| | 38 |
|
| Other-than-temporary impairment not recognized in earnings on debt securities | 0 |
| | (1 | ) | | 0 |
| | (1 | ) |
| Amounts reclassified to the Consolidated Statements of Operations | 10 |
| | (2 | ) | | 3 |
| | 11 |
|
| Net other comprehensive income | 6 |
| | 39 |
| | 3 |
| | 48 |
|
| Balance at September 30, 2019 |
| $0 |
| |
| $14 |
| |
| ($454 | ) | |
| ($440 | ) |
| Balance at July 1, 2020 |
| $54 |
| |
| $448 |
| |
| ($408 | ) | |
| $94 |
|
| Other comprehensive (loss) income before reclassifications | 0 |
| | (44 | ) | | 0 |
| | (44 | ) |
| Amounts reclassified to the Consolidated Statements of Operations | (42 | ) | | (1 | ) | | 3 |
| | (40 | ) |
| Net other comprehensive (loss) income | (42 | ) | | (45 | ) | | 3 |
| | (84 | ) |
| Balance at September 30, 2020 |
| $12 |
| |
| $403 |
| |
| ($405 | ) | |
| $10 |
|
| Primary location of amounts reclassified to the Consolidated Statements of Operations | Net interest income | | Securities gains, net | | Other operating expense | | |
| | | | | | | | | | | | | | | | | | | | | | | | | | |
| | As of and for the Six Months Ended June 30, |
| (in millions) | Net Unrealized Gains (Losses) on Derivatives | | Net Unrealized Gains (Losses) on Debt Securities | | Employee Benefit Plans | | Total AOCI |
| Balance at January 1, 2020 | $3 | | | $1 | | | ($415) | | | ($411) | |
| Other comprehensive income (loss) before reclassifications | 88 | | | 449 | | | 0 | | | 537 | |
| | | | | | | |
| Amounts reclassified to the Consolidated Statements of Operations | (37) | | | (2) | | | 7 | | | (32) | |
| Net other comprehensive income (loss) | 51 | | | 447 | | | 7 | | | 505 | |
| | | | | | | |
| Balance at June 30, 2020 | $54 | | | $448 | | | ($408) | | | $94 | |
| Balance at January 1, 2021 | ($11) | | | $380 | | | ($429) | | | ($60) | |
| Other comprehensive income (loss) before reclassifications | 25 | | | (297) | | | 0 | | | (272) | |
| | | | | | | |
| Amounts reclassified to the Consolidated Statements of Operations | (52) | | | (5) | | | 8 | | | (49) | |
| Net other comprehensive income (loss) | (27) | | | (302) | | | 8 | | | (321) | |
| | | | | | | |
| Balance at June 30, 2021 | ($38) | | | $78 | | | ($421) | | | ($381) | |
| Primary location of amounts reclassified to the Consolidated Statements of Operations | Net interest income | | Securities gains, net | | Other operating expense | | |
Citizens Financial Group, Inc. | 77
|
| | | | | | | | | | | | | | | | |
| | | As of and for the Nine Months Ended September 30, |
| (in millions) | Net Unrealized (Losses) Gains on Derivatives | | Net Unrealized (Losses) Gains on Debt Securities | | Employee Benefit Plans | | Total AOCI |
| Balance at January 1, 2019 |
| ($143 | ) | |
| ($490 | ) | |
| ($463 | ) | |
| ($1,096 | ) |
| Other comprehensive income before reclassifications | 103 |
| | 509 |
| | 0 |
| | 612 |
|
| Amounts reclassified to the Consolidated Statements of Operations | 40 |
| | (10 | ) | | 9 |
| | 39 |
|
| Net other comprehensive income | 143 |
| | 499 |
| | 9 |
| | 651 |
|
| Cumulative effect of change in accounting principle | 0 |
| | 5 |
| | 0 |
| | 5 |
|
| Balance at September 30, 2019 |
| $0 |
| |
| $14 |
| |
| ($454 | ) | |
| ($440 | ) |
| Balance at January 1, 2020 |
| $3 |
| |
| $1 |
| |
| ($415 | ) | |
| ($411 | ) |
| Other comprehensive income before reclassifications | 88 |
| | 405 |
| | 0 |
| | 493 |
|
| Amounts reclassified to the Consolidated Statements of Operations | (79 | ) | | (3 | ) | | 10 |
| | (72 | ) |
| Net other comprehensive income | 9 |
| | 402 |
| | 10 |
| | 421 |
|
| Balance at September 30, 2020 |
| $12 |
| |
| $403 |
| |
| ($405 | ) | |
| $10 |
|
| Primary location of amounts reclassified to the Consolidated Statements of Operations | Net interest income | | Securities gains, net | | Other operating expense | | |
NOTE 1110 - STOCKHOLDERS’ EQUITY
Preferred Stock
The following table summarizes the Company’s preferred stock: | | | | | | September 30, 2020 | | December 31, 2019 | | June 30, 2021 | | December 31, 2020 |
| (in millions, except per share and share data) | Liquidation value per share | | Preferred Shares | | Carrying Amount | | Preferred Shares | | Carrying Amount | (in millions, except per share and share data) | Liquidation value per share | | Preferred Shares | | Carrying Amount | | Preferred Shares | | Carrying Amount |
| Authorized ($25 par value) | | | 100,000,000 |
| | | | 100,000,000 |
| | | |
| Authorized ($25 par value per share) | | Authorized ($25 par value per share) | | 100,000,000 | | | | 100,000,000 | | |
| Issued and outstanding: | | | | | | | | | | Issued and outstanding: | |
| Series A | $1,000 | | 250,000 |
| | $247 | | 250,000 |
| | $247 | Series A | $1,000 | | | 0 | | | $0 | | 250,000 | | | $247 |
| Series B | 1,000 |
| | 300,000 | | 296 |
| | 300,000 |
| | 296 |
| Series B | 1,000 | | | 300,000 | | | 296 | | | 300,000 | | | 296 | |
| Series C | 1,000 |
| | 300,000 |
| | 297 |
| | 300,000 |
| | 297 |
| Series C | 1,000 | | | 300,000 | | | 297 | | | 300,000 | | | 297 | |
| Series D | 1,000 |
| (1) | 300,000 |
| (2) | 293 |
| | 300,000 |
| | 293 |
| Series D | 1,000 | | (1) | 300,000 | | (2) | 293 | | | 300,000 | | | 293 | |
| Series E | 1,000 |
| (1) | 450,000 |
| (3) | 437 |
| | 450,000 |
| | 437 |
| Series E | 1,000 | | (1) | 450,000 | | (3) | 437 | | | 450,000 | | | 437 | |
| Series F | 1,000 |
| | 400,000 |
| | 395 |
| | 0 |
| | 0 |
| Series F | 1,000 | | | 400,000 | | | 395 | | | 400,000 | | | 395 | |
| Series G | | Series G | 1,000 | | | 300,000 | | | 296 | | | 0 | | | 0 |
| Total | | | 2,000,000 |
| | $1,965 | | 1,600,000 |
| | $1,570 | Total | | 2,050,000 | | | $2,014 | | 2,000,000 | | | $1,965 |
(1) Equivalent to $25 per depositary share.
(2) Represented by 12,000,000 depositary shares each representing a 1/40th interest in the Series D Preferred Stock.
(3) Represented by 18,000,000 depositary shares each representing a 1/40th interest in the Series E Preferred Stock.
In June 2021, the Company provided notice of its intent to redeem all outstanding shares of the 5.500% fixed-to-floating non-cumulative perpetual Series A Preferred Stock (the “Series A Preferred Stock”) on July 6, 2021. Prior to the settlement, the Company reclassified the Series A Preferred Stock from shareholders’ equity to other liabilities in the Consolidated Balance Sheets. On July 6, 2021, the Company redeemed all outstanding shares of the Series A Preferred Stock.
On June 11, 2021, the Company issued $300 million, or 300,000 shares, of 4.000% fixed-rate reset non-cumulative perpetual Series G Preferred Stock, par value of $25.00 per share with a liquidation preference of $1,000 per share (the “Series G Preferred Stock”). As a result of this issuance, the Company received net proceeds of $296 million after the underwriting discount and other expenses. The Series G Preferred Stock has no stated maturity and will not be subject to any sinking fund or other obligation of the Company. Dividends, if declared, will accrue and be payable quarterly, in arrears, at a rate equal to 4.000% from the date of issuance to, but excluding, October 6, 2026, and from and including October 6, 2026, for each dividend reset period, at a rate equal to the five-year U.S. treasury rate as of the most recent reset dividend determination date, plus 3.215% per annum. The Series G Preferred Stock is redeemable at the Company’s option, in whole or in part, on any dividend payment date on or after October 6, 2026 or, in whole but not in part, at any time within the 90 days following a regulatory capital treatment event at a redemption price equal to $1,000 per share, plus any declared and unpaid dividends. The Company may not redeem shares of the Series G Preferred Stock without obtaining the prior approval of the FRB if then required under applicable capital guidelines. Except in certain limited circumstances, the Series G Preferred Stock does not have any voting rights.
For further detail regarding the terms and conditions of the Company’s preferred stock, see Note 16 to the Company’s Consolidated Financial Statements in the 20192020 Form 10-K and Note 11 to the Company’s Quarterly Report on Form 10-Q for the period ended June 30, 2020.
10-K.
Dividends
The following table provides information related to dividends per share and in the aggregate, declared and paid, for each type of stock issued and outstanding: | | | | | | | | | | | | | | | | | | | | | | | | | | |
| | Three Months Ended June 30, 2021 | | Three Months Ended June 30, 2020 |
| (in millions, except per share data) | | Dividends Declared per Share | Dividends Declared | Dividends Paid | | Dividends Declared per Share | Dividends Declared | Dividends Paid |
| Common stock | | $0.39 | | $168 | | $168 | | | $0.39 | | $168 | | $168 | |
| Preferred stock | | | | | | | | |
| Series A | | $10.50 | | $2 | | $2 | | | $13.48 | | $3 | | $7 | |
| Series B | | 30.00 | | 9 | | 0 | | | 30.00 | | 9 | | 0 | |
| Series C | | 15.94 | | 5 | | 5 | | | 15.94 | | 5 | | 5 | |
| Series D | | 15.88 | | 4 | | 4 | | | 15.88 | | 5 | | 5 | |
| Series E | | 12.50 | | 6 | | 6 | | | 12.50 | | 6 | | 5 | |
| Series F | | 14.13 | | 6 | | 6 | | | 0 | | 0 | | 0 | |
| Total preferred stock | | | $32 | | $23 | | | | $28 | | $22 | |
| | | | | | | | |
| | | | | | | | |
| | | | | | | | |
|
| | | | | | | | | | | | | | | | | | | | |
| | | Three Months Ended September 30, 2020 | | Three Months Ended September 30, 2019 |
| (in millions, except per share data) | | Dividends Declared per Share | Dividends Declared | Dividends Paid | | Dividends Declared per Share | Dividends Declared | Dividends Paid |
| Common stock | |
| $0.39 |
|
| $168 |
|
| $168 |
| |
| $0.36 |
|
| $162 |
|
| $162 |
|
| Preferred stock | | | | | | | | |
| Series A | |
| $10.90 |
|
| $3 |
|
| $3 |
| |
| $27.50 |
|
| $7 |
|
| $0 |
|
| Series B | | 0 |
| 0 |
| 9 |
| | 0 |
| 0 |
| 9 |
|
| Series C | | 15.94 |
| 4 |
| 5 |
| | 15.94 |
| 5 |
| 4 |
|
| Series D | | 15.88 |
| 4 |
| 5 |
| | 15.88 |
| 5 |
| 5 |
|
| Series E | | 12.50 |
| 6 |
| 6 |
| | 0 |
| 0 |
| 0 |
|
| Series F | | 19.15 |
| 8 |
| 0 |
| | 0 |
| 0 |
| 0 |
|
| Total preferred stock | | |
| $25 |
|
| $28 |
| | |
| $17 |
|
| $18 |
|
Citizens Financial Group, Inc. | 78
|
| | | | | | | | | | | | | | | | | | | | |
| | | Nine Months Ended September 30, 2020 | | Nine Months Ended September 30, 2019 |
| (in millions, except per share and share data) | | Dividends Declared per Share | Dividends Declared | Dividends Paid | | Dividends Declared per Share | Dividends Declared | Dividends Paid |
| Common stock | |
| $1.17 |
|
| $504 |
|
| $504 |
| |
| $1.00 |
|
| $459 |
|
| $459 |
|
| Preferred stock | | | | | | | | |
| Series A | |
| $51.88 |
|
| $13 |
|
| $10 |
| |
| $55.00 |
|
| $14 |
|
| $7 |
|
| Series B | | 30.00 |
| 9 |
| 18 |
| | 30.00 |
| 9 |
| 20 |
|
| Series C | | 47.81 |
| 14 |
| 15 |
| | 47.81 |
| 14 |
| 13 |
|
| Series D | | 47.63 |
| 14 |
| 15 |
| | 43.57 |
| 13 |
| 8 |
|
| Series E | | 37.50 |
| 17 |
| 15 |
| | 0 |
| 0 |
| 0 |
|
| Series F | | 19.15 |
| 8 |
| 0 |
| | 0 |
| 0 |
| 0 |
|
| Total preferred stock | | |
| $75 |
|
| $73 |
| | |
| $50 |
|
| $48 |
|
| | | | | | | | | | | | | | | | | | | | | | | | | | |
| | Six Months Ended June 30, 2021 | | Six Months Ended June 30, 2020 |
| (in millions, except per share data) | | Dividends Declared per Share | Dividends Declared | Dividends Paid | | Dividends Declared per Share | Dividends Declared | Dividends Paid |
| Common stock | | $0.78 | | $335 | | $335 | | | $0.78 | | $336 | | $336 | |
| Preferred stock | | | | | | | | |
| Series A | | $20.99 | | $5 | | $5 | | | $40.98 | | $10 | | $7 | |
| Series B | | 30.00 | | 9 | | 9 | | | 30.00 | | 9 | | 9 | |
| Series C | | 31.88 | | 10 | | 10 | | | 31.88 | | 10 | | 10 | |
| Series D | | 31.75 | | 9 | | 9 | | | 31.75 | | 10 | | 10 | |
| Series E | | 25.00 | | 11 | | 11 | | | 25.00 | | 11 | | 9 | |
| Series F | | 28.25 | | 11 | | 11 | | | 0 | | 0 | | 0 | |
| Total preferred stock | | | $55 | | $55 | | | | $50 | | $45 | |
| | | | | | | | |
| | | | | | | | |
| | | | | | | | |
Treasury Stock
During the ninesix months ended SeptemberJune 30, 2020,2021, the Company repurchased $270$95 million, or 7,548,6552,244,924 shares, of its outstanding common stock, which are held in treasury stock. On March 16, 2020, the Company announced it would suspend all share repurchase activity through June 30, 2020. On April 17, 2020, the Company extended this suspension through December 31, 2020.
NOTE 1211 - COMMITMENTS AND CONTINGENCIES
A summary of outstanding off-balance sheet arrangements is presented below. For more information on these arrangements, see Note 18 in the Company’s 20192020 Form 10-K.
|
| | | | | | | |
| (in millions) | September 30, 2020 | | December 31, 2019 |
| Commitments to extend credit |
| $73,173 |
| |
| $72,743 |
|
| Letters of credit | 2,132 |
| | 2,190 |
|
| Risk participation agreements | 103 |
| | 37 |
|
| Loans sold with recourse | 48 |
| | 37 |
|
| Marketing rights | 29 |
| | 33 |
|
| Total |
| $75,485 |
| |
| $75,040 |
|
| | | | | | | | | | | |
| (in millions) | June 30, 2021 | | December 31, 2020 |
| Commitments to extend credit | $76,761 | | | $74,160 | |
| Letters of credit | 1,926 | | | 2,239 | |
| Risk participation agreements | 68 | | | 98 | |
| Loans sold with recourse | 64 | | | 54 | |
| Marketing rights | 26 | | | 29 | |
| Total | $78,845 | | | $76,580 | |
Commitments to Extend Credit
Commitments to extend credit are agreements to lend to customers in accordance with conditions contractually agreed upon in advance. Generally, the commitments have fixed expiration dates or termination clauses and may require payment of a fee. Since many of these commitments are expected to expire without being drawn upon, the contract amounts are not necessarily indicative of future cash requirements.
The Company’s commercial loan trading desk provides ongoing secondary market support and liquidity to its clients. Unsettled loan trades (e.g., loan purchase contracts) represent firm commitments to purchase or sell loans from / to a third party at an agreed-upon price. Principal amounts associated with unsettled commercial loan trades are off-balance sheet commitments until delivery of the loans has taken place. The principal balances of unsettled commercial loan trade purchases and sales were $69 million and $143 million, respectively, at September 30, 2020 and $183 million and $236 million, respectively, at December 31, 2019.
Letters of Credit
Letters of credit in the table above reflect commercial, standby financial and standby performance letters of credit. StandbyFinancial and performance standby letters of credit both financial and performance, are issued by the Company for the benefit of its customers. They are used as conditional guarantees of payment to a third party in the event the customer either fails to make specific payments (financial) or fails to complete a specific project (performance). The Company’s exposure to credit loss in the event of counterparty nonperformance in connection with the above instruments is represented by the contractual amount of those instruments, net of the value of collateral held.instruments. Generally, letters of credit are collateralized by cash, accounts receivable, inventory or investment securities. Credit risk associated with letters of credit is considered in determining the appropriate amounts of reservesallowances for unfunded commitments. Standby letters of credit and commercial letters of credit are issued for terms of up to ten years and one year, respectively.
Other Commitments
Citizens has additional off-balance sheet arrangements that are summarized below:
| |
• | •Marketing Rights - During 2003, Citizens entered into a 25-year agreement to acquire the naming and marketing rights of a baseball stadium in Pennsylvania. •25-year agreement to acquire the naming and marketing rights of a baseball stadium in Pennsylvania. |
Loans sold with recourse - Citizens is an originator and servicer of residential mortgages and routinely sells such mortgage loans in the secondary market and to GSEs. In the context of such sales, the Company makes certain representations and warranties regarding the characteristics of the underlying loans and, as a result, may be contractually required to repurchase such loans or indemnify certain parties against
Citizens Financial Group, Inc. | 79
losses for certain breaches of those representations and warranties. The Company also sells the government guaranteed portion of certain SBA loans to outside investors, for which it retains the servicing rights.
| |
• | Risk Participation Agreements - RPAs are guarantees issued by the Company to other parties for a fee, whereby the Company agrees to participate in the credit risk of a derivative customer of the other party. The current amount of credit exposure is spread out over 84 counterparties. RPAs generally have terms ranging from one year to five years; however, certain outstanding agreements have terms as long as nine years.•Risk Participation Agreements - RPAs are guarantees issued by the Company to other parties for a fee, whereby the Company agrees to participate in the credit risk of a derivative customer of the other party. The current amount of credit exposure is spread out over multiple counterparties. At June 30, 2021, the remaining terms on these RPAs ranged from less than one year to eight years. |
Contingencies
The Company operates in a legal and regulatory environment that exposes it to potentially significant risks. A certain amount of litigation ordinarily results from the nature of the Company’s banking and other businesses. The Company is a party to legal proceedings, including class actions. The Company is also the subject of investigations, reviews, subpoenas, and regulatory matters arising out of its normal business operations, which, in some instances, relate to concerns about fair lending, unfair and/or deceptive practices, mortgage-related issues, and mis-selling of certain products. In addition, the Company engages in discussions with relevant governmental and regulatory authorities on a regular and ongoing basis regarding various issues, and any issues discussed or identified may result in investigatory or other action being taken. Litigation and regulatory matters may result in settlements, damages, fines, penalties, public or private censure, increased costs, required remediation, restrictions on business activities, or other impacts on the Company.
In these disputes and proceedings, the Company contests liability and the amount of damages as appropriate. Given their complex nature, and based on the Company's experience, it may be years before some of these matters are finally resolved. Moreover, before liability can be reasonably estimated for a claim, numerous legal and factual issues may need to be examined, including through potentially lengthy discovery and determination of important
factual matters, and by addressing novel or unsettled legal issues relevant to the proceedings in question. The Company cannot predict with certainty if, how, or when such claims will be resolved or what the eventual settlement, fine, penalty or other relief, if any, may be, particularly for claims that are at an early stage in their development or where claimants seek substantial or indeterminate damages. The Company recognizes a provision for a claim when, in the opinion of management after seeking legal advice, it is probable that a liability exists and the amount of loss can be reasonably estimated. In many proceedings, however, it is not possible to determine whether any loss is probable or to estimate the amount of any loss.
Based on information currently available, the advice of legal counsel and other advisers, and established reserves, management believes that the aggregate liabilities, if any, potentially arising from these proceedings will not have a materially adverse effect on the Company’s unaudited interim Consolidated Financial Statements.
NOTE 1312 - FAIR VALUE MEASUREMENTS
Citizens measures or monitors many of its assets and liabilities on a fair value basis. Fair value is used on a recurring basis for assets and liabilities for which fair value is the required or elected measurement basis of accounting. Additionally, fair value is used on a nonrecurring basis to evaluate assets for impairment or for disclosure purposes. Nonrecurring fair value adjustments typically involve the application of lower of cost or market accounting or write-downs of individual assets. Citizens also applies the fair value measurement guidance to determine amounts reported for certain disclosures in this Note for assets and liabilities that are not required to be reported at fair value in the financial statements.
Citizens Financial Group, Inc. | 80
Fair Value Option
Citizens elected to account for residential mortgage LHFS and certain commercial and industrial, and commercial real estate LHFS at fair value. The following table presents the difference between the aggregate fair value and the aggregate unpaid principal balance of LHFS measured at fair value:
|
| | | | | | | | | | | | | | | | | | | |
| | September 30, 2020 | | December 31, 2019 |
| (in millions) | Aggregate Fair Value | Aggregate Unpaid Principal | Aggregate Fair Value Greater (Less) Aggregate Unpaid Principal | | Aggregate Fair Value | Aggregate Unpaid Principal | Aggregate Fair Value Greater (Less) Aggregate Unpaid Principal |
| Residential mortgage loans held for sale, at fair value |
| $3,425 |
|
| $3,256 |
|
| $169 |
| |
| $1,778 |
|
| $1,727 |
|
| $51 |
|
| Commercial and commercial real estate loans held for sale, at fair value | 162 |
| 172 |
| (10 | ) | | 168 |
| 175 |
| (7 | ) |
| | | | | | | | | | | | | | | | | | | | | | | |
| June 30, 2021 | | December 31, 2020 |
| (in millions) | Aggregate Fair Value | Aggregate Unpaid Principal | Aggregate Fair Value Greater (Less) Aggregate Unpaid Principal | | Aggregate Fair Value | Aggregate Unpaid Principal | Aggregate Fair Value Greater (Less) Aggregate Unpaid Principal |
| Residential mortgage loans held for sale, at fair value | $3,499 | | $3,388 | | $111 | | | $3,416 | | $3,260 | | $156 | |
| Commercial and industrial, and commercial real estate loans held for sale, at fair value | 117 | | 119 | | (2) | | | 148 | | 153 | | (5) | |
For more information on the election of the fair value option for these assets see Note 19 in the Company’s 20192020 Form 10-K.
The following table presents the changes in fair value for assets where the Company has elected the fair value option:
|
| | | | | | | | | | | | | | | | |
| | Three Months Ended September 30, | | Nine Months Ended September 30, | |
| (in millions) | 2020 |
| | 2019 |
| | 2020 |
| | 2019 |
| Affected Line Item in the Consolidated Statements of Operations |
| Residential mortgage loans held for sale, at fair value |
| $46 |
| |
| ($4 | ) | |
| $149 |
| |
| $5 |
| Mortgage banking fees |
| Commercial and commercial real estate loans held for sale, at fair value | 6 |
| | 0 |
| | (2 | ) | | 4 |
| Capital market fees |
Recurring Fair Value Measurements
Citizens utilizes a variety of valuation techniques to measure its assets and liabilities at fair value on a recurring basis. For more information on the valuation techniques utilized to measure recurring fair value see Note 19 in the Company’s 20192020 Form 10-K.
Asset-backed securitiesCollateralized Loan Obligations
The fair value of securities backed by education loansCLOs is estimated using observable inputs, including prices of similar securities that transacttrade in the marketplace and current market assumptions related to yield, as well as unobservable inputs, including expected conditional default rates and prepayment speed estimates. Therefore, the
market. The Company classifies these asset-backed securities in Level 3 of the fair value hierarchy given the use of unobservable inputs.
Forward commitments to sell to-be-announced mortgage securities
The fair value of TBAs is estimated using observable prices of similar loan pools that transact in the marketplace, as well as sector curves and benchmarking techniques. Therefore, the Company classifies TBAs in Level 2 of the fair value hierarchy givenusing these observable inputs.
Derivatives - Commodities Contracts
The fair value of commodity derivatives uses the mid-point of market observable quoted prices as an input into the fair value model. The model uses the observed market inputs.prices combined with other market observed inputs to derive the fair value of the instrument, which generally classifies it as Level 2 instrument. This type of derivative is exposed to counterparty risk; therefore, the Company adjusts the fair value of the contract by the credit valuation adjustment.
Citizens Financial Group, Inc. | 81
The following table presents assets and liabilities measured at fair value, including gross derivative assets and liabilities, on a recurring basis at SeptemberJune 30, 2020:2021:
| | | | | | | | | | | | | | |
| (in millions) | Total | Level 1 | Level 2 | Level 3 |
| Debt securities available for sale: | | | | |
| Mortgage-backed securities | $24,392 | | $0 | | $24,392 | | $0 | |
| | | | |
| Collateralized loan obligations | 177 | | 0 | | 177 | | 0 | |
| State and political subdivisions | 3 | | 0 | | 3 | | 0 | |
| U.S. Treasury and other | 11 | | 11 | | 0 | | 0 | |
| Total debt securities available for sale | 24,583 | | 11 | | 24,572 | | 0 | |
| Loans held for sale, at fair value: | | | | |
| Residential loans held for sale | 3,499 | | 0 | | 3,499 | | 0 | |
| Commercial loans held for sale | 117 | | 0 | | 117 | | 0 | |
| Total loans held for sale, at fair value | 3,616 | | 0 | | 3,616 | | 0 | |
| Mortgage servicing rights | 902 | | 0 | | 0 | | 902 | |
| Derivative assets: | | | | |
| Interest rate contracts | 1,134 | | 0 | | 1,134 | | 0 | |
| Foreign exchange contracts | 273 | | 0 | | 273 | | 0 | |
| Commodities contracts | 424 | | 0 | | 424 | | 0 | |
| TBA contracts | 5 | | 0 | | 5 | | 0 | |
| Other contracts | 89 | | 0 | | 0 | | 89 | |
| Total derivative assets | 1,925 | | 0 | | 1,836 | | 89 | |
| Equity securities, at fair value | 80 | | 80 | | 0 | | 0 | |
| Total assets | $31,106 | | $91 | | $30,024 | | $991 | |
| Derivative liabilities: | | | | |
| Interest rate contracts | $197 | | $0 | | $197 | | $0 | |
| Foreign exchange contracts | 209 | | 0 | | 209 | | 0 | |
| Commodities contracts | 427 | | 0 | | 427 | | 0 | |
| TBA contracts | 28 | | 0 | | 28 | | 0 | |
| | | | |
| Total derivative liabilities | 861 | | 0 | | 861 | | 0 | |
| Total liabilities | $861 | | $0 | | $861 | | $0 | |
|
| | | | | | | | | | | | |
| (in millions) | Total |
| Level 1 |
| Level 2 |
| Level 3 |
|
| Debt securities available for sale: | | | | |
| Mortgage-backed securities |
| $22,056 |
|
| $0 |
|
| $22,056 |
|
| $0 |
|
| Asset-backed securities | 813 |
| 0 |
| 0 |
| 813 |
|
| State and political subdivisions | 4 |
| 0 |
| 4 |
| 0 |
|
| U.S. Treasury and other | 11 |
| 11 |
| 0 |
| 0 |
|
| Total debt securities available for sale | 22,884 |
| 11 |
| 22,060 |
| 813 |
|
| Loans held for sale, at fair value: | | | | |
| Residential loans held for sale | 3,425 |
| 0 |
| 3,425 |
| 0 |
|
| Commercial loans held for sale | 162 |
| 0 |
| 162 |
| 0 |
|
| Total loans held for sale, at fair value | 3,587 |
| 0 |
| 3,587 |
| 0 |
|
| Mortgage servicing rights | 606 |
| 0 |
| 0 |
| 606 |
|
| Derivative assets: | | | | |
| Interest rate contracts | 1,765 |
| 0 |
| 1,765 |
| 0 |
|
| Foreign exchange contracts | 239 |
| 0 |
| 239 |
| 0 |
|
| TBA contracts | 7 |
| 0 |
| 7 |
| 0 |
|
| Other contracts | 275 |
| 0 |
| 66 |
| 209 |
|
| Total derivative assets | 2,286 |
| 0 |
| 2,077 |
| 209 |
|
| Equity securities, at fair value: | | | | |
| Money market mutual fund investments | 57 |
| 57 |
| 0 |
| 0 |
|
| Total equity securities, at fair value | 57 |
| 57 |
| 0 |
| 0 |
|
| Total assets |
| $29,420 |
|
| $68 |
|
| $27,724 |
|
| $1,628 |
|
| Derivative liabilities: | | | | |
| Interest rate contracts |
| $217 |
|
| $0 |
|
| $217 |
|
| $0 |
|
| Foreign exchange contracts | 189 |
| 0 |
| 189 |
| 0 |
|
| TBA contracts | 34 |
| 0 |
| 34 |
| 0 |
|
| Other contracts | 66 |
| 0 |
| 66 |
| 0 |
|
| Total derivative liabilities | 506 |
| 0 |
| 506 |
| 0 |
|
| Total liabilities |
| $506 |
|
| $0 |
|
| $506 |
|
| $0 |
|
Citizens Financial Group, Inc. | 82
The following table presents assets and liabilities measured at fair value, including gross derivative assets and liabilities, on a recurring basis at December 31, 2019:2020:
| | | | | | | | | | | | | | |
| (in millions) | Total | Level 1 | Level 2 | Level 3 |
| Debt securities available for sale: | | | | |
| Mortgage-backed securities | $22,928 | | $0 | | $22,928 | | $0 | |
| State and political subdivisions | 3 | | 0 | | 3 | | 0 | |
| U.S. Treasury and other | 11 | | 11 | | 0 | | 0 | |
| Total debt securities available for sale | 22,942 | | 11 | | 22,931 | | 0 | |
| Loans held for sale, at fair value: | | | | |
| Residential loans held for sale | 3,416 | | 0 | | 3,416 | | 0 | |
| Commercial loans held for sale | 148 | | 0 | | 148 | | 0 | |
| Total loans held for sale, at fair value | 3,564 | | 0 | | 3,564 | | 0 | |
| Mortgage servicing rights | 658 | | 0 | | 0 | | 658 | |
| Derivative assets: | | | | |
| Interest rate contracts | 1,566 | | 0 | | 1,566 | | 0 | |
| Foreign exchange contracts | 320 | | 0 | | 320 | | 0 | |
| Commodities contracts | 62 | | 0 | | 62 | | 0 | |
| TBA contracts | 8 | | 0 | | 8 | | 0 | |
| Other contracts | 197 | | 0 | | 0 | | 197 | |
| Total derivative assets | 2,153 | | 0 | | 1,956 | | 197 | |
| Equity securities, at fair value | 66 | | 66 | | 0 | | 0 | |
| Total assets | $29,383 | | $77 | | $28,451 | | $855 | |
| Derivative liabilities: | | | | |
| Interest rate contracts | $217 | | $0 | | $217 | | $0 | |
| Foreign exchange contracts | 291 | | 0 | | 291 | | 0 | |
| Commodities contracts | 61 | | 0 | | 61 | | 0 | |
| TBA contracts | 65 | | 0 | | 65 | | 0 | |
| | | | |
| Total derivative liabilities | 634 | | 0 | | 634 | | 0 | |
| Total liabilities | $634 | | $0 | | $634 | | $0 | |
|
| | | | | | | | | | | | |
| (in millions) | Total |
| Level 1 |
| Level 2 |
| Level 3 |
|
| Debt securities available for sale: | | | | |
| Mortgage-backed securities |
| $20,537 |
|
| $0 |
|
| $20,537 |
|
| $0 |
|
| State and political subdivisions | 5 |
| 0 |
| 5 |
| 0 |
|
| U.S. Treasury and other | 71 |
| 71 |
| 0 |
| 0 |
|
| Total debt securities available for sale | 20,613 |
| 71 |
| 20,542 |
| 0 |
|
| Loans held for sale, at fair value: | | | | |
| Residential loans held for sale | 1,778 |
| 0 |
| 1,778 |
| 0 |
|
| Commercial loans held for sale | 168 |
| 0 |
| 168 |
| 0 |
|
| Total loans held for sale, at fair value | 1,946 |
| 0 |
| 1,946 |
| 0 |
|
| Mortgage servicing rights | 642 |
| 0 |
| 0 |
| 642 |
|
| Derivative assets: | | | | |
| Interest rate contracts | 773 |
| 0 |
| 773 |
| 0 |
|
| Foreign exchange contracts | 174 |
| 0 |
| 174 |
| 0 |
|
| Other contracts | 37 |
| 0 |
| 18 |
| 19 |
|
| Total derivative assets | 984 |
| 0 |
| 965 |
| 19 |
|
| Equity securities, at fair value: | | | | |
| Money market mutual fund investments | 47 |
| 47 |
| 0 |
| 0 |
|
| Total equity securities, at fair value | 47 |
| 47 |
| 0 |
| 0 |
|
| Total assets |
| $24,232 |
|
| $118 |
|
| $23,453 |
|
| $661 |
|
| Derivative liabilities: | | | | |
| Interest rate contracts |
| $133 |
|
| $0 |
|
| $133 |
|
| $0 |
|
| Foreign exchange contracts | 166 |
| 0 |
| 166 |
| 0 |
|
| Other contracts | 23 |
| 0 |
| 23 |
| 0 |
|
| Total derivative liabilities | 322 |
| 0 |
| 322 |
| 0 |
|
| Total liabilities |
| $322 |
|
| $0 |
|
| $322 |
|
| $0 |
|
Citizens Financial Group, Inc. | 83
The following tables present a roll forward of the balance sheet amounts for assets measured at fair value on a recurring basis and classified as Level 3:
| | | | | | | | | | | | | | | | | | | |
| Three Months Ended June 30, 2021 | | Six Months Ended June 30, 2021 |
| (in millions) | Mortgage Servicing Rights | | Other Derivative Contracts | | Mortgage Servicing Rights | | Other Derivative Contracts |
| Beginning balance | $893 | | | $38 | | | $658 | | | $197 | |
| | | | | | | |
| Issuances | 122 | | | 81 | | | 209 | | | 243 | |
Settlements (2) | (47) | | | (97) | | | (105) | | | (180) | |
Changes in fair value during the period recognized in earnings (3) | (66) | | | 67 | | | 140 | | | (171) | |
| Ending balance | $902 | | | $89 | | | $902 | | | $89 | |
|
| | | | | | | | | | | | | | | | | | | |
| | Three Months Ended September 30, 2020 | | Nine Months Ended September 30, 2020 |
| (in millions) | Mortgage Servicing Rights | Asset-Backed Securities | Other Derivative Contracts | | Mortgage Servicing Rights | Asset-Backed Securities | Other Derivative Contracts |
| Beginning balance |
| $568 |
|
| $0 |
|
| $173 |
| |
| $642 |
|
| $0 |
|
| $19 |
|
| Transfers upon election of fair value method | 0 |
| 0 |
| 0 |
| | 190 |
| 0 |
| 0 |
|
| Beginning balance, adjusted | 568 |
| 0 |
| 173 |
| | 832 |
| 0 |
| 19 |
|
| Purchases | 0 |
| 813 |
| 0 |
| | 0 |
| 813 |
| 0 |
|
| Issuances | 85 |
| 0 |
| 283 |
| | 238 |
| 0 |
| 688 |
|
Settlements (1) | (55 | ) | 0 |
| (372 | ) | | (141 | ) | 0 |
| (792 | ) |
Changes in fair value during the period recognized in earnings (2) | 8 |
| 0 |
| 125 |
| | (323 | ) | 0 |
| 294 |
|
| Ending balance |
| $606 |
|
| $813 |
|
| $209 |
| |
| $606 |
|
| $813 |
|
| $209 |
|
| | | | | | | | | | | | | | | | | |
| Three Months Ended June 30, 2020 | | Six Months Ended June 30, 2020 |
| (in millions) | Mortgage Servicing Rights | Other Derivative Contracts | | Mortgage Servicing Rights | Other Derivative Contracts |
| Beginning balance | $577 | | $143 | | | $642 | | $19 | |
Transfers upon election of fair value method (1) | 0 | | 0 | | | 190 | | 0 | |
| Beginning balance, adjusted | 577 | | 143 | | | 832 | | 19 | |
| | | | | |
| Issuances | 86 | | 234 | | | 153 | | 405 | |
Settlements (2) | (46) | | (344) | | | (86) | | (420) | |
Changes in fair value during the period recognized in earnings (3) | (49) | | 140 | | | (331) | | 169 | |
| Ending balance | $568 | | $173 | | | $568 | | $173 | |
|
| | | | | | | | | | | | | |
| | Three Months Ended September 30, 2019 | | Nine Months Ended September 30, 2019 |
| (in millions) | Mortgage Servicing Rights | Other Derivative Contracts | | Mortgage Servicing Rights | Other Derivative Contracts |
| Beginning balance |
| $531 |
|
| $25 |
| |
| $600 |
|
| $0 |
|
| Issuances | 78 |
| 61 |
| | 170 |
| 104 |
|
Settlements (1) | (31 | ) | (64 | ) | | (88 | ) | (107 | ) |
Changes in fair value during the period recognized in earnings (2) | (68 | ) | 4 |
| | (172 | ) | 11 |
|
Transfers from Level 2 to Level 3 (3) | 0 |
| 0 |
| | 0 |
| 18 |
|
| Ending balance |
| $510 |
|
| $26 |
| |
| $510 |
|
| $26 |
|
(1)(2) Represents changes in value of the MSRs due to i) passage of time including the impact from both regularly scheduled loan principal payments and partial
paydowns, and ii) loans that paid off during the period.
(2)(3) Represents changes in value primarily driven by market conditions. These changes are recorded in mortgage banking fees in the Consolidated Statements of Operations.
(3) Reflects changes in the significance of unobservable inputs on derivative contracts associated with mortgage origination activities.
The following table presents quantitative information about the Company’s Level 3 assets, including the range and weighted-average of the significant unobservable inputs used to fair value these assets, as well as valuation techniques used.
|
| | | | | | | | | | | |
| | As of SeptemberJune 30, 20202021 |
| | Valuation Technique | Unobservable Input | Range (Weighted Average) |
| Mortgage servicing rights | | Discounted Cash Flow | Constant prepayment rate | 10.87-37.32%10.56-29.54% CPR (19.4%(11.9% CPR) |
| Option adjusted spread | 350-1,060(1490)-1,060 bps (608(581 bps) |
Asset-Backed Securities | Discounted Cash Flow | Conditional prepayment rate | 8.00% |
Constant default rate | 1.85% |
| Other derivative contracts | | Internal Model | Pull through rate | 11.72-100.00% (82.45%10.38-99.90% (81.66%) |
| MSR value | (26.73)-124.27(0.21)-154.76 bps (81.38(99.01 bps) |
Nonrecurring Fair Value Measurements
Fair value is also used on a nonrecurring basis to evaluate collateral-dependent loanscertain assets for impairment or for disclosure purposes. For more information on the valuation techniques utilized to measure nonrecurring fair value see Note 19 in the Company’s 20192020 Form 10-K.
The following table presents losses on assets measured at fair value on a nonrecurring basis and recorded in earnings:
| | | | | | | | | | | | | | | | | | | | | | | |
| Three Months Ended June 30, | | Six Months Ended June 30, |
| (in millions) | 2021 | | 2020 | | 2021 | | 2020 |
| Collateral-dependent loans | $0 | | | ($22) | | | ($19) | | | ($44) | |
|
| | | | | | | | | | | | | | | |
| | Three Months Ended September 30, | | Nine Months Ended September 30, |
| (in millions) | 2020 |
| | 2019 |
| | 2020 |
| | 2019 |
|
| Collateral-dependent loans |
| ($21 | ) | |
| ($8 | ) | |
| ($65 | ) | |
| ($36 | ) |
Citizens Financial Group, Inc. | 84
The following table presents assets measured at fair value on a nonrecurring basis:
|
| | | | | | | | | | | | | | | | | | | | | | | | | |
| | September 30, 2020 | | December 31, 2019 |
| (in millions) | Total |
| Level 1 |
| Level 2 |
| Level 3 |
| | Total |
| Level 1 |
| Level 2 |
| Level 3 |
|
| Collateral-dependent loans |
| $633 |
|
| $0 |
|
| $633 |
|
| $0 |
| |
| $312 |
|
| $0 |
|
| $312 |
|
| $0 |
|
| | | | | | | | | | | | | | | | | | | | | | | | | | | | | |
| June 30, 2021 | | December 31, 2020 |
| (in millions) | Total | Level 1 | Level 2 | Level 3 | | Total | Level 1 | Level 2 | Level 3 |
| Collateral-dependent loans | $620 | | $0 | | $620 | | $0 | | | $758 | | $0 | | $758 | | $0 | |
The following table presentstables present the estimated fair value for financial instruments not recorded at fair value in the unaudited interim Consolidated Financial Statements. The carrying amounts are recorded in the Consolidated Balance Sheets under the indicated captions:
| | | | | | | | | | | | | | | | | | | | | | | | | | | | | | | | | | | |
| June 30, 2021 |
| Total | | Level 1 | | Level 2 | | Level 3 |
| (in millions) | Carrying Value | Estimated Fair Value | | Carrying Value | Estimated Fair Value | | Carrying Value | Estimated Fair Value | | Carrying Value | Estimated Fair Value |
| Financial assets: | | | | | | | | | | | |
| Debt securities held to maturity | $2,711 | | $2,790 | | | $0 | | $0 | | | $1,887 | | $1,964 | | | $824 | | $826 | |
| Other loans held for sale | 82 | | 82 | | | 0 | | 0 | | | 0 | | 0 | | | 82 | | 82 | |
| Loans and leases | 122,581 | | 123,022 | | | 0 | | 0 | | | 620 | | 620 | | | 121,961 | | 122,402 | |
| Other assets | 602 | | 602 | | | 0 | | 0 | | | 594 | | 594 | | | 8 | | 8 | |
| Financial liabilities: | | | | | | | | | | | |
| Deposits | 150,636 | | 150,658 | | | 0 | | 0 | | | 150,636 | | 150,658 | | | 0 | | 0 | |
| Short-term borrowed funds | 62 | | 62 | | | 0 | | 0 | | | 62 | | 62 | | | 0 | | 0 | |
| Long-term borrowed funds | 6,957 | | 7,307 | | | 0 | | 0 | | | 6,957 | | 7,307 | | | 0 | | 0 | |
| | | | | | | | | | | | | | | | | | | | | | | | | | | | | | | | | | | |
| December 31, 2020 |
| Total | | Level 1 | | Level 2 | | Level 3 |
| (in millions) | Carrying Value | Estimated Fair Value | | Carrying Value | Estimated Fair Value | | Carrying Value | Estimated Fair Value | | Carrying Value | Estimated Fair Value |
| Financial assets: | | | | | | | | | | | |
| Debt securities held to maturity | $3,235 | | $3,357 | | | $0 | | $0 | | | $2,342 | | $2,464 | | | $893 | | $893 | |
| Other loans held for sale | 439 | | 439 | | | 0 | | 0 | | | 0 | | 0 | | | 439 | | 439 | |
| Loans and leases | 123,090 | | 123,678 | | | 0 | | 0 | | | 758 | | 758 | | | 122,332 | | 122,920 | |
| Other assets | 604 | | 604 | | | 0 | | 0 | | | 596 | | 596 | | | 8 | | 8 | |
| Financial liabilities: | | | | | | | | | | | |
| Deposits | 147,164 | | 147,223 | | | 0 | | 0 | | | 147,164 | | 147,223 | | | 0 | | 0 | |
| Short-term borrowed funds | 243 | | 243 | | | 0 | | 0 | | | 243 | | 243 | | | 0 | | 0 | |
| Long-term borrowed funds | 8,346 | | 8,850 | | | 0 | | 0 | | | 8,346 | | 8,850 | | | 0 | | 0 | |
Citizens Financial Group, Inc. | 85
|
| | | | | | | | | | | | | | | | | | | | | | | | | | | |
| | September 30, 2020 |
| | Total | | Level 1 | | Level 2 | | Level 3 |
| (in millions) | Carrying Value | Estimated Fair Value | | Carrying Value | Estimated Fair Value | | Carrying Value | Estimated Fair Value | | Carrying Value | Estimated Fair Value |
| Financial assets: | | | | | | | | | | | |
| Securities held to maturity |
| $2,578 |
|
| $2,709 |
| |
| $0 |
|
| $0 |
| |
| $2,578 |
|
| $2,709 |
| |
| $0 |
|
| $0 |
|
| Equity securities, at cost | 605 |
| 605 |
| | 0 |
| 0 |
| | 597 |
| 597 |
| | 8 |
| 8 |
|
| Other loans held for sale | 127 |
| 127 |
| | 0 |
| 0 |
| | 0 |
| 0 |
| | 127 |
| 127 |
|
| Loans and leases | 124,071 |
| 125,498 |
| | 0 |
| 0 |
| | 633 |
| 633 |
| | 123,438 |
| 124,865 |
|
| Financial liabilities: | | | | | | | | | | | |
| Deposits | 142,921 |
| 143,004 |
| | 0 |
| 0 |
| | 142,921 |
| 143,004 |
| | 0 |
| 0 |
|
| Short-term borrowed funds | 252 |
| 252 |
| | 0 |
| 0 |
| | 252 |
| 252 |
| | 0 |
| 0 |
|
| Long-term borrowed funds | 9,109 |
| 9,568 |
| | 0 |
| 0 |
| | 9,109 |
| 9,568 |
| | 0 |
| 0 |
|
|
| | | | | | | | | | | | | | | | | | | | | | | | | | | |
| | December 31, 2019 |
| | Total | | Level 1 | | Level 2 | | Level 3 |
| (in millions) | Carrying Value | Estimated Fair Value | | Carrying Value | Estimated Fair Value | | Carrying Value | Estimated Fair Value | | Carrying Value | Estimated Fair Value |
| Financial assets: | | | | | | | | | | | |
| Securities held to maturity |
| $3,202 |
|
| $3,242 |
| |
| $0 |
|
| $0 |
| |
| $3,202 |
|
| $3,242 |
| |
| $0 |
|
| $0 |
|
| Equity securities, at cost | 807 |
| 807 |
| | 0 |
| 0 |
| | 807 |
| 807 |
| | 0 |
| 0 |
|
| Other loans held for sale | 1,384 |
| 1,384 |
| | 0 |
| 0 |
| | 0 |
| 0 |
| | 1,384 |
| 1,384 |
|
| Loans and leases | 119,088 |
| 119,792 |
| | 0 |
| 0 |
| | 312 |
| 312 |
| | 118,776 |
| 119,480 |
|
| Financial liabilities: | | | | | | | | | | | |
| Deposits | 125,313 |
| 125,340 |
| | 0 |
| 0 |
| | 125,313 |
| 125,340 |
| | 0 |
| 0 |
|
| Short-term borrowed funds | 274 |
| 274 |
| | 0 |
| 0 |
| | 274 |
| 274 |
| | 0 |
| 0 |
|
| Long-term borrowed funds | 14,047 |
| 14,228 |
| | 0 |
| 0 |
| | 14,047 |
| 14,228 |
| | 0 |
| 0 |
|
NOTE 1413 - NONINTEREST INCOME
Revenues from Contracts with Customers
The following table presents the components of revenue from contracts with customers disaggregated by revenue stream and business operating segment:
| | | | | | | | | | | | | | | | | | | | | | | | | | | | | |
| Three Months Ended June 30, 2021 | | Three Months Ended June 30, 2020 |
| (in millions) | Consumer Banking | Commercial Banking | Other | Consolidated | | Consumer Banking | Commercial Banking | Other | Consolidated |
| Service charges and fees | $74 | | $26 | | $0 | | $100 | | | $59 | | $25 | | $0 | | $84 | |
| Card fees | 56 | | 8 | | 0 | | 64 | | | 42 | | 7 | | 0 | | 49 | |
| Capital markets fees | 0 | | 84 | | 0 | | 84 | | | 0 | | 48 | | 0 | | 48 | |
| Trust and investment services fees | 60 | | 0 | | 0 | | 60 | | | 45 | | 0 | | 0 | | 45 | |
| Other banking fees | 0 | | 2 | | 0 | | 2 | | | 0 | | 1 | | 0 | | 1 | |
| Total revenue from contracts with customers | $190 | | $120 | | $0 | | $310 | | | $146 | | $81 | | $0 | | $227 | |
Total revenue from other sources(1) | 93 | | 58 | | 24 | | 175 | | | 282 | | 63 | | 18 | | 363 | |
| Total noninterest income | $283 | | $178 | | $24 | | $485 | | | $428 | | $144 | | $18 | | $590 | |
|
| | | | | | | | | | | | | | | | | | | |
| | Three Months Ended September 30, 2020 | | Three Months Ended September 30, 2019 |
| (in millions) | Consumer Banking | Commercial Banking | Consolidated (1) | | Consumer Banking | Commercial Banking | Consolidated (1) |
| Service charges and fees |
| $71 |
|
| $25 |
|
| $96 |
| |
| $102 |
|
| $25 |
|
| $127 |
|
| Card fees | 49 |
| 7 |
| 56 |
| | 57 |
| 10 |
| 67 |
|
| Capital markets fees | 0 |
| 50 |
| 50 |
| | 0 |
| 38 |
| 38 |
|
| Trust and investment services fees | 53 |
| 0 |
| 53 |
| | 50 |
| 0 |
| 50 |
|
| Other banking fees | 0 |
| 3 |
| 3 |
| | 1 |
| 2 |
| 3 |
|
| Total revenue from contracts with customers |
| $173 |
|
| $85 |
|
| $258 |
| |
| $210 |
|
| $75 |
|
| $285 |
|
| | | | Nine Months Ended September 30, 2020 | | Nine Months Ended September 30, 2019 | | Six Months Ended June 30, 2021 | | Six Months Ended June 30, 2020 |
| (in millions) | Consumer Banking | Commercial Banking | Consolidated (1) | | Consumer Banking | Commercial Banking | Consolidated (1) | (in millions) | Consumer Banking | Commercial Banking | Other | Consolidated | | Consumer Banking | Commercial Banking | Other | Consolidated |
| Service charges and fees |
| $222 |
|
| $76 |
|
| $298 |
| |
| $298 |
|
| $77 |
|
| $375 |
| Service charges and fees | $148 | | $51 | | $0 | | $199 | | | $151 | | $51 | | $0 | | $202 | |
| Card fees | 136 |
| 24 |
| 160 |
| | 162 |
| 28 |
| 190 |
| Card fees | 103 | | 15 | | 0 | | 118 | | | 87 | | 17 | | 0 | | 104 | |
| Capital markets fees | 0 |
| 163 |
| 163 |
| | 0 |
| 140 |
| 140 |
| Capital markets fees | 0 | | 156 | | 0 | | 156 | | | 0 | | 113 | | 0 | | 113 | |
| Trust and investment services fees | 151 |
| 0 |
| 151 |
| | 150 |
| 0 |
| 150 |
| Trust and investment services fees | 118 | | 0 | | 0 | | 118 | | | 98 | | 0 | | 0 | | 98 | |
| Other banking fees | 0 |
| 7 |
| 7 |
| | 1 |
| 7 |
| 8 |
| Other banking fees | 0 | | 4 | | 0 | | 4 | | | 0 | | 4 | | 0 | | 4 | |
| Total revenue from contracts with customers |
| $509 |
|
| $270 |
|
| $779 |
| |
| $611 |
|
| $252 |
|
| $863 |
| Total revenue from contracts with customers | $369 | | $226 | | $0 | | $595 | | | $336 | | $185 | | $0 | | $521 | |
Total revenue from other sources(1) | | Total revenue from other sources(1) | 265 | | 122 | | 45 | | 432 | | | 449 | | 84 | | 33 | | 566 | |
| Total noninterest income | | Total noninterest income | $634 | | $348 | | $45 | | $1,027 | | | $785 | | $269 | | $33 | | $1,087 | |
(1) ThereRevenue from other sources includes bank-owned life insurance income of $16 million and $14 million for the three months ended June 30, 2021 and 2020, respectively, and $30 million and $28 million for the six months ended June 30, 2021 and 2020, respectively. Bank-owned life insurance income is no revenue from contracts with customers included in Other non-segmentother income in the consolidated statements of operations.
The Company recognized trailing commissions of $3$4 million and $4$3 million for the three months ended SeptemberJune 30, 2021 and 2020, and2019, respectively, and $10$8 million and $11$7 million for the ninesix months ended SeptemberJune 30, 20202021 and 2019,2020, respectively, related to services provided inongoing commissions from previous reporting periods. Fees from other investment services are recognized at a point in time upon completion of the service.sales.
Revenue from Other Sources
|
| | | | | | | | | | | | | | | |
| | Three Months Ended September 30, | | Nine Months Ended September 30, |
| (in millions) | 2020 |
| | 2019 |
| | 2020 |
| | 2019 |
|
| Bank-owned life insurance |
| $13 |
| |
| $14 |
| |
| $41 |
| |
| $41 |
|
NOTE 1514 - OTHER OPERATING EXPENSE
The following table presents the details of other operating expense:
| | | | | | | | | | | | | | | | | | | | | | | |
| Three Months Ended June 30, | | Six Months Ended June 30, |
| (in millions) | 2021 | | 2020 | | 2021 | | 2020 |
| Marketing | $31 | | | $27 | | | $50 | | | $51 | |
| Other | 62 | | | 84 | | | 134 | | | 171 | |
| Other operating expense | $93 | | | $111 | | | $184 | | | $222 | |
|
| | | | | | | | | | | | | | | |
| | Three Months Ended September 30, | | Nine Months Ended September 30, |
| (in millions) | 2020 |
| | 2019 |
| | 2020 |
| | 2019 |
|
| Promotional expense |
| $24 |
| |
| $31 |
| |
| $75 |
| |
| $86 |
|
| Other | 71 |
| | 96 |
| | 242 |
| | 269 |
|
| Other operating expense |
| $95 |
| |
| $127 |
| |
| $317 |
| |
| $355 |
|
Citizens Financial Group, Inc. | 86
NOTE 1615 - EARNINGS PER SHARE
|
| | | | | | | | | | | | | | | |
| | Three Months Ended September 30, | | Nine Months Ended September 30, |
| (in millions, except share and per share data) | 2020 |
| | 2019 |
| | 2020 |
| | 2019 |
|
| Numerator (basic and diluted): | | | | | | | |
| Net income |
| $314 |
| |
| $449 |
| |
| $601 |
| |
| $1,341 |
|
| Less: Preferred stock dividends | 25 |
| | 17 |
| | 75 |
| | 50 |
|
| Net income available to common stockholders |
| $289 |
| |
| $432 |
| |
| $526 |
| |
| $1,291 |
|
| Denominator: | | | | | | | |
| Weighted-average common shares outstanding - basic | 426,846,096 |
| | 445,703,987 |
| | 427,058,412 |
| | 454,802,186 |
|
| Dilutive common shares: share-based awards | 1,146,253 |
| | 1,430,608 |
| | 1,083,946 |
| | 1,416,569 |
|
| Weighted-average common shares outstanding - diluted | 427,992,349 |
| | 447,134,595 |
| | 428,142,358 |
| | 456,218,755 |
|
| Earnings per common share: | | | | | | | |
| Basic |
| $0.68 |
| |
| $0.97 |
| |
| $1.23 |
| |
| $2.84 |
|
Diluted (1) | 0.68 |
| | 0.97 |
| | 1.23 |
| | 2.83 |
|
| | | | | | | | | | | | | | | | | | | | | | | |
| Three Months Ended June 30, | | Six Months Ended June 30, |
| (in millions, except share and per share data) | 2021 | | 2020 | | 2021 | | 2020 |
| Numerator (basic and diluted): | | | | | | | |
| Net income | $648 | | | $253 | | | $1,259 | | | $287 | |
| Less: Preferred stock dividends | 32 | | | 28 | | | 55 | | | 50 | |
| Net income available to common stockholders | $616 | | | $225 | | | $1,204 | | | $237 | |
| Denominator: | | | | | | | |
| Weighted-average common shares outstanding - basic | 425,948,706 | | | 426,613,053 | | | 425,951,197 | | | 427,165,737 | |
| Dilutive common shares: share-based awards | 1,612,866 | | | 953,867 | | | 1,717,045 | | | 1,126,843 | |
| Weighted-average common shares outstanding - diluted | 427,561,572 | | | 427,566,920 | | | 427,668,242 | | | 428,292,580 | |
| Earnings per common share: | | | | | | | |
| Basic | $1.45 | | | $0.53 | | | $2.83 | | | $0.56 | |
Diluted (1) | 1.44 | | | 0.53 | | | 2.81 | | | 0.55 | |
(1) Potential dilutive common shares are excluded from the computation of diluted EPS in the periods where the effect would be antidilutive. Excluded from the computation of diluted EPS were weighted average antidilutive shares totaling 1,193,66876,984 and 7721,579,361 for the three months ended SeptemberJune 30, 20202021 and 2019,2020, respectively, and 1,249,78543,877 and 359,9521,211,751 for the ninesix months ended SeptemberJune 30, 20202021 and 2019,2020, respectively.
NOTE 1716 - BUSINESS OPERATING SEGMENTS
Citizens is managed by its Chief Executive Officer on a segment basis. The Company’s 2 business operating segments are Consumer Banking and Commercial Banking. The business segments are determined based on the products and services provided, or the type of customer served. Each segment has a segment head who reports directly to the Chief Executive Officer. The Chief Executive Officer has final authority over resource allocation decisions and performance assessment. The business segments reflect this management structure and the manner in which financial information is currently evaluated by the Chief Executive Officer. For more information on the Company’s business operating segments, as well as Other non-segment operations, see Note 25 in the Company’s 20192020 Form 10-K.
| | | | | | | | | | | | | | | | | | | | | | | |
| As of and for the Three Months Ended June 30, 2021 |
| (in millions) | Consumer Banking | | Commercial Banking | | Other | | Consolidated |
| Net interest income | $897 | | | $419 | | | ($192) | | | $1,124 | |
| Noninterest income | 283 | | | 178 | | | 24 | | | 485 | |
| Total revenue | 1,180 | | | 597 | | | (168) | | | 1,609 | |
| Noninterest expense | 751 | | | 226 | | | 14 | | | 991 | |
| Profit (loss) before provision for credit losses | 429 | | | 371 | | | (182) | | | 618 | |
| Provision for credit losses | 45 | | | 34 | | | (292) | | | (213) | |
| Income (loss) before income tax expense (benefit) | 384 | | | 337 | | | 110 | | | 831 | |
| Income tax expense (benefit) | 98 | | | 72 | | | 13 | | | 183 | |
| Net income (loss) | $286 | | | $265 | | | $97 | | | $648 | |
| Total average assets | $75,600 | | | $57,527 | | | $51,329 | | | $184,456 | |
| | | | | | | | | | | | | | | | | | | | | | | |
| As of and for the Three Months Ended June 30, 2020 |
| (in millions) | Consumer Banking | | Commercial Banking | | Other | | Consolidated |
| Net interest income | $814 | | | $419 | | | ($73) | | | $1,160 | |
| Noninterest income | 428 | | | 144 | | | 18 | | | 590 | |
| Total revenue | 1,242 | | | 563 | | | (55) | | | 1,750 | |
| Noninterest expense | 735 | | | 213 | | | 31 | | | 979 | |
| Profit (loss) before provision for credit losses | 507 | | | 350 | | | (86) | | | 771 | |
| Provision for credit losses | 80 | | | 70 | | | 314 | | | 464 | |
| Income (loss) before income tax expense (benefit) | 427 | | | 280 | | | (400) | | | 307 | |
| Income tax expense (benefit) | 107 | | | 59 | | | (112) | | | 54 | |
| Net income (loss) | $320 | | | $221 | | | ($288) | | | $253 | |
| Total average assets | $71,634 | | | $65,280 | | | $42,879 | | | $179,793 | |
Citizens Financial Group, Inc. | 87
| | | | As of and for the Three Months Ended September 30, 2020 | | As of and for the Six Months Ended June 30, 2021 |
| (in millions) | Consumer Banking | | Commercial Banking | | Other | | Consolidated | (in millions) | Consumer Banking | | Commercial Banking | | Other | | Consolidated |
| Net interest income |
| $845 |
| |
| $421 |
| |
| ($129 | ) | |
| $1,137 |
| Net interest income | $1,760 | | | $840 | | | ($359) | | | $2,241 | |
| Noninterest income | 495 |
| | 144 |
| | 15 |
| | 654 |
| Noninterest income | 634 | | | 348 | | | 45 | | | 1,027 | |
| Total revenue | 1,340 |
| | 565 |
| | (114 | ) | | 1,791 |
| Total revenue | 2,394 | | | 1,188 | | | (314) | | | 3,268 | |
| Noninterest expense | 742 |
| | 210 |
| | 36 |
| | 988 |
| Noninterest expense | 1,501 | | | 453 | | | 55 | | | 2,009 | |
| Profit (loss) before provision for credit losses | 598 |
| | 355 |
| | (150 | ) | | 803 |
| Profit (loss) before provision for credit losses | 893 | | | 735 | | | (369) | | | 1,259 | |
| Provision for credit losses | 55 |
| | 161 |
| | 212 |
| | 428 |
| Provision for credit losses | 104 | | | 135 | | | (592) | | | (353) | |
| Income (loss) before income tax expense (benefit) | 543 |
| | 194 |
| | (362 | ) | | 375 |
| Income (loss) before income tax expense (benefit) | 789 | | | 600 | | | 223 | | | 1,612 | |
| Income tax expense (benefit) | 136 |
| | 41 |
| | (116 | ) | | 61 |
| Income tax expense (benefit) | 201 | | | 124 | | | 28 | | | 353 | |
| Net income (loss) |
| $407 |
| |
| $153 |
| |
| ($246 | ) | |
| $314 |
| Net income (loss) | $588 | | | $476 | | | $195 | | | $1,259 | |
| Total average assets |
| $73,605 |
| |
| $60,889 |
| |
| $43,181 |
| |
| $177,675 |
| Total average assets | $75,443 | | | $57,632 | | | $50,443 | | | $183,518 | |
|
| | | | | | | | | | | | | | | |
| | As of and for the Three Months Ended September 30, 2019 |
| (in millions) | Consumer Banking | | Commercial Banking | | Other | | Consolidated |
| Net interest income |
| $799 |
| |
| $360 |
| |
| ($14 | ) | |
| $1,145 |
|
| Noninterest income | 336 |
| | 133 |
| | 24 |
| | 493 |
|
| Total revenue | 1,135 |
| | 493 |
| | 10 |
| | 1,638 |
|
| Noninterest expense | 718 |
| | 213 |
| | 42 |
| | 973 |
|
| Profit (loss) before provision for credit losses | 417 |
| | 280 |
| | (32 | ) | | 665 |
|
| Provision for credit losses | 83 |
| | 27 |
| | (9 | ) | | 101 |
|
| Income (loss) before income tax expense (benefit) | 334 |
| | 253 |
| | (23 | ) | | 564 |
|
| Income tax expense (benefit) | 83 |
| | 57 |
| | (25 | ) | | 115 |
|
| Net income |
| $251 |
| |
| $196 |
| |
| $2 |
| |
| $449 |
|
| Total average assets |
| $66,365 |
| |
| $55,614 |
| |
| $40,131 |
| |
| $162,110 |
|
|
| | | | | | | | | | | | | | | |
| | As of and for the Nine Months Ended September 30, 2020 |
| (in millions) | Consumer Banking | | Commercial Banking | | Other | | Consolidated |
| Net interest income |
| $2,452 |
| |
| $1,205 |
| |
| ($200 | ) | |
| $3,457 |
|
| Noninterest income | 1,280 |
| | 413 |
| | 48 |
| | 1,741 |
|
| Total revenue | 3,732 |
| | 1,618 |
| | (152 | ) | | 5,198 |
|
| Noninterest expense | 2,215 |
| | 644 |
| | 120 |
| | 2,979 |
|
| Profit (loss) before provision for credit losses | 1,517 |
| | 974 |
| | (272 | ) | | 2,219 |
|
| Provision for credit losses | 232 |
| | 274 |
| | 986 |
| | 1,492 |
|
| Income (loss) before income tax expense (benefit) | 1,285 |
| | 700 |
| | (1,258 | ) | | 727 |
|
| Income tax expense (benefit) | 322 |
| | 147 |
| | (343 | ) | | 126 |
|
| Net income (loss) |
| $963 |
| |
| $553 |
| |
| ($915 | ) | |
| $601 |
|
| Total average assets |
| $71,227 |
| |
| $61,722 |
| |
| $41,943 |
| |
| $174,892 |
|
|
| | | | | | | | | | | | | | | |
| | As of and for the Nine Months Ended September 30, 2019 |
| (in millions) | Consumer Banking | | Commercial Banking | | Other | | Consolidated |
| Net interest income |
| $2,386 |
| |
| $1,103 |
| |
| ($18 | ) | |
| $3,471 |
|
| Noninterest income | 860 |
| | 432 |
| | 91 |
| | 1,383 |
|
| Total revenue | 3,246 |
| | 1,535 |
| | 73 |
| | 4,854 |
|
| Noninterest expense | 2,133 |
| | 639 |
| | 89 |
| | 2,861 |
|
| Profit (loss) before provision for credit losses | 1,113 |
| | 896 |
| | (16 | ) | | 1,993 |
|
| Provision for credit losses | 228 |
| | 73 |
| | (18 | ) | | 283 |
|
| Income before income tax expense (benefit) | 885 |
| | 823 |
| | 2 |
| | 1,710 |
|
| Income tax expense (benefit) | 219 |
| | 184 |
| | (34 | ) | | 369 |
|
| Net income |
| $666 |
| |
| $639 |
| |
| $36 |
| |
| $1,341 |
|
| Total average assets |
| $65,624 |
| |
| $55,793 |
| |
| $39,927 |
| |
| $161,344 |
|
| | | | | | | | | | | | | | | | | | | | | | | |
| As of and for the Six Months Ended June 30, 2020 |
| (in millions) | Consumer Banking | | Commercial Banking | | Other | | Consolidated |
| Net interest income | $1,607 | | | $784 | | | ($71) | | | $2,320 | |
| Noninterest income | 785 | | | 269 | | | 33 | | | 1,087 | |
| Total revenue | 2,392 | | | 1,053 | | | (38) | | | 3,407 | |
| Noninterest expense | 1,473 | | | 434 | | | 84 | | | 1,991 | |
| Profit (loss) before provision for credit losses | 919 | | | 619 | | | (122) | | | 1,416 | |
| Provision for credit losses | 177 | | | 113 | | | 774 | | | 1,064 | |
| Income (loss) before income tax expense (benefit) | 742 | | | 506 | | | (896) | | | 352 | |
| Income tax expense (benefit) | 186 | | | 106 | | | (227) | | | 65 | |
| Net income (loss) | $556 | | | $400 | | | ($669) | | | $287 | |
| Total average assets | $70,024 | | | $62,142 | | | $41,319 | | | $173,485 | |
There have been no significant changes in the management accounting practices utilized by the Company regarding the basis of presentation for segment results as discussed in Note 25 in the Company’s 20192020 Form 10-K.
Citizens Financial Group, Inc. | 88
CITIZENS FINANCIAL GROUP, INC.
NOTES TO CONSOLIDATED FINANCIAL STATEMENTS (UNAUDITED)
NOTE 17 - SUBSEQUENT EVENTS
On July 28, 2021 Citizens entered into the Investors acquisition agreement under which Citizens will acquire Investors for approximately $3.5 billion, with the transaction value based on Citizen’s closing price of $44.32 per common share as of July 27, 2021. Upon closing of the transaction, Investors’ stockholders will receive a combination of stock and cash, specifically 0.297 of a share of the Company’s common stock and $1.46 in cash for each share of Investors common stock they own. The Investors acquisition agreement provides that at the closing Investors will merge with and into Citizens, with Citizens surviving, and its subsidiary bank, Investors Bank, will merge with and into CBNA, with CBNA surviving. Following completion of the transaction, Investors’ stockholders are expected to own approximately 14% of the combined company’s outstanding shares.
In a press release dated July 28, 2021, Investors preliminarily reported total assets of $26.8 billion, including $21.1 billion of loans receivable, net, and $19.4 billion of deposits as of June 30, 2021. The Investors acquisition agreement has been unanimously approved by the boards of directors of each company and is expected to close in the first or second quarter of 2022, subject to approval by the shareholders of Investors, regulatory approvals, and other customary closing conditions.
ITEM 3. QUANTITATIVE AND QUALITATIVE DISCLOSURES ABOUT MARKET RISK
The information presented in the “Market Risk” section of Part I, Item 2 is incorporated herein by reference.
ITEM 4. CONTROLS AND PROCEDURES
The Company maintains a set of disclosure controls and procedures designed to ensure that information required to be disclosed by the Company in reports that it files or submits under the Exchange Act, is recorded, processed, summarized and reported within the time periods specified in SEC rules and forms. The design of any disclosure controls and procedures is based in part upon certain assumptions about the likelihood of future events, and there can be no assurance that any design will succeed in achieving its stated goals under all potential future conditions. Any controls and procedures, no matter how well designed and operated, can provide only reasonable,
not absolute, assurance of achieving the desired control objectives. In accordance with Rule 13a-15(b) of the Exchange Act, as of the end of the period covered by this quarterly report, an evaluation was carried out under the supervision and with the participation of the Company’s management, including its Chief Executive Officer and Chief Financial Officer, of the effectiveness of its disclosure controls and procedures. Based on that evaluation, the Company’s Chief Executive Officer and Chief Financial Officer concluded that the Company’s disclosure controls and procedures, as of the end of the period covered by this quarterly report, were effective to provide reasonable assurance that information required to be disclosed by the Company in reports that it files or submits under the Exchange Act is recorded, processed, summarized and reported within the time periods specified in SEC rules and forms and is accumulated and communicated to the Company’s management, including the Chief Executive Officer and Chief Financial Officer, as appropriate to allow timely decisions regarding required disclosure.
PART II. OTHER INFORMATION
ITEM 1. LEGAL PROCEEDINGS
The information required by this item is presented in Note 12,11, which is incorporated herein by reference.
ITEM 1A. RISK FACTORS
In addition to the risks below and other information set forth in this Report, you should consider the risks described under the caption “Risk Factors” in the Company’s 20192020 Form 10-K.
The risk factors set forth in our 2020 Form 10-K and Quarterly Report on Form 10-Q forare updated by the period ended June 30, 2020.following risks:
Failure to complete our proposed acquisition of Investors or proposed acquisition of HSBC branches could negatively impact our business, financial results, and stock price.
Citizens Financial Group, Inc. | 89
If for any reason the acquisition of Investors or the proposed acquisition of HSBC branches are not completed, our ongoing business may be adversely impacted and we will be subject to a number of risks, including: the financial markets may react negatively, resulting in negative impacts on our stock price and other adverse impacts; we may experience negative reactions from our customers, vendors, and employees; we will have incurred substantial expenses and will be required to pay certain costs relating to the acquisitions, whether or not the acquisitions are completed, such as legal, accounting, investment banking, and other professional and administrative fees; and matters relating to the acquisitions may require substantial commitments of time and resources by our management, which could otherwise have been devoted to other opportunities that may have benefited us.
Our ability to complete the proposed acquisition of Investors and/or the acquisition of HSBC branches is subject to the receipt of approval from various regulatory agencies.
Prior to the transactions contemplated in the Investors acquisition agreement being consummated, the Company and Investors must obtain certain regulatory approvals, including approvals of the Board of Governors of the Federal Reserve System and the Office of the Comptroller of the Currency. Similarly, prior to the consummation of the HSBC transaction, the Company and HSBC must obtain certain regulatory approvals. The terms and conditions of the approvals that are granted may impose conditions, limitations, obligations or costs, or place restrictions on the conduct of the Company or its business following the acquisitions, or require changes to the terms of the transactions completed by the Investors acquisition agreement and HSBC branch acquisition agreement. There can be no assurance that the regulations will not impose any such conditions, obligations or restrictions, and that such conditions, limitations, obligations or restrictions will not have the effect of delaying or preventing completion of any of the transactions contemplated by the Investors acquisition agreement or HSBC branch acquisition agreement, as applicable, imposing additional material costs on or materially limiting the revenues of the Company following the acquisitions or otherwise reduce the anticipated benefits of the acquisitions if the acquisitions were consummated successfully within the expected timeframe, any of which might have an adverse effect on the Company following the acquisitions.
We face risks and uncertainties related to our proposed acquisitions of Investors and HSBC branches.
Uncertainty about the effect of the proposed acquisitions on personnel and customers may have an adverse effect on us. These uncertainties may impair our ability to attract, retain, and motivate key personnel until the acquisitions are consummated and for a period of time thereafter, and could cause customers and others that deal with us to seek to change their existing business relationships with us. Employee retention may be particularly challenging during the pendency of the acquisitions, as employees may experience uncertainty about their roles with the Company following the acquisitions. The Investors and HSBC branches to be acquired by the Company have respectively operated and, until the completion of the acquisitions, will continue to operate independently. The ultimate success of the acquisitions, including anticipated benefits and cost savings, among other things, will depend, in part, on our ability to successfully combine and integrate our and Investors’ businesses and the HSBC’s branches in a manner that facilitates growth opportunities and realizes anticipated cost savings. It is possible that the integration process could result in the loss of key employees, the loss of customers, the disruption of the companies' ongoing business, unexpected integration issues, higher than expected integration costs, and an integration process that takes longer than originally anticipated. Also, if the Company experiences difficulties or delays with the integration process, the anticipated benefits of the acquisitions may not be realized fully, or at all.
Citizens Financial Group, Inc. | 90
The definitive agreements between the Company and Investors and HSBC, respectively, may be terminated in accordance with its terms.
The Investors acquisition agreement with Investors and the HSBC branch acquisition agreement with HSBC are each subject to a number of conditions which need to be fulfilled in order to consummate the proposed acquisitions. With respect to the Investors acquisition agreement, these conditions include, among other things, the approval of Investors’ stockholders, the receipt of all required regulatory approvals, the absence of any order, injunction, or other legal restraint, subject to certain exceptions, the accuracy of representations and warranties under the Investors acquisition agreement, our and Investors’ performance of our and their respective obligations under the Investors acquisition agreement in all material aspects, and each of our and Investors’ receipt of a tax opinion to the effect that the acquisition will be treated as a "reorganization" within the meaning of Section 368(a) of the Internal Revenue Code of 1986, as amended. The HSBC branch acquisition agreement is also subject to customary closing terms and conditions, including the receipt of all required regulatory approvals.
The conditions to the closing of the acquisitions may not be fulfilled in a timely manner or at all, and accordingly, the acquisitions may be delayed or may not be completed. With respect to the Investors acquisition agreement, we and Investors may opt to terminate the Investors acquisition agreement under certain circumstances. Among other situations, if the acquisition is not completed by July 28, 2022, either we or Investors may choose not to proceed with the acquisition (provided that such date may be extended to October 28, 2022 by us or Investors if all other condition precedents other than receipt of all requisite regulatory approvals have been satisfied or waived). We and Investors can also mutually decide to terminate the Investors acquisition agreement at any time. The HSBC branch acquisition agreement may also be terminated by the parties thereto under certain circumstances.
Shareholder litigation could prevent or delay the closing of the proposed acquisition of Investors or otherwise negatively impact our business and operations.
Lawsuits may be filed against us, Investors, or the directors and officers of either company relating to the proposed acquisition Litigation filed against us, our Board of Directors, or Investors and its Board of Directors could prevent or delay the completion of the acquisition, cause us to incur additional costs, or result in the payment of damages following completion of the acquisition. The defense or settlement of any lawsuit or claim that remains unresolved at the effective time of the acquisition may adversely affect the combined company's business, financial condition, results of operation, cash flows, and market price.
ITEM 2. UNREGISTERED SALES OF EQUITY SECURITIES AND USE OF PROCEEDS
None.
None.
ITEM 6. EXHIBITS
Citizens Financial Group, Inc. | 91
| |
101 | The following materials from the Registrant's Quarterly Report on Form 10-Q for the fiscal quarter ended September 30, 2020, formatted in inline XBRL: (i) the Consolidated Balance Sheets, (ii) the Consolidated Statements of Operations, (iii) the Consolidated Statements of Comprehensive Income, (iv) the Consolidated Statements of Changes in Stockholders’ Equity, (v) the Consolidated Statements of Cash Flows and (vi) the Notes to Consolidated Financial Statements*
|
101 The following materials from the Registrant's Quarterly Report on Form 10-Q for the fiscal quarter ended June 30, 2021, formatted in inline XBRL: (i) the Consolidated Balance Sheets, (ii) the Consolidated Statements of Operations, (iii) the Consolidated Statements of Comprehensive Income, (iv) the Consolidated Statements of Changes in Stockholders’ Equity, (v) the Consolidated Statements of Cash Flows and (vi) the Notes to Consolidated Financial Statements*
| |
104 | Cover page interactive data file in inline XBRL format, included in Exhibit 101 to this report* |
104 Cover page interactive data file in inline XBRL format, included in Exhibit 101 to this report*
† Indicates management contract or compensatory plan or arrangement.
* Filed herewith.
Citizens Financial Group, Inc. | 92
SIGNATURE
Pursuant to the requirements of the Securities Exchange Act of 1934, the Registrant has duly caused this Report to be signed on its behalf by the undersigned, thereunto duly authorized on November 4, 2020.August 3, 2021.
| | | | | |
| CITIZENS FINANCIAL GROUP, INC. |
| (Registrant) |
| |
CITIZENS FINANCIAL GROUP, INC. |
(Registrant) |
| By: | |
By: | /s/ C. Jack Read |
| Name: C. Jack Read |
| Title: Executive Vice President, Chief Accounting Officer and Controller |
| (Principal Accounting Officer and Authorized Officer) |
Citizens Financial Group, Inc. | 9593