0000759944us-gaap:DividendDeclaredMemberus-gaap:SeriesCPreferredStockMember2020-07-012020-09-30
UNITED STATES
SECURITIES AND EXCHANGE COMMISSION
Washington, D.C. 20549
FORM 10-Q
☒ QUARTERLY REPORT PURSUANT TO SECTION 13 OR 15(d)
OF THE SECURITIES EXCHANGE ACT OF 1934
For the Quarterly Period Ended
March 31,September 30, 2021
☐ TRANSITION REPORT PURSUANT TO SECTION 13 OR 15(d)
OF THE SECURITIES EXCHANGE ACT OF 1934
For the Transition Period From
(Not Applicable)
Commission File Number 001-36636
(Exact name of the registrant as specified in its charter)
| | | | | | | | |
| Delaware | | 05-0412693 |
(State or Other Jurisdiction of
Incorporation or Organization) | | (I.R.S. Employer
Identification Number) |
One Citizens Plaza, Providence, RI 02903
(Address of principal executive offices, including zip code)
(401) 456-7000(203) 900-6715
(Registrant’s telephone number, including area code)
Securities registered pursuant to Section 12(b) of the Act:
| | | | | | | | |
| Title of each class | Trading symbol(s) | Name of each exchange on which registered |
| Common stock, $0.01 par value per share | CFG | New York Stock Exchange |
Depositary Shares, each representing a 1/40th interest in a share of 6.350% Fixed-to-Floating Rate Non-Cumulative Perpetual Preferred Stock, Series D
| CFG PrD | New York Stock Exchange |
Depositary Shares, each representing a 1/40th interest in a share of 5.000% Fixed-Rate Non-Cumulative Perpetual Preferred Stock, Series E
| CFG PrE | New York Stock Exchange |
Indicate by check mark whether the Registrant (1) has filed all reports required to be filed by Section 13 or 15(d) of the Securities Exchange Act of 1934 during the preceding 12 months and (2) has been subject to such filing requirements for the past 90 days.
☑ Yes ☐ No
Indicate by check mark whether the registrant has submitted electronically every Interactive Data File required to be submitted pursuant to Rule 405 of Regulation S-T (§232.405 of this chapter) during the preceding 12 months (or for such shorter period that the registrant was required to submit such files).
☑ Yes ☐ No
Indicate by check mark whether the registrant is a large accelerated filer, an accelerated filer, a non-accelerated filer, a smaller reporting company, or an emerging growth company. See the definitions of “large accelerated filer,” “accelerated filer,” “smaller reporting company,” and “emerging growth company” in Rule 12b-2 of the Exchange Act:
| | | | | | | | | | | |
| Large accelerated filer | ☑ | Accelerated filer | ☐ |
| Non-accelerated filer | ☐ | Smaller reporting company | ☐ |
| | Emerging growth company | ☐ |
If an emerging growth company, indicate by check mark if the registrant has elected not to use the extended transition period for complying with any new or revised financial accounting standards provided pursuant to Section 13(a) of the Exchange Act. ☐
Indicate by check mark whether the registrant is a shell company (as defined in Rule 12b-2 of the Exchange Act). ☐ Yes ☑ No
There were 425,930,159426,199,576 shares of Registrant’s common stock ($0.01 par value) outstanding on April 23,October 22, 2021.
| | | | | | | | | | | | | | |
| | | | |
| | | |
| | Table of Contents | | |
| | | | |
| | | |
| | | |
| | | |
| Part I. Financial Information | | |
| | | |
| Item 1. Financial Statements | | |
| | | |
| | | |
| | | |
| | | |
| | | |
| | | |
| Notes to the Consolidated Financial Statements (unaudited) | | |
| | | |
| | | |
| | | |
| Item 3. Quantitative and Qualitative Disclosures about Market Risk | | |
| | | |
| Item 4. Controls and Procedures | | |
| | | |
| | | |
| Part II. Other Information | | |
| | | |
| Item 1. Legal Proceedings | | |
| Item 1A. Risk Factors | | |
| Item 2. Unregistered Sales of Equity Securities and Use of Proceeds | | |
| | | |
| Item 6. Exhibits | | |
| | | |
| | | |
| Signature | | |
| | | |
| | | |
| | | |
Citizens Financial Group, Inc. | 2
GLOSSARY OF ACRONYMS AND TERMS
The following is a list of common acronyms and terms we regularly use in our financial reporting:
| | | | | | | | |
| 2020 Form 10-K | | Annual Report on Form 10-K for the year ended December 31, 2020 |
| AACL | | Adjusted Allowance for Credit Losses |
| ACL | | Allowance for Credit Losses: Allowance for Loan and Lease Losses plus Allowance for Unfunded Lending Commitments |
| AFS | | Available for Sale |
| ALLL | | Allowance for Loan and Lease Losses |
| ALM | | Asset and Liability Management |
| AOCI | | Accumulated Other Comprehensive Income (Loss) |
| ARRC | | Alternative Reference Rate Committee |
| ASU | | Accounting Standards Update |
| ATM | | Automated Teller Machine |
| | |
| Board or Board of Directors | | The Board of Directors of Citizens Financial Group, Inc. |
| bps | | Basis Points |
| | |
| Capital Plan Rule | | Federal Reserve’s Regulation Y Capital Plan Rule |
| CARES Act | | Coronavirus Aid, Relief, and Economic Security Act |
| CBNA | | Citizens Bank, National Association |
| CCAR | | Comprehensive Capital Analysis and Review |
| CCB | | Capital Conservation Buffer |
| CCMI | | Citizens Capital Markets, Inc. |
| CECL | | Current Expected Credit Losses (ASU 2016-13, Financial Instruments-Credit Losses (Topic 326): Measurement of Credit Losses on Financial Instruments) |
| CET1 | | Common Equity Tier 1 |
| | |
| | |
| CET1 capital ratio | | Common Equity Tier 1 capital divided by total risk-weighted assets as defined under the U.S. Basel III Standardized approach |
| | |
| | |
| Citizens, CFG, the Company, we, us, or our | | Citizens Financial Group, Inc. and its Subsidiaries |
| CLO | | Collateralized Loan Obligation |
| CLTV | | Combined Loan-to-Value |
| | |
| | |
| COVID-19 pandemic | | Coronavirus Disease 2019 Pandemic |
| | |
| CRE | | Commercial Real Estate |
| | |
| | |
| | |
| Dodd-Frank Act | | The Dodd-Frank Wall Street Reform and Consumer Protection Act of 2010 |
| | |
| | |
EGRRCPA | | Economic Growth, Regulatory Relief and Consumer Protection Act |
| Elevated cash | | Cash above targeted operating levels |
| EPS | | Earnings Per Share |
| ERC | | Executive Risk Committee |
| EVE | | Economic Value of Equity |
| Exchange Act | | The Securities Exchange Act of 1934 |
| | |
| | |
| Fannie Mae (FNMA) | | Federal National Mortgage Association |
| FCA | | Financial Conduct Authority |
| FDIC | | Federal Deposit Insurance Corporation |
| FHA | | Federal Housing Administration |
| FHLB | | Federal Home Loan Bank |
| FICO | | Fair Isaac Corporation (credit rating) |
| | |
| FRB or Federal Reserve | | Board of Governors of the Federal Reserve System and, as applicable, Federal Reserve Bank(s) |
| Freddie Mac (FHLMC) | | Federal Home Loan Mortgage Corporation |
| | |
| FTE | | Fully Taxable Equivalent |
| | |
| GAAP | | Accounting Principles Generally Accepted in the United States of America |
| GDP | | Gross Domestic Product |
Citizens Financial Group, Inc. | 3
| | | | | | | | |
| Ginnie Mae (GNMA) | | Government National Mortgage Association |
| GSE | | Government Sponsored Entity |
| HSBC | | HSBC Bank U.S.A., N.A. |
| HSBC branches | | HSBC’s East Coast branches and National Online deposit business |
| HTM | | Held To Maturity |
| ICE | | Intercontinental Exchange |
| Investors | | Investors Bancorp, Inc. |
Citizens Financial Group, Inc. | 3
| JMP | | | | | | | | JMP Group LLC |
| Last-of-Layer | | Last-of-layer is a fair value hedge of the interest rate risk of a portfolio of similar prepayable assets whereby the last dollar amount within the portfolio of assets is identified as the hedged item |
| | |
| | |
| | |
| LHFS | | Loans Held for Sale |
| LIBOR | | London Interbank Offered Rate |
| LIHTC | | Low Income Housing Tax Credit |
| LTV | | Loan to Value |
| MBS | | Mortgage-Backed Securities |
| MD&A | | Management’s Discussion and Analysis of Financial Condition and Results of Operations |
| Mid-Atlantic | | District of Columbia, Delaware, Maryland, New Jersey, New York, Pennsylvania, Virginia, and West Virginia |
| Midwest | | Illinois, Indiana, Michigan, and Ohio |
| | |
| Modified CECL Transition | | The Day-1 CECL adoption entry booked to retained earnings plus 25% of subsequent CECL ACL reserve build |
| Modified AACL Transition | | The Day-1 CECL adoption entry booked to ACL plus 25% of subsequent CECL ACL reserve build |
| MSRs | | Mortgage Servicing Rights |
| NCOs | | Net charge-offs |
| New England | | Connecticut, Maine, Massachusetts, New Hampshire, Rhode Island, and Vermont |
| | |
| | |
| | |
| NPLs | | Nonaccrual loans and leases |
| OCC | | Office of the Comptroller of the Currency |
| OCI | | Other Comprehensive Income (Loss) |
| | |
OTCOperating Leverage | | OverPeriod-over-period percent change in total revenue, less the Counterperiod-over-period percent change in noninterest expense |
| Parent Company | | Citizens Financial Group, Inc. (the Parent Company of Citizens Bank, National Association and other subsidiaries) |
| | |
| | |
| PPP | | Paycheck Protection Program |
| | |
| ROTCE | | Return on Average Tangible Common Equity |
| RPA | | Risk Participation Agreement |
| RWA | | Risk-Weighted Assets |
| SBA | | United States Small Business Administration |
| | |
| | |
| SCB | | Stress Capital Buffer |
| SEC | | United States Securities and Exchange Commission |
| SOFR | | Secured Overnight Financing Rate |
| SVaR | | Stressed Value at Risk |
| Tailoring Rules | | Rules establishing risk-based categories for determining prudential standards for large U.S. and foreign banking organizations, consistent with the Dodd-Frank Act, as amended by the Economic Growth, Regulatory Relief and Consumer Protection Act |
| TBAs | | To-Be-Announced Mortgage Securities |
| TDR | | Troubled Debt Restructuring |
| Tier 1 capital ratio | | Tier 1 capital, which includes Common Equity Tier 1 capital plus non-cumulative perpetual preferred equity that qualifies as additional tier 1 capital, divided by total risk-weighted assets as defined under the U.S. Basel III Standardized approach |
Citizens Financial Group, Inc. | 4
| | | | | | | | |
| Tier 1 leverage ratio | | Tier 1 capital, which includes Common Equity Tier 1 capital plus non-cumulative perpetual preferred equity that qualifies as additional tier 1 capital, divided by quarterly adjusted average assets as defined under the U.S. Basel III Standardized approach |
| Total capital ratio | | Total capital, which includes Common Equity Tier 1 capital, tier 1 capital and allowance for credit losses and qualifying subordinated debt that qualifies as tier 2 capital, divided by total risk-weighted assets as defined under the U.S. Basel III Standardized approach |
| USDA | | United States Department of Agriculture |
| VA | | United States Department of Veterans Affairs |
| VaR | | Value at Risk |
| VIE | | Variable Interest Entities |
| Willamette | | Willamette Management Associates, Inc. |
Citizens Financial Group, Inc. | 45
PART I. FINANCIAL INFORMATION
ITEM 2. MANAGEMENT’S DISCUSSION AND ANALYSIS OF FINANCIAL CONDITION AND RESULTS OF OPERATIONS
| | | | | | | | |
| | Page |
| Forward-Looking Statements | | |
| | |
| | |
| | |
| Selected Consolidated Financial Data | | |
| Results of Operations | | |
| | |
| | |
| | |
| | |
| | |
| | |
| | |
| | |
| | |
| Analysis of Financial Condition | | |
| | |
| | |
| | |
| | |
| | |
| | |
| | |
| | |
| | |
| | |
| | |
| | |
| | |
Citizens Financial Group, Inc. | 56
FORWARD-LOOKING STATEMENTS
This document contains forward-looking statements within the meaning of the Private Securities Litigation Reform Act of 1995. Statements regarding potential future share repurchases and future dividends as well as the potential effects of the COVID-19 pandemic and associated lockdowns on our business, operations, financial performance and prospects, are forward-looking statements. Also, any statement that does not describe historical or current facts is a forward-looking statement. These statements often include the words “believes,” “expects,” “anticipates,” “estimates,” “intends,” “plans,” “goals,” “targets,” “initiatives,” “potentially,” “probably,” “projects,” “outlook,” “guidance” or similar expressions or future conditional verbs such as “may,” “will,” “should,” “would,” and “could.”
Forward-looking statements are based upon the current beliefs and expectations of management, and on information currently available to management. Our statements speak as of the date hereof, and we do not assume any obligation to update these statements or to update the reasons why actual results could differ from those contained in such statements in light of new information or future events. We caution you, therefore, against relying on any of these forward-looking statements. They are neither statements of historical fact nor guarantees or assurances of future performance. While there is no assurance that any list of risks and uncertainties or risk factors is complete, important factors that could cause actual results to differ materially from those in the forward-looking statements include the following, without limitation:
•Negative economic and political conditions that adversely affect the general economy, housing prices, the job market, consumer confidence and spending habits which may affect, among other things, the level of nonperformingnonaccrual assets, charge-offs and provision expense;
•The rate of growth in the economy and employment levels, as well as general business and economic conditions, and changes in the competitive environment;
•Our ability to implement our business strategy, including the cost savings and efficiency components, and achieve our financial performance goals;goals, including through the integration of Investors and the HSBC branches;
•The COVID-19 pandemic and associated lockdowns and their effects on the economic and business environments in which we operate;
•Our ability to meet heightened supervisory requirements and expectations;
•Liabilities and business restrictions resulting from litigation and regulatory investigations;
•Our capital and liquidity requirements under regulatory capital standards and our ability to generate capital internally or raise capital on favorable terms;
•The effect of changes in interest rates on our net interest income, net interest margin and our mortgage originations, mortgage servicing rights and mortgages held for sale;
•Changes in interest rates and market liquidity, as well as the magnitude of such changes, which may reduce interest margins, impact funding sources and affect the ability to originate and distribute financial products in the primary and secondary markets;
•The effect of changes in the level of checking or savings account deposits on our funding costs and net interest margin;
•Financial services reform and other current, pending or future legislation or regulation that could have a negative effect on our revenue and businesses;
•A failure in or breach of our operational or security systems or infrastructure, or those of our third party vendors or other service providers, including as a result of cyber-attacks;
•An inability to complete the acquisitions of Investors or the HSBC branches, or changes in the current anticipated timeframe, terms or manner of such acquisitions;
•Greater than expected costs or other difficulties related to the integration of our business and that of Investors and HSBC branches;
•The inability to retain existing Investors or HSBC clients and employees following the closings of the Investors and HSBC branch acquisitions;
Citizens Financial Group, Inc. | 7
•The occurrence of any event change or other circumstance that could give rise to the right of one or both parties to terminate (i) the agreement to acquire Investors or (ii) the agreement to acquire HSBC branches; and
•Management’s ability to identify and manage these and other risks.
In addition to the above factors, we also caution that the actual amounts and timing of any future common stock dividends or share repurchases will be subject to various factors, including our capital position, financial performance, risk-weighted assets, capital impacts of strategic initiatives, market conditions and regulatory and accounting considerations, as well as any other factors that our Board of Directors deems relevant in making such a determination. Therefore, there can be no assurance that we will repurchase shares from or pay any dividends to holders of our common stock, or as to the amount of any such repurchases or dividends. Further, statements about the effects of the COVID-19 pandemic and associated lockdowns on our business, operations,
Citizens Financial Group, Inc. | 6
financial performance and prospects may constitute forward-looking statements and are subject to the risk that the actual impacts may differ, possibly materially, from what is reflected in those forward-looking statements due to factors and future developments that are uncertain, unpredictable and in many cases beyond our control, including the scope and duration of the pandemic, actions taken by governmental authorities in response to the pandemic, and the direct and indirect impact of the pandemic on our customers, third parties and us. In addition, statements about our net charge-off guidance constitute forward-looking statements and are subject to the risk that the actual charge-offs may differ, possibly materially, from what is reflected in those statements due to, among other potential factors, the impact of the COVID-19 pandemic and the effectiveness of stimulus and forbearance programs in response, changes in economic conditions, and idiosyncratic events affecting our commercial loans. Statements about Citizens’ agreement to acquire Investors and CBNA’s agreement to acquire HSBC branches also constitute forward-looking statements and are subject to the risk that actual results could be materially different from those expressed in those statements, including if either of both transactions are not consummated in a timely manner or at all, or if integration is more costly or difficult than expected.
More information about factors that could cause actual results to differ materially from those described in the forward-looking statements can be found in the “Risk Factors” section in Part I, Item 1A of our Annual Report on2020 Form 10-K as well as Part II, Item 1A of our Form 10-Q for the yearquarter ended December 31, 2020.June 30, 2021.
INTRODUCTION
Citizens Financial Group, Inc. is one of the nation’s oldest and largest financial institutions with $187.2$187.0 billion in assets as of March 31,September 30, 2021. Our mission is to help customers, colleagues and communities each reach their potential by listening to them and understanding their needs in order to offer tailored advice, ideas and solutions. Headquartered in Providence, Rhode Island, we offer a broad range of retail and commercial banking products and services to individuals, small businesses, middle-market companies, large corporations, and institutions. We help our customers reach their potential by listening to them and by understanding their needs to offer tailored advice, ideas, and solutions. In Consumer Banking, we provide an integrated experience that includes mobile and online banking, a 24/7 customer contact center, as well as the convenience of approximately 2,9003,000 ATMs and approximately 1,000 branches in 11 states in the New England, Mid-Atlantic, and Midwest regions. Consumer Banking products and services include a full range of banking, lending, savings, wealth management and small business offerings. In Commercial Banking, we offer corporate, institutional and not-for-profit clients a full rangebroad complement of wholesale bankingfinancial products and servicessolutions, including lending and deposits, capital markets,leasing, deposit and treasury management services, foreign exchange, and interest rate products, and asset finance.commodity risk management solutions, as well as loan syndication, corporate finance, merger and acquisition, and debt and equity capital markets capabilities. More information is available at www.citizensbank.com.
On May 26, 2021, CBNA entered into an agreement to acquire 80 East Coast branches and the national online deposit business from HSBC for an approximate 2.0% premium paid on deposits at closing. The HSBC acquisition provides an attractive entry into important metro markets and supports our national expansion strategy. The branch purchase includes 66 locations in the New York City Metro area, 9 locations in the Mid-Atlantic/Washington D.C. area, and 5 locations in Southeast Florida. As of September 30, 2021, there were approximately $8.4 billion in deposits and $1.9 billion in loans. The transaction is expected to close in the first quarter of 2022, subject to customary closing terms and conditions and regulatory approvals.
On July 28, 2021 Citizens entered into a definitive agreement and a plan of merger under which we will acquire all of the outstanding shares of Investors for a combination of stock and cash. Pursuant to the terms of the agreement, Investors shareholders will receive 0.297 of a share of the Company’s common stock and $1.46 in cash for each share of Investors they own. The acquisition of Investors enhances Citizens’ banking franchise, adding an attractive middle market, small business and consumer customer base while building our physical presence in the northeast with the addition of 154 branches located in the greater New York City and Philadelphia metropolitan areas and across New Jersey. As of September 30, 2021, Investors disclosed that it had total assets of $27.3 billion, including $21.6 billion of loans, $24.5 billion of liabilities, including $20.4 billion of
Citizens Financial Group, Inc. | 8
deposits, and $2.8 billion of stockholders’ equity. The merger is expected to close in early second quarter 2022, subject to approval by the shareholders of Investors, regulatory approvals, and other customary closing conditions.
On August 5, 2021, Citizens entered into a definitive agreement to acquire Willamette, a valuation consulting and forensic analysis firm with offices in Chicago, Atlanta, and Portland, Oregon. This transaction further strengthens our growing corporate financial advisory capabilities. The acquisition was completed on September 1, 2021.
On September 8, 2021, Citizens entered into a definitive agreement to acquire JMP in an all-cash transaction. This acquisition further strengthens Citizens’ corporate finance and strategic advisory capabilities. Under the agreement, JMP shareholders will receive $7.50 for each common share of JMP they own, or approximately $149 million in cash. This transaction is targeted to close in mid-fourth quarter 2021, subject to approval by the shareholders of JMP and other customary closing conditions.
The following MD&A is intended to assist readers in their analysis of the accompanying unaudited interim Consolidated Financial Statements and supplemental financial information. It should be read in conjunction with the unaudited interim Consolidated Financial Statements and Notes to the unaudited interim Consolidated Financial Statements in Part I, Item 1, as well as other information contained in this document and our 2020 Form 10-K.
Non-GAAP Financial Measures
This document contains non-GAAP financial measures denoted as “Underlying”, “excluding elevated cash”, “excluding PPP loans”, as well as other results excluding the impact of certain items. Underlying results for any given reporting period exclude certain items that may occur in that period which management does not consider indicative of our on-going financial performance. We believe these non-GAAP financial measures provide useful information to investors because they are used by management to evaluate our operating performance and make day-to-day operating decisions. In addition, we believe our Underlying results or results excluding the impact of certain items in any given reporting period reflect our on-going financial performance and increase comparability of period-to-period results, and accordingly, are useful to consider in addition to our GAAP financial results.
Other companies may use similarly titled non-GAAP financial measures that are calculated differently from the way we calculate such measures. Accordingly, our non-GAAP financial measures may not be comparable to similar measures used by such companies. We caution investors not to place undue reliance on such non-GAAP financial measures, but to consider them with the most directly comparable GAAP measures. Non-GAAP financial measures have limitations as analytical tools and should not be considered in isolation or as a substitute for our results reported under GAAP.
Non-GAAP measures are denoted throughout our MD&A by the use of the term Underlying or identified as excluding the impact of certain items and whereitems. Where there is a reference to these metrics in that paragraph, all measures that follow that reference are on the same basis when applicable. For more information on the computation of non-GAAP financial measures, see “—Non-GAAP Financial Measures and Reconciliations.”
Citizens Financial Group, Inc. | 79
FINANCIAL PERFORMANCE
Quarter to Date and Period EndQuarterly Results - Key Highlights
Net income of $611$530 million increased $57769% from $314 million fromin the firstthird quarter of 2020, with earnings per diluted common share of $1.37,$1.18, up $1.34$0.50 from $0.03$0.68 per diluted common share in the third quarter of 2020. ROTCE of 13.7% compared to 8.3% in the third quarter of 2020.
Third quarter 2021 results reflect $16 million of expenses, net of tax benefit, or $0.04 per diluted common share, from notable items compared to $24 million of expenses, net of tax benefit, or $0.05 per diluted common share, from notable items in third quarter of 2020. On an Underlying basis, which excludes notable items, net income available to common stockholders of $520 million compared with $313 million in the third quarter of 2020. Underlying EPS of $1.22 compared to $0.73 in the third quarter of 2020. Underlying ROTCE of 14.2% compared with 9.0% in third quarter of 2020.
| | | | | | | | | | | | | | | | | | | | | | | | | | | | | | | | | | | | | | | | | | | | | |
| Table 1: Notable Items | | | | | | | | | | | | | | | | | | | |
| | | Three Months Ended September 30, |
| | | 2021 | | | | 2020 |
| (in millions) | | | Noninterest expense | | | | Income tax expense | | Net Income | | | | Noninterest expense | | | | Income tax expense | | Net Income |
| Reported results (GAAP): | | | $1,011 | | | | | $151 | | | $530 | | | | | $988 | | | | | $61 | | | $314 | |
| Less notable items: | | | | | | | | | | | | | | | | | | | |
| Total integration costs | | | 4 | | | | | (1) | | | (3) | | | | | 2 | | | | | — | | | (2) | |
Other notable items(1) | | | 19 | | | | | (6) | | | (13) | | | | | 29 | | | | | (7) | | | (22) | |
| Total notable items | | | 23 | | | | | (7) | | | (16) | | | | | 31 | | | | | (7) | | | (24) | |
| Underlying results (non-GAAP) | | | $988 | | | | | $158 | | | $546 | | | | | $957 | | | | | $68 | | | $338 | |
(1) Other notable items for the third quarter of 2021 include a pension settlement charge and a compensation-related tax credit as well as TOP 6 transformational and revenue and efficiency initiatives. Third quarter 2020 includes our TOP 6 transformational and revenue and efficiency initiatives.
•Total revenue of $1.7 billion decreased $132 million, or 7%, from the third quarter of 2020, driven by a decrease of 21% in noninterest income, partially offset by a 1% increase in net interest income.
•Net interest income of $1.1 billion increased 1% compared to the third quarter of 2020 reflecting 4% growth in interest-earning assets, largely offset by lower net interest margin.
◦Net interest margin of 2.72% decreased 10 basis points compared to 2.82% in the third quarter of 2020, primarily reflecting the impact of elevated cash balances and the lower rate environment, partly offset by improved funding mix and deposit pricing and the benefit of accelerated PPP loan forgiveness.
–Net interest margin on a FTE basis of 2.72% decreased 11 basis points compared to 2.83% in the third quarter of 2020.
–Average loans and leases of $122.6 billion decreased $2.3 billion, or 2%, from $124.9 billion in the third quarter of 2020, driven by a $5.2 billion decrease in commercial reflecting payoffs and a $1.9 billion decrease in PPP loans. The decrease in commercial was partially offset by a $2.9 billion increase in retail driven by growth in education, residential mortgage and automobile, partially offset by planned runoff of personal unsecured installment loans and a decrease in home equity.
–Average deposits of $151.9 billion increased $10.5 billion, or 7%, from $141.4 billion in the third quarter of 2020, reflecting an increase in demand deposits, money market accounts, savings and checking with interest, partially offset by a decrease in term deposits.
◦Noninterest income of $514 million decreased $140 million, or 21%, from the third quarter of 2020, driven by a decline in mortgage banking fees and other income, partially offset by higher capital markets, service charges, card and trust and investment services fees.
•Noninterest expense of $1.0 billionwas stable compared to the third quarter of 2020.
Citizens Financial Group, Inc. | 10
◦On an Underlying basis, noninterest expense of $988 million increased $31 million, or 3%, from the third quarter of 2020, given higher salaries and employee benefits, outside services and other operating expense.
•The efficiency ratio of 60.9% compared to 55.2% in the third quarter of 2020.
◦On an Underlying basis, the efficiency ratio of 59.5% compared to 53.4% in the third quarter of 2020.
•Credit provision benefit of $33 million compares with a $428 million credit provision expense in the third quarter of 2020, reflecting strong credit performance across the retail and commercial loan portfolios and improvement in the macroeconomic outlook.
Year to Date and Period End - Key Highlights
Net income of $1.8 billion increased $1.2 billion from the first nine months of 2020, with earnings per diluted common share of $3.99, up $2.76 from $1.23 per diluted common share in the first quarternine months of 2020. ROTCE of 17.2%16.1% increased from 0.4%5.1% in the first quarternine months of 2020. Improved results primarily reflect the impact of the COVID-19 pandemic and associated lockdowns in the first quarternine months of 2020, resulting in a significant ACL reserve build in the first quarter of 2020.during this period.
In the first quarternine months of 2021, results reflected $15reflect $39 million of expenses, net of tax benefit, or $0.04$0.10 per diluted common share, from notable items largely tiedcompared to $59 million of expenses, net of tax benefit, or $0.14 per diluted common share, from notable items in the first nine months of 2020.
| | | | | | | | | | | | | | | | | | | | | | | | | | | | | | | | | | | | | | | | | | | |
| Table 2: Notable Items | | | | | | | | | | | | | | | | | | | |
| | | Nine Months Ended September 30, |
| | | 2021 | | | | 2020 |
| (in millions) | | | Noninterest expense | | | | Income tax expense | | Net Income | | | | Noninterest expense | | | | Income tax expense | | Net Income |
| Reported results (GAAP) | | | $3,020 | | | | | $504 | | | $1,789 | | | | | $2,979 | | | | | $126 | | | $601 | |
| Less notable items: | | | | | | | | | | | | | | | | | | | |
| Total integration costs | | | 6 | | | | | (2) | | | (4) | | | | | 8 | | | | | (2) | | | (6) | |
Other notable items(1) | | | 48 | | | | | (13) | | | (35) | | | | | 75 | | | | | (22) | | | (53) | |
| Total notable items | | | 54 | | | | | (15) | | | (39) | | | | | 83 | | | | | (24) | | | (59) | |
| Underlying results (non-GAAP) | | | $2,966 | | | | | $519 | | | $1,828 | | | | | $2,896 | | | | | $150 | | | $660 | |
(1) For the nine months ended September 30, 2021, Other notable items include a pension settlement charge and a compensation-related credit as well as our TOP 6 transformational and revenue and efficiency initiatives. In the first quarter of 2020, there were $25 million of expenses, net of tax benefit, or $0.06 per diluted common share, from notable items, largely tied to TOP 6 transformational and revenue and efficiency initiatives.
| | | | | | | | | | | | | | | | | | | | | | | | | | | | | | | | | | | | | | | | | | | |
| Table 1: Notable Items | | | | | | | | | | | | | | | | | | | |
| | | Three Months Ended March 31, |
| | | 2021 | | | | 2020 |
| (in millions) | | | Noninterest expense | | | | Income tax expense | | Net Income | | | | Noninterest expense | | | | Income tax expense | | Net Income |
| Reported results (GAAP) | | | $1,018 | | | | | $170 | | | $611 | | | | | $1,012 | | | | | $11 | | | $34 | |
| Less notable items: | | | | | | | | | | | | | | | | | | | |
| Total integration costs | | | — | | | | | — | | | — | | | | | 4 | | | | | (1) | | | (3) | |
Other notable items (1) | | | 20 | | | | | (5) | | | (15) | | | | | 29 | | | | | (7) | | | (22) | |
| Total notable items | | | 20 | | | | | (5) | | | (15) | | | | | 33 | | | | | (8) | | | (25) | |
| Underlying results* (non-GAAP) | | | $998 | | | | | $175 | | | $626 | | | | | $979 | | | | | $19 | | | $59 | |
(1) For the three months ended March 31, 2021 and 2020, Other notable items include noninterest expense of $20 million and $29 million, respectively, related tofor the nine months ended September 30, 2020 includes our TOP 6 transformational and revenue and efficiency initiatives.initiatives as well as an income tax benefit related to legacy tax matters.
•Net income available to common stockholders of $588 million$1.7 billion increased $576 million,$1.2 billion, compared to $12$526 million in the first quarternine months of 2020.
◦On an Underlying basis, which excludes notable items, first quarter 2021 net income available to common stockholders of $603 million$1.7 billion compared with $37$585 million in the first quarternine months of 2020.
◦On an Underlying basis, EPS of $1.41 per share$4.09 compared to $0.09$1.37 in the first quarternine months of 2020.
•Total revenue of $1.7$4.9 billion was stable withdecreased $271 million, or 5%, from the first quarternine months of 2020, driven by a 9% increasedeclines of 11% and 2% in noninterest income partially offset by a 4% decrease inand net interest income.income, respectively.
◦Net interest income of $1.1$3.4 billion decreased 4%, reflecting 9% growth in average interest-earning assets, including the addition of PPP loans, which was more than offset by2% given lower net interest margin.margin, partially offset by 5% growth in interest-earning assets.
◦Net interest margin of 2.75%2.73% decreased 3420 basis points from 3.09%2.93% in the first quarternine months of 2020, primarily reflecting the impact of a lower rate environment, lower interest-earning asset yields and elevated cash balances, given strong deposit flows, partiallypartly offset by improved funding mix and deposit pricing.pricing and the benefit of accelerated PPP loan forgiveness.
–Net interest margin on a FTE basis of 2.76%2.73% decreased by 3420 basis points, compared to 3.10%2.93% in the first quarternine months of 2020.
–Average loans and leases of $122.8$123.0 billion increased $1.8decreased $1.9 billion, or 1%2%, from $121.1$124.9 billion in the first quarternine months of 2020, reflectingdriven by a $1.4$3.5 billion increasedecrease in commercial driven by PPP loans, partially offset byreflecting line of credit repayments and net payoffs, as well aspartially offset by an increase in PPP loans. The decrease in commercial was partially offset by a $425 million$1.6 billion increase in retail driven by
Citizens Financial Group, Inc. | 11
growth in education, and residential mortgage and automobile, partially offset by decreases in home equity and other retail given run offplanned run-off of personal unsecured installment loans.loans and a decrease in home equity.
–Period-end loans declined $895increased $228 million or 1%, from the fourth quarter of 2020, reflecting 5% growth in retail and a 1%5% decline in both commercial and retail.commercial.
Citizens Financial Group, Inc. | 8
–Average deposits of $146.6$149.6 billion increased $20.0$13.1 billion, or 16%10%, from $126.6$136.5 billion in the first quarternine months of 2020, reflecting an increase in demand deposits, money market accounts, savings and checking with interest, partially offset by a decrease in term deposits.
–Period-end deposit growth of $4.2$5.1 billion, or 3%, from the fourth quarter of 2020, reflecting growth in money market accounts, demand deposits, and savings given strong deposit flows from consumer-orientedelevated liquidity tied to government stimulus partially offset by a decline in term deposits and checkingassociated with interest.the COVID-19 disruption.
◦Noninterest income of $542 million increased $45$1.5 billion decreased $200 million, or 9%11%, from the first quarternine months of 2020, driven by growtha decline in mortgage banking fees strongpartially offset by improved capital markets, fees and record trust and investment services, fees, partially offset by a decrease inletter of credit and loan, card and service charges and fees, reflecting COVID-19 impacts on overdraft fees.
•Noninterest expense of $1.0$3.0 billion was stable compared to the first quarternine months of 2020.
◦On an Underlying basis, noninterest expense increased 2% from the first quarternine months of 2020, reflecting increases inhigher outside services, largely tied to growth initiatives, equipment and software driven by increased technology spend,expense, and salaries and employee benefits, as a result of higher revenue-based compensation, partially offset by a decrease in other operating expense driven by lower travel and advertising costs.expense.
•The efficiency ratio of 61.4%61.3% compared to 61.1%57.3% for the first quarternine months of 2020, and ROTCE of 17.2%16.1% compared to 0.4%5.1%.
◦On an Underlying basis, the efficiency ratio of 60.2% compared to 59.1%55.7% for the first quarternine months of 2020, and ROTCE of 17.6%16.5% compared to 1.1%5.7%.
•NegativeCredit provision for credit lossesbenefit of $140$386 million compares with a $600 million$1.5 billion credit provision expense for the first quarternine months of 2020, reflecting strong credit performance across the consumerretail and commercial loan portfolios and improvement in the macroeconomic outlook.
•Tangible book value per common share of $32.79$34.44 increased 3%7% from the first quarternine months of 2020. Fully diluted average common shares outstanding decreased 1.5 million shareswas stable over the same period.
Citizens Financial Group, Inc. | 912
SELECTED CONSOLIDATED FINANCIAL DATA
The summary of the Consolidated Operating Data for the three and nine months ended March 31,September 30, 2021 and 2020 and the summary Consolidated Balance Sheet data as of March 31,September 30, 2021 and December 31, 2020 are derived from our unaudited interim Consolidated Financial Statements, included in Part I, Item 1. Our historical results are not necessarily indicative of the results expected for any future period.
| | Table 2: Summary of Consolidated Operating Data | | | |
| Table 3: Summary of Consolidated Operating Data | | Table 3: Summary of Consolidated Operating Data | |
| | | | Three Months Ended March 31, | | Three Months Ended September 30, | | Nine Months Ended September 30, |
| (dollars in millions, except per share amounts) | (dollars in millions, except per share amounts) | | | 2021 | | 2020 | (dollars in millions, except per share amounts) | 2021 | | 2020 | | 2021 | | 2020 |
| OPERATING DATA: | OPERATING DATA: | | | | | | OPERATING DATA: | | | | | | | |
| Net interest income | Net interest income | | | $1,117 | | | $1,160 | | Net interest income | $1,145 | | | $1,137 | | | $3,386 | | | $3,457 | |
| Noninterest income | Noninterest income | | | 542 | | | 497 | | Noninterest income | 514 | | | 654 | | | 1,541 | | | 1,741 | |
| Total revenue | Total revenue | | | 1,659 | | | 1,657 | | Total revenue | 1,659 | | | 1,791 | | | 4,927 | | | 5,198 | |
| Provision for credit losses | Provision for credit losses | | | (140) | | | 600 | | Provision for credit losses | (33) | | | 428 | | | (386) | | | 1,492 | |
| Noninterest expense | Noninterest expense | | | 1,018 | | | 1,012 | | Noninterest expense | 1,011 | | | 988 | | | 3,020 | | | 2,979 | |
| Income before income tax expense | Income before income tax expense | | | 781 | | | 45 | | Income before income tax expense | 681 | | | 375 | | | 2,293 | | | 727 | |
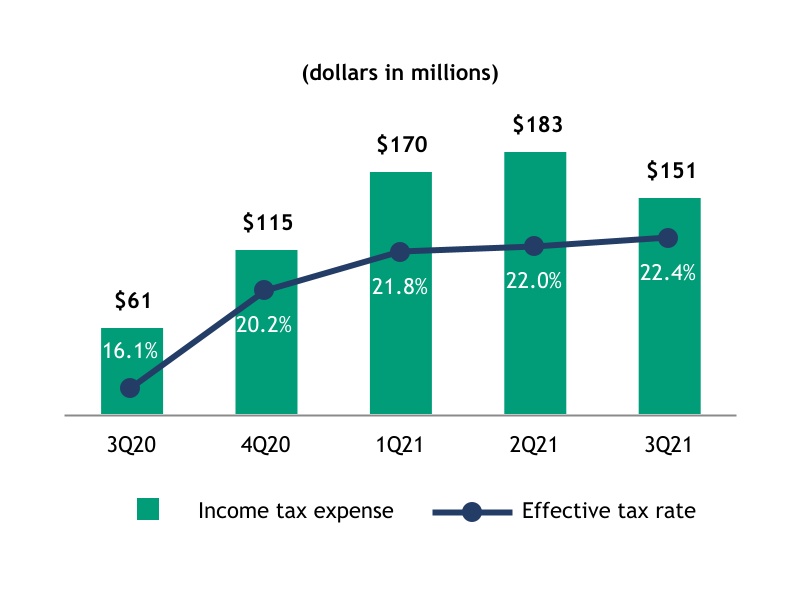
| Income tax expense | Income tax expense | | | 170 | | | 11 | | Income tax expense | 151 | | | 61 | | | 504 | | | 126 | |
| Net income | Net income | | | $611 | | | $34 | | Net income | $530 | | | $314 | | | $1,789 | | | $601 | |
| Net income available to common stockholders | Net income available to common stockholders | | | $588 | | | $12 | | Net income available to common stockholders | $504 | | | $289 | | | $1,708 | | | $526 | |
| Net income per common share - basic | Net income per common share - basic | | | $1.38 | | | $0.03 | | Net income per common share - basic | $1.18 | | | $0.68 | | | $4.01 | | | $1.23 | |
| Net income per common share - diluted | Net income per common share - diluted | | | $1.37 | | | $0.03 | | Net income per common share - diluted | $1.18 | | | $0.68 | | | $3.99 | | | $1.23 | |
| OTHER OPERATING DATA: | OTHER OPERATING DATA: | | | OTHER OPERATING DATA: | |
| Return on average common equity | Return on average common equity | | | 11.57 | % | | 0.24 | % | Return on average common equity | 9.39 | % | | 5.60 | % | | 10.91 | % | | 3.45 | % |
| Return on average tangible common equity | Return on average tangible common equity | | | 17.17 | | | 0.36 | | Return on average tangible common equity | 13.71 | | | 8.33 | | | 16.08 | | | 5.15 | |
| Return on average total assets | Return on average total assets | | | 1.36 | | | 0.08 | | Return on average total assets | 1.13 | | | 0.70 | | | 1.30 | | | 0.46 | |
| Return on average total tangible assets | Return on average total tangible assets | | | 1.41 | | | 0.09 | | Return on average total tangible assets | 1.17 | | | 0.73 | | | 1.35 | | | 0.48 | |
| Efficiency ratio | Efficiency ratio | | | 61.35 | | | 61.10 | | Efficiency ratio | 60.92 | | | 55.18 | | | 61.30 | | | 57.31 | |
Operating leverage(1) | Operating leverage(1) | | | (0.41) | | | (3.71) | | Operating leverage(1) | (9.64) | | | 7.77 | | | (6.59) | | | 2.95 | |
Net interest margin, FTE(2)(1) | Net interest margin, FTE(2)(1) | | | 2.76 | | | 3.10 | | Net interest margin, FTE(2)(1) | 2.72 | | | 2.83 | | | 2.73 | | | 2.93 | |
| Effective income tax rate | Effective income tax rate | | | 21.76 | | | 24.13 | | Effective income tax rate | 22.35 | | | 16.10 | | | 22.01 | | | 17.27 | |
(1)“Operating leverage” represents the period-over-period percent change in total revenue, less the period-over-period percent change in noninterest expense.
(2) Net interest margin is presented on a FTE basis using the federal statutory tax rate of 21%.
Citizens Financial Group, Inc. | 1013
| | Table 3: Summary of Consolidated Balance Sheet data | | |
| Table 4: Summary of Consolidated Balance Sheet data | | Table 4: Summary of Consolidated Balance Sheet data | |
| (dollars in millions) | (dollars in millions) | March 31, 2021 | | December 31, 2020 | (dollars in millions) | September 30, 2021 | | December 31, 2020 |
| BALANCE SHEET DATA: | BALANCE SHEET DATA: | | | | BALANCE SHEET DATA: | | | |
| Total assets | Total assets | $187,217 | | | $183,349 | | Total assets | $187,007 | | | $183,349 | |
| Loans held for sale, at fair value | Loans held for sale, at fair value | 4,304 | | | 3,564 | | Loans held for sale, at fair value | 3,177 | | | 3,564 | |
| Other loans held for sale | Other loans held for sale | 75 | | | 439 | | Other loans held for sale | 93 | | | 439 | |
| Loans and leases | Loans and leases | 122,195 | | | 123,090 | | Loans and leases | 123,318 | | | 123,090 | |
| Allowance for loan and lease losses | Allowance for loan and lease losses | (2,194) | | | (2,443) | | Allowance for loan and lease losses | (1,855) | | | (2,443) | |
| Total securities | Total securities | 28,138 | | | 26,847 | | Total securities | 28,107 | | | 26,847 | |
| Goodwill | Goodwill | 7,050 | | | 7,050 | | Goodwill | 7,065 | | | 7,050 | |
| Total liabilities | Total liabilities | 164,564 | | | 160,676 | | Total liabilities | 163,584 | | | 160,676 | |
| Total deposits | Total deposits | 151,349 | | | 147,164 | | Total deposits | 152,221 | | | 147,164 | |
| Short-term borrowed funds | Short-term borrowed funds | 70 | | | 243 | | Short-term borrowed funds | 8 | | | 243 | |
| Long-term borrowed funds | Long-term borrowed funds | 8,316 | | | 8,346 | | Long-term borrowed funds | 6,947 | | | 8,346 | |
| Total stockholders’ equity | Total stockholders’ equity | 22,653 | | | 22,673 | | Total stockholders’ equity | 23,423 | | | 22,673 | |
| OTHER BALANCE SHEET DATA: | OTHER BALANCE SHEET DATA: | | OTHER BALANCE SHEET DATA: | |
| Asset Quality Ratios: | Asset Quality Ratios: | | Asset Quality Ratios: | |
| Allowance for loan and lease losses to loans and leases | Allowance for loan and lease losses to loans and leases | 1.80 | % | | 1.98 | % | Allowance for loan and lease losses to loans and leases | 1.50 | % | | 1.98 | % |
| Allowance for credit losses to loans and leases | Allowance for credit losses to loans and leases | 1.94 | | | 2.17 | | Allowance for credit losses to loans and leases | 1.63 | | | 2.17 | |
Allowance for credit losses to loans and leases, excluding the impact of PPP loans(1) | Allowance for credit losses to loans and leases, excluding the impact of PPP loans(1) | 2.03 | | | 2.24 | | Allowance for credit losses to loans and leases, excluding the impact of PPP loans(1) | 1.65 | | | 2.24 | |
| Allowance for loan and lease losses to nonaccruing loans and leases | 218 | | | 240 | | |
| Allowance for credit losses to nonaccruing loans and leases | 235 | | | 262 | | |
| Nonaccruing loans and leases to loans and leases | 0.82 | | | 0.83 | | |
| Allowance for loan and lease losses to nonaccrual loans and leases | | Allowance for loan and lease losses to nonaccrual loans and leases | 248 | | | 240 | |
| Allowance for credit losses to nonaccrual loans and leases | | Allowance for credit losses to nonaccrual loans and leases | 268 | | | 262 | |
| Nonaccrual loans and leases to loans and leases | | Nonaccrual loans and leases to loans and leases | 0.61 | | | 0.83 | |
| Capital Ratios: | Capital Ratios: | | Capital Ratios: | |
| CET1 capital ratio | CET1 capital ratio | 10.1 | % | | 10.0 | % | CET1 capital ratio | 10.3 | % | | 10.0 | % |
| Tier 1 capital ratio | Tier 1 capital ratio | 11.4 | | | 11.3 | | Tier 1 capital ratio | 11.6 | | | 11.3 | |
| Total capital ratio | Total capital ratio | 13.4 | | | 13.4 | | Total capital ratio | 13.4 | | | 13.4 | |
| Tier 1 leverage ratio | Tier 1 leverage ratio | 9.5 | | | 9.4 | | Tier 1 leverage ratio | 9.7 | | | 9.4 | |
(1) For more information on the computation of non-GAAP financial measures, see “—Introduction — Non-GAAP Financial Measures” and “—Non-GAAP Financial Measures and Reconciliations.”
Citizens Financial Group, Inc. | 1114
RESULTS OF OPERATIONS
Net Interest Income
Net interest income is our largest source of revenue and is the difference between the interest earned on interest-earning assets (generally loans, leases and investment securities) and the interest expense incurred in connection with interest-bearing liabilities (generally deposits and borrowed funds). The level of net interest income is primarily a function of the difference between the effective yield on our average interest-earning assets and the effective cost of our interest-bearing liabilities. These factors are influenced by the pricing and mix of interest-earning assets and interest-bearing liabilities which, in turn, are impacted by external factors such as local economic conditions, competition for loans and deposits, the monetary policy of the FRB and market interest rates. For further discussion, refer to “—Market Risk — Non-Trading Risk,” and “—Risk Governance” as described in our 2020 Form 10-K.
The following table presents a five quarter trend of our Net interest margin, FTE and Net interest income:
FirstThird quarter 2021 versus fourthsecond quarter 2020:2021: Net interest income of $1.1 billion was down 1%up 2% given the impact of lowerhigher day count and interest-earning asset growth, with broadly stable net interest margin and loans.margin. Net interest margin on a FTE basis of 2.76% was up 1 basis point, reflecting improving2.72% reflects the benefit of accelerated PPP forgiveness, improved funding mix, and deposit pricing, and a steepening yield curve, largelypartially offset by higher cash balances and lower earning-asset yields. Interest-bearing depositsdeposit costs of 0.20%14 basis points decreased 72 basis points.
Citizens Financial Group, Inc. | 1215
| | Table 4: Major Components of Net Interest Income | | |
| Table 5: Major Components of Net Interest Income, Quarter-to-Date | | Table 5: Major Components of Net Interest Income, Quarter-to-Date | |
| | Three Months Ended March 31, | | | | Three Months Ended September 30, | | |
| 2021 | | 2020 | | Change | 2021 | | 2020 | | Change |
| (dollars in millions) | (dollars in millions) | Average
Balances | Income/
Expense | Yields/
Rates | | Average
Balances | Income/
Expense | Yields/
Rates | | Average
Balances | Yields/
Rates (bps) | (dollars in millions) | Average
Balances | Income/
Expense | Yields/
Rates | | Average
Balances | Income/
Expense | Yields/
Rates | | Average
Balances | Yields/
Rates (bps) |
| Assets: | | | | | | |
| Assets | | Assets | | | | | |
| Interest-bearing cash and due from banks and deposits in banks | Interest-bearing cash and due from banks and deposits in banks | $10,861 | | $3 | | 0.11 | % | | $1,859 | | $5 | | 1.12 | % | | $9,002 | | (101) bps | Interest-bearing cash and due from banks and deposits in banks | $13,749 | | $6 | | 0.16 | % | | $6,250 | | $2 | | 0.10 | % | | $7,499 | | 6 bps |
| Taxable investment securities | Taxable investment securities | 27,031 | | 128 | | 1.89 | | | 25,339 | | 147 | | 2.32 | | | 1,692 | | (43) | Taxable investment securities | 27,466 | | 116 | | 1.69 | | | 24,654 | | 121 | | 1.95 | | | 2,812 | | (26) |
| Non-taxable investment securities | Non-taxable investment securities | 3 | | — | | 2.60 | | | 4 | | — | | 2.60 | | | (1) | | — | Non-taxable investment securities | 2 | | — | | 2.60 | | | 4 | | — | | 2.60 | | | (2) | | — |
| Total investment securities | Total investment securities | 27,034 | | 128 | | 1.89 | | | 25,343 | | 147 | | 2.32 | | | 1,691 | | (43) | Total investment securities | 27,468 | | 116 | | 1.69 | | | 24,658 | | 121 | | 1.95 | | | 2,810 | | (26) |
| Commercial and industrial | Commercial and industrial | 44,287 | | 347 | | 3.12 | | | 43,152 | | 417 | | 3.82 | | | 1,135 | | (70) | Commercial and industrial | 42,330 | | 362 | | 3.36 | | | 46,844 | | 383 | | 3.20 | | | (4,514) | | 16 |
| Commercial real estate | Commercial real estate | 14,675 | | 94 | | 2.57 | | | 13,876 | | 139 | | 3.96 | | | 799 | | (139) | Commercial real estate | 14,656 | | 96 | | 2.56 | | | 14,644 | | 96 | | 2.57 | | | 12 | | (1) |
| Leases | Leases | 1,915 | | 13 | | 2.69 | | | 2,482 | | 18 | | 2.83 | | | (567) | | (14) | Leases | 1,695 | | 12 | | 2.72 | | | 2,373 | | 16 | | 2.65 | | | (678) | | 7 |
| Total commercial loans and leases | Total commercial loans and leases | 60,877 | | 454 | | 2.98 | | | 59,510 | | 574 | | 3.81 | | | 1,367 | | (83) | Total commercial loans and leases | 58,681 | | 470 | | 3.14 | | | 63,861 | | 495 | | 3.03 | | | (5,180) | | 11 |
| Residential mortgages | Residential mortgages | 19,388 | | 148 | | 3.05 | | | 18,866 | | 164 | | 3.47 | | | 522 | | (42) | Residential mortgages | 20,834 | | 157 | | 3.01 | | | 19,427 | | 153 | | 3.15 | | | 1,407 | | (14) |
| Home equity | Home equity | 12,001 | | 95 | | 3.20 | | | 13,042 | | 152 | | 4.69 | | | (1,041) | | (149) | Home equity | 11,829 | | 92 | | 3.08 | | | 12,416 | | 100 | | 3.21 | | | (587) | | (13) |
| Automobile | Automobile | 12,229 | | 125 | | 4.14 | | | 12,173 | | 131 | | 4.34 | | | 56 | | (20) | Automobile | 13,136 | | 126 | | 3.83 | | | 12,019 | | 128 | | 4.23 | | | 1,117 | | (40) |
| Education | Education | 12,436 | | 134 | | 4.38 | | | 10,610 | | 149 | | 5.64 | | | 1,826 | | (126) | Education | 12,707 | | 134 | | 4.19 | | | 10,929 | | 130 | | 4.74 | | | 1,778 | | (55) |
| | Other retail | Other retail | 5,916 | | 105 | | 7.25 | | | 6,854 | | 132 | | 7.77 | | | (938) | | (52) | Other retail | 5,454 | | 99 | | 7.15 | | | 6,260 | | 114 | | 7.22 | | | (806) | | (7) |
| Total retail loans | Total retail loans | 61,970 | | 607 | | 3.96 | | | 61,545 | | 728 | | 4.75 | | | 425 | | (79) | Total retail loans | 63,960 | | 608 | | 3.78 | | | 61,051 | | 625 | | 4.08 | | | 2,909 | | (30) |
| Total loans and leases | Total loans and leases | 122,847 | | 1,061 | | 3.47 | | | 121,055 | | 1,302 | | 4.29 | | | 1,792 | | (82) | Total loans and leases | 122,641 | | 1,078 | | 3.47 | | | 124,912 | | 1,120 | | 3.54 | | | (2,271) | | (7) |
| Loans held for sale, at fair value | Loans held for sale, at fair value | 3,254 | | 18 | | 2.27 | | | 1,890 | | 15 | | 3.28 | | | 1,364 | | (101) | Loans held for sale, at fair value | 3,299 | | 21 | | 2.51 | | | 3,295 | | 21 | | 2.60 | | | 4 | | (9) |
| Other loans held for sale | Other loans held for sale | 385 | | 6 | | 6.30 | | | 799 | | 9 | | 4.31 | | | (414) | | 199 | Other loans held for sale | 112 | | 1 | | 3.98 | | | 1,061 | | 16 | | 6.02 | | | (949) | | (204) |
| Interest-earning assets | Interest-earning assets | 164,381 | | 1,216 | | 2.97 | | | 150,946 | | 1,478 | | 3.91 | | | 13,435 | | (94) | Interest-earning assets | 167,269 | | 1,222 | | 2.89 | | | 160,176 | | 1,280 | | 3.15 | | | 7,093 | | (26) |
| Allowance for loan and lease losses | (2,439) | | | (1,708) | | | (731) | | | |
| Goodwill | 7,050 | | | 7,046 | | | 4 | | | |
| Other noninterest-earning assets | 13,577 | | | 10,893 | | | 2,684 | | | |
| | Noninterest-earning assets | | Noninterest-earning assets | 18,839 | | | 17,499 | | | 1,340 | | |
| Total assets | Total assets | $182,569 | | | $167,177 | | | $15,392 | | | Total assets | $186,108 | | | $177,675 | | | $8,433 | | |
| Liabilities and Stockholders’ Equity: | | | | | | | |
| Liabilities and Stockholders’ Equity | | Liabilities and Stockholders’ Equity | | | | | | |
| Checking with interest | Checking with interest | $26,116 | | $6 | | 0.09 | % | | $24,612 | | $37 | | 0.60 | % | | $1,504 | | (51) | Checking with interest | $27,965 | | $7 | | 0.09 | % | | $26,638 | | $8 | | 0.13 | % | | $1,327 | | (4) |
| Money market accounts | Money market accounts | 49,536 | | 22 | | 0.18 | | | 39,839 | | 93 | | 0.94 | | | 9,697 | | (76) | Money market accounts | 49,159 | | 18 | | 0.14 | | | 45,187 | | 33 | | 0.28 | | | 3,972 | | (14) |
| Regular savings | Regular savings | 18,611 | | 5 | | 0.11 | | | 14,201 | | 18 | | 0.51 | | | 4,410 | | (40) | Regular savings | 20,803 | | 5 | | 0.09 | | | 16,902 | | 10 | | 0.24 | | | 3,901 | | (15) |
| Term deposits | Term deposits | 8,572 | | 17 | | 0.83 | | | 18,616 | | 79 | | 1.70 | | | (10,044) | | (87) | Term deposits | 6,071 | | 5 | | 0.43 | | | 12,032 | | 38 | | 1.25 | | | (5,961) | | (82) |
| Total interest-bearing deposits | Total interest-bearing deposits | 102,835 | | 50 | | 0.20 | | | 97,268 | | 227 | | 0.94 | | | 5,567 | | (74) | Total interest-bearing deposits | 103,998 | | 35 | | 0.14 | | | 100,759 | | 89 | | 0.35 | | | 3,239 | | (21) |
| | Short-term borrowed funds | Short-term borrowed funds | 150 | | — | | 0.46 | | | 644 | | 1 | | 0.76 | | | (494) | | (30) | Short-term borrowed funds | 23 | | — | | 2.06 | | | 240 | | — | | 0.13 | | | (217) | | 193 |
| Long-term borrowed funds | Long-term borrowed funds | 8,336 | | 49 | | 2.35 | | | 14,057 | | 90 | | 2.56 | | | (5,721) | | (21) | Long-term borrowed funds | 6,956 | | 42 | | 2.38 | | | 9,196 | | 54 | | 2.35 | | | (2,240) | | 3 |
| Total borrowed funds | Total borrowed funds | 8,486 | | 49 | | 2.32 | | | 14,701 | | 91 | | 2.48 | | | (6,215) | | (16) | Total borrowed funds | 6,979 | | 42 | | 2.38 | | | 9,436 | | 54 | | 2.30 | | | (2,457) | | 8 |
| Total interest-bearing liabilities | Total interest-bearing liabilities | 111,321 | | 99 | | 0.36 | | | 111,969 | | 318 | | 1.14 | | | (648) | | (78) | Total interest-bearing liabilities | 110,977 | | 77 | | 0.28 | | | 110,195 | | 143 | | 0.52 | | | 782 | | (24) |
| Demand deposits | Demand deposits | 43,814 | | | 29,362 | | | 14,452 | | | Demand deposits | 47,873 | | | 40,608 | | | 7,265 | | |
| Other liabilities | Other liabilities | 4,858 | | | 4,053 | | | 805 | | | Other liabilities | 3,904 | | | 4,374 | | | (470) | | |
| Total liabilities | Total liabilities | 159,993 | | | 145,384 | | | 14,609 | | | Total liabilities | 162,754 | | | 155,177 | | | 7,577 | | |
| Stockholders’ equity | Stockholders’ equity | 22,576 | | | 21,793 | | | 783 | | | Stockholders’ equity | 23,354 | | | 22,498 | | | 856 | | |
| Total liabilities and stockholders’ equity | Total liabilities and stockholders’ equity | $182,569 | | | $167,177 | | | $15,392 | | | Total liabilities and stockholders’ equity | $186,108 | | | $177,675 | | | $8,433 | | |
| Interest rate spread | Interest rate spread | | | 2.62 | % | | | | 2.77 | % | | | (15) | Interest rate spread | | | 2.61 | % | | | | 2.63 | % | | | (2) |
| Net interest income and net interest margin | Net interest income and net interest margin | | $1,117 | | 2.75 | % | | $1,160 | | 3.09 | % | | (34) | Net interest income and net interest margin | | $1,145 | | 2.72 | % | | $1,137 | | 2.82 | % | | (10) |
Net interest income and net interest margin, FTE(1) | Net interest income and net interest margin, FTE(1) | | $1,120 | | 2.76 | % | | $1,164 | | 3.10 | % | | (34) | Net interest income and net interest margin, FTE(1) | | $1,147 | | 2.72 | % | | $1,140 | | 2.83 | % | | (11) |
| Memo: Total deposits (interest-bearing and demand) | Memo: Total deposits (interest-bearing and demand) | $146,649 | | $50 | | 0.14 | % | | $126,630 | | $227 | | 0.72 | % | | $20,019 | | (58) bps | Memo: Total deposits (interest-bearing and demand) | $151,871 | | $35 | | 0.09 | % | | $141,367 | | $89 | | 0.25 | % | | $10,504 | | (16) bps |
|
(1) Net interest income and net interest margin is presented on a FTE basis using the federal statutory tax rate of 21%. The FTE impact is predominantly attributable to commercial and industrial loans for the periods presented.
Third quarter 2021 vs third quarter 2020:Net interest income of $1.1 billion increased 1% from the third quarter of 2020 reflecting 4% growth in interest-earning assets, largely offset by lower net interest margin.
Net interest margin on a FTE basis of 2.72% decreased 11 basis points compared to 2.83% in the third quarter of 2020, primarily reflecting the impact of elevated cash balances and the lower rate environment, partially offset by an improved funding mix, deposit pricing, and the benefit of accelerated PPP loan forgiveness. Interest-bearing deposit costs decreased 21 basis points. Average interest-earning asset yields of 2.89% decreased 26 basis points from 3.15% in the third quarter of 2020, while average interest-bearing liability costs of 0.28% decreased 24 basis points from 0.52% in the third quarter of 2020.
Average interest-earning assets of $167.3 billion increased $7.1 billion, or 4%, from the third quarter of 2020, as elevated liquidity drove a $7.5 billion increase in cash held in interest-bearing deposits, and a $2.8 billion increase in investments. Loans and loans held for sale decreased $3.2 billion, or 2%, with a $5.2 billion decrease in average commercial reflecting line of credit repayments and net payoffs and a 1.9 billion decrease in
Citizens Financial Group, Inc. | 16
PPP loans. Retail loans increased $2.9 billion driven by growth in education, residential mortgage, and automobile, partially offset by planned run-off of personal unsecured installment loans and a decrease in home equity. Loans held for sale decreased $945 million, driven by education.
Average deposits of $151.9 billion increased $10.5 billion, or 7%, from the third quarter of 2020, reflecting an increase in demand deposits, money market accounts, savings and checking with interest, partially offset by a decrease in term deposits. Average total borrowed funds of $7.0 billion decreased $2.5 billion from the third quarter of 2020, as strong customer deposit inflows enabled the pay down of senior debt and short-term borrowings. Total borrowed funds costs of $42 million decreased $12 million from the third quarter of 2020. The total borrowed funds cost of 2.38% increased 8 basis points from 2.30% in the third quarter of 2020.
| | | | | | | | | | | | | | | | | | | | | | | | | | | | | | | | |
| Table 6: Major Components of Net Interest Income, Year-to-Date | | | | | |
| Nine Months Ended September 30, | | |
| 2021 | | 2020 | | Change |
| (dollars in millions) | Average
Balances | Income/
Expense | Yields/
Rates | | Average
Balances | Income/
Expense | Yields/
Rates | | Average
Balances | Yields/
Rates (bps) |
| Assets: | | | | | | | | | | |
| Interest-bearing cash and due from banks and deposits in banks | $11,967 | | $12 | | 0.13 | % | | $4,453 | | $8 | | 0.24 | % | | $7,514 | | (11) bps |
| Taxable investment securities | 27,366 | | 368 | | 1.79 | | | 25,056 | | 398 | | 2.12 | | | 2,310 | | (33) |
| Non-taxable investment securities | 3 | | — | | 2.60 | | | 4 | | — | | 2.60 | | | (1) | | — |
| Total investment securities | 27,369 | | 368 | | 1.79 | | | 25,060 | | 398 | | 2.12 | | | 2,309 | | (33) |
| Commercial and industrial | 43,661 | | 1,054 | | 3.19 | | | 46,813 | | 1,212 | | 3.40 | | | (3,152) | | (21) |
| Commercial real estate | 14,601 | | 285 | | 2.57 | | | 14,354 | | 341 | | 3.12 | | | 247 | | (55) |
| Leases | 1,800 | | 37 | | 2.73 | | | 2,427 | | 50 | | 2.74 | | | (627) | | (1) |
| Total commercial loans and leases | 60,062 | | 1,376 | | 3.02 | | | 63,594 | | 1,603 | | 3.31 | | | (3,532) | | (29) |
| Residential mortgages | 20,160 | | 459 | | 3.03 | | | 19,056 | | 467 | | 3.27 | | | 1,104 | | (24) |
| Home equity | 11,884 | | 279 | | 3.14 | | | 12,730 | | 363 | | 3.81 | | | (846) | | (67) |
| Automobile | 12,634 | | 376 | | 3.98 | | | 12,063 | | 388 | | 4.30 | | | 571 | | (32) |
| Education | 12,593 | | 403 | | 4.28 | | | 10,908 | | 424 | | 5.19 | | | 1,685 | | (91) |
| | | | | | | | | | |
| | | | | | | | | | |
| Other retail | 5,659 | | 304 | | 7.18 | | | 6,556 | | 369 | | 7.51 | | | (897) | | (33) |
| Total retail loans | 62,930 | | 1,821 | | 3.87 | | | 61,313 | | 2,011 | | 4.38 | | | 1,617 | | (51) |
| Total loans and leases | 122,992 | | 3,197 | | 3.45 | | | 124,907 | | 3,614 | | 3.84 | | | (1,915) | | (39) |
| Loans held for sale, at fair value | 3,435 | | 63 | | 2.45 | | | 2,635 | | 56 | | 2.85 | | | 800 | | (40) |
| Other loans held for sale | 242 | | 9 | | 4.88 | | | 791 | | 32 | | 5.32 | | | (549) | | (44) |
| Interest-earning assets | 166,005 | | 3,649 | | 2.92 | | | 157,846 | | 4,108 | | 3.45 | | | 8,159 | | (53) |
| | | | | | | | | | |
| | | | | | | | | | |
| | | | | | | | | | |
| Noninterest-earning assets | 18,386 | | | | | 17,046 | | | | | 1,340 | | |
| Total assets | $184,391 | | | | | $174,892 | | | | | $9,499 | | |
| Liabilities and Stockholders’ Equity: | | | | | | | | | | |
| Checking with interest | $27,126 | | $18 | | 0.09 | % | | $25,857 | | $56 | | 0.29 | % | | $1,269 | | (20) |
| Money market accounts | 49,362 | | 61 | | 0.16 | | | 43,411 | | 165 | | 0.51 | | | 5,951 | | (35) |
| Regular savings | 19,839 | | 15 | | 0.10 | | | 15,667 | | 43 | | 0.37 | | | 4,172 | | (27) |
| Term deposits | 7,195 | | 33 | | 0.64 | | | 15,692 | | 176 | | 1.49 | | | (8,497) | | (85) |
| Total interest-bearing deposits | 103,522 | | 127 | | 0.16 | | | 100,627 | | 440 | | 0.58 | | | 2,895 | | (42) |
| | | | | | | | | | |
| | | | | | | | | | |
| Short-term borrowed funds | 80 | | — | | 0.74 | | | 368 | | 1 | | 0.53 | | | (288) | | 21 |
| Long-term borrowed funds | 7,570 | | 136 | | 2.38 | | | 11,660 | | 210 | | 2.39 | | | (4,090) | | (1) |
| Total borrowed funds | 7,650 | | 136 | | 2.36 | | | 12,028 | | 211 | | 2.33 | | | (4,378) | | 3 |
| Total interest-bearing liabilities | 111,172 | | 263 | | 0.32 | | | 112,655 | | 651 | | 0.77 | | | (1,483) | | (45) |
| Demand deposits | 46,120 | | | | | 35,922 | | | | | 10,198 | | |
| Other liabilities | 4,166 | | | | | 4,172 | | | | | (6) | | |
| Total liabilities | 161,458 | | | | | 152,749 | | | | | 8,709 | | |
| Stockholders’ equity | 22,933 | | | | | 22,143 | | | | | 790 | | |
| Total liabilities and stockholders’ equity | $184,391 | | | | | $174,892 | | | | | $9,499 | | |
| Interest rate spread | | | 2.61 | % | | | | 2.68 | % | | | (7) |
| Net interest income and net interest margin | | $3,386 | | 2.73 | % | | | $3,457 | | 2.93 | % | | | (20) |
Net interest income and net interest margin, FTE(1) | | $3,393 | | 2.73 | % | | | $3,467 | | 2.93 | % | | | (20) |
| Memo: Total deposits (interest-bearing and demand) | $149,642 | | $127 | | 0.11 | % | | $136,549 | | $440 | | 0.43 | % | | $13,093 | | (32) bps |
| | | | | | | | | | |
| | | | | | | | | | |
| | | | | | | | | | |
| | | | | | | | | | |
(1) Net interest income and net interest margin is presented on a FTE basis using the federal statutory tax rate of 21%. The FTE impact is predominantly attributable to commercial and industrial loans for the periods presented.
First quarternine months 2021 versus first quarternine months 2020: Net interest income of $1.1$3.4 billion decreased 4%2% from the first quarternine months of 2020, with 9%reflecting 5% growth in interest-earning assets, including the addition of PPP loans, which was more thanlargely offset by lower net interest margin.
Citizens Financial Group, Inc. | 17
Net interest margin on a FTE basis of 2.76%2.73% decreased 3420 basis points compared to 3.10%2.93% in the first quarternine months of 2020, primarily reflecting the impact of a lower rate environment, lower interest-earning asset yields, and elevated cash balances (16 basis points) given strong deposit flows, partially offset by the benefit of accelerated PPP loan forgiveness, improved funding mix, and deposit pricing. Average interest-earning asset yields of 2.97%2.92% decreased 9453 basis points from 3.91%3.45% in the first quarternine months of 2020, while average interest-bearing liability costs of 0.36%0.32% decreased 7845 basis points from 1.14%0.77% in the first quarternine months of 2020.
Citizens Financial Group, Inc. | 13
Average interest-earning assets of $164.4$166.0 billion increased $13.4$8.2 billion, or 9%5%, from the first quarternine months of 2020, as increasedelevated liquidity allowed for a $6.2 billion, or 42%, decrease in borrowed funds, and drove a $9.0$7.5 billion increase in cash held in interest-bearing deposits and a $1.7$2.3 billion, or 7%9%, increase in investments. Results also reflected a $2.7$1.7 billion, or 2%1%, increasedecrease in average loans and leases and LHFS with a $1.4$3.5 billion increasedecrease in average commercial loans and leases driven by $4.8 billion of PPP loans, largelyreflecting payoffs, partially offset by line of credit repayments and net payoffs.a $1.3 billion increase in PPP loans. Furthermore, average retail loans increased $425 million,$1.6 billion, driven by growth in education, and residential mortgage, and automobile, partially offset by decreases in home equity and other retail given run offrun-off of personal unsecured installment loans. Loans held for sale increased $251 million, reflecting mortgage originations.
Average deposits of $146.6$149.6 billion increased $20.0$13.1 billion, or 16%10%, from the first quarternine months of 2020, reflecting growth in demand deposits, money market accounts, savings, and checking with interest, partially offset by a decline in term deposits. Average total borrowed funds of $8.5$7.7 billion decreased $6.2$4.4 billion from the first quarternine months of 2020, as strong customer deposit inflows allowed for significantly lower levels of FHLB advances. Results also reflectgiven the paydownpay down of senior debt and short-term borrowings. Total borrowed funds costs of $49$136 million decreased $42$75 million from the first quarternine months of 2020. The total borrowed funds cost of 2.32% decreased 162.36% increased 3 basis points from 2.48%2.33% in the first quarternine months of 2020.
Citizens Financial Group, Inc. | 18
Noninterest Income
The following table presents a five quarter trend of our noninterest income:
FirstThird quarter 2021 versus fourthsecond quarter 2020:2021: Noninterest income of $542$514 million was downincreased $29 million, or 6%, reflecting lowerfrom the second quarter of 2021. Results reflect higher mortgage banking fees, capital markets fees, foreign exchange and interest rate products and service charges and fees. These decreases werefees, card fees and other income, partially offset by improved trust and investment serviceslower capital markets fees.
•Mortgage banking fees increased driven by strong origination levels, the benefit of lower agency fees and net securities gains.improved MSR hedge results.
| | | | | | | | | | | | | | | | | | | | | | | | | | | | | | | |
| Table 5: Noninterest Income | | | | | | | | | | | | | | | |
| | | | | | | Three Months Ended March 31, | | | | |
| (in millions) | | | | | | | | | 2021 | | 2020 | | Change | | Percent |
| Mortgage banking fees | | | | | | | | | $165 | | | $159 | | | $6 | | | 4 | % |
| Service charges and fees | | | | | | | | | 99 | | | 118 | | | (19) | | | (16 | %) |
| Capital markets fees | | | | | | | | | 81 | | | 43 | | | 38 | | | 88 | |
| Card fees | | | | | | | | | 55 | | | 56 | | | (1) | | | (2) | |
| Trust and investment services fees | | | | | | | | | 58 | | | 53 | | | 5 | | | 9 | |
| Letter of credit and loan fees | | | | | | | | | 38 | | | 34 | | | 4 | | | 12 | |
| Foreign exchange and interest rate products | | | | | | | | | 28 | | | 24 | | | 4 | | | 17 | |
| Securities gains, net | | | | | | | | | 3 | | | — | | | 3 | | | 100 | |
Other income (1) | | | | | | | | | 15 | | | 10 | | | 5 | | | 50 | |
| Noninterest income | | | | | | | | | $542 | | | $497 | | | $45 | | | 9 | % |
•Other income increased reflecting the benefit of higher community development-related income and a seasonal improvement in tax-advantaged investments.
•Capital markets fees declined from record levels reflecting seasonally lower activity, primarily in syndication fees, partially offset by higher merger and acquisition advisory fees.
| | | | | | | | | | | | | | | | | | | | | | | | | | | | | | | | | | | | | | | | | | | | | | | |
| Table 7: Noninterest Income | | | | | | | | | | | | | | | |
| Three Months Ended September 30, | | | | | | Nine Months Ended September 30, | | | | |
| (in millions) | 2021 | | 2020 | | Change | | Percent | | 2021 | | 2020 | | Change | | Percent |
| Mortgage banking fees | $108 | | | $287 | | | ($179) | | | (62 | %) | | $358 | | | $722 | | | ($364) | | | (50 | %) |
| Service charges and fees | 110 | | | 97 | | | 13 | | | 13 | | | 309 | | | 299 | | | 10 | | | 3 | |
| Capital markets fees | 72 | | | 58 | | | 14 | | | 24 | | | 244 | | | 162 | | | 82 | | | 51 | |
| Card fees | 66 | | | 57 | | | 9 | | | 16 | | | 185 | | | 161 | | | 24 | | | 15 | |
| Trust and investment services fees | 61 | | | 53 | | | 8 | | | 15 | | | 179 | | | 151 | | | 28 | | | 19 | |
| Letter of credit and loan fees | 39 | | | 37 | | | 2 | | | 5 | | | 115 | | | 102 | | | 13 | | | 13 | |
| Foreign exchange and interest rate products | 29 | | | 27 | | | 2 | | | 7 | | | 85 | | | 85 | | | — | | | — | |
| Securities gains, net | 3 | | | 1 | | | 2 | | | 200 | | | 9 | | | 4 | | | 5 | | | 125 | |
Other income(1) | 26 | | | 37 | | | (11) | | | (30) | | | 57 | | | 55 | | | 2 | | | 4 | |
| Noninterest income | $514 | | | $654 | | | ($140) | | | (21 | %) | | $1,541 | | | $1,741 | | | ($200) | | | (11 | %) |
(1) Includes bank-owned life insurance income and other miscellaneous income for all periods presented.
FirstThird quarter 2021 versus firstthird quarter 2020: Noninterest income increased $45decreased $140 million, or 9%21%, from the firstthird quarter of 2020. Results reflected strong capital markets fees, growth inreflect lower mortgage banking fees and other income, partially offset by higher capital markets, service charges, card and trust and investment services fees.
•Mortgage banking fees decreased driven by lower gain-on-sale margins and production volumes.
•Capital markets fees increased driven by loan syndication and merger and acquisition advisory fees.
•Service charges and fees increased reflecting recovery from COVID-19 impacts.
•Card fees increased reflecting higher debit and credit card volumes given economic recovery.
Citizens Financial Group, Inc. | 1419
higher trust and investment services fees, offset by lower service charges and fees. Capital markets fees increased from•Other income decreased largely tied to a gain on the firstsale of education loans in the third quarter of 2020 driven by higher underwriting revenue and mergers and acquisitions advisory fees, as well as the impact of a mark-to-market loss on loan trading assets in the first quarter of 2020. Mortgage banking fees reflected higher production volumes and favorable MSR hedging results, partially offset by lower servicing income given higher amortization expense.
•Trust and investment services fees increased reflectingdriven by an increase in assets under management from strong net inflows and higher equity market levels. Servicelevels and strong inflows.
First nine months 2021 versus first nine months 2020: Noninterest income decreased $200 million, or 11%, from the first nine months of 2020. Results reflect lower mortgage banking fees partially offset by improved capital markets, trust and investment services, letter of credit and loan, card and service charges and fees.
•Mortgage banking fees decreased reflecting increased industry capacity and heightened competition resulting in lower gain-on-sale margins and production volumes.
•Capital markets fees increased driven by loan syndication, underwriting, and merger and acquisition advisory fees.
•Trust and investment services fees increased driven by an increase in assets under management from higher equity market levels and strong inflows.
•Letter of credit and loan fees increased reflecting higher commitment fees.
•Card fees and service charges and fees decreased from the first quarter of 2020 as a result of COVID-19 impacts on overdraft fees.increased largely tied to economic recovery.
Noninterest Expense
The following table presents a five quarter trend of our noninterest expense:
FirstThird quarter 2021 versus fourthsecond quarter 2020:2021: Noninterest expense of $1.0 billion, or $988 million on an Underlying basis, was broadly stableup slightly reflecting strong expense discipline and included the impactbenefit of notable items.efficiency initiatives.
| | | | | | | | | | | | | | | | | | | | | | | | | | | | | | | | | | | | | | | | | | | | | | | |
| Table 8: Noninterest Expense | | | | | | | | | | | | | | | |
| Three Months Ended September 30, | | | | | | Nine Months Ended September 30, | | | | |
| (in millions) | 2021 | | 2020 | | Change | | Percent | | 2021 | | 2020 | | Change | | Percent |
| Salaries and employee benefits | $509 | | | $524 | | | ($15) | | | (3 | %) | | $1,581 | | | $1,586 | | | ($5) | | | — | % |
| Equipment and software | 157 | | | 149 | | | 8 | | | 5 | | | 464 | | | 424 | | | 40 | | | 9 | |
| Outside services | 144 | | | 139 | | | 5 | | | 4 | | | 420 | | | 405 | | | 15 | | | 4 | |
| Occupancy | 77 | | | 81 | | | (4) | | | (5) | | | 247 | | | 247 | | | — | | | — | |
| Other operating expense | 124 | | | 95 | | | 29 | | | 31 | | | 308 | | | 317 | | | (9) | | | (3) | |
| Noninterest expense | $1,011 | | | $988 | | | $23 | | | 2 | % | | $3,020 | | | $2,979 | | | $41 | | | 1 | % |
Third quarter 2021 versus third quarter 2020: Noninterest expense increased$23 million, or 2%, compared to the third quarter of 2020 and remains well-controlled. Salaries and employee benefits were lower as a result of a compensation-related credit associated with the CARES Act. Other operating expenses increased reflecting a pension settlement charge. On an Underlying basis, noninterest expense of $998$988 million was up 3%, reflecting seasonally higher salaries and employee benefits. These increases were partially offset by lower other operating expense which reflected lower advertising costs.
| | | | | | | | | | | | | | | | | | | | | | | | | | | | | | | |
| Table 6: Noninterest Expense | | | | | | | | | | | | | | | |
| | | | | | | Three Months Ended March 31, | | | | |
| (in millions) | | | | | | | | | 2021 | | 2020 | | Change | | Percent |
| Salaries and employee benefits | | | | | | | | | $548 | | | $549 | | | ($1) | | | 0 | % |
| Equipment and software | | | | | | | | | 152 | | | 133 | | | 19 | | | 14 | |
| Outside services | | | | | | | | | 139 | | | 135 | | | 4 | | | 3 | |
| Occupancy | | | | | | | | | 88 | | | 84 | | | 4 | | | 5 | |
| Other operating expense | | | | | | | | | 91 | | | 111 | | | (20) | | | (18) | |
| Noninterest expense | | | | | | | | | $1,018 | | | $1,012 | | | $6 | | | 1 | % |
First quarter 2021 versus first quarter 2020: Noninterest expense increased $6$31 million, or 1%3%, from the first quarter of 2020, largely reflecting higher equipment and software driven by increased technology spend as well as higher outside services tiedcompared to growth initiatives. These results were partially offset by a decrease in other operating expense related mainly to lower travel and advertising costs. Underlying noninterest expense of $998$957 million increased $19 million, or 2%, as a result of the items stated above as well asgiven higher salaries and employee benefits, tied to higheroutside services and other operating expense.
•Higher salaries and employee benefits reflect revenue-based compensation.compensation and merit increases.
Citizens Financial Group, Inc. | 1520
•Outside services increased largely tied to growth initiatives.
•Other operating expense increased reflecting higher travel and advertising costs.
First nine months 2021 versus first nine months 2020: Noninterest expense increased $41 million, or 1%, and was stable with the first nine months of 2020. On an Underlying basis, noninterest expense of $3.0 billion increased $70 million, or 2%, given higher salaries and employee benefits and outside services due to the reasons stated above and higher equipment and software expense. These increases were partially offset by a decline in other operating expense.
•Equipment and software expense increased reflecting higher technology spend.
•Other operating expense decreased reflecting lower travel and advertising costs.
Provision for Credit Losses
The following table presents a five quarter trend of our provision for credit losses, net charge-offs and net charge-off ratio:
The provision for credit losses is the result of a detailed analysis performed to estimate our ACL. The total provision for credit losses includes the provision for loan and lease losses and the provision for unfunded commitments. Refer to “—Analysis of Financial Condition — Allowance for Credit Losses and NonaccruingNonaccrual Loans and Leases” for more information.
FirstThird quarter 2021 versus fourthsecond quarter 2020:2021: In the firstthird quarter of 2021, strong credit performance across the retail and commercial loan portfolios and improvement in the macroeconomic outlook resulted in a negativecredit provision for credit lossesbenefit of $140$33 million. This compared to a credit provision benefit of $124$213 million in the fourthsecond quarter of 2021.
Third quarter 2021 versus third quarter 2020: The credit provision benefit was $33 million in the third quarter of 2021, compared with a $428 million credit provision expense in the third quarter of 2020. The credit provision expense in 2020 reflects the adverse impacts from the COVID-19 pandemic and associated lockdowns, while the credit provision benefit in 2021 reflects strong credit performance and improving macroeconomic outlook.
First quarternine months 2021 versus first quarternine months 2020: As described above, the negativeThe credit provision for credit lossesbenefit was $140$386 million in the first quarternine months of 2021. This compared to a credit provision for credit lossesexpense of $600 million$1.5 billion in the first quarternine months of 2020, which reflected the adverse impacts from the COVID-19 pandemic and associated lockdowns.
Citizens Financial Group, Inc. | 1621
Income Tax Expense
The following table presents a five quarter trend of our income tax expense and effective income tax rate:
FirstThird quarter 2021 versus firstthird quarter 2020:Income tax expense increased $159$90 million from the firstthird quarter of 2020 due to increased taxable income. The effective income tax rate increased to 22.4% from 16.1% in the third quarter of 2020, driven by the decreased benefit of tax advantaged investments on higher pre-tax income.
First nine months 2021 versus first nine months 2020: Income tax expense for the first nine months of 2021 was $504 million compared to 21.8% from 24.1%$126 million in the first quarternine months of 2020. TheIncome tax expense increased $378 million from the first quarternine months of 2020 rate was elevated due to increased taxable income. The effective income tax rate increased to 22.0% from 17.3% in the negativefirst nine months of 2020 driven by the decreased benefit of tax impact of stock-based compensationadvantaged investment on lowerhigher pre-tax income.
Business Operating Segments
We have two business operating segments: Consumer Banking and Commercial Banking. Segment results are derived by specifically attributing managed assets, liabilities, capital and related revenues, provision for credit losses, which, at the segment level, is equal to net charge-offs, and other expenses. Non-segment operations are classified as Other, which includes corporate functions, the Treasury function, the securities portfolio, wholesale funding activities, intangible assets not directly allocated to a business operating segment, community development, non-core assets and other unallocated assets, liabilities, capital, revenues, provision for credit losses, expenses and income tax expense.expense not attributed to our Consumer or Commercial Banking segments as well as treasury and community development. In addition, Other includes goodwill not directly allocated to a business operating segment and any associated goodwill impairment charges. For impairment testing purposes, we allocate all goodwill to our Consumer Banking and/or Commercial Banking reporting units. There have been no significant changes in our methodologies used to allocate items to our business operating segments as described in “—Results of Operations — Business Operating Segments” in our 2020 Form 10-K.
Citizens Financial Group, Inc. | 22
The following table presents certain financial data of our business operating segments. Total business operating segment financial results differ from total consolidated financial results. These differences are reflected in Other non-segment operations. See Note 16 in Item 1 for further information.
| | | | | | | | | | | | | | | | | | | | | | | |
| Table 9: Selected Financial Data for Business Operating Segments, Quarter-to-Date | | |
| Consumer Banking | | Commercial Banking |
| Three Months Ended September 30, | | Three Months Ended September 30, |
| (dollars in millions) | 2021 | | 2020 | | 2021 | | 2020 |
| Net interest income | $919 | | | $845 | | | $428 | | | $421 | |
| Noninterest income | 315 | | | 495 | | | 168 | | | 144 | |
| Total revenue | 1,234 | | | 1,340 | | | 596 | | | 565 | |
| Noninterest expense | 749 | | | 742 | | | 226 | | | 210 | |
| Profit before credit losses | 485 | | | 598 | | | 370 | | | 355 | |
| Net charge-offs | 35 | | | 55 | | | 15 | | | 161 | |
| Income before income tax expense | 450 | | | 543 | | | 355 | | | 194 | |
| Income tax expense | 114 | | | 136 | | | 81 | | | 41 | |
| Net income | $336 | | | $407 | | | $274 | | | $153 | |
| Average Balances: | | | | | | | |
| Total assets | $75,070 | | | $73,605 | | | $56,702 | | | $60,889 | |
Total loans and leases(1)(2) | 70,984 | | | 69,719 | | | 53,815 | | | 57,796 | |
| Deposits | 100,968 | | | 94,212 | | | 45,465 | | | 41,393 | |
| Interest-earning assets | 71,879 | | | 69,925 | | | 54,177 | | | 58,177 | |
(1)Includes LHFS.
(2) The majority of PPP loans are reflected in Consumer Banking in accordance with how they are managed.
Consumer Banking
Net interest income increased $74 million, or 9%, from the third quarter of 2020, reflecting the benefit of accelerated PPP loan forgiveness and a $1.3 billion increase in average loans led by education, residential mortgage, and automobile, partially offset by a decline in other retail consistent with planned run-off of personal unsecured installment loans. In addition, higher deposit volumes, reflecting improved funding mix and deposit pricing, contributed to higher net interest income. Noninterest income decreased $180 million, or 36%, from the third quarter of 2020, driven by lower mortgage banking fees resulting from lower gain-on-sale margins and production volumes, and a decline in other income largely tied to a gain on the sale of education loans in the third quarter of 2020. These decreases were partially offset by recovery in service charges and fees from deposit products, card, as well as trust and investment services, reflecting an increase in assets under management. Noninterest expense was stable compared to the third quarter of 2020. Net charge-offs of $35 million decreased $20 million, or 36%, driven by the impact of U.S. Government stimulus programs and strong collateral values in automobile and residential real estate.
Commercial Banking
Net interest income of $428 million was stable compared to the third quarter of 2020. Noninterest income of $168 million increased $24 million, or 17%, from $144 million in the third quarter of 2020, driven by strength in capital markets due to higher loan syndication and merger and acquisition advisory fees, reflecting favorable market conditions and a strong pipeline. Noninterest expense of $226 million increased $16 million, or 8%, from $210 million in the third quarter of 2020, largely tied to increased technology spend as well as higher salaries and employee benefits. Net charge-offs of $15 milliondecreased $146 million from the third quarter of 2020 reflecting the stabilization from effects of the COVID-19 pandemic and associated lockdowns.
Citizens Financial Group, Inc. | 1723
| | Table 7: Selected Financial Data for Business Operating Segments | | |
| Table 10: Selected Financial Data for Business Operating Segments, Year-to-Date | | Table 10: Selected Financial Data for Business Operating Segments, Year-to-Date | |
| | Consumer Banking | | Commercial Banking | | Consumer Banking | | Commercial Banking |
| | Three Months Ended March 31, | | Three Months Ended March 31, | | Nine Months Ended September 30, | | Nine Months Ended September 30, |
| (dollars in millions) | (dollars in millions) | 2021 | | 2020 | | 2021 | | 2020 | (dollars in millions) | 2021 | | 2020 | | 2021 | | 2020 |
| Net interest income | Net interest income | $863 | | | $793 | | | $421 | | | $365 | | Net interest income | $2,679 | | | $2,452 | | | $1,268 | | | $1,205 | |
| Noninterest income | Noninterest income | 351 | | | 357 | | | 170 | | | 125 | | Noninterest income | 949 | | | 1,280 | | | 516 | | | 413 | |
| Total revenue | Total revenue | 1,214 | | | 1,150 | | | 591 | | | 490 | | Total revenue | 3,628 | | | 3,732 | | | 1,784 | | | 1,618 | |
| Noninterest expense | Noninterest expense | 750 | | | 738 | | | 227 | | | 221 | | Noninterest expense | 2,250 | | | 2,215 | | | 679 | | | 644 | |
| Profit before credit losses | Profit before credit losses | 464 | | | 412 | | | 364 | | | 269 | | Profit before credit losses | 1,378 | | | 1,517 | | | 1,105 | | | 974 | |
| Net charge-offs | Net charge-offs | 59 | | | 97 | | | 101 | | | 43 | | Net charge-offs | 139 | | | 232 | | | 150 | | | 274 | |
| Income before income tax expense | Income before income tax expense | 405 | | | 315 | | | 263 | | | 226 | | Income before income tax expense | 1,239 | | | 1,285 | | | 955 | | | 700 | |
| Income tax expense | Income tax expense | 103 | | | 79 | | | 52 | | | 47 | | Income tax expense | 315 | | | 322 | | | 205 | | | 147 | |
| Net income | Net income | $302 | | | $236 | | | $211 | | | $179 | | Net income | $924 | | | $963 | | | $750 | | | $553 | |
| Average Balances: | Average Balances: | | | | Average Balances: | | | |
| Total assets | Total assets | $75,283 | | | $68,415 | | | $57,738 | | | $59,005 | | Total assets | $75,317 | | | $71,227 | | | $57,318 | | | $61,722 | |
Total loans and leases(1)(2) | Total loans and leases(1)(2) | 70,188 | | | 65,343 | | | 54,813 | | | 56,555 | | Total loans and leases(1)(2) | 70,857 | | | 67,763 | | | 54,459 | | | 58,784 | |
| Deposits | Deposits | 97,180 | | | 85,228 | | | 43,974 | | | 33,545 | | Deposits | 99,708 | | | 90,377 | | | 44,501 | | | 38,905 | |
| Interest-earning assets | Interest-earning assets | 71,135 | | | 65,393 | | | 55,175 | | | 57,016 | | Interest-earning assets | 71,777 | | | 67,866 | | | 54,828 | | | 59,201 | |
(1) Includes LHFS.
(2) The majority of PPP loans are reflected in Consumer Banking in accordance with how they are managed.
Consumer Banking
Net interest income of $863 million$2.7 billion increased $70$227 million, or 9%, from the first quarternine months of 2020, driven by the benefit of accelerated PPP loan forgiveness, loan and deposit growth, partially offset by loweras well as improved funding mix, and deposit margins given lower rates.pricing. Average loans grew $4.8increased $3.1 billion led by education, and residential mortgage, as well as the impactand automobile, partially offset by a decline in other retail given planned run-off of the PPP loan program.personal unsecured installment loans. Deposits grew $12increased $9.3 billion, or 14%10%, driven byas a result of elevated liquidity tied to government stimulus.stimulus associated with the COVID-19 disruption. Noninterest income decreased $6$331 million, or 26%, from the first nine months of 2020, driven by lower mortgage banking fees as increased industry capacity and heightened competition resulted in lower gain-on-sale margins and production volumes. This decrease was partially offset by higher trust and investment services fees driven by an increase in assets under management, and higher card fees and service charges and fees, reflecting continued volume recovery from COVID-19 impacts. Noninterest expense increased $35 million, or 2%, from the first quarter of 2020, driven by lower service charges and fees reflecting COVID-19 impacts on overdraft fees, partially offset by higher mortgage banking and trust and investment services fees which reflected an increase in assets under management from strong equity market levels and net inflows. Noninterest expense increased $12 million, or 2%, from the first quarternine months of 2020, reflecting higher salaries and employee benefits tied to higher revenue-based compensation, combined with higher equipment and software as a result ofexpense and outside services resulting from increased technology spend and outside services, largely tied to growth initiatives, partially offset by lower other operating expense related to lower travel and advertising costs.initiatives. Net charge-offs of $59$139 million decreased $38$93 million, or 39%40%, reflectingdriven by the impact of U.S. Government stimulus programs and forbearance.forbearance, as well as strong collateral values in automobile and residential real estate.
Commercial Banking
Net interest income of $421 million$1.3 billion increased $56$63 million, or 15%5%, from $365 million$1.2 billion in the first quarternine months of 2020, primarily driven by higher loan and deposit volumes that were partially offset byreflecting improved funding mix and deposit pricing. Noninterest income of $170$516 million increased $45$103 million, or 36%25%, from $125$413 million in the first quarternine months of 2020, driven by strength in capital markets fees due tofrom higher underwriting revenueloan syndication and mergersmerger and acquisition advisory fees, as well as the impactin addition to higher letter of a mark-to-market loss oncredit and loan trading assetsfees. Noninterest expense of $679 million increased $35 million, or 5%, from $644 million in the first quarternine months of 2020. Noninterest expense of $227 million2020, largely tied to growth initiatives, increased$6 million, or 3%, from $221 million in the first quarter of 2020, driven by technology spends, and higher salaries and employee benefits, and higher equipment and software due to increased technology spend.benefits. Net charge-offs of $101$150 million increased $58decreased $124 million, or 45%, from the first quarternine months of 2020, driven by financereflecting the stabilization from effects of the COVID-19 pandemic and insurance, including one large charge-off related to a financial sponsor, and commercial real estate as a result of COVID-19 impacts.
Citizens Financial Group, Inc. | 1824
ANALYSIS OF FINANCIAL CONDITION
Securities
| | Table 8: Amortized Cost and Fair Value of AFS and HTM Securities | | | |
| Table 11: Amortized Cost and Fair Value of AFS and HTM Securities | | Table 11: Amortized Cost and Fair Value of AFS and HTM Securities | | |
| | March 31, 2021 | | December 31, 2020 | | | September 30, 2021 | | December 31, 2020 | |
| (in millions) | (in millions) | Amortized
Cost | | Fair Value | | Amortized
Cost | | Fair Value | | (in millions) | Amortized
Cost | | Fair Value | | Amortized
Cost | | Fair Value | |
| U.S. Treasury and other | U.S. Treasury and other | $11 | | | $11 | | | $11 | | | $11 | | | U.S. Treasury and other | $11 | | | $11 | | | $11 | | | $11 | | |
| State and political subdivisions | State and political subdivisions | 3 | | | 3 | | | 3 | | | 3 | | | State and political subdivisions | 2 | | | 2 | | | 3 | | | 3 | | |
| Mortgage-backed securities, at fair value: | | | |
| Mortgage-backed securities: | | Mortgage-backed securities: | | |
| Federal agencies and U.S. government sponsored entities | Federal agencies and U.S. government sponsored entities | 23,966 | | | 24,113 | | | 21,954 | | | 22,506 | | | Federal agencies and U.S. government sponsored entities | 23,838 | | | 23,840 | | | 21,954 | | | 22,506 | | |
| Other/non-agency | Other/non-agency | 324 | | | 340 | | | 396 | | | 422 | | | Other/non-agency | 280 | | | 291 | | | 396 | | | 422 | | |
| Total mortgage-backed securities, at fair value | 24,290 | | | 24,453 | | | 22,350 | | | 22,928 | | | |
| Total mortgage-backed securities | | Total mortgage-backed securities | 24,118 | | | 24,131 | | | 22,350 | | | 22,928 | | |
| | Collateralized loan obligations | | Collateralized loan obligations | 767 | | | 767 | | | — | | | — | | |
| Total debt securities available for sale, at fair value | Total debt securities available for sale, at fair value | $24,304 | | | $24,467 | | | $22,364 | | | $22,942 | | | Total debt securities available for sale, at fair value | $24,898 | | | $24,911 | | | $22,364 | | | $22,942 | | |
| Mortgage-backed securities, at cost: | | | | | | | | | |
| Mortgage-backed securities: | | Mortgage-backed securities: | | | | | | | | |
| Federal agencies and U.S. government sponsored entities | Federal agencies and U.S. government sponsored entities | $2,139 | | | $2,223 | | | $2,342 | | | $2,464 | | | Federal agencies and U.S. government sponsored entities | $1,705 | | | $1,778 | | | $2,342 | | | $2,464 | | |
| | Total mortgage-backed securities, at cost | 2,139 | | | 2,223 | | | 2,342 | | | 2,464 | | | |
| Asset-backed securities, at cost | 856 | | | 854 | | | 893 | | | 893 | | | |
| Total mortgage-backed securities | | Total mortgage-backed securities | 1,705 | | | 1,778 | | | 2,342 | | | 2,464 | | |
| Asset-backed securities | | Asset-backed securities | 787 | | | 789 | | | 893 | | | 893 | | |
| Total debt securities held to maturity | Total debt securities held to maturity | $2,995 | | | $3,077 | | | $3,235 | | | $3,357 | | | Total debt securities held to maturity | $2,492 | | | $2,567 | | | $3,235 | | | $3,357 | | |
| Total debt securities available for sale and held to maturity | Total debt securities available for sale and held to maturity | $27,299 | | | $27,544 | | | $25,599 | | | $26,299 | | | Total debt securities available for sale and held to maturity | $27,390 | | | $27,478 | | | $25,599 | | | $26,299 | | |
| Equity securities, at cost | | Equity securities, at cost | $616 | | | $616 | | | $604 | | | $604 | | |
| Equity securities, at fair value | Equity securities, at fair value | $73 | | | $73 | | | $66 | | | $66 | | | Equity securities, at fair value | 88 | | | 88 | | | 66 | | | 66 | | |
| Equity securities, at cost | 603 | | | 603 | | | 604 | | | 604 | | | |
|
Our securities portfolio is managed to maintain prudent levels of liquidity, credit quality, and market risk while achieving appropriate returns that align with our overall portfolio management strategy. The portfolio primarily includes high quality, highly liquid investments reflecting our ongoing commitment to maintain appropriatestrong contingent liquidity levels and pledging capacity. U.S. government-guaranteed notes and GSE-issued mortgage-backed securities represent 96%93% of the fair value of our debt securities portfolio holdings. Holdings backed by mortgages dominate our portfolio and facilitate our ability to pledge those securities to the FHLB for collateral purposes. For further discussion of the liquidity coverage ratios, see “Regulation and Supervision — Liquidity Requirements” in our 2020 Form 10-K.
The fair value of the AFS debt securities portfolio of $24.5$24.9 billion at March 31,September 30, 2021 increased $1.5$2.0 billion from $22.9 billion at December 31, 2020, including $1.9$2.5 billion in new investments,portfolio growth, offset by a $414$566 million reduction in unrealized gains driven by thea steepening yield curve. The decline in the fair value of the HTM debt securities portfolio of $280$790 million was primarily attributable to portfolio run off.run-off. For further information, see Note 2.
As of March 31,September 30, 2021, the portfolio’s average effective duration was 4.13.9 years compared with 2.7 years as of December 31, 2020, as higher long-term rates drove a decrease in both actual and projected securities prepayment speeds. We manage our securities portfolio duration and convexity risk through asset selection and securities structure, and maintain duration levels within our risk appetite in the context of the broader interest rate risk framework and limits.
Citizens Financial Group, Inc. | 1925
Loans and Leases
| | Table 9: Composition of Loans and Leases, Excluding LHFS | | |
| Table 12: Composition of Loans and Leases, Excluding LHFS | | Table 12: Composition of Loans and Leases, Excluding LHFS | |
| (in millions) | (in millions) | March 31, 2021 | | December 31, 2020 | | Change | | Percent | (in millions) | September 30, 2021 | | December 31, 2020 | | Change | | Percent |
Commercial and industrial (1) | Commercial and industrial (1) | $44,058 | | | $44,173 | | | ($115) | | | — | % | Commercial and industrial(1) | $41,854 | | | $44,173 | | | ($2,319) | | | (5) | % |
| Commercial real estate | Commercial real estate | 14,553 | | | 14,652 | | | (99) | | | (1) | | Commercial real estate | 14,508 | | | 14,652 | | | (144) | | | (1) | |
| Leases | Leases | 1,802 | | | 1,968 | | | (166) | | | (8) | | Leases | 1,593 | | | 1,968 | | | (375) | | | (19) | |
| Total commercial | Total commercial | 60,413 | | | 60,793 | | | (380) | | | (1) | | Total commercial | 57,955 | | | 60,793 | | | (2,838) | | | (5) | |
Residential mortgages | Residential mortgages | 19,202 | | | 19,539 | | | (337) | | | (2) | | Residential mortgages | 21,513 | | | 19,539 | | | 1,974 | | | 10 | |
| Home equity | Home equity | 11,854 | | | 12,149 | | | (295) | | | (2) | | Home equity | 11,889 | | | 12,149 | | | (260) | | | (2) | |
| Automobile | Automobile | 12,344 | | | 12,153 | | | 191 | | | 2 | | Automobile | 13,492 | | | 12,153 | | | 1,339 | | | 11 | |
| Education | Education | 12,691 | | | 12,308 | | | 383 | | | 3 | | Education | 13,000 | | | 12,308 | | | 692 | | | 6 | |
| Other retail | Other retail | 5,691 | | | 6,148 | | | (457) | | | (7) | | Other retail | 5,469 | | | 6,148 | | | (679) | | | (11) | |
| Total retail | Total retail | 61,782 | | | 62,297 | | | (515) | | | (1) | | Total retail | 65,363 | | | 62,297 | | | 3,066 | | | 5 | |
| Total loans and leases | Total loans and leases | $122,195 | | | $123,090 | | | ($895) | | | (1 | %) | Total loans and leases | $123,318 | | | $123,090 | | | $228 | | | — | % |
|
(1) Includes PPP loans fully guaranteed by the SBA of $5.1$1.9 billion at March 31,September 30, 2021 and $4.2 billion at December 31, 2020.
(2) Includes fully or partially guaranteed FHA, VA and USDA loans of $1.4 billion at September 30, 2021 and $249 million at December 31, 2020, including loans acquired through the exercise of the GNMA early buyout option.
Total loans and leases decreased $895increased $228 million or 1%, from $123.1 billion as of December 31, 2020, reflecting a $380 million$3.1 billion increase in retail driven by mortgage, automobile, and education, and a $2.8 billion decrease in commercial driven by payoffs and a $515 million decrease in retail.PPP loans.
Allowance for Credit Losses and NonaccruingNonaccrual Loans and Leases
The ACL is created through charges to the provision for credit losses in order to provide appropriate reserves to absorb estimated future estimated credit losses in accordance with GAAP. For furtheradditional information on our processes to determine ourregarding the ACL, see “—CriticalNote 4 of this report, and “Critical Accounting Estimates — Allowance for Credit Losses.”Estimates” and Note 5 in the Company’s 2020 Form 10-K.
The ACL of $2.4$2.0 billion as of March 31,September 30, 2021 compared with the ACL of $2.7 billion as of December 31, 2020, reflecting a reserve release of $298$666 million. For further information, see Note 4.
| | | | | | | | | | | | | | | | | | | | | | | |
| Table 10: ACL and Related Coverage Ratios by Portfolio | | | | | | |
| March 31, 2021 | | December 31, 2020 |
| (in millions) | Loans and Leases | Allowance | Coverage | | Loans and Leases | Allowance | Coverage |
| Allowance for Loan and Lease Losses | | | | | | | |
| Commercial and industrial | $44,058 | | $742 | | 1.68 | % | | $44,173 | | $821 | | 1.86 | % |
| Commercial real estate | 14,553 | | 353 | | 2.43 | | | 14,652 | | 360 | | 2.46 | |
| Leases | 1,802 | | 51 | | 2.82 | | | 1,968 | | 52 | | 2.67 | |
| Total commercial | 60,413 | | 1,146 | | 1.90 | | | 60,793 | | 1,233 | | 2.03 | |
| Residential mortgages | 19,202 | | 125 | | 0.65 | | | 19,539 | | 141 | | 0.72 | |
| Home equity | 11,854 | | 102 | | 0.86 | | | 12,149 | | 134 | | 1.10 | |
| Automobile | 12,344 | | 175 | | 1.41 | | | 12,153 | | 200 | | 1.65 | |
| Education | 12,691 | | 342 | | 2.70 | | | 12,308 | | 361 | | 2.93 | |
| Other retail | 5,691 | | 304 | | 5.34 | | | 6,148 | | 374 | | 6.07 | |
| Total retail loans | 61,782 | | 1,048 | | 1.70 | | | 62,297 | | 1,210 | | 1.94 | |
| Total loans and leases | $122,195 | | $2,194 | | 1.80 | % | | $123,090 | | $2,443 | | 1.98 | % |
Allowance for Unfunded Lending Commitments(1) | | | | | | | |
| Commercial | | $165 | | 2.17 | % | | | $186 | | 2.33 | % |
| Retail | | 13 | | 1.72 | | | | 41 | | 2.01 | |
| Total allowance for unfunded lending commitments | | 178 | | | | | 227 | | |
Allowance for credit losses(2) | $122,195 | | $2,372 | | 1.94 | % | | $123,090 | | $2,670 | | 2.17 | % |
Citizens Financial Group, Inc. | 26
| | | | | | | | | | | | | | | | | | | | | | | |
| Table 13: ACL and Related Coverage Ratios by Portfolio | | | | | | |
| September 30, 2021 | | December 31, 2020 |
| (in millions) | Loans and Leases | Allowance | Coverage | | Loans and Leases | Allowance | Coverage |
| Allowance for Loan and Lease Losses | | | | | | | |
| Commercial and industrial | $41,854 | | $592 | | 1.41 | % | | $44,173 | | $821 | | 1.86 | % |
| Commercial real estate | 14,508 | | 212 | | 1.46 | | | 14,652 | | 360 | | 2.46 | |
| Leases | 1,593 | | 63 | | 3.92 | | | 1,968 | | 52 | | 2.67 | |
| Total commercial | 57,955 | | 867 | | 1.50 | | | 60,793 | | 1,233 | | 2.03 | |
| Residential mortgages | 21,513 | | 141 | | 0.65 | | | 19,539 | | 141 | | 0.72 | |
| Home equity | 11,889 | | 92 | | 0.78 | | | 12,149 | | 134 | | 1.10 | |
| Automobile | 13,492 | | 165 | | 1.22 | | | 12,153 | | 200 | | 1.65 | |
| Education | 13,000 | | 332 | | 2.56 | | | 12,308 | | 361 | | 2.93 | |
| Other retail | 5,469 | | 258 | | 4.72 | | | 6,148 | | 374 | | 6.07 | |
| Total retail | 65,363 | | 988 | | 1.51 | | | 62,297 | | 1,210 | | 1.94 | |
| Total loans and leases | $123,318 | | $1,855 | | 1.50 | % | | $123,090 | | $2,443 | | 1.98 | % |
| Allowance for Unfunded Lending Commitments | | | | | | | |
Commercial(1) | | $130 | | 1.72 | % | | | $186 | | 2.33 | % |
Retail(2) | | 19 | | 1.54 | | | | 41 | | 2.01 | |
| Total allowance for unfunded lending commitments | | 149 | | | | | 227 | | |
Allowance for credit losses(3) | $123,318 | | $2,004 | | 1.63 | % | | $123,090 | | $2,670 | | 2.17 | % |
(1) Commercial and Retail coverages ratios calculated forCoverage ratio includes total commercial allowance for unfunded lending commitments include theand total commercial allowance for loan and lease losses and allowance for unfunded lending commitments in the numerator and total commercial loans and leases in the denominator.
(2) Coverage ratio includes total retail allowance for unfunded lending commitments and total retail allowance for loan losses in the numerator and total retail loans in the denominator.
(3) Excluding the impact of PPP loans, the ACL Coverage Ratio would have been 2.03%1.65% and 2.24% for March 31,September 30, 2021 and December 31, 2020, respectively. For more information on the computation of non-GAAP financial measures, see “—Introduction — Non-GAAP Financial Measures” and “—Non-GAAP Financial Measures and Reconciliations.”
Citizens Financial Group, Inc. | 20 | | | | | | | | | | | | | | | | | | | | | | | |
| Table 14: Nonaccrual Loans and Leases | | | | | | | |
| (dollars in millions) | September 30, 2021 | | December 31, 2020 | | Change | | Percent |
| Commercial and industrial | $170 | | | $280 | | | ($110) | | | (39 | %) |
| Commercial real estate | 98 | | | 176 | | | (78) | | | (44) | |
| Leases | 1 | | | 2 | | | (1) | | | (50) | |
| Total commercial | 269 | | | 458 | | | (189) | | | (41) | |
Residential mortgages(1) | 164 | | | 167 | | | (3) | | | (2) | |
| Home equity | 216 | | | 276 | | | (60) | | | (22) | |
| Automobile | 55 | | | 72 | | | (17) | | | (24) | |
| Education | 23 | | | 18 | | | 5 | | | 28 | |
| Other retail | 20 | | | 28 | | | (8) | | | (29) | |
| Total retail | 478 | | | 561 | | | (83) | | | (15) | |
| Nonaccrual loans and leases | $747 | | | $1,019 | | | ($272) | | | (27 | %) |
| Nonaccrual loans and leases to total loans and leases | 0.61 | % | | 0.83 | % | | (22 | bps) | | |
| Allowance for loan and lease losses to nonaccrual loans and leases | 248 | | | 240 | | | 8 | % | | |
| Allowance for credit losses to nonaccrual loans and leases | 268 | | | 262 | | | 6 | % | | |
| | | | | | | | | | | | | | | | | | | | | | | |
| Table 11: Nonaccrual Loans and Leases | | | | | | | |
| (dollars in millions) | March 31, 2021 | | December 31, 2020 | | Change | | Percent |
| Commercial and industrial | $281 | | | $280 | | | $1 | | | — | % |
| Commercial real estate | 100 | | | 176 | | | (76) | | | (43 | %) |
| Leases | 1 | | | 2 | | | (1) | | | (50) | |
| Total commercial loans and leases | 382 | | | 458 | | | (76) | | | (17) | |
| Residential mortgages | 237 | | | 167 | | | 70 | | | 42 | |
| Home equity | 269 | | | 276 | | | (7) | | | (3) | |
| Automobile | 70 | | | 72 | | | (2) | | | (3) | |
| Education | 22 | | | 18 | | | 4 | | | 22 | |
| Other retail | 28 | | | 28 | | | — | | | — | |
| Total retail loans | 626 | | | 561 | | | 65 | | | 12 | |
| Nonaccrual loans and leases | $1,008 | | | $1,019 | | | ($11) | | | (1 | %) |
| Nonaccrual loans and leases to total loans and leases | 0.82 | % | | 0.83 | % | | (1 | bp) | | |
| Allowance for loan and lease losses to nonaccruing loans and leases | 218 | | | 240 | | | (22 | %) | | |
| Allowance for credit losses to nonaccruing loans and leases | 235 | | | 262 | | | (27 | %) | | |
NPLs of $1.0 billion$747 million as of March 31,September 30, 2021 decreased $11$272 million, or 1%27%, from December 31, 2020, reflecting a $76$189 million decrease in commercial and a $65$83 million increasedecrease in retail. The decrease in commercialCommercial NPLs was primarily driven by the resolution of one large CREdecreased through loan partially offset by higher nonaccrual designation for mortgage loans after exiting forbearance.sale activity, repayments, and charge-offs.
| | | | | | | | | | | | | | | | | | | | | | | | | | | | | | | | | | | | | | | | | | | | | |
| Table 12: Net Charge-offs and Charge-Off Ratios | | | | | | | | | | | | | | | | | | | | | |
| | | | | | | Three Months Ended March 31, | | | | | | Three Months Ended March 31, | | |
| (dollars in millions) | | | | | | | | | 2021 | | 2020 | | Change | | | | 2021 | | 2020 | | Change |
| Commercial and industrial | | | | | | | | | $77 | | | $44 | | | $33 | | | | | 0.70 | % | | 0.41 | % | | 29 | bps |
| Commercial real estate | | | | | | | | | 26 | | | — | | | 26 | | | | | 0.73 | | | — | | | 73 | |
| Leases | | | | | | | | | 1 | | | — | | | 1 | | | | | 0.26 | | | 0.07 | | | 19 | |
| Total commercial | | | | | | | | | 104 | | | 44 | | | 60 | | | | | 0.69 | | | 0.30 | | | 39 | |
| Residential mortgages | | | | | | | | | (1) | | | — | | | (1) | | | | | (0.01) | | | 0.01 | | | (2) | |
| Home equity | | | | | | | | | (7) | | | (3) | | | (4) | | | | | (0.25) | | | (0.10) | | | (15) | |
| Automobile | | | | | | | | | 11 | | | 27 | | | (16) | | | | | 0.35 | | | 0.88 | | | (53) | |
| Education | | | | | | | | | 7 | | | 14 | | | (7) | | | | | 0.24 | | | 0.55 | | | (31) | |
| Other retail | | | | | | | | | 44 | | | 55 | | | (11) | | | | | 3.00 | | | 3.21 | | | (21) | |
| Total retail loans | | | | | | | | | 54 | | | 93 | | | (39) | | | | | 0.35 | | | 0.61 | | | (26) | |
| Total net charge-offs | | | | | | | | | $158 | | | $137 | | | $21 | | | | | 0.52 | % | | 0.46 | % | | 6 | bps |
Citizens Financial Group, Inc. | 27
First | | | | | | | | | | | | | | | | | | | | | | | | | | | | | | | | | | | | | | | | | | | | | |
| Table 15: Net Charge-offs and Charge-Off Ratios, Quarter-to-Date | | | | | | | | | | |
| | | | | | | Three Months Ended September 30, | | | | | | Three Months Ended September 30, | | |
| (dollars in millions) | | | | | | | | | 2021 | | 2020 | | Change | | | | 2021 | | 2020 | | Change |
| Commercial and industrial | | | | | | | | | $10 | | | $80 | | | ($70) | | | | | 0.09 | % | | 0.68 | % | | (59 | bps) |
| Commercial real estate | | | | | | | | | 5 | | | 42 | | | (37) | | | | | 0.12 | | | 1.13 | | | (101) | |
| Leases | | | | | | | | | (1) | | | 48 | | | (49) | | | | | (0.22) | | | 7.99 | | | (821) | |
| Total commercial | | | | | | | | | 14 | | | 170 | | | (156) | | | | | 0.09 | | | 1.06 | | | (97) | |
| Residential mortgages | | | | | | | | | — | | | — | | | — | | | | | — | | | — | | | — | |
| Home equity | | | | | | | | | (12) | | | (2) | | | (10) | | | | | (0.42) | | | (0.10) | | | (32) | |
| Automobile | | | | | | | | | 2 | | | 7 | | | (5) | | | | | 0.06 | | | 0.24 | | | (18) | |
| Education | | | | | | | | | 13 | | | 5 | | | 8 | | | | | 0.41 | | | 0.21 | | | 20 | |
| Other retail | | | | | | | | | 27 | | | 39 | | | (12) | | | | | 1.99 | | | 2.46 | | | (47) | |
| Total retail | | | | | | | | | 30 | | | 49 | | | (19) | | | | | 0.19 | | | 0.32 | | | (13) | |
| Total net charge-offs | | | | | | | | | $44 | | | $219 | | | ($175) | | | | | 0.14 | % | | 0.70 | % | | (56 | bps) |
Third quarter of 2021 NCOs of $158$44 million increased $21decreased $175 million, or 15%80%, from $137$219 million in the firstthird quarter of 2020, driven by an increasedecreases in commercial of $60 million partially offset by a decrease inand retail of $39 million. First$156 million and $19 million, respectively. Third quarter of 2021 annualized net charge-offs of 0.52%0.14% of average loans and leases were up 6down 56 basis points from the third quarter of 2020. The overall improvement in the macroeconomic environment and post-pandemic reopening drove the significant decline in commercial NCOs. Retail NCOs remained low driven by continued benefit to consumers from government stimulus and strong collateral values in residential real estate and automobile.
| | | | | | | | | | | | | | | | | | | | | | | | | | | | | | | | | | | | | | | | | | | | | |
| Table 16: Net Charge-offs and Charge-Off Ratios, Year-to-Date | | | | | | | | | | |
| | | | | | | Nine Months Ended September 30, | | | | | | Nine Months Ended September 30, | | |
| (dollars in millions) | | | | | | | | | 2021 | | 2020 | | Change | | | | 2021 | | 2020 | | Change |
| Commercial and industrial | | | | | | | | | $115 | | | $189 | | | ($74) | | | | | 0.35 | % | | 0.54 | % | | (19 | bps) |
| Commercial real estate | | | | | | | | | 31 | | | 42 | | | (11) | | | | | 0.28 | | | 0.39 | | | (11) | |
| Leases | | | | | | | | | 13 | | | 54 | | | (41) | | | | | 1.01 | | | 2.99 | | | (198) | |
| Total commercial | | | | | | | | | 159 | | | 285 | | | (126) | | | | | 0.35 | | | 0.60 | | | (25) | |
| Residential mortgages | | | | | | | | | (2) | | | 1 | | | (3) | | | | | (0.01) | | | 0.01 | | | (2) | |
| Home equity | | | | | | | | | (29) | | | (7) | | | (22) | | | | | (0.33) | | | (0.08) | | | (25) | |
| Automobile | | | | | | | | | 11 | | | 54 | | | (43) | | | | | 0.12 | | | 0.60 | | | (48) | |
| Education | | | | | | | | | 33 | | | 29 | | | 4 | | | | | 0.35 | | | 0.36 | | | (1) | |
| Other retail | | | | | | | | | 108 | | | 141 | | | (33) | | | | | 2.55 | | | 2.88 | | | (33) | |
| Total retail | | | | | | | | | 121 | | | 218 | | | (97) | | | | | 0.26 | | | 0.48 | | | (22) | |
| Total net charge-offs | | | | | | | | | $280 | | | $503 | | | ($223) | | | | | 0.30 | % | | 0.54 | % | | (24 | bps) |
First nine months 2021 NCOs of $280 million decreased $223 million, or 44%, from $503 million in the first nine months of 2020, driven by decreases in commercial and retail of $126 million and $97 million, respectively. First nine months 2021 annualized net charge-offs of 0.30% of average loans and leases were down 24 basis points from first quarternine months of 2020.
The increase inRetail and commercial NCOs were down in the first quarternine months of 2021 as compared to the first quarternine months of 2020 were primarily driven by a charge-off related to a financial sponsor, described below, as well as COVID-related charge-offs2020. The decline in CRE. Retailretail NCOs were down in the first quarter of 2021 as compared to the first quarter of 2020is primarily due to U.S. Government stimulus programs and forbearance, as well as forbearance.
Instrong collateral values in residential real estate and automobile. The decrease in commercial NCOs reflects the first quarter of 2021, we charged-off our full exposure of approximately $54 million associated with a private equity sponsor client. This impact has been incorporated into our most recent full-year 2021 net charge-off guidance of 35-45 basis points of average loans. We recently filed a lawsuit in Federal court against this sponsor client alleging breach of contract and fraud. The Company has completed a full portfolio review and believes this incident is an isolated matter.
We continue to assess the impact ofeconomic recovery following the COVID-19 pandemic and associated lockdownslockdowns. We continue to assess risks to the recovery, including potential for continuing impacts from COVID-19 variants, challenges in the global supply chain and recent inflationary trends, as well as potential impacts from ending monetary and fiscal stimulus programs. We have institutedmaintained a variety of measures to identify and monitor areas of potential risk, including direct outreach to commercial clients and close monitoring of retail credit metrics.
Citizens Financial Group, Inc. | 21
Commercial Loan Asset Quality
Our commercial loan and lease portfolio consists of traditional commercial and industrial loans, commercial leases and commercial real estate loans. The portfolio is predominantly focused on customers in our footprint and adjacent states in which we have a physical presence where our local delivery model provides for
Citizens Financial Group, Inc. | 28
strong client connectivity. Additionally, we also do business in certain specialized industry sectors on a national basis.
As of March 31, 2021, commercial NPLs of $382 million decreased $76 million from $458 million as of December 31,discussed in our 2020 representing 0.6% and 0.8% of the commercial loan and lease portfolio as of March 31, 2021 and December 31, 2020, respectively.
ForForm 10-K, for commercial loans and leases, we utilize regulatory classification ratings to monitor credit quality. Loans with a “pass” rating are those that we believe will be fully repaid in accordance with the contractual loan terms. Commercial loans
As of September 30, 2021, commercial NPLs of $269 million decreased $189 million from $458 million as of December 31, 2020, representing 0.5% and leases that are “criticized” are those that have some weakness, or potential weakness, that indicate an increased probability of future loss. “Criticized” loans are grouped into three categories, “special mention,” “substandard” and “doubtful.” Special mention loans have potential weaknesses that, if left uncorrected, may result in deterioration of our credit position at some future date. Substandard loans are inadequately protected loans which have well-defined weaknesses that could hinder normal repayment or collection0.8% of the debt. Doubtful loans have the same weaknessescommercial loan and lease portfolio as substandard, with the added characteristics that the possibility of loss is highSeptember 30, 2021 and collection of the full amount of the loan is improbable.December 31, 2020, respectively.
| | Table 13: Commercial Loans and Leases by Regulatory Classification | | |
| Table 17: Commercial Loans and Leases by Regulatory Classification | | Table 17: Commercial Loans and Leases by Regulatory Classification | |
| | March 31, 2021 | | September 30, 2021 |
| | | Criticized | | | | Criticized | |
| (in millions) | (in millions) | Pass | Special Mention | Substandard | Doubtful | Total | (in millions) | Pass | Special Mention | Substandard | Doubtful | Total |
Commercial and industrial(1) | Commercial and industrial(1) | $40,922 | | $1,282 | | $1,609 | | $245 | | $44,058 | | Commercial and industrial(1) | $39,218 | | $1,115 | | $1,386 | | $135 | | $41,854 | |
| Commercial real estate | Commercial real estate | 13,631 | | 489 | | 408 | | 25 | | 14,553 | | Commercial real estate | 13,146 | | 616 | | 735 | | 11 | | 14,508 | |
| Leases | Leases | 1,751 | | 34 | | 16 | | 1 | | 1,802 | | Leases | 1,519 | | 49 | | 24 | | 1 | | 1,593 | |
| Total commercial | Total commercial | $56,304 | | $1,805 | | $2,033 | | $271 | | $60,413 | | Total commercial | $53,883 | | $1,780 | | $2,145 | | $147 | | $57,955 | |
| | | | | | | | | | | | | | | | | |
| December 31, 2020 |
| | Criticized | |
| (in millions) | Pass | Special Mention | Substandard | Doubtful | Total |
Commercial and industrial(1) | $40,878 | | $1,583 | | $1,464 | | $248 | | $44,173 | |
| Commercial real estate | 13,356 | | 804 | | 416 | | 76 | | 14,652 | |
| Leases | 1,922 | | 33 | | 12 | | 1 | | 1,968 | |
| Total commercial | $56,156 | | $2,420 | | $1,892 | | $325 | | $60,793 | |
(1) Includes $5.1$1.9 billion and $4.2 billion of PPP loans designated as pass that are fully guaranteed by the SBA as of March 31,September 30, 2021 and December 31, 2020, respectively.
Total commercial criticized balances of $4.1 billion as of March 31,September 30, 2021 decreased $528$565 million compared with December 31, 2020. Commercial criticized as a percent of total commercial of 6.8%7.0% at March 31,September 30, 2021 decreased from 7.6% at December 31, 2020.
Commercial and industrial criticized balances of $3.1$2.6 billion, or 7.1%6.3% of the total commercial and industrial loan portfolio as of March 31,September 30, 2021, decreased from $3.3 billion, or 7.5%, as of December 31, 2020. The decrease was primarily driven by net repayments and charge-offs. Commercial and industrial criticized loans represented 76%65% of total criticized loans as of March 31,September 30, 2021 compared to 71% as of December 31, 2020.
Commercial real estate criticized balances of $922 million,$1.4 billion, or 6.3%9.4% of the commercial real estate portfolio, decreased fromwas stable compared to December 31, 2020 at $1.3 billion, or 8.8%, as of December 31, 2020. The decrease was primarily driven by credit upgrades and net charge-offs.. Commercial real estate accounted for 22%33% of total criticized loans as of March 31,September 30, 2021 compared to 28% as of December 31, 2020.
Citizens Financial Group, Inc. | 2229
| | Table 14: Commercial Loans and Leases by Industry Sector | | | |
| Table 18: Commercial Loans and Leases by Industry Sector | | Table 18: Commercial Loans and Leases by Industry Sector | |
| | March 31, 2021 | | December 31, 2020 | | September 30, 2021 | | December 31, 2020 |
| (dollars in millions) | (dollars in millions) | Balance | % of
Total Loans | | Balance | % of
Total Loans | (dollars in millions) | Balance | % of
Total Loans and Leases | | Balance | % of
Total Loans and Leases |
| Finance and insurance | Finance and insurance | $6,297 | | 5 | % | | $6,481 | | 5 | % | Finance and insurance | $7,939 | | 6 | % | | $6,473 | | 5 | % |
| Health, pharma, and social assistance | Health, pharma, and social assistance | 3,147 | | 3 | | | 3,243 | | 3 | | Health, pharma, and social assistance | 2,914 | | 2 | | | 3,253 | | 3 | |
| Accommodation and food services | Accommodation and food services | 3,251 | | 3 | | | 3,206 | | 3 | | Accommodation and food services | 3,083 | | 3 | | | 3,159 | | 3 | |
| Professional, scientific, and technical services | Professional, scientific, and technical services | 2,753 | | 2 | | | 2,804 | | 2 | | Professional, scientific, and technical services | 2,542 | | 2 | | | 2,804 | | 2 | |
| Other manufacturing | Other manufacturing | 2,366 | | 2 | | | 2,403 | | 2 | | Other manufacturing | 3,708 | | 3 | | | 3,686 | | 3 | |
| Information | 2,223 | | 2 | | | 2,378 | | 2 | | |
| Technology | | Technology | 3,822 | | 3 | | | 3,546 | | 3 | |
| Retail trade | Retail trade | 2,381 | | 2 | | | 2,336 | | 2 | | Retail trade | 2,258 | | 2 | | | 2,312 | | 2 | |
| Energy and related | Energy and related | 2,044 | | 2 | | | 2,237 | | 2 | | Energy and related | 1,971 | | 2 | | | 2,237 | | 2 | |
| Wholesale trade | Wholesale trade | 2,006 | | 2 | | | 1,904 | | 2 | | Wholesale trade | 2,261 | | 2 | | | 1,976 | | 2 | |
| Metals and mining | 1,533 | | 1 | | | 1,646 | | 1 | | |
| Arts, entertainment, and recreation | Arts, entertainment, and recreation | 1,250 | | 1 | | | 1,382 | | 1 | | Arts, entertainment, and recreation | 902 | | 1 | | | 1,383 | | 1 | |
| Other services | Other services | 1,368 | | 1 | | | 1,370 | | 1 | | Other services | 1,845 | | 1 | | | 1,360 | | 1 | |
| Administrative and waste management services | Administrative and waste management services | 1,241 | | 1 | | | 1,320 | | 1 | | Administrative and waste management services | 1,226 | | 1 | | | 1,327 | | 1 | |
| Computer, electrical equipment, appliance, and component manufacturing | 1,213 | | 1 | | | 1,174 | | 1 | | |
| Transportation and warehousing | Transportation and warehousing | 1,216 | | 1 | | | 1,169 | | 1 | | Transportation and warehousing | 1,092 | | 1 | | | 1,169 | | 1 | |
| Consumer products manufacturing | Consumer products manufacturing | 1,131 | | 1 | | | 1,112 | | 1 | | Consumer products manufacturing | 1,160 | | 1 | | | 1,078 | | 1 | |
| Automotive | Automotive | 990 | | 1 | | | 1,051 | | 1 | | Automotive | 1,000 | | 1 | | | 1,057 | | 1 | |
| Educational services | Educational services | 803 | | 1 | | | 844 | | 1 | | Educational services | 597 | | — | | | 844 | | — | |
| Chemicals | Chemicals | 771 | | — | | | 736 | | — | | Chemicals | 717 | | — | | | 736 | | — | |
| Real estate and rental and leasing | Real estate and rental and leasing | 744 | | — | | | 732 | | — | | Real estate and rental and leasing | 886 | | 1 | | | 734 | | — | |
All other (1) | All other (1) | 182 | | — | | | 490 | | — | | All other(1) | 28 | | — | | | 884 | | 1 | |
| Total commercial and industrial | Total commercial and industrial | 38,910 | | 32 | | | 40,018 | | 32 | | Total commercial and industrial | 39,951 | | 32 | | | 40,018 | | 32 | |
| Real estate and rental and leasing | Real estate and rental and leasing | 13,116 | | 11 | | | 13,169 | | 11 | | Real estate and rental and leasing | 12,984 | | 11 | | | 13,167 | | 11 | |
| Accommodation and food services | Accommodation and food services | 789 | | 1 | | | 749 | | 1 | | Accommodation and food services | 819 | | 1 | | | 749 | | 1 | |
| Finance and insurance | Finance and insurance | 469 | | — | | | 498 | | — | | Finance and insurance | 560 | | — | | | 498 | | — | |
All other (1) | All other (1) | 179 | | — | | | 236 | | — | | All other(1) | 145 | | — | | | 238 | | — | |
| Total commercial real estate | Total commercial real estate | 14,553 | | 12 | | | 14,652 | | 12 | | Total commercial real estate | 14,508 | | 12 | | | 14,652 | | 12 | |
| Total leases | Total leases | 1,802 | | 1 | | | 1,968 | | 2 | | Total leases | 1,593 | | 1 | | | 1,968 | | 2 | |
Total commercial (2) | Total commercial (2) | $55,265 | | 45 | % | | $56,638 | | 46 | % | Total commercial(2) | $56,052 | | 45 | % | | $56,638 | | 46 | % |
(1) Deferred fees and costs are reported in All other.
(2) Excludes PPP loans of $5.1$1.9 billion and $4.2 billion as of March 31,September 30, 2021 and December 31, 2020, respectively.
Retail Loan Asset Quality
For retail loans, we utilize credit scores provided by FICO, which are generally refreshedrefresh on a quarterly basis, and thea loan’s payment and delinquency status to monitor credit quality. Management believes FICO credit scores are considered the strongest indicator of credit losses over the contractual life of thea loan as the scores are based on current and historical national industry-wide consumer level credit performance data, anddata. These scores assist management in predicting the borrower’s future payment performance. The largest portion of the retail portfolio is represented by borrowers located in the New England, Mid-Atlantic, and Midwest regions, although we have continued to lend selectively in areas outside the footprint primarily in the auto,automobile, education and point-of-sale financing.
Citizens Financial Group, Inc. | 2330
| | Table 15: Aging of Retail Loans as a Percentage of Loan Class | | | | |
| Table 19: Aging of Retail Loans as a Percentage of Loan Class | | Table 19: Aging of Retail Loans as a Percentage of Loan Class | | | |
| | March 31, 2021 | | | December 31, 2020 | | September 30, 2021 | | | December 31, 2020 |
| | Days Past Due | | | Days Past Due | | Days Past Due | | | Days Past Due |
| | Current-29 | 30-59 | 60-89 | 90 or More | | | Current-29 | 30-59 | 60-89 | 90 or More | | | Current-29 | 30-59 | 60-89 | 90+ | | | Current-29 | 30-59 | 60-89 | 90+ | |
| Residential mortgages | Residential mortgages | 98.69 | % | 0.29 | % | 0.06 | % | 0.96 | % | | | 98.73 | % | 0.30 | % | 0.11 | % | 0.86 | % | | Residential mortgages | 96.97 | % | 0.72 | % | 0.26 | % | 2.05 | % | | | 98.73 | % | 0.30 | % | 0.11 | % | 0.86 | % | |
| Home equity | Home equity | 97.85 | | 0.39 | | 0.16 | | 1.60 | | | | 97.53 | | 0.50 | | 0.23 | | 1.74 | | | Home equity | 98.03 | | 0.29 | | 0.13 | | 1.55 | | | | 97.53 | | 0.50 | | 0.23 | | 1.74 | | |
| Automobile | Automobile | 98.64 | | 0.95 | | 0.33 | | 0.08 | | | | 97.93 | | 1.40 | | 0.53 | | 0.14 | | | Automobile | 98.71 | | 0.87 | | 0.31 | | 0.11 | | | | 97.93 | | 1.40 | | 0.53 | | 0.14 | | |
| Education | Education | 99.58 | | 0.23 | | 0.10 | | 0.09 | | | | 99.56 | | 0.27 | | 0.11 | | 0.06 | | | Education | 99.55 | | 0.25 | | 0.11 | | 0.09 | | | | 99.56 | | 0.27 | | 0.11 | | 0.06 | | |
| Other retail | Other retail | 98.44 | | 0.54 | | 0.42 | | 0.60 | | | | 98.36 | | 0.62 | | 0.47 | | 0.55 | | | Other retail | 98.21 | | 0.71 | | 0.51 | | 0.57 | | | | 98.36 | | 0.62 | | 0.47 | | 0.55 | | |
| Total retail | Total retail | 98.68 | % | 0.45 | % | 0.17 | % | 0.70 | % | | | 98.47 | % | 0.58 | % | 0.25 | % | 0.70 | % | | Total retail | 98.14 | % | 0.58 | % | 0.24 | % | 1.04 | % | | | 98.47 | % | 0.58 | % | 0.25 | % | 0.70 | % | |
|
(1) 90+ day past due includes $289 million and $44 million of loans fully or partially guaranteed by the FHA, VA, and USDA at September 30, 2021 and December 31, 2020, respectively.
For more information on the aging of accruing and nonaccruingnonaccrual retail loans, see Note 4.
| | Table 16: Retail Asset Quality Metrics | | |
| Table 20: Retail Asset Quality Metrics | | Table 20: Retail Asset Quality Metrics | |
| | March 31, 2021 | | December 31, 2020 | | September 30, 2021 | | December 31, 2020 |
| Average refreshed FICO for total portfolio | Average refreshed FICO for total portfolio | 769 | | | 771 | | Average refreshed FICO for total portfolio | 768 | | | 771 | |
CLTV ratio for secured real estate(1) | CLTV ratio for secured real estate(1) | 58 | % | | 60 | % | CLTV ratio for secured real estate(1) | 57 | % | | 60 | % |
| Nonaccruing retail loans to total retail | 1.01 | | | 0.90 | | |
| Nonaccrual retail loans to total retail | | Nonaccrual retail loans to total retail | 0.73 | | | 0.90 | |
(1) The real estate secured portfolio CLTV is calculated as the mortgage and second lien loan balance divided by the most recently available value of the property.
| | | | Three Months Ended March 31, | | | Three Months Ended September 30, | | Nine Months Ended September 30, | |
| (dollars in millions) | (dollars in millions) | | 2021 | | 2020 | | Change | | Percent | (dollars in millions) | 2021 | | 2020 | | Change | | Percent | | 2021 | | 2020 | | Change | | Percent |
| Net charge-offs | Net charge-offs | | $54 | | | $93 | | | ($39) | | | (42 | %) | Net charge-offs | $30 | | | $49 | | | ($19) | | | (39 | %) | | $121 | | | $218 | | | ($97) | | | (44 | %) |
| Annualized net charge-off rate | Annualized net charge-off rate | | 0.35 | % | | 0.61 | % | | (26) | bps | | Annualized net charge-off rate | 0.19 | % | | 0.32 | % | | (13) | bps | | | 0.26 | % | | 0.48 | % | | (22) | bps | |
Retail asset quality continues to reflect a stronger economic outlook. The retail annualized net charge-off rate decreased to 0.19% for the third quarter of 2021 from 0.32% in the third quarter of 2020. The net charge-off rate of 0.35%0.26% for the quarternine months ended March 31,September 30, 2021 reflected a decrease of 2622 basis points from the quarternine months ended March 31,September 30, 2020, driven by the forbearance and stimulus activityprograms stemming from the COVID-19 pandemic and associated lockdowns.lockdowns, as well as strong collateral values in automobile and residential real estate.
Troubled Debt Restructurings
In the first quarter of 2020, we adopted the CARES Act and interagency guidance issued by the bank regulatory agencies which provide that COVID-19-related modifications to retail and commercial loans that met certain eligibility criteria are exempt from classification as a TDR. PaymentWe generally do not consider payment deferrals and forbearance plans entered into as a result ofestablished due to the COVID-19 pandemic were generally not consideredto be TDRs.
As of March 31, 2021, $714 million of retail loans were classified as TDRs, compared with $718 million as of December 31, 2020. As of March 31, 2021, $188 million of retail TDRs were in nonaccrual status with 33% of those current on payments compared to $171 million in nonaccrual status with 38% of those current on payments at December 31, 2020. TDRs that are current on payments generally return to accrual status once repayment capacity and appropriate payment history has been established. TDRs are individually evaluated to estimate ACL, and loans, once classified as TDRs, remain classified as TDRs until paid off, sold, or refinanced at market terms. For additional information regarding TDRs, see Note 5 in our 2020 Form 10-K.
Citizens Financial Group, Inc. | 2431
| | Table 17: Accruing and Nonaccruing Retail Troubled Debt Restructurings | | |
| Table 21: Accruing and Nonaccrual Troubled Debt Restructurings | | Table 21: Accruing and Nonaccrual Troubled Debt Restructurings | |
| | March 31, 2021 | | September 30, 2021 |
| | | As a % of Accruing Retail TDRs | | | | As a % of Accruing TDRs | |
| (dollars in millions) | (dollars in millions) | Accruing | | 30-89 Days
Past Due | | 90+ Days Past Due | | Nonaccruing | | Total | (dollars in millions) | Accruing | | 30-89 Days
Past Due | | 90+ Days Past Due | | Nonaccrual | | Total |
| Residential mortgages | $174 | | | 2.0 | % | | 2.6 | % | | $46 | | | $220 | | |
| Commercial and industrial | | Commercial and industrial | $161 | | | — | % | | — | % | | $70 | | | $231 | |
| Commercial real estate | | Commercial real estate | — | | | — | | | — | | | 9 | | | 9 | |
| Total commercial | | Total commercial | 161 | | | — | | | — | | | 79 | | | 240 | |
Residential mortgages(1) | | Residential mortgages(1) | 339 | | | 3.9 | | | 9.8 | | | 39 | | | 378 | |
| Home equity | Home equity | 213 | | | 0.9 | | | — | | | 85 | | | 298 | | Home equity | 198 | | | 0.5 | | | — | | | 74 | | | 272 | |
| Automobile | Automobile | 3 | | | 0.1 | | | — | | | 43 | | | 46 | | Automobile | 8 | | | 0.1 | | | — | | | 28 | | | 36 | |
| Education | Education | 112 | | | 0.6 | | | 0.3 | | | 12 | | | 124 | | Education | 112 | | | 0.4 | | | 0.1 | | | 12 | | | 124 | |
| Other retail | Other retail | 24 | | | 0.3 | | | — | | | 2 | | | 26 | | Other retail | 21 | | | 0.2 | | | — | | | 2 | | | 23 | |
| Total retail | | Total retail | 678 | | | 5.1 | | | 9.9 | | | 155 | | | 833 | |
| Total | Total | $526 | | | 3.9 | % | | 2.9 | % | | $188 | | | $714 | | Total | $839 | | | 5.1 | % | | 9.9 | % | | $234 | | | $1,073 | |
| | | December 31, 2020 | | December 31, 2020 |
| | | As a % of Accruing Retail TDRs | | | | As a % of Accruing TDRs | |
| (dollars in millions) | (dollars in millions) | Accruing | | 30-89 Days
Past Due | | 90+ Days Past Due | | Nonaccruing | | Total | (dollars in millions) | Accruing | | 30-89 Days
Past Due | | 90+ Days Past Due | | Nonaccrual | | Total |
| Residential mortgages | $172 | | | 2.7 | % | | 2.6 | % | | $43 | | | $215 | | |
| Commercial and industrial | | Commercial and industrial | $134 | | | 0.1 | % | | — | % | | $97 | | | $231 | |
| Commercial real estate | | Commercial real estate | 26 | | | — | | | — | | | — | | | 26 | |
| Total commercial | | Total commercial | 160 | | | 0.1 | | | — | | | 97 | | | 257 | |
Residential mortgages(1) | | Residential mortgages(1) | 172 | | | 2.1 | | | 2.0 | | | 43 | | | 215 | |
| Home equity | Home equity | 221 | | | 1.3 | | | — | | | 83 | | | 304 | | Home equity | 221 | | | 1.0 | | | — | | | 83 | | | 304 | |
| Automobile | Automobile | 13 | | | 0.5 | | | — | | | 33 | | | 46 | | Automobile | 13 | | | 0.4 | | | — | | | 33 | | | 46 | |
| Education | Education | 116 | | | 0.6 | | | 0.3 | | | 10 | | | 126 | | Education | 116 | | | 0.5 | | | 0.3 | | | 10 | | | 126 | |
| Other retail | Other retail | 25 | | | 0.3 | | | — | | | 2 | | | 27 | | Other retail | 25 | | | 0.2 | | | — | | | 2 | | | 27 | |
| Total retail | | Total retail | 547 | | | 4.2 | | | 2.3 | | | 171 | | | 718 | |
| Total | Total | $547 | | | 5.4 | % | | 2.9 | % | | $171 | | | $718 | | Total | $707 | | | 4.3 | % | | 2.3 | % | | $268 | | | $975 | |
(1) Includes $82 million and $14 million in 90+ days past due and accruing that are fully or partially guaranteed by the FHA, VA, and USDA at September 30, 2021 and December 31, 2020, respectively.
Deposits
| | Table 18: Composition of Deposits | | |
| Table 22: Composition of Deposits | | Table 22: Composition of Deposits | |
| (in millions) | (in millions) | March 31, 2021 | | December 31, 2020 | | Change | | Percent | (in millions) | September 30, 2021 | | December 31, 2020 | | Change | | Percent |
| Demand | Demand | $46,067 | | | $43,831 | | | $2,236 | | | 5 | % | Demand | $48,184 | | | $43,831 | | | $4,353 | | | 10 | % |
| Checking with interest | Checking with interest | 26,883 | | | 27,204 | | | (321) | | | (1) | | Checking with interest | 27,985 | | | 27,204 | | | 781 | | | 3 | |
| Regular savings | Regular savings | 19,634 | | | 18,044 | | | 1,590 | | | 9 | | Regular savings | 21,166 | | | 18,044 | | | 3,122 | | | 17 | |
| Money market accounts | Money market accounts | 51,074 | | | 48,569 | | | 2,505 | | | 5 | | Money market accounts | 48,935 | | | 48,569 | | | 366 | | | 1 | |
| Term deposits | Term deposits | 7,691 | | | 9,516 | | | (1,825) | | | (19) | | Term deposits | 5,951 | | | 9,516 | | | (3,565) | | | (37) | |
| Total deposits | Total deposits | $151,349 | | | $147,164 | | | $4,185 | | | 3 | % | Total deposits | $152,221 | | | $147,164 | | | $5,057 | | | 3 | % |
Total deposits as of March 31,September 30, 2021 increased $4.2$5.1 billion, or 3%, to $151.3$152.2 billion, from $147.2 billion as of December 31, 2020, reflecting strong deposit flows from consumer-orientedas a result of elevated liquidity tied to government stimulus.stimulus associated with the COVID-19 disruption. Citizens Access®, our national digital platform, ended the quarter with $5.3$4.6 billion of deposits, down from $5.9 billion as of December 31, 2020, primarily due to rate reduction strategies that resulted in a decrease in term deposits.
Citizens Financial Group, Inc. | 2532
Borrowed Funds
Total borrowed funds as of March 31,September 30, 2021 decreased $203 million$1.6 billion from December 31, 2020, driven by a $173$235 million and $30 million$1.4 billion decrease in short-term and long-term borrowed funds, respectively. Strong deposit growth enabled the paydown of senior debt.
Long-term borrowed funds
| | Table 19: Summary of Long-Term Borrowed Funds | | |
| Table 23: Summary of Long-Term Borrowed Funds | | Table 23: Summary of Long-Term Borrowed Funds | |
| (in millions) | (in millions) | March 31, 2021 | | December 31, 2020 | (in millions) | September 30, 2021 | | December 31, 2020 |
| Parent Company: | Parent Company: | | | | Parent Company: | | | |
2.375% fixed-rate senior unsecured debt, due July 2021 | 2.375% fixed-rate senior unsecured debt, due July 2021 | $350 | | | $350 | | 2.375% fixed-rate senior unsecured debt, due July 2021 | $— | | | $350 | |
4.150% fixed-rate subordinated debt, due September 2022 (1)(2) | 4.150% fixed-rate subordinated debt, due September 2022 (1)(2) | 168 | | | 182 | | 4.150% fixed-rate subordinated debt, due September 2022 (1)(2) | 168 | | | 182 | |
3.750% fixed-rate subordinated debt, due July 2024 (1)(2) | 3.750% fixed-rate subordinated debt, due July 2024 (1)(2) | 90 | | | 159 | | 3.750% fixed-rate subordinated debt, due July 2024 (1)(2) | 90 | | | 159 | |
4.023% fixed-rate subordinated debt, due October 2024 (1)(2) | 4.023% fixed-rate subordinated debt, due October 2024 (1)(2) | 17 | | | 25 | | 4.023% fixed-rate subordinated debt, due October 2024 (1)(2) | 17 | | | 25 | |
4.350% fixed-rate subordinated debt, due August 2025 (1)(2) | 4.350% fixed-rate subordinated debt, due August 2025 (1)(2) | 133 | | | 193 | | 4.350% fixed-rate subordinated debt, due August 2025 (1)(2) | 133 | | | 193 | |
4.300% fixed-rate subordinated debt, due December 2025 (1)(2) | 4.300% fixed-rate subordinated debt, due December 2025 (1)(2) | 336 | | | 450 | | 4.300% fixed-rate subordinated debt, due December 2025 (1)(2) | 336 | | | 450 | |
| 2.850% fixed-rate senior unsecured notes, due July 2026 | 2.850% fixed-rate senior unsecured notes, due July 2026 | 497 | | | 497 | | 2.850% fixed-rate senior unsecured notes, due July 2026 | 497 | | | 497 | |
| 2.500% fixed-rate senior unsecured notes, due February 2030 | 2.500% fixed-rate senior unsecured notes, due February 2030 | 297 | | | 297 | | 2.500% fixed-rate senior unsecured notes, due February 2030 | 298 | | | 297 | |
| 3.250% fixed-rate senior unsecured notes, due April 2030 | 3.250% fixed-rate senior unsecured notes, due April 2030 | 745 | | | 745 | | 3.250% fixed-rate senior unsecured notes, due April 2030 | 745 | | | 745 | |
3.750% fixed-rate reset subordinated debt, due February 2031 (1)(2) | 3.750% fixed-rate reset subordinated debt, due February 2031 (1)(2) | 69 | | | — | | 3.750% fixed-rate reset subordinated debt, due February 2031 (1)(2) | 69 | | | — | |
4.300% fixed-rate reset subordinated debt, due February 2031 (1)(2) | 4.300% fixed-rate reset subordinated debt, due February 2031 (1)(2) | 135 | | | — | | 4.300% fixed-rate reset subordinated debt, due February 2031 (1)(2) | 135 | | | — | |
4.350% fixed-rate reset subordinated debt, due February 2031 (1)(2) | 4.350% fixed-rate reset subordinated debt, due February 2031 (1)(2) | 60 | | | — | | 4.350% fixed-rate reset subordinated debt, due February 2031 (1)(2) | 61 | | | — | |
| 2.638% fixed-rate subordinated debt, due September 2032 | 2.638% fixed-rate subordinated debt, due September 2032 | 545 | | | 543 | | 2.638% fixed-rate subordinated debt, due September 2032 | 548 | | | 543 | |
| CBNA’s Global Note Program: | CBNA’s Global Note Program: | | CBNA’s Global Note Program: | |
| | 2.550% senior unsecured notes, due May 2021 | 2.550% senior unsecured notes, due May 2021 | 1,000 | | | 1,003 | | 2.550% senior unsecured notes, due May 2021 | — | | | 1,003 | |
| 3.250% senior unsecured notes, due February 2022 | 3.250% senior unsecured notes, due February 2022 | 712 | | | 716 | | 3.250% senior unsecured notes, due February 2022 | 704 | | | 716 | |
0.918% floating-rate senior unsecured notes, due February 2022 (2) | 300 | | | 299 | | |
1.000% floating-rate senior unsecured notes, due May 2022 (2) | 250 | | | 250 | | |
0.845% floating-rate senior unsecured notes, due February 2022(3) | | 0.845% floating-rate senior unsecured notes, due February 2022(3) | 300 | | | 299 | |
0.932% floating-rate senior unsecured notes, due May 2022(3) | | 0.932% floating-rate senior unsecured notes, due May 2022(3) | 250 | | | 250 | |
| 2.650% senior unsecured notes, due May 2022 | 2.650% senior unsecured notes, due May 2022 | 508 | | | 510 | | 2.650% senior unsecured notes, due May 2022 | 505 | | | 510 | |
| 3.700% senior unsecured notes, due March 2023 | 3.700% senior unsecured notes, due March 2023 | 523 | | | 527 | | 3.700% senior unsecured notes, due March 2023 | 517 | | | 527 | |
1.143% floating-rate senior unsecured notes, due March 2023 (2) | 250 | | | 249 | | |
1.082% floating-rate senior unsecured notes, due March 2023(3) | | 1.082% floating-rate senior unsecured notes, due March 2023(3) | 250 | | | 249 | |
| 2.250% senior unsecured notes, due April 2025 | 2.250% senior unsecured notes, due April 2025 | 746 | | | 746 | | 2.250% senior unsecured notes, due April 2025 | 746 | | | 746 | |
| 3.750% senior unsecured notes, due February 2026 | 3.750% senior unsecured notes, due February 2026 | 536 | | | 551 | | 3.750% senior unsecured notes, due February 2026 | 533 | | | 551 | |
| Additional Borrowings by CBNA and Other Subsidiaries: | Additional Borrowings by CBNA and Other Subsidiaries: | | Additional Borrowings by CBNA and Other Subsidiaries: | |
| Federal Home Loan Bank advances, 0.920% weighted average rate, due through 2038 | 19 | | | 19 | | |
| Federal Home Loan Bank advances, 0.864% weighted average rate, due through 2041 | | Federal Home Loan Bank advances, 0.864% weighted average rate, due through 2041 | 19 | | | 19 | |
| Other | Other | 30 | | | 35 | | Other | 26 | | | 35 | |
| Total long-term borrowed funds | Total long-term borrowed funds | $8,316 | | | $8,346 | | Total long-term borrowed funds | $6,947 | | | $8,346 | |
(1) Notes were redeemed on June 28, 2021.
(2) The March 31,September 30, 2021 balances reflect the results of the February 2021 subordinated debt private exchange offers. See “Capital and Regulatory Matters-Regulatory Capital Ratios and Capital Composition” for additional information.
(2)(3) Rate disclosed reflects the floating rate as of March 31, 2021 or final floating rate, as applicable. September 30, 2021.
The Parent Company’s long-term borrowed funds as of March 31,September 30, 2021 and December 31, 2020 included principal balances of $3.2 billion and $3.5 billion, respectively, and unamortized deferred issuance costs and/or discounts of $87$82 million and $90 million, respectively. CBNA and other subsidiaries’ long-term borrowed funds as of March 31,September 30, 2021 and December 31, 2020 included principal balances of $3.8 billion and $4.8 billion, respectively, with unamortized deferred issuance costs and/or discounts of $10$8 million and $11 million, respectively, and hedging basis adjustments of $85$63 million and $112 million, respectively. See Note 8 for further information about our hedging of certain long-term borrowed funds. For information regarding our liquidity and available borrowing capacity, see “—Liquidity” and Note 7.
CAPITAL AND REGULATORY MATTERS
As a bank holding company and a financial holding company, we are subject to regulation and supervision by the FRB. Our banking subsidiary, CBNA, is a national banking association whose primary federal regulator is the OCC. Our regulation and supervision continues to evolve as the legal and regulatory frameworks governing our operations continue to change. For more information, see “Regulation and Supervision” in our 2020 Form 10-K.
Citizens Financial Group, Inc. | 2633
Tailoring of Prudential Requirements
Under the FRB’s Tailoring Rules, Category IV firms, such as us, are subject to biennial supervisory stress testing and are exempt from company-run stress testing and related disclosure requirements. The FRB supervises Category IV firms on an ongoing basis, including evaluation of the capital adequacy and capital planning processes during off-cycle years. We are also required to develop, maintain and submit to the FRB an annual capital plan, for reviewwhich must be reviewed and approvalapproved by our board of directors (oror one of its committees), as well as FR Y-14 reporting requirements.committees. On April 2, 2021, we submitted our 2021 Capital Plan to the FRB under the FRB’s 2021 CCAR process. For more information, see the “Tailoring of Prudential Requirements” section in item 1 of our 2020 Form 10-K.
Under the FRB’s Capital Plan Rule, a firm must update and resubmit its capital plan prior to the next annual submission date under certain circumstances, which includes a material change in the firm’s risk profile, financial condition or corporate structure since its last capital plan submission. On July 28, 2021, we announced an agreement to acquire Investors, which required us to resubmit our capital plan to the FRB, which was submitted on September 15, 2021.
Under the stress capital buffer (“SCB”) framework, the FRB will not object to capital plans on quantitative grounds and each firm is required to maintain capital ratios above the sum of its minimum requirements and the SCB requirements to avoid restrictions on capital distributions and discretionary bonus payments. For Category IV firms, like us, the FRB has stated that the SCB will be re-calibrated with each biennial supervisory stress test and updated annually to reflect our planned common stock dividends. On October 1, 2020, our SCB of 3.4% became effective and appliesapplied to our capital actions through September 30, 2021.
On February 3, 2021, the FRB adopted a final rule effective April 5, 2021 to tailor the requirements of its Capital Plan Rule, specifically modifying capital planning, regulatory reporting and stress capital buffer requirements to be consistent with the Tailoring Rules framework. Under the final rule, effective April 5, 2021,for Category IV firms, like us, the SCB will be re-calibrated with each biennial supervisory stress test and updated annually to reflect our planned common stock dividends. In addition, Category IV firms have the ability to elect to participate in the supervisory stress test and receive an updated SCB requirement in a year in which they are not subject to the supervisory stress test. We did not elect to participate in the 2021 supervisory stress test and thereforetest. On August 5, 2021, the FRB announced that our SCB is expected towill remain unchanged at 3.4% for 2021.from October 1, 2021 through September 30, 2022.
In light of the heightened uncertainty related to the COVID-19 pandemic and associated lockdowns, the FRB took certain actions to preserve capital at banks. Among those actions, the FRB imposed certain limitations on firms for the third and fourth quarters of 2020, including mandatory suspension of share repurchases and limiting common stock dividends to existing rates and the average quarterly net income over the prior four quarters. The FRB modified its limitations on capital distributions for the first and second quarters of 2021 such that firms that participate in CCAR, like us, may resume share repurchases provided that the aggregate of share repurchases and common stock dividends for the applicable quarter did not exceed average quarterly net income for the trailing four quarters. Beginning July 1, 2021, the FRB lifted the temporary additional restrictions on capital distributions and authorized firms, like us, that are on a two-year cycle and not subject to supervisory stress testing this year to make capital distributions that are consistent with the regulatory capital rules, including normal restrictions under the FRB stress capital buffer framework. In addition, we temporarily suspended share repurchases in connection with entering into the agreement to acquire Investors, and are poised to resume share repurchases after the Investors shareholder vote scheduled for November 19, 2021. In January 2021, our board of directors authorized us to repurchase up to $750 million of our common stock, beginning in the first quarter of which $655 million is available as of September 30, 2021. Our 2020 Capital Plan includes maintaining quarterly common dividends of $0.39 per common share through the SCB window period ending third quarter 2021. In March 2021, the FRB announced that the currentAll future capital distribution limitations will end on June 30, 2021 for firms, like us, thatdistributions are on a two-year cycle and not subject to supervisory stress testing this year.consideration and approval by our board of directors prior to execution. The timing and amount of future dividends and share repurchases will depend on various factors, including our capital position, financial performance, risk-weighted assets, capital impacts of strategic initiatives, market conditions and regulatory considerations. All future capital distributions are subject to consideration and approval by the board of directors prior to execution.
Regulations relating to capital planning, regulatory reporting and SCB requirements applicable to firms like us are subject to ongoing rulemakingrule-making and potential further guidance and interpretation by the applicable federal regulators. We will continue to evaluate the impact of these and any other prudential regulatory changes, including their potential resultant changes in our regulatory and compliance costs and expenses.
For more information, see “Regulation and Supervision” and “—Capital and Regulatory Matters” in our 2020 Form 10-K.
Capital Framework
Under the current U.S. Basel III capital framework, we and our banking subsidiary, CBNA, must meet the following specific minimum requirements: CET1 capital ratio of 4.5%, tier 1 capital ratio of 6.0%, total capital ratio of 8.0%, and tier 1 leverage ratio of 4.0%. As a bank holding company, our SCB of 3.4% is imposed on top of
Citizens Financial Group, Inc. | 34
the three minimum risk-based capital ratios listed above and a CCB of 2.5% is imposed on top of the three minimum risk-based capital ratios listed above for our banking subsidiary.
Under the U.S. Basel III rules, the CET1 deduction threshold for MSRs, certain deferred tax assets and significant investments in the capital of unconsolidated institutions is 25%. As of March 31,September 30, 2021, we did not meet the threshold for these additional capital deductions. MSRs or deferred tax assets not deducted from CET1 capital
Citizens Financial Group, Inc. | 27
are assigned a 250% risk weight and significant investments in the capital of unconsolidated financial institutions not deducted from CET1 capital are assigned an exposure category risk weight.
In reaction to the COVID-19 pandemic, the FRB and the other federal banking regulators adopted a final rule relative to regulatory capital treatment of ACL under CECL. This rule allowed electing banking organizations to delay the estimated impact of CECL on regulatory capital for a two-year period ending January 1, 2022, followed by a three-year transition period ending January 1, 2025 to phase-in the aggregate amount of the capital benefit provided during the initial two-year delay. As of March 31,September 30, 2021, $493$401 million of the capital benefit has been accumulated for application to the three-year transition period.
For additional discussion of the U.S. Basel III capital framework and its related application, see “Regulation and Supervision” in our 2020 Form 10-K. The table below presents our actual regulatory capital ratios under the U.S. Basel III Standardized rules:
| | Table 20: Regulatory Capital Ratios Under the U.S. Basel III Standardized Rules | | |
| Table 24: Regulatory Capital Ratios Under the U.S. Basel III Standardized Rules | | Table 24: Regulatory Capital Ratios Under the U.S. Basel III Standardized Rules | |
| | March 31, 2021 | | December 31, 2020 | Required Minimum plus Required CCB for Non-Leverage Ratios(1) | | September 30, 2021 | | December 31, 2020 | Required Minimum plus Required CCB for Non-Leverage Ratios(1) |
| (in millions, except ratio data) | (in millions, except ratio data) | Amount | Ratio | | Amount | Ratio | (in millions, except ratio data) | Amount | Ratio | | Amount | Ratio |
| CET1 capital | CET1 capital | $14,867 | | 10.1 | % | | $14,607 | | 10.0 | % | 7.9 | % | CET1 capital | $15,584 | | 10.3 | % | | $14,607 | | 10.0 | % | 7.9 | % |
| Tier 1 capital | Tier 1 capital | 16,832 | | 11.4 | | | 16,572 | | 11.3 | | 9.4 | | Tier 1 capital | 17,598 | | 11.6 | | | 16,572 | | 11.3 | | 9.4 | |
| Total capital | Total capital | 19,879 | | 13.4 | | | 19,602 | | 13.4 | | 11.4 | | Total capital | 20,295 | | 13.4 | | | 19,602 | | 13.4 | | 11.4 | |
| Tier 1 leverage | Tier 1 leverage | 16,832 | | 9.5 | | | 16,572 | | 9.4 | | 4.0 | | Tier 1 leverage | 17,598 | | 9.7 | | | 16,572 | | 9.4 | | 4.0 | |
| Risk-weighted assets | Risk-weighted assets | 147,817 | | | 146,781 | | | Risk-weighted assets | 151,796 | | | 146,781 | | |
| Quarterly adjusted average assets | Quarterly adjusted average assets | 176,890 | | | 175,370 | | | Quarterly adjusted average assets | 180,528 | | | 175,370 | | |
(1) Required “Minimum Capital ratios” are: CET1 capital of 4.5%; Tier 1 capital of 6.0%; Total capital of 8.0%; and Tier 1 leverage of 4.0%. “Minimum Capital ratios” also include a SCB of 3.4%; N/A to Tier 1 leverage.
At March 31,September 30, 2021, our CET1 capital, tier 1 capital and total capital ratios were 10.1%10.3%, 11.4%11.6% and 13.4%, respectively, as compared with 10.0%, 11.3%, and 13.4%, respectively, as of December 31, 2020. The CET1 capital ratio increased as net income for the threenine months ended March 31,September 30, 2021 was partially offset by $1.0dividends and common share repurchases as described in “—Capital Transactions” below, $5.0 billion of risk-weighted asset (“RWA”) growth the impact of the capital actions described in “—Capital Transactions” below and a decrease in the modified CECL transitional amount. The tier 1 capital ratio increased due to the changes in the CET1 capital ratio described above.above and the issuance of Series G Preferred Stock, partially offset by the redemption of Series A Preferred Stock as described in “—Capital Transactions” below. The total capital ratio was constantincreased as the changes in the CET1 and tier 1 capital ratioratios described above combined with the subordinated debt exchange offer in the first quarter of 2021, as described in the “Regulatory Capital Ratios and Capital Composition” section below, were partially offset by the reduction in the net AACL impact.impact and a decrease in qualifying subordinated debt. At March 31,September 30, 2021, our CET1 capital, tier 1 capital and total capital ratios were approximately 220240 basis points, 200220 basis points and 200 basis points, respectively, above their regulatory minimums plus our SCB. All ratios remained well above the U.S. Basel III minimums.
Regulatory Capital Ratios and Capital Composition
CET1 capital under U.S. Basel III Standardized rules totaled $14.9$15.6 billion at March 31,September 30, 2021, an increase of $260$977 million from $14.6 billion at December 31, 2020, largely driven by net income for the threenine months ended March 31,September 30, 2021, partially offset by dividends, common share repurchases and a decrease in the modified CECL transitional amount.amount and common share repurchases. Tier 1 capital at March 31,September 30, 2021 totaled $16.8$17.6 billion, reflecting a $260 million$1.0 billion increase from $16.6 billion at December 31, 2020, driven by the changes in CET1 capital.capital and the issuance of Series G Preferred Stock, partially offset by the redemption of Series A Preferred Stock. Total capital of $19.9$20.3 billion at March 31,September 30, 2021 increased $277$693 million from December 31, 2020, driven by the changes in CET1 and tier 1 capital and a decreasean increase in non-qualifyingqualifying subordinated debt, partially offset by the reduction in the net AACL impact.
RWA totaled $147.8$151.8 billion at March 31,September 30, 2021, based on U.S. Basel III Standardized rules, up $1.0$5.0 billion from December 31, 2020. This increase in RWA was2020, driven by higher automobile loans, commercial commitments, MSRs, agency
Citizens Financial Group, Inc. | 35
securities, commercial commitments,education loans, bank-owned life insurance education loans and unsettled trades. These RWA increases wereretail commitments partially offset by lower commercial loans and derivative valuations.other retail loans.
As of March 31,September 30, 2021, the tier 1 leverage ratio was 9.5%9.7%, up from 9.4% at December 31, 2020, driven by higher tier 1 capital, partially offset by the $1.5$5.2 billion increase in quarterly adjusted average assets.
Citizens Financial Group, Inc. | 28
| | Table 21: Capital Composition Under the U.S. Basel III Capital Framework | | |
| Table 25: Capital Composition Under the U.S. Basel III Capital Framework | | Table 25: Capital Composition Under the U.S. Basel III Capital Framework | |
| (in millions) | (in millions) | March 31, 2021 | | December 31, 2020 | (in millions) | September 30, 2021 | | December 31, 2020 |
| Total common shareholders' equity | Total common shareholders' equity | $20,688 | | | $20,708 | | Total common shareholders' equity | $21,409 | | | $20,708 | |
| Exclusions: | Exclusions: | | Exclusions: | |
| Modified CECL transitional amount | Modified CECL transitional amount | 493 | | | 568 | | Modified CECL transitional amount | 401 | | | 568 | |
| Net unrealized (gains)/losses recorded in accumulated other comprehensive income (loss), net of tax: | Net unrealized (gains)/losses recorded in accumulated other comprehensive income (loss), net of tax: | | Net unrealized (gains)/losses recorded in accumulated other comprehensive income (loss), net of tax: | |
| Debt and equity securities | Debt and equity securities | (71) | | | (380) | | Debt and equity securities | 33 | | | (380) | |
| Derivatives | Derivatives | 57 | | | 11 | | Derivatives | 74 | | | 11 | |
| Unamortized net periodic benefit costs | Unamortized net periodic benefit costs | 425 | | | 429 | | Unamortized net periodic benefit costs | 401 | | | 429 | |
| Deductions: | Deductions: | | Deductions: | |
| Goodwill | Goodwill | (7,050) | | | (7,050) | | Goodwill | (7,065) | | | (7,050) | |
| Deferred tax liability associated with goodwill | Deferred tax liability associated with goodwill | 380 | | 379 | | Deferred tax liability associated with goodwill | 384 | | | 379 | |
| Other intangible assets | Other intangible assets | (55) | | | (58) | | Other intangible assets | (53) | | | (58) | |
| Total common equity tier 1 | Total common equity tier 1 | 14,867 | | | 14,607 | | Total common equity tier 1 | 15,584 | | | 14,607 | |
| Qualifying preferred stock | Qualifying preferred stock | 1,965 | | | 1,965 | | Qualifying preferred stock | 2,014 | | | 1,965 | |
| Total tier 1 capital | Total tier 1 capital | 16,832 | | | 16,572 | | Total tier 1 capital | 17,598 | | | 16,572 | |
Qualifying subordinated debt(1) | Qualifying subordinated debt(1) | 1,282 | | | 1,204 | | Qualifying subordinated debt(1) | 1,208 | | | 1,204 | |
| Allowance for credit losses | Allowance for credit losses | 2,372 | | | 2,670 | | Allowance for credit losses | 2,004 | | | 2,670 | |
| Exclusions from tier 2 capital: | Exclusions from tier 2 capital: | | Exclusions from tier 2 capital: | |
| Modified AACL transitional amount | Modified AACL transitional amount | (607) | | | (682) | | Modified AACL transitional amount | (515) | | | (682) | |
Excess allowance for credit losses(2) | Excess allowance for credit losses(2) | — | | | (162) | | Excess allowance for credit losses(2) | — | | | (162) | |
| Adjusted allowance for credit losses | Adjusted allowance for credit losses | 1,765 | | | 1,826 | | Adjusted allowance for credit losses | 1,489 | | | 1,826 | |
| Total capital | Total capital | $19,879 | | | $19,602 | | Total capital | $20,295 | | | $19,602 | |
(1) (1)As of March 31,September 30, 2021 and December 31, 2020, the amount of non-qualifying subordinated debt excluded from regulatory capital was $271$349 million and $348 million, respectively.
(2) Excess allowance represents the amount excluded from tier 2 capital that is in excess of 1.25% of risk weighted assets, excluding market risk.
On February 11, 2021, we completed $265 million in private exchange offers for five series of outstanding subordinated notes. Exchange offer participants received newly-issued fixed-rate reset subordinated notes due 2031 which are redeemable by us five years prior to their maturity. These subordinated debt exchange offers will benefit our tier 2 and total capital going forward by increasing the amount of subordinated debt eligible for inclusion in tier 2 capital without increasing the aggregate principal amount of subordinated debt outstanding. See Note 7 for more details on our outstanding subordinated debt.
Capital Adequacy Process
Our assessment of capital adequacy begins with our board-approved risk appetite and risk management framework. This framework provides for the identification, measurement and management of material risks. There have been no significant changes to our capital adequacy risk appetite and risk management framework as described in “—Capital and Regulatory Matters” in our 2020 Form 10-K.
Capital Transactions
We completed the following capital actions during the quarterly periodnine months ended March 31,September 30, 2021:
•Issued 300,000 shares of CFG 4.000% fixed-rate reset non-cumulative perpetual Series G Preferred Stock at an aggregate offering price of $300 million;
•Redeemed all outstanding shares of CFG Series A Non-Cumulative Perpetual Preferred Stock on July 6, 2021;
•Completed $265 million of subordinated debt private exchange offers in February 2021;
•Declared and paid a quarterly common stock dividenddividends of $0.39 per share forin the first, quartersecond and third quarters of 2021, aggregating to $167$502 million;
Citizens Financial Group, Inc. | 36
•Declared a quarterly dividend of $10.49 per share in first quarter of 2021 and $10.50 per share in the second quarter of 2021 on the 5.500% fixed-to-floating rate non-cumulative perpetual Series A Preferred Stock, aggregating to $3$5 million;
•Declared a semi-annual dividend of $30.00 per share on the 6.000% fixed-to-floating rate non-cumulative perpetual Series B Preferred Stock, aggregating to $9 million;
•Declared quarterly dividenddividends of $15.94 per share on the 6.375% fixed-to-floating rate non-cumulative perpetual Series C Preferred Stock, aggregating to $5$15 million;
•Declared a quarterly dividenddividends of $15.88 per share on the 6.350% fixed-to-floating rate non-cumulative perpetual Series D Preferred Stock, aggregating to $5$14 million;
•Declared a quarterly dividenddividends of $12.50 per share on the 5.000% fixed-rate non-cumulative perpetual Series E Preferred Stock, aggregating to $5$17 million;
Citizens Financial Group, Inc. | 29
•Declared a quarterly dividenddividends of $14.13 per share on the 5.650% fixed-rate non-cumulative perpetual Series F Preferred Stock, aggregating to $5$17 million;
•Declared a quarterly dividend of $12.78 per share in the third quarter of 2021 on the 4.000% fixed-rate reset non-cumulative perpetual Series G Preferred Stock, aggregating to $4 million; and
•Repurchased $95 million of our outstanding common stock at a weighted-average price per share of $42.32.
Banking Subsidiary’s Capital
| | Table 22: CBNA's Capital Ratios Under the U.S. Basel III Standardized Rules | | |
| Table 26: CBNA's Capital Ratios Under the U.S. Basel III Standardized Rules | | Table 26: CBNA's Capital Ratios Under the U.S. Basel III Standardized Rules | |
| | March 31, 2021 | | December 31, 2020 | | September 30, 2021 | | December 31, 2020 |
| (dollars in millions, except ratio data) | (dollars in millions, except ratio data) | Amount | Ratio | | Amount | Ratio | (dollars in millions, except ratio data) | Amount | Ratio | | Amount | Ratio |
| CET1 capital | CET1 capital | $16,265 | | 11.0 | % | | $16,032 | | 10.9 | % | CET1 capital | $16,791 | | 11.1 | % | | $16,032 | | 10.9 | % |
| Tier 1 capital | Tier 1 capital | 16,265 | | 11.0 | | | 16,032 | | 10.9 | | Tier 1 capital | 16,791 | | 11.1 | | | 16,032 | | 10.9 | |
| Total capital | Total capital | 19,155 | | 13.0 | | | 18,980 | | 13.0 | | Total capital | 19,405 | | 12.8 | | | 18,980 | | 13.0 | |
| Tier 1 leverage | Tier 1 leverage | 16,265 | | 9.2 | | | 16,032 | | 9.2 | | Tier 1 leverage | 16,791 | | 9.3 | | | 16,032 | | 9.2 | |
| Risk-weighted assets | Risk-weighted assets | 147,394 | | | 146,558 | | | Risk-weighted assets | 151,438 | | | 146,558 | | |
| Quarterly adjusted average assets | Quarterly adjusted average assets | 176,427 | | | 174,954 | | | Quarterly adjusted average assets | 180,034 | | | 174,954 | | |
CBNA’s CET1 and tier 1 capital totaled $16.3$16.8 billion at March 31,September 30, 2021, up $233$759 million from $16.0 billion at December 31, 2020. This increase was primarily driven by net income for the threenine months ended March 31,September 30, 2021, partially offset by dividends paid to the Parent Company and a decrease in the modified CECL transitional amount. Total capital was $19.2$19.4 billion at March 31,September 30, 2021, an increase of $175$425 million from $19.0 billion at December 31, 2020, driven by the change in CET1 capital partially offset by the reduction in the net AACL impact.
CBNA’s RWA totaled $147.4$151.4 billion at March 31,September 30, 2021, up $836 million$4.9 billion from December 31, 2020, driven by higher automobile loans, commercial commitments, MSRs, agency securities, commercial commitments,education loans, bank-owned life insurance education loans and unsettled trades. These RWA increases wereretail commitments partially offset by lower commercial loans and derivative valuations.other retail loans.
As of March 31,September 30, 2021, CBNA’s tier 1 leverage ratio of 9.2% slightly9.3% increased as the increase in tier 1 capital was mostly offset by the $1.5$5.1 billion increase in quarterly adjusted average assets.
LIQUIDITY
Liquidity is defined as our ability to meet our cash-flow and collateral obligations in a timely manner, at a reasonable cost. An institution must maintain operating liquidity to meet its expected daily and forecasted cash-flow requirements, as well as contingent liquidity to meet unexpected (stress scenario) funding requirements. As noted earlier, reflecting the importance of meeting all unexpected and stress-scenario funding requirements, we identify and manage contingent liquidity, (consistingconsisting of cash balances at the FRB, unencumbered high-quality and liquid securities, and unused FHLB borrowing capacity).capacity. Separately, we also identify and manage asset liquidity as a subset of contingent liquidity, (consistingconsisting of cash balances at the FRB and unencumbered high-quality securities).securities. We consider the effective and prudent management of liquidity fundamental to our health and strength. We manage liquidity at the consolidated enterprise level and at each material legal entity, including at the Parent Company and CBNA level.
Citizens Financial Group, Inc. | 37
Parent Company Liquidity
Our Parent Company’s primary sources of cash are dividends and interest received from CBNA as a result of investing in bank equity and subordinated debt andas well as externally issued preferred stock, as well as senior and subordinated debt. Uses of cash include the routine cash flow requirements as a bank holding company, including periodic share repurchases and payments of dividends, interest and expenses; the needs of subsidiaries, including CBNA for additional equity and, as required, its need for debt financing; and the support for extraordinary funding requirements when necessary. To the extent the Parent Company has relied on wholesale borrowings, uses also include payments of related principal and interest.
During the nine months ended September 30, 2021, the Parent Company completed the following transactions:
•Redeemed all outstanding shares of 5.50% fixed-to-floating rate non-cumulative perpetual Series A Preferred Stock;
•Issued 300,000 shares of 4.00% fixed-rate reset non-cumulative perpetual Series G Preferred Stock at an aggregate offering price of $300 million; and
•Redeemed $350 million of 2.375% fixed-rate senior unsecured debt due July 2021.
During the three months ended March 31,September 30, 2021 and 2020, the Parent Company declared dividends on common stock of $167 million and $168 million, respectively, and declared dividends on preferred stock of $23$26 million and $22$25 million, respectively.
During the nine months ended September 30, 2021 and 2020, the Parent Company declared dividends on common stock of $502 million and $504 million, respectively, and declared dividends on preferred stock of $81 million and $75 million, respectively.
Our Parent Company’s cash and cash equivalents represent a source of liquidity that can be used to meet various needs and totaled $2.5 billion and $2.7 billion as of March 31,September 30, 2021 and December 31, 2020.2020, respectively. The Parent Company’s
Citizens Financial Group, Inc. | 30
double-leverage ratio, (thethe combined equity investment in Parent Company subsidiaries divided by Parent Company equity)equity, is a measure of reliance on equity cash flows from subsidiaries to fund Parent Company obligations. At March 31,September 30, 2021, the Parent Company’s double-leverage ratio was 98.2%97.2%.
CBNA Liquidity
As CBNA’s primary business involves taking deposits and making loans, a key role of liquidity management is to ensure that customers have timely access to funds from deposits and for loans. Liquidity management also involves maintaining sufficient liquidity to repay wholesale borrowings, pay operating expenses and support extraordinary funding requirements when necessary. In the ordinary course of business, the liquidity of CBNA is managed by matching sources and uses of cash. The primary sources of bank liquidity include deposits from our consumer and commercial customers; payments of principal and interest on loans and debt securities; and wholesale borrowings, as needed, and as described under “—Liquidity Risk Management and Governance.” The primary uses of bank liquidity include withdrawals and maturities of deposits; payment of interest on deposits; funding of loans and related commitments; and funding of securities purchases. To the extent that CBNA has relied on wholesale borrowings, uses also include payments of related principal and interest. For further information on CBNA’s outstanding debt, see Note 7.
As CBNA’s primary business involves taking deposits and making loans, a key role of liquidity management is to ensure that customers have timely access to funds from deposits and for loans. Liquidity management also involves maintaining sufficient liquidity to repay wholesale borrowings, pay operating expenses and support extraordinary funding requirements when necessary.
Liquidity Risk
We define liquidity risk as the risk that an entity will be unable to meet its payment obligations in a timely manner, at a reasonable cost. Liquidity risk can arise due to contingent liquidity risk and/or funding liquidity risk.
Contingent liquidity risk is the risk that market conditions may reduce an entity’s ability to liquidate, pledge and/or finance certain assets and thereby substantially reduce the liquidity value of such assets. Drivers of contingent liquidity risk include general market disruptions as well as specific issues regarding the credit quality and/or valuation of a security or loan, issuer or borrower and/or asset class.
Funding liquidity risk is the risk that market conditions and/or entity-specific events may reduce an entity’s ability to raise funds from depositors and/or wholesale market counterparties. Drivers of funding liquidity risk may be idiosyncratic or systemic, reflecting impediments to operations and/or damaged market confidence.
Citizens Financial Group, Inc. | 38
Factors Affecting Liquidity
Given the composition of assets and borrowing sources, contingent liquidity risk at CBNA would be materially affected by events such as deterioration of financing markets for high-quality securities (e.g., mortgage-backed securities and other instruments issued by the GNMA, FNMA and the FHLMC), by any inability of the FHLBs to provide collateralized advances and/or by a refusal of the FRB to act as a lender of last resort in systemic stress.
Similarly, given the structure of its balance sheet, the funding liquidity risk of CBNA would be materially affected by an adverse idiosyncratic event (e.g., a major loss, causing a perceived or actual deterioration in its financial condition), an adverse systemic event (e.g., default or bankruptcy of a significant capital markets participant), or a combination of both. Consequently, and despite ongoing exposure to a variety of idiosyncratic and systemic events, we view our contingent liquidity risk and our funding liquidity risk to be relatively modest.
Citizens Financial Group, Inc. | 31
An additional variable affecting our access to unsecured wholesale market funds and to large denomination (i.e., uninsured) customer deposits is the credit ratings assigned by such agencies as Moody’s, Standard and Poor’s, and Fitch.
| | | | | | | | | | | | | | | | | |
Table 23:27: Credit Ratings | | | | | |
| | March 31,September 30, 2021 |
| | Moody’s | | Standard and
Poor’s | | Fitch |
|
| Citizens Financial Group, Inc.: | | | | | |
| Long-term issuer | NR | | BBB+ | | BBB+ |
| Short-term issuer | NR | | A-2 | | F1 |
| Subordinated debt | NR | | BBB | | BBB |
| Preferred Stock | NR | | BB+ | | BB |
| Citizens Bank, National Association: | | | | | |
| Long-term issuer | Baa1 | | A- | | BBB+ |
| Short-term issuer | NR | | A-2 | | F1 |
| Long-term deposits | A1 | | NR | | A- |
| Short-term deposits | P-1 | | NR | | F1 |
NR = Not rated | | | | | |
Changes in our public credit ratings could affect both the cost and availability of our wholesale funding. As a result, and in order to maintain a conservative funding profile, CBNA continues to minimize reliance on unsecured wholesale funding. At March 31,September 30, 2021, our wholesale funding consisted primarily of term debt issued by the Parent Company and CBNA.
Existing and evolving regulatory liquidity requirements represent another key driver of systemic liquidity conditions and liquidity management practices. The FRB, the OCC, and the FDIC regularly evaluate our liquidity as part of the overall supervisory process. In addition, we are subject to existing and evolving regulatory liquidity requirements, some of which are subject to further rulemaking, guidance and interpretation by the applicable federal regulators. For further discussion, see “Regulation and Supervision — Tailoring of Prudential Requirements” and “—Liquidity Requirements” in our 2020 Form 10-K.
Liquidity Risk Management and Governance
Liquidity risk is measured and managed by the Funding and Liquidity unit within our Treasury unit in accordance with policy guidelines promulgated by our Board and the Asset Liability Committee. In managing liquidity risk, the Funding and Liquidity unit delivers regular and comprehensive reporting, including current levels versus threshold limits for a broad set of liquidity metrics and early warning indicators, explanatory commentary relating to emerging risk trends and, as appropriate, recommended remedial strategies.
Citizens Financial Group, Inc. | 39
Our Funding and Liquidity unit’s primary goal isgoals are to deliver and otherwise maintain prudent levels of operating liquidity (toto support expected and projected funding requirements), andrequirements, contingent liquidity (toto support unexpected funding requirements resulting from idiosyncratic, systemic, and combination stress events, and regulatory liquidity requirements)requirements in a timely manner from stable and cost-efficient funding sources.
We seek to accomplish this goal by funding loans with stable deposits; by prudently controlling dependence on wholesale funding, particularly short-term unsecured funding; and by maintaining ample available liquidity, including a contingent liquidity buffer of unencumbered high-quality loans and securities. As of March 31,September 30, 2021:
•CoreOrganically generated deposits continuedcontinue to be our primary source of funding, and ourresulting in a consolidated period end loan-to-deposits ratio, which excludesexcluding LHFS, was 80.7%of 81.0%;
•Our cash position, which is defined as cash balance held at the FRB, totaled $13.5$12.5 billion;
•Our total available liquidity, comprised of contingent liquidity and available discount window capacity, was approximately $80.1$76.1 billion;
•Contingent liquidity was $50.2$48.7 billion, consisting of unencumbered high-quality liquid securities of $22.6$21.1 billion, unused FHLB capacity of $14.1$15.1 billion, and our cash position of $13.5$12.5 billion. Asset liquidity, a component of contingent liquidity, was $36.1$33.6 billion, consisting of our cash position of $13.5$12.5 billion and unencumbered high-quality liquid securities of $22.6$21.1 billion;
Citizens Financial Group, Inc. | 32
•Available discount window capacity, defined as available total borrowing capacity from the FRB based on identified collateral, is secured by non-mortgage commercial and retail loans and totaled $29.9$27.4 billion. Use of this borrowing capacity would be considered only during exigent circumstances; and
•For a summary of our sources and uses of cash by type of activity for the threenine months ended March 31,September 30, 2021 and 2020, see the Consolidated Statements of Cash Flows.
The Funding and Liquidity unit monitors a variety of liquidity and funding metrics and early warning indicators and metrics, including specific risk thresholds limits. These monitoring tools are broadly classified as follows:
•Current liquidity sources and capacities, including cash at the FRBs, free and liquid securities and available and secured FHLB borrowing capacity;
•Liquidity stress sources, including idiosyncratic, systemic and combined stresses, in addition to evolving regulatory requirements; and
•Current and prospective exposures, including secured and unsecured wholesale funding and spot and cumulative cash-flow gaps across a variety of horizons.
Further, certain of these metrics are monitored individually for CBNA and for our consolidated enterprise on a daily basis, including cash position, unencumbered securities, asset liquidity and available FHLB borrowing capacity. In order to identify emerging trends and risks and inform funding decisions, specific metrics are also forecasted over a one-year horizon.
OFF-BALANCE SHEET ARRANGEMENTS
The following table presents our outstanding off-balance sheet arrangements. For further information, see Note 11.
| | Table 24: Outstanding Off-Balance Sheet Arrangements | | |
| Table 28: Outstanding Off-Balance Sheet Arrangements | | Table 28: Outstanding Off-Balance Sheet Arrangements | |
| (in millions) | (in millions) | March 31, 2021 | | December 31, 2020 | | Change | | Percent | (in millions) | September 30, 2021 | | December 31, 2020 | | Change | | Percent |
| Commitments to extend credit | Commitments to extend credit | $76,200 | | | $74,160 | | | $2,040 | | | 3 | % | Commitments to extend credit | $80,629 | | | $74,160 | | | $6,469 | | | 9 | % |
| Letters of credit | Letters of credit | 2,077 | | | 2,239 | | | (162) | | | (7) | | Letters of credit | 1,939 | | | 2,239 | | | (300) | | | (13) | |
| Risk participation agreements | Risk participation agreements | 71 | | | 98 | | | (27) | | | (28) | | Risk participation agreements | 57 | | | 98 | | | (41) | | | (42) | |
| Loans sold with recourse | Loans sold with recourse | 58 | | | 54 | | | 4 | | | 7 | | Loans sold with recourse | 70 | | | 54 | | | 16 | | | 30 | |
| Marketing rights | Marketing rights | 29 | | | 29 | | | — | | | — | | Marketing rights | 26 | | | 29 | | | (3) | | | (10) | |
| Total | Total | $78,435 | | | $76,580 | | | $1,855 | | | 2 | % | Total | $82,721 | | | $76,580 | | | $6,141 | | | 8 | % |
Citizens Financial Group, Inc. | 40
CRITICAL ACCOUNTING ESTIMATES
Our unaudited interim Consolidated Financial Statements, which are included in this Report, are prepared in accordance with GAAP. The preparation of financial statements in conformity with GAAP requires us to establish accounting policies and make estimates that affect amounts reported in our audited Consolidated Financial Statements.
An accounting estimate requires assumptions and judgments about uncertain matters that could have a material effect on our unaudited interim Consolidated Financial Statements. Estimates are made using facts and circumstances known at a point in time. Changes in those facts and circumstances could produce results substantially different from those estimates. Our most significant accounting policies and estimates and their related application are discussed below. For additional information regarding fair value measurements, see “—Critical Accounting Estimates” in our 2020 Form 10-K.
Allowance for Credit Losses
We reserve for expected credit losses on our loan and lease portfolio through the ALLL and for expected credit losses in our unfunded lending commitments through other liabilities. Collectively, the ALLL and allowance for expected credit losses in unfunded lending commitments are referred to as the ACL.
Changes in the ACL are reflected in net income through provision for credit losses. Changes in the credit risk profile of our loans and leases result in changes in provision expense with a resulting change, net of charge-offs and recoveries, in the ACL balance.
Citizens Financial Group, Inc. | 33
The ACL is often the most critical of all the accounting estimates for banking institutions like us. The ACL is maintained at a level we believe to be appropriate to absorb expected lifetime credit losses over the contractual life of the loan and lease portfolios and on the unfunded lending commitments. Our determination of the ACL is based on periodic evaluation of the loan and lease portfolios and unfunded lending commitments that are not unconditionally cancellable considering a number of relevant underlying factors, including key assumptions and evaluation of quantitative and qualitative information.
Key assumptions used in our ACL measurement process include the use of a two-year reasonable and supportable economic forecast period followed by a one-year period during which the expected credit losses revert to long-term historical macroeconomic inputs.
The evaluation of quantitative and qualitative information is performed through assessments of groups of assets that share similar risk characteristics and certain individual loans and leases that do not share similar risk characteristics with the collective group. Loans are grouped generally by product type (e.g., commercial and industrial, commercial real estate, residential mortgage, etc.), and significant loan portfolios are assessed for credit losses using econometric models. The evaluation process is inherently imprecise and subjective as it requires significant management judgment based on underlying factors that are susceptible to change, sometimes materially and rapidly.
The quantitative evaluation of the adequacy of the ACL utilizes a single economic forecast as its foundation, and is primarily based on econometric models that use known or estimated data as of the balance sheet date and forecasted data over the reasonable and supportable period. Known and estimated data include current probability of default, loss given default and exposure at default (for commercial), timing and amount of expected draws (for unfunded lending commitments), FICO, LTV, term and time on books (for retail loans), mix and level of loan balances, delinquency levels, assigned risk ratings, previous loss experience, current business conditions, amounts and timing of expected future cash flows, and factors particular to a specific commercial credit such as competition, business and management performance. Forward-looking economic assumptions include real gross domestic product, unemployment rate, interest rate curve, and changes in collateral values. This data is aggregated to estimate expected credit losses over the contractual life of the loans and leases, adjusted for expected prepayments. In highly volatile economic environments historical information, such as commercial customer financial statements or consumer credit ratings, may not be as important to estimating future expected losses as forecasted inputs to the models.
The ACL may also be affected materially by a variety of qualitative factors that we consider to reflect our current judgment of various events and risks that are not measured in our statistical procedures including uncertainty related to the economic forecasts used in the modeled credit loss estimates, loan growth, back testing results, credit underwriting policy exceptions, regulatory and audit findings, and peer comparisons. The qualitative allowance is further informed for certain industry sectors and certain loan classes by alternative scenarios to support the period-end ACL balance. We recognize that this approach may not be suitable in certain economic environments and differing analysis may be requested at management’s discretion. Due in part to its subjectivity, the qualitative evaluation may be materially impacted during periods of economic uncertainty and late breaking events could lead to revision of reserves to reflect management’s best estimate of expected credit losses.
The measurement process results in specific or pooled allowances for loans, leases and unfunded lending commitments, and qualitative allowances that are judgmentally determined and applied across the portfolio.
There are certain loan portfolios that may not need an econometric model to enable us to calculate management’s best estimate of the expected credit losses. Less data intensive, non-modeled approaches to estimating losses are considered more efficient and practical for portfolios that have lower levels of outstanding balances (e.g., runoff or closed portfolios, and new products or products that are not significant to our overall credit risk exposure).
The ACL decreased from $2.7 billion at December 31, 2020 to $2.4$2.0 billion at March 31,September 30, 2021, reflecting a reserve release of $298$666 million.
To determine the ACL as of March, 31,September 30, 2021, we utilized an economic forecast that generally reflects real GDP growth of approximately 3.2%5.8% over 2021, returning to fourth quarter 2019 real GDP levels by the last quarter of 2021. The forecast also projects the unemployment rate to be in the range of 6.3%5.3% to 7.0%6.3% throughout 2021. Overall, thisThis forecast reflects an overall improved macroeconomic outlook as compared to December 31, 2020. We continue to utilize our qualitative allowance framework to reassess and adjust ACL reserve levels. Macroeconomic forecast risk, driven by uncertainty and volatility of key macroeconomic variables, is one of the primary factors influencing our qualitative reserve. As the economic recovery following the COVID-19 pandemic has continued, we have assessed risks to the recovery, including potential for continuing impacts from COVID-19 variants, challenges in the global supply chain, and recent inflationary trends, as well as potential impacts from ending monetary and fiscal stimulus programs. In addition to judgment applied atto the commercial portfolio as a whole, we continued to apply management
Citizens Financial Group, Inc. | 34
judgment to adjust the modeled reserves in the commercial industry sectors most impacted by the COVID-19 pandemic and associated lockdowns, including CRE retail, CRE office and hospitality and casual dining.
Our determination of the ACL is sensitive to changes in forecasted macroeconomic conditions during the reasonable and supportable period. To illustrate the sensitivity, we applied a more pessimistic scenario than that described above which assumes that challenges in wide-spread distribution and acceptance of vaccines cause COVID-19 related hospitalizationCOVID-19-related infections to abate later than in our base case scenario, with concerns rising about resistant strains. Consumer spending is slower to rebound, with businesses reopening more slowly and fatality rates to be higher than base case. The decline in consumervacation spending from associated reductions in travel and an increase in state and local government restrictions cause real GDP to drop and unemployment to rise beyond our current forecast.muted. This pessimistic scenario reflects real GDP growth of approximately 2.5% and unemployment in the range of 8%5.9% to 8.5%8.4% over 2021. Excluding consideration of qualitative adjustments, this scenario would result in a quantitative lifetime loss estimate of approximately 1.2x our period endmodeled period-end ACL, or an increase of approximately $350$230 million. This analysis relates only to the modeled credit loss estimate and not to the overall period-end ACL, which includes qualitative adjustments.
Because several quantitative and qualitative factors are considered in determining the ACL, this sensitivity analysis does not necessarily reflect the nature and extent of future changes in the ACL or even what the ACL would be under these economic circumstances. The sensitivity is intended to provide insights into the impact of adverse changes in the macroeconomic environment and the corresponding impact to modeled loss estimates. The hypothetical determination does not incorporate the impact of management judgment or other qualitative factors that could be applied in the actual estimation of the ACL and does not imply any expectation of future deterioration in our loss rates.
To provide additional context regarding sensitivity to more pessimistic scenarios, our ACL balance of $2.4$2.0 billion represents 28%23% of the $8.6 billion of nine-quarternine-quarter losses projected in the Federal Reserve run of the December 2020 Supervisory Severely Adverse scenario, (the “Supervisory Severely Adverse scenario”), which forecasted more protracted unemployment and GDP declines compared with our ACL calculation. Our ACL calculation also included the impacts of government stimulus.
Comparatively, our ACL represents 47%39% of the $5.1 billion of projected losses in the Company run results of the Supervisory Severely Adverse scenario. Losses projected under the Company run Supervisory Severely Adverse scenario are lower than the Federal Reserve run results due to methodology and modeling differences. As an example, the Federal Reserve’s models did not recognize contractual loss sharing arrangements in the merchant loan portfolio. In addition, bothBoth the Company run and Federal Reserve run results include incremental losses associated with loan
Citizens Financial Group, Inc. | 41
originations assumed post-Junepost-September 30, 2020. In contrast, our March 31,September 30, 2021 ACL balance considers only existing loans and lines of credit as of the reporting date.
While the economic recovery path is clearer than it was atfrom the end of the fourth quarter 2020,COVID-19 pandemic continues, significant future uncertainty still exists, including progress in the rollout,impacts of COVID-19 variants and challenges from vaccine acceptance rates on consumer sentiment and effectiveness of COVID-19-related vaccines.spending behavior. It remains difficult to estimate how changes in economic forecasts might affect our ACL because such forecasts consider a wide variety of variables and inputs, and changes in the variables and inputs may not occur at the same time or in the same direction, and such changes may have differing impacts by product types. Further, theThe variables and inputs may be idiosyncratically affected by existing or futurerisks to the recovery, including potential for continuing impacts from COVID-19 variants, challenges in the global supply chain and recent inflationary trends, as well as potential impacts from ending monetary and fiscal stimulus programs and forbearance and other customer accommodation efforts. Nevertheless, changesprograms. Changes in one or multiple of the key variables may have a material impact to our estimation of expected credit losses.
We continue to monitor the impact of COVID-19 vaccination efforts, and related fiscal and monetary policy measures on the economy and the resulting potentially material effects on the ACL.
For additional information regarding the ALLL and allowance for unfunded lending commitments,ACL, see Note 14 of this report, and “Critical Accounting Estimates” and Note 4.
Citizens Financial Group, Inc. | 35
RISK GOVERNANCE
We are committed to maintaining a strong, integrated, and proactive approach to the management of all risks to which we are exposed in pursuit of our business objectives. A key aspect of our Board’s responsibility as the main decision making body is setting our risk appetite to ensure that the levels of risk that we are willing to accept in the attainment of our strategic business and financial objectives are clearly understood.
To enable our Board to carry out its objectives, it has delegated authority for risk management activities, as well as governance and oversight of those activities, to a number of Board and executive management level risk committees. The Executive Risk Committee (“ERC”), chaired by the Chief Risk Officer, is responsible for oversight of risk across the enterprise and actively considers our inherent material risks, analyzes our overall risk profile and seeks confirmation that the risks are being appropriately identified, assessed and mitigated. Reporting to the ERC are the following additional committees covering specific areas of risk: Compliance and Operational Risk Committee, Model Risk Committee, Credit Policy Committee, Asset Liability Committee, Business Initiatives Review Committee, and the Conduct and Ethics Committee.
There have been no significant changes in our risk governance practices, risk framework, risk appetite, or credit risk as described in “—Risk Governance” in our 2020 Form 10-K.
MARKET RISK
Market risk refers to potential losses arising from changes in interest rates, foreign exchange rates, equity prices, commodity prices and/or other relevant market rates or prices. Modest market risk arises from trading activities that serve customer needs, including hedging of interest rate and foreign exchange risk. As described below, more material market risk arises from our non-trading banking activities, such as loan origination and deposit-gathering. We have established enterprise-wide policies and methodologies to identify, measure, monitor and report market risk. We actively manage market risk for both non-trading and trading activities.
Non-Trading Risk
We are exposed to market risk as a result of non-trading banking activities. This market risk is substantially composed of interest rate risk, as we have no commodity risk and de minimis direct currency and equity risk. We also have market risk related to capital markets loan originations, as well as the valuation of our MSRs. There have been no significant changes in our sources of interest rate risk, interest rate risk practices, risk framework, metrics or assumptions as described in “—Market Risk — Non-Trading Risk” in our 2020 Form 10-K.
The table below reports net interest income exposures against a variety of interest rate scenarios. Our policies involve measuring exposures as a percentage change in net interest income over the next year due to either instantaneous or gradual parallel changes in rates relative to the market implied forward yield curve. As the following table illustrates, our balance sheet is asset sensitive; net interest income would benefit from an increase in interest rates, while exposure to a decline in interest rates is within limit. While an instantaneous and severe shift in interest rates is included in this analysis, we believe that any actual shift in interest rates would likely be more gradual and therefore have a more modest impact.
Citizens Financial Group, Inc. | 42
The table below presents the sensitivity of net interest income to various parallel yield curve shifts from the market implied forward yield curve:
| | | | | | | | | | | |
| Table 25: Sensitivity of Net Interest Income | | | |
| Estimated % Change in Net Interest Income over 12 Months |
| Basis points | March 31, 2021 | | December 31, 2020 |
| Instantaneous Change in Interest Rates | | | |
| 200 | 17.6 | % | | 21.2 | % |
| 100 | 9.1 | | | 11.2 | |
| -25 | (2.3) | | | (2.7) | |
| Gradual Change in Interest Rates | | | |
| 200 | 8.5 | | | 10.8 | |
| 100 | 4.3 | | | 5.5 | |
| -25 | (1.3) | | | (1.5) | |
Citizens Financial Group, Inc. | 36
| | | | | | | | | | | |
| Table 29: Sensitivity of Net Interest Income | | | |
| Estimated % Change in Net Interest Income over 12 Months |
| Basis points | September 30, 2021 | | December 31, 2020 |
| Instantaneous Change in Interest Rates | | | |
| 200 | 20.8 | % | | 21.2 | % |
| 100 | 10.9 | | | 11.2 | |
| -25 | (2.4) | | | (2.7) | |
| Gradual Change in Interest Rates | | | |
| 200 | 9.8 | | | 10.8 | |
| 100 | 4.9 | | | 5.5 | |
| -25 | (1.2) | | | (1.5) | |
We continue to manage asset sensitivity within the scope of our policy and changing market conditions. Asset sensitivity against a 200 basis point gradual increase in rates decreased 1.0% to 8.5% at March 31,9.8% as of September 30, 2021 fromas compared to 10.8% at December 31, 2020, driven byresulting from loan and deposit mix changes and the purchaseaddition of $7.0$10.5 billion of receive-fixed/pay-variable interest rate swaps and forecasted changes in balance sheet activity.swaps. Current levels of asset sensitivity areremain elevated relative to our core sensitivity profile due to meaningful increases inthese cash and deposit balances aswhich are a result of monetary and fiscal stimulus programs. In light of the yield curve steepening experienced in first quarter 2021, asset sensitivity has been reduced as we continue to balance near term net interest income considerations with the potential future benefit of rising short-term rates. Changes in interest rates can also affect the risk positions, which impactimpacts the repricing sensitivity or beta of the deposit base as well as the cash flows on assets that allow for early payoff without a penalty. The risk position is managed within our risk limits, and long-term view of interest rates through occasional adjustments to securities investments, interest rate swaps and mix of funding.
We use a valuation measure of exposure to structural interest rate risk, Economic Value of Equity (“EVE”), as a supplement to net interest income simulations. EVE complements net interest income simulation analysis as it estimates risk exposure over a long-term horizon. EVE measures the extent to which the economic value of assets, liabilities and off-balance sheet instruments may change in response to fluctuations in interest rates. This analysis is highly dependent upon assumptions applied to assets and liabilities with non-contractual maturities. The change in value is expressed as a percentage of regulatory capital.
We use interest rate swap contracts to manage the interest rate exposure to variability in the interest cash flows on our floating-rate assets and floating-rate wholesale funding, and to hedge market risk on fixed-rate capital markets debt issuances.
| | Table 26: Interest Rate Swap Contracts Used to Manage Non-Trading Interest Rate Exposure | | |
| Table 30: Interest Rate Swap Contracts Used to Manage Non-Trading Interest Rate Exposure | | Table 30: Interest Rate Swap Contracts Used to Manage Non-Trading Interest Rate Exposure | |
| | March 31, 2021 | | December 31, 2020 | | September 30, 2021 | | December 31, 2020 |
| | | | Weighted Average | | | Weighted Average | | | | Weighted Average | | | Weighted Average |
| (dollars in millions) | (dollars in millions) | Notional Amount | | Maturity (Years) | Receive Rate | Pay Rate | | Notional Amount | | Maturity (Years) | Receive Rate | Pay Rate | (dollars in millions) | Notional Amount | | Maturity (Years) | Receive Rate | Pay Rate | | Notional Amount | | Maturity (Years) | Receive Rate | Pay Rate |
Cash flow - receive-fixed/pay-variable - conventional ALM(1) | Cash flow - receive-fixed/pay-variable - conventional ALM(1) | $18,350 | | | 2.4 | | 1.2 | % | 0.1 | % | | $12,350 | | | 1.0 | | 1.5 | % | 0.2 | % | Cash flow - receive-fixed/pay-variable - conventional ALM(1) | $16,250 | | | 3.2 | | 1.1 | % | 0.1 | % | | $12,350 | | | 1.0 | | 1.5 | % | 0.2 | % |
| Fair value - receive-fixed/pay-variable - conventional debt | Fair value - receive-fixed/pay-variable - conventional debt | 3,200 | | | 1.4 | | 2.1 | | 0.2 | | | 3,200 | | | 1.7 | | 2.1 | | 0.2 | | Fair value - receive-fixed/pay-variable - conventional debt | 2,200 | | | 1.5 | | 2.5 | | 0.1 | | | 3,200 | | | 1.7 | | 2.1 | | 0.2 | |
Cash flow - pay-fixed/receive-variable - conventional ALM(1)(2) | Cash flow - pay-fixed/receive-variable - conventional ALM(1)(2) | 3,000 | | | 3.2 | | 0.1 | | 1.7 | | | 4,750 | | | 3.9 | | 0.2 | | 1.4 | | Cash flow - pay-fixed/receive-variable - conventional ALM(1)(2) | 3,000 | | | 2.7 | | 0.1 | | 1.7 | | | 4,750 | | | 3.9 | | 0.2 | | 1.4 | |
Fair value - pay-fixed/receive-variable - conventional ALM(1) | Fair value - pay-fixed/receive-variable - conventional ALM(1) | 2,000 | | | 3.5 | | 0.1 | | 1.5 | | | 2,000 | | | 3.7 | | 0.2 | | 1.5 | | Fair value - pay-fixed/receive-variable - conventional ALM(1) | 2,000 | | | 3.0 | | 0.1 | | 1.5 | | | 2,000 | | | 3.7 | | 0.2 | | 1.5 | |
| Total portfolio swaps | Total portfolio swaps | $26,550 | | | 2.5 | | 1.1 | % | 0.4 | % | | $22,300 | | | 2 | | 1.2 | % | 0.6 | % | Total portfolio swaps | $23,450 | | | 3.0 | | 1.0 | % | 0.4 | % | | $22,300 | | | 2.0 | | 1.2 | % | 0.6 | % |
|
(1) Asset Liability Management (“ALM”) strategies used to manage interest rate exposures include interest rate swap contracts used to manage exposure to the variability in the interest cash flows on our floating-rate commercial loans and floating-rate wholesale funding, as well as the variability in the fair value of AFS securities.
(2) December 31, 2020 includes $1.8 billion of forward-starting, pay-fixed interest rate swaps that were terminated in the first quarter of 2021.
Using the interest rate curve at March 31,September 30, 2021, the estimated net contribution to net interest income related to our ALM hedge strategies is approximately $93$103 million for the full-year 2021 compared to $133 million for the full-year 2020 which represents a decrease of $40 million. This amount2020. The estimated net contribution could differ from amounts actually recognized due to changes in interest rates hedge de-designations, and the addition of other hedges subsequent to March 31,September 30, 2021.
Citizens Financial Group, Inc. | 3743
The following table presents the pre-tax net gains (losses) recorded in the Consolidated Statements of Operations and in the Consolidated Statements of Comprehensive Income relating to derivative instruments designated as cash flow hedges:
| | | | | | | | | | | | | | | |
Table 27: Pre-Tax Gains (Losses) Recorded in the Consolidated Statements of Operations and the Consolidated Statements of Comprehensive Income(1) |
| | | Three Months Ended March 31, |
| (in millions) | | | | | 2021 | | 2020 |
| Amount of pre-tax net (losses) gains recognized in OCI | | | | | ($28) | | | $129 | |
| Amount of pre-tax net gains reclassified from OCI into interest income | | | | | 46 | | | 5 | |
| Amount of pre-tax net losses reclassified from OCI into interest expense | | | | | (12) | | | (1) | |
| | | | | | | | | | | | | | | | | | | | | | | | | | |
| Table 31: Pre-Tax Gains (Losses) Recorded in the Consolidated Statements of Operations and the Consolidated Statements of Comprehensive Income | | | |
| Three Months Ended September 30, | | Nine Months Ended September 30, | | | |
| (in millions) | 2021 | | 2020 | | 2021 | | 2020 | | | |
| Amount of pre-tax net gains (losses) recognized in OCI | ($15) | | | $— | | | $19 | | | $118 | | | | |
| Amount of pre-tax net gains (losses) reclassified from OCI into interest income | 46 | | | 68 | | | 141 | | | 128 | | | | |
| Amount of pre-tax net gains (losses) reclassified from OCI into interest expense | (13) | | | (11) | | | (37) | | | (22) | | | | |
(1) Using the interest rate curve at March 31,September 30, 2021, with respect to cash flow hedge strategies, we estimate that approximately $94$76 million will be reclassified from AOCI to net interest income over the next 12 months.
LIBOR Transition
As previously disclosed, many of our lending products, securities, derivatives, and other financial transactions utilize the LIBOR benchmark rate and will be impacted by its planned discontinuance. In late 2018, we formed a LIBOR Transition Program designed to guide the organization through the planned discontinuation of LIBOR. The Program, with direction and oversight from our Chief Financial Officer, is responsible for developing, maintaining and executing against a coordinated strategy to ensure a timely and orderly transition from LIBOR. The Program is structured to address various initiatives including program governance, transition management, communications, exposure management, new alternative reference rate product delivery, risk management, contract remediation, operations and technology readiness, accounting and reporting, as well as tax and regulation impacts. We have identified and are monitoring the risksRisks associated with the LIBOR transition are tracked and reviewed on a quarterly basis.basis with a focus on the identification of mitigation actions.
The ARRC recommended that banks be systemically and operationally capable of supporting transactions in alternative reference rates, such as SOFR, by the end of September 2020. Guided by this milestone, we are systemically and operationally prepared to support alternative reference rate transactions. On March 5, 2021, the Financial Conduct Authority (“FCA”) formally announced the future cessation or loss of representation of the LIBOR benchmark settings currently published by the Intercontinental Exchange (“ICE”) Benchmark Administration. Further, the FCA stated that the 1-week and 2-month U.S. dollarDollar LIBOR rates will cease as of December 31, 2021 and all other U.S. dollarDollar LIBOR tenors will cease as of June 30, 2023. With the FRB, OCC, and FDIC (collectively, the agencies) supporting this announcement, the LIBOR Transition Program adjusted LIBOR transition activities and timelines accordingly. The agencies are still urgingcontinue to urge market participants to stop entering into new U.S. dollarDollar LIBOR contracts as soon as practicable, but no later than the end of 2021. We are continuing all efforts to move new originations to alternative reference rates over the course of 2021.2021 in anticipation of this deadline. However, our plans for legacy contract remediation now extend through mid-2023.mid-2023 given the FCA announcement. More broadly, program governance remains robust, and progress has been made in the above-outlined initiatives as management continues to closely monitor industry and regulatory developments pertaining to the transition.
Capital Markets
A key component of our capital markets activities is the underwriting and distribution of corporate credit facilities to partially finance mergersmerger and acquisitionsacquisition transactions for our clients. We have a rigorous risk management process around these activities, including a limit structure capping our underwriting risk, our potential loss, and sub limits for specific asset classes. Further, the ability to approve underwriting exposure is delegated only to senior level individuals in the credit risk management and capital markets organizations with each transaction adjudicated in the Loan Underwriting Approval Committee.
Mortgage Servicing Rights
We have market risk associated with the value of residential MSRs, which are impacted by various types of inherent risks, including duration, basis, convexity, volatility and yield curve.
As part of our overall risk management strategy relative to the fair market value of the MSRs, we enter into various free-standing derivatives, such as interest rate swaps, interest rate swaptions, interest rate futures, and forward contracts to purchase mortgage-backed securities to economically hedge the changes in fair value. As of March 31,September 30, 2021 and December 31, 2020, the fair value of our MSRs was $893$978 million and $658 million, respectively, and the total notional amount of related derivative contracts was $15.0$15.4 billion and $11.4 billion,
Citizens Financial Group, Inc. | 3844
respectively. Gains and losses on MSRs and the related derivatives used for hedging are included in mortgage banking fees onin the Consolidated Statements of Operations.
As with our traded market risk-based activities, earnings at-risk excludes the impact of MSRs. MSRs are captured under our single price risk management framework that is used for calculating a management value at risk that is consistent with the definition used by banking regulators, as defined below.regulators.
Trading Risk
We are exposed to market risk primarily through client facilitation activities including derivatives and foreign exchange products as well as underwriting and market making activities. Exposure is created as a result of changes in interest rates and related basis spreads and volatility, foreign exchange rates, and credit spreads on a select range of interest rates, foreign exchange, commodities, corporate bonds and secondary loan instruments. These trading activities are conducted through CBNA and CCMI. There have been no significant changes in our market risk governance, market risk measurement, or market risk practices including VaR, stressed VaR, sensitivity analysis, stress testing, or VaR model review and validation as described in “—Market Risk — Trading Risk” in our 2020 Form 10-K.
Market Risk Regulatory Capital
The U.S. banking regulators’ “Market Risk Rule” covers the calculation of market risk capital. For the purposes of the Market Risk Rule, all of our client facing trades and associated hedges maintain a net low risk and do qualify as “covered positions.” The internal management VaR measure is calculated based on the same population of trades that is utilized for regulatory VaR.
| | Table 28: Results of Modeled and Non-Modeled Measures for Regulatory Capital Calculations | |
| Table 32: Results of Modeled and Non-Modeled Measures for Regulatory Capital Calculations | | Table 32: Results of Modeled and Non-Modeled Measures for Regulatory Capital Calculations |
| (in millions) | (in millions) | | For the Three Months Ended March 31, 2021 | | For the Three Months Ended March 31, 2020 | (in millions) | | For the Three Months Ended September 30, 2021 | | For the Three Months Ended September 30, 2020 |
Market Risk Category | Market Risk Category | | Period End | | Average | | High | | Low | | Period End | | Average | | High | | Low | Market Risk Category | | Period End | | Average | | High | | Low | | Period End | | Average | | High | | Low |
| Interest Rate | Interest Rate | | $2 | | | $3 | | | $6 | | | $1 | | | $1 | | | $1 | | | $4 | | | $— | | Interest Rate | | $1 | | | $1 | | | $3 | | | $— | | | $1 | | | $1 | | | $4 | | | $1 | |
| Foreign Exchange Currency Rate | Foreign Exchange Currency Rate | | — | | | — | | | — | | | — | | | — | | | — | | | — | | | — | | Foreign Exchange Currency Rate | | 1 | | | 1 | | | 1 | | | 1 | | | — | | | — | | | 4 | | | — | |
| Credit Spread | Credit Spread | | 15 | | | 13 | | | 18 | | | 6 | | | 14 | | | 5 | | | 14 | | | 4 | | Credit Spread | | 6 | | | 9 | | | 14 | | | 4 | | | 11 | | | 10 | | | 12 | | | 7 | |
| Commodity | Commodity | | — | | | — | | | — | | | — | | | — | | | — | | | — | | | — | | Commodity | | — | | | — | | | — | | | — | | | — | | | — | | | — | | | — | |
| General VaR | General VaR | | 14 | | | 12 | | | 16 | | | 7 | | | 13 | | | 5 | | | 14 | | | 4 | | General VaR | | 6 | | | 10 | | | 14 | | | 4 | | | 11 | | | 8 | | | 15 | | | 6 | |
| Specific Risk VaR | Specific Risk VaR | | — | | | — | | | — | | | — | | | — | | | — | | | — | | | — | | Specific Risk VaR | | — | | | — | | | — | | | — | | | — | | | — | | | — | | | — | |
| Total VaR | Total VaR | | $14 | | | $12 | | | $16 | | | $7 | | | $13 | | | $5 | | | $14 | | | $4 | | Total VaR | | $6 | | | $10 | | | $17 | | | $4 | | | $11 | | | $8 | | | $15 | | | $6 | |
| Stressed General VaR | Stressed General VaR | | $18 | | | $15 | | | $19 | | | $9 | | | $15 | | | $11 | | | $15 | | | $9 | | Stressed General VaR | | $8 | | | $11 | | | $16 | | | $5 | | | $13 | | | $10 | | | $20 | | | $7 | |
| Stressed Specific Risk VaR | Stressed Specific Risk VaR | | — | | | — | | | — | | | — | | | — | | | — | | | — | | | — | | Stressed Specific Risk VaR | | — | | | — | | | — | | | — | | | — | | | — | | | — | | | — | |
| Total Stressed VaR | Total Stressed VaR | | $18 | | | $15 | | | $19 | | | $9 | | | $15 | | | $11 | | | $15 | | | $9 | | Total Stressed VaR | | $8 | | | $11 | | | $16 | | | $5 | | | $13 | | | $10 | | | $20 | | | $7 | |
| Market Risk Regulatory Capital | Market Risk Regulatory Capital | | $82 | | | | $50 | | | | | Market Risk Regulatory Capital | | $62 | | | | | $55 | | | | |
| Specific Risk Not Modeled Add-on | Specific Risk Not Modeled Add-on | | 15 | | | 12 | | | Specific Risk Not Modeled Add-on | | 16 | | | 12 | | |
| | Total Market Risk Regulatory Capital | Total Market Risk Regulatory Capital | | $97 | | | $62 | | | Total Market Risk Regulatory Capital | | $78 | | | $67 | | |
| Market Risk-Weighted Assets | Market Risk-Weighted Assets | | $1,216 | | | $774 | | | Market Risk-Weighted Assets | | $973 | | | $834 | | |
VaR Backtesting
Backtesting is one form of validation of the VaR model and is run daily. The Market Risk Rule requires a comparison of our internal VaR measure to the actual net trading revenue (excluding fees, commissions, reserves, intra-day trading and net interest income) for each day over the preceding year (the most recent 250 business days). Any observed loss in excess of the VaR number is taken as an exception. The level of exceptions determines the multiplication factor used to derive the VaR and SVaR-based capital requirement for regulatory reporting purposes, when applicable. We perform sub-portfolio backtesting as required under the Market Risk Rule, using models approved by our banking regulators, for interest rate, credit spread, commodity, and foreign exchange positions.
Citizens Financial Group, Inc. | 3945
The following graph shows our daily net trading revenue and total internal, modeled VaR for the twelve months ended March 31,September 30, 2021.
Daily VaR Backtesting
Citizens Financial Group, Inc. | 4046
NON-GAAP FINANCIAL MEASURES AND RECONCILIATIONS
For more information on the computation of our non-GAAP financial measures, see “—Introduction — Non-GAAP Financial Measures,” included in this Report. The following tables present computations of non-GAAP financial measures representing our Underlying results used throughout the MD&A:
| | Table 29: Reconciliations of Non-GAAP Measures | | | | |
| Table 33: Reconciliations of Non-GAAP Measures | | Table 33: Reconciliations of Non-GAAP Measures | |
| | | | | As of and for the Three Months Ended March 31, | | | As of and for the Three Months Ended September 30, | | As of and for the Nine Months Ended September 30, |
| (in millions, except share, per share and ratio data) | (in millions, except share, per share and ratio data) | Ref. | | 2021 | | 2020 | (in millions, except share, per share and ratio data) | Ref. | 2021 | | 2020 | | 2021 | | 2020 |
| | Total revenue, Underlying: | Total revenue, Underlying: | | | | | | Total revenue, Underlying: | | | | | | | |
| Total revenue (GAAP) | Total revenue (GAAP) | A | | $1,659 | | | $1,657 | | Total revenue (GAAP) | A | $1,659 | | | $1,791 | | | $4,927 | | | $5,198 | |
| Less: Notable items | Less: Notable items | | | — | | | — | | Less: Notable items | | — | | | — | | | — | | | — | |
| | Total revenue, Underlying (non-GAAP) | Total revenue, Underlying (non-GAAP) | B | | $1,659 | | | $1,657 | | Total revenue, Underlying (non-GAAP) | B | $1,659 | | | $1,791 | | | $4,927 | | | $5,198 | |
| Noninterest expense, Underlying: | Noninterest expense, Underlying: | | | | | | Noninterest expense, Underlying: | | | | | | | |
| Noninterest expense (GAAP) | Noninterest expense (GAAP) | C | | $1,018 | | | $1,012 | | Noninterest expense (GAAP) | C | $1,011 | | | $988 | | | $3,020 | | | $2,979 | |
| Less: Notable items | Less: Notable items | | | 20 | | | 33 | | Less: Notable items | | 23 | | | 31 | | | 54 | | | 83 | |
| | Noninterest expense, Underlying (non-GAAP) | Noninterest expense, Underlying (non-GAAP) | D | | $998 | | | $979 | | Noninterest expense, Underlying (non-GAAP) | D | $988 | | | $957 | | | $2,966 | | | $2,896 | |
| Pre-provision profit: | Pre-provision profit: | | | | | | Pre-provision profit: | | | | | | | |
| Total revenue (GAAP) | Total revenue (GAAP) | A | | $1,659 | | | $1,657 | | Total revenue (GAAP) | A | $1,659 | | | $1,791 | | | $4,927 | | | $5,198 | |
| Less: Noninterest expense (GAAP) | Less: Noninterest expense (GAAP) | C | | 1,018 | | | 1,012 | | Less: Noninterest expense (GAAP) | C | 1,011 | | | 988 | | | 3,020 | | | 2,979 | |
| Pre-provision profit (GAAP) | Pre-provision profit (GAAP) | | | $641 | | | $645 | | Pre-provision profit (GAAP) | | $648 | | | $803 | | | $1,907 | | | $2,219 | |
| Pre-provision profit, Underlying | Pre-provision profit, Underlying | | | | | | Pre-provision profit, Underlying | | | | | | | |
| Total revenue, Underlying (non-GAAP) | Total revenue, Underlying (non-GAAP) | B | | $1,659 | | | $1,657 | | Total revenue, Underlying (non-GAAP) | B | $1,659 | | | $1,791 | | | $4,927 | | | $5,198 | |
| Less: Noninterest expense, Underlying (non-GAAP) | Less: Noninterest expense, Underlying (non-GAAP) | D | | 998 | | | 979 | | Less: Noninterest expense, Underlying (non-GAAP) | D | 988 | | | 957 | | | 2,966 | | | 2,896 | |
| Pre-provision profit, Underlying (non-GAAP) | Pre-provision profit, Underlying (non-GAAP) | | | $661 | | | $678 | | Pre-provision profit, Underlying (non-GAAP) | | $671 | | | $834 | | | $1,961 | | | $2,302 | |
| | Income before income tax expense, Underlying: | Income before income tax expense, Underlying: | | | | | | Income before income tax expense, Underlying: | | | | | | | |
| Income before income tax expense (GAAP) | Income before income tax expense (GAAP) | E | | $781 | | | $45 | | Income before income tax expense (GAAP) | E | $681 | | | $375 | | | $2,293 | | | $727 | |
| Less: Expense before income tax benefit related to notable items | | | (20) | | | (33) | | |
| Less: Income (loss) before income tax expense (benefit) related to notable items | | Less: Income (loss) before income tax expense (benefit) related to notable items | | (23) | | | (31) | | | (54) | | | (83) | |
| Income before income tax expense, Underlying (non-GAAP) | Income before income tax expense, Underlying (non-GAAP) | F | | $801 | | | $78 | | Income before income tax expense, Underlying (non-GAAP) | F | $704 | | | $406 | | | $2,347 | | | $810 | |
| Income tax expense and effective income tax rate, Underlying: | Income tax expense and effective income tax rate, Underlying: | | | | | | Income tax expense and effective income tax rate, Underlying: | | | | | | | |
| Income tax expense (GAAP) | Income tax expense (GAAP) | G | | $170 | | | $11 | | Income tax expense (GAAP) | G | $151 | | | $61 | | | $504 | | | $126 | |
| Less: Income tax benefit related to notable items | | | (5) | | | (8) | | |
| Less: Income tax expense (benefit) related to notable items | | Less: Income tax expense (benefit) related to notable items | | (7) | | | (7) | | | (15) | | | (24) | |
| | Income tax expense, Underlying (non-GAAP) | Income tax expense, Underlying (non-GAAP) | H | | $175 | | | $19 | | Income tax expense, Underlying (non-GAAP) | H | $158 | | | $68 | | | $519 | | | $150 | |
| Effective income tax rate (GAAP) | Effective income tax rate (GAAP) | G/E | | 21.76 | % | | 24.13 | % | Effective income tax rate (GAAP) | G/E | 22.35 | % | | 16.10 | % | | 22.01 | % | | 17.27 | % |
| Effective income tax rate, Underlying (non-GAAP) | Effective income tax rate, Underlying (non-GAAP) | H/F | | 21.85 | | | 24.52 | | Effective income tax rate, Underlying (non-GAAP) | H/F | 22.45 | | | 16.79 | | | 22.09 | | | 18.57 | |
| Net income, Underlying: | Net income, Underlying: | | | | Net income, Underlying: | |
| Net income (GAAP) | Net income (GAAP) | I | | $611 | | | $34 | | Net income (GAAP) | I | $530 | | | $314 | | | $1,789 | | | $601 | |
| Add: Notable items, net of income tax benefit | Add: Notable items, net of income tax benefit | | | 15 | | | 25 | | Add: Notable items, net of income tax benefit | | 16 | | | 24 | | | 39 | | | 59 | |
| | Net income, Underlying (non-GAAP) | Net income, Underlying (non-GAAP) | J | | $626 | | | $59 | | Net income, Underlying (non-GAAP) | J | $546 | | | $338 | | | $1,828 | | | $660 | |
| Net income available to common stockholders, Underlying: | Net income available to common stockholders, Underlying: | | | | | | Net income available to common stockholders, Underlying: | | | | | | | |
| Net income available to common stockholders (GAAP) | Net income available to common stockholders (GAAP) | K | | $588 | | | $12 | | Net income available to common stockholders (GAAP) | K | 504 | | | 289 | | | $1,708 | | | $526 | |
| Add: Notable items, net of income tax benefit | Add: Notable items, net of income tax benefit | | | 15 | | | 25 | | Add: Notable items, net of income tax benefit | | 16 | | | 24 | | | 39 | | | 59 | |
| | Net income available to common stockholders, Underlying (non-GAAP) | Net income available to common stockholders, Underlying (non-GAAP) | L | | $603 | | | $37 | | Net income available to common stockholders, Underlying (non-GAAP) | L | $520 | | | $313 | | | $1,747 | | | $585 | |
| Return on average common equity and return on average common equity, Underlying: | Return on average common equity and return on average common equity, Underlying: | | | | | | Return on average common equity and return on average common equity, Underlying: | | | | | | | |
| Average common equity (GAAP) | Average common equity (GAAP) | M | | $20,611 | | | $20,223 | | Average common equity (GAAP) | M | $21,326 | | | $20,534 | | | $20,926 | | | $20,401 | |
| Return on average common equity | Return on average common equity | K/M | | 11.57 | % | | 0.24 | % | Return on average common equity | K/M | 9.39 | % | | 5.60 | % | | 10.91 | % | | 3.45 | % |
Return on average common equity, Underlying (non-GAAP) | Return on average common equity, Underlying (non-GAAP) | L/M | | 11.85 | | | 0.74 | | Return on average common equity, Underlying (non-GAAP) | L/M | 9.70 | | | 6.05 | | | 11.17 | | | 3.83 | |
| |
Citizens Financial Group, Inc. | 4147
| | | | | | As of and for the Three Months Ended March 31, | | | As of and for the Three Months Ended September 30, | | As of and for the Nine Months Ended September 30, |
| (in millions, except share, per share and ratio data) | (in millions, except share, per share and ratio data) | Ref. | | 2021 | | 2020 | (in millions, except share, per share and ratio data) | Ref. | 2021 | | 2020 | | 2021 | | 2020 |
| Return on average tangible common equity and return on average tangible common equity, Underlying: | Return on average tangible common equity and return on average tangible common equity, Underlying: | | | | | | Return on average tangible common equity and return on average tangible common equity, Underlying: | | | | | | | | |
| Average common equity (GAAP) | Average common equity (GAAP) | M | | $20,611 | | | $20,223 | | Average common equity (GAAP) | M | $21,326 | | | $20,534 | | | $20,926 | | | $20,401 | |
| Less: Average goodwill (GAAP) | Less: Average goodwill (GAAP) | | | 7,050 | | | 7,046 | | Less: Average goodwill (GAAP) | | 7,055 | | | 7,050 | | | 7,052 | | | 7,049 | |
| Less: Average other intangibles (GAAP) | Less: Average other intangibles (GAAP) | | | 57 | | | 67 | | Less: Average other intangibles (GAAP) | | 52 | | | 62 | | | 54 | | | 65 | |
| Add: Average deferred tax liabilities related to goodwill (GAAP) | Add: Average deferred tax liabilities related to goodwill (GAAP) | | | 379 | | | 374 | | Add: Average deferred tax liabilities related to goodwill (GAAP) | | 383 | | | 375 | | | 381 | | | 375 | |
| Average tangible common equity | Average tangible common equity | N | | $13,883 | | | $13,484 | | Average tangible common equity | N | $14,602 | | | $13,797 | | | $14,201 | | | $13,662 | |
| Return on average tangible common equity | Return on average tangible common equity | K/N | | 17.17 | % | | 0.36 | % | Return on average tangible common equity | K/N | 13.71 | % | | 8.33 | % | | 16.08 | % | | 5.15 | % |
| Return on average tangible common equity, Underlying (non-GAAP) | Return on average tangible common equity, Underlying (non-GAAP) | L/N | | 17.59 | | | 1.10 | | Return on average tangible common equity, Underlying (non-GAAP) | L/N | 14.17 | | | 9.00 | | | 16.46 | | | 5.71 | |
| Return on average total assets and return on average total assets, Underlying: | Return on average total assets and return on average total assets, Underlying: | | | | Return on average total assets and return on average total assets, Underlying: | |
| Average total assets (GAAP) | Average total assets (GAAP) | O | | $182,569 | | | $167,177 | | Average total assets (GAAP) | O | $186,108 | | | $177,675 | | | $184,391 | | | $174,892 | |
| Return on average total assets | Return on average total assets | I/O | | 1.36 | % | | 0.08 | % | Return on average total assets | I/O | 1.13 | % | | 0.70 | % | | 1.30 | % | | 0.46 | % |
| Return on average total assets, Underlying (non-GAAP) | Return on average total assets, Underlying (non-GAAP) | J/O | | 1.39 | | | 0.14 | | Return on average total assets, Underlying (non-GAAP) | J/O | 1.16 | | | 0.76 | | | 1.33 | | | 0.50 | |
| Return on average total tangible assets and return on average total tangible assets, Underlying: | Return on average total tangible assets and return on average total tangible assets, Underlying: | | | | Return on average total tangible assets and return on average total tangible assets, Underlying: | | |
| Average total assets (GAAP) | Average total assets (GAAP) | O | | $182,569 | | | $167,177 | | Average total assets (GAAP) | O | $186,108 | | | $177,675 | | | $184,391 | | | $174,892 | |
| Less: Average goodwill (GAAP) | Less: Average goodwill (GAAP) | | | 7,050 | | | 7,046 | | Less: Average goodwill (GAAP) | | 7,055 | | | 7,050 | | | 7,052 | | | 7,049 | |
| Less: Average other intangibles (GAAP) | Less: Average other intangibles (GAAP) | | | 57 | | | 67 | | Less: Average other intangibles (GAAP) | | 52 | | | 62 | | | 54 | | | 65 | |
| Add: Average deferred tax liabilities related to goodwill (GAAP) | Add: Average deferred tax liabilities related to goodwill (GAAP) | | | 379 | | | 374 | | Add: Average deferred tax liabilities related to goodwill (GAAP) | | 383 | | | 375 | | | 381 | | | 375 | |
| Average tangible assets | Average tangible assets | P | | $175,841 | | | $160,438 | | Average tangible assets | P | $179,384 | | | $170,938 | | | $177,666 | | | $168,153 | |
| Return on average total tangible assets | Return on average total tangible assets | I/P | | 1.41 | % | | 0.09 | % | Return on average total tangible assets | I/P | 1.17 | % | | 0.73 | % | | 1.35 | % | | 0.48 | % |
| Return on average total tangible assets, Underlying (non-GAAP) | Return on average total tangible assets, Underlying (non-GAAP) | J/P | | 1.44 | | | 0.15 | | Return on average total tangible assets, Underlying (non-GAAP) | J/P | 1.21 | | | 0.79 | | | 1.38 | | | 0.52 | |
| Efficiency ratio and efficiency ratio, Underlying: | Efficiency ratio and efficiency ratio, Underlying: | | | | Efficiency ratio and efficiency ratio, Underlying: | | |
| Efficiency ratio | Efficiency ratio | C/A | | 61.35 | % | | 61.10 | % | Efficiency ratio | C/A | 60.92 | % | | 55.18 | % | | 61.30 | % | | 57.31 | % |
| Efficiency ratio, Underlying (non-GAAP) | Efficiency ratio, Underlying (non-GAAP) | D/B | | 60.19 | | | 59.08 | | Efficiency ratio, Underlying (non-GAAP) | D/B | 59.55 | | | 53.44 | | | 60.21 | | | 55.72 | |
| Operating leverage and operating leverage, Underlying: | Operating leverage and operating leverage, Underlying: | | | | Operating leverage and operating leverage, Underlying: | |
| Increase in total revenue | | | 0.07 | % | | 4.35 | % | |
| (Decrease) increase in total revenue | | (Decrease) increase in total revenue | | (7.33) | % | | 9.29 | % | | (5.20) | % | | 7.07 | % |
| Increase in noninterest expense | Increase in noninterest expense | | | 0.48 | | | 8.06 | | Increase in noninterest expense | | 2.31 | | | 1.52 | | | 1.39 | | | 4.12 | |
| Operating leverage | Operating leverage | | | (0.41 | %) | | (3.71) | % | Operating leverage | | (9.64) | % | | 7.77 | % | | (6.59 | %) | | 2.95 | % |
| Increase in total revenue, Underlying (non-GAAP) | | | 0.07 | % | | 4.35 | % | |
| (Decrease) increase in total revenue, Underlying (non-GAAP) | | (Decrease) increase in total revenue, Underlying (non-GAAP) | | (7.33) | % | | 9.29 | % | | (5.20) | % | | 7.07 | % |
| Increase in noninterest expense, Underlying (non-GAAP) | Increase in noninterest expense, Underlying (non-GAAP) | | | 1.94 | | | 5.09 | | Increase in noninterest expense, Underlying (non-GAAP) | | 3.26 | | | 0.32 | | | 2.45 | | | 2.32 | |
| Operating leverage, Underlying (non-GAAP) | Operating leverage, Underlying (non-GAAP) | | | (1.87 | %) | | (0.74) | % | Operating leverage, Underlying (non-GAAP) | | (10.59) | % | | 8.97 | % | | (7.65 | %) | | 4.75 | % |
| Tangible book value per common share: | Tangible book value per common share: | | | | | | Tangible book value per common share: | | | | | | | |
| Common shares - at period end (GAAP) | Common shares - at period end (GAAP) | Q | | 425,930,159 | | | 426,586,533 | | Common shares - at period end (GAAP) | Q | 426,199,576 | | | 427,073,084 | | | 426,199,576 | | | 427,073,084 | |
| Common stockholders' equity (GAAP) | Common stockholders' equity (GAAP) | | | $20,688 | | | $20,380 | | Common stockholders' equity (GAAP) | | $21,409 | | | $20,504 | | | $21,409 | | | $20,504 | |
| Less: Goodwill (GAAP) | Less: Goodwill (GAAP) | | | 7,050 | | | 7,050 | | Less: Goodwill (GAAP) | | 7,065 | | | 7,050 | | | 7,065 | | | 7,050 | |
| Less: Other intangible assets (GAAP) | Less: Other intangible assets (GAAP) | | | 54 | | | 66 | | Less: Other intangible assets (GAAP) | | 51 | | | 60 | | | 51 | | | 60 | |
| Add: Deferred tax liabilities related to goodwill (GAAP) | Add: Deferred tax liabilities related to goodwill (GAAP) | | | 380 | | | 375 | | Add: Deferred tax liabilities related to goodwill (GAAP) | | 384 | | | 377 | | | 384 | | | 377 | |
| Tangible common equity | Tangible common equity | R | | $13,964 | | | $13,639 | | Tangible common equity | R | $14,677 | | | $13,771 | | | $14,677 | | | $13,771 | |
| Tangible book value per common share | Tangible book value per common share | R/Q | | $32.79 | | | $31.97 | | Tangible book value per common share | R/Q | $34.44 | | | $32.24 | | | $34.44 | | | $32.24 | |
| Net income per average common share - basic and diluted and net income per average common share - basic and diluted, Underlying: | Net income per average common share - basic and diluted and net income per average common share - basic and diluted, Underlying: | | | | Net income per average common share - basic and diluted and net income per average common share - basic and diluted, Underlying: | |
| Average common shares outstanding - basic (GAAP) | Average common shares outstanding - basic (GAAP) | S | | 425,953,716 | | | 427,718,421 | | Average common shares outstanding - basic (GAAP) | S | 426,086,717 | | | 426,846,096 | | | 425,996,867 | | | 427,058,412 | |
| Average common shares outstanding - diluted (GAAP) | Average common shares outstanding - diluted (GAAP) | T | | 427,880,530 | | | 429,388,855 | | Average common shares outstanding - diluted (GAAP) | T | 427,840,964 | | | 427,992,349 | | | 427,679,885 | | | 428,142,358 | |
| Net income per average common share - basic (GAAP) | Net income per average common share - basic (GAAP) | K/S | | $1.38 | | | $0.03 | | Net income per average common share - basic (GAAP) | K/S | $1.18 | | | $0.68 | | | $4.01 | | | $1.23 | |
| Net income per average common share - diluted (GAAP) | Net income per average common share - diluted (GAAP) | K/T | | 1.37 | | | 0.03 | | Net income per average common share - diluted (GAAP) | K/T | 1.18 | | | 0.68 | | | 3.99 | | | 1.23 | |
| Net income per average common share - basic, Underlying (non-GAAP) | Net income per average common share - basic, Underlying (non-GAAP) | L/S | | 1.41 | | | 0.09 | | Net income per average common share - basic, Underlying (non-GAAP) | L/S | 1.22 | | | 0.73 | | | 4.10 | | | 1.37 | |
| Net income per average common share - diluted, Underlying (non-GAAP) | Net income per average common share - diluted, Underlying (non-GAAP) | L/T | | 1.41 | | | 0.09 | | Net income per average common share - diluted, Underlying (non-GAAP) | L/T | 1.22 | | | 0.73 | | | 4.09 | | | 1.37 | |
| Dividend payout ratio and dividend payout ratio, Underlying: | Dividend payout ratio and dividend payout ratio, Underlying: | | | | Dividend payout ratio and dividend payout ratio, Underlying: | |
| Cash dividends declared and paid per common share | Cash dividends declared and paid per common share | U | | $0.39 | | | $0.39 | | Cash dividends declared and paid per common share | U | $0.39 | | | $0.39 | | | $1.17 | | | $1.17 | |
| Dividend payout ratio | Dividend payout ratio | U/(K/S) | | 28 | % | | 1,398 | % | Dividend payout ratio | U/(K/S) | 33 | % | | 58 | % | | 29 | % | | 95 | % |
| Dividend payout ratio, Underlying (non-GAAP) | Dividend payout ratio, Underlying (non-GAAP) | U/(L/S) | | 28 | | | 451 | | Dividend payout ratio, Underlying (non-GAAP) | U/(L/S) | 32 | | | 53 | | | 29 | | | 85 | |
Citizens Financial Group, Inc. | 4248
The following table presents computations of non-GAAP financial measures representing certain metrics excluding the impact of PPP loans used throughout the MD&A:
| | | | | | | | | | | | | | |
| Table 30: Reconciliations of Non-GAAP Measures - Excluding PPP | | | | |
| (in millions, except share, per share and ratio data) | Ref. | March 31, 2021 | | December 31, 2020 |
| Allowance for credit losses to total loans and leases, excluding the impact of PPP loans: | | | | |
| Total loans and leases (GAAP) | A | $122,195 | | | $123,090 | |
| Less: PPP loans | | 5,148 | | | 4,155 | |
| Total loans and leases, excluding the impact of PPP loans (non-GAAP) | B | $117,047 | | | $118,935 | |
| Allowance for credit losses (GAAP) | C | $2,372 | | | $2,670 | |
| Allowance for credit losses to total loans and leases (GAAP) | C/A | 1.94 | % | | 2.17 | % |
| Allowance for credit losses to total loans and leases, excluding the impact of PPP loans (non-GAAP) | C/B | 2.03 | % | | 2.24 | % |
| | | | |
| | | | |
| | | | |
| | | | |
| | | | |
| | | | |
| | | | |
| | | | |
| | | | |
| | | | | | | | | | | | | | |
| Table 34: Reconciliations of Non-GAAP Measures - Excluding PPP | | | | |
| (in millions, except share, per share and ratio data) | Ref. | September 30, 2021 | | December 31, 2020 |
| Allowance for credit losses to total loans and leases, excluding the impact of PPP loans: | | | | |
| Total loans and leases (GAAP) | A | $123,318 | | | $123,090 | |
| Less: PPP loans | | 1,903 | | | 4,155 | |
| Total loans and leases, excluding the impact of PPP loans (non-GAAP) | B | $121,415 | | | $118,935 | |
| Allowance for credit losses (GAAP) | C | $2,004 | | | $2,670 | |
| Allowance for credit losses to total loans and leases (GAAP) | C/A | 1.63 | % | | 2.17 | % |
| Allowance for credit losses to total loans and leases, excluding the impact of PPP loans (non-GAAP) | C/B | 1.65 | % | | 2.24 | % |
| | | | |
| | | | |
| | | | |
| | | | |
| | | | |
| | | | |
| | | | |
| | | | |
| | | | |
The following table presents computations of non-GAAP financial measures representing certain metrics
excluding the impact of elevated cash levels used in “—Net Interest Income”:
| | | | | | | | | | | | | | |
| Table 31: Reconciliations of Non-GAAP Measures - Excluding Elevated Cash | | | | |
| | As of and for the Three Months Ended March 31, | | |
| (in millions, except ratio data) | Ref. | 2021 | 2020 | | | |
| Net interest income, FTE, excluding the impact of elevated cash: | | | | | | |
| Net interest income, FTE (GAAP) | A | $1,120 | | $1,164 | | | | |
| Less: Net interest income associated with elevated cash | | — | | — | | | | |
| Net interest income, FTE, excluding the impact of elevated cash (non-GAAP) | B | $1,120 | | $1,164 | | | | |
| Average interest-earning assets, excluding the impact of elevated cash: | | | | | | |
| Total interest-earning assets (GAAP) | C | $164,381 | | $150,946 | | | | |
| Less: Elevated cash | | 8,985 | | — | | | | |
| Total average interest-earning assets, excluding the impact of elevated cash (non-GAAP) | D | $155,396 | | $150,946 | | | | |
| Day count | E | 90 | | 91 | | | | |
| Day count (year) | F | 365 | | 366 | | | | |
| Ratios: | | | | | | |
| Net interest margin, FTE (GAAP) | A / C / E * F | 2.76 | % | 3.10 | % | | | |
| Net interest margin, FTE, excluding the impact of elevated cash (non-GAAP) | B / D / E * F | 2.92 | % | 3.10 | % | | | |
Citizens Financial Group, Inc. | 4349
ITEM 1. FINANCIAL STATEMENTS
Citizens Financial Group, Inc. | 4450
CONSOLIDATED BALANCE SHEETS (UNAUDITED)
| | (in millions, except share data) | (in millions, except share data) | March 31, 2021 | | December 31, 2020 | (in millions, except share data) | September 30, 2021 | | December 31, 2020 |
| ASSETS: | ASSETS: | | | | ASSETS: | | | |
| Cash and due from banks | Cash and due from banks | $1,117 | | | $1,037 | | Cash and due from banks | $1,145 | | | $1,037 | |
| Interest-bearing cash and due from banks | Interest-bearing cash and due from banks | 13,543 | | | 11,696 | | Interest-bearing cash and due from banks | 12,571 | | | 11,696 | |
| Interest-bearing deposits in banks | Interest-bearing deposits in banks | 308 | | | 306 | | Interest-bearing deposits in banks | 289 | | | 306 | |
Debt securities available for sale, at fair value (including $539 and $549 pledged to creditors, respectively)(1) | 24,467 | | | 22,942 | | |
Debt securities held to maturity (fair value of $3,077 and $3,357 respectively, and including $141 and $144 pledged to creditors, respectively)(1) | 2,995 | | | 3,235 | | |
Debt securities available for sale, at fair value (including $621 and $549 pledged to creditors, respectively)(1) | | Debt securities available for sale, at fair value (including $621 and $549 pledged to creditors, respectively)(1) | 24,911 | | | 22,942 | |
Debt securities held to maturity (fair value of $2,567 and $3,357 respectively, and including $85 and $144 pledged to creditors, respectively)(1) | | Debt securities held to maturity (fair value of $2,567 and $3,357 respectively, and including $85 and $144 pledged to creditors, respectively)(1) | 2,492 | | | 3,235 | |
| Loans held for sale, at fair value | Loans held for sale, at fair value | 4,304 | | | 3,564 | | Loans held for sale, at fair value | 3,177 | | | 3,564 | |
| Other loans held for sale | Other loans held for sale | 75 | | | 439 | | Other loans held for sale | 93 | | | 439 | |
| Loans and leases | Loans and leases | 122,195 | | | 123,090 | | Loans and leases | 123,318 | | | 123,090 | |
| Less: Allowance for loan and lease losses | Less: Allowance for loan and lease losses | (2,194) | | | (2,443) | | Less: Allowance for loan and lease losses | (1,855) | | | (2,443) | |
| Net loans and leases | Net loans and leases | 120,001 | | | 120,647 | | Net loans and leases | 121,463 | | | 120,647 | |
| Derivative assets | Derivative assets | 1,298 | | | 1,915 | | Derivative assets | 1,769 | | | 1,915 | |
| Premises and equipment, net | Premises and equipment, net | 743 | | | 759 | | Premises and equipment, net | 732 | | | 759 | |
| Bank-owned life insurance | Bank-owned life insurance | 2,135 | | | 1,756 | | Bank-owned life insurance | 2,428 | | | 1,756 | |
| Goodwill | Goodwill | 7,050 | | | 7,050 | | Goodwill | 7,065 | | | 7,050 | |
| Other assets | Other assets | 9,181 | | | 8,003 | | Other assets | 8,872 | | | 8,003 | |
| TOTAL ASSETS | TOTAL ASSETS | $187,217 | | | $183,349 | | TOTAL ASSETS | $187,007 | | | $183,349 | |
| LIABILITIES AND STOCKHOLDERS’ EQUITY: | LIABILITIES AND STOCKHOLDERS’ EQUITY: | | LIABILITIES AND STOCKHOLDERS’ EQUITY: | |
| LIABILITIES: | LIABILITIES: | | LIABILITIES: | |
| Deposits: | Deposits: | | Deposits: | |
| Noninterest-bearing | Noninterest-bearing | $46,067 | | | $43,831 | | Noninterest-bearing | $48,184 | | | $43,831 | |
| Interest-bearing | Interest-bearing | 105,282 | | | 103,333 | | Interest-bearing | 104,037 | | | 103,333 | |
| Total deposits | Total deposits | 151,349 | | | 147,164 | | Total deposits | 152,221 | | | 147,164 | |
| Short-term borrowed funds | Short-term borrowed funds | 70 | | | 243 | | Short-term borrowed funds | 8 | | | 243 | |
| Derivative liabilities | Derivative liabilities | 111 | | | 128 | | Derivative liabilities | 187 | | | 128 | |
| Deferred taxes, net | Deferred taxes, net | 593 | | | 629 | | Deferred taxes, net | 689 | | | 629 | |
| Long-term borrowed funds | Long-term borrowed funds | 8,316 | | | 8,346 | | Long-term borrowed funds | 6,947 | | | 8,346 | |
| Other liabilities | Other liabilities | 4,125 | | | 4,166 | | Other liabilities | 3,532 | | | 4,166 | |
| TOTAL LIABILITIES | TOTAL LIABILITIES | 164,564 | | | 160,676 | | TOTAL LIABILITIES | 163,584 | | | 160,676 | |
| Contingencies (refer to Note 11) | Contingencies (refer to Note 11) | 0 | | 0 | Contingencies (refer to Note 11) | 0 | | 0 |
| STOCKHOLDERS’ EQUITY: | STOCKHOLDERS’ EQUITY: | | STOCKHOLDERS’ EQUITY: | |
| Preferred stock: | Preferred stock: | | Preferred stock: | |
| $25.00 par value,100,000,000 shares authorized; 2,000,000 shares issued and outstanding at March 31, 2021 and December 31, 2020, respectively | 1,965 | | | 1,965 | | |
| $25.00 par value,100,000,000 shares authorized; 2,050,000 and 2,000,000 shares issued and outstanding at September 30, 2021 and December 31, 2020, respectively | | $25.00 par value,100,000,000 shares authorized; 2,050,000 and 2,000,000 shares issued and outstanding at September 30, 2021 and December 31, 2020, respectively | 2,014 | | | 1,965 | |
| Common stock: | Common stock: | | Common stock: | |
| $0.01 par value, 1,000,000,000 shares authorized; 570,841,385 shares issued and 425,930,159 shares outstanding at March 31, 2021 and 569,876,133 shares issued and 427,209,831 shares outstanding at December 31, 2020 | 6 | | | 6 | | |
| $0.01 par value, 1,000,000,000 shares authorized; 571,110,802 shares issued and 426,199,576 shares outstanding at September 30, 2021 and 569,876,133 shares issued and 427,209,831 shares outstanding at December 31, 2020 | | $0.01 par value, 1,000,000,000 shares authorized; 571,110,802 shares issued and 426,199,576 shares outstanding at September 30, 2021 and 569,876,133 shares issued and 427,209,831 shares outstanding at December 31, 2020 | 6 | | | 6 | |
| Additional paid-in capital | Additional paid-in capital | 18,945 | | | 18,940 | | Additional paid-in capital | 18,981 | | | 18,940 | |
| Retained earnings | Retained earnings | 6,866 | | | 6,445 | | Retained earnings | 7,648 | | | 6,445 | |
| Treasury stock, at cost, 144,911,226 and 142,666,302 shares at March 31, 2021 and December 31, 2020, respectively | (4,718) | | | (4,623) | | |
| Accumulated other comprehensive loss | (411) | | | (60) | | |
| Treasury stock, at cost, 144,911,226 and 142,666,302 shares at September 30, 2021 and December 31, 2020, respectively | | Treasury stock, at cost, 144,911,226 and 142,666,302 shares at September 30, 2021 and December 31, 2020, respectively | (4,718) | | | (4,623) | |
| Accumulated other comprehensive income (loss) | | Accumulated other comprehensive income (loss) | (508) | | | (60) | |
| TOTAL STOCKHOLDERS’ EQUITY | TOTAL STOCKHOLDERS’ EQUITY | $22,653 | | | $22,673 | | TOTAL STOCKHOLDERS’ EQUITY | $23,423 | | | $22,673 | |
| TOTAL LIABILITIES AND STOCKHOLDERS’ EQUITY | TOTAL LIABILITIES AND STOCKHOLDERS’ EQUITY | $187,217 | | | $183,349 | | TOTAL LIABILITIES AND STOCKHOLDERS’ EQUITY | $187,007 | | | $183,349 | |
(1) Includes only collateral pledged by the Company where counterparties have the right to sell or pledge the collateral.
The accompanying Notes to Consolidated Financial Statements are an integral part of these statements.
Citizens Financial Group, Inc. | 4551
CONSOLIDATED STATEMENTS OF OPERATIONS (UNAUDITED)
| | | | Three Months Ended March 31, | | Three Months Ended September 30, | | Nine Months Ended September 30, |
| (in millions, except share and per share data) | (in millions, except share and per share data) | | 2021 | | 2020 | (in millions, except share and per share data) | 2021 | | 2020 | | 2021 | | 2020 |
| INTEREST INCOME: | INTEREST INCOME: | | | | | INTEREST INCOME: | | | | | | | |
| Interest and fees on loans and leases | Interest and fees on loans and leases | | $1,061 | | | $1,302 | | Interest and fees on loans and leases | $1,078 | | | $1,120 | | | $3,197 | | | $3,614 | |
| Interest and fees on loans held for sale, at fair value | Interest and fees on loans held for sale, at fair value | | 18 | | | 15 | | Interest and fees on loans held for sale, at fair value | 21 | | | 21 | | | 63 | | | 56 | |
| Interest and fees on other loans held for sale | Interest and fees on other loans held for sale | | 6 | | | 9 | | Interest and fees on other loans held for sale | 1 | | | 16 | | | 9 | | | 32 | |
| Investment securities | Investment securities | | 128 | | | 147 | | Investment securities | 116 | | | 121 | | | 368 | | | 398 | |
| Interest-bearing deposits in banks | Interest-bearing deposits in banks | | 3 | | | 5 | | Interest-bearing deposits in banks | 6 | | | 2 | | | 12 | | | 8 | |
| Total interest income | Total interest income | | 1,216 | | | 1,478 | | Total interest income | 1,222 | | | 1,280 | | | 3,649 | | | 4,108 | |
| INTEREST EXPENSE: | INTEREST EXPENSE: | | | | | INTEREST EXPENSE: | | | | | | | |
| Deposits | Deposits | | 50 | | | 227 | | Deposits | 35 | | | 89 | | | 127 | | | 440 | |
| Short-term borrowed funds | Short-term borrowed funds | | 0 | | | 1 | | Short-term borrowed funds | — | | | — | | | — | | | 1 | |
| Long-term borrowed funds | Long-term borrowed funds | | 49 | | | 90 | | Long-term borrowed funds | 42 | | | 54 | | | 136 | | | 210 | |
| Total interest expense | Total interest expense | | 99 | | | 318 | | Total interest expense | 77 | | | 143 | | | 263 | | | 651 | |
| Net interest income | Net interest income | | 1,117 | | | 1,160 | | Net interest income | 1,145 | | | 1,137 | | | 3,386 | | | 3,457 | |
| Provision for credit losses | Provision for credit losses | | (140) | | | 600 | | Provision for credit losses | (33) | | | 428 | | | (386) | | | 1,492 | |
| Net interest income after provision for credit losses | Net interest income after provision for credit losses | | 1,257 | | | 560 | | Net interest income after provision for credit losses | 1,178 | | | 709 | | | 3,772 | | | 1,965 | |
| NONINTEREST INCOME: | NONINTEREST INCOME: | | | | | NONINTEREST INCOME: | | | | | | | |
| Mortgage banking fees | Mortgage banking fees | | 165 | | | 159 | | Mortgage banking fees | 108 | | | 287 | | | 358 | | | 722 | |
| Service charges and fees | Service charges and fees | | 99 | | | 118 | | Service charges and fees | 110 | | | 97 | | | 309 | | | 299 | |
| Capital markets fees | Capital markets fees | | 81 | | | 43 | | Capital markets fees | 72 | | | 58 | | | 244 | | | 162 | |
| Card fees | Card fees | | 55 | | | 56 | | Card fees | 66 | | | 57 | | | 185 | | | 161 | |
| Trust and investment services fees | Trust and investment services fees | | 58 | | | 53 | | Trust and investment services fees | 61 | | | 53 | | | 179 | | | 151 | |
| Letter of credit and loan fees | Letter of credit and loan fees | | 38 | | | 34 | | Letter of credit and loan fees | 39 | | | 37 | | | 115 | | | 102 | |
| Foreign exchange and interest rate products | Foreign exchange and interest rate products | | 28 | | | 24 | | Foreign exchange and interest rate products | 29 | | | 27 | | | 85 | | | 85 | |
| Securities gains, net | Securities gains, net | | 3 | | | 0 | | Securities gains, net | 3 | | | 1 | | | 9 | | | 4 | |
| | Other income | Other income | | 15 | | | 10 | | Other income | 26 | | | 37 | | | 57 | | | 55 | |
| Total noninterest income | Total noninterest income | | 542 | | | 497 | | Total noninterest income | 514 | | | 654 | | | 1,541 | | | 1,741 | |
| NONINTEREST EXPENSE: | NONINTEREST EXPENSE: | | | | | NONINTEREST EXPENSE: | | | | | | | |
| Salaries and employee benefits | Salaries and employee benefits | | 548 | | | 549 | | Salaries and employee benefits | 509 | | | 524 | | | 1,581 | | | 1,586 | |
| Equipment and software | Equipment and software | | 152 | | | 133 | | Equipment and software | 157 | | | 149 | | | 464 | | | 424 | |
| Outside services | Outside services | | 139 | | | 135 | | Outside services | 144 | | | 139 | | | 420 | | | 405 | |
| Occupancy | Occupancy | | 88 | | | 84 | | Occupancy | 77 | | | 81 | | | 247 | | | 247 | |
| Other operating expense | Other operating expense | | 91 | | | 111 | | Other operating expense | 124 | | | 95 | | | 308 | | | 317 | |
| Total noninterest expense | Total noninterest expense | | 1,018 | | | 1,012 | | Total noninterest expense | 1,011 | | | 988 | | | 3,020 | | | 2,979 | |
| Income before income tax expense | Income before income tax expense | | 781 | | | 45 | | Income before income tax expense | 681 | | | 375 | | | 2,293 | | | 727 | |
| Income tax expense | Income tax expense | | 170 | | | 11 | | Income tax expense | 151 | | | 61 | | | 504 | | | 126 | |
| NET INCOME | NET INCOME | | $611 | | | $34 | | NET INCOME | $530 | | | $314 | | | $1,789 | | | $601 | |
| Net income available to common stockholders | Net income available to common stockholders | | $588 | | | $12 | | Net income available to common stockholders | $504 | | | $289 | | | $1,708 | | | $526 | |
| Weighted-average common shares outstanding: | Weighted-average common shares outstanding: | | | Weighted-average common shares outstanding: | | | | | |
| Basic | Basic | | 425,953,716 | | | 427,718,421 | | Basic | 426,086,717 | | | 426,846,096 | | | 425,996,867 | | | 427,058,412 | |
| Diluted | Diluted | | 427,880,530 | | | 429,388,855 | | Diluted | 427,840,964 | | | 427,992,349 | | | 427,679,885 | | | 428,142,358 | |
| Per common share information: | Per common share information: | | | | | Per common share information: | | | | | | | |
| Basic earnings | Basic earnings | | $1.38 | | | $0.03 | | Basic earnings | $1.18 | | | $0.68 | | | $4.01 | | | $1.23 | |
| Diluted earnings | Diluted earnings | | 1.37 | | | 0.03 | | Diluted earnings | 1.18 | | | 0.68 | | | 3.99 | | | 1.23 | |
The accompanying Notes to unaudited interim Consolidated Financial Statements are an integral part of these statements.
Citizens Financial Group, Inc. | 4652
CONSOLIDATED STATEMENTS OF COMPREHENSIVE INCOME (UNAUDITED)
| | | | | | | | | | | | | | | |
| | | Three Months Ended March 31, |
| (in millions) | | | | | 2021 | | 2020 |
| Net income | | | | | $611 | | | $34 | |
| Other comprehensive income (loss): | | | | | | | |
| Net unrealized derivative instruments (losses) gains arising during the periods, net of income taxes of $(7) and $33, respectively | | | | | (21) | | | 96 | |
| Reclassification adjustment for net derivative gains included in net income, net of income taxes of $(9) and $(1), respectively | | | | | (25) | | | (3) | |
| Net unrealized debt securities (losses) gains arising during the periods, net of income taxes of $(100) and $129, respectively | | | | | (307) | | | 400 | |
| Reclassification of net debt securities gains to net income, net of income taxes of $(1) and $0, respectively | | | | | (2) | | | 0 | |
| Amortization of actuarial loss, net of income taxes of $0 and $1, respectively | | | | | 4 | | | 3 | |
| Total other comprehensive (loss) income, net of income taxes | | | | | (351) | | | 496 | |
| Total comprehensive income | | | | | $260 | | | $530 | |
| | | | | | | | | | | | | | | | | | | | | | | |
| Three Months Ended September 30, | | Nine Months Ended September 30, |
| (in millions) | 2021 | | 2020 | | 2021 | | 2020 |
| Net income | $530 | | | $314 | | | $1,789 | | | $601 | |
| Other comprehensive income (loss): | | | | | | | |
| Net unrealized derivative instruments gains (losses) arising during the periods, net of income taxes of $(4), $0, $5 and $30, respectively | (11) | | | — | | | 14 | | | 88 | |
| Reclassification of net derivative (gains) losses included in net income, net of income taxes of $(8), $(15), $(27) and $(27), respectively | (25) | | | (42) | | | (77) | | | (79) | |
| Net unrealized debt securities gains (losses) arising during the periods, net of income taxes of $(35), $(14), $(132) and $131, respectively | (109) | | | (44) | | | (406) | | | 405 | |
| Reclassification of net debt securities (gains) losses to net income, net of income taxes of $(1), $0, $(2) and $(1), respectively | (2) | | | (1) | | | (7) | | | (3) | |
| Reclassification of actuarial loss to net income, net of income taxes of $1, $1, $2 and $2, respectively | 20 | | | 3 | | | 28 | | | 10 | |
| Total other comprehensive income (loss), net of income taxes | (127) | | | (84) | | | (448) | | | 421 | |
| Total comprehensive income (loss) | $403 | | | $230 | | | $1,341 | | | $1,022 | |
The accompanying Notes to unaudited interim Consolidated Financial Statements are an integral part of these statements.
Citizens Financial Group, Inc. | 4753
CONSOLIDATED STATEMENTS OF CHANGES IN STOCKHOLDERS’ EQUITY (UNAUDITED)
| | | | | | | | | | | | | | | | | | | | | | | | | | | | | | | | |
| Preferred
Stock | | Common
Stock | Additional Paid-in Capital | Retained Earnings | Treasury Stock, at Cost | Accumulated Other Comprehensive Income (Loss) | Total |
| (in millions) | Shares | Amount | | Shares | Amount |
| Balance at January 1, 2020 | 2 | | $1,570 | | | 433 | | $6 | | $18,891 | | $6,498 | | ($4,353) | | ($411) | | $22,201 | |
| Dividends to common stockholders | — | | — | | | — | | — | | — | | (168) | | — | | — | | (168) | |
| Dividends to preferred stockholders | — | | — | | | — | | — | | — | | (22) | | — | | — | | (22) | |
| | | | | | | | | | |
| Treasury stock purchased | — | | — | | | (7) | | — | | — | | — | | (270) | | — | | (270) | |
| Share-based compensation plans | — | | — | | | 1 | | — | | 6 | | — | | 0 | | — | | 6 | |
| Employee stock purchase plan shares purchased | — | | — | | | — | | — | | 4 | | — | | — | | — | | 4 | |
| Cumulative effect of change in accounting principle | | | | | | | (331) | | | | (331) | |
| Total comprehensive income: | | | | | | | | | | |
| Net income | — | | — | | | — | | — | | — | | 34 | | — | | — | | 34 | |
| Other comprehensive income | — | | — | | | — | | — | | — | | — | | — | | 496 | | 496 | |
| Total comprehensive income | — | | — | | | — | | — | | — | | 34 | | — | | 496 | | 530 | |
| Balance at March 31, 2020 | 2 | | $1,570 | | | 427 | | $6 | | $18,901 | | $6,011 | | ($4,623) | | $85 | | $21,950 | |
| Balance at January 1, 2021 | 2 | | $1,965 | | | 427 | | $6 | | $18,940 | | $6,445 | | ($4,623) | | ($60) | | $22,673 | |
| Dividends to common stockholders | — | | — | | | — | | — | | — | | (167) | | — | | — | | (167) | |
| Dividends to preferred stockholders | — | | — | | | — | | — | | — | | (23) | | — | | — | | (23) | |
| | | | | | | | | | |
| Treasury stock purchased | — | | — | | | (2) | | — | | — | | — | | (95) | | — | | (95) | |
| Share-based compensation plans | — | | — | | | 1 | | — | | — | | — | | 0 | | — | | 0 | |
| Employee stock purchase plan shares purchased | — | | — | | | — | | — | | 5 | | — | | — | | — | | 5 | |
| | | | | | | | | | |
| Total comprehensive income: | | | | | | | | | | |
| Net income | — | | — | | | — | | — | | — | | 611 | | — | | — | | 611 | |
| Other comprehensive loss | — | | — | | | — | | — | | — | | — | | — | | (351) | | (351) | |
| Total comprehensive income (loss) | — | | — | | | — | | — | | — | | 611 | | — | | (351) | | 260 | |
| Balance at March 31, 2021 | 2 | | $1,965 | | | 426 | | $6 | | $18,945 | | $6,866 | | ($4,718) | | ($411) | | $22,653 | |
| | | | | | | | | | | | | | | | | | | | | | | | | | | | | | | | |
| Preferred
Stock | | Common
Stock | Additional Paid-in Capital | Retained Earnings | Treasury Stock, at Cost | Accumulated Other Comprehensive Income (Loss) | Total |
| (in millions) | Shares | Amount | | Shares | Amount |
| Balance at July 1, 2020 | 2 | | $1,965 | | | 427 | | $6 | | $18,908 | | $6,068 | | ($4,623) | | $94 | | $22,418 | |
| Dividends to common stockholders | — | | — | | | — | | — | | — | | (168) | | — | | — | | (168) | |
| Dividends to preferred stockholders | — | | — | | | — | | — | | — | | (25) | | — | | — | | (25) | |
| | | | | | | | | | |
| | | | | | | | | | |
| Share-based compensation plans | — | | — | | | — | | — | | 10 | | — | | — | | — | | 10 | |
| Employee stock purchase plan | — | | — | | | — | | — | | 4 | | — | | — | | — | | 4 | |
| | | | | | | | | | |
| Total comprehensive income (loss): | | | | | | | | | | |
| Net income | — | | — | | | — | | — | | — | | 314 | | — | | — | | 314 | |
| Other comprehensive income (loss) | — | | — | | | — | | — | | — | | — | | — | | (84) | | (84) | |
| Total comprehensive income (loss) | — | | — | | | — | | — | | — | | 314 | | — | | (84) | | 230 | |
| Balance at September 30, 2020 | 2 | | $1,965 | | | 427 | | $6 | | $18,922 | | $6,189 | | ($4,623) | | $10 | | $22,469 | |
| Balance at July 1, 2021 | 2 | | $2,014 | | | 426 | | $6 | | $18,964 | | $7,314 | | ($4,718) | | ($381) | | $23,199 | |
| Dividends to common stockholders | — | | — | | | — | | — | | — | | (167) | | — | | — | | (167) | |
| Dividends to preferred stockholders | — | | — | | | — | | — | | — | | (26) | | — | | — | | (26) | |
| | | | | | | | | | |
| | | | | | | | | | |
| Preferred stock redemption | — | | — | | | — | | — | | — | | (3) | | — | | — | | (3) | |
| Share-based compensation plans | — | | — | | | — | | — | | 11 | | — | | — | | — | | 11 | |
| Employee stock purchase plan | — | | — | | | — | | — | | 6 | | — | | — | | — | | 6 | |
| | | | | | | | | | |
| Total comprehensive income (loss): | | | | | | | | | | |
| Net income | — | | — | | | — | | — | | — | | 530 | | — | | — | | 530 | |
| Other comprehensive income (loss) | — | | — | | | — | | — | | — | | — | | — | | (127) | | (127) | |
| Total comprehensive income (loss) | — | | — | | | — | | — | | — | | 530 | | — | | (127) | | 403 | |
| Balance at September 30, 2021 | 2 | | $2,014 | | | 426 | | $6 | | $18,981 | | $7,648 | | ($4,718) | | ($508) | | $23,423 | |
The accompanying Notes to unaudited interim Consolidated Financial Statements are an integral part of these statements.
Citizens Financial Group, Inc. | 54
CONSOLIDATED STATEMENTS OF CHANGES IN STOCKHOLDERS’ EQUITY (UNAUDITED) | | | | | | | | | | | | | | | | | | | | | | | | | | | | | | | | |
| Preferred
Stock | | Common
Stock | Additional Paid-in Capital | Retained Earnings | Treasury Stock, at Cost | Accumulated Other Comprehensive Income (Loss) | Total |
| (in millions) | Shares | Amount | | Shares | Amount |
| Balance at January 1, 2020 | 2 | | $1,570 | | | 433 | | $6 | | $18,891 | | $6,498 | | ($4,353) | | ($411) | | $22,201 | |
| Dividends to common stockholders | — | | — | | | — | | — | | — | | (504) | | — | | — | | (504) | |
| Dividends to preferred stockholders | — | | — | | | — | | — | | — | | (75) | | — | | — | | (75) | |
| Preferred stock issued | — | | 395 | | | — | | — | | — | | — | | — | | — | | 395 | |
| Treasury stock purchased | — | | — | | | (7) | | — | | — | | — | | (270) | | — | | (270) | |
| Share-based compensation plans | — | | — | | | 1 | | — | | 17 | | — | | — | | — | | 17 | |
| Employee stock purchase plan | — | | — | | | — | | — | | 14 | | — | | — | | — | | 14 | |
| Cumulative effect of change in accounting principle | — | | — | | | — | | — | | — | | (331) | | — | | — | | (331) | |
| Total comprehensive income (loss): | | | | | | | | | | |
| Net income | — | | — | | | — | | — | | — | | 601 | | — | | — | | 601 | |
| Other comprehensive income (loss) | — | | — | | | — | | — | | — | | — | | — | | 421 | | 421 | |
| Total comprehensive income (loss) | — | | — | | | — | | — | | — | | 601 | | — | | 421 | | 1,022 | |
| Balance at September 30, 2020 | 2 | | $1,965 | | | 427 | | $6 | | $18,922 | | $6,189 | | ($4,623) | | $10 | | $22,469 | |
| Balance at January 1, 2021 | 2 | | $1,965 | | | 427 | | $6 | | $18,940 | | $6,445 | | ($4,623) | | ($60) | | $22,673 | |
| Dividends to common stockholders | — | | — | | | — | | — | | — | | (502) | | — | | — | | (502) | |
| Dividends to preferred stockholders | — | | — | | | — | | — | | — | | (81) | | — | | — | | (81) | |
| Preferred stock issued | — | | 296 | | | — | | — | | — | | — | | — | | — | | 296 | |
| Preferred stock redemption | — | | (247) | | | — | | — | | — | | (3) | | — | | — | | (250) | |
| Treasury stock purchased | — | | — | | | (2) | | — | | — | | — | | (95) | | — | | (95) | |
| Share-based compensation plans | — | | — | | | 1 | | — | | 24 | | — | | — | | — | | 24 | |
| Employee stock purchase plan | — | | — | | | — | | — | | 17 | | — | | — | | — | | 17 | |
| | | | | | | | | | |
| Total comprehensive income (loss): | | | | | | | | | | |
| Net income | — | | — | | | — | | — | | — | | 1,789 | | — | | — | | 1,789 | |
| Other comprehensive income (loss) | — | | — | | | — | | — | | — | | — | | — | | (448) | | (448) | |
| Total comprehensive income (loss) | — | | — | | | — | | — | | — | | 1,789 | | — | | (448) | | 1,341 | |
| Balance at September 30, 2021 | 2 | | $2,014 | | | 426 | | $6 | | $18,981 | | $7,648 | | ($4,718) | | ($508) | | $23,423 | |
The accompanying Notes to unaudited interim Consolidated Financial Statements are an integral part of these statements.
Citizens Financial Group, Inc. | 4855
CONSOLIDATED STATEMENTS OF CASH FLOWS (UNAUDITED)
| | | Three Months Ended March 31, | | | Nine Months Ended September 30, | |
| (in millions) | (in millions) | 2021 | | 2020 | | (in millions) | 2021 | | 2020 | |
| OPERATING ACTIVITIES | OPERATING ACTIVITIES | | | | | OPERATING ACTIVITIES | | | | |
| Net income | Net income | $611 | | | $34 | | | Net income | $1,789 | | | $601 | | |
| Adjustments to reconcile net income to net cash used in operating activities: | | | |
| Adjustments to reconcile net income to net change in cash due to operating activities: | | Adjustments to reconcile net income to net change in cash due to operating activities: | | |
| Provision for credit losses | Provision for credit losses | (140) | | | 600 | | | Provision for credit losses | (386) | | | 1,492 | | |
| Net change in loans held for sale | Net change in loans held for sale | (622) | | | (860) | | | Net change in loans held for sale | 623 | | | (655) | | |
| | Depreciation, amortization and accretion | Depreciation, amortization and accretion | 152 | | | 204 | | | Depreciation, amortization and accretion | 453 | | | 419 | | |
| | Deferred income taxes | Deferred income taxes | 80 | | | (134) | | | Deferred income taxes | 214 | | | (251) | | |
| Share-based compensation | Share-based compensation | 22 | | | 21 | | | Share-based compensation | 47 | | | 34 | | |
| Net gain on sales of: | | Net gain on sales of: | | |
| Debt securities | | Debt securities | (9) | | | (4) | | |
| | Net gain on sale of debt securities | (3) | | | 0 | | | |
| Premises and equipment | | Premises and equipment | (1) | | | — | | |
| | Increase in other assets | (773) | | | (1,022) | | | |
| Decrease in other liabilities | (17) | | | (170) | | | |
| Net cash used in operating activities | (690) | | | (1,327) | | | |
| Net (increase) decrease in other assets | | Net (increase) decrease in other assets | (2,393) | | | (2,960) | | |
| Net increase (decrease) in other liabilities | | Net increase (decrease) in other liabilities | 833 | | | 569 | | |
| Net change due to operating activities | | Net change due to operating activities | 1,170 | | | (755) | | |
| INVESTING ACTIVITIES | INVESTING ACTIVITIES | | | | | INVESTING ACTIVITIES | | | | |
| Investment securities: | Investment securities: | | | Investment securities: | | |
| Purchases of debt securities available for sale | Purchases of debt securities available for sale | (4,256) | | | (2,102) | | | Purchases of debt securities available for sale | (8,669) | | | (5,547) | | |
| Proceeds from maturities and paydowns of debt securities available for sale | Proceeds from maturities and paydowns of debt securities available for sale | 2,281 | | | 1,010 | | | Proceeds from maturities and paydowns of debt securities available for sale | 6,059 | | | 4,583 | | |
| Proceeds from sales of debt securities available for sale | Proceeds from sales of debt securities available for sale | 54 | | | 0 | | | Proceeds from sales of debt securities available for sale | 158 | | | 48 | | |
| | Proceeds from maturities and paydowns of debt securities held to maturity | Proceeds from maturities and paydowns of debt securities held to maturity | 241 | | | 131 | | | Proceeds from maturities and paydowns of debt securities held to maturity | 752 | | | 629 | | |
| | Net (increase) decrease in interest-bearing deposits in banks | Net (increase) decrease in interest-bearing deposits in banks | (2) | | | 17 | | | Net (increase) decrease in interest-bearing deposits in banks | 17 | | | (31) | | |
| | Acquisitions, net of cash acquired | Acquisitions, net of cash acquired | 0 | | | (3) | | | Acquisitions, net of cash acquired | (14) | | | (3) | | |
| Net decrease (increase) in loans and leases | 1,042 | | | (7,630) | | | |
| Net (increase) decrease in loans and leases | | Net (increase) decrease in loans and leases | (384) | | | (5,303) | | |
| Capital expenditures, net | Capital expenditures, net | (10) | | | (16) | | | Capital expenditures, net | (59) | | | 1 | | |
| Purchase of bank-owned life insurance | Purchase of bank-owned life insurance | (375) | | | 0 | | | Purchase of bank-owned life insurance | (650) | | | — | | |
| Other | Other | (47) | | | (175) | | | Other | (197) | | | 124 | | |
| Net cash used in investing activities | (1,072) | | | (8,768) | | | |
| Net change due to investing activities | | Net change due to investing activities | (2,987) | | | (5,499) | | |
| FINANCING ACTIVITIES | FINANCING ACTIVITIES | | | | | FINANCING ACTIVITIES | | | | |
| Net increase in deposits | 4,185 | | | 8,162 | | | |
| Net (decrease) increase in short-term borrowed funds | (176) | | | 780 | | | |
| Net increase (decrease) in deposits | | Net increase (decrease) in deposits | 5,057 | | | 17,608 | | |
| Net increase (decrease) in short-term borrowed funds | | Net increase (decrease) in short-term borrowed funds | (240) | | | (43) | | |
| Proceeds from issuance of long-term borrowed funds | Proceeds from issuance of long-term borrowed funds | 0 | | | 6,800 | | | Proceeds from issuance of long-term borrowed funds | — | | | 8,323 | | |
| Repayments of long-term borrowed funds | Repayments of long-term borrowed funds | (4) | | | (4,500) | | | Repayments of long-term borrowed funds | (1,356) | | | (13,258) | | |
| Treasury stock purchased | Treasury stock purchased | (95) | | | (270) | | | Treasury stock purchased | (95) | | | (270) | | |
| | Net proceeds from issuance of preferred stock | | Net proceeds from issuance of preferred stock | 296 | | | 395 | | |
| Redemption of preferred stock | | Redemption of preferred stock | (250) | | | — | | |
| Dividends paid to common stockholders | Dividends paid to common stockholders | (167) | | | (168) | | | Dividends paid to common stockholders | (502) | | | (504) | | |
| Dividends paid to preferred stockholders | Dividends paid to preferred stockholders | (32) | | | (23) | | | Dividends paid to preferred stockholders | (88) | | | (73) | | |
| Premium paid to exchange subordinated debt | Premium paid to exchange subordinated debt | (1) | | | 0 | | | Premium paid to exchange subordinated debt | (1) | | | (80) | | |
| Payments of employee tax withholding for share-based compensation | Payments of employee tax withholding for share-based compensation | (21) | | | (14) | | | Payments of employee tax withholding for share-based compensation | (21) | | | (14) | | |
| Net cash provided by financing activities | 3,689 | | | 10,767 | | | |
Increase in cash and cash equivalents (1) | 1,927 | | | 672 | | | |
| Net change due to financing activities | | Net change due to financing activities | 2,800 | | | 12,084 | | |
Net change in cash and cash equivalents(1) | | Net change in cash and cash equivalents(1) | 983 | | | 5,830 | | |
Cash and cash equivalents at beginning of period (1) | Cash and cash equivalents at beginning of period (1) | 12,733 | | | 3,386 | | | Cash and cash equivalents at beginning of period(1) | 12,733 | | | 3,386 | | |
Cash and cash equivalents at end of period (1) | Cash and cash equivalents at end of period (1) | $14,660 | | | $4,058 | | | Cash and cash equivalents at end of period(1) | $13,716 | | | $9,216 | | |
(1) Cash and cash equivalents includes cash and due from banks and interest-bearing cash and due from banks as reflected onin the Consolidated Balance Sheets.
The accompanying Notes to unaudited interim Consolidated Financial Statements are an integral part of these statements.
Citizens Financial Group, Inc. | 4956
NOTES TO CONSOLIDATED FINANCIAL STATEMENTS (UNAUDITED)
NOTE 1 - BASIS OF PRESENTATION
Basis of Presentation
The unaudited interim Consolidated Financial Statements, including the Notes presented in this document of Citizens Financial Group, Inc., have been prepared in accordance with GAAP interim reporting requirements, and therefore do not include all information and Notes included in the audited Consolidated Financial Statements in conformity with GAAP. These unaudited interim Consolidated Financial Statements and Notes presented in this document should be read in conjunction with the Company’s audited Consolidated Financial Statements and accompanying Notes included in the Company’s 2020 Form 10-K. The Company’s principal business activity is banking, conducted through its banking subsidiary, CBNA.
The unaudited interim Consolidated Financial Statements include the accounts of the Company and subsidiaries in which the Company has a controlling financial interest. All intercompany transactions and balances have been eliminated. The Company has evaluated its unconsolidated entities and does not believe that any entity in which it has an interest, but does not currently consolidate, meets the requirements to be consolidated as a variable interest entity. The unaudited interim Consolidated Financial Statements include all adjustments, consisting of normal recurring adjustments, necessary for a fair presentation of the results for the interim periods. The results for interim periods are not necessarily indicative of results for a full year.
The preparation of financial statements in conformity with GAAP requires management to make estimates and assumptions that affect the reported amounts of assets and liabilities at the date of the financial statements and the reported amounts of revenues and expenses during the reporting period. Actual results could differ from those estimates. Material estimates that are particularly susceptible to significant change in the near-term relate to the determination of the ACL and the fair value of MSRs.ACL.
Significant Accounting Policies
For further information regarding the Company’s significant accounting policies, see Note 1 in the Company’s 2020 Form 10-K.
Completed Acquisitions
On September 1, 2021, the Company closed on its acquisition of Willamette, a Chicago, Illinois-based business valuation, forensic analysis, and transaction financial advisory services firm. This acquisition resulted in an estimated increase to goodwill of $15 million which was allocated to the Commercial business segment as of September 30, 2021. The Company expects that some adjustments of the fair values assigned to the assets acquired and liabilities assumed may subsequently be recorded, although any such adjustments are not expected to be material.
Pending Acquisitions
On May 26, 2021, the Company announced that it had entered into an agreement to acquire 80 East Coast branches and the national online deposit business from HSBC for an approximate 2.0% premium paid on deposits at closing. The branch purchase includes 66 locations in the New York City Metro area, 9 locations in the Mid-Atlantic/Washington D.C. area, and 5 locations in Southeast Florida. As of September 30, 2021, there were approximately $8.4 billion in deposits and $1.9 billion in loans. The transaction is expected to close in the first quarter of 2022, subject to the satisfaction of customary closing terms and conditions and regulatory approvals.
On July 28, 2021, the Company announced that it had entered into a definitive agreement and plan of merger under which the Company will acquire all of the outstanding shares of Investors for a combination of stock and cash. Pursuant to the terms of the agreement, Investors shareholders will receive 0.297 of a share of the Company’s common stock and $1.46 in cash for each share of Investors they own. The acquisition of Investors builds our physical presence in the northeast with the addition of 154 branches located in the greater New York City and Philadelphia metropolitan areas and across New Jersey. As of September 30, 2021, Investors had total assets of $27.3 billion, including $21.6 billion of loans, $24.5 billion of liabilities, including $20.4 billion of deposits, and $2.8 billion of stockholders’ equity. The merger is expected to close in early second quarter 2022, subject to approval by the shareholders of Investors, regulatory approvals, and other customary closing conditions.
On September 8, 2021, Citizens entered into a definitive agreement to acquire JMP in an all-cash transaction. Under the agreement, JMP shareholders will receive $7.50 for each common share of JMP they own,
Citizens Financial Group, Inc. | 57
or approximately $149 million in cash. This transaction is targeted to close in mid-fourth quarter 2021, subject to approval by the shareholders of JMP and other customary closing conditions.
NOTE 2 - SECURITIES
The following table presents the major components of securities at amortized cost and fair value:
| | | March 31, 2021 | | December 31, 2020 | | September 30, 2021 | | December 31, 2020 |
| (in millions) | (in millions) | Amortized Cost | Gross Unrealized Gains | Gross Unrealized Losses | Fair Value | | Amortized Cost | Gross Unrealized Gains | Gross Unrealized Losses | Fair Value | (in millions) | Amortized Cost | Gross Unrealized Gains | Gross Unrealized Losses | Fair Value | | Amortized Cost | Gross Unrealized Gains | Gross Unrealized Losses | Fair Value |
| U.S. Treasury and other | U.S. Treasury and other | $11 | | $0 | | $0 | | $11 | | | $11 | | $0 | | $0 | | $11 | | U.S. Treasury and other | $11 | | $— | | $— | | $11 | | | $11 | | $— | | $— | | $11 | |
| State and political subdivisions | State and political subdivisions | 3 | | 0 | | 0 | | 3 | | | 3 | | 0 | | 0 | | 3 | | State and political subdivisions | 2 | | — | | — | | 2 | | | 3 | | — | | — | | 3 | |
| Mortgage-backed securities, at fair value: | | |
| Mortgage-backed securities: | | Mortgage-backed securities: | |
| Federal agencies and U.S. government sponsored entities | Federal agencies and U.S. government sponsored entities | 23,966 | | 415 | | (268) | | 24,113 | | | 21,954 | | 571 | | (19) | | 22,506 | | Federal agencies and U.S. government sponsored entities | 23,838 | | 307 | | (305) | | 23,840 | | | 21,954 | | 571 | | (19) | | 22,506 | |
| Other/non-agency | Other/non-agency | 324 | | 16 | | 0 | | 340 | | | 396 | | 26 | | 0 | | 422 | | Other/non-agency | 280 | | 11 | | — | | 291 | | | 396 | | 26 | | — | | 422 | |
| Total mortgage-backed securities, at fair value | 24,290 | | 431 | | (268) | | 24,453 | | | 22,350 | | 597 | | (19) | | 22,928 | | |
| | Total mortgage-backed securities | | Total mortgage-backed securities | 24,118 | | 318 | | (305) | | 24,131 | | | 22,350 | | 597 | | (19) | | 22,928 | |
| Collateralized loan obligations | | Collateralized loan obligations | 767 | | — | | — | | 767 | | | — | | — | | — | | — | |
| Total debt securities available for sale, at fair value | Total debt securities available for sale, at fair value | $24,304 | | $431 | | ($268) | | $24,467 | | | $22,364 | | $597 | | ($19) | | $22,942 | | Total debt securities available for sale, at fair value | $24,898 | | $318 | | ($305) | | $24,911 | | | $22,364 | | $597 | | ($19) | | $22,942 | |
| Federal agencies and U.S. government sponsored entities | Federal agencies and U.S. government sponsored entities | $2,139 | | $84 | | $0 | | $2,223 | | | $2,342 | | $122 | | $0 | | $2,464 | | Federal agencies and U.S. government sponsored entities | $1,705 | | $73 | | $— | | $1,778 | | | $2,342 | | $122 | | $— | | $2,464 | |
| Total mortgage-backed securities, at cost | 2,139 | | 84 | | 0 | | 2,223 | | | 2,342 | | 122 | | 0 | | 2,464 | | |
| Asset-backed securities, at cost | 856 | | 0 | | (2) | | 854 | | | 893 | | 0 | | 0 | | 893 | | |
| Total mortgage-backed securities | | Total mortgage-backed securities | 1,705 | | 73 | | — | | 1,778 | | | 2,342 | | 122 | | — | | 2,464 | |
| Asset-backed securities | | Asset-backed securities | 787 | | 2 | | — | | 789 | | | 893 | | — | | — | | 893 | |
| Total debt securities held to maturity | Total debt securities held to maturity | $2,995 | | $84 | | ($2) | | $3,077 | | | $3,235 | | $122 | | $0 | | $3,357 | | Total debt securities held to maturity | $2,492 | | $75 | | $— | | $2,567 | | | $3,235 | | $122 | | $— | | $3,357 | |
| Equity securities, at cost | | Equity securities, at cost | $616 | | $— | | $— | | $616 | | | $604 | | $— | | $— | | $604 | |
| Equity securities, at fair value | Equity securities, at fair value | $73 | | $— | | $— | | $73 | | | $66 | | $— | | $— | | $66 | | Equity securities, at fair value | 88 | | — | | — | | 88 | | | 66 | | — | | — | | 66 | |
| Equity securities, at cost | 603 | | — | | — | | 603 | | | 604 | | — | | — | | 604 | | |
Accrued interest receivable on debt securities totaled $56$53 million and $55 million as of March 31,September 30, 2021 and December 31, 2020, respectively, and is included in other assets onin the Consolidated Balance Sheets.
Citizens Financial Group, Inc. | 5058
The following table presents the amortized cost and fair value of debt securities by contractual maturity as of March 31,September 30, 2021. Expected maturities may differ from contractual maturities because issuers may have the right to call or prepay obligations with or without incurring penalties.
| | | March 31, 2021 | | September 30, 2021 |
| | Distribution of Maturities | | Distribution of Maturities |
| (in millions) | (in millions) | 1 Year or Less | After 1 Year through 5 Years | After 5 Years through 10 Years | After 10 Years | Total | (in millions) | 1 Year or Less | After 1 Year through 5 Years | After 5 Years through 10 Years | After 10 Years | Total |
| Amortized cost: | Amortized cost: | | Amortized cost: | |
| U.S. Treasury and other | U.S. Treasury and other | $11 | | $0 | | $0 | | $0 | | $11 | | U.S. Treasury and other | $11 | | $— | | $— | | $— | | $11 | |
| State and political subdivisions | State and political subdivisions | 0 | | 0 | | 0 | | 3 | | 3 | | State and political subdivisions | — | | — | | — | | 2 | | 2 | |
| Mortgage-backed securities: | Mortgage-backed securities: | | Mortgage-backed securities: | |
| Federal agencies and U.S. government sponsored entities | Federal agencies and U.S. government sponsored entities | 2 | | 108 | | 1,626 | | 22,230 | | 23,966 | | Federal agencies and U.S. government sponsored entities | 1 | | 32 | | 1,989 | | 21,816 | | 23,838 | |
| Other/non-agency | Other/non-agency | 0 | | 0 | | 0 | | 324 | | 324 | | Other/non-agency | — | | — | | — | | 280 | | 280 | |
| | Collateralized loan obligations | | Collateralized loan obligations | — | | — | | — | | 767 | | 767 | |
| Total debt securities available for sale | Total debt securities available for sale | 13 | | 108 | | 1,626 | | 22,557 | | 24,304 | | Total debt securities available for sale | 12 | | 32 | | 1,989 | | 22,865 | | 24,898 | |
| Mortgage-backed securities: | Mortgage-backed securities: | | Mortgage-backed securities: | |
| Federal agencies and U.S. government sponsored entities | Federal agencies and U.S. government sponsored entities | 0 | | 0 | | 0 | | 2,139 | | 2,139 | | Federal agencies and U.S. government sponsored entities | — | | — | | — | | 1,705 | | 1,705 | |
| Asset-backed securities | Asset-backed securities | 0 | | 0 | | 856 | | 0 | | 856 | | Asset-backed securities | — | | — | | 787 | | — | | 787 | |
| Total debt securities held to maturity | Total debt securities held to maturity | 0 | | 0 | | 856 | | 2,139 | | 2,995 | | Total debt securities held to maturity | — | | — | | 787 | | 1,705 | | 2,492 | |
| Total amortized cost of debt securities | Total amortized cost of debt securities | $13 | | $108 | | $2,482 | | $24,696 | | $27,299 | | Total amortized cost of debt securities | $12 | | $32 | | $2,776 | | $24,570 | | $27,390 | |
| | Fair value: | Fair value: | | Fair value: | |
| U.S. Treasury and other | U.S. Treasury and other | $11 | | $0 | | $0 | | $0 | | $11 | | U.S. Treasury and other | $11 | | $— | | $— | | $— | | $11 | |
| State and political subdivisions | State and political subdivisions | 0 | | 0 | | 0 | | 3 | | 3 | | State and political subdivisions | — | | — | | — | | 2 | | 2 | |
| Mortgage-backed securities: | Mortgage-backed securities: | | Mortgage-backed securities: | |
| Federal agencies and U.S. government sponsored entities | Federal agencies and U.S. government sponsored entities | 2 | | 111 | | 1,676 | | 22,324 | | 24,113 | | Federal agencies and U.S. government sponsored entities | 1 | | 33 | | 2,036 | | 21,770 | | 23,840 | |
| Other/non-agency | Other/non-agency | 0 | | 0 | | 0 | | 340 | | 340 | | Other/non-agency | — | | — | | — | | 291 | | 291 | |
| | Collateralized loan obligations | | Collateralized loan obligations | — | | — | | — | | 767 | | 767 | |
| Total debt securities available for sale | Total debt securities available for sale | 13 | | 111 | | 1,676 | | 22,667 | | 24,467 | | Total debt securities available for sale | 12 | | 33 | | 2,036 | | 22,830 | | 24,911 | |
| Mortgage-backed securities: | Mortgage-backed securities: | | Mortgage-backed securities: | |
| Federal agencies and U.S. government sponsored entities | Federal agencies and U.S. government sponsored entities | 0 | | 0 | | 0 | 2,223 | | 2,223 | | Federal agencies and U.S. government sponsored entities | — | | — | | — | | 1,778 | | 1,778 | |
| Asset-backed securities | Asset-backed securities | 0 | | 0 | | 854 | | 0 | | 854 | | Asset-backed securities | — | | — | | 789 | | — | | 789 | |
| Total debt securities held to maturity | Total debt securities held to maturity | 0 | | 0 | | 854 | | 2,223 | | 3,077 | | Total debt securities held to maturity | — | | — | | 789 | | 1,778 | | 2,567 | |
| Total fair value of debt securities | Total fair value of debt securities | $13 | | $111 | | $2,530 | | $24,890 | | $27,544 | | Total fair value of debt securities | $12 | | $33 | | $2,825 | | $24,608 | | $27,478 | |
Taxable interest income from investment securities as presented onin the Consolidated Statements of Operations was $128$116 million and $147$121 million for the three months ended March 31,September 30, 2021 and 2020, respectively, and $368 million and $398 million for the nine months ended September 30, 2021 and 2020, respectively.
The following table presents realized gains and losses on securities:
| | | | Three Months Ended March 31, | | Three Months Ended September 30, | | Nine Months Ended September 30, |
| (in millions) | (in millions) | | 2021 | | 2020 | (in millions) | 2021 | | 2020 | | 2021 | | 2020 |
| Gains on sale of debt securities | Gains on sale of debt securities | | $3 | | | $0 | | Gains on sale of debt securities | $3 | | | $1 | | | $9 | | | $4 | |
| Losses on sale of debt securities | Losses on sale of debt securities | | 0 | | | 0 | | Losses on sale of debt securities | — | | | — | | | — | | | — | |
| Debt securities gains, net | Debt securities gains, net | | $3 | | | $0 | | Debt securities gains, net | $3 | | | $1 | | | $9 | | | $4 | |
|
Citizens Financial Group, Inc. | 59
The following table presents the amortized cost and fair value of debt securities pledged:
| | | March 31, 2021 | | December 31, 2020 | | September 30, 2021 | | December 31, 2020 |
| (in millions) | (in millions) | Amortized Cost | Fair Value | | Amortized Cost | Fair Value | (in millions) | Amortized Cost | Fair Value | | Amortized Cost | Fair Value |
| Pledged against derivatives, to qualify for fiduciary powers, and to secure public and other deposits as required by law | | Pledged against derivatives, to qualify for fiduciary powers, and to secure public and other deposits as required by law | $4,547 | | $4,556 | | | $3,818 | | $3,937 | |
| Pledged against FHLB borrowed funds | | Pledged against FHLB borrowed funds | 227 | | 239 | | | 394 | | 423 | |
| Pledged against repurchase agreements | Pledged against repurchase agreements | $53 | | $55 | | | $224 | | $231 | | Pledged against repurchase agreements | 1 | | 1 | | | 224 | | 231 | |
| Pledged against FHLB borrowed funds | 322 | | 340 | | | 394 | | 423 | | |
| Pledged against derivatives, to qualify for fiduciary powers, and to secure public and other deposits as required by law | 3,677 | | 3,725 | | | 3,818 | | 3,937 | | |
The Company regularly enters into security repurchase agreements with unrelated counterparties, which involve the transfer of a security from one party to another, and a subsequent transfer of substantially the same security back to the original party. These repurchase agreements are typically short-term in nature and are
Citizens Financial Group, Inc. | 51
accounted for as secured borrowed funds onin the Company’s Consolidated Balance Sheets. The Company recognized 0no offsetting of short-term receivables or payables as of March 31,September 30, 2021 or December 31, 2020. The Company offsets certain derivative assets and derivative liabilities onin the Consolidated Balance Sheets. For further information, see Note 8.
Securitizations of mortgage loans retained in the investment portfolio were $81$60 million and $223 million for the three and nine months ended March 31, 2021.September 30, 2021, respectively. There were 0$34 million securitizations of mortgage loans retained in the investment portfolio for the three and nine months ended March 31,September 30, 2020. These securitizations include a substantive guarantee by a third party. In 2021, the guarantors were FNMA, FHLMC, and FHLMC.GNMA. The debt securities received from the guarantors are classified as AFS.
Impairment
As of March 31,September 30, 2021, the Company concluded that 71%68% of HTM securities met the zero expected credit loss criteria; therefore, no ACL was recognized. For the remaining 29%,remainder, the lifetime expected credit losses were determined to be insignificant based on the modeling of the Company’s credit loss position in the security.securities. The Company monitors the credit exposure through the use of credit quality indicators. For these securities, the Company uses external credit ratings or an internally derived credit rating when an external rating is not available. All securities were determined to be investment grade at March 31,September 30, 2021.
The following tables present AFS mortgage-backed debt securities with fair values below their respective carrying values, separated by the duration the securities have been in a continuous unrealized loss position:
| | | March 31, 2021 | | September 30, 2021 |
| | Less than 12 Months | | 12 Months or Longer | | Total | | Less than 12 Months | | 12 Months or Longer | | Total |
| (dollars in millions) | (dollars in millions) | Fair Value | Gross Unrealized Losses | | Fair Value | Gross Unrealized Losses | | Fair Value | Gross Unrealized Losses | (dollars in millions) | Fair Value | Gross Unrealized Losses | | Fair Value | Gross Unrealized Losses | | Fair Value | Gross Unrealized Losses |
| Federal agencies and U.S. government sponsored entities | Federal agencies and U.S. government sponsored entities | $9,997 | | ($268) | | | $0 | | $0 | | | $9,997 | | ($268) | | Federal agencies and U.S. government sponsored entities | $682 | | ($21) | | | $11,969 | | ($284) | | | $12,651 | | ($305) | |
|
| | | December 31, 2020 | | December 31, 2020 |
| | Less than 12 Months | | 12 Months or Longer | | Total | | Less than 12 Months | | 12 Months or Longer | | Total |
| (dollars in millions) | (dollars in millions) | Fair Value | Gross Unrealized Losses | | Fair Value | Gross Unrealized Losses | | Fair Value | Gross Unrealized Losses | (dollars in millions) | Fair Value | Gross Unrealized Losses | | Fair Value | Gross Unrealized Losses | | Fair Value | Gross Unrealized Losses |
| Federal agencies and U.S. government sponsored entities | Federal agencies and U.S. government sponsored entities | $1,991 | | ($19) | | | $0 | | $0 | | | $1,991 | | ($19) | | Federal agencies and U.S. government sponsored entities | $1,991 | | ($19) | | | $— | | $— | | | $1,991 | | ($19) | |
|
Citizens does not currently have the intent to sell these debt securities, and it is not more likely than not that the Company will be required to sell these debt securities prior to recovery of their amortized cost bases. Citizens has determined that credit losses are not expected to be incurred on the agency andMBS, non-agency MBS, and CLOs identified with unrealized losses as of March 31,September 30, 2021. The unrealized losses on these debt securities reflect non-credit-related factors driven by changes in interest rates. Therefore, the Company has determined that these debt securities are not impaired.
Citizens Financial Group, Inc. | 60
NOTE 3 - LOANS AND LEASES
Loans held for investment are reported at the amount of their outstanding principal, net of charge-offs, unearned income, deferred loan origination fees and costs, and unamortized premiums or discounts on purchased loans.
Loans and leases are disclosed in portfolio segments and classes. The Company’s loan and lease portfolio segments are commercial and retail. The classes of loans and leases are: commercial and industrial, commercial real estate, leases, residential mortgages, home equity, automobile, education and other retail.
Citizens Financial Group, Inc. | 52
The following table presents loans and leases, excluding LHFS.
| | (in millions) | (in millions) | March 31, 2021 | | December 31, 2020 | (in millions) | September 30, 2021 | | December 31, 2020 |
Commercial and industrial (1) | Commercial and industrial (1) | $44,058 | | | $44,173 | | Commercial and industrial(1) | $41,854 | | | $44,173 | |
| Commercial real estate | Commercial real estate | 14,553 | | | 14,652 | | Commercial real estate | 14,508 | | | 14,652 | |
| Leases | Leases | 1,802 | | | 1,968 | | Leases | 1,593 | | | 1,968 | |
| Total commercial | Total commercial | 60,413 | | | 60,793 | | Total commercial | 57,955 | | | 60,793 | |
Residential mortgages | Residential mortgages | 19,202 | | | 19,539 | | Residential mortgages | 21,513 | | | 19,539 | |
| Home equity | Home equity | 11,854 | | | 12,149 | | Home equity | 11,889 | | | 12,149 | |
| Automobile | Automobile | 12,344 | | | 12,153 | | Automobile | 13,492 | | | 12,153 | |
| Education | Education | 12,691 | | | 12,308 | | Education | 13,000 | | | 12,308 | |
| Other retail | Other retail | 5,691 | | | 6,148 | | Other retail | 5,469 | | | 6,148 | |
| Total retail loans | 61,782 | | | 62,297 | | |
| Total retail | | Total retail | 65,363 | | | 62,297 | |
| Total loans and leases | Total loans and leases | $122,195 | | | $123,090 | | Total loans and leases | $123,318 | | | $123,090 | |
(1) Includes $5.1$1.9 billion and $4.2 billion of PPP loans fully guaranteed by the SBA as of March 31,September 30, 2021 and December 31, 2020, respectively.
(2) Includes fully or partially guaranteed FHA, VA and USDA loans of $1.4 billion at September 30, 2021 and $249 million at December 31, 2020, including loans acquired through an exercise of the GNMA early buyout option.
Accrued
Included in other assets is accrued interest receivable on loans and leases held for investment totaled $444totaling $464 million and $449 million as of March 31,September 30, 2021 and December 31, 2020, respectively, and is included in other assets in the Consolidated Balance Sheets.
During the three months ended March 31, 2021 and 2020, the Company purchased $301 million and $218 million of education loans, respectively, and $177 million and $272 million of other retail loans, respectively.
During the three months ended March 31,September 30, 2021 and 2020, the Company sold $326purchased $323 million and $191$801 million of commercialeducation loans, and $119 million and $101 million of other retail loans, respectively. During the three months ended March 31, 2020,September 30, 2021, the company sold $1.5 billionCompany purchased $478 million of residential mortgage loans as compared to none in the same period of 2020. During the nine months ended September 30, 2021 and 2020, the Company purchased $975 million and $1.7 billion of education loans, and $472 million and $628 million of other retail loans, respectively. During the nine months ended September 30, 2021, the Company purchased $478 million of residential mortgage loans as compared to none in the same period of 2020.
During the three months ended September 30, 2021 and 2020, the Company sold $202 million and $94 million of commercial loans, respectively. During the three months ended September 30, 2020, the Company sold $879 million of education loans as compared to none in the same period of 2021. During the nine months ended September 30, 2021 and 2020, the Company sold $765 million and $356 million of commercial loans, respectively. During the nine months ended September 30, 2020, the Company sold $1.5 billion of residential mortgage loans and $879 million of education loans as compared to none in the same period of 2021.
Loans pledged as collateral for FHLB borrowed funds, primarily residential mortgages and home equity products, totaled $25.3$25.2 billion and $25.5 billion at March 31,September 30, 2021 and December 31, 2020, respectively. Loans pledged as collateral to support the contingent ability to borrow at the FRB discount window, if necessary, were primarily comprised of education, auto,automobile, commercial and industrial, and commercial real estate loans, and totaled $40.7$38.1 billion and $40.0 billion at March 31,September 30, 2021 and December 31, 2020, respectively.
Interest income on direct financing and sales-type leases was $13$12 million and $18$17 million for the three months ended March 31,September 30, 2021 and 2020, respectively, and is reported within interest and fees on loans and leases in the Consolidated Statements of Operations. For the nine months ended September 30, 2021 and 2020, this interest income was $37 million and $54 million, respectively.
Citizens Financial Group, Inc. | 61
The following table presents the composition of LHFS.
| | | March 31, 2021 | | December 31, 2020 | | September 30, 2021 | | December 31, 2020 |
| (in millions) | (in millions) | Residential Mortgages(1) | Commercial(2) | | Total | | Residential Mortgages(1) | Commercial(2) | Total | (in millions) | Residential Mortgages(1) | Commercial(2) | | Total | | Residential Mortgages(1) | Commercial(2) | Total |
| Loans held for sale at fair value | Loans held for sale at fair value | $4,208 | | $96 | | | $4,304 | | | $3,416 | | $148 | | $3,564 | | Loans held for sale at fair value | $3,104 | | $73 | | | $3,177 | | | $3,416 | | $148 | | $3,564 | |
| Other loans held for sale | Other loans held for sale | 0 | | 75 | | | 75 | | | 0 | | 439 | | 439 | | Other loans held for sale | — | | 93 | | | 93 | | | — | | 439 | | 439 | |
(1) Residential mortgage LHFS are originated for sale.
(2) Commercial LHFS at fair value consist of loans managed by the Company’s commercial secondary loan desk. Other commercial LHFS generally consist of loans associated with the Company’s syndication business.
NOTE 4 - ALLOWANCE FOR CREDIT LOSSES, NONACCRUINGNONACCRUAL LOANS AND LEASES, AND CONCENTRATIONS OF CREDIT RISK
Allowance for Credit Losses
Management’sRecorded in the ACL is management’s estimate of expected credit losses in the Company’s loan and lease portfolios is recorded in the ALLL and the allowance for unfunded lending commitments (collectively the ACL).portfolios. See Note 5 in the Company’s 2020 Form 10-K for a detailed discussion of the ACL reserve methodology and estimation techniques as of December 31, 2020. There were no significant changes to the ACL reserve methodology in the threenine months ended March 31,September 30, 2021.
Citizens Financial Group, Inc. | 53
The following table presents a summary of changes in the ALLL and the allowance for unfunded lending commitments for the three months ended Marchand nine months ended September 30, 2021:
| | | | | | | | | | | | | | | | | | | | | | | |
| Three Months Ended September 30, 2021 | | Nine Months Ended September 30, 2021 |
| (in millions) | Commercial | Retail | Total | | Commercial | Retail | Total |
| Allowance for loan and lease losses, beginning of period | $953 | | $994 | | $1,947 | | | $1,233 | | $1,210 | | $2,443 | |
| | | | | | | |
| | | | | | | |
| Charge-offs | (17) | | (70) | | (87) | | | (196) | | (243) | | (439) | |
| Recoveries | 3 | | 40 | | 43 | | | 37 | | 122 | | 159 | |
| Net charge-offs | (14) | | (30) | | (44) | | | (159) | | (121) | | (280) | |
| | | | | | | |
| Provision charged to income | (72) | | 24 | | (48) | | | (207) | | (101) | | (308) | |
| Allowance for loan and lease losses, end of period | $867 | | $988 | | $1,855 | | | $867 | | $988 | | $1,855 | |
| | | | | | | |
| Allowance for unfunded lending commitments, beginning of period | $121 | | $13 | | $134 | | | $186 | | $41 | | $227 | |
| | | | | | | |
| | | | | | | |
| Provision for unfunded lending commitments | 9 | | 6 | | 15 | | | (56) | | (22) | | (78) | |
| Allowance for unfunded lending commitments, end of period | $130 | | $19 | | $149 | | | $130 | | $19 | | $149 | |
Overall, an ending ACL balance of $2.0 billion at September 30, 2021 compared to $2.7 billion at December 31, 2021:
| | | | | | | | | | | | | | | |
| | | Three Months Ended March 31, 2021 |
| (in millions) | | | | | Commercial | Retail | Total |
| Allowance for loan and lease losses, beginning of period | | | | | $1,233 | | $1,210 | | $2,443 | |
| | | | | | | |
| | | | | | | |
| Charge-offs | | | | | (134) | | (93) | | (227) | |
| Recoveries | | | | | 30 | | 39 | | 69 | |
| Net charge-offs | | | | | (104) | | (54) | | (158) | |
| | | | | | | |
| Provision charged to income | | | | | 17 | | (108) | | (91) | |
| Allowance for loan and lease losses, end of period | | | | | $1,146 | | $1,048 | | $2,194 | |
| | | | | | | |
| Allowance for unfunded lending commitments, beginning of period | | | | | $186 | | $41 | | $227 | |
| | | | | | | |
| | | | | | | |
| Provision for unfunded lending commitments | | | | | (21) | | (28) | | (49) | |
| Allowance for unfunded lending commitments, end of period | | | | | $165 | | $13 | | $178 | |
2020. The difference in ACL as of March 31,September 30, 2021 as compared to December 31, 2020 was due to higher net charge-offs of $158$280 million, as detailed below, coupled with a negativecredit provision for credit losses for $140benefit of $386 million. This reflected strong credit performance across the retail and commercial loan portfolios, and improvement in the macroeconomic outlook. Overall, an ending ACL balance of $2.4 billion at March 31, 2021 compared to $2.7 billion at December 31, 2020.
The increasedecrease in commercial net charge-offs of $60$126 million infor the threenine months ended March 31,September 30, 2021 as compared to the threenine months ended March 31,September 30, 2020 was driven by higher charge-offs in financereflects the economic recovery following the COVID-19 pandemic and insurance, including one large charge-off related to a financial sponsor, and CRE.associated lockdowns. Retail net charge-offs were down $39$97 million in the threenine months ended March 31,September 30, 2021 as compared to the threenine months ended March 31,September 30, 2020 as a result of government stimulus and forbearance programs.programs as well as strong collateral values in residential real estate and automobile.
To determine the ACL as of March, 31,September 30, 2021, Citizens utilized an economic forecast that generally reflects real GDP growth of approximately 3.2%5.8% over 2021, returning to fourth quarter 2019 real GDP levels by the last quarter of 2021. The forecast also projects the unemployment rate to be in the range of 6.3%5.3% to 7.0%6.3% throughout 2021. Overall, thisThis forecast reflects an overall improved macroeconomic outlook as compared to December 31, 2020. We continue to utilize our qualitative allowance framework to reassess and adjust ACL reserve levels. Macroeconomic forecast risk, driven by uncertainty and volatility of key macroeconomic variables, is one of the primary factors influencing our qualitative reserve. As the economic recovery following the COVID-19 pandemic has continued, we have assessed risks to the recovery, including potential for continuing impacts from COVID-19 variants, challenges in the global supply chain, and recent inflationary trends, as well as potential impacts from ending monetary and fiscal stimulus programs. In addition to judgment applied atto the commercial portfolio as a whole, Citizens continued to apply management judgment
Citizens Financial Group, Inc. | 62
to adjust the modeled reserves in the commercial industry sectors most impacted by the COVID-19 pandemic and associated lockdowns, including CRE retail, CRE office and hospitality and casual dining.
Accrued interest receivable on loans and leases is excluded from asset balances used to calculate the ACL. Loans in COVID-19 pandemic-related forbearance programs continue to accrue interest during the forbearance period; a reserve is established for interest income expected to be uncollectible following forbearance. Accrued interest reversed against interest income for the three months ended March 31, 2021 was $1 million and $6 million for commercial and retail, respectively. For the three months ended March 31, 2020, these reversals were $1 million and $5 million for commercial and retail, respectively.
Citizens Financial Group, Inc. | 54
The following table presents a summary of changes in the ALLL and the allowance for unfunded lending commitments for the three months and nine months ended March 31,September 30, 2020:
| | | | Three Months Ended March 31, 2020 | | Three Months Ended September 30, 2020 | | Nine Months Ended September 30, 2020 |
| (in millions) | (in millions) | | Commercial | Retail | Total | (in millions) | Commercial | Retail | Total | | Commercial | Retail | Total |
| Allowance for loan and lease losses, beginning of period | Allowance for loan and lease losses, beginning of period | | $674 | | $578 | | $1,252 | | Allowance for loan and lease losses, beginning of period | $1,235 | | $1,213 | | $2,448 | | | $674 | | $578 | | $1,252 | |
| Cumulative effect of change in accounting principle | Cumulative effect of change in accounting principle | | (176) | | 629 | | 453 | | Cumulative effect of change in accounting principle | — | | — | | — | | | (176) | | 629 | | 453 | |
| Allowance for loan and lease losses, beginning of period, adjusted | Allowance for loan and lease losses, beginning of period, adjusted | | 498 | | 1,207 | | 1,705 | | Allowance for loan and lease losses, beginning of period, adjusted | 1,235 | | 1,213 | | 2,448 | | | 498 | | 1,207 | | 1,705 | |
| Charge-offs | Charge-offs | | (47) | | (127) | | (174) | | Charge-offs | (171) | | (86) | | (257) | | | (292) | | (319) | | (611) | |
| Recoveries | Recoveries | | 3 | | 34 | | 37 | | Recoveries | 1 | | 37 | | 38 | | | 7 | | 101 | | 108 | |
| Net charge-offs | Net charge-offs | | (44) | | (93) | | (137) | | Net charge-offs | (170) | | (49) | | (219) | | | (285) | | (218) | | (503) | |
| | Provision charged to income | Provision charged to income | | 298 | | 305 | | 603 | | Provision charged to income | 224 | | 89 | | 313 | | | 1,076 | | 264 | | 1,340 | |
| Allowance for loan and lease losses, end of period | Allowance for loan and lease losses, end of period | | $752 | | $1,419 | | $2,171 | | Allowance for loan and lease losses, end of period | $1,289 | | $1,253 | | $2,542 | | | $1,289 | | $1,253 | | $2,542 | |
| | Allowance for unfunded lending commitments, beginning of period | Allowance for unfunded lending commitments, beginning of period | | $44 | | $0 | | $44 | | Allowance for unfunded lending commitments, beginning of period | $69 | | $10 | | $79 | | | $44 | | $— | | $44 | |
| Cumulative effect of change in accounting principle | Cumulative effect of change in accounting principle | | (3) | | 1 | | (2) | | Cumulative effect of change in accounting principle | — | | — | | — | | | (3) | | 1 | | (2) | |
| Allowance for unfunded lending commitments, beginning of period, adjusted | Allowance for unfunded lending commitments, beginning of period, adjusted | | 41 | | 1 | | 42 | | Allowance for unfunded lending commitments, beginning of period, adjusted | 69 | | 10 | | 79 | | | 41 | | 1 | | 42 | |
| Provision for unfunded lending commitments | Provision for unfunded lending commitments | | (3) | | 0 | | (3) | | Provision for unfunded lending commitments | 83 | | 32 | | 115 | | | 111 | | 41 | | 152 | |
| Allowance for unfunded lending commitments, end of period | Allowance for unfunded lending commitments, end of period | | $38 | | $1 | | $39 | | Allowance for unfunded lending commitments, end of period | $152 | | $42 | | $194 | | | $152 | | $42 | | $194 | |
Credit Quality Indicators
LoanThe Company presents loan and lease portfolio segments and classes excluding LHFS, are presented by credit quality indicator and vintage year. Citizens defines the vintage date for the purpose of this disclosure as the date of the most recent credit decision. In general, renewals are categorized as new credit decisions and reflect the renewal date as the vintage date. Loans modified in a TDR are considered to be a continuation of the original loan and vintage date corresponds with the initial loan origination date.most recent credit decision.
For commercial loans and leases, Citizens utilizes regulatory classification ratings to monitor credit quality. RegulatoryThe assignment of regulatory classification ratings are assignedoccurs at loan origination and are periodically re-evaluated by Citizens utilizing a risk-based approach, or atincluding any time management becomes aware of information affecting the borrowers' ability to fulfill their obligations. BothThe review process considers both quantitative and qualitative factors are considered in this review process.factors. Loans with a “pass” rating are those that the Company believes will be fully repaidrepay in accordance with the contractual loan terms. Commercial loans and leases that areidentified as “criticized” are those that have some weakness or potential weakness that indicate an increased probability of future loss. “Criticized”Citizens groups “criticized” loans are grouped into three categories, “special mention,” “substandard”“substandard,” and “doubtful.” Special mention loans have potential weaknesses that, if left uncorrected, may result in deterioration of the Company’s credit position at some future date. Substandard loans are inadequately protected loans; these loans have well-defined weaknesses that could hinder normal repayment or collection of the debt. Doubtful loans have the same weaknesses as substandard, with the added characteristicscharacteristic that the possibility of loss is high and collection of the full amount of the loan is improbable.
Citizens Financial Group, Inc. | 5563
The following table presents the amortized cost basis of commercial loans and leases, by vintage date and regulatory classification rating, as of March 31,September 30, 2021:
| | | Term Loans by Origination Year | | Revolving Loans | | | Term Loans by Origination Year | | Revolving Loans | |
| (in millions) | (in millions) | 2021 | | 2020 | | 2019 | | 2018 | | 2017 | | Prior to 2017 | | Within the Revolving Period | Converted to Term | | Total | (in millions) | 2021 | | 2020 | | 2019 | | 2018 | | 2017 | | Prior to 2017 | | Within the Revolving Period | Converted to Term | | Total |
| Commercial and industrial | Commercial and industrial | | | | | | | | | | | | | | | | Commercial and industrial | | | | | | | | | | | | | | | |
Pass(1) | Pass(1) | $3,000 | | | $7,178 | | | $5,699 | | | $3,995 | | | $2,206 | | | $3,384 | | | $15,134 | | $326 | | | $40,922 | | Pass(1) | $6,411 | | | $4,086 | | | $4,723 | | | $3,079 | | | $1,723 | | | $2,480 | | | $16,578 | | $138 | | | $39,218 | |
| Special Mention | Special Mention | 0 | | | 41 | | | 221 | | | 241 | | | 86 | | | 244 | | | 415 | | 34 | | | 1,282 | | Special Mention | 4 | | | 47 | | | 226 | | | 148 | | | 55 | | | 182 | | | 451 | | 2 | | | 1,115 | |
| Substandard | Substandard | 22 | | | 101 | | | 294 | | | 256 | | | 124 | | | 177 | | | 612 | | 23 | | | 1,609 | | Substandard | 40 | | | 110 | | | 229 | | | 121 | | | 91 | | | 227 | | | 550 | | 18 | | | 1,386 | |
| Doubtful | Doubtful | 0 | | | 65 | | | 11 | | | 31 | | | 28 | | | 35 | | | 72 | | 3 | | | 245 | | Doubtful | 26 | | | 8 | | | 12 | | | 21 | | | 11 | | | 17 | | | 37 | | 3 | | | 135 | |
| Total commercial and industrial | Total commercial and industrial | 3,022 | | | 7,385 | | | 6,225 | | | 4,523 | | | 2,444 | | | 3,840 | | | 16,233 | | 386 | | | 44,058 | | Total commercial and industrial | 6,481 | | | 4,251 | | | 5,190 | | | 3,369 | | | 1,880 | | | 2,906 | | | 17,616 | | 161 | | | 41,854 | |
| Commercial real estate | Commercial real estate | | | | | | | | | | | | | | | | Commercial real estate | | | | | | | | | | | | | | | |
| Pass | Pass | 253 | | | 2,411 | | | 3,815 | | | 3,212 | | | 1,206 | | | 1,794 | | | 940 | | 0 | | | 13,631 | | Pass | 1,073 | | | 2,586 | | | 3,835 | | | 2,484 | | | 863 | | | 1,343 | | | 962 | | — | | | 13,146 | |
| Special Mention | Special Mention | 0 | | | 9 | | | 131 | | | 72 | | | 178 | | | 99 | | | 0 | | 0 | | | 489 | | Special Mention | 46 | | | 3 | | | 148 | | | 99 | | | 169 | | | 151 | | | — | | — | | | 616 | |
| Substandard | Substandard | 46 | | | 116 | | | 58 | | | 58 | | | 49 | | | 81 | | | 0 | | 0 | | | 408 | | Substandard | 28 | | | 97 | | | 91 | | | 279 | | | 150 | | | 81 | | | 9 | | — | | | 735 | |
| Doubtful | Doubtful | 0 | | | 16 | | | 0 | | | 7 | | | 0 | | | 2 | | | 0 | | 0 | | | 25 | | Doubtful | — | | | 9 | | | — | | | — | | | — | | | 2 | | | — | | — | | | 11 | |
| Total commercial real estate | Total commercial real estate | 299 | | | 2,552 | | | 4,004 | | | 3,349 | | | 1,433 | | | 1,976 | | | 940 | | 0 | | | 14,553 | | Total commercial real estate | 1,147 | | | 2,695 | | | 4,074 | | | 2,862 | | | 1,182 | | | 1,577 | | | 971 | | — | | | 14,508 | |
| Leases | Leases | | | | | | | | | | | | | | | | Leases | | | | | | | | | | | | | | | |
| Pass | Pass | 94 | | | 401 | | | 240 | | | 225 | | | 116 | | | 675 | | | 0 | | 0 | | | 1,751 | | Pass | 284 | | | 281 | | | 191 | | | 180 | | | 79 | | | 504 | | | — | | — | | | 1,519 | |
| Special Mention | Special Mention | 0 | | | 3 | | | 4 | | | 2 | | | 6 | | | 19 | | | 0 | | 0 | | | 34 | | Special Mention | 2 | | | 16 | | | 2 | | | 8 | | | 5 | | | 16 | | | — | | — | | | 49 | |
| Substandard | Substandard | 0 | | | 13 | | | 2 | | | 1 | | | 0 | | | 0 | | | 0 | | 0 | | | 16 | | Substandard | 1 | | | 16 | | | 6 | | | — | | | — | | | 1 | | | — | | — | | | 24 | |
| Doubtful | Doubtful | 0 | | | 0 | | | 0 | | | 0 | | | 0 | | | 1 | | | 0 | | 0 | | | 1 | | Doubtful | — | | | — | | | — | | | — | | | — | | | 1 | | | — | | — | | | 1 | |
| Total leases | Total leases | 94 | | | 417 | | | 246 | | | 228 | | | 122 | | | 695 | | | 0 | | 0 | | | 1,802 | | Total leases | 287 | | | 313 | | | 199 | | | 188 | | | 84 | | | 522 | | | — | | — | | | 1,593 | |
| Total commercial loans and leases | | | | | | | | | | | | | | | | |
| Total commercial | | Total commercial | | | | | | | | | | | | | | | |
Pass(1) | Pass(1) | 3,347 | | | 9,990 | | | 9,754 | | | 7,432 | | | 3,528 | | | 5,853 | | | 16,074 | | 326 | | | 56,304 | | Pass(1) | 7,768 | | | 6,953 | | | 8,749 | | | 5,743 | | | 2,665 | | | 4,327 | | | 17,540 | | 138 | | | 53,883 | |
| Special Mention | Special Mention | 0 | | | 53 | | | 356 | | | 315 | | | 270 | | | 362 | | | 415 | | 34 | | | 1,805 | | Special Mention | 52 | | | 66 | | | 376 | | | 255 | | | 229 | | | 349 | | | 451 | | 2 | | | 1,780 | |
| Substandard | Substandard | 68 | | | 230 | | | 354 | | | 315 | | | 173 | | | 258 | | | 612 | | 23 | | | 2,033 | | Substandard | 69 | | | 223 | | | 326 | | | 400 | | | 241 | | | 309 | | | 559 | | 18 | | | 2,145 | |
| Doubtful | Doubtful | 0 | | | 81 | | | 11 | | | 38 | | | 28 | | | 38 | | | 72 | | 3 | | | 271 | | Doubtful | 26 | | | 17 | | | 12 | | | 21 | | | 11 | | | 20 | | | 37 | | 3 | | | 147 | |
| Total commercial | Total commercial | $3,415 | | | $10,354 | | | $10,475 | | | $8,100 | | | $3,999 | | | $6,511 | | | $17,173 | | $386 | | | $60,413 | | Total commercial | $7,915 | | | $7,259 | | | $9,463 | | | $6,419 | | | $3,146 | | | $5,005 | | | $18,587 | | $161 | | | $57,955 | |
(1) Includes $5.1$1.9 billion of PPP loans designated as pass that are fully guaranteed by the SBA originating in 2021 and 2020.
Citizens Financial Group, Inc. | 5664
The following table presents the amortized cost basis of commercial loans and leases, by vintage date and regulatory classification rating, as of December 31, 2020:
| | | Term Loans by Origination Year | | Revolving Loans | | | Term Loans by Origination Year | | Revolving Loans | |
| (in millions) | (in millions) | 2020 | | 2019 | | 2018 | | 2017 | | 2016 | | Prior to 2016 | | Within the Revolving Period | Converted to Term | | Total | (in millions) | 2020 | | 2019 | | 2018 | | 2017 | | 2016 | | Prior to 2016 | | Within the Revolving Period | Converted to Term | | Total |
| Commercial and industrial | Commercial and industrial | | | | | | | | | | | | | | | | Commercial and industrial | | | | | | | | | | | | | | | |
Pass(1) | Pass(1) | $8,036 | | | $5,730 | | | $4,180 | | | $2,174 | | | $1,157 | | | $1,980 | | | $17,281 | | $340 | | | $40,878 | | Pass(1) | $8,036 | | | $5,730 | | | $4,180 | | | $2,174 | | | $1,157 | | | $1,980 | | | $17,281 | | $340 | | | $40,878 | |
| Special Mention | Special Mention | 34 | | | 264 | | | 163 | | | 84 | | | 60 | | | 173 | | | 771 | | 34 | | | 1,583 | | Special Mention | 34 | | | 264 | | | 163 | | | 84 | | | 60 | | | 173 | | | 771 | | 34 | | | 1,583 | |
| Substandard | Substandard | 91 | | | 195 | | | 248 | | | 100 | | | 81 | | | 127 | | | 600 | | 22 | | | 1,464 | | Substandard | 91 | | | 195 | | | 248 | | | 100 | | | 81 | | | 127 | | | 600 | | 22 | | | 1,464 | |
| Doubtful | Doubtful | 65 | | | 10 | | | 34 | | | 38 | | | 3 | | | 31 | | | 63 | | 4 | | | 248 | | Doubtful | 65 | | | 10 | | | 34 | | | 38 | | | 3 | | | 31 | | | 63 | | 4 | | | 248 | |
| Total commercial and industrial | Total commercial and industrial | 8,226 | | | 6,199 | | | 4,625 | | | 2,396 | | | 1,301 | | | 2,311 | | | 18,715 | | 400 | | | 44,173 | | Total commercial and industrial | 8,226 | | | 6,199 | | | 4,625 | | | 2,396 | | | 1,301 | | | 2,311 | | | 18,715 | | 400 | | | 44,173 | |
| Commercial real estate | Commercial real estate | | | | | | | | | | | | | | | | Commercial real estate | | | | | | | | | | | | | | | |
| Pass | Pass | 1,848 | | | 2,836 | | | 2,810 | | | 1,106 | | | 566 | | | 919 | | | 3,271 | | 0 | | | 13,356 | | Pass | 1,848 | | | 2,836 | | | 2,810 | | | 1,106 | | | 566 | | | 919 | | | 3,271 | | — | | | 13,356 | |
| Special Mention | Special Mention | 19 | | | 130 | | | 121 | | | 92 | | | 94 | | | 48 | | | 300 | | 0 | | | 804 | | Special Mention | 19 | | | 130 | | | 121 | | | 92 | | | 94 | | | 48 | | | 300 | | — | | | 804 | |
| Substandard | Substandard | 116 | | | 2 | | | 65 | | | 5 | | | 53 | | | 26 | | | 149 | | 0 | | | 416 | | Substandard | 116 | | | 2 | | | 65 | | | 5 | | | 53 | | | 26 | | | 149 | | — | | | 416 | |
| Doubtful | Doubtful | 16 | | | 26 | | | 8 | | | 0 | | | 0 | | | 2 | | | 24 | | 0 | | | 76 | | Doubtful | 16 | | | 26 | | | 8 | | | — | | | — | | | 2 | | | 24 | | — | | | 76 | |
| Total commercial real estate | Total commercial real estate | 1,999 | | | 2,994 | | | 3,004 | | | 1,203 | | | 713 | | | 995 | | | 3,744 | | 0 | | | 14,652 | | Total commercial real estate | 1,999 | | | 2,994 | | | 3,004 | | | 1,203 | | | 713 | | | 995 | | | 3,744 | | — | | | 14,652 | |
| Leases | Leases | | | | | | | | | | | | | | | | Leases | | | | | | | | | | | | | | | |
| Pass | Pass | 455 | | | 246 | | | 229 | | | 139 | | | 180 | | | 673 | | | 0 | | 0 | | | 1,922 | | Pass | 455 | | | 246 | | | 229 | | | 139 | | | 180 | | | 673 | | | — | | — | | | 1,922 | |
| Special Mention | Special Mention | 3 | | | 4 | | | 2 | | | 4 | | | 2 | | | 18 | | | 0 | | 0 | | | 33 | | Special Mention | 3 | | | 4 | | | 2 | | | 4 | | | 2 | | | 18 | | | — | | — | | | 33 | |
| Substandard | Substandard | 0 | | | 2 | | | 2 | | | 4 | | | 4 | | | 0 | | | 0 | | 0 | | | 12 | | Substandard | — | | | 2 | | | 2 | | | 4 | | | 4 | | | — | | | — | | — | | | 12 | |
| Doubtful | Doubtful | 0 | | | 0 | | | 0 | | | 0 | | | 0 | | | 1 | | | 0 | | 0 | | | 1 | | Doubtful | — | | | — | | | — | | | — | | | — | | | 1 | | | — | | — | | | 1 | |
| Total leases | Total leases | 458 | | | 252 | | | 233 | | | 147 | | | 186 | | | 692 | | | 0 | | 0 | | | 1,968 | | Total leases | 458 | | | 252 | | | 233 | | | 147 | | | 186 | | | 692 | | | — | | — | | | 1,968 | |
| Total commercial loans and leases | | | | | | | | | | | | | | | | |
| Total commercial | | Total commercial | | | | | | | | | | | | | | | |
Pass(1) | Pass(1) | 10,339 | | | 8,812 | | | 7,219 | | | 3,419 | | | 1,903 | | | 3,572 | | | 20,552 | | 340 | | | 56,156 | | Pass(1) | 10,339 | | | 8,812 | | | 7,219 | | | 3,419 | | | 1,903 | | | 3,572 | | | 20,552 | | 340 | | | 56,156 | |
| Special Mention | Special Mention | 56 | | | 398 | | | 286 | | | 180 | | | 156 | | | 239 | | | 1,071 | | 34 | | | 2,420 | | Special Mention | 56 | | | 398 | | | 286 | | | 180 | | | 156 | | | 239 | | | 1,071 | | 34 | | | 2,420 | |
| Substandard | Substandard | 207 | | | 199 | | | 315 | | | 109 | | | 138 | | | 153 | | | 749 | | 22 | | | 1,892 | | Substandard | 207 | | | 199 | | | 315 | | | 109 | | | 138 | | | 153 | | | 749 | | 22 | | | 1,892 | |
| Doubtful | Doubtful | 81 | | | 36 | | | 42 | | | 38 | | | 3 | | | 34 | | | 87 | | 4 | | | 325 | | Doubtful | 81 | | | 36 | | | 42 | | | 38 | | | 3 | | | 34 | | | 87 | | 4 | | | 325 | |
| Total commercial | Total commercial | $10,683 | | | $9,445 | | | $7,862 | | | $3,746 | | | $2,200 | | | $3,998 | | | $22,459 | | $400 | | | $60,793 | | Total commercial | $10,683 | | | $9,445 | | | $7,862 | | | $3,746 | | | $2,200 | | | $3,998 | | | $22,459 | | $400 | | | $60,793 | |
(1) Includes $4.2 billion of PPP loans designated as pass that are fully guaranteed by the SBA originating in 2020.
For retail loans, Citizens utilizes FICO credit scores provided by FICO and the loan’s payment and delinquency status to monitor credit quality. Management believes FICO credit scores are considered the strongest indicator of credit losses over the contractual life of the loan asand assist management in predicting the scoresborrower’s future payment performance. Scores are based on current and historical national industry-wide consumer level credit performance data, and assist management in predicting the borrower’s future payment performance.data.
Citizens Financial Group, Inc. | 5765
The following table presents the amortized cost basis of retail loans, by vintage date and FICO scores, as of March 31,September 30, 2021:
| | | Term Loans by Origination Year | | Revolving Loans | | | Term Loans by Origination Year | | Revolving Loans | |
| (in millions) | (in millions) | 2021 | | 2020 | | 2019 | | 2018 | | 2017 | | Prior to 2017 | | Within the Revolving Period | Converted to Term | | Total | (in millions) | 2021 | | 2020 | | 2019 | | 2018 | | 2017 | | Prior to 2017 | | Within the Revolving Period | Converted to Term | | Total |
| Residential mortgages | Residential mortgages | | | | | | | | | | | | | | | | Residential mortgages | | | | | | | | | | | | | | | |
| 800+ | 800+ | $307 | | | $3,088 | | | $1,756 | | | $556 | | | $1,014 | | | $3,023 | | | $0 | | $0 | | | $9,744 | | 800+ | $1,585 | | | $3,179 | | | $1,403 | | | $395 | | | $784 | | | $2,389 | | | $— | | $— | | | $9,735 | |
| 740-799 | 740-799 | 729 | | | 2,369 | | | 944 | | | 337 | | | 446 | | | 1,442 | | | 0 | | 0 | | | 6,267 | | 740-799 | 2,607 | | | 2,087 | | | 853 | | | 265 | | | 384 | | | 1,253 | | | — | | — | | | 7,449 | |
| 680-739 | 680-739 | 175 | | | 699 | | | 331 | | | 140 | | | 157 | | | 681 | | | 0 | | 0 | | | 2,183 | | 680-739 | 639 | | | 613 | | | 356 | | | 173 | | | 185 | | | 611 | | | — | | — | | | 2,577 | |
| 620-679 | 620-679 | 14 | | | 96 | | | 93 | | | 46 | | | 65 | | | 306 | | | 0 | | 0 | | | 620 | | 620-679 | 84 | | | 117 | | | 169 | | | 103 | | | 112 | | | 306 | | | — | | — | | | 891 | |
| <620 | <620 | 2 | | | 25 | | | 28 | | | 40 | | | 53 | | | 224 | | | 0 | | 0 | | | 372 | | <620 | 8 | | | 56 | | | 166 | | | 167 | | | 165 | | | 281 | | | — | | — | | | 843 | |
No FICO available(1) | No FICO available(1) | 2 | | | 2 | | | 1 | | | 0 | | | 0 | | | 11 | | | 0 | | 0 | | | 16 | | No FICO available(1) | 2 | | | 5 | | | 1 | | | — | | | — | | | 10 | | | — | | — | | | 18 | |
| Total residential mortgages | Total residential mortgages | 1,229 | | | 6,279 | | | 3,153 | | | 1,119 | | | 1,735 | | | 5,687 | | | 0 | | 0 | | | 19,202 | | Total residential mortgages | 4,925 | | | 6,057 | | | 2,948 | | | 1,103 | | | 1,630 | | | 4,850 | | | — | | — | | | 21,513 | |
| Home equity | Home equity | | | | | | | | | | | | | | | | Home equity | | | | | | | | | | | | | | | |
| 800+ | 800+ | 0 | | | 3 | | | 7 | | | 8 | | | 6 | | | 192 | | | 4,288 | | 335 | | | 4,839 | | 800+ | — | | | 2 | | | 6 | | | 6 | | | 4 | | | 154 | | | 4,333 | | 294 | | | 4,799 | |
| 740-799 | 740-799 | 0 | | | 1 | | | 5 | | | 6 | | | 6 | | | 170 | | | 3,167 | | 317 | | | 3,672 | | 740-799 | 1 | | | 1 | | | 5 | | | 5 | | | 8 | | | 137 | | | 3,405 | | 299 | | | 3,861 | |
| 680-739 | 680-739 | 0 | | | 1 | | | 6 | | | 11 | | | 16 | | | 175 | | | 1,610 | | 270 | | | 2,089 | | 680-739 | — | | | 1 | | | 8 | | | 13 | | | 17 | | | 151 | | | 1,665 | | 250 | | | 2,105 | |
| 620-679 | 620-679 | 0 | | | 3 | | | 13 | | | 20 | | | 23 | | | 144 | | | 363 | | 189 | | | 755 | | 620-679 | — | | | 3 | | | 13 | | | 23 | | | 19 | | | 123 | | | 345 | | 176 | | | 702 | |
| <620 | <620 | 0 | | | 5 | | | 21 | | | 33 | | | 26 | | | 124 | | | 87 | | 203 | | | 499 | | <620 | — | | | 2 | | | 16 | | | 22 | | | 21 | | | 96 | | | 86 | | 179 | | | 422 | |
No FICO available(1) | 0 | | | 0 | | | 0 | | | 0 | | | 0 | | | 0 | | | 0 | | 0 | | | 0 | | |
| | Total home equity | Total home equity | 0 | | | 13 | | | 52 | | | 78 | | | 77 | | | 805 | | | 9,515 | | 1,314 | | | 11,854 | | Total home equity | 1 | | | 9 | | | 48 | | | 69 | | | 69 | | | 661 | | | 9,834 | | 1,198 | | | 11,889 | |
| Automobile | Automobile | | | | | | | | | | | | | | | | Automobile | | | | | | | | | | | | | | | |
| 800+ | 800+ | 370 | | | 997 | | | 749 | | | 378 | | | 265 | | | 168 | | | 0 | | 0 | | | 2,927 | | 800+ | 1,287 | | | 897 | | | 608 | | | 286 | | | 183 | | | 84 | | | — | | — | | | 3,345 | |
| 740-799 | 740-799 | 495 | | | 1,426 | | | 906 | | | 460 | | | 288 | | | 169 | | | 0 | | 0 | | | 3,744 | | 740-799 | 1,781 | | | 1,177 | | | 707 | | | 344 | | | 195 | | | 85 | | | — | | — | | | 4,289 | |
| 680-739 | 680-739 | 441 | | | 1,253 | | | 781 | | | 396 | | | 232 | | | 136 | | | 0 | | 0 | | | 3,239 | | 680-739 | 1,436 | | | 958 | | | 589 | | | 277 | | | 154 | | | 69 | | | — | | — | | | 3,483 | |
| 620-679 | 620-679 | 188 | | | 616 | | | 421 | | | 220 | | | 131 | | | 86 | | | 0 | | 0 | | | 1,662 | | 620-679 | 680 | | | 436 | | | 297 | | | 156 | | | 89 | | | 45 | | | — | | — | | | 1,703 | |
| <620 | <620 | 18 | | | 159 | | | 218 | | | 168 | | | 117 | | | 87 | | | 0 | | 0 | | | 767 | | <620 | 120 | | | 142 | | | 168 | | | 118 | | | 75 | | | 45 | | | — | | — | | | 668 | |
No FICO available(1) | No FICO available(1) | 2 | | | 1 | | | 0 | | | 0 | | | 0 | | | 2 | | | 0 | | 0 | | | 5 | | No FICO available(1) | 4 | | | — | | | — | | | — | | | — | | | — | | | — | | — | | | 4 | |
| Total automobile | Total automobile | 1,514 | | | 4,452 | | | 3,075 | | | 1,622 | | | 1,033 | | | 648 | | | 0 | | 0 | | | 12,344 | | Total automobile | 5,308 | | | 3,610 | | | 2,369 | | | 1,181 | | | 696 | | | 328 | | | — | | — | | | 13,492 | |
| Education | Education | | | | | | | | | | | | | | | | Education | | | | | | | | | | | | | | | |
| 800+ | 800+ | 347 | | | 1,781 | | | 1,169 | | | 713 | | | 647 | | | 1,151 | | | 0 | | 0 | | | 5,808 | | 800+ | 1,080 | | | 1,865 | | | 921 | | | 566 | | | 519 | | | 951 | | | — | | — | | | 5,902 | |
| 740-799 | 740-799 | 399 | | | 1,883 | | | 971 | | | 528 | | | 370 | | | 638 | | | 0 | | 0 | | | 4,789 | | 740-799 | 1,245 | | | 1,743 | | | 730 | | | 402 | | | 297 | | | 550 | | | — | | — | | | 4,967 | |
| 680-739 | 680-739 | 98 | | | 560 | | | 326 | | | 187 | | | 136 | | | 312 | | | 0 | | 0 | | | 1,619 | | 680-739 | 369 | | | 526 | | | 246 | | | 150 | | | 113 | | | 278 | | | — | | — | | | 1,682 | |
| 620-679 | 620-679 | 5 | | | 55 | | | 50 | | | 41 | | | 34 | | | 125 | | | 0 | | 0 | | | 310 | | 620-679 | 29 | | | 60 | | | 41 | | | 34 | | | 28 | | | 105 | | | — | | — | | | 297 | |
| <620 | <620 | 0 | | | 5 | | | 12 | | | 15 | | | 12 | | | 62 | | | 0 | | 0 | | | 106 | | <620 | 2 | | | 8 | | | 11 | | | 11 | | | 10 | | | 46 | | | — | | — | | | 88 | |
No FICO available(1) | No FICO available(1) | 2 | | | 0 | | | 0 | | | 0 | | | 0 | | | 57 | | | 0 | | 0 | | | 59 | | No FICO available(1) | 10 | | | — | | | — | | | — | | | — | | | 54 | | | — | | — | | | 64 | |
| Total education | Total education | 851 | | | 4,284 | | | 2,528 | | | 1,484 | | | 1,199 | | | 2,345 | | | 0 | | 0 | | | 12,691 | | Total education | 2,735 | | | 4,202 | | | 1,949 | | | 1,163 | | | 967 | | | 1,984 | | | — | | — | | | 13,000 | |
| Other retail | Other retail | | | | | | | | | | | | | | | | Other retail | | | | | | | | | | | | | | | |
| 800+ | 800+ | 63 | | | 394 | | | 269 | | | 117 | | | 56 | | | 49 | | | 303 | | 0 | | | 1,251 | | 800+ | 134 | | | 288 | | | 154 | | | 79 | | | 37 | | | 35 | | | 366 | | — | | | 1,093 | |
| 740-799 | 740-799 | 95 | | | 546 | | | 359 | | | 151 | | | 68 | | | 42 | | | 592 | | 2 | | | 1,855 | | 740-799 | 211 | | | 395 | | | 216 | | | 103 | | | 47 | | | 29 | | | 711 | | 2 | | | 1,714 | |
| 680-739 | 680-739 | 87 | | | 431 | | | 245 | | | 102 | | | 45 | | | 22 | | | 531 | | 5 | | | 1,468 | | 680-739 | 179 | | | 308 | | | 151 | | | 69 | | | 29 | | | 14 | | | 667 | | 5 | | | 1,422 | |
| 620-679 | 620-679 | 56 | | | 229 | | | 88 | | | 36 | | | 13 | | | 7 | | | 170 | | 6 | | | 605 | | 620-679 | 114 | | | 150 | | | 51 | | | 24 | | | 8 | | | 5 | | | 264 | | 5 | | | 621 | |
| <620 | <620 | 4 | | | 46 | | | 35 | | | 20 | | | 7 | | | 4 | | | 74 | | 8 | | | 198 | | <620 | 19 | | | 39 | | | 19 | | | 11 | | | 3 | | | 3 | | | 78 | | 6 | | | 178 | |
No FICO available(1) | No FICO available(1) | 24 | | | 9 | | | 0 | | | 0 | | | 0 | | | 0 | | | 279 | | 2 | | | 314 | | No FICO available(1) | 120 | | | 7 | | | — | | | — | | | — | | | — | | | 313 | | 1 | | | 441 | |
| Total other retail | Total other retail | 329 | | | 1,655 | | | 996 | | | 426 | | | 189 | | | 124 | | | 1,949 | | 23 | | | 5,691 | | Total other retail | 777 | | | 1,187 | | | 591 | | | 286 | | | 124 | | | 86 | | | 2,399 | | 19 | | | 5,469 | |
| Retail | | | | | | | | | | | | | | | | |
| Total retail | | Total retail | | | | | | | | | | | | | | | |
| 800+ | 800+ | 1,087 | | | 6,263 | | | 3,950 | | | 1,772 | | | 1,988 | | | 4,583 | | | 4,591 | | 335 | | | 24,569 | | 800+ | 4,086 | | | 6,231 | | | 3,092 | | | 1,332 | | | 1,527 | | | 3,613 | | | 4,699 | | 294 | | | 24,874 | |
| 740-799 | 740-799 | 1,718 | | | 6,225 | | | 3,185 | | | 1,482 | | | 1,178 | | | 2,461 | | | 3,759 | | 319 | | | 20,327 | | 740-799 | 5,845 | | | 5,403 | | | 2,511 | | | 1,119 | | | 931 | | | 2,054 | | | 4,116 | | 301 | | | 22,280 | |
| 680-739 | 680-739 | 801 | | | 2,944 | | | 1,689 | | | 836 | | | 586 | | | 1,326 | | | 2,141 | | 275 | | | 10,598 | | 680-739 | 2,623 | | | 2,406 | | | 1,350 | | | 682 | | | 498 | | | 1,123 | | | 2,332 | | 255 | | | 11,269 | |
| 620-679 | 620-679 | 263 | | | 999 | | | 665 | | | 363 | | | 266 | | | 668 | | | 533 | | 195 | | | 3,952 | | 620-679 | 907 | | | 766 | | | 571 | | | 340 | | | 256 | | | 584 | | | 609 | | 181 | | | 4,214 | |
| <620 | <620 | 24 | | | 240 | | | 314 | | | 276 | | | 215 | | | 501 | | | 161 | | 211 | | | 1,942 | | <620 | 149 | | | 247 | | | 380 | | | 329 | | | 274 | | | 471 | | | 164 | | 185 | | | 2,199 | |
No FICO available(1) | No FICO available(1) | 30 | | | 12 | | | 1 | | | 0 | | | 0 | | | 70 | | | 279 | | 2 | | | 394 | | No FICO available(1) | 136 | | | 12 | | | 1 | | | — | | | — | | | 64 | | | 313 | | 1 | | | 527 | |
| Total retail | Total retail | $3,923 | | | $16,683 | | | $9,804 | | | $4,729 | | | $4,233 | | | $9,609 | | | $11,464 | | $1,337 | | | $61,782 | | Total retail | $13,746 | | | $15,065 | | | $7,905 | | | $3,802 | | | $3,486 | | | $7,909 | | | $12,233 | | $1,217 | | | $65,363 | |
(1) Represents loans for which an updated FICO score was unavailable (e.g., due to recent profile changes).
Citizens Financial Group, Inc. | 5866
The following table presents the amortized cost basis of retail loans, by vintage date and FICO scores, as of December 31, 2020:
| | | Term Loans by Origination Year | | Revolving Loans | | | Term Loans by Origination Year | | Revolving Loans | |
| (in millions) | (in millions) | 2020 | | 2019 | | 2018 | | 2017 | | 2016 | | Prior to 2016 | | Within the Revolving Period | Converted to Term | | Total | (in millions) | 2020 | | 2019 | | 2018 | | 2017 | | 2016 | | Prior to 2016 | | Within the Revolving Period | Converted to Term | | Total |
| Residential mortgages | Residential mortgages | | | | | | | | | | | | | | | | Residential mortgages | | | | | | | | | | | | | | | |
| 800+ | 800+ | $2,687 | | | $1,885 | | | $638 | | | $1,129 | | | $1,615 | | | $1,755 | | | $0 | | $0 | | | $9,709 | | 800+ | $2,687 | | | $1,885 | | | $638 | | | $1,129 | | | $1,615 | | | $1,755 | | | $— | | $— | | | $9,709 | |
| 740-799 | 740-799 | 2,931 | | | 1,133 | | | 398 | | | 527 | | | 743 | | | 904 | | | 0 | | 0 | | | 6,636 | | 740-799 | 2,931 | | | 1,133 | | | 398 | | | 527 | | | 743 | | | 904 | | | — | | — | | | 6,636 | |
| 680-739 | 680-739 | 784 | | | 351 | | | 162 | | | 172 | | | 295 | | | 458 | | | 0 | | 0 | | | 2,222 | | 680-739 | 784 | | | 351 | | | 162 | | | 172 | | | 295 | | | 458 | | | — | | — | | | 2,222 | |
| 620-679 | 620-679 | 97 | | | 94 | | | 44 | | | 56 | | | 66 | | | 223 | | | 0 | | 0 | | | 580 | | 620-679 | 97 | | | 94 | | | 44 | | | 56 | | | 66 | | | 223 | | | — | | — | | | 580 | |
| <620 | <620 | 12 | | | 28 | | | 35 | | | 58 | | | 50 | | | 185 | | | 0 | | 0 | | | 368 | | <620 | 12 | | | 28 | | | 35 | | | 58 | | | 50 | | | 185 | | | — | | — | | | 368 | |
No FICO available(1) | No FICO available(1) | 1 | | | 2 | | | 1 | | | 5 | | | 1 | | | 14 | | | 0 | | 0 | | | 24 | | No FICO available(1) | 1 | | | 2 | | | 1 | | | 5 | | | 1 | | | 14 | | | — | | — | | | 24 | |
| Total residential mortgages | Total residential mortgages | 6,512 | | | 3,493 | | | 1,278 | | | 1,947 | | | 2,770 | | | 3,539 | | | 0 | | 0 | | | 19,539 | | Total residential mortgages | 6,512 | | | 3,493 | | | 1,278 | | | 1,947 | | | 2,770 | | | 3,539 | | | — | | — | | | 19,539 | |
| Home equity | Home equity | | | | | | | | | | | | | | | | Home equity | | | | | | | | | | | | | | | |
| 800+ | 800+ | 2 | | | 8 | | | 10 | | | 7 | | | 5 | | | 216 | | | 4,319 | | 344 | | | 4,911 | | 800+ | 2 | | | 8 | | | 10 | | | 7 | | | 5 | | | 216 | | | 4,319 | | 344 | | | 4,911 | |
| 740-799 | 740-799 | 2 | | | 6 | | | 7 | | | 6 | | | 5 | | | 180 | | | 3,234 | | 331 | | | 3,771 | | 740-799 | 2 | | | 6 | | | 7 | | | 6 | | | 5 | | | 180 | | | 3,234 | | 331 | | | 3,771 | |
| 680-739 | 680-739 | 1 | | | 6 | | | 10 | | | 15 | | | 8 | | | 179 | | | 1,632 | | 284 | | | 2,135 | | 680-739 | 1 | | | 6 | | | 10 | | | 15 | | | 8 | | | 179 | | | 1,632 | | 284 | | | 2,135 | |
| 620-679 | 620-679 | 0 | | | 10 | | | 18 | | | 21 | | | 14 | | | 136 | | | 402 | | 195 | | | 796 | | 620-679 | — | | | 10 | | | 18 | | | 21 | | | 14 | | | 136 | | | 402 | | 195 | | | 796 | |
| <620 | <620 | 1 | | | 17 | | | 30 | | | 29 | | | 18 | | | 122 | | | 105 | | 214 | | | 536 | | <620 | 1 | | | 17 | | | 30 | | | 29 | | | 18 | | | 122 | | | 105 | | 214 | | | 536 | |
No FICO available(1) | 0 | | | 0 | | | 0 | | | 0 | | | 0 | | | 0 | | | 0 | | 0 | | | 0 | | |
| | Total home equity | Total home equity | 6 | | | 47 | | | 75 | | | 78 | | | 50 | | | 833 | | | 9,692 | | 1,368 | | | 12,149 | | Total home equity | 6 | | | 47 | | | 75 | | | 78 | | | 50 | | | 833 | | | 9,692 | | 1,368 | | | 12,149 | |
| Automobile | Automobile | | | | | | | | | | | | | | | | Automobile | | | | | | | | | | | | | | | |
| 800+ | 800+ | 1,056 | | | 812 | | | 424 | | | 312 | | | 169 | | | 62 | | | 0 | | 0 | | | 2,835 | | 800+ | 1,056 | | | 812 | | | 424 | | | 312 | | | 169 | | | 62 | | | — | | — | | | 2,835 | |
| 740-799 | 740-799 | 1,514 | | | 1,022 | | | 531 | | | 344 | | | 172 | | | 59 | | | 0 | | 0 | | | 3,642 | | 740-799 | 1,514 | | | 1,022 | | | 531 | | | 344 | | | 172 | | | 59 | | | — | | — | | | 3,642 | |
| 680-739 | 680-739 | 1,347 | | | 889 | | | 461 | | | 282 | | | 138 | | | 47 | | | 0 | | 0 | | | 3,164 | | 680-739 | 1,347 | | | 889 | | | 461 | | | 282 | | | 138 | | | 47 | | | — | | — | | | 3,164 | |
| 620-679 | 620-679 | 669 | | | 484 | | | 259 | | | 157 | | | 84 | | | 32 | | | 0 | | 0 | | | 1,685 | | 620-679 | 669 | | | 484 | | | 259 | | | 157 | | | 84 | | | 32 | | | — | | — | | | 1,685 | |
| <620 | <620 | 140 | | | 242 | | | 189 | | | 137 | | | 79 | | | 34 | | | 0 | | 0 | | | 821 | | <620 | 140 | | | 242 | | | 189 | | | 137 | | | 79 | | | 34 | | | — | | — | | | 821 | |
No FICO available(1) | No FICO available(1) | 2 | | | 0 | | | 0 | | | 0 | | | 0 | | | 4 | | | 0 | | 0 | | | 6 | | No FICO available(1) | 2 | | | — | | | — | | | — | | | — | | | 4 | | | — | | — | | | 6 | |
| Total automobile | Total automobile | 4,728 | | | 3,449 | | | 1,864 | | | 1,232 | | | 642 | | | 238 | | | 0 | | 0 | | | 12,153 | | Total automobile | 4,728 | | | 3,449 | | | 1,864 | | | 1,232 | | | 642 | | | 238 | | | — | | — | | | 12,153 | |
| Education | Education | | | | | | | | | | | | | | | | Education | | | | | | | | | | | | | | | |
| 800+ | 800+ | 1,817 | | | 1,363 | | | 849 | | | 781 | | | 578 | | | 777 | | | 0 | | 0 | | | 6,165 | | 800+ | 1,817 | | | 1,363 | | | 849 | | | 781 | | | 578 | | | 777 | | | — | | — | | | 6,165 | |
| 740-799 | 740-799 | 1,797 | | | 1,009 | | | 541 | | | 387 | | | 251 | | | 423 | | | 0 | | 0 | | | 4,408 | | 740-799 | 1,797 | | | 1,009 | | | 541 | | | 387 | | | 251 | | | 423 | | | — | | — | | | 4,408 | |
| 680-739 | 680-739 | 450 | | | 294 | | | 173 | | | 127 | | | 90 | | | 221 | | | 0 | | 0 | | | 1,355 | | 680-739 | 450 | | | 294 | | | 173 | | | 127 | | | 90 | | | 221 | | | — | | — | | | 1,355 | |
| 620-679 | 620-679 | 26 | | | 35 | | | 33 | | | 28 | | | 25 | | | 95 | | | 0 | | 0 | | | 242 | | 620-679 | 26 | | | 35 | | | 33 | | | 28 | | | 25 | | | 95 | | | — | | — | | | 242 | |
| <620 | <620 | 2 | | | 5 | | | 10 | | | 10 | | | 8 | | | 41 | | | 0 | | 0 | | | 76 | | <620 | 2 | | | 5 | | | 10 | | | 10 | | | 8 | | | 41 | | | — | | — | | | 76 | |
No FICO available(1) | No FICO available(1) | 2 | | | 0 | | | 0 | | | 0 | | | 0 | | | 60 | | | 0 | | 0 | | | 62 | | No FICO available(1) | 2 | | | — | | | — | | | — | | | — | | | 60 | | | — | | — | | | 62 | |
| Total education | Total education | 4,094 | | | 2,706 | | | 1,606 | | | 1,333 | | | 952 | | | 1,617 | | | 0 | | 0 | | | 12,308 | | Total education | 4,094 | | | 2,706 | | | 1,606 | | | 1,333 | | | 952 | | | 1,617 | | | — | | — | | | 12,308 | |
| Other retail | Other retail | | | | | | | | | | | | | | | | Other retail | | | | | | | | | | | | | | | |
| 800+ | 800+ | 461 | | | 380 | | | 163 | | | 77 | | | 15 | | | 44 | | | 341 | | 0 | | | 1,481 | | 800+ | 461 | | | 380 | | | 163 | | | 77 | | | 15 | | | 44 | | | 341 | | — | | | 1,481 | |
| 740-799 | 740-799 | 620 | | | 460 | | | 184 | | | 81 | | | 19 | | | 31 | | | 638 | | 2 | | | 2,035 | | 740-799 | 620 | | | 460 | | | 184 | | | 81 | | | 19 | | | 31 | | | 638 | | 2 | | | 2,035 | |
| 680-739 | 680-739 | 495 | | | 302 | | | 111 | | | 48 | | | 10 | | | 13 | | | 561 | | 5 | | | 1,545 | | 680-739 | 495 | | | 302 | | | 111 | | | 48 | | | 10 | | | 13 | | | 561 | | 5 | | | 1,545 | |
| 620-679 | 620-679 | 248 | | | 104 | | | 37 | | | 14 | | | 3 | | | 5 | | | 174 | | 7 | | | 592 | | 620-679 | 248 | | | 104 | | | 37 | | | 14 | | | 3 | | | 5 | | | 174 | | 7 | | | 592 | |
| <620 | <620 | 24 | | | 30 | | | 17 | | | 6 | | | 1 | | | 3 | | | 77 | | 8 | | | 166 | | <620 | 24 | | | 30 | | | 17 | | | 6 | | | 1 | | | 3 | | | 77 | | 8 | | | 166 | |
No FICO available(1) | No FICO available(1) | 54 | | | 1 | | | 0 | | | 0 | | | 0 | | | 0 | | | 272 | | 2 | | | 329 | | No FICO available(1) | 54 | | | 1 | | | — | | | — | | | — | | | — | | | 272 | | 2 | | | 329 | |
| Total other retail | Total other retail | 1,902 | | | 1,277 | | | 512 | | | 226 | | | 48 | | | 96 | | | 2,063 | | 24 | | | 6,148 | | Total other retail | 1,902 | | | 1,277 | | | 512 | | | 226 | | | 48 | | | 96 | | | 2,063 | | 24 | | | 6,148 | |
| Retail | | | | | | | | | | | | | | | | |
| Total retail | | Total retail | | | | | | | | | | | | | | | |
| 800+ | 800+ | 6,023 | | | 4,448 | | | 2,084 | | | 2,306 | | | 2,382 | | | 2,854 | | | 4,660 | | 344 | | | 25,101 | | 800+ | 6,023 | | | 4,448 | | | 2,084 | | | 2,306 | | | 2,382 | | | 2,854 | | | 4,660 | | 344 | | | 25,101 | |
| 740-799 | 740-799 | 6,864 | | | 3,630 | | | 1,661 | | | 1,345 | | | 1,190 | | | 1,597 | | | 3,872 | | 333 | | | 20,492 | | 740-799 | 6,864 | | | 3,630 | | | 1,661 | | | 1,345 | | | 1,190 | | | 1,597 | | | 3,872 | | 333 | | | 20,492 | |
| 680-739 | 680-739 | 3,077 | | | 1,842 | | | 917 | | | 644 | | | 541 | | | 918 | | | 2,193 | | 289 | | | 10,421 | | 680-739 | 3,077 | | | 1,842 | | | 917 | | | 644 | | | 541 | | | 918 | | | 2,193 | | 289 | | | 10,421 | |
| 620-679 | 620-679 | 1,040 | | | 727 | | | 391 | | | 276 | | | 192 | | | 491 | | | 576 | | 202 | | | 3,895 | | 620-679 | 1,040 | | | 727 | | | 391 | | | 276 | | | 192 | | | 491 | | | 576 | | 202 | | | 3,895 | |
| <620 | <620 | 179 | | | 322 | | | 281 | | | 240 | | | 156 | | | 385 | | | 182 | | 222 | | | 1,967 | | <620 | 179 | | | 322 | | | 281 | | | 240 | | | 156 | | | 385 | | | 182 | | 222 | | | 1,967 | |
No FICO available(1) | No FICO available(1) | 59 | | | 3 | | | 1 | | | 5 | | | 1 | | | 78 | | | 272 | | 2 | | | 421 | | No FICO available(1) | 59 | | | 3 | | | 1 | | | 5 | | | 1 | | | 78 | | | 272 | | 2 | | | 421 | |
| Total retail | Total retail | $17,242 | | | $10,972 | | | $5,335 | | | $4,816 | | | $4,462 | | | $6,323 | | | $11,755 | | $1,392 | | | $62,297 | | Total retail | $17,242 | | | $10,972 | | | $5,335 | | | $4,816 | | | $4,462 | | | $6,323 | | | $11,755 | | $1,392 | | | $62,297 | |
(1) Represents loans for which an updated FICO score was unavailable (e.g., due to recent profile changes).
Citizens Financial Group, Inc. | 5967
Nonaccrual and Past Due Assets
The following table presents nonaccrual loans and leases and loans accruing and 90 days or more past due:
| | | As of March 31, 2021 | | As of December 31, 2020 | | As of September 30, 2021 | | As of December 31, 2020 |
| (in millions) | (in millions) | Nonaccrual loans and leases | 90+ days past due and accruing | Nonaccrual with no related ACL | | Nonaccrual loans and leases | 90+ days past due and accruing | Nonaccrual with no related ACL | (in millions) | Nonaccrual loans and leases | 90+ days past due and accruing | Nonaccrual with no related ACL | | Nonaccrual loans and leases | 90+ days past due and accruing | Nonaccrual with no related ACL |
| Commercial and industrial | Commercial and industrial | $281 | | $3 | | $56 | | | $280 | | $20 | | $56 | | Commercial and industrial | $170 | | $4 | | $61 | | | $280 | | $20 | | $56 | |
| Commercial real estate | Commercial real estate | 100 | | 9 | | 37 | | | 176 | | 0 | | 2 | | Commercial real estate | 98 | | — | | 1 | | | 176 | | — | | 2 | |
| Leases | Leases | 1 | | 0 | | 0 | | | 2 | | 1 | | 0 | | Leases | 1 | | — | | — | | | 2 | | 1 | | — | |
| Total commercial | Total commercial | 382 | | 12 | | 93 | | | 458 | | 21 | | 58 | | Total commercial | 269 | | 4 | | 62 | | | 458 | | 21 | | 58 | |
Residential mortgages | Residential mortgages | 237 | | 23 | | 178 | | | 167 | | 30 | | 96 | | Residential mortgages | 164 | | 293 | | 142 | | | 167 | | 30 | | 96 | |
| Home equity | Home equity | 269 | | 0 | | 202 | | | 276 | | 0 | | 207 | | Home equity | 216 | | — | | 188 | | | 276 | | — | | 207 | |
| Automobile | Automobile | 70 | | 0 | | 33 | | | 72 | | 0 | | 17 | | Automobile | 55 | | — | | 29 | | | 72 | | — | | 17 | |
| Education | Education | 22 | | 2 | | 2 | | | 18 | | 2 | | 2 | | Education | 23 | | 1 | | 2 | | | 18 | | 2 | | 2 | |
| Other retail | Other retail | 28 | | 9 | | 2 | | | 28 | | 9 | | 0 | | Other retail | 20 | | 14 | | 2 | | | 28 | | 9 | | — | |
| Total retail | Total retail | 626 | | 34 | | 417 | | | 561 | | 41 | | 322 | | Total retail | 478 | | 308 | | 363 | | | 561 | | 41 | | 322 | |
| Total loans and leases | Total loans and leases | $1,008 | | $46 | | $510 | | | $1,019 | | $62 | | $380 | | Total loans and leases | $747 | | $312 | | $425 | | | $1,019 | | $62 | | $380 | |
(1) 90+ days past due and accruing includes $289 million and $21 million of loans fully or partially guaranteed by the FHA, VA, and USDA for September 30, 2021 and December 31, 2020, respectively.
Interest income is generally not recognized for loans and leases that are on nonaccrual status. The Company reverses accrued interest receivable with a charge to interest income upon classifying the loan or lease as nonaccrual.
The following table presents an analysis of the age of both accruing and nonaccruingnonaccrual loan and lease past due amounts:
| | | March 31, 2021 | | December 31, 2020 | | September 30, 2021 | | December 31, 2020 |
| | Days Past Due | | Days Past Due | | Days Past Due | | Days Past Due |
| (in millions) | (in millions) | Current-29 | 30-59 | 60-89 | 90 or More | Total | | Current-29 | 30-59 | 60-89 | 90 or More | Total | (in millions) | Current-29 | 30-59 | 60-89 | 90+ | Total | | Current-29 | 30-59 | 60-89 | 90+ | Total |
| Commercial and industrial | Commercial and industrial | $43,768 | | $178 | | $20 | | $92 | | $44,058 | | | $43,817 | | $223 | | $16 | | $117 | | $44,173 | | Commercial and industrial | $41,783 | | $25 | | $3 | | $43 | | $41,854 | | | $43,817 | | $223 | | $16 | | $117 | | $44,173 | |
| Commercial real estate | Commercial real estate | 14,440 | | 60 | | 36 | | 17 | | 14,553 | | | 14,531 | | 1 | | 85 | | 35 | | 14,652 | | Commercial real estate | 14,402 | | 3 | | 5 | | 98 | | 14,508 | | | 14,531 | | 1 | | 85 | | 35 | | 14,652 | |
| Leases | Leases | 1,798 | | 2 | | 0 | | 2 | | 1,802 | | | 1,956 | | 9 | | 0 | | 3 | | 1,968 | | Leases | 1,591 | | — | | 1 | | 1 | | 1,593 | | | 1,956 | | 9 | | — | | 3 | | 1,968 | |
| Total commercial | Total commercial | 60,006 | | 240 | | 56 | | 111 | | 60,413 | | | 60,304 | | 233 | | 101 | | 155 | | 60,793 | | Total commercial | 57,776 | | 28 | | 9 | | 142 | | 57,955 | | | 60,304 | | 233 | | 101 | | 155 | | 60,793 | |
Residential mortgages | Residential mortgages | 18,951 | | 55 | | 11 | | 185 | | 19,202 | | | 19,291 | | 59 | | 21 | | 168 | | 19,539 | | Residential mortgages | 20,861 | | 155 | | 57 | | 440 | | 21,513 | | | 19,291 | | 59 | | 21 | | 168 | | 19,539 | |
| Home equity | Home equity | 11,599 | | 46 | | 19 | | 190 | | 11,854 | | | 11,848 | | 61 | | 28 | | 212 | | 12,149 | | Home equity | 11,654 | | 35 | | 16 | | 184 | | 11,889 | | | 11,848 | | 61 | | 28 | | 212 | | 12,149 | |
| Automobile | Automobile | 12,176 | | 117 | | 41 | | 10 | | 12,344 | | | 11,901 | | 170 | | 65 | | 17 | | 12,153 | | Automobile | 13,318 | | 117 | | 42 | | 15 | | 13,492 | | | 11,901 | | 170 | | 65 | | 17 | | 12,153 | |
| Education | Education | 12,638 | | 29 | | 13 | | 11 | | 12,691 | | | 12,255 | | 33 | | 13 | | 7 | | 12,308 | | Education | 12,941 | | 33 | | 14 | | 12 | | 13,000 | | | 12,255 | | 33 | | 13 | | 7 | | 12,308 | |
| Other retail | Other retail | 5,602 | | 31 | | 24 | | 34 | | 5,691 | | | 6,047 | | 38 | | 29 | | 34 | | 6,148 | | Other retail | 5,371 | | 39 | | 28 | | 31 | | 5,469 | | | 6,047 | | 38 | | 29 | | 34 | | 6,148 | |
| Total retail loans | 60,966 | | 278 | | 108 | | 430 | | 61,782 | | | 61,342 | | 361 | | 156 | | 438 | | 62,297 | | |
| Total retail | | Total retail | 64,145 | | 379 | | 157 | | 682 | | 65,363 | | | 61,342 | | 361 | | 156 | | 438 | | 62,297 | |
| Total | Total | $120,972 | | $518 | | $164 | | $541 | | $122,195 | | | $121,646 | | $594 | | $257 | | $593 | | $123,090 | | Total | $121,921 | | $407 | | $166 | | $824 | | $123,318 | | | $121,646 | | $594 | | $257 | | $593 | | $123,090 | |
(1) 90+ days past due includes $289 million and $44 million of loans fully or partially guaranteed by the FHA, VA, and USDA at September 30, 2021 and December 31, 2020, respectively.
At March 31,September 30, 2021 and December 31, 2020, the Company had collateral-dependent residential mortgage and home equity loans totaling $613$543 million and $552 million, respectively. At March 31,September 30, 2021 and December 31, 2020, the Company had collateral-dependent commercial loans totaling $110$42 million and $206 million, respectively.
The amortized cost basis of mortgage loans collateralized by residential real estate property for which formal foreclosure proceedings were in process was $112$150 million and $119 million as of March 31,September 30, 2021 and December 31, 2020, respectively.
Citizens Financial Group, Inc. | 6068
Troubled Debt Restructurings
The following table summarizes TDRs by portfolio segment and total unfunded commitments:
| | | | | | | | | | | |
| (in millions) | March 31, 2021 | | December 31, 2020 |
| Commercial | $367 | | | $257 | |
| Retail | 714 | | | 718 | |
| Unfunded commitments related to TDRs | 167 | | | 49 | |
The following tables below summarize how loans were modified during the three and nine months ended March 31,September 30, 2021 and March 31, 2020. The reported balances represent the post-modification outstanding amortized cost basis and canmay include loans that became TDRs during the period and were subsequently paid off in full, charged off, or sold prior to period end. Pre-modification balances for modified loans approximate the post-modification balances shown.
| | | Three Months Ended March 31, 2021 | | | | | | | | | | | | | | | | | | | | | | | | | | | | | |
| | Primary Modification Types | | | Three Months Ended September 30, 2021 |
| | Interest Rate Reduction(1) | | Maturity Extension(2) | | Other(3) | | | Amortized Cost Basis |
| (dollars in millions) | (dollars in millions) | Number of Contracts | Amortized Cost | | Number of Contracts | Amortized Cost | | Number of Contracts | Amortized Cost | (dollars in millions) | Number of Contracts | | | Interest Rate Reduction(1) | Maturity Extension(2) | | Other(3) | Total |
| Commercial and industrial | Commercial and industrial | 0 | | $0 | | | 3 | | $3 | | | 4 | | $0 | | Commercial and industrial | 7 | | | | $— | | | | $38 | | | | $10 | | | $48 | |
| Commercial real estate | 0 | | 0 | | | 0 | | 0 | | | 0 | | 0 | | |
| Total commercial loans | 0 | | 0 | | | 3 | | 3 | | | 4 | | 0 | | |
| | Total commercial | | Total commercial | 7 | | | | — | | | | 38 | | | | 10 | | | 48 | |
| Residential mortgages | Residential mortgages | 20 | | 4 | | | 9 | | 6 | | | 13 | | 3 | | Residential mortgages | 101 | | | | 2 | | | | 7 | | | | 7 | | | 16 | |
| Home equity | Home equity | 34 | | 2 | | | 41 | | 5 | | | 72 | | 4 | | Home equity | 69 | | | | — | | | | 1 | | | | 3 | | | 4 | |
| Automobile | Automobile | 21 | | 0 | | | 52 | | 0 | | | 596 | | 8 | | Automobile | 224 | | | | — | | | | — | | | | 1 | | | 1 | |
| Education | Education | 0 | | 0 | | | 0 | | 0 | | | 147 | | 4 | | Education | 226 | | | | — | | | | — | | | | 8 | | | 8 | |
| Other retail | Other retail | 556 | | 3 | | | 0 | | 0 | | | 74 | | 1 | | Other retail | 549 | | | | 3 | | | | — | | | | 1 | | | 4 | |
| Total retail loans | 631 | | 9 | | | 102 | | 11 | | | 902 | | 20 | | |
| Total retail | | Total retail | 1,169 | | | | 5 | | | | 8 | | | | 20 | | | 33 | |
| Total | Total | 631 | | $9 | | | 105 | | $14 | | | 906 | | $20 | | Total | 1,176 | | | | $5 | | | | $46 | | | | $30 | | | $81 | |
| | | | | | | | | | | | | | | | | | | | | | | | | | |
| Three Months Ended March 31, 2020 |
| Primary Modification Types |
| Interest Rate Reduction(1) | | Maturity Extension(2) | | Other(3) |
| (dollars in millions) | Number of Contracts | Amortized Cost | | Number of Contracts | Amortized Cost | | Number of Contracts | Amortized Cost |
| Commercial and industrial | 0 | | $0 | | | 2 | | $0 | | | 17 | | $41 | |
| Commercial real estate | 0 | | 0 | | | 0 | | 0 | | | 0 | | 0 | |
| Total commercial loans | 0 | | 0 | | | 2 | | 0 | | | 17 | | 41 | |
| Residential mortgages | 38 | | 6 | | | 37 | | 7 | | | 21 | | 4 | |
| Home equity | 46 | | 4 | | | 6 | | 0 | | | 71 | | 4 | |
| Automobile | 47 | | 1 | | | 0 | | 0 | | | 183 | | 2 | |
| Education | 0 | | 0 | | | 0 | | 0 | | | 91 | | 2 | |
| Other retail | 861 | | 4 | | | 0 | | 0 | | | 112 | | 1 | |
| Total retail loans | 992 | | 15 | | | 43 | | 7 | | | 478 | | 13 | |
| Total | 992 | | $15 | | | 45 | | $7 | | | 495 | | $54 | |
| | | | | | | | | | | | | | | | | | | | | | | | | | | | | | | | |
| | | | Three Months Ended September 30, 2020 |
| | | | Amortized Cost Basis |
| (dollars in millions) | Number of Contracts | | | Interest Rate Reduction(1) | | Maturity Extension(2) | | Other(3) | Total |
| Commercial and industrial | 14 | | | | $— | | | | $103 | | | | $1 | | | $104 | |
| | | | | | | | | | | | |
| Total commercial | 14 | | | | — | | | | 103 | | | | 1 | | | 104 | |
| Residential mortgages | 107 | | | | 9 | | | | 6 | | | | 4 | | | 19 | |
| Home equity | 179 | | | | 2 | | | | 4 | | | | 6 | | | 12 | |
| Automobile | 1,191 | | | | 1 | | | | — | | | | 18 | | | 19 | |
| Education | 140 | | | | — | | | | — | | | | 3 | | | 3 | |
| Other retail | 484 | | | | 1 | | | | — | | | | — | | | 1 | |
| Total retail | 2,101 | | | | 13 | | | | 10 | | | | 31 | | | 54 | |
| Total | 2,115 | | | | $13 | | | | $113 | | | | $32 | | | $158 | |
| | | | | | | | | | | | | | | | | | | | | | | | | | | | | | | | |
| | | | Nine Months Ended September 30, 2021 |
| | | | Amortized Cost Basis |
| (dollars in millions) | Number of Contracts | | | Interest Rate Reduction(1) | | Maturity Extension(2) | | Other(3) | Total |
| Commercial and industrial | 29 | | | | $— | | | | $44 | | | | $64 | | | $108 | |
| | | | | | | | | | | | |
| Total commercial | 29 | | | | — | | | | 44 | | | | 64 | | | 108 | |
| Residential mortgages | 814 | | | | 14 | | | | 133 | | | | 54 | | | 201 | |
| Home equity | 318 | | | | 3 | | | | 9 | | | | 10 | | | 22 | |
| Automobile | 1,272 | | | | 1 | | | | — | | | | 14 | | | 15 | |
| Education | 638 | | | | — | | | | — | | | | 21 | | | 21 | |
| Other retail | 1,764 | | | | 7 | | | | — | | | | 2 | | | 9 | |
| Total retail | 4,806 | | | | 25 | | | | 142 | | | | 101 | | | 268 | |
| Total | 4,835 | | | | $25 | | | | $186 | | | | $165 | | | $376 | |
Citizens Financial Group, Inc. | 69
| | | | | | | | | | | | | | | | | | | | | | | | | | | | | | | | |
| | | | Nine Months Ended September 30, 2020 |
| | | | Amortized Cost Basis |
| (dollars in millions) | Number of Contracts | | | Interest Rate Reduction(1) | | Maturity Extension(2) | | Other(3) | Total |
| Commercial and industrial | 52 | | | | $— | | | | $106 | | | | $95 | | | $201 | |
| | | | | | | | | | | | |
| Total commercial | 52 | | | | — | | | | 106 | | | | 95 | | | 201 | |
| Residential mortgages | 348 | | | | 26 | | | | 27 | | | | 11 | | | 64 | |
| Home equity | 568 | | | | 8 | | | | 8 | | | | 21 | | | 37 | |
| Automobile | 2,368 | | | | 2 | | | | — | | | | 35 | | | 37 | |
| Education | 373 | | | | — | | | | — | | | | 9 | | | 9 | |
| Other retail | 2,167 | | | | 8 | | | | — | | | | 2 | | | 10 | |
| Total retail | 5,824 | | | | 44 | | | | 35 | | | | 78 | | | 157 | |
| Total | 5,876 | | | | $44 | | | | $141 | | | | $173 | | | $358 | |
(1) Includes modifications that consist of multiple concessions, one of which is an interest rate reduction.
(2) Includes modifications that consist of multiple concessions, one of which is a maturity extension (unless one of the other concessions was an interest rate reduction).
(3) Includes modifications other than interest rate reductions or maturity extensions, such as lowering scheduled payments for a specified period of time, principal forgiveness, and capitalizing arrearages. Also included are the following: deferrals, trial modifications, certain bankruptcies, loans in forbearance and prepayment plans. Modifications can include the deferral of accrued interest resulting in post modificationpost-modification balances being higher than pre-modification.
The net change to ALLL resulting from modificationsModified TDRs resulted in charge-offs of loans$1 million and $43 million for the three months ended March 31,September 30, 2021 and 2020, was $0respectively. Citizens recorded $5 million and $4 million, respectively. Charge-offs may also be recorded on TDRs. Citizens recorded $2$49 million of charge-offs related to TDRs for each of the threenine months ended March 31,September 30, 2021 and 2020.2020, respectively.
A payment default refersUnfunded commitments related to TDRs were $51 million and $49 million at September 30, 2021 and December 31, 2020, respectively.
The following table provides a loansummary of TDRs that becomesdefaulted (became 90 days or more past due under the modified terms. Loan data includes loans meeting the criteria that were paid off in full, charged off, or sold prior to March 31, 2021 and 2020. For commercial loans, the amortized cost basis of TDRs that defaulteddue) within 12 months of their modification date was $22 milliondate:
| | | | | | | | | | | | | | | | | | | | | | | | | | | | | | | | | | | |
| | Three Months Ended September 30, | | | | | | Nine Months Ended September 30, | | | | |
| (dollars in millions) | 2021 | | 2020 | | | | | | 2021 | | 2020 | | | | |
| Commercial TDRs | $— | | | $14 | | | | | | | $23 | | | $53 | | | | | |
Retail TDRs(1) | 37 | | | 22 | | | | | | | 66 | | | 47 | | | | | |
| Total | $37 | | | $36 | | | | | | | $89 | | | $100 | | | | | |
(1) and $13 million in the three months ended March 31, 2021 and 2020,
Citizens Financial Group, Inc. | 61
respectively. For retail loans, there were $15Includes $34 million and $11$6 million of loans which defaulted within 12 months of their restructuring datefully or partially government guaranteed by the FHA, VA, and USDA for the three months ended March 31,September 30, 2021 and 2020, respectively and $37 million and $14 million of loans fully or partially government guaranteed by the FHA, VA, and USDA for the nine months ended September 30, 2021 and 2020, respectively.
Concentrations of Credit Risk
Most of the Company’s lending activity is with customers located in the New England, Mid-Atlantic, and Midwest regions. Generally, loans are collateralized by assets including real estate, inventory, accounts receivable, other personal property, and investment securities. As of March 31,September 30, 2021 and December 31, 2020, Citizens had a significant amount of loans collateralized by residential and commercial real estate. There were no significant concentration risks within the commercial loan or retail loan portfolios. Exposure to credit losses arising from lending transactions may fluctuate with fair values of collateral supporting loans, which may not perform according to contractual agreements. The Company’s policy is to collateralize loans to the extent necessary; however, unsecured loans are also grantednecessary. However, based on the basis of the financial strength of the applicant and the facts surrounding the transaction.Citizens will grant unsecured loans.
Citizens Financial Group, Inc. | 70
Certain loan products, including residential mortgages, home equity loans and lines of credit, and credit cards, have contractual features that may increase credit exposure to the Company in the event of an increase in interest rates or a decline in housing values. These products include loans that exceed 90% of the value of the underlying collateral (high LTV loans), interest-only residential mortgages, and loans with low introductory rates. The following tables present balances of loans with these characteristics:
| | | March 31, 2021 | | September 30, 2021 |
| (in millions) | (in millions) | Residential Mortgages | | Home Equity | Other Retail | | Total | (in millions) | Residential Mortgages | | Home Equity | Other Retail | Education | Total |
| High loan-to-value | High loan-to-value | $224 | | | $41 | | $0 | | | $265 | | High loan-to-value | $179 | | | $18 | | $— | | $— | | $197 | |
| Interest-only | Interest-only | 2,936 | | | 0 | | 0 | | | 2,936 | | Interest-only | 3,317 | | | — | | — | | 1 | | 3,318 | |
| Low introductory rate | Low introductory rate | 0 | | | 0 | | 145 | | | 145 | | Low introductory rate | — | | | — | | 156 | | — | | 156 | |
| Multiple characteristics and other | Multiple characteristics and other | 2 | | | 0 | | 0 | | | 2 | | Multiple characteristics and other | 2 | | | — | | — | | — | | 2 | |
| Total | Total | $3,162 | | | $41 | | $145 | | | $3,348 | | Total | $3,498 | | | $18 | | $156 | | $1 | | $3,673 | |
| | | December 31, 2020 | | December 31, 2020 |
| (in millions) | (in millions) | Residential Mortgages | | Home Equity | Other Retail | | Total | (in millions) | Residential Mortgages | | Home Equity | Other Retail | | Total |
| High loan-to-value | High loan-to-value | $289 | | | $64 | | $0 | | | $353 | | High loan-to-value | $289 | | | $64 | | $— | | | $353 | |
| Interest-only | Interest-only | 2,801 | | | 0 | | 0 | | | 2,801 | | Interest-only | 2,801 | | | — | | — | | | 2,801 | |
| Low introductory rate | Low introductory rate | 0 | | | 0 | | 170 | | | 170 | | Low introductory rate | — | | | — | | 170 | | | 170 | |
| | Total | Total | $3,090 | | | $64 | | $170 | | | $3,324 | | Total | $3,090 | | | $64 | | $170 | | | $3,324 | |
NOTE 5 - MORTGAGE BANKING AND OTHER
The Company sells residential mortgages to GSEs and other parties, who may issue securities backed by pools of such loans. The Company retains no beneficial interests in these sales, but may retain the servicing rights for the loans sold. The Company ismay exercise its option to repurchase eligible government guaranteed residential mortgages or may be obligated to subsequently repurchase a loan if the purchaser discovers a representation or warranty violation such as noncompliance with eligibility or servicing requirements, or customer fraud that should have been identified in a loan file review.
The Company recognizes the right to service residential mortgage loans for others, or MSRs, as separate assets, which are presented in other assets on the Consolidated Balance Sheets, when purchased or when servicing is contractually separated from the underlying mortgage loans by sale with servicing rights retained. The following table summarizes activity related to residential mortgage loans sold with servicing rights retained:
| | | | Three Months Ended March 31, | | Three Months Ended September 30, | | Nine Months Ended September 30, |
| (in millions) | (in millions) | | 2021 | | 2020 | (in millions) | 2021 | | 2020 | | 2021 | | 2020 |
| Cash proceeds from residential mortgage loans sold with servicing retained | Cash proceeds from residential mortgage loans sold with servicing retained | | $9,038 | | | $5,272 | | Cash proceeds from residential mortgage loans sold with servicing retained | $9,024 | | | $9,504 | | | $28,601 | | | $23,668 | |
| Repurchased residential mortgages | | Repurchased residential mortgages | 114 | | | — | | | 1,283 | | | — | |
Gain on sales (1) | Gain on sales (1) | | 140 | | | 143 | | Gain on sales(1) | 96 | | | 273 | | | 321 | | | 699 | |
Contractually specified servicing, late and other ancillary fees (1) | Contractually specified servicing, late and other ancillary fees (1) | | 58 | | | 58 | | Contractually specified servicing, late and other ancillary fees(1) | 63 | | | 56 | | | 181 | | | 169 | |
(1) Reported in mortgage banking fees on the Consolidated Statements of Operations.
The Company records MSRs at fair value method each reporting date with any changes in fair value during the period recorded in mortgage banking fees in the Consolidated Statements of Operations.
The unpaid principal balance of the related residential mortgage loans related to our MSR was $81.8$87.4 billion and $81.2 billion as of March 31,at September 30, 2021 and
Citizens Financial Group, Inc. | 62
December 31, 2020, respectively. The Company manages an active hedging strategy to manage the risk associated with changes in the value of the MSR portfolio, which includes the purchase of freestanding derivatives.
Citizens Financial Group, Inc. | 71
The following table summarizes changes in MSRs recorded using the fair value method:
| | | | As of and for the Three Months Ended March 31, | | As of and for the Three Months Ended September 30, | | As of and for the Nine Months Ended September 30, |
| (in millions) | (in millions) | | 2021 | | 2020 | (in millions) | 2021 | | 2020 | | 2021 | | 2020 |
| Fair value as of beginning of the period | Fair value as of beginning of the period | | $658 | | | $642 | | Fair value as of beginning of the period | $902 | | | $568 | | | $658 | | | $642 | |
Transfers upon election of fair value method(1) | Transfers upon election of fair value method(1) | | 0 | | | 190 | | Transfers upon election of fair value method(1) | — | | | — | | | — | | | 190 | |
| Fair value as of beginning of the period, adjusted | Fair value as of beginning of the period, adjusted | | 658 | | | 832 | | Fair value as of beginning of the period, adjusted | 902 | | | 568 | | | 658 | | | 832 | |
| Amounts capitalized | Amounts capitalized | | 87 | | | 67 | | Amounts capitalized | 109 | | | 85 | | | 318 | | | 238 | |
Changes in unpaid principal balance during the period (2) | Changes in unpaid principal balance during the period (2) | | (58) | | | (40) | | Changes in unpaid principal balance during the period(2) | (54) | | | (55) | | | (159) | | | (141) | |
Changes in fair value during the period (3) | Changes in fair value during the period (3) | | 206 | | | (282) | | Changes in fair value during the period(3) | 21 | | | 8 | | | 161 | | | (323) | |
| Fair value at end of the period | Fair value at end of the period | | $893 | | | $577 | | Fair value at end of the period | $978 | | | $606 | | | $978 | | | $606 | |
(1) Effective January 1, 2020, the Company elected to account for all MSRs previously accounted for under the amortization method under the fair value method.
(2) Represents changes in value of the MSRs due to i) passage of time including the impact from both regularly scheduled loan principal payments and partial
paydowns, and ii) loans that paid off during the period.
(3) Represents changes in value primarily driven by market conditions. These changes are recorded in mortgage banking fees in the Consolidated Statements of Operations.
The fair value of MSRs is estimated by using the present value of estimated future net servicing cash flows, taking into consideration actual and expected mortgage loan prepayment rates, discount rates, contractual servicing fee income, servicing costs, default rates, ancillary income, and other economic factors, which are determined based on current market interest rates. The valuation does not attempt to forecast or predict the future direction of interest rates.
The sensitivity analysis below presents the impact to current fair value of an immediate 50 basis point and 100 basis point adverse change in key economic assumptions and the decline in fair value if the respective adverse change was realized. These sensitivities are hypothetical, with the effect of a variation in a particular assumption on the fair value of the MSRs calculated independently without changing any other assumption. In reality, changes in one factor may result in changes in another (e.g., changes in interest rates, which drive changes in prepayment rates, could result in changes in the discount rates), which may amplify or counteract the sensitivities. The primary risk inherent in the Company’s MSRs is an increase in prepayments of the underlying mortgage loans serviced, which is largely dependent upon movements in market interest rates.
| | | March 31, 2021 | | December 31, 2020 | | September 30, 2021 | | December 31, 2020 |
| | Actual | Decline in fair value due to | | Actual | Decline in fair value due to | | Actual | Decline in fair value due to | | Actual | Decline in fair value due to |
| (dollars in millions) | (dollars in millions) | | (dollars in millions) | |
| Fair value | Fair value | $893 | 50 bps adverse change | 100 bps adverse change | | $658 | 50 bps adverse change | 100 bps adverse change | Fair value | $978 | 50 bps adverse change | 100 bps adverse change | | $658 | 50 bps adverse change | 100 bps adverse change |
| Weighted average life (in years) | Weighted average life (in years) | 5.9 | | 4.2 | Weighted average life (in years) | 6.0 | | 4.2 |
Weighted average constant prepayment rate | Weighted average constant prepayment rate | 11.3% | $103 | $228 | | 17.3% | $122 | $202 | Weighted average constant prepayment rate | 11.3% | $125 | $275 | | 17.3% | $122 | $202 |
| Weighted average option adjusted spread | Weighted average option adjusted spread | 582 bps | 18 | 37 | | 595 bps | 12 | 24 | Weighted average option adjusted spread | 582 bps | 20 | 39 | | 595 bps | 12 | 24 |
Citizens accounts(1) Estimated adverse change for derivativesthe weighted average constant prepayment rate based on an adverse change in its mortgage banking operations at fair value on the Consolidated Balance Sheets as derivative assets or derivative liabilities, depending on whether the derivative had a positive (asset) or negative (liability) fair value as of the balance sheet date. The Company’s mortgage banking derivatives include commitments to originate mortgages held for sale, certain loan sale agreements, and other financial instruments that meet the definition of a derivative. Refer to Note 8 for additional information.market interest rates.
Other Serviced Loans
From time to time, Citizens engages in other servicing relationships. The following table presents the unpaid principal balance of other serviced loans:
| | (in millions) | (in millions) | March 31, 2021 | | December 31, 2020 | (in millions) | September 30, 2021 | | December 31, 2020 |
Education(1) | Education(1) | $903 | | | $974 | | Education(1) | $809 | | | $974 | |
Commercial(2)(1) | Commercial(2)(1) | 55 | | | 51 | | Commercial(2)(1) | 67 | | | 51 | |
|
(1)Represents the servicing associated with education loans sold.
(2) Represents the government guaranteed portion of SBA loans sold to outside investors.
Citizens Financial Group, Inc. | 6372
NOTE 6 - VARIABLE INTEREST ENTITIES
Citizens is involved in various entities that are considered VIEs, including investments in limited partnerships that sponsor affordable housing projects, limited liability companies that sponsor renewable energy projects or asset-backed securities, and lending to special purpose entities. Citizens’ maximum exposure to loss as a result of its involvement with these entities is limited to the balance sheet carrying amount of its investment in equity and asset-backed securities, unfunded commitments, and outstanding principal balance of loans to special purpose entities. The Company does not consolidate any of its investments in these entities. These investments are included in other assets in the Consolidated Balance Sheets. For more details see Note 10 in the 2020 Form 10-K.
A summary of these investments is presented below:
| | (in millions) | (in millions) | March 31, 2021 | | December 31, 2020 | (in millions) | September 30, 2021 | | December 31, 2020 |
| Lending to special purpose entities included in loans and leases | Lending to special purpose entities included in loans and leases | $1,269 | | | $1,295 | | Lending to special purpose entities included in loans and leases | $1,849 | | | $1,295 | |
| LIHTC investment included in other assets | LIHTC investment included in other assets | 1,776 | | | 1,687 | | LIHTC investment included in other assets | 1,899 | | | 1,687 | |
| LIHTC unfunded commitments included in other liabilities | LIHTC unfunded commitments included in other liabilities | 874 | | | 875 | | LIHTC unfunded commitments included in other liabilities | 910 | | | 875 | |
| Investment in asset-backed securities included in HTM securities | Investment in asset-backed securities included in HTM securities | 854 | | | 893 | | Investment in asset-backed securities included in HTM securities | 789 | | | 893 | |
| Renewable energy investments included in other assets | Renewable energy investments included in other assets | 459 | | | 403 | | Renewable energy investments included in other assets | 441 | | | 403 | |
Lending to Special Purpose Entities
Citizens provides lending facilities to third-party sponsored special purpose entities. Because the sponsor for each respective entity has the power to direct how proceeds from the Company are utilized, as well as maintains responsibility for any associated servicing commitments, Citizens is not the primary beneficiary of these entities. Accordingly, Citizens does not consolidate these VIEs on the Consolidated Balance Sheets. As of March 31,September 30, 2021 and December 31, 2020, the lending facilities had aggregate unpaid principal balances of $1.8 billion and $1.3 billion, in each period,respectively, and undrawn commitments to extend credit of $1.7$2.2 billion and $1.5 billion, respectively.
Low Income Housing Tax Credit Partnerships
The purpose of the Company’s equity investments is to assist in achieving the goals of the Community Reinvestment Act and to earn an adequate return of capital. LIHTC partnerships are managed by unrelated general partners that have the power to direct the activities which most significantly affect the performance of the partnerships. Citizens is therefore not the primary beneficiary of any LIHTC partnerships. Accordingly, Citizens does not consolidate these VIEs and accounts for these investments in other assets on the Consolidated Balance Sheets.
Citizens applies the proportional amortization method to account for its LIHTC investments. Under the proportional amortization method, the Company applies a practical expedient and amortizes the initial cost of the investment in proportion to the tax credits received in the current period as compared to the total tax credits expected to be received over the life of the investment. The amortization and tax benefits are included as a component of income tax expense. The tax credits received are reported as a reduction of income tax expense (or an increase to income tax benefit) related to these transactions.
The following table presents other information related to the Company’s affordable housing tax credit investments:
| | | | Three Months Ended March 31, | | Three Months Ended September 30, | | Nine Months Ended September 30, |
| (in millions) | (in millions) | | 2021 | | 2020 | (in millions) | 2021 | | 2020 | | 2021 | | 2020 |
| Tax credits included in income tax expense | Tax credits included in income tax expense | | $51 | | | $41 | | Tax credits included in income tax expense | $48 | | | $40 | | | $150 | | | $120 | |
| Other tax benefits included in income tax expense | Other tax benefits included in income tax expense | | 12 | | | 10 | | Other tax benefits included in income tax expense | 11 | | | 10 | | | 36 | | | 30 | |
| Total tax benefit included in income tax expense | | 63 | | | 51 | | |
| Less: Amortization expense included in income tax expense | | 53 | | | 43 | | |
| Total tax benefits included in income tax expense | | Total tax benefits included in income tax expense | 59 | | | 50 | | | 186 | | | 150 | |
| Less: Amortization included in income tax expense | | Less: Amortization included in income tax expense | 50 | | | 42 | | | 156 | | | 127 | |
| Net benefit from affordable housing tax credit investments included in income tax expense | Net benefit from affordable housing tax credit investments included in income tax expense | | $10 | | | $8 | | Net benefit from affordable housing tax credit investments included in income tax expense | $9 | | | $8 | | | $30 | | | $23 | |
NaNNo LIHTC investment impairment losses were recognized in the three and nine months ended March 31,September 30, 2021 and 2020, respectively.
Asset-backed securities
Citizens invests in certain asset-backed securities that are sponsored by legal entities determined to be VIEs. Each reporting period, Citizens is required to evaluate any changes in its involvement with the VIEs that issue the asset-backed securities to determine if the Company is required to consolidate the VIE. As of March 31,
Citizens Financial Group, Inc. | 64
2021, the Company concluded, based on the fact that the activities which most significantly affect the performance of the VIE are controlled by the equity holder in the VIE, and not by Citizens; therefore, Citizens is not the primary beneficiary of the VIE and does not consolidate the VIE. The Company accounts for its investment in the debt issued by these entities as HTM asset-backed securities on the Consolidated Balance Sheets.
Renewable Energy Entities
The Company’s investments in renewable energy entities provide benefits from a return generated by government incentives plus other tax attributes that are associated with tax ownership (e.g., tax depreciation). As a tax equity investor, Citizens does not have the power to direct the activities which most significantly affect the performance of these entities and therefore is not the primary beneficiary of any renewable energy entities. Accordingly, Citizens does not consolidate these VIEs and accounts for these investments in other assets on the Consolidated Balance Sheets.
NOTE 7 - BORROWED FUNDS
Short-term borrowed funds
Short-term borrowed funds were $70$8 million and $243 million as of March 31,September 30, 2021 and December 31, 2020, respectively.
Citizens Financial Group, Inc. | 73
Long-term borrowed funds
The following table presents a summary of the Company’s long-term borrowed funds:
| | (in millions) | (in millions) | March 31, 2021 | | December 31, 2020 | (in millions) | September 30, 2021 | | December 31, 2020 |
| Parent Company: | Parent Company: | | | | Parent Company: | | | |
2.375% fixed-rate senior unsecured debt, due July 2021 | 2.375% fixed-rate senior unsecured debt, due July 2021 | $350 | | | $350 | | 2.375% fixed-rate senior unsecured debt, due July 2021 | $— | | | $350 | |
4.150% fixed-rate subordinated debt, due September 2022 (1)(2) | 4.150% fixed-rate subordinated debt, due September 2022 (1)(2) | 168 | | | 182 | | 4.150% fixed-rate subordinated debt, due September 2022 (1)(2) | 168 | | | 182 | |
3.750% fixed-rate subordinated debt, due July 2024 (1)(2) | 3.750% fixed-rate subordinated debt, due July 2024 (1)(2) | 90 | | | 159 | | 3.750% fixed-rate subordinated debt, due July 2024 (1)(2) | 90 | | | 159 | |
4.023% fixed-rate subordinated debt, due October 2024 (1)(2) | 4.023% fixed-rate subordinated debt, due October 2024 (1)(2) | 17 | | | 25 | | 4.023% fixed-rate subordinated debt, due October 2024 (1)(2) | 17 | | | 25 | |
4.350% fixed-rate subordinated debt, due August 2025 (1)(2) | 4.350% fixed-rate subordinated debt, due August 2025 (1)(2) | 133 | | | 193 | | 4.350% fixed-rate subordinated debt, due August 2025 (1)(2) | 133 | | | 193 | |
4.300% fixed-rate subordinated debt, due December 2025 (1)(2) | 4.300% fixed-rate subordinated debt, due December 2025 (1)(2) | 336 | | | 450 | | 4.300% fixed-rate subordinated debt, due December 2025 (1)(2) | 336 | | | 450 | |
| 2.850% fixed-rate senior unsecured notes, due July 2026 | 2.850% fixed-rate senior unsecured notes, due July 2026 | 497 | | | 497 | | 2.850% fixed-rate senior unsecured notes, due July 2026 | 497 | | | 497 | |
| 2.500% fixed-rate senior unsecured notes, due February 2030 | 2.500% fixed-rate senior unsecured notes, due February 2030 | 297 | | | 297 | | 2.500% fixed-rate senior unsecured notes, due February 2030 | 298 | | | 297 | |
| 3.250% fixed-rate senior unsecured notes, due April 2030 | 3.250% fixed-rate senior unsecured notes, due April 2030 | 745 | | | 745 | | 3.250% fixed-rate senior unsecured notes, due April 2030 | 745 | | | 745 | |
3.750% fixed-rate reset subordinated debt, due February 2031 (1)(2) | 3.750% fixed-rate reset subordinated debt, due February 2031 (1)(2) | 69 | | | 0 | | 3.750% fixed-rate reset subordinated debt, due February 2031 (1)(2) | 69 | | | — | |
4.300% fixed-rate reset subordinated debt, due February 2031 (1)(2) | 4.300% fixed-rate reset subordinated debt, due February 2031 (1)(2) | 135 | | | 0 | | 4.300% fixed-rate reset subordinated debt, due February 2031 (1)(2) | 135 | | | — | |
4.350% fixed-rate reset subordinated debt, due February 2031 (1)(2) | 4.350% fixed-rate reset subordinated debt, due February 2031 (1)(2) | 60 | | | 0 | | 4.350% fixed-rate reset subordinated debt, due February 2031 (1)(2) | 61 | | | — | |
| 2.638% fixed-rate subordinated debt, due September 2032 | 2.638% fixed-rate subordinated debt, due September 2032 | 545 | | | 543 | | 2.638% fixed-rate subordinated debt, due September 2032 | 548 | | | 543 | |
| CBNA’s Global Note Program: | CBNA’s Global Note Program: | | CBNA’s Global Note Program: | |
| | 2.550% senior unsecured notes, due May 2021 | 2.550% senior unsecured notes, due May 2021 | 1,000 | | | 1,003 | | 2.550% senior unsecured notes, due May 2021 | — | | | 1,003 | |
| 3.250% senior unsecured notes, due February 2022 | 3.250% senior unsecured notes, due February 2022 | 712 | | | 716 | | 3.250% senior unsecured notes, due February 2022 | 704 | | | 716 | |
0.918% floating-rate senior unsecured notes, due February 2022 (2) | 300 | | | 299 | | |
1.000% floating-rate senior unsecured notes, due May 2022 (2) | 250 | | | 250 | | |
0.845% floating-rate senior unsecured notes, due February 2022(3) | | 0.845% floating-rate senior unsecured notes, due February 2022(3) | 300 | | | 299 | |
0.932% floating-rate senior unsecured notes, due May 2022(3) | | 0.932% floating-rate senior unsecured notes, due May 2022(3) | 250 | | | 250 | |
| 2.650% senior unsecured notes, due May 2022 | 2.650% senior unsecured notes, due May 2022 | 508 | | | 510 | | 2.650% senior unsecured notes, due May 2022 | 505 | | | 510 | |
| 3.700% senior unsecured notes, due March 2023 | 3.700% senior unsecured notes, due March 2023 | 523 | | | 527 | | 3.700% senior unsecured notes, due March 2023 | 517 | | | 527 | |
1.143% floating-rate senior unsecured notes, due March 2023 (2) | 250 | | | 249 | | |
1.082% floating-rate senior unsecured notes, due March 2023(3) | | 1.082% floating-rate senior unsecured notes, due March 2023(3) | 250 | | | 249 | |
| 2.250% senior unsecured notes, due April 2025 | 2.250% senior unsecured notes, due April 2025 | 746 | | | 746 | | 2.250% senior unsecured notes, due April 2025 | 746 | | | 746 | |
| 3.750% senior unsecured notes, due February 2026 | 3.750% senior unsecured notes, due February 2026 | 536 | | | 551 | | 3.750% senior unsecured notes, due February 2026 | 533 | | | 551 | |
Additional Borrowings by CBNA and Other Subsidiaries:
| Additional Borrowings by CBNA and Other Subsidiaries:
| | Additional Borrowings by CBNA and Other Subsidiaries:
| |
| Federal Home Loan Bank advances, 0.920% weighted average rate, due through 2038 | 19 | | | 19 | | |
| Federal Home Loan Bank advances, 0.864% weighted average rate, due through 2041 | | Federal Home Loan Bank advances, 0.864% weighted average rate, due through 2041 | 19 | | | 19 | |
| Other | Other | 30 | | | 35 | | Other | 26 | | | 35 | |
| Total long-term borrowed funds | Total long-term borrowed funds | $8,316 | | | $8,346 | | Total long-term borrowed funds | $6,947 | | | $8,346 | |
(1) March 31,Notes were redeemed on June 28, 2021.
(2) September 30, 2021 balances reflect the February 2021 completion of $265 million in private exchange offers for 5 series of outstanding subordinated notes whereby participants received newly issued 3.750%, 4.300%, and 4.350% fixed-rate reset subordinated notes due 2031 which are redeemable by the Company five years prior to their maturity.
(2)(3) Rate disclosed reflects the floating rate as of March 31, 2021 or final rate, as applicable.September 30, 2021.
The Parent Company’s long-term borrowed funds as of March 31,September 30, 2021 and December 31, 2020 included
Citizens Financial Group, Inc. | 65
principal balances of $3.2 billion and $3.5 billion, respectively, and unamortized deferred issuance costs and/or discounts of $87$82 million and $90 million, respectively. CBNA and other subsidiaries’ long-term borrowed funds as of March 31,September 30, 2021 and December 31, 2020 included principal balances of $3.8 billion and $4.8 billion, respectively, with unamortized deferred issuance costs and/or discounts of $10$8 million and $11 million, respectively, and hedging basis adjustments of $85$63 million and $112 million, respectively. See Note 8 for further information about the Company’s hedging of certain long-term borrowed funds.
Advances, lines of credit, and letters of credit from the FHLB are collateralized primarily by residential mortgages and home equity products at least sufficient to satisfy the collateral maintenance level established by the FHLB. The utilized borrowing capacity for FHLB advances and letters of credit was $2.8$2.2 billion and $3.2 billion at March 31,September 30, 2021 and December 31, 2020, respectively. The Company’s available FHLB borrowing capacity was $14.1$15.1 billion and $13.9 billion at March 31,September 30, 2021 and December 31, 2020, respectively. Citizens can also borrow from the FRB discount window to meet short-term liquidity requirements. Collateral, including certain loans, is pledged to support this borrowing capacity. At March 31,September 30, 2021, the Company’s unused secured borrowing capacity was approximately $66.6$63.6 billion, which includes unencumbered securities, FHLB borrowing capacity, and FRB discount window capacity.
Citizens Financial Group, Inc. | 74
The following table presents a summary of maturities for the Company’s long-term borrowed funds at March 31,September 30, 2021:
| | (in millions) | (in millions) | Parent Company | CBNA and Other Subsidiaries | Consolidated | (in millions) | Parent Company | CBNA and Other Subsidiaries | Consolidated |
| Year | Year | | Year | |
| 2021 | 2021 | $350 | | $1,006 | | $1,356 | | 2021 | $— | | $4 | | $4 | |
| 2022 | 2022 | 168 | | 1,777 | | 1,945 | | 2022 | 168 | | 1,765 | | 1,933 | |
| 2023 | 2023 | 0 | | 774 | | 774 | | 2023 | — | | 768 | | 768 | |
| 2024 | 2024 | 107 | | 1 | | 108 | | 2024 | 107 | | — | | 107 | |
| 2025 | 2025 | 469 | | 759 | | 1,228 | | 2025 | 469 | | 760 | | 1,229 | |
| 2026 and thereafter | 2026 and thereafter | 2,348 | | 557 | | 2,905 | | 2026 and thereafter | 2,353 | | 553 | | 2,906 | |
| Total | Total | $3,442 | | $4,874 | | $8,316 | | Total | $3,097 | | $3,850 | | $6,947 | |
NOTE 8 - DERIVATIVES
In the normal course of business, Citizens enters into a variety of derivative transactions to meet the financing needs of its customers and to reduce its own exposure to fluctuations in interest rates and foreign currency exchange rates. These transactions include interest rate swap contracts, interest rate options, foreign exchange contracts, residential loan commitment rate locks, interest rate future contracts, swaptions, certain commodities, forward commitments to sell TBAs, forward sale contracts and purchase options. The Company does not use derivatives for speculative purposes.
The Company’s derivative instruments are recognized on the Consolidated Balance Sheets in derivative assets and derivative liabilities at fair value. Certain derivatives are cleared through a central clearing house. Cleared derivatives represent contracts executed bilaterally with counterparties in the OTC market that are novated to a central clearing house who then becomes our counterparty. OTC-cleared derivative instruments are typically settled in cash each day based on the prior day value. Information regarding the valuation methodology and inputs used to estimate the fair value of the Company’s derivative instruments is described in Note 19 in the Company’s 2020 Form 10-K.
Derivative assets and derivative liabilities are netted by counterparty on the Consolidated Balance Sheets if a “right of setoff” has been established in a master netting agreement between the Company and the counterparty. This netted derivative asset or liability position is also netted against the fair value of any cash collateral that has been pledged or received in accordance with a master netting agreement.
Citizens Financial Group, Inc. | 66
The following table presents derivative instruments included onin the Consolidated Balance Sheets:
| | | March 31, 2021 | | December 31, 2020 | | September 30, 2021 | | December 31, 2020 |
| (in millions) | (in millions) | Notional Amount(1) | Derivative Assets | Derivative Liabilities | | Notional Amount(1) | Derivative Assets | Derivative Liabilities | (in millions) | Notional Amount(1) | Derivative Assets | Derivative Liabilities | | Notional Amount(1) | Derivative Assets | Derivative Liabilities |
| Derivatives designated as hedging instruments: | Derivatives designated as hedging instruments: | | | | Derivatives designated as hedging instruments: | | | |
| Interest rate contracts | Interest rate contracts | $26,550 | | $3 | | $2 | | | $22,300 | | $1 | | $3 | | Interest rate contracts | $23,450 | | $18 | | $2 | | | $22,300 | | $1 | | $3 | |
| Derivatives not designated as hedging instruments: | Derivatives not designated as hedging instruments: | | Derivatives not designated as hedging instruments: | |
| Interest rate contracts | Interest rate contracts | 148,086 | | 1,122 | | 182 | | | 149,021 | | 1,565 | | 214 | | Interest rate contracts | 142,109 | | 912 | | 167 | | | 149,021 | | 1,565 | | 214 | |
| Foreign exchange contracts | Foreign exchange contracts | 18,731 | | 273 | | 213 | | | 16,789 | | 320 | | 291 | | Foreign exchange contracts | 16,342 | | 249 | | 205 | | | 16,789 | | 320 | | 291 | |
| Commodities contracts | Commodities contracts | 294 | | 135 | | 138 | | | 246 | | 62 | | 61 | | Commodities contracts | 539 | | 822 | | 822 | | | 246 | | 62 | | 61 | |
| TBA contracts | TBA contracts | 12,842 | | 156 | | 16 | | | 11,149 | | 8 | | 65 | | TBA contracts | 9,284 | | 44 | | 9 | | | 11,149 | | 8 | | 65 | |
| Other contracts | Other contracts | 7,527 | | 38 | | 0 | | | 8,051 | | 197 | | 0 | | Other contracts | 5,604 | | 53 | | — | | | 8,051 | | 197 | | — | |
| Total derivatives not designated as hedging instruments | Total derivatives not designated as hedging instruments | | 1,724 | | 549 | | | 2,152 | | 631 | | Total derivatives not designated as hedging instruments | | 2,080 | | 1,203 | | | 2,152 | | 631 | |
| Gross derivative fair values | Gross derivative fair values | | 1,727 | | 551 | | | 2,153 | | 634 | | Gross derivative fair values | | 2,098 | | 1,205 | | | 2,153 | | 634 | |
Less: Gross amounts offset in the Consolidated Balance Sheets (2) | Less: Gross amounts offset in the Consolidated Balance Sheets (2) | | (190) | | (190) | | | (182) | | (182) | | Less: Gross amounts offset in the Consolidated Balance Sheets(2) | | (233) | | (233) | | | (182) | | (182) | |
Less: Cash collateral applied (2) | Less: Cash collateral applied (2) | | (239) | | (250) | | | (56) | | (324) | | Less: Cash collateral applied(2) | | (96) | | (785) | | | (56) | | (324) | |
| Total net derivative fair values presented in the Consolidated Balance Sheets | Total net derivative fair values presented in the Consolidated Balance Sheets | | $1,298 | | $111 | | | $1,915 | | $128 | | Total net derivative fair values presented in the Consolidated Balance Sheets | | $1,769 | | $187 | | | $1,915 | | $128 | |
(1) The notional or contractual amount of interest rate derivatives and foreign exchange contracts is the amount upon which interest and other payments under the contract are based. For interest rate contracts, the notional amount is typically not exchanged. Therefore, notional amounts should not be taken as the measure of credit or market risk, as they do not measure the true economic risk of these contracts.
(2) Amounts represent the impact of enforceable master netting agreements that allow the Company to net settle positive and negative positions as well as collateral paid and received.
The Company’s derivative transactions are internally divided into three sub-groups: institutional, customer and residential loan. Certain derivative transactions within these sub-groups are designated as fair value or cash flow hedges, as described below:
Derivatives Designated As Hedging Instruments
The Company’s institutional derivatives qualify for hedge accounting treatment. The net interest accruals on interest rate swaps designated in a fair value or cash flow hedge relationship are treated as an adjustment to interest income or interest expense of the item being hedged. The Company formally documents at inception all hedging relationships, as well as risk management objectives and strategies for undertaking various accounting
Citizens Financial Group, Inc. | 75
hedges. Additionally, the Company monitors the effectiveness of its hedge relationships during the duration of the hedge period. The methods utilized to assess hedge effectiveness vary based on hedge relationship and the Company monitors each relationship to ensure that management’s initial intent continues to be satisfied. The Company discontinues hedge accounting treatment when it is determined that a derivative is not expected to be, or has ceased to be, effective as a hedge and subsequently reflects changes in the fair value of the derivative in earnings after termination of the hedge relationship.
Fair Value Hedges
In a fair value hedge, changes in the fair value of both the derivative instrument and the hedged asset or liability attributable to the risk being hedged are recognized in the same income statement line item in the Consolidated Statements of Operations when the changes in fair value occur.
Citizens has outstanding interest rate swap agreements utilized to manage the interest rate exposure on its long-term borrowings certain fixed rate residential mortgages and AFS debt securities. Certain fair value hedges have been designated as a last-of-layer hedge, which affords the Company the ability to execute a fair value hedge of the interest rate risk associated with a portfolio of similar prepayable assets whereby the last dollar amount estimated to remain in the portfolio of assets is identified as the hedged item.
Citizens Financial Group, Inc. | 67
The following table presents the change in fair value of interest rate contracts designated as fair value hedges, as well as the change in fair value of the related hedged items attributable to the risk being hedged, included in the Consolidated Statements of Operations:
| | | | Three Months Ended March 31, | | | Three Months Ended September 30, | | Nine Months Ended September 30, | |
| (in millions) | (in millions) | | 2021 | | 2020 | Affected Line Item in the Consolidated Statements of Operations | (in millions) | 2021 | | 2020 | | 2021 | | 2020 | Affected Line Item in the Consolidated Statements of Operations |
| Interest rate swaps hedging borrowed funds | Interest rate swaps hedging borrowed funds | | ($28) | | | $93 | | Interest expense - long-term borrowed funds | Interest rate swaps hedging borrowed funds | ($13) | | | ($16) | | | ($51) | | | $82 | | Interest expense - long-term borrowed funds |
| Hedged long-term debt attributable to the risk being hedged | Hedged long-term debt attributable to the risk being hedged | | 28 | | | (92) | | Interest expense - long-term borrowed funds | Hedged long-term debt attributable to the risk being hedged | 13 | | | 17 | | | 50 | | | (78) | | Interest expense - long-term borrowed funds |
| Interest rate swaps hedging fixed rate loans | Interest rate swaps hedging fixed rate loans | | 0 | | | 17 | | Interest and fees on loans and leases | Interest rate swaps hedging fixed rate loans | — | | | — | | | — | | | 17 | | Interest and fees on loans and leases |
| Hedged fixed rate loans attributable to the risk being hedged | Hedged fixed rate loans attributable to the risk being hedged | | 0 | | | (17) | | Interest and fees on loans and leases | Hedged fixed rate loans attributable to the risk being hedged | — | | | — | | | — | | | (17) | | Interest and fees on loans and leases |
| Interest rate swaps hedging debt securities available for sale | Interest rate swaps hedging debt securities available for sale | | 28 | | | (107) | | Interest income - investment securities | Interest rate swaps hedging debt securities available for sale | 7 | | | 7 | | | 39 | | | (114) | | Interest income - investment securities |
| Hedged debt securities available for sale attributable to risk being hedged | Hedged debt securities available for sale attributable to risk being hedged | | (28) | | | 107 | | Interest income - investment securities | Hedged debt securities available for sale attributable to risk being hedged | (7) | | | (7) | | | (39) | | | 114 | | Interest income - investment securities |
The following table reflects amounts recorded onin the Consolidated Balance Sheets related to cumulative basis adjustments for fair value hedges:
| | | March 31, 2021 | | December 31, 2020 | | September 30, 2021 | | December 31, 2020 |
| (in millions) | (in millions) | Debt securities available for sale(1) | Long-term borrowed funds | | Debt securities available for sale(1) | Long-term borrowed funds | (in millions) | Debt securities available for sale(1) | Long-term borrowed funds | | Debt securities available for sale(1) | Long-term borrowed funds |
| Carrying amount of hedged assets | Carrying amount of hedged assets | $9,549 | | $0 | | | $10,869 | | $0 | | Carrying amount of hedged assets | $7,287 | | $— | | | $10,869 | | $— | |
| Carrying amount of hedged liabilities | Carrying amount of hedged liabilities | 0 | | 3,280 | | | 0 | | 3,307 | | Carrying amount of hedged liabilities | — | | 2,259 | | | — | | 3,307 | |
| Cumulative amount of fair value hedging adjustments included in the carrying amount of the hedged items | Cumulative amount of fair value hedging adjustments included in the carrying amount of the hedged items | 68 | | 85 | | | 96 | | 112 | | Cumulative amount of fair value hedging adjustments included in the carrying amount of the hedged items | 57 | | 63 | | | 96 | | 112 | |
(1) The Company designated $2.0 billion as the hedged amount (from a closed portfolio of prepayable financial assets with an amortized cost basis of $9.5$7.3 billion and $10.9 billion as of March 31,September 30, 2021 and December 31, 2020, respectively) in a last-of-layer hedging relationship, which commenced in the third quarter of 2019.
Cash Flow Hedges
In a cash flow hedge, the entire change in the fair value of the interest rate swap included in the assessment of hedge effectiveness is initially recorded in OCI and is subsequently reclassified from OCI to current period earnings (interest income or interest expense) in the same period that the hedged item affects earnings.
Citizens has outstanding interest rate swap agreements designed to hedge a portion of the Company’s floating-rate assets, and liabilities. All of these swaps have been deemed highly effective cash flow hedges. During the next 12 months, there are $94$76 million in pre-tax net gains on derivative instruments included in OCI expected to be reclassified to net interest income in the Consolidated Statements of Operations. This amount could differ from amounts actually recognized due to changes in interest rates, hedge de-designations, and the addition of other hedges subsequent to March 31,September 30, 2021.
The following table presents the pre-tax net gains (losses) recorded in the Consolidated Statements of Operations and in the Consolidated Statements of Comprehensive Income relating to derivative instruments designated as cash flow hedges:
| | | | | | | | | | | | | | | |
| | | Three Months Ended March 31, |
| (in millions) | | | | | 2021 | | 2020 |
| Amount of pre-tax net (losses) gains recognized in OCI | | | | | ($28) | | | $129 | |
| Amount of pre-tax net gains reclassified from OCI into interest income | | | | | 46 | | | 5 | |
| Amount of pre-tax net losses reclassified from OCI into interest expense | | | | | (12) | | | (1) | |
Citizens Financial Group, Inc. | 76
| | | | | | | | | | | | | | | | | | | | | | | |
| Three Months Ended September 30, | | Nine Months Ended September 30, |
| (in millions) | 2021 | | 2020 | | 2021 | | 2020 |
| Amount of pre-tax net gains (losses) recognized in OCI | ($15) | | | $— | | | $19 | | | $118 | |
| Amount of pre-tax net gains (losses) reclassified from OCI into interest income | 46 | | | 68 | | | 141 | | | 128 | |
| Amount of pre-tax net gains (losses) reclassified from OCI into interest expense | (13) | | | (11) | | | (37) | | | (22) | |
Derivatives Not Designated As Hedging Instruments
Economic Hedges
The Company’s economic hedges include those related to offsetting customer derivatives, residential mortgage loan derivatives (including interest rate lock commitments and forward sales commitments) and derivatives to hedge its residential MSR portfolio. Customer derivatives include interest rate, foreign exchange
Citizens Financial Group, Inc. | 68
and commodity derivative contracts designed to meet the hedging and financing needs of the Company’s customers, and are economically hedged by the Company to offset its market exposure. Interest rate lock commitments on residential mortgage loans that will be held for sale are considered derivative instruments, and are economically hedged by entering into forward sale commitments to manage changes in fair value due to interest rate risk. Residential MSR portfolio derivatives are entered to hedge the risk of changes in the fair value of the Company’s MSR asset.MSRs.
The following table presents the effect of economic hedges on noninterest income:
| | | | Amounts Recognized in
Noninterest Income for the | | | Amounts Recognized in
Noninterest Income for the | |
| | | Three Months Ended March 31, | Affected Line Item in the Consolidated Statements of Operations | | Three Months Ended September 30, | | Nine Months Ended September 30, | Affected Line Item in the Consolidated Statements of Operations |
| (in millions) | (in millions) | | 2021 | | 2020 | (in millions) | 2021 | | 2020 | | 2021 | 2020 | Affected Line Item in the Consolidated Statements of Operations |
| Economic hedge type: | Economic hedge type: | | | | | Economic hedge type: | | | | | | | |
| Customer interest rate contracts | Customer interest rate contracts | | ($348) | | | $1,089 | | Foreign exchange and interest rate products | Customer interest rate contracts | ($10) | | | $7 | | | ($225) | | | $1,276 | | Foreign exchange and interest rate products |
| Derivatives hedging interest rate risk | | Derivatives hedging interest rate risk | 17 | | | 1 | | | 244 | | | (1,245) | | Foreign exchange and interest rate products |
| Customer foreign exchange contracts | Customer foreign exchange contracts | | (116) | | | (30) | | Foreign exchange and interest rate products | Customer foreign exchange contracts | (61) | | | 80 | | | (158) | | | 73 | | Foreign exchange and interest rate products |
| Derivatives hedging foreign exchange risk | | Derivatives hedging foreign exchange risk | 95 | | | (126) | | | 234 | | | (77) | | Foreign exchange and interest rate products |
| Customer commodity contracts | Customer commodity contracts | | 94 | | | (63) | | Foreign exchange and interest rate products | Customer commodity contracts | 468 | | | 26 | | | 881 | | | (30) | | Foreign exchange and interest rate products |
| Derivative contracts to hedge interest rate risk | | 356 | | | (1,084) | | Foreign exchange and interest rate products | |
| Derivative contracts to hedge foreign exchange risk | | 150 | | | 99 | | Foreign exchange and interest rate products | |
| Derivative transactions to hedge commodity price risk | | (92) | | | 63 | | Foreign exchange and interest rate products | |
| Derivatives hedging commodity price risk | | Derivatives hedging commodity price risk | (465) | | | (25) | | | (874) | | | 32 | | Foreign exchange and interest rate products |
| Residential loan commitments | Residential loan commitments | | (238) | | | 140 | | Mortgage banking fees | Residential loan commitments | (13) | | | 36 | | | (184) | | | 190 | | Mortgage banking fees |
| Derivative contracts used to hedge residential loan commitments | | 275 | | | (129) | | Mortgage banking fees | |
| Derivatives hedging residential loan commitments and mortgage loans held for sale, at fair value | | Derivatives hedging residential loan commitments and mortgage loans held for sale, at fair value | 4 | | | 6 | | | 138 | | | (13) | | Mortgage banking fees |
| Derivative contracts used to hedge residential MSRs | Derivative contracts used to hedge residential MSRs | | (182) | | | 271 | | Mortgage banking fees | Derivative contracts used to hedge residential MSRs | (20) | | | 2 | | | (149) | | | 335 | | Mortgage banking fees |
| Total | Total | | ($101) | | | $356 | | | Total | $15 | | | $7 | | | ($93) | | | $541 | | |
Citizens Financial Group, Inc. | 77
NOTE 9 - ACCUMULATED OTHER COMPREHENSIVE INCOME (LOSS)
The following table presents the changes in the balances, net of income taxes, of each component of AOCI: | | | | | | | | | | | | | | | | | | | | | | | | | | |
| | As of and for the Three Months Ended March 31, |
| (in millions) | Net Unrealized (Losses) Gains on Derivatives | | Net Unrealized (Losses) Gains on Debt Securities | | Employee Benefit Plans | | Total AOCI |
| Balance at January 1, 2020 | $3 | | | $1 | | | ($415) | | | ($411) | |
| Other comprehensive income before reclassifications | 96 | | | 400 | | | 0 | | | 496 | |
| | | | | | | |
| Amounts reclassified to the Consolidated Statements of Operations | (3) | | | 0 | | | 3 | | | 0 | |
| Net other comprehensive income | 93 | | | 400 | | | 3 | | | 496 | |
| | | | | | | |
| Balance at March 31, 2020 | $96 | | | $401 | | | ($412) | | | $85 | |
| Balance at January 1, 2021 | ($11) | | | $380 | | | ($429) | | | ($60) | |
| Other comprehensive loss before reclassifications | (21) | | | (307) | | | 0 | | | (328) | |
| | | | | | | |
| Amounts reclassified to the Consolidated Statements of Operations | (25) | | | (2) | | | 4 | | | (23) | |
| Net other comprehensive (loss) income | (46) | | | (309) | | | 4 | | | (351) | |
| | | | | | | |
| Balance at March 31, 2021 | ($57) | | | $71 | | | ($425) | | | ($411) | |
| Primary location in the Consolidated Statements of Operations of amounts reclassified from AOCI | Net interest income | | Securities gains, net | | Other operating expense | | |
| | | | | | | | | | | | | | | | | | | | | | | | | | |
| | As of and for the Three Months Ended September 30, |
| (in millions) | Net Unrealized Gains (Losses) on Derivatives | | Net Unrealized Gains (Losses) on Debt Securities | | Employee Benefit Plans | | Total AOCI |
| Balance at July 1, 2020 | $54 | | | $448 | | | ($408) | | | $94 | |
| Other comprehensive income (loss) before reclassifications | — | | | (44) | | | — | | | (44) | |
| Amounts reclassified to the Consolidated Statements of Operations | (42) | | | (1) | | | 3 | | | (40) | |
| Net other comprehensive income (loss) | (42) | | | (45) | | | 3 | | | (84) | |
| Balance at September 30, 2020 | $12 | | | $403 | | | ($405) | | | $10 | |
| Balance at July 1, 2021 | ($38) | | | $78 | | | ($421) | | | ($381) | |
| Other comprehensive income (loss) before reclassifications | (11) | | | (109) | | | — | | | (120) | |
| | | | | | | |
| Amounts reclassified to the Consolidated Statements of Operations | (25) | | | (2) | | | 20 | | | (7) | |
| Net other comprehensive income (loss) | (36) | | | (111) | | | 20 | | | (127) | |
| Balance at September 30, 2021 | ($74) | | | ($33) | | | ($401) | | | ($508) | |
| Primary location of amounts reclassified to the Consolidated Statements of Operations | Net interest income | | Securities gains, net | | Other operating expense | | |
| | | | | | | | | | | | | | | | | | | | | | | | | | |
| | As of and for the Nine Months Ended September 30, |
| (in millions) | Net Unrealized Gains (Losses) on Derivatives | | Net Unrealized Gains (Losses) on Debt Securities | | Employee Benefit Plans | | Total AOCI |
| Balance at January 1, 2020 | $3 | | | $1 | | | ($415) | | | ($411) | |
| Other comprehensive income (loss) before reclassifications | 88 | | | 405 | | | — | | | 493 | |
| | | | | | | |
| Amounts reclassified to the Consolidated Statements of Operations | (79) | | | (3) | | | 10 | | | (72) | |
| Net other comprehensive income (loss) | 9 | | | 402 | | | 10 | | | 421 | |
| | | | | | | |
| Balance at September 30, 2020 | $12 | | | $403 | | | ($405) | | | $10 | |
| Balance at January 1, 2021 | ($11) | | | $380 | | | ($429) | | | ($60) | |
| Other comprehensive income (loss) before reclassifications | 14 | | | (406) | | | — | | | (392) | |
| | | | | | | |
| Amounts reclassified to the Consolidated Statements of Operations | (77) | | | (7) | | | 28 | | | (56) | |
| Net other comprehensive income (loss) | (63) | | | (413) | | | 28 | | | (448) | |
| | | | | | | |
| Balance at September 30, 2021 | ($74) | | | ($33) | | | ($401) | | | ($508) | |
| Primary location of amounts reclassified to the Consolidated Statements of Operations | Net interest income | | Securities gains, net | | Other operating expense | | |
Citizens Financial Group, Inc. | 6978
NOTE 10 - STOCKHOLDERS’ EQUITY
Preferred Stock
The following table summarizes the Company’s preferred stock: | | | March 31, 2021 | | December 31, 2020 | | September 30, 2021 | | December 31, 2020 |
| (in millions, except per share and share data) | (in millions, except per share and share data) | Liquidation value per share | | Preferred Shares | | Carrying Amount | | Preferred Shares | | Carrying Amount | (in millions, except per share and share data) | Liquidation value per share | | Preferred Shares | | Carrying Amount | | Preferred Shares | | Carrying Amount |
| Authorized ($25 par value) | | 100,000,000 | | | | 100,000,000 | | | |
| Authorized ($25 par value per share) | | Authorized ($25 par value per share) | | 100,000,000 | | | | 100,000,000 | | |
| Issued and outstanding: | Issued and outstanding: | | Issued and outstanding: | |
| Series A | Series A | $1,000 | | 250,000 | | | $247 | | 250,000 | | | $247 | Series A | $1,000 | | | — | | | $— | | 250,000 | | | $247 |
| Series B | Series B | 1,000 | | | 300,000 | | 296 | | | 300,000 | | | 296 | | Series B | 1,000 | | | 300,000 | | | 296 | | | 300,000 | | | 296 | |
| Series C | Series C | 1,000 | | | 300,000 | | | 297 | | | 300,000 | | | 297 | | Series C | 1,000 | | | 300,000 | | | 297 | | | 300,000 | | | 297 | |
| Series D | Series D | 1,000 | | (1) | 300,000 | | (2) | 293 | | | 300,000 | | | 293 | | Series D | 1,000 | | (1) | 300,000 | | (2) | 293 | | | 300,000 | | | 293 | |
| Series E | Series E | 1,000 | | (1) | 450,000 | | (3) | 437 | | | 450,000 | | | 437 | | Series E | 1,000 | | (1) | 450,000 | | (3) | 437 | | | 450,000 | | | 437 | |
| Series F | Series F | 1,000 | | | 400,000 | | | 395 | | | 400,000 | | | 395 | | Series F | 1,000 | | | 400,000 | | | 395 | | | 400,000 | | | 395 | |
| Series G | | Series G | 1,000 | | | 300,000 | | | 296 | | | — | | | — |
| Total | Total | | 2,000,000 | | | $1,965 | | 2,000,000 | | | $1,965 | Total | | 2,050,000 | | | $2,014 | | 2,000,000 | | | $1,965 |
(1) Equivalent to $25 per depositary share.
(2) Represented by 12,000,000 depositary shares each representing a 1/40th interest in the Series D Preferred Stock.
(3) Represented by 18,000,000 depositary shares each representing a 1/40th interest in the Series E Preferred Stock.
On July 6, 2021, the Company redeemed all outstanding shares of the 5.500% fixed-to-floating rate non-cumulative perpetual Series A Preferred Stock.
On June 11, 2021, the Company issued $300 million, or 300,000 shares, of 4.000% fixed-rate reset non-cumulative perpetual Series G Preferred Stock, par value of $25.00 per share with a liquidation preference of $1,000 per share (the “Series G Preferred Stock”). For further detail regarding the terms and conditions of the Company’s Series G Preferred Stock, see Note 10 to the Company’s Consolidated Financial Statements in the Form 10-Q for the period ended June 30, 2021.
For further detail regarding the terms and conditions of the Company’s preferred stock, see Note 16 to the Company’s Consolidated Financial Statements in the 2020 Form 10-K.
Dividends
| | | Three Months Ended March 31, 2021 | | Three Months Ended March 31, 2020 | | Three Months Ended September 30, 2021 | | Three Months Ended September 30, 2020 |
| (in millions, except per share and share data) | | Dividends Declared per Share | Dividends Declared | Dividends Paid | | Dividends Declared per Share | Dividends Declared | Dividends Paid | |
| (in millions, except per share data) | | (in millions, except per share data) | | Dividends Declared per Share | Dividends Declared | Dividends Paid | | Dividends Declared per Share | Dividends Declared | Dividends Paid |
| Common stock | Common stock | | $0.39 | | $167 | | $167 | | | $0.39 | | $168 | | $168 | | Common stock | | $0.39 | | $167 | | $167 | | | $0.39 | | $168 | | $168 | |
| Preferred stock | Preferred stock | | Preferred stock | |
| Series A | Series A | | $10.49 | | $3 | | $3 | | | $27.50 | | $7 | | $0 | | Series A | | $— | | $— | | $3 | | | $10.90 | | $3 | | $3 | |
| Series B | Series B | | 0 | | 0 | | 9 | | | 0 | | 0 | | 9 | | Series B | | — | | — | | 9 | | | — | | — | | 9 | |
| Series C | Series C | | 15.94 | | 5 | | 5 | | | 15.94 | | 5 | | 5 | | Series C | | 15.94 | | 5 | | 5 | | | 15.94 | | 4 | | 5 | |
| Series D | Series D | | 15.88 | | 5 | | 5 | | | 15.88 | | 5 | | 5 | | Series D | | 15.88 | | 5 | | 4 | | | 15.88 | | 4 | | 5 | |
| Series E | Series E | | 12.50 | | 5 | | 5 | | | 12.50 | | 5 | | 4 | | Series E | | 12.50 | | 6 | | 6 | | | 12.50 | | 6 | | 6 | |
| Series F | Series F | | 14.13 | | 5 | | 5 | | | 0 | | 0 | | 0 | | Series F | | 14.13 | | 6 | | 6 | | | 19.15 | | 8 | | — | |
| Series G | | Series G | | 12.78 | | 4 | | — | | | — | | — | | — | |
| Total preferred stock | Total preferred stock | | $23 | | $32 | | | $22 | | $23 | | Total preferred stock | | $26 | | $33 | | | | $25 | | $28 | |
|
Citizens Financial Group, Inc. | 79
| | | | | | | | | | | | | | | | | | | | | | | | | | |
| | Nine Months Ended September 30, 2021 | | Nine Months Ended September 30, 2020 |
| (in millions, except per share data) | | Dividends Declared per Share | Dividends Declared | Dividends Paid | | Dividends Declared per Share | Dividends Declared | Dividends Paid |
| Common stock | | $1.17 | | $502 | | $502 | | | $1.17 | | $504 | | $504 | |
| Preferred stock | | | | | | | | |
| Series A | | $20.99 | | $5 | | $8 | | | $51.88 | | $13 | | $10 | |
| Series B | | 30.00 | | 9 | | 18 | | | 30.00 | | 9 | | 18 | |
| Series C | | 47.81 | | 15 | | 15 | | | 47.81 | | 14 | | 15 | |
| Series D | | 47.63 | | 14 | | 13 | | | 47.63 | | 14 | | 15 | |
| Series E | | 37.50 | | 17 | | 17 | | | 37.50 | | 17 | | 15 | |
| Series F | | 42.38 | | 17 | | 17 | | | 19.15 | | 8 | | — | |
| Series G | | 12.78 | | 4 | | — | | | — | | — | | — | |
| Total preferred stock | | | $81 | | $88 | | | | $75 | | $73 | |
| | | | | | | | |
| | | | | | | | |
| | | | | | | | |
Treasury Stock
During the threenine months ended March 31,September 30, 2021, the Company repurchased $95 million, or 2,244,924 shares, of its outstanding common stock, which are held in treasury stock.
NOTE 11 - COMMITMENTS AND CONTINGENCIES
A summary of outstanding off-balance sheet arrangements is presented below. For more information on these arrangements, see Note 18 in the Company’s 2020 Form 10-K.
| | | | | | | | | | | |
| (in millions) | March 31, 2021 | | December 31, 2020 |
| Commitments to extend credit | $76,200 | | | $74,160 | |
| Letters of credit | 2,077 | | | 2,239 | |
| Risk participation agreements | 71 | | | 98 | |
| Loans sold with recourse | 58 | | | 54 | |
| Marketing rights | 29 | | | 29 | |
| Total | $78,435 | | | $76,580 | |
Citizens Financial Group, Inc. | 70
| | | | | | | | | | | |
| (in millions) | September 30, 2021 | | December 31, 2020 |
| Commitments to extend credit | $80,629 | | | $74,160 | |
| Letters of credit | 1,939 | | | 2,239 | |
| Risk participation agreements | 57 | | | 98 | |
| Loans sold with recourse | 70 | | | 54 | |
| Marketing rights | 26 | | | 29 | |
| Total | $82,721 | | | $76,580 | |
Commitments to Extend Credit
Commitments to extend credit are agreements to lend to customers in accordance with conditions contractually agreed upon in advance. Generally, the commitments have fixed expiration dates or termination clauses and may require payment of a fee. Since many of these commitments are expected to expire without being drawn upon, the contract amounts are not necessarily indicative of future cash requirements.
Letters of Credit
Letters of credit in the table above reflect commercial, standby financial and standby performance letters of credit. Financial and performance standby letters of credit are issued by the Company for the benefit of its customers. They are used as conditional guarantees of payment to a third party in the event the customer either fails to make specific payments (financial) or fails to complete a specific project (performance). The Company’s exposure to credit loss in the event of counterparty nonperformance in connection with the above instruments is represented by the contractual amount of those instruments. Generally, letters of credit are collateralized by cash, accounts receivable, inventory or investment securities. Credit risk associated with letters of credit is considered in determining the appropriate amounts of allowances for unfunded commitments. Standby letters of credit and commercial letters of credit are issued for terms of up to ten years and one year, respectively.
Other Commitments
Citizens has additional off-balance sheet arrangements that are summarized below:
•Marketing Rights - During 2003, Citizens entered into a 25-year agreement to acquire the naming and marketing rights of a baseball stadium in Pennsylvania.
•Loans sold with recourse - Citizens is an originator and servicer of residential mortgages and routinely sells such mortgage loans in the secondary market and to GSEs. In the context of such sales, the Company makes certain representations and warranties regarding the characteristics of the underlying loans and,
Citizens Financial Group, Inc. | 80
as a result, may be contractually required to repurchase such loans or indemnify certain parties against losses for certain breaches of those representations and warranties. The Company also sells the government guaranteed portion of certain SBA loans to outside investors, for which it retains the servicing rights.
•Risk Participation Agreements - RPAs are guarantees issued by the Company to other parties for a fee, whereby the Company agrees to participate in the credit risk of a derivative customer of the other party. The current amount of credit exposure is spread out over multiple counterparties. At September 30, 2021, the remaining terms on these RPAs generally have terms rangingranged from less than one year to five years; however, certain outstanding agreements have terms as long as nineeight years.
Contingencies
The Company operates in a legal and regulatory environment that exposes it to potentially significant risks. A certain amount of litigation ordinarily results from the nature of the Company’s banking and other businesses. The Company is a party to legal proceedings, including class actions. The Company is also the subject of investigations, reviews, subpoenas, and regulatory matters arising out of its normal business operations, which, in some instances, relate to concerns about fair lending, unfair and/or deceptive practices, mortgage-related issues, and mis-selling of certain products. In addition, the Company engages in discussions with relevant governmental and regulatory authorities on a regular and ongoing basis regarding various issues, and any issues discussed or identified may result in investigatory or other action being taken. Litigation and regulatory matters may result in settlements, damages, fines, penalties, public or private censure, increased costs, required remediation, restrictions on business activities, or other impacts on the Company.
In these disputes and proceedings, the Company contests liability and the amount of damages as appropriate. Given their complex nature, and based on the Company's experience, it may be years before some of these matters are finally resolved. Moreover, before liability can be reasonably estimated for a claim, numerous legal and factual issues may need to be examined, including through potentially lengthy discovery and determination of important factual matters, and by addressing novel or unsettled legal issues relevant to the proceedings in question. The Company cannot predict with certainty if, how, or when such claims will be resolved or what the eventual settlement, fine, penalty or other relief, if any, may be, particularly for claims that are at an early stage in their development or where claimants seek substantial or indeterminate damages. The Company recognizes a provision for a claim when, in the opinion of management after seeking legal advice,
Citizens Financial Group, Inc. | 71
it is probable that a liability exists and the amount of loss can be reasonably estimated. In many proceedings, however, it is not possible to determine whether any loss is probable or to estimate the amount of any loss.
Based on information currently available, the advice of legal counsel and other advisers, and established reserves, management believes that the aggregate liabilities, if any, potentially arising from these proceedings will not have a materially adverse effect on the Company’s unaudited interim Consolidated Financial Statements.
NOTE 12 - FAIR VALUE MEASUREMENTS
Citizens measures or monitors many of its assets and liabilities on a fair value basis. Fair value is used on a recurring basis for assets and liabilities for which fair value is the required or elected measurement basis of accounting. Additionally, fair value is used on a nonrecurring basis to evaluate assets for impairment or for disclosure purposes. Nonrecurring fair value adjustments typically involve the application of lower of cost or market accounting or write-downs of individual assets. Citizens also applies the fair value measurement guidance to determine amounts reported for certain disclosures in this Note for assets and liabilities that are not required to be reported at fair value in the financial statements.
Citizens Financial Group, Inc. | 81
Fair Value Option
Citizens elected to account for residential mortgage LHFS and certain commercial and industrial, and commercial real estate LHFS at fair value. The following table presents the difference between the aggregate fair value and the aggregate unpaid principal balance of LHFS measured at fair value:
| | | March 31, 2021 | | December 31, 2020 | | September 30, 2021 | | December 31, 2020 |
| (in millions) | (in millions) | Aggregate Fair Value | Aggregate Unpaid Principal | Aggregate Fair Value Greater (Less) Aggregate Unpaid Principal | | Aggregate Fair Value | Aggregate Unpaid Principal | Aggregate Fair Value Greater (Less) Aggregate Unpaid Principal | (in millions) | Aggregate Fair Value | Aggregate Unpaid Principal | Aggregate Fair Value Greater (Less) Than Aggregate Unpaid Principal | | Aggregate Fair Value | Aggregate Unpaid Principal | Aggregate Fair Value Greater (Less) Than Aggregate Unpaid Principal |
| Residential mortgage loans held for sale, at fair value | Residential mortgage loans held for sale, at fair value | $4,208 | | $4,165 | | $43 | | | $3,416 | | $3,260 | | $156 | | Residential mortgage loans held for sale, at fair value | $3,104 | | $3,029 | | $75 | | | $3,416 | | $3,260 | | $156 | |
| Commercial and industrial, and commercial real estate loans held for sale, at fair value | Commercial and industrial, and commercial real estate loans held for sale, at fair value | 96 | | 98 | | (2) | | | 148 | | 153 | | (5) | | Commercial and industrial, and commercial real estate loans held for sale, at fair value | 73 | | 75 | | (2) | | | 148 | | 153 | | (5) | |
For more information on the election of the fair value option for these assets see Note 19 in the Company’s 2020 Form 10-K.
Recurring Fair Value Measurements
Citizens utilizes a variety of valuation techniques to measure its assets and liabilities at fair value on a recurring basis. For more information on the valuation techniques utilized to measure recurring fair value see Note 19 in the Company’s 2020 Form 10-K.
Collateralized Loan Obligations
The fair value of CLOs is estimated using observable inputs, including prices of similar securities that trade in the market. The Company classifies these securities in Level 2 of the fair value hierarchy using these observable inputs.
Derivatives - Commodities Contracts
The fair value of commodity derivatives uses the mid-point of market observable quoted prices as an input into the fair value model. The model uses the observed market prices combined with other market observed inputs to derive the fair value of the instrument, which generally classifies it as Level 2 instrument. This type of derivative is exposed to counterparty risk; therefore, the Company adjusts the fair value of the contract by the credit valuation adjustment.
Citizens Financial Group, Inc. | 7282
The following table presents assets and liabilities measured at fair value, including gross derivative assets and liabilities, on a recurring basis at March 31,September 30, 2021:
| | (in millions) | (in millions) | Total | Level 1 | Level 2 | Level 3 | (in millions) | Total | Level 1 | Level 2 | Level 3 |
| Debt securities available for sale: | Debt securities available for sale: | | Debt securities available for sale: | |
| Mortgage-backed securities | Mortgage-backed securities | $24,453 | | $0 | | $24,453 | | $0 | | Mortgage-backed securities | $24,131 | | $— | | $24,131 | | $— | |
| | Collateralized loan obligations | | Collateralized loan obligations | 767 | | — | | 767 | | — | |
| State and political subdivisions | State and political subdivisions | 3 | | 0 | | 3 | | 0 | | State and political subdivisions | 2 | | — | | 2 | | — | |
| U.S. Treasury and other | U.S. Treasury and other | 11 | | 11 | | 0 | | 0 | | U.S. Treasury and other | 11 | | 11 | | — | | — | |
| Total debt securities available for sale | Total debt securities available for sale | 24,467 | | 11 | | 24,456 | | 0 | | Total debt securities available for sale | 24,911 | | 11 | | 24,900 | | — | |
| Loans held for sale, at fair value: | Loans held for sale, at fair value: | | Loans held for sale, at fair value: | |
| Residential loans held for sale | Residential loans held for sale | 4,208 | | 0 | | 4,208 | | 0 | | Residential loans held for sale | 3,104 | | — | | 3,104 | | — | |
| Commercial loans held for sale | Commercial loans held for sale | 96 | | 0 | | 96 | | 0 | | Commercial loans held for sale | 73 | | — | | 73 | | — | |
| Total loans held for sale, at fair value | Total loans held for sale, at fair value | 4,304 | | 0 | | 4,304 | | 0 | | Total loans held for sale, at fair value | 3,177 | | — | | 3,177 | | — | |
| Mortgage servicing rights | Mortgage servicing rights | 893 | | 0 | | 0 | | 893 | | Mortgage servicing rights | 978 | | — | | — | | 978 | |
| Derivative assets: | Derivative assets: | | Derivative assets: | |
| Interest rate contracts | Interest rate contracts | 1,125 | | 0 | | 1,125 | | 0 | | Interest rate contracts | 930 | | — | | 930 | | — | |
| Foreign exchange contracts | Foreign exchange contracts | 273 | | 0 | | 273 | | 0 | | Foreign exchange contracts | 249 | | — | | 249 | | — | |
| Commodities contracts | Commodities contracts | 135 | | 0 | | 135 | | 0 | | Commodities contracts | 822 | | — | | 822 | | — | |
| TBA contracts | TBA contracts | 156 | | 0 | | 156 | | 0 | | TBA contracts | 44 | | — | | 44 | | — | |
| Other contracts | Other contracts | 38 | | 0 | | 0 | | 38 | | Other contracts | 53 | | — | | — | | 53 | |
| Total derivative assets | Total derivative assets | 1,727 | | 0 | | 1,689 | | 38 | | Total derivative assets | 2,098 | | — | | 2,045 | | 53 | |
| Equity securities, at fair value | Equity securities, at fair value | 73 | | 73 | | 0 | | 0 | | Equity securities, at fair value | 88 | | 88 | | — | | — | |
| Total assets | Total assets | $31,464 | | $84 | | $30,449 | | $931 | | Total assets | $31,252 | | $99 | | $30,122 | | $1,031 | |
| Derivative liabilities: | Derivative liabilities: | | Derivative liabilities: | |
| Interest rate contracts | Interest rate contracts | $184 | | $0 | | $184 | | $0 | | Interest rate contracts | $169 | | $— | | $169 | | $— | |
| Foreign exchange contracts | Foreign exchange contracts | 213 | | 0 | | 213 | | 0 | | Foreign exchange contracts | 205 | | — | | 205 | | — | |
| Commodities contracts | Commodities contracts | 138 | | 0 | | 138 | | 0 | | Commodities contracts | 822 | | — | | 822 | | — | |
| TBA contracts | TBA contracts | 16 | | 0 | | 16 | | 0 | | TBA contracts | 9 | | — | | 9 | | — | |
| | Total derivative liabilities | Total derivative liabilities | 551 | | 0 | | 551 | | 0 | | Total derivative liabilities | 1,205 | | — | | 1,205 | | — | |
| Total liabilities | Total liabilities | $551 | | $0 | | $551 | | $0 | | Total liabilities | $1,205 | | $— | | $1,205 | | $— | |
Citizens Financial Group, Inc. | 7383
The following table presents assets and liabilities measured at fair value, including gross derivative assets and liabilities, on a recurring basis at December 31, 2020:
| | (in millions) | (in millions) | Total | Level 1 | Level 2 | Level 3 | (in millions) | Total | Level 1 | Level 2 | Level 3 |
| Debt securities available for sale: | Debt securities available for sale: | | Debt securities available for sale: | |
| Mortgage-backed securities | Mortgage-backed securities | $22,928 | | $0 | | $22,928 | | $0 | | Mortgage-backed securities | $22,928 | | $— | | $22,928 | | $— | |
| State and political subdivisions | State and political subdivisions | 3 | | 0 | | 3 | | 0 | | State and political subdivisions | 3 | | — | | 3 | | — | |
| U.S. Treasury and other | U.S. Treasury and other | 11 | | 11 | | 0 | | 0 | | U.S. Treasury and other | 11 | | 11 | | — | | — | |
| Total debt securities available for sale | Total debt securities available for sale | 22,942 | | 11 | | 22,931 | | 0 | | Total debt securities available for sale | 22,942 | | 11 | | 22,931 | | — | |
| Loans held for sale, at fair value: | Loans held for sale, at fair value: | | Loans held for sale, at fair value: | |
| Residential loans held for sale | Residential loans held for sale | 3,416 | | 0 | | 3,416 | | 0 | | Residential loans held for sale | 3,416 | | — | | 3,416 | | — | |
| Commercial loans held for sale | Commercial loans held for sale | 148 | | 0 | | 148 | | 0 | | Commercial loans held for sale | 148 | | — | | 148 | | — | |
| Total loans held for sale, at fair value | Total loans held for sale, at fair value | 3,564 | | 0 | | 3,564 | | 0 | | Total loans held for sale, at fair value | 3,564 | | — | | 3,564 | | — | |
| Mortgage servicing rights | Mortgage servicing rights | 658 | | 0 | | 0 | | 658 | | Mortgage servicing rights | 658 | | — | | — | | 658 | |
| Derivative assets: | Derivative assets: | | Derivative assets: | |
| Interest rate contracts | Interest rate contracts | 1,566 | | 0 | | 1,566 | | 0 | | Interest rate contracts | 1,566 | | — | | 1,566 | | — | |
| Foreign exchange contracts | Foreign exchange contracts | 320 | | 0 | | 320 | | 0 | | Foreign exchange contracts | 320 | | — | | 320 | | — | |
| Commodities contracts | Commodities contracts | 62 | | 0 | | 62 | | 0 | | Commodities contracts | 62 | | — | | 62 | | — | |
| TBA contracts | TBA contracts | 8 | | 0 | | 8 | | 0 | | TBA contracts | 8 | | — | | 8 | | — | |
| Other contracts | Other contracts | 197 | | 0 | | 0 | | 197 | | Other contracts | 197 | | — | | — | | 197 | |
| Total derivative assets | Total derivative assets | 2,153 | | 0 | | 1,956 | | 197 | | Total derivative assets | 2,153 | | — | | 1,956 | | 197 | |
| Equity securities, at fair value | Equity securities, at fair value | 66 | | 66 | | 0 | | 0 | | Equity securities, at fair value | 66 | | 66 | | — | | — | |
| Total assets | Total assets | $29,383 | | $77 | | $28,451 | | $855 | | Total assets | $29,383 | | $77 | | $28,451 | | $855 | |
| Derivative liabilities: | Derivative liabilities: | | Derivative liabilities: | |
| Interest rate contracts | Interest rate contracts | $217 | | $0 | | $217 | | $0 | | Interest rate contracts | $217 | | $— | | $217 | | $— | |
| Foreign exchange contracts | Foreign exchange contracts | 291 | | 0 | | 291 | | 0 | | Foreign exchange contracts | 291 | | — | | 291 | | — | |
| Commodities contracts | Commodities contracts | 61 | | 0 | 61 | | 0 | Commodities contracts | 61 | | — | | 61 | | — | |
| TBA contracts | TBA contracts | 65 | | 0 | | 65 | | 0 | | TBA contracts | 65 | | — | | 65 | | — | |
| | Total derivative liabilities | Total derivative liabilities | 634 | | 0 | | 634 | | 0 | | Total derivative liabilities | 634 | | — | | 634 | | — | |
| Total liabilities | Total liabilities | $634 | | $0 | | $634 | | $0 | | Total liabilities | $634 | | $— | | $634 | | $— | |
Citizens Financial Group, Inc. | 84
The following tables present a roll forward of the balance sheet amounts for assets measured at fair value on a recurring basis and classified as Level 3:
| | | | Three Months Ended March 31, 2021 | | Three Months Ended September 30, 2021 | | Nine Months Ended September 30, 2021 |
| (in millions) | (in millions) | | Mortgage Servicing Rights | | Other Derivative Contracts | (in millions) | Mortgage Servicing Rights | | Other Derivative Contracts | | Mortgage Servicing Rights | | Other Derivative Contracts |
| Beginning balance | Beginning balance | | $658 | | | $197 | | Beginning balance | $902 | | | $89 | | | $658 | | | $197 | |
| | Issuances | Issuances | | 87 | | | 162 | | Issuances | 109 | | | 81 | | | 318 | | | 323 | |
Settlements (2) | Settlements (2) | | (58) | | | (83) | | Settlements(2) | (54) | | | (104) | | | (159) | | | (283) | |
Changes in fair value during the period recognized in earnings (3) | Changes in fair value during the period recognized in earnings (3) | | 206 | | | (238) | | Changes in fair value during the period recognized in earnings(3) | 21 | | | (13) | | | 161 | | | (184) | |
| Ending balance | Ending balance | | $893 | | | $38 | | Ending balance | $978 | | | $53 | | | $978 | | | $53 | |
| | | Three Months Ended March 31, 2020 | | | Three Months Ended September 30, 2020 | | Nine Months Ended September 30, 2020 |
| (in millions) | (in millions) | Mortgage Servicing Rights | Other Derivative Contracts | | (in millions) | Mortgage Servicing Rights | Asset-Backed Securities | Other Derivative Contracts | | Mortgage Servicing Rights | Asset-Backed Securities | Other Derivative Contracts |
| Beginning balance | Beginning balance | $642 | | $19 | | | Beginning balance | $568 | | $— | | $173 | | | $642 | | $— | | $19 | |
Transfers upon election of fair value method (1) | Transfers upon election of fair value method (1) | 190 | | 0 | | | Transfers upon election of fair value method(1) | — | | — | | — | | | 190 | | — | | — | |
| Beginning balance, adjusted | Beginning balance, adjusted | 832 | | 19 | | | Beginning balance, adjusted | 568 | | — | | 173 | | | 832 | | — | | 19 | |
| | Purchases | | Purchases | — | | 813 | | — | | | — | | 813 | | — | |
| Issuances | Issuances | 67 | | 171 | | | Issuances | 85 | | — | | 283 | | | 238 | | — | | 688 | |
Settlements (2) | Settlements (2) | (40) | | (76) | | | Settlements(2) | (55) | | — | | (372) | | | (141) | | — | | (792) | |
Changes in fair value during the period recognized in earnings (3) | Changes in fair value during the period recognized in earnings (3) | (282) | | 29 | | | Changes in fair value during the period recognized in earnings(3) | 8 | | — | | 125 | | | (323) | | — | | 294 | |
| Ending balance | Ending balance | $577 | | $143 | | | Ending balance | $606 | | $813 | | $209 | | | $606 | | $813 | | $209 | |
(1) Effective January 1, 2020, the Company elected to account for all MSRs previously accounted for under the amortization method under the fair value method.
(2) Represents changes in value of the MSRs due to i) passage of time including the impact from both regularly scheduled loan principal payments and partial
paydowns, and ii) loans that paid off during the period.
(3) Represents changes in value primarily driven by market conditions. These changes are recorded in mortgage banking fees in the Consolidated Statements of Operations.
Citizens Financial Group, Inc. | 74
The following table presents quantitative information about the Company’s Level 3 assets, including the range and weighted-average of the significant unobservable inputs used to fair value these assets, as well as valuation techniques used.
| | | | | | | | | | | | |
| | As of March 31,September 30, 2021 |
| | Valuation Technique | Unobservable Input | Range (Weighted Average) |
| Mortgage servicing rights | | Discounted Cash Flow | Constant prepayment rate | 9.96-16.58%9.96-27.98% CPR (11.3% CPR) |
| Option adjusted spread | 350-1,509350-1,318 bps (582 bps) |
| Other derivative contracts | | Internal Model | Pull through rate | 18.26-100.00% (82.01%10.96-100.00% (83.30%) |
| MSR value | (16.59)-164.28(10.00)-145.29 bps (92.86(99.79 bps) |
Nonrecurring Fair Value Measurements
Fair value is also used on a nonrecurring basis to evaluate certain assets for impairment or for disclosure purposes. For more information on the valuation techniques utilized to measure nonrecurring fair value see Note 19 in the Company’s 2020 Form 10-K.
The following table presents losses on assets measured at fair value on a nonrecurring basis and recorded in earnings:
| | | Three Months Ended March 31, | | | Three Months Ended September 30, | | Nine Months Ended September 30, |
| (in millions) | (in millions) | 2021 | | 2020 | | (in millions) | 2021 | | 2020 | | 2021 | | 2020 |
| Collateral-dependent loans | Collateral-dependent loans | ($19) | | | ($34) | | | Collateral-dependent loans | ($4) | | | ($21) | | | ($23) | | | ($65) | |
Citizens Financial Group, Inc. | 85
The following table presents assets measured at fair value on a nonrecurring basis:
| | | March 31, 2021 | | December 31, 2020 | | September 30, 2021 | | December 31, 2020 |
| (in millions) | (in millions) | Total | Level 1 | Level 2 | Level 3 | | Total | Level 1 | Level 2 | Level 3 | (in millions) | Total | Level 1 | Level 2 | Level 3 | | Total | Level 1 | Level 2 | Level 3 |
| Collateral-dependent loans | Collateral-dependent loans | $724 | | $0 | | $724 | | $0 | | | $758 | | $0 | | $758 | | $0 | | Collateral-dependent loans | $585 | | $— | | $585 | | $— | | | $758 | | $— | | $758 | | $— | |
The following tables present the estimated fair value for financial instruments not recorded at fair value in the unaudited interim Consolidated Financial Statements. The carrying amounts are recorded in the Consolidated Balance Sheets under the indicated captions:
| | | March 31, 2021 | | September 30, 2021 |
| | Total | | Level 1 | | Level 2 | | Level 3 | | Total | | Level 1 | | Level 2 | | Level 3 |
| (in millions) | (in millions) | Carrying Value | Estimated Fair Value | | Carrying Value | Estimated Fair Value | | Carrying Value | Estimated Fair Value | | Carrying Value | Estimated Fair Value | (in millions) | Carrying Value | Estimated Fair Value | | Carrying Value | Estimated Fair Value | | Carrying Value | Estimated Fair Value | | Carrying Value | Estimated Fair Value |
| Financial assets: | Financial assets: | | | | | | | | Financial assets: | | | | | | | |
| Debt securities held to maturity | Debt securities held to maturity | $2,995 | | $3,077 | | | $0 | | $0 | | | $2,139 | | $2,223 | | | $856 | | $854 | | Debt securities held to maturity | $2,492 | | $2,567 | | | $— | | $— | | | $1,705 | | $1,778 | | | $787 | | $789 | |
| Other loans held for sale | Other loans held for sale | 75 | | 75 | | | 0 | | 0 | | | 0 | | 0 | | | 75 | | 75 | | Other loans held for sale | 93 | | 93 | | | — | | — | | | — | | — | | | 93 | | 93 | |
| Loans and leases | Loans and leases | 122,195 | | 122,365 | | | 0 | | 0 | | | 724 | | 724 | | | 121,471 | | 121,641 | | Loans and leases | 123,318 | | 123,318 | | | — | | — | | | 585 | | 585 | | | 122,733 | | 122,733 | |
| Other assets | Other assets | 603 | | 603 | | | 0 | | 0 | | | 595 | | 595 | | | 8 | | 8 | | Other assets | 616 | | 616 | | | — | | — | | | 593 | | 593 | | | 23 | | 23 | |
| Financial liabilities: | Financial liabilities: | | Financial liabilities: | |
| Deposits | Deposits | 151,349 | | 151,384 | | | 0 | | 0 | | | 151,349 | | 151,384 | | | 0 | | 0 | | Deposits | 152,221 | | 152,237 | | | — | | — | | | 152,221 | | 152,237 | | | — | | — | |
| Short-term borrowed funds | Short-term borrowed funds | 70 | | 70 | | | 0 | | 0 | | | 70 | | 70 | | | 0 | | 0 | | Short-term borrowed funds | 8 | | 8 | | | — | | — | | | 8 | | 8 | | | — | | — | |
| Long-term borrowed funds | Long-term borrowed funds | 8,316 | | 8,618 | | | 0 | | 0 | | | 8,316 | | 8,618 | | | 0 | | 0 | | Long-term borrowed funds | 6,947 | | 7,260 | | | — | | — | | | 6,947 | | 7,260 | | | — | | — | |
| | | | | | | | | | | | | | | | | | | | | | | | | | | | | | | | | | | |
| December 31, 2020 |
| Total | | Level 1 | | Level 2 | | Level 3 |
| (in millions) | Carrying Value | Estimated Fair Value | | Carrying Value | Estimated Fair Value | | Carrying Value | Estimated Fair Value | | Carrying Value | Estimated Fair Value |
| Financial assets: | | | | | | | | | | | |
| Debt securities held to maturity | $3,235 | | $3,357 | | | $— | | $— | | | $2,342 | | $2,464 | | | $893 | | $893 | |
| Other loans held for sale | 439 | | 439 | | | — | | — | | | — | | — | | | 439 | | 439 | |
| Loans and leases | 123,090 | | 123,678 | | | — | | — | | | 758 | | 758 | | | 122,332 | | 122,920 | |
| Other assets | 604 | | 604 | | | — | | — | | | 596 | | 596 | | | 8 | | 8 | |
| Financial liabilities: | | | | | | | | | | | |
| Deposits | 147,164 | | 147,223 | | | — | | — | | | 147,164 | | 147,223 | | | — | | — | |
| Short-term borrowed funds | 243 | | 243 | | | — | | — | | | 243 | | 243 | | | — | | — | |
| Long-term borrowed funds | 8,346 | | 8,850 | | | — | | — | | | 8,346 | | 8,850 | | | — | | — | |
Citizens Financial Group, Inc. | 7586
| | | | | | | | | | | | | | | | | | | | | | | | | | | | | | | | | | | |
| December 31, 2020 |
| Total | | Level 1 | | Level 2 | | Level 3 |
| (in millions) | Carrying Value | Estimated Fair Value | | Carrying Value | Estimated Fair Value | | Carrying Value | Estimated Fair Value | | Carrying Value | Estimated Fair Value |
| Financial assets: | | | | | | | | | | | |
| Debt securities held to maturity | $3,235 | | $3,357 | | | $0 | | $0 | | | $2,342 | | $2,464 | | | $893 | | $893 | |
| Other loans held for sale | 439 | | 439 | | | 0 | | 0 | | | 0 | | 0 | | | 439 | | 439 | |
| Loans and leases | 123,090 | | 123,678 | | | 0 | | 0 | | | 758 | | 758 | | | 122,332 | | 122,920 | |
| Other assets | 604 | | 604 | | | 0 | | 0 | | | 596 | | 596 | | | 8 | | 8 | |
| Financial liabilities: | | | | | | | | | | | |
| Deposits | 147,164 | | 147,223 | | | 0 | | 0 | | | 147,164 | | 147,223 | | | 0 | | 0 | |
| Short-term borrowed funds | 243 | | 243 | | | 0 | | 0 | | | 243 | | 243 | | | 0 | | 0 | |
| Long-term borrowed funds | 8,346 | | 8,850 | | | 0 | | 0 | | | 8,346 | | 8,850 | | | 0 | | 0 | |
NOTE 13 - NONINTEREST INCOME
Revenues from Contracts with Customers
The following table presents the components of revenue from contracts with customers disaggregated by revenue stream and business operating segment:
| | | Three Months Ended March 31, 2021 | | Three Months Ended March 31, 2020 | | Three Months Ended September 30, 2021 | | Three Months Ended September 30, 2020 |
| (in millions) | (in millions) | Consumer Banking | Commercial Banking | Consolidated (1) | | Consumer Banking | Commercial Banking | Consolidated (1) | (in millions) | Consumer Banking | Commercial Banking | Other | Consolidated | | Consumer Banking | Commercial Banking | Other | Consolidated |
| Service charges and fees | Service charges and fees | $74 | | $25 | | $99 | | | $92 | | $26 | | $118 | | Service charges and fees | $82 | | $27 | | $— | | $109 | | | $71 | | $25 | | $— | | $96 | |
| Card fees | Card fees | 47 | | 7 | | 54 | | | 45 | | 10 | | 55 | | Card fees | 57 | | 8 | | — | | 65 | | | 49 | | 7 | | — | | 56 | |
| Capital markets fees | Capital markets fees | 0 | | 72 | | 72 | | | 0 | | 65 | | 65 | | Capital markets fees | — | | 69 | | — | | 69 | | | — | | 50 | | — | | 50 | |
| Trust and investment services fees | Trust and investment services fees | 58 | | 0 | | 58 | | | 53 | | 0 | | 53 | | Trust and investment services fees | 61 | | — | | — | | 61 | | | 53 | | — | | — | | 53 | |
| Other banking fees | Other banking fees | 0 | | 2 | | 2 | | | 0 | | 3 | | 3 | | Other banking fees | — | | 3 | | — | | 3 | | | — | | 3 | | — | | 3 | |
| Total revenue from contracts with customers | Total revenue from contracts with customers | $179 | | $106 | | $285 | | | $190 | | $104 | | $294 | | Total revenue from contracts with customers | $200 | | $107 | | $— | | $307 | | | $173 | | $85 | | $— | | $258 | |
| Total revenue from other sources | | Total revenue from other sources | 115 | | 61 | | 31 | | 207 | | | 322 | | 59 | | 15 | | 396 | |
| Total noninterest income | | Total noninterest income | $315 | | $168 | | $31 | | $514 | | | $495 | | $144 | | $15 | | $654 | |
| | | | | | | | | | | | | | | | | | | | | | | | | | | | | |
| Nine Months Ended September 30, 2021 | | Nine Months Ended September 30, 2020 |
| (in millions) | Consumer Banking | Commercial Banking | Other | Consolidated | | Consumer Banking | Commercial Banking | Other | Consolidated |
| Service charges and fees | $230 | | $78 | | $— | | $308 | | | $222 | | $76 | | $— | | $298 | |
| Card fees | 160 | | 23 | | — | | 183 | | | 136 | | 24 | | — | | 160 | |
| Capital markets fees | — | | 225 | | — | | 225 | | | — | | 163 | | — | | 163 | |
| Trust and investment services fees | 179 | | — | | — | | 179 | | | 151 | | — | | — | | 151 | |
| Other banking fees | — | | 7 | | — | | 7 | | | — | | 7 | | — | | 7 | |
| Total revenue from contracts with customers | $569 | | $333 | | $— | | $902 | | | $509 | | $270 | | $— | | $779 | |
| Total revenue from other sources | 380 | | 183 | | 76 | | 639 | | | 771 | | 143 | | 48 | | 962 | |
| Total noninterest income | $949 | | $516 | | $76 | | $1,541 | | | $1,280 | | $413 | | $48 | | $1,741 | |
(1) There is no revenue from contracts with customers included in Other non-segment operations.
The Company recognized trailing commissions of $4 million and $3 million for the three months ended March 31,September 30, 2021 and 2020, respectively, and $12 million and $10 million for the nine months ended September 30, 2021 and 2020, respectively, related to services provided inongoing commissions from previous reporting periods. Fees from other investment services are recognized at a point in time upon completion of the service.sales.
Revenue from Other Sources
| | | | | | | | | | | | | | | |
| | | Three Months Ended March 31, |
| (in millions) | | | | | 2021 | | 2020 |
| Bank-owned life insurance | | | | | $14 | | | $14 | |
NOTE 14 - OTHER OPERATING EXPENSE
The following table presents the details of other operating expense:
| | | | | | | | | | | | | | | |
| | | Three Months Ended March 31, |
| (in millions) | | | | | 2021 | | 2020 |
| Promotional expense | | | | | $19 | | | $24 | |
| Other | | | | | 72 | | | 87 | |
| Other operating expense | | | | | $91 | | | $111 | |
| | | | | | | | | | | | | | | | | | | | | | | |
| Three Months Ended September 30, | | Nine Months Ended September 30, |
| (in millions) | 2021 | | 2020 | | 2021 | | 2020 |
| Marketing | $32 | | | $24 | | | $82 | | | $75 | |
| Other | 92 | | | 71 | | | 226 | | | 242 | |
| Other operating expense | $124 | | | $95 | | | $308 | | | $317 | |
Citizens Financial Group, Inc. | 7687
NOTE 15 - EARNINGS PER SHARE
| | | | Three Months Ended March 31, | | Three Months Ended September 30, | | Nine Months Ended September 30, |
| (in millions, except share and per share data) | (in millions, except share and per share data) | | 2021 | | 2020 | (in millions, except share and per share data) | 2021 | | 2020 | | 2021 | | 2020 |
| Numerator (basic and diluted): | Numerator (basic and diluted): | | | | | Numerator (basic and diluted): | | | | | | | |
| Net income | Net income | | $611 | | | $34 | | Net income | $530 | | | $314 | | | $1,789 | | | $601 | |
| Less: Preferred stock dividends | Less: Preferred stock dividends | | 23 | | | 22 | | Less: Preferred stock dividends | 26 | | | 25 | | | 81 | | | 75 | |
| Net income available to common stockholders | Net income available to common stockholders | | $588 | | | $12 | | Net income available to common stockholders | $504 | | | $289 | | | $1,708 | | | $526 | |
| Denominator: | Denominator: | | | | | Denominator: | | | | | | | |
| Weighted-average common shares outstanding - basic | Weighted-average common shares outstanding - basic | | 425,953,716 | | | 427,718,421 | | Weighted-average common shares outstanding - basic | 426,086,717 | | | 426,846,096 | | | 425,996,867 | | | 427,058,412 | |
| Dilutive common shares: share-based awards | Dilutive common shares: share-based awards | | 1,926,814 | | | 1,670,434 | | Dilutive common shares: share-based awards | 1,754,247 | | | 1,146,253 | | | 1,683,018 | | | 1,083,946 | |
| Weighted-average common shares outstanding - diluted | Weighted-average common shares outstanding - diluted | | 427,880,530 | | | 429,388,855 | | Weighted-average common shares outstanding - diluted | 427,840,964 | | | 427,992,349 | | | 427,679,885 | | | 428,142,358 | |
| Earnings per common share: | Earnings per common share: | | | | | Earnings per common share: | | | | | | | |
| Basic | Basic | | $1.38 | | | $0.03 | | Basic | $1.18 | | | $0.68 | | | $4.01 | | | $1.23 | |
Diluted (1) | Diluted (1) | | 1.37 | | | 0.03 | | Diluted(1) | 1.18 | | | 0.68 | | | 3.99 | | | 1.23 | |
(1) Potential dilutive common shares arewere excluded from the computation of diluted EPS in the periods where the effect would be antidilutive. Excluded from the computation of diluted EPS were weighted average antidilutive shares totaling 305,21010,614 and 1,030,7451,193,668 for the three months ended March 31,September 30, 2021 and 2020, respectively, and 4,238 and 1,249,785 for the nine months ended September 30, 2021 and 2020, respectively.
NOTE 16 - BUSINESS OPERATING SEGMENTS
Citizens is managed by its Chief Executive Officer on a segment basis. The Company’s 2 business operating segments are Consumer Banking and Commercial Banking. The business segments are determined based on the products and services provided, or the type of customer served. Each segment has a segment head who reports directly to the Chief Executive Officer. The Chief Executive Officer has final authority over resource allocation decisions and performance assessment. The business segments reflect this management structure and the manner in which financial information is currently evaluated by the Chief Executive Officer. For more information on the Company’s business operating segments, as well as Other non-segment operations, see Note 25 in the Company’s 2020 Form 10-K.
| | | As of and for the Three Months Ended March 31, 2021 | | As of and for the Three Months Ended September 30, 2021 |
| (in millions) | (in millions) | Consumer Banking | | Commercial Banking | | Other | | Consolidated | (in millions) | Consumer Banking | | Commercial Banking | | Other | | Consolidated |
| Net interest income | Net interest income | $863 | | | $421 | | | ($167) | | | $1,117 | | Net interest income | $919 | | | $428 | | | ($202) | | | $1,145 | |
| Noninterest income | Noninterest income | 351 | | | 170 | | | 21 | | | 542 | | Noninterest income | 315 | | | 168 | | | 31 | | | 514 | |
| Total revenue | Total revenue | 1,214 | | | 591 | | | (146) | | | 1,659 | | Total revenue | 1,234 | | | 596 | | | (171) | | | 1,659 | |
| Noninterest expense | Noninterest expense | 750 | | | 227 | | | 41 | | | 1,018 | | Noninterest expense | 749 | | | 226 | | | 36 | | | 1,011 | |
| Profit (loss) before provision for credit losses | Profit (loss) before provision for credit losses | 464 | | | 364 | | | (187) | | | 641 | | Profit (loss) before provision for credit losses | 485 | | | 370 | | | (207) | | | 648 | |
| Provision for credit losses | Provision for credit losses | 59 | | | 101 | | | (300) | | | (140) | | Provision for credit losses | 35 | | | 15 | | | (83) | | | (33) | |
| Income before income tax expense | 405 | | | 263 | | | 113 | | | 781 | | |
| Income tax expense | 103 | | | 52 | | | 15 | | | 170 | | |
| Net income | $302 | | | $211 | | | $98 | | | $611 | | |
| Income (loss) before income tax expense (benefit) | | Income (loss) before income tax expense (benefit) | 450 | | | 355 | | | (124) | | | 681 | |
| Income tax expense (benefit) | | Income tax expense (benefit) | 114 | | | 81 | | | (44) | | | 151 | |
| Net income (loss) | | Net income (loss) | $336 | | | $274 | | | ($80) | | | $530 | |
| Total average assets | Total average assets | $75,283 | | | $57,738 | | | $49,548 | | | $182,569 | | Total average assets | $75,070 | | | $56,702 | | | $54,336 | | | $186,108 | |
| | | As of and for the Three Months Ended March 31, 2020 | | As of and for the Three Months Ended September 30, 2020 |
| (in millions) | (in millions) | Consumer Banking | | Commercial Banking | | Other | | Consolidated | (in millions) | Consumer Banking | | Commercial Banking | | Other | | Consolidated |
| Net interest income | Net interest income | $793 | | | $365 | | | $2 | | | $1,160 | | Net interest income | $845 | | | $421 | | | ($129) | | | $1,137 | |
| Noninterest income | Noninterest income | 357 | | | 125 | | | 15 | | | 497 | | Noninterest income | 495 | | | 144 | | | 15 | | | 654 | |
| Total revenue | Total revenue | 1,150 | | | 490 | | | 17 | | | 1,657 | | Total revenue | 1,340 | | | 565 | | | (114) | | | 1,791 | |
| Noninterest expense | Noninterest expense | 738 | | | 221 | | | 53 | | | 1,012 | | Noninterest expense | 742 | | | 210 | | | 36 | | | 988 | |
| Profit (loss) before provision for credit losses | Profit (loss) before provision for credit losses | 412 | | | 269 | | | (36) | | | 645 | | Profit (loss) before provision for credit losses | 598 | | | 355 | | | (150) | | | 803 | |
| Provision for credit losses | Provision for credit losses | 97 | | | 43 | | | 460 | | | 600 | | Provision for credit losses | 55 | | | 161 | | | 212 | | | 428 | |
| Income (loss) before income tax expense (benefit) | Income (loss) before income tax expense (benefit) | 315 | | | 226 | | | (496) | | | 45 | | Income (loss) before income tax expense (benefit) | 543 | | | 194 | | | (362) | | | 375 | |
| Income tax expense (benefit) | Income tax expense (benefit) | 79 | | | 47 | | | (115) | | | 11 | | Income tax expense (benefit) | 136 | | | 41 | | | (116) | | | 61 | |
| Net income (loss) | Net income (loss) | $236 | | | $179 | | | ($381) | | | $34 | | Net income (loss) | $407 | | | $153 | | | ($246) | | | $314 | |
| Total average assets | Total average assets | $68,415 | | | $59,005 | | | $39,757 | | | $167,177 | | Total average assets | $73,605 | | | $60,889 | | | $43,181 | | | $177,675 | |
Citizens Financial Group, Inc. | 88
| | | | | | | | | | | | | | | | | | | | | | | |
| As of and for the Nine Months Ended September 30, 2021 |
| (in millions) | Consumer Banking | | Commercial Banking | | Other | | Consolidated |
| Net interest income | $2,679 | | | $1,268 | | | ($561) | | | $3,386 | |
| Noninterest income | 949 | | | 516 | | | 76 | | | 1,541 | |
| Total revenue | 3,628 | | | 1,784 | | | (485) | | | 4,927 | |
| Noninterest expense | 2,250 | | | 679 | | | 91 | | | 3,020 | |
| Profit (loss) before provision for credit losses | 1,378 | | | 1,105 | | | (576) | | | 1,907 | |
| Provision for credit losses | 139 | | | 150 | | | (675) | | | (386) | |
| Income (loss) before income tax expense (benefit) | 1,239 | | | 955 | | | 99 | | | 2,293 | |
| Income tax expense (benefit) | 315 | | | 205 | | | (16) | | | 504 | |
| Net income (loss) | $924 | | | $750 | | | $115 | | | $1,789 | |
| Total average assets | $75,317 | | | $57,318 | | | $51,756 | | | $184,391 | |
| | | | | | | | | | | | | | | | | | | | | | | |
| As of and for the Nine Months Ended September 30, 2020 |
| (in millions) | Consumer Banking | | Commercial Banking | | Other | | Consolidated |
| Net interest income | $2,452 | | | $1,205 | | | ($200) | | | $3,457 | |
| Noninterest income | 1,280 | | | 413 | | | 48 | | | 1,741 | |
| Total revenue | 3,732 | | | 1,618 | | | (152) | | | 5,198 | |
| Noninterest expense | 2,215 | | | 644 | | | 120 | | | 2,979 | |
| Profit (loss) before provision for credit losses | 1,517 | | | 974 | | | (272) | | | 2,219 | |
| Provision for credit losses | 232 | | | 274 | | | 986 | | | 1,492 | |
| Income (loss) before income tax expense (benefit) | 1,285 | | | 700 | | | (1,258) | | | 727 | |
| Income tax expense (benefit) | 322 | | | 147 | | | (343) | | | 126 | |
| Net income (loss) | $963 | | | $553 | | | ($915) | | | $601 | |
| Total average assets | $71,227 | | | $61,722 | | | $41,943 | | | $174,892 | |
There have been no significant changes in the management accounting practices utilized by the Company
Citizens Financial Group, Inc. | 77
regarding the basis of presentation for segment results as discussed in Note 25 in the Company’s 2020 Form 10-K.
ITEM 3. QUANTITATIVE AND QUALITATIVE DISCLOSURES ABOUT MARKET RISK
The information presented in the “Market Risk” section of Part I, Item 2 is incorporated herein by reference.
ITEM 4. CONTROLS AND PROCEDURES
The Company maintains a set of disclosure controls and procedures designed to ensure that information required to be disclosed by the Company in reports that it files or submits under the Exchange Act, is recorded, processed, summarized and reported within the time periods specified in SEC rules and forms. The design of any disclosure controls and procedures is based in part upon certain assumptions about the likelihood of future events, and there can be no assurance that any design will succeed in achieving its stated goals under all potential future conditions. Any controls and procedures, no matter how well designed and operated, can provide only reasonable, not absolute, assurance of achieving the desired control objectives. In accordance with Rule 13a-15(b) of the Exchange Act, as of the end of the period covered by this quarterly report, an evaluation was carried out under the supervision and with the participation of the Company’s management, including its Chief Executive Officer and Chief Financial Officer, of the effectiveness of its disclosure controls and procedures. Based on that evaluation, the Company’s Chief Executive Officer and Chief Financial Officer concluded that the Company’s disclosure controls and procedures, as of the end of the period covered by this quarterly report, were effective to provide reasonable assurance that information required to be disclosed by the Company in reports that it files or submits under the Exchange Act is recorded, processed, summarized and reported within the time periods specified in SEC rules and forms and is accumulated and communicated to the Company’s management, including the Chief Executive Officer and Chief Financial Officer, as appropriate to allow timely decisions regarding required disclosure.
PART II. OTHER INFORMATION
Citizens Financial Group, Inc. | 89
CITIZENS FINANCIAL GROUP, INC.
ITEM 1. LEGAL PROCEEDINGS
The information required by this item is presented in Note 11, which is incorporated herein by reference.
ITEM 1A. RISK FACTORS
In addition to the other information set forth in this Report, you should consider the risks described under the caption “Risk Factors” in the Company’s 2020 Form 10-K.10-K and Form 10-Q for the period ended June 30, 2021.
ITEM 2. UNREGISTERED SALES OF EQUITY SECURITIES AND USE OF PROCEEDS
Details of the repurchases of the Company’s common stock during the three months ended March 31, 2021 are included below:
| | | | | | | | | | | | | | |
| Period | Total Number of Shares Repurchased | Weighted Average Price Paid Per Share | Total Number of Shares Purchased as Part of Publicly Announced Plans or Programs (1) | Maximum Dollar Amount of Shares That May Yet Be Purchased As Part of Publicly Announced Plans or Programs (1) |
| January 1, 2021 - January 31, 2021 | 2,103,412 | $42.32 | 2,103,412 | $660,988,442 |
| February 1, 2021 - February 28, 2021 | — | $— | — | $660,988,442 |
| March 1, 2021 - March 31, 2021 | 141,512 | $42.32 | 141,512 | $655,000,000 |
(1) On January 20, 2021, the Company announced that its Board of Directors has authorized share repurchases of CFG common stock of up to $750 million commencing in the first quarter of 2021. This share repurchase plan allowed for share repurchases that may be executed in the open market or in privately negotiated transactions, including under Rule 10b5-1 plans. The timing and exact amount of future share repurchases will be subject to various factors, including the Company’s capital position, financial performance and market conditions.None.
ITEM 6. EXHIBITS
Citizens Financial Group, Inc. | 78
3.2 Certificate of Designations of the Registrant with respect to the Series F Preferred Stock, dated June 1, 2020,as filed with the Secretary of State of the State of Delaware and effective June 1, 2020July 8, 2021 (incorporated herein by reference to Exhibit 3.13.1 of the CurrentQuarterly Report on Form 8-K,10-Q for the quarterly period ended June 30, 2021, filed June 4, 2020)August 3, 2021)
101 The following materials from the Registrant's Quarterly Report on Form 10-Q for the fiscal quarter ended March 31,September 30, 2021, formatted in inline XBRL: (i) the Consolidated Balance Sheets, (ii) the Consolidated Statements of Operations, (iii) the Consolidated Statements of Comprehensive Income, (iv) the Consolidated Statements of Changes in Stockholders’ Equity, (v) the Consolidated Statements of Cash Flows and (vi) the Notes to Consolidated Financial Statements*
104 Cover page interactive data file in inline XBRL format, included in Exhibit 101 to this report*
* Filed herewith.
Citizens Financial Group, Inc. | 7990
SIGNATURE
Pursuant to the requirements of the Securities Exchange Act of 1934, the Registrant has duly caused this Report to be signed on its behalf by the undersigned, thereunto duly authorized on May 5,November 3, 2021.
| | | | | |
| CITIZENS FINANCIAL GROUP, INC. |
| (Registrant) |
| |
| By: | /s/ C. Jack Read |
| Name: C. Jack Read |
| Title: Executive Vice President, Chief Accounting Officer and Controller |
| (Principal Accounting Officer and Authorized Officer) |
Citizens Financial Group, Inc. | 8091