UNITED STATES
SECURITIES AND EXCHANGE COMMISSION
Washington, D.C. 20549
FORM 10-Q
| | | | | | | | | | | |
| ☒ | QUARTERLY REPORT PURSUANT TO SECTION 13 OR 15(d) OF THE SECURITIES EXCHANGE ACT OF 1934 | |
For the quarterly period ended March 31,September 30, 2021
OR
| | | | | | | | | | | |
| ☐ | TRANSITION REPORT PURSUANT TO SECTION 13 OR 15(d) OF THE SECURITIES EXCHANGE ACT OF 1934 | |
For the transition period from to .
Commission File Number: 1-8944
CLEVELAND-CLIFFS INC.
(Exact Name of Registrant as Specified in Its Charter)
| | | | | | | | | | | | | | | | | | | | |
| Ohio | | 34-1464672 | |
| (State or Other Jurisdiction of Incorporation or Organization) | | (I.R.S. Employer Identification No.) | |
| | | | |
| 200 Public Square, | Cleveland, | Ohio | | 44114-2315 | |
| (Address of Principal Executive Offices) | | (Zip Code) | |
Registrant’s Telephone Number, Including Area Code: (216) 694-5700
Securities registered pursuant to Section 12(b) of the Act:
| | | | | | | | | | | | | | |
| Title of each class | | Trading Symbol(s) | | Name of each exchange on which registered |
| Common shares, par value $0.125 per share | | CLF | | New York Stock Exchange |
Indicate by check mark whether the registrant (1) has filed all reports required to be filed by Section 13 or 15(d) of the Securities Exchange Act of 1934 during the preceding 12 months (or for such shorter period that the registrant was required to file such reports), and (2) has been subject to such filing requirements for the past 90 days.
Yes ☒ No ☐
Indicate by check mark whether the registrant has submitted electronically every Interactive Data File required to be submitted pursuant to Rule 405 of Regulation S-T (§232.405 of this chapter) during the preceding 12 months (or for such shorter period that the registrant was required to submit such files).
Yes ☒ No ☐
Indicate by check mark whether the registrant is a large accelerated filer, an accelerated filer, a non-accelerated filer, a smaller reporting company, or an emerging growth company. See the definitions of “large accelerated filer,” “accelerated filer,” “smaller reporting company,” and "emerging growth company" in Rule 12b-2 of the Exchange Act.
| | | | | | | | | | | |
| Large accelerated filer | ☒ | Accelerated filer | ☐ |
| Non-accelerated filer | ☐ | Smaller reporting company | ☐ |
| | Emerging growth company | ☐ |
If an emerging growth company, indicate by check mark if the registrant has elected not to use the extended transition period for complying with any new or revised financial accounting standards provided pursuant to Section 13(a) of the Exchange Act. ☐
Indicate by check mark whether the registrant is a shell company (as defined in Rule 12b-2 of the Exchange Act).
Yes ☐ No ☒
The number of shares outstanding of the registrant’s common shares, par value $0.125 per share, was 499,402,288500,090,665 as of April 26,October 25, 2021.
TABLE OF CONTENTS
| | | | | | | | | | | | | | | | | |
| | | | | |
| | | Page Number |
| | | | | |
| DEFINITIONS | | | |
| | | |
| PART I - FINANCIAL INFORMATION | | | |
| Item 1. | Financial Statements | | | |
| | Statements of Unaudited Condensed Consolidated Financial Position as of March 31,September 30, 2021 and December 31, 2020 | | | |
| | Statements of Unaudited Condensed Consolidated Operations for the Three and Nine Months Ended March 31,September 30, 2021 and 2020 | | | |
| | Statements of Unaudited Condensed Consolidated Comprehensive Income (Loss) for the Three and Nine Months Ended March 31,September 30, 2021 and 2020 | | | |
| | Statements of Unaudited Condensed Consolidated Cash Flows for the ThreeNine Months Ended March 31,September 30, 2021 and 2020 | | | |
| | Statements of Unaudited Condensed Consolidated Changes in Equity for the ThreeNine Months Ended March 31,September 30, 2021 and 2020 | | | |
| | Notes to Unaudited Condensed Consolidated Financial Statements | | | |
| Item 2. | Management's Discussion and Analysis of Financial Condition and Results of Operations | | | |
| Item 3. | Quantitative and Qualitative Disclosures About Market Risk | | | |
| Item 4. | Controls and Procedures | | | |
| | | |
| PART II - OTHER INFORMATION | | | |
| Item 1. | Legal Proceedings | | | |
| Item 1A. | Risk Factors | | | |
| Item 2. | Unregistered Sales of Equity Securities and Use of Proceeds | | | |
| Item 4. | Mine Safety Disclosures | | | |
| Item 5. | Other Information | | | |
| Item 6. | Exhibits | | | |
| | | | | |
| Signatures | | | |
| | | |
DEFINITIONS
The following abbreviations or acronyms are used in the text. References in this report to the “Company,” “we,” “us,” “our” and “Cliffs” are to Cleveland-Cliffs Inc. and subsidiaries, collectively, unless stated otherwise or the context indicates otherwise.
| | | | | | | | |
| Abbreviation or acronym | | Term |
| | |
| 4.625% 2029 Senior Notes | | 4.625% Senior Guaranteed Notes due 2029 issued by Cleveland-Cliffs Inc. on February 17, 2021 in an aggregate principal amount of $500 million |
| 4.875% 2031 Senior Notes | | 4.875% Senior Guaranteed Notes due 2031 issued by Cleveland-Cliffs Inc. on February 17, 2021 in an aggregate principal amount of $500 million |
| 2020 Acquisitions | | The AK Steel Merger and AM USA Transaction, together |
| ABL Facility | | Asset-Based Revolving Credit Agreement, dated as of March 13, 2020, among Cleveland-Cliffs Inc., the lenders party thereto from time to time and Bank of America, N.A., as administrative agent, as amended as of March 27, 2020, and December 9, 2020, and as may be further amended from time to time |
Acquisitions | | The AK Steel Merger and AM USA Transaction, together |
| Adjusted EBITDA | | EBITDA, excluding certain items such as EBITDA of noncontrolling interests, extinguishment of debt, severance, acquisition-related costs, acquisition-related loss on equity method investment, amortization of inventory step-up and impacts of discontinued operations |
| AK Steel | | AK Steel Holding Corporation (n/k/a Cleveland-Cliffs Steel Holding Corporation) and its consolidated subsidiaries, including AK Steel Corporation (n/k/a Cleveland-Cliffs Steel Corporation), its direct, wholly owned subsidiary, collectively, unless stated otherwise or the context indicates otherwise |
| AK Steel Merger | | The merger of Merger Sub with and into AK Steel, with AK Steel surviving the merger as a wholly owned subsidiary of Cleveland-Cliffs Inc., subject to the terms and conditions set forth in the AK Steel Merger Agreement, consummated on March 13, 2020 |
| AK Steel Merger Agreement | | Agreement and Plan of Merger, dated as of December 2, 2019, among Cleveland-Cliffs Inc., AK Steel and Merger Sub |
| AM USA Transaction | | The acquisition of ArcelorMittal USA, consummated on December 9, 2020 |
| AM USA Transaction Agreement | | Transaction Agreement, dated as of September 28, 2020, by and between Cleveland-Cliffs Inc. and ArcelorMittal |
| AOCI | | Accumulated Other Comprehensive Income (Loss) |
| ArcelorMittal | | ArcelorMittal S.A., a company organized under the laws of Luxembourg and the former ultimate parent company of ArcelorMittal USA |
| ArcelorMittal USA | | Substantially all of the operations of the former ArcelorMittal USA LLC, its subsidiaries and certain affiliates, and Kote and Tek, collectively |
| ASC | | Accounting Standards Codification |
| ASU | | Accounting Standards Update |
| BOF | | Basic Oxygen Furnaces |
| Board | | The Board of Directors of Cleveland-Cliffs Inc. |
| CARES Act | | Coronavirus Aid, Relief, and Economic Security Act |
| CERCLA | | Comprehensive Environmental Response, Compensation and Liability Act of 1980 |
| COVID-19 | | A novel strain of coronavirus that the World Health Organization declared a global pandemic in March 2020 |
| Dodd-Frank Act | | Dodd-Frank Wall Street Reform and Consumer Protection Act |
| EAF | | Electric arc furnace |
| EBITDA | | Earnings before interest, taxes, depreciation and amortization |
| EDC | | Export Development Canada |
| EPA | | U.S. Environmental Protection Agency |
| EPS | | Earnings per share |
| Exchange Act | | Securities Exchange Act of 1934, as amended |
| FASB | | Financial Accounting Standards Board |
| Fe | | Iron |
| FMSH Act | | Federal Mine Safety and Health Act of 1977, as amended |
| FPT | | Ferrous Processing and Trading Company, including certain related entities |
| FPT Acquisition | | The purchase of FPT, subject to the terms and conditions set forth in the FPT Acquisition Agreement |
| FPT Acquisition Agreement | | Securities Purchase Agreement, dated as of October 8, 2021, by and between Cleveland-Cliffs Inc. and Anthony Soave Revocable Trust u/a/d January 14, 1987, as amended and restated |
| GAAP | | Accounting principles generally accepted in the United States |
| GHG | | Greenhouse gas |
| HBI | | Hot briquetted iron |
| Hibbing | | Iron ore mining property owned by Hibbing Taconite Company, an unincorporated joint venture between subsidiaries of Cliffs and U.S. Steel |
| HRC | | Hot-rolled coil steel |
| IRB | | Industrial Revenue Bond |
| Kote and Tek | | I/N Kote L.P. (n/k/a Cleveland-Cliffs Kote L.P.) and I/N Tek L.P. (n/k/a Cleveland-Cliffs Tek L.P.), former joint ventures between subsidiaries of the former ArcelorMittal USA LLC and Nippon Steel Corporation |
| Long ton | | 2,240 pounds |
| Merger Sub | | Pepper Merger Sub Inc., a direct, wholly owned subsidiary of Cliffs prior to the AK Steel Merger |
| Metric ton | | 2,205 pounds |
| | | | | | | | |
| Abbreviation or acronym | | Term |
| MSHA | | U.S. Mine Safety and Health Administration |
| Net ton | | 2,000 pounds |
| | |
| NPDES | | National Pollutant Discharge Elimination System, authorized by the Clean Water Act |
| OPEB | | Other postretirement benefits |
| Platts 62% price | | Platts IODEX 62% Fe Fines CFR North China |
| RCRA | | Resource Conservation and Recovery Act |
| | | | | | | | |
Abbreviation or acronym | | Term |
| RI/FS | | Remedial Investigation/Feasibility Study |
SAAR | | Seasonally Adjusted Annualized Rate |
| SEC | | U.S. Securities and Exchange Commission |
| Section 232 | | Section 232 of the Trade Expansion Act of 1962, as amended |
| Securities Act | | Securities Act of 1933, as amended |
| SunCoke Middletown | | Middletown Coke Company, LLC, a subsidiary of SunCoke Energy, Inc. |
| Topic 805 | | ASC Topic 805, Business Combinations |
| Topic 815 | | ASC Topic 815, Derivatives and Hedging |
Tubular Components | | Cleveland-Cliffs Tubular Components LLC (f/k/a AK Tube LLC), an indirect, wholly owned subsidiary of AK Steel |
| U.S. | | United States of America |
| U.S. Steel | | U.S.United States Steel Corporation and its subsidiaries, collectively, unless stated otherwise or the context indicates otherwise |
| UAW | | United Auto Workers |
| USMCA | | United States-Mexico-Canada Agreement |
USW | | United Steelworkers |
| | |
| VIE | | Variable interest entity |
PART I
| | | | | |
| Item 1. | Financial Statements |
Statements of Unaudited Condensed Consolidated Financial Position
Cleveland-Cliffs Inc. and Subsidiaries
| | | (In Millions) | | (In Millions) |
| | March 31,
2021 | | December 31,
2020 | | September 30,
2021 | | December 31,
2020 |
| ASSETS | ASSETS | | | | ASSETS | | | |
| Current assets: | Current assets: | | Current assets: | |
| Cash and cash equivalents | Cash and cash equivalents | $ | 110 | | | $ | 112 | | Cash and cash equivalents | $ | 42 | | | $ | 112 | |
| Accounts receivable, net | Accounts receivable, net | 1,659 | | | 1,169 | | Accounts receivable, net | 2,348 | | | 1,169 | |
| Inventories | Inventories | 3,932 | | | 3,828 | | Inventories | 4,505 | | | 3,828 | |
| Other current assets | Other current assets | 160 | | | 189 | | Other current assets | 251 | | | 189 | |
| Total current assets | Total current assets | 5,861 | | | 5,298 | | Total current assets | 7,146 | | | 5,298 | |
| Non-current assets: | Non-current assets: | | Non-current assets: | |
| Property, plant and equipment, net | Property, plant and equipment, net | 9,014 | | | 8,743 | | Property, plant and equipment, net | 8,974 | | | 8,743 | |
| Goodwill | Goodwill | 994 | | | 1,406 | | Goodwill | 1,072 | | | 1,406 | |
| Deferred income taxes | Deferred income taxes | 562 | | | 537 | | Deferred income taxes | 70 | | | 537 | |
| Other non-current assets | Other non-current assets | 784 | | | 787 | | Other non-current assets | 804 | | | 787 | |
| TOTAL ASSETS | TOTAL ASSETS | $ | 17,215 | | | $ | 16,771 | | TOTAL ASSETS | $ | 18,066 | | | $ | 16,771 | |
| LIABILITIES AND EQUITY | LIABILITIES AND EQUITY | | | | LIABILITIES AND EQUITY | | | |
| Current liabilities: | Current liabilities: | | Current liabilities: | |
| Accounts payable | Accounts payable | $ | 1,743 | | | $ | 1,575 | | Accounts payable | $ | 1,828 | | | $ | 1,575 | |
| Accrued employment costs | Accrued employment costs | 465 | | | 460 | | Accrued employment costs | 592 | | | 460 | |
| Pension and OPEB liabilities, current | Pension and OPEB liabilities, current | 151 | | | 151 | | Pension and OPEB liabilities, current | 151 | | | 151 | |
| Other current liabilities | Other current liabilities | 574 | | | 743 | | Other current liabilities | 708 | | | 743 | |
| Total current liabilities | Total current liabilities | 2,933 | | | 2,929 | | Total current liabilities | 3,279 | | | 2,929 | |
| Non-current liabilities: | Non-current liabilities: | | Non-current liabilities: | |
| Long-term debt | Long-term debt | 5,734 | | | 5,390 | | Long-term debt | 5,350 | | | 5,390 | |
| Pension and OPEB liabilities, non-current | Pension and OPEB liabilities, non-current | 3,916 | | | 4,113 | | Pension and OPEB liabilities, non-current | 3,773 | | | 4,113 | |
| Other non-current liabilities | Other non-current liabilities | 1,175 | | | 1,260 | | Other non-current liabilities | 1,374 | | | 1,260 | |
| TOTAL LIABILITIES | TOTAL LIABILITIES | 13,758 | | | 13,692 | | TOTAL LIABILITIES | 13,776 | | | 13,692 | |
| Commitments and contingencies (See Note 18) | Commitments and contingencies (See Note 18) | 0 | | 0 | Commitments and contingencies (See Note 18) | 0 | | 0 |
| Series B Participating Redeemable Preferred Stock - 0 par value | | |
| Authorized, Issued and Outstanding - 583,273 shares | 738 | | | 738 | | |
| Series B Participating Redeemable Preferred Stock - no par value | | Series B Participating Redeemable Preferred Stock - no par value | |
| Authorized, Issued and Outstanding - no shares (2020 - 583,273 shares) | | Authorized, Issued and Outstanding - no shares (2020 - 583,273 shares) | — | | | 738 | |
| Equity: | Equity: | | Equity: | |
| Common shares - par value $0.125 per share | Common shares - par value $0.125 per share | | Common shares - par value $0.125 per share | |
| Authorized - 600,000,000 shares (2020 - 600,000,000 shares); | | |
| Authorized - 1,200,000,000 shares (2020 - 600,000,000 shares); | | Authorized - 1,200,000,000 shares (2020 - 600,000,000 shares); | |
| Issued - 506,832,537 shares (2020 - 506,832,537 shares); | Issued - 506,832,537 shares (2020 - 506,832,537 shares); | | Issued - 506,832,537 shares (2020 - 506,832,537 shares); | |
| Outstanding - 499,214,434 shares (2020 - 477,517,372 shares) | 63 | | | 63 | | |
| Outstanding - 500,055,941 shares (2020 - 477,517,372 shares) | | Outstanding - 500,055,941 shares (2020 - 477,517,372 shares) | 63 | | | 63 | |
| Capital in excess of par value of shares | Capital in excess of par value of shares | 5,487 | | | 5,431 | | Capital in excess of par value of shares | 4,887 | | | 5,431 | |
| Retained deficit | Retained deficit | (2,948) | | | (2,989) | | Retained deficit | (894) | | | (2,989) | |
| Cost of 7,618,103 common shares in treasury (2020 - 29,315,165 shares) | (93) | | | (354) | | |
| Accumulated other comprehensive loss | (120) | | | (133) | | |
| Cost of 6,776,596 common shares in treasury (2020 - 29,315,165 shares) | | Cost of 6,776,596 common shares in treasury (2020 - 29,315,165 shares) | (83) | | | (354) | |
| Accumulated other comprehensive income (loss) | | Accumulated other comprehensive income (loss) | 23 | | | (133) | |
| Total Cliffs shareholders' equity | Total Cliffs shareholders' equity | 2,389 | | | 2,018 | | Total Cliffs shareholders' equity | 3,996 | | | 2,018 | |
| Noncontrolling interest | Noncontrolling interest | 330 | | | 323 | | Noncontrolling interest | 294 | | | 323 | |
| TOTAL EQUITY | TOTAL EQUITY | 2,719 | | | 2,341 | | TOTAL EQUITY | 4,290 | | | 2,341 | |
| TOTAL LIABILITIES, REDEEMABLE PREFERRED STOCK AND EQUITY | TOTAL LIABILITIES, REDEEMABLE PREFERRED STOCK AND EQUITY | $ | 17,215 | | | $ | 16,771 | | TOTAL LIABILITIES, REDEEMABLE PREFERRED STOCK AND EQUITY | $ | 18,066 | | | $ | 16,771 | |
The accompanying notes are an integral part of these unaudited condensed consolidated financial statements.
Statements of Unaudited Condensed Consolidated Operations
Cleveland-Cliffs Inc. and Subsidiaries
| | | | (In Millions, Except Per Share Amounts) | | (In Millions, Except Per Share Amounts) |
| | | Three Months Ended
March 31, | | Three Months Ended
September 30, | | Nine Months Ended
September 30, |
| | | 2021 | | 2020 | | 2021 | | 2020 | | 2021 | | 2020 |
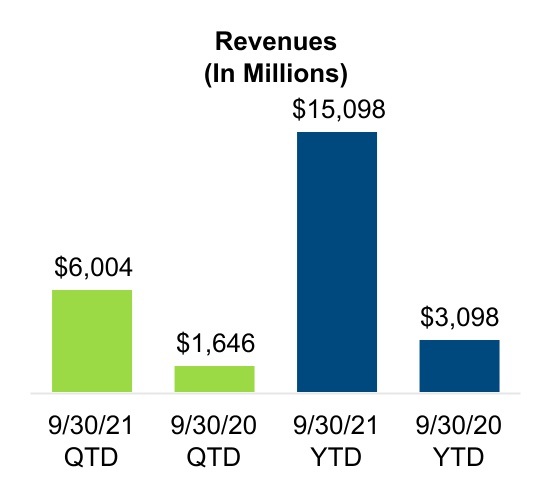
| Revenues | Revenues | | $ | 4,049 | | | $ | 359 | | Revenues | $ | 6,004 | | | $ | 1,646 | | | $ | 15,098 | | | $ | 3,098 | |
| Operating costs: | Operating costs: | | | Operating costs: | |
| Cost of goods sold | Cost of goods sold | | (3,761) | | | (356) | | Cost of goods sold | (4,229) | | | (1,525) | | | (11,838) | | | (3,089) | |
| Selling, general and administrative expenses | Selling, general and administrative expenses | | (95) | | | (28) | | Selling, general and administrative expenses | (112) | | | (59) | | | (311) | | | (149) | |
| Acquisition-related costs | Acquisition-related costs | | (13) | | | (42) | | Acquisition-related costs | (4) | | | (7) | | | (18) | | | (68) | |
| Miscellaneous – net | Miscellaneous – net | | (3) | | | (12) | | Miscellaneous – net | (10) | | | (17) | | | (38) | | | (41) | |
| Total operating costs | Total operating costs | | (3,872) | | | (438) | | Total operating costs | (4,355) | | | (1,608) | | | (12,205) | | | (3,347) | |
| Operating income (loss) | Operating income (loss) | | 177 | | | (79) | | Operating income (loss) | 1,649 | | | 38 | | | 2,893 | | | (249) | |
| Other income (expense): | Other income (expense): | | | Other income (expense): | |
| Interest expense, net | Interest expense, net | | (92) | | | (31) | | Interest expense, net | (81) | | | (68) | | | (258) | | | (168) | |
| Gain (loss) on extinguishment of debt | Gain (loss) on extinguishment of debt | | (66) | | | 3 | | Gain (loss) on extinguishment of debt | — | | | — | | | (88) | | | 133 | |
| Net periodic benefit credits other than service cost component | Net periodic benefit credits other than service cost component | | 47 | | | 6 | | Net periodic benefit credits other than service cost component | 46 | | | 9 | | | 139 | | | 30 | |
| | Other non-operating income | | Other non-operating income | 1 | | | 1 | | | 5 | | | 1 | |
| Total other expense | Total other expense | | (111) | | | (22) | | Total other expense | (34) | | | (58) | | | (202) | | | (4) | |
| Income (loss) from continuing operations before income taxes | Income (loss) from continuing operations before income taxes | | 66 | | | (101) | | Income (loss) from continuing operations before income taxes | 1,615 | | | (20) | | | 2,691 | | | (253) | |
| Income tax benefit (expense) | Income tax benefit (expense) | | (9) | | | 51 | | Income tax benefit (expense) | (334) | | | 22 | | | (559) | | | 98 | |
| Income (loss) from continuing operations | Income (loss) from continuing operations | | 57 | | | (50) | | Income (loss) from continuing operations | 1,281 | | | 2 | | | 2,132 | | | (155) | |
| Income from discontinued operations, net of tax | Income from discontinued operations, net of tax | | 0 | | | 1 | | Income from discontinued operations, net of tax | 1 | | | — | | | 2 | | | — | |
| Net income (loss) | Net income (loss) | | 57 | | | (49) | | Net income (loss) | 1,282 | | | 2 | | | 2,134 | | | (155) | |
| Income attributable to noncontrolling interest | Income attributable to noncontrolling interest | | (16) | | | (3) | | Income attributable to noncontrolling interest | (8) | | | (12) | | | (39) | | | (31) | |
| Net income (loss) attributable to Cliffs shareholders | Net income (loss) attributable to Cliffs shareholders | | $ | 41 | | | $ | (52) | | Net income (loss) attributable to Cliffs shareholders | $ | 1,274 | | | $ | (10) | | | $ | 2,095 | | | $ | (186) | |
| | Earnings (loss) per common share attributable to Cliffs shareholders - basic | Earnings (loss) per common share attributable to Cliffs shareholders - basic | | | Earnings (loss) per common share attributable to Cliffs shareholders - basic | |
| Continuing operations | Continuing operations | | $ | 0.08 | | | $ | (0.18) | | Continuing operations | $ | 2.46 | | | $ | (0.02) | | | $ | 3.87 | | | $ | (0.51) | |
| Discontinued operations | Discontinued operations | | 0 | | | 0 | | Discontinued operations | — | | | — | | | — | | | — | |
| | | $ | 0.08 | | | $ | (0.18) | | | $ | 2.46 | | | $ | (0.02) | | | $ | 3.87 | | | $ | (0.51) | |
| Earnings (loss) per common share attributable to Cliffs shareholders - diluted | Earnings (loss) per common share attributable to Cliffs shareholders - diluted | | | | | Earnings (loss) per common share attributable to Cliffs shareholders - diluted | | | | | | | |
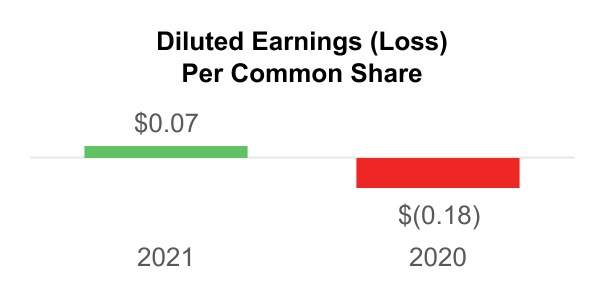
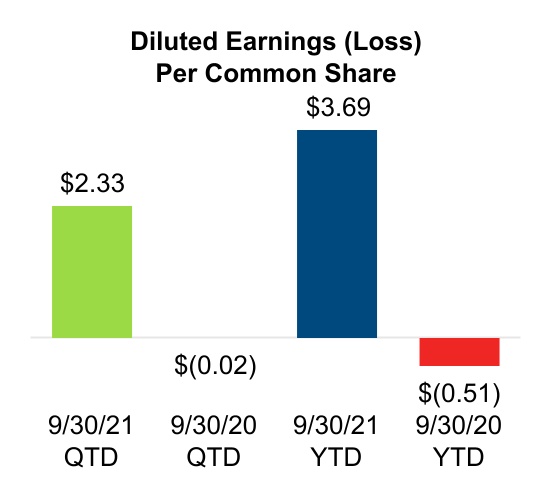
| Continuing operations | Continuing operations | | $ | 0.07 | | | $ | (0.18) | | Continuing operations | $ | 2.33 | | | $ | (0.02) | | | $ | 3.69 | | | $ | (0.51) | |
| Discontinued operations | Discontinued operations | | 0 | | | 0 | | Discontinued operations | — | | | — | | | — | | | — | |
| | | $ | 0.07 | | | $ | (0.18) | | | $ | 2.33 | | | $ | (0.02) | | | $ | 3.69 | | | $ | (0.51) | |
The accompanying notes are an integral part of these unaudited condensed consolidated financial statements.
Statements of Unaudited Condensed Consolidated Comprehensive Income (Loss)
Cleveland-Cliffs Inc. and Subsidiaries
| | | | (In Millions) | | (In Millions) |
| | | Three Months Ended
March 31, | | Three Months Ended
September 30, | | Nine Months Ended
September 30, |
| | | 2021 | | 2020 | | 2021 | | 2020 | | 2021 | | 2020 |
| Net income (loss) | Net income (loss) | | $ | 57 | | | $ | (49) | | Net income (loss) | $ | 1,282 | | | $ | 2 | | | $ | 2,134 | | | $ | (155) | |
| Other comprehensive income (loss): | Other comprehensive income (loss): | | | Other comprehensive income (loss): | |
| Changes in pension and OPEB, net of tax | Changes in pension and OPEB, net of tax | | 7 | | | 6 | | Changes in pension and OPEB, net of tax | 6 | | | 6 | | | 20 | | | 18 | |
| Changes in foreign currency translation | Changes in foreign currency translation | | (1) | | | (1) | | Changes in foreign currency translation | — | | | 2 | | | (1) | | | 2 | |
| Changes in derivative financial instruments, net of tax | Changes in derivative financial instruments, net of tax | | 7 | | | (3) | | Changes in derivative financial instruments, net of tax | 83 | | | 16 | | | 137 | | | 17 | |
| Total other comprehensive income | Total other comprehensive income | | 13 | | | 2 | | Total other comprehensive income | 89 | | | 24 | | | 156 | | | 37 | |
| Comprehensive income (loss) | Comprehensive income (loss) | | 70 | | | (47) | | Comprehensive income (loss) | 1,371 | | | 26 | | | 2,290 | | | (118) | |
| Comprehensive income attributable to noncontrolling interests | Comprehensive income attributable to noncontrolling interests | | (16) | | | (3) | | Comprehensive income attributable to noncontrolling interests | (8) | | | (12) | | | (39) | | | (31) | |
| Comprehensive income (loss) attributable to Cliffs shareholders | Comprehensive income (loss) attributable to Cliffs shareholders | | $ | 54 | | | $ | (50) | | Comprehensive income (loss) attributable to Cliffs shareholders | $ | 1,363 | | | $ | 14 | | | $ | 2,251 | | | $ | (149) | |
The accompanying notes are an integral part of these unaudited condensed consolidated financial statements.
Statements of Unaudited Condensed Consolidated Cash Flows
Cleveland-Cliffs Inc. and Subsidiaries
| | | (In Millions) | | (In Millions) |
| | Three Months Ended
March 31, | | Nine Months Ended
September 30, |
| | 2021 | | 2020 | | 2021 | | 2020 |
| OPERATING ACTIVITIES | OPERATING ACTIVITIES | | | | OPERATING ACTIVITIES | | | |
| Net income (loss) | Net income (loss) | $ | 57 | | | $ | (49) | | Net income (loss) | $ | 2,134 | | | $ | (155) | |
| Adjustments to reconcile net income (loss) to net cash used by operating activities: | | |
| Adjustments to reconcile net income (loss) to net cash provided (used) by operating activities: | | Adjustments to reconcile net income (loss) to net cash provided (used) by operating activities: | |
| Depreciation, depletion and amortization | Depreciation, depletion and amortization | 217 | | | 35 | | Depreciation, depletion and amortization | 664 | | | 184 | |
| Amortization of inventory step-up | Amortization of inventory step-up | 81 | | | 23 | | Amortization of inventory step-up | 129 | | | 74 | |
| Changes in deferred revenue | Changes in deferred revenue | (3) | | | (48) | | Changes in deferred revenue | 1 | | | (46) | |
| Deferred income taxes | Deferred income taxes | 10 | | | (48) | | Deferred income taxes | 557 | | | (90) | |
| Pension and OPEB credits | | Pension and OPEB credits | (59) | | | (11) | |
| Loss (gain) on extinguishment of debt | Loss (gain) on extinguishment of debt | 66 | | | (3) | | Loss (gain) on extinguishment of debt | 88 | | | (133) | |
| Gain on derivatives | | Gain on derivatives | — | | | (19) | |
| Other | Other | (2) | | | 51 | | Other | 79 | | | 47 | |
| Changes in operating assets and liabilities, net of business combination: | Changes in operating assets and liabilities, net of business combination: | | Changes in operating assets and liabilities, net of business combination: | |
| Receivables and other assets | Receivables and other assets | (480) | | | 254 | | Receivables and other assets | (1,175) | | | 260 | |
| Inventories | Inventories | (172) | | | (267) | | Inventories | (793) | | | (4) | |
| Pension and OPEB payments and contributions | Pension and OPEB payments and contributions | (175) | | | (13) | | Pension and OPEB payments and contributions | (279) | | | (31) | |
| Payables, accrued expenses and other liabilities | Payables, accrued expenses and other liabilities | 22 | | | (99) | | Payables, accrued expenses and other liabilities | 302 | | | (127) | |
| Net cash used by operating activities | (379) | | | (164) | | |
| Net cash provided (used) by operating activities | | Net cash provided (used) by operating activities | 1,648 | | | (51) | |
| INVESTING ACTIVITIES | INVESTING ACTIVITIES | | INVESTING ACTIVITIES | |
| Purchase of property, plant and equipment | Purchase of property, plant and equipment | (136) | | | (138) | | Purchase of property, plant and equipment | (473) | | | (379) | |
| Acquisition of AK Steel, net of cash acquired | Acquisition of AK Steel, net of cash acquired | 0 | | | (869) | | Acquisition of AK Steel, net of cash acquired | — | | | (869) | |
| Acquisition of ArcelorMittal USA, net of cash acquired | | Acquisition of ArcelorMittal USA, net of cash acquired | 54 | | | — | |
| Other investing activities | Other investing activities | 1 | | | 0 | | Other investing activities | 5 | | | 8 | |
| Net cash used by investing activities | Net cash used by investing activities | (135) | | | (1,007) | | Net cash used by investing activities | (414) | | | (1,240) | |
| FINANCING ACTIVITIES | FINANCING ACTIVITIES | | FINANCING ACTIVITIES | |
| Series B Redeemable Preferred Stock redemption | | Series B Redeemable Preferred Stock redemption | (1,343) | | | — | |
| Proceeds from issuance of common shares | Proceeds from issuance of common shares | 322 | | | 0 | | Proceeds from issuance of common shares | 322 | | | — | |
| Proceeds from issuance of debt | Proceeds from issuance of debt | 1,000 | | | 716 | | Proceeds from issuance of debt | 1,000 | | | 1,763 | |
| Debt issuance costs | Debt issuance costs | (16) | | | (44) | | Debt issuance costs | (17) | | | (58) | |
| Repayments of debt | Repayments of debt | (902) | | | (430) | | Repayments of debt | (1,346) | | | (1,000) | |
| Borrowings under credit facilities | Borrowings under credit facilities | 1,158 | | | 800 | | Borrowings under credit facilities | 4,353 | | | 800 | |
| Repayments under credit facilities | Repayments under credit facilities | (1,010) | | | 0 | | Repayments under credit facilities | (4,160) | | | (400) | |
| | Repayments of leased liabilities | | Repayments of leased liabilities | (70) | | | (9) | |
| SunCoke Middletown distributions to noncontrolling interest owners | | SunCoke Middletown distributions to noncontrolling interest owners | (57) | | | (48) | |
| Other financing activities | Other financing activities | (40) | | | (37) | | Other financing activities | 14 | | | (54) | |
| Net cash provided by financing activities | 512 | | | 1,005 | | |
| Net cash provided (used) by financing activities | | Net cash provided (used) by financing activities | (1,304) | | | 994 | |
| Net decrease in cash and cash equivalents | Net decrease in cash and cash equivalents | (2) | | | (166) | | Net decrease in cash and cash equivalents | (70) | | | (297) | |
| Cash and cash equivalents at beginning of period | Cash and cash equivalents at beginning of period | 112 | | | 353 | | Cash and cash equivalents at beginning of period | 112 | | | 353 | |
| Cash and cash equivalents at end of period | Cash and cash equivalents at end of period | $ | 110 | | | $ | 187 | | Cash and cash equivalents at end of period | $ | 42 | | | $ | 56 | |
The accompanying notes are an integral part of these unaudited condensed consolidated financial statements.
Statements of Unaudited Condensed Consolidated Changes in Equity
Cleveland-Cliffs Inc. and Subsidiaries
| | | (In Millions) | | (In Millions) |
| | Number
of
Common
Shares Outstanding | | Par Value of
Common
Shares Issued | | Capital in
Excess of
Par Value
of Shares | | Retained
Deficit | | Common
Shares
in
Treasury | | AOCI | | Non-controlling Interests | | Total | | Number
of
Common
Shares Outstanding | | Par Value of
Common
Shares Issued | | Capital in
Excess of
Par Value
of Shares | | Retained
Deficit | | Common
Shares
in
Treasury | | AOCI | | Non-controlling Interests | | Total |
| December 31, 2020 | December 31, 2020 | 478 | | | $ | 63 | | | $ | 5,431 | | | $ | (2,989) | | | $ | (354) | | | $ | (133) | | | $ | 323 | | | $ | 2,341 | | December 31, 2020 | 478 | | | $ | 63 | | | $ | 5,431 | | | $ | (2,989) | | | $ | (354) | | | $ | (133) | | | $ | 323 | | | $ | 2,341 | |
| Comprehensive income | Comprehensive income | — | | | — | | | — | | | 41 | | | — | | | 13 | | | 16 | | | 70 | | Comprehensive income | — | | | — | | | — | | | 41 | | | — | | | 13 | | | 16 | | | 70 | |
| Issuance of common stock | Issuance of common stock | 20 | | | 0 | | | 78 | | | — | | | 244 | | | — | | | — | | | 322 | | Issuance of common stock | 20 | | | — | | | 78 | | | — | | | 244 | | | — | | | — | | | 322 | |
| Stock and other incentive plans | Stock and other incentive plans | 1 | | | — | | | (22) | | | — | | | 17 | | | — | | | — | | | (5) | | Stock and other incentive plans | 1 | | | — | | | (22) | | | — | | | 17 | | | — | | | — | | | (5) | |
| Acquisition of ArcelorMittal USA - Measurement period adjustments | Acquisition of ArcelorMittal USA - Measurement period adjustments | — | | | — | | | — | | | — | | | — | | | — | | | (1) | | | (1) | | Acquisition of ArcelorMittal USA - Measurement period adjustments | — | | | — | | | — | | | — | | | — | | | — | | | (1) | | | (1) | |
| Net distributions to noncontrolling interests | Net distributions to noncontrolling interests | — | | | — | | | — | | | — | | | — | | | — | | | (8) | | | (8) | | Net distributions to noncontrolling interests | — | | | — | | | — | | | — | | | — | | | — | | | (8) | | | (8) | |
| March 31, 2021 | March 31, 2021 | 499 | | | $ | 63 | | | $ | 5,487 | | | $ | (2,948) | | | $ | (93) | | | $ | (120) | | | $ | 330 | | | $ | 2,719 | | March 31, 2021 | 499 | | | $ | 63 | | | $ | 5,487 | | | $ | (2,948) | | | $ | (93) | | | $ | (120) | | | $ | 330 | | | $ | 2,719 | |
| | Comprehensive income | | Comprehensive income | — | | | — | | | — | | | 780 | | | — | | | 54 | | | 15 | | | 849 | |
| Stock and other incentive plans | | Stock and other incentive plans | 1 | | | — | | | 4 | | | — | | | 6 | | | — | | | — | | | 10 | |
| Acquisition of ArcelorMittal USA - Measurement period adjustments | | Acquisition of ArcelorMittal USA - Measurement period adjustments | — | | | — | | | — | | | — | | | — | | | — | | | (13) | | | (13) | |
| Net distributions to noncontrolling interests | | Net distributions to noncontrolling interests | — | | | — | | | — | | | — | | | — | | | — | | | (24) | | | (24) | |
| June 30, 2021 | | June 30, 2021 | 500 | | | $ | 63 | | | $ | 5,491 | | | $ | (2,168) | | | $ | (87) | | | $ | (66) | | | $ | 308 | | | $ | 3,541 | |
| Comprehensive income | | Comprehensive income | — | | | — | | | — | | | 1,274 | | | — | | | 89 | | | 8 | | | 1,371 | |
| Stock and other incentive plans | | Stock and other incentive plans | — | | | — | | | 5 | | | — | | | 4 | | | — | | | — | | | 9 | |
| Series B Redeemable Preferred Stock redemption | | Series B Redeemable Preferred Stock redemption | — | | | — | | | (605) | | | — | | | — | | | — | | | — | | | (605) | |
| 1.500% 2025 Convertible Notes repurchase | | 1.500% 2025 Convertible Notes repurchase | — | | | — | | | (4) | | | — | | | — | | | — | | | — | | | (4) | |
| Net distributions to noncontrolling interests | | Net distributions to noncontrolling interests | — | | | — | | | — | | | — | | | — | | | — | | | (22) | | | (22) | |
| September 30, 2021 | | September 30, 2021 | 500 | | | $ | 63 | | | $ | 4,887 | | | $ | (894) | | | $ | (83) | | | $ | 23 | | | $ | 294 | | | $ | 4,290 | |
| | | (In Millions) | | (In Millions) |
| | Number
of
Common
Shares Outstanding | | Par Value of Common
Shares Issued | | Capital in
Excess of
Par Value
of Shares | | Retained
Deficit | | Common
Shares
in
Treasury | | AOCI | | Non-controlling Interests | | Total | | Number
of
Common
Shares Outstanding | | Par Value of Common
Shares Issued | | Capital in
Excess of
Par Value
of Shares | | Retained
Deficit | | Common
Shares
in
Treasury | | AOCI | | Non-controlling Interests | | Total |
| December 31, 2019 | December 31, 2019 | 271 | | | $ | 37 | | | $ | 3,873 | | | $ | (2,842) | | | $ | (391) | | | $ | (319) | | | $ | 0 | | | $ | 358 | | December 31, 2019 | 271 | | | $ | 37 | | | $ | 3,873 | | | $ | (2,842) | | | $ | (391) | | | $ | (319) | | | $ | — | | | $ | 358 | |
| Comprehensive income (loss) | Comprehensive income (loss) | — | | | — | | | — | | | (52) | | | — | | | 2 | | | 3 | | | (47) | | Comprehensive income (loss) | — | | | — | | | — | | | (52) | | | — | | | 2 | | | 3 | | | (47) | |
| Stock and other incentive plans | Stock and other incentive plans | 1 | | | — | | | (24) | | | — | | | 26 | | | — | | | — | | | 2 | | Stock and other incentive plans | 1 | | | — | | | (24) | | | — | | | 26 | | | — | | | — | | | 2 | |
| Acquisition of AK Steel | Acquisition of AK Steel | 127 | | | 16 | | | 602 | | | — | | | — | | | — | | | 330 | | | 948 | | Acquisition of AK Steel | 127 | | | 16 | | | 602 | | | — | | | — | | | — | | | 330 | | | 948 | |
| Common stock dividends ($0.06 per share) | Common stock dividends ($0.06 per share) | — | | | — | | | — | | | (24) | | | — | | | — | | | — | | | (24) | | Common stock dividends ($0.06 per share) | — | | | — | | | — | | | (24) | | | — | | | — | | | — | | | (24) | |
| Net distributions to noncontrolling interests | Net distributions to noncontrolling interests | — | | | — | | | — | | | — | | | — | | | — | | | (6) | | | (6) | | Net distributions to noncontrolling interests | — | | | — | | | — | | | — | | | — | | | — | | | (6) | | | (6) | |
| March 31, 2020 | March 31, 2020 | 399 | | | $ | 53 | | | $ | 4,451 | | | $ | (2,918) | | | $ | (365) | | | $ | (317) | | | $ | 327 | | | $ | 1,231 | | March 31, 2020 | 399 | | | $ | 53 | | | $ | 4,451 | | | $ | (2,918) | | | $ | (365) | | | $ | (317) | | | $ | 327 | | | $ | 1,231 | |
| | Comprehensive income (loss) | | Comprehensive income (loss) | — | | | — | | | — | | | (124) | | | — | | | 11 | | | 16 | | | (97) | |
| Stock and other incentive plans | | Stock and other incentive plans | — | | | — | | | (7) | | | — | | | 9 | | | — | | | — | | | 2 | |
| Net distributions to noncontrolling interests | | Net distributions to noncontrolling interests | — | | | — | | | — | | | — | | | — | | | — | | | (18) | | | (18) | |
| June 30, 2020 | | June 30, 2020 | 399 | | | $ | 53 | | | $ | 4,444 | | | $ | (3,042) | | | $ | (356) | | | $ | (306) | | | $ | 325 | | | $ | 1,118 | |
| Comprehensive income (loss) | | Comprehensive income (loss) | — | | | — | | | — | | | (10) | | | — | | | 24 | | | 12 | | 26 | |
| Stock and other incentive plans | | Stock and other incentive plans | — | | | — | | | 3 | | | — | | | 1 | | | — | | | — | | | 4 | |
| Net distributions to noncontrolling interests | | Net distributions to noncontrolling interests | — | | | — | | | — | | | — | | | — | | | — | | | (24) | | | (24) | |
| September 30, 2020 | | September 30, 2020 | 399 | | | $ | 53 | | | $ | 4,447 | | | $ | (3,052) | | | $ | (355) | | | $ | (282) | | | $ | 313 | | | $ | 1,124 | |
The accompanying notes are an integral part of these unaudited condensed consolidated financial statements.
Notes to Unaudited Condensed Consolidated Financial Statements
Cleveland-Cliffs Inc. and Subsidiaries
NOTE 1 - BASIS OF PRESENTATION AND SIGNIFICANT ACCOUNTING POLICIES
Business, Consolidation and Presentation
The accompanying unaudited condensed consolidated financial statements have been prepared in accordance with SEC rules and regulations and, in the opinion of management, include all adjustments (consisting of normal recurring adjustments) necessary to present fairly the financial position, results of operations, comprehensive income (loss), cash flows and changes in equity for the periods presented. The preparation of financial statements in conformity with GAAP requires management to make estimates and assumptions that affect the amounts reported in the financial statements and accompanying notes. Management bases its estimates on various assumptions and historical experience, which are believed to be reasonable; however, due to the inherent nature of estimates, actual results may differ significantly due to changed conditions or assumptions. The results of operations for the three and nine months ended March 31,September 30, 2021 are not necessarily indicative of results to be expected for the year ending December 31, 2021 or any other future period. These unaudited condensed consolidated financial statements should be read in conjunction with the financial statements and notes included in our Annual Report on Form 10-K for the year ended December 31, 2020.2020 and in our Quarterly Reports on Form 10-Q for the quarterly periods ended June 30, 2021 and March 31, 2021.
Proposed FPT Acquisition
On October 8, 2021, we entered into the FPT Acquisition Agreement, pursuant to which Cliffs will acquire FPT for an aggregate purchase price of $775 million, on a cash-free, debt-free basis and subject to customary adjustment. We expect to complete the FPT Acquisition in the fourth quarter of 2021. Completion of the FPT Acquisition is subject to various customary closing conditions, including the receipt of required regulatory approvals, including the expiration or termination of the waiting period under the Hart-Scott-Rodino Act, and it is possible factors outside of our control could result in the FPT Acquisition being completed at a later time or not at all. The FPT Acquisition Agreement also contains certain termination rights that may be exercised by either party. We plan to complete the FPT Acquisition as soon as reasonably practicable following the satisfaction or waiver of all applicable conditions.
Business Operations
We are vertically integrated from the mining of iron ore and coal; to production of metallics and coke; through iron making, steelmaking, rolling and finishing; and to downstream tubular components, stamping and tooling. We have the unique advantage as a steel producer of being fully or partially self-sufficient with our production of raw materials for steel manufacturing, which includes iron ore pellets, HBI and coking coal.
We are organized into four4 operating segments based on differentiated products, Steelmaking, Tubular, Tooling and Stamping, and European Operations. We primarily operate through one1 reportable segment – the Steelmaking segment.
Basis of Consolidation
The unaudited condensed consolidated financial statements consolidate our accounts and the accounts of our wholly owned subsidiaries, all subsidiaries in which we have a controlling interest and VIEs for which we are the primary beneficiary. All intercompany transactions and balances are eliminated upon consolidation.
Investments in Affiliates
We have investments in several businesses accounted for using the equity method of accounting. We review an investment for impairment when circumstances indicate that a loss in value below its carrying amount is other than temporary.
As of March 31,September 30, 2021 and December 31, 2020, our investment in affiliates of $116 million and $105 million, respectively, was classified in Other non-current assets.
Significant Accounting Policies
A detailed description of our significant accounting policies can be found in the audited financial statements included in our Annual Report on Form 10-K for the year ended December 31, 2020 filed with the SEC. There have been no material changes in our significant accounting policies and estimates from those disclosed therein.
Recent Accounting Pronouncements
Issued and Not Effective
In August 2020, the FASB issued ASU 2020-06, Debt—Debt with Conversion and Other Options (Subtopic 470-20) and Derivatives and Hedging—Contracts in Entity’s Own Equity (Subtopic 815-40). This update requires certain convertible instruments to be accounted for as a single liability measured at its amortized cost. Additionally, the update requires the use of the "if-converted" method, removing the treasury stock method, when calculating diluted shares. The two methods of adoption are the full and modified retrospective approaches. We expect to utilize the modified retrospective approach. Using this approach, the guidance shall be applied to transactions outstanding as of the beginning of the fiscal year in which the amendment is adopted. The final rule is effective for fiscal years beginning after December 15, 2021. Early adoption is permitted for fiscal years beginning after December 15, 2020, including interim periods within those fiscal years. We expect the adoption of this update to decrease our diluted EPSwill add approximately 17 million dilutive shares unless the additional shares under the if-converted method are anti-dilutive. We expect to adopt the update at the required adoption date of January 1, 2022.
NOTE 2 - SUPPLEMENTARY FINANCIAL STATEMENT INFORMATION
Allowance for Credit Losses
The following is a roll forward of our allowance for credit losses associated with Accounts receivable, net:
| | | (In Millions) | | (In Millions) |
| | 2021 | | 2020 | | 2021 | | 2020 |
| Allowance for credit losses as of January 1 | Allowance for credit losses as of January 1 | $ | (5) | | | $ | 0 | | Allowance for credit losses as of January 1 | $ | (5) | | | $ | — | |
| Increase in allowance | Increase in allowance | (1) | | | (1) | | Increase in allowance | — | | | (5) | |
| Allowance for credit losses as of March 31 | $ | (6) | | | $ | (1) | | |
| Allowance for credit losses as of September 30 | | Allowance for credit losses as of September 30 | $ | (5) | | | $ | (5) | |
Inventories
The following table presents the detail of our Inventories in the Statements of Unaudited Condensed Consolidated Financial Position:
| | | (In Millions) | | (In Millions) |
| | March 31,
2021 | | December 31,
2020 | | September 30,
2021 | | December 31,
2020 |
| Product inventories | Product inventories | | | | Product inventories | | | |
| Finished and semi-finished goods | Finished and semi-finished goods | $ | 2,296 | | | $ | 2,125 | | Finished and semi-finished goods | $ | 2,510 | | | $ | 2,125 | |
| Raw materials | Raw materials | 1,372 | | | 1,431 | | Raw materials | 1,711 | | | 1,431 | |
| Total product inventories | Total product inventories | 3,668 | | | 3,556 | | Total product inventories | 4,221 | | | 3,556 | |
| Manufacturing supplies and critical spares | Manufacturing supplies and critical spares | 264 | | | 272 | | Manufacturing supplies and critical spares | 284 | | | 272 | |
| Inventories | Inventories | $ | 3,932 | | | $ | 3,828 | | Inventories | $ | 4,505 | | | $ | 3,828 | |
Cash Flow Information
A reconciliation of capital additions to cash paid for capital expenditures is as follows:
| | | (In Millions) | | (In Millions) |
| | Three Months Ended
March 31, | | Nine Months Ended
September 30, |
| | 2021 | | 2020 | | 2021 | | 2020 |
| Capital additions | Capital additions | $ | 162 | | | $ | 158 | | Capital additions | $ | 572 | | | $ | 333 | |
| Less: | Less: | | Less: | |
| Non-cash accruals | Non-cash accruals | 23 | | | (10) | | Non-cash accruals | 64 | | | (89) | |
| Right-of-use assets - finance leases | Right-of-use assets - finance leases | 3 | | | 30 | | Right-of-use assets - finance leases | 35 | | | 43 | |
| | Cash paid for capital expenditures including deposits | Cash paid for capital expenditures including deposits | $ | 136 | | | $ | 138 | | Cash paid for capital expenditures including deposits | $ | 473 | | | $ | 379 | |
Cash payments (receipts) for income taxes and interest are as follows:
| | | (In Millions) | | (In Millions) |
| | Three Months Ended
March 31, | | Nine Months Ended
September 30, |
| | 2021 | | 2020 | | 2021 | | 2020 |
| Taxes paid on income | Taxes paid on income | $ | 3 | | | $ | 0 | | Taxes paid on income | $ | 38 | | | $ | 3 | |
| Income tax refunds | Income tax refunds | (14) | | | (60) | | Income tax refunds | (15) | | | (119) | |
Interest paid on debt obligations net of capitalized interest1 | Interest paid on debt obligations net of capitalized interest1 | 75 | | | 30 | | Interest paid on debt obligations net of capitalized interest1 | 231 | | | 117 | |
| 1 Capitalized interest was $1 million and $10 million for the three months ended March 31, 2021 and 2020, respectively. | |
1 Capitalized interest was $4 million and $38 million for the nine months ended September 30, 2021 and 2020, respectively. | | 1 Capitalized interest was $4 million and $38 million for the nine months ended September 30, 2021 and 2020, respectively. |
NOTE 3 - ACQUISITIONS
In 2020, we acquired two2 major steelmakers, AK Steel and ArcelorMittal USA, vertically integrating our legacy iron ore business with steel production. Our fully-integrated portfolio includes custom-made pellets and HBI; flat-rolled carbon steel, stainless, electrical, plate, tinplate, slabs and long steel products; and carbon and stainless steel tubing, hot and cold stamping and tooling. The AK Steel Merger combined Cliffs, a producer of iron ore pellets, with AK Steel, a producer of flat-rolled carbon, stainless and electrical steel products, to create a vertically integrated producer of value-added iron ore and steel products. The AM USA Transaction transformed us into a fully-integrated steel enterprise with the size and scale to expand product offerings and improve through-the cyclethrough-the-cycle margins.
We now have a presence across the entire steel manufacturing process, from mining to pelletizing to the development and production of finished high value steel products. The combination is expected to create significant opportunities to generate additional value from market trends across the entire steel value chain and enable more consistent, predictable performance through normal market cycles.
Acquisition of ArcelorMittal USA
Overview
On December 9, 2020, pursuant to the terms of the AM USA Transaction Agreement, we purchased ArcelorMittal USA from ArcelorMittal. In connection with the closing of the AM USA Transaction, as contemplated by the terms of the AM USA Transaction Agreement, ArcelorMittal’s former joint venture partner in Kote and Tek exercised its put right pursuant to the terms of the Kote and Tek joint venture agreements. As a result, we purchased all of such joint venture partner’s interests in Kote and Tek. Following the closing of the AM USA Transaction, we own 100% of the interests in Kote and Tek.
We incurred acquisition-related costs excluding severance costs of $2$1 million and $3 million for the three and nine months ended March 31,September 30, 2021, respectively, which were recorded in Acquisition-related costs on the Statements of Unaudited Condensed Consolidated Operations.
The AM USA Transaction was accounted for under the acquisition method of accounting for business combinations.
The fair value of the total purchase consideration was determined as follows:
| | | | | |
| (In Millions) |
| Fair value of Cliffs common shares issued | $ | 990 | |
| Fair value of Series B Participating Redeemable Preferred Stock issued | 738 | |
| Fair value of settlement of a pre-existing relationship | 237 | |
Cash consideration (subject to customary working capital adjustments) | 635639 | |
| Total purchase consideration | $ | 2,6002,604 | |
The fair value of Cliffs common shares issued iswas calculated as follows:
| | | | | |
| Number of Cliffs common shares issued | 78,186,671 |
| Closing price of Cliffs common share as of December 9, 2020 | $ | 12.66 | |
| Fair value of Cliffs common shares issued (in millions) | $ | 990 | |
The fair value of Cliffs Series B Participating Redeemable Preferred Stock issued iswas calculated as follows:
| | | | | |
| Number of Cliffs Series B Participating Redeemable Preferred Stock issued | 583,273 | |
| Redemption price per share as of December 9, 2020 | $ | 1,266 | |
| Fair value of Cliffs Series B Participating Redeemable Preferred Stock issued (in millions) | $ | 738 | |
The fair value of the estimated cash consideration iswas comprised of the following:
| | | | | |
| (In Millions) |
| Cash consideration pursuant to the AM USA Transaction Agreement | $ | 505 | |
| Cash consideration for purchase of the remaining JV partner's interest of Kote and Tek | 182 | |
Estimated totalTotal cash consideration receivable | (52)(48) | |
Total estimated cash consideration | $ | 635639 | |
The cash portion of the purchase price iswas subject to customary working capital adjustments.adjustments, and the working capital adjustments were finalized during the second quarter of 2021. We made certain elections under Section 338(h)(10) of the Internal Revenue Code of 1986, as amended, which did not change the final cash consideration.
The fair value of the settlement of a pre-existing relationship iswas comprised of the following:
| | | | | |
| (In Millions) |
| Accounts receivable | $ | 97 | |
| Freestanding derivative asset from customer supply agreement | 140 | |
| Total fair value of settlement of a pre-existing relationship | $ | 237 | |
Valuation Assumption and Preliminary Purchase Price Allocation
We estimated fair values at December 9, 2020 for the preliminary allocation of consideration to the net tangible and intangible assets acquired and liabilities assumed in connection with the AM USA Transaction. During the measurement period, we will continue to obtain information to assist in finalizing the fair value of assets acquired and liabilities assumed, which may differ materially from these preliminary estimates. If we determine any measurement period adjustments are material, we will apply those adjustments, including any related impacts to net income, in the reporting period in which the adjustments are determined. We are in the process of conducting a valuation of the assets acquired and liabilities assumed related to the AM USA Transaction, most notably, inventories, personal and real property, mineral reserves, leases, investments, deferred taxes, asset retirement obligations and the final allocation will be made when completed, including the result of any identified goodwill. Accordingly, the provisional measurements noted below are preliminary and subject to modification in the future.
The preliminary purchase price allocation to assets acquired and liabilities assumed in the AM USA Transaction was:
| | | (In Millions) | | (In Millions) |
| | Initial Allocation of Consideration | | Measurement Period Adjustments | | Updated Allocation | | Initial Allocation of Consideration | | Measurement Period Adjustments | | Updated Allocation |
| Cash and cash equivalents | Cash and cash equivalents | $ | 35 | | | $ | 0 | | | $ | 35 | | Cash and cash equivalents | $ | 35 | | | $ | — | | | $ | 35 | |
| Accounts receivable, net | Accounts receivable, net | 349 | | | 0 | | | 349 | | Accounts receivable, net | 349 | | | (5) | | | 344 | |
| Inventories | Inventories | 2,115 | | | 14 | | | 2,129 | | Inventories | 2,115 | | | 14 | | | 2,129 | |
| Other current assets | Other current assets | 34 | | | (5) | | | 29 | | Other current assets | 34 | | | (1) | | | 33 | |
| Property, plant and equipment | Property, plant and equipment | 4,017 | | | 366 | | | 4,383 | | Property, plant and equipment | 4,017 | | | 372 | | | 4,389 | |
| Other non-current assets | Other non-current assets | 158 | | | 8 | | | 166 | | Other non-current assets | 158 | | | 7 | | | 165 | |
| Accounts payable | Accounts payable | (758) | | | 2 | | | (756) | | Accounts payable | (758) | | | 27 | | | (731) | |
| Accrued employment costs | Accrued employment costs | (271) | | | (3) | | | (274) | | Accrued employment costs | (271) | | | 4 | | | (267) | |
| Pension and OPEB liabilities, current | Pension and OPEB liabilities, current | (109) | | | 0 | | | (109) | | Pension and OPEB liabilities, current | (109) | | | — | | | (109) | |
| Other current liabilities | Other current liabilities | (398) | | | (2) | | | (400) | | Other current liabilities | (398) | | | (8) | | | (406) | |
| Pension and OPEB liabilities, non-current | Pension and OPEB liabilities, non-current | (3,195) | | | 0 | | | (3,195) | | Pension and OPEB liabilities, non-current | (3,195) | | | — | | | (3,195) | |
| Other non-current liabilities | Other non-current liabilities | (598) | | | 35 | | | (563) | | Other non-current liabilities | (598) | | | (81) | | | (679) | |
| Noncontrolling interest | Noncontrolling interest | (13) | | | 1 | | | (12) | | Noncontrolling interest | (13) | | | 13 | | | — | |
| Net identifiable assets acquired | Net identifiable assets acquired | 1,366 | | | 416 | | | 1,782 | | Net identifiable assets acquired | 1,366 | | | 342 | | | 1,708 | |
| Goodwill | Goodwill | 1,230 | | | (412) | | | 818 | | Goodwill | 1,230 | | | (334) | | | 896 | |
| Total net assets acquired | Total net assets acquired | $ | 2,596 | | | $ | 4 | | | $ | 2,600 | | Total net assets acquired | $ | 2,596 | | | $ | 8 | | | $ | 2,604 | |
During the period subsequent to the AM USA Transaction, we made certain measurement period adjustments to the acquired assets and liabilities assumed due to clarification of information utilized to determine fair value during the measurement period. The measurement period adjustment related to the revaluation of the Company's previously held equity method investment, which is now being consolidated post-acquisition, resulted in a loss of $18 million, within Miscellaneous – net for the nine months ended September 30, 2021.
The goodwill resulting from the acquisition of ArcelorMittal USA primarily represents the growth opportunities in the automotive, construction, appliances, infrastructure and machinery and equipment markets, as well as any synergistic benefits to be realized from the AM USA Transaction, and was assigned to our flat steel operations within our Steelmaking segment. Goodwill from the AM USA Transaction is expected to be deductible for U.S. federal income tax purposes.
Acquisition of AK Steel
Overview
On March 13, 2020, pursuant to the AK Steel Merger Agreement, we completed the acquisition of AK Steel, in which we were the acquirer. As a result of the AK Steel Merger, each share of AK Steel common stock issued and outstanding immediately prior to the effective time of the AK Steel Merger (other than excluded shares) was converted into the right to receive 0.400 Cliffs common shares and, if applicable, cash in lieu of any fractional Cliffs common shares.
The AK Steel Merger was accounted for under the acquisition method of accounting for business combinations. The acquisition date fair value of the consideration transferred totaled $1,535 million. The following tables summarize the consideration paid for AK Steel and the estimated fair values of the assets acquired and liabilities assumed at the acquisition date.
The fair value of the total purchase consideration was determined as follows:
| | | | | |
| (In Millions) |
| Fair value of AK Steel debt | $ | 914 | |
Fair value of Cliffs common shares issued for AK Steel outstanding common stock1 | 618 | |
Other1 | 3 | |
| Total purchase consideration | $ | 1,535 | |
| |
1 Included as non-cash investing activities in Statementsthe Statement of Unaudited Condensed Consolidated Cash Flows for the threenine months ended March 31,September 30, 2020. |
The fair value of Cliffs common shares issued for outstanding shares of AK Steel common stock and with respect to Cliffs common shares underlying converted AK Steel equity awards that vested upon completion of the AK Steel Merger iswas calculated as follows:
| | | | | |
| (In Millions, Except Per Share Amounts) |
| Number of shares of AK Steel common stock issued and outstanding | 317 | |
| Exchange ratio | 0.400 | |
| Number of Cliffs common shares issued to AK Steel stockholders | 127 | |
| Price per share of Cliffs common shares | $ | 4.87 | |
| Fair value of Cliffs common shares issued for AK Steel outstanding common stock | $ | 618 | |
The fair value of AK Steel's debt included in the consideration iswas calculated as follows:
| | | | | |
| (In Millions) |
| Credit Facility | $ | 590 | |
7.50%7.500% Senior Secured Notes due July 2023 | 324 | |
| Fair value of debt included in consideration | $ | 914 | |
Valuation Assumption and Purchase Price Allocation
The allocation of consideration to the net tangible and intangible assets acquired and liabilities assumed in connection with the AK Steel Merger iswas based on estimated fair values at March 13, 2020, and was finalized during the quarter ended March 31, 2021. The following is a summary of the purchase price allocation to assets acquired and liabilities assumed in the AK Steel Merger:
| | | (In Millions) | | (In Millions) |
| | Initial Allocation of Consideration | | Measurement Period Adjustments | | Final Allocation of Consideration as of March 31, 2021 | | Initial Allocation of Consideration | | Measurement Period Adjustments | | Final Allocation of Consideration as of March 31, 2021 |
| Cash and cash equivalents | Cash and cash equivalents | $ | 38 | | | $ | 1 | | | $ | 39 | | Cash and cash equivalents | $ | 38 | | | $ | 1 | | | $ | 39 | |
| Accounts receivable, net | Accounts receivable, net | 666 | | | (2) | | | 664 | | Accounts receivable, net | 666 | | | (2) | | | 664 | |
| Inventories | Inventories | 1,563 | | | (243) | | | 1,320 | | Inventories | 1,563 | | | (243) | | | 1,320 | |
| Other current assets | Other current assets | 68 | | | (16) | | | 52 | | Other current assets | 68 | | | (16) | | | 52 | |
| Property, plant and equipment | Property, plant and equipment | 2,184 | | | 90 | | | 2,274 | | Property, plant and equipment | 2,184 | | | 90 | | | 2,274 | |
| Deferred income taxes | Deferred income taxes | 0 | | | 69 | | | 69 | | Deferred income taxes | — | | | 69 | | | 69 | |
| Other non-current assets | Other non-current assets | 475 | | | (4) | | | 471 | | Other non-current assets | 475 | | | (4) | | | 471 | |
| Accounts payable | Accounts payable | (636) | | | (8) | | | (644) | | Accounts payable | (636) | | | (8) | | | (644) | |
| Accrued employment costs | Accrued employment costs | (94) | | | 1 | | | (93) | | Accrued employment costs | (94) | | | 1 | | | (93) | |
| Pension and OPEB liabilities, current | Pension and OPEB liabilities, current | (75) | | | (3) | | | (78) | | Pension and OPEB liabilities, current | (75) | | | (3) | | | (78) | |
| Other current liabilities | Other current liabilities | (236) | | | 9 | | | (227) | | Other current liabilities | (236) | | | 9 | | | (227) | |
| Long-term debt | Long-term debt | (1,179) | | | 0 | | | (1,179) | | Long-term debt | (1,179) | | | — | | | (1,179) | |
| Pension and OPEB liabilities, non-current | Pension and OPEB liabilities, non-current | (873) | | | 2 | | | (871) | | Pension and OPEB liabilities, non-current | (873) | | | 2 | | | (871) | |
| Other non-current liabilities | Other non-current liabilities | (507) | | | 72 | | | (435) | | Other non-current liabilities | (507) | | | 72 | | | (435) | |
| Noncontrolling interest | Noncontrolling interest | 0 | | | (1) | | | (1) | | Noncontrolling interest | — | | | (1) | | | (1) | |
| Net identifiable assets acquired | Net identifiable assets acquired | 1,394 | | | (33) | | | 1,361 | | Net identifiable assets acquired | 1,394 | | | (33) | | | 1,361 | |
| Goodwill | Goodwill | 141 | | | 33 | | | 174 | | Goodwill | 141 | | | 33 | | | 174 | |
| Total net assets acquired | Total net assets acquired | $ | 1,535 | | | $ | 0 | | | $ | 1,535 | | Total net assets acquired | $ | 1,535 | | | $ | — | | | $ | 1,535 | |
During the period subsequent to the AK Steel Merger, we made certain measurement period adjustments to the acquired assets and liabilities assumed due to clarification of information utilized to determine fair value during the measurement period.
The goodwill resulting from the acquisition of AK Steel was assigned to our downstream Tubular and Tooling and Stamping operating segments. Goodwill is calculated as the excess of the purchase price over the net identifiable assets recognized and primarily represents the growth opportunities in light weighting solutions to automotive customers, as well as any synergistic benefits to be realized. Goodwill from the AK Steel Merger is not expected to be deductible for income tax purposes.
The purchase price allocated to identifiable intangible assets and liabilities acquired was:
| | | | | | | | | | | |
| (In Millions) | | Weighted Average Life (In Years) |
| Intangible assets: | | | |
| Customer relationships | $ | 77 | | | 18 |
| Developed technology | 60 | | | 17 |
| Trade names and trademarks | 11 | | | 10 |
| Total identifiable intangible assets | $ | 148 | | | 17 |
| Intangible liabilities: | | | |
| Above-market supply contracts | $ | (71) | | | 12 |
The above-market supply contracts relate to the long-term coke and energy supply agreements with SunCoke Energy, which includes SunCoke Middletown, a consolidated VIE. Refer to NOTE 16 - VARIABLE INTEREST ENTITIES for further information.
Pro Forma Results
The following table provides unaudited pro forma financial information, prepared in accordance with Topic 805, for the three and nine months ended March 31,September 30, 2020, as if AK Steel had been acquired as of January 1, 2019:
| | | | | | | | | | | |
| | | | | | | (In Millions) |
| | | | | Three Months Ended
March 31, |
| | | | | | | 2020 |
Revenues | | | | | | | $ | 1,526 | |
Net loss attributable to Cliffs shareholders | | | | | | | (17) | |
| | | | | | | | | | | |
| (In Millions) |
| Three Months Ended
September 30, 2020 | | Nine Months Ended
September 30, 2020 |
| Revenues | $ | 1,646 | | | $ | 4,265 | |
| Net loss attributable to Cliffs shareholders | (6) | | | (124) | |
The unaudited pro forma financial information has been calculated after applying our accounting policies and adjusting the historical results with pro forma adjustments, net of tax, that assume the AK Steel Merger occurred on January 1, 2019. Significant pro forma adjustments include the following:
1.The elimination of intercompany revenues between Cliffs and AK Steel of $68$136 million and $395 million for the three and nine months ended March 31, 2020.September 30, 2020, respectively.
2.The 2020 pro forma net incomeNet loss was adjusted to exclude $23$15 million and $74 million of non-recurring inventory acquisition accounting adjustments incurred during the three and nine months ended March 31, 2020.September 30, 2020, respectively.
3.The elimination of nonrecurring transaction costs incurred by Cliffs and AK Steel in connection with the AK Steel Merger of $27$1 million and $29 million for the three and nine months ended March 31, 2020.September 30, 2020, respectively.
4.Total other pro forma adjustments included incomeexpense of $13$10 million for both the three and nine months ended March 31,September 30, 2020, primarily due to reducedincreased interest andexpense, offset by reduced amortization expense, offset partially by additional depreciation expense and pension and OPEB expense.
5.The income tax impact of pro forma transaction adjustments that affect Net loss attributable to Cliffs shareholders at a statutory rate of 24.3% resulted in an income tax expensebenefit of $12$6 million and $2 million for the three and nine months ended March 31, 2020.September 30, 2020, respectively.
The unaudited pro forma financial information does not reflect the potential realization of synergies or cost savings, nor does it reflect other costs relating to the integration of AK Steel. This unaudited pro forma financial information should not be considered indicative of the results that would have actually occurred if the AK Steel Merger had been consummated on January 1, 2019, nor are they indicative of future results.
NOTE 4 - REVENUES
We generate our revenue through product sales, in which shipping terms generally indicate when we have fulfilled our performance obligations and transferred control of products to our customer. Our revenue transactions consist of a single performance obligation to transfer promised goods. Our contracts with customers usually define the mechanism for determining the sales price, which is generally fixed upon transfer of control, but the contracts generally do not impose a specific quantity on either party. Quantities to be delivered to the customer are generally determined at a point near the date of delivery through purchase orders or other written instructions we receive from the customer. Spot market sales are made through purchase orders or other written instructions. We consider our performance obligation to be complete and recognize revenue when control transfers in accordance with shipping terms.
Revenue is measured as the amount of consideration we expect to receive in exchange for transferring product. We reduce the amount of revenue recognized for estimated returns and other customer credits, such as discounts and volume rebates, based on the expected value to be realized. Payment terms are consistent with terms standard to the markets we serve. Sales taxes collected from customers are excluded from revenues.
Prior to the AM USA Transaction, we had a supply agreement with ArcelorMittal USA, which included supplemental revenue or refunds based on the HRC price in the year the iron ore was consumed in ArcelorMittal USA's blast furnaces. As control transferred prior to consumption, the supplemental revenue was recorded in
accordance with Topic 815. All sales occurring subsequent to the AM USA Transaction are intercompany and eliminated in consolidation. For the three months ended March 31, 2020, we had a derivative loss of $26 million includedIncluded within Revenues related to Topic 815 for the supplemental revenue portion of
the supply agreement.agreement is derivative revenue of $9 million and $14 million for the three and nine months ended September 30, 2020, respectively.
The following table represents our Revenues by market:
| | | (In Millions) | | (In Millions) |
| | Three Months Ended
March 31, | | Three Months Ended
September 30, | | Nine Months Ended
September 30, |
| | 2021 | | 2020 | | 2021 | | 2020 | | 2021 | | 2020 |
| Steelmaking: | Steelmaking: | | | | Steelmaking: | | | | | | | |
| Automotive | Automotive | $ | 1,287 | | | $ | 102 | | Automotive | $ | 1,149 | | | $ | 790 | | | $ | 3,577 | | | $ | 1,201 | |
| Infrastructure and manufacturing | Infrastructure and manufacturing | 954 | | | 39 | | Infrastructure and manufacturing | 1,603 | | | 190 | | | 3,889 | | | 420 | |
| Distributors and converters | Distributors and converters | 1,248 | | | 52 | | Distributors and converters | 2,447 | | | 135 | | | 5,672 | | | 326 | |
| Steel producers | Steel producers | 430 | | 144 | | Steel producers | 670 | | | 391 | | | 1,572 | | 919 | |
| Total Steelmaking | Total Steelmaking | 3,919 | | | 337 | | Total Steelmaking | 5,869 | | | 1,506 | | | 14,710 | | | 2,866 | |
| Other Businesses: | Other Businesses: | | Other Businesses: | |
| Automotive | Automotive | 105 | | | 16 | | Automotive | 105 | | | 123 | | | 306 | | | 188 | |
| Infrastructure and manufacturing | Infrastructure and manufacturing | 10 | | | 4 | | Infrastructure and manufacturing | 12 | | | 9 | | | 33 | | | 26 | |
| Distributors and converters | Distributors and converters | 15 | | | 2 | | Distributors and converters | 18 | | | 8 | | | 49 | | | 18 | |
| Total Other Businesses | Total Other Businesses | 130 | | | 22 | | Total Other Businesses | 135 | | | 140 | | | 388 | | | 232 | |
| Total revenues | Total revenues | $ | 4,049 | | | $ | 359 | | Total revenues | $ | 6,004 | | | $ | 1,646 | | | $ | 15,098 | | | $ | 3,098 | |
| |
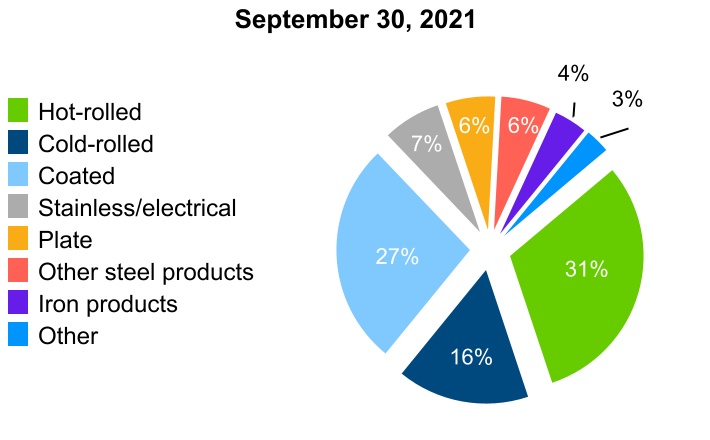
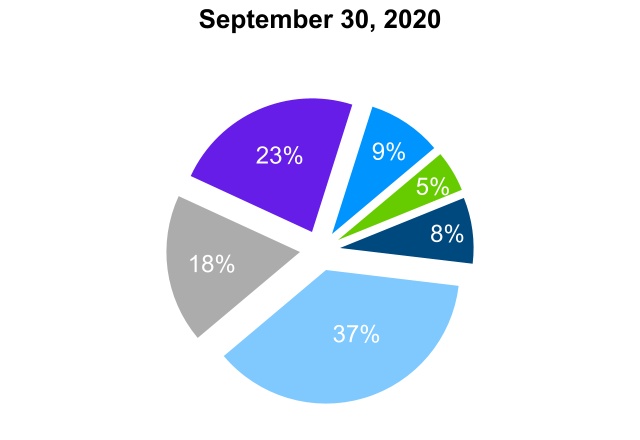
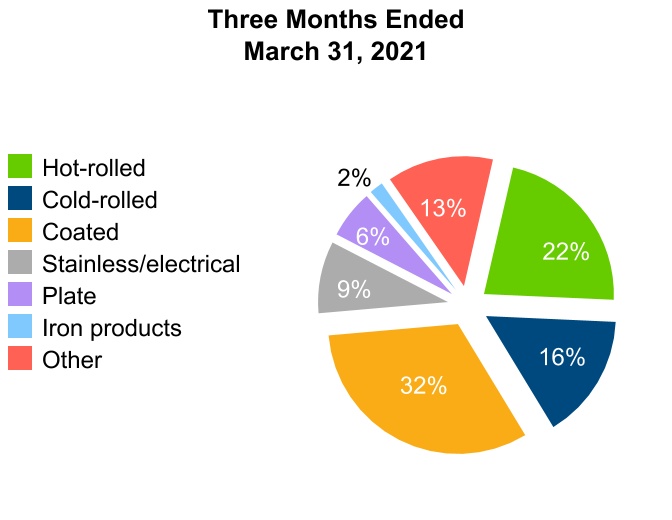
The following table representstables represent our Revenues by product line:
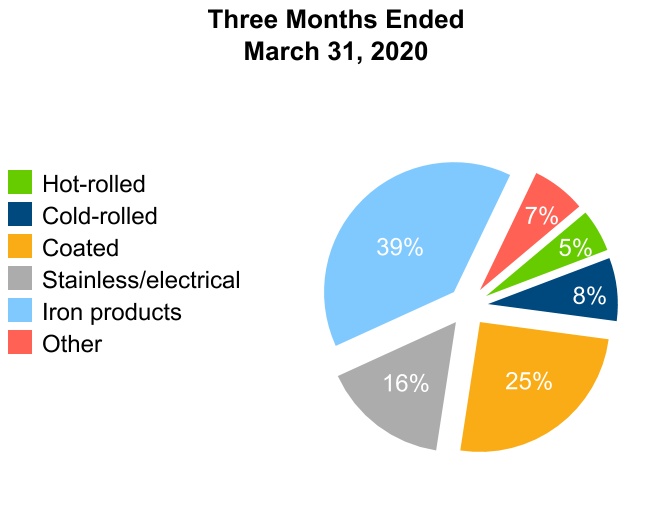
| | | | | | | | | | | | | | | | | | | | | | | |
| (Dollars In Millions, Sales Volumes in Thousands) |
| Three Months Ended
March 31, |
| 2021 | | 2020 |
| Revenue | | Volume1 | | Revenue | | Volume1 |
| Steelmaking: | | | | | | | |
| Hot-rolled steel | $ | 895 | | | 1,182 | | | $ | 19 | | | 31 | |
| Cold-rolled steel | 632 | | | 748 | | | 28 | | | 40 | |
| Coated steel | 1,308 | | | 1,369 | | | 90 | | | 99 | |
| Stainless and electrical steel | 363 | | | 167 | | | 56 | | | 27 | |
| Plate steel | 244 | | | 275 | | | 0 | | | 0 | |
| Other steel products | 289 | | | 403 | | | 0 | | | 0 | |
| Iron products | 70 | | | 600 | | | 142 | | | 1,351 | |
| Other | 118 | | | N/A | | 2 | | | N/A |
| Total steelmaking | 3,919 | | | | | 337 | | | |
| Other Businesses: | | | | | | | |
| Other | 130 | | | N/A | | 22 | | | N/A |
| Total revenues | $ | 4,049 | | | | | $ | 359 | | | |
| | | | | | | |
1 All steel product volumes are stated in net tons. Iron product volumes are stated in long tons. |
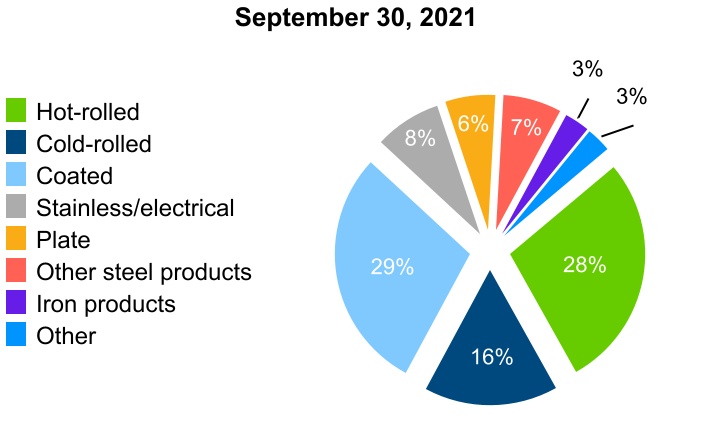
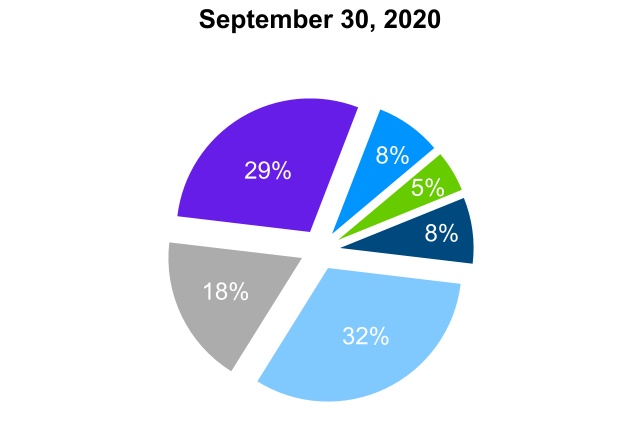
| | | | | | | | | | | | | | | | | | | | | | | |
| (Dollars in Millions, Sales Volumes in Thousands) |
| Three Months Ended September 30, |
| 2021 | | 2020 |
| Revenue | | Volume1 | | Revenue | | Volume1 |
| Steelmaking: | | | | | | | |
| Hot-rolled steel | $ | 1,800 | | | 1,332 | | | $ | 89 | | | 134 | |
| Cold-rolled steel | 935 | | | 728 | | | 126 | | | 179 | |
| Coated steel | 1,635 | | | 1,291 | | | 604 | | | 656 | |
| Stainless and electrical steel | 441 | | | 177 | | | 296 | | | 146 | |
| Plate steel | 357 | | | 244 | | | — | | | — | |
| Other steel products | 374 | | | 381 | | | — | | | — | |
| Iron products | 252 | | | 1,426 | | | 384 | | | 3,703 | |
| Other | 75 | | | N/A | | 7 | | | N/A |
| Total Steelmaking | 5,869 | | | | | 1,506 | | | |
| Other Businesses: | | | | | | | |
| Other | 135 | | | N/A | | 140 | | | N/A |
| Total revenues | $ | 6,004 | | | | | $ | 1,646 | | | |
| | | | | | | |
1 All steel product volumes are stated in net tons. Iron product volumes are stated in long tons. |
|
| | | | | | | | | | | | | | | | | | | | | | | |
| (Dollars in Millions, Sales Volumes in Thousands) |
| Nine Months Ended September 30, |
| 2021 | | 2020 |
| Revenue | | Volume1 | | Revenue | | Volume1 |
| Steelmaking: | | | | | | | |
| Hot-rolled steel | $ | 4,204 | | | 3,900 | | | $ | 150 | | | 228 | |
| Cold-rolled steel | 2,352 | | | 2,196 | | | 242 | | | 342 | |
| Coated steel | 4,338 | | | 3,907 | | | 995 | | | 1,088 | |
| Stainless and electrical steel | 1,201 | | | 512 | | | 560 | | | 268 | |
| Plate steel | 929 | | | 792 | | | — | | | — | |
| Other steel products | 1,009 | | | 1,195 | | | — | | | — | |
| Iron products | 477 | | | 2,875 | | | 903 | | | 8,772 | |
| Other | 200 | | | N/A | | 16 | | | N/A |
| Total steelmaking | 14,710 | | | | | 2,866 | | | |
| Other Businesses: | | | | | | | |
| Other | 388 | | | N/A | | 232 | | | N/A |
| Total revenues | $ | 15,098 | | | | | $ | 3,098 | | | |
| | | | | | | |
1 All steel product volumes are stated in net tons. Iron product volumes are stated in long tons. |
|
NOTE 5 - SEGMENT REPORTING
We are vertically integrated from the mining of iron ore and coal; to production of metallics and coke; through iron making, steelmaking, rolling, finishing; and to downstream tubing, stamping and tooling. We are organized into 4 operating segments based on our differentiated products - Steelmaking, Tubular, Tooling and Stamping, and European Operations. Our previous Mining and Pelletizing segment is included within the Steelmaking operating segment as iron ore pellets are a primary raw material for our steel products. We have 1 reportable segment - Steelmaking. The operating segment results of our Tubular, Tooling and Stamping, and European Operations that do not constitute reportable segments are combined and disclosed in the Other Businesses category. Our Steelmaking segment is the largest flat-rolled steel producer supported by being the largest iron ore pellet producer in North America, primarily serving the automotive, infrastructure and manufacturing, and distributors and converters markets. Our Other Businesses primarily include the operating segments that provide customer solutions with carbon and stainless steel tubing products, advanced-engineered solutions, tool design and build, hot- and cold-stamped steel components, and complex assemblies. All intersegment transactions were eliminated in consolidation.
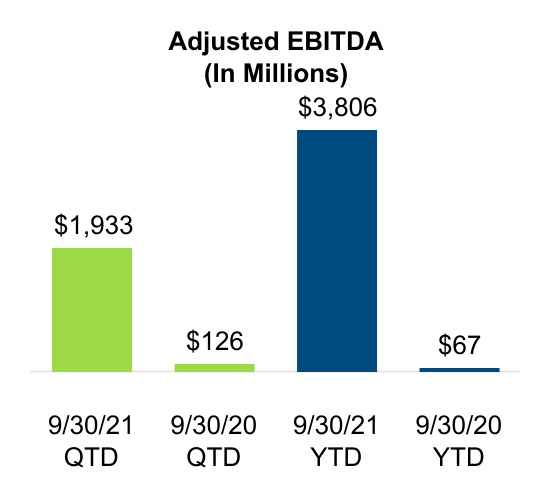
We evaluate performance on an operating segment basis, as well as a consolidated basis, based on Adjusted EBITDA, which is a non-GAAP measure. This measure is used by management, investors, lenders and other external users of our financial statements to assess our operating performance and to compare operating performance to other companies in the steel industry. In addition, management believes Adjusted EBITDA is a useful measure to assess the earnings power of the business without the impact of capital structure and can be used to assess our ability to service debt and fund future capital expenditures in the business.
Our results by segment are as follows:
| | | | | | | | | | | | | | | |
| | | | | (In Millions) |
| | | Three Months Ended
March 31, |
| | | | | 2021 | | 2020 |
| Revenues: | | | | | | | |
| Steelmaking | | | | | $ | 3,919 | | | $ | 337 | |
| Other Businesses | | | | | 130 | | | 22 | |
| Total revenues | | | | | $ | 4,049 | | | $ | 359 | |
| | | | | | | |
| Adjusted EBITDA: | | | | | | | |
| Steelmaking | | | | | $ | 537 | | | $ | 44 | |
| Other Businesses | | | | | 11 | | | 2 | |
| Corporate and eliminations | | | | | (35) | | | (23) | |
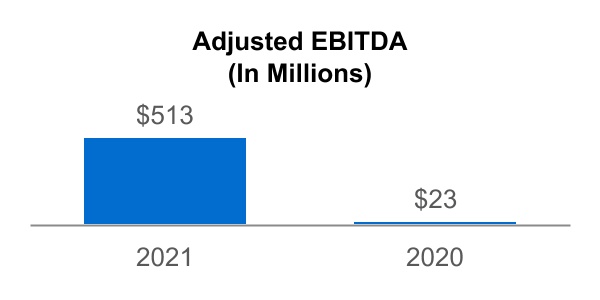
| Total Adjusted EBITDA | | | | | $ | 513 | | | $ | 23 | |
| | | | | | | |
Our results by segment are as follows:
| | | | | | | | | | | | | | | | | | | | | | | |
| (In Millions) |
| Three Months Ended
September 30, | | Nine Months Ended
September 30, |
| 2021 | | 2020 | | 2021 | | 2020 |
| Revenues: | | | | | | | |
| Steelmaking | $ | 5,869 | | | $ | 1,506 | | | $ | 14,710 | | | $ | 2,866 | |
| Other Businesses | 135 | | | 140 | | | 388 | | | 232 | |
| Total revenues | $ | 6,004 | | | $ | 1,646 | | | $ | 15,098 | | | $ | 3,098 | |
| | | | | | | |
| Adjusted EBITDA: | | | | | | | |
| Steelmaking | $ | 1,969 | | | $ | 127 | | | $ | 3,901 | | | $ | 117 | |
| Other Businesses | 6 | | | 18 | | | 25 | | | 22 | |
| Corporate and eliminations | (42) | | | (19) | | | (120) | | | (72) | |
| Total Adjusted EBITDA | $ | 1,933 | | | $ | 126 | | | $ | 3,806 | | | $ | 67 | |
The following table provides a reconciliation of our consolidated Net income (loss) to total Adjusted EBITDA:
| | | | (In Millions) | | (In Millions) |
| | | Three Months Ended
March 31, | | Three Months Ended
September 30, | | Nine Months Ended
September 30, |
| | | 2021 | | 2020 | | 2021 | | 2020 | | 2021 | | 2020 |
| Net income (loss) | Net income (loss) | | $ | 57 | | | $ | (49) | | Net income (loss) | $ | 1,282 | | | $ | 2 | | | $ | 2,134 | | | $ | (155) | |
| Less: | Less: | | | Less: | |
| Interest expense, net | Interest expense, net | | (92) | | | (31) | | Interest expense, net | (81) | | | (68) | | | (258) | | | (168) | |
| Income tax benefit (expense) | Income tax benefit (expense) | | (9) | | | 51 | | Income tax benefit (expense) | (334) | | | 22 | | | (559) | | | 98 | |
| Depreciation, depletion and amortization | Depreciation, depletion and amortization | | (217) | | | (35) | | Depreciation, depletion and amortization | (239) | | | (72) | | | (664) | | | (184) | |
| | | 375 | | | (34) | | | 1,936 | | | 120 | | | 3,615 | | | 99 | |
| Less: | Less: | | | Less: | |
EBITDA of noncontrolling interests1 | EBITDA of noncontrolling interests1 | | 22 | | | 4 | | EBITDA of noncontrolling interests1 | 17 | | | 16 | | | 60 | | | 41 | |
| Gain (loss) on extinguishment of debt | Gain (loss) on extinguishment of debt | | (66) | | | 3 | | Gain (loss) on extinguishment of debt | — | | | — | | | (88) | | | 133 | |
| Severance costs | Severance costs | | (11) | | | (19) | | Severance costs | (3) | | | (2) | | | (15) | | | (38) | |
| Acquisition-related costs excluding severance costs | Acquisition-related costs excluding severance costs | | (2) | | | (23) | | Acquisition-related costs excluding severance costs | (1) | | | (5) | | | (3) | | | (30) | |
| Acquisition-related loss on equity method investment | | Acquisition-related loss on equity method investment | — | | | — | | | (18) | | | — | |
| Amortization of inventory step-up | Amortization of inventory step-up | | (81) | | | (23) | | Amortization of inventory step-up | (11) | | | (15) | | | (129) | | | (74) | |
| Impact of discontinued operations | Impact of discontinued operations | | 0 | | | 1 | | Impact of discontinued operations | 1 | | | — | | | 2 | | | — | |
| Total Adjusted EBITDA | Total Adjusted EBITDA | | $ | 513 | | | $ | 23 | | Total Adjusted EBITDA | $ | 1,933 | | | $ | 126 | | | $ | 3,806 | | | $ | 67 | |
| 1 EBITDA of noncontrolling interests includes $16 million and $3 million for income and $6 million and $1 million for depreciation, depletion and amortization for the three months ended March 31, 2021 and 2020, respectively. | |
1 EBITDA of noncontrolling interests includes the following: | | 1 EBITDA of noncontrolling interests includes the following: |
| Net income attributable to noncontrolling interests | | Net income attributable to noncontrolling interests | $ | 8 | | | $ | 12 | | | $ | 39 | | | $ | 31 | |
| Depreciation, depletion and amortization | | Depreciation, depletion and amortization | 9 | | | 4 | | | 21 | | | 10 | |
| EBITDA of noncontrolling interests | | EBITDA of noncontrolling interests | $ | 17 | | | $ | 16 | | | $ | 60 | | | $ | 41 | |
The following summarizes our assets by segment:
| | | (In Millions) | | (In Millions) |
| | March 31,
2021 | | December 31,
2020 | | September 30,
2021 | | December 31,
2020 |
| Assets: | Assets: | | | | Assets: | | | |
| Steelmaking | Steelmaking | $ | 16,271 | | | $ | 15,849 | | Steelmaking | $ | 17,439 | | | $ | 15,849 | |
| Other Businesses | Other Businesses | 295 | | | 239 | | Other Businesses | 351 | | | 239 | |
| Total segment assets | Total segment assets | 16,566 | | | 16,088 | | Total segment assets | 17,790 | | | 16,088 | |
| Corporate | Corporate | 649 | | | 683 | | Corporate | 276 | | | 683 | |
| Total assets | Total assets | $ | 17,215 | | | $ | 16,771 | | Total assets | $ | 18,066 | | | $ | 16,771 | |
The following table summarizes our capital additions by segment:
| | | | | | | | | | | | | | | |
| | | | | (In Millions) |
| | | Three Months Ended
March 31, |
| | | | | 2021 | | 2020 |
Capital additions1: | | | | | | | |
| Steelmaking | | | | | $ | 133 | | | $ | 154 | |
| Other Businesses | | | | | 11 | | | 3 | |
| Corporate | | | | | 18 | | | 1 | |
| Total capital additions | | | | | $ | 162 | | | $ | 158 | |
| | | | | | | |
1 Refer to NOTE 2 - SUPPLEMENTARY FINANCIAL STATEMENT INFORMATION for additional information. |
| | | | | | | | | | | | | | | | | | | | | | | |
| (In Millions) |
| Three Months Ended
September 30, | | Nine Months Ended
September 30, |
| 2021 | | 2020 | | 2021 | | 2020 |
Capital additions1: | | | | | | | |
| Steelmaking | $ | 233 | | | $ | 93 | | | $ | 512 | | | $ | 313 | |
| Other Businesses | 10 | | | 9 | | | 42 | | | 19 | |
| Corporate | — | | | — | | | 18 | | | 1 | |
| Total capital additions | $ | 243 | | | $ | 102 | | | $ | 572 | | | $ | 333 | |
| | | | | | | |
1 Refer to NOTE 2 - SUPPLEMENTARY FINANCIAL STATEMENT INFORMATION for additional information. |
NOTE 6 - PROPERTY, PLANT AND EQUIPMENT
The following table indicates the carrying value of each of the major classes of our depreciable assets:
| | | (In Millions) | | (In Millions) |
| | March 31,
2021 | | December 31,
2020 | | September 30,
2021 | | December 31,
2020 |
| Land, land improvements and mineral rights | Land, land improvements and mineral rights | $ | 1,241 | | | $ | 1,213 | | Land, land improvements and mineral rights | $ | 1,285 | | | $ | 1,213 | |
| Buildings | Buildings | 1,004 | | | 703 | | Buildings | 852 | | | 703 | |
| Equipment | Equipment | 7,877 | | | 6,786 | | Equipment | 8,334 | | | 6,786 | |
| Other | Other | 173 | | | 151 | | Other | 213 | | | 151 | |
| Construction in progress | Construction in progress | 407 | | | 1,364 | | Construction in progress | 417 | | | 1,364 | |
Total property, plant and equipment1 | Total property, plant and equipment1 | 10,702 | | | 10,217 | | Total property, plant and equipment1 | 11,101 | | | 10,217 | |
| Allowance for depreciation and depletion | Allowance for depreciation and depletion | (1,688) | | | (1,474) | | Allowance for depreciation and depletion | (2,127) | | | (1,474) | |
| Property, plant and equipment, net | Property, plant and equipment, net | $ | 9,014 | | | $ | 8,743 | | Property, plant and equipment, net | $ | 8,974 | | | $ | 8,743 | |
| 1 Includes right-of-use assets related to finance leases of $365 million and $361 million as of March 31, 2021 and December 31, 2020, respectively. | |
1 Includes right-of-use assets related to finance leases of $396 million and $361 million as of September 30, 2021 and December 31, 2020, respectively. | | 1 Includes right-of-use assets related to finance leases of $396 million and $361 million as of September 30, 2021 and December 31, 2020, respectively. |
We recorded depreciation and depletion expense of $215$238 million and $36$661 million for the three and nine months ended March 31,September 30, 2021, respectively, and $72 million and $183 million for the three and nine months ended September 30, 2020, respectively.
NOTE 7 - GOODWILL AND INTANGIBLE ASSETS AND LIABILITIES
Goodwill
The following is a summary of Goodwill by segment:
| | | (In Millions) | | (In Millions) |
| | March 31,
2021 | | December 31,
2020 | | September 30,
2021 | | December 31,
2020 |
| Steelmaking | Steelmaking | $ | 820 | | | $ | 1,232 | | Steelmaking | $ | 898 | | | $ | 1,232 | |
| Other Businesses | Other Businesses | 174 | | | 174 | | Other Businesses | 174 | | | 174 | |
| Total goodwill | Total goodwill | $ | 994 | | | $ | 1,406 | | Total goodwill | $ | 1,072 | | | $ | 1,406 | |
The decrease of $412$334 million in the balance of Goodwill in our Steelmaking segment as of March 31,September 30, 2021, compared to December 31, 2020, is due to the change in estimated identified goodwill as a result of measurement period adjustments to the preliminary purchase price allocation for the acquisition of ArcelorMittal USA. Refer to NOTE 3 - ACQUISITIONS for further details.
Intangible Assets and Liabilities
The following is a summary of our intangible assets and liabilities:
| | | (In Millions) | | (In Millions) |
| | March 31, 2021 | | December 31, 2020 | | September 30, 2021 | | December 31, 2020 |
| | Gross Amount | | Accumulated Amortization | | Net Amount | | Gross Amount | | Accumulated Amortization | | Net Amount | | Gross Amount | | Accumulated Amortization | | Net Amount | | Gross Amount | | Accumulated Amortization | | Net Amount |
Intangible assets1: | Intangible assets1: | | | | | | | | | | | | | Intangible assets1: | | | | | | | | | | | |
| Customer relationships | Customer relationships | | $ | 77 | | | $ | (5) | | | $ | 72 | | | $ | 77 | | | $ | (3) | | | $ | 74 | | Customer relationships | $ | 77 | | | $ | (7) | | | $ | 70 | | | $ | 77 | | | $ | (3) | | | $ | 74 | |
| Developed technology | Developed technology | | 60 | | | (4) | | | 56 | | | 60 | | | (3) | | | 57 | | Developed technology | 60 | | | (6) | | | 54 | | | 60 | | | (3) | | | 57 | |
| Trade names and trademarks | Trade names and trademarks | | 11 | | | (1) | | | 10 | | | 11 | | | (1) | | | 10 | | Trade names and trademarks | 11 | | | (2) | | | 9 | | | 11 | | | (1) | | | 10 | |
| Mining permits | Mining permits | | 72 | | | (25) | | | 47 | | | 72 | | | (25) | | | 47 | | Mining permits | 72 | | | (25) | | | 47 | | | 72 | | | (25) | | | 47 | |
| Total intangible assets | Total intangible assets | | $ | 220 | | | $ | (35) | | | $ | 185 | | | $ | 220 | | | $ | (32) | | | $ | 188 | | Total intangible assets | $ | 220 | | | $ | (40) | | | $ | 180 | | | $ | 220 | | | $ | (32) | | | $ | 188 | |
Intangible liabilities2: | Intangible liabilities2: | | | | | | | | | | | | | Intangible liabilities2: | | | | | | | | | | | |
| Above-market supply contracts | Above-market supply contracts | | $ | (71) | | | $ | 8 | | | $ | (63) | | | $ | (71) | | | $ | 7 | | | $ | (64) | | Above-market supply contracts | $ | (71) | | | $ | 12 | | | $ | (59) | | | $ | (71) | | | $ | 7 | | | $ | (64) | |
| 1 Intangible assets are classified as Other non-current assets. Amortization related to mining permits is recognized in Cost of goods sold. Amortization of all other intangible assets is recognized in Selling, general and administrative expenses. | 1 Intangible assets are classified as Other non-current assets. Amortization related to mining permits is recognized in Cost of goods sold. Amortization of all other intangible assets is recognized in Selling, general and administrative expenses. | 1 Intangible assets are classified as Other non-current assets. Amortization related to mining permits is recognized in Cost of goods sold. Amortization of all other intangible assets is recognized in Selling, general and administrative expenses. |
2 Intangible liabilities are classified as Other non-current liabilities. Amortization of all intangible liabilities is recognized in Cost of goods sold. | 2 Intangible liabilities are classified as Other non-current liabilities. Amortization of all intangible liabilities is recognized in Cost of goods sold. | 2 Intangible liabilities are classified as Other non-current liabilities. Amortization of all intangible liabilities is recognized in Cost of goods sold. |
Amortization expense related to intangible assets was $3 million and $1$8 million for the three and nine months ended March 31,September 30, 2021, respectively, and $2 million and $6 million for the three and nine months ended September 30, 2020, respectively. Estimated future amortization expense is $7$3 million for the remainder of 2021 and $10 million annually for the years 2022 through 2026.
Income from amortization related to the intangible liabilities was $1$2 million and $2$5 million for the three and nine months ended March 31,September 30, 2021, respectively, and $2 million and $5 million for the three and nine months ended September 30, 2020, respectively. Estimated future income from amortization is $6$2 million for the remainder of 2021 and $5 million annually for the years 2022 through 2026.
NOTE 8 - DEBT AND CREDIT FACILITIES
The following represents a summary of our long-term debt:
| | (In Millions) | (In Millions) | (In Millions) |
| March 31, 2021 | |
| September 30, 2021 | | September 30, 2021 |
| Debt Instrument | Debt Instrument | | Issuer1 | | Annual Effective Interest Rate | | Total Principal Amount | | Unamortized
Debt Issuance Costs | | Unamortized Premiums (Discounts) | | Total Debt | Debt Instrument | | Issuer1 | | Annual Effective Interest Rate | | Total Principal Amount | | Unamortized
Debt Issuance Costs | | Unamortized Premiums (Discounts) | | Total Debt |
| Senior Secured Notes: | Senior Secured Notes: | | | | | | | | | | | | | Senior Secured Notes: | | | | | | | | | | | | |
| 9.875% 2025 Senior Secured Notes | 9.875% 2025 Senior Secured Notes | | Cliffs | | 10.57% | | $ | 633 | | | $ | (5) | | | $ | (16) | | | $ | 612 | | 9.875% 2025 Senior Secured Notes | | Cliffs | | 10.57% | | $ | 607 | | | $ | (4) | | | $ | (14) | | | $ | 589 | |
| 6.75% 2026 Senior Secured Notes | | Cliffs | | 6.99% | | 845 | | | (19) | | | (8) | | | 818 | | |
| 6.750% 2026 Senior Secured Notes | | 6.750% 2026 Senior Secured Notes | | Cliffs | | 6.99% | | 845 | | | (16) | | | (8) | | | 821 | |
| Senior Unsecured Notes: | Senior Unsecured Notes: | | Senior Unsecured Notes: | |
| 1.50% 2025 Convertible Senior Notes | | Cliffs | | 6.26% | | 296 | | | (3) | | | (47) | | | 246 | | |
| 5.75% 2025 Senior Notes | | Cliffs | | 6.01% | | 396 | | | (2) | | | (4) | | | 390 | | |
| 7.00% 2027 Senior Notes | | Cliffs | | 9.24% | | 73 | | | 0 | | | (7) | | | 66 | | |
| 7.00% 2027 AK Senior Notes | | AK Steel | | 9.24% | | 56 | | | 0 | | | (6) | | | 50 | | |
| 1.500% 2025 Convertible Senior Notes | | 1.500% 2025 Convertible Senior Notes | | Cliffs | | 6.26% | | 294 | | | (3) | | | (42) | | | 249 | |
| 7.000% 2027 Senior Notes | | 7.000% 2027 Senior Notes | | Cliffs | | 9.24% | | 73 | | | — | | | (7) | | | 66 | |
| 7.000% 2027 AK Senior Notes | | 7.000% 2027 AK Senior Notes | | AK Steel | | 9.24% | | 56 | | | — | | | (5) | | | 51 | |
| 5.875% 2027 Senior Notes | 5.875% 2027 Senior Notes | | Cliffs | | 6.49% | | 556 | | | (4) | | | (17) | | | 535 | | 5.875% 2027 Senior Notes | | Cliffs | | 6.49% | | 556 | | | (4) | | | (16) | | | 536 | |
| 4.625% 2029 Senior Notes | 4.625% 2029 Senior Notes | | Cliffs | | 4.63% | | 500 | | | (9) | | | 0 | | | 491 | | 4.625% 2029 Senior Notes | | Cliffs | | 4.63% | | 500 | | | (8) | | | — | | | 492 | |
| 4.875% 2031 Senior Notes | 4.875% 2031 Senior Notes | | Cliffs | | 4.88% | | 500 | | | (9) | | | 0 | | | 491 | | 4.875% 2031 Senior Notes | | Cliffs | | 4.88% | | 500 | | | (8) | | | — | | | 492 | |
| 6.25% 2040 Senior Notes | | Cliffs | | 6.34% | | 263 | | | (2) | | | (3) | | | 258 | | |
| 6.250% 2040 Senior Notes | | 6.250% 2040 Senior Notes | | Cliffs | | 6.34% | | 263 | | | (2) | | | (3) | | | 258 | |
| IRBs due 2024 to 2028 | IRBs due 2024 to 2028 | | AK Steel | | Various | | 92 | | | 0 | | | 2 | | | 94 | | IRBs due 2024 to 2028 | | AK Steel | | Various | | 92 | | | — | | | 2 | | | 94 | |
EDC Revolving Facilities3 | EDC Revolving Facilities3 | | * | | Various | | 80 | | | — | | | — | | | 53 | | EDC Revolving Facilities3 | | * | | Various | | 80 | | | — | | | — | | | 55 | |
ABL Facility3 | ABL Facility3 | | Cliffs2 | | 2.14% | | 3,500 | | | — | | | — | | | 1,630 | | ABL Facility3 | | Cliffs2 | | 2.23% | | 3,500 | | | — | | | — | | | 1,673 | |
| Total debt | | Total debt | | 5,376 | |
| Less: current debt | | Less: current debt | | 26 | |
| Total long-term debt | Total long-term debt | | $ | 5,734 | | Total long-term debt | | $ | 5,350 | |
| * Our subsidiaries, Fleetwood Metal Industries Inc. and The Electromac Group Inc., are the borrowers under the EDC Revolving Facilities. | 1 Unless otherwise noted, references in this column and throughout this NOTE 8 - DEBT AND CREDIT FACILITIES to "Cliffs" are to Cleveland-Cliffs Inc., and references to "AK Steel" are to AK Steel Corporation (n/k/a Cleveland-Cliffs Steel Corporation). | 1 Unless otherwise noted, references in this column and throughout this NOTE 8 - DEBT AND CREDIT FACILITIES to "Cliffs" are to Cleveland-Cliffs Inc., and references to "AK Steel" are to AK Steel Corporation (n/k/a Cleveland-Cliffs Steel Corporation). | 1 Unless otherwise noted, references in this column and throughout this NOTE 8 - DEBT AND CREDIT FACILITIES to "Cliffs" are to Cleveland-Cliffs Inc., and references to "AK Steel" are to AK Steel Corporation (n/k/a Cleveland-Cliffs Steel Corporation). |
2 Refers to Cleveland-Cliffs Inc. as borrower under our ABL Facility. | 2 Refers to Cleveland-Cliffs Inc. as borrower under our ABL Facility. | 2 Refers to Cleveland-Cliffs Inc. as borrower under our ABL Facility. |
3 The total principal amounts for the indicated credit facilities are stated at their respective maximum borrowing capacities. | 3 The total principal amounts for the indicated credit facilities are stated at their respective maximum borrowing capacities. | 3 The total principal amounts for the indicated credit facilities are stated at their respective maximum borrowing capacities. |
| | (In Millions) | (In Millions) | (In Millions) |
| December 31, 2020 | December 31, 2020 | December 31, 2020 |
| Debt Instrument | Debt Instrument | | Issuer1 | | Annual Effective Interest Rate | | Total Principal Amount | | Unamortized
Debt Issuance Costs | | Unamortized
Premiums
(Discounts) | | Total Debt | Debt Instrument | | Issuer1 | | Annual Effective Interest Rate | | Total Principal Amount | | Unamortized
Debt Issuance Costs | | Unamortized
Premiums
(Discounts) | | Total Debt |
| Senior Secured Notes: | Senior Secured Notes: | | | | | | | | | | | | | Senior Secured Notes: | | | | | | | | | | | | |
| 4.875% 2024 Senior Notes | 4.875% 2024 Senior Notes | | Cliffs | | 5.00% | | $ | 395 | | | $ | (3) | | | $ | (1) | | | $ | 391 | | 4.875% 2024 Senior Notes | | Cliffs | | 5.00% | | $ | 395 | | | $ | (3) | | | $ | (1) | | | $ | 391 | |
| 9.875% 2025 Senior Secured Notes | 9.875% 2025 Senior Secured Notes | | Cliffs | | 10.57% | | 955 | | | (8) | | | (25) | | | 922 | | 9.875% 2025 Senior Secured Notes | | Cliffs | | 10.57% | | 955 | | | (8) | | | (25) | | | 922 | |
| 6.75% 2026 Senior Secured Notes | | Cliffs | | 6.99% | | 845 | | | (20) | | | (9) | | | 816 | | |
| 6.750% 2026 Senior Secured Notes | | 6.750% 2026 Senior Secured Notes | | Cliffs | | 6.99% | | 845 | | | (20) | | | (9) | | | 816 | |
| Senior Unsecured Notes: | Senior Unsecured Notes: | | Senior Unsecured Notes: | |
| 7.625% 2021 AK Senior Notes | 7.625% 2021 AK Senior Notes | | AK Steel | | 7.33% | | 34 | | | 0 | | | 0 | | | 34 | | 7.625% 2021 AK Senior Notes | | AK Steel | | 7.33% | | 34 | | | — | | | — | | | 34 | |
| 7.50% 2023 AK Senior Notes | | AK Steel | | 6.17% | | 13 | | | 0 | | | 0 | | | 13 | | |
| 7.500% 2023 AK Senior Notes | | 7.500% 2023 AK Senior Notes | | AK Steel | | 6.17% | | 13 | | | — | | | — | | | 13 | |
| 6.375% 2025 Senior Notes | 6.375% 2025 Senior Notes | | Cliffs | | 8.11% | | 64 | | | 0 | | | (4) | | | 60 | | 6.375% 2025 Senior Notes | | Cliffs | | 8.11% | | 64 | | | — | | | (4) | | | 60 | |
| 6.375% 2025 AK Senior Notes | 6.375% 2025 AK Senior Notes | | AK Steel | | 8.11% | | 29 | | | 0 | | | (2) | | | 27 | | 6.375% 2025 AK Senior Notes | | AK Steel | | 8.11% | | 29 | | | — | | | (2) | | | 27 | |
| 1.50% 2025 Convertible Senior Notes | | Cliffs | | 6.26% | | 296 | | | (4) | | | (49) | | | 243 | | |
| 5.75% 2025 Senior Notes | | Cliffs | | 6.01% | | 396 | | | (3) | | | (4) | | | 389 | | |
| 7.00% 2027 Senior Notes | | Cliffs | | 9.24% | | 73 | | | 0 | | | (8) | | | 65 | | |
| 7.00% 2027 AK Senior Notes | | AK Steel | | 9.24% | | 56 | | | 0 | | | (6) | | | 50 | | |
| 1.500% 2025 Convertible Senior Notes | | 1.500% 2025 Convertible Senior Notes | | Cliffs | | 6.26% | | 296 | | | (4) | | | (49) | | | 243 | |
| 5.750% 2025 Senior Notes | | 5.750% 2025 Senior Notes | | Cliffs | | 6.01% | | 396 | | | (3) | | | (4) | | | 389 | |
| 7.000% 2027 Senior Notes | | 7.000% 2027 Senior Notes | | Cliffs | | 9.24% | | 73 | | | — | | | (8) | | | 65 | |
| 7.000% 2027 AK Senior Notes | | 7.000% 2027 AK Senior Notes | | AK Steel | | 9.24% | | 56 | | | — | | | (6) | | | 50 | |
| 5.875% 2027 Senior Notes | 5.875% 2027 Senior Notes | | Cliffs | | 6.49% | | 556 | | | (4) | | | (18) | | | 534 | | 5.875% 2027 Senior Notes | | Cliffs | | 6.49% | | 556 | | | (4) | | | (18) | | | 534 | |
| 6.25% 2040 Senior Notes | | Cliffs | | 6.34% | | 263 | | | (2) | | | (3) | | | 258 | | |
| 6.250% 2040 Senior Notes | | 6.250% 2040 Senior Notes | | Cliffs | | 6.34% | | 263 | | | (2) | | | (3) | | | 258 | |
| IRBs due 2024 to 2028 | IRBs due 2024 to 2028 | | AK Steel | | Various | | 92 | | | 0 | | | 2 | | | 94 | | IRBs due 2024 to 2028 | | AK Steel | | Various | | 92 | | | — | | | 2 | | | 94 | |
EDC Revolving Facility3 | EDC Revolving Facility3 | | * | | 3.25% | | 40 | | | — | | | — | | | 18 | | EDC Revolving Facility3 | | * | | 3.25% | | 40 | | | — | | | — | | | 18 | |
ABL Facility3 | ABL Facility3 | | Cliffs2 | | 2.15% | | 3,500 | | | — | | | — | | | 1,510 | | ABL Facility3 | | Cliffs2 | | 2.15% | | 3,500 | | | — | | | — | | | 1,510 | |
| Total debt | Total debt | | 5,424 | | Total debt | | 5,424 | |
| Less: current debt | Less: current debt | | 34 | | Less: current debt | | 34 | |
| Total long-term debt | Total long-term debt | | $ | 5,390 | | Total long-term debt | | $ | 5,390 | |
| * Our subsidiaries, Fleetwood Metal Industries Inc. and The Electromac Group Inc., are the borrowers under the EDC Revolving Facility. | 1 Unless otherwise noted, references in this column and throughout this NOTE 8 - DEBT AND CREDIT FACILITIES to "Cliffs" are to Cleveland-Cliffs Inc., and references to "AK Steel" are to AK Steel Corporation (n/k/a Cleveland-Cliffs Steel Corporation). | 1 Unless otherwise noted, references in this column and throughout this NOTE 8 - DEBT AND CREDIT FACILITIES to "Cliffs" are to Cleveland-Cliffs Inc., and references to "AK Steel" are to AK Steel Corporation (n/k/a Cleveland-Cliffs Steel Corporation). | 1 Unless otherwise noted, references in this column and throughout this NOTE 8 - DEBT AND CREDIT FACILITIES to "Cliffs" are to Cleveland-Cliffs Inc., and references to "AK Steel" are to AK Steel Corporation (n/k/a Cleveland-Cliffs Steel Corporation). |
2 Refers to Cleveland-Cliffs Inc. as borrower under our ABL Facility. | 2 Refers to Cleveland-Cliffs Inc. as borrower under our ABL Facility. | 2 Refers to Cleveland-Cliffs Inc. as borrower under our ABL Facility. |
3 The total principal amounts for the indicated credit facilities are stated at their respective maximum borrowing capacities. | 3 The total principal amounts for the indicated credit facilities are stated at their respective maximum borrowing capacities. | 3 The total principal amounts for the indicated credit facilities are stated at their respective maximum borrowing capacities. |
4.625% 2029Debt Extinguishments - 2021
During the third quarter of 2021, we issued a notice of redemption to the holders of our IRBs due 2024, which were redeemed on October 15, 2021. As such, the aggregate principal amount of $26 million for our IRBs due 2024 was classified as current debt as of September 30, 2021.
During the third quarter of 2021, we repurchased $2 million in aggregate principal amount of 1.500% 2025 Convertible Senior Notes. On June 28, 2021, we redeemed all of the $396 million aggregate principal amount outstanding of the 5.750% 2025 Senior Notes
On February 17, using available liquidity. During the second quarter of 2021, we entered into an indenture among Cliffs, the guarantors party thereto and U.S. Bank National Association, as trustee, relating to the issuance by Cliffs of $500also repurchased $25 million aggregate principal amount of 4.625% 20299.875% 2025 Senior Notes issued at par value.
The 4.625% 2029 Senior Notes were issued in private placement transactions exempt from the registration requirements of the Securities Act. The 4.625% 2029 Senior Notes bear interest at a rate of 4.625% per annum, payable semi-annually in arrears on March 1 and September 1 of each year, commencing on September 1, 2021. The 4.625% 2029 Senior Notes will mature on March 1, 2029.
The 4.625% 2029 Senior Notes are unsecured senior obligations and rank equally in right of payment with all of our existing and future unsecured and unsubordinated indebtedness. The 4.625% 2029 Senior Notes are guaranteed on a senior unsecured basis by our material direct and indirect wholly-owned domestic subsidiaries and, therefore, are structurally senior to any of our existing and future indebtedness that is not guaranteed by such guarantors and are structurally subordinated to all existing and future indebtedness and other liabilities of our subsidiaries that do not guarantee the 4.625% 2029 SeniorSecured Notes.
The 4.625% 2029 Senior Notes may be redeemed, in whole or in part, on not less than 10 nor more than 60 days’ prior notice sent to the holders of the notes. The following is a summary of redemption prices for our 4.625% 2029 Senior Notes:
| | | | | | | | | | | | | | | | | |
Redemption Period | | Redemption Price1
| | Restricted Amount |
Prior to March 1, 2024 - using the proceeds of equity issuance | | 104.625 | | % | | Up to 35% of original aggregate principal |
Prior to March 1, 20242
| | 100.000 | | | | |
Beginning March 1, 2024 | | 102.313 | | | | |
Beginning March 1, 2025 | | 101.156 | | | | |
Beginning on March 1, 2026 and thereafter | | 100.000 | | | | |
| | | | | |
1 Plus accrued and unpaid interest, if any, up to, but excluding, the redemption date.
|
2 Plus a "make-whole" premium.
|
In addition, if a change in control triggering event, as defined in the indenture, occurs with respect to the 4.625% 2029 Senior Notes, we will be required to offer to repurchase the notes at a purchase price equal to 101% of their principal amount, plus accrued and unpaid interest, if any, to, but not including, the date of repurchase.
The terms of the 4.625% 2029 Senior Notes contain certain customary covenants; however, there are no financial covenants.
4.875% 2031 Senior Notes
On February 17, 2021, we entered into an indenture among Cliffs, the guarantors party thereto and U.S. Bank National Association, as trustee, relating to the issuance by Cliffs of $500 million aggregate principal amount of 4.875% 2031 Senior Notes issued at par value.
The 4.875% 2031 Senior Notes were issued in private placement transactions exempt from the registration requirements of the Securities Act. The 4.875% 2031 Senior Notes bear interest at a rate of 4.875% per annum, payable semi-annually in arrears on March 1 and September 1 of each year, commencing on September 1, 2021. The 4.875% 2031 Senior Notes will mature on March 1, 2031.
The 4.875% 2031 Senior Notes are unsecured senior obligations and rank equally in right of payment with all of our existing and future unsecured and unsubordinated indebtedness. The 4.875% 2031 Senior Notes are guaranteed on a senior unsecured basis by our material direct and indirect wholly-owned domestic subsidiaries and, therefore, are structurally senior to any of our existing and future indebtedness that is not guaranteed by such guarantors and are structurally subordinated to all existing and future indebtedness and other liabilities of our subsidiaries that do not guarantee the 4.875% 2031 Senior Notes.
The 4.875% 2031 Senior Notes may be redeemed, in whole or in part, on not less than 10 nor more than 60 days’ prior notice sent to the holders of the notes. The following is a summary of redemption prices for our 4.875% 2031 Senior Notes:
| | | | | | | | | | | | | | | | | |
Redemption Period | | Redemption Price1
| | Restricted Amount |
Prior to March 1, 2026 - using the proceeds of equity issuance | | 104.875 | | % | | Up to 35% of original aggregate principal |
Prior to March 1, 2026 2
| | 100.000 | | | | |
Beginning March 1, 2026 | | 102.438 | | | | |
Beginning March 1, 2027 | | 101.625 | | | | |
Beginning March 1, 2028 | | 100.813 | | | | |
Beginning on March 1, 2029 and thereafter | | 100.000 | | | | |
| | | | | |
1 Plus accrued and unpaid interest, if any, up to, but excluding, the redemption date.
|
2 Plus a "make-whole" premium.
|
In addition, if a change in control triggering event, as defined in the indenture, occurs with respect to the 4.875% 2031 Senior Notes, we will be required to offer to repurchase the notes at a purchase price equal to 101% of their principal amount, plus accrued and unpaid interest, if any, to, but not including, the date of repurchase.
The terms of the 4.875% 2031 Senior Notes contain certain customary covenants; however, there are no financial covenants.
Debt Extinguishments - 2021
On March 11, 2021, we purchased anredeemed $322 million in aggregate principal amount of $322 million of the 9.875% 2025 Senior Secured Notes using the net proceeds from the February 11, 2021 issuance of 20 million common shares and cash on hand. On March 12, 2021, we fully redeemed the 4.875% 2024 Senior Secured Notes, 7.625% 2021 AK Senior Notes, 7.50%7.500% 2023 AK Senior Notes, 6.375% 2025 Senior Notes and 6.375% 2025 AK Senior Notes, which totaled an aggregate principal amount of $535 million.
The following is a summary of the debt extinguished and the respective impact on extinguishment:
| | | | (In Millions) | | (In Millions) |
| | | Three Months Ended
March 31, 2021 | | Three Months Ended
September 30, 2021 | | Nine Months Ended
September 30, 2021 |
| Debt Instrument | Debt Instrument | | Debt Extinguished | | (Loss) on Extinguishment | Debt Instrument | | Debt Extinguished | | (Loss) on Extinguishment | | Debt Extinguished | | (Loss) on Extinguishment |
| 9.875% 2025 Senior Secured Notes | 9.875% 2025 Senior Secured Notes | | $ | 322 | | | $ | (42) | | 9.875% 2025 Senior Secured Notes | | $ | — | | | $ | — | | | $ | 347 | | | $ | (47) | |
| 4.875% 2024 Senior Secured Notes | 4.875% 2024 Senior Secured Notes | | 395 | | | (14) | | 4.875% 2024 Senior Secured Notes | | — | | | — | | | 395 | | | (14) | |
| 7.625% 2021 AK Senior Notes | 7.625% 2021 AK Senior Notes | | 34 | | | 0 | | 7.625% 2021 AK Senior Notes | | — | | | — | | | 34 | | | — | |
| 7.50% 2023 AK Senior Notes | | 13 | | | 0 | | |
| 7.500% 2023 AK Senior Notes | | 7.500% 2023 AK Senior Notes | | — | | | — | | | 13 | | | — | |
| 6.375% 2025 Senior Notes | 6.375% 2025 Senior Notes | | 64 | | | (7) | | 6.375% 2025 Senior Notes | | — | | | — | | | 64 | | | (7) | |
| 1.500% 2025 Convertible Senior Notes | | 1.500% 2025 Convertible Senior Notes | | 2 | | | — | | | 2 | | | — | |
| 6.375% 2025 AK Senior Notes | 6.375% 2025 AK Senior Notes | | 29 | | | (3) | | 6.375% 2025 AK Senior Notes | | — | | | — | | | 29 | | | (3) | |
| 5.750% 2025 Senior Notes | | 5.750% 2025 Senior Notes | | — | | | — | | | 396 | | | (17) | |
| | | $ | 857 | | | $ | (66) | | | $ | 2 | | | $ | — | | | $ | 1,280 | | | $ | (88) | |
Debt Extinguishments - 2020
On April 24, 2020, we used the net proceeds from the offering of the additional 9.875% 2025 Senior Secured Notes to repurchase $736 million aggregate principal amount of our outstanding senior notes of various series, which resulted in debt reduction of $181 million. During the second quarter of 2020, we also repurchased an additional $12 million aggregate principal amount of our outstanding senior notes of various series with cash on hand. On June 1, 2020, we redeemed $7 million aggregate principal amount of our outstanding 2020 IRBs.
On March 13, 2020, in connection with the AK Steel Merger, we purchased $364 million aggregate principal amount of 7.625% 2021 AK Senior Notes and $311 million aggregate principal amount of 7.50%7.500% 2023 AK Senior Notes upon early settlement of tender offers made by Cliffs. The net proceeds from the offering of 6.75%6.750% 2026 Senior Secured Notes, along with a portion of the ABL Facility borrowings, were used to fund such purchases. As the 7.625% 2021 AK Senior Notes and 7.50%7.500% 2023 AK Senior Notes were recorded at fair value just prior to being purchased, there was no gain or loss on extinguishment. Additionally, in connection with the final settlement of the tender offers, we purchased $9 million aggregate principal amount of the 7.625% 2021 AK Senior Notes and $56$57 million aggregate principal amount of the 7.50%7.500% 2023 AK Senior Notes with cash on hand.
The following is a summary of the debt extinguished and the respective impact on extinguishment:
| | | | (In Millions) | | | (In Millions) |
| | | Three Months Ended
March 31, 2020 | | | | Nine Months Ended
September 30, 2020 |
| Debt Instrument | Debt Instrument | | Debt Extinguished | | Gain on Extinguishment | Debt Instrument | | | Debt Extinguished | | Gain on Extinguishment |
| 7.625% 2021 AK Senior Notes | 7.625% 2021 AK Senior Notes | | $ | 373 | | | $ | 0 | | 7.625% 2021 AK Senior Notes | | | $ | 373 | | | $ | — | |
| 7.50% 2023 AK Senior Notes | | 367 | | | 3 | | |
| 7.500% 2023 AK Senior Notes | | 7.500% 2023 AK Senior Notes | | | 367 | | | 3 | |
| 4.875% 2024 Senior Secured Notes | | 4.875% 2024 Senior Secured Notes | | | 6 | | | 1 | |
| 6.375% 2025 Senior Notes | | 6.375% 2025 Senior Notes | | | 168 | | | 21 | |
| 1.500% 2025 Convertible Senior Notes | | 1.500% 2025 Convertible Senior Notes | | | 20 | | | 1 | |
| 5.750% 2025 Senior Notes | | 5.750% 2025 Senior Notes | | | 77 | | | 16 | |
| 7.000% 2027 Senior Notes | | 7.000% 2027 Senior Notes | | | 247 | | | 29 | |
| 5.875% 2027 Senior Notes | | 5.875% 2027 Senior Notes | | | 194 | | | 49 | |
| 6.250% 2040 Senior Notes | | 6.250% 2040 Senior Notes | | | 36 | | | 13 | |
| | | | | $ | 1,488 | | | $ | 133 | |
| | | $ | 740 | | | $ | 3 | | |
ABL Facility
As of March 31,September 30, 2021, we were in compliance with the ABL Facility liquidity requirements and, therefore, the springing financial covenant requiring a minimum fixed charge coverage ratio of 1.0 to 1.0 was not applicable.
The following represents a summary of our borrowing capacity under the ABL Facility:
| | | | | | | | |
| | (In Millions) |
| | March 31,September 30,
2021 |
Available borrowing base on ABL Facility1 | | $ | 3,500 | |
| Borrowings | | (1,630)(1,673) | |
Letter of credit obligations2 | | (272)(236) | |
| Borrowing capacity available | | $ | 1,5981,591 | |
| | |
1 As of March 31,September 30, 2021, the ABL Facility has a maximum borrowing base of $3.5 billion. The available borrowing base is determined by applying customary advance rates to eligible accounts receivable, inventory and certain mobile equipment. |
2 We issued standby letters of credit with certain financial institutions in order to support business obligations including, but not limited to, workers' compensation, employee severance, insurance, operating agreements, IRBs and environmental obligations. |
Debt Maturities
The following represents a summary of our maturities of debt instruments based on the principal amounts outstanding at March 31,September 30, 2021:
| | | | | | | | |
| | (In Millions) |
| | Maturities of Debt |
| 2021 (remaining period of year) | | $ | 0 | |
| 2022 | | 0 | |
| 2023 | | 53 | |
| 2024 | | 62 | |
| 2025 | | 2,955 | |
| Thereafter | | 2,823 | |
| Total maturities of debt | | $ | 5,893 | |
| | | | | | | | |
| | (In Millions) |
| | Maturities of Debt |
| 2021 (remaining period of year) | | $ | 26 | |
| 2022 | | — | |
| 2023 | | 55 | |
| 2024 | | 36 | |
| 2025 | | 2,574 | |
| Thereafter | | 2,823 | |
| Total maturities of debt | | $ | 5,514 | |
NOTE 9 - FAIR VALUE MEASUREMENTS
The carrying values of certain financial instruments (e.g., Accounts receivable, net, Accounts payable and Other current liabilities) approximate fair value and, therefore, have been excluded from the table below. A summary of the carrying value and fair value of other financial instruments were as follows:
| | | (In Millions) | | (In Millions) |
| | March 31, 2021 | | December 31, 2020 | | September 30, 2021 | | December 31, 2020 |
| | Classification | | Carrying Value | | Fair Value | | Carrying Value | | Fair Value | | Classification | | Carrying Value | | Fair Value | | Carrying Value | | Fair
Value |
| Senior Notes | Senior Notes | Level 1 | | $ | 3,957 | | | $ | 4,674 | | | $ | 3,802 | | | $ | 4,446 | | Senior Notes | Level 1 | | $ | 3,554 | | | $ | 4,385 | | | $ | 3,802 | | | $ | 4,446 | |
| IRBs due 2024 to 2028 | IRBs due 2024 to 2028 | Level 1 | | 94 | | | 94 | | | 94 | | | 91 | | IRBs due 2024 to 2028 | Level 1 | | 94 | | | 93 | | | 94 | | | 91 | |
| EDC Revolving Facilities - outstanding balance | EDC Revolving Facilities - outstanding balance | Level 2 | | 53 | | | 53 | | | 18 | | | 18 | | EDC Revolving Facilities - outstanding balance | Level 2 | | 55 | | | 55 | | | 18 | | | 18 | |
| ABL Facility - outstanding balance | ABL Facility - outstanding balance | Level 2 | | 1,630 | | | 1,630 | | | 1,510 | | | 1,510 | | ABL Facility - outstanding balance | Level 2 | | 1,673 | | | 1,673 | | | 1,510 | | | 1,510 | |
| Total long-term debt | | $ | 5,734 | | | $ | 6,451 | | | $ | 5,424 | | | $ | 6,065 | | |
| Total | | Total | | $ | 5,376 | | | $ | 6,206 | | | $ | 5,424 | | | $ | 6,065 | |
The fair value of both current and long-term debt was determined using quoted market prices.
NOTE 10 - PENSIONS AND OTHER POSTRETIREMENT BENEFITS
We offer defined benefit pension plans, defined contribution pension plans and OPEB plans to a significant portion of our employees and retirees. Benefits are also provided through multiemployer plans for certain union members.
The following are the components of defined benefit pension and OPEB costs (credits):
Defined Benefit Pension Costs (Credits)
| | | | (In Millions) | | (In Millions) |
| | | Three Months Ended
March 31, | | Three Months Ended
September 30, | | Nine Months Ended
September 30, |
| | | 2021 | | 2020 | | 2021 | | 2020 | | 2021 | | 2020 |
| Service cost | Service cost | | $ | 14 | | | $ | 5 | | Service cost | $ | 14 | | | $ | 5 | | | $ | 42 | | | $ | 16 | |
| Interest cost | Interest cost | | 26 | | | 8 | | Interest cost | 26 | | | 20 | | | 78 | | | 43 | |
| Expected return on plan assets | Expected return on plan assets | | (90) | | | (18) | | Expected return on plan assets | (89) | | | (38) | | | (269) | | | (93) | |
| Amortization: | Amortization: | | | Amortization: | |
| | Prior service costs | | Prior service costs | 1 | | | 1 | | | 1 | | | 1 | |
| Net actuarial loss | Net actuarial loss | | 8 | | | 7 | | Net actuarial loss | 8 | | | 8 | | | 24 | | | 21 | |
| Net periodic benefit cost (credit) | | $ | (42) | | | $ | 2 | | |
| Net periodic benefit credits | | Net periodic benefit credits | $ | (40) | | | $ | (4) | | | $ | (124) | | | $ | (12) | |
OPEB Costs (Credits)
| | | | | | | | | | | | | | | |
| | | | | (In Millions) |
| | | Three Months Ended
March 31, |
| | | | | 2021 | | 2020 |
| Service cost | | | | | $ | 13 | | | $ | 1 | |
| Interest cost | | | | | 18 | | | 2 | |
| Expected return on plan assets | | | | | (10) | | | (5) | |
| Amortization: | | | | | | | |
| Prior service credits | | | | | 0 | | | (1) | |
| Net actuarial loss | | | | | 1 | | | 1 | |
| Net periodic benefit cost (credit) | | | | | $ | 22 | | | $ | (2) | |
| | | | | | | | | | | | | | | | | | | | | | | |
| (In Millions) |
| Three Months Ended
September 30, | | Nine Months Ended
September 30, |
| 2021 | | 2020 | | 2021 | | 2020 |
| Service cost | $ | 13 | | | $ | 1 | | | $ | 38 | | | $ | 3 | |
| Interest cost | 19 | | | 4 | | | 56 | | | 11 | |
| Expected return on plan assets | (10) | | | (4) | | | (30) | | | (13) | |
| Amortization: | | | | | | | |
| Prior service credits | (2) | | | (1) | | | (2) | | | (2) | |
| Net actuarial loss | 1 | | | 1 | | | 3 | | | 2 | |
| Net periodic benefit costs | $ | 21 | | | $ | 1 | | | $ | 65 | | | $ | 1 | |
Based on funding requirements, we made defined benefit pension contributions of $146$1 million and $4$154 million for the three and nine months ended March 31,September 30, 2021, respectively, compared to defined benefit pension contributions of $1 million and $5 million for the three and nine months ended September 30, 2020, respectively. As a result of the CARES Act enacted on March 27, 2020, we deferred $118 million of 2020 pension contributions, which were paid on January 4, 2021. For the three and nine months ended September 30, 2021, we made contributions of $22 million and $27 million, respectively, for our voluntary employee benefit association trust plans. Based on funding requirements, 0no contributions for our voluntary employee benefit association trust plans were required or made for the three and nine months ended March 31, 2021 andSeptember 30, 2020.
NOTE 11 - INCOME TAXES
Our 2021 estimated annual effective tax rate before discrete items as of March 31,September 30, 2021 is 19%21%. The estimated annual effective tax rate differs frommirrors the U.S. statutory rate of 21% primarily due to, as the deduction foradjusting items, including percentage depletion in excess of cost depletion.depletion, net to zero. The 2020 estimated annual effective tax rate before discrete items as of March 31,September 30, 2020 was 47%36%. The decrease in the estimated annual effective tax rate before discrete items is driven by the change in the mixincome.
NOTE 12 - ASSET RETIREMENT OBLIGATIONS
The following is a summary of our asset retirement obligations:
| | | (In Millions) | | (In Millions) |
| | March 31,
2021 | | December 31,
2020 | | September 30,
2021 | | December 31,
2020 |
Asset retirement obligations1 | Asset retirement obligations1 | $ | 310 | | | $ | 342 | | Asset retirement obligations1 | $ | 392 | | | $ | 342 | |
| Less: current portion | Less: current portion | 12 | | | 7 | | Less: current portion | 25 | | | 7 | |
| Long-term asset retirement obligations | Long-term asset retirement obligations | $ | 298 | | | $ | 335 | | Long-term asset retirement obligations | $ | 367 | | | $ | 335 | |
| 1 Includes $158 million and $190 million related to our active operations as of March 31, 2021 and December 31, 2020, respectively. | |
1 Includes $236 million and $190 million related to our active operations as of September 30, 2021 and December 31, 2020, respectively. | | 1 Includes $236 million and $190 million related to our active operations as of September 30, 2021 and December 31, 2020, respectively. |
The accrued closure obligation provides for contractual and legal obligations related to our indefinitely idled and closed operations and for the eventual closure of our active operations. The closure date for each of our active mine sites was determined based on the exhaustion date of the remaining mineral reserves, and the amortization of the related asset and accretion of the liability is recognized over the estimated mine lives. The closure date and expected timing of the capital requirements to meet our obligations for our indefinitely idled or closed mines is determined based on the unique circumstances of each property. For indefinitely idled or closed mines, the accretion of the liability is recognized over the anticipated timing of remediation. As the majority of our asset retirement obligations at our steelmaking operations have indeterminate settlement dates, asset retirement obligations have been recorded at present values using estimated ranges of the economic lives of the underlying assets.
The following is a roll forward of our asset retirement obligation liability:
| | | (In Millions) | | (In Millions) |
| | 2021 | | 2020 | | 2021 | | 2020 |
| Asset retirement obligation as of January 1 | Asset retirement obligation as of January 1 | $ | 342 | | | $ | 165 | | Asset retirement obligation as of January 1 | $ | 342 | | | $ | 165 | |
| Increase (decrease) from Acquisitions | (34) | | | 14 | | |
| Increase from acquisitions | | Increase from acquisitions | 57 | | | 17 | |
| Accretion expense | Accretion expense | 3 | | | 2 | | Accretion expense | 13 | | | 8 | |
| Remediation payments | Remediation payments | (1) | | | 0 | | Remediation payments | (20) | | | (4) | |
| Asset retirement obligation as of March 31 | $ | 310 | | | $ | 181 | | |
| Asset retirement obligation as of September 30 | | Asset retirement obligation as of September 30 | $ | 392 | | | $ | 186 | |
The decreaseincrease from Acquisitionsacquisitions for the threenine months ended March 31,September 30, 2021 relates to measurement period adjustments as a result of the preliminary purchase price allocation of the AM USA Transaction.
NOTE 13 - CAPITAL STOCK
Series B Participating Redeemable Preferred Stock Redemption
We had 583,273 shares of the Series B Participating Redeemable Preferred Stock issued and outstanding as of June 30, 2021 and December 31, 2020. During the third quarter of 2021, we redeemed all 583,273 shares of the Series B Participating Redeemable Preferred Stock at a redemption price of $1.3 billion using borrowings under our ABL Facility.
Underwritten Public Offering
On February 11, 2021, we sold 20 million of our common shares and 40 million common shares were sold by an affiliate of ArcelorMittal in an underwritten public offering. In each case, shares were sold at a price per share of $16.12. Prior to this sale, ArcelorMittal held approximately 78 million common shares, which were issued as a part of the consideration in connection with the AM USA Transaction. We did not receive any proceeds from the sale of the 40 million common shares sold on behalf of ArcelorMittal. We used the net proceeds from the offering, plus cash on hand, to redeem $322 million aggregate principal amount of our outstanding 9.875% 2025 Senior Secured Notes.
Acquisition of AK Steel
As more fully described in NOTE 3 - ACQUISITIONS, we acquired AK Steel on March 13, 2020. At the effective time of the AK Steel Merger, each share of AK Steel common stock issued and outstanding prior to the effective time of the AK Steel Merger was converted into, and became exchangeable for, 0.400 Cliffs common shares, par value $0.125 per share. We issued a total of 127 million common shares in connection with the AK Steel Merger at a fair value of $618 million. Following the closing of the AK Steel Merger, AK Steel's common stock was de-listed from the New York Stock Exchange.
Acquisition of ArcelorMittal USA
As more fully described in NOTE 3 - ACQUISITIONS, we acquired ArcelorMittal USA on December 9, 2020. Pursuant to the terms of the AM USA Transaction Agreement, we issued 78,186,671 common shares and 583,273 shares of a new series of our Serial Preferred Stock, Class B, without par value, designated as the “Series B Participating Redeemable Preferred Stock,” in each case to an indirect, wholly owned subsidiary of ArcelorMittal as part of the consideration paid by us in connection with the closing of the AM USA Transaction.
Amendment to Articles of Incorporation
On April 29, 2021, we filed a Certificate of Amendment to our Fourth Amended Articles of Incorporation, as amended, to increase the total number of authorized common shares from 600,000,000 to 1,200,000,000.
Preferred Stock
We have 3,000,000 shares of Serial Preferred Stock, Class A, without par value, authorized, of which, none are issued or outstanding.outstanding as of September 30, 2021. We also have 4,000,000 shares of Serial Preferred Stock, Class B, without par value, authorized, of which, 583,273 sharesnone are issued andor outstanding as described above.of September 30, 2021.
Dividends
The below table summarizes our dividend activity during 2020:
| | | | | | | | | | | | | | | | | | | | |
| Declaration Date | | Record Date | | Payment Date | | Dividend Declared per Common Share |
| 2/18/2020 | | 4/3/2020 | | 4/15/2020 | | $ | 0.06 | |
| 12/2/2019 | | 1/3/2020 | | 1/15/2020 | | 0.06 | |
Subsequent to the dividend paid on April 15, 2020, our Board suspended future dividends.
NOTE 14 - ACCUMULATED OTHER COMPREHENSIVE LOSSINCOME (LOSS)
The following tables reflect the changes in Accumulated other comprehensive lossincome (loss) related to Cliffs shareholders’ equity:
| | | (In Millions) | | (In Millions) |
| | Postretirement Benefit Liability,
net of tax | | Foreign Currency Translation | | Derivative Financial Instruments, net of tax | | Accumulated Other Comprehensive Loss | | Postretirement Benefit Liability,
net of tax | | Foreign Currency Translation | | Derivative Financial Instruments, net of tax | | Accumulated Other Comprehensive Income (Loss) |
| December 31, 2020 | December 31, 2020 | $ | (135) | | | $ | 3 | | | $ | (1) | | | $ | (133) | | December 31, 2020 | $ | (135) | | | $ | 3 | | | $ | (1) | | | $ | (133) | |
| Other comprehensive income (loss) before reclassifications | Other comprehensive income (loss) before reclassifications | 0 | | | (1) | | | 8 | | | 7 | | Other comprehensive income (loss) before reclassifications | — | | | (1) | | | 8 | | | 7 | |
| Net (gain) loss reclassified from accumulated other comprehensive loss | 7 | | | 0 | | | (1) | | | 6 | | |
| Net (income) loss reclassified from AOCI | | Net (income) loss reclassified from AOCI | 7 | | | — | | | (1) | | | 6 | |
| March 31, 2021 | March 31, 2021 | $ | (128) | | | $ | 2 | | | $ | 6 | | | $ | (120) | | March 31, 2021 | $ | (128) | | | $ | 2 | | | $ | 6 | | | $ | (120) | |
| Other comprehensive income before reclassifications | | Other comprehensive income before reclassifications | — | | | — | | | 51 | | | 51 | |
| Net (income) loss reclassified from AOCI | | Net (income) loss reclassified from AOCI | 7 | | | — | | | (4) | | | 3 | |
| June 30, 2021 | | June 30, 2021 | $ | (121) | | | $ | 2 | | | $ | 53 | | | $ | (66) | |
| Other comprehensive income before reclassifications | | Other comprehensive income before reclassifications | — | | | — | | | 93 | | | 93 | |
| Net (income) loss reclassified from AOCI | | Net (income) loss reclassified from AOCI | 6 | | | — | | | (10) | | | (4) | |
| September 30, 2021 | | September 30, 2021 | $ | (115) | | | $ | 2 | | | $ | 136 | | | $ | 23 | |
|
| | | | | | | | | | | | | | | | | | | | | | | |
| (In Millions) |
| Postretirement Benefit Liability, net of tax | | Foreign
Currency Translation | | Derivative Financial Instruments, net of tax | | Accumulated Other Comprehensive Loss |
| December 31, 2019 | $ | (316) | | | $ | — | | | $ | (3) | | | $ | (319) | |
| Other comprehensive loss before reclassifications | — | | | (1) | | | (5) | | | (6) | |
| Net loss reclassified from AOCI | 6 | | | — | | | 2 | | | 8 | |
| March 31, 2020 | $ | (310) | | | $ | (1) | | | $ | (6) | | | $ | (317) | |
| Other comprehensive income before reclassifications | — | | | 1 | | | 1 | | | 2 | |
| Net loss reclassified from AOCI | 6 | | | — | | | 3 | | | 9 | |
| June 30, 2020 | $ | (304) | | | $ | — | | | $ | (2) | | | $ | (306) | |
| Other comprehensive income before reclassifications | — | | | 2 | | | 12 | | | 14 | |
| Net loss reclassified from AOCI | 6 | | | — | | | 4 | | | 10 | |
| September 30, 2020 | $ | (298) | | | $ | 2 | | | $ | 14 | | | $ | (282) | |
| | | | | | | |
| | | | | | | |
| | | | | | | |
| | | | | | | | | | | | | | | | | | | | | | | |
| (In Millions) |
| Postretirement Benefit Liability, net of tax | | Foreign
Currency Translation | | Derivative Financial Instruments, net of tax | | Accumulated Other Comprehensive Loss |
| December 31, 2019 | $ | (316) | | | $ | 0 | | | $ | (3) | | | $ | (319) | |
| Other comprehensive loss before reclassifications | 0 | | | (1) | | | (5) | | | (6) | |
| Net loss reclassified from accumulated other comprehensive loss | 6 | | | 0 | | | 2 | | | 8 | |
| March 31, 2020 | $ | (310) | | | $ | (1) | | | $ | (6) | | | $ | (317) | |
| | | | | | | |
| | | | | | | |
| | | | | | | |
| | | | | | | |
| | | | | | | |
| | | | | | | |
| | | | | | | |
| | | | | | | |
| | | | | | | |
The following table reflects the details about Accumulated other comprehensive lossincome (loss) components reclassified from Cliffs shareholders’ equity:
| | | | (In Millions) | | | (In Millions) | |
| Details about Accumulated Other Comprehensive Loss Components | | | Amount of (Gain)/Loss Reclassified into Income, Net of Tax | | Affected Line Item in the Statement of Unaudited Condensed Consolidated Operations | |
| | Three Months Ended
March 31, | | Affected Line Item in the Statement of Unaudited Condensed Consolidated Operations | |
| | 2021 | | | |
| Amortization of pension and OPEB liability: | | | | | | |
| | Details about Accumulated Other Comprehensive Income (Loss) Components | | Details about Accumulated Other Comprehensive Income (Loss) Components | | Amount of (Income)/Loss Reclassified into Income, Net of Tax | | Affected Line Item in the Statement of Unaudited Condensed Consolidated Operations |
| | Three Months Ended
September 30, | | Nine Months Ended
September 30, | |
| | 2021 | | 2020 | | 2021 | | 2020 | |
| Changes in pension and OPEB: | | Changes in pension and OPEB: | | | | | | | | | | |
| Prior service credits | | Prior service credits | | $ | (1) | | | $ | — | | | $ | (1) | | | $ | (1) | | | Net periodic benefit credits other than service cost component |
| Net actuarial loss | Net actuarial loss | | | $ | 9 | | | $ | 7 | | | Other non-operating income | Net actuarial loss | | 9 | | | 8 | | | 27 | | | 23 | | | Net periodic benefit credits other than service cost component |
| | | 8 | | | 8 | | | 26 | | | 22 | | | Total before taxes |
| Income tax benefit | Income tax benefit | | | (2) | | | (1) | | | Income tax benefit (expense) | Income tax benefit | | (2) | | | (2) | | | (6) | | | (4) | | | Income tax benefit (expense) |
| Net of taxes | Net of taxes | | | $ | 7 | | | $ | 6 | | | Net of taxes | | $ | 6 | | | $ | 6 | | | $ | 20 | | | $ | 18 | | |
| | Changes in derivative financial instruments: | Changes in derivative financial instruments: | | | | Changes in derivative financial instruments: | |
| Commodity contracts | Commodity contracts | | | $ | (1) | | | $ | 3 | | | Cost of goods sold | Commodity contracts | | $ | (13) | | | $ | 4 | | | $ | (19) | | | $ | 11 | | | Cost of goods sold |
| Income tax benefit | | | 0 | | | (1) | | | Income tax benefit (expense) | |
| Income tax (benefit) expense | | Income tax (benefit) expense | | 3 | | | — | | | 4 | | | (2) | | | Income tax benefit (expense) |
| Net of taxes | Net of taxes | | | $ | (1) | | | $ | 2 | | | Net of taxes | | $ | (10) | | | $ | 4 | | | $ | (15) | | | $ | 9 | | |
| | Total reclassifications for the period, net of tax | Total reclassifications for the period, net of tax | | | $ | 6 | | | $ | 8 | | | Total reclassifications for the period, net of tax | | $ | (4) | | | $ | 10 | | | $ | 5 | | | $ | 27 | | |
NOTE 15 - RELATED PARTIES
We have certain co-owned joint ventures with companies from the steel and mining industries, including integrated steel companies, their subsidiaries and other downstream users of steel and iron ore products.
Hibbing is a co-owned joint venture inof which we own 85.3% and U.S. Steel owns 14.7% as of March 31,September 30, 2021. As a result of the AM USA Transaction, we acquired an additional 62.3% ownership stake in the Hibbing mine and became the majority owner and mine manager. Prior to the AM USA Transaction, ArcelorMittal was a related party due to its ownership interest in Hibbing. As such, for the three and nine months ended March 31,September 30, 2020, certain long-term contracts with ArcelorMittal resulted in Revenues from related parties. As of March 31,September 30, 2020, we owned 23% of Hibbing.
Revenues from related parties were as follows:
| | | | (In Millions) | | (In Millions) |
| | | Three Months Ended
March 31, | | Three Months Ended
September 30, | | Nine Months Ended
September 30, |
| | | 2021 | | 2020 | | 2021 | | 2020 | | 2021 | | 2020 |
| Revenue from related parties | | $ | 77 | | | $ | 11 | | |
| Revenues from related parties | | Revenues from related parties | $ | 11 | | | $ | 294 | | | $ | 123 | | | $ | 587 | |
| Revenues | Revenues | | $ | 4,049 | | | $ | 359 | | Revenues | $ | 6,004 | | | $ | 1,646 | | | $ | 15,098 | | | $ | 3,098 | |
| Related party revenues as a percent of Revenues | Related party revenues as a percent of Revenues | | 2 | % | | 3 | % | Related party revenues as a percent of Revenues | — | % | | 18 | % | | 1 | % | | 19 | % |
| Purchases from related parties | Purchases from related parties | | $ | 27 | | | $ | 3 | | Purchases from related parties | $ | 16 | | | $ | 8 | | | $ | 58 | | | $ | 20 | |
The following table presents the classification of related party assets and liabilities in the Statements of Unaudited Condensed Consolidated Financial Position:
| | | (In Millions) | | (In Millions) |
| Balance Sheet Location of Assets (Liabilities) | Balance Sheet Location of Assets (Liabilities) | | March 31,
2021 | | December 31,
2020 | Balance Sheet Location of Assets (Liabilities) | | September 30,
2021 | | December 31,
2020 |
| Accounts receivable, net | Accounts receivable, net | | $ | 30 | | | $ | 2 | | Accounts receivable, net | | $ | 4 | | | $ | 2 | |
| | Accounts payable | Accounts payable | | (9) | | | (6) | | Accounts payable | | (7) | | | (6) | |
|
NOTE 16 - VARIABLE INTEREST ENTITIES
SunCoke Middletown
We purchase all the coke and electrical power generated from SunCoke Middletown’s plant under long-term supply agreements and have committed to purchase all the expected production from the facility through 2032. We consolidate SunCoke Middletown as a VIE because we are the primary beneficiary despite having no ownership interest in SunCoke Middletown. SunCoke Middletown had income before income taxes of $17$11 million and $4$43 million for the three and nine months ended March 31,September 30, 2021, respectively, compared to $11 million and $31 million for the three and nine months ended September 30, 2020, respectively, that was included in our consolidated income before income taxes.
The assets of the consolidated VIE can only be used to settle the obligations of the consolidated VIE and not obligations of the Company. The creditors of SunCoke Middletown do not have recourse to the assets or general credit of the Company to satisfy liabilities of the VIE. The Statements of Unaudited Condensed Consolidated Financial Position includes the following amounts for SunCoke Middletown:
| | | (In Millions) | | (In Millions) |
| | March 31,
2021 | | December 31,
2020 | | September 30,
2021 | | December 31,
2020 |
| Cash and cash equivalents | Cash and cash equivalents | $ | 4 | | | $ | 5 | | Cash and cash equivalents | $ | — | | | $ | 5 | |
| Inventories | Inventories | 22 | | | 21 | | Inventories | 21 | | | 21 | |
| Property, plant and equipment, net | Property, plant and equipment, net | 304 | | | 308 | | Property, plant and equipment, net | 303 | | | 308 | |
| Accounts payable | Accounts payable | (12) | | | (15) | | Accounts payable | (17) | | | (15) | |
| Other assets (liabilities), net | Other assets (liabilities), net | 1 | | | (10) | | Other assets (liabilities), net | (12) | | | (10) | |
| Noncontrolling interests | Noncontrolling interests | (319) | | | (309) | | Noncontrolling interests | (295) | | | (309) | |
NOTE 17 - EARNINGS PER SHARE
The following table summarizes the computation of basic and diluted earnings per share:
| | | | (In Millions, Except Per Share Amounts) | | (In Millions, Except Per Share Amounts) |
| | | Three Months Ended
March 31, | | Three Months Ended
September 30, | | Nine Months Ended
September 30, |
| | | 2021 | | 2020 | | 2021 | | 2020 | | 2021 | | 2020 |
| Income (loss) from continuing operations | Income (loss) from continuing operations | | $ | 57 | | | $ | (50) | | Income (loss) from continuing operations | $ | 1,281 | | | $ | 2 | | | $ | 2,132 | | | $ | (155) | |
| Income from continuing operations attributable to noncontrolling interest | Income from continuing operations attributable to noncontrolling interest | | (16) | | | (3) | | Income from continuing operations attributable to noncontrolling interest | (8) | | | (12) | | | (39) | | | (31) | |
| Net income (loss) from continuing operations attributable to Cliffs shareholders | Net income (loss) from continuing operations attributable to Cliffs shareholders | | 41 | | | (53) | | Net income (loss) from continuing operations attributable to Cliffs shareholders | 1,273 | | | (10) | | | 2,093 | | | (186) | |
| Income from discontinued operations, net of tax | Income from discontinued operations, net of tax | | 0 | | | 1 | | Income from discontinued operations, net of tax | 1 | | | — | | | 2 | | | — | |
| Net income (loss) attributable to Cliffs shareholders | Net income (loss) attributable to Cliffs shareholders | | $ | 41 | | | $ | (52) | | Net income (loss) attributable to Cliffs shareholders | $ | 1,274 | | | $ | (10) | | | $ | 2,095 | | | $ | (186) | |
| | Weighted average number of shares: | Weighted average number of shares: | | | Weighted average number of shares: | |
| Basic | Basic | | 490 | | 298 | Basic | 500 | | | 399 | | | 497 | | 365 |
| Redeemable preferred shares | Redeemable preferred shares | | 58 | | 0 | Redeemable preferred shares | 17 | | | — | | | 44 | | — |
| Convertible senior notes | Convertible senior notes | | 19 | | 0 | Convertible senior notes | 24 | | | — | | | 21 | | — |
| Employee stock plans | Employee stock plans | | 4 | | 0 | Employee stock plans | 6 | | | — | | | 5 | | — |
| Diluted | Diluted | | 571 | | 298 | Diluted | 547 | | | 399 | | | 567 | | 365 |
| Earnings (loss) per common share attributable to Cliffs shareholders - basic1: | Earnings (loss) per common share attributable to Cliffs shareholders - basic1: | | | Earnings (loss) per common share attributable to Cliffs shareholders - basic1: | |
| Continuing operations | Continuing operations | | $ | 0.08 | | | $ | (0.18) | | Continuing operations | $ | 2.46 | | | $ | (0.02) | | | $ | 3.87 | | | $ | (0.51) | |
| Discontinued operations | Discontinued operations | | 0 | | | 0 | | Discontinued operations | — | | | — | | | — | | | — | |
| | | $ | 0.08 | | | $ | (0.18) | | | $ | 2.46 | | | $ | (0.02) | | | $ | 3.87 | | | $ | (0.51) | |
| | Earnings (loss) per common share attributable to Cliffs shareholders - diluted: | Earnings (loss) per common share attributable to Cliffs shareholders - diluted: | | | Earnings (loss) per common share attributable to Cliffs shareholders - diluted: | |
| Continuing operations | Continuing operations | | $ | 0.07 | | | $ | (0.18) | | Continuing operations | $ | 2.33 | | | $ | (0.02) | | | $ | 3.69 | | | $ | (0.51) | |
| Discontinued operations | Discontinued operations | | 0 | | | 0 | | Discontinued operations | — | | | — | | | — | | | — | |
| | | $ | 0.07 | | | $ | (0.18) | | | $ | 2.33 | | | $ | (0.02) | | | $ | 3.69 | | | $ | (0.51) | |
| 1 For the three months ended March 31, 2021, basic earnings per share is calculated by dividing Net income (loss) attributable to Cliffs shareholders, less $4 million of earnings attributed to Series B Participating Redeemable Preferred Stock, by the weighted average number of basic common shares outstanding during the period presented. | |
1 For the three and nine months ended September 30, 2021, basic earnings per share is calculated by dividing Net income (loss) attributable to Cliffs shareholders, less $42 million and $172 million, respectively, of earnings attributed to Series B Participating Redeemable Preferred Stock, by the weighted average number of basic common shares outstanding during the period presented. | | 1 For the three and nine months ended September 30, 2021, basic earnings per share is calculated by dividing Net income (loss) attributable to Cliffs shareholders, less $42 million and $172 million, respectively, of earnings attributed to Series B Participating Redeemable Preferred Stock, by the weighted average number of basic common shares outstanding during the period presented. |
For both the three and nine months ended March 31,September 30, 2020, we had 2 million shares related to employee stock plans that were excluded from the diluted EPS calculation as they were anti-dilutive. There was 0no dilution during the three and nine months ended March 31,September 30, 2020 related to the common share equivalents for the convertible senior notes as our common shares average price did not rise aboveexceed the conversion price.
NOTE 18 - COMMITMENTS AND CONTINGENCIES
Purchase Commitments
We purchase portions of the principal raw materials required for our steel manufacturing operations under annual and multi-year agreements, some of which have minimum quantity requirements. We also use large volumes of natural gas, electricity and industrial gases in our steel manufacturing operations. We negotiate most of our purchases of chrome, industrial gases and a portion of our electricity under multi-year agreements. Our purchases of coke are made under annual or multi-year agreements with periodic price adjustments. We typically purchase coal under annual fixed-price agreements. We also purchase certain transportation services under multi-year contracts with minimum quantity requirements.
Contingencies
We are currently the subject of, or party to, various claims and legal proceedings incidental to our current and historical operations. These claims and legal proceedings are subject to inherent uncertainties and unfavorable rulings could occur. An unfavorable ruling could include monetary damages, additional funding requirements or an injunction. If an unfavorable ruling were to occur, there exists the possibility of a material adverse effect on the financial position and results of operations for the period in which the ruling occurs or future periods. However, based on currently available information we do not believe that any pending claims or legal proceedings will result in a material adverse effect in relation to our consolidated financial statements.
Environmental Contingencies
Although we believe our operating practices have been consistent with prevailing industry standards, hazardous materials may have been released at operating sites or third-party sites in the past, including operating sites that we no longer own. If we reasonably can, we estimate potential remediation expenditures for those sites where future remediation efforts are probable based on identified conditions, regulatory requirements or contractual obligations arising from the sale of a business or facility. For sites involving government requiredgovernment-required investigations, we typically make an estimate of potential remediation expenditures only after the investigation is complete and when we better understand the nature and scope of remediation is determined or approved by the remediation.relevant environmental agencies. In general, the material factors in these estimates include the costs associated with investigations, delineations, risk assessments, remedial work, governmental response and oversight, site monitoring, and preparation of reports to the appropriate environmental agencies.
The following is a summary of our environmental obligations:
| | | (In Millions) | | (In Millions) |
| | March 31,
2021 | | December 31,
2020 | | September 30,
2021 | | December 31,
2020 |
| Environmental obligations | Environmental obligations | $ | 134 | | | $ | 135 | | Environmental obligations | $ | 161 | | | $ | 135 | |
| Less: current portion | Less: current portion | 20 | | | 18 | | Less: current portion | 16 | | | 18 | |
| Long-term environmental obligations | Long-term environmental obligations | $ | 114 | | | $ | 117 | | Long-term environmental obligations | $ | 145 | | | $ | 117 | |
The increase in environmental obligations as of September 30, 2021, compared to December 31, 2020, relates to measurement period adjustments as a result of the preliminary purchase price allocation of the AM USA Transaction.
We cannot predict the ultimate costs for each site with certainty because of the evolving nature of the investigation and remediation process. Rather, to estimate the probable costs, we must make certain assumptions. The most significant of these assumptions is for the nature and scope of the work that will be necessary to investigate and remediate a particular site and the cost of that work. Other significant assumptions include the cleanup technology that will be used, whether and to what extent any other parties will participate in paying the investigation and remediation costs, reimbursement of past response costs and future oversight costs by governmental agencies, and the reaction of the governing environmental agencies to the proposed work plans. Costs for future investigation and remediation are not discounted to their present value, unless the amount and timing of the cash disbursements are readily known. To the extent that we have been able to reasonably estimate future liabilities, we do not believe that there is a reasonable possibility that we will incur a loss or losses that exceed the amounts we accrued for the environmental matters discussed below that would, either individually or in the aggregate, have a material adverse effect on our consolidated financial condition, results of operations or cash flows. However, since we recognize amounts in the consolidated financial statements in accordance with GAAP that exclude potential losses that are not probable or that may not be currently estimable, the ultimate costs of these environmental matters may be higher than the liabilities we currently have recorded in our consolidated financial statements.
Pursuant to RCRA, which governs the treatment, handling and disposal of hazardous waste, the EPA and authorized state environmental agencies may conduct inspections of RCRA-regulated facilities to identify areas where there have been releases of hazardous waste or hazardous constituents into the environment and may order the facilities to take corrective action to remediate such releases. Likewise, the EPA or the states may require closure or post-closure care of residual, industrial and hazardous waste management units, including, but not limited to, landfills and deep injection wells. Environmental regulators have the authority to inspect all of our facilities. While we cannot predict the future actions of these regulators, it is possible that they may identify conditions in future inspections of these facilities that they believe require corrective action.
Pursuant to CERCLA, the EPA and state environmental authorities have conducted site investigations at some of our facilities and other third-party facilities, portions of which previously may have been used for disposal of materials that are currently regulated. The results of these investigations are still pending, and we could be directed to spend funds for remedial activities at the former disposal areas. Because of the uncertain status of these
investigations, however, we cannot reasonably predict whether or when such spending might be required or its magnitude.
On April 29, 2002, AK Steel entered a mutually agreed-upon administrative order with the consent of the EPA pursuant to Section 122 of CERCLA to perform a RI/FS of the Hamilton plant site located in New Miami, Ohio. The plant ceased operations in 1990 and all of its former structures have been demolished. AK Steel submitted the investigation portion of the RI/FS and completed supplemental studies. Until the RI/FS is complete, we cannot reasonably estimate the additional costs, if any, we may incur for potentially required remediation of the site or when we may incur them.
EPA Administrative Order In Re: Ashland Coke
On September 26, 2012, the EPA issued an order under Section 3013 of RCRA requiring a plan to be developed for investigation of four4 areas at the Ashland Works coke plant. The Ashland Works coke plant ceased operations in 2011 and all of its former structures have been demolished and removed. In 1981, AK Steel acquired the plant from Honeywell International Corporation (as successor to Allied Corporation), who had managed the coking operations there for approximately 60 years. In connection with the sale of the coke plant, Honeywell agreed to indemnify AK Steel against certain claims and obligations that could arise from the investigation, and we intend to pursue such indemnification from Honeywell, if necessary. We cannot reasonably estimate how long it will take to complete the site investigation. On March 10, 2016, the EPA invited AK Steel to participate in settlement discussions regarding an enforcement action. Settlement discussions between the parties are ongoing, though whether the parties will reach agreement and any such agreement’s terms are uncertain. Until the site investigation is complete, we cannot reasonably estimate the costs, if any, we may incur for potential additional required remediation of the site or when we may incur them.
Burns Harbor Water Issues
In August 2019, ArcelorMittal Burns Harbor LLC (n/k/a Cleveland-Cliffs Burns Harbor LLC) suffered a loss of the blast furnace cooling water recycle system, which led to the discharge of cyanide and ammonia in excess of the Burns Harbor plant's NPDES permit limits. Since that time, the facility has taken numerous steps to prevent recurrence and maintain compliance with its NPDES permit. Since the August 2019 event, we have been engaged in settlement discussions with the U.S. Department of Justice, the EPA and the State of Indiana to resolve any alleged violations of environmental laws or regulations. Also, ArcelorMittal Burns Harbor LLC was served with a subpoena on December 5, 2019, from the United States District Court for the Northern District of Indiana relating to the August 2019 event and has responded to the subpoena requests. In addition, the plaintiffs in Environmental Law & Policy Center et al. v. ArcelorMittal Burns Harbor LLC et al. (U.S. District Court, N.D. Indiana Case No. 19-cv-473), which was filed on December 20, 2019, have alleged violations resulting from the August 2019 event and other Clean Water Act claims. Although we cannot accurately estimateWhile the amount of civil penalty,monetary sanctions, the cost of any injunctive relief requirements, orand the costs to resolve third-party claims, including potential natural resource damages claims, they are likely to exceed the reporting threshold in total.total, we believe that the ultimate disposition of any such proceedings will not have, individually or in the aggregate, a material adverse effect on our consolidated financial condition, results of operations or cash flows.
In addition to the foregoing matters, we are or may befrom time to time involved in proceedings with various regulatory authorities that may require us to pay fines, comply with more rigorous standards or other requirements or incur capital and operating expenses for environmental compliance. We believe that the ultimate disposition of any such proceedings will not have, individually or in the aggregate, a material adverse effect on our consolidated financial condition, results of operations or cash flows.
Tax Matters
The calculation of our tax liabilities involves dealing with uncertainties in the application of complex tax regulations. We recognize liabilities for anticipated tax audit issues based on our estimate of whether, and the extent to which, additional taxes will be due. If we ultimately determine that payment of these amounts is unnecessary, we reverse the liability and recognize a tax benefit during the period in which we determine that the liability is no longer necessary. We also recognize tax benefits to the extent that it is more likely than not that our positions will be sustained when challenged by the taxing authorities. To the extent we prevail in matters for which liabilities have been established, or are required to pay amounts in excess of our liabilities, our effective tax rate in a given period could be materially affected. An unfavorable tax settlement would require use of our cash and result in an increase in our
effective tax rate in the year of resolution. A favorable tax settlement would be recognized as a reduction in our effective tax rate in the year of resolution. Refer to NOTE 11 - INCOME TAXES for further information.
Other Contingencies
In addition to the matters discussed above, there are various pending and potential claims against us and our subsidiaries involving product liability, personal injury, commercial, employee benefits and other matters arising in the ordinary course of business. Because of the considerable uncertainties that exist for any claim, it is difficult to reliably or accurately estimate what the amount of a loss would be if a claimant prevails. If material assumptions or factual understandings we rely on to evaluate exposure for these contingencies prove to be inaccurate or otherwise change, we may be required to record a liability for an adverse outcome. If, however, we have reasonably evaluated potential future liabilities for all of these contingencies, including those described more specifically above, it is our opinion, unless we otherwise noted, that the ultimate liability from these contingencies, individually or in the aggregate, should not have a material adverse effect on our consolidated financial position, results of operations or cash flows.
NOTE 19 - SUBSEQUENT EVENTS
We have evaluated subsequent events through the date of financial statement issuance.
| | | | | |
| Item 2. | Management's Discussion and Analysis of Financial Condition and Results of Operations |
Management's Discussion and Analysis of Financial Condition and Results of Operations is designed to provide a reader of our financial statements with a narrative from the perspective of management on our financial condition, results of operations, liquidity and other factors that may affect our future results. We believe it is important to read our Management's Discussion and Analysis of Financial Condition and Results of Operations in conjunction with our Annual Report on Form 10-K for the year ended December 31, 2020, as well as other publicly available information.
Overview
Cleveland-CliffsCliffs is the largest flat-rolled steel producer in North America. Founded in 1847 as a mine operator, we are also the largest producermanufacturer of iron ore pellets in North America. In 2020, we acquired two major steelmakers, AK SteelWe are vertically integrated from mined raw materials and ArcelorMittal USA, vertically integratingdirect reduced iron to primary steelmaking and downstream finishing, stamping, tooling, and tubing. We serve a diverse range of markets due to our legacy iron ore business with quality-focusedcomprehensive offering of flat-rolled steel productionproducts and emphasis onare the largest supplier of steel to the automotive end market. Our fully integrated portfolio includes custom-made pellets and HBI; flat-rolled carbon steel, stainless, electrical, plate, tinplate and long steel products; and carbon and stainless steel tubing, hot and cold stamping and tooling.industry in North America. Headquartered in Cleveland, Ohio, we employ approximately 25,000 people across our mining, steel and downstream manufacturing operations in the United States and Canada.
On October 8, 2021, we entered into the FPT Acquisition Agreement, pursuant to which Cliffs will acquire FPT. We expect to complete the FPT Acquisition in the fourth quarter of 2021, subject to the receipt of regulatory approvals and the satisfaction of other customary closing conditions. Unless otherwise noted, discussion of our business and results of operations in this Quarterly Report on Form 10-Q refers to our continuing operations on a stand-alone basis without giving effect to the pending FPT Acquisition.
Economic Overview
The fundamentals for our business have rebounded strongly since the COVID-19 pandemic disruption that occurred during 2020. The price for domestic HRC, the most significant index in driving our revenues and profitability, currently is at an all-time high, as a direct result of favorable supply-demand dynamics following the pandemic.high. The HRC index averaged $1,201$1,500 per net ton for the first quarternine months of 2021, 105%188% higher than the same period last year.
The dramatic increase in the HRC price is a result of both supply and demand factors. Healthy consumer balance sheets have driven strong demand for light vehicles and consumer goods, such as HVAC products and appliances. In addition, demandDemand from machinery and equipment producers has remainedalso been robust. The demand for light vehicles has also been strong; however, automotive supply chain difficulties have limited the demand for steel from automotive manufacturers. On the supply side, spot steel availability remains very limited as steel production in the U.S. has not recovered from the facility shutdowns that occurred during the early pandemic period.been limited. Import penetration has grown slightly but remains lower than its prior five-year average due to healthy demand globally as well as trade restrictions such as the Section 232 tariffs.
Along with these supply-demand factors, pricing for HRC has also risen due to the rise in the price of steelmaking input costs both domestically and globally, most notably for iron units. The price of busheling scrap, a necessary input for flat-rolled steel production in EAFs in the U.S., averaged $535$600 per long ton during the first quarternine months of 2021, a 70%107% increase from the prior-year period. We expect the price of busheling scrap to remain elevated due to decreasing prime scrap generation from original equipment manufacturers and the growth of EAF
capacity in the U.S., along with a push for expanded EAF production in China.scrap use globally. As we are fully-integrated and have primarily a blast furnace footprint, the rising prices for busheling scrap in the U.S. bolster our competitive advantage, as we source the majority of our iron feedstock from our stable-cost mining and pelletizing operations in Minnesota and Michigan. The rising price of busheling scrap should also enhance the benefit of sourcing more scrap internally following the profitability of our HBI sold externally,FPT Acquisition and provide greater cost savings potential for HBI used internally.
TheWhile it has fallen in recent months, the price of iron ore has also risen dramatically over the past year, which, along with strong demand, has been an important factor in rising steel prices globally. The Platts 62% Price averaged $167$177 per metric ton in the first quarternine months of 2021, an 88%a 77% increase compared to the same period in 2020. While playinghigher iron ore prices play a role in increased steel prices, of steel, we also directly benefit from higher iron ore prices for the portion of iron ore pellets we sell to third parties.
The largest market for our steel products is the automotive industry in North America, which makes light vehicle production a key driver of demand. In the first quarternine months of 2021, North American light vehicle production was approximately 3.69.8 million units, a 5% reduction7% increase from the prior year’s comparable period. The reductionThis increase is primarily due to the ongoing recovery from the COVID-19 pandemic, though automotive production has been adversely affected in 2021 by the global semiconductor shortage. In addition to the semiconductor shortage, production in North America has also experienced weather‐relatedas well as other material shortages and other supply chain disruptions, including a petrochemical shortage.disruptions. This has caused several outages amongst light vehicle manufacturers. In light of these production outages, we have been able to redirect certain volumes originally intended for this end market to the spot market, where demand ishas been strong and pricing is at ancontinues to remain near all-time high.highs.
During the first quarternine months of 2021, light vehicle sales in the U.S. saw a SAARseasonally adjusted annualized rate of approximately 16.715.7 million units with 3.73.5 million passenger cars and 13.012.2 million light trucks sold. The first quarter average represents an 11%sold, representing a 13% increase over the first nine months of 2020. These improved sales, combined with continued production difficulties, brought light vehicle inventories to an all-time low of 22 days' supply during the third quarter of 2020. However, the most recent sales data from March reflected an increase in sales to a SAAR of 17.9 million units, the highest sales rate in 41 months, leaving dealer inventories at multi-year lows.2021.
Competitive Strengths
As the largest flat-rolled steel producer in North America, we benefit from having the size and scale necessary in a competitive, capital intensive business. Our sizeable operating footprint provides us with the operational leverage, flexibility and cost performance to achieve competitive margins throughout the business cycle. We also have a unique vertically integrated profile, which begins at the mining stage and goes all the way through the manufacturing of steel products, including stamping, tooling and tubing. This positioning gives us both lower and more predictable costs throughout the supply chain and more control over both our manufacturing inputs and our end product destination.
Our legacy business of producing iron ore pellets, which is our primary steelmaking raw material input, is another competitive advantage. Mini-mills (producers using EAFs) now comprise about 70% of steel production in the U.S. Their primary iron input is scrap metal, which has unpredictable and often volatile pricing. By controlling our iron ore pellet supply, our primary steelmaking raw material feedstock can be secured at a stable and predictable cost and not be subject to factors outside of our control.
We are also the largest supplier of automotive-grade steel in the U.S. Compared to other steel end markets, automotive steel is generally higher quality and more operationally and technologically intensive to produce. As such, it often generates higher through-the-cycle margins, making it a desirable end market for the steel industry. With our continued technological innovation, as well as leading delivery performance, we expect to remain the leader in supplying this industry.
We believe we offer the most comprehensive flat-rolled steel product selection in the industry, along with several complementary products and services. A sampling of this offering includes advanced high-strength steel, hot-dipped galvanized, aluminized, galvalume, electrogalvanized, galvanneal, HRC, cold-rolled coil, plate, tinplate, grain oriented electrical steel, non-oriented electrical steel, stainless steels, tool &and die, stamped components, rail and slabs. Across the quality spectrum and the supply chain, our customers can frequently find the solutions they need from our product selection.
We are the first and the only producer of HBI in the Great Lakes region. Construction of our Toledo, Ohio, direct reduction plant was completed in the fourth quarter of 2020. From this modern plant, we produce a high-quality, low-cost and low-carbon intensive HBI product that can be used in our blast furnaces as a productivity enhancer for our BOFs and EAFs as a scrap and pig iron alternative. Ore-based metallics that compete with our HBI generally have to be imported from locations like Russia, Ukraine and Brazil. With increasing tightness in the scrap market and our own internal needs for scrap and metallics, we expect our Toledo direct reduction plant to support healthy Steelmaking margins for us going forward.
Strategy
Optimizing Our Fully-Integrated Steelmaking Footprint
We have transformed into a fully-integrated steel enterprise with the size and scale to achieve improved through-the-cycle margins and are the largest flat-rolled steel producer in North America. We will also bolster our raw material portfolio with the FPT Acquisition, a leading prime scrap processor in the U.S.
Now that the AM USA Transaction is completed, ourOur focus is on meeting the integration of these facilities within our footprint. These assets build upon our existing high-end steelmaking and raw material capabilities, and also open up new markets to us. The combination provides uscurrently strong demand environment for steel. We have the additional scale and technical capabilities necessary in a
competitive and increasingly quality-focused marketplace. We have ample opportunities to implementimplemented improvements in logistics, procurement, utilization and quality.
We expect the AM USA Transactionquality, and will continue to improve our production capabilities, flexibility, and cost performance. We have targeted approximately $150 million of potential cost synergies through asset optimization, economies of scale, and duplicative overhead savings. The transaction also provided us additional accessexplore opportunities to non-automotive industries with pricing correlated to the U.S. HRC index, which currently is at an all-time high.do so.
Maximizing Our Commercial Strengths
With the Acquisitions completed, we now have enhanced our offering toWe offer a full suite of flat steel products encompassing all steps of the steel manufacturing process. We have increased ouran industry-leading market share in the automotive sector, where our portfolio of high-end products will deliverdelivers a broad range of differentiated solutions for this highly sought after customer base.
We believe we have the broadest flat steel product offering in North America and can meet customer needs from a variety of end markets and quality specifications. We have several finishing and downstream facilities with advanced technological capabilities.
We are also proponents of the “value over volume” approach in terms of steel supply. We take our leadership role in the industry very seriously and intend to manage our steel output in a responsible manner.
ExpandingExpand our Ferrous Scrap Recycling Presence
Throughout our entire footprint, we consume a very significant amount of scrap in our EAFs and BOFs, of which currently more than half must be purchased from third parties. Prime scrap supply has been shrinking in the U.S. for the last 50 years and is unlikely to New Marketsgrow materially in the future. As the steel industry continues to increase its focus on decarbonization and with the new flat-rolled EAF capacity set to come online over the next five years, securing access to prime scrap has become an important strategic initiative.
Our Toledo direct reduction plant allowsexpansion in this area will be accomplished with the FPT Acquisition. As the largest supplier of flat-rolled steel in North America, we are the largest source of the steel that generates prime scrap in manufacturing facilities. Based on this, we seek to leverage our long-standing flat-rolled automotive and other customer relationships into recycling partnerships to grow our prime scrap presence. The FPT Acquisition will also allow us to offer another unique, high-quality productoptimize productivity at our existing EAFs and BOFs, as we have no current plans to discerning raw material buyers. EAF steelmakers primarily use scrap for their iron feedstock, andadd additional steelmaking capacity.
Advancing our HBI offers a sophisticated alternative with less impurities, allowing other steelmakers to increaseParticipation in the quality of their respective end-steel products and reduce reliance on imported metallics.
The completed Acquisitions provide other potential outlets for HBI, as it can also be used in our integrated steel operations to increase productivity and help to reduce carbon footprint, allowing for more cost efficient and environmentally friendly steelmaking.Green Economy
We are also seeking to expand our customer base with the rapidly growing and desirable electric vehicle market. At this time, we believe the North American automotive industry is approaching a monumental inflection point, with the adoption of electrical motors in passenger vehicles. As this market grows, it will require more advanced steel applications to meet the needs of electric vehicle producers and consumers. With our unique technical capabilities, we believe we are positioned better than any other North American steelmaker to supply the steel and parts necessary to fill these needs.
Improving Financial FlexibilityWe also have the right products to meet the growing demand for renewable energy as well as for the modernization of the U.S. electrical grid. We offer plate products that can be used in windmills, which we estimate contain 130 tons of steel per megawatt of electricity. In addition, panels for solar power are heavy consumers of galvanized steel, where we are a leading producer. We estimate solar panels consume 40 tons of steel per megawatt of electricity.
GivenWe are currently the cyclicalitysole producer of our business, it is important to us to beelectrical steel in the financial position to easily withstand any negative demand or pricing pressure we may encounter. As such, our top priority forU.S., which can facilitate the allocationmodernization of our free cash flow is to improve our balance sheet via the reduction of long-term debt. During the COVID-19 pandemic, we were able to issue secured debt to provide insurance capital through the uncertain industry conditions that the pandemic caused. Now that business conditions have improved and we expect to generate healthy free cash flow during 2021, we have the ability to lower our long-term debt balance.
We anticipate that the current strong market environment will provide us ample opportunities to reduce our debtU.S. electrical grid. Along with our own free cash flow generation. We willcharging networks, electrical steels are also continue to review the composition of our debt, as we are interested in both extending our average maturity profile and increasing our ratio of unsecured debt to secured debt, which we demonstrated by executing a series of favorable debt and equity capital markets transactions during February 2021. These actions will better prepare us to navigate more easily through potentially volatile industry conditionsneeded in the future.motors of electric vehicles.
Enhance our Commitment to Environmental Sustainability
As we transform, ourOur commitment to operating our business in a more environmentally responsible manner remains constant. One of the most important issues impacting our industry, our stakeholders and our planet is climate change. As a result,In early 2021, we are continuing Cliffs’ proactive approach by committingannounced our commitment to reduce GHG emissions 25% from 2017 levels by 2030. This goal represents combined Scope 1 (direct) and Scope 2 (indirect) GHG emission reductions across all of our operations.
Prior to setting this goal with our newly acquired steel assets, we exceeded our previous 26% GHG reduction target at our legacy facilities six years ahead of our 2025 goal. In 2019, we reduced our combined Scope 1 and Scope 2 GHG emissions by 42% on a mass basis from 2005 baseline levels. Our goal is to further reduce those emissions in coming years.
Additionally, many of our steel assets have improved plant and energy efficiency through participation in programs like the U.S. Department of Energy’s Better Plants program and the EPA’s Energy Star program. With our longstanding focus on plant and energy efficiency, we aim to build on our previous successes across our newly integrated enterprise.
Our GHG reduction commitment is based on executing the following five strategic priorities:
•Developing domestically sourced, high quality iron ore feedstock and utilizing natural gas in the production of HBI;
•Implementing energy efficiency and clean energy projects;
•Investing in the development of carbon capture technology;
•Enhancing our GHG emissions transparency and sustainability focus; and
•Supporting public policies that facilitate GHG reduction in the domestic steel industry.
Improving Financial Flexibility
Recent Developments
Labor Agreements
On April 12,Given the cyclicality of our business, it is important to us to be in the financial position to easily withstand any negative demand or pricing pressure we may encounter. During the COVID-19 pandemic, we were able to issue secured debt to provide insurance capital through the uncertain industry conditions caused by the pandemic. Now that business conditions have improved, allowing us to generate a healthy free cash flow during 2021, we reachedhave the ability to make investments to both improve and grow our business, particularly as it pertains to scrap metal. We have also been able to reduce our diluted share count and effectively return capital to shareholders via the cash redemption of our Series B Participating Redeemable Preferred Stock during the third quarter of 2021.
We anticipate that the current strong market environment will provide us ample opportunities to reduce our debt with our own free cash flow generation. We will also continue to review the composition of our debt, as we are interested in both extending our average maturity profile and increasing our ratio of unsecured debt to secured debt, which we demonstrated by executing a tentative agreement with the USW for a new 53-month labor contract for our Mansfield Works employees that is effective asseries of April 1,favorable debt and equity capital markets transactions during February 2021. The new contract will cover approximately 300 USW-represented workers.
Financing Transactions
On February 11,In addition, in June 2021, we sold 20 million of our common shares and 40 million common shares were sold by an affiliate of ArcelorMittal, in an underwritten public offering. In each case, shares were sold at a price per share of $16.12. Prior to this sale, ArcelorMittal held approximately 78 million common shares, which were issued as a part of the consideration in connection with the AM USA Transaction. We did not receive any proceeds from the sale of the 40 million common shares sold on behalf of ArcelorMittal. We used the net proceeds from the offering, plus cash on hand, to redeem $322redeemed all $396 million aggregate principal amount outstanding of our outstanding 9.875%5.750% 2025 Senior Secured Notes. These actions will better prepare us to navigate more easily through potentially volatile industry conditions in the future.
Recent Developments
Acquisition of FPT
On February 17,October 8, 2021, we issued $500entered into the FPT Acquisition Agreement, pursuant to which Cliffs will acquire FPT for an aggregate purchase price of $775 million, aggregate principal amounton a cash-free, debt-free basis and subject to customary adjustment. We expect to complete the FPT Acquisition in the fourth quarter of 4.625% 2029 Senior Notes and $500 million aggregate principal amount of 4.875% 2031 Senior Notes in an offering that was exempt from the registration requirements2021. Completion of the Securities Act. We usedFPT Acquisition is subject to various customary closing conditions, including the net proceeds fromreceipt of required regulatory approvals, including the notes offering to redeem allexpiration or termination of the outstanding 4.875% 2024 Senior Secured Noteswaiting period under the Hart-Scott-Rodino Act, and 6.375% 2025 Senior Notes issuedit is possible factors outside of our control could result in the FPT Acquisition being completed at a later time or not at all. The FPT Acquisition Agreement also contains certain termination rights that may be exercised by Cleveland-Cliffs Inc. andeither party. We plan to complete the FPT Acquisition as soon as reasonably practicable following the satisfaction or waiver of all applicable conditions.
COVID-19 Vaccination Incentive Program
During the third quarter of 2021, we launched a COVID-19 vaccination incentive program with the outstanding 7.625% 2021 AK Senior Notes, 7.50% 2023 AK Senior Notes and 6.375% 2025 AK Senior Notes issuedintent of protecting our workforce by AK Steel Corporation (n/k/providing employees with an incentive of up to $3,000 per employee to get vaccinated. We achieved a Cleveland-Cliffs Steel Corporation)company-wide vaccination rate of 75%, and pay fees and expenses in connection with such redemptions, and reduce borrowings underor nearly 19,000 employees out of our ABL Facility.
Refer to NOTE 8 - DEBT AND CREDIT FACILITIES for further detail.workforce of
approximately 25,000 employees. The incentive, which totaled $45 million, was primarily paid out during the third quarter of 2021.
Series B Participating Redeemable Preferred Stock Redemption
During the third quarter of 2021, we redeemed with cash all 583,273 shares outstanding of our Series B Participating Redeemable Preferred Stock at a redemption price of $1.3 billion. There were no accumulated and unpaid dividends on the Series B Participating Redeemable Preferred Stock as of the redemption date.
Labor Agreements
On October 4, 2021, we reached a tentative agreement with the UAW for a new three-year labor contract for our Rockport Works employees. The new contract is retroactively effective from October 1, 2021 through September 30, 2024, and will cover approximately 350 UAW-represented workers.
On August 5, 2021, we reached a tentative agreement with the UAW for a new three-year labor contract for our Dearborn Works employees. The new contract is retroactively effective from August 1, 2021 through July 31, 2024, and will cover approximately 1,000 UAW-represented workers.
Results of Operations
Overview
For the three and nine months ended March 31,September 30, 2021, we had Net income of $57$1,282 million and $2,134 million, respectively, compared to aNet income of $2 million and Net loss of $49$155 million for the prior-year period.three and nine months ended September 30, 2020, respectively. Our Revenues, diluted EPS and Adjusted EBITDA for the three and nine months ended March 31,September 30, 2021 and 2020 were as follows:
See "— Results of Operations — Adjusted EBITDA" below for a reconciliation of our Net income (loss) to Adjusted EBITDA.
Revenues
During the three and nine months ended March 31,September 30, 2021, our consolidated Revenues were $4.0increased by $4.4 billion an increase of $3.7and $12.0 billion, respectively, compared to the prior-year period.periods. The increase for the three months ended September 30, 2021, was primarily due to our Steelmaking segment, which had an increase in steel shipments of 3.0 million net tons and an increase in the average steel product selling price of $334 per net ton. The increase for the nine months ended September 30, 2021, was primarily due to the addition of 3.910.6 million net tons of steel shipments from our Steelmaking segment, as a resultalong with an increase in the average steel product selling price of the Acquisitions.$111 per net ton and increased demand.
Revenues by Product Line
The following represents our consolidated Revenues by product line for the three months ended:
The following represents our consolidated Revenues by product line:line for the nine months ended:
The change in product mix for 2021, compared to 2020, is due to the inclusion of full-period results for the 2020 Acquisitions. The results for 2020 include AK Steel operations subsequent to March 13, 2020, and our results from operations previously reported as part of our historical Mining and Pelletizing segment.
Revenues by Market
The following table represents our consolidated Revenues and percentage of revenues tofrom each of the markets we supply:
| | | (In Millions) | | (In Millions) |
| | Three Months Ended March 31, | | Three Months Ended
September 30, | | Nine Months Ended
September 30, |
| | 2021 | | 2020 | | 2021 | | 2020 | | 2021 | | 2020 |
| | Revenue | | % | | Revenue | | % | | Revenue | | % | | Revenue | | % | | Revenue | | % | | Revenue | | % |
| Automotive | Automotive | $ | 1,392 | | | 34 | % | | $ | 118 | | | 33 | % | Automotive | $ | 1,254 | | | 21 | % | | $ | 913 | | | 55 | % | | $ | 3,883 | | | 26 | % | | $ | 1,389 | | | 45 | % |
| Infrastructure and Manufacturing | Infrastructure and Manufacturing | 964 | | | 24 | % | | 43 | | | 12 | % | Infrastructure and Manufacturing | 1,615 | | | 27 | % | | 199 | | | 12 | % | | 3,922 | | | 26 | % | | 446 | | | 14 | % |
| Distributors and Converters | Distributors and Converters | 1,263 | | | 31 | % | | 54 | | | 15 | % | Distributors and Converters | 2,465 | | | 41 | % | | 143 | | | 9 | % | | 5,721 | | | 38 | % | | 344 | | | 11 | % |
| Steel Producers | Steel Producers | 430 | | | 11 | % | | 144 | | | 40 | % | Steel Producers | 670 | | | 11 | % | | 391 | | | 24 | % | | 1,572 | | | 10 | % | | 919 | | | 30 | % |
| Total revenues | Total revenues | $ | 4,049 | | | $ | 359 | | | Total revenues | $ | 6,004 | | | $ | 1,646 | | | $ | 15,098 | | | $ | 3,098 | | |
|
Operating Costs
Cost of goods sold
During the three and nine months ended September 30, 2021, Cost of goods soldincreased by $3.4$2.7 billion for the three months ended March 31, 2021,and $8.7 billion, respectively, as compared to the prior-year period,periods. The increases were primarily due to the addition of 3.93.0 million and 10.6 million net tons of steel shipments resulting from our Steelmaking segment for the Acquisitions.three and nine months ended September 30, 2021, respectively.
Selling, general and administrative expenses
As a result of the 2020 Acquisitions, our Selling, general and administrative expenses increased by $67$53 million and $162 million during the three and nine months ended March 31,September 30, 2021, respectively, as compared to the prior-year period.periods.
Acquisition-related costs
The following table represents the components of Acquisition-related costscosts: of $13 millionfor the three months ended March 31, 2021, includes severance of $11 million and other various third-party expenses related to the Acquisitions of $2 million. The Acquisition-related costs of $42 million for the three months ended March 31, 2020, includes severance of $19 million and $23 million of other various third-party expenses related to the AK Steel Merger.
| | | | | | | | | | | | | | | | | | | | | | | |
| (In Millions) |
| Three Months Ended
September 30, | Nine Months Ended
September 30, |
| 2021 | | 2020 | | 2021 | | 2020 |
| Severance | $ | (3) | | | $ | (2) | | | $ | (15) | | | $ | (38) | |
| Third-party expenses | (1) | | | (5) | | | (3) | | | (30) | |
| Total | $ | (4) | | | $ | (7) | | | $ | (18) | | | $ | (68) | |
Refer to NOTE 3 - ACQUISITIONS for further information on the 2020 Acquisitions.
Miscellaneous – net
Miscellaneous – net decreased by $9$7 million and $3 million for the three and nine months ended March 31,September 30, 2021, respectively, as compared to the prior-year period, which wasperiods. The decreases were primarily due to the decrease in expenses incurred at our Toledo direct reduction plant recorded in Miscellaneous – net prior to start of production in December 2020. The decrease during the nine months ended September 30, 2021 was partially offset by the acquisition-related loss on equity method investment.
Other Income (Expense)
Interest expense, net
Interest expense, net increased by $61$13 million and $90 million for the three and nine months ended September 30, 2021, respectively, as compared to the prior-year periods. The increase for the three months ended March 31,September 30, 2021 as comparedwas primarily due to borrowings on the ABL Facility, and a decrease in capitalized interest during 2021, due to the prior-year period,completion of our Toledo direct reduction plant in December 2020, partially offset by the debt restructuring activities during 2021, which reduced interest expense on our senior notes. The increase during the nine months ended September 30, 2021 was primarily due to the incremental debt that we incurred in connection with the AK Steel Merger, along with borrowings on the ABL Facility and a decrease in capitalized interest during the current year2021, due to the completion of theour Toledo direct reduction plant.plant in December 2020.
Gain (loss) on extinguishment of debt
The loss on extinguishment of debt of $66$88 million for the threenine months ended March 31,September 30, 2021, primarily relates toresulted from the redemption of $396 million aggregate principal amount of 5.750% 2025 Senior Notes and the repurchase of $25 million aggregate principal amount of 9.875% 2025 Senior Secured Notes. The nine months ended September 30, 2021 was also impacted by the redemption of $322 million in aggregate principal amount of 9.875% 2025 Senior Secured Notes using the net proceeds from the issuanceand repurchase of 20 million common shares. Additionally, we repurchased $535 million in aggregate principal amount of our outstanding senior notes of various other series usingin the net proceedsfirst quarter of 2021.
The gain on extinguishment of debt of $133 million for the nine months ended September 30, 2020, primarily resulted from the issuancerepurchase of $748 million aggregate principal amount of our outstanding senior notes. The nine months ended September 30, 2020, was also impacted by the 4.625% 2029repurchase of $57 million aggregate principal amount of 7.500% 2023 AK Senior Notes and 4.875% 2031$9 million aggregate principal amount of 7.625% 2021 AK Senior Notes, along with cash on hand. Notes.
Refer to NOTE 8 - DEBT AND CREDIT FACILITIES for further details.
Net periodic benefit credits other than service cost component
The increase of $41 millionincreases in Net periodic benefit credits other than service cost componentof $37 million and $109 million for the three and nine months ended September 30, 2021, respectively, as compared to the prior-year periods, primarily relatesrelate to an increase in the expected return on pension and voluntary employee benefit association trust assets acquired as a result of the 2020 Acquisitions. Refer to NOTE 10 - PENSIONS AND OTHER POSTRETIREMENT BENEFITS for further details.
Income Taxes
Our effective tax rate is impacted by permanent items, primarily depletion. It also is affected by discrete items that may occur in any given period but are not consistent from period to period. The following represents a summary of our tax provision and corresponding effective rates:
| | | | (In Millions) | | (In Millions) |
| | | Three Months Ended
March 31, | | Three Months Ended
September 30, | Nine Months Ended
September 30, |
| | | 2021 | | 2020 | | 2021 | | 2020 | | 2021 | | 2020 |
| Income tax benefit (expense) | Income tax benefit (expense) | | $ | (9) | | | $ | 51 | | Income tax benefit (expense) | $ | (334) | | | $ | 22 | | | $ | (559) | | | $ | 98 | |
| Effective tax rate | Effective tax rate | | 14 | % | | 51 | % | Effective tax rate | 21 | % | | 110 | % | | 21 | % | | 39 | % |
The difference in the effective rate and income tax expense from the comparable prior-year period primarily relates to the mix of income as well as discrete items recordedchange in each period.income.
Our 2021 estimated annual effective tax rate before discrete items is 19%21%. This estimated annual effective tax rate differs frommirrors the U.S. statutory rate of 21%, primarily due toas the deduction foradjusting items, including percentage depletion in excess of cost depletion.depletion, net to zero. The 2020 estimated annual effective tax rate before discrete items at March 31,September 30, 2020 was 47%36%. The decrease in the estimated annual effective tax rate before discrete items is driven by the change in the mixincome.
Adjusted EBITDA
We evaluate performance on an operating segment basis, as well as a consolidated basis, based on Adjusted EBITDA, which is a non-GAAP measure. This measure is used by management, investors, lenders and other external users of our financial statements to assess our operating performance and to compare operating performance to other companies in the steel industry, although it is not necessarily comparable to similarly titled measures used by other companies.industry. In addition, management believes Adjusted EBITDA is a useful measure to assess the earnings power of the business without the impact of capital structure and can be used to assess our ability to service debt and fund future capital expenditures in the business.
The following table provides a reconciliation of our Net income (loss) to Adjusted EBITDA:
| | | | (In Millions) | | (In Millions) |
| | | Three Months Ended
March 31, | | Three Months Ended
September 30, | | Nine Months Ended
September 30, |
| | | 2021 | | 2020 | | 2021 | | 2020 | | 2021 | | 2020 |
| Net income (loss) | Net income (loss) | | $ | 57 | | | $ | (49) | | Net income (loss) | $ | 1,282 | | | $ | 2 | | | $ | 2,134 | | | $ | (155) | |
| Less: | Less: | | | Less: | |
| Interest expense, net | Interest expense, net | | (92) | | | (31) | | Interest expense, net | (81) | | | (68) | | | (258) | | | (168) | |
| Income tax benefit (expense) | Income tax benefit (expense) | | (9) | | | 51 | | Income tax benefit (expense) | (334) | | | 22 | | | (559) | | | 98 | |
| Depreciation, depletion and amortization | Depreciation, depletion and amortization | | (217) | | | (35) | | Depreciation, depletion and amortization | (239) | | | (72) | | | (664) | | | (184) | |
| Total EBITDA | Total EBITDA | | $ | 375 | | | $ | (34) | | Total EBITDA | $ | 1,936 | | | $ | 120 | | | $ | 3,615 | | | $ | 99 | |
| Less: | Less: | | | | | Less: | | | | | | | |
EBITDA of noncontrolling interests1 | EBITDA of noncontrolling interests1 | | $ | 22 | | | $ | 4 | | EBITDA of noncontrolling interests1 | $ | 17 | | | $ | 16 | | | $ | 60 | | | $ | 41 | |
| Gain (loss) on extinguishment of debt | Gain (loss) on extinguishment of debt | | (66) | | | 3 | | Gain (loss) on extinguishment of debt | — | | | — | | | (88) | | | 133 | |
| Severance costs | Severance costs | | (11) | | | (19) | | Severance costs | (3) | | | (2) | | | (15) | | | (38) | |
| Acquisition-related costs excluding severance costs | Acquisition-related costs excluding severance costs | | (2) | | | (23) | | Acquisition-related costs excluding severance costs | (1) | | | (5) | | | (3) | | | (30) | |
| Acquisition-related loss on equity method investment | | Acquisition-related loss on equity method investment | — | | | — | | | (18) | | | — | |
| Amortization of inventory step-up | Amortization of inventory step-up | | (81) | | | (23) | | Amortization of inventory step-up | (11) | | | (15) | | | (129) | | | (74) | |
| Impact of discontinued operations | Impact of discontinued operations | | — | | | 1 | | Impact of discontinued operations | 1 | | | — | | | 2 | | | — | |
| Total Adjusted EBITDA | Total Adjusted EBITDA | | $ | 513 | | | $ | 23 | | Total Adjusted EBITDA | $ | 1,933 | | | $ | 126 | | | $ | 3,806 | | | $ | 67 | |
| 1 EBITDA of noncontrolling interests includes $16 million and $3 million for income and $6 million and $1 million for depreciation, depletion and amortization for the three months ended March 31, 2021 and 2020, respectively. | |
1 EBITDA of noncontrolling interests includes the following: | | 1 EBITDA of noncontrolling interests includes the following: |
| Net income attributable to noncontrolling interests | | Net income attributable to noncontrolling interests | $ | 8 | | | $ | 12 | | | $ | 39 | | | $ | 31 | |
| Depreciation, depletion and amortization | | Depreciation, depletion and amortization | 9 | | | 4 | | | 21 | | | 10 | |
| EBITDA of noncontrolling interests | | EBITDA of noncontrolling interests | $ | 17 | | | $ | 16 | | | $ | 60 | | | $ | 41 | |
The following table provides a summary of our Adjusted EBITDA by segment:
| | | | (In Millions) | | (In Millions) |
| | | Three Months Ended
March 31, | | Three Months Ended
September 30, | | Nine Months Ended
September 30, |
| | | 2021 | | 2020 | | 2021 | | 2020 | | 2021 | | 2020 |
| Adjusted EBITDA: | Adjusted EBITDA: | | | | | Adjusted EBITDA: | | | | | | | |
| Steelmaking | Steelmaking | | $ | 537 | | | $ | 44 | | Steelmaking | $ | 1,969 | | | $ | 127 | | | $ | 3,901 | | | $ | 117 | |
| Other Businesses | Other Businesses | | 11 | | | 2 | | Other Businesses | 6 | | | 18 | | | 25 | | | 22 | |
| Corporate and eliminations | Corporate and eliminations | | (35) | | | (23) | | Corporate and eliminations | (42) | | | (19) | | | (120) | | | (72) | |
| Total Adjusted EBITDA | Total Adjusted EBITDA | | $ | 513 | | | $ | 23 | | Total Adjusted EBITDA | $ | 1,933 | | | $ | 126 | | | $ | 3,806 | | | $ | 67 | |
Adjusted EBITDA from our Steelmaking segment increased by $493 million for the three and nine months ended March 31,September 30, 2021, increased by $1,842 million and $3,784 million, respectively, as compared to the prior-year period.periods. The results were favorably impacted by the operating results related to the acquired steelmaking operations. Our Steelmaking segment Adjusted EBITDA included $66 million and $180 million of Selling, general and administrative expenses for the three and nine months ended September 30, 2021, respectively. See "—Steelmaking" below for further detail.
Adjusted EBITDA from Corporate and eliminations primarily relates to Selling, general and administrative expenses at our Corporate headquarters.
Steelmaking
The following is a summary of our Steelmaking segment results included in our consolidated financial statements for the three and nine months ended March 31,September 30, 2021 and 2020. The results for the three months ended March 31, 2021 include full periodfull-period results for all Steelmaking operations. The results for the three months ended March 31, 2020 include AK Steel operations subsequent to March 13, 2020, and our results from operations previously reported as part of our Mining and Pelletizing segment.
The following is a summary of our Steelmaking segment operating results:
| | | | | | | | | | | | | | | | | | | | | | | |
| Three Months Ended
September 30, | | Nine Months Ended
September 30, |
| 2021 | | 2020 | | 2021 | | 2020 |
| Operating Results - In Millions | | | | | | | |
| Revenues | $ | 5,869 | | | $ | 1,506 | | | $ | 14,710 | | | $ | 2,866 | |
| Cost of goods sold | $ | (4,098) | | | $ | (1,405) | | | $ | (11,472) | | | $ | (2,882) | |
| Selling Price - Per Ton | | | | | | | |
| Average net selling price per net ton of steel products | $ | 1,334 | | | $ | 1,000 | | | $ | 1,122 | | | $ | 1,011 | |
The following tables represent our Steelmaking segment Revenues by product line:
| | | | | | | | | | | | | | | | | | | | | | | |
| (Dollars In Millions,
Sales Volumes In Thousands) |
| Three Months Ended
September 30, |
| 2021 | | 2020 |
| Revenue | | Volume1 | | Revenue | | Volume1 |
| Hot-rolled steel | $ | 1,800 | | | 1,332 | | | $ | 89 | | | 134 | |
| Cold-rolled steel | 935 | | | 728 | | | 126 | | | 179 | |
| Coated steel | 1,635 | | | 1,291 | | | 604 | | | 656 | |
| Stainless and electrical steel | 441 | | | 177 | | | 296 | | | 146 | |
| Plate steel | 357 | | | 244 | | | — | | | — | |
| Other steel products | 374 | | | 381 | | | — | | | — | |
| Iron products | 252 | | | 1,426 | | | 384 | | | 3,703 | |
| Other | 75 | | | N/A | | 7 | | | N/A |
| Total | $ | 5,869 | | | | | $ | 1,506 | | | |
| | | | | | | |
1 All steel product volumes are stated in net tons. Iron product volumes are stated in long tons. |
The following is a summary of our Steelmaking segment operating results:
| | | | | | | | | | | |
| Three Months Ended
March 31, |
| 2021 | | 2020 |
| Operating Results - In Millions | | | |
| Revenues | $ | 3,919 | | | $ | 337 | |
| Cost of goods sold | $ | (3,644) | | | $ | (335) | |
| Selling Price - Per Ton | | | |
| Average net selling price per net ton of steel products | $ | 900 | | | $ | 980 | |
The average net selling price per ton for the three months ended March 31, 2021, reflects changes in mix associated with the first full quarter of ownership of ArcelorMittal USA, reducing the overall contribution of higher-priced coated, stainless and electrical steel products.
The following table represents our Steelmaking segment Revenues by product line:
| | | (Dollars In Millions,
Sales Volumes In Thousands) | | (Dollars In Millions,
Sales Volumes In Thousands) |
| | Three Months Ended
March 31, | | Nine Months Ended
September 30, |
| | 2021 | | 2020 | | 2021 | | 2020 |
| | Revenue | | Volume1 | | Revenue | | Volume1 | | Revenue | | Volume1 | | Revenue | | Volume1 |
| Hot-rolled steel | Hot-rolled steel | $ | 895 | | | 1,182 | | | $ | 19 | | | 31 | | Hot-rolled steel | $ | 4,204 | | | 3,900 | | | $ | 150 | | | 228 | |
| Cold-rolled steel | Cold-rolled steel | 632 | | | 748 | | | 28 | | | 40 | | Cold-rolled steel | 2,352 | | | 2,196 | | | 242 | | | 342 | |
| Coated steel | Coated steel | 1,308 | | | 1,369 | | | 90 | | | 99 | | Coated steel | 4,338 | | | 3,907 | | | 995 | | | 1,088 | |
| Stainless and electrical steel | Stainless and electrical steel | 363 | | | 167 | | | 56 | | | 27 | | Stainless and electrical steel | 1,201 | | | 512 | | | 560 | | | 268 | |
| Plate Steel | 244 | | | 275 | | | — | | | — | | |
| Plate steel | | Plate steel | 929 | | | 792 | | | — | | | — | |
| Other steel products | Other steel products | 289 | | | 403 | | | — | | | — | | Other steel products | 1,009 | | | 1,195 | | | — | | | — | |
| Iron products | Iron products | 70 | | | 600 | | | 142 | | | 1,351 | | Iron products | 477 | | | 2,875 | | | 903 | | | 8,772 | |
| Other | Other | 118 | | | N/A | | 2 | | | N/A | Other | 200 | | | N/A | | 16 | | | N/A |
| Total | Total | $ | 3,919 | | | $ | 337 | | | Total | $ | 14,710 | | | $ | 2,866 | | |
| 1 All steel product volumes are stated in net tons. Iron product volumes are stated in long tons. | 1 All steel product volumes are stated in net tons. Iron product volumes are stated in long tons. | 1 All steel product volumes are stated in net tons. Iron product volumes are stated in long tons. |
Operating Results
Steelmaking revenues for the three and nine months ended March 31,September 30, 2021 increased by $3,582$4,363 million and $11,844 million, respectively, compared to the prior-year periodperiods, primarily due to the addition of sales following the 2020 Acquisitions. The three and nine months ended March 31,September 30, 2021 included results of the operations acquired in the 2020 Acquisitions for athe full quarter,nine months, compared to the three and nine months ended March 31,September 30, 2020, which included the operating results from AK Steel during the period of March 13, 2020 through March 31,September 30, 2020. Results for the three and nine months ended March 31,September 30, 2021 were impacted positively by the increase in the price for domestic HRC, which is the most significant index in driving our revenues and profitability. The HRC index averaged $1,201$1,500 per net ton for the first quarternine months of 2021, 105%188% higher than the same period last year and currently at an all-time high as a direct result of favorable supply-demand dynamics following the COVID-19 pandemic. We have also benefited from higher steel shipments due to stronger demand.
Cost of goods sold for the three and nine months ended March 31,September 30, 2021 increased by $3,309$2,693 million and $8,590 million, respectively, compared to the prior-year periodperiods, predominantly due to additional sales resulting from the Acquisitions.as discussed above.
As a result, Adjusted EBITDA was $537$1,969 million and $3,901 million for the three and nine months ended March 31,September 30, 2021, respectively, compared to $44$127 million and $117 million for the prior-year period. Refer to "— Resultsthree and nine months ended September 30, 2020, respectively. Adjusted EBITDA for the three and nine months ended September 30, 2021 was positively impacted by the addition of Operations" abovesales following the 2020 Acquisitions, the increase in the price for additional information.HRC and the higher demand for steel products, as discussed above.
Production
During the first threenine months of 2021, we produced 4.814.3 million net tons of raw steel, 6.921.0 million long tons of iron ore products and 0.72.2 million net tons of coke. OurWe restarted our temporarily idled Columbus Coatings and Monessen facilities acquired throughduring the AM USA Transaction aresecond and third quarters of 2021, respectively. As a result of our HBI use in our blast furnaces and associated reduction of coke needs, we temporarily idled due to impacts of the COVID-19 pandemic. We anticipate restarting our Columbus facilitycoke battery at Middletown Works during the secondthird quarter of 2021. During the first threenine months of 2020, we produced 0.32.1 million net tons of raw steel, and 4.811.4 million long tons of iron ore pellets.pellets and 0.3 million net tons of coke.
Liquidity, Cash Flows and Capital Resources
Our primary sources of liquidity are Cash and cash equivalents and cash generated from our operations, availability under the ABL Facility and other financing activities. Our capital allocation decision-making process is focused on preserving healthy liquidity levels while maintaining the strength of our balance sheet and creating financial flexibility to manage through the inherent cyclical demand for our products and volatility in commodity prices. We are focused on maximizing the cash generation of our operations, reducing debt, and aligning capital investments with our strategic priorities and the requirements of our business plan, including regulatory and permission-to-operate related projects.
Following the onset of the COVID-19 pandemic in the U.S. in 2020, our primary focus was to maintain adequate levels of liquidity to manage through a potentially prolonged economic downturn. Now that business conditions have improved, and we expectallowing us to generate a healthy free cash flow during remaining nine months of 2021, we believe we will have the ability to lowermake investments to both improve and grow our long-termbusiness, particularly as it pertains to scrap metal. We have also been able to reduce our diluted share count and effectively return capital to shareholders via the cash redemption of our Series B Participating Redeemable Preferred Stock during the third quarter of 2021.
In addition, we anticipate that the current strong market environment will provide us ample opportunities to reduce our debt balance.with our own free cash flow generation. We also continue to look at the composition of our debt, as we are interested in both extending our average maturity profilelength and increasing our ratio of unsecured debt to secured debt.debt, which can be accomplished with cash provided by operating activities. These actions will better prepare us to navigate more easily through potentially volatile industry conditions in the future. In furtherance of these goals, we consummated certainthe following financing transactions in Februaryduring the first nine months of 2021.
On February 11, 2021, we sold 20 million common shares at a price per share of $16.12. We used the net proceeds from the offering, plus cash on hand, to redeem $322 million aggregate principal amount of our outstanding 9.875% 2025 Senior Secured Notes. Prior to such use, the net proceeds were used to temporarily reduce the outstanding borrowings under our ABL Facility.
On February 17, 2021, we issued $500 million aggregate principal amount of 4.625% 2029 Senior Notes and $500 million aggregate principal amount of 4.875% 2031 Senior Notes in an offering that was exempt from the registration requirements of the Securities Act. We used the net proceeds from the notes offeringsoffering to redeem all of the outstanding 4.875% 2024 Senior Secured Notes and 6.375% 2025 Senior Notes issued by Cleveland-Cliffs Inc. and all of the outstanding 7.625% 2021 AK Senior Notes, 7.50%7.500% 2023 AK Senior Notes and 6.375% 2025 AK Senior Notes issued by AK Steel Corporation (n/k/a Cleveland-Cliffs Steel Corporation), and pay fees and expenses in connection with such redemptions, and reduce borrowings under our ABL Facility.
The application of the net proceeds to us from the February 2021 financing transactions shifted our debt horizon by providing a four-year window in which none of our long-term senior notes are due, clearing the way for us to fully focus on operational integration.
Additionally, on June 28, 2021, we redeemed the entirety of our outstanding 5.750% 2025 Senior Notes using available liquidity. Pursuant to the terms of the indenture governing the 5.750% 2025 Senior Notes, we paid $415 million, including $396 million aggregate principal amount, plus make-whole premiums and accrued and unpaid interest to, but not including, the redemption date.
Based on our outlook for the next 12 months, which is subject to continued changing demand from customers and volatility in domestic steel prices, we expect to have ample liquidity through cash generated from operations and availability under our ABL Facility sufficient to meet the needs of our operations and service our debt obligations.
The following discussion summarizes the significant items impacting our cash flows during the threenine months ended March 31,September 30, 2021 and 2020 as well as expected impacts to our future cash flows over the next 12 months. Refer to the Statements of Unaudited Condensed Consolidated Cash Flows for additional information. Unless otherwise noted, the following discussion refers to our continuing operations on a stand-alone basis without giving effect to the pending FPT Acquisition.
Operating Activities
Net cash provided by operating activities was $1,648 million for the nine months ended September 30, 2021, compared to net cash used by operating activities was $379 million and $164of $51 million for the threenine months ended March 31, 2021 and 2020, respectively.September 30, 2020. The increase in cash usedprovided by operating activities during the first threenine months of 2021, compared to 2020, was driven by improved operating results, partially offset by changes in working capital. Changes in working capital included increases in inventory primarily related to the increasingautomotive chip shortage and increased raw material and production costs, as well as increases in receivables dueprimarily related to rising prices, unwindprices. The increase in cash provided by operating activities was also offset by deferred pension contributions.
Our U.S.
Cash and cash equivalents balance at March 31, 2021 was $91 million, or 86% of our consolidated Cash and cash equivalents balance, excluding cash related to our consolidated VIE of $4 million.
Investing Activities
Net cash used by investing activities was $135$414 million and $1,007$1,240 million for the threenine months ended March 31,September 30, 2021 and 2020, respectively. We had capital expenditures including capitalized interest, of $136$473 million and $138$379 million for the threenine months ended March 31,September 30, 2021 and 2020, respectively. We had cash outflows including deposits and capitalized interest, forrelating to the development of the Toledo direct reduction plant of $28$57 million and $112$273 million for the threenine months ended March 31,September 30, 2021 and 2020, respectively. Additionally, we spent approximately $108$416 million and $26$106 million primarily on sustaining capital expenditures during the threenine months ended March 31,September 30, 2021 and 2020, respectively. Sustaining capital spend includes infrastructure, mobile equipment, fixed equipment, product quality, environment, health and safety.
During the first threenine months of 2020, we had net cash outflows of $869 million for the acquisition of AK Steel, net of cash acquired, which included $590 million used to repay the former AK Steel Corporation revolving credit facility and $324 million used to purchase outstanding 7.50%7.500% 2023 AK Senior Notes.
We anticipate total cash used for capital expenditures during the next 12 months to be between $650$750 and $700$850 million.
Financing Activities
Net cash used by financing activities was $1,304 million for the nine months ended September 30, 2021, compared to net cash provided by financing activities was $512 million and $1,005of $994 million for the threenine months ended March 31, 2021 and 2020, respectively.September 30, 2020. Cash inflowsoutflows from financing activities for the threenine months ended March 31,September 30, 2021 included the issuanceredemption of $500all 583,273 shares outstanding of our Series B Participating Redeemable Preferred Stock at a redemption price of $1.3 billion during the third quarter of 2021, along with $1.3 billion for repayments of debt. We used available liquidity to redeem all $396 million aggregate principal amount outstanding of 4.625% 2029our 5.750% 2025 Senior Notes, issuance of $500 million aggregate principal amount of 4.875% 2031 Senior Notes, issuance of 20 million common shares for net proceeds of $322 million and net borrowings of $148 million under credit facilities.Notes. We used the net proceeds from the issuance of the 20 million common shares, and cash on hand, to repurchaseredeem $322 million in aggregate principal amount of 9.875% 2025 Senior Secured Notes. We used the net proceeds from the issuances of the 4.625% 2029 Senior Notes and 4.875% 2031 Senior Notes to redeem all of the outstanding 4.875% 2024 Senior Secured Notes, and 6.375% 2025 Senior Notes, issued by Cleveland-Cliffs Inc. and all of the outstanding 7.625% 2021 AK Senior Notes, 7.50%7.500% 2023 AK Senior Notes and 6.375% 2025 AK Senior Notes, issued by AK Steel Corporation (n/k/a Cleveland-Cliffs Steel Corporation), and pay fees and expenses in connection with such redemptions, and reduce borrowings under our ABL Facility.
Cash inflows from financing activities for the nine months ended September 30, 2021 included the issuances of $500 million aggregate principal amount of 4.625% 2029 Senior Notes, $500 million aggregate principal amount of 4.875% 2031 Senior Notes and 20 million common shares for proceeds of $322 million, along with net borrowings of $193 million under credit facilities.
Net cash provided by financing activities for the threenine months ended March 31,September 30, 2020 primarily related to the issuanceissuances of $725$845 million aggregate principal amount of 6.75%6.750% 2026 Senior Secured Notes, $955 million aggregate principal amount of 9.875% 2025 Senior Secured Notes and borrowings of $800 million under the ABL Facility. The net proceeds from the initial issuance of $725 million aggregate principal amount of the 6.75%6.750% 2026 Senior Secured Notes, along with cash on hand, were used to purchase $373 million aggregate principal amount of 7.625% 2021 AK Senior Notes and $367 million aggregate principal amount of 7.50%7.500% 2023 AK Senior Notes and to pay for the $44 million of debt issuance costs.costs in the first quarter of 2020. The net proceeds from the additional issuance of $555 million aggregate principal amount of the 9.875% 2025 Senior Secured Notes were used to repurchase $736 million aggregate principal amount of our outstanding senior notes. Additionally, during the nine months ended September 30, 2020, we repaid $400 million under the ABL Facility.
We anticipate future uses of cash and cash provided by financing activities during the next 12 months to include opportunistic debt transactions as partrepayment of our liability management strategy, in addition to, providing supplemental financing to meet cash requirements for business improvement opportunities.ABL balance, as well as opportunistic transactions, including other debt repayments.
Capital Resources
The following represents a summary of key liquidity measures:
| | | | | |
| (In Millions) |
| March 31,September 30,
2021 |
| Cash and cash equivalents | $ | 11042 | |
Less: Cash and cash equivalents from VIE's | (4) | |
Total cash and cash equivalents | $ | 106 | |
| |
Available borrowing base on ABL Facility1 | $ | 3,500 | |
| Borrowings | (1,630)(1,673) | |
| Letter of credit obligations | (272)(236) | |
| Borrowing capacity available | $ | 1,5981,591 | |
| |
1 As of March 31,September 30, 2021, the ABL Facility had a maximum borrowing base of $3.5 billion. The available borrowing base is determined by applying customary advance rates to eligible accounts receivable, inventory and certain mobile equipment. |
| |
| |
Our primary sources of funding are cash and cash equivalents, which totaled $106$42 million as of March 31,September 30, 2021, cash generated by our business, availability under the ABL Facility and other financing activities. The combination of cash and availability under the ABL Facility gives us $1.7$1.6 billion in liquidity entering the secondfourth quarter of 2021, which is expected to be adequate to fund operations, letter of credit obligations, sustaining and expansion capital expenditures and other cash commitments for at least the next 12 months.
As of March 31,September 30, 2021, we were in compliance with the ABL Facility liquidity requirements and, therefore, the springing financial covenant requiring a minimum fixed charge coverage ratio of 1.0 to 1.0 was not applicable.
Off-Balance Sheet Arrangements
In the normal course of business, we are a party to certain arrangements that are not reflected on our Statements of Unaudited Condensed Consolidated Financial Position. These arrangements include minimum "take or pay" purchase commitments, such as minimum electric power demand charges, minimum coal, coke, diesel and natural gas purchase commitments, minimum railroad transportation commitments and minimum port facility usage commitments, and financial instruments with off-balance sheet risk, such as bank letters of credit and bank guarantees.
Information about our Guarantors and the Issuer of our Guaranteed Securities
The accompanying summarized financial information has been prepared and presented pursuant to SEC Regulation S-X, Rule 3-10, “Financial Statements of Guarantors and Issuers of Guaranteed Securities Registered or Being Registered,” and Rule 13-01 "Financial Disclosures about Guarantors and Issuers of Guaranteed Securities and Affiliates Whose Securities Collateralized a Registrant's Securities." Certain of our subsidiaries (the "Guarantor subsidiaries") have fully and unconditionally, and jointly and severally, guaranteed the obligations under (a) the 5.75% 2025 Senior Notes, the 5.875% 2027 Senior Notes, the 7.00%7.000% 2027 Senior Notes, the 4.625% 2029 Senior Notes and the 4.875% 2031 Senior Notes issued by Cleveland-Cliffs Inc. on a senior unsecured basis and (b) the 6.75%6.750% 2026 Senior Secured Notes and the 9.875% 2025 Senior Secured Notes on a senior secured basis. See NOTE 8 - DEBT AND CREDIT FACILITIES for further information.
The following presents the summarized financial information on a combined basis for Cleveland-Cliffs Inc. (parent company and issuer of the guaranteed obligations) and the Guarantor subsidiaries, collectively referred to as the obligated group. Transactions between the obligated group have been eliminated. Information for the non-Guarantor subsidiaries was excluded from the combined summarized financial information of the obligated group.
Each Guarantor subsidiary is consolidated by Cleveland-Cliffs Inc. as of March 31,September 30, 2021. Refer to Exhibit 22, incorporated herein by reference, for the detailed list of entities included within the obligated group as of March 31,September 30, 2021. The guarantee of a Guarantor subsidiary with respect to Cliffs' 5.75% 2025 Senior Notes, the 6.75%6.750% 2026 Senior Secured Notes, the 5.875% 2027 Senior Notes, the 7.00%7.000% 2027 Senior Notes, the 9.875% 2025 Senior Secured Notes, the 4.625% 2029 Senior Notes and the 4.875% 2031 Senior Notes will be automatically and unconditionally released and discharged, and such Guarantor subsidiary’s obligations under the guarantee and the related indentures (the “Indentures”) will be automatically and unconditionally released and discharged, upon the occurrence of any of the
following, along with the delivery to the trustee of an officer’s certificate and an opinion of counsel, each stating that all conditions precedent provided for in the applicable Indenture relating to the release and discharge of such Guarantor subsidiary’s guarantee have been complied with:
(a) any sale, exchange, transfer or disposition of such Guarantor subsidiary (by merger, consolidation, or the sale of) or the capital stock of such Guarantor subsidiary after which the applicable Guarantor subsidiary is no longer a subsidiary of the Company or the sale of all or substantially all of such Guarantor subsidiary’s assets (other than by lease), whether or not such Guarantor subsidiary is the surviving entity in such transaction, to a person which is not the Company or a subsidiary of the Company; provided that (i) such sale, exchange, transfer or disposition is made in compliance with the applicable Indenture, including the covenants regarding consolidation, merger and sale of assets and, as applicable, dispositions of assets that constitute notes collateral, and (ii) all the obligations of such Guarantor subsidiary under all debt of the Company or its subsidiaries terminate upon consummation of such transaction;
(b) designation of any Guarantor subsidiary as an “excluded subsidiary” (as defined in the Indentures); or
(c) defeasance or satisfaction and discharge of the Indentures.
Each entity in the summarized combined financial information follows the same accounting policies as described in the consolidated financial statements. The accompanying summarized combined financial information does not reflect investments of the obligated group in non-Guarantor subsidiaries. The financial information of the obligated group is presented on a combined basis; intercompany balances and transactions within the obligated group have been eliminated. The obligated group's amounts due from, amounts due to, and transactions with, non-Guarantor subsidiaries and related parties have been presented in separate line items.
Summarized Combined Financial Information of the Issuer and Guarantor Subsidiaries:
The following table is summarized combined financial information from the Statements of Unaudited Condensed Consolidated Financial Position of the obligated group:
| | | (In Millions) | | (In Millions) |
| | March 31, 2021 | | December 31, 2020 | | September 30, 2021 | | December 31, 2020 |
| Current assets | Current assets | $ | 5,491 | | | $ | 4,903 | | Current assets | $ | 6,513 | | | $ | 4,903 | |
| Non-current assets | Non-current assets | 10,160 | | | 10,535 | | Non-current assets | 10,094 | | | 10,535 | |
| Current liabilities | Current liabilities | (2,810) | | | (2,767) | | Current liabilities | (3,099) | | | (2,767) | |
| Non-current liabilities | Non-current liabilities | (10,508) | | | (10,563) | | Non-current liabilities | (10,104) | | | (10,563) | |
|
The following table is summarized combined financial information from the Statements of Unaudited Condensed Consolidated Operations of the obligated group:
| | | | | |
| (In Millions) |
| ThreeNine Months Ended |
| March 31,September 30, 2021 |
| Revenues | $ | 3,97914,875 | |
| Cost of goods sold | (3,724)(11,691) | |
| Income from continuing operations | 322,084 | |
| Net income | 332,090 | |
| Net income attributable to Cliffs shareholders | 342,090 | |
As of March 31,September 30, 2021 and December 31, 2020, the obligated group had the following balances with non-Guarantor subsidiaries and other related parties:
| | | (In Millions) | | (In Millions) |
| | March 31, 2021 | | December 31, 2020 | | September 30, 2021 | | December 31, 2020 |
| Balances with non-Guarantor subsidiaries: | Balances with non-Guarantor subsidiaries: | | | | Balances with non-Guarantor subsidiaries: | | | |
| Accounts receivable, net | Accounts receivable, net | $ | 29 | | | $ | 69 | | Accounts receivable, net | $ | 165 | | | $ | 69 | |
| Accounts payable | Accounts payable | (25) | | | (17) | | Accounts payable | (118) | | | (17) | |
| | Balances with other related parties: | Balances with other related parties: | | Balances with other related parties: | |
| Accounts receivable, net | Accounts receivable, net | $ | 30 | | | $ | 2 | | Accounts receivable, net | $ | 4 | | | $ | 2 | |
| | Accounts payable | Accounts payable | (9) | | | (6) | | Accounts payable | (7) | | | (6) | |
|
Additionally, for the threenine months ended March 31,September 30, 2021, the obligated group had Revenues of $77$123 million and Cost of goods sold of $59$104 million, in each case with other related parties.
Market Risks
We are subject to a variety of risks, including those caused by changes in commodity prices and interest rates. We have established policies and procedures to manage such risks; however, certain risks are beyond our control.
Pricing Risks
In the ordinary course of business, we are exposed to market risk and price fluctuations related to the sale of our products, which are impacted primarily by market prices for HRC, and the purchase of energy and raw materials used in our operations, which are impacted by market prices for electricity, natural gas, ferrous and stainless steel scrap, chrome, coal, coke, nickel and zinc. Our strategy to address market risk has generally been to obtain competitive prices for our products and services and allow operating results to reflect market price movements dictated by supply and demand; however, we make forward physical purchases and enter into hedge contracts to manage exposure to price risk related to the purchases of certain raw materials and energy used in the production process.
Our financial results can vary for our operations as a result of fluctuations in market prices. We attempt to mitigate these risks by aligning fixed and variable components in our customer pricing contracts, supplier purchasing agreements and derivative financial instruments.
Some customer contracts have fixed-pricing terms, which increase our exposure to fluctuations in raw material and energy costs. To reduce our exposure, we enter into annual, fixed-price agreements for certain raw materials. Some of our existing multi-year raw material supply agreements have required minimum purchase quantities. Under adverse economic conditions, those minimums may exceed our needs. Absent exceptions for force majeure and other circumstances affecting the legal enforceability of the agreements, these minimum purchase requirements may compel us to purchase quantities of raw materials that could significantly exceed our anticipated needs or pay damages to the supplier for shortfalls. In these circumstances, we would attempt to negotiate agreements for new purchase quantities. There is a risk, however, that we would not be successful in reducing
purchase quantities, either through negotiation or litigation. If that occurred, we would likely be required to purchase more of a particular raw material in a particular year than we need, negatively affecting our results of operations and cash flows.
Certain of our customer contracts include variable-pricing mechanisms that adjust selling prices in response to changes in the costs of certain raw materials and energy, while other of our customer contracts exclude such mechanisms. We may enter multi-year purchase agreements for certain raw materials with similar variable-price mechanisms, allowing us to achieve natural hedges between the customer contracts and supplier purchase agreements. Therefore, in some cases, price fluctuations for energy (particularly natural gas and electricity), raw materials (such as scrap, chrome, zinc and nickel) or other commodities may be, in part, passed on to customers rather than absorbed solely by us. There is a risk, however, that the variable-price mechanisms in the sales contracts may not necessarily change in tandem with the variable-price mechanisms in our purchase agreements, negatively affecting our results of operations and cash flows.
Our strategy to address volatile natural gas rates and electricity rates includes improving efficiency in energy usage, identifying alternative providers and utilizing the lowest cost alternative fuels. If we are unable to align fixed and variable components between customer contracts and supplier purchase agreements, we use cash-settled commodity price swaps and options to hedge the market risk associated with the purchase of certain of our raw materials and energy requirements. Additionally, we routinely use these derivative instruments to hedge a portion of our natural gas, electricity and zinc requirements. Our hedging strategy is designed to protect us from excessive pricing volatility. However, since we do not typically hedge 100% of our exposure, abnormal price increases in any of these commodity markets might still negatively affect operating costs.
The following table summarizes the impactnegative effect of a hypothetical change in the fair value of our derivative instruments outstanding as of September 30, 2021, due to a 10% and 25% change in the market price fromof each of the March 31, 2021 estimated price on our derivative instruments, thereby impacting our pre-taxindicated commodities:
| | | | | | | | | | | | | | |
| | (In Millions) |
| Commodity Derivative | | 10% Change | | 25% Change |
| Natural gas | | $ | 28 | | | $ | 71 | |
| Electricity | | — | | | 1 | |
| Zinc | | 4 | | | 10 | |
Any resulting changes in fair value would be recorded as adjustments to AOCI, net of income taxes or recognized in net earnings, as appropriate. These hypothetical losses would be partially offset by the same amount.
| | | | | | | | | | | | | | |
| | (In Millions) |
| | Positive or Negative Effect on
Pre-tax Income |
| Commodity Derivative | | 10% Increase or Decrease | | 25% Increase or Decrease |
| Natural gas | | $ | 22 | | | $ | 54 | |
| Electricity | | 1 | | | 3 | |
| Zinc | | 1 | | | 1 | |
lower prices paid for the related commodities.Valuation of Goodwill and Other Long-Lived Assets
We assign goodwill arising from acquired companies to the reporting units that are expected to benefit from the synergies of the acquisition. Goodwill is tested on a qualitative basis for impairment at the reporting unit level on an annual basis (October 1) and between annual tests if an event occurs or circumstances change that would more likely than not reduce the fair value of a reporting unit below its carrying value. These events or circumstances could include a significant change in the business climate, legal factors, operating performance indicators, competition or sale or disposition of a significant portion of a reporting unit. As necessary, should our qualitative test indicate that it is more likely than not that the fair value of a reporting unit is less than its carry amount, we perform a quantitative test to determine the amount of impairment, if any, to the carrying value of the reporting unit and its associated goodwill.
Application of the goodwill impairment test requires judgment, including the identification of reporting units, assignment of assets and liabilities to reporting units, assignment of goodwill to reporting units and if a quantitative assessment is deemed necessary in determination of the fair value of each reporting unit. The fair value of each reporting unit is estimated using a discounted cash flow methodology, which considers forecasted cash flows discounted at an estimated weighted average cost of capital. Assessing the recoverability of our goodwill requires significant assumptions regarding the estimated future cash flows and other factors to determine the fair value of a reporting unit, including, among other things, estimates related to forecasts of future revenues, expected Adjusted EBITDA, expected capital expenditures and working capital requirements, which are based upon our long-range plan estimates. The assumptions used to calculate the fair value of a reporting unit may change from year to year based on operating results, market conditions and other factors. Changes in these assumptions could materially affect the determination of fair value for each reporting unit.
Long-lived assets are reviewed for impairment upon the occurrence of events or changes in circumstances that would indicate that the carrying value of the assets may not be recoverable. Such indicators may include: a significant decline in expected future cash flows; a sustained, significant decline in market pricing; a significant adverse change in legal or environmental factors or in the business climate; changes in estimates of our recoverable reserves; and unanticipated competition. Any adverse change in these factors could have a significant impact on the recoverability of our long-lived assets and could have a material impact on our consolidated statements of operations and statement of financial position.
A comparison of each asset group's carrying value to the estimated undiscounted net future cash flows expected to result from the use of the assets, including cost of disposition, is used to determine if an asset is recoverable. Projected future cash flows reflect management's best estimate of economic and market conditions over the projected period, including growth rates in revenues and costs, and estimates of future expected changes in operating margins and capital expenditures. If the carrying value of the asset group is higher than its undiscounted net future cash flows, the asset group is measured at fair value and the difference is recorded as a reduction to the long-lived assets. We estimate fair value using a market approach, an income approach or a cost approach. For the threenine months ended March 31,September 30, 2021, we concluded that an event triggering the need for an impairment assessment did not occur.
Interest Rate Risk
Interest payable on our senior notes is at fixed rates. Interest payable under our ABL Facility is at a variable rate based upon the applicable base rate plus the applicable base rate margin depending on the excess availability. As of March 31,September 30, 2021, we had $1,630$1,673 million outstanding under the ABL Facility. An increase in prevailing interest rates would increase interest expense and interest paid for any outstanding borrowings from the ABL Facility. For example, a 100 basis point change to interest rates under the ABL Facility at the current borrowing level would result in a change of $17 million to interest expense on an annual basis.
Supply Concentration Risks
Many of our operations and mines rely on one source each of electric power and natural gas. A significant interruption or change in service or rates from our energy suppliers could materially impact our production costs, margins and profitability.
Forward-Looking Statements
This report contains statements that constitute "forward-looking statements" within the meaning of the federal securities laws. As a general matter, forward-looking statements relate to anticipated trends and expectations rather than historical matters. Forward-looking statements are subject to uncertainties and factors relating to our operations and business environment that are difficult to predict and may be beyond our control. Such uncertainties and factors may cause actual results to differ materially from those expressed or implied by the forward-looking statements. These statements speak only as of the date of this report, and we undertake no ongoing obligation, other than that imposed by law, to update these statements. Investors are cautioned not to place undue reliance on forward-looking statements. Uncertainties and risk factors that could affect our future performance and cause results to differ from the forward-looking statements in this report include, but are not limited to:
•our ability to successfully complete the FPT Acquisition;
•disruptions to our operations relating to the COVID-19 pandemic, including the heightened risk that a significant portion of our workforce or on-site contractors may suffer illness or otherwise be unable to perform their ordinary work functions;
•continued volatility of steel and iron ore market prices, which directly and indirectly impact the prices of the products that we sell to our customers;
•uncertainties associated with the highly competitive and cyclical steel industry and our reliance on the demand for steel from the automotive industry, which has been experiencing a trend toward light weighting and supply chain disruptions, such as the microchip shortage, that could result in lower steel volumes being consumed;
•potential weaknesses and uncertainties in global economic conditions, excess global steelmaking capacity, oversupply of iron ore, prevalence of steel imports and reduced market demand, including as a result of the COVID-19 pandemic;
•severe financial hardship, bankruptcy, temporary or permanent shutdowns or operational challenges, due to the COVID-19 pandemic or otherwise, of one or more of our major customers, including customers in the automotive market, key suppliers or contractors, which, among other adverse effects, could lead to reduced demand for our products, increased difficulty collecting receivables, and customers and/or suppliers asserting force majeure or other reasons for not performing their contractual obligations to us;
•our ability to reduce our indebtedness or return capital to shareholders within the expected timeframes or at all;
•risks related to U.S. government actions with respect to Section 232, the USMCA and/or other trade agreements, tariffs, treaties or policies, as well as the uncertainty of obtaining and maintaining effective antidumping and countervailing duty orders to counteract the harmful effects of unfairly traded imports;
•impacts of existing and increasing governmental regulation, including climate change and other environmental regulation that may be proposed under the Biden Administration, and related costs and liabilities, including failure to receive or maintain required operating and environmental permits, approvals, modifications or other authorizations of, or from, any governmental or regulatory authority and costs related to implementing improvements to ensure compliance with regulatory changes, including potential financial assurance requirements;
•potential impacts to the environment or exposure to hazardous substances resulting from our operations;
•our ability to maintain adequate liquidity, our level of indebtedness and the availability of capital could limit cash flow necessary to fund working capital, planned capital expenditures, acquisitions, and other general corporate purposes or ongoing needs of our business;
•adverse changes in credit ratings, interest rates, foreign currency rates and tax laws;
•limitations on our ability to realize some or all of our deferred tax assets, including our NOLs;net operating loss carryforwards;
•our ability to realize the anticipated synergies and benefits of the AcquisitionsFPT Acquisition and to successfully integrate the businessesbusiness of AK Steel and ArcelorMittal USAFPT into our existing businesses, including uncertainties associated with maintaining relationships with customers, vendors and employees;
•additional debt we assumed, incurred or issuedwill incur in connection with the Acquisitions,FPT Acquisition, as well as additional debt we incurred in connection with enhancing our liquidity during the COVID-19 pandemic and the 2020 Acquisitions, may negatively impact our credit profile and limit our financial flexibility;
•known and unknown liabilities we assumedwill assume in connection with the Acquisitions, including significant environmental, pension and OPEB obligations;FPT Acquisition;
•the ability of our customers, joint venture partners and third-party service providers to meet their obligations to us on a timely basis or at all;
•supply chain disruptions or changes in the cost or quality of energy sources or critical raw materials and supplies, including iron ore, industrial gases, graphite electrodes, scrap, chrome, zinc, coke and coal;
•liabilities and costs arising in connection with any business decisions to temporarily idle or permanently close a mine or production facility, which could adversely impact the carrying value of associated assets and give rise to impairment charges or closure and reclamation obligations, as well as uncertainties associated with restarting any previously idled mine or production facility;
•problems or disruptions associated with transporting products to our customers, moving products internally among our facilities or suppliers transporting raw materials to us;
•uncertainties associated with natural or human-caused disasters, adverse weather conditions, unanticipated geological conditions, critical equipment failures, infectious disease outbreaks, tailings dam failures and other unexpected events;
•our level of self-insurance and our ability to obtain sufficient third-party insurance to adequately cover potential adverse events and business risks;
•disruptions in, or failures of, our information technology systems, including those related to cybersecurity;
•our ability to successfully identify and consummate any strategic investments or development projects, cost-effectively achieve planned production rates or levels, and diversify our product mix and add new customers;
•our actual economic iron ore and coal reserves or reductions in current mineral estimates, including whether we are able to replace depleted reserves with additional mineral bodies to support the long-term viability of our operations;
•the outcome of any contractual disputes with our customers, joint venture partners, lessors, or significant energy, raw material or service providers, or any other litigation or arbitration;
•our ability to maintain our social license to operate with our stakeholders, including by fostering a strong reputation and consistent operational and safety track record;
•our ability to maintain satisfactory labor relations with unions and employees;
•availability of workers to fill critical operational positions and potential labor shortages caused by the COVID-19 pandemic, as well as our ability to attract, hire, develop and retain key personnel, including within the acquired AK Steel and ArcelorMittal USA businesses;personnel;
•unanticipated or higher costs associated with pension and OPEB obligations resulting from changes in the value of plan assets or contribution increases required for unfunded obligations; and
•potential significant deficiencies or material weaknesses in our internal control over financial reporting.
For additional factors affecting our business, refer to Part II – Item 1A. Risk Factors of this Quarterly Report on Form 10-Q. You are urged to carefully consider these risk factors.
| | | | | |
| Item 3. | Quantitative and Qualitative Disclosures About Market Risk |
Information regarding our market risk is presented under the caption "Market Risks," which is included in our Annual Report on Form 10-K for the year ended December 31, 2020, and Part I – Item 2. Management's Discussion and Analysis of Financial Condition and Results of Operations of this Quarterly Report on Form 10-Q.
| | | | | |
| Item 4. | Controls and Procedures |
We maintain disclosure controls and procedures that are designed to ensure that information required to be disclosed in our Exchange Act reports is recorded, processed, summarized and reported within the time periods specified in the SEC’s rules and forms, and that such information is accumulated and communicated to our management, including our President and Chief Executive Officer and Chief Financial Officer, as appropriate, to allow timely decisions regarding required disclosure based solely on the definition of “disclosure controls and procedures” in Rule 13a-15(e) promulgated under the Exchange Act. In designing and evaluating the disclosure controls and procedures, management recognized that any controls and procedures, no matter how well designed and operated, can provide only reasonable assurance of achieving the desired control objectives, and management necessarily was required to apply its judgment in evaluating the cost-benefit relationship of possible controls and procedures.
As of the end of the period covered by this report, we carried out an evaluation under the supervision and with the participation of our management, including our President and Chief Executive Officer and our Chief Financial Officer, of the effectiveness of the design and operation of our disclosure controls and procedures. Based on the foregoing, our President and Chief Executive Officer and Chief Financial Officer concluded that our disclosure controls and procedures were effective.
There was no change in the Company’s internal control over financial reporting during the quarter ended September 30, 2021 that materially affected, or is reasonably likely to materially affect, our internal control over financial reporting.
PART II - OTHER INFORMATION
Mesabi Trust Arbitration. As previously described in our Annual Report on Form 10-K for the year ended December 31, 2020, Mesabi Trust filed a demand for arbitration with the American Arbitration Association against Northshore and Cleveland-Cliffs Inc. on December 9, 2019, alleging various breaches of a royalty agreement under which Northshore extracts iron ore from Mesabi Trust lands in return for paying royalties to Mesabi Trust. In its demand, Mesabi Trust asserted that we improperly based royalty payments for intercompany sales of DR-grade pellets on artificially low pricing of DR-grade pellet sales to one of our arms’ length third-party customers. Mesabi Trust further asserted that we paid royalties too soon on DR-grade pellets stockpiled at Northshore and destined for shipment to our Toledo direct reduction plant. The allegations also included failure to provide access to information and individuals necessary to determine compliance with the royalty agreement. In addition to seeking damages and costs, Mesabi Trust sought declarations as to the methodology and timing for calculating royalties on our intercompany DR-grade pellet sales, and that Mesabi Trust should have full and unfettered access to all of our information and employees. On September 30, 2021, a three-member arbitration panel awarded Mesabi Trust $2 million plus interest as damages for 2019 and 2020 and ruled that the royalty agreement requires that, for royalties on intercompany sales, Northshore reference all third-party pellet sales, regardless of grade, and select the highest price arms’ length pellet sale from the preceding four quarters. The panel, however, rejected all other relief sought by Mesabi Trust, including its request for an alternative pricing methodology and its request for a premium adjustment for intercompany sales of DR-grade pellets. The panel also rejected Mesabi Trust’s claim relating to the timing of royalty payments on stockpiled DR-grade pellets, rejected all of Mesabi Trust’s claims regarding information sharing deficiencies, and denied Mesabi Trust’s claim for $2 million in attorneys’ fees and expenses.
Environmental Matters. SEC regulations require us to disclose certain information about administrative or judicial proceedings involving the environment and to which a governmental authority is a party if we reasonably believe that such proceedings may result in monetary sanctions above a stated threshold. Pursuant to SEC regulations, we use a threshold of $1 million for purposes of determining whether disclosure of any such proceedings is required. We believe that this threshold is reasonably designed to result in disclosure of any such proceedings that are material to our business or financial condition.
We have described the other material pending legal proceedings, including administrative or judicial proceedings involving the environment, to which we are a party in our Annual Report on Form 10-K for the year ended December 31, 2020, in our Quarterly Reports on Form 10-Q for the quarterly periods ended March 31, 2021 and June 30, 2021, and in NOTE 18 - COMMITMENTS AND CONTINGENCIES to the consolidated financial statements in Part I – Item 1. Financial Statements of this Quarterly Report on Form 10-Q, which is incorporated herein by reference.
OurWe caution readers that our business activities involve risks and uncertainties that could cause actual results to differ materially from those currently expected by management. We described the most significant risks that could impact our results in Part I, Item 1A, "Risk Factors" in our Annual Report on Form 10-K for the year ended December 31, 2020, includesand the additional risk factors presented below update and supplement that disclosure.
Risks Relating to the FPT Acquisition
The FPT Acquisition Agreement may be terminated in accordance with its terms and the FPT Acquisition may not be completed.
The FPT Acquisition Agreement contains a detailed discussionnumber of customary conditions that must be satisfied or waived in order to complete the FPT Acquisition. Those conditions include, among others:
•the receipt of required regulatory approvals;
•the absence of any governmental order or law prohibiting consummation of the FPT Acquisition;
•the accuracy of our risk factors.representations and warranties and the representations and warranties regarding FPT under the FPT Acquisition Agreement (subject to the materiality standards set forth in the FPT Acquisition Agreement);
•the performance by the parties to the FPT Acquisition Agreement of our respective obligations under the FPT Acquisition Agreement in all material respects; and
•the absence of a material adverse effect (as described in the FPT Acquisition Agreement) on FPT.
These conditions to the closing of the FPT Acquisition may not be fulfilled in a timely manner or at all, and, accordingly, the FPT Acquisition may be delayed or may not be completed.
In addition, if the FPT Acquisition is not completed by April 8, 2022 (unless extended by written agreement of the parties), either party may choose not to proceed with the FPT Acquisition. The parties can mutually decide to terminate the FPT Acquisition Agreement at any time.
Even if we complete the proposed FPT Acquisition, we may fail to realize all of the anticipated benefits of the FPT Acquisition, and our integration of FPT may not be as successful as anticipated.
The anticipated benefits of the FPT Acquisition may not be realized fully or at all, may take longer to realize than expected, may require more non-recurring costs and expenditures to realize than expected or could have other adverse effects that we do not currently foresee. In addition, there could be potential unknown liabilities and unforeseen expenses associated with the FPT Acquisition and/or FPT's business that were not disclosed to us or discovered in the course of performing due diligence.
The FPT Acquisition involves numerous operational, financial, accounting, labor, human resources, legal, tax and other functions that must be integrated. Difficulties in integrating FPT may result in the combined company performing differently than expected, in operational challenges or in the failure to realize anticipated expense-related efficiencies. Our and FPT’s existing businesses could also be negatively impacted by the FPT Acquisition. Potential difficulties that may be encountered in the integration process include, among other factors:
•the inability to successfully integrate FPT's business into our existing businesses in a manner that enables us to achieve the anticipated benefits and cost savings from the FPT Acquisition;
•not realizing anticipated operating efficiencies or incurring unexpected costs to realize such efficiencies;
•potential unknown liabilities and unforeseen expenses, delays or regulatory conditions associated with the FPT Acquisition;
•uncertainties related to the entry into a new line of business;
•the loss of key employees, the disruption of ongoing businesses, or inconsistencies in standards, controls, procedures and policies;
•integrating relationships with customers, vendors and business partners;
•performance shortfalls at one or both of the companies as a result of the diversion of management’s attention caused by completing the FPT Acquisition and integrating FPT’s operations into our existing businesses; and
•inconsistencies in standards, controls, procedures and policies.
| | | | | |
| Item 2. | Unregistered Sales of Equity Securities and Use of Proceeds |
The following table presents information with respect to repurchases by the Company of our common shares during the periods indicated:
ISSUER PURCHASES OF EQUITY SECURITIES
| | Period | Period | | Total Number of Shares (or Units) Purchased1 | | Average Price Paid per Share (or Unit) | | Total Number of Shares (or Units) Purchased as Part of Publicly Announced Plans or Programs | | Maximum Number (or Approximate Dollar Value) of Shares (or Units) that May Yet Be Purchased Under the Plans or Programs | Period | | Total Number of Shares (or Units) Purchased1 | | Average Price Paid per Share (or Unit) | | Total Number of Shares (or Units) Purchased as Part of Publicly Announced Plans or Programs | | Maximum Number (or Approximate Dollar Value) of Shares (or Units) that May Yet Be Purchased Under the Plans or Programs |
| January 1 - 31, 2021 | | 731,095 | | | $ | 18.51 | | | — | | | $ | — | | |
| February 1 - 28, 2021 | | 5,521 | | | 16.83 | | | — | | | — | | |
| March 1 - 31, 2021 | | 1,891 | | | 8.68 | | | — | | | — | | |
| July 1 - 31, 2021 | | July 1 - 31, 2021 | | 476 | | | $ | 22.06 | | | — | | | $ | — | |
| August 1 - 31, 2021 | | August 1 - 31, 2021 | | 1,491 | | | 23.90 | | | — | | | — | |
| September 1 - 30, 2021 | | September 1 - 30, 2021 | | 4,787 | | | 21.31 | | | — | | | — | |
| Total | Total | | 738,507 | | | $ | 18.47 | | | — | | | $ | — | | Total | | 6,754 | | | $ | 21.93 | | | — | | | $ | — | |
| 1 All shares were delivered to us to satisfy tax withholding obligations due upon the vesting or payment of stock awards. | 1 All shares were delivered to us to satisfy tax withholding obligations due upon the vesting or payment of stock awards. | 1 All shares were delivered to us to satisfy tax withholding obligations due upon the vesting or payment of stock awards. |
| | | | | |
| Item 4. | Mine Safety Disclosures |
We are committed to protecting the occupational health and well-being of each of our employees. Safety is one of our core values and we strive to ensure that safe production is the first priority for all employees. Our internal objective is to achieve zero injuries and incidents across the Company by focusing on proactively identifying needed prevention activities, establishing standards and evaluating performance to mitigate any potential loss to people, equipment, production and the environment. We have implemented intensive employee training that is geared toward maintaining a high level of awareness and knowledge of safety and health issues in the work environment through the development and coordination of requisite information, skills and attitudes. We believe that through these policies, we have developed an effective safety management system.
Under the Dodd-Frank Act, each operator of a coal or other mine is required to include certain mine safety results within its periodic reports filed with the SEC. As required by the reporting requirements included in §1503(a) of the Dodd-Frank Act and Item 104 of Regulation S-K, the required mine safety results regarding certain mining safety and health matters for each of our mine locations that are covered under the scope of the Dodd-Frank Act are included in Exhibit 95 of Part II – Item 6. Exhibits of this Quarterly Report on Form 10-Q.
None.
All documents referenced below have been filed pursuant to the Securities Exchange Act of 1934 by Cleveland-Cliffs Inc., file number 1-09844, unless otherwise indicated.
| | | | | | | | |
Exhibit Number | | Exhibit |
| | Indenture, dated as of February 17, 2021, by and among Cleveland-Cliffs Inc., the Guarantors party thereto and U.S. Bank National Association, as trustee, including Forms of 4.625% Senior Guaranteed Notes due 2029 and 4.875% Senior Guaranteed Notes due 2031 (filed herewith). |
| | Schedule of the obligated group, including the parent and issuer and the subsidiary guarantors that have guaranteed the obligations under the 5.75% 2025 Senior Notes, the 6.75% 2026 Senior Secured Notes, the 5.875% 2027 Senior Notes, the 7.00% 2027 Senior Notes, the 9.875% 2025 Senior Secured Notes, the 4.625% 2029 Senior Notes and the 4.875% 2031 Senior Notes issued by Cleveland-Cliffs Inc. (filed herewith). |
| | Certification Pursuant to 15 U.S.C. Section 7241, as Adopted Pursuant to Section 302 of the Sarbanes-Oxley Act of 2002, signed and dated by Lourenco Goncalves as of April 28,October 26, 2021 (filed herewith). |
| | Certification Pursuant to 15 U.S.C. Section 7241, as Adopted Pursuant to Section 302 of the Sarbanes-Oxley Act of 2002, signed and dated by Keith A. KociCelso L. Goncalves, Jr. as of April 28,October 26, 2021 (filed herewith). |
| | Certification Pursuant to 18 U.S.C. Section 1350, as Adopted Pursuant to Section 906 of the Sarbanes-Oxley Act of 2002, signed and dated by Lourenco Goncalves, Chairman, President and Chief Executive Officer of Cleveland-Cliffs Inc., as of April 28,October 26, 2021 (filed herewith). |
| | Certification Pursuant to 18 U.S.C. Section 1350, as Adopted Pursuant to Section 906 of the Sarbanes-Oxley Act of 2002, signed and dated by Keith A. Koci,Celso L. Goncalves, Jr., Executive Vice President, Chief Financial Officer of Cleveland-Cliffs Inc., as of April 28,October 26, 2021 (filed herewith). |
| | Mine Safety Disclosures (filed herewith). |
| 101 | | The following financial information from Cleveland-Cliffs Inc.'s Quarterly Report on Form 10-Q for the quarterly period ended March 31,September 30, 2021 formatted in Inline XBRL (Extensible Business Reporting Language) includes: (i) the Statements of Unaudited Condensed Consolidated Financial Position, (ii) the Statements of Unaudited Condensed Consolidated Operations, (iii) the Statements of Unaudited Condensed Consolidated Comprehensive Income (Loss), (iv) the Statements of Unaudited Condensed Consolidated Cash Flows, (v) the Statements of Unaudited Condensed Consolidated Changes in Equity, and (vi) Notes to the Unaudited Condensed Consolidated Financial Statements. |
| 104 | | The cover page from this Quarterly Report on Form 10-Q, formatted in Inline XBRL and contained in Exhibit 101. |
SIGNATURES
Pursuant to the requirements of the Securities Exchange Act of 1934, the Registrant has duly caused this report to be signed on its behalf by the undersigned, thereunto duly authorized.
| | | | | | | | | | | | | | | | | | | | | | | |
| | | CLEVELAND-CLIFFS INC. |
| | | | |
| | | By: | | /s/ Kimberly A. Floriani |
| | | | | Name: | | Kimberly A. Floriani |
| | | | | Title: | | Senior Vice President, Corporate Controller & Chief Accounting Officer |
| | | | | | | |
| Date: | April 28,October 26, 2021 | | | | | | |