UNITED STATES
SECURITIES AND EXCHANGE COMMISSION
Washington, D.C. 20549
FORM 10-Q
x QUARTERLY REPORT PURSUANT TO SECTION 13 OR 15(d) OF THE SECURITIES EXCHANGE ACT OF 1934
For the quarterly period ended SeptemberJune 30, 20172019
Commission File No. 001-11241
CATERPILLAR FINANCIAL SERVICES CORPORATION
(Exact name of Registrant as specified in its charter)
|
| | |
| Delaware | 37-1105865 |
| (State of incorporation) | (IRS Employer I.D. No.) |
| | |
2120 West End Ave. , Nashville, Tennessee | 37203-0001 |
| (Address of principal executive offices) | (Zip Code) |
Registrant's telephone number, including area code:(615) 341-1000
|
| | | | |
| Securities registered pursuant to Section 12(b) of the Act: |
| Title of each class | Trading Symbol(s) | | Name of each exchange on which registered |
| Medium-Term Notes, Series H, 3.300% Notes Due 2024 | CAT/24 | | New York Stock Exchange
|
Indicate by check mark whether the registrant (1) has filed all reports required to be filed by Section 13 or 15(d) of the Securities Exchange Act of 1934 during the preceding 12 months (or for such shorter period that the registrant was required to file such reports), and (2) has been subject to such filing requirements for the past 90 days. Yes [ü ] No [ ]
Indicate by check mark whether the registrant has submitted electronically and posted on its corporate Web site, if any, every Interactive Data File required to be submitted and posted pursuant to Rule 405 of Regulation S-T (§232.405 of this chapter) during the preceding 12 months (or for such shorter period that the registrant was required to submit and post such files). Yes [ü ] No [ ]
Indicate by check mark whether the registrant is a large accelerated filer, an accelerated filer, a non-accelerated filer, smaller reporting company, or an emerging growth company. See the definitions of "large accelerated filer," "accelerated filer," "smaller reporting company," and "emerging growth company" in Rule 12b-2 of the Exchange Act.
|
| | | | |
| Large accelerated filer | [ ] | | Accelerated filer | [ ] |
| Non-accelerated filer | [ü ] | (Do not check if a smaller reporting company) | |
| | | Smaller reporting company | [ ] |
| | | | Emerging growth company | [ ] |
If an emerging growth company, indicate by check mark if the registrant has elected not to use the extended transition period for complying with any new or revised financial accounting standards provided pursuant to Section 13(a) of the Exchange Act. [ ]
Indicate by check mark whether the registrant is a shell company (as defined in Rule 12b-2 of the Exchange Act).
Yes [ ] No [ü ]
As of NovemberAugust 1, 2017,2019, one share of common stock of the registrant was outstanding, which is owned by Caterpillar Inc.
The registrant is a wholly owned subsidiary of Caterpillar Inc. and meets the conditions set forth in General Instruction (H)(1)(a) and (b) of Form 10-Q, and is therefore filing this form with the reduced disclosure format.
PART I. FINANCIAL INFORMATION
ITEM 1. CONSOLIDATED FINANCIAL STATEMENTS (Unaudited)
In addition to the accompanying unaudited consolidated financial statements for Caterpillar Financial Services Corporation (together with its subsidiaries, "Cat Financial," "the Company," "we," "us" or "our"), we suggest that you read our 20162018 Annual Report on Form 10-K filed with the Securities and Exchange Commission (SEC) on February 15, 2017.14, 2019. The Company files electronically with the SEC required reports on Form 8-K, Form 10-Q, Form 10-K and10-K; registration statements on Form S-3S-3; and other forms or reports as required. The public may read and copy any materials the Company has filed with the SEC at the SEC’s Public Reference Room at 100 F Street, N.E., Washington, D.C. 20549. The public may obtain information on the operation of the Public Reference Room by calling the SEC at 1-800-SEC-0330. The SEC maintains a website (www.sec.gov) that contains reports, proxy and information statements, and other information regarding issuers that file electronically with the SEC. Copies of our annual report on Form 10-K, quarterly reports on Form 10-Q, current reports on Form 8-K and any amendments to these reports filed or furnished with the SEC are available free of charge through Caterpillar Inc.'sCaterpillar’s website (www.caterpillar.com/secfilings) as soon as reasonably practicable after filing with the SEC. Copies may also be obtained free of charge by writing to: Legal Dept., Caterpillar Financial Services Corporation, 2120 West End Ave., Nashville, Tennessee 37203-0001. In addition, the public may obtain more detailed information about our parent company, Caterpillar, Inc. (together with its subsidiaries, "Caterpillar" or "Cat") by visiting its website (www.caterpillar.com). None of the information contained at any time on our website Caterpillar’s website or the SEC’sCaterpillar’s website is incorporated by reference into this document.
Caterpillar Financial Services Corporation
CONSOLIDATED STATEMENTS OF PROFIT
(Unaudited)
(Dollars in Millions)
| | | | Three Months Ended
September 30, | | Nine Months Ended
September 30, | Three Months Ended
June 30, | | Six Months Ended
June 30, |
| | 2017 |
| 2016 | | 2017 | | 2016 | 2019 |
| 2018 | | 2019 | | 2018 |
| | | | | | | | | | | | | | | |
| Revenues: | | | | | | | | | | | | | | |
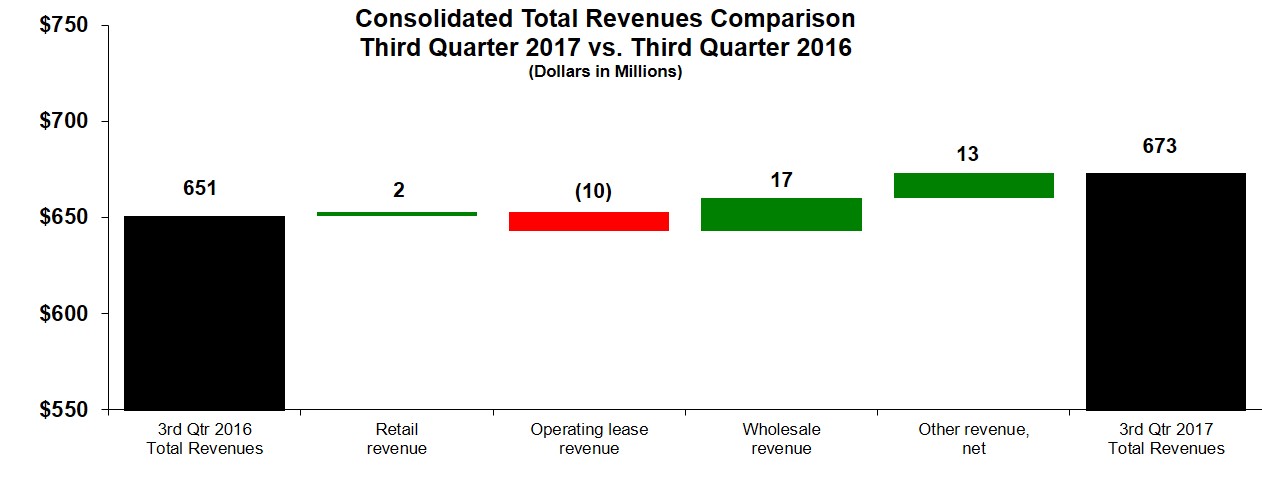
| Retail finance | $ | 309 |
| | $ | 307 |
| | $ | 924 |
| | $ | 914 |
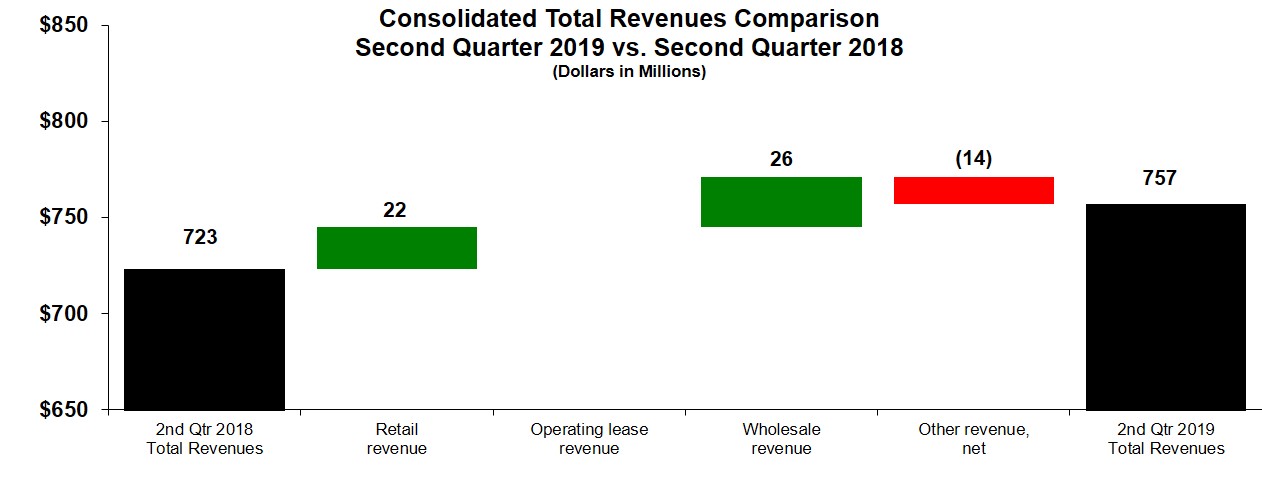
| $ | 350 |
| | $ | 328 |
| | $ | 685 |
| | $ | 645 |
|
| Operating lease | 247 |
| | 257 |
| | 737 |
| | 756 |
| 257 |
| | 257 |
| | 515 |
| | 501 |
|
| Wholesale finance | 79 |
| | 62 |
| | 222 |
| | 202 |
| 131 |
| | 105 |
| | 250 |
| | 196 |
|
| Other, net | 38 |
| | 25 |
| | 128 |
| | 81 |
| 19 |
| | 33 |
| | 43 |
| | 71 |
|
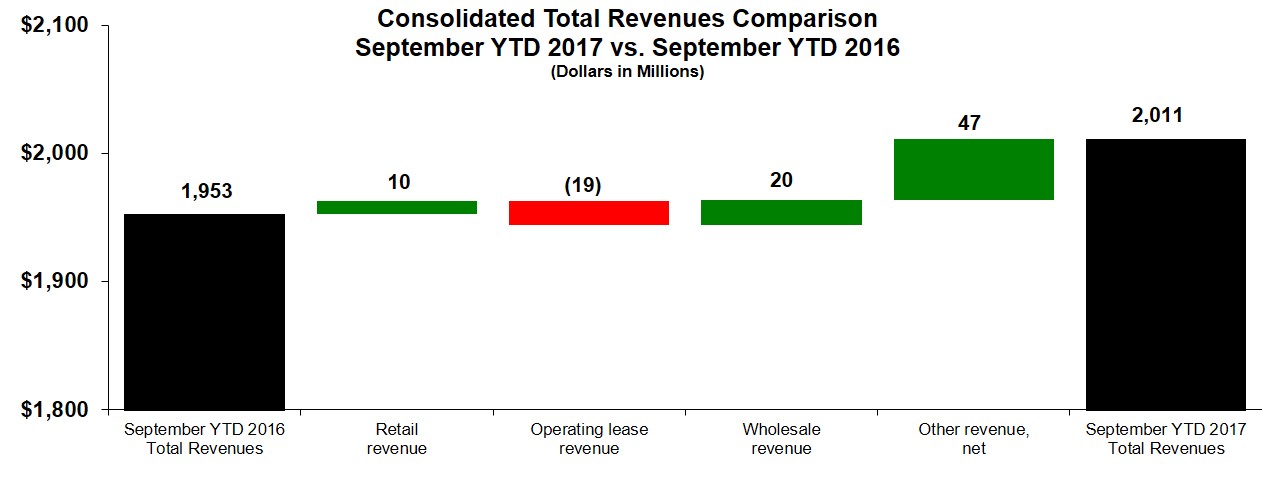
| Total revenues | 673 |
| | 651 |
| | 2,011 |
| | 1,953 |
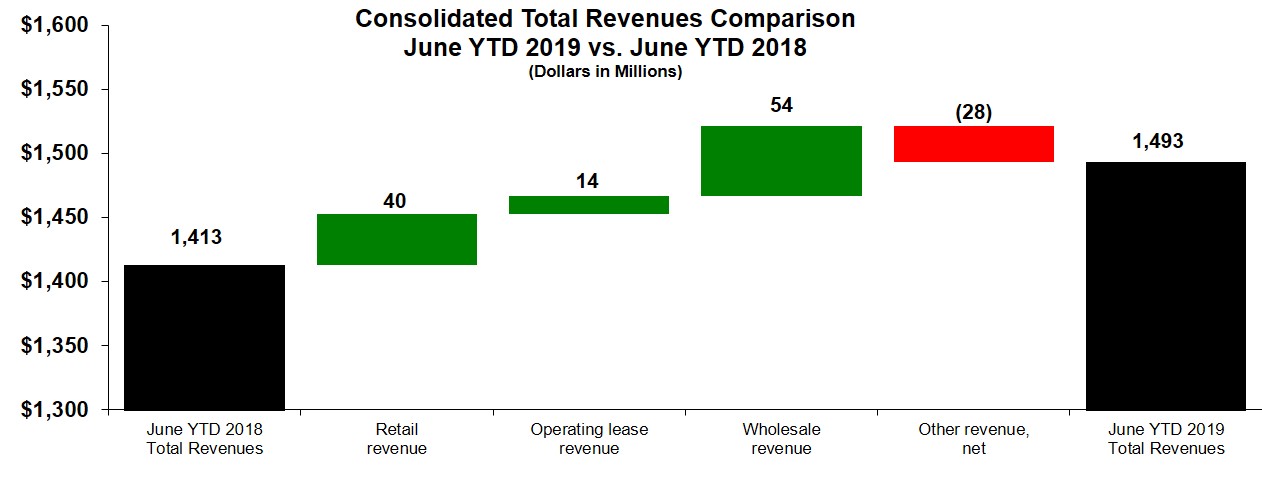
| 757 |
| | 723 |
| | 1,493 |
| | 1,413 |
|
| | | | | | | | | | | | | | | |
| Expenses: | |
| | |
| | |
| | |
| |
| | |
| | |
| | |
|
| Interest | 169 |
| | 151 |
| | 499 |
| | 458 |
| 200 |
| | 190 |
| | 401 |
| | 364 |
|
| Depreciation on equipment leased to others | 201 |
| | 213 |
| | 608 |
| | 627 |
| 204 |
| | 209 |
| | 406 |
| | 408 |
|
| General, operating and administrative | 113 |
| | 97 |
| | 319 |
| | 292 |
| 126 |
| | 107 |
| | 250 |
| | 217 |
|
| Provision for credit losses | 48 |
| | 29 |
| | 82 |
| | 96 |
| 71 |
| | 104 |
| | 124 |
| | 171 |
|
| Other | 12 |
| | 12 |
| | 36 |
| | 31 |
| 9 |
| | 8 |
| | 19 |
| | 17 |
|
| Total expenses | 543 |
| | 502 |
| | 1,544 |
| | 1,504 |
| 610 |
| | 618 |
| | 1,200 |
| | 1,177 |
|
| | | | | | | | | | | | | | | |
| Other income (expense) | (4 | ) | | (3 | ) | | (10 | ) | | (10 | ) | (6 | ) | | (5 | ) | | (10 | ) | | (12 | ) |
| | | | | | | | | | | | | | | |
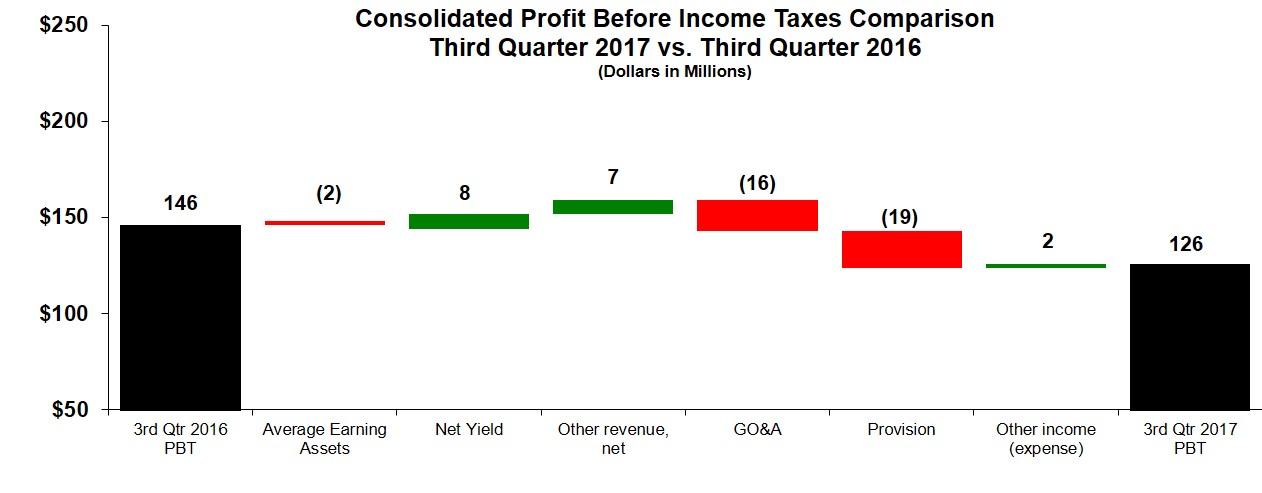
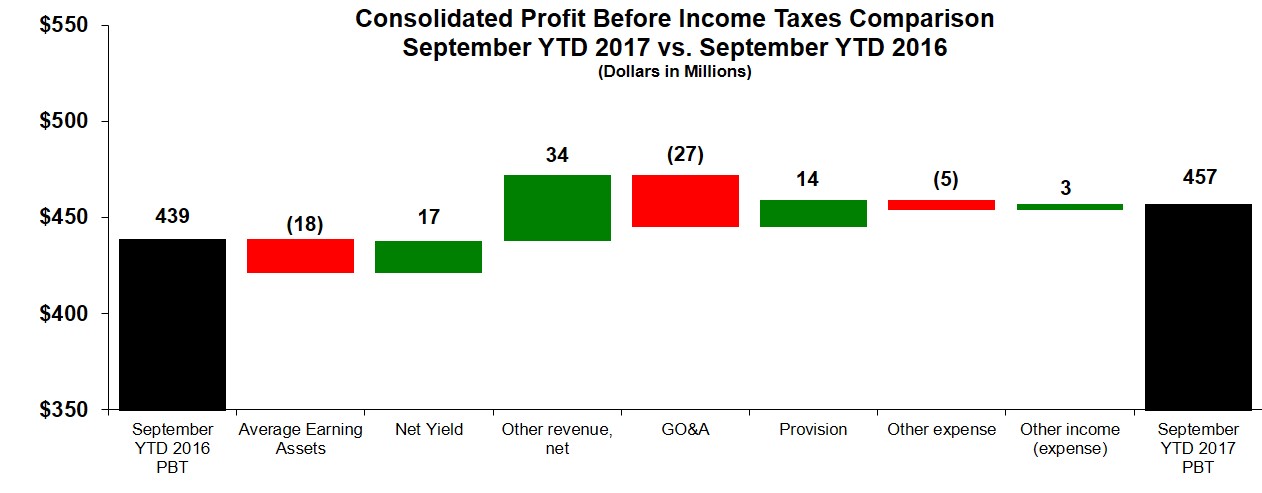
| Profit before income taxes | 126 |
| | 146 |
| | 457 |
| | 439 |
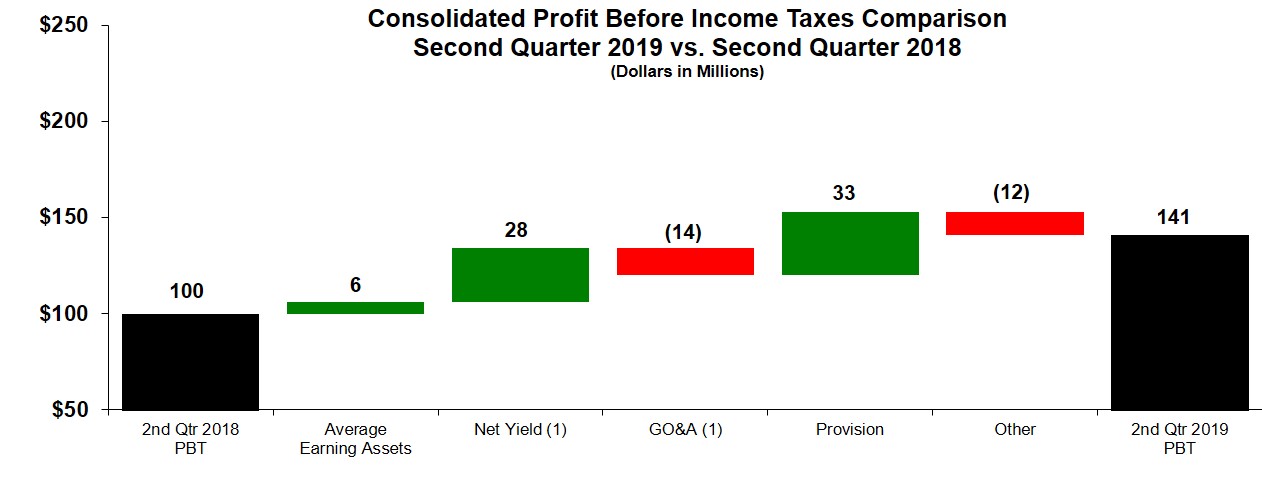
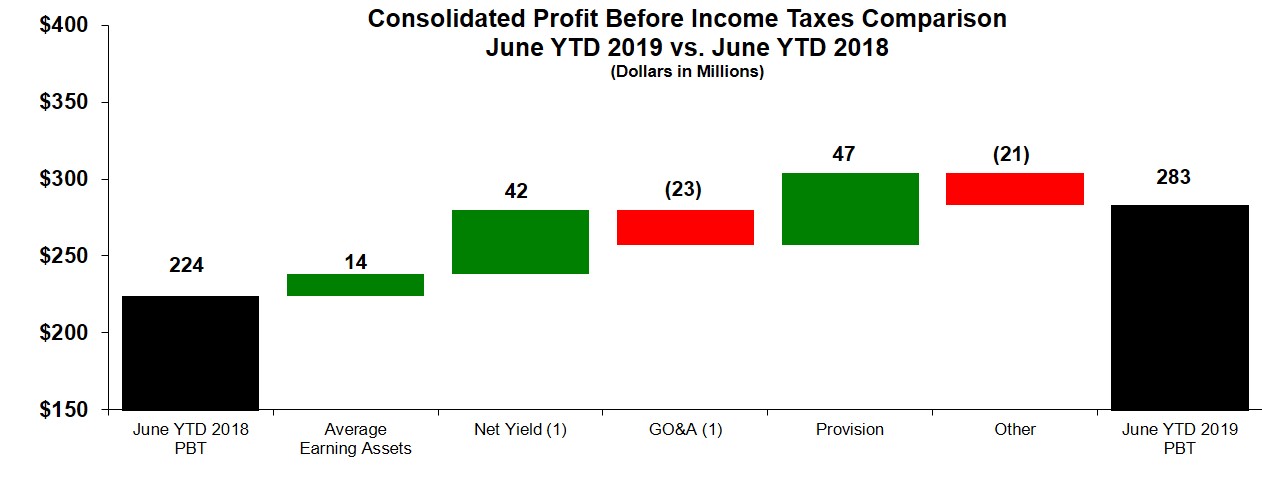
| 141 |
| | 100 |
| | 283 |
| | 224 |
|
| | | | | | | | | | | | | | | |
| Provision for income taxes | 38 |
| | 48 |
| | 137 |
| | 136 |
| 57 |
| | 24 |
| | 95 |
| | 53 |
|
| | | | | | | | | | | | | | | |
| Profit of consolidated companies | 88 |
| | 98 |
| | 320 |
| | 303 |
| 84 |
| | 76 |
| | 188 |
| | 171 |
|
| | | | | | | | | | | | | | | |
| Less: Profit attributable to noncontrolling interests | 2 |
| | 1 |
| | 5 |
| | 4 |
| 5 |
| | 5 |
| | 11 |
| | 9 |
|
| | | | | | | | | | | | | | | |
Profit 1 | $ | 86 |
| | $ | 97 |
| | $ | 315 |
| | $ | 299 |
| |
Profit(1) | | $ | 79 |
| | $ | 71 |
| | $ | 177 |
| | $ | 162 |
|
| | | | | | | | | | | | | | | |
1(1) Profit attributable to Caterpillar Financial Services Corporation.
See Notes to Consolidated Financial Statements (unaudited).
Caterpillar Financial Services Corporation
CONSOLIDATED STATEMENTS OF COMPREHENSIVE INCOME
(Unaudited)
(Dollars in Millions)
| | | | Three Months Ended
September 30, | | Nine Months Ended
September 30, | Three Months Ended
June 30, | | Six Months Ended
June 30, |
| | 2017 |
| 2016 | | 2017 | | 2016 | 2019 |
| 2018 | | 2019 | | 2018 |
| | | | | | | | | | | | | | | |
| Profit of consolidated companies | $ | 88 |
| | $ | 98 |
| | $ | 320 |
| | $ | 303 |
| $ | 84 |
| | $ | 76 |
| | $ | 188 |
| | $ | 171 |
|
| | | | | | | | | | | | | | | |
| Other comprehensive income (loss), net of tax: | | | | | | | | | | | | | | |
Foreign currency translation, net of tax (expense)/benefit of:
2017 $30 three months, $94 nine months;
2016 $4 three months, $21 nine months | 154 |
| | (5 | ) | | 395 |
| | 100 |
| |
Foreign currency translation, net of tax (expense)/benefit of:
2019 $7 three months, $3 six months; 2018 $(31) three months, $(15) six months | | 18 |
| | (262 | ) | | 33 |
| | (191 | ) |
| Derivative financial instruments: | | | | | | | | | | | | | | |
Gains (losses) deferred, net of tax (expense)/benefit of: 2017 $8 three months, $22 nine months; 2016 $5 three months, $8 nine months | (14 | ) | | (10 | ) | | (41 | ) | | (15 | ) | |
(Gains) losses reclassified to earnings, net of tax expense/(benefit) of:
2017 $(7) three months, $(23) nine months;
2016 $(3) three months, $(6) nine months | 11 |
| | 7 |
| | 41 |
| | 13 |
| |
| Available-for-sale securities: | | | | | | | | |
Gains (losses) deferred, net of tax (expense)/benefit of:
2017 $0 three months, $0 nine months;
2016 $(1) three months, $(1) nine months | (1 | ) | | 1 |
| | — |
| | (1 | ) | |
(Gains) losses reclassified to earnings, net of tax expense/(benefit) of:
2017 $0 three months, $0 nine months;
2016 $0 three months, $0 nine months | — |
| | — |
| | — |
| | — |
| |
Gains (losses) deferred, net of tax (expense)/benefit of:
2019 $5 three months, $6 six months; 2018 $(29) three months, $(22) six months | | (19 | ) | | 99 |
| | (22 | ) | | 73 |
|
(Gains) losses reclassified to earnings, net of tax expense/(benefit) of:
2019 $- three months, $3 six months; 2018 $28 three months, $23 six months | | (3 | ) | | (96 | ) | | (14 | ) | | (76 | ) |
| Total Other comprehensive income (loss), net of tax | 150 |
| | (7 | ) | | 395 |
| | 97 |
| (4 | ) | | (259 | ) | | (3 | ) | | (194 | ) |
| |
|
| | | | | | |
|
| | | | | | |
| Comprehensive income (loss) | 238 |
| | 91 |
| | 715 |
| | 400 |
| 80 |
| | (183 | ) | | 185 |
| | (23 | ) |
| | | | | | | | | | | | | | | |
Less: Comprehensive income (loss) attributable to the noncontrolling interests | 5 |
| | 1 |
| | 11 |
| | 2 |
| 3 |
| | (3 | ) | | 11 |
| | 7 |
|
| | | | | | | | | | | | | | | |
Comprehensive income (loss) attributable to Caterpillar Financial Services Corporation | $ | 233 |
| | $ | 90 |
| | $ | 704 |
| | $ | 398 |
| $ | 77 |
| | $ | (180 | ) | | $ | 174 |
| | $ | (30 | ) |
| | | | | | | | | | | | | | | |
See Notes to Consolidated Financial Statements (unaudited).
Caterpillar Financial Services Corporation
CONSOLIDATED STATEMENTS OF FINANCIAL POSITION
(Unaudited)
(Dollars in Millions, except share data)
| | | | September 30,
2017 | | December 31,
2016 | June 30,
2019 | | December 31,
2018 |
| Assets: | | | | | | |
| Cash and cash equivalents | $ | 710 |
| | $ | 1,795 |
| $ | 760 |
| | $ | 766 |
|
| Finance receivables, net | 26,597 |
| | 26,212 |
| 28,297 |
| | 27,923 |
|
| Notes receivable from Caterpillar | 1,577 |
| | 530 |
| 640 |
| | 662 |
|
| Equipment on operating leases, | |
| | |
| |
| less accumulated depreciation | 3,580 |
| | 3,708 |
| |
| Deferred and refundable income taxes | 156 |
| | 119 |
| |
| Equipment on operating leases, net | | 3,575 |
| | 3,562 |
|
| Other assets | 1,063 |
| | 1,251 |
| 1,293 |
| | 1,268 |
|
| Total assets | $ | 33,683 |
| | $ | 33,615 |
| $ | 34,565 |
| | $ | 34,181 |
|
| | | | | | | |
| Liabilities and shareholder’s equity: | |
| | |
| |
| | |
|
| Payable to dealers and others | $ | 142 |
| | $ | 140 |
| $ | 411 |
| | $ | 117 |
|
| Payable to Caterpillar - other | 60 |
| | 49 |
| |
| Payable to Caterpillar - borrowings and other | | 1,389 |
| | 1,601 |
|
| Accrued expenses | 241 |
| | 172 |
| 289 |
| | 259 |
|
| Income taxes payable | 95 |
| | 32 |
| |
| Payable to Caterpillar - borrowings | 1,493 |
| | 1,637 |
| |
| Short-term borrowings | 5,459 |
| | 7,094 |
| 5,266 |
| | 5,723 |
|
| Current maturities of long-term debt | 5,614 |
| | 6,155 |
| 6,235 |
| | 5,820 |
|
| Long-term debt | 16,015 |
| | 14,382 |
| 17,107 |
| | 16,995 |
|
| Deferred income taxes and other liabilities | 864 |
| | 969 |
| |
| Other liabilities | | 834 |
| | 817 |
|
| Total liabilities | 29,983 |
| | 30,630 |
| 31,531 |
| | 31,332 |
|
| | | | | | | |
| Commitments and contingent liabilities (Notes 7 and 9) |
|
| |
|
| |
| Commitments and contingent liabilities (Notes 8 and 10) | |
|
| |
|
|
| | | | | | | |
| Common stock - $1 par value | | | |
| | | |
|
| Authorized: 2,000 shares; Issued and | |
| | |
| |
| | |
|
| outstanding: one share (at paid-in amount) | 745 |
| | 745 |
| 745 |
| | 745 |
|
| Additional paid-in capital | 2 |
| | 2 |
| 2 |
| | 2 |
|
| Retained earnings | 3,423 |
| | 3,108 |
| 2,954 |
| | 2,874 |
|
| Accumulated other comprehensive income/(loss) | (606 | ) | | (995 | ) | (831 | ) | | (925 | ) |
| Noncontrolling interests | 136 |
| | 125 |
| 164 |
| | 153 |
|
| Total shareholder’s equity | 3,700 |
| | 2,985 |
| 3,034 |
| | 2,849 |
|
| | | | | | | |
| Total liabilities and shareholder’s equity | $ | 33,683 |
| | $ | 33,615 |
| $ | 34,565 |
| | $ | 34,181 |
|
| | | | | | | |
See Notes to Consolidated Financial Statements (unaudited).
Caterpillar Financial Services Corporation
CONSOLIDATED STATEMENTS OF CHANGES IN SHAREHOLDER'S EQUITY
(Unaudited)
(Dollars in Millions)
|
| | | | | | | | | | | | | | | | | | | | | | | |
Nine Months Ended
September 30, 2016 | Common stock | | Additional paid-in capital | | Retained earnings | | Accumulated other comprehensive income/(loss) | | Noncontrolling interests | | Total |
| Balance at December 31, 2015 | $ | 745 |
| | $ | 2 |
| | $ | 2,999 |
| | $ | (897 | ) | | $ | 126 |
| | $ | 2,975 |
|
| Profit of consolidated companies | |
| | |
| | 299 |
| | |
| | 4 |
| | 303 |
|
| Foreign currency translation, net of tax | |
| | |
| | |
| | 102 |
| | (2 | ) | | 100 |
|
| Derivative financial instruments, net of tax | |
| | |
| | |
| | (2 | ) | | |
| | (2 | ) |
| Available-for-sale securities, net of tax | | | | | | | (1 | ) | | | | (1 | ) |
| Balance at September 30, 2016 | $ | 745 |
| | $ | 2 |
| | $ | 3,298 |
| | $ | (798 | ) | | $ | 128 |
| | $ | 3,375 |
|
| | | | | | | | | | | | |
Nine Months Ended
September 30, 2017 | |
| | |
| | |
| | |
| | |
| | |
|
| Balance at December 31, 2016 | $ | 745 |
| | $ | 2 |
| | $ | 3,108 |
| | $ | (995 | ) | | $ | 125 |
| | $ | 2,985 |
|
| Profit of consolidated companies | |
| | |
| | 315 |
| | |
| | 5 |
| | 320 |
|
| Foreign currency translation, net of tax | |
| | |
| | |
| | 389 |
| | 6 |
| | 395 |
|
| Derivative financial instruments, net of tax | |
| | |
| | |
| | — |
| | |
| | — |
|
| Available-for-sale securities, net of tax | | | | | | | — |
| | | | — |
|
| Balance at September 30, 2017 | $ | 745 |
| | $ | 2 |
| | $ | 3,423 |
| | $ | (606 | ) | | $ | 136 |
| | $ | 3,700 |
|
| | | | | | | | | | | | |
|
| | | | | | | | | | | | | | | | | | | | | | | |
| Three Months Ended June 30, 2018 | Common stock | | Additional paid-in capital | | Retained earnings | | Accumulated other comprehensive income/(loss) | | Noncontrolling interests | | Total |
| Balance at March 31, 2018 | $ | 745 |
| | $ | 2 |
| | $ | 3,060 |
| | $ | (533 | ) | | $ | 150 |
| | $ | 3,424 |
|
| Profit of consolidated companies | | | | | 71 |
| | | | 5 |
| | 76 |
|
| Foreign currency translation, net of tax | | | | | | | (254 | ) | | (8 | ) | | (262 | ) |
| Derivative financial instruments, net of tax | | | | | | | 3 |
| | | | 3 |
|
| Balance at June 30, 2018 | $ | 745 |
| | $ | 2 |
| | $ | 3,131 |
| | $ | (784 | ) | | $ | 147 |
| | $ | 3,241 |
|
| | | | | | | | | | | | |
| Three Months Ended June 30, 2019 | | | | | | | | | | | |
| Balance at March 31, 2019 | $ | 745 |
| | $ | 2 |
| | $ | 2,875 |
| | $ | (829 | ) | | $ | 161 |
| | $ | 2,954 |
|
| Profit of consolidated companies | | | | | 79 |
| | | | 5 |
| | 84 |
|
| Foreign currency translation, net of tax | | | | | | | 20 |
| | (2 | ) | | 18 |
|
| Derivative financial instruments, net of tax | | | | | | | (22 | ) | | | | (22 | ) |
| Balance at June 30, 2019 | $ | 745 |
| | $ | 2 |
| | $ | 2,954 |
| | $ | (831 | ) | | $ | 164 |
| | $ | 3,034 |
|
| | | | | | | | | | | | |
| Six Months Ended June 30, 2018 | | | | | | | | | | | |
| Balance at December 31, 2017 | $ | 745 |
| | $ | 2 |
| | $ | 2,969 |
| | $ | (592 | ) | | $ | 140 |
| | $ | 3,264 |
|
| Profit of consolidated companies | |
| | |
| | 162 |
| | |
| | 9 |
| | 171 |
|
| Foreign currency translation, net of tax | |
| | |
| | |
| | (189 | ) | | (2 | ) | | (191 | ) |
| Derivative financial instruments, net of tax | |
| | |
| | |
| | (3 | ) | | |
| | (3 | ) |
| Balance at June 30, 2018 | $ | 745 |
| | $ | 2 |
| | $ | 3,131 |
| | $ | (784 | ) | | $ | 147 |
| | $ | 3,241 |
|
| | | | | | | | | | | | |
| Six Months Ended June 30, 2019 | |
| | |
| | |
| | |
| | |
| | |
|
| Balance at December 31, 2018 | $ | 745 |
| | $ | 2 |
| | $ | 2,874 |
| | $ | (925 | ) | | $ | 153 |
| | $ | 2,849 |
|
| Profit of consolidated companies | |
| | |
| | 177 |
| | |
| | 11 |
| | 188 |
|
| Foreign currency translation, net of tax | |
| | |
| | |
| | 33 |
| | — |
| | 33 |
|
| Derivative financial instruments, net of tax | |
| | |
| | |
| | (36 | ) | | |
| | (36 | ) |
Adjustment to adopt new accounting guidance(1) | | | | | (97 | ) | | 97 |
| | | | — |
|
| Balance at June 30, 2019 | $ | 745 |
| | $ | 2 |
| | $ | 2,954 |
| | $ | (831 | ) | | $ | 164 |
| | $ | 3,034 |
|
| | | | | | | | | | | | |
(1) See Note 2 regarding new accounting guidance related to reclassification of certain tax effects from accumulated other comprehensive income/(loss).
See Notes to Consolidated Financial Statements (unaudited).
Caterpillar Financial Services Corporation
CONSOLIDATED STATEMENTS OF CASH FLOWS
(Unaudited)
(Dollars in Millions)
| | | | Nine Months Ended
September 30, | Six Months Ended
June 30, |
| | 2017 | | 2016 | 2019 | | 2018 |
| Cash flows from operating activities: | | | | | | |
| Profit of consolidated companies | $ | 320 |
| | $ | 303 |
| $ | 188 |
| | $ | 171 |
|
| Adjustments for non-cash items: | |
| | |
| |
| | |
|
| Depreciation and amortization | 616 |
| | 635 |
| 413 |
| | 414 |
|
| Amortization of receivables purchase discount | (180 | ) | | (158 | ) | (231 | ) | | (177 | ) |
| Provision for credit losses | 82 |
| | 96 |
| 124 |
| | 171 |
|
| Other, net | 12 |
| | 81 |
| 74 |
| | 67 |
|
| Changes in assets and liabilities: | |
| | |
| |
| | |
|
| Receivables from others | 69 |
| | 10 |
| |
| Other receivables/payables with Caterpillar | 1 |
| | (2 | ) | |
| Other assets | | 56 |
| | (1 | ) |
| Payable to dealers and others | (31 | ) | | 30 |
| 294 |
| | (42 | ) |
| Accrued interest payable | 3 |
| | (17 | ) | |
| Accrued expenses and other liabilities, net | (4 | ) | | 22 |
| |
| Income taxes payable | 38 |
| | 100 |
| |
| Settlements of designated derivatives | (7 | ) | | 36 |
| |
| Debt exchange premium | — |
| | (33 | ) | |
| Accrued expenses | | (38 | ) | | (13 | ) |
| Other payables with Caterpillar | | (4 | ) | | (29 | ) |
| Other liabilities | | 31 |
| | (52 | ) |
| Net cash provided by operating activities | 919 |
| | 1,103 |
| 907 |
| | 509 |
|
| | | | | | | |
| Cash flows from investing activities: | |
| | |
| |
| | |
|
| Capital expenditures for equipment on operating leases and other capital expenditures | (1,018 | ) | | (1,265 | ) | |
| Expenditures for equipment on operating leases | | (694 | ) | | (799 | ) |
| Capital expenditures - excluding equipment on operating leases | | (11 | ) | | (95 | ) |
| Proceeds from disposals of equipment | 753 |
| | 497 |
| 354 |
| | 454 |
|
| Additions to finance receivables | (9,765 | ) | | (8,888 | ) | (7,027 | ) | | (6,823 | ) |
| Collections of finance receivables | 10,192 |
| | 9,307 |
| 6,543 |
| | 6,142 |
|
| Net changes in Caterpillar purchased receivables | (161 | ) | | 580 |
| 15 |
| | (608 | ) |
| Proceeds from sales of receivables | 98 |
| | 55 |
| 119 |
| | 124 |
|
| Net change in variable lending to Caterpillar | (1,051 | ) | | (1,001 | ) | 69 |
| | (39 | ) |
| Additions to other notes receivable with Caterpillar | (53 | ) | | (91 | ) | (80 | ) | | (90 | ) |
| Collections on other notes receivable with Caterpillar | 56 |
| | 46 |
| 33 |
| | 42 |
|
| Proceeds from sale of securities | 4 |
| | — |
| |
| Restricted cash and cash equivalents activity, net | (2 | ) | | 7 |
| |
| Settlements of undesignated derivatives | 23 |
| | (23 | ) | (31 | ) | | (4 | ) |
| Net cash provided by (used for) investing activities | (924 | ) | | (776 | ) | (710 | ) | | (1,696 | ) |
| | | | | | | |
| Cash flows from financing activities: | |
| | |
| |
| | |
|
| Net change in variable lending from Caterpillar | (105 | ) | | 466 |
| (118 | ) | | (109 | ) |
| Proceeds from borrowings with Caterpillar | — |
| | 253 |
| |
| Payments on borrowings with Caterpillar | (49 | ) | | (3 | ) | (93 | ) | | — |
|
| Proceeds from debt issued (original maturities greater than three months) | 6,972 |
| | 4,424 |
| 5,340 |
| | 4,307 |
|
| Payments on debt issued (original maturities greater than three months) | (5,714 | ) | | (5,077 | ) | (4,897 | ) | | (4,433 | ) |
| Short-term borrowings, net (original maturities three months or less) | (2,207 | ) | | (365 | ) | (436 | ) | | 1,453 |
|
| Net cash provided by (used for) financing activities | (1,103 | ) | | (302 | ) | (204 | ) | | 1,218 |
|
| | | | | | | |
| Effect of exchange rate changes on cash and cash equivalents | 23 |
| | 10 |
| |
| Effect of exchange rate changes on cash, cash equivalents and restricted cash | | (2 | ) | | (9 | ) |
| | | | | | | |
| Increase/(decrease) in cash and cash equivalents | (1,085 | ) | | 35 |
| |
| Cash and cash equivalents at beginning of year | 1,795 |
| | 1,016 |
| |
| Cash and cash equivalents at end of period | $ | 710 |
| | $ | 1,051 |
| |
| Increase/(decrease) in cash, cash equivalents and restricted cash | | (9 | ) | | 22 |
|
Cash, cash equivalents and restricted cash at beginning of year(1) | | 773 |
| | 732 |
|
Cash, cash equivalents and restricted cash at end of period(1) | | $ | 764 |
| | $ | 754 |
|
| | | | | | | |
| Non-cash activity: In September 2016, $381 million of medium-term notes with varying interest rates and maturity dates were exchanged for $366 million of 1.93% medium-term notes due in 2021 and $15 million of cash. In addition, a debt exchange premium of $33 million was paid and is included in the operating section of the Consolidated Statements of Cash Flows. | |
(1) As of June 30, 2019 and December 31, 2018, restricted cash, which is included in Other assets in the Consolidated Statements of Financial Position, was $4 million and $7 million, respectively. Restricted cash primarily includes cash related to syndication activities.
See Notes to Consolidated Financial Statements (unaudited).
Notes to Consolidated Financial Statements
(Unaudited)
In the opinion of management, the accompanying unaudited consolidated financial statements include all adjustments, consisting only of normal recurring adjustments, necessary for a fair statement of (a) the consolidated profit for the three and ninesix months ended SeptemberJune 30, 20172019 and 2016,2018, (b) the consolidated comprehensive income for the three and ninesix months ended SeptemberJune 30, 20172019 and 2016,2018, (c) the consolidated financial position as of SeptemberJune 30, 20172019 and December 31, 2016,2018, (d) the consolidated changes in shareholder's equity for the ninethree and six months ended SeptemberJune 30, 20172019 and 20162018 and (e) the consolidated cash flows for the ninesix months ended SeptemberJune 30, 20172019 and 2016.2018. The preparation of financial statements, in conformity with generally accepted accounting principles in the United States of America (U.S. GAAP) and pursuant to the rules and regulations of the Securities and Exchange Commission (SEC), requires management to make estimates and assumptions that affect reported amounts. Significant estimates include residual values for leased assets, allowance for credit losses and income taxes. Actual results may differ from these estimates.
Interim results are not necessarily indicative of results for a full year. The information included in this Form 10-Q should be read in conjunction with the audited consolidated financial statements and notes thereto included in our annual report on Form 10-K for the year ended December 31, 2016 (20162018 (2018 Form 10-K) filed with the SEC on February 15, 2017.14, 2019. The December 31, 20162018 financial position data included herein was derived from the audited consolidated financial statements included in the 20162018 Form 10-K but does not include all disclosures required by U.S. GAAP. Certain amounts for prior periods have been reclassified to conform to thewith current period financial statement presentation.
We consolidate all variable-interestvariable interest entities (VIEs) where we are the primary beneficiary. For VIEs, we assess whether we are the primary beneficiary as prescribed by the accounting guidance on the consolidation of VIEs. The primary beneficiary of a VIE is the party that has both the power to direct the activities that most significantly impact the entity’s economic performance and the obligation to absorb losses or the right to receive benefits that could potentially be significant to the entity. Please refer to Note 78 for more information.
We have customers and dealers that are VIEs of which we are not the primary beneficiary. Although we have provided financial support to these entities and therefore have a variable interest, we do not have the power to direct the activities that most significantly impact their economic performance. Our maximum exposure to loss from our involvement with these VIEs is limited to the credit risk inherently present in the financial support that we have provided. These risks are evaluated and reflected in our financial statements as part of our overall portfolio of finance receivables and related allowance for credit losses.
| |
| 2. | New Accounting Pronouncements |
| |
| A. | Adoption of New Accounting Standards |
Revenue recognitionLease accounting (Accounting Standards Update (ASU) 2016-02) – In May 2014,February 2016, the Financial Accounting Standards Board (FASB) issued new revenue recognition guidance to provide a single, comprehensive revenue recognition model for all contracts with customers. Under the new guidance, an entity will recognize revenue to depict the transfer of promised goods or services to customers at an amount that the entity expects to be entitled to in exchange for those goods or services. A five step model has been introduced for an entity to apply when recognizing revenue. The new guidance also includes enhanced disclosure requirements and is effective January 1, 2018. Entities have the option to apply the new guidance under a retrospective approach to each prior reporting period presented, or a modified retrospective approach with the cumulative effect of initially applying the new guidance recognized at the date of initial application within the Consolidated Statement of Changes in Shareholder's Equity. We will adopt the new guidance effective January 1, 2018 under the modified retrospective approach. We have completed our evaluation of the impact of the new standard and do not expect the adoption to have a material impact on our financial statements.
Recognition and measurement of financial assets and financial liabilities – In January 2016, the FASB issued accounting guidance that affects the accounting for equity investments, financial liabilities accounted for under the fair value option and the presentation and disclosure requirements for financial instruments. Under the new guidance, all equity investments in unconsolidated entities (other than those accounted for using the equity method of accounting) will generally be measured at fair value through earnings. There will no longer be an available-for-sale classification for equity securities with readily determinable fair values. For financial liabilities when the fair value option has been elected, changes in fair value due to instrument-specific credit risk will be recognized separately in other comprehensive income. In addition, the FASB clarified guidance related to the valuation allowance assessment when recognizing deferred tax assets resulting from unrealized losses on available-for-sale debt securities. The new guidance is effective January 1, 2018, with the cumulative effect adjustment from initially applying the new guidance recognized in the Consolidated Statement of Financial Position as of the beginning of the year of adoption. We do not expect the adoption to have a material impact on our financial statements.
Lease accounting – In February 2016, the FASB issued accounting guidance that revises the accounting for leases. Under the new guidance, lessees are required to recognize a right-of-use asset and a lease liability for substantially all leases. The new guidance will continue to classify leases as either financing or operating, with classification affecting the pattern of expense recognition. The accounting applied by a lessor under the new guidance will be substantially equivalent to current lease accounting guidance. The new guidance iswas effective January 1, 2019 with early adoption permitted. The new standard is required to beand was applied withusing a modified retrospective approach through a cumulative effect adjustment to eachretained earnings as of January 1, 2019. The prior reporting period presentedcomparative information has not been recasted and continues to be reported under the accounting guidance in effect for those periods.
The new guidance provides for certaina number of optional practical expedients.expedients in transition. We are inelected the process"package of evaluating the effect ofpractical expedients," which allows us not to reassess under the new guidance our prior conclusions about lease identification, lease classification and initial direct costs. We did not elect the use-of-hindsight practical expedient. In addition, the new guidance provides practical expedients for an entity’s ongoing lessee accounting. We have elected not to separate lease and non-lease components for the majority of our asset classes. We have elected the short-term lease recognition exemption for all leases that qualify which means we will not recognize right-of-use assets or lease liabilities for these leases with a term of twelve months or less.
The most significant effects of adoption relate to the recognition of right-of-use assets and lease liabilities on our balance sheet for operating leases and providing new disclosures about our leasing activities. The adoption did not have a material impact on our results of operations.
In March 2019, the FASB issued Leases - Codification improvements (ASU 2019-01) which amended the new leasing guidance. Under these amendments, lessors that are not manufacturers or dealers will use their cost, less any discounts that may apply, as the fair value of the underlying asset, and lessors within the scope of Financial Services-Depository and Lending guidance will present all principal payments received under leases within investment activities on the statement of cash flows. We adopted the new guidance effective January 1, 2019, and the adoption did not have a material impact to our financial statements.
See Note 4 for additional information.
Reclassification of certain tax effects from accumulated other comprehensive income (ASU 2018-02) – In February 2018, the FASB issued accounting guidance to allow a reclassification from accumulated other comprehensive income (AOCI) to retained earnings for stranded tax effects resulting from U.S. tax reform legislation. We adopted the guidance effective January 1, 2019 and the resulting reclassification was included in the period of adoption. The reclassification resulted in decreased retained earnings and increased AOCI of $97 million.
The following ASUs were effective January 1, 2019 and did not have a material impact on our financial statements.statements:
|
| |
| ASU | Description |
| 2017-12 | Derivatives and hedging - Targeted improvements |
| |
| B. | Accounting Standards Issued But Not Yet Adopted |
Measurement of creditCredit losses on financial instruments(ASU 2016-13) – In June 2016, the FASB issued accounting guidance to introduce a new model for recognizing credit losses on financial instruments based on an estimate of current expected credit losses. The new guidance will apply to loans, accounts receivable, trade receivables, other financial assets measured at amortized cost, loan commitments and other off-balance sheet credit exposures. The new guidance will also apply to debt securities and other financial assets measured at fair value through other comprehensive income. The new guidance is effective January 1, 2020, with early adoption permitted beginning January 1, 2019. We are in the process of evaluatingAn implementation team continues to evaluate data requirements and methodologies and has started designing new processes and controls. The team is also modeling results to assess the effect of the new guidance on our financial statements. We plan to adopt the new guidance effective January 1, 2020.
Classification for certain cash receiptsWe consider the applicability and cash payments – In August 2016, the FASB issued accounting guidance relatedimpact of all ASUs. ASUs not listed above were assessed and either determined to the presentation and classification of certain transactions in the statement of cash flows where diversity in practice exists. The guidance is effective January 1, 2018 with early adoption permitted. We dobe not expect the adoptionapplicable or not expected to have a material impact on our financial statements.
Classification of restricted cash – In November 2016, the FASB issued accounting guidance related to the presentation and classification of changes in restricted cash on the statement of cash flows where diversity in practice exists. The new standard is required to be applied with a retrospective approach. The guidance is effective January 1, 2018 with early adoption permitted. We do not expect the adoption to have a material impact on our financial statements.
Derivatives and hedging – In August 2017, the FASB issued accounting guidance to better align hedge accounting with a company’s risk management activities, simplify the application of hedge accounting and improve the disclosures of hedging arrangements. The new guidance is required to be applied on a modified retrospective basis. The guidance is effective January 1, 2019, with early adoption permitted. We are in the process of evaluating the effect of the new guidance on our financial statements.
A summary of finance receivables included in the Consolidated Statements of Financial Position was as follows:
|
| | | | | | | | |
| (Millions of dollars) | | September 30,
2017 | | December 31,
2016 |
Finance leases and installment sale contracts – Retail (1) | | $ | 14,172 |
| | $ | 13,565 |
|
| Retail notes receivable | | 9,711 |
| | 10,195 |
|
| Wholesale notes receivable | | 3,753 |
| | 3,457 |
|
| Finance leases and installment sale contracts – Wholesale | | 118 |
| | 103 |
|
| | | 27,754 |
| | 27,320 |
|
| Less: Unearned income | | (814 | ) | | (765 | ) |
| Recorded investment in finance receivables | | 26,940 |
| | 26,555 |
|
| Less: Allowance for credit losses | | (343 | ) | | (343 | ) |
| Total finance receivables, net | | $ | 26,597 |
|
| $ | 26,212 |
|
| | | | | |
|
| | | | | | | | |
| (Millions of dollars) | | June 30,
2019 | | December 31,
2018 |
Retail loans, net(1) | | $ | 15,482 |
| | $ | 15,509 |
|
Retail leases, net(2) | | 7,683 |
| | 7,499 |
|
| Caterpillar purchased receivables, net | | 4,837 |
| | 4,691 |
|
Wholesale loans, net(1) | | 729 |
| | 626 |
|
| Wholesale leases, net | | 89 |
| | 109 |
|
| Recorded investment in finance receivables | | 28,820 |
| | 28,434 |
|
| Less: Allowance for credit losses | | (523 | ) | | (511 | ) |
Total finance receivables, net(3) | | $ | 28,297 |
|
| $ | 27,923 |
|
| | | | | |
(1)Includes $0failed sale leasebacks.
(2) Includes $9 million of finance leases with Caterpillar as of June 30, 2019 and $4December 31, 2018.
(3)Includes $65 million and $0 million of finance receivables classified as held for sale as of SeptemberJune 30, 20172019 and December 31, 2016,2018, respectively.
Allowance for Credit Losses
The allowance for credit losses is an estimate of the losses inherent in our finance receivable portfolio and includes consideration of accounts that have been individually identified as impaired, as well as pools of finance receivables where it is probable that certain receivables in the pool are impaired but the individual accounts cannot yet be identified. In identifying and measuring impairment, management takes into consideration past loss experience, known and inherent risks in the portfolio, adverse situations that may affect the borrower’s ability to repay, estimated value of underlying collateral and current economic conditions.
Accounts are identified for individual review based on past-due status and information available about the customer, such as financial statements, news reports and published credit ratings, as well as general information regarding industry trends and the economic environment in which our customers operate. The allowance for credit losses attributable to finance receivables that are individually evaluated and determined to be impaired is based either on the present value of expected future cash flows discounted at the receivables' effective interest rate, the fair value of the collateral for collateral-dependent receivables or the observable market price of the receivable. In determining collateral value, we estimate the current fair market value of the collateral less selling costs. We also consider credit enhancements such as additional collateral and contractual third-party guarantees. The allowance for credit losses attributable to the remaining accounts not yet individually identified as impaired is estimated based on loss forecast models utilizing probabilities of default, our estimate of the loss emergence period and the estimated loss given default. In addition, qualitative factors not able to be fully captured in our loss forecast models including industry trends, macroeconomic factors and model imprecision are considered in the evaluation of the adequacy of the allowance for credit losses. These qualitative factors are subjective and require a degree of management judgment.
Our allowance for credit losses is segregated into three portfolio segments:
Customer - Finance receivables with retailend-user customers.
Dealer - Finance receivables with Caterpillar dealers.
Caterpillar Purchased Receivables - Trade receivables purchased from Caterpillar entities.
A portfolio segment is the level at which the Company develops a systematic methodology for determining its allowance for credit losses.
We further evaluate our portfolio segments by the class of finance receivables, which is defined as a level of information (below a portfolio segment) in which the finance receivables have the same initial measurement attribute and a similar method for assessing and monitoring credit risk. Typically, our finance receivables within a geographic area have similar credit risk profiles and methods for assessing and monitoring credit risk. Our classes, which align with management reporting for credit losses, are as follows:
North America - Includes financeFinance receivables originated in the United States and Canada.
EuropeEAME - Includes financeFinance receivables originated in Europe, Africa, the Middle East and the Commonwealth of Independent States.
Asia/Pacific - Includes financeFinance receivables originated in Australia, New Zealand, China, Japan, Southeast Asia and Southeast Asia.India.
Mining - Includes financeFinance receivables related to large mining customers worldwide and project financing in various countries.
Latin America - Includes financeFinance receivables originated in Mexico and Central and South American countries.
Caterpillar Power Finance - Includes financeFinance receivables originated worldwide related to marine vessels with Caterpillar engines worldwide and Caterpillar electrical power generation, gas compression and co-generation systems and non-Caterpillar equipment that is powered by these systems worldwide.systems.
Our allowance for credit losses as of SeptemberJune 30, 20172019 was $343$523 million or 1.271.81 percent of our recorded investment in finance receivables compared with $343$511 million or 1.291.80 percent as of December 31, 2016.2018. An analysis of the allowance for credit losses was as follows:
| | | (Millions of dollars) | | | | | | | | | | | | | | |
| | September 30, 2017 | June 30, 2019 |
| Allowance for Credit Losses: | Customer | | Dealer | | Caterpillar Purchased Receivables | | Total | Customer | | Dealer | | Caterpillar Purchased Receivables | | Total |
| Balance at beginning of year | $ | 331 |
| | $ | 10 |
| | $ | 2 |
| | $ | 343 |
| $ | 486 |
| | $ | 21 |
| | $ | 4 |
| | $ | 511 |
|
| Receivables written off | (119 | ) | | — |
| | — |
| | (119 | ) | (125 | ) | | — |
| | — |
| | (125 | ) |
| Recoveries on receivables previously written off | 31 |
| | — |
| | — |
| | 31 |
| 21 |
| | — |
| | — |
| | 21 |
|
| Provision for credit losses | 80 |
| | — |
| | — |
| | 80 |
| 99 |
| | 24 |
| | 1 |
| | 124 |
|
| Adjustment due to sale of receivables | (1 | ) | | — |
| | — |
| | (1 | ) | (9 | ) | | — |
| | — |
| | (9 | ) |
| Foreign currency translation adjustment | 9 |
| | — |
| | — |
| | 9 |
| 1 |
| | — |
| | — |
| | 1 |
|
| Balance at end of period | $ | 331 |
| | $ | 10 |
| | $ | 2 |
| | $ | 343 |
| $ | 473 |
| | $ | 45 |
| | $ | 5 |
| | $ | 523 |
|
| | | | | | | | | | | | | | | |
| Individually evaluated for impairment | $ | 100 |
| | $ | — |
| | $ | — |
| | $ | 100 |
| $ | 266 |
| | $ | 39 |
| | $ | — |
| | $ | 305 |
|
| Collectively evaluated for impairment | 231 |
| | 10 |
| | 2 |
| | 243 |
| 207 |
| | 6 |
| | 5 |
| | 218 |
|
| Ending Balance | $ | 331 |
| | $ | 10 |
| | $ | 2 |
| | $ | 343 |
| $ | 473 |
| | $ | 45 |
| | $ | 5 |
| | $ | 523 |
|
| | | | | | | | | | | | | | | |
| Recorded Investment in Finance Receivables: | |
| | |
| | |
| | |
| |
| | |
| | |
| | |
|
| Individually evaluated for impairment | $ | 869 |
| | $ | — |
| | $ | — |
| | $ | 869 |
| $ | 789 |
| | $ | 78 |
| | $ | — |
| | $ | 867 |
|
| Collectively evaluated for impairment | 18,704 |
| | 4,544 |
| | 2,823 |
| | 26,071 |
| 18,758 |
| | 4,358 |
| | 4,837 |
| | 27,953 |
|
| Ending Balance | $ | 19,573 |
| | $ | 4,544 |
| | $ | 2,823 |
| | $ | 26,940 |
| $ | 19,547 |
| | $ | 4,436 |
| | $ | 4,837 |
| | $ | 28,820 |
|
| | | | | | | | | | | | | | | |
| | | (Millions of dollars) | | | | | | | | | | | | | | |
| | December 31, 2016 | December 31, 2018 |
| Allowance for Credit Losses: | Customer | | Dealer | | Caterpillar Purchased Receivables | | Total | Customer | | Dealer | | Caterpillar Purchased Receivables | | Total |
| Balance at beginning of year | $ | 327 |
| | $ | 9 |
| | $ | 2 |
| | $ | 338 |
| $ | 353 |
| | $ | 9 |
| | $ | 3 |
| | $ | 365 |
|
| Receivables written off | (158 | ) | | — |
| | — |
| | (158 | ) | (235 | ) | | — |
| | — |
| | (235 | ) |
| Recoveries on receivables previously written off | 35 |
| | — |
| | — |
| | 35 |
| 46 |
| | — |
| | — |
| | 46 |
|
| Provision for credit losses | 132 |
| | 1 |
| | — |
| | 133 |
| 337 |
| | 12 |
| | 1 |
| | 350 |
|
| Adjustment due to sale of receivables | (8 | ) | | — |
| | — |
| | (8 | ) | (7 | ) | | — |
| | — |
| | (7 | ) |
| Foreign currency translation adjustment | 3 |
| | — |
| | — |
| | 3 |
| (8 | ) | | — |
| | — |
| | (8 | ) |
| Balance at end of year | $ | 331 |
| | $ | 10 |
| | $ | 2 |
| | $ | 343 |
| $ | 486 |
| | $ | 21 |
| | $ | 4 |
| | $ | 511 |
|
| | | | | | | | | | | | | | | |
| Individually evaluated for impairment | $ | 85 |
| | $ | — |
| | $ | — |
| | $ | 85 |
| $ | 288 |
| | $ | 14 |
| | $ | — |
| | $ | 302 |
|
| Collectively evaluated for impairment | 246 |
| | 10 |
| | 2 |
| | 258 |
| 198 |
| | 7 |
| | 4 |
| | 209 |
|
| Ending Balance | $ | 331 |
| | $ | 10 |
| | $ | 2 |
| | $ | 343 |
| $ | 486 |
| | $ | 21 |
| | $ | 4 |
| | $ | 511 |
|
| | | | | | | | | | | | | | | |
| Recorded Investment in Finance Receivables: | |
| | |
| | |
| | |
| |
| | |
| | |
| | |
|
| Individually evaluated for impairment | $ | 786 |
| | $ | — |
| | $ | — |
| | $ | 786 |
| $ | 859 |
| | $ | 78 |
| | $ | — |
| | $ | 937 |
|
| Collectively evaluated for impairment | 18,859 |
| | 4,479 |
| | 2,431 |
| | 25,769 |
| 18,724 |
| | 4,082 |
| | 4,691 |
| | 27,497 |
|
| Ending Balance | $ | 19,645 |
| | $ | 4,479 |
| | $ | 2,431 |
| | $ | 26,555 |
| $ | 19,583 |
| | $ | 4,160 |
| | $ | 4,691 |
| | $ | 28,434 |
|
| | | | | | | | | | | | | | | |
Credit quality of finance receivables
At origination, we evaluate credit risk based on a variety of credit quality factors including prior payment experience, customer financial information, credit-rating agency ratings, loan-to-value ratios and other internal metrics. On an ongoing basis, we monitor credit quality based on past-due status and collection experience as there is a meaningful correlation between the past-due status of customers and the risk of loss.
In determining past-due status, we consider the entire recorded investment in finance receivablereceivables past due when any installment is over 30 days past due. The tables below summarize our recorded investment in finance receivables by aging category.
| | | (Millions of dollars) | | | | | | | | | | | | | | | | | | | | | | | | | | |
| | September 30, 2017 | June 30, 2019 |
| | 31-60 Days Past Due | | 61-90 Days Past Due | | 91+ Days Past Due | | Total Past Due | | Current | | Recorded Investment in Finance Receivables | | 91+ Still Accruing | 31-60 Days Past Due | | 61-90 Days Past Due | | 91+ Days Past Due | | Total Past Due | | Current | | Recorded Investment in Finance Receivables | | 91+ Still Accruing |
| Customer | |
| | |
| | |
| | | | | | | | | |
| | |
| | |
| | | | | | | | |
| North America | $ | 64 |
| | $ | 17 |
| | $ | 49 |
| | $ | 130 |
| | $ | 7,916 |
| | $ | 8,046 |
| | $ | 8 |
| $ | 90 |
| | $ | 17 |
| | $ | 44 |
| | $ | 151 |
| | $ | 7,899 |
| | $ | 8,050 |
| | $ | 12 |
|
| Europe | 27 |
| | 9 |
| | 56 |
| | 92 |
| | 2,642 |
| | 2,734 |
| | 4 |
| |
| EAME | | 29 |
| | 13 |
| | 167 |
| | 209 |
| | 2,885 |
| | 3,094 |
| | 7 |
|
| Asia/Pacific | 27 |
| | 13 |
| | 17 |
| | 57 |
| | 2,299 |
| | 2,356 |
| | 9 |
| 38 |
| | 15 |
| | 25 |
| | 78 |
| | 3,033 |
| | 3,111 |
| | 12 |
|
| Mining | 8 |
| | 4 |
| | 52 |
| | 64 |
| | 1,682 |
| | 1,746 |
| | 1 |
| 3 |
| | 13 |
| | 19 |
| | 35 |
| | 1,814 |
| | 1,849 |
| | — |
|
| Latin America | 53 |
| | 28 |
| | 180 |
| | 261 |
| | 1,672 |
| | 1,933 |
| | — |
| 44 |
| | 17 |
| | 85 |
| | 146 |
| | 1,398 |
| | 1,544 |
| | — |
|
| Caterpillar Power Finance | 11 |
| | 34 |
| | 124 |
| | 169 |
| | 2,589 |
| | 2,758 |
| | 11 |
| 7 |
| | 13 |
| | 296 |
| | 316 |
| | 1,583 |
| | 1,899 |
| | — |
|
| Dealer | |
| | |
| | |
| | | | | | | | | |
| | |
| | |
| | | | | | | | |
| North America | — |
| | — |
| | — |
| | — |
| | 2,816 |
| | 2,816 |
| | — |
| — |
| | — |
| | — |
| | — |
| | 2,524 |
| | 2,524 |
| | — |
|
| Europe | — |
| | — |
| | — |
| | — |
| | 350 |
| | 350 |
| | — |
| |
| EAME | | — |
| | — |
| | — |
| | — |
| | 603 |
| | 603 |
| | — |
|
| Asia/Pacific | — |
| | — |
| | — |
| | — |
| | 580 |
| | 580 |
| | — |
| — |
| | — |
| | — |
| | — |
| | 515 |
| | 515 |
| | — |
|
| Mining | — |
| | — |
| | — |
| | — |
| | 5 |
| | 5 |
| | — |
| — |
| | — |
| | — |
| | — |
| | 4 |
| | 4 |
| | — |
|
| Latin America | 5 |
| | — |
| | 3 |
| | 8 |
| | 783 |
| | 791 |
| | — |
| 1 |
| | 1 |
| | 79 |
| | 81 |
| | 706 |
| | 787 |
| | 1 |
|
| Caterpillar Power Finance | — |
| | — |
| | — |
| | — |
| | 2 |
| | 2 |
| | — |
| — |
| | — |
| | — |
| | — |
| | 3 |
| | 3 |
| | — |
|
Caterpillar Purchased Receivables | |
| | |
| | |
| | | | | | | | | |
| | |
| | |
| | | | | | | | |
| North America | 13 |
| | 5 |
| | 3 |
| | 21 |
| | 1,666 |
| | 1,687 |
| | 3 |
| 14 |
| | 9 |
| | 17 |
| | 40 |
| | 3,220 |
| | 3,260 |
| | |
| Europe | 2 |
| | — |
| | — |
| | 2 |
| | 333 |
| | 335 |
| | — |
| |
| EAME | | 1 |
| | — |
| | 2 |
| | 3 |
| | 510 |
| | 513 |
| | |
| Asia/Pacific | 1 |
| | — |
| | — |
| | 1 |
| | 396 |
| | 397 |
| | — |
| — |
| | 2 |
| | 3 |
| | 5 |
| | 587 |
| | 592 |
| | |
| Mining | — |
| | — |
| | — |
| | — |
| | — |
| | — |
| | — |
| — |
| | — |
| | — |
| | — |
| | — |
| | — |
| | |
| Latin America | — |
| | — |
| | — |
| | — |
| | 400 |
| | 400 |
| | — |
| — |
| | — |
| | — |
| | — |
| | 465 |
| | 465 |
| | |
| Caterpillar Power Finance | — |
| | — |
| | — |
| | — |
| | 4 |
| | 4 |
| | — |
| — |
| | — |
| | — |
| | — |
| | 7 |
| | 7 |
| | |
| Total | $ | 211 |
| | $ | 110 |
| | $ | 484 |
| | $ | 805 |
| | $ | 26,135 |
| | $ | 26,940 |
| | $ | 36 |
| $ | 227 |
| | $ | 100 |
| | $ | 737 |
| | $ | 1,064 |
| | $ | 27,756 |
| | $ | 28,820 |
| | $ | 32 |
|
| | | | | | | | | | | | | | | | | | | | | | | | | | | |
(1) Caterpillar Purchased Receivables are non-interest bearing trade receivables purchased at a discount.
| | | (Millions of dollars) | | | | | | | | | | | | | | | | | | | | | | | | | | |
| | December 31, 2016 | December 31, 2018 |
| | 31-60 Days Past Due | | 61-90 Days Past Due | | 91+ Days Past Due | | Total Past Due | | Current | | Recorded Investment in Finance Receivables | | 91+ Still Accruing | 31-60 Days Past Due | | 61-90 Days Past Due | | 91+ Days Past Due | | Total Past Due | | Current | | Recorded Investment in Finance Receivables | | 91+ Still Accruing |
| Customer | |
| | |
| | |
| | | | | | | | | |
| | |
| | |
| | | | | | | | |
| North America | $ | 50 |
| | $ | 16 |
| | $ | 59 |
| | $ | 125 |
| | $ | 8,051 |
| | $ | 8,176 |
| | $ | 5 |
| $ | 65 |
| | $ | 18 |
| | $ | 84 |
| | $ | 167 |
| | $ | 7,883 |
| | $ | 8,050 |
| | $ | 14 |
|
| Europe | 16 |
| | 12 |
| | 39 |
| | 67 |
| | 2,388 |
| | 2,455 |
| | 6 |
| |
| EAME | | 19 |
| | 9 |
| | 153 |
| | 181 |
| | 2,850 |
| | 3,031 |
| | 5 |
|
| Asia/Pacific | 18 |
| | 7 |
| | 15 |
| | 40 |
| | 1,944 |
| | 1,984 |
| | 4 |
| 25 |
| | 9 |
| | 8 |
| | 42 |
| | 2,923 |
| | 2,965 |
| | 5 |
|
| Mining | 3 |
| | 2 |
| | 63 |
| | 68 |
| | 1,756 |
| | 1,824 |
| | 2 |
| 28 |
| | 1 |
| | 9 |
| | 38 |
| | 1,642 |
| | 1,680 |
| | — |
|
| Latin America | 40 |
| | 33 |
| | 214 |
| | 287 |
| | 1,808 |
| | 2,095 |
| | — |
| 38 |
| | 29 |
| | 71 |
| | 138 |
| | 1,421 |
| | 1,559 |
| | — |
|
| Caterpillar Power Finance | 11 |
| | 9 |
| | 73 |
| | 93 |
| | 3,018 |
| | 3,111 |
| | 1 |
| 10 |
| | 1 |
| | 384 |
| | 395 |
| | 1,903 |
| | 2,298 |
| | — |
|
| Dealer | |
| | |
| | |
| | | | | | | | | |
| | |
| | |
| | | | | | | | |
| North America | — |
| | — |
| | — |
| | — |
| | 2,705 |
| | 2,705 |
| | — |
| — |
| | — |
| | — |
| | — |
| | 2,210 |
| | 2,210 |
| | — |
|
| Europe | — |
| | — |
| | — |
| | — |
| | 336 |
| | 336 |
| | — |
| |
| EAME | | — |
| | — |
| | — |
| | — |
| | 619 |
| | 619 |
| | — |
|
| Asia/Pacific | — |
| | — |
| | — |
| | — |
| | 582 |
| | 582 |
| | — |
| — |
| | — |
| | — |
| | — |
| | 514 |
| | 514 |
| | — |
|
| Mining | — |
| | — |
| | — |
| | — |
| | 6 |
| | 6 |
| | — |
| — |
| | — |
| | — |
| | — |
| | 4 |
| | 4 |
| | — |
|
| Latin America | — |
| | — |
| | — |
| | — |
| | 848 |
| | 848 |
| | — |
| — |
| | — |
| | 78 |
| | 78 |
| | 731 |
| | 809 |
| | — |
|
| Caterpillar Power Finance | — |
| | — |
| | — |
| | — |
| | 2 |
| | 2 |
| | — |
| — |
| | — |
| | — |
| | — |
| | 4 |
| | 4 |
| | — |
|
Caterpillar Purchased Receivables | |
| | |
| | |
| | | | | | | | | |
| | |
| | |
| | | | | | | | |
| North America | 11 |
| | 3 |
| | 1 |
| | 15 |
| | 1,303 |
| | 1,318 |
| | 1 |
| 22 |
| | 12 |
| | 18 |
| | 52 |
| | 2,982 |
| | 3,034 |
| | |
| Europe | — |
| | — |
| | 1 |
| | 1 |
| | 268 |
| | 269 |
| | — |
| |
| EAME | | 1 |
| | — |
| | 1 |
| | 2 |
| | 546 |
| | 548 |
| | |
| Asia/Pacific | — |
| | — |
| | — |
| | — |
| | 475 |
| | 475 |
| | — |
| 5 |
| | 1 |
| | 1 |
| | 7 |
| | 756 |
| | 763 |
| | |
| Mining | — |
| | — |
| | — |
| | — |
| | — |
| | — |
| | — |
| — |
| | — |
| | — |
| | — |
| | — |
| | — |
| | |
| Latin America | — |
| | — |
| | — |
| | — |
| | 366 |
| | 366 |
| | — |
| — |
| | — |
| | — |
| | — |
| | 338 |
| | 338 |
| | |
| Caterpillar Power Finance | — |
| | — |
| | — |
| | — |
| | 3 |
| | 3 |
| | — |
| — |
| | — |
| | — |
| | — |
| | 8 |
| | 8 |
| | |
| Total | $ | 149 |
| | $ | 82 |
| | $ | 465 |
| | $ | 696 |
| | $ | 25,859 |
| | $ | 26,555 |
| | $ | 19 |
| $ | 213 |
| | $ | 80 |
| | $ | 807 |
| | $ | 1,100 |
| | $ | 27,334 |
| | $ | 28,434 |
| | $ | 24 |
|
| | | | | | | | | | | | | | | | | | | | | | | | | | | |
(1) Caterpillar Purchased Receivables are non-interest bearing trade receivables purchased at a discount.
Impaired finance receivables
For all classes, a finance receivable is considered impaired, based on current information and events, if it is probable that we will be unable to collect all amounts due according to the contractual terms. Impaired finance receivables include finance receivables that have been restructured and are considered to be Troubled Debt Restructures.troubled debt restructures.
There were $78 million in impaired finance receivables with a related allowance of $39 million and $14 million as of June 30, 2019 and December 31, 2018, respectively, for the Dealer portfolio segment, all of which was in Latin America. There were no impaired finance receivables as of SeptemberJune 30, 20172019 and December 31, 2016,2018, for the Dealer and Caterpillar Purchased Receivables portfolio segments.segment. Our recorded investment in impaired finance receivables and the related unpaid principal balances and allowance for the Customer portfolio segment were as follows:
| | | (Millions of dollars) | | | | | | | | | | | | | | | | | | | | | | |
| | As of September 30, 2017 | | As of December 31, 2016 | As of June 30, 2019 | | As of December 31, 2018 |
Impaired Finance Receivables With No Allowance Recorded | Recorded Investment | | Unpaid Principal Balance | | Related Allowance | | Recorded Investment | | Unpaid Principal Balance | | Related Allowance | Recorded Investment | | Unpaid Principal Balance | | Related Allowance | | Recorded Investment | | Unpaid Principal Balance | | Related Allowance |
| North America | $ | 16 |
| | $ | 21 |
| | $ | — |
| | $ | 10 |
| | $ | 10 |
| | $ | — |
| $ | 11 |
| | $ | 11 |
| | $ | — |
| | $ | 10 |
| | $ | 10 |
| | $ | — |
|
| Europe | 47 |
| | 47 |
| | — |
| | 49 |
| | 48 |
| | — |
| |
| EAME | | 1 |
| | 1 |
| | — |
| | 1 |
| | 1 |
| | — |
|
| Asia/Pacific | 32 |
| | 31 |
| | — |
| | 3 |
| | 2 |
| | — |
| — |
| | — |
| | — |
| | 1 |
| | 1 |
| | — |
|
| Mining | 127 |
| | 125 |
| | — |
| | 129 |
| | 129 |
| | — |
| 26 |
| | 26 |
| | — |
| | 33 |
| | 33 |
| | — |
|
| Latin America | 60 |
| | 60 |
| | — |
| | 68 |
| | 68 |
| | — |
| 21 |
| | 21 |
| | — |
| | 29 |
| | 29 |
| | — |
|
| Caterpillar Power Finance | 187 |
| | 200 |
| | — |
| | 271 |
| | 271 |
| | — |
| 52 |
| | 52 |
| | — |
| | 69 |
| | 83 |
| | — |
|
| Total | $ | 469 |
| | $ | 484 |
| | $ | — |
| | $ | 530 |
| | $ | 528 |
| | $ | — |
| $ | 111 |
| | $ | 111 |
| | $ | — |
| | $ | 143 |
| | $ | 157 |
| | $ | — |
|
Impaired Finance Receivables With An Allowance Recorded | |
| | |
| | |
| | |
| | |
| | |
| |
| | |
| | |
| | |
| | |
| | |
|
| North America | $ | 36 |
| | $ | 35 |
| | $ | 13 |
| | $ | 61 |
| | $ | 60 |
| | $ | 22 |
| $ | 28 |
| | $ | 28 |
| | $ | 10 |
| | $ | 40 |
| | $ | 41 |
| | $ | 14 |
|
| Europe | 8 |
| | 8 |
| | 5 |
| | 7 |
| | 7 |
| | 3 |
| |
| EAME | | 101 |
| | 101 |
| | 56 |
| | 92 |
| | 92 |
| | 57 |
|
| Asia/Pacific | 25 |
| | 25 |
| | 3 |
| | 50 |
| | 50 |
| | 8 |
| 10 |
| | 10 |
| | 3 |
| | 4 |
| | 4 |
| | 2 |
|
| Mining | — |
| | — |
| | — |
| | — |
| | — |
| | — |
| 63 |
| | 62 |
| | 20 |
| | 56 |
| | 55 |
| | 26 |
|
| Latin America | 92 |
| | 104 |
| | 35 |
| | 93 |
| | 104 |
| | 34 |
| 70 |
| | 69 |
| | 26 |
| | 75 |
| | 75 |
| | 25 |
|
| Caterpillar Power Finance | 239 |
| | 241 |
| | 44 |
| | 45 |
| | 44 |
| | 18 |
| 406 |
| | 420 |
| | 151 |
| | 449 |
| | 455 |
| | 164 |
|
| Total | $ | 400 |
| | $ | 413 |
| | $ | 100 |
| | $ | 256 |
| | $ | 265 |
| | $ | 85 |
| $ | 678 |
| | $ | 690 |
| | $ | 266 |
| | $ | 716 |
| | $ | 722 |
| | $ | 288 |
|
| Total Impaired Finance Receivables | |
| | |
| | |
| | |
| | |
| | |
| |
| | |
| | |
| | |
| | |
| | |
|
| North America | $ | 52 |
| | $ | 56 |
| | $ | 13 |
| | $ | 71 |
| | $ | 70 |
| | $ | 22 |
| $ | 39 |
| | $ | 39 |
| | $ | 10 |
| | $ | 50 |
| | $ | 51 |
| | $ | 14 |
|
| Europe | 55 |
| | 55 |
| | 5 |
| | 56 |
| | 55 |
| | 3 |
| |
| EAME | | 102 |
| | 102 |
| | 56 |
| | 93 |
| | 93 |
| | 57 |
|
| Asia/Pacific | 57 |
| | 56 |
| | 3 |
| | 53 |
| | 52 |
| | 8 |
| 10 |
| | 10 |
| | 3 |
| | 5 |
| | 5 |
| | 2 |
|
| Mining | 127 |
| | 125 |
| | — |
| | 129 |
| | 129 |
| | — |
| 89 |
| | 88 |
| | 20 |
| | 89 |
| | 88 |
| | 26 |
|
| Latin America | 152 |
| | 164 |
| | 35 |
| | 161 |
| | 172 |
| | 34 |
| 91 |
| | 90 |
| | 26 |
| | 104 |
| | 104 |
| | 25 |
|
| Caterpillar Power Finance | 426 |
| | 441 |
| | 44 |
| | 316 |
| | 315 |
| | 18 |
| 458 |
| | 472 |
| | 151 |
| | 518 |
| | 538 |
| | 164 |
|
| Total | $ | 869 |
| | $ | 897 |
| | $ | 100 |
| | $ | 786 |
| | $ | 793 |
| | $ | 85 |
| $ | 789 |
| | $ | 801 |
| | $ | 266 |
| | $ | 859 |
| | $ | 879 |
| | $ | 288 |
|
| | | | | | | | | | | | | | | | | | | | | | | |
| | | (Millions of dollars) | | | | | | | | | | | | | | |
| | Three Months Ended
September 30, 2017 | | Three Months Ended
September 30, 2016 | Three Months Ended
June 30, 2019 | | Three Months Ended
June 30, 2018 |
Impaired Finance Receivables With No Allowance Recorded | Average Recorded Investment | | Interest Income Recognized | | Average Recorded Investment | | Interest Income Recognized | Average Recorded Investment | | Interest Income Recognized | | Average Recorded Investment | | Interest Income Recognized |
| North America | $ | 14 |
| | $ | 1 |
| | $ | 24 |
| | $ | — |
| $ | 10 |
| | $ | — |
| | $ | 18 |
| | $ | 1 |
|
| Europe | 47 |
| | — |
| | 49 |
| | 1 |
| |
| EAME | | 1 |
| | — |
| | 7 |
| | — |
|
| Asia/Pacific | 30 |
| | 1 |
| | 1 |
| | — |
| — |
| | — |
| | 29 |
| | — |
|
| Mining | 128 |
| | 1 |
| | 90 |
| | 2 |
| 29 |
| | 1 |
| | 45 |
| | 1 |
|
| Latin America | 68 |
| | 1 |
| | 58 |
| | — |
| 20 |
| | 1 |
| | 43 |
| | — |
|
| Caterpillar Power Finance | 171 |
| | 1 |
| | 282 |
| | 3 |
| 41 |
| | — |
| | 189 |
| | 1 |
|
| Total | $ | 458 |
| | $ | 5 |
| | $ | 504 |
| | $ | 6 |
| $ | 101 |
| | $ | 2 |
| | $ | 331 |
| | $ | 3 |
|
Impaired Finance Receivables With An Allowance Recorded | |
| | |
| | |
| | |
| |
| | |
| | |
| | |
|
| North America | $ | 44 |
| | $ | — |
| | $ | 42 |
| | $ | — |
| $ | 35 |
| | $ | — |
| | $ | 56 |
| | $ | — |
|
| Europe | 6 |
| | — |
| | 10 |
| | — |
| |
| EAME | | 94 |
| | — |
| | 48 |
| | 1 |
|
| Asia/Pacific | 28 |
| | 1 |
| | 35 |
| | — |
| 9 |
| | — |
| | 5 |
| | — |
|
| Mining | — |
| | — |
| | 19 |
| | — |
| 39 |
| | — |
| | 64 |
| | 1 |
|
| Latin America | 102 |
| | 1 |
| | 67 |
| | 1 |
| 74 |
| | 2 |
| | 65 |
| | 1 |
|
| Caterpillar Power Finance | 251 |
| | 3 |
| | 43 |
| | — |
| 443 |
| | 4 |
| | 356 |
| | 3 |
|
| Total | $ | 431 |
| | $ | 5 |
| | $ | 216 |
| | $ | 1 |
| $ | 694 |
| | $ | 6 |
| | $ | 594 |
| | $ | 6 |
|
| Total Impaired Finance Receivables | |
| | |
| | |
| | |
| |
| | |
| | |
| | |
|
| North America | $ | 58 |
| | $ | 1 |
| | $ | 66 |
| | $ | — |
| $ | 45 |
| | $ | — |
| | $ | 74 |
| | $ | 1 |
|
| Europe | 53 |
| | — |
| | 59 |
| | 1 |
| |
| EAME | | 95 |
| | — |
| | 55 |
| | 1 |
|
| Asia/Pacific | 58 |
| | 2 |
| | 36 |
| | — |
| 9 |
| | — |
| | 34 |
| | — |
|
| Mining | 128 |
| | 1 |
| | 109 |
| | 2 |
| 68 |
| | 1 |
| | 109 |
| | 2 |
|
| Latin America | 170 |
| | 2 |
| | 125 |
| | 1 |
| 94 |
| | 3 |
| | 108 |
| | 1 |
|
| Caterpillar Power Finance | 422 |
| | 4 |
| | 325 |
| | 3 |
| 484 |
| | 4 |
| | 545 |
| | 4 |
|
| Total | $ | 889 |
| | $ | 10 |
| | $ | 720 |
| | $ | 7 |
| $ | 795 |
| | $ | 8 |
| | $ | 925 |
| | $ | 9 |
|
| | | | | | | | | | | | | | | |
| | | (Millions of dollars) | | | | | | | | | | | | | | |
| | Nine Months Ended
September 30, 2017 | | Nine Months Ended
September 30, 2016 | Six Months Ended
June 30, 2019 | | Six Months Ended
June 30, 2018 |
Impaired Finance Receivables With No Allowance Recorded | Average Recorded Investment | | Interest Income Recognized | | Average Recorded Investment | | Interest Income Recognized | Average Recorded Investment | | Interest Income Recognized | | Average Recorded Investment | | Interest Income Recognized |
| North America | $ | 12 |
| | $ | 1 |
| | $ | 19 |
| | $ | 1 |
| $ | 10 |
| | $ | — |
| | $ | 18 |
| | $ | 1 |
|
| Europe | 48 |
| | 1 |
| | 45 |
| | 1 |
| |
| EAME | | 1 |
| | — |
| | 23 |
| | — |
|
| Asia/Pacific | 22 |
| | 2 |
| | 2 |
| | — |
| — |
| | — |
| | 31 |
| | 1 |
|
| Mining | 128 |
| | 5 |
| | 84 |
| | 3 |
| 30 |
| | 1 |
| | 78 |
| | 2 |
|
| Latin America | 69 |
| | 2 |
| | 39 |
| | — |
| 23 |
| | 1 |
| | 44 |
| | 1 |
|
| Caterpillar Power Finance | 233 |
| | 7 |
| | 269 |
| | 8 |
| 51 |
| | 1 |
| | 178 |
| | 3 |
|
| Total | $ | 512 |
| | $ | 18 |
| | $ | 458 |
| | $ | 13 |
| $ | 115 |
| | $ | 3 |
| | $ | 372 |
| | $ | 8 |
|
Impaired Finance Receivables With An Allowance Recorded | |
| | |
| | |
| | |
| |
| | |
| | |
| | |
|
| North America | $ | 52 |
| | $ | 1 |
| | $ | 28 |
| | $ | — |
| $ | 37 |
| | $ | 1 |
| | $ | 53 |
| | $ | 1 |
|
| Europe | 6 |
| | — |
| | 11 |
| | — |
| |
| EAME | | 94 |
| | 1 |
| | 32 |
| | 1 |
|
| Asia/Pacific | 35 |
| | 2 |
| | 34 |
| | 2 |
| 8 |
| | — |
| | 6 |
| | — |
|
| Mining | — |
| | — |
| | 15 |
| | — |
| 42 |
| | 1 |
| | 36 |
| | 1 |
|
| Latin America | 101 |
| | 3 |
| | 59 |
| | 2 |
| 75 |
| | 3 |
| | 76 |
| | 2 |
|
| Caterpillar Power Finance | 141 |
| | 4 |
| | 50 |
| | 1 |
| 446 |
| | 7 |
| | 355 |
| | 4 |
|
| Total | $ | 335 |
| | $ | 10 |
| | $ | 197 |
| | $ | 5 |
| $ | 702 |
| | $ | 13 |
| | $ | 558 |
| | $ | 9 |
|
| Total Impaired Finance Receivables | |
| | |
| | |
| | |
| |
| | |
| | |
| | |
|
| North America | $ | 64 |
| | $ | 2 |
| | $ | 47 |
| | $ | 1 |
| $ | 47 |
| | $ | 1 |
| | $ | 71 |
| | $ | 2 |
|
| Europe | 54 |
| | 1 |
| | 56 |
| | 1 |
| |
| EAME | | 95 |
| | 1 |
| | 55 |
| | 1 |
|
| Asia/Pacific | 57 |
| | 4 |
| | 36 |
| | 2 |
| 8 |
| | — |
| | 37 |
| | 1 |
|
| Mining | 128 |
| | 5 |
| | 99 |
| | 3 |
| 72 |
| | 2 |
| | 114 |
| | 3 |
|
| Latin America | 170 |
| | 5 |
| | 98 |
| | 2 |
| 98 |
| | 4 |
| | 120 |
| | 3 |
|
| Caterpillar Power Finance | 374 |
| | 11 |
| | 319 |
| | 9 |
| 497 |
| | 8 |
| | 533 |
| | 7 |
|
| Total | $ | 847 |
| | $ | 28 |
| | $ | 655 |
| | $ | 18 |
| $ | 817 |
| | $ | 16 |
| | $ | 930 |
| | $ | 17 |
|
| | | | | | | | | | | | | | | |
Recognition of income is suspended and the finance receivable is placed on non-accrual status when management determines that collection of future income is not probable (generally after 120 days past due). Recognition is resumed and previously suspended income is recognized when the finance receivable becomes current and collection of remaining amounts is considered probable. Payments received while the finance receivable is on non-accrual status are applied to interest and principal in accordance with the contractual terms.
As of SeptemberJune 30, 20172019 and December 31, 2016,2018, there were $78 million in finance receivables on non-accrual status for the Dealer portfolio segment, of $3 million and $-, respectively, all of which werewas in the Latin America finance receivable class. As of September 30, 2017 and December 31, 2016, there were finance receivables on non-accrual status for the Caterpillar Purchased Receivables portfolio segment of $- and $1 million, respectively, all of which were in the Europe finance receivable class.America. The recorded investment in Customer finance receivables on non-accrual status was as follows:
| | | (Millions of dollars) | September 30,
2017 | | December 31,
2016 | June 30,
2019 | | December 31,
2018 |
| North America | $ | 48 |
| | $ | 66 |
| $ | 37 |
| | $ | 77 |
|
| Europe | 56 |
| | 35 |
| |
| EAME | | 165 |
| | 154 |
|
| Asia/Pacific | 11 |
| | 12 |
| 13 |
| | 4 |
|
| Mining | 55 |
| | 69 |
| 20 |
| | 50 |
|
| Latin America | 242 |
| | 307 |
| 98 |
| | 106 |
|
| Caterpillar Power Finance | 277 |
| | 90 |
| 447 |
| | 416 |
|
| Total | $ | 689 |
| | $ | 579 |
| $ | 780 |
| | $ | 807 |
|
| | | | | | | |
Troubled debt restructurings
A restructuring of a finance receivable constitutes a troubled debt restructuring (TDR) when the lender grants a concession it would not otherwise consider to a borrower experiencing financial difficulties. Concessions granted may include extended contract maturities, inclusion of interest only periods, below market interest rates, extended skip payment periods and reduction of principal and/or accrued interest.
As of SeptemberJune 30, 2017,2019 and December 31, 2018, there were no additional funds committed to lend to a borrower whose terms have been modified in a TDR. As of December 31, 2016, there were $11 million of additional funds committed to lend to a borrower whose terms have been modified in a TDR.
There were no finance receivables modified as TDRs during the three and ninesix months ended SeptemberJune 30, 20172019 and 20162018 for the Dealer or Caterpillar Purchased Receivables portfolio segments. Our recorded investment in finance receivables in the Customer portfolio segment modified as TDRs were as follows:
| | | (Dollars in millions) | Three Months Ended
September 30, 2017 | | Three Months Ended
September 30, 2016 | Three Months Ended
June 30, 2019 | | Three Months Ended
June 30, 2018 |
| | Number of Contracts | | Pre-TDR Recorded Investment | | Post-TDR Recorded Investment | | Number of Contracts | | Pre-TDR Recorded Investment | | Post-TDR Recorded Investment | Number of Contracts | | Pre-TDR Recorded Investment | | Post-TDR Recorded Investment | | Number of Contracts | | Pre-TDR Recorded Investment | | Post-TDR Recorded Investment |
| North America | 11 |
| | $ | 4 |
| | $ | 5 |
| | 2 |
| | $ | — |
| | $ | — |
| 8 |
| | $ | 5 |
| | $ | 4 |
| | 17 |
| | $ | 7 |
| | $ | 7 |
|
| Europe | 1 |
| | — |
| | — |
| | — |
| | — |
| | — |
| |
| EAME | | 2 |
| | 10 |
| | 10 |
| | — |
| | — |
| | — |
|
| Asia/Pacific | — |
| | — |
| | — |
| | 4 |
| | 1 |
| | 1 |
| — |
| | — |
| | — |
| | — |
| | — |
| | — |
|
| Mining | — |
| | — |
| | — |
| | 1 |
| | 33 |
| | 30 |
| 1 |
| | 6 |
| | 6 |
| | — |
| | — |
| | — |
|
Latin America(1) | 3 |
| | 21 |
| | 22 |
| | 341 |
| | 105 |
| | 74 |
| |
| Latin America | | 4 |
| | 2 |
| | 2 |
| | — |
| | — |
| | — |
|
| Caterpillar Power Finance | 5 |
| | 51 |
| | 44 |
| | 4 |
| | 13 |
| | 13 |
| 7 |
| | 47 |
| | 47 |
| | 2 |
| | 50 |
| | 17 |
|
| Total | 20 |
| | $ | 76 |
| | $ | 71 |
| | 352 |
| | $ | 152 |
| | $ | 118 |
| 22 |
| | $ | 70 |
| | $ | 69 |
| | 19 |
| | $ | 57 |
| | $ | 24 |
|
| | | | | | | | | | | | | | | | | | | | | | | |
| | Nine Months Ended
September 30, 2017 | | Nine Months Ended
September 30, 2016 | Six Months Ended
June 30, 2019 | | Six Months Ended
June 30, 2018 |
| | Number of Contracts | | Pre-TDR Recorded Investment | | Post-TDR Recorded Investment | | Number of Contracts | | Pre-TDR Recorded Investment | | Post-TDR Recorded Investment | Number of Contracts | | Pre-TDR Recorded Investment | | Post-TDR Recorded Investment | | Number of Contracts | | Pre-TDR Recorded Investment | | Post-TDR Recorded Investment |
| North America | 37 |
| | $ | 13 |
| | $ | 13 |
| | 15 |
| | $ | 16 |
| | $ | 16 |
| 8 |
| | $ | 5 |
| | $ | 4 |
| | 30 |
| | $ | 13 |
| | $ | 13 |
|
| Europe | 2 |
| | — |
| | — |
| | 3 |
| | 11 |
| | 8 |
| |
| EAME | | 21 |
| | 21 |
| | 17 |
| | — |
| | — |
| | — |
|
| Asia/Pacific | 6 |
| | 39 |
| | 30 |
| | 8 |
| | 4 |
| | 4 |
| — |
| | — |
| | — |
| | — |
| | — |
| | — |
|
| Mining | 2 |
| | 57 |
| | 56 |
| | 2 |
| | 43 |
| | 35 |
| 1 |
| | 6 |
| | 6 |
| | 1 |
| | 29 |
| | 29 |
|
| Latin America | 17 |
| | 26 |
| | 27 |
| | 431 |
| | 117 |
| | 87 |
| 4 |
| | 2 |
| | 2 |
| | 1 |
| | 3 |
| | 3 |
|
Caterpillar Power Finance(2) | 59 |
| | 319 |
| | 305 |
| | 34 |
| | 196 |
| | 177 |
| |
| Caterpillar Power Finance | | 15 |
| | 98 |
| | 97 |
| | 5 |
| | 53 |
| | 20 |
|
| Total | 123 |
| | $ | 454 |
| | $ | 431 |
| | 493 |
| | $ | 387 |
| | $ | 327 |
| 49 |
| | $ | 132 |
| | $ | 126 |
| | 37 |
| | $ | 98 |
| | $ | 65 |
|
| | | | | | | | | | | | | | | | | | | | | | | |
We lease Caterpillar equipment, machinery, engines and other equipment to customers primarily through sales-type (non-tax) leases, where the lessee for tax purposes is considered to be the owner of the equipment during the term of the lease. We also offer tax leases that are classified as either operating or direct finance leases for financial accounting purposes, depending on the characteristics of the lease. For tax purposes, we are considered the owner of the equipment.
Our lease agreements may include options for the lessee to purchase the underlying asset at the end of the lease term for either a stated fixed price or fair market value.
The residual values for leased assets, which are an estimate of the market value of leased equipment at the end of the lease term, are based on an analysis of historical wholesale market sales prices, projected forward on a level trend line without consideration for inflation or possible future pricing action. At the inception of the lease, residual values are estimated with consideration of the following critical factors: market size and demand, any known significant market/product trends, total expected hours of usage, machine configuration, application, location, model changes, quantities, past remarketing experience, third-party residual guarantees and contractual customer purchase options. Many of these factors are gathered in an application survey that is completed prior to quotation. The lease agreement also clearly defines applicable return conditions and remedies for non-compliance, to ensure that the leased equipment will be in good operating condition upon return. Model changes and updates, as well as market strength and product acceptance, are monitored and adjustments are made to residual values in accordance with the significance of any such changes. Our sales staff work closely with customers and dealers to manage the sale of lease returns and the recovery of residual exposure.
The residuals for leases classified as operating leases are included in Equipment on operating leases, net in the Consolidated Statements of Financial Position. The residuals for leases classified as finance leases are included in Finance receivables, net in the Consolidated Statements of Financial Position.
During the term of our operating leases, we evaluate the carrying value of our equipment on a regular basis taking into consideration expected residual values at lease termination. Adjustments to depreciation expense reflecting revised estimates of expected residual values at the end of the lease terms are recorded prospectively on a straight-line basis. For finance leases, residual value adjustments are recognized through a reduction of finance revenue.
Contractual maturities for finance lease receivables (classified as sales-type and direct finance leases) were as follows:
|
| | | | | | | | | | | | |
| (Millions of dollars) | | June 30, 2019 |
| Amounts due in | | Retail leases | | Wholesale leases | | Total |
| Remaining six months of 2019 | | $ | 1,834 |
| | $ | 14 |
| | $ | 1,848 |
|
| 2020 | | 2,606 |
| | 21 |
| | 2,627 |
|
| 2021 | | 1,543 |
| | 14 |
| | 1,557 |
|
| 2022 | | 716 |
| | 6 |
| | 722 |
|
| 2023 | | 302 |
| | 3 |
| | 305 |
|
| Thereafter | | 149 |
| | 2 |
| | 151 |
|
| Total | | 7,150 |
| | 60 |
| | 7,210 |
|
| Guaranteed residual value | | 411 |
| | 33 |
| | 444 |
|
| Unguaranteed residual value | | 835 |
| | 2 |
| | 837 |
|
| Unearned income | | (713 | ) | | (6 | ) | | (719 | ) |
| Total | | $ | 7,683 |
| | $ | 89 |
| | $ | 7,772 |
|
| | | | | | | |
|
| | | | | | | | | | | | |
| (Millions of dollars) | | December 31, 2018 |
| Amounts due in | | Retail leases | | Wholesale leases | | Total |
| 2019 | | $ | 3,024 |
| | $ | 29 |
| | $ | 3,053 |
|
| 2020 | | 2,055 |
| | 21 |
| | 2,076 |
|
| 2021 | | 1,092 |
| | 12 |
| | 1,104 |
|
| 2022 | | 465 |
| | 5 |
| | 470 |
|
| 2023 | | 171 |
| | 2 |
| | 173 |
|
| Thereafter | | 62 |
| | 2 |
| | 64 |
|
| Total | | 6,869 |
| | 71 |
| | 6,940 |
|
| Guaranteed residual value | | 416 |
| | 42 |
| | 458 |
|
| Unguaranteed residual value | | 854 |
| | 3 |
| | 857 |
|
| Unearned income | | (640 | ) | | (7 | ) | | (647 | ) |
| Total | | $ | 7,499 |
| | $ | 109 |
| | $ | 7,608 |
|
| | | | | | | |
Our finance lease receivables generally may be repaid or refinanced without penalty prior to contractual maturity and we also sell finance lease receivables to third parties to mitigate the concentration of credit risk with certain customers. Accordingly, this presentation should not be regarded as a forecast of future cash collections.
Components of equipment on operating leases, less accumulated depreciation, were as follows:
|
| | | | | | | | |
| (Millions of dollars) | | | | |
| | | June 30,
2019 | | December 31,
2018 |
| Equipment on operating leases, at cost | | $ | 5,249 |
| | $ | 5,201 |
|
| Less: Accumulated depreciation | | (1,674 | ) | | (1,639 | ) |
Equipment on operating leases, net (1) | | $ | 3,575 |
| | $ | 3,562 |
|
| | | | | |
(1) For the three months ended September 30, 2016, 321 contracts with a pre-TDR recorded investment of $94Includes $66 million and a post-TDR recorded investment$45 million of $64 million are relatedoperating leases with Caterpillar as of June 30, 2019 and December 31, 2018, respectively.
The carrying amount of residual assets covered by residual value guarantees and subject to four customers.
(2) For the nine months ended September 30, 2017, 44 contracts with a pre-TDR recorded investment of $200operating leases was $21 million and a post-TDR recorded investment$25 million as of $200 million are related to four customers.June 30, 2019 and December 31, 2018, respectively.
DuringAt June 30, 2019, payments due for operating leases were as follows:
|
| | | | | | | | | | | | | | | | | | | | | | | | | | |
| (Millions of dollars) |
Remaining Six Months of 2019 | | 2020 | | 2021 | | 2022 | | 2023 | | Thereafter | | Total |
| $ | 525 |
| | $ | 620 |
| | $ | 346 |
| | $ | 165 |
| | $ | 69 |
| | $ | 31 |
| | $ | 1,756 |
|
At December 31, 2018, scheduled minimum rental payments for operating leases were as follows:
|
| | | | | | | | | | | | | | | | | | | | | | | | | | |
| (Millions of dollars) |
| 2019 | | 2020 | | 2021 | | 2022 | | 2023 | | Thereafter | | Total |
| $ | 808 |
| | $ | 503 |
| | $ | 257 |
| | $ | 115 |
| | $ | 41 |
| | $ | 15 |
| | $ | 1,739 |
|
We also sell operating lease receivables to third parties to mitigate the nine months ended September 30, 2017, thereconcentration of credit risk with certain customers. Accordingly, this presentation should not be regarded as a forecast of future cash collections.
Revenue from finance and operating leases were 241 contracts, primarily relatedas follows:
|
| | | | | | | | |
| (Millions of dollars) | | | | |
| | | Three Months Ended
June 30, 2019 | | Six Months Ended
June 30, 2019 |
| Finance lease revenue (included in retail and wholesale finance revenue) | | $ | 135 |
| | $ | 253 |
|
| Operating lease revenue | | 257 |
| | 515 |
|
| Total | | $ | 392 |
| | $ | 768 |
|
| | | | | |
We typically pay property taxes on tax leases directly to two customers, withthe taxing authorities and invoice the lessee for reimbursement. These property tax reimbursements are accounted for as variable lease payments and are included in Operating lease revenues in the Consolidated Statements of Profit. We individually assess our operating lease receivables for impairment. If collectability of a recorded investment of $16 million withoperating lease receivable is not considered probable, we recognize a payment default (defined as 91+ days past due) which had been modified within twelve months prior to the default date in the Customer portfolio segment, all of which were in the Latin America finance receivable class.current-period adjustment against operating lease revenue.
We lease certain property, vehicles and other equipment primarily through operating leases. We recognize a lease liability and corresponding right-of-use asset based on the present value of lease payments. To determine the present value of lease payments for most of our leases, we use our incremental borrowing rate based on information available on the lease commencement date. We have elected not to separate payments for lease components from non-lease components. Our lease agreements may include options to extend or terminate the lease. When it is reasonably certain that we will exercise that option, we have included the option in the recognition of right-of-use assets and lease liabilities. Our variable lease costs primarily include maintenance, taxes and insurance. We have elected not to recognize right-of-use assets or lease liabilities for leases with a term of twelve months or less.
Our finance leases are not significant and therefore are not included in the following disclosures.
The components of lease cost were as follows:
|
| | | | | | | | |
| (Millions of dollars) | | | | |
| | | Three Months Ended
June 30, 2019 | | Six Months Ended
June 30, 2019 |
| Operating lease cost | | $ | 2 |
| | $ | 4 |
|
| Short-term lease cost | | $ | 1 |
| | $ | 1 |
|
| Variable lease cost | | $ | — |
| | $ | — |
|
| | | | | |
Supplemental information related to operating leases was as follows:
|
| | | | | | | | | |
| (Millions of dollars) | | | | | |
| | Consolidated Statements of Financial Position Location | | June 30,
2019 | | January 1,
2019 |
| Right-of-use assets | Other assets | | $ | 20 |
| | $ | 22 |
|
| Lease liabilities | Other liabilities | | $ | 20 |
| | $ | 23 |
|
| Weighted average remaining lease term | | | 4 years |
| | 4 years |
|
| Weighted average discount rate | | | 2.6 | % | | 2.6 | % |
| | | | | | |
At June 30, 2019, maturities of operating lease liabilities were as follows:
|
| | | | |
| (Millions of dollars) | | |
| Remaining six months of 2019 | | $ | 4 |
|
| 2020 | | 6 |
|
| 2021 | | 4 |
|
| 2022 | | 3 |
|
| 2023 | | 2 |
|
| Thereafter | | 2 |
|
| Total lease payments | | 21 |
|
| Less: imputed interest | | (1 | ) |
| Total | | $ | 20 |
|
| | | |
At December 31, 2018, minimum payments for operating leases having initial non-cancelable terms in excess of one year were as follows:
|
| | | | |
| (Millions of dollars) | | |
| 2019 | | $ | 8 |
|
| 2020 | | 6 |
|
| 2021 | | 4 |
|
| 2022 | | 2 |
|
| 2023 | | 2 |
|
| Thereafter | | 2 |
|
| Total | | $ | 24 |
|
| | | |
Supplemental cash flow information related to operating leases was as follows:
|
| | | |
| (Millions of dollars) | |
| | Six Months Ended
June 30, 2019 |
| Cash paid for amounts included in the measurement of operating lease liabilities | $ | 4 |
|
Right-of-use assets obtained in exchange for operating lease obligations(1) | $ | 24 |
|
| | |
(1) Includes a $23 million impact of initial recognition of right-of-use assets and lease liabilities.
| |
| 5. | Derivative Financial Instruments and Risk Management |
Our earnings and cash flow are subject to fluctuations due to changes in foreign currency exchange rates and interest rates. Our Risk Management Policy (policy) allows for the use of derivative financial instruments to manage foreign currency exchange rate and interest rate exposures. Our policy specifies that derivatives are not to be used for speculative purposes. Derivatives that we use are primarily foreign currency forward, option and cross currency contracts and interest rate contracts. Our derivative activities are subject to the management, direction and control of our senior financial officers. Risk management practices, including the use of financial derivative instruments, are presented to our Board of Directors and the Audit Committee of the Caterpillar Inc. Board of Directors at least annually.
All derivatives are recognized on the Consolidated Statements of Financial Position at their fair value. On the date the derivative contract is entered into, the derivative instrument is (1) designated as a hedge of the fair value of a recognized asset or liability (fair value hedge), (2) designated as a hedge of a forecasted transaction or the variability of cash flows (cash flow hedge) or (3) undesignated. Changes in the fair value of a derivative that is qualified, designated and highly effective as a fair value hedge, along with the gain or loss on the hedged recognized asset or liability that is attributable to the hedged risk, are recorded in current earnings. Changes in the fair value of a derivative that is qualified, designated and highly effective as a cash flow hedge are recorded in Accumulated other comprehensive income/(loss) (AOCI), to the extent effective, on the Consolidated Statements of Financial Position until they are reclassified to earnings in the same period or periods during which the hedged transaction affects earnings. Changes in the fair value of undesignated derivative instruments and the ineffective portion of designated derivative instruments are reported in current earnings. Cash flows from designated derivative financial instruments are classified within the same category as the item being hedged on the Consolidated Statements of Cash Flows. Cash flows from undesignated derivative financial instruments are included in the investing category on the Consolidated Statements of Cash Flows.
We formally document all relationships between hedging instruments and hedged items, as well as the risk-management objective and strategy for undertaking various hedge transactions. This process includes linking all derivatives that are designated as fair value hedges to specific assets and liabilities on the Consolidated Statements of Financial Position and linking cash flow hedges to specific forecasted transactions or variability of cash flow.
We also formally assess, both at the hedge’s inception and on an ongoing basis, whether the designated derivatives that are used in hedging transactions are highly effective in offsetting changes in fair value or cash flow of hedged items. When a derivative is determined not to be highly effective as a hedge or the underlying hedged transaction is no longer probable, we discontinue hedge accounting prospectively in accordance with derecognition criteria for hedge accounting.
Foreign currency exchange rate risk
We have balance sheet positions and expected future transactions denominated in foreign currencies, thereby creating exposure to movements in exchange rates. In managing foreign currency risk, our objective is to minimize earnings volatility resulting from conversion and the remeasurement of net foreign currency balance sheet positions and future transactions denominated in foreign currencies. Our policy allows the use of foreign currency forward, option and cross currency contracts to offset the risk of currency mismatch between our assets and liabilities and exchange rate risk associated with future transactions denominated in foreign currencies. Our foreign currency forward option and cross currencyoption contracts are primarily undesignated. We designate fixed-to-fixed cross currency contracts as cash flow hedges to protect against movements in exchange rates on foreign currency fixed ratefixed-rate assets and liabilities.
Interest rate risk
Interest rate movements create a degree of risk by affecting the amount of our interest payments and the value of our fixed-rate debt. Our practice is to use interest rate contracts to manage our exposure to interest rate changes.
We have a match-funding policy that addresses interest rate risk by aligning the interest rate profile (fixed or floating rate and duration) of our debt portfolio with the interest rate profile of our finance receivable portfolio within predetermined ranges on an ongoing basis. In connection with that policy, we use interest rate derivative instruments to modify the debt structure to match assets within the finance receivable portfolio. This matched funding reduces the volatility of margins between interest-bearing assets and interest-bearing liabilities, regardless of which direction interest rates move.
Our policy allows us to use fixed-to-floating, floating-to-fixed and floating-to-floating interest rate contracts to meet the match-funding objective. We designate fixed-to-floating interest rate contracts as fair value hedges to protect debt against changes in fair value due to changes in the benchmark interest rate. We designate most floating-to-fixed interest rate contracts as cash flow hedges to protect against the variability of cash flows due to changes in the benchmark interest rate.
As of SeptemberJune 30, 2017, $22019, $3 million of deferred net gains,losses, net of tax, included in equity (AOCI in the Consolidated Statements of Financial Position), related to our floating-to-fixed interest rate contracts, are expected to be reclassified to Interest expense over the next twelve months. The actual amount recorded in Interest expense will vary based on interest rates at the time the hedged transactions impact earnings.
We have, at certain times, liquidated fixed-to-floating interest rate contracts that resulted in deferred gains at the time of liquidation. The deferred gains associated with these interest rate contracts are included in Long-term debt in the Consolidated Statements of Financial Position and are being amortized to Interest expense over the remaining term of the previously designated hedged item.
The location and fair value of derivative instruments reported in the Consolidated Statements of Financial Position were as follows:
| | | (Millions of dollars) | | | | | | | | Asset (Liability) Fair Value |
| | | | Asset (Liability) Fair Value | |
| | Consolidated Statements of Financial Position Location | | September 30,
2017 | | December 31,
2016 | Consolidated Statements of Financial Position Location | | June 30,
2019 | | December 31,
2018 |
| Designated derivatives | | | | | | | | | | |
| Interest rate contracts | Other assets | | $ | 3 |
| | $ | 4 |
| Other assets | | $ | 6 |
| | $ | 4 |
|
| Interest rate contracts | Accrued expenses | | (1 | ) | | (1 | ) | Accrued expenses | | (71 | ) | | (40 | ) |
| Cross currency contracts | Other assets | | 8 |
| | 29 |
| Other assets | | 62 |
| | 88 |
|
| Cross currency contracts | Accrued expenses | | (41 | ) | | (3 | ) | Accrued expenses | | (17 | ) | | (9 | ) |
| | | | $ | (31 | ) | | $ | 29 |
| | | $ | (20 | ) | | $ | 43 |
|
| Undesignated derivatives | | | |
| | | | | |
| | |
| Foreign exchange contracts | Other assets | | $ | 17 |
| | $ | 12 |
| Other assets | | $ | 11 |
| | $ | 15 |
|
| Foreign exchange contracts | Accrued expenses | | (8 | ) | | (4 | ) | Accrued expenses | | (18 | ) | | (12 | ) |
| Cross currency contracts | Other assets | | 25 |
| | 27 |
| Other assets | | 5 |
| | 5 |
|
| Cross currency contracts | | Accrued expenses | | (2 | ) | | (2 | ) |
| | | | $ | 34 |
| | $ | 35 |
| | | $ | (4 | ) | | $ | 6 |
|
| | | | | | | | | |
The total notional amount of our derivative instruments was $3.56$8.74 billion and $2.63$10.21 billion as of SeptemberJune 30, 20172019 and December 31, 2016,2018, respectively. The notional amounts of derivative financial instruments do not represent amounts exchanged by the parties. The amounts exchanged by the parties are calculated by reference to the notional amounts and by other terms of the derivatives, such as foreign currency exchange rates and interest rates.
The effect of derivatives designated as hedging instruments on the Consolidated Statements of Profit was as follows:
| | | Fair Value Hedges | |
| Cash Flow Hedges | | Cash Flow Hedges |
| (Millions of dollars) | | | Three Months Ended
September 30, 2017 | | Three Months Ended
September 30, 2016 | Three Months Ended June 30, 2019 |
| | Classification | | Gains (Losses) on Derivatives | | Gains (Losses) on Borrowings | | Gains (Losses) on Derivatives | | Gains (Losses) on Borrowings | | Recognized in Earnings |
| | | Amounts of Gains (Losses) Recognized in AOCI | Classification | | Amounts of Gains (Losses) Reclassified from AOCI | | Amount of the line items in the Consolidated Statements of Profit |
| Interest rate contracts | Other income (expense) | | $ | — |
| | $ | — |
| | $ | (11 | ) | | $ | 11 |
| $ | (34 | ) | Interest expense | | $ | — |
| | $ | (200 | ) |
| Cross currency contracts | | 10 |
| Other income (expense) | | (4 | ) | | (6 | ) |
| | | | Interest expense | | 7 |
| | (200 | ) |
| | | $ | (24 | ) | | | $ | 3 |
| |
|
|
| | | | | | | |
| | | | | | | | | | Three Months Ended June 30, 2018 |
| | | Nine Months Ended
September 30, 2017 | | Nine Months Ended
September 30, 2016 | | Recognized in Earnings |
| | Classification | | Gains (Losses) on Derivatives | | Gains (Losses) on Borrowings | | Gains (Losses) on Derivatives | | Gains (Losses) on Borrowings | Amounts of Gains (Losses) Recognized in AOCI (Effective Portion) | Classification | | Reclassified from AOCI to Earnings (Effective Portion) | | Recognized in Earnings (Ineffective Portion) |
| Interest rate contracts | Other income (expense) | | $ | (1 | ) | | $ | 1 |
| | $ | (11 | ) | | $ | 10 |
| $ | 5 |
| Interest expense | | $ | — |
| | $ | — |
|
| Cross currency contracts | | 123 |
| Other income (expense) | | 119 |
| | — |
|
| | | | | | | | | | | Interest expense | | 5 |
| | — |
|
| | | $ | 128 |
| | | $ | 124 |
| | $ | — |
|
| | | | | | | |
| | | Six Months Ended June 30, 2019 |
| | | | Recognized in Earnings |
| | | Amounts of Gains (Losses) Recognized in AOCI | Classification | | Amounts of Gains (Losses) Reclassified from AOCI | | Amount of the line items in the Consolidated Statements of Profit |
| Interest rate contracts | | $ | (60 | ) | Interest expense | | $ | 1 |
| | $ | (401 | ) |
| Cross currency contracts | | 32 |
| Other income (expense) | | 2 |
| | (10 | ) |
| | | | Interest expense | | 14 |
| | (401 | ) |
| | | $ | (28 | ) | | | $ | 17 |
| |
|
|
| | | | | | | |
| | | Six Months Ended June 30, 2018 |
| | | | Recognized in Earnings |
| | | Amounts of Gains (Losses) Recognized in AOCI (Effective Portion) | Classification | | Reclassified from AOCI to Earnings (Effective Portion) | | Recognized in Earnings (Ineffective Portion) |
| Interest rate contracts | | $ | 5 |
| Interest expense | | $ | 1 |
| | $ | — |
|
| Cross currency contracts | | 90 |
| Other income (expense) | | 90 |
| | — |
|
| | | | Interest expense | | 8 |
| | — |
|
| | | $ | 95 |
| | | $ | 99 |
| | $ | — |
|
| | | | | | | |
|
| | | | | | | | | | | | |
| Cash Flow Hedges |
| (Millions of dollars) | Three Months Ended September 30, 2017 |
| | | Recognized in Earnings |
| | Amounts of Gains (Losses) Recognized in AOCI (Effective Portion) | Classification | | Reclassified from AOCI to Earnings (Effective Portion) | | Recognized in Earnings (Ineffective Portion) |
| Interest rate contracts | $ | (1 | ) | Interest expense | | $ | 1 |
| | $ | — |
|
| Cross currency contracts | (21 | ) | Other income (expense) | | (20 | ) | | — |
|
| Cross currency contracts | | Interest expense | | 1 |
| | — |
|
| | $ | (22 | ) | | | $ | (18 | ) | | $ | — |
|
| | | | | | | |
| | Three Months Ended September 30, 2016 |
| | | Recognized in Earnings |
| | Amounts of Gains (Losses) Recognized in AOCI (Effective Portion) | Classification | | Reclassified from AOCI to Earnings (Effective Portion) | | Recognized in Earnings (Ineffective Portion) |
| Interest rate contracts | $ | 2 |
| Interest expense | | $ | — |
| | $ | — |
|
| Cross currency contracts | (17 | ) | Other income (expense) | | (10 | ) | | — |
|
| | $ | (15 | ) | | | $ | (10 | ) | | $ | — |
|
| | | | | | | |
| | Nine Months Ended September 30, 2017 |
| | | Recognized in Earnings |
| | Amounts of Gains (Losses) Recognized in AOCI (Effective Portion) | Classification | | Reclassified from AOCI to Earnings (Effective Portion) | | Recognized in Earnings (Ineffective Portion) |
| Interest rate contracts | $ | (1 | ) | Interest expense | | $ | 2 |
| | $ | — |
|
| Cross currency contracts | (62 | ) | Other income (expense) | | (69 | ) | | — |
|
| Cross currency contracts | | Interest expense | | 3 |
| | — |
|
| | $ | (63 | ) | | | $ | (64 | ) | | $ | — |
|
| | | | | | | |
| | Nine Months Ended September 30, 2016 |
| | | Recognized in Earnings |
| | Amounts of Gains (Losses) Recognized in AOCI (Effective Portion) | Classification | | Reclassified from AOCI to Earnings (Effective Portion) | | Recognized in Earnings (Ineffective Portion) |
| Interest rate contracts | $ | — |
| Interest expense | | $ | (3 | ) | | $ | — |
|
| Cross currency contracts | (23 | ) | Other income (expense) | | (16 | ) | | — |
|
| | $ | (23 | ) | | | $ | (19 | ) | | $ | — |
|
| | | | | | | |
The effect of derivatives not designated as hedging instruments on the Consolidated Statements of Profit was as follows: | | | (Millions of dollars) | | | Three Months Ended September 30, | | | Three Months Ended June 30, |
| | Classification | | 2017 | | 2016 | Classification | | 2019 | | 2018 |
| Foreign exchange contracts | Other income (expense) | | $ | 14 |
| | $ | (5 | ) | Other income (expense) | | $ | (9 | ) | | $ | 18 |
|
| Cross currency contracts | Other income (expense) | | (3 | ) | | — |
| Other income (expense) | | (1 | ) | | 5 |
|
| | | | $ | 11 |
| | $ | (5 | ) | | | $ | (10 | ) | | $ | 23 |
|
| | | | | | | | | |
| | | Nine Months Ended September 30, | | Six Months Ended June 30, |
| | Classification | | 2017 | | 2016 | Classification | | 2019 | | 2018 |
| Foreign exchange contracts | Other income (expense) | | $ | 25 |
| | $ | (21 | ) | Other income (expense) | | $ | (38 | ) | | $ | 11 |
|
| Cross currency contracts | Other income (expense) | | (4 | ) | | (12 | ) | Other income (expense) | | (1 | ) | | 5 |
|
| | | $ | 21 |
| | $ | (33 | ) | | $ | (39 | ) | | $ | 16 |
|
| | | | | | | | | |
Balance sheet offsetting
We enter into International Swaps and Derivatives Association (ISDA) master netting agreements that permit the net settlement of amounts owed under their respective derivative contracts. Under these master netting agreements, net settlement generally permits us or the counterparty to determine the net amount payable for contracts due on the same date and in the same currency for similar types of derivative transactions. The master netting agreements generally also provide for net settlement of all outstanding contracts with a counterparty in the case of an event of default or a termination event.
Collateral is generally not required of the counterparties or us under the master netting agreements. As of SeptemberJune 30, 20172019 and December 31, 2016,2018, no cash collateral was received or pledged under the master netting agreements.
The effect of net settlement provisions of the master netting agreements on our derivative balances upon an event of default or a termination event was as follows:
| | | Offsetting of Derivative Assets and Liabilities | Offsetting of Derivative Assets and Liabilities | | | | | Offsetting of Derivative Assets and Liabilities | | | | |
| (Millions of dollars) | (Millions of dollars) | | | | | (Millions of dollars) | | June 30,
2019 | | December 31,
2018 |
| | | September 30,
2017 | | December 31,
2016 | |
| Derivative Assets | Derivative Assets | | | | | Derivative Assets | | | | |
| Gross Amount of Recognized Assets | Gross Amount of Recognized Assets | | $ | 53 |
| | $ | 72 |
| Gross Amount of Recognized Assets | | $ | 84 |
| | $ | 112 |
|
| Gross Amounts Offset | Gross Amounts Offset | | — |
| | — |
| Gross Amounts Offset | | — |
| | — |
|
Net Amount of Assets(1) | Net Amount of Assets(1) | | 53 |
| | 72 |
| Net Amount of Assets(1) | | 84 |
| | 112 |
|
| Gross Amounts Not Offset | Gross Amounts Not Offset | | (8 | ) | | (7 | ) | Gross Amounts Not Offset | | (19 | ) | | (34 | ) |
| Net Amount | Net Amount | | $ | 45 |
| | $ | 65 |
| Net Amount | | $ | 65 |
| | $ | 78 |
|
| | | | | | | | | | | |
| Derivative Liabilities | Derivative Liabilities | | | | | Derivative Liabilities | | | | |
| Gross Amount of Recognized Liabilities | Gross Amount of Recognized Liabilities | | $ | (50 | ) | | $ | (8 | ) | Gross Amount of Recognized Liabilities | | $ | (108 | ) | | $ | (63 | ) |
| Gross Amounts Offset | Gross Amounts Offset | | — |
| | — |
| Gross Amounts Offset | | — |
| | — |
|
Net Amount of Liabilities(1) | Net Amount of Liabilities(1) | | (50 | ) | | (8 | ) | Net Amount of Liabilities(1) | | (108 | ) | | (63 | ) |
| Gross Amounts Not Offset | Gross Amounts Not Offset | | 8 |
| | 7 |
| Gross Amounts Not Offset | | 19 |
| | 34 |
|
| Net Amount | Net Amount | | $ | (42 | ) | | $ | (1 | ) | Net Amount | | $ | (89 | ) | | $ | (29 | ) |
| | | | | | | | | | | |
(1) As presented in the Consolidated Statements of Financial Position.
| |
5.6. | Accumulated Other Comprehensive Income/(Loss) |
Comprehensive income/(loss) and its components are presented in the Consolidated Statements of Comprehensive Income. Changes in Accumulated other comprehensive income/(loss), net of tax, included in the Consolidated Statements of Changes in Shareholder's Equity, consisted of the following:
|
| | | | | | | | | | | | | | | |
| (Millions of dollars) | Foreign currency translation | | Derivative financial instruments | | Available-for- sale securities | | Total |
| | | | | | | | |
| Three Months Ended September 30, 2016 | | | | | | | |
| Balance at June 30, 2016 | $ | (790 | ) | | $ | 1 |
| | $ | (2 | ) | | $ | (791 | ) |
Other comprehensive income/(loss) before reclassifications | (5 | ) | | (10 | ) | | 1 |
| | (14 | ) |
Amounts reclassified from accumulated other comprehensive (income)/loss | — |
| | 7 |
| | — |
| | 7 |
|
| Other comprehensive income/(loss) | (5 | ) | | (3 | ) | | 1 |
| | (7 | ) |
| Balance at September 30, 2016 | $ | (795 | ) | | $ | (2 | ) | | $ | (1 | ) | | $ | (798 | ) |
| | | | | | | | |
| Three Months Ended September 30, 2017 | | | | | | | |
| Balance at June 30, 2017 | $ | (756 | ) | | $ | 2 |
| | $ | 1 |
| | $ | (753 | ) |
Other comprehensive income/(loss) before reclassifications | 151 |
| | (14 | ) | | (1 | ) | | 136 |
|
Amounts reclassified from accumulated other comprehensive (income)/loss | — |
| | 11 |
| | — |
| | 11 |
|
| Other comprehensive income/(loss) | 151 |
| | (3 | ) | | (1 | ) | | 147 |
|
| Balance at September 30, 2017 | $ | (605 | ) | | $ | (1 | ) | | $ | — |
| | $ | (606 | ) |
| | | | | | | | |
| Nine Months Ended September 30, 2016 | | | | | | | |
| Balance at December 31, 2015 | $ | (897 | ) | | $ | — |
| | $ | — |
| | $ | (897 | ) |
Other comprehensive income/(loss) before reclassifications | 102 |
| | (15 | ) | | (1 | ) | | 86 |
|
Amounts reclassified from accumulated other comprehensive (income)/loss | — |
| | 13 |
| | — |
| | 13 |
|
| Other comprehensive income/(loss) | 102 |
| | (2 | ) | | (1 | ) | | 99 |
|
| Balance at September 30, 2016 | $ | (795 | ) | | $ | (2 | ) | | $ | (1 | ) | | $ | (798 | ) |
| | | | | | | | |
| Nine Months Ended September 30, 2017 | | | | | | | |
| Balance at December 31, 2016 | $ | (994 | ) | | $ | (1 | ) | | $ | — |
| | $ | (995 | ) |
Other comprehensive income/(loss) before reclassifications | 389 |
| | (41 | ) | | — |
| | 348 |
|
Amounts reclassified from accumulated other comprehensive (income)/loss | — |
| | 41 |
| | — |
| | 41 |
|
| Other comprehensive income/(loss) | 389 |
| | — |
| | — |
| | 389 |
|
| Balance at September 30, 2017 | $ | (605 | ) | | $ | (1 | ) | | $ | — |
| | $ | (606 | ) |
| | | | | | | | |
|
| | | | | | | | | | | |
| (Millions of dollars) | Foreign currency translation | | Derivative financial instruments | | Total |
| Three Months Ended June 30, 2018 | | | | | |
| Balance at March 31, 2018 | $ | (522 | ) | | $ | (11 | ) | | $ | (533 | ) |
| Other comprehensive income/(loss) before reclassifications | (254 | ) | | 99 |
| | (155 | ) |
| Amounts reclassified from accumulated other comprehensive (income)/loss | — |
| | (96 | ) | | (96 | ) |
| Other comprehensive income/(loss) | (254 | ) | | 3 |
| | (251 | ) |
| Balance at June 30, 2018 | $ | (776 | ) | | $ | (8 | ) | | $ | (784 | ) |
| | | | | | |
| Three Months Ended June 30, 2019 | | | | | |
| Balance at March 31, 2019 | $ | (778 | ) | | $ | (51 | ) | | $ | (829 | ) |
| Other comprehensive income/(loss) before reclassifications | 20 |
| | (19 | ) | | 1 |
|
| Amounts reclassified from accumulated other comprehensive (income)/loss | — |
| | (3 | ) | | (3 | ) |
| Other comprehensive income/(loss) | 20 |
| | (22 | ) | | (2 | ) |
| Balance at June 30, 2019 | $ | (758 | ) | | $ | (73 | ) | | $ | (831 | ) |
| | | | | | |
| Six Months Ended June 30, 2018 | | | | | |
| Balance at December 31, 2017 | $ | (587 | ) | | $ | (5 | ) | | $ | (592 | ) |
| Other comprehensive income/(loss) before reclassifications | (189 | ) | | 73 |
| | (116 | ) |
| Amounts reclassified from accumulated other comprehensive (income)/loss | — |
| | (76 | ) | | (76 | ) |
| Other comprehensive income/(loss) | (189 | ) | | (3 | ) | | (192 | ) |
| Balance at June 30, 2018 | $ | (776 | ) | | $ | (8 | ) | | $ | (784 | ) |
| | | | | | |
| Six Months Ended June 30, 2019 | | | | | |
| Balance at December 31, 2018 | $ | (889 | ) | | $ | (36 | ) | | $ | (925 | ) |
| Other comprehensive income/(loss) before reclassifications | 33 |
| | (22 | ) | | 11 |
|
| Amounts reclassified from accumulated other comprehensive (income)/loss | — |
| | (14 | ) | | (14 | ) |
Adjustment to adopt new accounting guidance(1) | 98 |
| | (1 | ) | | 97 |
|
| Other comprehensive income/(loss) | 131 |
| | (37 | ) | | 94 |
|
| Balance at June 30, 2019 | $ | (758 | ) | | $ | (73 | ) | | $ | (831 | ) |
| | | | | | |
(1) See Note 2 regarding new accounting guidance related to reclassification of certain tax effects from accumulated other comprehensive income/(loss).
The effect of the reclassifications out of Accumulated other comprehensive income/(loss) on the Consolidated Statements of Profit was as follows:
| | | (Millions of dollars) | | Three Months Ended
September 30, | | Nine Months Ended
September 30, | | Three Months Ended
June 30, | | Six Months Ended
June 30, |
| | Classification of income (expense) | | 2017 | | 2016 | | 2017 | | 2016 | |
| Derivative financial instruments | | Classification of income (expense) | | 2019 | | 2018 | | 2019 | | 2018 |
| Cross currency contracts | Other income (expense) | | $ | (20 | ) | | $ | (10 | ) | | $ | (69 | ) | | $ | (16 | ) | Other income (expense) | | $ | (4 | ) | | $ | 119 |
| | $ | 2 |
| | $ | 90 |
|
| Cross currency contracts | Interest expense | | 1 |
| | — |
| | 3 |
| | — |
| Interest expense | | 7 |
| | 5 |
| | 14 |
| | 8 |
|
| Interest rate contracts | Interest expense | | 1 |
| | — |
| | 2 |
| | (3 | ) | Interest expense | | — |
| | — |
| | 1 |
| | 1 |
|
| Reclassifications before tax | | (18 | ) | | (10 | ) | | (64 | ) | | (19 | ) | | 3 |
| | 124 |
| | 17 |
| | 99 |
|
| Tax (provision) benefit | | 7 |
| | 3 |
| | 23 |
| | 6 |
| | — |
| | (28 | ) | | (3 | ) | | (23 | ) |
Total reclassifications from Accumulated other comprehensive income/(loss) | Total reclassifications from Accumulated other comprehensive income/(loss) | | $ | (11 | ) | | $ | (7 | ) | | $ | (41 | ) | | $ | (13 | ) | Total reclassifications from Accumulated other comprehensive income/(loss) | | $ | 3 |
| | $ | 96 |
| | $ | 14 |
| | $ | 76 |
|
| | | | | | | | | | | | | | | | | |
A. Basis for Segment Information
We report information internally for operating segments based on management responsibility. Our operating segments offerprovide financing alternatives to customers and dealers around the world for the purchase and lease of Caterpillar and other equipment,products, as well as financing for vehicles, power generation facilities and marine vessels that, in most cases, incorporate Caterpillar sales to dealers.products. Financing plans include operating and finance leases, installment sale contracts, working capital loans and wholesale financing plans within each of the respective segments.
B. Description of Segments
We have fivesix operating segments that offer financing services. Following is a brief description of our segments:
North America - Includes our operations in the United States and Canada.
EuropeEAME - Includes our operations in Europe, Africa, the Middle East and the Commonwealth of Independent States.
Asia/Pacific - Includes our operations in Australia, New Zealand, China, Japan, Southeast Asia and Southeast Asia.India.
Latin America - Includes our operations in Mexico and Central and South American countries.
Caterpillar Power Finance - Includes our operations in Central and South American countries. This segment also includes Caterpillar Power Finance (CPF), which financesProvides financing worldwide for marine vessels with Caterpillar engines worldwide and also provides financing for Caterpillar electrical power generation, gas compression and co-generation systems and non-Caterpillar equipment that is powered by these systems worldwide.systems.
Mining - Serves large mining customers worldwide and provides project financing in various countries.
C. Segment Measurement and Reconciliations
Cash, debt and other expenses are allocated to our segments based on their respective portfolios. The related Interest expense is calculated based on the amount of allocated debt and the rates associated with that debt. The performance of each segment is assessed based on a consistent leverage ratio. The Provision for credit losses is based on each segment's respective finance receivable portfolio. Capital expenditures include expenditures for equipment on operating leases and other miscellaneous capital expenditures.
Reconciling items are created based on accounting differences between segment reporting and consolidated external reporting. For the reconciliation of profit before income taxes, we have grouped the reconciling items as follows:
Unallocated - This item is related to corporate requirements and strategies that are considered to be for the benefit of the entire organization. Also included are the consolidated results of the special purpose corporation (see Note 78 for additional information) and other miscellaneous items.
Timing - Timing differences in the recognition of costs between segment reporting and consolidated external reporting.
Methodology - Methodology differences between segment reporting and consolidated external reporting are as follows:
| |
| ◦ | Segment assets include off-balance sheet managed assets for which we maintain servicing responsibilities. |
| |
| ◦ | The impact of differences between the actual leverage and the segment leverage ratios. |
| |
| ◦ | Interest expense includes realized forward points on foreign currency forward contracts. |
| |
| ◦ | The net gain or loss from interest rate derivatives. |
| |
◦ | The profit attributable to noncontrolling interests is considered a component of segment profit. |
Supplemental segment data and reconciliations to consolidated external reporting for the three months ended SeptemberJune 30 was as follows:
| | (Millions of dollars)
2017 | External Revenues | | Profit before income taxes | | Interest Expense | | Depreciation on equipment leased to others | | Provision for credit losses | | Assets at September 30, 2017 | | Capital expenditures | |
(Millions of dollars)
2019 | | External Revenues | | Profit before income taxes | | Interest Expense | | Depreciation on equipment leased to others | | Provision for credit losses | | Assets at June 30, 2019 | | Capital expenditures |
| North America | $ | 338 |
| | $ | 90 |
| | $ | 77 |
| | $ | 130 |
| | $ | 11 |
| | $ | 14,703 |
| | $ | 187 |
| $ | 414 |
| | $ | 131 |
| | $ | 99 |
| | $ | 146 |
| | $ | 2 |
| | $ | 15,990 |
| | $ | 388 |
|
| Europe | 68 |
| | 20 |
| | 9 |
| | 19 |
| | 2 |
| | 4,084 |
| | 25 |
| |
| EAME | | 73 |
| | 22 |
| | 13 |
| | 17 |
| | (2 | ) | | 4,917 |
| | 18 |
|
| Asia/Pacific | 68 |
| | 25 |
| | 22 |
| | 5 |
| | 1 |
| | 3,924 |
| | 2 |
| 105 |
| | 52 |
| | 29 |
| | 3 |
| | 5 |
| | 4,737 |
| | 4 |
|
| Latin America and CPF | 101 |
| | 2 |
| | 41 |
| | 10 |
| | 20 |
| | 6,371 |
| | 6 |
| |
| Latin America | | 62 |
| | 3 |
| | 25 |
| | 5 |
| | 13 |
| | 3,040 |
| | 17 |
|
| Caterpillar Power Finance | | 26 |
| | (33 | ) | | 11 |
| | 1 |
| | 42 |
| | 1,856 |
| | — |
|
| Mining | 71 |
| | 12 |
| | 12 |
| | 36 |
| | 4 |
| | 2,372 |
| | 88 |
| 70 |
| | 7 |
| | 14 |
| | 32 |
| | 11 |
| | 2,393 |
| | 26 |
|
| Total Segments | 646 |
| | 149 |
| | 161 |
| | 200 |
| | 38 |
| | 31,454 |
| | 308 |
| 750 |
| | 182 |
| | 191 |
| | 204 |
| | 71 |
| | 32,933 |
| | 453 |
|
| Unallocated | 35 |
| | (47 | ) | | 50 |
| | — |
| | — |
| | 2,718 |
| | — |
| 15 |
| | (83 | ) | | 65 |
| | — |
| | — |
| | 2,140 |
| | 6 |
|
| Timing | (8 | ) | | (13 | ) | | — |
| | 1 |
| | 10 |
| | 16 |
| | — |
| (8 | ) | | (4 | ) | | — |
| | — |
| | — |
| | 22 |
| | — |
|
| Methodology | — |
| | 37 |
| | (42 | ) | | — |
| | — |
| | (225 | ) | | — |
| — |
| | 46 |
| | (56 | ) | | — |
| | — |
| | (201 | ) | | — |
|
Inter-segment Eliminations (1) | — |
| | — |
| | — |
| | — |
| | — |
| | (280 | ) | | — |
| — |
| | — |
| | — |
| | — |
| | — |
| | (329 | ) | | — |
|
| Total | $ | 673 |
| | $ | 126 |
| | $ | 169 |
| | $ | 201 |
| | $ | 48 |
| | $ | 33,683 |
| | $ | 308 |
| $ | 757 |
| | $ | 141 |
| | $ | 200 |
| | $ | 204 |
| | $ | 71 |
| | $ | 34,565 |
| | $ | 459 |
|
| | | | | | | | | | | | | | | | | | | | | | | | | | | |
| 2016 | External Revenues | | Profit before income taxes | | Interest Expense | | Depreciation on equipment leased to others | | Provision for credit losses | | Assets at December 31, 2016 | | Capital expenditures | |
| 2018 | | External Revenues | | Profit before income taxes | | Interest Expense | | Depreciation on equipment leased to others | | Provision for credit losses | | Assets at December 31, 2018 | | Capital expenditures |
| North America | $ | 310 |
| | $ | 79 |
| | $ | 70 |
| | $ | 123 |
| | $ | 10 |
| | $ | 14,925 |
| | $ | 281 |
| $ | 378 |
| | $ | 105 |
| | $ | 91 |
| | $ | 144 |
| | $ | 8 |
| | $ | 15,632 |
| | $ | 456 |
|
| Europe | 68 |
| | 21 |
| | 8 |
| | 21 |
| | 1 |
| | 3,834 |
| | 44 |
| |
| EAME | | 71 |
| | 5 |
| | 13 |
| | 19 |
| | 13 |
| | 4,862 |
| | 22 |
|
| Asia/Pacific | 65 |
| | 20 |
| | 21 |
| | 8 |
| | 1 |
| | 3,620 |
| | 4 |
| 95 |
| | 44 |
| | 30 |
| | 4 |
| | (1 | ) | | 4,639 |
| | 3 |
|
| Latin America and CPF | 122 |
| | 31 |
| | 36 |
| | 15 |
| | 17 |
| | 7,270 |
| | 11 |
| |
| Latin America | | 63 |
| | (20 | ) | | 25 |
| | 8 |
| | 36 |
| | 2,972 |
| | 19 |
|
| Caterpillar Power Finance | | 31 |
| | (36 | ) | | 15 |
| | — |
| | 46 |
| | 2,259 |
| | — |
|
| Mining | 73 |
| | 14 |
| | 11 |
| | 45 |
| | (3 | ) | | 2,734 |
| | 19 |
| 70 |
| | 11 |
| | 15 |
| | 33 |
| | 2 |
| | 2,234 |
| | 31 |
|
| Total Segments | 638 |
| | 165 |
| | 146 |
| | 212 |
| | 26 |
| | 32,383 |
| | 359 |
| 708 |
| | 109 |
| | 189 |
| | 208 |
| | 104 |
| | 32,598 |
| | 531 |
|
| Unallocated | 21 |
| | (35 | ) | | 32 |
| | — |
| | — |
| | 1,688 |
| | (3 | ) | 23 |
| | (65 | ) | | 62 |
| | 1 |
| | — |
| | 1,957 |
| | 2 |
|
| Timing | (8 | ) | | (7 | ) | | — |
| | 1 |
| | 3 |
| | 27 |
| | — |
| (8 | ) | | 9 |
| | — |
| | — |
| | — |
| | 55 |
| | — |
|
| Methodology | — |
| | 23 |
| | (27 | ) | | — |
| | — |
| | (220 | ) | | — |
| — |
| | 47 |
| | (61 | ) | | — |
| | — |
| | (159 | ) | | — |
|
Inter-segment Eliminations (1) | — |
| | — |
| | — |
| | — |
| | — |
| | (263 | ) | | — |
| — |
| | — |
| | — |
| | — |
| | — |
| | (270 | ) | | — |
|
| Total | $ | 651 |
| | $ | 146 |
| | $ | 151 |
| | $ | 213 |
| | $ | 29 |
| | $ | 33,615 |
| | $ | 356 |
| $ | 723 |
| | $ | 100 |
| | $ | 190 |
| | $ | 209 |
| | $ | 104 |
| | $ | 34,181 |
| | $ | 533 |
|
| | | | | | | | | | | | | | | | | | | | | | | | | | | |
Eliminations areElimination is primarily related to intercompany loans.
Supplemental segment data and reconciliations to consolidated external reporting for the ninesix months ended SeptemberJune 30 was as follows:
| | (Millions of dollars)
2017 | External Revenues | | Profit before income taxes | | Interest Expense | | Depreciation on equipment leased to others | | Provision for credit losses | | Assets at September 30, 2017 | | Capital expenditures | |
(Millions of dollars)
2019 | | External Revenues | | Profit before income taxes | | Interest Expense | | Depreciation on equipment leased to others | | Provision for credit losses | | Assets at June 30, 2019 | | Capital expenditures |
| North America | $ | 989 |
| | $ | 262 |
| | $ | 224 |
| | $ | 388 |
| | $ | 25 |
| | $ | 14,703 |
| | $ | 722 |
| $ | 815 |
| | $ | 247 |
| | $ | 196 |
| | $ | 290 |
| | $ | 9 |
| | $ | 15,990 |
| | $ | 567 |
|
| Europe | 200 |
| | 62 |
| | 27 |
| | 60 |
| | — |
| | 4,084 |
| | 71 |
| |
| EAME | | 145 |
| | 46 |
| | 27 |
| | 34 |
| | (3 | ) | | 4,917 |
| | 41 |
|
| Asia/Pacific | 197 |
| | 73 |
| | 64 |
| | 19 |
| | (5 | ) | | 3,924 |
| | 5 |
| 199 |
| | 94 |
| | 59 |
| | 6 |
| | 8 |
| | 4,737 |
| | 10 |
|
| Latin America and CPF | 335 |
| | 48 |
| | 124 |
| | 33 |
| | 56 |
| | 6,371 |
| | 48 |
| |
| Latin America | | 122 |
| | 6 |
| | 48 |
| | 11 |
| | 29 |
| | 3,040 |
| | 19 |
|
| Caterpillar Power Finance | | 55 |
| | (49 | ) | | 24 |
| | 1 |
| | 68 |
| | 1,856 |
| | — |
|
| Mining | 213 |
| | 57 |
| | 37 |
| | 107 |
| | (5 | ) | | 2,372 |
| | 168 |
| 139 |
| | 19 |
| | 28 |
| | 64 |
| | 13 |
| | 2,393 |
| | 59 |
|
| Total Segments | 1,934 |
| | 502 |
| | 476 |
| | 607 |
| | 71 |
| | 31,454 |
| | 1,014 |
| 1,475 |
| | 363 |
| | 382 |
| | 406 |
| | 124 |
| | 32,933 |
| | 696 |
|
| Unallocated | 100 |
| | (128 | ) | | 139 |
| | — |
| | — |
| | 2,718 |
| | 4 |
| 34 |
| | (166 | ) | | 129 |
| | — |
| | — |
| | 2,140 |
| | 9 |
|
| Timing | (23 | ) | | (20 | ) | | — |
| | 1 |
| | 11 |
| | 16 |
| | — |
| (16 | ) | | (9 | ) | | — |
| | — |
| | — |
| | 22 |
| | — |
|
| Methodology | — |
| | 103 |
| | (116 | ) | | — |
| | — |
| | (225 | ) | | — |
| — |
| | 95 |
| | (110 | ) | | — |
| | — |
| | (201 | ) | | — |
|
Inter-segment Eliminations (1) | — |
| | — |
| | — |
| | — |
| | — |
| | (280 | ) | | — |
| — |
| | — |
| | — |
| | — |
| | — |
| | (329 | ) | | — |
|
| Total | $ | 2,011 |
| | $ | 457 |
| | $ | 499 |
| | $ | 608 |
| | $ | 82 |
| | $ | 33,683 |
| | $ | 1,018 |
| $ | 1,493 |
| | $ | 283 |
| | $ | 401 |
| | $ | 406 |
| | $ | 124 |
| | $ | 34,565 |
| | $ | 705 |
|
| | | | | | | | | | | | | | | | | | | | | | | | | | | |
| 2016 | External Revenues | | Profit before income taxes | | Interest Expense | | Depreciation on equipment leased to others | | Provision for credit losses | | Assets at December 31, 2016 | | Capital expenditures | |
| 2018 | | External Revenues | | Profit before income taxes | | Interest Expense | | Depreciation on equipment leased to others | | Provision for credit losses | | Assets at December 31, 2018 | | Capital expenditures |
| North America | $ | 927 |
| | $ | 255 |
| | $ | 216 |
| | $ | 350 |
| | $ | 23 |
| | $ | 14,925 |
| | $ | 933 |
| $ | 739 |
| | $ | 200 |
| | $ | 173 |
| | $ | 279 |
| | $ | 25 |
| | $ | 15,632 |
| | $ | 666 |
|
| Europe | 202 |
| | 63 |
| | 25 |
| | 62 |
| | 3 |
| | 3,834 |
| | 120 |
| |
| EAME | | 139 |
| | 12 |
| | 23 |
| | 39 |
| | 24 |
| | 4,862 |
| | 36 |
|
| Asia/Pacific | 190 |
| | 56 |
| | 62 |
| | 21 |
| | 6 |
| | 3,620 |
| | 73 |
| 177 |
| | 84 |
| | 55 |
| | 10 |
| | (5 | ) | | 4,639 |
| | 7 |
|
| Latin America and CPF | 367 |
| | 76 |
| | 118 |
| | 47 |
| | 59 |
| | 7,270 |
| | 35 |
| |
| Latin America | | 132 |
| | (16 | ) | | 54 |
| | 15 |
| | 48 |
| | 2,972 |
| | 27 |
|
| Caterpillar Power Finance | | 65 |
| | (39 | ) | | 27 |
| | 1 |
| | 64 |
| | 2,259 |
| | — |
|
| Mining | 232 |
| | 35 |
| | 35 |
| | 145 |
| | 3 |
| | 2,734 |
| | 105 |
| 132 |
| | 16 |
| | 30 |
| | 63 |
| | 8 |
| | 2,234 |
| | 64 |
|
| Total Segments | 1,918 |
| | 485 |
| | 456 |
| | 625 |
| | 94 |
| | 32,383 |
| | 1,266 |
| 1,384 |
| | 257 |
| | 362 |
| | 407 |
| | 164 |
| | 32,598 |
| | 800 |
|
| Unallocated | 60 |
| | (99 | ) | | 81 |
| | — |
| | 1 |
| | 1,688 |
| | — |
| 45 |
| | (132 | ) | | 120 |
| | 1 |
| | — |
| | 1,957 |
| | 94 |
|
| Timing | (25 | ) | | (13 | ) | | — |
| | 2 |
| | 1 |
| | 27 |
| | (1 | ) | (16 | ) | | 6 |
| | — |
| | — |
| | 7 |
| | 55 |
| | — |
|
| Methodology | — |
| | 66 |
| | (79 | ) | | — |
| | — |
| | (220 | ) | | — |
| — |
| | 93 |
| | (118 | ) | | — |
| | — |
| | (159 | ) | | — |
|
Inter-segment Eliminations (1) | — |
| | — |
| | — |
| | — |
| | — |
| | (263 | ) | | — |
| — |
| | — |
| | — |
| | — |
| | — |
| | (270 | ) | | — |
|
| Total | $ | 1,953 |
| | $ | 439 |
| | $ | 458 |
| | $ | 627 |
| | $ | 96 |
| | $ | 33,615 |
| | $ | 1,265 |
| $ | 1,413 |
| | $ | 224 |
| | $ | 364 |
| | $ | 408 |
| | $ | 171 |
| | $ | 34,181 |
| | $ | 894 |
|
| | | | | | | | | | | | | | | | | | | | | | | | | | | |
Eliminations areElimination is primarily related to intercompany loans.
We provide loan guarantees to third-party lenders for financing associated with machinery purchased by customers. These guarantees have varying terms and are secured by the machinery being financed. We also provide residual value guarantees to third-party lenders associated with machinery leased to customers. These guarantees have varying terms. In addition, we participate in standby letters of credit issued to third parties on behalf of our customers. These standby letters of credit have varying terms and beneficiaries and are secured by customer assets.
No significant loss has been experienced or is anticipated under any of these guarantees. At SeptemberJune 30, 20172019 and December 31, 2016,2018, the related recorded liability was less than $1 million and less than $1 million, respectively. The maximum potential amount of future payments (undiscounted and without reduction for any amounts that may possibly be recovered under recourse or collateralized provisions) we could be required to make under the guarantees was $87$99 million and $43$97 million at SeptemberJune 30, 20172019 and December 31, 2016,2018, respectively.
We provide guarantees to repurchase certain loans of Caterpillar dealers from a special purpose corporation (SPC) that qualifies as a VIE (see Note 1 for additional information regarding the accounting guidance on the consolidation of VIEs). The purpose of the SPC is to provide short-term working capital loans to Caterpillar dealers. This SPC issues commercial paper and uses the proceeds to fund its loan program. We have a loan purchase agreement with the SPC that obligates us to purchase certain loans that are not paid at maturity. We receive a fee for providing this guarantee, which provides a source of liquidity for the SPC. We are the primary beneficiary of the SPC as our guarantees result in us having both the power to direct the activities that most significantly impact the SPC's economic performance and the obligation to absorb losses and therefore we have consolidated the financial statements of the SPC. As of SeptemberJune 30, 20172019 and December 31, 2016,2018, the SPC’s assets of $1.10$1.37 billion and $1.09$1.15 billion, respectively, were primarily comprised of loans to dealers, which are included in Finance receivables, net in the Consolidated Statements of Financial Position, and the SPC's liabilities of $1.10$1.37 billion and $1.09$1.15 billion, respectively, were primarily comprised of commercial paper, which is included in Short-term borrowings in the Consolidated Statements of Financial Position. The assets of the SPC are not available to pay our creditors. We may be obligated to perform under the guarantee if the SPC experiences losses. No loss has been experienced or is anticipated under this loan purchase agreement.
| |
8.9. | Fair Value Measurements |
| |
| A. | Fair Value Measurements |
The guidance on fair value measurements defines fair value as the exchange price that would be received for an asset or paid to transfer a liability (an exit price) in the principal or most advantageous market for the asset or liability in an orderly transaction between market participants. This guidance also specifies a fair value hierarchy based upon the observability of inputs used in valuation techniques. Observable inputs (highest level) reflect market data obtained from independent sources, while unobservable inputs (lowest level) reflect internally developed market assumptions. In accordance with this guidance, fair value measurements are classified under the following hierarchy:
Level 1 – Quoted prices for identical instruments in active markets.
Level 2 – Quoted prices for similar instruments in active markets; quoted prices for identical or similar instruments in markets that are not active; and model-derived valuations in which all significant inputs or significant value-drivers are observable in active markets.
Level 3 – Model-derived valuations in which one or more significant inputs or significant value-drivers are unobservable.
When available, we use quoted market prices to determine fair value and we classify such measurements within Level 1. In some cases where market prices are not available, we make use of observable market-based inputs to calculate fair value, in which case the measurements are classified within Level 2. If quoted or observable market prices are not available, fair value is based upon valuations in which one or more significant inputs are unobservable, including internally developed models that use, where possible, current market-based parameters such as interest rates, yield curves and currency rates. These measurements are classified within Level 3.
Fair value measurements are classified according to the lowest level input or value-driver that is significant to the valuation. A measurement may therefore be classified within Level 3 even though there may be significant inputs that are readily observable.
Fair value measurement includes the consideration of nonperformance risk. Nonperformance risk refers to the risk that an obligation (either by a counterparty or us) will not be fulfilled. For financial assets traded in an active market (Level 1), the nonperformance risk is included in the market price. For certain other financial assets and liabilities (Level 2 and 3), our fair value calculations have been adjusted accordingly.
Derivative financial instruments
The fair value of interest rate contracts is primarily based on standard industry accepted models that utilize the appropriate market-based forward swap curves and zero-coupon interest rates to determine discounted cash flows. The fair value of foreign currency forward and cross currency contracts is based on a standard industry accepted valuation modelmodels that discountsdiscount cash flows resulting from the differential between the contract price and the market-based forward rate.
Derivative financial instruments are measured on a recurring basis at fair value and are classified as Level 2 measurements. We had derivative financial instruments in a net assetliability position included in our Consolidated Statements of Financial Position of $3 million and $64$24 million as of SeptemberJune 30, 20172019, and in a net asset position of $49 million as of December 31, 2016, respectively.2018.
Impaired loans
Our impaired loans are subject to measurement at fair value on a nonrecurring basis and are classified as Level 3 measurements. A loan is considered impaired when management determines that collection of contractual amounts due is not probable. In these cases, an allowance for credit losses may be established based either on the present value of expected future cash flows discounted at the receivables' effective interest rate, the fair value of the collateral for collateral-dependent receivables or the observable market price of the receivable. In determining collateral value, we estimate the current fair market value of the collateral less selling costs. We had impaired loans carried at the fair value of $251$417 million and $137$469 million as of SeptemberJune 30, 20172019 and December 31, 2016,2018, respectively.
B.Fair Values of Financial Instruments
| |
| B. | Fair Values of Financial Instruments |
In addition to the methods and assumptions we use to record the fair value of financial instruments as discussed in the Fair Value Measurements section above, we used the following methods and assumptions to estimate the fair value of our financial instruments.instruments:
Cash and cash equivalents – carrying amount approximated fair value.
Finance receivables, net – fair value was estimated by discounting the future cash flows using current rates representative of receivables with similar remaining maturities.
Restricted cash and cash equivalents – carrying amount approximated fair value.
Short-term borrowings – carrying amount approximated fair value.
Long-term debt – fair value for fixed and floating-rate debt was estimated based on quoted market prices.
Guarantees – fair value of guarantees is based on our estimate of the premium a market participant would require to issue the same guarantee in a stand-alone, arms-length transaction with an unrelated party. If quoted or observable market prices are not available, fair value is based upon internally developed models that utilize current market-based assumptions.
Please refer to the table below for the fair values of our financial instruments.
| | | (Millions of dollars) | September 30, 2017 | | December 31, 2016 | | June 30, 2019 | | December 31, 2018 | |
| | Carrying Amount | | Fair Value | | Carrying Amount | | Fair Value | | Fair Value Levels | | Reference | Carrying Amount | | Fair Value | | Carrying Amount | | Fair Value | | Fair Value Levels | | Reference |
| Cash and cash equivalents | $ | 710 |
| | $ | 710 |
| | $ | 1,795 |
| | $ | 1,795 |
| | 1 | | $ | 760 |
| | $ | 760 |
| | $ | 766 |
| | $ | 766 |
| | 1 | |
Restricted cash and cash equivalents(2) | | $ | 4 |
| | $ | 4 |
| | $ | 7 |
| | $ | 7 |
| | 1 | |
Finance receivables, net (excluding finance leases(1)) | $ | 19,797 |
| | $ | 19,787 |
| | $ | 20,101 |
| | $ | 19,949 |
| | 3 | | Note 3 | $ | 20,530 |
| | $ | 20,733 |
| | $ | 20,451 |
| | $ | 20,510 |
| | 3 | | Note 3 |
| Interest rate contracts: | | | | | | | | | | | | | | | | |
| In a net receivable position | $ | 3 |
| | $ | 3 |
| | $ | 4 |
| | $ | 4 |
| | 2 | | Note 4 | |
| In a net payable position | $ | (1 | ) | | $ | (1 | ) | | $ | (1 | ) | | $ | (1 | ) | | 2 | | Note 4 | |
| In a receivable position | | $ | 6 |
| | $ | 6 |
| | $ | 4 |
| | $ | 4 |
| | 2 | | Note 5 |
| In a payable position | | $ | (71 | ) | | $ | (71 | ) | | $ | (40 | ) | | $ | (40 | ) | | 2 | | Note 5 |
| Cross currency contracts: | | | | | | | | | | | | | | | | |
| In a receivable position | $ | 33 |
| | $ | 33 |
| | $ | 56 |
| | $ | 56 |
| | 2 | | Note 4 | $ | 67 |
| | $ | 67 |
| | $ | 93 |
| | $ | 93 |
| | 2 | | Note 5 |
| In a payable position | $ | (41 | ) | | $ | (41 | ) | | $ | (3 | ) | | $ | (3 | ) | | 2 | | Note 4 | $ | (19 | ) | | $ | (19 | ) | | $ | (11 | ) | | $ | (11 | ) | | 2 | | Note 5 |
| Foreign currency contracts: | | | | | | | | | |
| Foreign exchange contracts: | | | | | | | | | |
| In a receivable position | $ | 17 |
| | $ | 17 |
| | $ | 12 |
| | $ | 12 |
| | 2 | | Note 4 | $ | 11 |
| | $ | 11 |
| | $ | 15 |
| | $ | 15 |
| | 2 | | Note 5 |
| In a payable position | $ | (8 | ) | | $ | (8 | ) | | $ | (4 | ) | | $ | (4 | ) | | 2 | | Note 4 | $ | (18 | ) | | $ | (18 | ) | | $ | (12 | ) | | $ | (12 | ) | | 2 | | Note 5 |
Restricted cash and cash equivalents(2) | $ | 31 |
| | $ | 31 |
| | $ | 29 |
| | $ | 29 |
| | 1 | | |
| Short-term borrowings | $ | (5,459 | ) | | $ | (5,459 | ) | | $ | (7,094 | ) | | $ | (7,094 | ) | | 1 | | $ | (5,266 | ) | | $ | (5,266 | ) | | $ | (5,723 | ) | | $ | (5,723 | ) | | 1 | |
| Long-term debt | $ | (21,629 | ) | | $ | (21,854 | ) | | $ | (20,537 | ) | | $ | (20,724 | ) | | 2 | | $ | (23,342 | ) | | $ | (23,596 | ) | | $ | (22,815 | ) | | $ | (22,684 | ) | | 2 | |
| Guarantees | $ | — |
| | $ | — |
| | $ | (1 | ) | | $ | (1 | ) | | 3 | | Note 7 | $ | (1 | ) | | $ | (1 | ) | | $ | — |
| | $ | — |
| | 3 | | Note 8 |
| | | | | | | | | | | | | | | | | |
(1)AsRepresents finance leases and failed sale leasebacks of September$7.77 billion as of June 30, 20172019 and finance leases of$7.47 billion as of December 31, 2016, represents finance leases with a net carrying value of $6.80 billion and $6.11 billion, respectively.2018.
(2) Included in Other assets in the Consolidated Statements of Financial Position.
We are involved in unresolved legal actions that arise in the normal course of business. Although it is not possible to predict with certainty the outcome of our unresolved legal actions, we believe that these unresolved legal actions will neither individually nor in the aggregate have a material adverse effect on our consolidated results of operations, financial position or liquidity.
The Provisionprovision for income taxes reflects an estimated annual tax rate of 3029 percent in the thirdsecond quarter of 2017,2019, excluding the discrete item discussed in the following paragraph, compared with 3124 percent in the thirdsecond quarter of 2016.2018. The increase in the estimated annual tax rate is primarily due to changes in the geographic mix of profits.
The provision for income taxes in the second quarter of 2019 also included a $13 million charge for a valuation allowance against the deferred tax assets of a non-U.S. subsidiary.
ITEM 2. MANAGEMENT'S DISCUSSION AND ANALYSIS OF FINANCIAL CONDITION AND RESULTS OF OPERATIONS
OVERVIEW
We reported third-quarter 2017second-quarter 2019 revenues of $673$757 million, an increase of $22$34 million, or 35 percent, compared with the thirdsecond quarter of 2016. 2018. Second-quarter 2019 profit was $79 million, an $8 million, or 11 percent, increase from the second quarter of 2018.
The increase in revenues was primarily due to a $15$26 million favorable impact from higher average financing rates and a $14 million favorable impact from lending activity with Caterpillar,higher average earning assets, partially offset by a $6$10 million unfavorable impact from lower average earning assets.due to the termination of a committed credit facility with Caterpillar and the absence of the related fees.
ProfitSecond-quarter 2019 profit before income taxes was $126$141 million, fora $41 million, or 41 percent, increase from the thirdsecond quarter of 2017, compared with $146 million for the third quarter of 2016.2018. The decreaseincrease was primarily due to a $19$33 million increasedecrease in provision for credit losses and a $16$28 million increase in net yield on average earning assets. These favorable impacts were partially offset by a $14 million increase in general, operating and administrative expenses primarily dueand the $10 million unfavorable impact mentioned above related to higher incentive compensation. These unfavorable impacts were partially offset bythe termination of a $9 million favorable impact from lending activitycommitted credit facility with Caterpillar and an $8 million increase in net yield on average earning assets.Caterpillar.
The Provisionprovision for income taxes reflects an estimated annual tax rate of 3029 percent in the thirdsecond quarter of 2017,2019, excluding the discrete item discussed in the following paragraph, compared with 3124 percent in the thirdsecond quarter of 2016.2018. The increase in the estimated annual tax rate is primarily due to changes in the geographic mix of profits.
The provision for income taxes in the second quarter of 2019 also included a $13 million charge for a valuation allowance against the deferred tax assets of a non-U.S. subsidiary.
During the thirdsecond quarter of 2017,2019, retail new business volume was $2.78$3.35 billion, an increasea decrease of $83$210 million, or 36 percent, from the thirdsecond quarter of 2016.2018. The increasedecrease was primarily related todriven by lower volume in Asia/Pacific, North America and EAME, partially offset by higher volume in Asia/Pacific and Mining, partially offset by decreases in Latin America and Caterpillar Power Finance.Mining.
At the end of the thirdsecond quarter of 2017,2019, past dues were 2.733.38 percent, compared with 2.773.16 percent at the end of the thirdsecond quarter of 2016.2018. The increase in past dues was primarily driven by EAME. Write-offs, net of recoveries, were $47$74 million for the thirdsecond quarter of 2017,2019, compared with $29$80 million for the thirdsecond quarter of 2016. The increase in write-offs, net of recoveries, was primarily due to the Latin America and marine portfolios.2018. As of SeptemberJune 30, 2017,2019, the allowance for credit losses totaled $343$523 million, or 1.271.81 percent of our recorded investment in finance receivables, compared with $346$534 million, or 1.281.89 percent of our recorded investment in finance receivables at September 30, 2016.March 31, 2019. The allowance for credit losses at year-end 20162018 was $343$511 million, or 1.291.80 percent of our recorded investment in finance receivables.
THIRDSECOND QUARTER 20172019 COMPARED WITH THIRDSECOND QUARTER 20162018
Consolidated Total Revenues
The chart above graphically illustrates reasons for the change in Consolidated Total Revenues between thirdsecond quarter 20162018 (at left) and thirdsecond quarter 20172019 (at right). Items favorably impacting total revenues appear as upward stair steps with corresponding dollar amounts above each bar, while items negatively impacting total revenues appear as downward stair steps with dollar amounts reflected in parentheses above each bar. Management utilizes these charts internally to visually communicate results.
Retail revenue for the thirdsecond quarter of 20172019 was $309$350 million, an increase of $2$22 million from the same period in 20162018. The increase was due to an $8a $26 million favorable impact from higher interest rates on retail finance receivables, partially offset by a $6$4 million unfavorable impact from lower average earning assets. For the quarter ended SeptemberJune 30, 20172019, retail average earning assets were $23.05$22.87 billion, a decrease of $544$255 million from the same period in 20162018. The annualized average yield was 5.376.13 percent for the thirdsecond quarter of 20172019, compared with 5.205.66 percent for the thirdsecond quarter of 20162018.
Operating lease revenue for the thirdsecond quarter of 2017both 2019 and 2018 was $247$257 million. A $5 million favorable impact from property tax revenues on operating leases as a decreaseresult of $10 million from the same period in 2016. The decreasenew lease accounting guidance was due tooffset by a $12$4 million unfavorable impact from lower average earning assets partially offset byand a $2$1 million favorableunfavorable impact from higherlower average rental rates on operating leases.
Wholesale revenue for the thirdsecond quarter of 20172019 was $79$131 million, an increase of $17$26 million from the same period in 2016.2018. The increase was due to an $11$18 million favorable impact from higher average earning assets and an $8 million favorable impact from higher interest rates on wholesale finance receivables and a $6 million favorable impact from higher average earning assets.receivables. For the quarter ended SeptemberJune 30, 2017,2019, wholesale average earning assets were $3.94$5.76 billion, an increase of $366$839 million from the same period in 2016.2018. The annualized average yield was 8.079.13 percent for the thirdsecond quarter of 2017,2019, compared with 6.918.51 percent for the thirdsecond quarter of 2016.2018.
Other revenue, net items were as follows: | | (Millions of dollars) | Three Months Ended
September 30, | Three Months Ended
June 30, |
| | 2017 |
| 2016 | | $ Change | 2019 |
| 2018 | | $ Change |
Interest income on Notes Receivable from Caterpillar(1) | $ | 21 |
| | $ | 9 |
| | $ | 12 |
| |
Finance receivable and operating lease fees (including late charges)(2) | 21 |
|
| 19 |
| | 2 |
| |
| Finance receivable and operating lease fees (including late charges) | | $ | 15 |
| | $ | 19 |
| | $ | (4 | ) |
| Fees on committed credit facility extended to Caterpillar | 10 |
|
| 10 |
| | — |
| — |
| | 10 |
| | (10 | ) |
| Interest income on Notes Receivable from Caterpillar | | 8 |
| | 7 |
| | 1 |
|
| Net loss on returned or repossessed equipment | (20 | ) | | (16 | ) | | (4 | ) | (7 | ) | | (7 | ) | | — |
|
| Miscellaneous other revenue, net | 6 |
|
| 3 |
| | 3 |
| 3 |
| | 4 |
| | (1 | ) |
| Total Other revenue, net | $ | 38 |
|
| $ | 25 |
| | $ | 13 |
| $ | 19 |
|
| $ | 33 |
| | $ | (14 | ) |
| | | | | | | | | | | |
(1)For
There was a $15 million unfavorable impact from currency on revenues in the three months ended September 30, 2017second quarter of 2019. Currency represents the net translation impact resulting from changes in foreign currency exchange rates versus the U.S. dollar and 2016, includes $7 millionis included in all financial statement line items and $9 million, respectively,each of portfolio-related revenues.
(2)Portfolio-related revenues.the items included in the above analysis.
Consolidated Profit Before Income Taxes
(1) Analysis excludes $5 million in offsetting revenues and expenses for property taxes on operating leases.
The chart above graphically illustrates reasons for the change in Consolidated Profit Before Income Taxes between thirdsecond quarter 20162018 (at left) and thirdsecond quarter 20172019 (at right). Items favorably impacting profit before income taxes appear as upward stair steps with corresponding dollar amounts above each bar, while items negatively impacting profit before income taxes appear as downward stair steps with dollar amounts reflected in parentheses above each bar. Management utilizes these charts internally to visually communicate results.
Profit before income taxes was $126$141 million for the thirdsecond quarter of 2017,2019, compared with $146$100 million for the thirdsecond quarter of 2016.2018. The decreaseincrease was primarily due to a $19$33 million increasedecrease in provision for credit losses and a $16$28 million increase in net yield on average earning assets. These favorable impacts were partially offset by a $14 million increase in general, operating and administrative expenses primarilyand a $10 million unfavorable impact due to higher incentive compensation. These unfavorable impacts were partially offset bythe termination of a $9 million favorable impact from lending activitycommitted credit facility with Caterpillar and an $8the absence of the related fees.
There was a $7 million increaseunfavorable impact from currency on profit before income taxes in the second quarter of 2019. Currency represents the net yield on average earning assets.translation impact resulting from changes in foreign currency exchange rates versus the U.S. dollar and is included in all financial statement line items and each of the items included in the above analysis.
Provision for income taxesIncome Taxes
The Provisionprovision for income taxes reflects an estimated annual tax rate of 3029 percent in the thirdsecond quarter of 2017,2019, excluding the discrete item discussed in the following paragraph, compared with 3124 percent in the thirdsecond quarter of 2016.2018. The increase in the estimated annual tax rate is primarily due to changes in the geographic mix of profits.
UNAUDITEDThe provision for income taxes in the second quarter of 2019 also included a $13 million charge for a valuation allowance against the deferred tax assets of a non-U.S. subsidiary.
NINESIX MONTHS ENDED SEPTEMBERJUNE 30, 20172019 VS. NINESIX MONTHS ENDED SEPTEMBERJUNE 30, 20162018
Consolidated Total Revenues
The chart above graphically illustrates reasons for the change in Consolidated Total Revenues between SeptemberJune YTD 20162018 (at left) and SeptemberJune YTD 20172019 (at right). Items favorably impacting total revenues appear as upward stair steps with corresponding dollar amounts above each bar, while items negatively impacting total revenues appear as downward stair steps with dollar amounts reflected in parentheses above each bar. Management utilizes these charts internally to visually communicate results.
Retail revenue for the first ninesix months of 20172019 was $924$685 million, an increase of $10$40 million from the same period in 2016.2018. The increase was due to a $29$47 million favorable impact from higher interest rates on retail finance receivables, partially offset by a $19 million unfavorable impact from lower average earning assets. For the nine months ended September 30, 2017, retail average earning assets were $23.09 billion, a decrease of $493 million from the same period in 2016. The annualized average yield was 5.34 percent for the first nine months of 2017, compared with 5.17 percent for the same period in 2016.
Operating lease revenue for the first nine months of 2017 was $737 million, a decrease of $19 million from the same period in 2016. The decrease was due to a $16 million unfavorable impact from lower average earning assets and a $3 million unfavorable impact from lower average rental rates on operating leases.
Wholesale revenue for the first nine months of 2017 was $222 million, an increase of $20 million from the same period in 2016. The increase was due to a $27 million favorable impact from higher interest rates on wholesale finance receivables, partially offset by a $7 million unfavorable impact from lower average earning assets. For the ninesix months ended SeptemberJune 30, 2017, wholesale2019, retail average earning assets were $3.70$22.93 billion, a decrease of $135$239 million from the same period in 2016.2018. The annualized average yield was 8.015.98 percent for the first ninesix months of 2017,2019, compared with 7.005.57 percent for the same period in 2016.2018.
Operating lease revenue for the first six months of 2019 was $515 million, an increase of $14 million from the same period in 2018. The increase was due to a $10 million favorable impact from property tax revenues on operating leases as a result of the new lease accounting guidance and a $9 million favorable impact from higher average rental rates on operating leases, partially offset by a $5 million unfavorable impact from lower average earning assets.
Wholesale revenue for the first six months of 2019 was $250 million, an increase of $54 million from the same period in 2018. The increase was due to a $42 million favorable impact from higher average earning assets and a $12 million favorable impact from higher interest rates on wholesale finance receivables. For the six months ended June 30, 2019, wholesale average earning assets were $5.60 billion, an increase of $978 million from the same period in 2018. The annualized average yield was 8.94 percent for the first six months of 2019, compared with 8.49 percent for the same period in 2018.
Other revenue, net items were as follows: | | (Millions of dollars) | Nine Months Ended
September 30, | Six Months Ended
June 30, |
| | 2017 | | 2016 | | $ Change | 2019 | | 2018 | | $ Change |
Interest income on Notes Receivable from Caterpillar(1) | $ | 59 |
| | $ | 23 |
| | $ | 36 |
| |
Finance receivable and operating lease fees (including late charges)(2) | 57 |
| | 55 |
| | 2 |
| |
| Finance receivable and operating lease fees (including late charges) | | $ | 30 |
| | $ | 37 |
| | $ | (7 | ) |
| Fees on committed credit facility extended to Caterpillar | 30 |
| | 30 |
| | — |
| 5 |
| | 20 |
| | (15 | ) |
| Interest income on Notes Receivable from Caterpillar | | 15 |
| | 14 |
| | 1 |
|
| Net loss on returned or repossessed equipment | (30 | ) | | (36 | ) | | 6 |
| (15 | ) | | (7 | ) | | (8 | ) |
| Miscellaneous other revenue, net | 12 |
| | 9 |
| | 3 |
| 8 |
| | 7 |
| | 1 |
|
| Total Other revenue, net | $ | 128 |
| | $ | 81 |
| | $ | 47 |
| $ | 43 |
| | $ | 71 |
| | $ | (28 | ) |
| | | | | | | | | | | |
(1)For
There was a $31 million unfavorable impact from currency on revenues in the ninefirst six months ended September 30, 2017of 2019. Currency represents the net translation impact resulting from changes in foreign currency exchange rates versus the U.S. dollar and 2016, includes $20 millionis included in all financial statement line items and $23 million, respectively,each of portfolio-related revenues.
(2)Portfolio-related revenues.the items included in the above analysis.
Consolidated Profit Before Income Taxes
(1) Analysis excludes $10 million in offsetting revenues and expenses for property taxes on operating leases.
The chart above graphically illustrates reasons for the change in Consolidated Profit Before Income Taxes between SeptemberJune YTD 20162018 (at left) and SeptemberJune YTD 20172019 (at right). Items favorably impacting profit before income taxes appear as upward stair steps with corresponding dollar amounts above each bar, while items negatively impacting profit before income taxes appear as downward stair steps with dollar amounts reflected in parentheses above each bar. Management utilizes these charts internally to visually communicate results.
Profit before income taxes was $457$283 million for the first ninesix months of 2017,2019, compared with $439$224 million for the same period in 2016.2018. The increase was primarily due to a $26$47 million favorable impact from lending activity with Caterpillar,decrease in provision for credit losses and a $17$42 million increase in net yield on average earning assets and a $14 million decrease in provision for credit losses.assets. These favorable impacts were partially offset by a $27$23 million increase in general, operating and administrative expenses primarilyand a $15 million unfavorable impact due to higher incentive compensationthe termination of a committed credit facility with Caterpillar and an $18the absence of the related fees.
There was a $12 million unfavorable impact from lower average earning assets.currency on profit before income taxes in the first six months of 2019. Currency represents the net translation impact resulting from changes in foreign currency exchange rates versus the U.S. dollar and is included in all financial statement line items and each of the items included in the above analysis.
Provision for income taxesIncome Taxes
The Provisionprovision for income taxes reflects an estimated annual tax rate of 3029 percent for the ninefirst six months ended September 30, 2017,of 2019, excluding the discrete item discussed in the following paragraph, compared with 3124 percent for the nine months ended September 30, 2016.same period in 2018. The increase in the estimated annual tax rate is primarily due to changes in the geographic mix of profits.
The provision for income taxes for the first six months of 2019 also included a $13 million charge for a valuation allowance against the deferred tax assets of a non-U.S. subsidiary.
Finance Receivables and Equipment on Operating Leases
New Business Volume
| | | (Millions of dollars) | Nine Months Ended
September 30, | Six Months Ended
June 30, |
| | 2017 | | 2016 | | $ Change | 2019 | | 2018 | | $ Change |
| New retail financing | $ | 6,785 |
| | $ | 6,771 |
| | $ | 14 |
| $ | 4,967 |
| | $ | 5,269 |
| | $ | (302 | ) |
| New operating lease activity | 1,029 |
| | 1,295 |
| | (266 | ) | 730 |
| | 828 |
| | (98 | ) |
| New wholesale financing | 26,349 |
| | 23,194 |
| | 3,155 |
| 23,566 |
| | 21,935 |
| | 1,631 |
|
| Total | $ | 34,163 |
| | $ | 31,260 |
| | $ | 2,903 |
| $ | 29,263 |
| | $ | 28,032 |
| | $ | 1,231 |
|
| | | | | | | | | | | |
New retail financing increaseddecreased primarily due to higherlower volume in Asia/Pacific, North America and EAME, partially offset by lowerhigher volume across all other regions.in Mining. New operating lease activity (which is substantially related to retail) decreased primarily due to lower rentals of CatCaterpillar equipment in North America, Europe and Asia/Pacific.America. New wholesale financing increased primarily due to higher purchases of trade receivables from Caterpillar.
Total Managed Portfolio
We define total portfolio as finance receivables, net plus equipment on operating leases, less accumulated depreciation.net. We also manage and service receivables and leases that have been sold by us to third parties with limited or no recourse in order to mitigate our concentration of credit risk with certain customers. These assets are not available to pay our creditors. Total managed portfolio was as follows:
| | (Millions of dollars) | September 30,
2017 | | December 31,
2016 | | $ Change | June 30,
2019 | | December 31,
2018 | | $ Change |
| Finance receivables, net | $ | 26,597 |
| | $ | 26,212 |
| | $ | 385 |
| $ | 28,297 |
| | $ | 27,923 |
| | $ | 374 |
|
| Equipment on operating leases, less accumulated depreciation | 3,580 |
| | 3,708 |
| | (128 | ) | |
| Equipment on operating leases, net | | 3,575 |
| | 3,562 |
| | 13 |
|
| Total portfolio | $ | 30,177 |
| | $ | 29,920 |
| | $ | 257 |
| $ | 31,872 |
| | $ | 31,485 |
| | $ | 387 |
|
| | | | | | | | | | | |
| Retail finance leases | $ | 91 |
| | $ | 41 |
| | $ | 50 |
| |
| Retail installment sale contracts | 75 |
| | 79 |
| | (4 | ) | |
| Retail notes receivable | 58 |
| | 87 |
| | (29 | ) | |
| Retail loans, net | | $ | 163 |
| | $ | 130 |
| | $ | 33 |
|
| Retail leases, net | | 90 |
| | 100 |
| | (10 | ) |
| Operating leases | 43 |
| | 79 |
| | (36 | ) | 20 |
| | 25 |
| | (5 | ) |
| Total off-balance sheet managed assets | $ | 267 |
| | $ | 286 |
| | $ | (19 | ) | $ | 273 |
| | $ | 255 |
| | $ | 18 |
|
| | | | | | | | | | | |
| Total managed portfolio | $ | 30,444 |
| | $ | 30,206 |
| | $ | 238 |
| $ | 32,145 |
| | $ | 31,740 |
| | $ | 405 |
|
| | | | | | | | | | | |
Total Portfolio Metrics
At the end of the thirdsecond quarter of 2017,2019, past dues were 2.733.38 percent, compared with 2.773.16 percent at the end of the thirdsecond quarter of 2016.2018. The increase in past dues was primarily driven by EAME. Total non-performing finance receivables, which represent finance receivables currently on non-accrual status, were $692$858 million and $580$885 million at SeptemberJune 30, 20172019 and December 31, 2016,2018, respectively. Total non-performing finance receivables as a percentage of our recorded investment in finance receivables were 2.572.98 percent and 2.183.11 percent at SeptemberJune 30, 20172019 and December 31, 2016,2018, respectively.
Our allowance for credit losses as of SeptemberJune 30, 20172019 was $343$523 million or 1.271.81 percent of our recorded investment in finance receivables compared with $343$511 million or 1.291.80 percent as of December 31, 2016.2018. The allowance is subject to an ongoing evaluation based on many quantitative and qualitative factors, including past loss experience, known and inherent risks in the portfolio, adverse situations that may affect the borrower’s ability to repay, estimated value of underlying collateral and current economic conditions. We believe our allowance is sufficient to provide for losses inherent in our existing finance receivable portfolio as of SeptemberJune 30, 2017.2019.
CAPITAL RESOURCES AND LIQUIDITY
Capital resources and liquidity provide us with the ability to meet our financial obligations on a timely basis. Maintaining and managing adequate capital and liquidity resources includes management of funding sources and their utilization based on current, future and contingent needs. Throughout the thirdsecond quarter of 2017,2019, we experienced favorable liquidity conditions. We ended the thirdsecond quarter of 20172019 with $710$760 million of cash, a decrease of $1.09 billion$6 million from year-end 2016.2018. Our cash balances are held in numerous locations throughout the world with approximately $385$337 million held by our non-U.S. subsidiaries. Amounts held by non-U.S. subsidiaries are available for general corporate use and could be used in the U.S. without incurring significant additional U.S. taxes. We expect to meet our U.S. funding needs without repatriating undistributed profits that are indefinitely reinvested outside the U.S.
BORROWINGS
Borrowings consist primarily of medium-term notes and commercial paper, the combination of which is used to manage interest rate risk and funding requirements.
We receive debt ratings from the major credit rating agencies. In December 2016, Moody's Investors Service downgraded our long-term ratings to A3 from A2,Moody’s long- and short-term ratings toof our debt is A3 and Prime-2, from Prime-1. The Moody’s downgrade didwhile Fitch and S&P maintain a “mid-A” debt rating. This split rating has not havehad a material impact on our borrowing costs or our overall financial health. A furtherHowever, a downgrade of our credit ratings by Moody's or oneany of the other major credit rating agencies would result in increased borrowing costs and could make access to certain credit markets more difficult. However, our long-term ratings with Fitch and S&P continue to be "mid-A". In the event economic conditions deteriorate such that access to debt markets becomes unavailable, we would rely on cash flows from our existing portfolio, existing cash balances, access to our revolving credit facilities and our other credit line facilities and potential borrowings from Caterpillar. In addition, Caterpillar maintains a support agreement with us, which requires Caterpillar to remain as our sole owner and may, under certain circumstances, require Caterpillar to make payments to us should we fail to maintain certain financial ratios.
Total borrowings outstanding as of SeptemberJune 30, 20172019 were $28.58$29.92 billion, a decrease of $687$141 million over December 31, 2016.2018. Outstanding borrowings were as follows:
| | (Millions of dollars)
| September 30,
2017 | | December 31,
2016 | June 30,
2019 | | December 31,
2018 |
| Medium-term notes, net of unamortized discount and debt issuance costs | $ | 20,828 |
| | $ | 19,667 |
| $ | 22,672 |
| | $ | 22,169 |
|
| Commercial paper, net of unamortized discount | 4,227 |
| | 5,985 |
| 4,434 |
| | 4,759 |
|
| Bank borrowings – long-term | 801 |
| | 870 |
| 670 |
| | 646 |
|
| Bank borrowings – short-term | 755 |
| | 553 |
| 434 |
| | 526 |
|
| Variable denomination floating rate demand notes | 477 |
| | 556 |
| 398 |
| | 438 |
|
| Notes payable to Caterpillar | 1,493 |
| | 1,637 |
| 1,307 |
| | 1,518 |
|
| Total outstanding borrowings | $ | 28,581 |
| | $ | 29,268 |
| $ | 29,915 |
| | $ | 30,056 |
|
| | | | | | | |
Medium-term notes
We issue medium-term unsecured notes through securities dealers or underwriters in the U.S., Canada, Europe, Australia, Japan, Hong Kong, China, Argentina and MexicoChina to both retail and institutional investors. These notes are offered in several currencies and with a variety of maturities. These notes are senior unsecured obligations of the Company. Medium-term notes issued totaled $5.77$4.11 billion and redeemed totaled $4.84$3.63 billion for the ninesix months ended SeptemberJune 30, 2017.2019. Medium-term notes outstanding as of SeptemberJune 30, 2017,2019, mature as follows:
| | | (Millions of dollars) | | |
| 2017 | $ | 1,045 |
| |
| 2018 | 5,884 |
| |
| 2019 | 4,534 |
| $ | 1,956 |
|
| 2020 | 4,186 |
| 7,473 |
|
| 2021 | 1,640 |
| 6,259 |
|
| 2022 | | 2,840 |
|
| 2023 | | 2,152 |
|
| Thereafter | 3,539 |
| 1,992 |
|
| Total | $ | 20,828 |
| $ | 22,672 |
|
| | |
| |
|
Commercial paper
We issue unsecured commercial paper in the U.S., Europe and other international capital markets. These short-term promissory notes are issued on a discounted basis and are payable at maturity.
Revolving credit facilities
We have three global credit facilities with a syndicate of banks totaling $10.50 billion (Credit Facility) available in the aggregate to both Caterpillar and us for general liquidity purposes. Based on management's allocation decision, which can be revised from time to time, the portion of the Credit Facility available to us as of SeptemberJune 30, 20172019 was $7.75 billion. Information on our Credit Facility is as follows:
In September 2017, we entered into a new 364-day facility. The 364-day facility of $3.15 billion (of which $2.33 billion is available to us) expires in September 2018.2019.
In September 2017, we amended and extended the three-year facility. The three-year facility, as amended in September 2018, of $2.73 billion (of which $2.01 billion is available to us) now expires in September 2020.2021.
In September 2017, we amended and extended the five-year facility. The five-year facility, as amended in September 2018, of $4.62 billion (of which $3.41 billion is available to us) now expires in September 2022.2023.
At SeptemberJune 30, 2017,2019, Caterpillar’s consolidated net worth was $15.69$14.86 billion, which was above the $9.00 billion required under the Credit Facility. The consolidated net worth is defined in the Credit Facility as the consolidated shareholders' equity including preferred stock but excluding the pension and other postretirement benefits balance within Accumulated other comprehensive income/(loss).
At SeptemberJune 30, 2017,2019, our covenant interest coverage ratio was 1.881.60 to 1. This is above the 1.15 to 1 minimum ratio, calculated as (1) profit excluding income taxes, interest expense and net gain/(loss) from interest rate derivatives to (2) interest expense, calculated at the end of each calendar quarter for the rolling four quarter period then most recently ended, required by the Credit Facility.
In addition, at SeptemberJune 30, 2017,2019, our six-month covenant leverage ratio was 7.208.23 to 1. This is below the maximum ratio of debt to net worth of 10 to 1, calculated (1) on a monthly basis as the average of the leverage ratios determined on the last day of each of the six preceding calendar months and (2) at each December 31, required by the Credit Facility.
In the event that either Caterpillar or we do not meet one or more of our respective financial covenants under the Credit Facility in the future (and are unable to obtain a consent or waiver), the syndicate of banks may terminate the commitments allocated to the party that does not meet its covenants. Additionally, in such event, certain of our other lenders under other loan agreements where similar financial covenants or cross default provisions are applicable, may, at their election, choose to pursue remedies under those loan agreements, including accelerating the repayment of outstanding borrowings. At SeptemberJune 30, 2017,2019, there were no borrowings under the Credit Facility.
Bank borrowings
Available credit lines with banks as of SeptemberJune 30, 20172019 totaled $4.59$4.84 billion. These committed and uncommitted credit lines, which may be eligible for renewal at various future dates or have no specified expiration date, are used primarily by our non-U.S. subsidiaries for local funding requirements. As of SeptemberJune 30, 2017,2019, we had $1.56$1.10 billion outstanding against these credit lines and were in compliance with all debt covenants under these credit lines. The remaining available credit commitments may be withdrawn any time at the lenders' discretion.
Variable denomination floating rate demand notes
We obtain funding from the sale of variable denomination floating rate demand notes, which may be redeemed at any time at the option of the holder without any material restriction. We do not hold reserves to fund the payment of the demand notes. The notes are offered on a continuous basis. As of SeptemberJune 30, 2017,2019, there was $477$398 million of variable denomination floating rate demand notes outstanding. The maximum amount of variable denomination floating rate demand notes that we may have outstanding at any time may not exceed $1.25 billion.
Notes receivable from/payable to Caterpillar
Under our variable amount and term lending agreements and other notes receivable with Caterpillar, we may borrow up to $2.77$2.79 billion from Caterpillar and Caterpillar may borrow up to $2.64$2.05 billion from us. The variable amount lending agreements are in effect for indefinite periods of time and may be changed or terminated by either party with 30 days notice. The term lending agreements have remaining maturities ranging up to nine years. We had notes payable of $1.49$1.31 billion and notes receivable of $1.58 billion$640 million outstanding under these agreements as of SeptemberJune 30, 2017.
2019.
Committed credit facility
We extended a $2 billion committed credit facility to Caterpillar, which expires in February 2019. We receive a fee from Caterpillar based on amounts drawn under the credit facility and a commitment fee for the undrawn amounts under the credit facility. At September 30, 2017, there were no borrowings under this credit facility.
OFF-BALANCE SHEET ARRANGEMENTS
We lease all of our facilities. In addition, we have potential payment exposure for guarantees issued to third parties totaling $87$99 million as of SeptemberJune 30, 2017.2019.
CASH FLOWS
Operating cash flow was $919$907 million in the first ninesix months of 2017,2019, compared with $1.10 billion$509 million for the same period in 2018. The increase is primarily due to an overpayment received on a year ago.foreign currency exchange settlement. The overpayment received on the last day of June was returned the first week of July. The cash was reflected as Payable to dealers and others as of June 30, 2019. Net cash used for investing activities was $924$710 million for the first ninesix months of 2017,2019, compared with $776 million$1.70 billion for the same period in 2016.2018. The changedecrease was primarily due to the impact of intercompanyCaterpillar purchased receivables partially offset byand higher proceeds from disposalcollections of equipment and lower capital expenditures for equipment on operating leases.finance receivables. Net cash used for financing activities was $1.10 billion$204 million for the first ninesix months of 2017,2019, compared with $302 millioncash provided by financing activities of $1.22 billion for the same period in 2016.2018. The change was primarily due to the impactlower portfolio funding requirements.
RECENT ACCOUNTING PRONOUNCEMENTS
For a discussion of borrowings with Caterpillar.recent accounting pronouncements, see Part I, Item 1. Note 2 - New Accounting Pronouncements.
CRITICAL ACCOUNTING POLICIES
CAUTIONARY STATEMENT REGARDING FORWARD-LOOKING STATEMENTS
Certain statements contained in this Quarterly Report on Form 10-Q may be considered "forward-looking statements" as that term is defined inrelate to future events and expectations and are forward-looking statements within the meaning of the Private Securities Litigation Reform Act of 1995. These statements may relate to future events or our future financial performance, which may involve known and unknown risks and uncertainties and other factors that may cause our actual results, levels of activity, performance or achievement to be materially different from those expressed or implied by any forward-looking statements. From time to time, we may also provide forward-looking statements in oral presentations to the public or in other materials we issue to the public. Forward-looking statements give current expectations or forecasts of future events about the company. You may identify these statements by the fact that they do not relate to historical or current facts and may use wordsWords such as "believes," "expects," "estimates," "anticipates," "will," "should," "plan," "project," "intend," "could" and“believe,” “estimate,” “will be,” “will,” “would,” “expect,” “anticipate,” “plan,” “project,” “intend,” “could,” “should” or other similar words or phrases.expressions often identify forward-looking statements. All statements other than statements of historical fact are forward-looking statements, including, without limitation, statements regarding our outlook, projections, forecasts or trend descriptions. These statements do not guarantee future performance and speak only as of the date they are only predictions. Actual events ormade, and we do not undertake to update our forward-looking statements.
Cat Financial’s actual results may differ materially due tofrom those described or implied in our forward-looking statements based on a number of factors, that affect international businesses, including, changes inbut not limited to: (i) government monetary or fiscal policies; (ii) political and economic conditions, disruptionsrisks, commercial instability and events beyond our control in the countries in which we operate; (iii) demand for Caterpillar products; (iv) our ability to develop, produce and market quality products that meet our customers’ needs; (v) information technology security threats and computer crime; (vi) disruptions or volatility in global financial and credit markets and changes in laws, regulations and political stability, as well as factors specific to Cat Financial andlimiting our sources of liquidity or the markets we serve, including the market’s acceptance of our products and services, the creditworthinessliquidity of our customers, dealers and suppliers; (vii) failure to maintain our credit ratings and potential resulting increases to our cost of borrowing and adverse effects on our cost of funds, liquidity, competitive position and access to capital markets; (viii) changes in interest raterates, currency fluctuations or market liquidity conditions; (ix) an increase in delinquencies, repossessions or net losses of our customers; (x) our compliance with financial and currency rate fluctuationsother restrictive covenants in debt agreements; (xi) alleged or actual violations of trade or anti-corruption laws and estimatedregulations; (xii) additional tax expense or exposure; (xiii) new regulations or changes in financial services regulations; (xiv) residual values of leased equipment. These riskequipment; (xv) marketing, operational or administrative support received from Caterpillar; (xvi) changes in accounting guidance; and (xvii) other factors may not be exhaustive. We operatedescribed in a continually changing business environmentmore detail in Cat Financial’s Forms 10-Q, 10-K and new risk factors emerge from time to time. We cannot predict these new risk factors, nor can we assess the impact, if any, of these new risk factors on our businesses or the extent to which any factor, or combination of factors, may cause actual results to differ materially from those projected in any forward-looking statements. Accordingly, forward-looking statements should not be relied upon as a prediction of actual results. Moreover, we do not assume responsibility for the accuracy and completeness of those statements. All of the forward-looking statements are qualified in their entirety by reference to the factors discussed under the captions "Risk Factors" and "Management's Discussion and Analysis of Financial Condition and Results of Operations" in our annual report on Form 10-K filedother filings with the Securities and Exchange Commission (SEC) on February 15, 2017 for the fiscal year ended December 31, 2016, as supplemented in our Form 10-Q filings with the SEC on May 3, 2017 and August 2, 2017 and in this Form 10-Q filing. We undertake no obligation to publicly update forward-looking statements, whether as a result of new information, future events or otherwise.Commission.
ITEM 4. CONTROLS AND PROCEDURES
Evaluation of disclosure controlsDisclosure Controls and proceduresProcedures
An evaluation was performed under the supervision and with the participation of our management, including our Chief Executive Officer (CEO) and our Chief Financial Officer (CFO), of the effectiveness of the design and operation of our disclosure controls and procedures, as such term is defined underin Rule 13a-15(e) ofunder the Securities Exchange Act of 1934, as amended, as of the end of the period covered by this quarterly report. Based on that evaluation, our CEO and CFO concluded that our disclosure controls and procedures were effective as of the end of the period covered by this quarterly report.
Changes in internal controlInternal Control over financial reportingFinancial Reporting
There have been no changes in the Company's internal control over financial reporting during the thirdsecond quarter of 20172019 that materially affected, or are reasonably likely to materially affect, the Company's internal control over financial reporting.
PART II. OTHER INFORMATION
ITEM 1. LEGAL PROCEEDINGS
We are involved in unresolved legal actions that arise in the normal course of business. Although it is not possible to predict with certainty the outcome of our unresolved legal actions, we believe that these unresolved legal actions will neither individually nor in the aggregate have a material adverse effect on our consolidated results of operations, financial position or liquidity.
ITEM 1A. RISK FACTORS
ITEM 4. MINE SAFETY DISCLOSURES
Not applicable.
ITEM 5. OTHER INFORMATION
None.
ITEM 6. EXHIBITS
|
| |
Exhibit No. | Description of Exhibit |
| | |
10.1 | Credit Agreement (364-Day Facility), dated as of September 7, 2017, among the Company, Caterpillar Inc., Caterpillar International Finance Designated Activity Company and Caterpillar Finance Kabushiki Kaisha, certain financial institutions named therein, Citibank, N.A., as Agent, Citibank Europe PLC, UK Branch, as Local Currency Agent, and The Bank of Tokyo-Mitsubishi UFJ, Ltd., as Japan Local Currency Agent (incorporated by reference from Exhibit 99.1 to the Company’s Current Report on Form 8-K filed September 12, 2017) |
10.2 | |
10.3 | |
10.4 | Omnibus Amendment No. 2 to Amended and Restated Credit Agreement (3-Year Facility) and Amendment No. 2 to Japan Local Currency Addendum, dated as of September 8, 2017, among the Company, Caterpillar Inc., Caterpillar International Finance Designated Activity Company and Caterpillar Finance Kabushiki Kaisha, certain financial institutions named therein, Citibank, N.A., as Agent, Citibank Europe PLC, UK Branch, as Local Currency Agent, and The Bank of Tokyo-Mitsubishi UFJ, Ltd., as Japan Local Currency Agent (incorporated by reference from Exhibit 99.4 to the Company’s Current Report on Form 8-K filed September 12, 2017) |
10.5 | Omnibus Amendment No. 2 to Amended and Restated Credit Agreement (5-Year Facility) and Amendment No. 2 to Japan Local Currency Addendum, dated as of September 8, 2017, among the Company, Caterpillar Inc., Caterpillar International Finance Designated Activity Company and Caterpillar Finance Kabushiki Kaisha, certain financial institutions named therein, Citibank, N.A., as Agent, Citibank Europe PLC, UK Branch, as Local Currency Agent, and The Bank of Tokyo-Mitsubishi UFJ, Ltd., as Japan Local Currency Agent (incorporated by reference from Exhibit 99.5 to the Company’s Current Report on Form 8-K filed September 12, 2017) |
12 | |
| 31.1 | |
| 31.2 | |
| 32 | |
| 101.INS | XBRL Instance Document |
| 101.SCH | XBRL Taxonomy Extension Schema Document |
| 101.CAL | XBRL Taxonomy Extension Calculation Linkbase Document |
| 101.DEF | XBRL Taxonomy Extension Definition Linkbase Document |
| 101.LAB | XBRL Taxonomy Extension Label Linkbase Document |
| 101.PRE | XBRL Taxonomy Extension Presentation Linkbase Document |
Signatures
Pursuant to the requirements of the Securities Exchange Act of 1934, the Registrant has duly caused this report to be signed on its behalf by the undersigned, thereunto duly authorized.
|
| | | |
| | | Caterpillar Financial Services Corporation |
(Registrant) | | |
| Date: | NovemberAugust 1, 20172019 | /s/David T. Walton |
| | | David T. Walton, President, Director and Chief Executive Officer |
|
| | | |
| Date: | NovemberAugust 1, 20172019 | /s/James A. DuensingPatrick T. McCartan |
| | | James A. Duensing,Patrick T. McCartan, Executive Vice President and Chief
Financial Officer |
|
| | | |
| Date: | NovemberAugust 1, 20172019 | /s/Leslie S. ZmuggMichael G. Sposato |
| | | Leslie S. Zmugg,Michael G. Sposato, Secretary |
|
| | | |
| Date: | NovemberAugust 1, 20172019 | /s/Jeffry D. Everett |
| | | Jeffry D. Everett, Controller |