UNITED STATES
SECURITIES AND EXCHANGE COMMISSION
Washington, D.C. 2054920549Form
FORM 10-Q
☒ QUARTERLY REPORT PURSUANT TO SECTION 13 OR 15(d) OF THE SECURITIES EXCHANGE ACT OF 1934
For the quarterly period ended March 31,September 30, 2022
Commission File No. 001-11241
CATERPILLAR FINANCIAL SERVICES CORPORATION
(Exact name of Registrant as specified in its charter)
| | | | | | | | |
| Delaware | 37-1105865 |
| (State of incorporation) | (IRS Employer I.D. No.) |
| |
| 2120 West End Ave., Nashville, Tennessee | 37203-0001 |
| (Address of principal executive offices) | (Zip Code) |
Registrant’s telephone number, including area code: (615) 341-1000
| | | | | | | | | | | | | | |
| Securities registered pursuant to Section 12(b) of the Act: |
| | Title of each class | Trading Symbol(s) | | Name of each exchange on which registered |
| | Medium-Term Notes, Series H,
3.300% Notes Due 2024 | CAT/24 | | New York Stock Exchange
|
Indicate by check mark whether the registrant (1) has filed all reports required to be filed by Section 13 or 15(d) of the Securities Exchange Act of 1934 during the preceding 12 months (or for such shorter period that the registrant was required to file such reports), and (2) has been subject to such filing requirements for the past 90 days. Yes ☒ No ☐
Indicate by check mark whether the registrant has submitted electronically every Interactive Data File required to be submitted pursuant to Rule 405 of Regulation S-T (§232.405 of this chapter) during the preceding 12 months (or for such shorter period that the registrant was required to submit such files). Yes ☒ No ☐
Indicate by check mark whether the registrant is a large accelerated filer, an accelerated filer, a non-accelerated filer, smaller reporting company, or an emerging growth company. See the definitions of “large accelerated filer,” “accelerated filer,” “smaller reporting company,” and “emerging growth company” in Rule 12b-2 of the Exchange Act.
| | | | | | | | | | | | | | |
| Large accelerated filer | ☐ | | Accelerated filer | ☐ |
| Non-accelerated filer | ☒ | | Smaller reporting company | ☐ |
| | | Emerging growth company | ☐ |
If an emerging growth company, indicate by check mark if the registrant has elected not to use the extended transition period for complying with any new or revised financial accounting standards provided pursuant to Section 13(a) of the Exchange Act. ☐
Indicate by check mark whether the registrant is a shell company (as defined in Rule 12b-2 of the Exchange Act).
Yes ☐ No ☒
As of May 4,November 2, 2022, 1one share of common stock of the registrant was outstanding, which is owned by Caterpillar Inc.
The registrant is a wholly owned subsidiary of Caterpillar Inc. and meets the conditions set forth in General Instruction (H)(1)(a) and (b) of Form 10-Q, and is therefore filing this form with the reduced disclosure format.
Table of Contents
| | | | | | | | |
| Part I. Financial Information | | |
| Item 1. | | 3 |
| Item 2. | | 2427 |
| Item 3. | Quantitative and Qualitative Disclosures About Market Risk | * |
| Item 4. | | 3136 |
| | |
| Part II. Other Information | | |
| Item 1. | | 3136 |
| Item 1A. | | 3136 |
| Item 2. | Unregistered Sales of Equity Securities and Use of Proceeds | * |
| Item 3. | Defaults Upon Senior Securities | * |
| Item 4. | Mine Safety Disclosures | * |
| Item 5. | | 31* |
| Item 6. | | 3237 |
| * Item omitted because no answer is called for or item is not applicable. |
* Item omitted because no answer is called for or item is not applicable.
PART I. FINANCIAL INFORMATION
ITEM 1. CONSOLIDATED FINANCIAL STATEMENTS (Unaudited)
In addition to the accompanying unaudited consolidated financial statements for Caterpillar Financial Services Corporation (together with its subsidiaries, “Cat Financial,” “the Company,” “we,” “us” or “our”), we suggest that you read our 2021 Annual Report on Form 10-K filed with the Securities and Exchange Commission (SEC) on February 16, 2022. The Company files electronically with the SEC required reports on Form 8-K, Form 10-Q, Form 10-K; registration statements on Form S-3; and other forms or reports as required. The SEC maintains a website (www.sec.gov) that contains reports, proxy and information statements, and other information regarding issuers that file electronically with the SEC. Copies of our annual reports on Form 10-K, quarterly reports on Form 10-Q, current reports on Form 8-K and any amendments to these reports filed or furnished with the SEC are available free of charge through Caterpillar’s website (www.caterpillar.com/secfilings) as soon as reasonably practicable after filing with the SEC. In addition, the public may obtain more detailed information about our parent company, Caterpillar, by visiting its website (www.caterpillar.com). None of the information contained at any time on our website or Caterpillar’s website is incorporated by reference into this document.
Caterpillar Financial Services Corporation
CONSOLIDATED STATEMENTS OF PROFIT
(Unaudited)
(Dollars in Millions)
| | | Three Months Ended
March 31, | | | Three Months Ended
September 30, | | Nine Months Ended
September 30, |
| | | 2022 | | 2021 | | | 2022 | | 2021 | | 2022 | | 2021 |
| | | | | | | | | | | | | |
| Revenues: | Revenues: | | | Revenues: | |
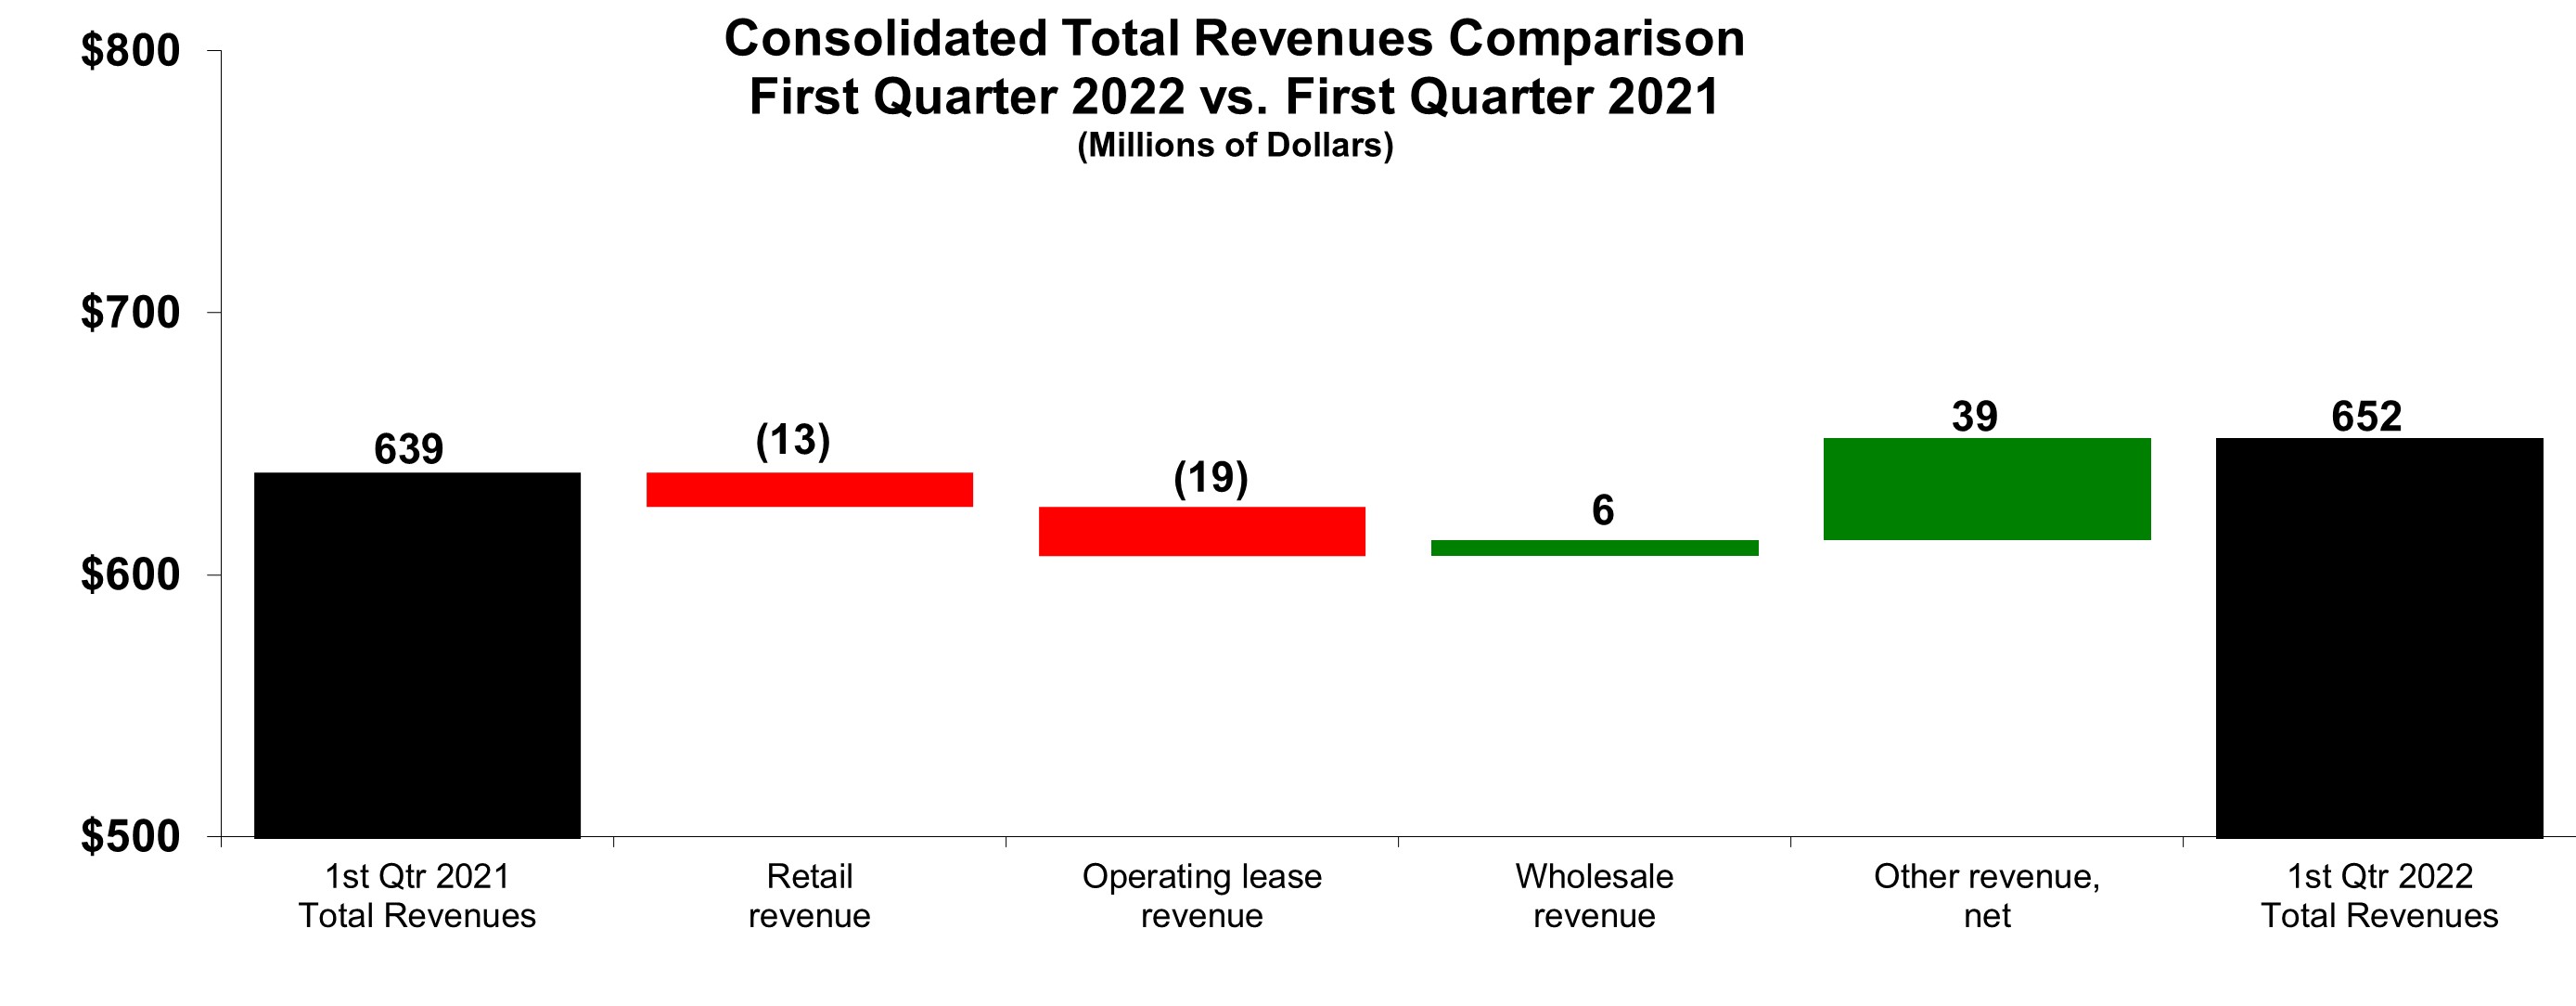
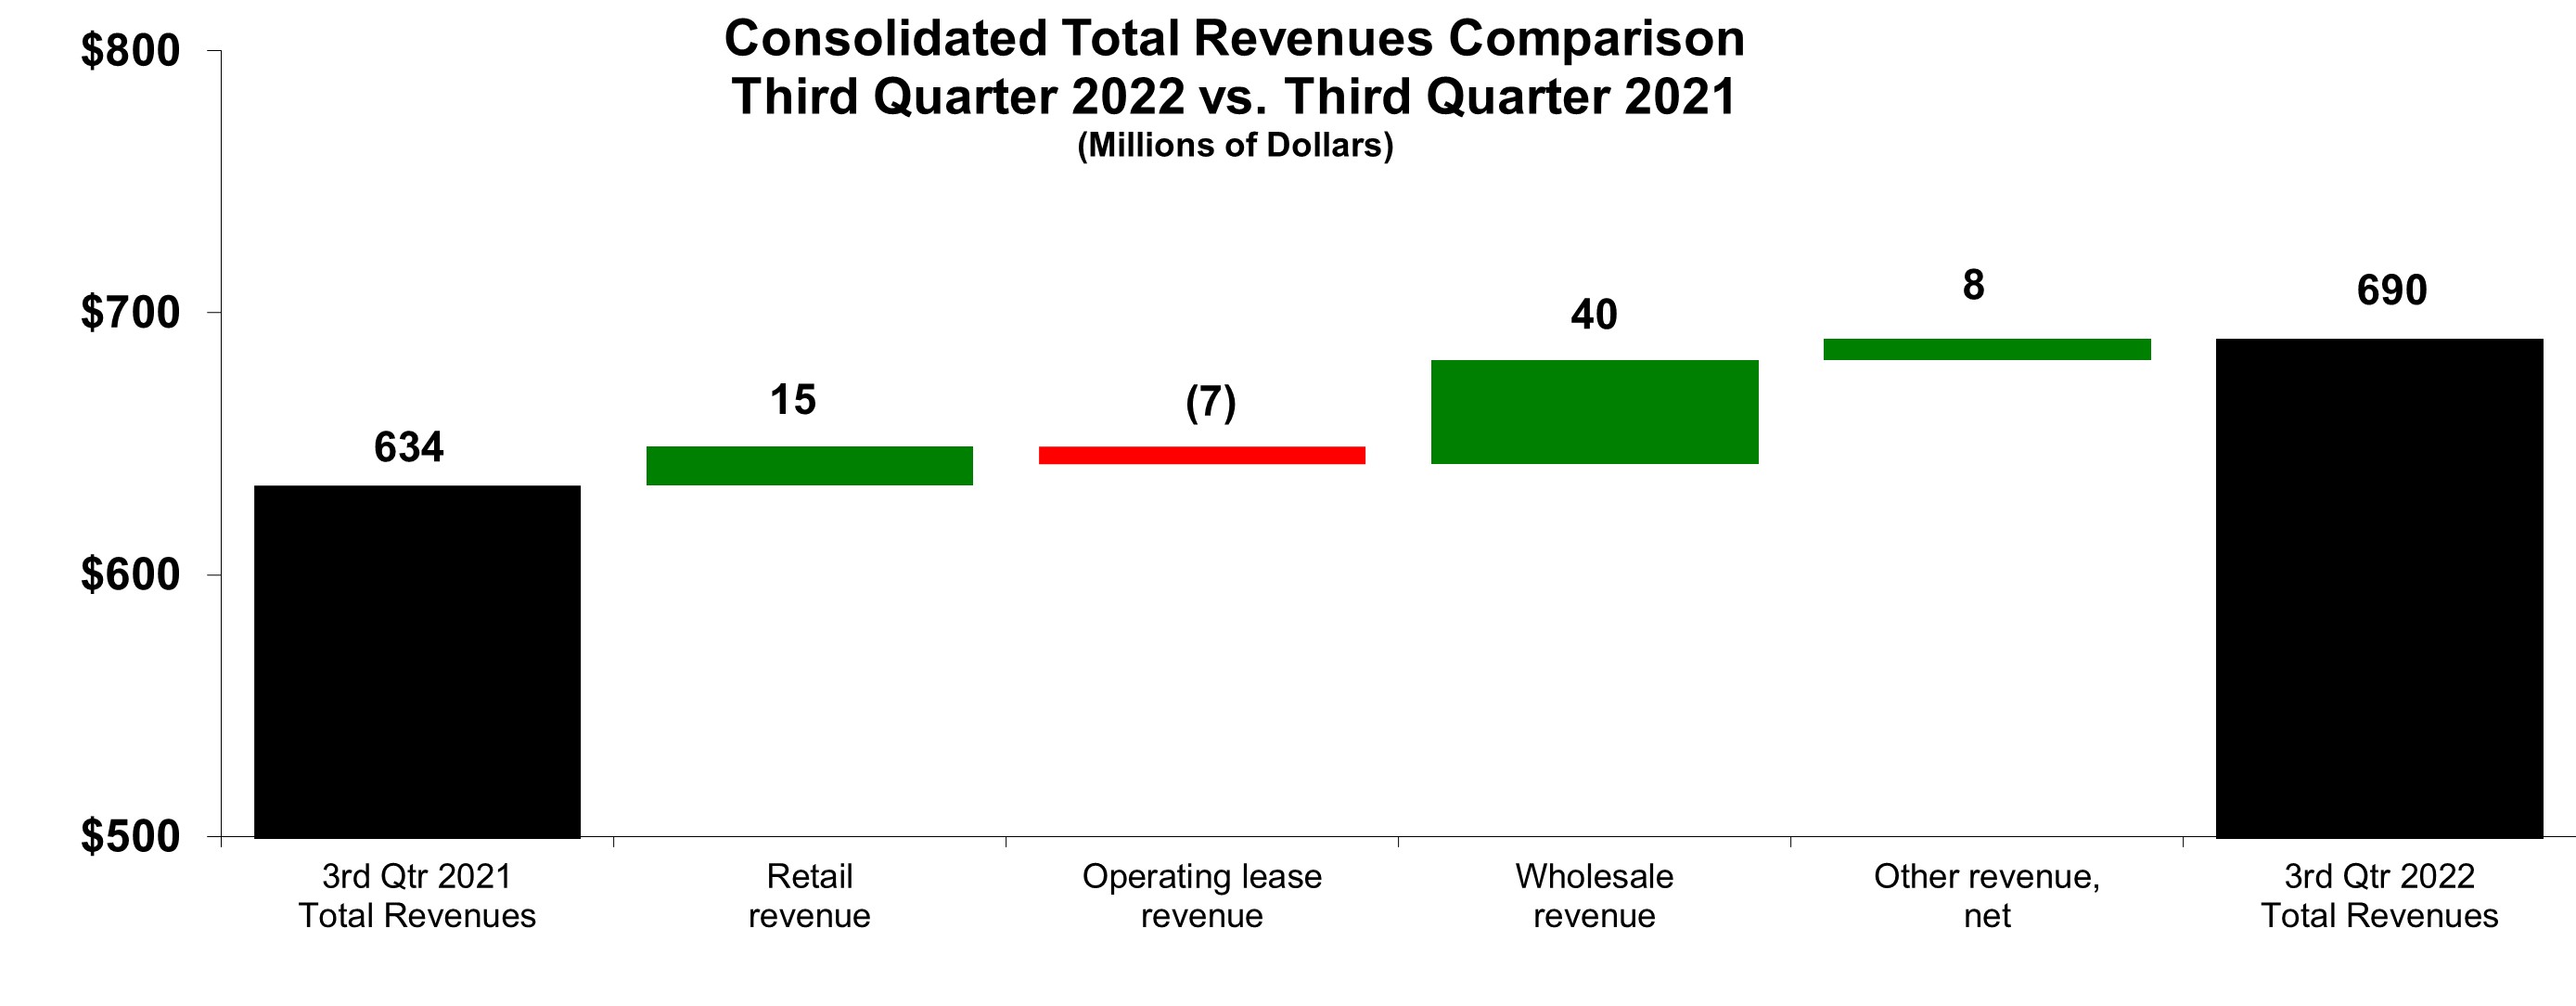
| Retail finance | Retail finance | $ | 290 | | | $ | 303 | | | Retail finance | $ | 312 | | | $ | 297 | | | $ | 903 | | | $ | 903 | |
| Operating lease | Operating lease | 225 | | | 244 | | | Operating lease | 222 | | | 229 | | | 671 | | | 711 | |
| Wholesale finance | Wholesale finance | 84 | | | 78 | | | Wholesale finance | 117 | | | 77 | | | 300 | | | 237 | |
| Other, net | Other, net | 53 | | | 14 | | | Other, net | 39 | | | 31 | | | 136 | | | 68 | |
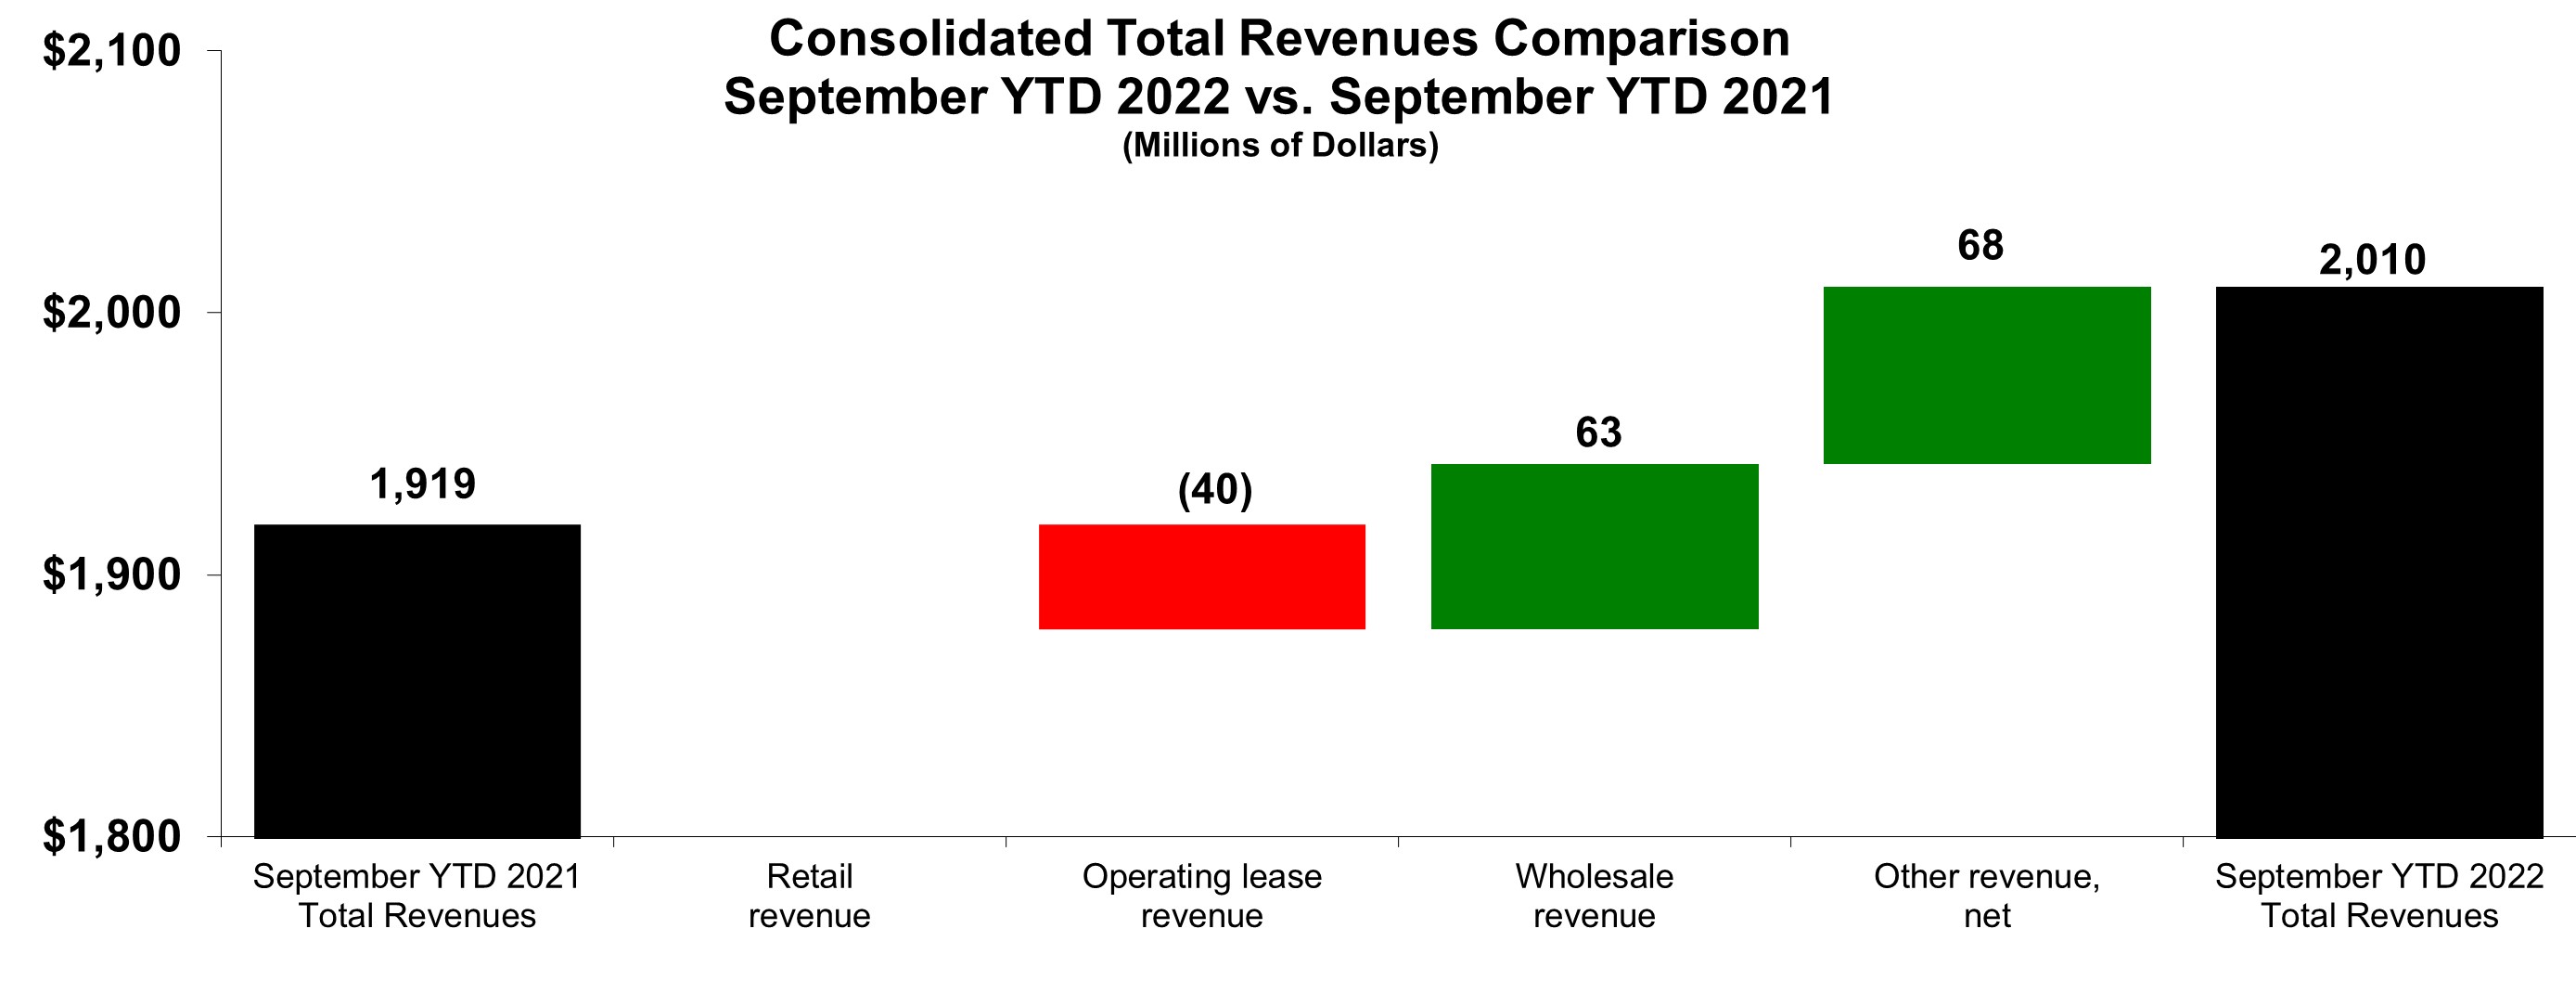
| Total revenues | Total revenues | 652 | | | 639 | | | Total revenues | 690 | | | 634 | | | 2,010 | | | 1,919 | |
| | Expenses: | Expenses: | | | | | Expenses: | | | | | | | |
| Interest | Interest | 106 | | | 125 | | | Interest | 151 | | | 110 | | | 377 | | | 351 | |
| Depreciation on equipment leased to others | Depreciation on equipment leased to others | 184 | | | 192 | | | Depreciation on equipment leased to others | 179 | | | 191 | | | 544 | | | 570 | |
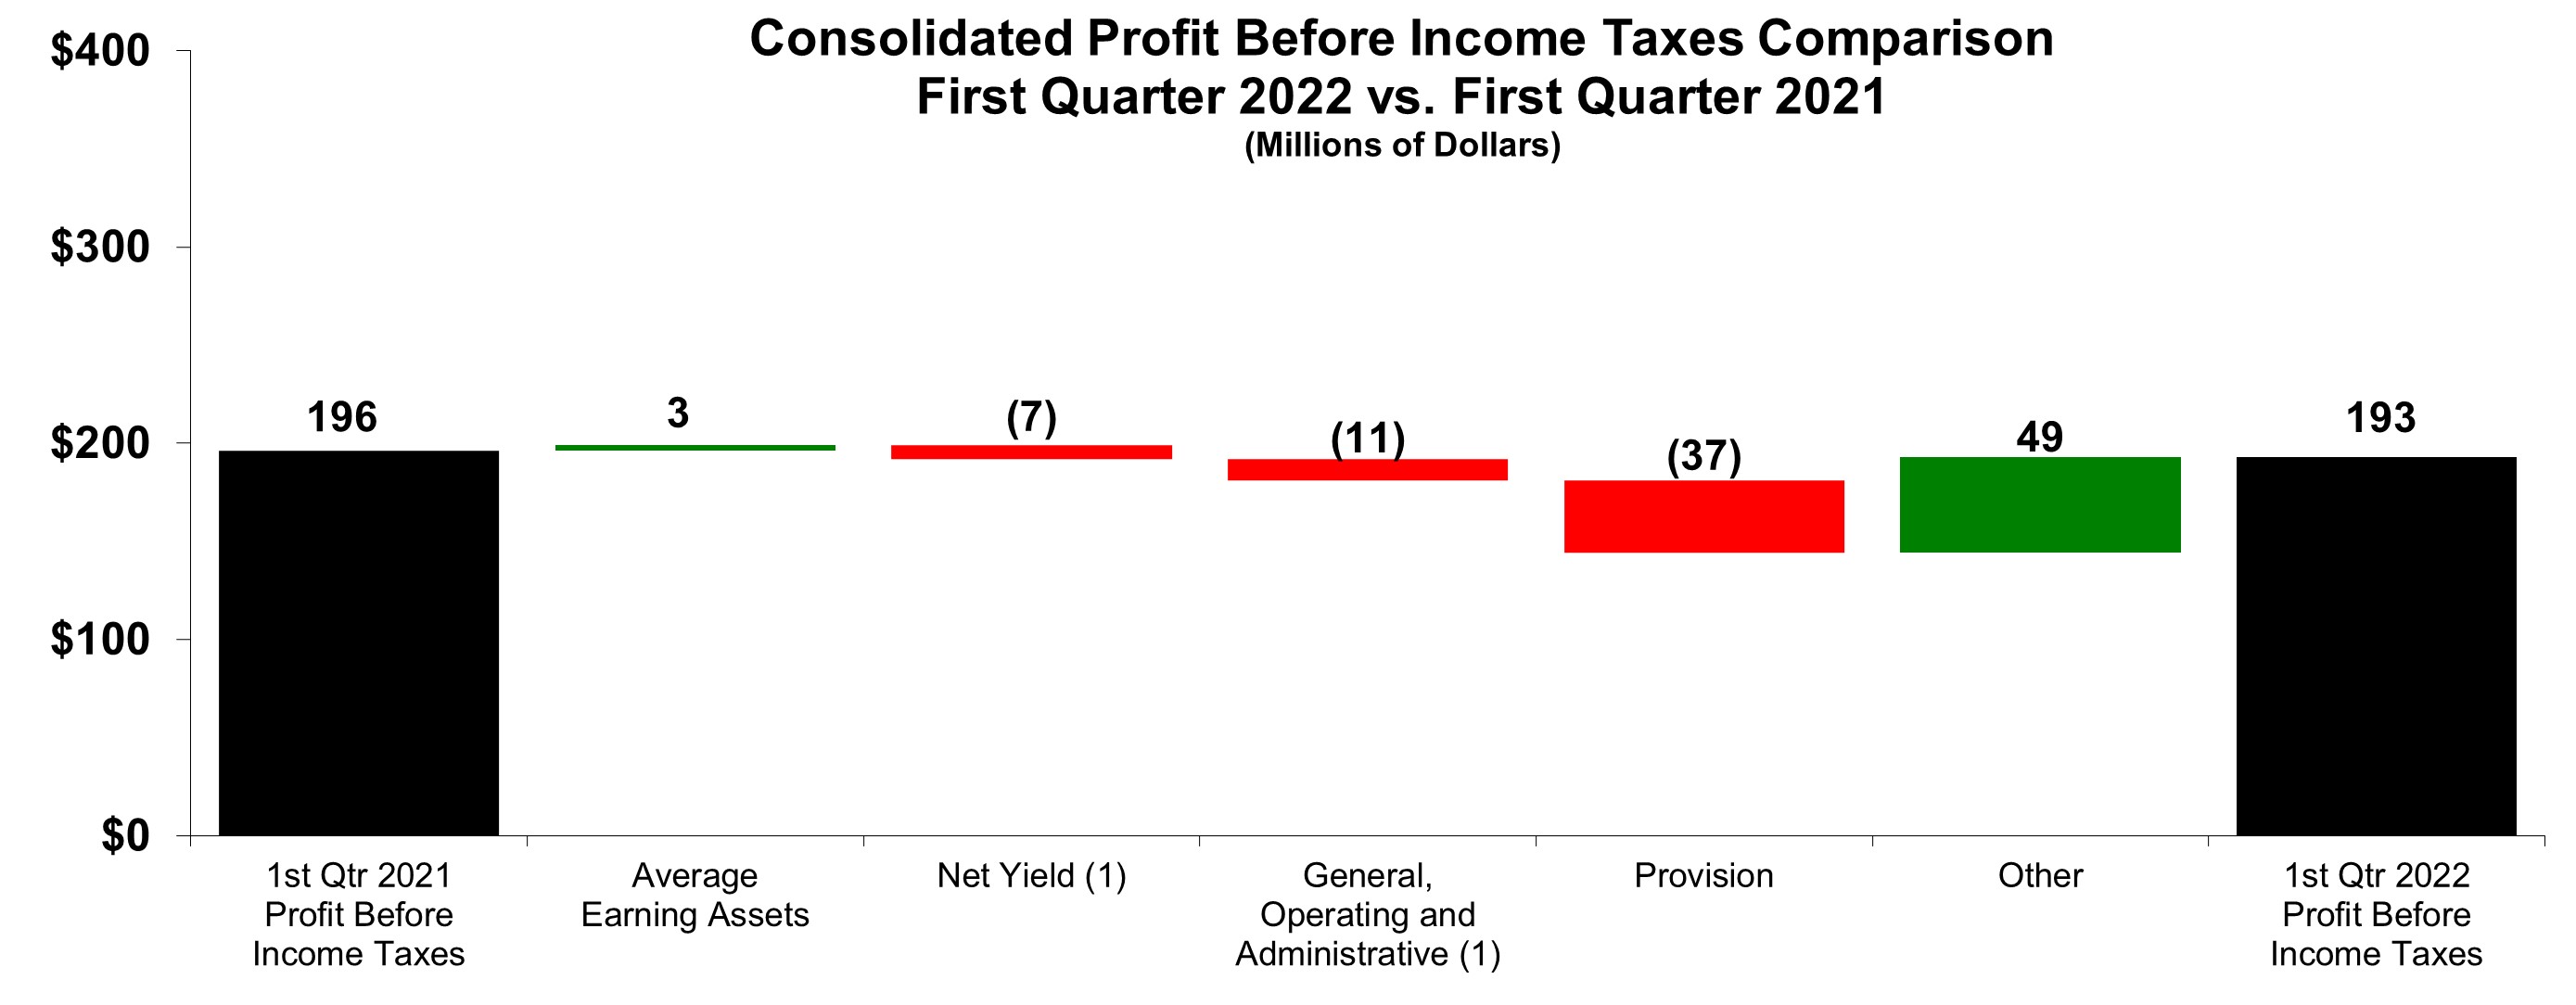
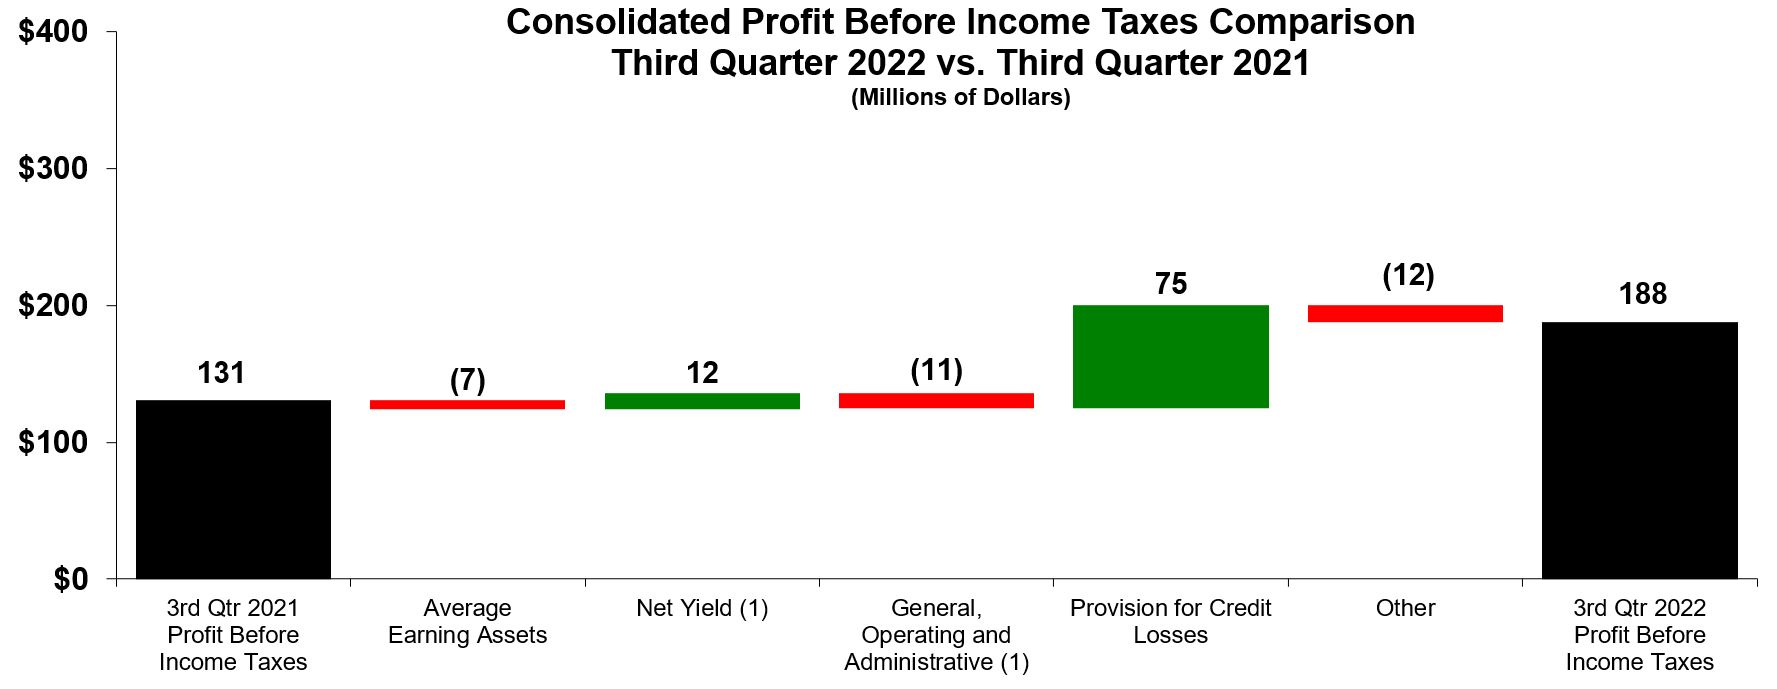
| General, operating and administrative | General, operating and administrative | 131 | | | 121 | | | General, operating and administrative | 136 | | | 127 | | | 397 | | | 382 | |
| Provision for credit losses | Provision for credit losses | 27 | | | (10) | | | Provision for credit losses | (16) | | | 59 | | | 34 | | | 60 | |
| Other | Other | 7 | | | 7 | | | Other | 7 | | | 9 | | | 20 | | | 24 | |
| Total expenses | Total expenses | 455 | | | 435 | | | Total expenses | 457 | | | 496 | | | 1,372 | | | 1,387 | |
| | Other income (expense) | Other income (expense) | (4) | | | (8) | | | Other income (expense) | (45) | | | (7) | | | (58) | | | (16) | |
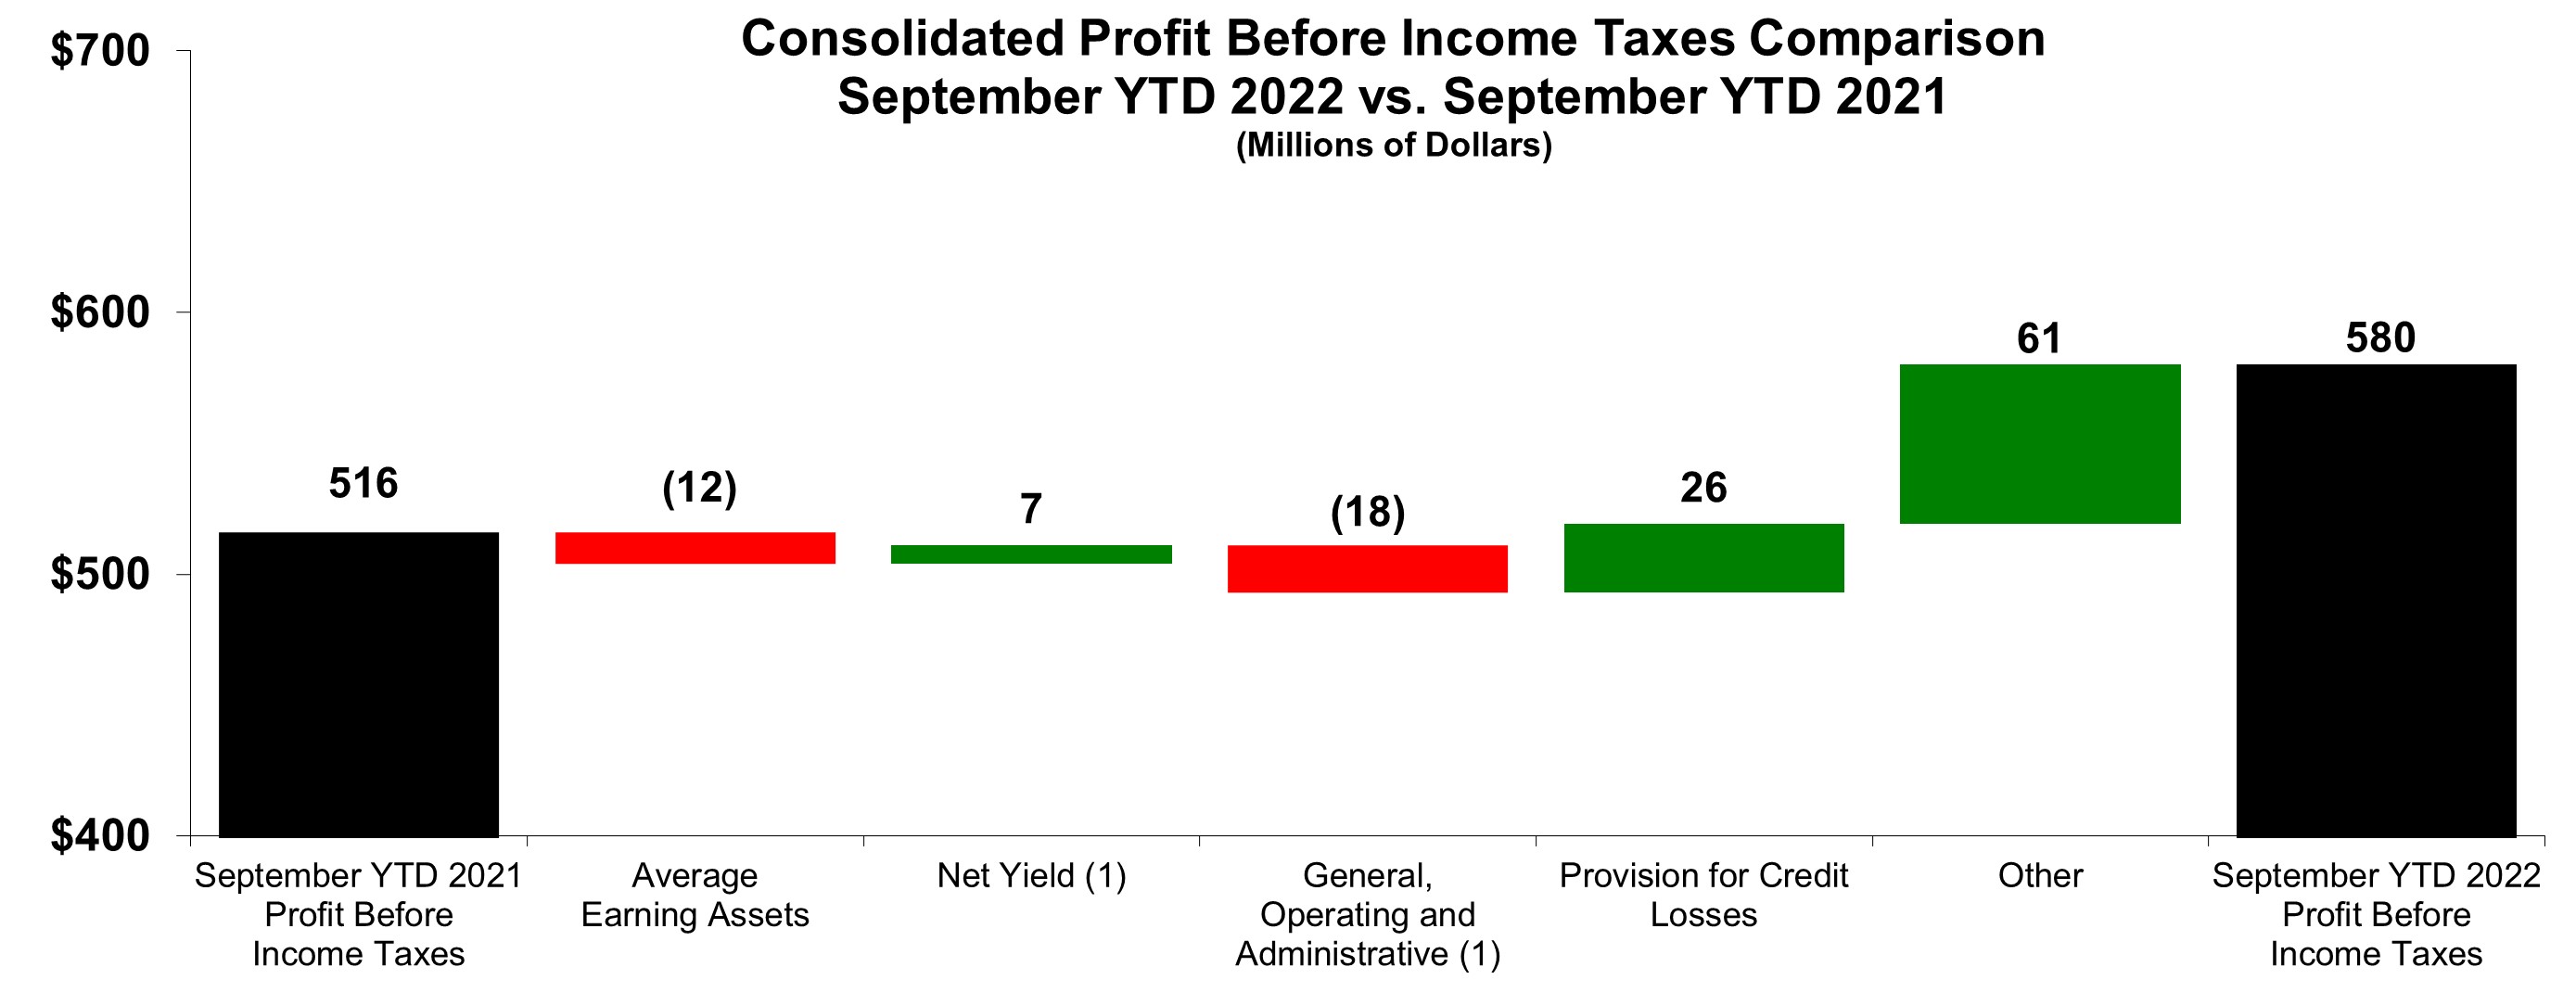
| | Profit before income taxes | Profit before income taxes | 193 | | | 196 | | | Profit before income taxes | 188 | | | 131 | | | 580 | | | 516 | |
| | Provision for income taxes | Provision for income taxes | 49 | | | 53 | | | Provision for income taxes | 55 | | | 27 | | | 157 | | | 124 | |
| | Profit of consolidated companies | Profit of consolidated companies | 144 | | | 143 | | | Profit of consolidated companies | 133 | | | 104 | | | 423 | | | 392 | |
| | Less: Profit attributable to noncontrolling interests | Less: Profit attributable to noncontrolling interests | 1 | | | 3 | | | Less: Profit attributable to noncontrolling interests | 2 | | | 3 | | | 6 | | | 9 | |
| | Profit attributable to Caterpillar Financial Services Corporation | Profit attributable to Caterpillar Financial Services Corporation | $ | 143 | | | $ | 140 | | | Profit attributable to Caterpillar Financial Services Corporation | $ | 131 | | | $ | 101 | | | $ | 417 | | | $ | 383 | |
|
See Notes to Consolidated Financial Statements (Unaudited).
Caterpillar Financial Services Corporation
CONSOLIDATED STATEMENTS OF COMPREHENSIVE INCOME
(Unaudited)
(Dollars in Millions)
| | | Three Months Ended
March 31, | | | Three Months Ended
September 30, | | Nine Months Ended
September 30, |
| | | 2022 | | 2021 | | | 2022 | | 2021 | | 2022 | | 2021 |
| | | | | | | | | | | | | |
| Profit of consolidated companies | Profit of consolidated companies | $ | 144 | | | $ | 143 | | | Profit of consolidated companies | $ | 133 | | | $ | 104 | | | $ | 423 | | | $ | 392 | |
| | Other comprehensive income (loss), net of tax (Note 5): | Other comprehensive income (loss), net of tax (Note 5): | | | Other comprehensive income (loss), net of tax (Note 5): | |
| Foreign currency translation | Foreign currency translation | 10 | | | (121) | | | Foreign currency translation | (296) | | | (137) | | | (543) | | | (185) | |
| Derivative financial instruments | Derivative financial instruments | 16 | | | 11 | | | Derivative financial instruments | (5) | | | 9 | | | 18 | | | 21 | |
| Total Other comprehensive income (loss), net of tax | Total Other comprehensive income (loss), net of tax | 26 | | | (110) | | | Total Other comprehensive income (loss), net of tax | (301) | | | (128) | | | (525) | | | (164) | |
| | Comprehensive income (loss) | Comprehensive income (loss) | 170 | | | 33 | | | Comprehensive income (loss) | (168) | | | (24) | | | (102) | | | 228 | |
| | Less: Comprehensive income (loss) attributable to the noncontrolling interests | Less: Comprehensive income (loss) attributable to the noncontrolling interests | 3 | | | 1 | | | Less: Comprehensive income (loss) attributable to the noncontrolling
interests | (6) | | | 1 | | | (9) | | | 9 | |
| | Comprehensive income (loss) attributable to Caterpillar Financial Services Corporation | Comprehensive income (loss) attributable to Caterpillar Financial Services Corporation | $ | 167 | | | $ | 32 | | | Comprehensive income (loss) attributable to Caterpillar Financial
Services Corporation | $ | (162) | | | $ | (25) | | | $ | (93) | | | $ | 219 | |
|
See Notes to Consolidated Financial Statements (Unaudited).
Caterpillar Financial Services Corporation
CONSOLIDATED STATEMENTS OF FINANCIAL POSITION
(Unaudited)
(Dollars in Millions, except share data)
| | | March 31,
2022 | | December 31,
2021 | | September 30,
2022 | | December 31,
2021 |
| Assets: | Assets: | | | | Assets: | | | |
| Cash and cash equivalents | Cash and cash equivalents | $ | 664 | | | $ | 610 | | Cash and cash equivalents | $ | 761 | | | $ | 610 | |
| Finance receivables, net of Allowance for credit losses of $357 and $337 | 27,355 | | | 27,177 | | |
| Finance receivables, net of Allowance for credit losses of $339 and $337 | | Finance receivables, net of Allowance for credit losses of $339 and $337 | 25,772 | | | 27,177 | |
| Notes receivable from Caterpillar | Notes receivable from Caterpillar | 475 | | | 389 | | Notes receivable from Caterpillar | 495 | | | 389 | |
| Equipment on operating leases, net | Equipment on operating leases, net | 3,043 | | | 3,123 | | Equipment on operating leases, net | 2,916 | | | 3,123 | |
| | Other assets | Other assets | 1,058 | | | 1,088 | | Other assets | 1,539 | | | 1,088 | |
| Total assets | Total assets | $ | 32,595 | | | $ | 32,387 | | Total assets | $ | 31,483 | | | $ | 32,387 | |
| | Liabilities and shareholder’s equity: | Liabilities and shareholder’s equity: | | | | Liabilities and shareholder’s equity: | | | |
| Payable to dealers and others | Payable to dealers and others | $ | 163 | | | $ | 163 | | Payable to dealers and others | $ | 168 | | | $ | 163 | |
| Payable to Caterpillar - borrowings and other | Payable to Caterpillar - borrowings and other | 117 | | | 95 | | Payable to Caterpillar - borrowings and other | 93 | | | 95 | |
| Accrued expenses | Accrued expenses | 378 | | | 233 | | Accrued expenses | 359 | | | 233 | |
| | Short-term borrowings | Short-term borrowings | 4,501 | | | 5,395 | | Short-term borrowings | 4,199 | | | 5,395 | |
| Current maturities of long-term debt | Current maturities of long-term debt | 7,679 | | | 6,307 | | Current maturities of long-term debt | 6,694 | | | 6,307 | |
| Long-term debt | Long-term debt | 15,641 | | | 16,287 | | Long-term debt | 16,030 | | | 16,287 | |
| Other liabilities | Other liabilities | 965 | | | 926 | | Other liabilities | 1,061 | | | 926 | |
| Total liabilities | Total liabilities | 29,444 | | | 29,406 | | Total liabilities | 28,604 | | | 29,406 | |
| | Commitments and contingent liabilities (Note 7) | Commitments and contingent liabilities (Note 7) | 0 | | 0 | Commitments and contingent liabilities (Note 7) | |
| | Common stock - $1 par value | Common stock - $1 par value | | | Common stock - $1 par value | | |
| Authorized: 2,000 shares; Issued and | Authorized: 2,000 shares; Issued and | | | | Authorized: 2,000 shares; Issued and | | | |
| outstanding: 1 share (at paid-in amount) | 745 | | | 745 | | |
| outstanding: one share (at paid-in amount) | | outstanding: one share (at paid-in amount) | 745 | | | 745 | |
| Additional paid-in capital | Additional paid-in capital | 2 | | | 2 | | Additional paid-in capital | 2 | | | 2 | |
| Retained earnings | Retained earnings | 2,940 | | | 2,797 | | Retained earnings | 3,214 | | | 2,797 | |
| Accumulated other comprehensive income (loss) | Accumulated other comprehensive income (loss) | (750) | | | (774) | | Accumulated other comprehensive income (loss) | (1,284) | | | (774) | |
| Noncontrolling interests | Noncontrolling interests | 214 | | | 211 | | Noncontrolling interests | 202 | | | 211 | |
| Total shareholder’s equity | Total shareholder’s equity | 3,151 | | | 2,981 | | Total shareholder’s equity | 2,879 | | | 2,981 | |
| | Total liabilities and shareholder’s equity | Total liabilities and shareholder’s equity | $ | 32,595 | | | $ | 32,387 | | Total liabilities and shareholder’s equity | $ | 31,483 | | | $ | 32,387 | |
|
See Notes to Consolidated Financial Statements (Unaudited).
Caterpillar Financial Services Corporation
CONSOLIDATED STATEMENTS OF CHANGES IN SHAREHOLDER’S EQUITY
(Unaudited)
(Dollars in Millions)
| | Three Months Ended March 31, 2021 | Common
stock | | Additional
paid-in
capital | | Retained
earnings | | Accumulated
other
comprehensive
income (loss) | | Noncontrolling
interests | | Total | |
| Balance at December 31, 2020 | $ | 745 | | | $ | 2 | | | $ | 3,142 | | | $ | (595) | | | $ | 197 | | | $ | 3,491 | | |
| Three Months Ended September 30, 2021 | | Three Months Ended September 30, 2021 | Common
stock | | Additional
paid-in
capital | | Retained
earnings | | Accumulated
other
comprehensive
income (loss) | | Noncontrolling
interests | | Total |
| Balance at June 30, 2021 | | Balance at June 30, 2021 | $ | 745 | | | $ | 2 | | | $ | 3,074 | | | $ | (633) | | | $ | 205 | | | $ | 3,393 | |
| Profit of consolidated companies | Profit of consolidated companies | | | | | 140 | | | | | 3 | | | 143 | | Profit of consolidated companies | | | | | 101 | | | | | 3 | | | 104 | |
| | Foreign currency translation, net of tax | Foreign currency translation, net of tax | | (119) | | | (2) | | | (121) | | Foreign currency translation, net of tax | | (135) | | | (2) | | | (137) | |
| Derivative financial instruments, net of tax | Derivative financial instruments, net of tax | | 11 | | | 11 | | Derivative financial instruments, net of tax | | 9 | | | 9 | |
| | Balance at March 31, 2021 | $ | 745 | | | $ | 2 | | | $ | 3,282 | | | $ | (703) | | | $ | 198 | | | $ | 3,524 | | |
| Balance at September 30, 2021 | | Balance at September 30, 2021 | $ | 745 | | | $ | 2 | | | $ | 3,175 | | | $ | (759) | | | $ | 206 | | | $ | 3,369 | |
| | Three Months Ended March 31, 2022 | | |
| Three Months Ended September 30, 2022 | | Three Months Ended September 30, 2022 | |
| Balance at June 30, 2022 | | Balance at June 30, 2022 | $ | 745 | | | $ | 2 | | | $ | 3,083 | | | $ | (991) | | | $ | 208 | | | $ | 3,047 | |
| Profit of consolidated companies | | Profit of consolidated companies | | | | | 131 | | | | | 2 | | | 133 | |
| | Foreign currency translation, net of tax | | Foreign currency translation, net of tax | | (288) | | | (8) | | | (296) | |
| Derivative financial instruments, net of tax | | Derivative financial instruments, net of tax | | (5) | | | (5) | |
| | Balance at September 30, 2022 | | Balance at September 30, 2022 | $ | 745 | | | $ | 2 | | | $ | 3,214 | | | $ | (1,284) | | | $ | 202 | | | $ | 2,879 | |
| | Nine Months Ended September 30, 2021 | | Nine Months Ended September 30, 2021 | |
| Balance at December 31, 2020 | | Balance at December 31, 2020 | $ | 745 | | | $ | 2 | | | $ | 3,142 | | | $ | (595) | | | $ | 197 | | | $ | 3,491 | |
| Profit of consolidated companies | | Profit of consolidated companies | | | | | 383 | | | | | 9 | | | 392 | |
| Dividend paid to Caterpillar | | Dividend paid to Caterpillar | | | | | (350) | | | | | | | (350) | |
| Foreign currency translation, net of tax | | Foreign currency translation, net of tax | | | | | | | (185) | | | (185) | |
| Derivative financial instruments, net of tax | | Derivative financial instruments, net of tax | | | | | | | 21 | | | | | 21 | |
| | Balance at September 30, 2021 | | Balance at September 30, 2021 | $ | 745 | | | $ | 2 | | | $ | 3,175 | | | $ | (759) | | | $ | 206 | | | $ | 3,369 | |
| | Nine Months Ended September 30, 2022 | | Nine Months Ended September 30, 2022 | | | | | | | | | | | |
| Balance at December 31, 2021 | Balance at December 31, 2021 | $ | 745 | | | $ | 2 | | | $ | 2,797 | | | $ | (774) | | | $ | 211 | | | $ | 2,981 | | Balance at December 31, 2021 | $ | 745 | | | $ | 2 | | | $ | 2,797 | | | $ | (774) | | | $ | 211 | | | $ | 2,981 | |
| Profit of consolidated companies | Profit of consolidated companies | | | | | 143 | | | | | 1 | | | 144 | | Profit of consolidated companies | | | | | 417 | | | | | 6 | | | 423 | |
| | Foreign currency translation, net of tax | Foreign currency translation, net of tax | | 8 | | | 2 | | | 10 | | Foreign currency translation, net of tax | | | | | | | (528) | | | (15) | | | (543) | |
| Derivative financial instruments, net of tax | Derivative financial instruments, net of tax | | 16 | | | 16 | | Derivative financial instruments, net of tax | | | | | | | 18 | | | | | 18 | |
| | Balance at March 31, 2022 | $ | 745 | | | $ | 2 | | | $ | 2,940 | | | $ | (750) | | | $ | 214 | | | $ | 3,151 | | |
| Balance at September 30, 2022 | | Balance at September 30, 2022 | $ | 745 | | | $ | 2 | | | $ | 3,214 | | | $ | (1,284) | | | $ | 202 | | | $ | 2,879 | |
| |
See Notes to Consolidated Financial Statements (Unaudited).
Caterpillar Financial Services Corporation
CONSOLIDATED STATEMENTS OF CASH FLOWS
(Unaudited)
(Dollars in Millions)
| | | Three Months Ended
March 31, | | Nine Months Ended
September 30, |
| | | 2022 | | 2021 | | 2022 | | 2021 |
| Cash flows from operating activities: | Cash flows from operating activities: | | | | Cash flows from operating activities: | | | |
| Profit of consolidated companies | Profit of consolidated companies | $ | 144 | | | $ | 143 | | Profit of consolidated companies | $ | 423 | | | $ | 392 | |
| Adjustments for non-cash items: | Adjustments for non-cash items: | | | | Adjustments for non-cash items: | | | |
| Depreciation and amortization | Depreciation and amortization | 187 | | | 195 | | Depreciation and amortization | 554 | | | 581 | |
| Accretion of Caterpillar purchased receivable revenue | Accretion of Caterpillar purchased receivable revenue | (81) | | | (74) | | Accretion of Caterpillar purchased receivable revenue | (284) | | | (226) | |
| Provision for credit losses | Provision for credit losses | 27 | | | (10) | | Provision for credit losses | 34 | | | 60 | |
| | Other, net | Other, net | (27) | | | 23 | | Other, net | 116 | | | 74 | |
| Changes in assets and liabilities: | Changes in assets and liabilities: | | | | Changes in assets and liabilities: | | | |
| Other assets | Other assets | 1 | | | (12) | | Other assets | 41 | | | 57 | |
| Payable to dealers and others | Payable to dealers and others | 27 | | | 13 | | Payable to dealers and others | 62 | | | 27 | |
| Accrued expenses | Accrued expenses | 3 | | | 28 | | Accrued expenses | 17 | | | (63) | |
| Other payables with Caterpillar | Other payables with Caterpillar | 19 | | | 6 | | Other payables with Caterpillar | (3) | | | 9 | |
| Other liabilities | Other liabilities | 22 | | | 23 | | Other liabilities | 61 | | | 25 | |
| Net cash provided by operating activities | Net cash provided by operating activities | 322 | | | 335 | | Net cash provided by operating activities | 1,021 | | | 936 | |
| | Cash flows from investing activities: | Cash flows from investing activities: | | | | Cash flows from investing activities: | | | |
| Expenditures for equipment on operating leases | Expenditures for equipment on operating leases | (238) | | | (224) | | Expenditures for equipment on operating leases | (860) | | | (889) | |
| Capital expenditures - excluding equipment on operating leases | Capital expenditures - excluding equipment on operating leases | (3) | | | (4) | | Capital expenditures - excluding equipment on operating leases | (9) | | | (10) | |
| Proceeds from disposals of equipment | Proceeds from disposals of equipment | 239 | | | 244 | | Proceeds from disposals of equipment | 607 | | | 767 | |
| Additions to finance receivables | Additions to finance receivables | (3,139) | | | (2,867) | | Additions to finance receivables | (10,578) | | | (10,292) | |
| Collections of finance receivables | Collections of finance receivables | 3,160 | | | 3,062 | | Collections of finance receivables | 10,333 | | | 9,949 | |
| Net changes in Caterpillar purchased receivables | Net changes in Caterpillar purchased receivables | (42) | | | (411) | | Net changes in Caterpillar purchased receivables | 678 | | | 100 | |
| Proceeds from sales of receivables | Proceeds from sales of receivables | 9 | | | 5 | | Proceeds from sales of receivables | 50 | | | 44 | |
| Net change in variable lending to Caterpillar | Net change in variable lending to Caterpillar | (5) | | | 19 | | Net change in variable lending to Caterpillar | (3) | | | 3 | |
| Additions to other notes receivable from Caterpillar | Additions to other notes receivable from Caterpillar | (91) | | | (23) | | Additions to other notes receivable from Caterpillar | (139) | | | (75) | |
| Collections of other notes receivable from Caterpillar | Collections of other notes receivable from Caterpillar | 10 | | | 28 | | Collections of other notes receivable from Caterpillar | 34 | | | 45 | |
| | Settlements of undesignated derivatives | Settlements of undesignated derivatives | (33) | | | (51) | | Settlements of undesignated derivatives | (69) | | | (68) | |
| Other, net | Other, net | — | | | 1 | | Other, net | — | | | 1 | |
| Net cash provided by (used for) investing activities | Net cash provided by (used for) investing activities | (133) | | | (221) | | Net cash provided by (used for) investing activities | 44 | | | (425) | |
| | Cash flows from financing activities: | Cash flows from financing activities: | | | | Cash flows from financing activities: | | | |
| Net change in variable lending from Caterpillar | Net change in variable lending from Caterpillar | — | | | (1,000) | | Net change in variable lending from Caterpillar | — | | | (1,000) | |
| | Proceeds from debt issued (original maturities greater than three months) | Proceeds from debt issued (original maturities greater than three months) | 2,131 | | | 1,779 | | Proceeds from debt issued (original maturities greater than three months) | 5,570 | | | 6,437 | |
| Payments on debt issued (original maturities greater than three months) | Payments on debt issued (original maturities greater than three months) | (1,381) | | | (2,243) | | Payments on debt issued (original maturities greater than three months) | (5,269) | | | (6,710) | |
| Short-term borrowings, net (original maturities three months or less) | Short-term borrowings, net (original maturities three months or less) | (892) | | | 1,669 | | Short-term borrowings, net (original maturities three months or less) | (1,173) | | | 1,334 | |
| | Dividend paid to Caterpillar | | Dividend paid to Caterpillar | — | | | (350) | |
| Net cash provided by (used for) financing activities | Net cash provided by (used for) financing activities | (142) | | | 205 | | Net cash provided by (used for) financing activities | (872) | | | (289) | |
| | Effect of exchange rate changes on cash, cash equivalents and restricted cash | Effect of exchange rate changes on cash, cash equivalents and restricted cash | 5 | | | — | | Effect of exchange rate changes on cash, cash equivalents and restricted cash | (44) | | | 4 | |
| | Increase (decrease) in cash, cash equivalents and restricted cash | Increase (decrease) in cash, cash equivalents and restricted cash | 52 | | | 319 | | Increase (decrease) in cash, cash equivalents and restricted cash | 149 | | | 226 | |
Cash, cash equivalents and restricted cash at beginning of year(1) | Cash, cash equivalents and restricted cash at beginning of year(1) | 614 | | | 425 | | Cash, cash equivalents and restricted cash at beginning of year(1) | 614 | | | 425 | |
Cash, cash equivalents and restricted cash at end of period(1) | Cash, cash equivalents and restricted cash at end of period(1) | $ | 666 | | | $ | 744 | | Cash, cash equivalents and restricted cash at end of period(1) | $ | 763 | | | $ | 651 | |
|
(1) As of March 31,September 30, 2022 and December 31, 2021, restricted cash, which is included in Other assets in the Consolidated Statements of Financial Position, was $2 million and $4 million, respectively. Restricted cash primarily includes cash related to syndication activities.
See Notes to Consolidated Financial Statements (Unaudited).
Notes to Consolidated Financial Statements
(Unaudited)
1.Basis of Presentation
In the opinion of management, the accompanying unaudited consolidated financial statements include all adjustments, consisting only of normal recurring adjustments, necessary for a fair statement of (a) the consolidated profit for the three and nine months ended March 31,September 30, 2022 and 2021, (b) the consolidated comprehensive income for the three and nine months ended March 31,September 30, 2022 and 2021, (c) the consolidated financial position at March 31,September 30, 2022 and December 31, 2021, (d) the consolidated changes in shareholder’s equity for the three and nine months ended March 31,September 30, 2022 and 2021 and (e) the consolidated cash flows for the threenine months ended March 31,September 30, 2022 and 2021. The preparation of financial statements, in conformity with generally accepted accounting principles and pursuant to the rules and regulations of the Securities and Exchange Commission (SEC), requires management to make estimates and assumptions that affect the reported amounts. Significant estimates include residual values for leased assets, allowance for credit losses and income taxes. Actual results may differ from these estimates.
Interim results are not necessarily indicative of results for a full year. The information included in this Form 10-Q should be read in conjunction with the audited consolidated financial statements and notes thereto included in our annual report on Form 10-K for the year ended December 31, 2021 (2021 Form 10-K). The December 31, 2021 financial position data included herein was derived from the audited consolidated financial statements included in the 2021 Form 10-K but does not include all disclosures required by generally accepted accounting principles.
We consolidate all variable interest entities (VIEs) where we are the primary beneficiary. For VIEs, we assess whether we are the primary beneficiary as prescribed by the accounting guidance on the consolidation of VIEs. The primary beneficiary of a VIE is the party that has both the power to direct the activities that most significantly impact the entity’s economic performance and the obligation to absorb losses or the right to receive benefits that could potentially be significant to the entity. Please refer to Note 7 for more information.
We have customers and dealers that are VIEs of which we are not the primary beneficiary. Although we have provided financial support to these entities and therefore have a variable interest, we do not have the power to direct the activities that most significantly impact their economic performance. Our maximum exposure to loss from our involvement with these VIEs is limited to the credit risk inherently present in the financial support that we have provided. Credit risk was evaluated and reflected in our financial statements as part of our overall portfolio of finance receivables and related allowance for credit losses.
2.New Accounting Pronouncements
A.Adoption of New Accounting Standards
We consider the applicability and impact of all Accounting Standards Updates (ASUs). We adopted the following ASU effective January 1, 2022, which did not have a material impact on our financial statements:
| | | | | |
| ASU | Description |
| |
| 2021-05 | Lessor – Variable lease payments |
| |
B.Accounting Standards Issued But Not Yet Adopted
Credit Losses (ASU 2022-02) – In March 2022, the Financial Accounting Standards Board (FASB) issued accounting guidance related to Troubled Debt Restructurings (TDRs) by Creditors and Vintage Disclosures for Gross Write-offs. The guidance is effective for fiscal years beginning after December 15, 2022. We are evaluating the new guidance and do not expect the adoption to have a material impact on our financial statements.
We consider the applicability and impact of all ASUs. ASUs not listed above were assessed and either determined to be not applicable or not expected to have a material impact on our financial statements.
3.Finance Receivables
A summary of finance receivables included in the Consolidated Statements of Financial Position was as follows:
| | (Millions of dollars) | (Millions of dollars) | | March 31,
2022 | | December 31,
2021 | (Millions of dollars) | | September 30,
2022 | | December 31,
2021 |
Retail loans, net(1) | Retail loans, net(1) | | $ | 15,050 | | | $ | 14,817 | | Retail loans, net(1) | | $ | 14,859 | | | $ | 14,817 | |
| Retail leases, net | Retail leases, net | | 7,625 | | | 7,818 | | Retail leases, net | | 6,805 | | | 7,818 | |
| Caterpillar purchased receivables, net | Caterpillar purchased receivables, net | | 4,647 | | | 4,462 | | Caterpillar purchased receivables, net | | 3,962 | | | 4,462 | |
Wholesale loans, net(1) | Wholesale loans, net(1) | | 380 | | | 406 | | Wholesale loans, net(1) | | 478 | | | 406 | |
| Wholesale leases, net | Wholesale leases, net | | 10 | | | 11 | | Wholesale leases, net | | 7 | | | 11 | |
| Total finance receivables | Total finance receivables | | 27,712 | | | 27,514 | | Total finance receivables | | 26,111 | | | 27,514 | |
| Less: Allowance for credit losses | Less: Allowance for credit losses | | (357) | | | (337) | | Less: Allowance for credit losses | | (339) | | | (337) | |
| Total finance receivables, net | Total finance receivables, net | | $ | 27,355 | | | $ | 27,177 | | Total finance receivables, net | | $ | 25,772 | | | $ | 27,177 | |
|
(1) Includes failed sale leasebacks.
Finance leases
Revenues from finance leases were $112$105 million and $122$120 million for the three months ended March 31,September 30, 2022 and 2021, respectively, and $326 million and $365 million for the nine months ended September 30, 2022 and 2021, respectively, and are included in retail and wholesale finance revenue in the Consolidated Statements of Profit. The residual values for finance leases are included in Finance receivables, net in the Consolidated Statements of Financial Position. Residual value adjustments are recognized through a reduction of finance revenue over the remaining lease term.
Allowance for credit losses
Portfolio segments
A portfolio segment is the level at which we develop a systematic methodology for determining our allowance for credit losses. Our portfolio segments and related methods for estimating expected credit losses are as follows:
Customer
We provide loans and finance leases to end-user customers primarily for the purpose of financing new and used Caterpillar machinery, engines and equipment for commercial use, the majority of which operate in construction-related industries. We also provide financing for vehicles, power generation facilities and marine vessels that, in most cases, incorporate Caterpillar products. The average original term of our customer finance receivable portfolio was approximately 50 months with an average remaining term of approximately 2726 months as of March 31,September 30, 2022.
We typically maintain a security interest in financed equipment and we require physical damage insurance coverage on the financed equipment, both of which provide us with certain rights and protections. If our collection efforts fail to bring a defaulted account current, we generally can repossess the financed equipment, after satisfying local legal requirements, and sell it within the Caterpillar dealer network or through third-party auctions.
We estimate the allowance for credit losses related to our customer finance receivables based on loss forecast models utilizing probabilities of default and our estimated loss given default based on past loss experience adjusted for current conditions and reasonable and supportable forecasts capturing country and industry-specific economic factors.
During the three and nine months ended March 31,September 30, 2022, our forecasts for the markets in which we operate reflected a continuation of the trend of a growing economy, improvedrelatively low unemployment rates and relatively low delinquencies. However, an increase inhigh inflation exacerbated by an increase in commodity prices, dampened the expectations ofrates and consequent central bank actions are weakening global economic growth. We believe the economic forecasts employed represent reasonable and supportable forecasts, followed by a reversion to long-term trends.
Dealer
We provide financing to Caterpillar dealers in the form of wholesale financing plans. Our wholesale financing plans provide assistance to dealers by financing their mostly new Caterpillar equipment inventory and rental fleets on a secured and unsecured basis. In addition, we provide a variety of secured and unsecured loans to Caterpillar dealers.
We estimate the allowance for credit losses for dealer finance receivables based on historical loss rates with consideration of current economic conditions and reasonable and supportable forecasts.
In general, our Dealer portfolio segment has not historically experienced large increases or decreases in credit losses based on changes in economic conditions due to our close working relationships with the dealers and their financial strength. Therefore, we made no adjustments to historical loss rates during the three and nine months ended March 31,September 30, 2022.
Caterpillar Purchased Receivables
We purchase receivables from Caterpillar, primarily related to the sale of equipment and parts to dealers. Caterpillar purchased receivables are non-interest-bearing short-term trade receivables that are purchased at a discount.
We estimate the allowance for credit losses for Caterpillar purchased receivables based on historical loss rates with consideration of current economic conditions and reasonable and supportable forecasts.
In general, our Caterpillar Purchased Receivables portfolio segment has not historically experienced large increases or decreases in credit losses based on changes in economic conditions due to the short-term maturities of the receivables, our close working relationships with the dealers and their financial strength. Therefore, we made no adjustments to historical loss rates during the three and nine months ended March 31,September 30, 2022.
Classes of finance receivables
We further evaluate our portfolio segments by the class of finance receivables, which is defined as a level of information (below a portfolio segment) in which the finance receivables have the same initial measurement attribute and a similar method for assessing and monitoring credit risk. Our classes, which align with management reporting for credit losses, are as follows:
•North America - Finance receivables originated in the United States and Canada.
•EAME - Finance receivables originated in Europe, Africa, the Middle East and the Commonwealth of Independent States.
•Asia/Pacific - Finance receivables originated in Australia, New Zealand, China, Japan, Southeast Asia and India.
•Mining - Finance receivables related to large mining customers worldwide.
•Latin America - Finance receivables originated in Mexico and Central and South American countries.
•Caterpillar Power Finance - Finance receivables originated worldwide related to marine vessels with Caterpillar engines and Caterpillar electrical power generation, gas compression and co-generation systems and non-Caterpillar equipment that is powered by these systems.
An analysis of the allowance for credit losses was as follows:
| | (Millions of dollars) | (Millions of dollars) | Three Months Ended March 31, 2022 | | Three Months Ended March 31, 2021 | (Millions of dollars) | Three Months Ended September 30, 2022 | | Three Months Ended September 30, 2021 |
| Allowance for Credit Losses: | Allowance for Credit Losses: | Customer | | Dealer | | Caterpillar
Purchased
Receivables | | Total | | Customer | | Dealer | | Caterpillar
Purchased
Receivables | | Total | Allowance for Credit Losses: | Customer | | Dealer | | Caterpillar
Purchased
Receivables | | Total | | Customer | | Dealer | | Caterpillar
Purchased
Receivables | | Total |
| Beginning Balance | Beginning Balance | $ | 251 | | | $ | 82 | | | $ | 4 | | | $ | 337 | | | $ | 431 | | | $ | 44 | | | $ | 4 | | | $ | 479 | | Beginning Balance | $ | 290 | | | $ | 82 | | | $ | 4 | | | $ | 376 | | | $ | 354 | | | $ | 44 | | | $ | 4 | | | $ | 402 | |
| Write-offs | Write-offs | (20) | | | — | | | — | | | (20) | | | (34) | | | — | | | — | | | (34) | | Write-offs | (30) | | | — | | | — | | | (30) | | | (91) | | | — | | | — | | | (91) | |
| Recoveries | Recoveries | 12 | | | — | | | — | | | 12 | | | 10 | | | — | | | — | | | 10 | | Recoveries | 17 | | | — | | | — | | | 17 | | | 15 | | | — | | | — | | | 15 | |
Provision for credit losses(1) | Provision for credit losses(1) | 26 | | | (1) | | | 1 | | | 26 | | | (10) | | | — | | | — | | | (10) | | Provision for credit losses(1) | (2) | | | (17) | | | — | | | (19) | | | 17 | | | 38 | | | — | | | 55 | |
| Other | Other | 2 | | | — | | | — | | | 2 | | | (4) | | | — | | | — | | | (4) | | Other | (5) | | | — | | | — | | | (5) | | | (3) | | | — | | | — | | | (3) | |
Ending Balance | Ending Balance | $ | 271 | | | $ | 81 | | | $ | 5 | | | $ | 357 | | | $ | 393 | | | $ | 44 | | | $ | 4 | | | $ | 441 | | Ending Balance | $ | 270 | | | $ | 65 | | | $ | 4 | | | $ | 339 | | | $ | 292 | | | $ | 82 | | | $ | 4 | | | $ | 378 | |
| | | | Nine Months Ended September 30, 2022 | | Nine Months Ended September 30, 2021 |
| | Allowance for Credit Losses: | | Allowance for Credit Losses: | Customer | | Dealer | | Caterpillar
Purchased
Receivables | | Total | | Customer | | Dealer | | Caterpillar
Purchased
Receivables | | Total |
| Beginning Balance | | Beginning Balance | $ | 251 | | | $ | 82 | | | $ | 4 | | | $ | 337 | | | $ | 431 | | | $ | 44 | | | $ | 4 | | | $ | 479 | |
| Write-offs | | Write-offs | (68) | | | — | | | — | | | (68) | | | (193) | | | — | | | — | | | (193) | |
| Recoveries | | Recoveries | 47 | | | — | | | — | | | 47 | | | 39 | | | — | | | — | | | 39 | |
Provision for credit losses(1) | | Provision for credit losses(1) | 46 | | | (17) | | | — | | | 29 | | | 20 | | | 38 | | | — | | | 58 | |
| Other | | Other | (6) | | | — | | | — | | | (6) | | | (5) | | | — | | | — | | | (5) | |
Ending Balance(2) | | Ending Balance(2) | $ | 270 | | | $ | 65 | | | $ | 4 | | | $ | 339 | | | $ | 292 | | | $ | 82 | | | $ | 4 | | | $ | 378 | |
| | Finance Receivables | Finance Receivables | $ | 20,953 | | | $ | 2,112 | | | $ | 4,647 | | | $ | 27,712 | | | $ | 19,798 | | | $ | 3,078 | | | $ | 4,065 | | | $ | 26,941 | | Finance Receivables | $ | 19,927 | | | $ | 2,222 | | | $ | 3,962 | | | $ | 26,111 | | | $ | 20,702 | | | $ | 2,368 | | | $ | 3,703 | | | $ | 26,773 | |
|
(1) The three months ended March 31,Excludes provision for credit losses on unfunded commitments and other miscellaneous receivables.
(2) Ending balances as of September 30, 2022 included ainclude higher reservereserves for the Russia and Ukraine portfolios.
Credit quality of finance receivables
At origination, we evaluate credit risk based on a variety of credit quality factors including prior payment experience, customer financial information, credit ratings, loan-to-value ratios, probabilities of default, industry trends, macroeconomic factors and other internal metrics. On an ongoing basis, we monitor credit quality based on past-due status as there is a meaningful correlation between the past-due status of customers and the risk of loss. In determining past-due status, we consider the entire finance receivable past due when any installment is over 30 days past due.
Customer
The tables below summarize the aging category of our amortized cost of finance receivables in the Customer portfolio segment by origination year.
| | (Millions of dollars) | (Millions of dollars) | March 31, 2022 | (Millions of dollars) | September 30, 2022 |
| | 2022 | | 2021 | | 2020 | | 2019 | | 2018 | | Prior | | Revolving
Finance
Receivables | | | Total
Finance
Receivables | | 2022 | | 2021 | | 2020 | | 2019 | | 2018 | | Prior | | Revolving
Finance
Receivables | | | Total
Finance
Receivables |
| North America | North America | | | | | | | | | | | | | | | | | North America | | | | | | | | | | | | | | | | |
| Current | Current | $ | 1,204 | | | $ | 4,442 | | | $ | 2,323 | | | $ | 1,213 | | | $ | 503 | | | $ | 154 | | | $ | 188 | | | | $ | 10,027 | | Current | $ | 3,151 | | | $ | 3,632 | | | $ | 1,765 | | | $ | 811 | | | $ | 289 | | | $ | 64 | | | $ | 233 | | | | $ | 9,945 | |
| 31-60 days past due | 31-60 days past due | 5 | | | 29 | | | 22 | | | 15 | | | 7 | | | 3 | | | 6 | | | | 87 | | 31-60 days past due | 18 | | | 25 | | | 19 | | | 13 | | | 6 | | | 2 | | | 4 | | | | 87 | |
| 61-90 days past due | 61-90 days past due | — | | | 8 | | | 4 | | | 4 | | | 2 | | | 1 | | | 2 | | | | 21 | | 61-90 days past due | 5 | | | 9 | | | 4 | | | 2 | | | 1 | | | 1 | | | 2 | | | | 24 | |
| 91+ days past due | 91+ days past due | — | | | 10 | | | 13 | | | 10 | | | 11 | | | 8 | | | 5 | | | | 57 | | 91+ days past due | 5 | | | 16 | | | 13 | | | 8 | | | 5 | | | 5 | | | 5 | | | | 57 | |
| | EAME | EAME | | | | EAME | | | |
| Current | Current | 307 | | | 1,369 | | | 739 | | | 496 | | | 295 | | | 136 | | | — | | | | 3,342 | | Current | 873 | | | 1,014 | | | 511 | | | 309 | | | 179 | | | 81 | | | — | | | | 2,967 | |
| 31-60 days past due | 31-60 days past due | 1 | | | 12 | | | 6 | | | 5 | | | 1 | | | — | | | — | | | | 25 | | 31-60 days past due | 6 | | | 12 | | | 5 | | | 4 | | | — | | | — | | | — | | | | 27 | |
| 61-90 days past due | 61-90 days past due | — | | | 4 | | | 4 | | | 1 | | | 1 | | | 1 | | | — | | | | 11 | | 61-90 days past due | 2 | | | 4 | | | 5 | | | 1 | | | 1 | | | — | | | — | | | | 13 | |
| 91+ days past due | 91+ days past due | — | | | 4 | | | 11 | | | 3 | | | 2 | | | 2 | | | — | | | | 22 | | 91+ days past due | 3 | | | 21 | | | 11 | | | 5 | | | 2 | | | 1 | | | — | | | | 43 | |
| | Asia/Pacific | Asia/Pacific | | | | Asia/Pacific | | | |
| Current | Current | 369 | | | 1,313 | | | 786 | | | 317 | | | 91 | | | 30 | | | 38 | | | | 2,944 | | Current | 896 | | | 886 | | | 467 | | | 154 | | | 45 | | | 9 | | | 37 | | | | 2,494 | |
| 31-60 days past due | 31-60 days past due | 1 | | | 14 | | | 19 | | | 9 | | | 1 | | | — | | | — | | | | 44 | | 31-60 days past due | 5 | | | 13 | | | 11 | | | 2 | | | 1 | | | — | | | — | | | | 32 | |
| 61-90 days past due | 61-90 days past due | — | | | 4 | | | 8 | | | 5 | | | 1 | | | — | | | — | | | | 18 | | 61-90 days past due | 1 | | | 6 | | | 6 | | | 2 | | | — | | | — | | | — | | | | 15 | |
| 91+ days past due | 91+ days past due | — | | | 7 | | | 10 | | | 11 | | | 2 | | | — | | | — | | | | 30 | | 91+ days past due | 1 | | | 8 | | | 6 | | | 6 | | | 1 | | | — | | | — | | | | 22 | |
| | Mining | Mining | | | | Mining | | | |
| Current | Current | 197 | | | 858 | | | 321 | | | 303 | | | 168 | | | 167 | | | 48 | | | | 2,062 | | Current | 579 | | | 698 | | | 247 | | | 226 | | | 118 | | | 112 | | | 79 | | | | 2,059 | |
| 31-60 days past due | 31-60 days past due | — | | | — | | | — | | | — | | | — | | | — | | | — | | | | — | | 31-60 days past due | — | | | — | | | — | | | — | | | — | | | — | | | — | | | | — | |
| 61-90 days past due | 61-90 days past due | — | | | — | | | — | | | — | | | — | | | — | | | — | | | | — | | 61-90 days past due | — | | | — | | | — | | | — | | | — | | | 3 | | | — | | | | 3 | |
| 91+ days past due | 91+ days past due | — | | | 1 | | | 1 | | | 8 | | | 12 | | | 8 | | | — | | | | 30 | | 91+ days past due | — | | | — | | | 1 | | | — | | | 3 | | | 1 | | | — | | | | 5 | |
| | Latin America | Latin America | | | | Latin America | | | |
| Current | Current | 204 | | | 607 | | | 270 | | | 137 | | | 45 | | | 29 | | | — | | | | 1,292 | | Current | 584 | | | 443 | | | 176 | | | 86 | | | 24 | | | 14 | | | — | | | | 1,327 | |
| 31-60 days past due | 31-60 days past due | — | | | 6 | | | 7 | | | 5 | | | 16 | | | — | | | — | | | | 34 | | 31-60 days past due | 5 | | | 9 | | | 5 | | | 2 | | | 12 | | | — | | | — | | | | 33 | |
| 61-90 days past due | 61-90 days past due | — | | | 5 | | | 1 | | | 1 | | | 1 | | | — | | | — | | | | 8 | | 61-90 days past due | 4 | | | 4 | | | 2 | | | 1 | | | — | | | — | | | — | | | | 11 | |
| 91+ days past due | 91+ days past due | — | | | 9 | | | 14 | | | 9 | | | 5 | | | 18 | | | — | | | | 55 | | 91+ days past due | — | | | 14 | | | 14 | | | 5 | | | 4 | | | 17 | | | — | | | | 54 | |
| | Caterpillar Power Finance | Caterpillar Power Finance | | | | Caterpillar Power Finance | | | |
| Current | Current | 12 | | | 108 | | | 151 | | | 113 | | | 65 | | | 236 | | | 115 | | | | 800 | | Current | 44 | | | 94 | | | 151 | | | 94 | | | 30 | | | 170 | | | 118 | | | | 701 | |
| 31-60 days past due | 31-60 days past due | 2 | | | — | | | — | | | — | | | — | | | — | | | — | | | | 2 | | 31-60 days past due | — | | | — | | | — | | | — | | | — | | | — | | | — | | | | — | |
| 61-90 days past due | 61-90 days past due | — | | | — | | | — | | | — | | | — | | | — | | | — | | | | — | | 61-90 days past due | — | | | — | | | — | | | — | | | — | | | — | | | — | | | | — | |
| 91+ days past due | 91+ days past due | — | | | — | | | — | | | — | | | — | | | 42 | | | — | | | | 42 | | 91+ days past due | — | | | — | | | — | | | — | | | — | | | 8 | | | — | | | | 8 | |
| | Totals by Aging Category | Totals by Aging Category | | | | Totals by Aging Category | | | |
| Current | Current | 2,293 | | | 8,697 | | | 4,590 | | | 2,579 | | | 1,167 | | | 752 | | | 389 | | | | 20,467 | | Current | 6,127 | | | 6,767 | | | 3,317 | | | 1,680 | | | 685 | | | 450 | | | 467 | | | | 19,493 | |
| 31-60 days past due | 31-60 days past due | 9 | | | 61 | | | 54 | | | 34 | | | 25 | | | 3 | | | 6 | | | | 192 | | 31-60 days past due | 34 | | | 59 | | | 40 | | | 21 | | | 19 | | | 2 | | | 4 | | | | 179 | |
| 61-90 days past due | 61-90 days past due | — | | | 21 | | | 17 | | | 11 | | | 5 | | | 2 | | | 2 | | | | 58 | | 61-90 days past due | 12 | | | 23 | | | 17 | | | 6 | | | 2 | | | 4 | | | 2 | | | | 66 | |
| 91+ days past due | 91+ days past due | — | | | 31 | | | 49 | | | 41 | | | 32 | | | 78 | | | 5 | | | | 236 | | 91+ days past due | 9 | | | 59 | | | 45 | | | 24 | | | 15 | | | 32 | | | 5 | | | | 189 | |
| Total | Total | $ | 2,302 | | | $ | 8,810 | | | $ | 4,710 | | | $ | 2,665 | | | $ | 1,229 | | | $ | 835 | | | $ | 402 | | | | $ | 20,953 | | Total | $ | 6,182 | | | $ | 6,908 | | | $ | 3,419 | | | $ | 1,731 | | | $ | 721 | | | $ | 488 | | | $ | 478 | | | | $ | 19,927 | |
|
| | | | | | | | | | | | | | | | | | | | | | | | | | | | | | | | | | | | | | | | | | | | | | | | | |
| (Millions of dollars) | December 31, 2021 |
| 2021 | | 2020 | | 2019 | | 2018 | | 2017 | | Prior | | Revolving
Finance
Receivables | | | | Total
Finance
Receivables |
| North America | | | | | | | | | | | | | | | | | |
| Current | $ | 4,792 | | | $ | 2,596 | | | $ | 1,426 | | | $ | 630 | | | $ | 182 | | | $ | 32 | | | $ | 182 | | | | | $ | 9,840 | |
| 31-60 days past due | 27 | | | 32 | | | 20 | | | 12 | | | 4 | | | 1 | | | 5 | | | | | 101 | |
| 61-90 days past due | 7 | | | 8 | | | 5 | | | 3 | | | 1 | | | 1 | | | 5 | | | | | 30 | |
| 91+ days past due | 9 | | | 17 | | | 12 | | | 13 | | | 5 | | | 4 | | | 5 | | | | | 65 | |
| | | | | | | | | | | | | | | | | |
| EAME | | | | | | | | | | | | | | | | | |
| Current | 1,499 | | | 836 | | | 577 | | | 352 | | | 140 | | | 26 | | | — | | | | | 3,430 | |
| 31-60 days past due | 5 | | | 4 | | | 3 | | | 1 | | | 1 | | | — | | | — | | | | | 14 | |
| 61-90 days past due | 3 | | | 3 | | | 3 | | | 1 | | | — | | | — | | | — | | | | | 10 | |
| 91+ days past due | 3 | | | 11 | | | 2 | | | 2 | | | — | | | 2 | | | — | | | | | 20 | |
| | | | | | | | | | | | | | | | | |
| Asia/Pacific | | | | | | | | | | | | | | | | | |
| Current | 1,456 | | | 943 | | | 420 | | | 119 | | | 40 | | | 3 | | | 36 | | | | | 3,017 | |
| 31-60 days past due | 10 | | | 14 | | | 10 | | | 2 | | | — | | | — | | | — | | | | | 36 | |
| 61-90 days past due | 3 | | | 7 | | | 4 | | | 1 | | | — | | | — | | | — | | | | | 15 | |
| 91+ days past due | 2 | | | 10 | | | 10 | | | 3 | | | — | | | — | | | — | | | | | 25 | |
| | | | | | | | | | | | | | | | | |
| Mining | | | | | | | | | | | | | | | | | |
| Current | 944 | | | 356 | | | 332 | | | 194 | | | 36 | | | 161 | | | 36 | | | | | 2,059 | |
| 31-60 days past due | 6 | | | — | | | — | | | — | | | — | | | — | | | — | | | | | 6 | |
| 61-90 days past due | 1 | | | — | | | — | | | — | | | 4 | | | — | | | — | | | | | 5 | |
| 91+ days past due | — | | | 1 | | | 8 | | | 9 | | | 3 | | | 1 | | | — | | | | | 22 | |
| | | | | | | | | | | | | | | | | |
| Latin America | | | | | | | | | | | | | | | | | |
| Current | 617 | | | 299 | | | 160 | | | 70 | | | 17 | | | 18 | | | — | | | | | 1,181 | |
| 31-60 days past due | 4 | | | 7 | | | 3 | | | 3 | | | 1 | | | — | | | — | | | | | 18 | |
| 61-90 days past due | 3 | | | 3 | | | 1 | | | 1 | | | — | | | — | | | — | | | | | 8 | |
| 91+ days past due | 4 | | | 9 | | | 9 | | | 7 | | | 7 | | | 14 | | | — | | | | | 50 | |
| | | | | | | | | | | | | | | | | |
| Caterpillar Power Finance | | | | | | | | | | | | | | | | | |
| Current | 120 | | | 152 | | | 119 | | | 70 | | | 180 | | | 104 | | | 101 | | | | | 846 | |
| 31-60 days past due | — | | | — | | | — | | | — | | | — | | | — | | | — | | | | | — | |
| 61-90 days past due | — | | | — | | | — | | | — | | | — | | | — | | | — | | | | | — | |
| 91+ days past due | — | | | — | | | — | | | — | | | — | | | 44 | | | — | | | | | 44 | |
| | | | | | | | | | | | | | | | | |
| | | | | | | | | | | | | | | | | |
| | | | | | | | | | | | | | | | | |
| Totals by Aging Category | | | | | | | | | | | | | | | | | |
| Current | 9,428 | | | 5,182 | | | 3,034 | | | 1,435 | | | 595 | | | 344 | | | 355 | | | | | 20,373 | |
| 31-60 days past due | 52 | | | 57 | | | 36 | | | 18 | | | 6 | | | 1 | | | 5 | | | | | 175 | |
| 61-90 days past due | 17 | | | 21 | | | 13 | | | 6 | | | 5 | | | 1 | | | 5 | | | | | 68 | |
| 91+ days past due | 18 | | | 48 | | | 41 | | | 34 | | | 15 | | | 65 | | | 5 | | | | | 226 | |
| Total | $ | 9,515 | | | $ | 5,308 | | | $ | 3,124 | | | $ | 1,493 | | | $ | 621 | | | $ | 411 | | | $ | 370 | | | | | $ | 20,842 | |
| | | | | | | | | | | | | | | | | |
Finance receivables in the Customer portfolio segment are substantially secured by collateral, primarily in the form of Caterpillar and other equipment. For those contracts where the borrower is experiencing financial difficulty, repayment of the outstanding amounts is generally expected to be provided through the operation or repossession and sale of the equipment.
Dealer
As of March 31,September 30, 2022 our total amortized cost of finance receivables within the Dealer portfolio segment was current, with the exception of $81 million. Of these past due receivables, $78 million were 91+ days past due in Latin America and were originated in 2017. As of December 31, 2021, our total amortized cost of finance receivables within the Dealer portfolio segment was current, with the exception of $62 million and $78 million, respectively, that was 91+ days past due in Latin America, all of which was originated in 2017.
Caterpillar Purchased Receivables
The tables below summarize the aging category of our amortized cost of finance receivables in the Caterpillar Purchased Receivables portfolio segment.
| | (Millions of dollars) | (Millions of dollars) | | | | | | | | | | | | | (Millions of dollars) | | | | | | | | | | | | |
| | | March 31, 2022 | | September 30, 2022 |
| | | 31-60
Days
Past Due | | 61-90
Days
Past Due | | 91+
Days
Past Due | | Total
Past Due | | Current | |
Total Finance
Receivables | | | 31-60
Days
Past Due | | 61-90
Days
Past Due | | 91+
Days
Past Due | | Total
Past Due | | Current | |
Total Finance
Receivables | |
| | North America | North America | $ | 5 | | | $ | 12 | | | $ | 5 | | | $ | 22 | | | $ | 2,481 | | | $ | 2,503 | | | North America | $ | 11 | | | $ | 7 | | | $ | 6 | | | $ | 24 | | | $ | 2,208 | | | $ | 2,232 | | |
| EAME | EAME | 2 | | | — | | | 1 | | | 3 | | | 714 | | | 717 | | | EAME | 1 | | | — | | | 2 | | | 3 | | | 801 | | | 804 | | |
| Asia/Pacific | Asia/Pacific | 1 | | | — | | | — | | | 1 | | | 885 | | | 886 | | | Asia/Pacific | 8 | | | — | | | — | | | 8 | | | 503 | | | 511 | | |
| Mining | Mining | — | | | — | | | — | | | — | | | — | | | — | | | Mining | — | | | — | | | — | | | — | | | — | | | — | | |
| Latin America | Latin America | 3 | | | 1 | | | — | | | 4 | | | 532 | | | 536 | | | Latin America | 8 | | | 8 | | | 9 | | | 25 | | | 383 | | | 408 | | |
| Caterpillar Power Finance | Caterpillar Power Finance | 1 | | | — | | | — | | | 1 | | | 4 | | | 5 | | | Caterpillar Power Finance | — | | | — | | | 1 | | | 1 | | | 6 | | | 7 | | |
| Total | Total | $ | 12 | | | $ | 13 | | | $ | 6 | | | $ | 31 | | | $ | 4,616 | | | $ | 4,647 | | | Total | $ | 28 | | | $ | 15 | | | $ | 18 | | | $ | 61 | | | $ | 3,901 | | | $ | 3,962 | | |
|
| | | | | | | | | | | | | | | | | | | | | | | | | | | | | | | | | | | | | |
| (Millions of dollars) | | | | | | | | | | | | | |
| | December 31, 2021 |
| | 31-60
Days
Past Due | | 61-90
Days
Past Due | | 91+
Days
Past Due | | Total
Past Due | | Current | |
Total Finance
Receivables | | |
| | | | | | | | | | | | | |
| | | | | | | | | | | | | |
| | | | | | | | | | | | | |
| | | | | | | | | | | | | |
| | | | | | | | | | | | | |
| | | | | | | | | | | | | |
| | | | | | | | | | | | | |
| | | | | | | | | | | | | |
| | | | | | | | | | | | | |
| | | | | | | | | | | | | |
| | | | | | | | | | | | | |
| | | | | | | | | | | | | |
| | | | | | | | | | | | | |
| | | | | | | | | | | | | |
| | | | | | | | | | | | | |
| North America | $ | 8 | | | $ | 6 | | | $ | 5 | | | $ | 19 | | | $ | 2,499 | | | $ | 2,518 | | | |
| EAME | 1 | | | — | | | 1 | | | 2 | | | 844 | | | 846 | | | |
| Asia/Pacific | — | | | — | | | 1 | | | 1 | | | 620 | | | 621 | | | |
| Mining | — | | | — | | | — | | | — | | | — | | | — | | | |
| Latin America | 1 | | | 1 | | | — | | | 2 | | | 472 | | | 474 | | | |
| Caterpillar Power Finance | — | | | — | | | — | | | — | | | 3 | | | 3 | | | |
| Total | $ | 10 | | | $ | 7 | | | $ | 7 | | | $ | 24 | | | $ | 4,438 | | | $ | 4,462 | | | |
| | | | | | | | | | | | | |
Non-accrual finance receivables
Recognition of income is suspended and the finance receivable is placed on non-accrual status when management determines that collection of future income is not probable. Contracts on non-accrual status are generally more than 120 days past due or have been restructured in a TDR. Recognition is resumed and previously suspended income is recognized when collection is considered probable. Payments received while the finance receivable is on non-accrual status are applied to interest and principal in accordance with the contractual terms. Interest earned but uncollected prior to the receivable being placed on non-accrual status is written off through Provision for credit losses when, in the judgment of management, it is considered uncollectible.
In our Customer portfolio segment, finance receivables which were on non-accrual status and finance receivables over 90 days past due and still accruing income were as follows:
| | (Millions of dollars) | (Millions of dollars) | March 31, 2022 | | December 31, 2021 | (Millions of dollars) | September 30, 2022 | | December 31, 2021 |
| | Amortized Cost | | Amortized Cost | | Amortized Cost | | Amortized Cost |
| | Non-accrual
With an
Allowance | | Non-accrual
Without an
Allowance | | 91+ Still
Accruing | | Non-accrual
With an
Allowance | | Non-accrual
Without an
Allowance | | 91+ Still
Accruing | | Non-accrual
With an
Allowance | | Non-accrual
Without an
Allowance | | 91+ Still
Accruing | | Non-accrual
With an
Allowance | | Non-accrual
Without an
Allowance | | 91+ Still
Accruing |
| North America | North America | $ | 43 | | | $ | 6 | | | $ | 13 | | | $ | 47 | | | $ | 9 | | | $ | 12 | | North America | $ | 54 | | | $ | 5 | | | $ | 10 | | | $ | 47 | | | $ | 9 | | | $ | 12 | |
| EAME | EAME | 20 | | | 1 | | | 2 | | | 18 | | | 1 | | | 2 | | EAME | 42 | | | — | | | 4 | | | 18 | | | 1 | | | 2 | |
| Asia/Pacific | Asia/Pacific | 13 | | | — | | | 18 | | | 19 | | | — | | | 7 | | Asia/Pacific | 15 | | | — | | | 7 | | | 19 | | | — | | | 7 | |
| Mining | Mining | 28 | | | 1 | | | 1 | | | 8 | | | 1 | | | 14 | | Mining | 6 | | | 1 | | | — | | | 8 | | | 1 | | | 14 | |
| Latin America | Latin America | 56 | | | — | | | 1 | | | 52 | | | 4 | | | 1 | | Latin America | 57 | | | — | | | — | | | 52 | | | 4 | | | 1 | |
| Caterpillar Power Finance | Caterpillar Power Finance | 31 | | | 12 | | | — | | | 40 | | | 11 | | | — | | Caterpillar Power Finance | 9 | | | 11 | | | — | | | 40 | | | 11 | | | — | |
| Total | Total | $ | 191 | | | $ | 20 | | | $ | 35 | | | $ | 184 | | | $ | 26 | | | $ | 36 | | Total | $ | 183 | | | $ | 17 | | | $ | 21 | | | $ | 184 | | | $ | 26 | | | $ | 36 | |
|
There was $1$2 million and $3$1 million of interest income recognized during the three months ended March 31,September 30, 2022 and 2021, respectively, for customer finance receivables on non-accrual status. There was $11 million and $9 million of interest income recognized during the nine months ended September 30, 2022 and 2021, respectively, for customer finance receivables on non-accrual status.
There were $62 million and $78 million in finance receivables in our Dealer portfolio segment on non-accrual status as of March 31,September 30, 2022 and December 31, 2021, respectively, all of which was in Latin America. There were no finance receivables in our Dealer portfolio segment more than 90 days past due and still accruing income as of March 31,September 30, 2022 and December 31, 2021 and no interest income was recognized on dealer finance receivables on non-accrual status during the three and nine months ended March 31,September 30, 2022 and 2021.
Troubled debt restructurings
A restructuring of a finance receivable constitutes a TDR when the lender grants a concession it would not otherwise consider to a borrower experiencing financial difficulties. Concessions granted may include extended contract maturities, inclusion of interest only periods, below market interest rates, payment deferrals and reduction of principal and/or accrued interest. We individually evaluate TDR contracts and establish an allowance based on the present value of expected future cash flows discounted at the receivable’s effective interest rate, the fair value of the collateral for collateral-dependent receivables or the observable market price of the receivable.
There were no finance receivables modified as TDRs during the three and nine months ended March 31,September 30, 2022 and 2021 for the Dealer or Caterpillar Purchased Receivables portfolio segments. Finance receivables in the Customer portfolio segment modified as TDRs were as follows:
| | (Millions of dollars) | (Millions of dollars) | Three Months Ended
March 31, 2022 | | Three Months Ended
March 31, 2021 | (Millions of dollars) | Three Months Ended
September 30, 2022 | | Three Months Ended
September 30, 2021 |
| | | Pre-TDR
Amortized
Cost | | Post-TDR
Amortized
Cost | | Pre-TDR
Amortized
Cost | | Post-TDR
Amortized
Cost | | Pre-TDR
Amortized
Cost | | Post-TDR
Amortized
Cost | | Pre-TDR
Amortized
Cost | | Post-TDR
Amortized
Cost |
| | North America | | North America | $ | 3 | | | $ | 3 | | | $ | 1 | | | $ | 1 | |
| EAME | EAME | $ | 1 | | | $ | 1 | | | $ | — | | | $ | — | | EAME | — | | | — | | | 1 | | | 1 | |
| | Asia/Pacific | | Asia/Pacific | — | | | — | | | 4 | | | 4 | |
| Mining | Mining | — | | | — | | | 11 | | | 5 | | Mining | 15 | | | 15 | | | — | | | — | |
| | Latin America | | Latin America | — | | | — | | | 4 | | | 4 | |
| Caterpillar Power Finance | Caterpillar Power Finance | 6 | | | 6 | | | — | | | — | | Caterpillar Power Finance | 11 | | | 11 | | | 7 | | | 3 | |
| Total | Total | $ | 7 | | | $ | 7 | | | $ | 11 | | | $ | 5 | | Total | $ | 29 | | | $ | 29 | | | $ | 17 | | | $ | 13 | |
| | | | Nine Months Ended
September 30, 2022 | | Nine Months Ended
September 30, 2021 |
| | | Pre-TDR
Amortized
Cost | | Post-TDR
Amortized
Cost | | Pre-TDR
Amortized
Cost | | Post-TDR
Amortized
Cost |
| North America | | North America | $ | 4 | | | $ | 4 | | | $ | 5 | | | $ | 5 | |
| EAME | | EAME | 1 | | | 1 | | | 1 | | | 1 | |
| Asia/Pacific | | Asia/Pacific | — | | | — | | | 4 | | | 4 | |
| Mining | | Mining | 15 | | | 15 | | | 11 | | | 5 | |
| Latin America | | Latin America | — | | | — | | | 10 | | | 10 | |
| Caterpillar Power Finance | | Caterpillar Power Finance | 20 | | | 19 | | | 23 | | | 19 | |
| Total | | Total | $ | 40 | | | $ | 39 | | | $ | 54 | | | $ | 44 | |
| |
The Post-TDR amortized cost of TDRs in the Customer portfolio segment with a payment default (defined as 91+ days past due) which had been modified within twelve months prior to the default date, was as follows:
| | (Millions of dollars) | (Millions of dollars) | Three Months Ended March 31, | | (Millions of dollars) | Three Months Ended September 30, | | Nine Months Ended September 30, |
| | 2022 | | 2021 | | | 2022 | | 2021 | | 2022 | | 2021 |
| North America | North America | $ | — | | | $ | 1 | | | North America | $ | — | | | $ | — | | | $ | — | | | $ | 1 | |
| | Asia/Pacific | Asia/Pacific | — | | | 4 | | | Asia/Pacific | — | | | — | | | — | | | 6 | |
| Mining | Mining | 5 | | | — | | | Mining | — | | | — | | | 5 | | | — | |
| | Latin America | | Latin America | — | | | — | | | — | | | 15 | |
| Caterpillar Power Finance | Caterpillar Power Finance | — | | | 5 | | | Caterpillar Power Finance | — | | | — | | | — | | | 5 | |
| Total | Total | $ | 5 | | | $ | 10 | | | Total | $ | — | | | $ | — | | | $ | 5 | | | $ | 27 | |
|
4.Derivative Financial Instruments and Risk Management
Our earnings and cash flow are subject to fluctuations due to changes in foreign currency exchange rates and interest rates. Our Risk Management Policy (policy) allows for the use of derivative financial instruments to prudently manage foreign currency exchange rate and interest rate exposures. Our policy specifies that derivatives are not to be used for speculative purposes. Derivatives that we use are primarily foreign currency forward, option and cross currency contracts and interest rate contracts. Our derivative activities are subject to the management, direction and control of our senior financial officers. We present at least annually to our Board of Directors and the Audit Committee of the Caterpillar Inc. Board of Directors on our risk management practices, including our use of financial derivative instruments.
All derivatives are recognized on the Consolidated Statements of Financial Position at their fair value. On the date the derivative contract is entered into, the derivative instrument is (1) designated as a hedge of the fair value of a recognized asset or liability (fair value hedge), (2) designated as a hedge of a forecasted transaction or the variability of cash flows (cash flow hedge) or (3) undesignated. We record in current earnings changes in the fair value of a derivative that is qualified, designated and highly effective as a fair value hedge, along with the gain or loss on the hedged recognized asset or liability that is attributable to the hedged risk. We record in Accumulated other comprehensive income (loss) (AOCI) changes in the fair value of a derivative that is qualified, designated and highly effective as a cash flow hedge, to the extent effective, on the Consolidated Statements of Financial Position until we reclassify them to earnings in the same period or periods during which the hedged transaction affects earnings. We report changes in the fair value of undesignated derivative instruments in current earnings. We classify cash flows from designated derivative financial instruments within the same category as the item being hedged on the Consolidated Statements of Cash Flows. We include cash flows from undesignated derivative financial instruments in the investing category on the Consolidated Statements of Cash Flows.
We formally document all relationships between hedging instruments and hedged items, as well as the risk-management objective and strategy for undertaking various hedge transactions. This process includes linking all derivatives that are designated as fair value hedges to specific assets and liabilities on the Consolidated Statements of Financial Position and linking cash flow hedges to specific forecasted transactions or variability of cash flow.
We also formally assess, both at the hedge’s inception and on an ongoing basis, whether the designated derivatives that are used in hedging transactions are highly effective in offsetting changes in fair value or cash flow of hedged items. When a derivative is determined not to be highly effective as a hedge or the underlying hedged transaction is no longer probable, we discontinue hedge accounting prospectively, in accordance with the derecognition criteria for hedge accounting.
Foreign currency exchange rate risk
We have balance sheet positions and expected future transactions denominated in foreign currencies, thereby creating exposure to movements in exchange rates. In managing foreign currency risk, our objective is to minimize earnings volatility resulting from conversion and the remeasurement of net foreign currency balance sheet positions and future transactions denominated in foreign currencies. Our policy allows the use of foreign currency forward, option and cross currency contracts to offset the risk of currency mismatch between our assets and liabilities and exchange rate risk associated with future transactions denominated in foreign currencies. Our foreign currency forward and option contracts are primarily undesignated. We designate fixed-to-fixed cross currency contracts as cash flow hedges to protect against movements in exchange rates on foreign currency fixed-rate assets and liabilities.
Interest rate risk
Interest rate movements create a degree of risk by affecting the amount of our interest payments and the value of our fixed-rate debt. Our practice is to use interest rate contracts to manage our exposure to interest rate changes.
We have a match-funding policy that addresses interest rate risk by aligning the interest rate profile (fixed or floating rate and duration) of our debt portfolio with the interest rate profile of our finance receivable portfolio within predetermined ranges on an ongoing basis. In connection with that policy, we use interest rate derivative instruments to modify the debt structure to match assets within the finance receivable portfolio. This matched funding reduces the volatility of margins between interest-bearing assets and interest-bearing liabilities, regardless of which direction interest rates move.
Our policy allows us to use fixed-to-floating, floating-to-fixed and floating-to-floating interest rate contracts to meet the match-funding objective. We designate fixed-to-floating interest rate contracts as fair value hedges to protect debt against changes in fair value due to changes in the benchmark interest rate. We designate most floating-to-fixed interest rate contracts as cash flow hedges to protect against the variability of cash flows due to changes in the benchmark interest rate. We have, at certain times, liquidated fixed-to-floating and floating-to-fixed interest rate contracts. We amortize the gains or losses associated with these contracts at the time of liquidation into earnings over the original term of the previously designated hedged item.
The location and fair value of derivative instruments reported in the Consolidated Statements of Financial Position were as follows:
| | (Millions of dollars) | (Millions of dollars) | | (Millions of dollars) | |
| | | March 31, 2022 | | December 31, 2021 | | September 30, 2022 | | December 31, 2021 |
| | Assets1 | | Liabilities2 | | Assets1 | | Liabilities2 | | Assets1 | | Liabilities2 | | Assets1 | | Liabilities2 |
| Designated derivatives | Designated derivatives | | | | | | | | | Designated derivatives | | | | | | | | |
| Foreign exchange contracts | Foreign exchange contracts | | $ | 131 | | | $ | (78) | | | $ | 142 | | | $ | (32) | | Foreign exchange contracts | | $ | 605 | | | $ | (4) | | | $ | 142 | | | $ | (32) | |
| Interest rate contracts | Interest rate contracts | | 75 | | | (59) | | | 38 | | | (15) | | Interest rate contracts | | 94 | | | (119) | | | 38 | | | (15) | |
| | $ | 206 | | | $ | (137) | | | $ | 180 | | | $ | (47) | | | $ | 699 | | | $ | (123) | | | $ | 180 | | | $ | (47) | |
| Undesignated derivatives | Undesignated derivatives | | | | | | | | | Undesignated derivatives | | | | | | | | |
| Foreign exchange contracts | Foreign exchange contracts | | $ | 35 | | | $ | (81) | | | $ | 28 | | | $ | (36) | | Foreign exchange contracts | | $ | 100 | | | $ | (49) | | | $ | 28 | | | $ | (36) | |
| | $ | 35 | | | $ | (81) | | | $ | 28 | | | $ | (36) | | | $ | 100 | | | $ | (49) | | | $ | 28 | | | $ | (36) | |
|
(1) Assets are classified on the Consolidated Statements of Financial Position as Other assets.
(2) Liabilities are classified on the Consolidated Statements of Financial Position as Accrued expenses.
The total notional amount of our derivative instruments was $13.42$14.02 billion and $13.85 billion as of March 31,September 30, 2022 and December 31, 2021, respectively. The notional amounts of derivative financial instruments do not represent amounts exchanged by the parties. We calculate the amounts exchanged by the parties by referencing the notional amounts and by other terms of the derivatives, such as foreign currency exchange rates and interest rates.
The effect of derivativesGains (Losses) on the Consolidated Statements of Profit wasderivative instruments are categorized as follows:
| | (Millions of dollars) | (Millions of dollars) | | (Millions of dollars) | |
| | Fair Value /
Undesignated Hedges | | Cash Flow Hedges | | Fair Value /
Undesignated Hedges | | Cash Flow Hedges |
| | Gains (Losses) Recognized1 | | Gains (Losses)
Recognized in AOCI | | Gains (Losses) Reclassified from AOCI2 | | Gains (Losses) Recognized1 | | Gains (Losses)
Recognized in AOCI | | Gains (Losses) Reclassified from AOCI2 |
| | | Three Months Ended March 31, | | Three Months Ended September 30, |
| | 2022 | | 2021 | | 2022 | | 2021 | | 2022 | | 2021 | | 2022 | | 2021 | | 2022 | | 2021 | | 2022 | | 2021 |
| Foreign exchange contracts | Foreign exchange contracts | | $ | (79) | | | $ | 86 | | | $ | (27) | | | $ | 119 | | | $ | 16 | | | $ | 114 | | Foreign exchange contracts | | $ | 16 | | | $ | 44 | | | $ | 276 | | | $ | 89 | | | $ | 303 | | | $ | 84 | |
| Interest rate contracts | Interest rate contracts | | 6 | | | 6 | | | 56 | | | — | | | (6) | | | (10) | | Interest rate contracts | | (5) | | | 5 | | | 26 | | | 3 | | | 8 | | | (5) | |
| | $ | (73) | | | $ | 92 | | | $ | 29 | | | $ | 119 | | | $ | 10 | | | $ | 104 | | | $ | 11 | | | $ | 49 | | | $ | 302 | | | $ | 92 | | | $ | 311 | | | $ | 79 | |
| | | | Nine Months Ended September 30, |
| | | 2022 | | 2021 | | 2022 | | 2021 | | 2022 | | 2021 |
| Foreign exchange contracts | | Foreign exchange contracts | | $ | (26) | | | $ | 72 | | | $ | 570 | | | $ | 170 | | | $ | 656 | | | $ | 166 | |
| Interest rate contracts | | Interest rate contracts | | 4 | | | 18 | | | 103 | | | 4 | | | — | | | (21) | |
| | | $ | (22) | | | $ | 90 | | | $ | 673 | | | $ | 174 | | | $ | 656 | | | $ | 145 | |
| |
(1)Foreign exchange contract gains (losses) are primarily from undesignated forward contracts and are included in Other income (expense). Interest rate contract gains (losses) are from designated fair value hedges and are included in Interest expense.
(2)Foreign exchange contract gains (losses) are primarily included in Other income (expense). Interest rate contract gains (losses) are included in Interest expense.
The following amounts were recorded in the Consolidated Statements of Financial Position related to cumulative basis adjustments for fair value hedges:
| | (Millions of dollars) | (Millions of dollars) | | (Millions of dollars) | |
| | Carrying Value of
the Hedged Liabilities | | Cumulative Amount of Fair Value
Hedging Adjustment Included in the
Carrying Value of the Hedged
Liabilities | | Carrying Value of
the Hedged Liabilities | | Cumulative Amount of Fair Value
Hedging Adjustment Included in the
Carrying Value of the Hedged
Liabilities |
| | March 31, 2022 | | December 31, 2021 | | March 31, 2022 | | December 31, 2021 | | September 30, 2022 | | December 31, 2021 | | September 30, 2022 | | December 31, 2021 |
| Current maturities of long-term debt | Current maturities of long-term debt | | $ | 750 | | | $ | 755 | | | $ | — | | | $ | 5 | | Current maturities of long-term debt | | $ | — | | | $ | 755 | | | $ | — | | | $ | 5 | |
| Long-term debt | Long-term debt | | 1,447 | | | 1,304 | | | (59) | | | (2) | | Long-term debt | | 1,980 | | | 1,304 | | | (119) | | | (2) | |
| Total | Total | | $ | 2,197 | | | $ | 2,059 | | | $ | (59) | | | $ | 3 | | Total | | $ | 1,980 | | | $ | 2,059 | | | $ | (119) | | | $ | 3 | |
|
As of March 31,September 30, 2022, $10$32 million of deferred net gains, net of tax, included in equity (AOCI in the Consolidated Statements of Financial Position), related to our cash flow hedges, are expected to be reclassified to earnings over the next twelve months. The actual amount recorded in earnings will vary based on interest rates and exchange rates at the time the hedged transactions impact earnings.
We enter into International Swaps and Derivatives Association master netting agreements that permit the net settlement of amounts owed under their respective derivative contracts. Under these master netting agreements, net settlement generally permits us or the counterparty to determine the net amount payable for contracts due on the same date and in the same currency for similar types of derivative transactions. The master netting agreements generallymay also provide for net settlement of all outstanding contracts with a counterparty in the case of an event of default or a termination event.
Collateral is generallytypically not required of the counterparties or us under the master netting agreements. As of March 31,September 30, 2022 and December 31, 2021, no cash collateral was received or pledged under the master netting agreements.
The effect of net settlement provisions of the master netting agreements on our derivative balances upon an event of default or a termination event was as follows:
| | (Millions of dollars) | (Millions of dollars) | | (Millions of dollars) | |
| | March 31, 2022 | | December 31, 2021 | | September 30, 2022 | | December 31, 2021 |
| | Assets | | Liabilities | | Assets | | Liabilities | | Assets | | Liabilities | | Assets | | Liabilities |
| Gross amounts recognized | Gross amounts recognized | | $ | 241 | | | $ | (218) | | | $ | 208 | | | $ | (83) | | Gross amounts recognized | | $ | 799 | | | $ | (172) | | | $ | 208 | | | $ | (83) | |
| Financial instruments not offset | Financial instruments not offset | | (96) | | | 96 | | | (67) | | | 67 | | Financial instruments not offset | | (169) | | | 169 | | | (67) | | | 67 | |
| | Net amount | Net amount | | $ | 145 | | | $ | (122) | | | $ | 141 | | | $ | (16) | | Net amount | | $ | 630 | | | $ | (3) | | | $ | 141 | | | $ | (16) | |
|
5.Accumulated Other Comprehensive Income (Loss)
We present Comprehensive income (loss) and its components in the Consolidated Statements of Comprehensive Income. Changes in Accumulated other comprehensive income (loss) included in the Consolidated Statements of Changes in Shareholder’s Equity consisted of the following:
| | (Millions of dollars) | (Millions of dollars) | | Three Months Ended
March 31, | | (Millions of dollars) | | Three Months Ended
September 30, | | Nine Months Ended
September 30, |
| | 2022 | | 2021 | | | 2022 | | 2021 | | 2022 | | 2021 |
| Foreign currency translation | Foreign currency translation | | | | | | Foreign currency translation | | | | | | | | |
| Balance at beginning of period | Balance at beginning of period | | $ | (762) | | | $ | (551) | | | Balance at beginning of period | | $ | (1,002) | | | $ | (601) | | | $ | (762) | | | $ | (551) | |
| | Gains (losses) on foreign currency translation | Gains (losses) on foreign currency translation | | 19 | | | (94) | | | Gains (losses) on foreign currency translation | | (258) | | | (122) | | | (456) | | | (154) | |
| Less: Tax provision/(benefit) | Less: Tax provision/(benefit) | | 11 | | | 25 | | | Less: Tax provision/(benefit) | | 30 | | | 13 | | | 72 | | | 31 | |
| Net gains (losses) on foreign currency translation | Net gains (losses) on foreign currency translation | | 8 | | | (119) | | | Net gains (losses) on foreign currency translation | | (288) | | | (135) | | | (528) | | | (185) | |
| | Other comprehensive income (loss), net of tax | Other comprehensive income (loss), net of tax | | 8 | | | (119) | | | Other comprehensive income (loss), net of tax | | (288) | | | (135) | | | (528) | | | (185) | |
| Balance at end of period | Balance at end of period | | $ | (754) | | | $ | (670) | | | Balance at end of period | | $ | (1,290) | | | $ | (736) | | | $ | (1,290) | | | $ | (736) | |
| | Derivative financial instruments | Derivative financial instruments | | | Derivative financial instruments | |
| Balance at beginning of period | Balance at beginning of period | | $ | (12) | | | $ | (44) | | | Balance at beginning of period | | $ | 11 | | | $ | (32) | | | $ | (12) | | | $ | (44) | |
| | Gains (losses) deferred | Gains (losses) deferred | | 29 | | | 119 | | | Gains (losses) deferred | | 302 | | | 92 | | | 673 | | | 174 | |
| Less: Tax provision/(benefit) | Less: Tax provision/(benefit) | | 6 | | | 25 | | | Less: Tax provision/(benefit) | | 95 | | | 14 | | | 158 | | | 30 | |
| Net gains (losses) deferred | Net gains (losses) deferred | | 23 | | | 94 | | | Net gains (losses) deferred | | 207 | | | 78 | | | 515 | | | 144 | |
| (Gains) losses reclassified to earnings | (Gains) losses reclassified to earnings | | (10) | | | (104) | | | (Gains) losses reclassified to earnings | | (311) | | | (79) | | | (656) | | | (145) | |
| Less: Tax (provision)/benefit | Less: Tax (provision)/benefit | | (3) | | | (21) | | | Less: Tax (provision)/benefit | | (99) | | | (10) | | | (159) | | | (22) | |
| Net (gains) losses reclassified to earnings | Net (gains) losses reclassified to earnings | | (7) | | | (83) | | | Net (gains) losses reclassified to earnings | | (212) | | | (69) | | | (497) | | | (123) | |
| Other comprehensive income (loss), net of tax | Other comprehensive income (loss), net of tax | | 16 | | | 11 | | | Other comprehensive income (loss), net of tax | | (5) | | | 9 | | | 18 | | | 21 | |
| Balance at end of period | Balance at end of period | | $ | 4 | | | $ | (33) | | | Balance at end of period | | $ | 6 | | | $ | (23) | | | $ | 6 | | | $ | (23) | |
| | Total Accumulated other comprehensive income (loss) at end of period | Total Accumulated other comprehensive income (loss) at end of period | | $ | (750) | | | $ | (703) | | | Total Accumulated other comprehensive income (loss) at end of period | | $ | (1,284) | | | $ | (759) | | | $ | (1,284) | | | $ | (759) | |
|
6.Segment Information
A. Basis for Segment Information
We report information internally for operating segments based on management responsibility. Our operating segments provide financing alternatives to customers and dealers around the world for Caterpillar products and services and vehicles, power generation facilities and marine vessels that, in most cases, incorporate Caterpillar products. Financing products include operating and finance leases, retail loans, working capital loans to Caterpillar dealers and wholesale financing plans within each of the operating segments. Certain operating segments also purchase short-term trade receivables from Caterpillar.
B. Description of Segments
We have six operating segments that offer financing services. Following is a brief description of our segments:
•North America - Includes our operations in the United States and Canada.
•EAME - Includes our operations in Europe, Africa, the Middle East and the Commonwealth of Independent States.
•Asia/Pacific - Includes our operations in Australia, New Zealand, China, Japan, Southeast Asia and India.
•Latin America - Includes our operations in Mexico and Central and South American countries.
•Mining - Provides financing for large mining customers worldwide.
•Caterpillar Power Finance - Provides financing worldwide for marine vessels with Caterpillar engines and for Caterpillar electrical power generation, gas compression and co-generation systems and non-Caterpillar equipment that is powered by these systems.
C. Segment Measurement and Reconciliations
Cash, debt and other expenses are allocated to our segments based on their respective portfolios. The related Interest expense is calculated based on the amount of allocated debt and the rates associated with that debt. The performance of each segment is assessed based on a consistent leverage ratio. The Provision for credit losses is based on each segment’s respective finance receivable portfolio. Capital expenditures include expenditures for equipment on operating leases and other miscellaneous capital expenditures.
Reconciling items are created based on accounting differences between segment reporting and consolidated external reporting. For the reconciliation of Profit before income taxes, we have grouped the reconciling items as follows:
•Unallocated - This item is related to corporate requirements and strategies that are considered to be for the benefit of the entire organization. Also included are the consolidated results of the special purpose corporation (see Note 7 for additional information) and other miscellaneous items.
•Timing - Timing differences in the recognition of costs between segment reporting and consolidated external reporting.
•Methodology - Methodology differences between segment reporting and consolidated external reporting are as follows:
◦Segment assets include off-balance sheet managed assets for which we maintain servicing responsibilities.
◦The impact of differences between the actual leverage and the segment leverage ratios.
◦Interest expense includes realized forward points on foreign currency forward contracts.
◦The net gain or loss from interest rate derivatives is excluded from segment reporting.
Supplemental segment data and reconciliations to consolidated external reporting for the three months ended March 31September 30 was as follows:
| (Millions of dollars)
2022 | (Millions of dollars)
2022 | External
Revenues | | Profit
before
income
taxes | | Interest
Expense | | Depreciation
on equipment
leased to
others | | Provision
for
credit
losses | | Assets at
March 31,
2022 | | Capital
expenditures | (Millions of dollars)
2022 | External
Revenues | | Profit
before
income
taxes | | Interest
Expense | | Depreciation
on equipment
leased to
others | | Provision
for
credit
losses | | Assets at
September 30,
2022 | | Capital
expenditures |
| North America | North America | $ | 359 | | | $ | 127 | | | $ | 54 | | | $ | 128 | | | $ | 6 | | | $ | 15,846 | | | $ | 199 | | North America | $ | 383 | | | $ | 150 | | | $ | 69 | | | $ | 126 | | | $ | (5) | | | $ | 15,014 | | | $ | 205 | |
| EAME | EAME | 67 | | | — | | | 7 | | | 14 | | | 26 | | | 4,959 | | | 14 | | EAME | 72 | | | — | | | 27 | | | 13 | | | 7 | | | 4,724 | | | 45 | |
| Asia/Pacific | Asia/Pacific | 75 | | | 37 | | | 17 | | | 1 | | | 1 | | | 4,255 | | | 2 | | Asia/Pacific | 70 | | | 33 | | | 19 | | | 1 | | | 1 | | | 3,705 | | | 3 | |
| Latin America | Latin America | 58 | | | 19 | | | 26 | | | 2 | | | (1) | | | 2,541 | | | 2 | | Latin America | 75 | | | 31 | | | 37 | | | 3 | | | (8) | | | 2,539 | | | 3 | |
| Mining | Mining | 72 | | | 20 | | | 8 | | | 38 | | | (2) | | | 2,679 | | | 22 | | Mining | 72 | | | 21 | | | 11 | | | 35 | | | (4) | | | 2,553 | | | 36 | |
| Caterpillar Power Finance | Caterpillar Power Finance | 19 | | | 15 | | | 3 | | | 1 | | | (3) | | | 909 | | | — | | Caterpillar Power Finance | 11 | | | 12 | | | 5 | | | 1 | | | (7) | | | 738 | | | — | |
| Total Segments | Total Segments | 650 | | | 218 | | | 115 | | | 184 | | | 27 | | | 31,189 | | | 239 | | Total Segments | 683 | | | 247 | | | 168 | | | 179 | | | (16) | | | 29,273 | | | 292 | |
| Unallocated | Unallocated | 5 | | | (72) | | | 42 | | | — | | | — | | | 1,477 | | | 2 | | Unallocated | 10 | | | (80) | | | 53 | | | — | | | — | | | 1,762 | | | 2 | |
| Timing | Timing | (3) | | | 1 | | | — | | | — | | | — | | | 16 | | | — | | Timing | (3) | | | — | | | — | | | — | | | — | | | 18 | | | — | |
| Methodology | Methodology | — | | | 46 | | | (51) | | | — | | | — | | | 82 | | | — | | Methodology | — | | | 21 | | | (70) | | | — | | | — | | | 582 | | | — | |
Inter-segment Eliminations (1) | Inter-segment Eliminations (1) | — | | | — | | | — | | | — | | | — | | | (169) | | | — | | Inter-segment Eliminations (1) | — | | | — | | | — | | | — | | | — | | | (152) | | | — | |
| Total | Total | $ | 652 | | | $ | 193 | | | $ | 106 | | | $ | 184 | | | $ | 27 | | | $ | 32,595 | | | $ | 241 | | Total | $ | 690 | | | $ | 188 | | | $ | 151 | | | $ | 179 | | | $ | (16) | | | $ | 31,483 | | | $ | 294 | |
| | 2021 | 2021 | External
Revenues | | Profit
before
income
taxes | | Interest
Expense | | Depreciation
on equipment
leased to
others | | Provision
for
credit
losses | | Assets at
December 31,
2021 | | Capital
expenditures | 2021 | External
Revenues | | Profit
before
income
taxes | | Interest
Expense | | Depreciation
on equipment
leased to
others | | Provision
for
credit
losses | | Assets at
December 31,
2021 | | Capital
expenditures |
| North America | North America | $ | 347 | | | $ | 99 | | | $ | 69 | | | $ | 137 | | | $ | 1 | | | $ | 15,755 | | | $ | 178 | | North America | $ | 349 | | | $ | 94 | | | $ | 62 | | | $ | 138 | | | $ | 10 | | | $ | 15,755 | | | $ | 236 | |
| EAME | EAME | 67 | | | 30 | | | 5 | | | 15 | | | (4) | | | 5,192 | | | 10 | | EAME | 69 | | | 26 | | | 6 | | | 15 | | | — | | | 5,192 | | | 40 | |
| Asia/Pacific | Asia/Pacific | 92 | | | 51 | | | 23 | | | 2 | | | — | | | 4,117 | | | 3 | | Asia/Pacific | 78 | | | 33 | | | 18 | | | 1 | | | 7 | | | 4,117 | | | 4 | |
| Latin America | Latin America | 47 | | | 16 | | | 14 | | | 2 | | | 3 | | | 2,405 | | | 7 | | Latin America | 52 | | | (19) | | | 19 | | | 2 | | | 40 | | | 2,405 | | | 1 | |
| Mining | Mining | 71 | | | 18 | | | 10 | | | 35 | | | (3) | | | 2,672 | | | 26 | | Mining | 73 | | | 22 | | | 8 | | | 34 | | | 2 | | | 2,672 | | | 28 | |
| Caterpillar Power Finance | Caterpillar Power Finance | 13 | | | 11 | | | 4 | | | 1 | | | (7) | | | 957 | | | — | | Caterpillar Power Finance | 13 | | | 4 | | | 3 | | | 1 | | | — | | | 957 | | | — | |
| Total Segments | Total Segments | 637 | | | 225 | | | 125 | | | 192 | | | (10) | | | 31,098 | | | 224 | | Total Segments | 634 | | | 160 | | | 116 | | | 191 | | | 59 | | | 31,098 | | | 309 | |
| Unallocated | Unallocated | 5 | | | (72) | | | 50 | | | — | | | — | | | 1,458 | | | 4 | | Unallocated | 3 | | | (71) | | | 43 | | | — | | | — | | | 1,458 | | | 2 | |
| Timing | Timing | (3) | | | 1 | | | — | | | — | | | — | | | 15 | | | — | | Timing | (3) | | | 2 | | | — | | | — | | | — | | | 15 | | | — | |
| Methodology | Methodology | — | | | 42 | | | (50) | | | — | | | — | | | 18 | | | — | | Methodology | — | | | 40 | | | (49) | | | — | | | — | | | 18 | | | — | |
Inter-segment Eliminations (1) | Inter-segment Eliminations (1) | — | | | — | | | — | | | — | | | — | | | (202) | | | — | | Inter-segment Eliminations (1) | — | | | — | | | — | | | — | | | — | | | (202) | | | — | |
| Total | Total | $ | 639 | | | $ | 196 | | | $ | 125 | | | $ | 192 | | | $ | (10) | | | $ | 32,387 | | | $ | 228 | | Total | $ | 634 | | | $ | 131 | | | $ | 110 | | | $ | 191 | | | $ | 59 | | | $ | 32,387 | | | $ | 311 | |
|
(1) Elimination is primarily related to intercompany loans
Supplemental segment data and reconciliations to consolidated external reporting for the nine months ended September 30 was as follows:
| | | | | | | | | | | | | | | | | | | | | | | | | | | | | | | | | | | | | | | | | |
(Millions of dollars)
2022 | External
Revenues | | Profit
before
income
taxes | | Interest
Expense | | Depreciation
on equipment
leased to
others | | Provision
for
credit
losses | | Assets at
September 30,
2022 | | Capital
expenditures |
| North America | $ | 1,112 | | | $ | 411 | | | $ | 181 | | | $ | 381 | | | $ | 11 | | | $ | 15,014 | | | $ | 652 | |
| EAME | 207 | | | 5 | | | 45 | | | 41 | | | 49 | | | 4,724 | | | 101 | |
| Asia/Pacific | 216 | | | 104 | | | 55 | | | 4 | | | 5 | | | 3,705 | | | 6 | |
| Latin America | 204 | | | 65 | | | 98 | | | 7 | | | (3) | | | 2,539 | | | 21 | |
| Mining | 218 | | | 66 | | | 29 | | | 109 | | | (14) | | | 2,553 | | | 83 | |
| Caterpillar Power Finance | 41 | | | 35 | | | 10 | | | 2 | | | (14) | | | 738 | | | — | |
| Total Segments | 1,998 | | | 686 | | | 418 | | | 544 | | | 34 | | | 29,273 | | | 863 | |
| Unallocated | 21 | | | (222) | | | 138 | | | — | | | — | | | 1,762 | | | 6 | |
| Timing | (9) | | | 3 | | | — | | | — | | | — | | | 18 | | | — | |
| Methodology | — | | | 113 | | | (179) | | | — | | | — | | | 582 | | | — | |
Inter-segment Eliminations (1) | — | | | — | | | — | | | — | | | — | | | (152) | | | — | |
| Total | $ | 2,010 | | | $ | 580 | | | $ | 377 | | | $ | 544 | | | $ | 34 | | | $ | 31,483 | | | $ | 869 | |
| | | | | | | | | | | | | |
| 2021 | External
Revenues | | Profit
before
income
taxes | | Interest
Expense | | Depreciation
on equipment
leased to
others | | Provision
for
credit
losses | | Assets at
December 31,
2021 | | Capital
expenditures |
| North America | $ | 1,044 | | | $ | 295 | | | $ | 195 | | | $ | 409 | | | $ | 14 | | | $ | 15,755 | | | $ | 680 | |
| EAME | 204 | | | 50 | | | 16 | | | 45 | | | 28 | | | 5,192 | | | 67 | |
| Asia/Pacific | 263 | | | 133 | | | 66 | | | 5 | | | 7 | | | 4,117 | | | 9 | |
| Latin America | 149 | | | 15 | | | 48 | | | 6 | | | 47 | | | 2,405 | | | 9 | |
| Mining | 215 | | | 79 | | | 28 | | | 103 | | | (17) | | | 2,672 | | | 128 | |
| Caterpillar Power Finance | 40 | | | 34 | | | 10 | | | 2 | | | (19) | | | 957 | | | — | |
| Total Segments | 1,915 | | | 606 | | | 363 | | | 570 | | | 60 | | | 31,098 | | | 893 | |
| Unallocated | 12 | | | (218) | | | 138 | | | — | | | — | | | 1,458 | | | 6 | |
| Timing | (8) | | | 5 | | | — | | | — | | | — | | | 15 | | | — | |
| Methodology | — | | | 123 | | | (150) | | | — | | | — | | | 18 | | | — | |
Inter-segment Eliminations (1) | — | | | — | | | — | | | — | | | — | | | (202) | | | — | |
| Total | $ | 1,919 | | | $ | 516 | | | $ | 351 | | | $ | 570 | | | $ | 60 | | | $ | 32,387 | | | $ | 899 | |
| | | | | | | | | | | | | |
(1) Elimination is primarily related to intercompany loans.
7.Commitments and Contingent Liabilities
Guarantees
We provide credit guarantees and residual value guarantees to third parties for financing and leasing associated with Caterpillar machinery. In addition, we provide standby letters of credit issued to third parties on behalf of our customers. These guarantees and standby letters of credit have varying terms and beneficiaries and are generally secured by customer assets.
No significant loss has been experienced or is anticipated under any of these guarantees. At March 31,September 30, 2022 and December 31, 2021, the related recorded liability was less than $1 million. The maximum potential amount of future payments (undiscounted and without reduction for any amounts that may possibly be recovered under recourse or collateralized provisions) we could be required to make under the guarantees was $35$25 million and $36 million at March 31,September 30, 2022 and December 31, 2021, respectively.
We provide guarantees to purchase certain loans of Caterpillar dealers from a special-purpose corporation (SPC) that qualifies as a VIE (see Note 1 for additional information regarding the accounting guidance on the consolidation of VIEs).VIE. The purpose of the SPC is to provide short-term working capital loans to Caterpillar dealers. This SPC issues commercial paper and uses the proceeds to fund its loan program. We receive a fee for providing this guarantee. We are the primary beneficiary of the SPC as our guarantees result in us having both the power to direct the activities that most significantly impact the SPC’s economic performance and the obligation to absorb losses and therefore we have consolidated the financial statements of the SPC. As of March 31,September 30, 2022 and December 31, 2021, the SPC’s assets of $839 million$1.09 billion and $888 million, respectively, were primarily comprised of loans to dealers, which are included in Finance receivables, net in the Consolidated Statements of Financial Position, and the SPC’s liabilities of $838 million$1.09 billion and $888 million, respectively, were primarily comprised of commercial paper, which is included in Short-term borrowings in the Consolidated Statements of Financial Position. The assets of the SPC are not available to pay our creditors. We may be obligated to perform under the guarantee if the SPC experiences losses. No loss has been experienced or is anticipated under this loan purchase agreement.
Litigation and claims
We are involved in unresolved legal actions that arise in the normal course of business. Although it is not possible to predict with certainty the outcome of our unresolved legal actions, we believe that these unresolved legal actions will neither individually nor in the aggregate have a material adverse effect on our consolidated results of operations, financial position or liquidity.
8.Fair Value Measurements
A.Fair Value Measurements
The guidance on fair value measurements defines fair value as the exchange price that would be received for an asset or paid to transfer a liability (an exit price) in the principal or most advantageous market for the asset or liability in an orderly transaction between market participants. This guidance also specifies a fair value hierarchy based upon the observability of inputs used in valuation techniques. Observable inputs (highest level) reflect market data obtained from independent sources, while unobservable inputs (lowest level) reflect internally developed market assumptions. In accordance with this guidance, fair value measurements are classified under the following hierarchy:
•Level 1 – Quoted prices for identical instruments in active markets.
•Level 2 – Quoted prices for similar instruments in active markets; quoted prices for identical or similar instruments in markets that are not active; and model-derived valuations in which all significant inputs or significant value-drivers are observable in active markets.
•Level 3 – Model-derived valuations in which one or more significant inputs or significant value-drivers are unobservable.
When available, we use quoted market prices to determine fair value and we classify such measurements within Level 1. In some cases where market prices are not available, we make use of observable market-based inputs to calculate fair value, in which case the measurements are classified within Level 2. If quoted or observable market prices are not available, fair value is based upon valuations in which one or more significant inputs are unobservable, including internally developed models that use, where possible, current market-based parameters such as interest rates, yield curves and currency rates. These measurements are classified within Level 3.
We classify fair value measurements according to the lowest level input or value-driver that is significant to the valuation. We may therefore classify a measurement within Level 3 even though there may be significant inputs that are readily observable.
Fair value measurement includes the consideration of nonperformance risk. Nonperformance risk refers to the risk that an obligation (either by a counterparty or us) will not be fulfilled. For financial assets traded in an active market, the nonperformance risk is included in the market price. For certain other financial assets and liabilities, our fair value calculations have been adjusted accordingly.
Derivative financial instruments
The fair value of interest rate contracts is primarily based on a standard industry accepted valuation model that utilizes the appropriate market-based forward swap curves and zero-coupon interest rates to determine discounted cash flows. The fair value of foreign currency forward and cross currency contracts is based on standard industry accepted valuation models that discount cash flows resulting from the differential between the contract price and the market-based forward rate.
Derivative financial instruments are measured on a recurring basis at fair value and are classified as Level 2 measurements. We had derivative financial instruments included in our Consolidated Statements of Financial Position in a net asset position of $23$627 million and $125 million as of March 31,September 30, 2022 and December 31, 2021, respectively.
See Note 4 for additional information.
Loans measured at fair value
Certain loans are subject to measurement at fair value on a nonrecurring basis and are classified as Level 3 measurements. A loan is measured at fair value when management determines that collection of contractual amounts due is not probable and the loan is individually evaluated. In these cases, an allowance for credit losses may be established based either on the present value of expected future cash flows discounted at the receivables’ effective interest rate, the fair value of the collateral for collateral-dependent receivables or the observable market price of the receivable. In determining collateral value, we estimate the current fair market value of the collateral less selling costs. We had loans carried at fair value of $108$90 million and $100 million as of March 31,September 30, 2022 and December 31, 2021, respectively.
B.Fair Values of Financial Instruments
Cash and cash equivalents, Restricted cash and cash equivalents (included in Other Assets in the Consolidated Statements of Financial Position) and Short-term borrowings are classified as Level 1 measurements and carrying amount approximates fair value. We use the following methods and assumptions to estimate the fair value of our financial instruments not carried at fair value:
Finance receivables, net – we estimate fair value by discounting the future cash flows using current rates representative of receivables with similar remaining maturities.
Long-term debt – we estimate fair value for fixed and floating-rate debt based on quoted market prices.
Fair values of our financial instruments not carried at fair value were as follows:
| | (Millions of dollars) | (Millions of dollars) | March 31, 2022 | | December 31, 2021 | | (Millions of dollars) | September 30, 2022 | | December 31, 2021 | |
| | | Carrying
Amount | | Fair
Value | | Carrying
Amount | | Fair
Value | | Fair
Value
Levels | | Reference | | Carrying
Amount | | Fair
Value | | Carrying
Amount | | Fair
Value | | Fair
Value
Levels | | Reference |
| Assets | Assets | | | | | | | | | | | | Assets | | | | | | | | | | | |
Finance receivables, net (excluding finance leases(1)) | Finance receivables, net (excluding finance leases(1)) | $ | 19,433 | | | $ | 19,180 | | | $ | 19,068 | | | $ | 19,047 | | | 3 | | Note 3 | Finance receivables, net (excluding finance leases(1)) | $ | 18,657 | | | $ | 18,038 | | | $ | 19,068 | | | $ | 19,047 | | | 3 | | Note 3 |
| Liabilities | Liabilities | | Liabilities | |
| Long-term debt | Long-term debt | $ | 23,320 | | | $ | 23,010 | | | $ | 22,594 | | | $ | 22,797 | | | 2 | | Long-term debt | $ | 22,724 | | | $ | 21,886 | | | $ | 22,594 | | | $ | 22,797 | | | 2 | |
|
(1) Represents finance leases and failed sale leasebacks of $7.92$7.12 billion and $8.11 billion as of March 31,September 30, 2022 and December 31, 2021, respectively.
9.Income Taxes
The provision for income taxes reflected an estimated annual tax rate of 2527 percent in the firstthird quarter of 2022, compared with 2724 percent in the firstthird quarter of 2021. The decreaseincrease in the estimated annual tax rate was primarily due to changes in the geographic mix of profits.
ITEM 2. MANAGEMENT’S DISCUSSION AND ANALYSIS OF FINANCIAL CONDITION AND RESULTS OF OPERATIONS
This Management’s Discussion and Analysis of Financial Condition and Results of Operations should be read in conjunction with our unaudited financial statements and related notes included elsewhere in this report and our discussion of significant risks to the company’s business under Part I, Item 1A. Risk Factors of the 2021 Form 10-K.10-K.
OVERVIEW
We reported first-quarterthird-quarter 2022 revenues of $652$690 million, an increase of $13$56 million, or 29 percent, compared with $634 million in the firstthird quarter of 2021. First-quarterThird-quarter 2022 profit was $143$131 million, a $3an increase of $30 million, or 230 percent, increase fromcompared with $101 million in the firstthird quarter of 2021.
The increase in revenues was primarily due to a $36$63 million favorable impact from returned or repossessed equipment, partially offset by a $29 million unfavorable impact from lowerhigher average financing rates.
First-quarterThird-quarter 2022 profit before income taxes was $193$188 million, a $3an increase of $57 million, or 244 percent, decrease fromcompared with $131 million in the firstthird quarter of 2021. The decreaseincrease was primarilymainly due to a $37$75 million increase infavorable impact from a lower provision for credit losses, partially offset by a $36$25 million favorable impact from returned or repossessed equipment. The impact of lower average financing rates was mostly offset by lower interest expense.mark-to-market adjustments on derivative contracts.
The provision for income taxes reflected an estimated annual tax rate of 2527 percent in the firstthird quarter of 2022, compared with 2724 percent in the firstthird quarter of 2021.
During the firstthird quarter of 2022, retail new business volume was $2.78$2.73 billion, a decrease of $30$617 million, or 118 percent, from the firstthird quarter of 2021. The decrease was primarily driven by lower volume across all segments with the exception of an increase in Asia/Pacific and Mining, partially offset by increases in North America and Latin America.
At the end of the firstthird quarter of 2022, past dues were 2.052.00 percent, compared with 2.902.41 percent at the end of the firstthird quarter of 2021. The decreasePast dues decreased across all our portfolio segments, with the exception of an increase in past dues was mostly driven by the North America, Caterpillar Power Finance and EAME portfolios.Latin America. Write-offs, net of recoveries, were $8$13 million for the firstthird quarter of 2022, compared with $24$76 million for the firstthird quarter of 2021. As of March 31,September 30, 2022, the allowance for credit losses totaled $357$339 million, or 1.291.30 percent of finance receivables, compared with $376 million, or 1.41 percent of finance receivables at June 30, 2022. The allowance for credit losses at year-end 2021 was $337 million, or 1.22 percent of finance receivables at December 31, 2021. The increase in allowance for credit losses included a higher reserve for the Russia and Ukraine portfolios.receivables.
Global Business Conditions
Caterpillar continues to monitor a variety of external factors including the ongoing impact of the COVID-19 pandemic around the world, such as supply chain disruptions, and associatedinflationary cost and labor pressures. We are monitoring the potential downstream impacts from these factors on our business, while remaining focused on portfolio health and continuing to provide qualified customers and dealers with new loans and leases to support their current and future business needs.
We arecontinue to closely monitoringmonitor the events in Russia and Ukraine and have evaluated our exposure in these countries. We have increased the Allowance for credit losses for our associated portfolios to $32 million due to the increased risk.
FIRSTTHIRD QUARTER 2022 COMPARED WITH FIRSTTHIRD QUARTER 2021
Consolidated Total Revenues
The chart above graphically illustrates reasons for the change in consolidated total revenues between firstthird quarter 2021 (at left) and firstthird quarter 2022 (at right). Items favorably impacting total revenues appear as upward stair steps with corresponding dollar amounts above each bar, while items negatively impacting total revenues appear as downward stair steps with dollar amounts reflected in parentheses above each bar. Management utilizes these charts internally to visually communicate results.
Retail revenue for the firstthird quarter of 2022 was $290$312 million, a decreasean increase of $13$15 million from the same period in 2021. The decreaseincrease was mostly due to a $12$24 million favorable impact from higher interest rates on retail finance receivables, partially offset by a $9 million unfavorable impact from lower interest rates on retail finance receivables.average earning assets. For the quarter ended March 31,September 30, 2022, retail average earning assets were $22.54$22.05 billion, a decrease of $87$802 million from the same period in 2021. The annualized average yield was 5.145.65 percent for the firstthird quarter of 2022, compared with 5.365.20 percent for the firstthird quarter of 2021.
Operating lease revenue for the firstthird quarter of 2022 was $225$222 million, a decrease of $19$7 million from the same period in 2021. The decrease was primarily due to a $16 million unfavorable impact from lower average earning assets.assets, partially offset by an $11 million favorable impact from higher rental rates on operating leases.
Wholesale revenue for the firstthird quarter of 2022 was $84$117 million, an increase of $6$40 million from the same period in 2021. The increase was primarily due to a $9$37 million favorable impact from higher average earning assets, partially offset by a $3 million unfavorable impact from lower interest rates on wholesale finance receivables. For the quarter ended March 31,September 30, 2022, wholesale average earning assets were $4.63$4.37 billion, an increase of $468$132 million from the same period in 2021. The annualized average yield was 7.2510.63 percent for the firstthird quarter of 2022, compared with 7.517.24 percent for the firstthird quarter of 2021.
Other revenue, net items were as follows:
| (Millions of dollars) | (Millions of dollars) | Three Months Ended
March 31, | (Millions of dollars) | Three Months Ended
September 30, |
| | | 2022 | | 2021 | | Change | | 2022 | | 2021 | | Change |
| | Net gain (loss) on returned or repossessed equipment | $ | 30 | | | $ | (6) | | | $ | 36 | | |
| Net gain on returned or repossessed equipment | | Net gain on returned or repossessed equipment | $ | 16 | | | $ | 11 | | | $ | 5 | |
| Finance receivable and operating lease fees (including late charges) | Finance receivable and operating lease fees (including late charges) | 15 | | | 13 | | | 2 | | Finance receivable and operating lease fees (including late charges) | 14 | | | 14 | | | — | |
| Interest income on Notes receivable from Caterpillar | Interest income on Notes receivable from Caterpillar | 4 | | | 4 | | | — | | Interest income on Notes receivable from Caterpillar | 5 | | | 3 | | | 2 | |
| Miscellaneous other revenue, net | Miscellaneous other revenue, net | 4 | | | 3 | | | 1 | | Miscellaneous other revenue, net | 4 | | | 3 | | | 1 | |
| Total Other revenue, net | Total Other revenue, net | $ | 53 | | | $ | 14 | | | $ | 39 | | Total Other revenue, net | $ | 39 | | | $ | 31 | | | $ | 8 | |
|
There was a $7$16 million unfavorable impact from currency on revenues in the firstthird quarter of 2022. Currency represents the net translation impact resulting from changes in foreign currency exchange rates versus the U.S. dollar and is included in all financial statement line items and each of the items included in the above analysis.
Consolidated Profit Before Income Taxes
(1) Analysis excludes $4$3 million and $5 million in offsetting revenues and expenses for property taxes on operating leases for the firstthird quarter of 2022 and 2021, respectively.2021.
The chart above graphically illustrates reasons for the change in consolidated profit before income taxes between firstthird quarter 2021 (at left) and firstthird quarter 2022 (at right). Items favorably impacting profit before income taxes appear as upward stair steps with corresponding dollar amounts above each bar, while items negatively impacting profit before income taxes appear as downward stair steps with dollar amounts reflected in parentheses above each bar. Management utilizes these charts internally to visually communicate results.
First-quarterThird-quarter 2022 profit before income taxes was $193$188 million, an increase of $57 million, or 44 percent, compared with $196$131 million for the firstthird quarter of 2021. The decreaseincrease was primarilymainly due to a $37$75 million increase infavorable impact from a lower provision for credit losses, partially offset by a $36$25 million favorable impact from returned or repossessed equipment. The impact of lower average financing rates was mostly offset by lower interest expense.mark-to-market adjustments on derivative contracts.
There was a $4$1 million unfavorable impact from currency on profit before income taxes in the firstthird quarter of 2022. Currency represents the net translation impact resulting from changes in foreign currency exchange rates versus the U.S. dollar and is included in all financial statement line items and each of the items included in the above analysis.
Provision for Income Taxes
The provision for income taxes reflected an estimated annual tax rate of 2527 percent in the firstthird quarter of 2022, compared with 2724 percent in the firstthird quarter of 2021. The increase in the estimated annual tax rate was primarily due to changes in the geographic mix of profits.
NINE MONTHS ENDED SEPTEMBER 30, 2022 VS. NINE MONTHS ENDED SEPTEMBER 30, 2021
Consolidated Total Revenues
The chart above graphically illustrates reasons for the change in consolidated total revenues between September YTD 2021 (at left) and September YTD 2022 (at right). Items favorably impacting total revenues appear as upward stair steps with corresponding dollar amounts above each bar, while items negatively impacting total revenues appear as downward stair steps with dollar amounts reflected in parentheses above each bar. Management utilizes these charts internally to visually communicate results.
Retail revenue for the first nine months of both 2022 and 2021 was $903 million. There was a $19 million favorable impact from higher interest rates on retail finance receivables, offset by a $19 million unfavorable impact from lower average earning assets. For the nine months ended September 30, 2022, retail average earning assets were $22.32 billion, a decrease of $484 million from the same period in 2021. The annualized average yield was 5.39 percent for the first nine months of 2022, compared with 5.28 percent for the same period in 2021.
Operating lease revenue for the first nine months of 2022 was $671 million, a decrease of $40 million from the same period in 2021. The decrease was primarily due to a $49 million unfavorable impact from lower average earning assets, partially offset by a $12 million favorable impact from higher rental rates on operating leases.
Wholesale revenue for the first nine months of 2022 was $300 million, an increase of $63 million from the same period in 2021. The increase was due to a $51 million favorable impact from higher interest rates on wholesale finance receivables and a $12 million favorable impact from higher average earning assets. For the nine months ended September 30, 2022, wholesale average earning assets were $4.44 billion, an increase of $208 million from the same period in 2021. The annualized average yield was 9.00 percent for the first nine months of 2022, compared with 7.45 percent for the same period in 2021.
Other revenue, net items were as follows:
| | | | | | | | | | | | | | | | | |
(Millions of dollars) | Nine Months Ended
September 30, |
| | 2022 | | 2021 | | Change |
| Net gain on returned or repossessed equipment | $ | 67 | | | $ | 8 | | | $ | 59 | |
| Finance receivable and operating lease fees (including late charges) | 44 | | | 42 | | | 2 | |
| | | | | |
| Interest income on Notes receivable from Caterpillar | 13 | | | 10 | | | 3 | |
| Miscellaneous other revenue, net | 12 | | | 8 | | | 4 | |
| Total Other revenue, net | $ | 136 | | | $ | 68 | | | $ | 68 | |
| | | | | |
There was a $29 million unfavorable impact from currency on revenues in the first nine months of 2022. Currency represents the net translation impact resulting from changes in foreign currency exchange rates versus the U.S. dollar and is included in all financial statement line items and each of the items included in the above analysis.
Consolidated Profit Before Income Taxes
(1) Analysis excludes $11 million and $14 million in offsetting revenues and expenses for property taxes on operating leases for September YTD 2022 and 2021, respectively.
The chart above graphically illustrates reasons for the change in consolidated profit before income taxes between September YTD 2021 (at left) and September YTD 2022 (at right). Items favorably impacting profit before income taxes appear as upward stair steps with corresponding dollar amounts above each bar, while items negatively impacting profit before income taxes appear as downward stair steps with dollar amounts reflected in parentheses above each bar. Management utilizes these charts internally to visually communicate results.
Profit before income taxes was $580 million for the first nine months of 2022, an increase of $64 million, or 12 percent, compared with $516 million for the same period in 2021. The increase was primarily due to a $59 million favorable impact from returned or repossessed equipment and a $26 million favorable impact from a lower provision for credit losses, partially offset by an $18 million unfavorable impact from an increase in GO&A expenses.
There was an $9 million unfavorable impact from currency on profit before income taxes in the first nine months of 2022. Currency represents the net translation impact resulting from changes in foreign currency exchange rates versus the U.S. dollar and is included in all financial statement line items and each of the items included in the above analysis.
Provision for Income Taxes
The provision for income taxes reflected an estimated annual tax rate of 27 percent for the first nine months of 2022, compared with 24 percent for the same period in 2021. The increase in the estimated annual tax rate was primarily due to changes in the geographic mix of profits.
Finance Receivables and Equipment on Operating Leases
New Business Volume
| | (Millions of dollars) | (Millions of dollars) | Three Months Ended
March 31, | (Millions of dollars) | Nine Months Ended
September 30, |
| | 2022 | | 2021 | | Change | | 2022 | | 2021 | | Change |
| New retail financing | New retail financing | $ | 2,536 | | | $ | 2,579 | | | $ | (43) | | New retail financing | $ | 7,721 | | | $ | 8,765 | | | $ | (1,044) | |
| New operating lease activity | New operating lease activity | 243 | | | 230 | | | 13 | | New operating lease activity | 878 | | | 910 | | | (32) | |
| New wholesale financing | New wholesale financing | 10,743 | | | 9,638 | | | 1,105 | | New wholesale financing | 34,773 | | | 29,662 | | | 5,111 | |
| Total | Total | $ | 13,522 | | | $ | 12,447 | | | $ | 1,075 | | Total | $ | 43,372 | | | $ | 39,337 | | | $ | 4,035 | |
|
New retail financing decreased primarily due to lower volume across all segments with the exception of an increase in Asia/Pacific and Mining, partially offset by increases in North America and Latin America. New wholesale financing increased primarily due to higher purchases of trade receivables from Caterpillar.
Total Managed Portfolio
We define total portfolio as Finance receivables, net plus Equipment on operating leases, net. We also manage and service receivables and leases that have been sold by us to third parties with limited or no recourse in order to mitigate our concentration of credit risk with certain customers. These assets are not available to pay our creditors. Total managed portfolio was as follows:
| (Millions of dollars) | (Millions of dollars) | March 31,
2022 | | December 31,
2021 | | Change | (Millions of dollars) | September 30,
2022 | | December 31,
2021 | | Change |
| Finance receivables, net | Finance receivables, net | $ | 27,355 | | | $ | 27,177 | | | $ | 178 | | Finance receivables, net | $ | 25,772 | | | $ | 27,177 | | | $ | (1,405) | |
| Equipment on operating leases, net | Equipment on operating leases, net | 3,043 | | | 3,123 | | | (80) | | Equipment on operating leases, net | 2,916 | | | 3,123 | | | (207) | |
| Total portfolio | Total portfolio | $ | 30,398 | | | $ | 30,300 | | | $ | 98 | | Total portfolio | $ | 28,688 | | | $ | 30,300 | | | $ | (1,612) | |
| | Retail loans, net | Retail loans, net | $ | 101 | | | $ | 107 | | | $ | (6) | | Retail loans, net | $ | 69 | | | $ | 107 | | | $ | (38) | |
| Retail leases, net | | Retail leases, net | 27 | | | 19 | | | 8 | |
| Operating leases | Operating leases | 27 | | | 23 | | | 4 | | Operating leases | 23 | | | 23 | | | — | |
| Retail leases, net | 16 | | | 19 | | | (3) | | |
| Total off-balance sheet managed assets | Total off-balance sheet managed assets | $ | 144 | | | $ | 149 | | | $ | (5) | | Total off-balance sheet managed assets | $ | 119 | | | $ | 149 | | | $ | (30) | |
| | Total managed portfolio | Total managed portfolio | $ | 30,542 | | | $ | 30,449 | | | $ | 93 | | Total managed portfolio | $ | 28,807 | | | $ | 30,449 | | | $ | (1,642) | |
|
Total Portfolio Metrics
At the end of the firstthird quarter of 2022, past dues were 2.052.00 percent, compared with 2.902.41 percent at the end of the firstthird quarter of 2021. The decreasePast dues decreased across all our portfolio segments, with the exception of an increase in past dues was mostly driven by the North America, Caterpillar Power Finance and EAME portfolios.Latin America. Total non-performing finance receivables, which represent finance receivables currently on non-accrual status, were $289$262 million and $288 million at March 31,September 30, 2022 and December 31, 2021, respectively. Total non-performing finance receivables as a percentage of our finance receivables were 1.041.00 percent and 1.05 percent at March 31,September 30, 2022 and December 31, 2021, respectively.
Our allowance for credit losses as of March 31,September 30, 2022 was $357$339 million, or 1.291.30 percent of finance receivables, compared with $337 million, or 1.22 percent, as of December 31, 2021. The increase in allowance for credit losses included a higher reserve for the Russia and Ukraine portfolios. The allowance is subject to an ongoing evaluation based on many quantitative and qualitative factors, including past loss experience, known and inherent risks in the portfolio, adverse situations that may affect the borrower’s ability to repay, estimated value of underlying collateral and economic forecasts. We believe our allowance is sufficient to provide for losses over the remaining life of our finance receivable portfolio as of March 31,September 30, 2022.
CAPITAL RESOURCES AND LIQUIDITY
Maintaining and managing adequate capital and liquidity resources includes management of funding sources and their utilization based on current, future and contingent needs. Throughout the firstthird quarter of 2022, we experienced favorable liquidity conditions. We ended the firstthird quarter of 2022 with $664$761 million of cash, an increase of $54$151 million from year-end 2021. Our cash balances are held in numerous locations throughout the world with approximately $179$640 million held by our non-U.S. subsidiaries.subsidiaries, including $142 million in Russia which is currently subject to local government restrictions that substantially limit transfer outside of the country. We expect to meet our U.S. funding needs without repatriating undistributed profits that are indefinitely reinvested outside the U.S.
BORROWINGS
Borrowings consist primarily of medium-term notes and commercial paper, the combination of which is used to manage interest rate risk and funding requirements.
We receive debt ratings from the major credit rating agencies. Moody’s, Fitch and S&P maintain a “mid-A” debt rating. A downgrade of our credit ratings by any of the major credit rating agencies would result in increased borrowing costs and could make access to certain credit markets more difficult. In the event economic conditions deteriorate such that access to debt markets becomes unavailable, we would rely on cash flows from our existing portfolio, existing cash balances, access to our committed credit facilities and other credit line facilities, and potential borrowings from Caterpillar. In addition, Caterpillar maintains a support agreement with us, which requires Caterpillar to remain our sole owner and may, under certain circumstances, require Caterpillar to make payments to us should we fail to maintain certain financial ratios.
Total borrowings outstanding as of March 31,September 30, 2022 were $27.84$26.95 billion, a decrease of $168 million over$1.07 billion from December 31, 2021. Outstanding borrowings were as follows:
| (Millions of dollars)
| (Millions of dollars)
| March 31,
2022 | | December 31,
2021 | (Millions of dollars)
| September 30,
2022 | | December 31,
2021 |
| Medium-term notes, net | Medium-term notes, net | $ | 22,836 | | | $ | 22,246 | | Medium-term notes, net | $ | 22,263 | | | $ | 22,246 | |
| Commercial paper, net of unamortized discount | Commercial paper, net of unamortized discount | 4,044 | | | 4,896 | | Commercial paper, net of unamortized discount | 3,723 | | | 4,896 | |
| Bank borrowings and other – long-term | Bank borrowings and other – long-term | 484 | | | 348 | | Bank borrowings and other – long-term | 461 | | | 348 | |
| Bank borrowings and other – short-term | Bank borrowings and other – short-term | 183 | | | 213 | | Bank borrowings and other – short-term | 221 | | | 213 | |
| Variable denomination floating rate demand notes | Variable denomination floating rate demand notes | 274 | | | 286 | | Variable denomination floating rate demand notes | 255 | | | 286 | |
| Notes payable to Caterpillar | Notes payable to Caterpillar | 22 | | | 22 | | Notes payable to Caterpillar | 22 | | | 22 | |
| Total outstanding borrowings | Total outstanding borrowings | $ | 27,843 | | | $ | 28,011 | | Total outstanding borrowings | $ | 26,945 | | | $ | 28,011 | |
|
Medium-term notes
We issue medium-term unsecured notes through securities dealers or underwriters in the U.S., Canada, Europe, Australia, Japan, Hong Kong, and China to both retail and institutional investors. These notes are offered in several currencies and with a variety of maturities. These notes are senior unsecured obligations of the Company. Medium-term notes issued totaled $2.00$5.25 billion and redeemed totaled $1.35$5.10 billion for the threenine months ended March 31,September 30, 2022. Medium-term notes, net outstanding as of March 31,September 30, 2022 mature as follows:
| | (Millions of dollars) | (Millions of dollars) | | (Millions of dollars) | |
| 2022 | 2022 | $ | 6,122 | | 2022 | $ | 2,369 | |
| 2023 | 2023 | 5,128 | | 2023 | 5,630 | |
| 2024 | 2024 | 7,232 | | 2024 | 7,229 | |
| 2025 | 2025 | 1,614 | | 2025 | 3,658 | |
| 2026 | 2026 | 1,551 | | 2026 | 1,551 | |
| Thereafter | Thereafter | 1,248 | | Thereafter | 1,945 | |
| Fair value adjustments | Fair value adjustments | (59) | | Fair value adjustments | (119) | |
| Total | Total | $ | 22,836 | | Total | $ | 22,263 | |
|
Commercial paper
We issue unsecured commercial paper in the U.S., Europe and other international capital markets. These short-term promissory notes are issued on a discounted basis and are payable at maturity. As of March 31,September 30, 2022, there was $4.04$3.72 billion outstanding in commercial paper.
Revolving credit facilities
As of March 31,September 30, 2022, we had three global credit facilities with a syndicate of banks totaling $10.50 billion (Credit Facility) available in the aggregate to both Caterpillar and us for general liquidity purposes. Based on management’s allocation decision, which can be revised from time to time, the portion of the Credit Facility available to us as of March 31,September 30, 2022 was $7.75 billion. Information on our Credit Facility is as follows:
•In September 2022, we entered into a new 364-day facility. The 364-day facility of $3.15 billion (of which $2.33 billion is available to us) expires in September 2022.August 2023.
•The three-year facility, asIn September 2022, we amended and restated in September 2021,the three-year facility (as amended and restated, the "three-year facility"). The three-year facility of $2.73 billion (of which $2.01 billion is available to us) expires in September 2024.2025.
•The five-year facility, asIn September 2022, we amended and restated in September 2021,the five-year facility (as amended and restated, the "five-year facility"). The five-year facility of $4.62 billion (of which $3.41 billion is available to us) expires in September 2026. 2027.
At March 31,September 30, 2022, Caterpillar’s consolidated net worth was $17.16$15.69 billion, which was above the $9.00 billion required under the Credit Facility. The consolidated net worth is defined in the Credit Facility as the consolidated shareholders’ equity including preferred stock but excluding the pension and other postretirement benefits balance within Accumulated other comprehensive income (loss).
At March 31,September 30, 2022, our covenant interest coverage ratio was 2.562.59 to 1. This was above the 1.15 to 1 minimum ratio, calculated as (1) profit excluding income taxes, interest expense and net gain (loss) from interest rate derivatives to (2) interest expense, calculated at the end of each calendar quarter for the rolling four quarter period then most recently ended, required by the Credit Facility.
In addition, at March 31,September 30, 2022, our six-month covenant leverage ratio was 7.537.03 to 1. This was below the maximum ratio of debt to net worth of 10 to 1, calculated (1) on a monthly basis as the average of the leverage ratios determined on the last day of each of the six preceding calendar months and (2) at each December 31, required by the Credit Facility.
In the event that either Caterpillar or we do not meet one or more of our respective financial covenants under the Credit Facility in the future (and are unable to obtain a consent or waiver), the syndicate of banks may terminate the commitments allocated to the party that does not meet its covenants. Additionally, in such event, certain of our other lenders under other loan agreements where similar financial covenants or cross default provisions are applicable, may, at their election, choose to pursue remedies under those loan agreements, including accelerating the repayment of outstanding borrowings. At March 31,September 30, 2022, there were no borrowings under the Credit Facility.
Bank borrowings
Available credit lines with banks as of March 31,September 30, 2022 totaled $3.19$3.18 billion. These committed and uncommitted credit lines, which may be eligible for renewal at various future dates or have no specified expiration date, are used primarily by our non-U.S. subsidiaries for local funding requirements. We may guarantee subsidiary borrowings under these lines. As of March 31,September 30, 2022, we had $666$681 million outstanding against these credit lines and were in compliance with all debt covenants under these credit lines. The remaining available credit commitments may be withdrawn any time at the lenders’ discretion.
Variable denomination floating rate demand notes
We obtain funding from the sale of variable denomination floating rate demand notes, which may be redeemed at any time at the option of the holder without any material restriction. We do not hold reserves to fund the payment of the demand notes. The notes are offered on a continuous basis. As of March 31,September 30, 2022, there were $274$255 million of variable denomination floating rate demand notes outstanding. The maximum amount of variable denomination floating rate demand notes that we may have outstanding at any time may not exceed $1.25 billion.
Notes receivable from/payable to Caterpillar
Under our variable amount and term lending agreements and other notes receivable with Caterpillar, we may borrow up to $2.41$2.37 billion from Caterpillar and Caterpillar may borrow up to $1.76$1.75 billion from us. The variable amount lending agreements are in effect for indefinite periods of time and may be changed or terminated by either party with 30 days notice. The term lending agreements have remaining maturities ranging up to ten years. We had notes payable of $22 million and notes receivable of $475$495 million outstanding under these agreements as of March 31,September 30, 2022.
OFF-BALANCE SHEET ARRANGEMENTS
We are a party to certain off-balance sheet arrangements, primarily in the form of guarantees. Please refer to Note 7 of Notes to Consolidated Financial Statements for further information.
CASH FLOWS
Operating cash flow was $322 million$1.02 billion in the first threenine months of 2022, compared with $335$936 million for the same period in 2021. Net cash used forprovided by investing activities was $133$44 million for the first threenine months of 2022, compared with net cash used of $221$425 million for the same period in 2021. The change was primarily due to portfolio related activity. Net cash used for financing activities was $142$872 million for the first threenine months of 2022, compared with net cash provided of $205$289 million for the same period in 2021. The change was primarily due to lower portfolio funding requirements related to Caterpillar purchased receivables.
RECENT ACCOUNTING PRONOUNCEMENTS
For a discussion of recent accounting pronouncements, see Part I, Item 1. Note 2 - New Accounting Pronouncements.
CRITICAL ACCOUNTING ESTIMATES
For a discussion of the Company’s critical accounting estimates, see Part II, Item 7. Management’s Discussion and Analysis of Financial Condition and Results of Operations in our 2021 Form 10-K. There have been no significant changes to our critical accounting estimates since our 2021 Form 10-K.
CAUTIONARY STATEMENT REGARDING FORWARD-LOOKING STATEMENTS
Certain statements in this Form 10-Q relate to future events and expectations and are forward-looking statements within the meaning of the Private Securities Litigation Reform Act of 1995. Words such as “believe,” “estimate,” “will be,” “will,” “would,” “expect,” “anticipate,” “plan,” “project,” “intend,” “could,” “should” or other similar words or expressions often identify forward-looking statements. All statements other than statements of historical fact are forward-looking statements, including, without limitation, statements regarding our outlook, projections, forecasts, trend descriptions. These statements do not guarantee future performance and speak only as of the date they are made, and we do not undertake to update our forward-looking statements.
Cat Financial’s actual results may differ materially from those described or implied in our forward-looking statements based on a number of factors, including, but not limited to: (i) disruptions or volatility in global financial markets limiting our sources of liquidity or the liquidity of our customers, dealers and suppliers; (ii) failure to maintain our credit ratings and potential resulting increases to our cost of borrowing and adverse effects on our cost of funds, liquidity, competitive position and access to capital markets; (iii) changes in interest rates, currency fluctuations or market liquidity conditions; (iv) an increase in delinquencies, repossessions or net losses of our customers; (v) residual values of leased equipment; (vi) our compliance with financial and other restrictive covenants in debt agreements; (vii) government monetary or fiscal policies; (viii) political and economic risks, commercial instability and events beyond our control in the countries in which we operate; (ix) demand for Caterpillar products; (x) marketing, operational or administrative support received from Caterpillar; (xi) our ability to develop, produce and market quality products that meet our customers’ needs; (xii) information technology security threats and computer crime; (xiii) alleged or actual violations of trade or anti-corruption laws and regulations; (xiv) new regulations or changes in financial services regulations; (xv) additional tax expense or exposure; (xvi) changes in accounting guidance; (xvii) the ongoing global coronavirus pandemic; and (xviii) other factors described in more detail under the section entitled “Part I - Item 1A. Risk Factors” of Cat Financial's Annual Report on Form 10-K for the fiscal year ended December 31, 2021, as such factors may be updated from time to time in Cat Financial's periodic filings with the Securities and Exchange Commission.
ITEM 4. CONTROLS AND PROCEDURES
Evaluation of Disclosure Controls and Procedures
An evaluation was performed under the supervision and with the participation of our management, including our Chief Executive Officer (CEO) and our Chief Financial Officer (CFO), of the effectiveness of the design and operation of our disclosure controls and procedures, as such term is defined under Rule 13a-15(e) of the Securities Exchange Act of 1934, as amended, as of the end of the period covered by this quarterly report. Based on that evaluation, our CEO and CFO concluded that our disclosure controls and procedures were effective as of the end of the period covered by this quarterly report.
Changes in Internal Control over Financial Reporting
There have been no changes in the Company’s internal control over financial reporting during the firstthird quarter of 2022 that materially affected, or are reasonably likely to materially affect, the Company’s internal control over financial reporting.
PART II. OTHER INFORMATION
ITEM 1. LEGAL PROCEEDINGS
We are involved in unresolved legal actions that arise in the normal course of business. Although it is not possible to predict with certainty the outcome of our unresolved legal actions, we believe that these unresolved legal actions will neither individually nor in the aggregate have a material adverse effect on our consolidated results of operations, financial position or liquidity.
ITEM 1A. RISK FACTORS
There have been no material changes to the risk factors we previously disclosed in our Annual Report on Form 10-K for the year ended December 31, 2021.
ITEM 5. OTHER INFORMATION
Disclosures Required Pursuant to Section 13(r) of the Securities Exchange Act of 1934
During the first quarter, Caterpillar Eurasia LLC, one of our affiliates, engaged in limited transactions or dealings with the Federal Security Service of Russia (the “FSB”). Specifically, Caterpillar Eurasia LLC, from time to time, directly or indirectly, makes required submissions to and receives regulatory authorizations from the FSB related to the importation of software used in the on-board telematics and control systems of Caterpillar machines that are imported into Russia. Caterpillar Eurasia LLC did not generate any net revenue or net profits from such approval activity and does not make any sales to or have other dealings with the FSB. Caterpillar Eurasia LLC plans to continue these activities as long as it remains lawful to do so.
ITEM 6. EXHIBITS
| | | | | |
Exhibit
No. | Description of Exhibit |
| |
| 31.1 | |
| |
| 31.2 | |
| |
| 32 | |
| |
| 101.INS | Inline XBRL Instance Document (the instance document does not appear in the Interactive Data File because its XBRL tags are embedded within the Inline XBRL document) |
| |
| 101.SCH | Inline XBRL Taxonomy Extension Schema Document |
| |
| 101.CAL | Inline XBRL Taxonomy Extension Calculation Linkbase Document |
| |
| 101.DEF | Inline XBRL Taxonomy Extension Definition Linkbase Document |
| |
| 101.LAB | Inline XBRL Taxonomy Extension Label Linkbase Document |
| |
| 101.PRE | Inline XBRL Taxonomy Extension Presentation Linkbase Document |
| |
| 104 | Cover Page Interactive File (embedded within the Inline XBRL document and included in Exhibit 101) |
| |
| The agreements and other documents filed as exhibits to this report are not intended to provide factual information or other disclosure other than with respect to the terms of the agreements or other documents themselves, and you should not rely on them for that purpose. In particular, any representations and warranties made by us in these agreements or other documents were made solely within the specific context of the relevant agreement or document and may not describe the actual state of affairs as of the date they were made or at any other time. |
Signatures
Pursuant to the requirements of the Securities Exchange Act of 1934, the Registrant has duly caused this report to be signed on its behalf by the undersigned, thereunto duly authorized.
| | | | | | | | | | | |
| | Caterpillar Financial Services Corporation |
| | |
| Date: | May 4,November 2, 2022 | /s/David T. Walton |
| | David T. Walton, President, Director and Chief Executive
Officer |
| | | | | | | | | | | |
| Date: | May 4,November 2, 2022 | /s/Kristen R. Covey |
| | Kristen R. Covey, Executive Vice President and Chief
Financial Officer |
| | | | | | | | | | | |
| Date: | May 4,November 2, 2022 | /s/James M. Rooney |
| | James M. Rooney, Secretary |
| | | | | | | | | | | |
| Date: | May 4,November 2, 2022 | /s/Sumeet Puri |
| | Sumeet Puri, Controller (Principal Accounting Officer) |