UNITED STATES
SECURITIES AND EXCHANGE COMMISSION
WASHINGTON, D.C. 20549
FORM 10-Q
QUARTERLY REPORT PURSUANT TO SECTION 13 OR 15(d) OF
THE SECURITIES EXCHANGE ACT OF 1934
For the quarterly period ended March 31,June 30, 2018
Commission File Number: 1-9047
Independent Bank Corp.
(Exact name of registrant as specified in its charter)
|
| |
| Massachusetts | 04-2870273 |
(State or other jurisdiction of incorporation or organization) | (I.R.S. Employer Identification No.) |
Office Address: 2036 Washington Street, Hanover Massachusetts 02339
Mailing Address: 288 Union Street, Rockland, Massachusetts 02370
(Address of principal executive offices, including zip code)
(781) 878-6100
(Registrant’s telephone number, including area code)
Indicate by check mark whether the registrant (1) has filed all reports required to be filed by Section 13 or 15(d) of the Securities Exchange Act of 1934 during the preceding 12 months (or for such shorter period that the registrant was required to file such reports), and (2) has been subject to such filing requirements for the past 90 days. Yes x No o
Indicate by check mark whether the registrant has submitted electronically and posted on its corporate Web site, if any, every Interactive Data File required to be submitted and posted pursuant to Rule 405 of Regulation S-T (§232.405 of this chapter) during the preceding 12 months (or for such shorter period that the registrant was required to submit and post such files). Yes x No o
Indicate by check mark whether the registrant is a large accelerated filer, an accelerated filer, a non-accelerated filer, or a smaller reporting company. See the definitions of “large accelerated filer,” “accelerated filer,” “smaller reporting company” and "emerging growth company" in Rule 12b-2 of the Exchange Act.
|
| | | |
| Large Accelerated Filer | x | Accelerated Filer | o |
| | | | |
| Non-accelerated Filer | o | Smaller Reporting Company | o |
| | | | |
| | | Emerging Growth Company | o |
If an emerging growth company, indicate by check mark if the registrant has elected not to use the extended transition period for complying with any new or revised financial accounting standards provided pursuant to Section 13(a) of the Exchange Acts. o
Indicate by check mark whether the registrant is a shell company (as defined in Rule 12b-2 of the Exchange Act). Yes o No x
As of MayAugust 1, 2018, there were 27,524,22827,538,339 shares of the issuer’s common stock outstanding, par value $0.01 per share.
| Table of Contents |
| |
| | PAGE |
| |
| |
| |
| |
| |
| |
| |
| |
| | |
Condensed Notes to Consolidated Financial Statements - March 31,June 30, 2018 | |
| |
| |
| |
| |
| |
| |
| |
| |
| |
| |
| |
| |
| |
| |
| | |
| |
| |
| |
| |
| |
| |
| |
| |
| |
| |
| |
| |
| |
| |
| |
| |
| |
| |
|
| |
| |
| |
| | |
| |
| |
| |
| |
| |
| |
| |
| |
| |
| | |
| Exhibit 31.1 – Certification 302 | |
| Exhibit 31.2 – Certification 302 | |
| Exhibit 32.1 – Certification 906 | |
| Exhibit 32.2 – Certification 906 | |
PART 1. FINANCIAL INFORMATION
Item 1. Financial Statements
INDEPENDENT BANK CORP.
CONSOLIDATED BALANCE SHEETS
(Unaudited—Dollars in thousands)
| | | | March 31,
2018 | | December 31
2017 | June 30,
2018 | | December 31
2017 |
Assets | | Cash and due from banks | $ | 102,623 |
| | $ | 103,485 |
| $ | 113,930 |
| | $ | 103,485 |
|
| Interest-earning deposits with banks | 62,925 |
| | 109,631 |
| 209,176 |
| | 109,631 |
|
| Securities | | | | | | |
| Trading | 1,601 |
| | 1,324 |
| 1,598 |
| | 1,324 |
|
| Equities | 20,075 |
| | — |
| 20,133 |
| | — |
|
| Available for sale | 445,750 |
| | 447,498 |
| 442,929 |
| | 447,498 |
|
| Held to maturity (fair value $517,555 and $494,194) | 528,861 |
| | 497,688 |
| |
| Held to maturity (fair value $523,288 and $494,194) | | 538,261 |
| | 497,688 |
|
| Total securities | 996,287 |
| | 946,510 |
| 1,002,921 |
| | 946,510 |
|
| Loans held for sale (at fair value) | 3,937 |
| | 4,768 |
| 9,614 |
| | 4,768 |
|
| Loans | | | | | | |
| Commercial and industrial | 903,214 |
| | 888,528 |
| 976,264 |
| | 888,528 |
|
| Commercial real estate | 3,102,271 |
| | 3,116,561 |
| 3,131,337 |
| | 3,116,561 |
|
| Commercial construction | 400,934 |
| | 401,797 |
| 364,225 |
| | 401,797 |
|
| Small business | 133,666 |
| | 132,370 |
| 147,137 |
| | 132,370 |
|
| Residential real estate | 761,331 |
| | 754,329 |
| 779,421 |
| | 754,329 |
|
| Home equity - first position | 617,164 |
| | 612,990 |
| 646,626 |
| | 612,990 |
|
| Home equity - subordinate positions | 434,288 |
| | 439,098 |
| 422,671 |
| | 439,098 |
|
| Other consumer | 9,188 |
| | 9,880 |
| 11,590 |
| | 9,880 |
|
| Total loans | 6,362,056 |
| | 6,355,553 |
| 6,479,271 |
| | 6,355,553 |
|
| Less: allowance for loan losses | (60,862 | ) | | (60,643 | ) | (62,557 | ) | | (60,643 | ) |
| Net loans | 6,301,194 |
| | 6,294,910 |
| 6,416,714 |
| | 6,294,910 |
|
| Federal Home Loan Bank stock | 13,027 |
| | 11,597 |
| 13,107 |
| | 11,597 |
|
| Bank premises and equipment, net | 95,214 |
| | 94,722 |
| 95,838 |
| | 94,722 |
|
| Goodwill | 231,806 |
| | 231,806 |
| 231,806 |
| | 231,806 |
|
| Other intangible assets | 8,462 |
| | 9,341 |
| 7,918 |
| | 9,341 |
|
| Cash surrender value of life insurance policies | 152,568 |
| | 151,528 |
| 153,574 |
| | 151,528 |
|
| Other real estate owned and other foreclosed assets | 358 |
| | 612 |
| 245 |
| | 612 |
|
| Other assets | 122,009 |
| | 123,119 |
| 126,159 |
| | 123,119 |
|
| Total assets | $ | 8,090,410 |
| | $ | 8,082,029 |
| $ | 8,381,002 |
| | $ | 8,082,029 |
|
Liabilities and Stockholders' Equity | | Deposits | | | | | | |
| Demand deposits | $ | 2,167,361 |
| | $ | 2,159,396 |
| $ | 2,262,871 |
| | $ | 2,159,396 |
|
| Savings and interest checking accounts | 2,606,257 |
| | 2,599,922 |
| 2,739,228 |
| | 2,599,922 |
|
| Money market | 1,323,138 |
| | 1,325,634 |
| 1,351,623 |
| | 1,325,634 |
|
| Time certificates of deposit of $100,000 and over | 293,266 |
| | 278,531 |
| 302,219 |
| | 278,531 |
|
| Other time certificates of deposits | 361,489 |
| | 365,770 |
| 357,549 |
| | 365,770 |
|
| Total deposits | 6,751,511 |
| | 6,729,253 |
| 7,013,490 |
| | 6,729,253 |
|
| Borrowings | | | | | | |
| | | Federal Home Loan Bank borrowings | 53,257 |
| | 53,264 |
| 50,775 |
| | 53,264 |
|
| Customer repurchase agreements | 137,914 |
| | 162,679 |
| 142,235 |
| | 162,679 |
|
| Junior subordinated debentures (less unamortized debt issuance costs of $124 and $125) | 73,075 |
| | 73,073 |
| |
| Subordinated debentures (less unamortized debt issuance costs of $307 and $318) | 34,693 |
| | 34,682 |
| |
| Junior subordinated debentures (less unamortized debt issuance costs of $121 and $125) | | 73,077 |
| | 73,073 |
|
| Subordinated debentures (less unamortized debt issuance costs of $295 and $318) | | 34,705 |
| | 34,682 |
|
| Total borrowings | 298,939 |
| | 323,698 |
| 300,792 |
| | 323,698 |
|
| Other liabilities | 83,901 |
| | 85,269 |
| 89,655 |
| | 85,269 |
|
| Total liabilities | 7,134,351 |
| | 7,138,220 |
| 7,403,937 |
| | 7,138,220 |
|
| Commitments and contingencies | — |
| | — |
| — |
| | — |
|
| Stockholders' equity | | | | | | |
| Preferred stock, $.01 par value, authorized: 1,000,000 shares, outstanding: none | — |
| | — |
| — |
| | — |
|
Common stock, $.01 par value, authorized: 75,000,000 shares,
issued and outstanding: 27,512,328 shares at March 31, 2018 and 27,450,190 shares at December 31, 2017 (includes 169,904 and 177,191 shares of unvested participating restricted stock awards, respectively) | 273 |
| | 273 |
| |
| Value of shares held in rabbi trust at cost: 155,373 shares at March 31, 2018 and 164,438 shares at December 31, 2017 | (4,591 | ) | | (4,590 | ) | |
Common stock, $.01 par value, authorized: 75,000,000 shares,
issued and outstanding: 27,532,524 shares at June 30, 2018 and 27,450,190 shares at December 31, 2017 (includes 159,969 and 177,191 shares of unvested participating restricted stock awards, respectively) | | 274 |
| | 273 |
|
| Value of shares held in rabbi trust at cost: 156,714 shares at June 30, 2018 and 164,438 shares at December 31, 2017 | | (4,653 | ) | | (4,590 | ) |
| Deferred compensation and other retirement benefit obligations | 4,591 |
| | 4,590 |
| 4,653 |
| | 4,590 |
|
| Additional paid in capital | 479,715 |
| | 479,430 |
| 481,979 |
| | 479,430 |
|
| Retained earnings | 484,266 |
| | 465,937 |
| 504,926 |
| | 465,937 |
|
| Accumulated other comprehensive loss, net of tax | (8,195 | ) | | (1,831 | ) | (10,114 | ) | | (1,831 | ) |
| Total stockholders’ equity | 956,059 |
| | 943,809 |
| 977,065 |
| | 943,809 |
|
| Total liabilities and stockholders' equity | $ | 8,090,410 |
| | $ | 8,082,029 |
| $ | 8,381,002 |
| | $ | 8,082,029 |
|
The accompanying condensed notes are an integral part of these unaudited consolidated financial statements.
INDEPENDENT BANK CORP.
CONSOLIDATED STATEMENTS OF INCOME
(Unaudited—Dollars in thousands, except per share data)
| | | | Three Months Ended | Three Months Ended | | Six Months Ended |
| | March 31 | June 30 | | June 30 |
| | 2018 | | 2017 | 2018 | | 2017 | | 2018 | | 2017 |
| Interest income | | | | | | | | | | |
| Interest and fees on loans | $ | 67,184 |
| | $ | 58,793 |
| $ | 72,082 |
| | $ | 62,287 |
| | $ | 139,266 |
| | $ | 121,080 |
|
| Taxable interest and dividends on securities | 6,219 |
| | 5,367 |
| 6,498 |
| | 5,609 |
| | 12,717 |
| | 10,976 |
|
| Nontaxable interest and dividends on securities | 16 |
| | 26 |
| 16 |
| | 26 |
| | 32 |
| | 52 |
|
| Interest on loans held for sale | 19 |
| | 14 |
| 30 |
| | 21 |
| | 49 |
| | 35 |
|
| Interest on federal funds sold and short-term investments | 311 |
| | 207 |
| 541 |
| | 190 |
| | 852 |
| | 397 |
|
| Total interest and dividend income | 73,749 |
| | 64,407 |
| 79,167 |
| | 68,133 |
| | 152,916 |
| | 132,540 |
|
| Interest expense | | | | | | | | | | |
| Interest on deposits | 3,935 |
| | 2,767 |
| 4,587 |
| | 2,912 |
| | 8,522 |
| | 5,679 |
|
| Interest on borrowings | 1,343 |
| | 1,440 |
| 1,412 |
| | 1,466 |
| | 2,755 |
| | 2,906 |
|
| Total interest expense | 5,278 |
| | 4,207 |
| 5,999 |
| | 4,378 |
| | 11,277 |
| | 8,585 |
|
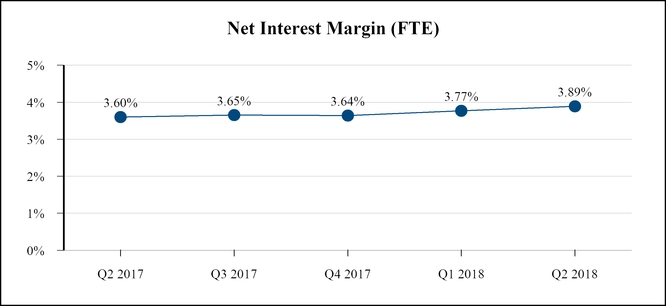
| Net interest income | 68,471 |
| | 60,200 |
| 73,168 |
| | 63,755 |
| | 141,639 |
| | 123,955 |
|
| Provision for loan losses | 500 |
| | 600 |
| 2,000 |
| | 1,050 |
| | 2,500 |
| | 1,650 |
|
| Net interest income after provision for loan losses | 67,971 |
| | 59,600 |
| 71,168 |
| | 62,705 |
| | 139,139 |
| | 122,305 |
|
| Noninterest income | | | | | | | | | | |
| Deposit account fees | 4,431 |
| | 4,544 |
| 4,551 |
| | 4,392 |
| | 8,982 |
| | 8,936 |
|
| Interchange and ATM fees | 4,173 |
| | 3,922 |
| 4,769 |
| | 4,434 |
| | 8,942 |
| | 8,356 |
|
| Investment management | 6,142 |
| | 5,614 |
| 6,822 |
| | 5,995 |
| | 12,964 |
| | 11,609 |
|
| Mortgage banking income | 870 |
| | 957 |
| 1,038 |
| | 1,314 |
| | 1,908 |
| | 2,271 |
|
| Gain on sale of equity securities | — |
| | 4 |
| 2 |
| | 3 |
| | 2 |
| | 7 |
|
| Increase in cash surrender value of life insurance policies | 947 |
| | 964 |
| 998 |
| | 1,017 |
| | 1,945 |
| | 1,981 |
|
| Loan level derivative income | 447 |
| | 606 |
| 708 |
| | 1,337 |
| | 1,155 |
| | 1,943 |
|
| Other noninterest income | 2,853 |
| | 2,301 |
| 2,999 |
| | 2,906 |
| | 5,852 |
| | 5,207 |
|
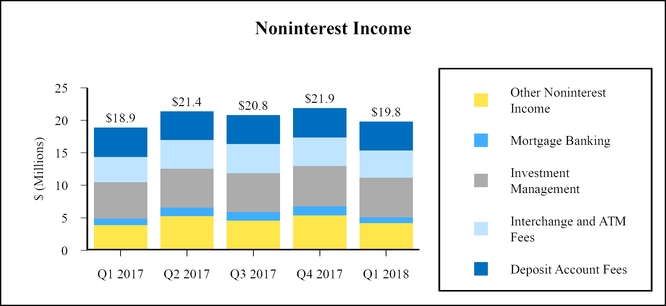
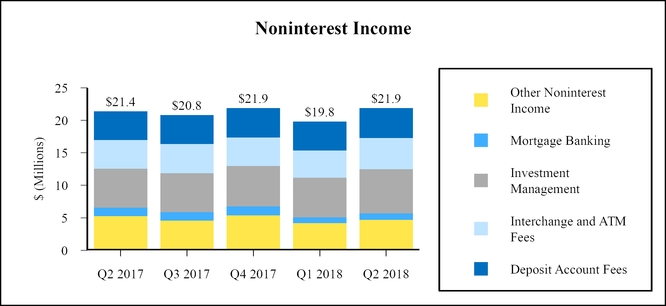
| Total noninterest income | 19,863 |
| | 18,912 |
| 21,887 |
| | 21,398 |
| | 41,750 |
| | 40,310 |
|
| Noninterest expenses | | | | | | | | | | |
| Salaries and employee benefits | 31,100 |
| | 28,324 |
| 30,288 |
| | 28,654 |
| | 61,388 |
| | 56,978 |
|
| Occupancy and equipment expenses | 7,408 |
| | 6,158 |
| 6,497 |
| | 6,059 |
| | 13,905 |
| | 12,217 |
|
| Data processing and facilities management | 1,286 |
| | 1,272 |
| 1,264 |
| | 1,188 |
| | 2,550 |
| | 2,460 |
|
| FDIC assessment | 798 |
| | 783 |
| 691 |
| | 778 |
| | 1,489 |
| | 1,561 |
|
| Advertising expense | 1,123 |
| | 1,294 |
| 1,166 |
| | 1,365 |
| | 2,289 |
| | 2,659 |
|
| Consulting expense | | 1,089 |
| | 1,262 |
| | 1,845 |
| | 1,816 |
|
| Debit card expense | | 841 |
| | 852 |
| | 1,650 |
| | 1,624 |
|
| Loss on sale of equity securities | — |
| | 3 |
| — |
| | 2 |
| | — |
| | 5 |
|
| Merger and acquisition expense | — |
| | 484 |
| 434 |
| | 2,909 |
| | 434 |
| | 3,393 |
|
| Software maintenance | 972 |
| | 930 |
| 997 |
| | 896 |
| | 1,969 |
| | 1,826 |
|
| Other noninterest expenses | 10,764 |
| | 9,525 |
| 9,421 |
| | 8,844 |
| | 18,620 |
| | 17,043 |
|
| Total noninterest expenses | 53,451 |
| | 48,773 |
| 52,688 |
| | 52,809 |
| | 106,139 |
| | 101,582 |
|
| Income before income taxes | 34,383 |
| | 29,739 |
| 40,367 |
| | 31,294 |
| | 74,750 |
| | 61,033 |
|
| Provision for income taxes | 6,828 |
| | 9,014 |
| 9,249 |
| | 10,731 |
| | 16,077 |
| | 19,745 |
|
| Net income | $ | 27,555 |
| | $ | 20,725 |
| $ | 31,118 |
| | $ | 20,563 |
| | $ | 58,673 |
| | $ | 41,288 |
|
| Basic earnings per share | $ | 1.00 |
| | $ | 0.77 |
| $ | 1.13 |
| | $ | 0.75 |
| | $ | 2.13 |
| | $ | 1.52 |
|
| Diluted earnings per share | $ | 1.00 |
| | $ | 0.76 |
| $ | 1.13 |
| | $ | 0.75 |
| | $ | 2.13 |
| | $ | 1.52 |
|
| Weighted average common shares (basic) | 27,486,573 |
| | 27,029,640 |
| 27,526,653 |
| | 27,257,799 |
| | 27,506,724 |
| | 27,144,350 |
|
| Common share equivalents | 67,381 |
| | 81,283 |
| |
| Weighted average common shares (diluted) | 27,553,954 |
| | 27,110,923 |
| |
| Cash dividends declared per common share | $ | 0.38 |
| | $ | 0.32 |
| |
|
| | | | | | | | | | | | | | | |
| Common share equivalents | 54,525 |
| | 74,497 |
| | 61,480 |
| | 78,757 |
|
| Weighted average common shares (diluted) | 27,581,178 |
| | 27,332,296 |
| | 27,568,204 |
| | 27,223,107 |
|
| Cash dividends declared per common share | $ | 0.38 |
| | $ | 0.32 |
| | $ | 0.76 |
| | $ | 0.64 |
|
The accompanying condensed notes are an integral part of these unaudited consolidated financial statements.
INDEPENDENT BANK CORP.
CONSOLIDATED STATEMENTS OF COMPREHENSIVE INCOME
(Unaudited—Dollars in thousands)
| | | | Three Months Ended | Three Months Ended | | Six Months Ended |
| | March 31 | June 30 | | June 30 |
| | 2018 | | 2017 | 2018 | | 2017 | | 2018 | | 2017 |
| Net income | $ | 27,555 |
| | $ | 20,725 |
| $ | 31,118 |
| | $ | 20,563 |
| | $ | 58,673 |
| | $ | 41,288 |
|
| Other comprehensive income (loss), net of tax | | | | | | | | | | |
| Net change in fair value of securities available for sale | (5,468 | ) | | 531 |
| (1,924 | ) | | 792 |
| | (7,392 | ) | | 1,323 |
|
| Net change in fair value of cash flow hedges | 215 |
| | 89 |
| (112 | ) | | (190 | ) | | 103 |
| | (101 | ) |
| Net change in other comprehensive income for defined benefit postretirement plans | 117 |
| | 78 |
| 117 |
| | 78 |
| | 234 |
| | 156 |
|
| Total other comprehensive income (loss) | (5,136 | ) | | 698 |
| (1,919 | ) | | 680 |
| | (7,055 | ) | | 1,378 |
|
| Total comprehensive income | $ | 22,419 |
| | $ | 21,423 |
| $ | 29,199 |
| | $ | 21,243 |
| | $ | 51,618 |
| | $ | 42,666 |
|
The accompanying condensed notes are an integral part of these unaudited consolidated financial statements.
INDEPENDENT BANK CORP.
CONSOLIDATED STATEMENTS OF STOCKHOLDERS’ EQUITY
(Unaudited—Dollars in thousands, except per share data)
| | | | Common Stock Outstanding | | Common Stock | | Value of Shares Held in Rabbi Trust at Cost | | Deferred Compensation and Other Retirement Benefit Obligations | | Additional Paid in Capital | | Retained Earnings | | Accumulated Other
Comprehensive Loss | | Total | Common Stock Outstanding | | Common Stock | | Value of Shares Held in Rabbi Trust at Cost | | Deferred Compensation and Other Retirement Benefit Obligations | | Additional Paid in Capital | | Retained Earnings | | Accumulated Other
Comprehensive Income (Loss) | | Total |
| Balance December 31, 2017 | 27,450,190 |
| | $ | 273 |
| | $ | (4,590 | ) | | $ | 4,590 |
| | $ | 479,430 |
| | $ | 465,937 |
| | $ | (1,831 | ) | | $ | 943,809 |
| 27,450,190 |
| | $ | 273 |
| | $ | (4,590 | ) | | $ | 4,590 |
| | $ | 479,430 |
| | $ | 465,937 |
| | $ | (1,831 | ) | | $ | 943,809 |
|
| Opening balance reclassification (1) | — |
| | — |
| | — |
| | — |
| | — |
| | 397 |
| | (397 | ) | | — |
| — |
| | — |
| | — |
| | — |
| | — |
| | 397 |
| | (397 | ) | | — |
|
| Cumulative effect accounting adjustment (2) | — |
| | — |
| | — |
| | — |
| | — |
| | 831 |
| | (831 | ) | | — |
| — |
| | — |
| | — |
| | — |
| | — |
| | 831 |
| | (831 | ) | | — |
|
| Net income | — |
| | — |
| | — |
| | — |
| | — |
| | 27,555 |
| | — |
| | 27,555 |
| — |
| | — |
| | — |
| | — |
| | — |
| | 58,673 |
| | — |
| | 58,673 |
|
| Other comprehensive loss | — |
| | — |
| | — |
| | — |
| | — |
| | — |
| | (5,136 | ) | | (5,136 | ) | — |
| | — |
| | — |
| | — |
| | — |
| | — |
| | (7,055 | ) | | (7,055 | ) |
| Common dividend declared ($0.38 per share) | — |
| | — |
| | — |
| | — |
| | — |
| | (10,454 | ) | | — |
| | (10,454 | ) | |
| Common dividend declared ($0.76 per share) | | — |
| | — |
| | — |
| | — |
| | — |
| | (20,912 | ) | | — |
| | (20,912 | ) |
| Proceeds from exercise of stock options, net of cash paid | 19,256 |
| | — |
| | — |
| | — |
| | 143 |
| | — |
| | — |
| | 143 |
| 20,756 |
| | — |
| | — |
| | — |
| | 184 |
| | — |
| | — |
| | 184 |
|
| Stock based compensation | — |
| | — |
| | — |
| | — |
| | 1,041 |
| | — |
| | — |
| | 1,041 |
| — |
| | — |
| | — |
| | — |
| | 2,392 |
| | — |
| | — |
| | 2,392 |
|
| Restricted stock awards issued, net of awards surrendered | 36,961 |
| | — |
| | — |
| | — |
| | (1,318 | ) | | — |
| | — |
| | (1,318 | ) | 43,217 |
| | 1 |
| | — |
| | — |
| | (1,339 | ) | | — |
| | — |
| | (1,338 | ) |
| Shares issued under direct stock purchase plan | 5,921 |
| | — |
| | — |
| | — |
| | 419 |
| | — |
| | — |
| | 419 |
| 18,361 |
| | — |
| | — |
| | — |
| | 1,312 |
| | — |
| | — |
| | 1,312 |
|
| Deferred compensation and other retirement benefit obligations | — |
| | — |
| | (1 | ) | | 1 |
| | — |
| | — |
| | — |
| | — |
| — |
| | — |
| | (63 | ) | | 63 |
| | — |
| | — |
| | — |
| | — |
|
| Balance March 31, 2018 | 27,512,328 |
| | $ | 273 |
| | $ | (4,591 | ) | | $ | 4,591 |
| | $ | 479,715 |
| | $ | 484,266 |
| | $ | (8,195 | ) | | $ | 956,059 |
| |
| Balance June 30, 2018 | | 27,532,524 |
| | $ | 274 |
| | $ | (4,653 | ) | | $ | 4,653 |
| | $ | 481,979 |
| | $ | 504,926 |
| | $ | (10,114 | ) | | $ | 977,065 |
|
| | | | | | | | | | | | | | | | | | | | | | | | | | | | | | | |
| Balance December 31, 2016 | 27,005,813 |
| | $ | 268 |
| | $ | (4,277 | ) | | $ | 4,277 |
| | $ | 451,664 |
| | $ | 414,095 |
| | $ | (1,337 | ) | | $ | 864,690 |
| 27,005,813 |
| | $ | 268 |
| | $ | (4,277 | ) | | $ | 4,277 |
| | $ | 451,664 |
| | $ | 414,095 |
| | $ | (1,337 | ) | | $ | 864,690 |
|
| Cumulative effect accounting adjustment (3) | — |
| | — |
| | — |
| | — |
| | 542 |
| | (365 | ) | | — |
| | 177 |
| — |
| | — |
| | — |
| | — |
| | 542 |
| | (365 | ) | | — |
| | 177 |
|
| Net income | — |
| | — |
| | — |
| | — |
| | — |
| | 20,725 |
| | — |
| | 20,725 |
| — |
| | — |
| | — |
| | — |
| | — |
| | 41,288 |
| | — |
| | 41,288 |
|
| Other comprehensive income | — |
| | — |
| | — |
| | — |
| | — |
| | — |
| | 698 |
| | 698 |
| — |
| | — |
| | — |
| | — |
| | — |
| | — |
| | 1,378 |
| | 1,378 |
|
| Common dividend declared ($0.32 per share) | — |
| | — |
| | — |
| | — |
| | — |
| | (8,653 | ) | | — |
| | (8,653 | ) | |
| Common dividend declared ($0.64 per share) | | — |
| | — |
| | — |
| | — |
| | — |
| | (17,431 | ) | | — |
| | (17,431 | ) |
| Common stock issued for acquisition | | 369,286 |
| | 4 |
| | — |
| | — |
| | 23,464 |
| | — |
| | — |
| | 23,468 |
|
| Proceeds from exercise of stock options, net of cash paid | 7,688 |
| | — |
| | — |
| | — |
| | 143 |
| | — |
| | — |
| | 143 |
| 11,174 |
| | — |
| | — |
| | — |
| | 8 |
| | — |
| | — |
| | 8 |
|
| Stock based compensation | — |
| | — |
| | — |
| | — |
| | 643 |
| | — |
| | — |
| | 643 |
| — |
| | — |
| | — |
| | — |
| | 1,560 |
| | — |
| | — |
| | 1,560 |
|
| Restricted stock awards issued, net of awards surrendered | 27,534 |
| | 1 |
| | — |
| | — |
| | (1,337 | ) | | — |
| | — |
| | (1,336 | ) | 32,524 |
| | — |
| | — |
| | — |
| | (1,361 | ) | | — |
| | — |
| | (1,361 | ) |
| Shares issued under direct stock purchase plan | 5,733 |
| | — |
| | — |
| | — |
| | 393 |
| | — |
| | — |
| | 393 |
| 12,374 |
| | — |
| | — |
| | — |
| | 807 |
| | — |
| | — |
| | 807 |
|
| Deferred compensation and other retirement benefit obligations | — |
| | — |
| | (53 | ) | | 53 |
| | — |
| | — |
| | — |
| | — |
| — |
| | — |
| | (137 | ) | | 137 |
| | — |
| | — |
| | — |
| | — |
|
| Balance March 31, 2017 | 27,046,768 |
| | $ | 269 |
| | $ | (4,330 | ) | | $ | 4,330 |
| | $ | 452,048 |
| | $ | 425,802 |
| | $ | (639 | ) | | $ | 877,480 |
| |
| Balance June 30, 2017 | | 27,431,171 |
| | $ | 272 |
| | $ | (4,414 | ) | | $ | 4,414 |
| | $ | 476,684 |
| | $ | 437,587 |
| | $ | 41 |
| | $ | 914,584 |
|
| |
| (1) | Represents adjustment needed to reflect the cumulative impact on retained earnings for reclassification of the income tax effects attributable to accumulated other comprehensive income, as a result of the Tax Cuts and Jobs Act (the "Tax Act"). Pursuant to the Company's adoption of Accounting Standards Update 2018-02, the Company has elected to reclassify amounts stranded in other comprehensive income to retained earnings. |
| |
| (2) | Represents adjustment needed to reflect the cumulative impact on retained earnings for the classification and measurement of investments in equity securities. Pursuant to the Company's adoption of Accounting Standards Update 2016-01, the Company's investments in equity securities will no longer be classified as available for sale, therefore the Company was required to reclassify the net unrealized gain recognized on the change in fair value of these equity securities from other comprehensive income to retained earnings. |
| |
| (3) | Represents adjustment needed to reflect the cumulative impact on retained earnings for previously recognized stock based compensation, which included an adjustment for estimated forfeitures. Pursuant to the Company's adoption of Accounting Standards Update 2016-09, the Company has elected to recognize stock based compensation without inclusion of a forfeiture estimate, and as such has recognized this adjustment to present retained earnings consistent with this election. |
The accompanying condensed notes are an integral part of these unaudited consolidated financial statements.
INDEPENDENT BANK CORP.
CONSOLIDATED STATEMENTS OF CASH FLOWS
(Unaudited—Dollars in thousands)
| | | | Three Months Ended | Six Months Ended |
| | March 31 | June 30 |
| | 2018 | | 2017 | 2018 | | 2017 |
| Cash flow from operating activities | | | | | | |
| Net income | $ | 27,555 |
| | $ | 20,725 |
| $ | 58,673 |
| | $ | 41,288 |
|
| Adjustments to reconcile net income to net cash provided by operating activities | | | | | | |
| Depreciation and amortization | 4,181 |
| | 3,557 |
| 8,021 |
| | 7,454 |
|
| Provision for loan losses | 500 |
| | 600 |
| 2,500 |
| | 1,650 |
|
| Deferred income tax expense | 359 |
| | 709 |
| 283 |
| | 642 |
|
| Net unrealized loss on equity securities | 485 |
| | — |
| 433 |
| | — |
|
| Net gain on sale of securities | — |
| | (1 | ) | (2 | ) | | (2 | ) |
| Net (gain) loss on bank premises and equipment | (7 | ) | | 4 |
| |
| Net (gain) loss on other real estate owned and foreclosed assets | 1 |
| | (29 | ) | |
| Net gain on bank premises and equipment | | (4 | ) | | (92 | ) |
| Net loss on other real estate owned and foreclosed assets | | 1 |
| | 70 |
|
| Realized gain on sale leaseback transaction | (258 | ) | | (258 | ) | (441 | ) | | (517 | ) |
| Stock based compensation | 1,041 |
| | 643 |
| 2,392 |
| | 1,560 |
|
| Increase in cash surrender value of life insurance policies | (947 | ) | | (964 | ) | (1,945 | ) | | (1,981 | ) |
| Change in fair value on loans held for sale | 26 |
| | 147 |
| (44 | ) | | (6 | ) |
| Net change in: | | | | | | |
| Trading assets | (277 | ) | | (485 | ) | (274 | ) | | (489 | ) |
| Loans held for sale | 805 |
| | 2,594 |
| (4,802 | ) | | (3,236 | ) |
| Other assets | 2,594 |
| | 18,384 |
| (1,591 | ) | | 8,973 |
|
| Other liabilities | (2,175 | ) | | (8,192 | ) | 4,444 |
| | (6,104 | ) |
| Total adjustments | 6,328 |
| | 16,709 |
| 8,971 |
| | 7,922 |
|
| Net cash provided by operating activities | 33,883 |
| | 37,434 |
| 67,644 |
| | 49,210 |
|
| Cash flows used in investing activities | | | | | | |
| Proceeds from sales of equity securities | | 10 |
| | — |
|
| Purchases of equity securities | (78 | ) | | — |
| (202 | ) | | — |
|
| Proceeds from sales of securities available for sale | — |
| | 16 |
| — |
| | 35 |
|
| Proceeds from maturities and principal repayments of securities available for sale | 11,040 |
| | 12,107 |
| 27,625 |
| | 24,406 |
|
| Purchases of securities available for sale | (37,201 | ) | | (49,617 | ) | (53,559 | ) | | (74,956 | ) |
| Proceeds from maturities and principal repayments of securities held to maturity | 22,888 |
| | 19,101 |
| 42,716 |
| | 38,634 |
|
| Purchases of securities held to maturity | (53,995 | ) | | (34,090 | ) | (83,047 | ) | | (49,802 | ) |
| Net purchases of Federal Home Loan Bank stock | (1,430 | ) | | — |
| (1,510 | ) | | (2,438 | ) |
| Investments in low income housing projects | (1,213 | ) | | (3,437 | ) | (2,132 | ) | | (3,871 | ) |
| Purchases of life insurance policies | (93 | ) | | (93 | ) | (101 | ) | | (101 | ) |
| Net increase in loans | (6,856 | ) | | (64,997 | ) | (124,355 | ) | | (118,579 | ) |
| Cash acquired in business combinations, net of cash paid | | — |
| | 6,289 |
|
| Purchases of bank premises and equipment | (2,803 | ) | | (5,457 | ) | (5,707 | ) | | (14,182 | ) |
| Proceeds from the sale of bank premises and equipment | 52 |
| | 27 |
| 63 |
| | 1,918 |
|
| Proceeds from the sale of other real estate owned and foreclosed assets | 253 |
| | 1,255 |
| 253 |
| | 1,531 |
|
| Net cash used in investing activities | (69,436 | ) | | (125,185 | ) | (199,946 | ) | | (191,116 | ) |
| Cash flows provided by financing activities | | | | | | |
| Net increase (decrease) in time deposits | 10,486 |
| | (33,219 | ) | 15,522 |
| | (55,787 | ) |
| Net increase in other deposits | 11,804 |
| | 91,721 |
| |
| Net decrease in customer repurchase agreements | (24,765 | ) | | (31,141 | ) | |
| | | Net increase in other deposits | | 268,770 |
| | 179,495 |
|
| Repayments of long-term Federal Home Loan Bank borrowings | | (2,475 | ) | | — |
|
| Net decrease in customer repurchase agreements | | (20,444 | ) | | (17,542 | ) |
| Net proceeds from exercise of stock options | 143 |
| | 143 |
| 184 |
| | 8 |
|
| Restricted stock awards issued, net of awards surrendered | (1,318 | ) | | (1,336 | ) | (1,338 | ) | | (1,361 | ) |
| Proceeds from shares issued under direct stock purchase plan | 419 |
| | 393 |
| 1,312 |
| | 807 |
|
| Common dividends paid | (8,784 | ) | | (7,832 | ) | (19,239 | ) | | (16,487 | ) |
| Net cash provided by (used in) financing activities | (12,015 | ) | | 18,729 |
| |
| Net decrease in cash and cash equivalents | (47,568 | ) | | (69,022 | ) | |
| Net cash provided by financing activities | | 242,292 |
| | 89,133 |
|
| Net increase (decrease) in cash and cash equivalents | | 109,990 |
| | (52,773 | ) |
| Cash and cash equivalents at beginning of year | 213,116 |
| | 289,095 |
| 213,116 |
| | 289,095 |
|
| Cash and cash equivalents at end of period | $ | 165,548 |
| | $ | 220,073 |
| $ | 323,106 |
| | $ | 236,322 |
|
| Supplemental schedule of noncash investing and financing activities | | | | | | |
| Transfer of loans to other real estate owned & foreclosed assets | $ | — |
| | $ | 457 |
| $ | — |
| | $ | 457 |
|
| Net increase in capital commitments relating to low income housing project investments | $ | 9 |
| | $ | 60 |
| $ | 4 |
| | $ | 46 |
|
| In conjunction with the Company's acquisitions, assets were acquired and liabilities were assumed as follows | | | | |
| Common stock issued for acquisition | | $ | — |
| | $ | 23,468 |
|
| Fair value of assets acquired, net of cash acquired | | $ | — |
| | $ | 179,252 |
|
| Fair value of liabilities assumed | | $ | — |
| | $ | 162,073 |
|
The accompanying condensed notes are an integral part of these unaudited consolidated financial statements.
CONDENSED NOTES TO UNAUDITED CONSOLIDATED FINANCIAL STATEMENTS
NOTE 1 - BASIS OF PRESENTATION
Independent Bank Corp. (the “Company”) is a state chartered, federally registered bank holding company, incorporated in 1985. The Company is the sole stockholder of Rockland Trust Company (“Rockland Trust” or the “Bank”), a Massachusetts trust company chartered in 1907.
All material intercompany balances and transactions have been eliminated in consolidation. Certain previously reported amounts have been reclassified to conform to the current year’s presentation.
The accompanying unaudited consolidated financial statements have been prepared in accordance with accounting principles generally accepted in the United States of America ("GAAP") for interim financial information and with the instructions to Form 10-Q and Article 10 of Regulation S-X. Accordingly, they do not include all of the information and notes required by GAAP for complete financial statements. In the opinion of management, all adjustments considered necessary for a fair presentation of the financial statements, primarily consisting of normal recurring adjustments, have been included. Results for the quarter ended March 31,June 30, 2018 are not necessarily indicative of the results that may be expected for the year ending December 31, 2018 or any other interim period.
For further information, refer to the consolidated financial statements and notes thereto included in the Company’s Annual Report on Form 10-K for the year ended December 31, 2017, filed with the Securities and Exchange Commission.
NOTE 2 - RECENT ACCOUNTING STANDARDS UPDATES
Financial Accounting Standards Board ("FASB") Accounting Standards Codification ("ASC") Topic 326 "Financial Instruments - Credit Losses" Update No. 2016-13. Update No. 2016-13 was issued in June 2016 to provide financial statement users with more decision-useful information about the expected credit losses on financial instruments and other commitments to extend credit held by a reporting entity at each reporting date. To achieve this objective, the amendments in this update replace the incurred loss impairment methodology in current GAAP with a methodology that reflects expected credit losses and requires consideration of a broader range of reasonable and supportable information to inform credit loss estimates. The amendments affect entities holding financial assets and net investment in leases that are not accounted for at fair value through net income. The amendments affect loans, debt securities, trade receivables, net investments in leases, off-balance sheet credit exposures, reinsurance receivables, and any other financial assets not excluded from the scope that have the contractual right to receive cash. For public companies, the amendments in this update are effective for fiscal years beginning after December 15, 2019, including interim periods within those fiscal years. Early adoption is permitted as of fiscal years beginning after December 15, 2018, including interim periods within those fiscal years. The Company is currently assessing the impact of the adoption of this standard on the Company's consolidated financial position.
FASB ASC Topic 842 "Leases" Update No. 2016-02. Update No. 2016-02 was issued in February 2016 and affects any entity that enters into a lease (as that term is defined in this update), with some specified scope exemptions. The core principle of this update is that a lessee should recognize in the statement of financial position a liability to make lease payments and a right-of-use asset representing its right to use the underlying asset for the lease term. For leases with a term of 12 months or less, a lessee is permitted to make an accounting policy election by class of underlying asset not to recognize lease assets and lease liabilities. The recognition, measurement, and presentation of expenses and cash flows arising from a lease have not significantly changed from previous GAAP. In addition, the accounting applied by a lessor is largely unchanged from that applied under previous GAAP. For public companies, the amendments in this update are effective for fiscal years beginning after December 15, 2018, including interim periods within those fiscal years. The Company is currently in the process of reviewing its current lease agreements to assess the impact of the adoption of this standard.
FASB ASC Topic 825-10 "Financial Instruments - Overall Recognition and Measurement of Financial Assets and Financial Liabilities" Update No. 2016-01. Update No. 2016-01 was issued in January 2016 to amend the guidance in U.S. GAAP on the classification and measurement of financial instruments. Although the update retains many current requirements, it significantly revises an entity's accounting related to (1) the classification and measurement of investments in equity securities and (2) the presentation of certain fair value changes for financial liabilities measured at fair value. The update also amends certain disclosure requirements associated with the fair value of financial instruments and various other aspects of recognition, measurement, presentation and disclosure of financial instruments. For public companies, the amendments in this update are effective for fiscal years beginning after December 15, 2017, including interim periods within those fiscal years. Upon adoption of this standard on January 1, 2018, there was no material impact on the Company's consolidated financial position.
NOTE 3 - SECURITIES
Trading Securities
The Company had trading securities of $1.6 million and $1.3 million as of March 31,June 30, 2018 and December 31, 2017, respectively. These securities are held in a rabbi trust and will be used for future payments associated with the Company’s nonqualified 401(k) Restoration Plan and Nonqualified Deferred Compensation Plan.
Equity Securities
The Company had equity securities of $20.1 million as of March 31,June 30, 2018. These securities consist primarily of mutual funds held in a rabbi trust and will be used for future payments associated with the Company’s supplemental executive retirement plans. These securities were previously classified as available for sale and were reclassified as equity securities due to a change in accounting guidance effective January 1, 2018. The equity securities werehad a fair value of $20.6 million as of December 31, 2017 and are reflected accordingly as available for sale in the table below.
Available for Sale and Held to Maturity Securities
The following table presents a summary of the amortized cost, gross unrealized gains and losses and fair value of securities available for sale and securities held to maturity for the periods indicated:
| | | | March 31, 2018 | | December 31, 2017 | June 30, 2018 | | December 31, 2017 |
| | Amortized Cost | | Gross Unrealized Gains | | Gross Unrealized Losses | | Fair Value | | Amortized Cost | | Gross Unrealized Gains | | Gross Unrealized Losses | | Fair Value | Amortized Cost | | Gross Unrealized Gains | | Gross Unrealized Losses | | Fair Value | | Amortized Cost | | Gross Unrealized Gains | | Gross Unrealized Losses | | Fair Value |
| | (Dollars in thousands) | (Dollars in thousands) |
| Available for sale securities | | | | | | | | | | | | | | | | | | | | | | | | | | | | | | |
| U.S. government agency securities | $ | 35,478 |
| | $ | — |
| | $ | (535 | ) | | $ | 34,943 |
| | $ | 35,475 |
| | $ | 86 |
| | $ | (131 | ) | | $ | 35,430 |
| $ | 33,479 |
| | $ | — |
| | $ | (760 | ) | | $ | 32,719 |
| | $ | 35,475 |
| | $ | 86 |
| | $ | (131 | ) | | $ | 35,430 |
|
| Agency mortgage-backed securities | 226,111 |
| | 1,266 |
| | (4,166 | ) | | 223,211 |
| | 214,934 |
| | 1,897 |
| | (1,067 | ) | | 215,764 |
| 219,409 |
| | 1,019 |
| | (5,439 | ) | | 214,989 |
| | 214,934 |
| | 1,897 |
| | (1,067 | ) | | 215,764 |
|
| Agency collateralized mortgage obligations | 139,433 |
| | 73 |
| | (4,314 | ) | | 135,192 |
| | 124,098 |
| | 78 |
| | (2,164 | ) | | 122,012 |
| 150,122 |
| | 90 |
| | (5,065 | ) | | 145,147 |
| | 124,098 |
| | 78 |
| | (2,164 | ) | | 122,012 |
|
| State, county, and municipal securities | 2,232 |
| | 22 |
| | — |
| | 2,254 |
| | 2,237 |
| | 37 |
| | — |
| | 2,274 |
| 1,977 |
| | 19 |
| | — |
| | 1,996 |
| | 2,237 |
| | 37 |
| | — |
| | 2,274 |
|
| Single issuer trust preferred securities issued by banks | 2,002 |
| | 3 |
| | — |
| | 2,005 |
| | 2,012 |
| | 4 |
| | — |
| | 2,016 |
| 1,320 |
| | 9 |
| | — |
| | 1,329 |
| | 2,012 |
| | 4 |
| | — |
| | 2,016 |
|
| Pooled trust preferred securities issued by banks and insurers | 2,173 |
| | — |
| | (518 | ) | | 1,655 |
| | 2,179 |
| | — |
| | (539 | ) | | 1,640 |
| 2,166 |
| | — |
| | (415 | ) | | 1,751 |
| | 2,179 |
| | — |
| | (539 | ) | | 1,640 |
|
| Small business administration pooled securities | 47,434 |
| | — |
| | (944 | ) | | 46,490 |
| | 47,852 |
| | 44 |
| | (118 | ) | | 47,778 |
| 46,102 |
| | — |
| | (1,104 | ) | | 44,998 |
| | 47,852 |
| | 44 |
| | (118 | ) | | 47,778 |
|
| Equity securities | — |
| | — |
| | — |
| | — |
| | 19,432 |
| | 1,594 |
| | (442 | ) | | 20,584 |
| — |
| | — |
| | — |
| | — |
| | 19,432 |
| | 1,594 |
| | (442 | ) | | 20,584 |
|
| Total available for sale securities | $ | 454,863 |
| | $ | 1,364 |
| | $ | (10,477 | ) | | $ | 445,750 |
| | $ | 448,219 |
| | $ | 3,740 |
| | $ | (4,461 | ) | | $ | 447,498 |
| $ | 454,575 |
| | $ | 1,137 |
| | $ | (12,783 | ) | | $ | 442,929 |
| | $ | 448,219 |
| | $ | 3,740 |
| | $ | (4,461 | ) | | $ | 447,498 |
|
| Held to maturity securities | | | | | | | | | | | | | | | | | | | | | | | | | | | | | | |
| U.S. Treasury securities | $ | 1,005 |
| | $ | 16 |
| | $ | — |
| | $ | 1,021 |
| | $ | 1,006 |
| | $ | 29 |
| | $ | — |
| | $ | 1,035 |
| $ | 1,005 |
| | $ | 9 |
| | $ | — |
| | $ | 1,014 |
| | $ | 1,006 |
| | $ | 29 |
| | $ | — |
| | $ | 1,035 |
|
| Agency mortgage-backed securities | 192,961 |
| | 474 |
| | (3,026 | ) | | 190,409 |
| | 204,768 |
| | 1,791 |
| | (736 | ) | | 205,823 |
| 186,299 |
| | 286 |
| | (4,585 | ) | | 182,000 |
| | 204,768 |
| | 1,791 |
| | (736 | ) | | 205,823 |
|
| Agency collateralized mortgage obligations | 306,395 |
| | 126 |
| | (8,703 | ) | | 297,818 |
| | 262,998 |
| | 397 |
| | (4,987 | ) | | 258,408 |
| 323,746 |
| | 151 |
| | (10,555 | ) | | 313,342 |
| | 262,998 |
| | 397 |
| | (4,987 | ) | | 258,408 |
|
| Single issuer trust preferred securities issued by banks | 1,500 |
| | 21 |
| | — |
| | 1,521 |
| | 1,500 |
| | 29 |
| | — |
| | 1,529 |
| 1,500 |
| | 23 |
| | — |
| | 1,523 |
| | 1,500 |
| | 29 |
| | — |
| | 1,529 |
|
| Small business administration pooled securities | 27,000 |
| | 95 |
| | (309 | ) | | 26,786 |
| | 27,416 |
| | 183 |
| | (200 | ) | | 27,399 |
| 25,711 |
| | 51 |
| | (353 | ) | | 25,409 |
| | 27,416 |
| | 183 |
| | (200 | ) | | 27,399 |
|
| Total held to maturity securities | $ | 528,861 |
| | $ | 732 |
| | $ | (12,038 | ) | | $ | 517,555 |
| | $ | 497,688 |
| | $ | 2,429 |
| | $ | (5,923 | ) | | $ | 494,194 |
| $ | 538,261 |
| | $ | 520 |
| | $ | (15,493 | ) | | $ | 523,288 |
| | $ | 497,688 |
| | $ | 2,429 |
| | $ | (5,923 | ) | | $ | 494,194 |
|
| Total | $ | 983,724 |
| | $ | 2,096 |
| | $ | (22,515 | ) | | $ | 963,305 |
| | $ | 945,907 |
| | $ | 6,169 |
| | $ | (10,384 | ) | | $ | 941,692 |
| $ | 992,836 |
| | $ | 1,657 |
| | $ | (28,276 | ) | | $ | 966,217 |
| | $ | 945,907 |
| | $ | 6,169 |
| | $ | (10,384 | ) | | $ | 941,692 |
|
When securities are sold, the adjusted cost of the specific security sold is used to compute the gain or loss on the sale.
The actual maturities of certain securities may differ from the contractual maturities because borrowers may have the right to call or prepay obligations with or without call or prepayment penalties. A schedule of the contractual maturities of securities available for sale and securities held to maturity as of March 31,June 30, 2018 is presented below:
| | | | Due in one year or less | | Due after one year to five years | | Due after five to ten years | | Due after ten years | | Total | Due in one year or less | | Due after one year to five years | | Due after five to ten years | | Due after ten years | | Total |
| | Amortized Cost | | Fair Value | | Amortized Cost | | Fair Value | | Amortized Cost | | Fair Value | | Amortized Cost | | Fair Value | | Amortized Cost | | Fair Value | Amortized Cost | | Fair Value | | Amortized Cost | | Fair Value | | Amortized Cost | | Fair Value | | Amortized Cost | | Fair Value | | Amortized Cost | | Fair Value |
| | (Dollars in thousands) | (Dollars in thousands) |
| Available for sale securities | | | | | | | | | | | | | | | | | | | | | | | | | | | | | | | | | | | | | | |
| U.S. government agency securities | $ | 2,997 |
| | $ | 2,995 |
| | $ | 20,016 |
| | $ | 19,860 |
| | $ | 12,465 |
| | $ | 12,088 |
| | $ | — |
| | $ | — |
| | $ | 35,478 |
| | $ | 34,943 |
| $ | 999 |
| | $ | 998 |
| | $ | 20,014 |
| | $ | 19,781 |
| | $ | 12,466 |
| | $ | 11,940 |
| | $ | — |
| | $ | — |
| | $ | 33,479 |
| | $ | 32,719 |
|
| Agency mortgage-backed securities | 84 |
| | 85 |
| | 43,016 |
| | 42,235 |
| | 97,629 |
| | 96,201 |
| | 85,382 |
| | 84,690 |
| | 226,111 |
| | 223,211 |
| 520 |
| | 524 |
| | 43,223 |
| | 42,216 |
| | 95,410 |
| | 93,245 |
| | 80,256 |
| | 79,004 |
| | 219,409 |
| | 214,989 |
|
| Agency collateralized mortgage obligations | 8 |
| | 8 |
| | — |
| | — |
| | — |
| | — |
| | 139,425 |
| | 135,184 |
| | 139,433 |
| | 135,192 |
| — |
| | — |
| | — |
| | — |
| | — |
| | — |
| | 150,122 |
| | 145,147 |
| | 150,122 |
| | 145,147 |
|
| State, county, and municipal securities | — |
| | — |
| | 1,026 |
| | 1,028 |
| | 1,206 |
| | 1,226 |
| | — |
| | — |
| | 2,232 |
| | 2,254 |
| — |
| | — |
| | 1,024 |
| | 1,026 |
| | 953 |
| | 970 |
| | — |
| | — |
| | 1,977 |
| | 1,996 |
|
| Single issuer trust preferred securities issued by banks | — |
| | — |
| | — |
| | — |
| | — |
| | — |
| | 2,002 |
| | 2,005 |
| | 2,002 |
| | 2,005 |
| — |
| | — |
| | — |
| | — |
| | — |
| | — |
| | 1,320 |
| | 1,329 |
| | 1,320 |
| | 1,329 |
|
| Pooled trust preferred securities issued by banks and insurers | — |
| | — |
| | — |
| | — |
| | — |
| | — |
| | 2,173 |
| | 1,655 |
| | 2,173 |
| | 1,655 |
| — |
| | — |
| | — |
| | — |
| | — |
| | — |
| | 2,166 |
| | 1,751 |
| | 2,166 |
| | 1,751 |
|
| Small business administration pooled securities | — |
| | — |
| | — |
| | — |
| | — |
| | — |
| | 47,434 |
| | 46,490 |
| | 47,434 |
| | 46,490 |
| — |
| | — |
| | — |
| | — |
| | — |
| | — |
| | 46,102 |
| | 44,998 |
| | 46,102 |
| | 44,998 |
|
| Total available for sale securities | $ | 3,089 |
| | $ | 3,088 |
| | $ | 64,058 |
| | $ | 63,123 |
| | $ | 111,300 |
| | $ | 109,515 |
| | $ | 276,416 |
| | $ | 270,024 |
| | $ | 454,863 |
| | $ | 445,750 |
| $ | 1,519 |
| | $ | 1,522 |
| | $ | 64,261 |
| | $ | 63,023 |
| | $ | 108,829 |
| | $ | 106,155 |
| | $ | 279,966 |
| | $ | 272,229 |
| | $ | 454,575 |
| | $ | 442,929 |
|
| Held to maturity securities | | | | | | | | | | | | | | | | | | | | | | | | | | | | | | | | | | | | | | |
| U.S. Treasury securities | $ | — |
| | $ | — |
| | $ | 1,005 |
| | $ | 1,021 |
| | $ | — |
| | $ | — |
| | $ | — |
| | $ | — |
| | $ | 1,005 |
| | $ | 1,021 |
| $ | — |
| | $ | — |
| | $ | 1,005 |
| | $ | 1,014 |
| | $ | — |
| | $ | — |
| | $ | — |
| | $ | — |
| | $ | 1,005 |
| | $ | 1,014 |
|
| Agency mortgage-backed securities | — |
| | — |
| | 9,052 |
| | 8,932 |
| | 14,057 |
| | 14,146 |
| | 169,852 |
| | 167,331 |
| | 192,961 |
| | 190,409 |
| — |
| | — |
| | 8,998 |
| | 8,846 |
| | 29,911 |
| | 29,380 |
| | 147,390 |
| | 143,774 |
| | 186,299 |
| | 182,000 |
|
| Agency collateralized mortgage obligations | — |
| | — |
| | — |
| | — |
| | 1,426 |
| | 1,423 |
| | 304,969 |
| | 296,395 |
| | 306,395 |
| | 297,818 |
| — |
| | — |
| | — |
| | — |
| | 1,179 |
| | 1,175 |
| | 322,567 |
| | 312,167 |
| | 323,746 |
| | 313,342 |
|
| Single issuer trust preferred securities issued by banks | — |
| | — |
| | — |
| | — |
| | — |
| | — |
| | 1,500 |
| | 1,521 |
| | 1,500 |
| | 1,521 |
| — |
| | — |
| | — |
| | — |
| | 1,500 |
| | 1,523 |
| | — |
| | — |
| | 1,500 |
| | 1,523 |
|
| Small business administration pooled securities | — |
| | — |
| | — |
| | — |
| | — |
| | — |
| | 27,000 |
| | 26,786 |
| | 27,000 |
| | 26,786 |
| — |
| | — |
| | — |
| | — |
| | — |
| | — |
| | 25,711 |
| | 25,409 |
| | 25,711 |
| | 25,409 |
|
| Total held to maturity securities | $ | — |
| | $ | — |
| | $ | 10,057 |
| | $ | 9,953 |
| | $ | 15,483 |
| | $ | 15,569 |
| | $ | 503,321 |
| | $ | 492,033 |
| | $ | 528,861 |
| | $ | 517,555 |
| $ | — |
| | $ | — |
| | $ | 10,003 |
| | $ | 9,860 |
| | $ | 32,590 |
| | $ | 32,078 |
| | $ | 495,668 |
| | $ | 481,350 |
| | $ | 538,261 |
| | $ | 523,288 |
|
Inclusive in the table above is $7.4$6.6 million of callable securities at March 31,June 30, 2018.
The carrying value of securities pledged to secure public funds, trust deposits, repurchase agreements and for other purposes, as required or permitted by law, was $552.7$545.4 million and $547.2 million at March 31,June 30, 2018 and December 31, 2017, respectively.
At March 31,June 30, 2018 and December 31, 2017, the Company had no investments in obligations of individual states, counties, or municipalities which exceeded 10% of stockholders’ equity.
Other-Than-Temporary Impairment ("OTTI")
The Company continually reviews investment securities for the existence of OTTI, taking into consideration current market conditions, the extent and nature of changes in fair value, issuer rating changes and trends, the credit worthiness of the obligor of the security, volatility of earnings, current analysts’ evaluations, the Company’s intent to sell the security, whether it is more likely than not that the Company will be required to sell the debt security before its anticipated recovery, as well as other qualitative factors. The term “other-than-temporary” is not intended to indicate that the decline is permanent, but indicates that the prospects for a near-term recovery of value is not necessarily favorable, or that there is a lack of evidence to support a realizable value equal to or greater than the carrying value of the investment.
The following tables show the gross unrealized losses and fair value of the Company’s investments in an unrealized loss position, which the Company has not deemed to be OTTI, aggregated by investment category and length of time that individual securities have been in a continuous unrealized loss position:
| | | | March 31, 2018 | June 30, 2018 |
| | | | Less than 12 months | | 12 months or longer | | Total | | | Less than 12 months | | 12 months or longer | | Total |
| | # of holdings | | Fair Value | | Unrealized Losses | | Fair Value | | Unrealized Losses | | Fair Value | | Unrealized Losses | # of holdings | | Fair Value | | Unrealized Losses | | Fair Value | | Unrealized Losses | | Fair Value | | Unrealized Losses |
| | (Dollars in thousands) | (Dollars in thousands) |
| U.S. government agency securities | 6 |
| | $ | 34,943 |
| | $ | (535 | ) | | $ | — |
| | $ | — |
| | $ | 34,943 |
| | $ | (535 | ) | 4 |
| | $ | 32,719 |
| | $ | (760 | ) | | $ | — |
| | $ | — |
| | $ | 32,719 |
| | $ | (760 | ) |
| Agency mortgage-backed securities | 140 |
| | 338,326 |
| | (6,624 | ) | | 14,205 |
| | (568 | ) | | 352,531 |
| | (7,192 | ) | 151 |
| | 341,018 |
| | (9,349 | ) | | 14,003 |
| | (675 | ) | | 355,021 |
| | (10,024 | ) |
| Agency collateralized mortgage obligations | 51 |
| | 244,572 |
| | (5,384 | ) | | 150,834 |
| | (7,633 | ) | | 395,406 |
| | (13,017 | ) | 52 |
| | 274,293 |
| | (7,235 | ) | | 137,912 |
| | (8,385 | ) | | 412,205 |
| | (15,620 | ) |
| Pooled trust preferred securities issued by banks and insurers | 1 |
| | — |
| | — |
| | 1,655 |
| | (518 | ) | | 1,655 |
| | (518 | ) | 1 |
| | — |
| | — |
| | 1,751 |
| | (415 | ) | | 1,751 |
| | (415 | ) |
| Small business administration pooled securities | 6 |
| | 56,839 |
| | (1,074 | ) | | 9,569 |
| | (179 | ) | | 66,408 |
| | (1,253 | ) | 6 |
| | 54,637 |
| | (1,264 | ) | | 8,947 |
| | (193 | ) | | 63,584 |
| | (1,457 | ) |
| Total temporarily impaired securities | 204 |
| | $ | 674,680 |
| | $ | (13,617 | ) | | $ | 176,263 |
| | $ | (8,898 | ) | | $ | 850,943 |
| | $ | (22,515 | ) | 214 |
| | $ | 702,667 |
| | $ | (18,608 | ) | | $ | 162,613 |
| | $ | (9,668 | ) | | $ | 865,280 |
| | $ | (28,276 | ) |
|
| | | | | | | | | | | | | | | | | | | | | | | | | | |
| | December 31, 2017 |
| | | | Less than 12 months | | 12 months or longer | | Total |
| | # of holdings | | Fair Value | | Unrealized Losses | | Fair Value | | Unrealized Losses | | Fair Value | | Unrealized Losses |
| | (Dollars in thousands) |
| U.S.government agency securities | 4 |
| | $ | 24,343 |
| | $ | (131 | ) | | $ | — |
| | $ | — |
| | $ | 24,343 |
| | $ | (131 | ) |
| Agency mortgage-backed securities | 84 |
| | 235,411 |
| | (1,493 | ) | | 14,886 |
| | (310 | ) | | 250,297 |
| | (1,803 | ) |
| Agency collateralized mortgage obligations | 42 |
| | 178,142 |
| | (1,579 | ) | | 159,506 |
| | (5,572 | ) | | 337,648 |
| | (7,151 | ) |
| Pooled trust preferred securities issued by banks and insurers | 1 |
| | — |
| | — |
| | 1,640 |
| | (539 | ) | | 1,640 |
| | (539 | ) |
| Small business administration pooled securities | 4 |
| | 34,553 |
| | (223 | ) | | 9,647 |
| | (95 | ) | | 44,200 |
| | (318 | ) |
| Equity securities | 28 |
| | 3,290 |
| | (39 | ) | | 7,619 |
| | (403 | ) | | 10,909 |
| | (442 | ) |
| Total temporarily impaired securities | 163 |
| | $ | 475,739 |
| | $ | (3,465 | ) | | $ | 193,298 |
| | $ | (6,919 | ) | | $ | 669,037 |
| | $ | (10,384 | ) |
The Company does not intend to sell these investments and has determined, based upon available evidence, that it is more likely than not that the Company will not be required to sell each security before the recovery of its amortized cost basis. As a result, the Company does not consider these investments to be OTTI and accordingly, there was no OTTI recorded and no cumulative credit related component of OTTI for the three and six months ended March 31,June 30, 2018 and 2017.
The Company made this determination by reviewing various qualitative and quantitative factors regarding each investment category, such as current market conditions, extent and nature of changes in fair value, issuer rating changes and trends, volatility of earnings, and current analysts’ evaluations.
As a result of the Company’s review of these qualitative and quantitative factors, the causes of the impairments listed in the table above by category are as follows at March 31,June 30, 2018:
U.S. Government Agency Securities, Agency Mortgage-Backed Securities, Agency Collateralized Mortgage Obligations and Small Business Administration Pooled Securities: These portfolios have contractual terms that generally do not permit the issuer to settle the securities at a price less than the current par value of the investment. The decline in market value of these securities is attributable to changes in interest rates and not credit quality. Additionally, these securities are implicitly guaranteed by the U.S. Government or one of its agencies.
Pooled Trust Preferred Securities: This portfolio consists of one below investment grade security which is performing. The unrealized loss on this security is attributable to the illiquid nature of the trust preferred market in the current economic and regulatory environment. Management evaluates collateral credit and instrument structure, including
current and expected deferral and default rates and timing. In addition, discount rates are determined by evaluating comparable spreads observed currently in the market for similar instruments.
NOTE 4 - LOANS, ALLOWANCE FOR LOAN LOSSES, AND CREDIT QUALITY
The following tables bifurcate the amount of loans and the allowance allocated to each loan category based on the type of impairment analysis as of the periods indicated:
| | | | March 31, 2018 | | June 30, 2018 | |
| | (Dollars in thousands) | | (Dollars in thousands) | |
| | Commercial and Industrial | | Commercial Real Estate | | Commercial Construction | | Small Business | | Residential Real Estate | |
Home Equity | | Other Consumer | | Total | | Commercial and Industrial | | Commercial Real Estate | | Commercial Construction | | Small Business | | Residential Real Estate | |
Home Equity | | Other Consumer | | Total | |
| Financing receivables ending balance: | | | | | | | | | | | | | | | | | | | | | | | | | | | | | | | | |
| Collectively evaluated for impairment | $ | 870,110 |
| | $ | 3,079,910 |
| | $ | 400,934 |
| | $ | 132,813 |
| | $ | 742,744 |
| | $ | 1,044,316 |
| | $ | 8,896 |
| | $ | 6,279,723 |
| | $ | 943,722 |
| | $ | 3,110,500 |
| | $ | 364,225 |
| | $ | 146,334 |
| | $ | 761,476 |
| | $ | 1,062,334 |
| | $ | 11,335 |
| | $ | 6,399,926 |
| |
| Individually evaluated for impairment | $ | 33,104 |
| | $ | 16,470 |
| | $ | — |
| | $ | 853 |
| | $ | 13,278 |
| | $ | 6,926 |
| | $ | 292 |
| | $ | 70,923 |
| | $ | 32,542 |
| | $ | 15,016 |
| | $ | — |
| | $ | 803 |
| | $ | 12,705 |
| | $ | 6,759 |
| | $ | 255 |
| | $ | 68,080 |
| |
| Purchased credit impaired loans | $ | — |
| | $ | 5,891 |
| | $ | — |
| | $ | — |
| | $ | 5,309 |
| | $ | 210 |
| | $ | — |
| | $ | 11,410 |
| | $ | — |
| | $ | 5,821 |
| | $ | — |
| | $ | — |
| | $ | 5,240 |
| | $ | 204 |
| | $ | — |
| | $ | 11,265 |
| |
| Total loans by group | $ | 903,214 |
| | $ | 3,102,271 |
| | $ | 400,934 |
| | $ | 133,666 |
| | $ | 761,331 |
| | $ | 1,051,452 |
| | $ | 9,188 |
| | $ | 6,362,056 |
| (1 | ) | $ | 976,264 |
| | $ | 3,131,337 |
| | $ | 364,225 |
| | $ | 147,137 |
| | $ | 779,421 |
| | $ | 1,069,297 |
| | $ | 11,590 |
| | $ | 6,479,271 |
| (1 | ) |
|
| | | | | | | | | | | | | | | | | | | | | | | | | | | | | | | | | |
| | December 31, 2017 | |
| | (Dollars in thousands) | |
| | Commercial and Industrial | | Commercial Real Estate | | Commercial Construction | | Small Business | | Residential Real Estate | |
Home Equity | | Other Consumer | | Total | |
| Financing receivables ending balance: | | | | | | | | | | | | | | | | |
| Collectively evaluated for impairment | $ | 853,885 |
| | $ | 3,093,945 |
| | $ | 401,797 |
| | $ | 131,667 |
| | $ | 733,809 |
| | $ | 1,045,053 |
| | $ | 9,573 |
| | $ | 6,269,729 |
| |
| Individually evaluated for impairment | $ | 34,643 |
| | $ | 16,638 |
| | $ | — |
| | $ | 703 |
| | $ | 13,684 |
| | $ | 6,826 |
| | $ | 307 |
| | $ | 72,801 |
| |
| Purchased credit impaired loans | $ | — |
| | $ | 5,978 |
| | $ | — |
| | $ | — |
| | $ | 6,836 |
| | $ | 209 |
| | $ | — |
| | $ | 13,023 |
| |
| Total loans by group | $ | 888,528 |
| | $ | 3,116,561 |
| | $ | 401,797 |
| | $ | 132,370 |
| | $ | 754,329 |
| | $ | 1,052,088 |
| | $ | 9,880 |
| | $ | 6,355,553 |
| (1 | ) |
| |
| (1) | The amount of net deferred costs on originated loans included in the ending balance was $6.4$6.7 million and $6.1 million at March 31,June 30, 2018 and December 31, 2017, respectively. Net unamortized discounts on acquired loans not deemed to be purchased credit impaired ("PCI") included in the ending balance was $9.1$8.8 million and $9.4 million at March 31,June 30, 2018 and December 31, 2017, respectively. |
The following tables summarize changes in allowance for loan losses by loan category for the periods indicated:
| | | | Three Months Ended March 31, 2018 | Three Months Ended June 30, 2018 |
| | (Dollars in thousands) | (Dollars in thousands) |
| | Commercial and
Industrial | | Commercial
Real Estate | | Commercial
Construction | | Small
Business | | Residential
Real Estate | |
Home Equity | | Other Consumer | | Total | Commercial and
Industrial | | Commercial
Real Estate | | Commercial
Construction | | Small
Business | | Residential
Real Estate | |
Home Equity | | Other Consumer | | Total |
| Allowance for loan losses | | | | | | | | | | | | | | | | | | | | | | | | | | | | | | |
| Beginning balance | $ | 13,256 |
| | $ | 31,453 |
| | $ | 5,698 |
| | $ | 1,577 |
| | $ | 2,822 |
| | $ | 5,390 |
| | $ | 447 |
| | $ | 60,643 |
| $ | 13,533 |
| | $ | 31,459 |
| | $ | 5,679 |
| | $ | 1,593 |
| | $ | 2,837 |
| | $ | 5,359 |
| | $ | 402 |
| | $ | 60,862 |
|
| Charge-offs | (133 | ) | | — |
| | — |
| | (24 | ) | | (39 | ) | | (79 | ) | | (318 | ) | | (593 | ) | (4 | ) | | — |
| | — |
| | (102 | ) | | (109 | ) | | (95 | ) | | (259 | ) | | (569 | ) |
| Recoveries | 12 |
| | 20 |
| | — |
| | 9 |
| | 2 |
| | 34 |
| | 235 |
| | 312 |
| 59 |
| | 18 |
| | — |
| | 10 |
| | 1 |
| | 23 |
| | 153 |
| | 264 |
|
| Provision (benefit) | 398 |
| | (14 | ) | | (19 | ) | | 31 |
| | 52 |
| | 14 |
| | 38 |
| | 500 |
| 1,200 |
| | 618 |
| | (463 | ) | | 208 |
| | 180 |
| | 181 |
| | 76 |
| | 2,000 |
|
| Ending balance | $ | 13,533 |
| | $ | 31,459 |
| | $ | 5,679 |
| | $ | 1,593 |
| | $ | 2,837 |
| | $ | 5,359 |
| | $ | 402 |
| | $ | 60,862 |
| $ | 14,788 |
| | $ | 32,095 |
| | $ | 5,216 |
| | $ | 1,709 |
| | $ | 2,909 |
| | $ | 5,468 |
| | $ | 372 |
| | $ | 62,557 |
|
| Ending balance: collectively evaluated for impairment | $ | 13,524 |
| | $ | 31,422 |
| | $ | 5,679 |
| | $ | 1,590 |
| | $ | 1,893 |
| | $ | 5,111 |
| | $ | 386 |
| | $ | 59,605 |
| |
| Ending balance: individually evaluated for impairment | $ | 9 |
| | $ | 37 |
| | $ | — |
| | $ | 3 |
| | $ | 944 |
| | $ | 248 |
| | $ | 16 |
| | $ | 1,257 |
| |
| | | | | | | | | | | | | | | | | |
| | Three Months Ended March 31, 2017 | Three Months Ended June 30, 2017 |
| | (Dollars in thousands) | (Dollars in thousands) |
| | Commercial and Industrial | | Commercial Real Estate | | Commercial Construction | | Small Business | | Residential Real Estate | |
Home Equity | | Other Consumer | | Total | Commercial and
Industrial | | Commercial
Real Estate | | Commercial
Construction | | Small
Business | | Residential
Real Estate | |
Home Equity | | Other Consumer | | Total |
| Allowance for loan losses | | | | | | | | | | | | | | | | | | | | | | | | | | | | | | |
| Beginning balance | $ | 16,921 |
| | $ | 30,369 |
| | $ | 4,522 |
| | $ | 1,502 |
| | $ | 2,621 |
| | $ | 5,238 |
| | $ | 393 |
| | $ | 61,566 |
| $ | 16,518 |
| | $ | 30,743 |
| | $ | 5,023 |
| | $ | 1,533 |
| | $ | 2,716 |
| | $ | 5,345 |
| | $ | 440 |
| | $ | 62,318 |
|
| Charge-offs | — |
| | — |
| | — |
| | (70 | ) | | (23 | ) | | (14 | ) | | (401 | ) | | (508 | ) | (3,591 | ) | | — |
| | — |
| | (24 | ) | | (116 | ) | | (122 | ) | | (345 | ) | | (4,198 | ) |
| Recoveries | 187 |
| | 31 |
| | — |
| | 66 |
| | 12 |
| | 76 |
| | 288 |
| | 660 |
| 13 |
| | 26 |
| | — |
| | 13 |
| | 2 |
| | 26 |
| | 229 |
| | 309 |
|
| Provision (benefit) | (590 | ) | | 343 |
| | 501 |
| | 35 |
| | 106 |
| | 45 |
| | 160 |
| | 600 |
| 604 |
| | 178 |
| | (209 | ) | | 91 |
| | 91 |
| | 104 |
| | 191 |
| | 1,050 |
|
| Ending balance | $ | 16,518 |
| | $ | 30,743 |
| | $ | 5,023 |
| | $ | 1,533 |
| | $ | 2,716 |
| | $ | 5,345 |
| | $ | 440 |
| | $ | 62,318 |
| $ | 13,544 |
| | $ | 30,947 |
| | $ | 4,814 |
| | $ | 1,613 |
| | $ | 2,693 |
| | $ | 5,353 |
| | $ | 515 |
| | $ | 59,479 |
|
| Ending balance: collectively evaluated for impairment | $ | 12,960 |
| | $ | 30,570 |
| | $ | 5,023 |
| | $ | 1,531 |
| | $ | 1,650 |
| | $ | 5,110 |
| | $ | 419 |
| | $ | 57,263 |
| |
| Ending balance: individually evaluated for impairment | $ | 3,558 |
| | $ | 173 |
| | $ | — |
| | $ | 2 |
| | $ | 1,066 |
| | $ | 235 |
| | $ | 21 |
| | $ | 5,055 |
| |
|
| | | | | | | | | | | | | | | | | | | | | | | | | | | | | | | |
| | Six Months Ended June 30, 2018 |
| | (Dollars in thousands) |
| | Commercial and
Industrial | | Commercial
Real Estate | | Commercial
Construction | | Small
Business | | Residential
Real Estate | |
Home Equity | | Other Consumer | | Total |
| Allowance for loan losses | | | | | | | | | | | | | | | |
| Beginning balance | $ | 13,256 |
| | $ | 31,453 |
| | $ | 5,698 |
| | $ | 1,577 |
| | $ | 2,822 |
| | $ | 5,390 |
| | $ | 447 |
| | $ | 60,643 |
|
| Charge-offs | (137 | ) | | — |
| | — |
| | (126 | ) | | (148 | ) | | (174 | ) | | (577 | ) | | (1,162 | ) |
| Recoveries | 71 |
| | 38 |
| | — |
| | 19 |
| | 3 |
| | 57 |
| | 388 |
| | 576 |
|
| Provision (benefit) | 1,598 |
| | 604 |
| | (482 | ) | | 239 |
| | 232 |
| | 195 |
| | 114 |
| | 2,500 |
|
| Ending balance | $ | 14,788 |
| | $ | 32,095 |
| | $ | 5,216 |
| | $ | 1,709 |
| | $ | 2,909 |
| | $ | 5,468 |
| | $ | 372 |
| | $ | 62,557 |
|
| Ending balance: collectively evaluated for impairment | $ | 14,780 |
| | $ | 32,021 |
| | $ | 5,216 |
| | $ | 1,708 |
| | $ | 2,050 |
| | $ | 5,237 |
| | $ | 358 |
| | $ | 61,370 |
|
| Ending balance: individually evaluated for impairment | $ | 8 |
| | $ | 74 |
| | $ | — |
| | $ | 1 |
| | $ | 859 |
| | $ | 231 |
| | $ | 14 |
| | $ | 1,187 |
|
| | Six Months Ended June 30, 2017 |
| | (Dollars in thousands) |
| | Commercial and Industrial | | Commercial Real Estate | | Commercial Construction | | Small Business | | Residential Real Estate | |
Home Equity | | Other Consumer | | Total |
| Allowance for loan losses | | | | | | | | | | | | | | | |
| Beginning balance | $ | 16,921 |
| | $ | 30,369 |
| | $ | 4,522 |
| | $ | 1,502 |
| | $ | 2,621 |
| | $ | 5,238 |
| | $ | 393 |
| | $ | 61,566 |
|
| Charge-offs | (3,591 | ) | | — |
| | — |
| | (94 | ) | | (139 | ) | | (136 | ) | | (746 | ) | | (4,706 | ) |
| Recoveries | 200 |
| | 57 |
| | — |
| | 79 |
| | 14 |
| | 102 |
| | 517 |
| | 969 |
|
| Provision (benefit) | 14 |
| | 521 |
| | 292 |
| | 126 |
| | 197 |
| | 149 |
| | 351 |
| | 1,650 |
|
| Ending balance | $ | 13,544 |
| | $ | 30,947 |
| | $ | 4,814 |
| | $ | 1,613 |
| | $ | 2,693 |
| | $ | 5,353 |
| | $ | 515 |
| | $ | 59,479 |
|
| Ending balance: collectively evaluated for impairment | $ | 13,474 |
| | $ | 30,781 |
| | $ | 4,814 |
| | $ | 1,612 |
| | $ | 1,657 |
| | $ | 5,110 |
| | $ | 495 |
| | $ | 57,943 |
|
| Ending balance: individually evaluated for impairment | $ | 70 |
| | $ | 166 |
| | $ | — |
| | $ | 1 |
| | $ | 1,036 |
| | $ | 243 |
| | $ | 20 |
| | $ | 1,536 |
|
For the purpose of estimating the allowance for loan losses, management segregates the loan portfolio into the portfolio segments detailed in the above tables. Each of these loan categories possesses unique risk characteristics that are considered when determining the appropriate level of allowance for each segment. Some of the risk characteristics unique to each loan category include:
Commercial Portfolio
Commercial and Industrial: Loans in this category consist of revolving and term loan obligations extended to business and corporate enterprises for the purpose of financing working capital and/or capital investment. Collateral generally consists of pledges of business assets including, but not limited to: accounts receivable, inventory, plant and equipment, or real estate, if applicable. Repayment sources consist of primarily, operating cash flow, and secondarily, liquidation of assets.
Commercial Real Estate: Loans in this category consist of mortgage loans to finance investment in real property such as multi-family residential, commercial/retail, office, industrial, hotels, educational and healthcare facilities and other specific use properties. Loans are typically written with amortizing payment structures. Collateral values are determined based upon third party appraisals and evaluations. Loan to value ratios at origination are governed by established policy and regulatory guidelines. Repayment sources consist of, primarily, cash flow from operating leases and rents and, secondarily, liquidation of assets.
Commercial Construction: Loans in this category consist of short-term construction loans, revolving and nonrevolving credit lines and construction/permanent loans to finance the acquisition, development and construction or rehabilitation of real property. Project types include residential 1-4 family, condominium and multi-family homes, commercial/retail, office, industrial, hotels, educational and healthcare facilities and other specific use properties. Loans may be written with nonamortizing or hybrid payment structures depending upon the type of project. Collateral values are determined based upon third party appraisals and evaluations. Loan to value ratios at origination are governed by established policy and regulatory guidelines. Repayment sources vary depending upon the type of project and may consist of sale or lease of units, operating cash flows or liquidation of other assets.
Small Business: Loans in this category consist of revolving, term loan and mortgage obligations extended to sole proprietors and small businesses for purposes of financing working capital and/or capital investment. Collateral generally consists of pledges of business assets including, but not limited to, accounts receivable, inventory, plant and equipment, or real estate if applicable. Repayment sources consist primarily of operating cash flows and, secondarily, liquidation of assets.
For the commercial portfolio it is the Company’s policy to obtain personal guarantees for payment from individuals holding material ownership interests of the borrowing entities.
Consumer Portfolio
Residential Real Estate: Residential mortgage loans held in the Company’s portfolio are made to borrowers who demonstrate the ability to make scheduled payments with full consideration to underwriting factors such as current and expected income, employment status, current assets, other financial resources, credit history and the value of the collateral. Collateral consists of mortgage liens on 1-4 family residential properties. Residential mortgage loans also include loans to construct owner-occupied 1-4 family residential properties.
Home Equity: Home equity loans and credit lines are made to qualified individuals and are primarily secured by senior or junior mortgage liens on owner-occupied 1-4 family homes, condominiums or vacation homes. Each home equity loan has a fixed rate and is billed in equal payments comprised of principal and interest. Each home equity line of credit has a variable rate and is billed in interest-only payments during the draw period. At the end of the draw period, the home equity line of credit is billed as a percentage of the then outstanding principal balance plus all accrued interest over a predetermined repayment period, as set forth in the note. Additionally, the Company has the option of renewing each line of credit for additional draw periods. Borrower qualifications include favorable credit history combined with supportive income requirements and combined loan to value ratios within established policy guidelines.
Other Consumer: Other consumer loan products include personal lines of credit and amortizing loans made to qualified individuals for various purposes such as education, debt consolidation, personal expenses or overdraft protection. Borrower qualifications include favorable credit history combined with supportive income and collateral requirements within established policy guidelines. These loans may be secured or unsecured.
Credit Quality
The Company continually monitors the asset quality of the loan portfolio using all available information. Based on this information, loans demonstrating certain payment issues or other weaknesses may be categorized as adversely risk-rated, delinquent, impaired, nonperforming and/or put on nonaccrual status. Additionally, in the course of resolving such loans, the Company may choose to restructure the contractual terms of certain loans to match the borrower’s ability to repay the loan based on their current financial condition. If a restructured loan meets certain criteria, it may be categorized as a troubled debt restructuring (“TDR”).
The Company reviews numerous credit quality indicators when assessing the risk in its loan portfolio. For the commercial portfolio, the Company utilizes a 10-point credit risk-rating system, which assigns a risk-grade to each loan obligation based on a number of quantitative and qualitative factors associated with a commercial or small business loan transaction. Factors considered include industry and market conditions, position within the industry, earnings trends, operating cash flow, asset/liability values, debt capacity, guarantor strength, management and controls, financial reporting, collateral, and other considerations. The risk-ratings categories are defined as follows:
1- 6 Rating — Pass: Risk-rating grades “1” through “6” comprise those loans ranging from ‘Substantially Risk Free’ which indicates borrowers are of unquestioned credit standing and the pinnacle of credit quality, well established companies with a very strong financial condition, and loans fully secured by cash collateral, through ‘Acceptable Risk’, which indicates borrowers may exhibit declining earnings, strained cash flow, increasing or above average leverage and/or weakening market fundamentals that indicate below average asset quality, margins and market share. Collateral coverage is protective.
7 Rating — Potential Weakness: Borrowers exhibit potential credit weaknesses or downward trends deserving management’s close attention. If not checked or corrected, these trends will weaken the Company’s asset and position. While potentially weak, currently these borrowers are marginally acceptable; no loss of principal or interest is envisioned.
8 Rating — Definite Weakness Loss Unlikely: Borrowers exhibit well defined weaknesses that jeopardize the orderly liquidation of debt. Loan may be inadequately protected by the current net worth and paying capacity of the obligor or by the collateral pledged, if any. Normal repayment from the borrower is in jeopardy, although no loss of principal is envisioned. However, there is a distinct possibility that a partial loss of interest and/or principal will occur if the deficiencies are not corrected. Collateral coverage may be inadequate to cover the principal obligation.
9 Rating — Partial Loss Probable: Borrowers exhibit well defined weaknesses that jeopardize the orderly liquidation of debt with the added provision that the weaknesses make collection of the debt in full, on the basis of currently existing facts, conditions, and values, highly questionable and improbable. Serious problems exist to the point where partial loss of principal is likely.
10 Rating — Definite Loss: Borrowers deemed incapable of repayment. Loans to such borrowers are considered uncollectible and of such little value that continuation as active assets of the Company is not warranted.
The credit quality of the commercial loan portfolio is actively monitored and any changes in credit quality are reflected in risk-rating changes. Risk-ratings are assigned or reviewed for all new loans, when advancing significant additions to existing relationships (over $50,000), at least quarterly for all actively managed loans, and any time a significant event occurs, including at renewal of the loan.
The Company utilizes a comprehensive strategy for monitoring commercial credit quality. Actively managed commercial borrowers are required to provide updated financial information at least annually which is carefully evaluated for any changes in credit quality. Larger loan relationships are subject to a full annual credit review by an experienced credit analysis group, while continuous portfolio monitoring techniques are employed to evaluate changes in credit quality for smaller loan relationships. Additionally, the Company retains an independent loan review firm to evaluate the credit quality of the commercial loan portfolio. The independent loan review process achieves significant penetration into the commercial loan portfolio and reports the results of these reviews to the Audit Committee of the Board of Directors on a quarterly basis.
The following tables detail the amount of outstanding principal balances relative to each of the risk-rating categories for the Company’s commercial portfolio:
| | | | | | March 31, 2018 | | | June 30, 2018 |
| Category | Risk Rating | | Commercial and Industrial | | Commercial Real Estate | | Commercial Construction | | Small Business | | Total | Risk Rating | | Commercial and Industrial | | Commercial Real Estate | | Commercial Construction | | Small Business | | Total |
| | | | (Dollars in thousands) | | | (Dollars in thousands) |
| Pass | 1 - 6 | | $ | 829,401 |
| | $ | 2,992,497 |
| | $ | 399,568 |
| | $ | 131,237 |
| | $ | 4,352,703 |
| 1 - 6 | | $ | 896,554 |
| | $ | 3,037,955 |
| | $ | 364,225 |
| | $ | 144,865 |
| | $ | 4,443,599 |
|
| Potential weakness | 7 | | 15,910 |
| | 70,879 |
| | 947 |
| | 1,404 |
| | 89,140 |
| 7 | | 17,294 |
| | 47,608 |
| | — |
| | 1,293 |
| | 66,195 |
|
| Definite weakness-loss unlikely | 8 | | 51,782 |
| | 38,431 |
| | 419 |
| | 1,022 |
| | 91,654 |
| 8 | | 56,413 |
| | 45,311 |
| | — |
| | 977 |
| | 102,701 |
|
| Partial loss probable | 9 | | 6,121 |
| | 464 |
| | — |
| | 3 |
| | 6,588 |
| 9 | | 6,003 |
| | 463 |
| | — |
| | 2 |
| | 6,468 |
|
| Definite loss | 10 | | — |
| | — |
| | — |
| | — |
| | — |
| 10 | | — |
| | — |
| | — |
| | — |
| | — |
|
| Total | | $ | 903,214 |
| | $ | 3,102,271 |
| | $ | 400,934 |
| | $ | 133,666 |
| | $ | 4,540,085 |
| | $ | 976,264 |
| | $ | 3,131,337 |
| | $ | 364,225 |
| | $ | 147,137 |
| | $ | 4,618,963 |
|
|
| | | | | | | | | | | | | | | | | | | | | |
| | | | December 31, 2017 |
| Category | Risk Rating | | Commercial and Industrial | | Commercial Real Estate | | Commercial Construction | | Small Business | | Total |
| | | | (Dollars in thousands) |
| Pass | 1 - 6 | | $ | 806,331 |
| | $ | 3,007,672 |
| | $ | 400,964 |
| | $ | 130,265 |
| | $ | 4,345,232 |
|
| Potential weakness | 7 | | 16,563 |
| | 69,788 |
| | — |
| | 1,471 |
| | 87,822 |
|
| Definite weakness-loss unlikely | 8 | | 59,415 |
| | 38,637 |
| | 833 |
| | 631 |
| | 99,516 |
|
| Partial loss probable | 9 | | 6,219 |
| | 464 |
| | — |
| | 3 |
| | 6,686 |
|
| Definite loss | 10 | | — |
| | — |
| | — |
| | — |
| | — |
|
| Total | | | $ | 888,528 |
| | $ | 3,116,561 |
| | $ | 401,797 |
| | $ | 132,370 |
| | $ | 4,539,256 |
|
For the Company’s consumer portfolio, the quality of the loan is best indicated by the repayment performance of an individual borrower. However, the Company does supplement performance data with current Fair Isaac Corporation (“FICO”) scores and Loan to Value (“LTV”) estimates. Current FICO data is purchased and appended to all consumer loans on a regular basis. In addition, automated valuation services and broker opinions of value are used to supplement original value data for the residential and home equity portfolios, periodically. The following table shows the weighted average FICO scores and the weighted average combined LTV ratios as of the periods indicated below:
| | | | March 31,
2018 | | December 31,
2017 | June 30,
2018 | | December 31,
2017 |
| Residential portfolio | | | | | | |
| FICO score (re-scored)(1) | 747 |
| | 745 |
| 747 |
| | 745 |
|
| LTV (re-valued)(2) | 58.2 | % | | 59.2 | % | 58.1 | % | | 59.2 | % |
| Home equity portfolio | | | | | | |
| FICO score (re-scored)(1) | 768 |
| | 766 |
| 768 |
| | 766 |
|
| LTV (re-valued)(2)(3) | 48.7 | % | | 50.1 | % | 49.2 | % | | 50.1 | % |
| |
| (1) | The average FICO scores at March 31,June 30, 2018 are based upon rescores available from February 2018 and origination score data for loans booked inbetween March and June 2018. The average FICO scores at December 31, 2017 are based upon rescores available from August 2017 and origination score data for loans booked between September and December 2017. |
| |
| (2) | The combined LTV ratios for March 31,June 30, 2018 are based upon updated automated valuations as of FebruaryMay 2018, when available or the most current valuation data available. The combined LTV ratios for December 31, 2017 are based upon updated automated valuations as of August 2017, when available, or the most current valuation data available. The updated automated valuations provides new information on loans that may be available since the previous valuation was obtained. If no new information is available, the valuation will default to the previously obtained data or most recent appraisal. |
| |
| (3) | For home equity loans and lines in a subordinate lien, the LTV data represents a combined LTV, taking into account the senior lien data for loans and lines. |
Asset Quality
The Company’s philosophy toward managing its loan portfolios is predicated upon careful monitoring, which stresses early detection and response to delinquent and default situations. Delinquent loans are managed by a team of collection specialists and the Company seeks to make arrangements to resolve any delinquent or default situation over the shortest possible time frame. As a general rule, loans more than 90 days past due with respect to principal or interest are classified as nonaccrual loans. The Company also may use discretion regarding other loans over 90 days delinquent if the loan is well secured and/or in process of collection.
The following table shows information regarding nonaccrual loans at the dates indicated:
| | | | March 31, 2018 | | December 31, 2017 | June 30, 2018 | | December 31, 2017 |
| | (Dollars in thousands) | (Dollars in thousands) |
| Commercial and industrial | $ | 30,751 |
| | $ | 32,055 |
| $ | 30,095 |
| | $ | 32,055 |
|
| Commercial real estate | 2,997 |
| | 3,123 |
| 3,110 |
| | 3,123 |
|
| Small business | 412 |
| | 230 |
| 384 |
| | 230 |
|
| Residential real estate | 7,646 |
| | 8,129 |
| 7,612 |
| | 8,129 |
|
| Home equity | 5,858 |
| | 6,022 |
| 5,861 |
| | 6,022 |
|
| Other consumer | 40 |
| | 71 |
| 36 |
| | 71 |
|
| Total nonaccrual loans (1) | $ | 47,704 |
| | $ | 49,630 |
| $ | 47,098 |
| | $ | 49,630 |
|
(1)Included in these amounts were $5.6$4.1 million and $6.1 million of nonaccruing TDRs at March 31,June 30, 2018 and December 31, 2017, respectively.
The following table shows information regarding foreclosed residential real estate property at the dates indicated: | | | | March 31, 2018 | | December 31, 2017 | June 30, 2018 | | December 31, 2017 |
| | (Dollars in thousands) | (Dollars in thousands) |
| Foreclosed residential real estate property held by the creditor | $ | 358 |
| | $ | 612 |
| $ | 245 |
| | $ | 612 |
|
| Recorded investment in mortgage loans collateralized by residential real estate property that are in the process of foreclosure | $ | 2,094 |
| | $ | 2,971 |
| $ | 2,152 |
| | $ | 2,971 |
|
The following tables show the age analysis of past due financing receivables as of the dates indicated:
| | | | March 31, 2018 | June 30, 2018 |
| | 30-59 days | | 60-89 days | | 90 days or more | | Total Past Due | | | | Total Financing Receivables | | Recorded Investment >90 Days and Accruing | 30-59 days | | 60-89 days | | 90 days or more | | Total Past Due | | | | Total Financing Receivables | | Recorded Investment >90 Days and Accruing |
| | Number of Loans | | Principal Balance | | Number of Loans | | Principal Balance | | Number of Loans | | Principal Balance | | Number of Loans | | Principal Balance | | Current | | Number of Loans | | Principal Balance | | Number of Loans | | Principal Balance | | Number of Loans | | Principal Balance | | Number of Loans | | Principal Balance | | Current | |
| | (Dollars in thousands) | (Dollars in thousands) |
| Loan Portfolio | | | | | | | | | | | | | | | | | | | | | | | | | | | | | | | | | | | | | | | | | | |
| Commercial and industrial | 4 |
| | $ | 411 |
| | 2 |
| | $ | 101 |
| | 14 |
| | $ | 30,638 |
| | 20 |
| | $ | 31,150 |
| | $ | 872,064 |
| | $ | 903,214 |
| | $ | — |
| 5 |
| | $ | 291 |
| | 2 |
| | $ | 368 |
| | 12 |
| | $ | 30,042 |
| | 19 |
| | $ | 30,701 |
| | $ | 945,563 |
| | $ | 976,264 |
| | $ | — |
|
| Commercial real estate | 9 |
| | 3,127 |
| | 4 |
| | 1,253 |
| | 6 |
| | 1,413 |
| | 19 |
| | 5,793 |
| | 3,096,478 |
| | 3,102,271 |
| | — |
| 12 |
| | 9,675 |
| | 3 |
| | 2,534 |
| | 9 |
| | 2,272 |
| | 24 |
| | 14,481 |
| | 3,116,856 |
| | 3,131,337 |
| | — |
|
| Commercial construction | 2 |
| | 855 |
| | — |
| | — |
| | — |
| | — |
| | 2 |
| | 855 |
| | 400,079 |
| | 400,934 |
| | — |
| — |
| | — |
| | — |
| | — |
| | — |
| | — |
| | — |
| | — |
| | 364,225 |
| | 364,225 |
| | — |
|
| Small business | 11 |
| | 107 |
| | 8 |
| | 69 |
| | 23 |
| | 347 |
| | 42 |
| | 523 |
| | 133,143 |
| | 133,666 |
| | — |
| 8 |
| | 120 |
| | 8 |
| | 59 |
| | 14 |
| | 286 |
| | 30 |
| | 465 |
| | 146,672 |
| | 147,137 |
| | — |
|
| Residential real estate | 13 |
| | 1,834 |
| | 7 |
| | 1,100 |
| | 19 |
| | 3,052 |
| | 39 |
| | 5,986 |
| | 755,345 |
| | 761,331 |
| | — |
| 15 |
| | 2,567 |
| | 7 |
| | 908 |
| | 18 |
| | 3,405 |
| | 40 |
| | 6,880 |
| | 772,541 |
| | 779,421 |
| | — |
|
| Home equity | 22 |
| | 2,266 |
| | 8 |
| | 882 |
| | 26 |
| | 2,440 |
| | 56 |
| | 5,588 |
| | 1,045,864 |
| | 1,051,452 |
| | — |
| 21 |
| | 1,388 |
| | 11 |
| | 1,191 |
| | 24 |
| | 2,618 |
| | 56 |
| | 5,197 |
| | 1,064,100 |
| | 1,069,297 |
| | — |
|
| Other consumer (1) | 221 |
| | 104 |
| | 7 |
| | 2 |
| | 18 |
| | 20 |
| | 246 |
| | 126 |
| | 9,062 |
| | 9,188 |
| | 9 |
| 205 |
| | 81 |
| | 9 |
| | 11 |
| | 10 |
| | 22 |
| | 224 |
| | 114 |
| | 11,476 |
| | 11,590 |
| | 14 |
|
| Total | 282 |
| | $ | 8,704 |
| | 36 |
| | $ | 3,407 |
| | 106 |
| | $ | 37,910 |
| | 424 |
| | $ | 50,021 |
| | $ | 6,312,035 |
| | $ | 6,362,056 |
| | $ | 9 |
| 266 |
| | $ | 14,122 |
| | 40 |
| | $ | 5,071 |
| | 87 |
| | $ | 38,645 |
| | 393 |
| | $ | 57,838 |
| | $ | 6,421,433 |
| | $ | 6,479,271 |
| | $ | 14 |
|
|
| | | | | | | | | | | | | | | | | | | | | | | | | | | | | | | | | | | | | | | |
| | December 31, 2017 |
| | 30-59 days | | 60-89 days | | 90 days or more | | Total Past Due | | | | Total Financing Receivables | | Recorded Investment >90 Days and Accruing |
| | Number of Loans | | Principal Balance | | Number of Loans | | Principal Balance | | Number of Loans | | Principal Balance | | Number of Loans | | Principal Balance | | Current | |
| | (Dollars in thousands) |
| Loan Portfolio | | | | | | | | | | | | | | | | | | | | | |
| Commercial and industrial | 2 |
| | $ | 195 |
| | 2 |
| | $ | 370 |
| | 14 |
| | $ | 32,007 |
| | 18 |
| | $ | 32,572 |
| | $ | 855,956 |
| | $ | 888,528 |
| | $ | — |
|
| Commercial real estate | 7 |
| | 3,060 |
| | — |
| | — |
| | 9 |
| | 1,793 |
| | 16 |
| | 4,853 |
| | 3,111,708 |
| | 3,116,561 |
| | — |
|
| Commercial construction | — |
| | — |
| | — |
| | — |
| | — |
| | — |
| | — |
| | — |
| | 401,797 |
| | 401,797 |
| | — |
|
| Small business | 17 |
| | 339 |
| | 11 |
| | 144 |
| | 10 |
| | 57 |
| | 38 |
| | 540 |
| | 131,830 |
| | 132,370 |
| | — |
|
| Residential real estate | 6 |
| | 870 |
| | 13 |
| | 2,385 |
| | 22 |
| | 3,471 |
| | 41 |
| | 6,726 |
| | 747,603 |
| | 754,329 |
| | — |
|
| Home equity | 22 |
| | 1,310 |
| | 6 |
| | 451 |
| | 20 |
| | 2,025 |
| | 48 |
| | 3,786 |
| | 1,048,302 |
| | 1,052,088 |
| | — |
|
| Other consumer (1) | 265 |
| | 197 |
| | 16 |
| | 27 |
| | 17 |
| | 45 |
| | 298 |
| | 269 |
| | 9,611 |
| | 9,880 |
| | 8 |
|
| Total | 319 |
| | $ | 5,971 |
| | 48 |
| | $ | 3,377 |
| | 92 |
| | $ | 39,398 |
| | 459 |
| | $ | 48,746 |
| | $ | 6,306,807 |
| | $ | 6,355,553 |
| | $ | 8 |
|
(1) Other consumer portfolio is inclusive of deposit account overdrafts recorded as loan balances.
Troubled Debt Restructurings
In the course of resolving nonperforming loans, the Bank may choose to restructure the contractual terms of certain loans. The Bank attempts to work out an alternative payment schedule with the borrower in order to avoid foreclosure actions. Any loans that are modified are reviewed by the Bank to identify if a TDR has occurred, which is when, for economic or legal reasons related to a borrower’s financial difficulties, the Bank grants a concession to the borrower that it would not otherwise consider. Terms may be modified to fit the ability of the borrower to repay in line with its current financial status and the restructuring of the loan may include the transfer of assets from the borrower to satisfy the debt, a modification of loan terms, or a combination of the two.
The following table shows the Company’s total TDRs and other pertinent information as of the dates indicated:
| | | | March 31, 2018 | | December 31, 2017 | June 30, 2018 | | December 31, 2017 |
| | (Dollars in thousands) | (Dollars in thousands) |
| TDRs on accrual status | $ | 25,617 |
| | $ | 25,852 |
| $ | 25,528 |
| | $ | 25,852 |
|
| TDRs on nonaccrual | 5,637 |
| | 6,067 |
| 4,095 |
| | 6,067 |
|
| Total TDRs | $ | 31,254 |
| | $ | 31,919 |
| $ | 29,623 |
| | $ | 31,919 |
|
| Amount of specific reserves included in the allowance for loan losses associated with TDRs | $ | 1,257 |
| | $ | 1,342 |
| $ | 1,149 |
| | $ | 1,342 |
|
| Additional commitments to lend to a borrower who has been a party to a TDR | $ | 600 |
| | $ | 487 |
| $ | 767 |
| | $ | 487 |
|
The Company’s policy is to have any restructured loan which is on nonaccrual status prior to being modified remain on nonaccrual status for six months subsequent to being modified before management considers its return to accrual status. If the restructured loan is on accrual status prior to being modified, it is reviewed to determine if the modified loan should remain on accrual status. Additionally, loans classified as TDRs are adjusted to reflect the changes in value of the recorded investment in the loan, if any, resulting from the granting of a concession. For all residential loan modifications, the borrower must perform during a 90 day trial period before the modification is finalized.
The following tables show the modifications which occurred during the periods indicated and the change in the recorded investment subsequent to the modifications occurring:
| | | | Three Months Ended | Three Months Ended | | Six Months Ended |
| | March 31, 2018 | June 30, 2018 | | June 30, 2018 |
| | Number of Contracts | | Pre-Modification Outstanding Recorded Investment | | Post-Modification Outstanding Recorded Investment (1) | Number of Contracts | | Pre-Modification Outstanding Recorded Investment | | Post-Modification Outstanding Recorded Investment (1) | | Number of Contracts | | Pre-Modification Outstanding Recorded Investment | | Post-Modification Outstanding Recorded Investment (1) |
| | (Dollars in thousands) | (Dollars in thousands) |
| Troubled debt restructurings | | | | | | | | | | | | | | | | |
| Commercial real estate | 1 |
| | 445 |
| | 445 |
| — |
| | — |
| | — |
| | 1 |
| | 445 |
| | 445 |
|
| Residential real estate | | 1 |
| | 149 |
| | 149 |
| | 1 |
| | 149 |
| | 149 |
|
| Home equity | 2 |
| | 242 |
| | 242 |
| 4 |
| | 230 |
| | 230 |
| | 6 |
| | 472 |
| | 472 |
|
| Total | 3 |
| | $ | 687 |
| | $ | 687 |
| 5 |
| | $ | 379 |
| | $ | 379 |
| | 8 |
| | $ | 1,066 |
| | $ | 1,066 |
|
| | | | Three Months Ended | Three Months Ended | | Six Months Ended |
| | March 31, 2017 | June 30, 2017 | | June 30, 2017 |
| | Number of Contracts | | Pre-Modification Outstanding Recorded Investment | | Post-Modification Outstanding Recorded Investment (1) | Number of Contracts | | Pre-Modification Outstanding Recorded Investment | | Post-Modification Outstanding Recorded Investment (1) | | Number of Contracts | | Pre-Modification Outstanding Recorded Investment | | Post-Modification Outstanding Recorded Investment (1) |
| | (Dollars in thousands) | (Dollars in thousands) |
| Troubled debt restructurings | | | | | | | | | | | | | | | | |
| Commercial and industrial | 2 |
| | $ | 80 |
| | $ | 80 |
| 6 |
| | $ | 1,299 |
| | $ | 1,299 |
| | 8 |
| | $ | 1,379 |
| | $ | 1,379 |
|
| Commercial real estate | 4 |
| | 934 |
| | 934 |
| 2 |
| | 950 |
| | 950 |
| | 6 |
| | 1,884 |
| | 1,884 |
|
| Small business | 4 |
| | 143 |
| | 143 |
| 4 |
| | 121 |
| | 121 |
| | 8 |
| | 264 |
| | 264 |
|
| Residential real estate | | 5 |
| | 889 |
| | 900 |
| | 5 |
| | 889 |
| | 900 |
|
| Home equity | 2 |
| | 140 |
| | 140 |
| 8 |
| | 851 |
| | 854 |
| | 10 |
| | 991 |
| | 994 |
|
| Total | 12 |
| | $ | 1,297 |
| | $ | 1,297 |
| 25 |
| | $ | 4,110 |
| | $ | 4,124 |
| | 37 |
| | $ | 5,407 |
| | $ | 5,421 |
|
| |
| (1) | The post-modification balances represent the legal principal balance of the loan on the date of modification. These amounts may show an increase when modifications include a capitalization of interest. |
The following table shows the Company’s post-modification balance of TDRs listed by type of modification during the periods indicated:
| | | | | | | | Three Months Ended | | Six Months Ended |
| | Three Months Ended March 31 | June 30 | | June 30 |
| | 2018 | | 2017 | 2018 | | 2017 | | 2018 | | 2017 |
| | (Dollars in thousands) | (Dollars in thousands) | | (Dollars in thousands) |
| Extended maturity | $ | 445 |
| | $ | 1,207 |
| $ | — |
| | $ | 2,872 |
| | $ | 445 |
| | $ | 4,079 |
|
| Court ordered concession | 242 |
| | 90 |
| 379 |
| | 1,252 |
| | 621 |
| | 1,342 |
|
| Total | $ | 687 |
| | $ | 1,297 |
| $ | 379 |
| | $ | 4,124 |
| | $ | 1,066 |
| | $ | 5,421 |
|
The Company considers a loan to have defaulted when it reaches 90 days past due. ThereAs of June 30, 2018, there were no loans modified during the precedingpast twelve months that had subsequently defaulted during the three and six months ended March 31, 2018June 30, 2018. As of June 30, 2017, there was one loan modified during the preceding twelve months with a recorded investment of $205,000, which had subsequently defaulted during the three and six months ended June 30, 2017.
All TDR loans are considered impaired and therefore are subject to a specific review for impairment. The impairment analysis appropriately discounts the present value of the anticipated cash flows by the loan’s contractual rate of interest in effect prior to the loan’s modification. The amount of impairment, if any, is recorded as a specific loss allocation to each individual loan in the allowance for loan losses. Commercial loans (commercial and industrial, commercial construction, commercial real estate and small business loans), residential loans, and home equity loans that have been classified as TDRs and which subsequently default are reviewed to determine if the loan should be deemed collateral dependent. In such an instance, any shortfall between the value of the collateral and the carrying value of the loan is determined by measuring the recorded investment in the loan against the fair value of the collateral less costs to sell. The Company charges off the amount of any confirmed loan loss in the period when the loans, or portion of loans, are deemed uncollectible. Smaller balance consumer TDR loans are reviewed for performance to determine when a charge-off is appropriate.
Impaired Loans
A loan is considered impaired when, based on current information and events, it is probable that the Company will be unable to collect the scheduled payments of principal or interest when due according to the contractual terms of the loan agreement. Factors considered by management in determining impairment include payment status, collateral value, and the probability of collecting scheduled principal and interest payments when due. Loans that experience insignificant payment delays and payment shortfalls generally are not classified as impaired. Management determines the significance of payment delays and payment shortfalls on a case-by-case basis, taking into consideration all of the circumstances surrounding the loan and the borrower, including the length of the delay, the reasons for the delay, the borrower’s prior payment record, and the amount of the shortfall in relation to the principal and interest owed.
The tables below set forth information regarding the Company’s impaired loans by loan portfolio at the dates indicated:
| | | | March 31, 2018 | June 30, 2018 |
| | Recorded Investment | | Unpaid Principal Balance | | Related Allowance | Recorded Investment | | Unpaid Principal Balance | | Related Allowance |
| | (Dollars in thousands) | (Dollars in thousands) |
| With no related allowance recorded | | | | | | | | | | |
| Commercial and industrial | $ | 32,878 |
| | $ | 38,785 |
| | $ | — |
| $ | 32,319 |
| | $ | 38,662 |
| | $ | — |
|
| Commercial real estate | 14,747 |
| | 15,894 |
| | — |
| 12,858 |
| | 13,719 |
| | — |
|
| Small business | 727 |
| | 797 |
| | — |
| 645 |
| | 744 |
| | — |
|
| Residential real estate | 4,234 |
| | 4,367 |
| | — |
| 4,803 |
| | 4,945 |
| | — |
|
| Home equity | 5,248 |
| | 5,357 |
| | — |
| 5,037 |
| | 5,243 |
| | — |
|
| Other consumer | 85 |
| | 86 |
| | — |
| 64 |
| | 65 |
| | — |
|
| Subtotal | 57,919 |
| | 65,286 |
| | — |
| 55,726 |
| | 63,378 |
| | — |
|
| With an allowance recorded | | | | | | | | | | |
| Commercial and industrial | $ | 226 |
| | $ | 226 |
| | $ | 9 |
| $ | 223 |
| | $ | 223 |
| | $ | 8 |
|
| Commercial real estate | 1,723 |
| | 1,723 |
| | 37 |
| 2,158 |
| | 2,282 |
| | 74 |
|
| Small business | 126 |
| | 132 |
| | 3 |
| 158 |
| | 166 |
| | 1 |
|
| Residential real estate | 9,044 |
| | 9,790 |
| | 944 |
| 7,902 |
| | 8,752 |
| | 859 |
|
| Home equity | 1,678 |
| | 1,919 |
| | 248 |
| 1,722 |
| | 1,942 |
| | 231 |
|
| Other consumer | 207 |
| | 209 |
| | 16 |
| 191 |
| | 193 |
| | 14 |
|
| Subtotal | 13,004 |
| | 13,999 |
| | 1,257 |
| 12,354 |
| | 13,558 |
| | 1,187 |
|
| Total | $ | 70,923 |
| | $ | 79,285 |
| | $ | 1,257 |
| $ | 68,080 |
| | $ | 76,936 |
| | $ | 1,187 |
|
|
| | | | | | | | | | | |
| | December 31, 2017 |
| | Recorded Investment | | Unpaid Principal Balance | | Related Allowance |
| | (Dollars in thousands) |
| With no related allowance recorded | | | | | |
| Commercial and industrial | $ | 34,267 |
| | $ | 38,329 |
| | $ | — |
|
| Commercial real estate | 13,245 |
| | 14,374 |
| | — |
|
| Small business | 556 |
| | 619 |
| | — |
|
| Residential real estate | 4,264 |
| | 4,397 |
| | — |
|
| Home equity | 4,950 |
| | 5,056 |
| | — |
|
| Other consumer | 91 |
| | 92 |
| | — |
|
| Subtotal | 57,373 |
| | 62,867 |
| | — |
|
| With an allowance recorded | | | | | |
| Commercial and industrial | $ | 376 |
| | $ | 376 |
| | $ | 10 |
|
| Commercial real estate | 3,393 |
| | 3,399 |
| | 42 |
|
| Small business | 147 |
| | 153 |
| | 1 |
|
| Residential real estate | 9,420 |
| | 10,154 |
| | 1,007 |
|
| Home equity | 1,876 |
| | 2,110 |
| | 265 |
|
| Other consumer | 216 |
| | 217 |
| | 17 |
|
| Subtotal | 15,428 |
| | 16,409 |
| | 1,342 |
|
| Total | $ | 72,801 |
| | $ | 79,276 |
| | $ | 1,342 |
|
The following tables set forth information regarding interest income recognized on impaired loans, by portfolio, for the periods indicated:
| | | | Three Months Ended | Three Months Ended | | Six Months Ended |
| | March 31, 2018 | June 30, 2018 | | June 30, 2018 |
| | Average Recorded Investment | | Interest Income Recognized | Average Recorded Investment | | Interest Income Recognized | | Average Recorded Investment | | Interest Income Recognized |
| | (Dollars in thousands) | (Dollars in thousands) |
| With no related allowance recorded | | | | | | | | | | |
| Commercial and industrial | $ | 33,784 |
| | $ | 31 |
| $ | 32,557 |
| | $ | 34 |
| | $ | 33,198 |
| | $ | 68 |
|
| Commercial real estate | 14,855 |
| | 157 |
| 13,018 |
| | 148 |
| | 13,131 |
| | 295 |
|
| Small business | 710 |
| | 5 |
| 672 |
| | 3 |
| | 703 |
| | 8 |
|
| Residential real estate | 4,254 |
| | 53 |
| 4,825 |
| | 60 |
| | 4,842 |
| | 119 |
|
| Home equity | 5,280 |
| | 53 |
| 5,100 |
| | 54 |
| | 5,160 |
| | 106 |
|
| Other consumer | 87 |
| | 1 |
| 66 |
| | 1 |
| | 68 |
| | 2 |
|
| Subtotal | 58,970 |
| | 300 |
| 56,238 |
| | 300 |
| | 57,102 |
| | 598 |
|
| With an allowance recorded | | | | | | | | | | |
| Commercial and industrial | $ | 227 |
| | $ | 2 |
| $ | 225 |
| | $ | 2 |
| | $ | 226 |
| | $ | 5 |
|
| Commercial real estate | 1,730 |
| | 24 |
| 2,165 |
| | 24 |
| | 2,172 |
| | 48 |
|
| Small business | 131 |
| | 2 |
| 163 |
| | 3 |
| | 169 |
| | 6 |
|
| Residential real estate | 9,060 |
| | 71 |
| 8,003 |
| | 68 |
| | 8,045 |
| | 136 |
|
| Home equity | 1,688 |
| | 12 |
| 1,732 |
| | 15 |
| | 1,744 |
| | 27 |
|
| Other consumer | 211 |
| | 2 |
| 194 |
| | 1 |
| | 198 |
| | 3 |
|
| Subtotal | 13,047 |
| | 113 |
| 12,482 |
| | 113 |
| | 12,554 |
| | 225 |
|
| Total | $ | 72,017 |
| | $ | 413 |
| $ | 68,720 |
| | $ | 413 |
| | $ | 69,656 |
| | $ | 823 |
|
| | | | Three Months Ended | Three Months Ended | | Six Months Ended |
| | March 31, 2017 | June 30, 2017 | | June 30, 2017 |
| | Average Recorded Investment | | Interest Income Recognized | Average Recorded Investment | | Interest Income Recognized | | Average Recorded Investment | | Interest Income Recognized |
| | (Dollars in thousands) | (Dollars in thousands) |
| With no related allowance recorded | | | | | | | | | | |
| Commercial and industrial | $ | 39,193 |
| | $ | 208 |
| $ | 49,477 |
| | $ | 19 |
| | $ | 49,502 |
| | $ | 240 |
|
| Commercial real estate | 9,678 |
| | 91 |
| 11,547 |
| | 110 |
| | 11,655 |
| | 217 |
|
| Small business | 304 |
| | 3 |
| 549 |
| | 3 |
| | 559 |
| | 7 |
|
| Residential real estate | 3,671 |
| | 43 |
| 4,064 |
| | 48 |
| | 4,082 |
| | 96 |
|
| Home equity | 4,323 |
| | 44 |
| 4,746 |
| | 48 |
| | 4,781 |
| | 96 |
|
| Other consumer | 120 |
| | 2 |
| 114 |
| | 2 |
| | 118 |
| | 4 |
|
| Subtotal | 57,289 |
| | 391 |
| 70,497 |
| | 230 |
| | 70,697 |
| | 660 |
|
| With an allowance recorded | | | | | | | | | | |
| Commercial and industrial | $ | 10,178 |
| | $ | 4 |
| $ | 1,521 |
| | $ | 18 |
| | $ | 1,555 |
| | $ | 37 |
|
| Commercial real estate | 5,189 |
| | 50 |
| 5,633 |
| | 56 |
| | 5,656 |
| | 112 |
|
| Small business | 457 |
| | 5 |
| 316 |
| | 3 |
| | 321 |
| | 7 |
|
| Residential real estate | 10,057 |
| | 85 |
| 9,841 |
| | 77 |
| | 9,882 |
| | 157 |
|
| Home equity | 1,402 |
| | 13 |
| 1,489 |
| | 13 |
| | 1,497 |
| | 26 |
|
| Other consumer | 245 |
| | 2 |
| 237 |
| | 2 |
| | 241 |
| | 3 |
|
| Subtotal | 27,528 |
| | 159 |
| 19,037 |
| | 169 |
| | 19,152 |
| | 342 |
|
| Total | $ | 84,817 |
| | $ | 550 |
| $ | 89,534 |
| | $ | 399 |
| | $ | 89,849 |
| | $ | 1,002 |
|
Purchased Credit Impaired Loans
Certain loans acquired by the Company may have shown evidence of deterioration of credit quality since origination and it was therefore deemed unlikely that the Company would be able to collect all contractually required payments. As such, these loans were deemed to be PCI loans and the carrying value and prospective income recognition are predicated upon future cash flows expected to be collected. The following table displays certain information pertaining to PCI loans at the dates indicated:
| | | | March 31, 2018 | | December 31, 2017 | June 30, 2018 | | December 31, 2017 |
| | (Dollars in thousands) | (Dollars in thousands) |
| Outstanding balance | $ | 12,868 |
| | $ | 14,485 |
| $ | 12,702 |
| | $ | 14,485 |
|
| Carrying amount | $ | 11,410 |
| | $ | 13,023 |
| $ | 11,265 |
| | $ | 13,023 |
|
The following table summarizes activity in the accretable yield for the PCI loan portfolio:
| | | | Three Months Ended March 31 | Three Months Ended June 30 | | Six Months Ended June 30 |
| | 2018 | | 2017 | 2018 | | 2017 | | 2018 | | 2017 |
| | (Dollars in thousands) | (Dollars in thousands) |
| Beginning balance | $ | 1,791 |
| | $ | 2,370 |
| $ | 1,642 |
| | $ | 2,279 |
| | $ | 1,791 |
| | $ | 2,370 |
|
| Accretion | (215 | ) | | (307 | ) | (198 | ) | | (302 | ) | | (413 | ) | | (609 | ) |
| Other change in expected cash flows (1) | 44 |
| | 216 |
| 160 |
| | 190 |
| | 204 |
| | 406 |
|
| Reclassification from nonaccretable difference for loans which have paid off (2) | 22 |
| | — |
| — |
| | 18 |
| | 22 |
| | 18 |
|
| Ending balance | $ | 1,642 |
| | $ | 2,279 |
| $ | 1,604 |
| | $ | 2,185 |
| | $ | 1,604 |
| | $ | 2,185 |
|
(1) Represents changes in cash flows expected to be collected and resulting in increased interest income as a prospective yield adjustment over the remaining life of the loan(s).
(2) Results in increased interest income during the period in which the loan paid off at amount greater than originally expected.
NOTE 5 -EARNINGS PER SHARE
Earnings per share consisted of the following components for the periods indicated:
| | | | Three Months Ended | Three Months Ended | | Six Months Ended |
| | March 31 | June 30 | | June 30 |
| | 2018 | | 2017 | 2018 | | 2017 | | 2018 | | 2017 |
| | (Dollars in thousands, except per share data) | (Dollars in thousands, except per share data) |
| Net income | $ | 27,555 |
| | $ | 20,725 |
| $ | 31,118 |
| | $ | 20,563 |
| | $ | 58,673 |
| | $ | 41,288 |
|
| | | | | | | | | | | |
| Weighted Average Shares | | | | |
| Basic shares | 27,486,573 |
| | 27,029,640 |
| 27,526,653 |
| | 27,257,799 |
| | 27,506,724 |
| | 27,144,350 |
|
| Effect of dilutive securities | 67,381 |
| | 81,283 |
| 54,525 |
| | 74,497 |
| | 61,480 |
| | 78,757 |
|
| Diluted shares | 27,553,954 |
| | 27,110,923 |
| 27,581,178 |
| | 27,332,296 |
| | 27,568,204 |
| | 27,223,107 |
|
| | | | | | | | | | | |
| Net income per share | | | | | | | | | | |
| Basic EPS | $ | 1.00 |
| | $ | 0.77 |
| $ | 1.13 |
| | $ | 0.75 |
| | $ | 2.13 |
| | $ | 1.52 |
|
| Effect of dilutive securities | — |
| | (0.01 | ) | — |
| | — |
| | — |
| | — |
|
| Diluted EPS | $ | 1.00 |
| | $ | 0.76 |
| $ | 1.13 |
| | $ | 0.75 |
| | $ | 2.13 |
| | $ | 1.52 |
|
The following table illustrates the options to purchase common stock or shares of performance-based restricted stock that were excluded from the calculation of diluted earnings per share because they were anti-dilutive for the periods indicated:
| | | | Three Months Ended | Three Months Ended | | Six Months Ended |
| | March 31 | June 30 | | June 30 |
| | 2018 | | 2017 | 2018 | | 2017 | | 2018 | | 2017 |
| Stock options | 143 |
| | — |
| 181 |
| | — |
| | 163 |
| | — |
|
| Performance-based restricted stock | — |
| | 127 |
| — |
| | — |
| | — |
| | — |
|
NOTE 6 - STOCK BASED COMPENSATION
Time Vested Restricted Stock Awards
During the threesix months ended March 31,June 30, 2018, the Company made the following awards of restricted stock:
| | | Date | | Shares Granted | | Plan | | Grant Date Fair Value Per Share | | Vesting Period | | Shares Granted | | Plan | | Grant Date Fair Value Per Share | | Vesting Period |
| 2/15/2018 | | 39,950 |
| | 2005 Employee Stock Plan | | $ | 71.75 |
| | Ratably over 5 years from grant date | | 39,950 |
| | 2005 Employee Stock Plan | | $ | 71.75 |
| | Ratably over 5 years from grant date |
| 2/27/2018 | | 1,150 |
| | 2005 Employee Stock Plan | | $ | 72.60 |
| | Ratably over 5 years from grant date | | 1,150 |
| | 2005 Employee Stock Plan | | $ | 72.60 |
| | Ratably over 5 years from grant date |
| 5/15/2018 | | | 530 |
| | 2005 Employee Stock Plan | | $ | 74.00 |
| | Ratably over 5 years from grant date |
| 5/22/2018 | | | 6,000 |
| | 2018 Non-Employee Director Stock Plan | | $ | 76.58 |
| | Shares vested immediately |
The fair value of the restricted stock awards is based upon the average of the high and low price at which the Company’s common stock traded on the date of grant. The holders of restricted stock awards are entitled to receive dividends and to vote from and as of the date of grant.
Performance-Based Restricted Stock Awards
On February 15, 2018, the Company granted 16,300 performance-based restricted stock awards to certain executive level employees. These performance-based restricted stock awards were issued from the 2005 Employee Stock Plan and were determined to have a grant date fair value per share of $71.75, determined by the average of the high and low price at which the Company's common stock traded on the date of grant. The number of shares to be vested will be contingent upon the Company's attainment of certain performance measures outlined in the award agreement and will be measured as of the end of the three year performance period, January 1, 2018 through December 31, 2020. The awards will vest upon the earlier of the date on which it is determined if the performance goal is achieved subsequent to the performance period or March 31, 2021. These awards will be accounted for as equity awards due to the nature of these awards and the fact that these shares will not be settled in cash.
The holders of these awards are not entitled to receive dividends or vote until the shares are vested.
On February 27, 2018, the performance-based restricted stock awards that were awarded on February 12, 2015 vested at 100% of the maximum target shares awarded, or 16,427 shares.
Stock Options
The Company did not grant anyhas made the following awards of nonqualified options to purchase shares of common stock during the threesix months ended March 31, 2018.June 30, 2018:
|
| | | |
| | Six Months Ended
June 30, 2018 |
| Date of grant | 4/3/2018 |
|
| Plan | 2010 Non-Employee Director Stock Plan |
|
| Options granted | 5,000 |
|
| Vesting period (1) | 21 months |
|
| Expiration date | 4/3/2028 |
|
| Expected volatility | 21.15 | % |
| Expected life (years) | 5.5 |
|
| Expected dividend yield | 1.94 | % |
| Risk free interest rate | 2.62 | % |
| Fair value per option | $ | 13.46 |
|
(1) Vesting period began on the grant date.
NOTE 7 - REPURCHASE AGREEMENTS
The Company can raise additional liquidity by entering into repurchase agreements at its discretion. These repurchases are accounted for as a secured borrowing transaction for accounting purposes. Payments on such borrowings are interest only until the scheduled repurchase date. In a repurchase agreement the Company is subject to the risk that the purchaser may default at maturity and not return the securities underlying the agreements. In order to minimize this potential risk, the Company enters into repurchase agreements that stipulate that the securities underlying the agreement are not delivered to the customer and instead are held in segregated safekeeping accounts by the Company's safekeeping agents.
The table below sets forth information regarding the Company’s repurchase agreements allocated by source of collateral at the dates indicated: | | | | March 31,
2018 | | December 31,
2017 | June 30,
2018 | | December 31,
2017 |
| | (Dollars in thousands) | (Dollars in thousands) |
| Sources of collateral | | |
| U.S. government agency securities | $ | 13,200 |
| | $ | 16,867 |
| $ | 14,149 |
| | $ | 16,867 |
|
| Agency mortgage-backed securities | 55,946 |
| | 51,273 |
| 57,546 |
| | 51,273 |
|
| Agency collateralized mortgage obligations | 68,768 |
| | 94,539 |
| 70,540 |
| | 94,539 |
|
| Total customer repurchase agreements (1) | $ | 137,914 |
| | $ | 162,679 |
| $ | 142,235 |
| | $ | 162,679 |
|
(1) All customer repurchase agreements have an overnight and continuous maturity date.
For further information regarding the Company's repurchase agreements see Note 9 - Balance Sheet Offsetting.
NOTE 8 - DERIVATIVE AND HEDGING ACTIVITIES
The Company early adopted ASU 2017-12, Derivatives and Hedging: Targeted Improvements to Accounting for Hedging Activities as of January 1, 2018 to incorporate the new standard’s alignment of hedge accounting qualifications with the Company’s interest rate risk management with respect to new hedges entered into during the first quarter of 2018. This new standard was adopted under a modified retrospective transition, resulting in no changes to the accounting for hedge positions entered in to prior to January 1, 2018.
The Company’s derivative financial instruments are used to manage differences in the amount, timing, and duration of the Company’s known or expected cash receipts and its known or expected cash payments principally to manage the Company’s interest rate risk. Additionally, the Company enters into interest rate derivatives and foreign exchange contracts to accommodate the business requirements of its customers (“customer related positions”). The Company minimizes the market and liquidity risks of customer related positions by entering into similar offsetting positions with broker-dealers. Derivative instruments are carried at fair value in the Company’s financial statements. The accounting for changes in the fair value of a derivative instrument is dependent upon whether or not it qualifies as a hedge for accounting purposes, and further, by the type of hedging relationship.
The Company does not enter into proprietary trading positions for any derivatives.
Interest Rate Positions
The Company may utilize various interest rate derivatives as hedging instruments against interest rate risk associated with the Company’s borrowings and loan portfolios. An interest rate derivative is an agreement whereby one party agrees to pay a floating rate of interest on a notional principal amount in exchange for receiving a fixed rate of interest on the same notional amount, for a predetermined period of time, from a second party. The amounts relating to the notional principal amount are not actually exchanged.
The following tables reflect the Company's derivative positions for the periods indicated below for interest rate derivatives which qualify as cash flow hedges for accounting purposes:
| | | March 31, 2018 | |
| June 30, 2018 | | June 30, 2018 |
| Notional Amount | Notional Amount | | Trade Date | | Effective Date | | Maturity Date | | Receive (Variable) Index | | Current Rate Received | | Pay Fixed Swap Rate | | Fair Value | Notional Amount | | Trade Date | | Effective Date | | Maturity Date | | Receive (Variable) Index | | Current Rate Received | | Pay Fixed Swap Rate | | Fair Value |
(Dollars in thousands) | | $ | 25,000 |
| | 12/9/2008 | | 12/10/2008 | | 12/10/2018 | | 3 Month LIBOR | | 2.07 | % | | 2.94 | % | | $ | (118 | ) | 25,000 |
| | 12/9/2008 | | 12/10/2008 | | 12/10/2018 | | 3 Month LIBOR | | 2.33 | % | | 2.94 | % | | $ | (61 | ) |
| 25,000 | 25,000 |
| | 4/1/2016 | | 1/17/2017 | | 12/15/2021 | | 3 Month LIBOR | | 2.12 | % | | 1.36 | % | | 1,128 |
| 25,000 |
| | 4/1/2016 | | 1/17/2017 | | 12/15/2021 | | 3 Month LIBOR | | 2.34 | % | | 1.36 | % | | 1,227 |
|
| 25,000 | 25,000 |
| | 4/1/2016 | | 1/17/2017 | | 12/15/2021 | | 3 Month LIBOR | | 2.12 | % | | 1.36 | % | | 1,116 |
| 25,000 |
| | 4/1/2016 | | 1/17/2017 | | 12/15/2021 | | 3 Month LIBOR | | 2.34 | % | | 1.36 | % | | 1,218 |
|
| 25,000 | 25,000 |
| | 7/18/2017 | | 8/15/2017 | | 8/15/2022 | | 3 Month LIBOR | | 1.87 | % | | 1.88 | % | | 796 |
| 25,000 |
| | 7/18/2017 | | 8/15/2017 | | 8/15/2022 | | 3 Month LIBOR | | 2.32 | % | | 1.88 | % | | 949 |
|
| | | | | | | | | | | | | | | |
| Notional Amount | Notional Amount | | Trade Date | | Effective Date | | Maturity Date | | Pay (Variable) Index | | Current Rate Paid | | Receive Fixed Swap Rate | | Fair Value | Notional Amount | | Trade Date | | Effective Date | | Maturity Date | | Pay (Variable) Index | | Current Rate Paid | | Receive Fixed Swap Rate | | Fair Value |
| 50,000 | 50,000 |
| | 1/9/2018 | | 1/16/2018 | | 1/15/2023 | | 1 Month LIBOR | | 1.78 | % | | 2.24 | % | | $ | (678 | ) | 50,000 |
| | 1/9/2018 | | 1/16/2018 | | 1/15/2023 | | 1 Month LIBOR | | 2.07 | % | | 2.24 | % | | $ | (1,073 | ) |
| | | | | | | | | | | | | | | |
| Notional Amount | Notional Amount | | Trade Date | | Effective Date | | Maturity Date | | Pay (Variable) Index | | Current Rate Paid | | Receive Fixed Swap Rate Cap - Floor | | Fair Value | Notional Amount | | Trade Date | | Effective Date | | Maturity Date | | Pay (Variable) Index | | Current Rate Paid | | Receive Fixed Swap Rate Cap - Floor | | Fair Value |
| 50,000 | 50,000 |
| | 1/9/2018 | | 1/16/2018 | | 1/15/2022 | | 1 Month LIBOR | | 1.78 | % | | 2.75% - 1.80% |
| | $ | (270 | ) | 50,000 |
| | 1/9/2018 | | 1/16/2018 | | 1/15/2022 | | 1 Month LIBOR | | 2.07 | % | | 2.75% - 1.80% |
| | $ | (382 | ) |
| | | | | | | | | | | | | | | |
|
|
| | | | | | $ | 1,974 |
|
|
| | | | | | $ | 1,878 |
|
|
| | | | | | | | | | | | | | | | | | | | |
| December 31, 2017 |
| Notional Amount | | Trade Date | | Effective Date | | Maturity Date | | Receive (Variable) Index | | Current Rate Received | | Pay Fixed Swap Rate | | Fair Value |
| (Dollars in thousands) |
| $ | 25,000 |
| | 12/9/2008 | | 12/10/2008 | | 12/10/2018 | | 3 Month LIBOR | | 1.54 | % | | 2.94 | % | | $ | (264 | ) |
| 25,000 |
| | 4/1/2016 | | 1/17/2017 | | 12/15/2021 | | 3 Month LIBOR | | 1.59 | % | | 1.36 | % | | 772 |
|
| 25,000 |
| | 4/1/2016 | | 1/17/2017 | | 12/15/2021 | | 3 Month LIBOR | | 1.59 | % | | 1.36 | % | | 763 |
|
| 25,000 |
| | 7/18/2017 | | 8/15/2017 | | 8/15/2022 | | 3 Month LIBOR | | 1.42 | % | | 1.88 | % | | 345 |
|
|
| | | | | | | | | | | | | | $ | 1,616 |
|
The maximum length of time over which the Company is currently hedging its exposure to the variability in future cash flows for forecasted transactions related to the payment of variable interest on existing financial instruments is five years.
For derivative instruments that are designated and qualify as cash flow hedging instruments, the effective portion of the gains or losses is reported as a component of other comprehensive income ("OCI"), and is subsequently reclassified into earnings in the period that the hedged forecasted transaction affects earnings. The Company expects approximately $53,000$77,000 to be reclassified to interest income and $656,000$822,000 (pre-tax) to be reclassified as an offset to interest income and an offset to interest expense, respectively, from OCI related to the Company’s cash flow hedges in the next twelve months. This reclassification is due to anticipated payments that will be made and/or received on the swaps based upon the forward curve as of March 31,June 30, 2018.
The Company recognized $61,000 and $122,000 of net amortization income that was an offset to interest expense related to previously terminated swaps for each of the three and six month periods ended March 31,June 30, 2018 and 2017.2017, respectively.
The Company had no fair value hedges as of March 31,June 30, 2018 or December 31, 2017.
Customer Related Positions
Loan level derivatives, primarily interest rate swaps, offered to commercial borrowers through the Company’s loan level derivative program do not qualify as hedges for accounting purposes. The Company believes that its exposure to commercial customer derivatives is limited because these contracts are simultaneously matched at inception with an offsetting dealer transaction. The commercial customer derivative program allows the Company to retain variable-rate commercial loans while allowing the customer to synthetically fix the loan rate by entering into a variable-to-fixed interest rate swap.
Foreign exchange contracts offered to commercial borrowers through the Company’s derivative program do not qualify as hedges for accounting purposes. The Company acts as a seller and buyer of foreign exchange contracts to accommodate its
customers. To mitigate the market and liquidity risk associated with these derivatives, the Company enters into similar offsetting positions.
The following tables reflect the Company’s customer related derivative positions for the periods indicated below for those derivatives not designated as hedging:
| | | | | | Notional Amount Maturing | | | | | Notional Amount Maturing | | |
| | Number of Positions (1) | | Less than 1 year | | Less than 2 years | | Less than 3 years | | Less than 4 years | | Thereafter | | Total | | Fair Value | Number of Positions (1) | | Less than 1 year | | Less than 2 years | | Less than 3 years | | Less than 4 years | | Thereafter | | Total | | Fair Value |
| | March 31, 2018 | June 30, 2018 |
| | (Dollars in thousands) | (Dollars in thousands) |
| Loan level swaps | | | | | | | | | | | | | | | | | | | | | | | | | | | | | | |
| Receive fixed, pay variable | 248 |
| | $ | 34,081 |
| | $ | 95,894 |
| | $ | 173,172 |
| | $ | 59,531 |
| | $ | 602,621 |
| | $ | 965,299 |
| | $ | (11,404 | ) | 244 |
| | $ | 59,965 |
| | $ | 61,506 |
| | $ | 176,919 |
| | $ | 57,508 |
| | $ | 614,476 |
| | $ | 970,374 |
| | $ | (17,467 | ) |
| Pay fixed, receive variable | 233 |
| | $ | 34,081 |
| | $ | 95,894 |
| | $ | 173,172 |
| | $ | 59,531 |
| | $ | 602,621 |
| | $ | 965,299 |
| | $ | 11,390 |
| 229 |
| | $ | 59,965 |
| | $ | 61,506 |
| | $ | 176,919 |
| | $ | 57,508 |
| | $ | 614,476 |
| | $ | 970,374 |
| | $ | 17,456 |
|
| Foreign exchange contracts | | | | | | | | | | | | | | | | | | | | | | | | | | | | | | |
| Buys foreign currency, sells U.S. currency | 18 |
| | $ | 33,089 |
| | $ | — |
| | $ | — |
| | $ | — |
| | $ | — |
| | $ | 33,089 |
| | $ | 770 |
| 28 |
| | $ | 48,077 |
| | $ | — |
| | $ | — |
| | $ | — |
| | $ | — |
| | $ | 48,077 |
| | $ | (1,041 | ) |
| Buys U.S. currency, sells foreign currency | 18 |
| | $ | 33,089 |
| | $ | — |
| | $ | — |
| | $ | — |
| | $ | — |
| | $ | 33,089 |
| | $ | (751 | ) | 28 |
| | $ | 48,077 |
| | $ | — |
| | $ | — |
| | $ | — |
| | $ | — |
| | $ | 48,077 |
| | $ | 1,067 |
|
| | December 31, 2017 | December 31, 2017 |
| | (Dollars in thousands) | (Dollars in thousands) |
| Loan level swaps | | | | | | | | | | | | | | | | | | | | | | | | | | | | | | |
| Receive fixed, pay variable | 246 |
| | $ | 36,023 |
| | $ | 61,500 |
| | $ | 152,287 |
| | $ | 111,147 |
| | $ | 591,385 |
| | $ | 952,342 |
| | $ | 3,875 |
| 246 |
| | $ | 36,023 |
| | $ | 61,500 |
| | $ | 152,287 |
| | $ | 111,147 |
| | $ | 591,385 |
| | $ | 952,342 |
| | $ | 3,875 |
|
| Pay fixed, receive variable | 231 |
| | $ | 36,023 |
| | $ | 61,500 |
| | $ | 152,287 |
| | $ | 111,147 |
| | $ | 591,385 |
| | $ | 952,342 |
| | $ | (3,880 | ) | 231 |
| | $ | 36,023 |
| | $ | 61,500 |
| | $ | 152,287 |
| | $ | 111,147 |
| | $ | 591,385 |
| | $ | 952,342 |
| | $ | (3,880 | ) |
| Foreign exchange contracts | | | | | | | | | | | | | | | | | | | | | | | | | | | | | | |
| Buys foreign currency, sells U.S. currency | 15 |
| | $ | 26,382 |
| | $ | 3,780 |
| | $ | — |
| | $ | — |
| | $ | — |
| | $ | 30,162 |
| | $ | 1,202 |
| 15 |
| | $ | 26,382 |
| | $ | 3,780 |
| | $ | — |
| | $ | — |
| | $ | — |
| | $ | 30,162 |
| | $ | 1,202 |
|
| Buys U.S. currency, sells foreign currency | 15 |
| | $ | 26,382 |
| | $ | 3,780 |
| | $ | — |
| | $ | — |
| | $ | — |
| | $ | 30,162 |
| | $ | (1,188 | ) | 15 |
| | $ | 26,382 |
| | $ | 3,780 |
| | $ | — |
| | $ | — |
| | $ | — |
| | $ | 30,162 |
| | $ | (1,188 | ) |
| |
| (1) | The Company may enter into one dealer swap agreement which offsets multiple commercial borrower swap agreements. |
Mortgage Derivatives
Prior to closing and funding certain 1- 4 family residential mortgage loans, an interest rate lock commitment is generally extended to the borrower. During the period from commitment date to closing date, the Company is subject to the risk that market rates of interest may change. If market rates rise, investors generally will pay less to purchase such loans resulting in a reduction in the gain on sale of the loans or, possibly, a loss. In an effort to mitigate such risk, forward delivery sales commitments are executed, under which the Company agrees to deliver whole mortgage loans to various investors. These forward commitments carry a market price that has a strong inverse relationship to that of mortgage prices. Certain assumptions, including pull through rates and rate lock periods, are used in managing the existing and future hedges. The accuracy of underlying assumptions will impact the ultimate effectiveness of any hedging strategies.
The change in fair value on the interest rate lock commitments and forward delivery sale commitments are recorded in current period earnings as a component of mortgage banking income. In addition, the Company has elected the fair value option to carry loans held for sale at fair value. The change in fair value of loans held for sale is recorded in current period earnings as a component of mortgage banking income in accordance with the Company's fair value election. The change in fair value associated with loans held for sale was a decreasean increase of $26,000$70,000 and $147,000$153,000 for the three month periods ended March 31,June 30, 2018 and 2017, respectively, and an increase of $44,000 and $6,000 for the six months ended June 30, 2018 and 2017, respectively. These amounts were offset in earnings by the change in the fair value of mortgage derivatives. Additionally, the aggregate amount of net realized gains or losses on sales of such loans included within mortgage banking income was $782,000$755,000 and $980,000$977,000 for the three month periods ended March 31,June 30, 2018 and 2017, respectively and $1.5 million and $2.0 million for the six months ended June 30, 2018 and 2017, respectively.
The table below presents the fair value of the Company’s derivative financial instruments, as well as their classification on the balance sheet at the periods indicated:
| | | | Asset Derivatives | | Liability Derivatives | Asset Derivatives | | Liability Derivatives |
| | | Fair Value at | | Fair Value at | | Fair Value at | | Fair Value at | | Fair Value at | | Fair Value at | | Fair Value at | | Fair Value at |
| | Balance Sheet
Location | | March 31
2018 | | December 31
2017 | | Balance Sheet
Location | | March 31
2018 | | December 31
2017 | Balance Sheet
Location | | June 30
2018 | | December 31
2017 | | Balance Sheet
Location | | June 30
2018 | | December 31
2017 |
| | (Dollars in thousands) | (Dollars in thousands) |
| Derivatives designated as hedges | | | | | | | | | | | | | | | | |
| Interest rate derivatives | Other assets | | $ | 3,040 |
| | $ | 1,880 |
| | Other liabilities | | $ | 1,066 |
| | $ | 264 |
| Other assets | | $ | 3,394 |
| | $ | 1,880 |
| | Other liabilities | | $ | 1,516 |
| | $ | 264 |
|
| Derivatives not designated as hedges | | | | | | | | | | | | | | | | |
| Customer Related Positions | | | | | | | | | | | | | | | | |
| Loan level derivatives | Other assets | | $ | 16,916 |
| | $ | 14,236 |
| | Other liabilities | | $ | 16,930 |
| | $ | 14,241 |
| Other assets | | $ | 21,861 |
| | $ | 14,236 |
| | Other liabilities | | $ | 21,872 |
| | $ | 14,241 |
|
| Foreign exchange contracts | Other assets | | 914 |
| | 1,202 |
| | Other liabilities | | 895 |
| | 1,188 |
| Other assets | | 1,137 |
| | 1,202 |
| | Other liabilities | | 1,111 |
| | 1,188 |
|
| Mortgage Derivatives | | | | | | | | | | | | | | | | |
| Interest rate lock commitments | Other assets | | 151 |
| | 149 |
| | Other liabilities | | — |
| | — |
| Other assets | | 231 |
| | 149 |
| | Other liabilities | | — |
| | — |
|
| Forward sales agreements | Other assets | | 19 |
| | 9 |
| | Other liabilities | | — |
| | — |
| Other assets | | 80 |
| | 9 |
| | Other liabilities | | — |
| | — |
|
| | | $ | 18,000 |
| | $ | 15,596 |
| | $ | 17,825 |
| | $ | 15,429 |
| | $ | 23,309 |
| | $ | 15,596 |
| | $ | 22,983 |
| | $ | 15,429 |
|
| Total | | $ | 21,040 |
| | $ | 17,476 |
| | $ | 18,891 |
| | $ | 15,693 |
| | $ | 26,703 |
| | $ | 17,476 |
| | $ | 24,499 |
| | $ | 15,693 |
|
The table below presents the effect of the Company’s derivative financial instruments included in OCI and current earnings for the periods indicated:
| | | | Three Months Ended | Three Months Ended | | Six Months Ended |
| | March 31 | June 30 | | June 30 |
| | 2018 | | 2017 | 2018 | | 2017 | | 2018 | | 2017 |
| | (Dollars in thousands) | (Dollars in thousands) |
| Derivatives designated as hedges | | | | | | | | | | |
| Gain in OCI on derivatives (effective portion), net of tax | $ | 215 |
| | $ | 89 |
| |
| Gain (loss) in OCI on derivatives (effective portion), net of tax | | $ | (112 | ) | | $ | (190 | ) | | $ | 103 |
| | $ | (101 | ) |
| Gain (loss) reclassified from OCI into interest income or interest expense (effective portion) | $ | 90 |
| | $ | (93 | ) | $ | 167 |
| | $ | (80 | ) | | $ | 257 |
| | $ | (173 | ) |
| Loss recognized in income on derivatives (ineffective portion and amount excluded from effectiveness testing) | | | | | | | | | | |
| Interest expense | $ | — |
| | $ | — |
| $ | — |
| | $ | — |
| | $ | — |
| | $ | — |
|
| Other expense | — |
| | — |
| — |
| | — |
| | — |
| | — |
|
| Total | $ | — |
| | $ | — |
| $ | — |
| | $ | — |
| | $ | — |
| | $ | — |
|
| Derivatives not designated as hedges | | | | | | | | | | |
| Changes in fair value of customer related positions | | | | | | | | | | |
| Other income | $ | 9 |
| | $ | (7 | ) | $ | 15 |
| | $ | 7 |
| | $ | 24 |
| | $ | — |
|
| Other expense | (13 | ) | | (6 | ) | (5 | ) | | (4 | ) | | (18 | ) | | (10 | ) |
| Changes in fair value of mortgage derivatives | | | | | | | | | | |
| Mortgage banking income | 12 |
| | 50 |
| 141 |
| | 54 |
| | 153 |
| | 104 |
|
| Total | $ | 8 |
| | $ | 37 |
| $ | 151 |
| | $ | 57 |
| | $ | 159 |
| | $ | 94 |
|
The Company's derivative agreements with institutional counterparties contain various credit-risk related contingent provisions, such as requiring the Company to maintain a well-capitalized capital position. If the Company fails to meet these conditions, the counterparties could request the Company make immediate payment or demand that the Company provide immediate and ongoing full collateralization on derivative positions in net liability positions. The aggregate fair value of all derivative instruments with credit-risk related contingent features that were in a net liability position was $288,000$106,000 and $4.2 million
at March 31,June 30, 2018 and December 31, 2017, respectively. Although none of the contingency provisions have applied as of March 31,June 30, 2018 and December 31, 2017, the Company has posted collateral to offset the net liability exposures with institutional counterparties.
By using derivatives, the Company is exposed to credit risk to the extent that counterparties to the derivative contracts do not perform as required. Should a counterparty fail to perform under the terms of a derivative contract, the Company's credit exposure on interest rate swaps is limited to the net positive fair value and accrued interest of all swaps with each counterparty. The Company seeks to minimize counterparty credit risk through credit approvals, limits, monitoring procedures, and obtaining collateral, where appropriate. Institutional counterparties must have an investment grade credit rating and be approved by the Company's Board of Directors. As such, management believes the risk of incurring credit losses on derivative contracts with institutional counterparties is remote. The Company's exposure relating to institutional counterparties was $17.4$23.2 million and $7.1 million at March 31,June 30, 2018 and December 31, 2017, respectively. The Company’s exposure relating to customer counterparties was approximately $3.2$2.4 million and $9.5 million at March 31,June 30, 2018 and December 31, 2017, respectively. Credit exposure may be reduced by the value of collateral pledged by the counterparty.
NOTE 9 - BALANCE SHEET OFFSETTING
The Company does not offset fair value amounts recognized for derivative instruments or repurchase agreements. The Company does net the amount recognized for the right to reclaim cash collateral against the obligation to return cash collateral arising from derivative instruments executed with the same counterparty under a master netting arrangement. Collateral legally required to be maintained at dealer banks by the Company is monitored and adjusted as necessary.
The following tables present the Company's asset and liability derivative positions and the potential effect of netting arrangements on its financial position, as of the periods indicated:
| | | | | Gross Amounts Not Offset in the Statement of Financial Position | | | Gross Amounts Not Offset in the Statement of Financial Position | |
| | Gross Amounts Recognized in the Statement of Financial Position | Gross Amounts Offset in the Statement of Financial Position | Net Amounts Presented in the Statement of Financial Position | Financial Instruments (1) | Collateral Pledged (Received) | Net Amount | Gross Amounts Recognized in the Statement of Financial Position | Gross Amounts Offset in the Statement of Financial Position | Net Amounts Presented in the Statement of Financial Position | Financial Instruments (1) | Collateral Pledged (Received) | Net Amount |
| | March 31, 2018 | June 30, 2018 |
| | (Dollars in thousands) | (Dollars in thousands) |
| Derivative Assets | | |
| Interest rate swaps | $ | 3,040 |
| $ | — |
| $ | 3,040 |
| $ | 948 |
| $ | (1,128 | ) | $ | 964 |
| $ | 3,394 |
| $ | — |
| $ | 3,394 |
| $ | 1,455 |
| $ | (1,227 | ) | $ | 712 |
|
| Loan level derivatives | 16,916 |
| — |
| 16,916 |
| 2,767 |
| (8,945 | ) | 5,204 |
| 21,861 |
| — |
| 21,861 |
| 2,171 |
| (10,123 | ) | 9,567 |
|
| Customer foreign exchange contracts | 914 |
| — |
| 914 |
| — |
| — |
| 914 |
| 1,137 |
| — |
| 1,137 |
| — |
| — |
| 1,137 |
|
| | $ | 20,870 |
| $ | — |
| $ | 20,870 |
| $ | 3,715 |
| $ | (10,073 | ) | $ | 7,082 |
| $ | 26,392 |
| $ | — |
| $ | 26,392 |
| $ | 3,626 |
| $ | (11,350 | ) | $ | 11,416 |
|
| | | |
| Derivative Liabilities | | |
| Interest rate swaps | $ | 1,066 |
| $ | — |
| $ | 1,066 |
| $ | 948 |
| $ | 118 |
| $ | — |
| $ | 1,516 |
| $ | — |
| $ | 1,516 |
| $ | 1,455 |
| $ | 61 |
| $ | — |
|
| Loan level derivatives | 16,930 |
| — |
| 16,930 |
| 2,767 |
| 141 |
| 14,022 |
| 21,872 |
| — |
| 21,872 |
| 2,171 |
| 32 |
| 19,669 |
|
| Customer foreign exchange contracts | 895 |
| — |
| 895 |
| — |
| — |
| 895 |
| 1,111 |
| — |
| 1,111 |
| — |
| — |
| 1,111 |
|
| | $ | 18,891 |
| $ | — |
| $ | 18,891 |
| $ | 3,715 |
| $ | 259 |
| $ | 14,917 |
| $ | 24,499 |
| $ | — |
| $ | 24,499 |
| $ | 3,626 |
| $ | 93 |
| $ | 20,780 |
|
| | | |
| Customer repurchase agreements | 137,914 |
| — |
| 137,914 |
| — |
| 137,914 |
| — |
| 142,235 |
| — |
| 142,235 |
| — |
| 142,235 |
| — |
|
| |
| (1) | Reflects offsetting derivative positions with the same counterparty. |
|
| | | | | | | | | | | | | | | | | | |
| | | | | Gross Amounts Not Offset in the Statement of Financial Position | |
| | Gross Amounts Recognized in the Statement of Financial Position | Gross Amounts Offset in the Statement of Financial Position | Net Amounts Presented in the Statement of Financial Position | Financial Instruments (1) | Collateral Pledged (Received) | Net Amount |
| | December 31, 2017 |
| | (Dollars in thousands) |
| Derivative Assets | |
| Interest rate swaps | $ | 1,880 |
| $ | — |
| $ | 1,880 |
| $ | 805 |
| $ | — |
| $ | 1,075 |
|
| Loan level derivatives | 14,236 |
| — |
| 14,236 |
| 4,578 |
| — |
| 9,658 |
|
| Customer foreign exchange contracts | 1,202 |
| — |
| 1,202 |
| — |
| — |
| 1,202 |
|
| | $ | 17,318 |
| $ | — |
| $ | 17,318 |
| $ | 5,383 |
| $ | — |
| $ | 11,935 |
|
| | | | | | | |
| Derivative Liabilities | |
| Interest rate swaps | $ | 264 |
| $ | — |
| $ | 264 |
| $ | — |
| $ | 264 |
| $ | — |
|
| Loan level derivatives | 14,241 |
| — |
| 14,241 |
| 5,383 |
| 3,675 |
| 5,183 |
|
| Customer foreign exchange contracts | 1,188 |
| — |
| 1,188 |
| — |
| — |
| 1,188 |
|
| | $ | 15,693 |
| $ | — |
| $ | 15,693 |
| $ | 5,383 |
| $ | 3,939 |
| $ | 6,371 |
|
| | | | | | | |
| Customer repurchase agreements | 162,679 |
| — |
| 162,679 |
| — |
| 162,679 |
| — |
|
| |
| (1) | Reflects offsetting derivative positions with the same counterparty. |
NOTE 10 - FAIR VALUE MEASUREMENTS
Fair value is a market-based measure considered from the perspective of a market participant rather than an entity-specific measure. Therefore, even when market assumptions are not readily available, the assumptions applied by the Company when determining fair value reflect those that the Company determines market participants would use to price the asset or liability at the measurement date. If there has been a significant decrease in the volume and level of activity for the asset or liability, regardless of the valuation technique(s) used, the objective of a fair value measurement remains the same. Fair value is the price that would be received if the asset were to be sold or that would be or paid if liability were to be transferred in an orderly market transaction (that is, not a forced liquidation or distressed sale) between market participants at the measurement date under current market conditions. When determining fair value, the Company considers pricing information and other inputs that are current as of the measurement date. In periods of market dislocation, the observability of prices and other inputs may be reduced for certain instruments, or not available at all. The unavailability or reduced availability of pricing or other input information could cause an instrument to be reclassified from one level to another.
The Fair Value Measurements and Disclosures Topic of the FASB ASC defines fair value and establishes a fair value hierarchy that prioritizes the inputs to valuation techniques used to measure fair value. The hierarchy gives the highest priority to unadjusted quoted prices in active markets for identical assets or liabilities (Level 1 measurements) and the lowest priority to unobservable inputs (Level 3 measurements). The three levels of the fair value hierarchy under the Fair Value Measurements and Disclosures Topic of the FASB ASC are described below:
Level 1 – Inputs are quoted prices (unadjusted) in active markets for identical assets or liabilities that the reporting entity has the ability to access at the measurement date.
Level 2 – Valuations based on quoted prices in markets that are not active or for which all significant inputs are observable, either directly or indirectly.
Level 3 – Prices or valuations that require inputs that are both significant to the fair value measurement and unobservable.
To the extent that valuation is based on models or inputs that are less observable or unobservable in the market, the determination of fair value requires more judgment. Accordingly, the degree of judgment exercised by the Company in determining
fair value is greatest for instruments categorized in Level 3. A financial instrument’s level within the fair value hierarchy is based on the lowest level of any input that is significant to the fair value measurement.
Valuation Techniques
There have been no changes in the valuation techniques used during the current period.
Securities
Trading and Equity Securities
These equity securities are valued based on market quoted prices. These securities are categorized in Level 1 as they are actively traded and no valuation adjustments have been applied.
U.S. Government Agency Securities
Fair value is estimated using either multi-dimensional spread tables or benchmarks. The inputs used include benchmark yields, reported trades, and broker/dealer quotes. These securities are classified as Level 2.
Agency Mortgage-Backed Securities
Fair value is estimated using either a matrix or benchmarks. The inputs used include benchmark yields, reported trades, broker/dealer quotes, and issuer spreads. These securities are categorized as Level 2.
Agency Collateralized Mortgage Obligations and Small Business Administration Pooled Securities
The valuation model for these securities is volatility-driven and ratings based, and uses multi-dimensional spread tables. The inputs used include benchmark yields, reported trades, new issue data, broker dealer quotes, and collateral performance. If there is at least one significant model assumption or input that is not observable, these securities are categorized as Level 3 within the fair value hierarchy; otherwise, they are classified as Level 2.
State, County, and Municipal Securities
The fair value is estimated using a valuation matrix with inputs including bond interest rate tables, recent transactions, and yield relationships. These securities are categorized as Level 2.
Single and Pooled Issuer Trust Preferred Securities
The fair value of trust preferred securities, including pooled and single issuer preferred securities, is estimated using external pricing models, discounted cash flow methodologies or similar techniques. The inputs used in these valuations include benchmark yields, reported trades, new issue data, broker dealer quotes, and collateral performance. If there is at least one significant model assumption or input that is not observable, these securities are classified as Level 3 within the fair value hierarchy; otherwise, they are classified as Level 2.
Loans Held for Sale
The Company has elected the fair value option to account for originated closed loans intended for sale. The fair value is measured on an individual loan basis using quoted market prices and when not available, comparable market value or discounted cash flow analysis may be utilized. These assets are typically classified as Level 2.
Derivative Instruments
Derivatives
The valuation of these instruments is determined using widely accepted valuation techniques including discounted cash flow analysis on the expected cash flows of each derivative. This analysis reflects the contractual terms of the derivatives, including the period to maturity, and uses observable market-based inputs, including interest rate curves and implied volatilities. The Company incorporates credit valuation adjustments to appropriately reflect nonperformance risk in the fair value measurements. In adjusting the fair value of its derivative contracts for the effect of nonperformance risk, the Company has considered the impact of netting and any applicable credit enhancements, such as collateral postings. Additionally, in conjunction with fair value measurement guidance, the Company has made an accounting policy election to measure the credit risk of its derivative financial instruments that are subject to master netting agreements on a net basis by counterparty portfolio. Although the Company has determined that the majority of the inputs used to value its interest rate derivatives fall within Level 2 of the fair value hierarchy, the credit valuation adjustments associated with its interest rate derivatives may also utilize Level 3 inputs, such as estimates of current credit spreads to evaluate the likelihood of default by the Company and its counterparties. However, as of March 31,June 30, 2018 and December 31, 2017, the Company has assessed the significance of the impact of the credit valuation adjustments on the overall valuation of its derivative positions and has determined that the credit valuation adjustments are not significant to the overall
valuation of its derivatives. As a result, the Company has determined that its derivative valuations in their entirety are properly classified as Level 2.
Mortgage Derivatives
The fair value of mortgage derivatives is determined based on current market prices for similar assets in the secondary market and, therefore, classified as Level 2 within the fair value hierarchy.
Impaired Loans
Collateral dependent loans that are deemed to be impaired are valued based upon the lower of cost or fair value of the underlying collateral less costs to sell. The inputs used in the appraisals of the collateral are not always observable, and in such cases the loans may be classified as Level 3 within the fair value hierarchy; otherwise, they are classified as Level 2.
Other Real Estate Owned and Other Foreclosed Assets
Other Real Estate Owned ("OREO") and Other Foreclosed Assets are valued at the lower of cost or fair value of the property, less estimated costs to sell. The fair values are generally estimated based upon recent appraisal values of the property less costs to sell the property. Certain inputs used in appraisals are not always observable, and therefore OREO and Other Foreclosed Assets may be classified as Level 3 within the fair value hierarchy.
Goodwill and Other Intangible Assets
Goodwill and other intangible assets are subject to impairment testing. The Company conducts an annual impairment test of goodwill in the third quarter of each year, or more frequently if necessary. Other intangible assets are reviewed for impairment whenever events or changes in circumstances indicate that the carrying amount of the assets may not be recoverable. To estimate the fair value of goodwill and, if necessary, other intangible assets, the Company utilizes both a comparable analysis of relevant price multiples in recent market transactions and discounted cash flow analysis. Both valuation models require a significant degree of management judgment. In the event the fair value as determined by the valuation model is less than the carrying value, the intangibles may be impaired. If the impairment testing resulted in impairment, the Company would classify the impaired goodwill and other intangible assets subjected to nonrecurring fair value adjustments as Level 3.
Assets and liabilities measured at fair value on a recurring and nonrecurring basis were as follows as of the dates indicated:
| | | | | | Fair Value Measurements at Reporting Date Using | | | Fair Value Measurements at Reporting Date Using |
| | Balance | | Quoted Prices in Active Markets for Identical Assets (Level 1) | | Significant Other Observable Inputs (Level 2) | | Significant Unobservable Inputs (Level 3) | Balance | | Quoted Prices in Active Markets for Identical Assets (Level 1) | | Significant Other Observable Inputs (Level 2) | | Significant Unobservable Inputs (Level 3) |
| | March 31, 2018 | June 30, 2018 |
| | (Dollars in thousands) | (Dollars in thousands) |
| Recurring fair value measurements | | | | | | | | | | | | | | |
| Assets | | | | | | | | | | | | | | |
| Trading securities | $ | 1,601 |
| | $ | 1,601 |
| | $ | — |
| | $ | — |
| $ | 1,598 |
| | $ | 1,598 |
| | $ | — |
| | $ | — |
|
| Equity securities | 20,075 |
| | 20,075 |
| | — |
| | — |
| 20,133 |
| | 20,133 |
| | — |
| | — |
|
| Securities available for sale | | | | | | | | | | | | | | |
| U.S. Government agency securities | 34,943 |
| | — |
| | 34,943 |
| | — |
| 32,719 |
| | — |
| | 32,719 |
| | — |
|
| Agency mortgage-backed securities | 223,211 |
| | — |
| | 223,211 |
| | — |
| 214,989 |
| | — |
| | 214,989 |
| | — |
|
| Agency collateralized mortgage obligations | 135,192 |
| | — |
| | 135,192 |
| | — |
| 145,147 |
| | — |
| | 145,147 |
| | — |
|
| State, county, and municipal securities | 2,254 |
| | — |
| | 2,254 |
| | — |
| 1,996 |
| | — |
| | 1,996 |
| | — |
|
| Single issuer trust preferred securities issued by banks and insurers | 2,005 |
| | — |
| | 2,005 |
| | — |
| 1,329 |
| | — |
| | 1,329 |
| | — |
|
| Pooled trust preferred securities issued by banks and insurers | 1,655 |
| | — |
| | — |
| | 1,655 |
| 1,751 |
| | — |
| | — |
| | 1,751 |
|
| Small business administration pooled securities | 46,490 |
| | — |
| | 46,490 |
| | — |
| 44,998 |
| | — |
| | 44,998 |
| | — |
|
| Loans held for sale | 3,937 |
| | — |
| | 3,937 |
| | — |
| 9,614 |
| | — |
| | 9,614 |
| | — |
|
| Derivative instruments | 21,040 |
| | — |
| | 21,040 |
| | — |
| 26,703 |
| | — |
| | 26,703 |
| | — |
|
| Liabilities | | | | | | | | | | | | | | |
| Derivative instruments | 18,891 |
| | — |
| | 18,891 |
| | — |
| 24,499 |
| | — |
| | 24,499 |
| | — |
|
| Total recurring fair value measurements | $ | 473,512 |
| | $ | 21,676 |
| | $ | 450,181 |
| | $ | 1,655 |
| $ | 476,478 |
| | $ | 21,731 |
| | $ | 452,996 |
| | $ | 1,751 |
|
| | | | | | | | | | | | | | | |
| Nonrecurring fair value measurements | | | | | | | | | | | | | | |
| Assets | | | | | | | | | | | | | | |
| Collateral dependent impaired loans | $ | 32,113 |
| | $ | — |
| | $ | — |
| | $ | 32,113 |
| $ | 35,732 |
| | $ | — |
| | $ | — |
| | $ | 35,732 |
|
| Other real estate owned and other foreclosed assets | 358 |
| | — |
| | — |
| | 358 |
| 245 |
| | — |
| | — |
| | 245 |
|
| Total nonrecurring fair value measurements | $ | 32,471 |
| | $ | — |
| | $ | — |
| | $ | 32,471 |
| $ | 35,977 |
| | $ | — |
| | $ | — |
| | $ | 35,977 |
|
|
| | | | | | | | | | | | | | | |
| | | | Fair Value Measurements at Reporting Date Using |
| | Balance | | Quoted Prices in Active Markets for Identical Assets (Level 1) | | Significant Other Observable Inputs (Level 2) | | Significant Unobservable Inputs (Level 3) |
| | December 31, 2017 |
| | (Dollars in thousands) |
| Recurring fair value measurements | | | | | | | |
| Assets | | | | | | | |
| Trading securities | $ | 1,324 |
| | $ | 1,324 |
| | $ | — |
| | $ | — |
|
| Equity securities | 20,584 |
| | 20,584 |
| | — |
| | — |
|
| Securities available for sale | | | | | | | |
| U.S. Government agency securities | 35,430 |
| | — |
| | 35,430 |
| | — |
|
| Agency mortgage-backed securities | 215,764 |
| | — |
| | 215,764 |
| | — |
|
| Agency collateralized mortgage obligations | 122,012 |
| | — |
| | 122,012 |
| | — |
|
| State, county, and municipal securities | 2,274 |
| | — |
| | 2,274 |
| | — |
|
| Single issuer trust preferred securities issued by banks and insurers | 2,016 |
| | — |
| | 2,016 |
| | — |
|
| Pooled trust preferred securities issued by banks and insurers | 1,640 |
| | — |
| | — |
| | 1,640 |
|
| Small business administration pooled securities | 47,778 |
| | — |
| | 47,778 |
| | — |
|
| Loans held for sale | 4,768 |
| | — |
| | 4,768 |
| | — |
|
| Derivative instruments | 17,476 |
| | — |
| | 17,476 |
| | — |
|
| Liabilities | | | | | | | |
| Derivative instruments | 15,693 |
| | — |
| | 15,693 |
| | — |
|
| Total recurring fair value measurements | $ | 455,373 |
| | $ | 21,908 |
| | $ | 431,825 |
| | $ | 1,640 |
|
| | | | | | | | |
| Nonrecurring fair value measurements: | | | | | | | |
| Assets | | | | | | | |
| Collateral dependent impaired loans | $ | 33,567 |
| | $ | — |
| | $ | — |
| | $ | 33,567 |
|
| Other real estate owned and other foreclosed assets | 612 |
| | — |
| | — |
| | 612 |
|
| Total nonrecurring fair value measurements | $ | 34,179 |
| | $ | — |
| | $ | — |
| | $ | 34,179 |
|
The table below presents a reconciliation for all assets and liabilities measured at fair value on a recurring basis using significant unobservable inputs (Level 3), which were valued using pricing models and discounted cash flow methodologies, as of the dates indicated:
| | | | Three Months Ended | Three Months Ended |
| | March 31 | June 30 |
| | 2018 | | 2017 | 2018 | | 2017 |
| | (Dollars in thousands) | (Dollars in thousands) |
| Pooled Trust Preferred Securities | | | | | | |
| Beginning balance | $ | 1,640 |
| | $ | 1,584 |
| $ | 1,655 |
| | $ | 1,596 |
|
| Gains and (losses) (realized/unrealized) | | | | | | |
| Included in other comprehensive income | 21 |
| | 11 |
| 104 |
| | (4 | ) |
| Settlements | (6 | ) | | 1 |
| (8 | ) | | 1 |
|
| Ending balance | $ | 1,655 |
| | $ | 1,596 |
| $ | 1,751 |
| | $ | 1,593 |
|
| | | | | |
| | | Six Months Ended |
| | | June 30 |
| | | 2018 | | 2017 |
| | | (Dollars in thousands) |
| Pooled Trust Preferred Securities | | | | |
| Beginning balance | | $ | 1,640 |
| | $ | 1,584 |
|
| Gains and (losses) (realized/unrealized) | | | | |
| Included in other comprehensive income | | 125 |
| | 7 |
|
| Settlements | | (14 | ) | | 2 |
|
| Ending balance | | $ | 1,751 |
| | $ | 1,593 |
|
| | | | | |
It is the Company’s policy to recognize the transfers between levels of the fair value hierarchy as of the end of the reporting period. There were no transfers between the levels of the fair value hierarchy for any assets or liabilities measured at fair value on a recurring basis during the threesix month periods ended March 31,June 30, 2018 or 2017.
The following table sets forth certain unobservable inputs regarding the Company’s investment in securities that are classified as Level 3 for the periods indicated:
| | | | | March 31
2018 | | December 31
2017 | | March 31
2018 | | December 31
2017 | | March 31
2018 | | December 31
2017 | | June 30
2018 | | December 31
2017 | | June 30
2018 | | December 31
2017 | | June 30
2018 | | December 31
2017 |
| Valuation Technique | | Fair Value | | Unobservable Inputs | | Range | | Weighted Average | | Fair Value | | Unobservable Inputs | | Range | | Weighted Average |
| | | (Dollars in thousands) | | | (Dollars in thousands) | |
| Discounted cash flow methodology | Discounted cash flow methodology | | Discounted cash flow methodology | |
| Pooled trust preferred securities | | $ | 1,655 |
| | $ | 1,640 |
| | Cumulative prepayment | | 0% - 60% | | 0% - 61% | | 2.4% | | 2.5% | | $ | 1,751 |
| | $ | 1,640 |
| | Cumulative prepayment | | 0% - 60% | | 0% - 61% | | 2.4% | | 2.5% |
| | | | | | | Cumulative default | | 5% - 100% | | 5% - 100% | | 12.3% | | 12.4% | | | | | | Cumulative default | | 5% - 100% | | 5% - 100% | | 13.6% | | 12.4% |
| | | | | | | Loss given default | | 85% - 100% | | 85% - 100% | | 94.4% | | 94.3% | | | | | | Loss given default | | 85% - 100% | | 85% - 100% | | 94.4% | | 94.3% |
| | | | | | | Cure given default | | 0% - 75% | | 0% - 75% | | 60.9% | | 60.9% | | | | | | Cure given default | | 0% - 75% | | 0% - 75% | | 60.9% | | 60.9% |
| Appraisals of collateral(1) | Appraisals of collateral(1) | | Appraisals of collateral(1) | |
| Collateral dependent impaired loans | | $ | 32,113 |
| | $ | 33,567 |
| | | $ | 35,732 |
| | $ | 33,567 |
| |
| Other real estate owned and foreclosed assets | | $ | 358 |
| | $ | 612 |
| | | $ | 245 |
| | $ | 612 |
| |
| |
| (1) | Fair value is generally determined through independent appraisals of the underlying collateral, which generally include various Level 3 inputs which are not identifiable. Appraisals may be adjusted by management for qualitative factors such as economic factors and estimated liquidation expenses. The range of these possible adjustments may vary. |
For the fair value measurements in the table above, which are classified as Level 3 within the fair value hierarchy, the Company’s Treasury and Finance groups determine the valuation policies and procedures. For the pricing of the securities, the Company uses third-party pricing information, without adjustment. Depending on the type of the security, management employs various techniques to analyze the pricing it receives from third parties, such as analyzing changes in market yields and in certain instances reviewing the underlying collateral of the security. Management reviews changes in fair value from period to period and performs testing to ensure that prices received from the third parties are consistent with their expectation of the market. For the securities whose market is deemed to be inactive and which are categorized as Level 3, the fair value models are calibrated and significant inputs are back tested on a quarterly basis, to the extent possible. This testing is done by the third party service provider, who performs this testing by comparing anticipated inputs to actual results. Significant changes in fair value from period to period are closely scrutinized to ensure fair value models are not flawed. The driver(s) of the respective change in fair value and the method for forecasting the driver(s) is closely considered by management.
The significant unobservable inputs used in the fair value measurement of the Company’s pooled trust preferred securities are cumulative prepayment rates, cumulative default rates, loss given default rates and cure given default rates. Significant increases (decreases) in deferrals or defaults, in isolation, would result in a significantly lower (higher) fair value measurement. Alternatively, significant increases (decreases) in cure rates, in isolation, would result in a significantly higher (lower) fair value measurement.
Additionally, the Company has certain assets which are marked to fair value on a nonrecurring basis which are categorized within Level 3. These assets include collateral dependent impaired loans and OREO. The determination of the fair value amount is derived from the use of independent third party appraisals and evaluations. Real estate appraisals are prepared by firms from a predetermined list of qualified and approved appraisers or evaluators. Upon receipt of a real estate appraisal or evaluation, the Company's Commercial Real Estate Appraisal Department will review the report for compliance with regulatory and Company standards, as well as reasonableness and acceptance of the value conclusions. Any issues or concerns regarding compliance or value conclusions will be addressed with the engaged firm and the report may be adjusted or revised. If a disagreement cannot be resolved, the Company will either address the key issues and modify the report for acceptance or reject the report and re-order a new report. Ultimately, the Company will confirm the collateral value as part of its review process.
The estimated fair values and related carrying amounts for assets and liabilities for which fair value is only disclosed are shown below as of the periods indicated:
| | | | | | | | Fair Value Measurements at Reporting Date Using | | | | | Fair Value Measurements at Reporting Date Using |
| | Carrying Value | | Fair Value | | Quoted Prices in Active Markets for Identical Assets (Level 1) | | Significant Other Observable Inputs (Level 2) | | Significant Unobservable Inputs (Level 3) | Carrying Value | | Fair Value | | Quoted Prices in Active Markets for Identical Assets (Level 1) | | Significant Other Observable Inputs (Level 2) | | Significant Unobservable Inputs (Level 3) |
| March 31, 2018 | June 30, 2018 |
| | (Dollars in thousands) | (Dollars in thousands) |
| Financial assets | | | | | | |
| Securities held to maturity(a) | | | | | | | | | | | | | | | | | | |
| U.S. Treasury securities | $ | 1,005 |
| | $ | 1,021 |
| | $ | — |
| | $ | 1,021 |
| | $ | — |
| $ | 1,005 |
| | $ | 1,014 |
| | $ | — |
| | $ | 1,014 |
| | $ | — |
|
| Agency mortgage-backed securities | 192,961 |
| | 190,409 |
| | — |
| | 190,409 |
| | — |
| 186,299 |
| | 182,000 |
| | — |
| | 182,000 |
| | — |
|
| Agency collateralized mortgage obligations | 306,395 |
| | 297,818 |
| | — |
| | 297,818 |
| | — |
| 323,746 |
| | 313,342 |
| | — |
| | 313,342 |
| | — |
|
| Single issuer trust preferred securities issued by banks | 1,500 |
| | 1,521 |
| | — |
| | 1,521 |
| | — |
| 1,500 |
| | 1,523 |
| | — |
| | 1,523 |
| | — |
|
| Small business administration pooled securities | 27,000 |
| | 26,786 |
| | — |
| | 26,786 |
| | — |
| 25,711 |
| | 25,409 |
| | — |
| | 25,409 |
| | — |
|
| Loans, net of allowance for loan losses(b) | 6,269,081 |
| | 6,103,312 |
| | — |
| | — |
| | 6,103,312 |
| 6,380,982 |
| | 6,198,830 |
| | — |
| | — |
| | 6,198,830 |
|
| Federal Home Loan Bank stock(c) | 13,027 |
| | 13,027 |
| | — |
| | 13,027 |
| | — |
| 13,107 |
| | 13,107 |
| | — |
| | 13,107 |
| | — |
|
| Cash surrender value of life insurance policies(d) | 152,568 |
| | 152,568 |
| | — |
| | 152,568 |
| | — |
| 153,574 |
| | 153,574 |
| | — |
| | 153,574 |
| | — |
|
| Financial liabilities | | | | | | | | | | | | | | | | | | |
| Deposit liabilities, other than time deposits(e) | $ | 6,096,756 |
| | $ | 6,096,756 |
| | $ | — |
| | $ | 6,096,756 |
| | $ | — |
| $ | 6,353,722 |
| | $ | 6,353,722 |
| | $ | — |
| | $ | 6,353,722 |
| | $ | — |
|
| Time certificates of deposits(f) | 654,755 |
| | 646,819 |
| | — |
| | 646,819 |
| | — |
| 659,768 |
| | 651,660 |
| | — |
| | 651,660 |
| | — |
|
| Federal Home Loan Bank borrowings(f) | 53,257 |
| | 52,176 |
| | — |
| | 52,176 |
| | — |
| 50,775 |
| | 49,975 |
| | — |
| | 49,975 |
| | — |
|
| Customer repurchase agreements and other short-term borrowings(f) | 137,914 |
| | 137,914 |
| | — |
| | — |
| | 137,914 |
| 142,235 |
| | 142,235 |
| | — |
| | — |
| | 142,235 |
|
| Junior subordinated debentures(g) | 73,075 |
| | 72,283 |
| | — |
| | 72,283 |
| | — |
| 73,077 |
| | 71,192 |
| | — |
| | 71,192 |
| | — |
|
| Subordinated debentures(f) | 34,693 |
| | 32,429 |
| | — |
| | — |
| | 32,429 |
| 34,705 |
| | 31,885 |
| | — |
| | — |
| | 31,885 |
|
|
| | | | | | | | | | | | | | | | | | | |
| | | | | | Fair Value Measurements at Reporting Date Using |
| | Carrying Value | | Fair Value | | Quoted Prices in Active Markets for Identical Assets (Level 1) | | Significant Other Observable Inputs (Level 2) | | Significant Unobservable Inputs (Level 3) |
| December 31, 2017 |
| | (Dollars in thousands) |
| Financial assets | |
| Securities held to maturity(a) | | | | | | | | | |
| U.S. Treasury securities | $ | 1,006 |
| | $ | 1,035 |
| | $ | — |
| | $ | 1,035 |
| | $ | — |
|
| Agency mortgage-backed securities | 204,768 |
| | 205,823 |
| | — |
| | 205,823 |
| | — |
|
| Agency collateralized mortgage obligations | 262,998 |
| | 258,408 |
| | — |
| | 258,408 |
| | — |
|
| Single issuer trust preferred securities issued by banks | 1,500 |
| | 1,529 |
| | — |
| | 1,529 |
| | — |
|
| Small business administration pooled securities | 27,416 |
| | 27,399 |
| | — |
| | 27,399 |
| | — |
|
| Loans, net of allowance for loan losses(b) | 6,261,343 |
| | 6,116,051 |
| | — |
| | — |
| | 6,116,051 |
|
| Federal Home Loan Bank stock(c) | 11,597 |
| | 11,597 |
| | — |
| | 11,597 |
| | — |
|
| Cash surrender value of life insurance policies(d) | 151,528 |
| | 151,528 |
| | — |
| | 151,528 |
| | — |
|
| Financial liabilities | | | | | | | | | |
| Deposit liabilities, other than time deposits(e) | $ | 6,084,952 |
| | $ | 6,084,952 |
| | $ | — |
| | $ | 6,084,952 |
| | $ | — |
|
| Time certificates of deposits(f) | 644,301 |
| | 639,060 |
| | — |
| | 639,060 |
| | — |
|
| Federal Home Loan Bank borrowings(f) | 53,264 |
| | 52,111 |
| | — |
| | 52,111 |
| | — |
|
| Customer repurchase agreements and other short-term borrowings(f) | 162,679 |
| | 162,679 |
| | — |
| | — |
| | 162,679 |
|
| Junior subordinated debentures(g) | 73,073 |
| | 74,680 |
| | — |
| | 74,680 |
| | — |
|
| Subordinated debentures(f) | 34,682 |
| | 32,707 |
| | — |
| | — |
| | 32,707 |
|
| |
| (a) | The fair values presented are based on quoted market prices, where available. If quoted market prices are not available, fair values are based on quoted market prices of comparable instruments and/or discounted cash flow analysis. |
| |
| (b) | In accordance with recent accounting guidance, the fair value of loans as of March 31,June 30, 2018 was measured using the exit price valuation method, determined primarily by discounting the future cash flows using the current rates at which similar loans would be made to borrowers with similar credit ratings and for the same remaining maturities or cash flows, while incorporating liquidity and credit assumptions. Previously the fair value of loans as of December 31, 2017 was estimated solely by discounting the future cash flows using the current rates at which similar loans would be made to borrowers with similar credit ratings and for the same remaining maturities or cash flows. Additionally, this amount excludes collateral dependent impaired loans, which are deemed to be marked to fair value on a nonrecurring basis. |
| |
| (c) | FHLB stock has no quoted market value and is carried at cost, therefore the carrying amount approximates fair value. |
| |
| (d) | Cash surrender value of life insurance is recorded at its cash surrender value (or the amount that can be realized upon surrender of the policy), therefore carrying amount approximates fair value. |
| |
| (e) | Fair value of demand deposits, savings and interest checking accounts and money market deposits is the amount payable on demand at the reporting date. |
| |
| (f) | Fair value was determined by discounting anticipated future cash payments using rates currently available for instruments with similar remaining maturities. |
| |
| (g) | Fair value was determined based upon market prices of securities with similar terms and maturities. |
This summary excludes certain financial assets and liabilities for which the carrying value approximates fair value. For financial assets, these may include cash and due from banks, federal funds sold and short-term investments. For financial liabilities, these may include federal funds purchased. These instruments would all be considered to be classified as Level 1 within the fair value hierarchy. Also excluded from the summary are financial instruments measured at fair value on a recurring and nonrecurring basis, as previously described.
The Company considers its current use of financial instruments to be the highest and best use of the instruments.
NOTE 11 - REVENUE RECOGNITION
The Company adopted the new revenue recognition standard under Accounting Standards Codification Topic 606 ("ASC 606") as of January 1, 2018 and is using the modified retrospective transition method upon adoption. The Company determined that there were no material changes to be made to revenue recognition upon adoption and that there were no practical expedients to apply to its contracts.
A portion of the Company's noninterest income is derived from contracts with customers, and as such, the revenue recognized depicts the transfer of promised goods or services to customers in an amount that reflects the consideration to which the entity expects to be entitled in exchange for those goods or services. The Company considers the terms of the contract and all relevant facts and circumstances when applying this guidance. To ensure its alignment with this core principle, the Company measures revenue and the timing of recognition by applying the following five steps:
| |
| 1. | Identify the contract(s) with customers |
| |
| 2. | Identify the performance obligations |
| |
| 3. | Determine the transaction price |
| |
| 4. | Allocate the transaction price to the performance obligations |
| |
| 5. | Recognize revenue when (or as) the entity satisfies a performance obligation |
The Company has disaggregated its revenue from contracts with customers into categories that depict how the nature, amount, timing, and uncertainty of revenue and cash flows are affected by economic factors. The following table presents the revenue streams that the Company has disaggregated as of the periods indicated:
| | | | Three Months Ended | Three Months Ended | | Six Months Ended |
| | March 31, 2018 | March 31, 2017 | June 30, 2018 | | June 30, 2017 | | June 30, 2018 | | June 30, 2017 |
| | (Dollars in thousands) | (Dollars in thousands) |
| Deposit account fees (inclusive of cash management fees) | $ | 4,431 |
| $ | 4,544 |
| $ | 4,551 |
| | $ | 4,392 |
| | $ | 8,982 |
| | $ | 8,936 |
|
| Interchange fees | 3,405 |
| 3,121 |
| 3,919 |
| | 3,561 |
| | 7,324 |
| | 6,682 |
|
| ATM fees | 654 |
| 687 |
| 736 |
| | 759 |
| | 1,390 |
| | 1,446 |
|
| Investment management - wealth management and advisory services | 5,582 |
| 5,137 |
| 6,083 |
| | 5,488 |
| | 11,665 |
| | 10,625 |
|
| Investment management - retail investments and insurance revenue | 560 |
| 477 |
| 739 |
| | 507 |
| | 1,299 |
| | 984 |
|
| Merchant processing income | 431 |
| 293 |
| 348 |
| | 274 |
| | 779 |
| | 567 |
|
| Other noninterest income | 974 |
| 822 |
| 1,060 |
| | 1,259 |
| | 2,034 |
| | 2,081 |
|
| Total noninterest income in-scope of ASC 606 | | 17,436 |
| | 16,240 |
| | 33,473 |
| | 31,321 |
|
| Total noninterest income out-of-scope of ASC 606 | | 4,451 |
| | 5,158 |
| | 8,277 |
| | 8,989 |
|
| Total noninterest income | | 21,887 |
| | 21,398 |
| | 41,750 |
| | 40,310 |
|
In each of the revenue streams identified above, there were no significant judgments made in determining or allocating the transaction price, as the consideration and service requirements are generally explicitly identified in the associated contracts. Additional information related to each of the revenue streams is further noted below:
Deposit Account Fees
The Company offers various deposit account products to its customers governed by specific deposit agreements applicable to either personal customers or business customers. These agreements identify the general conditions and obligations of both parties, and include standard information regarding deposit account related fees.
Deposit account services include providing access to deposit accounts as well as access to the various deposit transactional services of the Company. These transactional services are primarily those that are identified in the standard fee schedule, and include, but are not limited to, services such as overdraft protection, wire transfer, and check collection. Revenue is recognized in conjunction with the various services being provided. For example, the Company may assess monthly fixed service fees associated with the customer having access to the deposit account, which can vary depending on the account type and daily account balance. In addition, the Company may also assess separate fixed fees associated with and at the time specific transactions are entered in to by the customer. As such, the Company considers its performance obligations to be met concurrently with providing the account access or completing the requested deposit transaction.
Cash Management
Cash management services are a subset of the Deposit account fees revenue stream. These services primarily include ACH transaction processing, positive pay and remote deposit services. These services are also governed by separate agreements entered
into with the customer. The fee arrangement for these services areis structured to assess fees under one of two scenarios, either a per transaction fee arrangement or an earnings credit analysis arrangement. Under the per transaction fee arrangement, fixed fees are assessed concurrently with customers executing the transactions, and as such, the Company considers its performance obligations to be met concurrently with completing the requested transaction. Under the earnings credit analysis arrangement, the Company provides a monthly earnings credit to the customer that is negotiated and determined based on various factors. The credit is then available to absorb the per transaction fees that are assessed on the customer's deposit account activity for the month. Any amount of the transactional fees in excess of the earnings credit is recognized as revenue in that month.
Interchange Fees
The Company earns interchange revenue from its issuance of credit and debit cards granted through its membership in various card payment networks. The Company provides credit cards and debit cards to its customers which are authorized and settled through these payment networks, and in exchange, the Company earns revenue as determined by each payment network's interchange program. The revenue is recognized concurrently with the settlement of card transactions within each network.
ATM Fees
The Company deploys automated teller machines (ATMs) as part of its overall branch network. Certain transactions performed at the ATMs require customers to acknowledge and pay a fee for the requested service. Certain ATM fees are disclosed in the deposit account agreement fee schedules, whereas those assessed to non-Rockland Trust deposit holders are solely determined during the transaction at the machine.
The ATM fee is a fixed dollar per transaction amount, and as such, is recognized concurrently with the overall daily processing and settlement of the ATM activity.
Investment Management - Wealth Management and Advisory Services
The Company offers investment management and trust services to individuals, institutions, small businesses and charitable institutions. Each investment management product is governed by its own contract along with a separate identifiable fee schedule unique to that product. The Company also offers additional services, such as estate settlement, financial planning, tax services and other special services quoted at the client's request.
The asset management and/or custody fees are based upon a percentage of the monthly valuation of the principal assets in the customer's account, whereas fees for additional or special services are fixed in nature and are charged as services are rendered. As the fees are dependent on assets under management, which are susceptible to market factors outside of the Company's control, this variable consideration is constrained and therefore no revenue is estimated at contract initiation. As such, all revenue is recognized in correlation to the monthly management fee determinations or as transactional services are provided. Due to the fact that payments are primarily made subsequent to the valuation period, the Company records a receivable for revenue earned but not received. The following table provides the amount of investment management revenue earned but not received as of the periods indicated:
|
| | | | | | | |
| | March 31, 2018 | | December 31, 2017 |
| | (Dollars in thousands) |
| Receivables, included in other assets | $ | 1,839 |
| | $ | 1,934 |
|
|
| | | | | | | |
| | June 30, 2018 | | December 31, 2017 |
| | (Dollars in thousands) |
| Receivables, included in other assets | $ | 1,850 |
| | $ | 1,934 |
|
Investment Management - Retail Investments and Insurance Revenue
The Company offers the sale of mutual fund shares, unit investment trust shares, general securities, fixed and variable annuities and life insurance products through registered representatives who are both employed by the Company and licensed and contracted with various Broker General Agents to offer these products to the Company’s customer base. As such, the Company performs these services as an agent and earns a fixed commission on the sales of these products and services. To a lesser degree, production bonus commissions can also be earned based upon the Company meeting certain volume thresholds.
In general, the Company recognizes commission revenue at the point of sale, and for certain insurance products, may also earn and recognize annual residual commissions commensurate with annual premiums being paid.
Merchant Processing Income
The Company refers customers to third party merchant processing partners in exchange for commission and fee income. The income earned is comprised of multiple components, including a fixed referral fee per each referred customer, a rebate amount determined primarily as a percentage of net revenue earned by the third party from services provided to each referred customer, and overall production bonus commissions if certain new account production thresholds are met. Merchant processing income is recognized in conjunction with either completing the referral to earn the fixed fee amount or as the merchant activity is processed to derive the Company's rebate and/or production bonus amounts.
Other Noninterest Income
The Company earns various types of other noninterest income that fall within the scope of the new revenue recognition rules, and have been aggregated into one general revenue stream in the table noted above. This amount includes, but is not limited to, the following types of revenue with customers:
Safe Deposit Rent
The Company rents out the use of safe deposit boxes to its customers, which can be accessed when the bank is open for business. The safe deposit box rental fee is paid upfront and is recognized as revenue ratably over the annual term of the contract.
1031 Exchange Fee Revenue
The Company provides like-kind exchange services pursuant to Section 1031 of the Internal Revenue Code. Fee income is recognized in conjunction with completing the exchange transactions.
Foreign Currency
The Company earns fee income associated with various transactions related to foreign currency product offerings, including foreign currency bank notes and drafts and foreign currency wires. The majority of this income is derived from commissions earned related to customers executing the above mentioned foreign currency transactions through arrangements with third party correspondents.
NOTE 12 - COMPREHENSIVE INCOME (LOSS)
The following tables present a reconciliation of the changes in the components of other comprehensive income (loss) for the dates indicated, including the amount of income tax (expense) benefit allocated to each component of other comprehensive income (loss):
| | | | Three Months Ended
March 31, 2018 | Three Months Ended
June 30, 2018 | | Six Months Ended
June 30, 2018 |
| | Pre Tax
Amount | | Tax (Expense)
Benefit | | After Tax
Amount | Pre Tax
Amount | | Tax (Expense)
Benefit | | After Tax
Amount | | Pre Tax
Amount | | Tax (Expense)
Benefit | | After Tax
Amount |
| | (Dollars in thousands) | (Dollars in thousands) |
| Change in fair value of securities available for sale | $ | (7,240 | ) | | $ | 1,772 |
| | $ | (5,468 | ) | $ | (2,533 | ) | | $ | 609 |
| | $ | (1,924 | ) | | $ | (9,773 | ) | | $ | 2,381 |
| | $ | (7,392 | ) |
| Less: net security gains reclassified into other noninterest income (expense) | — |
| | — |
| | — |
| — |
| | — |
| | — |
| | — |
| | — |
| | — |
|
| Net change in fair value of securities available for sale | (7,240 | ) | | 1,772 |
| | (5,468 | ) | (2,533 | ) | | 609 |
| | (1,924 | ) | | (9,773 | ) | | 2,381 |
| | (7,392 | ) |
| | | | | | | | | | | | | | | | | |
| Change in fair value of cash flow hedges | 386 |
| | (106 | ) | | 280 |
| 10 |
| | (2 | ) | | 8 |
| | 396 |
| | (108 | ) | | 288 |
|
| Less: net cash flow hedge gains reclassified into interest income or interest expense (1) | 90 |
| | (25 | ) | | 65 |
| 167 |
| | (47 | ) | | 120 |
| | 257 |
| | (72 | ) | | 185 |
|
| Net change in fair value of cash flow hedges | 296 |
| | (81 | ) | | 215 |
| (157 | ) | | 45 |
| | (112 | ) | | 139 |
| | (36 | ) | | 103 |
|
| | | | | | | | | | | | | | | | | |
| Net unamortized loss related to defined benefit pension and other postretirement adjustments arising during the period | — |
| | — |
| | — |
| |
| Amortization of net actuarial losses | 94 |
| | (26 | ) | | 68 |
| 93 |
| | (27 | ) | | 66 |
| | 187 |
| | (53 | ) | | 134 |
|
| Amortization of net prior service costs | 69 |
| | (20 | ) | | 49 |
| 69 |
| | (18 | ) | | 51 |
| | 138 |
| | (38 | ) | | 100 |
|
| Net change in other comprehensive income for defined benefit postretirement plans (2) | 163 |
| | (46 | ) | | 117 |
| 162 |
| | (45 | ) | | 117 |
| | 325 |
| | (91 | ) | | 234 |
|
| Total other comprehensive loss | $ | (6,781 | ) | | $ | 1,645 |
| | $ | (5,136 | ) | $ | (2,528 | ) | | $ | 609 |
| | $ | (1,919 | ) | | $ | (9,309 | ) | | $ | 2,254 |
| | $ | (7,055 | ) |
| | | | Three Months Ended
March 31, 2017 | Three Months Ended
June 30, 2017 | | Six Months Ended
June 30, 2017 |
| | Pre Tax
Amount | | Tax (Expense)
Benefit | | After Tax
Amount | Pre Tax
Amount | | Tax (Expense)
Benefit | | After Tax
Amount | | Pre Tax
Amount | | Tax (Expense)
Benefit | | After Tax
Amount |
| | (Dollars in thousands) | (Dollars in thousands) |
| Change in fair value of securities available for sale | $ | 896 |
| | $ | (364 | ) | | $ | 532 |
| $ | 1,277 |
| | $ | (485 | ) | | $ | 792 |
| | $ | 2,173 |
| | $ | (849 | ) | | $ | 1,324 |
|
| Less: net security losses reclassified into other noninterest income | 1 |
| | — |
| | 1 |
| |
| Less: net security gains reclassified into other noninterest income | | 1 |
| | (1 | ) | | — |
| | 2 |
| | (1 | ) | | 1 |
|
| Net change in fair value of securities available for sale | 895 |
| | (364 | ) | | 531 |
| 1,276 |
| | (484 | ) | | 792 |
| | 2,171 |
| | (848 | ) | | 1,323 |
|
| | | | | | | | | | | | | | | | | |
| Change in fair value of cash flow hedges | 58 |
| | (24 | ) | | 34 |
| (399 | ) | | 162 |
| | (237 | ) | | (341 | ) | | 138 |
| | (203 | ) |
| Less: net cash flow hedge losses reclassified into interest income or interest expense (1) | (93 | ) | | 38 |
| | (55 | ) | (80 | ) | | 33 |
| | (47 | ) | | (173 | ) | | 71 |
| | (102 | ) |
| Net change in fair value of cash flow hedges | 151 |
| | (62 | ) | | 89 |
| (319 | ) | | 129 |
| | (190 | ) | | (168 | ) | | 67 |
| | (101 | ) |
| | | | | | | | | | | | | | | | | |
| Net unamortized loss related to defined benefit pension and other postretirement adjustments arising during the period | (7 | ) | | 3 |
| | (4 | ) | (7 | ) | | 3 |
| | (4 | ) | | (14 | ) | | 6 |
| | (8 | ) |
| Amortization of net actuarial losses | 70 |
| | (29 | ) | | 41 |
| 69 |
| | (28 | ) | | 41 |
| | 139 |
| | (57 | ) | | 82 |
|
| Amortization of net prior service credits | 69 |
| | (28 | ) | | 41 |
| |
| Amortization of net prior service costs | | 69 |
| | (28 | ) | | 41 |
| | 138 |
| | (56 | ) | | 82 |
|
| Net change in other comprehensive income for defined benefit postretirement plans (2) | 132 |
| | (54 | ) | | 78 |
| 131 |
| | (53 | ) | | 78 |
| | 263 |
| | (107 | ) | | 156 |
|
| Total other comprehensive income | $ | 1,178 |
| | $ | (480 | ) | | $ | 698 |
| $ | 1,088 |
| | $ | (408 | ) | | $ | 680 |
| | $ | 2,266 |
| | $ | (888 | ) | | $ | 1,378 |
|
| |
| (1) | Includes the amortization of the remaining balance of a realized but unrecognized gain, net of tax, from the termination of interest rate swaps in 2009. The original gain of $1.4 million, net of tax, is being recognized in earnings through December 2018, the original maturity date of the swap. The balance of this gain has amortized to $122,000$78,000 and $137,000 at March 31,June 30, 2018 and December 31, 2017, respectively. |
| |
| (2) | The amortization of prior service costs is included in the computation of net periodic pension cost as disclosed in the Employee Benefit Plans footnote in the Company's Annual Report on Form 10-K for the year ended December 31, 2017, filed with the Securities and Exchange Commission. |
Effective January 1, 2018, the Company elected to reclassify certain tax effects from accumulated other comprehensive income to retained earnings, related to items that were stranded in other comprehensive income as a result of the Tax Act. A description of the other income tax effects that were reclassified as a result of the Act are listed in the table below.
Information on the Company’s accumulated other comprehensive income (loss), net of tax, is comprised of the following components as of the periods indicated:
| | | | Unrealized Gain on Securities | | Unrealized Gain (Loss) on Cash Flow Hedge | | Deferred Gain on Hedge Transactions | | Defined Benefit Postretirement Plans | | Accumulated Other Comprehensive Loss | Unrealized Gain on Securities | | Unrealized Gain (Loss) on Cash Flow Hedge | | Deferred Gain on Hedge Transactions | | Defined Benefit Postretirement Plans | | Accumulated Other Comprehensive Income (Loss) |
| | (Dollars in thousands) | (Dollars in thousands) |
| | 2018 | 2018 |
| Beginning balance: January 1, 2018 | $ | (504 | ) | | $ | 948 |
| | $ | 137 |
| | $ | (2,412 | ) | | $ | (1,831 | ) | $ | (504 | ) | | $ | 948 |
| | $ | 137 |
| | $ | (2,412 | ) | | $ | (1,831 | ) |
| Opening balance reclassification | (111 | ) | | 205 |
| | 29 |
| | (520 | ) | | (397 | ) | (111 | ) | | 205 |
| | 29 |
| | (520 | ) | | (397 | ) |
| Cumulative effect accounting adjustment | (831 | ) | | — |
| | — |
| | — |
| | (831 | ) | (831 | ) | | — |
| | — |
| | — |
| | (831 | ) |
| Net change in other comprehensive income (loss) | (5,468 | ) | | 259 |
| | (44 | ) | | 117 |
| | (5,136 | ) | (7,392 | ) | | 191 |
| | (88 | ) | | 234 |
| | (7,055 | ) |
| Ending balance: March 31, 2018 | $ | (6,914 | ) | | $ | 1,412 |
| | $ | 122 |
| | $ | (2,815 | ) | | $ | (8,195 | ) | |
| Ending balance: June 30, 2018 | | $ | (8,838 | ) | | $ | 1,344 |
| | $ | 78 |
| | $ | (2,698 | ) | | $ | (10,114 | ) |
| | 2017 | 2017 |
| Beginning balance: January 1, 2017 | $ | 173 |
| | $ | 361 |
| | $ | 281 |
| | $ | (2,152 | ) | | $ | (1,337 | ) | $ | 173 |
| | $ | 361 |
| | $ | 281 |
| | $ | (2,152 | ) | | $ | (1,337 | ) |
| Net change in other comprehensive income (loss) | 531 |
| | 125 |
| | (36 | ) | | 78 |
| | 698 |
| 1,323 |
| | (29 | ) | | (72 | ) | | 156 |
| | 1,378 |
|
| Ending balance: March 31, 2017 | $ | 704 |
| | $ | 486 |
| | $ | 245 |
| | $ | (2,074 | ) | | $ | (639 | ) | |
| Ending balance: June 30, 2017 | | $ | 1,496 |
| | $ | 332 |
| | $ | 209 |
| | $ | (1,996 | ) | | $ | 41 |
|
NOTE 13 - COMMITMENTS AND CONTINGENCIES
Financial Instruments with Off-Balance Sheet Risk
In the normal course of business, the Company enters into various transactions to meet the financing needs of its customers, which, in accordance with GAAP, are not included in its consolidated balance sheets. These transactions include commitments to extend credit and standby letters of credit, which involve, to varying degrees, elements of credit risk and interest rate risk in excess of the amounts recognized in the consolidated balance sheets. The Company minimizes its exposure to loss under these commitments by subjecting them to credit approval and monitoring procedures.
The Company enters into contractual commitments to extend credit, normally with fixed expiration dates or termination clauses, at specified rates and for specific purposes. Substantially all of these commitments to extend credit are contingent upon customers maintaining specific credit standards at the time of loan funding.
Standby letters of credit are written conditional commitments issued to guarantee the performance of a customer to a third party. In the event the customer does not perform in accordance with the terms of the agreement with the third party, the Company would be required to fund the commitment. The maximum potential amount of future payments the Company could be required to make is represented by the contractual amount of the commitment. If the commitment were funded, the Company would be entitled to seek recovery from the customer. The Company’s policies generally require that standby letter of credit arrangements contain security and debt covenants similar to those contained in loan agreements.
The fees collected in connection with the issuance of standby letters of credit are representative of the fair value of the Company's obligation undertaken in issuing the guarantee. In accordance with applicable accounting standards related to guarantees, fees collected in connection with the issuance of standby letters of credit are deferred. The fees are then recognized in income proportionately over the life of the standby letter of credit agreement. The deferred standby letter of credit fees represent the fair value of the Company's potential obligations under the standby letter of credit guarantees.
The following table summarizes the above financial instruments at the dates indicated:
| | | | March 31, 2018 | | December 31, 2017 | June 30, 2018 | | December 31, 2017 |
| | (Dollars in thousands) | (Dollars in thousands) |
| Commitments to extend credit | $ | 2,502,731 |
| | $ | 2,443,478 |
| $ | 2,536,434 |
| | $ | 2,443,478 |
|
| Standby letters of credit | 15,994 |
| | 15,534 |
| 16,132 |
| | 15,534 |
|
| Deferred standby letter of credit fees | 114 |
| | 102 |
| 115 |
| | 102 |
|
Lease Commitments
The Company leases office space, space for ATM locations, and certain branch locations under noncancelable operating leases.
Rent expense incurred under operating leases was approximately $2.5 million and $2.0 million the three months ended March 31, 2018 and 2017, respectively. Several of these leases have renewal options that typically range from 5 to 10 years.
Rent expense incurred under operating leases was approximately $2.3 million and $2.1 million for the three months ended June 30, 2018 and 2017, respectively, and $4.8 million and $4.2 million for the six months ended June 30, 2018 and 2017, respectively.
There has been no significant change in the future minimum lease payments payable by the Company since December 31, 2017. See the Company's Annual Report on Form 10-K for the fiscal year ended December 31, 2017 for information regarding leases and other commitments.
Other Contingencies
At March 31,June 30, 2018, Rockland Trust was involved in pending lawsuits that arose in the ordinary course of business. Management has reviewed these pending lawsuits with legal counsel and has taken into consideration the view of counsel as to their outcome. In the opinion of management, the final disposition of pending lawsuits is not expected to have a material adverse effect on the Company’s financial position or results of operations.
The Bank is required to maintain certain reserve requirements of vault cash and/or deposits with the Federal Reserve Bank of Boston. There was no reserve requirement at March 31, 2018 and theThe reserve requirement was $35.4 million and $35.8 million at June 30, 2018 and December 31, 2017.2017, respectively.
NOTE 14 - LOW INCOME HOUSING PROJECT INVESTMENTS
The Company has invested in low income housing projects that generate Low Income Housing Tax Credits (“LIHTC”) which provide the Company with tax credits and operating loss tax benefits over a period of approximately 15 years. None of the original investment is expected to be repaid.
The following table presents certain information related to the Company's investments in low income housing projects as of the dates indicated:
| | | | March 31
2018 | | December 31
2017 | | June 30
2018 | | December 31
2017 | |
| | (Dollars in thousands) | | (Dollars in thousands) | |
| Original investment value | $ | 47,408 |
| | $ | 47,399 |
| | $ | 47,403 |
| | $ | 47,399 |
| |
| Current recorded investment | 34,153 |
| | 35,225 |
| | 33,010 |
| | 35,225 |
| |
| Unfunded liability obligation | 3,332 |
| | 4,536 |
| | 2,408 |
| | 4,536 |
| |
| Tax credits and benefits | 5,494 |
| (1) | 5,654 |
| | 5,505 |
| (1) | 5,654 |
| |
| Amortization of investments | 4,330 |
| (2) | 4,402 |
| (4) | 4,388 |
| (2) | 4,402 |
| (4) |
| Net income tax benefit | 1,165 |
| (3) | 1,253 |
| | 1,117 |
| (3) | 1,253 |
| |
(1) This amount reflects anticipated tax credits and tax benefits for the full year ended December 31, 2018.
(2) The amortization amount reduces the tax credits and benefits anticipated for the full year ended December 31, 2018.
(3) This amount represents the net tax benefit expected to be realized for the full year ended December 31, 2018 in determining the Company's effective tax rate.
(4) The 2017 amount is inclusive of $466,000 related to the revaluation of Low Income Housing tax creditLIHTC investments as a result of the Tax Act.
Item 2. Management’s Discussion and Analysis of Financial Condition and Results of Operations
The following discussion should be read in conjunction with the consolidated financial statements, notes and tables included in the Company’s Annual Report on Form 10-K for the fiscal year ended December 31, 2017, filed with the Securities and Exchange Commission.
Cautionary Statement Regarding Forward-Looking Statements
This Quarterly Report on Form 10-Q, in the Management's Discussion and Analysis of Financial Condition and Results of Operations and elsewhere, contains forward-looking statements within the meaning of the Private Securities Litigation Reform Act of 1995. Such statements are not historical facts and include expressions about management’s confidence and strategies and management’s expectations about new and existing programs and products, acquisitions, relationships, opportunities, taxation, technology, market conditions and economic expectations. These statements may be identified by forward-looking terminology such as “should,” “expect,” “believe,” “view,” “opportunity,” “allow,” “continues,” “reflects,” “typically,” “usually,” “anticipate,” or similar statements or variations of such terms. Such forward-looking statements involve certain risks and uncertainties and our actual results may differ materially from such forward-looking statements. Factors that may cause actual results to differ materially from those contemplated by such forward-looking statements, in addition to those risk factors listed under the “Risk Factors” section of the Company's Annual Report on Form 10-K for the fiscal year ended December 31, 2017, include, but are not limited to:
a weakening in the United States economy in general and the regional and local economies within the New England region and the Company’s market area;
adverse changes or volatility in the local real estate market;
adverse changes in asset quality including an unanticipated credit deterioration in our loan portfolio including those related to one or more large commercial relationships;
acquisitions may not produce results at levels or within time frames originally anticipated and may result in unforeseen integration issues or impairment of goodwill and/or other intangibles;
changes in trade, monetary and fiscal policies and laws, including interest rate policies of the Board of Governors of the Federal Reserve System;
higher than expected tax expense, resulting from failure to comply with general tax laws, changes in tax laws, or failure to comply with requirements of the federal New Markets Tax Credit program;
unexpected changes in market interest rates for interest earning assets and/or interest bearing liabilities;
unexpected increased competition in the Company’s market area;
unanticipated loan delinquencies, loss of collateral, decreased service revenues, and other potential negative effects on our business caused by severe weather or other external events;
a deterioration in the conditions of the securities markets;
a deterioration of the credit rating for U.S. long-term sovereign debt;
theour inability to adapt to changes in information technology, including changes to industry accepted delivery models driven by a migration to the internet as a means of service delivery;
electronic fraudulent activity within the financial services industry, especially in the commercial banking sector;
adverse changes in consumer spending and savings habits;
failure to consummate or a delay in consummating the acquisition of MNB Bancorp, which is subject to certain standard conditions, including regulatory approvals and approval by MNB Bancorp shareholders;
the inability to realize expected synergies from merger transactions in the amounts or in the timeframe anticipated;
the inability to retain customers and employees, including those acquired in previous acquisitions;
the effect of laws and regulations regarding the financial services industry including, but not limited to, the Dodd-Frank Wall Street Reform and the Consumer Protection Act and regulatory uncertainty surrounding these laws and regulations;
changes in laws and regulations (including laws and regulations concerning taxes, banking, securities and insurance) generally applicable to the Company’s business;
changes in accounting policies, practices and standards, as may be adopted by the regulatory agencies as well as the Public Company Accounting Oversight Board, the Financial Accounting Standards Board, and other accounting standard setters;
cyber security attacks or intrusions that could adversely impact our businesses; and
other unexpected material adverse changes in our operations or earnings.
Except as required by law, the Company disclaims any intent or obligation to update publicly any such forward-looking statements, whether in response to new information, future events or otherwise. Any public statements or disclosures by the Company following this Quarterly Report on Form 10-Q which modify or impact any of the forward-looking statements contained in this Quarterly Report on Form 10-Q will be deemed to modify or supersede such statements in this Quarterly Report on Form 10-Q.
Selected Quarterly Financial Data
The selected consolidated financial and other data of the Company set forth below does not purport to be complete and should be read in conjunction with, and is qualified in its entirety by, the more detailed information, including the Consolidated Financial Statements and related notes, appearing elsewhere in this Quarterly Report on Form 10-Q.
| | | | | | Three Months Ended | | | | | Three Months Ended | | |
| | March 31,
2018 | | December 31,
2017 | | September 30,
2017 | | June 30,
2017 | | March 31,
2017 | June 30,
2018 | | March 31,
2018 | | December 31,
2017 | | September 30,
2017 | | June 30,
2017 |
| | (Dollars in thousands, except per share data) | (Dollars in thousands, except per share data) |
| Financial condition data | | | | | | | | | | | | | | | | | | |
| Securities | $ | 996,287 |
| | $ | 946,510 |
| | $ | 909,221 |
| | $ | 915,628 |
| | $ | 905,249 |
| $ | 1,002,921 |
| | $ | 996,287 |
| | $ | 946,510 |
| | $ | 909,221 |
| | $ | 915,628 |
|
| Loans | 6,362,056 |
| | 6,355,553 |
| | 6,289,902 |
| | 6,269,696 |
| | 6,064,366 |
| 6,479,271 |
| | 6,362,056 |
| | 6,355,553 |
| | 6,289,902 |
| | 6,269,696 |
|
| Allowance for loan losses | (60,862 | ) | | (60,643 | ) | | (59,710 | ) | | (59,479 | ) | | (62,318 | ) | (62,557 | ) | | (60,862 | ) | | (60,643 | ) | | (59,710 | ) | | (59,479 | ) |
| Goodwill and other intangible assets | 240,268 |
| | 241,147 |
| | 242,105 |
| | 243,005 |
| | 230,613 |
| 239,724 |
| | 240,268 |
| | 241,147 |
| | 242,105 |
| | 243,005 |
|
| Total assets | 8,090,410 |
| | 8,082,029 |
| | 8,052,919 |
| | 8,017,293 |
| | 7,738,114 |
| 8,381,002 |
| | 8,090,410 |
| | 8,082,029 |
| | 8,052,919 |
| | 8,017,293 |
|
| Total deposits | 6,751,511 |
| | 6,729,253 |
| | 6,682,942 |
| | 6,695,380 |
| | 6,470,674 |
| 7,013,490 |
| | 6,751,511 |
| | 6,729,253 |
| | 6,682,942 |
| | 6,695,380 |
|
| Total borrowings | 298,939 |
| | 323,698 |
| | 340,683 |
| | 320,378 |
| | 304,297 |
| 300,792 |
| | 298,939 |
| | 323,698 |
| | 340,683 |
| | 320,378 |
|
| Stockholders’ equity | 956,059 |
| | 943,809 |
| | 931,224 |
| | 914,584 |
| | 877,480 |
| 977,065 |
| | 956,059 |
| | 943,809 |
| | 931,224 |
| | 914,584 |
|
| Nonperforming loans | 47,713 |
| | 49,638 |
| | 50,277 |
| | 51,783 |
| | 55,052 |
| 47,112 |
| | 47,713 |
| | 49,638 |
| | 50,277 |
| | 51,783 |
|
| Nonperforming assets | 48,071 |
| | 50,250 |
| | 53,175 |
| | 54,812 |
| | 58,456 |
| 47,357 |
| | 48,071 |
| | 50,250 |
| | 53,175 |
| | 54,812 |
|
| Income statement | | | | | | | | | | | | | | | | | | |
| Interest income | $ | 73,749 |
| | $ | 72,876 |
| | $ | 71,778 |
| | $ | 68,133 |
| | $ | 64,407 |
| $ | 79,167 |
| | $ | 73,749 |
| | $ | 72,876 |
| | $ | 71,778 |
| | $ | 68,133 |
|
| Interest expense | 5,278 |
| | 5,044 |
| | 4,705 |
| | 4,378 |
| | 4,207 |
| 5,999 |
| | 5,278 |
| | 5,044 |
| | 4,705 |
| | 4,378 |
|
| Net interest income | 68,471 |
| | 67,832 |
| | 67,073 |
| | 63,755 |
| | 60,200 |
| 73,168 |
| | 68,471 |
| | 67,832 |
| | 67,073 |
| | 63,755 |
|
| Provision for loan losses | 500 |
| | 1,300 |
| | — |
| | 1,050 |
| | 600 |
| 2,000 |
| | 500 |
| | 1,300 |
| | — |
| | 1,050 |
|
| Noninterest income | 19,863 |
| | 21,914 |
| | 20,770 |
| | 21,398 |
| | 18,912 |
| 21,887 |
| | 19,863 |
| | 21,914 |
| | 20,770 |
| | 21,398 |
|
| Noninterest expenses | 53,451 |
| | 51,467 |
| | 51,310 |
| | 52,809 |
| | 48,773 |
| 52,688 |
| | 53,451 |
| | 51,467 |
| | 51,310 |
| | 52,809 |
|
| Net income | 27,555 |
| | 22,064 |
| | 23,852 |
| | 20,563 |
| | 20,725 |
| 31,118 |
| | 27,555 |
| | 22,064 |
| | 23,852 |
| | 20,563 |
|
| Per share data | | | | | | | | | | | | | | | | | | |
| Net income—basic | $ | 1.00 |
| | $ | 0.80 |
| | $ | 0.87 |
| | $ | 0.75 |
| | $ | 0.77 |
| $ | 1.13 |
| | $ | 1.00 |
| | $ | 0.80 |
| | $ | 0.87 |
| | $ | 0.75 |
|
| Net income—diluted | 1.00 |
| | 0.80 |
| | 0.87 |
| | 0.75 |
| | 0.76 |
| 1.13 |
| | 1.00 |
| | 0.80 |
| | 0.87 |
| | 0.75 |
|
| Cash dividends declared | 0.38 |
| | 0.32 |
| | 0.32 |
| | 0.32 |
| | 0.32 |
| 0.38 |
| | 0.38 |
| | 0.32 |
| | 0.32 |
| | 0.32 |
|
| Book value per share | 34.75 |
| | 34.38 |
| | 33.94 |
| | 33.34 |
| | 32.44 |
| 35.49 |
| | 34.75 |
| | 34.38 |
| | 33.94 |
| | 33.34 |
|
| Tangible book value per share (1) | 26.02 |
| | 25.60 |
| | 25.12 |
| | 24.48 |
| | 23.92 |
| 26.78 |
| | 26.02 |
| | 25.60 |
| | 25.12 |
| | 24.48 |
|
| Performance ratios | | | | | | | | | | | | | | | | | | |
| Return on average assets | 1.39 | % | | 1.08 | % | | 1.18 | % | | 1.06 | % | | 1.10 | % | 1.52 | % | | 1.39 | % | | 1.08 | % | | 1.18 | % | | 1.06 | % |
| Return on average common equity | 11.73 | % | | 9.28 | % | | 10.18 | % | | 9.15 | % | | 9.59 | % | 12.85 | % | | 11.73 | % | | 9.28 | % | | 10.18 | % | | 9.15 | % |
| Net interest margin (on a fully tax equivalent basis) | 3.77 | % | | 3.64 | % | | 3.65 | % | | 3.60 | % | | 3.51 | % | 3.89 | % | | 3.77 | % | | 3.64 | % | | 3.65 | % | | 3.60 | % |
| Equity to assets | 11.82 | % | | 11.68 | % | | 11.56 | % | | 11.41 | % | | 11.34 | % | 11.66 | % | | 11.82 | % | | 11.68 | % | | 11.56 | % | | 11.41 | % |
| Dividend payout ratio | 31.88 | % | | 39.79 | % | | 36.80 | % | | 42.09 | % | | 74.62 | % | 33.60 | % | | 31.88 | % | | 39.79 | % | | 36.80 | % | | 42.09 | % |
| Asset Quality Ratios | | | | | | | | | | |
| Nonperforming loans as a percent of gross loans | 0.75 | % | | 0.78 | % | | 0.80 | % | | 0.83 | % | | 0.91 | % | |
| Nonperforming assets as a percent of total assets | 0.59 | % | | 0.62 | % | | 0.66 | % | | 0.68 | % | | 0.76 | % | |
| Allowance for loan losses as a percent of total loans | 0.96 | % | | 0.95 | % | | 0.95 | % | | 0.95 | % | | 1.03 | % | |
| | | Asset Quality Ratios | | | | | | | | | | |
| Nonperforming loans as a percent of gross loans | | 0.73 | % | | 0.75 | % | | 0.78 | % | | 0.80 | % | | 0.83 | % |
| Nonperforming assets as a percent of total assets | | 0.57 | % | | 0.59 | % | | 0.62 | % | | 0.66 | % | | 0.68 | % |
| Allowance for loan losses as a percent of total loans | | 0.97 | % | | 0.96 | % | | 0.95 | % | | 0.95 | % | | 0.95 | % |
| Allowance for loan losses as a percent of nonperforming loans | 127.56 | % | | 122.17 | % | | 118.76 | % | | 114.86 | % | | 113.20 | % | 132.78 | % | | 127.56 | % | | 122.17 | % | | 118.76 | % | | 114.86 | % |
| Capital ratios | | | | | | | | | | | | | | | | | | |
| Tier 1 leverage capital ratio | 10.32 | % | | 10.04 | % | | 10.03 | % | | 10.07 | % | | 9.92 | % | 10.39 | % | | 10.32 | % | | 10.04 | % | | 10.03 | % | | 10.07 | % |
| Common equity tier 1 capital ratio | 11.47 | % | | 11.20 | % | | 11.13 | % | | 10.95 | % | | 10.89 | % | 11.64 | % | | 11.47 | % | | 11.20 | % | | 11.13 | % | | 10.95 | % |
| Tier 1 risk-based capital ratio | 12.57 | % | | 12.31 | % | | 12.24 | % | | 12.07 | % | | 12.05 | % | 12.73 | % | | 12.57 | % | | 12.31 | % | | 12.24 | % | | 12.07 | % |
| Total risk-based capital ratio | 14.08 | % | | 13.82 | % | | 13.75 | % | | 13.58 | % | | 13.66 | % | 14.24 | % | | 14.08 | % | | 13.82 | % | | 13.75 | % | | 13.58 | % |
| |
| (1) | Represents a non-GAAP measure. For reconciliation to GAAP book value per share, see Item 2 "Management's Discussion and Analysis of Financial Condition and Results of Operations - Executive Level Overview - Non-GAAP Measures" below. |
Executive Level Overview
Management evaluates the Company's operating results and financial condition using measures that include net income, earnings per share, return on assets and equity, return on tangible common equity, net interest margin, tangible book value per share, asset quality indicators, and many others. These metrics are used by management to make key decisions regarding the Company's balance sheet, liquidity, interest rate sensitivity, and capital resources and assist with identifying opportunities for improving the Company's financial position or operating results. The Company is focused on organic growth, but will also consider acquisition opportunities that can provide a satisfactory financial return. During the second quarter of 2018, the Company announced the signing of a definitive merger agreement with MNB Bancorp ("MNB"), which is expected to close in the fourth quarter of 2018.
Interest-Earning Assets
Management’s balance sheet strategy emphasizes commercial and home equity lending. The results depicted in the following table reflect an overall increase in total loans over the past five quarters due to the results of that strategy, as well as the impact from acquisitions. For the firstsecond quarter of 2018, total loan growth in the commercial and industrial loans, small business and residential categories were offset by declines in commercial real estate and home equity related balances.was strong across all major categories.
Management strives to be disciplined about loan pricing and considers interest rate sensitivity when generating loan assets. The Company has gradually and intentionally shifted its balance sheet composition so that its interest-rate risk position is fundamentally asset-sensitive. Management takes a disciplined approach to credit underwriting, seeking to avoid undue credit risk and loan losses.
Funding and Net Interest Margin
The Company's overall sources of funding reflect strong business and retail deposit growth, supporting management's emphasis on core deposit growth to fund loans, as depicted by the following chart:
As of March 31,June 30, 2018, core deposits comprised 90.1%90.35% of total deposits. The continued emphasis on core deposits has resulted in a cost of deposits of only 0.24%0.27% for the 2018 firstsecond quarter, which increased by twothree basis points when compared to the fourthfirst quarter of 2017.2018.
The Company's net interest margin was 3.77%3.89% for the quarter ended March 31,June 30, 2018, a 1312 basis point increase from the fourthfirst quarter of 2017,2018, reflecting the Company's asset sensitive position, as shown by the following chart:
Noninterest Income
Management continues to focus on noninterest income growth, which is primarily comprised of deposit account fees, interchange and ATM fees, investment management fees and mortgage banking income. The following chart shows the components of noninterest income over the past five quarters:
Expense Control
Management seeks to take a balanced approach to noninterest expense control by monitoring the management of ongoing operating expenses while making needed capital expenditures and prudently investing in growth initiatives. The Company’s primary expenses arise from Rockland Trust’s employee salaries and benefits, as well as expenses associated with buildings and equipment. The following chart depicts the Company's efficiency ratio on a GAAP basis (calculated by dividing noninterest expense by the sum of noninterest income and net interest income), as well as the Company's efficiency ratio on a non-GAAP operating basis, if applicable (calculated by dividing noninterest expense, excluding certain noncore items, by the sum of noninterest income, excluding certain noncore items, and net interest income), over the past five quarters:
*See "Non-GAAP Measures" below for a reconciliation to GAAP financial measures.
Tax Effectiveness
The Company participates in federal and state tax credit programs designed to promote economic development, affordable housing, and job creation. The Company continues to participate in the federal New Markets Tax Credit program and has also made low-income housing tax credit investments. The Company has also established security corporation subsidiaries and, through its subsidiaries, purchased tax-exempt bonds. Federal and state tax credit program participation and other tax strategies help the Company operate in a more tax effective manner and sometimes also create a competitive advantage for Rockland Trust and its community development subsidiaries. During the firstsecond quarter of 2018, the Company’s effective tax rate was 19.86%, reflecting the decreased corporate federal tax rate associated with the Tax Act. In addition, the effective tax rate includes the impact of excess tax benefits associated with stock compensation transactions and other discrete items, totaling $1.2 million.22.91%.
Capital
The Company's approach with respect to revenue, expense, and tax effectiveness is designed to promote long-term earnings growth. Strong earnings retention has contributed to capital growth. Book value per share increased 1.1%2.1% in the firstsecond quarter of 2018 and 7.1%6.4% over the past four quarters. In addition, tangible book value per share increased 1.6%rose 2.9% in the firstsecond quarter of 20172018 and has increasedhigher by 8.8%9.4% over the past four quarters (see "Non-GAAP Measures" below for a reconciliation of non-GAAP measures). Stockholders' equity as a percentage of total assets was 11.82%11.66% for the firstsecond quarter of 2018, compared to 11.68%11.82% in the fourthfirst quarter of 2017.2018. The Company's tangible common equity ratio (or tangible common equity as a percentage of tangible assets) increaseddecreased to 9.12%9.06% for the firstsecond quarter of 2018, as compared to 8.96%9.12% in the fourthfirst quarter of 2017.2018. See "Non-GAAP Measures" below for a reconciliation of non-GAAP measures. The following chart shows the Company's book value and tangible book value per share over the past five quarters:
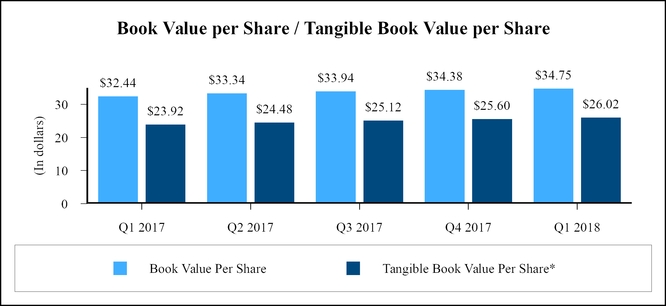
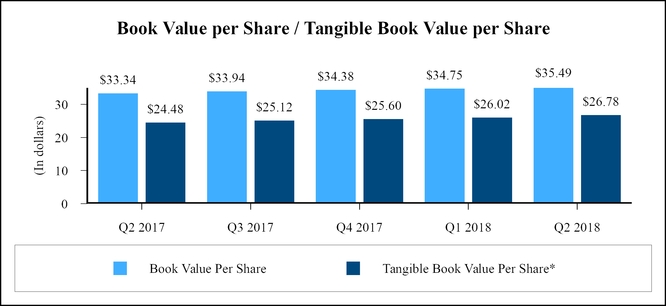
*See "Non-GAAP Measures" below for a reconciliation to GAAP financial measures.
The Company's growth in capital enables the payment of cash dividends. The Company declared quarterly cash dividends of $0.38 per share for the first quartertwo quarters of 2018, representing an increase of 18.8% from the 2017 quarterly dividend rate of $0.32 per share.
FirstSecond Quarter 2018 Results
Net income for the firstsecond quarter of 2018 was $27.6$31.1 million, or $1.00$1.13 on a diluted earnings per share basis, an increase of 33.0%51.3% and 31.6%50.7%, respectively, as compared to $20.7$20.6 million, or $0.76$0.75 on a diluted earnings per share basis, for the prior year firstsecond quarter. FirstBoth periods results included merger and acquisition results which the Company deems to be noncore. Excluding these merger and acquisition expenses, second quarter 2018 operating net income of $27.6was $31.4 million (which included no adjustments) compared to the operating net income from the firstsecond quarter of 2017 of $21.1$22.4 million, reflected an increase of 30.9%40.4%. See "Non-GAAP Measures" below for a reconciliation of non-GAAP measures.
2018 Outlook
During the Company’s firstsecond quarter 2018 earnings call, the Company stated that it anticipates the following for the full year ending December 31, 2018 (as compared with the year ending December 31, 2017):
Loan and deposit growth for the full year 2018 to be in the low single digit range;
Assuming no further Fed Funds rate increases, the full year 2018 net interest margin is expected to expand by 1525 to 2030 basis points versus the full year 2017;2017, with deposit costs increasing 4 to 5 basis points per quarter;
Both full year 2018 non-interestnoninterest income and non-interestnoninterest expense are expected to increase at a low to mid-single digit rate;rate compared to 2017, with the operating efficiency ratio improving for the remainder of the year;
There is no near term pressure on credit quality, but a gradual normalization of credit is inevitable; and
The effective tax rate for the remainder of the year (excluding discrete items) is expected to approximate 23%be approximately 23.3%.
Non-GAAP Measures
When management assesses the Company’s financial performance for purposes of making day-to-day and strategic decisions, it does so based upon the performance of its core banking business, which is primarily derived from the combination of net interest income and noninterest or fee income, reduced by operating expenses, the provision for loan losses, and the impact of income taxes and other noncore items shown in the table that follows. There are items that impact the Company's results that management believes are unrelated to its core banking business such as gains or losses on the sales of securities, merger and acquisition expenses loss on extinguishment of debt, impairment, and other items, such as one-time adjustments as a result of changes in laws and regulations. Management, therefore, computes certain non-GAAP measures including net operating earnings and operating EPS, noninterest income on an operating basis and efficiency ratio on an operating basis, which exclude items management considers to be noncore. Management believes excluding these items facilitates greater visibility into the Company’s core banking business and underlying trends that may, to some extent, be obscured by inclusion of such items.
Management also supplements its evaluation of financial performance with an analysis of tangible book value per share (which is computed by dividing stockholders' equity less goodwill and identifiable intangible assets, or tangible common equity, by common shares outstanding) and with the Company's tangible common equity ratio (which is computed by dividing tangible common equity by tangible assets) which are non-GAAP measures. The Company has included information on these tangible ratios because management believes that investors may find it useful to have access to the same analytical tools used by management to assess performance and identify trends. The Company has recognized goodwill and other intangible assets in conjunction with merger and acquisition activities. Excluding the impact of goodwill and other intangibles in measuring asset and capital values for the ratios provided, along with other bank standard capital ratios, facilitates comparison of the capital adequacy of the Company to other companies in the financial services industry.
These non-GAAP measures should not be viewed as a substitute for financial results determined in accordance with GAAP. An item which management deems to be noncore and excludes when computing these non-GAAP measures can be of substantial importance to the Company’s results for any particular period. The Company’s non-GAAP performance measures are not necessarily comparable to similarly named non-GAAP performance measures which may be presented by other companies.
The following tables summarize adjustments for noncore items for the time periods indicated below and reconciles non-GAAP measures:
| | | | Three Months Ended March 31 | Three Months Ended June 30 |
| | Net Income | | Diluted Earnings Per Share | Net Income | | Diluted Earnings Per Share |
| | 2018 | | 2017 | | 2018 | | 2017 | 2018 | | 2017 | | 2018 | | 2017 |
| | (Dollars in thousands, except per share data) | (Dollars in thousands, except per share data) |
| Net income available to common shareholders (GAAP) | $ | 27,555 |
| | $ | 20,725 |
| | $ | 1.00 |
| | $ | 0.76 |
| $ | 31,118 |
| | $ | 20,563 |
| | $ | 1.13 |
| | $ | 0.75 |
|
| Non-GAAP adjustments | | | | | | | | | | | | | | |
| Noninterest expense components | | | | | | | | | | | | | | |
| Merger and acquisition expenses | — |
| | 484 |
| | — |
| | 0.02 |
| 434 |
| | 2,909 |
| | 0.01 |
| | 0.11 |
|
| Total impact of noncore items | — |
| | 484 |
| | — |
| | 0.02 |
| 434 |
| | 2,909 |
| | 0.01 |
| | 0.11 |
|
| Net tax benefit associated with noncore items (1) | — |
| | (153 | ) | | — |
| | — |
| (122 | ) | | (1,088 | ) | | — |
| | (0.04 | ) |
| Noncore items, net of tax | $ | — |
| | $ | 331 |
| | $ | — |
| | $ | 0.02 |
| $ | 312 |
| | $ | 1,821 |
| | $ | 0.01 |
| | $ | 0.07 |
|
| Operating net income (Non-GAAP) | $ | 27,555 |
| | $ | 21,056 |
| | $ | 1.00 |
| | $ | 0.78 |
| $ | 31,430 |
| | $ | 22,384 |
| | $ | 1.14 |
| | $ | 0.82 |
|
| | | | | | | | | |
| | | Six Months Ended June 30 |
| | | Net Income | | Diluted Earnings Per Share |
| | | 2018 | | 2017 | | 2018 | | 2017 |
| | | (Dollars in thousands, except per share data) |
| Net income available to common shareholders (GAAP) | | $ | 58,673 |
| | $ | 41,288 |
| | $ | 2.13 |
| | $ | 1.52 |
|
| Non-GAAP adjustments | | | | | | | | |
| Noninterest income components | | | | | | | | |
| Gain on sale of fixed income securities | | — |
| | — |
| | — |
| | n/a |
|
| Gain on life insurance benefits, tax exempt | | — |
| | — |
| | n/a |
| | n/a |
|
| Noninterest expense components | | | | | | | |
|
|
| Impairment on acquired facilities | | — |
| | — |
| | — |
| | — |
|
| Loss on extinguishment of debt | | — |
| | — |
| | — |
| | 0.02 |
|
| Loss on sale of fixed income securities | | — |
| | — |
| | — |
| | — |
|
| Merger and acquisition expenses | | 434 |
| | 3,393 |
| | 0.01 |
| | 0.12 |
|
| Loss on termination of derivatives | | — |
| | — |
| | — |
| | — |
|
| Total impact of noncore items | | 434 |
| | 3,393 |
| | 0.01 |
| | 0.14 |
|
| Net tax benefit associated with noncore items (1) | | (122 | ) | | (1,241 | ) | | — |
| | (0.06 | ) |
| Operating net income (Non-GAAP) | | $ | 58,985 |
| | $ | 43,440 |
| | $ | 2.14 |
| | $ | 1.60 |
|
| | | | | | | | | |
| |
| (1) | The net tax benefit associated with noncore items is determined by assessing whether each noncore item is included or excluded from net taxable income and applying the Company's combined marginal tax rate to only those items included in net taxable income. |
| | | | Three Months Ended | | Three Months Ended | |
| | March 31
2018 | | December 31
2017 | | September 30
2017 | | June 30
2017 | | March 31
2017 | | | June 30
2018 | | March 31
2018 | | December 31
2017 | | September 30
2017 | | June 30
2017 | | |
| | (Dollars in thousands) | | (Dollars in thousands) | |
| Net interest income (GAAP) | $ | 68,471 |
| | $ | 67,832 |
| | $ | 67,073 |
| | $ | 63,755 |
| | $ | 60,200 |
| | (a) | $ | 73,168 |
| | $ | 68,471 |
| | $ | 67,832 |
| | $ | 67,073 |
| | $ | 63,755 |
| | (a) |
| | | | | | | | | | | | | | | | | | | | | |
| Noninterest income (GAAP) | $ | 19,863 |
| | $ | 21,914 |
| | $ | 20,770 |
| | $ | 21,398 |
| | $ | 18,912 |
| | (b) | $ | 21,887 |
| | $ | 19,863 |
| | $ | 21,914 |
| | $ | 20,770 |
| | $ | 21,398 |
| | (b) |
| Noninterest income on an operating basis (Non-GAAP)* | $ | 19,863 |
| | $ | 21,914 |
| | $ | 20,770 |
| | $ | 21,398 |
| | $ | 18,912 |
| | (c) | $ | 21,887 |
| | $ | 19,863 |
| | $ | 21,914 |
| | $ | 20,770 |
| | $ | 21,398 |
| | (c) |
| | | | | | | | | | | | | | | | | | | | | |
| Noninterest expense (GAAP) | $ | 53,451 |
| | $ | 51,467 |
| | $ | 51,310 |
| | $ | 52,809 |
| | $ | 48,773 |
| | (d) | $ | 52,688 |
| | $ | 53,451 |
| | $ | 51,467 |
| | $ | 51,310 |
| | $ | 52,809 |
| | (d) |
| Less: | | | | | | | | | | | | | | | | | | | | |
| Merger and acquisition expense | — |
| | — |
| | — |
| | 2,909 |
| | 484 |
| | 434 |
| | — |
| | — |
| | — |
| | 2,909 |
| |
| Noninterest expense on an operating basis (Non-GAAP) | $ | 53,451 |
| | $ | 51,467 |
| | $ | 51,310 |
| | $ | 49,900 |
| | $ | 48,289 |
| | (e) | $ | 52,254 |
| | $ | 53,451 |
| | $ | 51,467 |
| | $ | 51,310 |
| | $ | 49,900 |
| | (e) |
| | | | | | | | | | | | | | | | | | | | | |
| Total revenue (GAAP) | $ | 88,334 |
| | $ | 89,746 |
| | $ | 87,843 |
| | $ | 85,153 |
| | $ | 79,112 |
| | (a+b) | $ | 95,055 |
| | $ | 88,334 |
| | $ | 89,746 |
| | $ | 87,843 |
| | $ | 85,153 |
| | (a+b) |
| Total operating revenue (Non-GAAP)* | $ | 88,334 |
| | $ | 89,746 |
| | $ | 87,843 |
| | $ | 85,153 |
| | $ | 79,112 |
| | (a+c) | $ | 95,055 |
| | $ | 88,334 |
| | $ | 89,746 |
| | $ | 87,843 |
| | $ | 85,153 |
| | (a+c) |
| | | | | | | | | | | | | | | | | | | | | |
| Ratios | | | | | | | | | | | | | | | | | | | | |
| Noninterest income as a % of revenue (GAAP based) | 22.49 | % | | 24.42 | % | | 23.64 | % | | 25.13 | % | | 23.91 | % | | (b/(a+b)) | 23.03 | % | | 22.49 | % | | 24.42 | % | | 23.64 | % | | 25.13 | % | | (b/(a+b)) |
| Noninterest income as a % of revenue on an operating basis (Non-GAAP)* | 22.49 | % | | 24.42 | % | | 23.64 | % | | 25.13 | % | | 23.91 | % | | (c/(a+c)) | 23.03 | % | | 22.49 | % | | 24.42 | % | | 23.64 | % | | 25.13 | % | | (c/(a+c)) |
| Efficiency ratio (GAAP based) | 60.51 | % | | 57.35 | % | | 58.41 | % | | 62.02 | % | | 61.65 | % | | (d/(a+b)) | 55.43 | % | | 60.51 | % | | 57.35 | % | | 58.41 | % | | 62.02 | % | | (d/(a+b)) |
| Efficiency ratio on an operating basis (Non-GAAP) | 60.51 | % | | 57.35 | % | | 58.41 | % | | 58.60 | % | | 61.04 | % | | (e/(a+c)) | 54.97 | % | | 60.51 | % | | 57.35 | % | | 58.41 | % | | 58.60 | % | | (e/(a+c)) |
* There were no adjustments for the periods presented.
The following table summarizes the calculation of the Company's tangible common equity ratio and tangible book value per share for the periods indicated: | | | | March 31,
2018 | | December 31
2017 | | September 30
2017 | | June 30
2017 | | March 31,
2017 | | June 30,
2018 | | March 31
2018 | | December 31
2017 | | September 30
2017 | | June 30,
2017 | |
| | (Dollars in thousands, except per share data) | | (Dollars in thousands, except per share data) | |
| Tangible common equity | | | | | | | | | | | | | | | | | | | | |
| Stockholders' equity (GAAP) | $ | 956,059 |
| | $ | 943,809 |
| | $ | 931,224 |
| | $ | 914,584 |
| | $ | 877,480 |
| (a) | $ | 977,065 |
| | $ | 956,059 |
| | $ | 943,809 |
| | $ | 931,224 |
| | $ | 914,584 |
| (a) |
| Less: Goodwill and other intangibles | 240,268 |
| | 241,147 |
| | 242,105 |
| | 243,005 |
| | 230,613 |
| | 239,724 |
| | 240,268 |
| | 241,147 |
| | 242,105 |
| | 243,005 |
| |
| Tangible common equity (Non-GAAP) | 715,791 |
| | 702,662 |
| | 689,119 |
| | 671,579 |
| | 646,867 |
| (b) | 737,341 |
| | 715,791 |
| | 702,662 |
| | 689,119 |
| | 671,579 |
| (b) |
| Tangible assets | | | | | | | | |
| | | | | | | | | |
| |
| Assets (GAAP) | 8,090,410 |
| | 8,082,029 |
| | 8,052,919 |
| | 8,017,293 |
| | 7,738,114 |
| (c) | 8,381,002 |
| | 8,090,410 |
| | 8,082,029 |
| | 8,052,919 |
| | 8,017,293 |
| (c) |
| Less: Goodwill and other intangibles | 240,268 |
| | 241,147 |
| | 242,105 |
| | 243,005 |
| | 230,613 |
| | 239,724 |
| | 240,268 |
| | 241,147 |
| | 242,105 |
| | 243,005 |
| |
| Tangible assets (Non-GAAP) | $ | 7,850,142 |
| | $ | 7,840,882 |
| | $ | 7,810,814 |
| | $ | 7,774,288 |
| | $ | 7,507,501 |
| (d) | $ | 8,141,278 |
| | $ | 7,850,142 |
| | $ | 7,840,882 |
| | $ | 7,810,814 |
| | $ | 7,774,288 |
| (d) |
| Common shares | 27,512,328 |
|
| 27,450,190 |
|
| 27,437,791 |
| | 27,431,171 |
| | 27,046,768 |
| (e) | 27,532,524 |
|
| 27,512,328 |
|
| 27,450,190 |
| | 27,437,791 |
| | 27,431,171 |
| (e) |
| | | | | | | | | | | | | | | | | | | | | |
| Common equity to assets ratio (GAAP) | 11.82 | % | | 11.68 | % | | 11.56 | % | | 11.41 | % | | 11.34 | % | (a/c) | 11.66 | % | | 11.82 | % | | 11.68 | % | | 11.56 | % | | 11.41 | % | (a/c) |
| Tangible common equity to tangible assets ratio (Non-GAAP) | 9.12 | % | | 8.96 | % | | 8.82 | % | | 8.64 | % | | 8.62 | % | (b/d) | 9.06 | % | | 9.12 | % | | 8.96 | % | | 8.82 | % | | 8.64 | % | (b/d) |
| Book value per share (GAAP) | $ | 34.75 |
| | $ | 34.38 |
| | $ | 33.94 |
| | $ | 33.34 |
| | $ | 32.44 |
| (a/e) | $ | 35.49 |
| | $ | 34.75 |
| | $ | 34.38 |
| | $ | 33.94 |
| | $ | 33.34 |
| (a/e) |
| Tangible book value per share (Non-GAAP) | $ | 26.02 |
| | $ | 25.60 |
| | $ | 25.12 |
| | $ | 24.48 |
| | $ | 23.92 |
| (b/e) | $ | 26.78 |
| | $ | 26.02 |
| | $ | 25.60 |
| | $ | 25.12 |
| | $ | 24.48 |
| (b/e) |
Critical Accounting Policies
Critical accounting policies are defined as those that are reflective of significant judgments and uncertainties, and could potentially result in materially different results under different assumptions and conditions. The Company believes that the most critical accounting policies are those which the Company’s financial condition depends upon, and which involve the most complex or subjective decisions or assessments.
There have been no material changes in critical accounting policies during the first threesix months of 2018. Please refer to the Company's Annual Report on Form 10-K for the fiscal year ended December 31, 2017 for a complete listing of critical accounting policies.
FINANCIAL POSITION
Securities Portfolio The Company’s securities portfolio consists of trading securities, equity securities, securities available for sale, and securities which management intends to hold until maturity. Securities increased by $49.8$56.4 million, or 5.3%6.0%, at March 31,June 30, 2018 as compared to December 31, 2017, reflecting new purchases of $91.2$136.8 million made during the threesix month period, partially offset by paydowns on existing securities. The ratio of securities to total assets was 12.31%11.97% and 11.71% at March 31,June 30, 2018 and December 31, 2017, respectively.
The Company monitors investment securities for the presence of other-than-temporary impairment (“OTTI”). For debt securities, the primary consideration in determining whether impairment is OTTI is whether or not the Bank expects to collect all contractual cash flows. Further details regarding the Company's analysis of potential OTTI can be found in Note 3 “Securities” within Condensed Notes to Consolidated Financial Statements included in Item 1 hereof.
Residential Mortgage Loan Sales The Company’s primary loan sale activity arises from the sale of government sponsored enterprise eligible residential mortgage loans. During the threesix months ended March 31,June 30, 2018 and 2017, the Bank originated residential loans with the intention of selling them in the secondary market or to hold in the Company's residential portfolio. When a loan is sold, the Company enters into agreements that contain representations and warranties about the characteristics of the loans sold and their origination. The Company may be required to either repurchase mortgage loans or to indemnify the purchaser from losses if representations and warranties are breached. The Company incurred no losses during the three and six month periods ended March 31,June 30, 2018 and March 31,June 30, 2017 related to these activities.
The following table shows the total residential loans that were closed and whether the amounts were held in the portfolio or sold/held for sale in the secondary market during the periodperiods indicated:
Table 1 - Closed Residential Real Estate Loans
| | | | Three Months Ended March 31 | Three Months Ended June 30 | | Six Months Ended June 30 |
| | 2018 | | 2017 | 2018 | | 2017 | | 2018 | | 2017 |
| | (Dollars in thousands) | (Dollars in thousands) |
| Held in portfolio | $ | 38,816 |
| | $ | 42,580 |
| $ | 41,770 |
| | $ | 42,191 |
| | $ | 80,586 |
| | $ | 84,771 |
|
| Sold or held for sale in the secondary market | 38,091 |
| | 45,457 |
| 45,851 |
| | 54,077 |
| | 83,942 |
| | 99,534 |
|
| Total closed loans | $ | 76,907 |
| | $ | 88,037 |
| $ | 87,621 |
| | $ | 96,268 |
| | $ | 164,528 |
| | $ | 184,305 |
|
The Company sold $38.9$40.2 million and $49.6$48.2 million in residential loans during the three months ended March 31,June 30, 2018 and 2017, respectively and $79.1 million and $97.8 million during the six months ended June 30, 2018 and 2017, respectively. All loans sold during these periods were sold with servicing rights released.
Currently, the Bank sells the servicing of sold loans for a servicing release premium, simultaneous with the sale of the loan. In the past, the Bank may have opted to sell loans and retain the servicing. In the event of a sale with servicing rights retained, a mortgage servicing asset is established, which represents the then current estimated fair value based on market prices for comparable mortgage servicing contracts, when available, or alternatively is based on a valuation model that calculates the present value of estimated future net servicing income. The valuation model incorporates assumptions that market participants would use in estimating future net servicing income, such as the cost to service, the discount rate, an inflation rate, ancillary income, prepayment speeds and default rates and losses. Servicing rights are recorded in other assets in the consolidated balance sheets, are amortized in proportion to and over the period of estimated net servicing income, and are assessed for impairment based on fair value at each reporting date. Impairment is determined by stratifying the rights based on predominant characteristics, such as interest rate, loan type and investor type. Impairment is recognized through a valuation allowance, to the extent that fair value is less than the capitalized amount. If the Company later determines that all or a portion of the impairment no longer exists, a reduction of the allowance may be recorded as an increase to income. The principal balance of loans serviced by the Bank on behalf of investors was $269.5$256.9 million, $277.8 million and $299.8$303.7 million at March 31,June 30, 2018, December 31, 2017, and March 31,June 30, 2017, respectively. The following table shows the adjusted cost of the servicing rights associated with these loans and the changes for the periods indicated:
Table 2 - Mortgage Servicing Asset
| | | | Three Months Ended March 31 | Three Months Ended June 30 | | Six Months Ended June 30 |
| | 2018 | | 2017 | 2018 | | 2017 | | 2018 | | 2017 |
| | (Dollars in thousands) | (Dollars in thousands) |
| Balance at beginning of period | $ | 1,697 |
| | $ | 2,048 |
| $ | 1,632 |
| | $ | 1,958 |
| | $ | 1,697 |
| | $ | 2,048 |
|
| Acquired portfolio | | — |
| | 28 |
| | — |
| | 28 |
|
| Amortization | (83 | ) | | (101 | ) | (76 | ) | | (108 | ) | | (159 | ) | | (209 | ) |
| Change in valuation allowance | 18 |
| | 11 |
| 3 |
| | (2 | ) | | 21 |
| | 9 |
|
| Balance at end of period | $ | 1,632 |
| | $ | 1,958 |
| $ | 1,559 |
| | $ | 1,876 |
| | $ | 1,559 |
| | $ | 1,876 |
|
Forward sale contracts of mortgage loans, considered derivative instruments for accounting purposes, may be utilized by the Company in its efforts to manage risk of loss associated with its mortgage loan commitments and mortgage loans held for sale. Prior to closing and funding certain one-to-four family residential mortgage loans, an interest rate lock commitment is generally extended to the borrower. During the period from commitment date to closing date, the Company is subject to the risk that market rates of interest may change. If market rates rise, investors generally will pay less to purchase such loans, resulting in a reduction in the gain on sale of the loans or, possibly, a loss. In an effort to mitigate such risk, forward delivery sales commitments are executed, under which the Company agrees to deliver whole mortgage loans to investors which economically hedges this market risk. See Note 8, “Derivative and Hedging Activities” within Condensed Notes to Consolidated Financial Statements included in Item 1 hereof for more information on mortgage activity and mortgage related derivatives.
Loan Portfolio Management continues to focus on growth in the commercial and home equity lending categories. Management believes this emphasis is prudent, given the prevailing interest rate and economic environment, as well as strategic priorities. The Company’s loan portfolio increased by $6.5$123.7 million during the first threesix months of 2018.2018, primarily driven by the commercial and industrial portfolio which increased by $87.7 million and by the residential real estate portfolio which increased by $25.1 million.
The Company's commercial loan portfolio is comprised primarily of commercial and industrial loans as well as commercial real estate loans. Management considers the Company’s commercial and industrial portfolio to be well-diversified with loans to various types of industries. The following pie chart shows the diversification of the commercial and industrial portfolio as of March 31,June 30, 2018:
| | | | (Dollars in thousands) | (Dollars in thousands) |
| Average loan size | $ | 230 |
| $ | 248 |
|
| Largest individual commercial and industrial loan outstanding | $ | 22,893 |
| $ | 27,500 |
|
| Commercial and industrial nonperforming loans/commercial and industrial loans | 3.40 | % | 3.08 | % |
The Company’s commercial real estate loan portfolio, inclusive of commercial construction, is the Company’s largest loan type concentration. The Company believes that this portfolio is also well-diversified with loans secured by a variety of property types, such as owner-occupied and nonowner-occupied commercial, retail, office, industrial, warehouse, industrial development bonds, and other special purpose properties, such as hotels, motels, nursing homes, restaurants, churches, recreational facilities, marinas, and golf courses. Commercial real estate also includes loans secured by certain residential-related property types including multi-family apartment buildings, residential development tracts and condominiums. The following pie chart shows the diversification of the commercial real estate loan portfolio as of March 31,June 30, 2018:
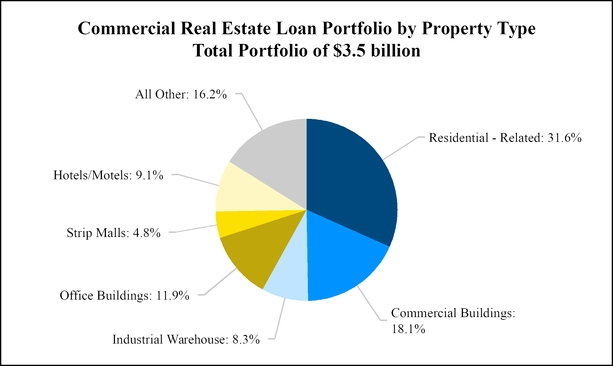
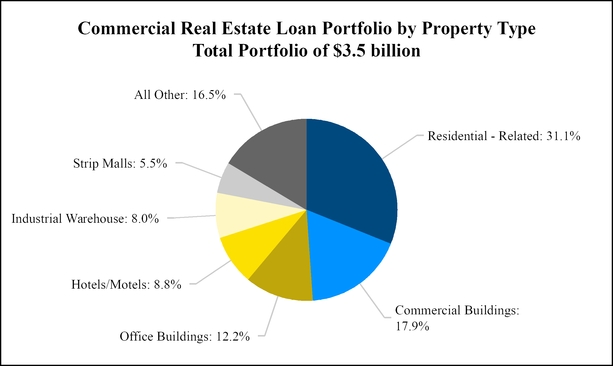
| | | | (Dollars in thousands) | (Dollars in thousands) |
| Average loan size | $ | 864 |
| $ | 872 |
|
| Largest individual commercial real estate mortgage outstanding | $ | 27,184 |
| $ | 27,522 |
|
| Commercial real estate nonperforming loans/commercial real estate loans | 0.09 | % | 0.09 | % |
| Owner occupied commercial real estate loans/commercial real estate loans | 15.1 | % | 15.2 | % |
In addition to the commercial portfolios, the Company also originates both fixed-rate and adjustable-rate residential real estate loans as well as residential construction lending related to single-home residential development within the Company's market area. The Company also provides home equity loans and lines that may be made as a fixed rate term loan or under a variable rate revolving line of credit secured by a first or junior mortgage on the borrower's residence or second home. Additionally, the Company makes loans for a wide variety of other personal needs. Consumer loans primarily consist of installment loans and overdraft protections. The residential, home equity and other consumer portfolios totaled $1.8$1.9 billion at March 31,June 30, 2018.
Asset Quality The Company continually monitors the asset quality of the loan portfolio using all available information. Based on this assessment, loans demonstrating certain payment issues or other weaknesses may be categorized as delinquent, impaired, nonperforming and/or put on nonaccrual status. Additionally, in the course of resolving such loans, the Company may choose to restructure the contractual terms of certain loans to match the borrower’s ability to repay the loan based on their current financial condition. If a restructured loan meets certain criteria, it may be categorized as a troubled debt restructuring ("TDR").
Delinquency The Company’s philosophy toward managing its loan portfolios is predicated upon careful monitoring, which stresses early detection and response to delinquent and default situations. The Company seeks to make arrangements to resolve any delinquent or default situation over the shortest possible time frame. Generally, the Company requires that a delinquency notice be mailed to a borrower upon expiration of a grace period (typically no longer than 15 days beyond the due date). Reminder notices may be sent and telephone calls may be made prior to the expiration of the grace period. If the delinquent status is not resolved within a reasonable time frame following the mailing of a delinquency notice, the Bank’s personnel charged with managing its loan portfolios contacts the borrower to ascertain the reasons for delinquency and the prospects for payment. Any subsequent actions taken to resolve the delinquency will depend upon the nature of the loan and the length of time that the loan has been delinquent. The borrower’s needs are considered as much as reasonably possible without jeopardizing the Bank’s position. A late charge is usually assessed on loans upon expiration of the grace period.
Nonaccrual Loans As a general rule, loans more than 90 days past due with respect to principal or interest are classified as nonaccrual loans. However, certain loans that are more than 90 days past due may be kept on an accruing status if the loans are well secured and/or in the process of collection. The Company may also put a junior lien mortgage on nonaccrual status as a
result of delinquency with respect to the first position, which is held by another financial institution, while the junior lien is currently performing. Income accruals are suspended on all nonaccrual loans and all previously accrued and uncollected interest is reversed against current income. A loan remains on nonaccrual status until it becomes current with respect to principal and interest (and in certain instances remains current for up to six months), the loan is liquidated, or when the loan is determined to be uncollectible and is charged-off against the allowance for loan losses.
Troubled Debt Restructurings In the course of resolving problem loans, the Company may choose to restructure the contractual terms of certain loans. The Company attempts to work out an alternative payment schedule with the borrower in order to avoid or cure a default. Loans that are modified are reviewed by the Company to identify if a TDR has occurred, which is when, for economic or legal reasons related to a borrower’s financial difficulties, the Bank grants a concession to the borrower that it would not otherwise consider. Terms may be modified to fit the ability of the borrower to repay in line with its current financial status and the restructuring of the loan may include adjustments to interest rates, extensions of maturity, consumer loans where the borrower's obligations have been effectively discharged through Chapter 7 Bankruptcy and the borrower has not reaffirmed the debt to the Bank, and other actions intended to minimize economic loss and avoid foreclosure or repossession of collateral. If such efforts by the Bank do not result in satisfactory performance, the loan is referred to legal counsel, at which time foreclosure proceedings are initiated. At any time prior to a sale of the property at foreclosure, the Bank may terminate foreclosure proceedings if the borrower is able to work out a satisfactory payment plan.
It is the Company’s policy to have any restructured loans which are on nonaccrual status prior to being modified remain on nonaccrual status for six months, subsequent to being modified, before management considers its return to accrual status. If the restructured loan is on accrual status prior to being modified, it is reviewed to determine if the modified loan should remain on accrual status. Loans that are considered TDRs are classified as performing, unless they are on nonaccrual status or greater than 90 days delinquent. Loans classified as TDRs remain classified as such for the life of the loan, except in limited circumstances, when it may be determined that the borrower is performing under modified terms and the restructuring agreement specified an interest rate greater than or equal to an acceptable market rate for a comparable new loan at the time of the restructuring.
Purchased Credit Impaired Loans Purchased Credit Impaired (“PCI”) loans are acquired loans which had evidence of deterioration in credit quality at the purchase date and for which it is probable that all contractually required payments will not be collected. PCI loans are recorded at fair value without any carryover of the allowance for loan losses. The excess cash flows expected to be collected over the carrying amount of the loans, referred to as the "accretable yield," is accreted into interest income over the life of the loans using the effective yield method. Accordingly, PCI loans are not subject to classification as nonaccrual in the same manner as originated loans, rather they are generally considered to be accruing loans because their interest income recognized relates to the accretable yield and not to contractual interest payments. See Note 4, "Loans, Allowance for Loan Losses, and Credit Quality" within Condensed Notes to Consolidated Financial Statements included in Item 1 hereof for more information.
Nonperforming Assets Nonperforming assets are comprised of nonperformingnonaccrual loans, loans past due 90 days or more but still accruing interest, and other real estate owned (“OREO”("OREO"). Nonperforming loans consist of nonaccrual loans and loans that are more than 90 days past due but still accruing interest.
OREO consists of real estate properties, which have primarily served as collateral to secure loans, that are controlled or owned by the Bank. These properties are recorded at fair value less estimated costs to sell at the date control is established, resulting in a new cost basis. The amount by which the recorded investment in the loan exceeds the fair value (net of estimated costs to sell) of the foreclosed asset is charged to the allowance for loan losses. Subsequent declines in the fair value of the foreclosed asset below the new cost basis are recorded through the use of a valuation allowance. Subsequent increases in the fair value are recorded as reductions in the valuation allowance, but not below zero. All costs incurred thereafter in maintaining the property are generally charged to noninterest expense. In the event the real estate is utilized as a rental property, net rental income and expenses are recorded as incurred within noninterest expense.
The following table sets forth information regarding nonperforming assets held by the Company at the dates indicated:
Table 3 - Nonperforming Assets
| | | | March 31,
2018 | | December 31,
2017 | | March 31,
2017 | June 30,
2018 | | December 31,
2017 | | June 30,
2017 |
| | (Dollars in thousands) | (Dollars in thousands) |
| Loans accounted for on a nonaccrual basis | | | | | | | | | | |
| Commercial and industrial | $ | 30,751 |
| | $ | 32,055 |
| | $ | 36,877 |
| $ | 30,095 |
| | $ | 32,055 |
| | $ | 33,630 |
|
| Commercial real estate | 2,997 |
| | 3,123 |
| | 4,792 |
| 3,110 |
| | 3,123 |
| | 4,679 |
|
| Small business | 412 |
| | 230 |
| | 207 |
| 384 |
| | 230 |
| | 453 |
|
| Residential real estate | 7,646 |
| | 8,129 |
| | 7,139 |
| 7,612 |
| | 8,129 |
| | 7,683 |
|
| Home equity | 5,858 |
| | 6,022 |
| | 5,987 |
| 5,861 |
| | 6,022 |
| | 5,240 |
|
| Other consumer | 40 |
| | 71 |
| | 48 |
| 36 |
| | 71 |
| | 90 |
|
| Total (1) | $ | 47,704 |
| | $ | 49,630 |
| | $ | 55,050 |
| $ | 47,098 |
| | $ | 49,630 |
| | $ | 51,775 |
|
| Loans past due 90 days or more but still accruing | | | | | | | | | | |
| Other consumer | 9 |
| | 8 |
| | 2 |
| 14 |
| | 8 |
| | 8 |
|
| Total | $ | 9 |
| | $ | 8 |
| | $ | 2 |
| $ | 14 |
| | $ | 8 |
| | $ | 8 |
|
| Total nonperforming loans | $ | 47,713 |
| | $ | 49,638 |
| | $ | 55,052 |
| $ | 47,112 |
| | $ | 49,638 |
| | $ | 51,783 |
|
| Other real estate owned | 358 |
| | 612 |
| | 3,404 |
| 245 |
| | 612 |
| | 3,029 |
|
| Total nonperforming assets | $ | 48,071 |
| | $ | 50,250 |
| | $ | 58,456 |
| $ | 47,357 |
| | $ | 50,250 |
| | $ | 54,812 |
|
| Nonperforming loans as a percent of gross loans | 0.75 | % | | 0.78 | % | | 0.91 | % | 0.73 | % | | 0.78 | % | | 0.83 | % |
| Nonperforming assets as a percent of total assets | 0.59 | % | | 0.62 | % | | 0.76 | % | 0.57 | % | | 0.62 | % | | 0.68 | % |
| |
| (1) | Inclusive of TDRs on nonaccrual status of $5.6$4.1 million, $6.1 million, and $5.4$5.7 million at March 31,June 30, 2018, December 31, 2017, and March 31,June 30, 2017, respectively. |
The following table summarizes the changes in nonperforming assets for the periods indicated:
Table 4 - Activity in Nonperforming Assets
| | | | Three Months Ended | Three Months Ended | | Six Months Ended |
| | March 31,
2018 | | March 31,
2017 | June 30,
2018 | | June 30,
2017 | | June 30, 2018 | | June 30, 2017 |
| | (Dollars in thousands) | (Dollars in thousands) |
| Nonperforming assets beginning balance | $ | 50,250 |
| | $ | 61,580 |
| $ | 48,071 |
| | $ | 58,456 |
| | $ | 50,250 |
| | $ | 61,580 |
|
| New to nonperforming | 2,001 |
| | 3,948 |
| 3,642 |
| | 3,619 |
| | 5,643 |
| | 7,567 |
|
| Loans charged-off | (594 | ) | | (508 | ) | (568 | ) | | (4,198 | ) | | (1,162 | ) | | (4,706 | ) |
| Loans paid-off | (2,692 | ) | | (4,745 | ) | (2,209 | ) | | (1,124 | ) | | (4,901 | ) | | (5,869 | ) |
| Loans transferred to other real estate owned and foreclosed assets | — |
| | (457 | ) | — |
| | — |
| | — |
| | (457 | ) |
| Loans restored to performing status | (690 | ) | | (629 | ) | (1,490 | ) | | (1,642 | ) | | (2,180 | ) | | (2,271 | ) |
| New to other real estate owned | — |
| | 457 |
| — |
| | — |
| | — |
| | 457 |
|
| Valuation write down | | — |
| | (95 | ) | | — |
| | (95 | ) |
| Sale of other real estate owned | (254 | ) | | (1,226 | ) | — |
| | (279 | ) | | (254 | ) | | (1,505 | ) |
| Other | 50 |
| | 36 |
| (89 | ) | | 75 |
| | (39 | ) | | 111 |
|
| Nonperforming assets ending balance | $ | 48,071 |
| | $ | 58,456 |
| $ | 47,357 |
| | $ | 54,812 |
| | $ | 47,357 |
| | $ | 54,812 |
|
The following table sets forth information regarding troubled debt restructured loans as of the dates indicated:
Table 5 - Troubled Debt Restructurings
| | | | March 31,
2018 | | December 31,
2017 | | March 31,
2017 | June 30,
2018 | | December 31,
2017 | | June 30,
2017 |
| | (Dollars in thousands) | (Dollars in thousands) |
| Performing troubled debt restructurings | $ | 25,617 |
| | $ | 25,852 |
| | $ | 25,575 |
| $ | 25,528 |
| | $ | 25,852 |
| | $ | 26,908 |
|
| Nonaccrual troubled debt restructurings | 5,637 |
| | 6,067 |
| | 5,439 |
| 4,095 |
| | 6,067 |
| | 5,728 |
|
| Total | $ | 31,254 |
| | $ | 31,919 |
| | $ | 31,014 |
| $ | 29,623 |
| | $ | 31,919 |
| | $ | 32,636 |
|
| Performing troubled debt restructurings as a % of total loans | 0.40 | % | | 0.41 | % | | 0.42 | % | 0.39 | % | | 0.41 | % | | 0.43 | % |
| Nonaccrual troubled debt restructurings as a % of total loans | 0.09 | % | | 0.10 | % | | 0.09 | % | 0.06 | % | | 0.10 | % | | 0.09 | % |
| Total troubled debt restructurings as a % of total loans | 0.49 | % | | 0.50 | % | | 0.51 | % | 0.46 | % | | 0.50 | % | | 0.52 | % |
The following table summarizes changes in TDRs for the periods indicated:
Table 6 - Activity in Troubled Debt Restructurings
| | | | Three Months Ended | Three Months Ended | | Six Months Ended |
| | March 31
2018 | | March 31
2017 | June 30
2018 | | June 30
2017 | | June 30
2018 | | June 30
2017 |
| | (Dollars in thousands) | (Dollars in thousands) |
| TDRs beginning balance | $ | 31,919 |
| | $ | 32,292 |
| $ | 31,254 |
| | $ | 31,014 |
| | $ | 31,919 |
| | $ | 32,292 |
|
| New to TDR status | 235 |
| | 231 |
| 378 |
| | 2,976 |
| | 613 |
| | 3,207 |
|
| Transfer to OREO | — |
| | (215 | ) | — |
| | — |
| | — |
| | (215 | ) |
| Paydowns | (845 | ) | | (1,277 | ) | (1,815 | ) | | (1,352 | ) | | (2,660 | ) | | (2,629 | ) |
| Charge-offs | (55 | ) | | (17 | ) | (194 | ) | | (2 | ) | | (249 | ) | | (19 | ) |
| TDRs ending balance | $ | 31,254 |
| | $ | 31,014 |
| $ | 29,623 |
| | $ | 32,636 |
| | $ | 29,623 |
| | $ | 32,636 |
|
Income accruals are suspended on all nonaccrual loans and all previously accrued and uncollected interest is reversed against current income. The table below shows interest income that was recognized or collected on all nonaccrual loans and TDRs as of the dates indicated:
Table 7 - Interest Income - Nonaccrual Loans and Troubled Debt Restructurings
| | | | Three Months Ended | Three Months Ended | | Six Months Ended |
| | 2018 | | 2017 | 2018 | | 2017 | | 2018 | | 2017 |
| | (Dollars in thousands) | (Dollars in thousands) |
| The amount of incremental gross interest income that would have been recorded if nonaccrual loans had been current in accordance with their original terms | $ | 636 |
| | $ | 571 |
| $ | 632 |
| | $ | 481 |
| | $ | 1,268 |
| | $ | 1,031 |
|
| The amount of interest income on nonaccrual loans and performing TDRs that was included in net income | $ | 500 |
| | $ | 523 |
| $ | 544 |
| | $ | 395 |
| | $ | 928 |
| | $ | 764 |
|
A loan is considered impaired when, based on current information and events, it is probable that the Bank will be unable to collect the scheduled payments of principal or interest when due according to the contractual terms of the loan agreement. Factors considered by management in determining impairment include payment status, collateral value, and the probability of collecting scheduled principal and interest payments when due. Loans that experience insignificant payment delays and payment shortfalls generally are not classified as impaired. Management determines the significance of payment delays and payment
shortfalls on a case-by-case basis, taking into consideration all of the circumstances surrounding the loan and the borrower,
including the length of the delay, the reasons for the delay, the borrower's prior payment record, and the amount of the shortfall in relation to the principal and interest owed.
Impaired loans include all commercial and industrial loans, commercial real estate loans, commercial construction and small business loans that are on nonaccrual status, TDRs, and other loans that have been categorized as impaired. Impairment is measured on a loan by loan basis by comparing the loan’s value to either the present value of expected future cash flows discounted at the loan's effective interest rate, the loan's obtainable market price, or the fair value of the collateral if the loan is collateral dependent. For impaired loans deemed collateral dependent, where impairment is measured using the fair value of the collateral, the Bank will either order a new appraisal or use another available source of collateral assessment such as a broker’s opinion of value to determine a reasonable estimate of the fair value of the collateral.
Total impaired loans at March 31,June 30, 2018 and December 31, 2017 were $70.9$68.1 million and $72.8 million, respectively. For additional information regarding the Company’s asset quality, including delinquent loans, nonaccruals, TDRs, and impaired loans, see Note 4, “Loans, Allowance for Loan Losses, and Credit Quality” within Condensed Notes to Consolidated Financial Statements included in Item 1 hereof.
Potential problem loans are any loans which are not included in nonaccrual or nonperforming loans, where known information about possible credit problems of the borrowers causes management to have concerns as to the ability of such borrowers to comply with present loan repayment terms. At March 31,June 30, 2018, there were 5748 relationships, with an aggregate balance of $78.9$52.7 million, deemed to be potential problem loans. These potential problem loans continued to perform with respect to payments. Management actively monitors these loans and strives to minimize any possible adverse impact to the Company.
Allowance for Loan Losses The allowance for loan losses is maintained at a level that management considers appropriate to provide for probable loan losses based upon evaluation of known and inherent risks in the loan portfolio. The allowance is increased by providing for loan losses through a charge to expense and by credits for recoveries of loans previously charged-off and is reduced by loans being charged-off.
While management uses available information to recognize losses on loans, future additions to the allowance may be necessary based on increases in nonperforming loans, changes in economic conditions, or for other reasons. Additionally, various regulatory agencies, as an integral part of the Bank's examination process, periodically assess the adequacy of the allowance for loan losses to access whether the allowance was determined in accordance with GAAP and applicable guidance.
The allowance for loan losses is allocated to loan types using both a formula-based approach applied to groups of loans and an analysis of certain individual loans for impairment. The formula-based approach emphasizes loss factors derived from actual historical portfolio loss rates, which are combined with an assessment of certain qualitative factors to determine the allowance amounts allocated to the various loan categories. Allowance amounts are determined based on an estimate of the historical average annual percentage rate of loan loss for each loan category, an estimate of the incurred loss emergence and confirmation period for each loan category, and certain qualitative risk factors considered in the computation of the allowance for loan losses. Additionally, the Company reviews numerous credit quality indicators when assessing the risk in its loan portfolio. For the commercial portfolio, the Company utilizes a 10-point commercial risk-rating system, which assigns a risk-grade to each borrower based on a number of quantitative and qualitative factors associated with a commercial loan transaction. Factors considered include industry and market conditions, position within the industry, earnings trends, operating cash flow, asset/liability values, debt capacity, guarantor strength, management and controls, financial reporting, collateral and other considerations.
As of March 31,June 30, 2018, the allowance for loan losses totaled $60.9$62.6 million, or 0.96%0.97% of total loans, as compared to $60.6 million, or 0.95% of total loans, at December 31, 2017.
The following table summarizes changes in the allowance for loan losses and other selected statistics for the periods presented:
Table 8 - Summary of Changes in the Allowance for Loan Losses
| | | | Three Months Ended | Three Months Ended |
| | March 31,
2018 | | December 31,
2017 | | September 30,
2017 | | June 30,
2017 | | March 31,
2017 | June 30,
2018 | | March 31,
2018 | | December 31,
2017 | | September 30,
2017 | | June 30,
2017 |
| | (Dollars in thousands) | (Dollars in thousands) |
| Average total loans | $ | 6,334,295 |
| | $ | 6,308,374 |
| | $ | 6,275,200 |
| | $ | 6,158,997 |
| | $ | 6,017,713 |
| $ | 6,432,287 |
| | $ | 6,334,295 |
| | $ | 6,308,374 |
| | $ | 6,275,200 |
| | $ | 6,158,997 |
|
| Allowance for loan losses, beginning of period | $ | 60,643 |
| | $ | 59,710 |
| | $ | 59,479 |
| | $ | 62,318 |
| | $ | 61,566 |
| $ | 60,862 |
| | $ | 60,643 |
| | $ | 59,710 |
| | $ | 59,479 |
| | $ | 62,318 |
|
| Charged-off loans | | | | | | | | | | | | | | | | | | |
| Commercial and industrial | 133 |
| | 176 |
| | 124 |
| | 3,591 |
| | — |
| 4 |
| | 133 |
| | 176 |
| | 124 |
| | 3,591 |
|
| Commercial real estate | — |
| | 39 |
| | — |
| | — |
| | — |
| — |
| | — |
| | 39 |
| | — |
| | — |
|
| Small business | 24 |
| | 44 |
| | 164 |
| | 24 |
| | 70 |
| 102 |
| | 24 |
| | 44 |
| | 164 |
| | 24 |
|
| Residential real estate | 39 |
| | 25 |
| | 43 |
| | 116 |
| | 23 |
| 109 |
| | 39 |
| | 25 |
| | 43 |
| | 116 |
|
| Home equity | 79 |
| | 59 |
| | 81 |
| | 122 |
| | 14 |
| 95 |
| | 79 |
| | 59 |
| | 81 |
| | 122 |
|
| Other consumer | 318 |
| | 343 |
| | 405 |
| | 345 |
| | 401 |
| 259 |
| | 318 |
| | 343 |
| | 405 |
| | 345 |
|
| Total charged-off loans | 593 |
| | 686 |
| | 817 |
| | 4,198 |
| | 508 |
| 569 |
| | 593 |
| | 686 |
| | 817 |
| | 4,198 |
|
| Recoveries on loans previously charged-off | | | | | | | | | | | | | | | | | | |
| Commercial and industrial | 12 |
| | 11 |
| | 404 |
| | 13 |
| | 187 |
| 59 |
| | 12 |
| | 11 |
| | 404 |
| | 13 |
|
| Commercial real estate | 20 |
| | 42 |
| | 286 |
| | 26 |
| | 31 |
| 18 |
| | 20 |
| | 42 |
| | 286 |
| | 26 |
|
| Small business | 9 |
| | 18 |
| | 17 |
| | 13 |
| | 66 |
| 10 |
| | 9 |
| | 18 |
| | 17 |
| | 13 |
|
| Residential real estate | 2 |
| | 2 |
| | 15 |
| | 2 |
| | 12 |
| 1 |
| | 2 |
| | 2 |
| | 15 |
| | 2 |
|
| Home equity | 34 |
| | 31 |
| | 65 |
| | 26 |
| | 76 |
| 23 |
| | 34 |
| | 31 |
| | 65 |
| | 26 |
|
| Other consumer | 235 |
| | 215 |
| | 261 |
| | 229 |
| | 288 |
| 153 |
| | 235 |
| | 215 |
| | 261 |
| | 229 |
|
| Total recoveries | 312 |
| | 319 |
| | 1,048 |
| | 309 |
| | 660 |
| 264 |
| | 312 |
| | 319 |
| | 1,048 |
| | 309 |
|
| Net loans charged-off (recovered) | | | | | | | | | | | | | | | | | | |
| Commercial and industrial | 121 |
| | 165 |
| | (280 | ) | | 3,578 |
| | (187 | ) | (55 | ) | | 121 |
| | 165 |
| | (280 | ) | | 3,578 |
|
| Commercial real estate | (20 | ) | | (3 | ) | | (286 | ) | | (26 | ) | | (31 | ) | (18 | ) | | (20 | ) | | (3 | ) | | (286 | ) | | (26 | ) |
| Small business | 15 |
| | 26 |
| | 147 |
| | 11 |
| | 4 |
| 92 |
| | 15 |
| | 26 |
| | 147 |
| | 11 |
|
| Residential real estate | 37 |
| | 23 |
| | 28 |
| | 114 |
| | 11 |
| 108 |
| | 37 |
| | 23 |
| | 28 |
| | 114 |
|
| Home equity | 45 |
| | 28 |
| | 16 |
| | 96 |
| | (62 | ) | 72 |
| | 45 |
| | 28 |
| | 16 |
| | 96 |
|
| Other consumer | 83 |
| | 128 |
| | 144 |
| | 116 |
| | 113 |
| 106 |
| | 83 |
| | 128 |
| | 144 |
| | 116 |
|
| Total net loans charged-off (recovered) | 281 |
| | 367 |
| | (231 | ) | | 3,889 |
| | (152 | ) | 305 |
| | 281 |
| | 367 |
| | (231 | ) | | 3,889 |
|
| Provision for loan losses | 500 |
| | 1,300 |
| | — |
| | 1,050 |
| | 600 |
| 2,000 |
| | 500 |
| | 1,300 |
| | — |
| | 1,050 |
|
| Total allowance for loan losses, end of period | $ | 60,862 |
| | $ | 60,643 |
| | $ | 59,710 |
| | $ | 59,479 |
| | $ | 62,318 |
| $ | 62,557 |
| | $ | 60,862 |
| | $ | 60,643 |
| | $ | 59,710 |
| | $ | 59,479 |
|
| Net loans charged-off (recovered) as a percent of average total loans (annualized) | 0.02 | % | | 0.02 | % | | (0.01 | )% | | 0.25 | % | | (0.01 | )% | 0.02 | % | | 0.02 | % | | 0.02 | % | | (0.01 | )% | | 0.25 | % |
| Allowance for loan losses as a percent of total loans | 0.96 | % | | 0.95 | % | | 0.95 | % | | 0.95 | % | | 1.03 | % | 0.97 | % | | 0.96 | % | | 0.95 | % | | 0.95 | % | | 0.95 | % |
| Allowance for loan losses as a percent of nonperforming loans | 127.56 | % | | 122.17 | % | | 118.76 | % | | 114.86 | % | | 113.20 | % | 132.78 | % | | 127.56 | % | | 122.17 | % | | 118.76 | % | | 114.86 | % |
For purposes of the allowance for loan losses, management segregates the loan portfolio into the portfolio segments detailed in the table below. The allocation of the allowance for loan losses is made to each loan category using the analytical techniques and estimation methods described herein. While these amounts represent management’s best estimate of the distribution of probable losses at the evaluation dates, they are not necessarily indicative of either the categories in which actual losses may occur or the extent of such actual losses that may be recognized within each category. Each of these loan categories possess unique risk
characteristics that are considered when determining the appropriate level of allowance for each segment. The total allowance is available to absorb losses from any segment of the loan portfolio.
The following table sets forth the allocation of the allowance for loan losses by loan category at the dates indicated:
Table 9 - Summary of Allocation of Allowance for Loan Losses
| | | | March 31,
2018 | | December 31,
2017 | June 30,
2018 | | December 31,
2017 |
| | Allowance Amount | | Percent of Loans In Category To Total Loans | | Allowance Amount | | Percent of Loans In Category To Total Loans | Allowance Amount | | Percent of Loans In Category To Total Loans | | Allowance Amount | | Percent of Loans In Category To Total Loans |
| | (Dollars in thousands) | (Dollars in thousands) |
| Commercial and industrial | $ | 13,533 |
| | 14.2 | % | | $ | 13,256 |
| | 14.0 | % | $ | 14,788 |
| | 15.1 | % | | $ | 13,256 |
| | 14.0 | % |
| Commercial real estate | 31,459 |
| | 48.8 | % | | 31,453 |
| | 48.9 | % | 32,095 |
| | 48.3 | % | | 31,453 |
| | 48.9 | % |
| Commercial construction | 5,679 |
| | 6.3 | % | | 5,698 |
| | 6.3 | % | 5,216 |
| | 5.6 | % | | 5,698 |
| | 6.3 | % |
| Small business | 1,593 |
| | 2.1 | % | | 1,577 |
| | 2.1 | % | 1,709 |
| | 2.3 | % | | 1,577 |
| | 2.1 | % |
| Residential real estate | 2,837 |
| | 12.0 | % | | 2,822 |
| | 11.9 | % | 2,909 |
| | 12.0 | % | | 2,822 |
| | 11.9 | % |
| Home equity | 5,359 |
| | 16.5 | % | | 5,390 |
| | 16.6 | % | 5,468 |
| | 16.5 | % | | 5,390 |
| | 16.6 | % |
| Other consumer | 402 |
| | 0.1 | % | | 447 |
| | 0.2 | % | 372 |
| | 0.2 | % | | 447 |
| | 0.2 | % |
| Total allowance for loan losses | $ | 60,862 |
| | 100.0 | % | | $ | 60,643 |
| | 100.0 | % | $ | 62,557 |
| | 100.0 | % | | $ | 60,643 |
| | 100.0 | % |
To determine if a loan should be charged-off, all possible sources of repayment are analyzed. Possible sources of repayment include the potential for future cash flows, the value of the Bank’s collateral, and the strength of co-makers or guarantors. When available information confirms that specific loans or portions thereof are uncollectible, these amounts are promptly charged-off against the allowance for loan losses and any recoveries of such previously charged-off amounts are credited to the allowance.
Regardless of whether a loan is unsecured or collateralized, the Company charges off the amount of any confirmed loan loss in the period when the loans, or portions of loans, are deemed uncollectible. For troubled, collateral-dependent loans, loss-confirming events may include an appraisal or other valuation that reflects a shortfall between the value of the collateral and the carrying value of the loan or receivable, or a deficiency balance following the sale of the collateral.
For additional information regarding the Company’s allowance for loan losses, see Note 4, “Loans, Allowance for Loan Losses, and Credit Quality” within Condensed Notes to Consolidated Financial Statements included in Item 1 hereof.
Federal Home Loan Bank Stock The Bank held an investment in Federal Home Loan Bank (“FHLB”) of Boston of $13.0$13.1 million and $11.6 million at March 31,June 30, 2018 and December 31, 2017, respectively. The FHLB is a cooperative that provides services to its member banking institutions. The primary reason for the FHLB of Boston membership is to gain access to a reliable source of wholesale funding, particularly term funding, as a tool to manage interest rate risk. The purchase of stock in the FHLB is a requirement for a member to gain access to funding. The Company purchases and/or is subject to redemption of FHLB stock proportional to the volume of funding received and views the holdings as a necessary long-term investment for the purposes of balance sheet liquidity and not for investment return.
Goodwill and Other Intangible Assets Goodwill and other intangible assets were $240.3$239.7 million and $241.1 million as of March 31,June 30, 2018 and December 31, 2017, respectively. The decrease in 2018 was due to amortization of definite-lived intangibles.
The Company typically performs its annual goodwill impairment testing during the third quarter of the year, unless certain indicators suggest earlier testing to be warranted. The Company performed its annual goodwill impairment testing during the third quarter of 2017 and determined that the Company's goodwill was not impaired. Other intangible assets are reviewed for impairment whenever events or changes in circumstances indicate that the carrying amount of the assets may not be recoverable. There were no events or changes that indicated impairment of other intangible assets.
Cash Surrender Value of Life Insurance Policies The Bank holds life insurance policies for the purpose of offsetting its future obligations to its employees under its retirement and benefits plans. The cash surrender value of life insurance policies was $152.6$153.6 million and $151.5 million at March 31,June 30, 2018 and December 31, 2017, respectively. The Company recorded tax exempt income from the life insurance policies of $947,000$998,000 and $964,000$1.0 million for the three months ended March 31,June 30, 2018 and 2017, respectively, and $1.9 million and $2.0 million for the six month periods ended June 30, 2018 and 2017, respectively.
Deposits As of March 31,June 30, 2018, total deposits were $6.8$7.0 billion, representing a $22.3$284.2 million, or 0.3%4.2%, increase from December 31, 2017. The Company experienced growth was primarily attributable to increases in bothall categories with a continued emphasis on core deposits, and time deposits. Core deposits as a percentagewhich represent 90.35% of total deposits remained consistent at 90.1% as of March 31,June 30, 2018. The total cost of deposits was 0.24%0.27% and 0.18% for the first quarter ofthree months ended June 30, 2018 representing an increase fromand 2017, respectively, and 0.25% and 0.18%, for the year ago period of six basis points.months ended June 30, 2018 and 2017, respectively.
The BankCompany also participates in the Promontory Interfinancial Network, allowing the Bank to provide easy access to multi-million dollar Federal Deposit Insurance Corporation ("FDIC") deposit insurance protection on certificate of deposit and money market investments for consumers, businesses and public entities. In addition, the Company may occasionally raise funds through brokered certificates of deposit. This channel allows the Company to seek additional funding in potentially large quantities by attracting deposits from outside the Bank’s core market. At March 31,market and amounted to $51.9 million and $48.5 million, at June 30, 2018 and December 31, 2017, respectively. During the Company had brokeredsecond quarter of 2018, the Economic Growth, Regulatory Relief, and Consumer Protection Act was promulgated and determined that reciprocal deposits, of $52.1 million and $54.5 million, respectively, primarily consisting of deposits associated withsuch as those acquired through the Promontory Interfinancial Network.Network, were no longer to be treated as brokered deposits. Accordingly, these amounts are no longer included in the total brokered amounts reported by the Company.
In addition, the Company may occasionally raise funds through the use of brokered deposits outside of the Promontory network, which which amounted to $6.0 million at both June 30, 2018 and December 31, 2017.
Borrowings The Company’s borrowings consist of both short-term and long-term borrowings and provide the Bank with one of its primary sources of funding. Maintaining available borrowing capacity provides the Bank with a contingent source of liquidity.
The Company’s borrowings, net of applicable debt issuance costs, consisted of the following as of the periods indicated:
Table 10 - Borrowings
| | | | March 31,
2018 | | December 31,
2017 | June 30,
2018 | | December 31,
2017 |
| | (Dollars in thousands) | (Dollars in thousands) |
| Federal Home Loan Bank borrowings | $ | 53,257 |
| | $ | 53,264 |
| $ | 50,775 |
| | $ | 53,264 |
|
| Short-term borrowings - one year and under (1) | | | | | | |
| Customer repurchase agreements | 137,914 |
| | 162,679 |
| 142,235 |
| | 162,679 |
|
| Long-term borrowings - over one year (1) | | | | | | |
| Junior subordinated debentures: | | | | | | |
| Capital Trust V | 51,503 |
| | 51,503 |
| 51,504 |
| | 51,503 |
|
| Slades Ferry Trust I | 10,230 |
| | 10,229 |
| 10,232 |
| | 10,229 |
|
| Central Trust I | 5,258 |
| | 5,258 |
| 5,258 |
| | 5,258 |
|
| Central Trust II | 6,084 |
| | 6,083 |
| 6,083 |
| | 6,083 |
|
| Subordinated debentures | 34,693 |
| | 34,682 |
| 34,705 |
| | 34,682 |
|
| Total long-term borrowings | $ | 107,768 |
| | $ | 107,755 |
| $ | 107,782 |
| | $ | 107,755 |
|
| Total borrowings | $ | 298,939 |
| | $ | 323,698 |
| $ | 300,792 |
| | $ | 323,698 |
|
(1) Classification is based upon duration at origination and not predicated upon remaining time to maturity.
The Bank had $2.9 billion of assets pledged as collateral against borrowings as of March 31,June 30, 2018 and December 31, 2017, respectively. These assets are primarily pledged to the FHLB of Boston and the Federal Reserve Bank of Boston. Assets are also pledged as collateral for customer repurchase agreements.
Capital Resources On March 15,June 21, 2018, the Company’s Board of Directors declared a cash dividend of $0.38 per share to stockholders of record as of the close of business on March 26,July 2, 2018. This dividend was paid on April 6,July 10, 2018.
The Company and the Bank are subject to various regulatory capital requirements administered by the federal banking agencies. Failure to meet minimum capital requirements can initiate certain mandatory and possibly additional discretionary actions by regulators that, if undertaken, could have a direct material effect on the Company’s financial statements. Under capital adequacy guidelines and the regulatory framework for prompt corrective action, the Company and the Bank must meet specific capital guidelines that involve quantitative measures of the Company’s and the Bank’s assets, liabilities and certain off-balance sheet items as calculated under regulatory accounting practices. The capital amounts and classification are also subject to qualitative judgments by the regulators about components, risk weightings and other factors.
Quantitative measures established by regulation to ensure capital adequacy require the Company and the Bank to maintain minimum amounts and ratios (set forth in the table below) of Total, Tier 1 Capital and Common Equity Tier 1 Capital (as defined for regulatory purposes) to risk weighted assets (as defined for regulatory purposes) and Tier 1 Capital to average assets (as defined for regulatory purposes). At March 31,June 30, 2018 and December 31, 2017, the Company and the Bank exceeded the minimum requirements for all applicable ratios that were in effect during the respective periods. The Company’s and the Bank’s capital amounts and ratios are presented in the following table, along with the applicable minimum requirements for each period indicated:
Table 11 - Company and Bank's Capital Amounts and Ratios
| | | | Actual | | For Capital Adequacy Purposes | | To Be Well Capitalized Under Prompt
Corrective Action Provisions | Actual | | For Capital Adequacy Purposes | | To Be Well Capitalized Under Prompt
Corrective Action Provisions |
| | Amount | | Ratio | | Amount | | | | Ratio | | Amount | | | | Ratio | Amount | | Ratio | | Amount | | | | Ratio | | Amount | | | | Ratio |
| | March 31, 2018 | June 30, 2018 |
| | (Dollars in thousands) | (Dollars in thousands) |
| Company (consolidated) | | | | | | | | | | | | | | | | | | | | | | |
| Total capital (to risk weighted assets) | $ | 904,691 |
| | 14.08 | % | | $ | 513,998 |
| | ≥ | | 8.0 | % | | N/A | | N/A | $ | 929,728 |
| | 14.24 | % | | $ | 522,274 |
| | ≥ | | 8.0 | % | | N/A | | N/A |
Common equity tier 1 capital (to risk weighted assets) | 736,859 |
| | 11.47 | % | | 289,124 |
| | ≥ | | 4.5 | % | | N/A | | N/A | 760,189 |
| | 11.64 | % | | 293,779 |
| | ≥ | | 4.5 | % | | N/A | | N/A |
| Tier 1 capital (to risk weighted assets) | 807,859 |
| | 12.57 | % | | 385,498 |
| | ≥ | | 6.0 | % | | N/A | | N/A | 831,189 |
| | 12.73 | % | | 391,706 |
| | ≥ | | 6.0 | % | | N/A | | N/A |
| Tier 1 capital (to average assets) | 807,859 |
| | 10.32 | % | | 313,181 |
| | ≥ | | 4.0 | % | | N/A | | N/A | 831,189 |
| | 10.39 | % | | 320,139 |
| | ≥ | | 4.0 | % | | N/A | | N/A |
| Bank | | | | | | | | | | | | | | | | | | | | | | |
| Total capital (to risk weighted assets) | $ | 862,886 |
| | 13.44 | % | | $ | 513,784 |
| | ≥ | | 8.0 | % | | $ | 642,230 |
| | ≥ | | 10.00 | % | $ | 882,616 |
| | 13.52 | % | | $ | 522,130 |
| | ≥ | | 8.0 | % | | $ | 652,663 |
| | ≥ | | 10.00 | % |
Common equity tier 1 capital (to risk weighted assets) | 800,748 |
| | 12.47 | % | | 289,003 |
| | ≥ | | 4.5 | % | | 417,449 |
| | ≥ | | 6.50 | % | 818,782 |
| | 12.55 | % | | 293,698 |
| | ≥ | | 4.5 | % | | 424,231 |
| | ≥ | | 6.50 | % |
| Tier 1 capital (to risk weighted assets) | 800,748 |
| | 12.47 | % | | 385,338 |
| | ≥ | | 6.0 | % | | 513,784 |
| | ≥ | | 8.00 | % | 818,782 |
| | 12.55 | % | | 391,598 |
| | ≥ | | 6.0 | % | | 522,130 |
| | ≥ | | 8.00 | % |
| Tier 1 capital (to average assets) | 800,748 |
| | 10.23 | % | | 313,062 |
| | ≥ | | 4.0 | % | | 391,328 |
| | ≥ | | 5.00 | % | 818,782 |
| | 10.23 | % | | 320,025 |
| | ≥ | | 4.0 | % | | 400,031 |
| | ≥ | | 5.00 | % |
| | December 31, 2017 | December 31, 2017 |
| | (Dollars in thousands) | (Dollars in thousands) |
| Company (consolidated) | | | | | | | | | | | | | | | | | | | | | | |
| Total capital (to risk weighted assets) | $ | 886,807 |
| | 13.82 | % | | $ | 513,398 |
| | ≥ | | 8.0 | % | | N/A | | N/A | $ | 886,807 |
| | 13.82 | % | | $ | 513,398 |
| | ≥ | | 8.0 | % | | N/A | | N/A |
Common equity tier 1 capital (to risk weighted assets) | 718,995 |
| | 11.20 | % | | 288,787 |
| | ≥ | | 4.5 | % | | N/A | | N/A | 718,995 |
| | 11.20 | % | | 288,787 |
| | ≥ | | 4.5 | % | | N/A | | N/A |
| Tier 1 capital (to risk weighted assets) | 789,992 |
| | 12.31 | % | | 385,049 |
| | ≥ | | 6.0 | % | | N/A | | N/A | 789,992 |
| | 12.31 | % | | 385,049 |
| | ≥ | | 6.0 | % | | N/A | | N/A |
| Tier 1 capital (to average assets) | 789,992 |
| | 10.04 | % | | 314,756 |
| | ≥ | | 4.0 | % | | N/A | | N/A | 789,992 |
| | 10.04 | % | | 314,756 |
| | ≥ | | 4.0 | % | | N/A | | N/A |
| Bank | | | | | | | | | | | | | | | | | | | | | | |
| Total capital (to risk weighted assets) | $ | 846,147 |
| | 13.19 | % | | $ | 513,175 |
| | ≥ | | 8.0 | % | | $ | 641,469 |
| | ≥ | | 10.00 | % | $ | 846,147 |
| | 13.19 | % | | $ | 513,175 |
| | ≥ | | 8.0 | % | | $ | 641,469 |
| | ≥ | | 10.00 | % |
Common equity tier 1 capital (to risk weighted assets) | 784,014 |
| | 12.22 | % | | 288,661 |
| | ≥ | | 4.5 | % | | 416,955 |
| | ≥ | | 6.50 | % | 784,014 |
| | 12.22 | % | | 288,661 |
| | ≥ | | 4.5 | % | | 416,955 |
| | ≥ | | 6.50 | % |
| Tier 1 capital (to risk weighted assets) | 784,014 |
| | 12.22 | % | | 384,881 |
| | ≥ | | 6.0 | % | | 513,175 |
| | ≥ | | 8.00 | % | 784,014 |
| | 12.22 | % | | 384,881 |
| | ≥ | | 6.0 | % | | 513,175 |
| | ≥ | | 8.00 | % |
| Tier 1 capital (to average assets) | 784,014 |
| | 9.97 | % | | 314,630 |
| | ≥ | | 4.0 | % | | 393,288 |
| | ≥ | | 5.00 | % | 784,014 |
| | 9.97 | % | | 314,630 |
| | ≥ | | 4.0 | % | | 393,288 |
| | ≥ | | 5.00 | % |
In addition to the minimum risk-based capital requirements outlined in the table above, the Company is required to maintain a minimum capital conservation buffer, in the form of common equity, in order to avoid restrictions on capital distributions and discretionary bonuses. The required amount of the capital conservation buffer is being phased-in, beginning at 0.625% on January 1, 2016 and ultimately increasing to 2.5% on January 1, 2019. At March 31,June 30, 2018 the Company's capital levels exceeded the fully-phased in buffer of 2.5%.
Dividend Restrictions In the ordinary course of business, the Company is dependent upon dividends from the Bank to provide funds for the payment of dividends to shareholders and to provide for other cash requirements. Banking regulations may limit the amount of dividends that may be paid. Approval by regulatory authorities is required if the effect of dividends declared would cause the regulatory capital of the Bank to fall below specified minimum levels. Approval is also required if dividends declared exceed the net profits for that year combined with the retained net profits for the preceding two years. Under the foregoing dividend restrictions and while maintaining its "well capitalized" status, dividends paid by the Bank to the Company totaled $13.5$15.5 million and $11.7 million for the three months ended March 31,June 30, 2018 and 2017, respectively, and totaled $28.9 million and $23.4 million for the six months ended June 30, 2018 and 2017, respectively.
Trust Preferred Securities In accordance with the applicable accounting standard related to variable interest entities, the common stock of trusts which have issued trust preferred securities have not been included in the consolidated financial statements of the Company. At both March 31,June 30, 2018 and 2017, $71.0 million in trust preferred securities have been included in the Tier 1 capital of the Company for regulatory reporting purposes pursuant to the Federal Reserve's capital adequacy guidelines.
Community Reinvestment Act In September 2017, the FDIC and the Massachusetts Division of Banks assigned the Bank a CRA rating of Satisfactory.
Investment Management As of March 31,June 30, 2018, the Rockland Trust Investment Management Group had assets under administration of $3.5$3.6 billion, representing 5,6485,693 trust, fiduciary, and agency accounts. At December 31, 2017, assets under administration were $3.5 billion, representing approximately 5,616 trust, fiduciary, and agency accounts. Included in these amounts as of March 31,June 30, 2018 and December 31, 2017 are assets under administration of $292.1$293.2 million and $303.7 million, respectively, relating to the Company’s registered investment advisor, Bright Rock Capital Management, LLC, which provides investment management services to institutional and high net worth clients. Revenue from the Investment Management Group was $5.6$6.1 million and $5.1$5.5 million for the three months ended March 31,June 30, 2018 and 2017, respectively, and $11.7 million and $10.6 million for the six months ended June 30, 2018 and 2017, respectively.
Retail investments and insurance revenue was $560,000$739,000 and $477,000$507,000 for the three months ended March 31,June 30, 2018 and 2017, respectively, and $1.3 million and $1.0 million for the six months ended June 30, 2018 and 2017, respectively. Retail investments and insurance revenue includes commission revenue from LPL Financial (“LPL”) and its affiliates and their insurance subsidiary, LPL Insurance Associates, Inc., which offers the sale of mutual fund shares, unit investment trust shares, general securities, fixed and variable annuities and life insurance. Registered representatives who are both employed by the Bank and licensed and contracted with LPL are onsite to offer these products to the Bank’s customer base. These same agents are also approved and appointed with various other Broker General Agents for the purposes of processing insurance solutions for clients.
RESULTS OF OPERATIONS
The following table provides a summary of results of operations for the three and six months ended March 31,June 30, 2018 and 2017:
Table 12 - Summary of Results of Operations
| | | | Three Months Ended March 31 | Three Months Ended June 30 | | Six Months Ended June 30 |
| | 2018 | | 2017 | 2018 | | 2017 | | 2018 | | 2017 |
| | (Dollars in thousands, except per share data) | (Dollars in thousands, except per share data) |
| Net Income | $ | 27,555 |
| | $ | 20,725 |
| $ | 31,118 |
| | $ | 20,563 |
| | $ | 58,673 |
| | $ | 41,288 |
|
| Diluted earnings per share | $ | 1.00 |
| | $ | 0.76 |
| $ | 1.13 |
| | $ | 0.75 |
| | $ | 2.13 |
| | $ | 1.52 |
|
| Return on average assets | 1.39 | % | | 1.10 | % | 1.52 | % | | 1.06 | % | | 1.46 | % | | 1.08 | % |
| Return on average equity | 11.73 | % | | 9.59 | % | 12.85 | % | | 9.15 | % | | 12.30 | % | | 9.36 | % |
| Net interest margin | 3.77 | % | | 3.51 | % | 3.89 | % | | 3.60 | % | | 3.83 | % | | 3.56 | % |
Net Interest Income The amount of net interest income is affected by changes in interest rates and by the volume, mix, and interest rate sensitivity of interest-earning assets and interest-bearing liabilities.
On a fully tax equivalent basis ("FTE"), net interest income for the firstsecond quarter of 2018 was $68.6$73.3 million, representing an increase of $8.1$9.2 million, or 13.3%14.4%, when compared to the firstsecond quarter of 2017. Net interest income benefited from the Company's sustained asset sensitive position, along with the reinvestment of excess liquidity.position.
The following tables present the Company’s average balances, net interest income, interest rate spread, and net interest margin for the three and six months ending March 31,June 30, 2018 and 2017, respectively. Nontaxable income from loans and securities is presented on a FTE basis by adjusting tax-exempt income upward by an amount equivalent to the prevailing income taxes that would have been paid if the income had been fully taxable.
Table 13 - Average Balance, Interest Earned/Paid & Average Yields Quarter-to-Date
| | | | Three Months Ended March 31 | Three Months Ended June 30 |
| | 2018 | | 2017 | 2018 | | 2017 |
| | Average Balance | | Interest Earned/ Paid | | Yield/Rate | | Average Balance | | Interest Earned/ Paid | | Yield/Rate | Average Balance | | Interest Earned/ Paid | | Yield/Rate | | Average Balance | | Interest Earned/ Paid | | Yield/Rate |
| | (Dollars in thousands) | (Dollars in thousands) |
| Interest-earning assets | | | | | | | | | | | | | | | | | | | | | | |
| Interest-earning deposits with banks, federal funds sold, and short term investments | $ | 81,934 |
| | $ | 311 |
| | 1.54 | % | | $ | 105,007 |
| | $ | 207 |
| | 0.80 | % | $ | 122,116 |
| | $ | 541 |
| | 1.78 | % | | $ | 72,676 |
| | $ | 190 |
| | 1.05 | % |
| Securities | | | | | | | | | | | | | | | | | | | | | | |
| Securities - trading | 1,433 |
| | — |
| | — | % | | 999 |
| | — |
| | — | % | 1,599 |
| | — |
| | — | % | | 1,292 |
| | — |
| | — | % |
| Securities - taxable investments | 967,221 |
| | 6,219 |
| | 2.61 | % | | 875,417 |
| | 5,367 |
| | 2.49 | % | 993,222 |
| | 6,498 |
| | 2.62 | % | | 900,086 |
| | 5,609 |
| | 2.50 | % |
| Securities - nontaxable investments (1) | 2,262 |
| | 20 |
| | 3.59 | % | | 3,793 |
| | 40 |
| | 4.28 | % | 2,204 |
| | 20 |
| | 3.64 | % | | 3,787 |
| | 40 |
| | 4.24 | % |
| Total securities | 970,916 |
| | 6,239 |
| | 2.61 | % | | 880,209 |
| | 5,407 |
| | 2.49 | % | $ | 997,025 |
| | $ | 6,518 |
| | 2.62 | % | | $ | 905,165 |
| | $ | 5,649 |
| | 2.50 | % |
| Loans held for sale | 2,753 |
| | 19 |
| | 2.80 | % | | 2,725 |
| | 14 |
| | 2.08 | % | 4,719 |
| | 30 |
| | 2.55 | % | | 3,733 |
| | 21 |
| | 2.26 | % |
| Loans (2) | | | | | | | | | | | | | | | | | | | | | | |
| Commercial and industrial | 879,336 |
| | 9,615 |
| | 4.43 | % | | 880,765 |
| | 8,642 |
| | 3.98 | % | 943,110 |
| | 11,116 |
| | 4.73 | % | | 895,173 |
| | 9,098 |
| | 4.08 | % |
| Commercial real estate (1) | 3,107,437 |
| | 33,289 |
| | 4.34 | % | | 3,029,344 |
| | 30,215 |
| | 4.05 | % | 3,092,771 |
| | 35,175 |
| | 4.56 | % | | 3,028,745 |
| | 30,968 |
| | 4.10 | % |
| Commercial construction | 397,720 |
| | 4,671 |
| | 4.76 | % | | 331,285 |
| | 3,577 |
| | 4.38 | % | 416,830 |
| | 5,256 |
| | 5.06 | % | | 362,603 |
| | 4,105 |
| | 4.54 | % |
| Small business | 132,125 |
| | 1,862 |
| | 5.72 | % | | 124,374 |
| | 1,680 |
| | 5.48 | % | 138,758 |
| | 2,008 |
| | 5.80 | % | | 129,100 |
| | 1,776 |
| | 5.52 | % |
| Total commercial | 4,516,618 |
| | 49,437 |
| | 4.44 | % | | 4,365,768 |
| | 44,114 |
| | 4.10 | % | 4,591,469 |
| | 53,555 |
| | 4.68 | % | | 4,415,621 |
| | 45,947 |
| | 4.17 | % |
| Residential real estate | 755,996 |
| | 7,501 |
| | 4.02 | % | | 643,672 |
| | 6,099 |
| | 3.84 | % | 769,441 |
| | 7,661 |
| | 3.99 | % | | 704,726 |
| | 7,024 |
| | 4.00 | % |
| Home equity | 1,051,022 |
| | 10,205 |
| | 3.94 | % | | 996,940 |
| | 8,708 |
| | 3.54 | % | 1,061,082 |
| | 10,830 |
| | 4.09 | % | | 1,028,109 |
| | 9,444 |
| | 3.68 | % |
| Total consumer real estate | 1,807,018 |
| | 17,706 |
| | 3.97 | % | | 1,640,612 |
| | 14,807 |
| | 3.66 | % | 1,830,523 |
| | 18,491 |
| | 4.05 | % | | 1,732,835 |
| | 16,468 |
| | 3.81 | % |
| Other consumer | 10,659 |
| | 214 |
| | 8.14 | % | | 11,333 |
| | 241 |
| | 8.62 | % | 10,295 |
| | 211 |
| | 8.22 | % | | 10,541 |
| | 240 |
| | 9.13 | % |
| Total loans | 6,334,295 |
| | 67,357 |
| | 4.31 | % | | 6,017,713 |
| | 59,162 |
| | 3.99 | % | $ | 6,432,287 |
| | $ | 72,257 |
| | 4.51 | % | | $ | 6,158,997 |
| | $ | 62,655 |
| | 4.08 | % |
| Total interest-earning assets | $ | 7,389,898 |
| | $ | 73,926 |
| | 4.06 | % | | $ | 7,005,654 |
| | $ | 64,790 |
| | 3.75 | % | $ | 7,556,147 |
| | $ | 79,346 |
| | 4.21 | % | | $ | 7,140,571 |
| | $ | 68,515 |
| | 3.85 | % |
| Cash and due from banks | 97,605 |
| | | | | | 94,955 |
| | | | | 100,952 |
| | | | | | 97,129 |
| | | | |
| Federal Home Loan Bank stock | 13,016 |
| | | | | | 13,108 |
| | | | | 13,399 |
| | | | | | 13,700 |
| | | | |
| Other assets | 545,516 |
| | | | | | 540,411 |
| | | | | 545,994 |
| | | | | | 551,388 |
| | | | |
| Total assets | $ | 8,046,035 |
| | | | | | $ | 7,654,128 |
| | | | | $ | 8,216,492 |
| | | | | | $ | 7,802,788 |
| | | | |
| Interest-bearing liabilities | | | | | | | | | | | | | | | | | | | | | | |
| Deposits | | | | | | | | | | | | | | | | | | | | | | |
| Savings and interest checking accounts | $ | 2,563,186 |
| | $ | 1,093 |
| | 0.17 | % | | $ | 2,479,373 |
| | $ | 763 |
| | 0.12 | % | $ | 2,664,148 |
| | $ | 1,293 |
| | 0.19 | % | | $ | 2,568,020 |
| | $ | 849 |
| | 0.13 | % |
| Money market | 1,338,265 |
| | 1,364 |
| | 0.41 | % | | 1,258,466 |
| | 857 |
| | 0.28 | % | 1,360,216 |
| | 1,667 |
| | 0.49 | % | | 1,287,991 |
| | 935 |
| | 0.29 | % |
| Time deposits | 646,529 |
| | 1,478 |
| | 0.93 | % | | 634,947 |
| | 1,147 |
| | 0.73 | % | 653,373 |
| | 1,627 |
| | 1.00 | % | | 609,787 |
| | 1,128 |
| | 0.74 | % |
| Total interest-bearing deposits | $ | 4,547,980 |
| | $ | 3,935 |
| | 0.35 | % | | $ | 4,372,786 |
| | $ | 2,767 |
| | 0.26 | % | $ | 4,677,737 |
| | $ | 4,587 |
| | 0.39 | % | | $ | 4,465,798 |
| | $ | 2,912 |
| | 0.26 | % |
| Borrowings | | | | | | | | | | | | | | | | | | | | | | |
| Federal Home Loan Bank borrowings | $ | 73,040 |
| | $ | 260 |
| | 1.44 | % | | $ | 66,556 |
| | $ | 403 |
| | 2.46 | % | $ | 62,600 |
| | $ | 295 |
| | 1.89 | % | | $ | 63,275 |
| | $ | 418 |
| | 2.65 | % |
| Customer repurchase agreements | 155,768 |
| | 66 |
| | 0.17 | % | | 157,305 |
| | 56 |
| | 0.14 | % | 143,259 |
| | 64 |
| | 0.18 | % | | 155,692 |
| | 55 |
| | 0.14 | % |
| Junior subordinated debentures | 73,074 |
| | 590 |
| | 3.27 | % | | 73,085 |
| | 554 |
| | 3.07 | % | 73,076 |
| | 625 |
| | 3.43 | % | | 73,068 |
| | 565 |
| | 3.10 | % |
| Subordinated debentures | 34,687 |
| | 427 |
| | 4.99 | % | | 34,641 |
| | 427 |
| | 5.00 | % | 34,699 |
| | 428 |
| | 4.95 | % | | 34,652 |
| | 428 |
| | 4.95 | % |
| Total borrowings | $ | 336,569 |
| | $ | 1,343 |
| | 1.62 | % | | $ | 331,587 |
| | $ | 1,440 |
| | 1.76 | % | $ | 313,634 |
| | $ | 1,412 |
| | 1.81 | % | | $ | 326,687 |
| | $ | 1,466 |
| | 1.80 | % |
| | | Total interest-bearing liabilities | $ | 4,884,549 |
| | $ | 5,278 |
| | 0.44 | % | | $ | 4,704,373 |
| | $ | 4,207 |
| | 0.36 | % | $ | 4,991,371 |
| | $ | 5,999 |
| | 0.48 | % | | $ | 4,792,485 |
| | $ | 4,378 |
| | 0.37 | % |
| Demand deposits | 2,129,517 |
| | | | | | 1,987,579 |
| | | | | 2,174,571 |
| | | | | | 2,026,770 |
| | | | |
| Other liabilities | 79,125 |
| | | | | | 85,691 |
| | | | | 79,266 |
| | | | | | 81,725 |
| | | | |
| Total liabilities | $ | 7,093,191 |
| | | | | | $ | 6,777,643 |
| | | | | $ | 7,245,208 |
| | | | | | $ | 6,900,980 |
| | | | |
| Stockholders' equity | 952,844 |
| | | | | | 876,485 |
| | | | | 971,284 |
| | | | | | 901,808 |
| | | | |
| Total liabilities and stockholders' equity | $ | 8,046,035 |
| | | | | | $ | 7,654,128 |
| | | | | $ | 8,216,492 |
| | | | | | $ | 7,802,788 |
| | | | |
| Net interest income (1) | | | $ | 68,648 |
| | | | | | $ | 60,583 |
| | | | | $ | 73,347 |
| | | | | | $ | 64,137 |
| | |
| Interest rate spread (3) | | | | | 3.62 | % | | | | | | 3.39 | % | | | | | 3.73 | % | | | | | | 3.48 | % |
| Net interest margin (4) | | | | | 3.77 | % | | | | | | 3.51 | % | | | | | 3.89 | % | | | | | | 3.60 | % |
| Supplemental information | | | | | | | | | | | | | | | | | | | | | | |
| Total deposits, including demand deposits | $ | 6,677,497 |
| | $ | 3,935 |
| | | | $ | 6,360,365 |
| | $ | 2,767 |
| | | $ | 6,852,308 |
| | $ | 4,587 |
| | | | $ | 6,492,568 |
| | $ | 2,912 |
| | |
| Cost of total deposits | | | | | 0.24 | % | | | | | | 0.18 | % | | | | | 0.27 | % | | | | | | 0.18 | % |
| Total funding liabilities, including demand deposits | $ | 7,014,066 |
| | $ | 5,278 |
| | | | $ | 6,691,952 |
| | $ | 4,207 |
| | | $ | 7,165,942 |
| | $ | 5,999 |
| | | | $ | 6,819,255 |
| | $ | 4,378 |
| | |
| Cost of total funding liabilities | | | | | 0.31 | % | | | | | | 0.25 | % | | | | | 0.34 | % | | | | | | 0.26 | % |
| |
| (1) | The total amount of adjustment to present interest income and yield on a FTE basis is $177,000$179,000 and $383,000$382,000 for the three months ended March 31,June 30, 2018 and 2017, respectively. The FTE adjustment relates to nontaxable investment securities with average balances of $2.3$2.2 million and $3.8 million and nontaxable industrial development bonds recorded within commercial real estate with average balances of $51.9$55.1 million and $73.8$70.3 million, for the three months ended March 31,June 30, 2018 and 2017, respectively. |
| |
| (2) | Average nonaccruing loans are included in loans. |
| |
| (3) | Interest rate spread represents the difference between the weighted average yield on interest-earning assets and the weighted average cost of interest-bearing liabilities. |
| |
| (4) | Net interest margin represents annualized net interest income as a percentage of average interest-earning assets. |
Table 14 - Average Balance, Interest Earned/Paid & Average Yields Year-to-Date
|
| | | | | | | | | | | | | | | | | | | | | |
| | Six Months Ended June 30 |
| | 2018 | | 2017 |
| | Average Balance | | Interest Earned/ Paid | | Yield/ Rate | | Average Balance | | Interest Earned/ Paid | | Yield/ Rate |
| | (Dollars in thousands) |
| Interest-earning assets | | | | | | | | | | | |
| Interest-earning deposits with banks, federal funds sold, and short-term investments | $ | 102,136 |
| | $ | 852 |
| | 1.68 | % | | $ | 88,752 |
| | $ | 397 |
| | 0.90 | % |
| Securities | | | | | | | | | | | |
| Securities - trading | 1,517 |
| | — |
| | — | % | | 1,146 |
| | — |
| | — | % |
| Securities - equity | | | | | | | | | | | |
| Securities - taxable investments | 980,293 |
| | 12,717 |
| | 2.62 | % | | 887,820 |
| | 10,976 |
| | 2.49 | % |
| Securities - nontaxable investments (1) | 2,233 |
| | 40 |
| | 3.61 | % | | 3,790 |
| | 80 |
| | 4.26 | % |
| Total securities | $ | 984,043 |
| | $ | 12,757 |
| | 2.61 | % | | $ | 892,756 |
| | $ | 11,056 |
| | 2.50 | % |
| Loans held for sale | 3,741 |
| | 49 |
| | 2.64 | % | | 3,232 |
| | 35 |
| | 2.18 | % |
| Loans (2) | | | | | | | — |
| | | | |
| Commercial and industrial | 911,399 |
| | 20,731 |
| | 4.59 | % | | 888,009 |
| | 17,740 |
| | 4.03 | % |
| Commercial real estate (1) | 3,100,063 |
| | 68,464 |
| | 4.45 | % | | 3,029,043 |
| | 61,182 |
| | 4.07 | % |
| Commercial construction | 407,328 |
| | 9,927 |
| | 4.91 | % | | 347,031 |
| | 7,682 |
| | 4.46 | % |
| Small business | 135,460 |
| | 3,870 |
| | 5.76 | % | | 126,750 |
| | 3,456 |
| | 5.50 | % |
| Total commercial | 4,554,250 |
| | 102,992 |
| | 4.56 | % | | 4,390,833 |
| | 90,060 |
| | 4.14 | % |
| Residential real estate | 762,755 |
| | 15,162 |
| | 4.01 | % | | 674,368 |
| | 13,123 |
| | 3.92 | % |
| Home equity | 1,056,080 |
| | 21,035 |
| | 4.02 | % | | 1,012,610 |
| | 18,152 |
| | 3.61 | % |
| Total consumer real estate | 1,818,835 |
| | 36,197 |
| | 4.01 | % | | 1,686,978 |
| | 31,275 |
| | 3.74 | % |
| Other consumer | 10,476 |
| | 425 |
| | 8.18 | % | | 10,934 |
| | 481 |
| | 8.87 | % |
| Total loans | $ | 6,383,561 |
| | $ | 139,614 |
| | 4.41 | % | | $ | 6,088,745 |
| | $ | 121,816 |
| | 4.03 | % |
| Total interest-earning assets | $ | 7,473,481 |
| | $ | 153,272 |
| | 4.14 | % | | $ | 7,073,485 |
| | $ | 133,304 |
| | 3.80 | % |
| Cash and due from banks | 99,288 |
| | | | | | 96,048 |
| | | | |
| Federal Home Loan Bank stock | 13,209 |
| | | | | | 13,406 |
| | | | |
| Other assets | 545,756 |
| | | | | | 545,929 |
| | | | |
| Total assets | $ | 8,131,734 |
| | | | | | $ | 7,728,868 |
| | | | |
| Interest-bearing liabilities | | | | | | | | | | | |
| Deposits | | | | | | | | | | | |
| Savings and interest checking accounts | $ | 2,613,945 |
| | $ | 2,386 |
| | 0.18 | % | | $ | 2,523,941 |
| | $ | 1,612 |
| | 0.13 | % |
| Money market | 1,349,301 |
| | 3,031 |
| | 0.45 | % | | 1,273,310 |
| | 1,792 |
| | 0.28 | % |
| Time deposits | 649,970 |
| | 3,105 |
| | 0.96 | % | | 622,298 |
| | 2,275 |
| | 0.74 | % |
| Total interest-bearing deposits | $ | 4,613,216 |
| | $ | 8,522 |
| | 0.37 | % | | $ | 4,419,549 |
| | $ | 5,679 |
| | 0.26 | % |
| Borrowings | | | | | | | | | | | |
| Federal Home Loan Bank borrowings | $ | 67,792 |
| | 555 |
| | 1.65 | % | | $ | 64,905 |
| | $ | 821 |
| | 2.55 | % |
| Customer repurchase agreements | 149,479 |
| | 130 |
| | 0.18 | % | | 156,494 |
| | 111 |
| | 0.14 | % |
| Junior subordinated debentures | 73,075 |
| | 1,215 |
| | 3.35 | % | | 73,077 |
| | 1,119 |
| | 3.09 | % |
| Subordinated debentures | 34,693 |
| | 855 |
| | 4.97 | % | | 34,647 |
| | 855 |
| | 4.98 | % |
| Total borrowings | $ | 325,039 |
| | $ | 2,755 |
| | 1.71 | % | | $ | 329,123 |
| | $ | 2,906 |
| | 1.78 | % |
| Total interest-bearing liabilities | $ | 4,938,255 |
| | $ | 11,277 |
| | 0.46 | % | | $ | 4,748,672 |
| | $ | 8,585 |
| | 0.36 | % |
| Demand deposits | 2,152,168 |
| | | | | | 2,007,282 |
| | | | |
|
| | | | | | | | | | | | | | | | | | | | | |
| Other liabilities | 79,196 |
| | | | | | 83,697 |
| | | | |
| Total liabilities | $ | 7,169,619 |
| | | | | | $ | 6,839,651 |
| | | | |
| Stockholders' equity | 962,115 |
| | | | | | 889,217 |
| | | | |
| Total liabilities and stockholders' equity | $ | 8,131,734 |
| | | | | | $ | 7,728,868 |
| | | | |
| Net interest income (1) | | | $ | 141,995 |
| | | | | | $ | 124,719 |
| | |
| Interest rate spread (3) | | | | | 3.68 | % | | | | | | 3.44 | % |
| Net interest margin (4) | | | | | 3.83 | % | | | | | | 3.56 | % |
| Supplemental information | | | | | | | | | | | |
| Total deposit, including demand deposits | $ | 6,765,384 |
| | $ | 8,522 |
| | | | $ | 6,426,831 |
| | $ | 5,679 |
| | |
| Cost of total deposits | | | | | 0.25 | % | | | | | | 0.18 | % |
| Total funding liabilities, including demand deposits | $ | 7,090,423 |
| | $ | 11,277 |
| | | | $ | 6,755,954 |
| | $ | 8,585 |
| | |
| Cost of total funding liabilities | | | | | 0.32 | % | | | | | | 0.26 | % |
| |
| (1) | The total amount of adjustment to present interest income and yield on a FTE basis is $356,000 and $764,000 for the six months ended June 30, 2018 and 2017, respectively. The FTE adjustment relates to nontaxable investment securities with average balances of $2.2 million and $3.8 million and nontaxable industrial development bonds recorded within commercial real estate with average balances of $53.5 million and $72.0 million for the six months ended June 30, 2018 and 2017, respectively. |
| |
| (2) | Average nonaccruing loans are included in loans. |
| |
| (3) | Interest rate spread represents the difference between the weighted average yield on interest-earning assets and the weighted average cost of interest-bearing liabilities. |
| |
| (4) | Net interest margin represents annualized net interest income as a percentage of average interest-earning assets. |
The following table presents certain information on a FTE basis regarding changes in the Company’s interest income and interest expense for the periods indicated. For each category of interest-earning assets and interest-bearing liabilities, information is provided with respect to changes attributable to: (1) changes in rate (change in rate multiplied by old volume), (2) changes in volume (change in volume multiplied by old rate), and (3) changes in volume/rate (change in volume multiplied by change in rate) which is allocated to the change due to rate column:
Table 1415 - Volume Rate Analysis
| | | | Three Months Ended March 31 | Three Months Ended June 30 | | Six Months Ended June 30 |
| | 2018 Compared To 2017 | 2018 Compared To 2017 | | 2018 Compared To 2017 |
| | Change
Due to
Rate | | Change Due to Volume | | Total Change | Change
Due to
Rate | | Change Due to Volume | | Total Change | | Change Due to Rate | | Change Due to Volume | | Total Change |
| | (Dollars in thousands) | (Dollars in thousands) |
| Income on interest-earning assets | | | | | | | | | | | | | | | | |
| Interest earning deposits, federal funds sold and short term investments | $ | 149 |
| | $ | (45 | ) | | $ | 104 |
| $ | 222 |
| | $ | 129 |
| | $ | 351 |
| | $ | 395 |
| | $ | 60 |
| | $ | 455 |
|
| Securities | | | | | | | | | | | | | | | | |
| Securities - taxable investments | 289 |
| | 563 |
| | 852 |
| 309 |
| | 580 |
| | 889 |
| | 598 |
| | 1,143 |
| | 1,741 |
|
| Securities - nontaxable investments (1) | (4 | ) | | (16 | ) | | (20 | ) | (3 | ) | | (17 | ) | | (20 | ) | | (7 | ) | | (33 | ) | | (40 | ) |
| Total securities | | | | | 832 |
| | | | | 869 |
| | | | | | 1,701 |
|
| Loans held for sale | 5 |
| | — |
| | 5 |
| 3 |
| | 6 |
| | 9 |
| | 8 |
| | 6 |
| | 14 |
|
| Loans | | | | | | | | | | | | | | | | |
| Commercial and industrial | 987 |
| | (14 | ) | | 973 |
| 1,531 |
| | 487 |
| | 2,018 |
| | 2,524 |
| | 467 |
| | 2,991 |
|
| Commercial real estate (1) | 2,295 |
| | 779 |
| | 3,074 |
| 3,552 |
| | 655 |
| | 4,207 |
| | 5,848 |
| | 1,434 |
| | 7,282 |
|
| Commercial construction | 377 |
| | 717 |
| | 1,094 |
| 537 |
| | 614 |
| | 1,151 |
| | 910 |
| | 1,335 |
| | 2,245 |
|
| Small business | 77 |
| | 105 |
| | 182 |
| 99 |
| | 133 |
| | 232 |
| | 177 |
| | 237 |
| | 414 |
|
| Total commercial | | | | | 5,323 |
| | | | | 7,608 |
| | | | | | 12,932 |
|
| Residential real estate | 338 |
| | 1,064 |
| | 1,402 |
| (8 | ) | | 645 |
| | 637 |
| | 319 |
| | 1,720 |
| | 2,039 |
|
| Home equity | 1,025 |
| | 472 |
| | 1,497 |
| 1,083 |
| | 303 |
| | 1,386 |
| | 2,104 |
| | 779 |
| | 2,883 |
|
| Total consumer real estate | | | | | 2,899 |
| | | | | 2,023 |
| | | | | | 4,922 |
|
| Other consumer | (13 | ) | | (14 | ) | | (27 | ) | (23 | ) | | (6 | ) | | (29 | ) | | (36 | ) | | (20 | ) | | (56 | ) |
| Total loans (1)(2) | | | | | 8,195 |
| | | | | 9,602 |
| | | | | | 17,798 |
|
| Total income of interest-earning assets | | | | | $ | 9,136 |
| | | | | $ | 10,831 |
| | | | | | $ | 19,968 |
|
| Expense of interest-bearing liabilities | | | | | | | | | | | | | | | | |
| Deposits | | | | | | | | | | | | | | | | |
| Savings and interest checking accounts | $ | 304 |
| | $ | 26 |
| | $ | 330 |
| $ | 412 |
| | $ | 32 |
| | $ | 444 |
| | $ | 717 |
| | $ | 57 |
| | $ | 774 |
|
| Money market | 453 |
| | 54 |
| | 507 |
| 680 |
| | 52 |
| | 732 |
| | 1,132 |
| | 107 |
| | 1,239 |
|
| Time certificates of deposits | 310 |
| | 21 |
| | 331 |
| 418 |
| | 81 |
| | 499 |
| | 729 |
| | 101 |
| | 830 |
|
| Total interest bearing deposits | | | | | 1,168 |
| | | | | 1,675 |
| | | | | | 2,843 |
|
| Borrowings | | | | | | | | | | | | | | | | |
| Federal Home Loan Bank borrowings | (182 | ) | | 39 |
| | (143 | ) | (119 | ) | | (4 | ) | | (123 | ) | | (303 | ) | | 37 |
| | (266 | ) |
| Customer repurchase agreements and other short-term borrowings | 11 |
| | (1 | ) | | 10 |
| 13 |
| | (4 | ) | | 9 |
| | 24 |
| | (5 | ) | | 19 |
|
| Junior subordinated debentures | 36 |
| | — |
| | 36 |
| 60 |
| | — |
| | 60 |
| | 96 |
| | — |
| | 96 |
|
| Subordinated debentures | (1 | ) | | 1 |
| | — |
| (1 | ) | | 1 |
| | — |
| | (1 | ) | | 1 |
| | — |
|
| Total borrowings | | | | | (97 | ) | | | | | (54 | ) | | | | | | (151 | ) |
| Total expense of interest-bearing liabilities | | | | | 1,071 |
| | | | | 1,621 |
| | | | | | 2,692 |
|
| Change in net interest income | | | | | $ | 8,065 |
| | | | | $ | 9,210 |
| | | | | | $ | 17,276 |
|
| |
| (1) | The table above reflects income determined on a FTE basis. See footnote (1) to table 13 and 14 above for the related adjustments. |
| |
| (2) | Loans include portfolio loans and nonaccrual loans; however, unpaid interest on nonaccrual loans has not been included for purposes of determining interest income. |
Provision For Loan Losses The provision for loan losses represents the charge to expense that is required to maintain an appropriate level of allowance for loan losses. The provision for loan losses was $500,000$2.0 million and $2.5 million, for the three and six months ended March 31,June 30, 2018, respectively, as compared to $600,000$1.1 million and $1.7 million for the comparable year-ago period. The Company’s allowance for loan losses, as a percentage of total loans, was 0.96%0.97% at March 31,June 30, 2018, and 0.95% at both December 31, 2017, and 1.03% at March 31,June 30, 2017. The Company recorded net charge-offs of $281,000$305,000 and $586,000 for the three and six months ended March 31,June 30, 2018, as compared to net recoveriescharge-offs of $152,000$3.9 million and $3.7 million for the three and six months ended March 31,June 30, 2017.
Economic activity has remained generally positive in the New England area. Staffing has been tight in the market and wage increases have begun to materialize. Some large employers publicly announced their intentions to raise wages in response to the reduction in the corporate tax rate in the Tax Act. Pricing activity appears mixed as some retail firms suggest they may need to raise prices in response to rising labor and shipping costs, however the general change in pricing is expected to be relatively minor. Commercial real estate trends continue to be strong into the first quarter of 2018. However, some concern is noted over commercial real estate valuations which could be pressured in response to rising yields on longer term Treasury securities. Residential real estate metrics also remain strong with median sales prices continuing their upward momentum throughout New England. Overall volume of closed sales through the first quarter of 2018 was down slightly from prior periods due to continued tightening of supply, however demand remains quite strong. Continued strength in most economic fundamentals is generally expected through 2018 with most industries and sectors maintaining a positive to stable outlook.
Management’s periodic evaluation of the appropriate allowance for loan losses considers past loan loss experience, known and inherent risks within the loan portfolio, adverse situations which may affect the borrowers’ ability to repay, the estimated value of the underlying collateral, if any, and current economic conditions. Substantial
Regarding the estimated value of the underlying collateral, substantial portions of the Bank’s loans are secured by real estate in Massachusetts and Rhode Island. Accordingly, the ultimate collectability of a substantial portion of the Bank’s loan portfolio is susceptible to changes in property values within those states.
In addition, economic activity maintained its moderate pace of expansion into the second quarter of 2018. A tight labor market persists in the New England market, however wages appear to be rising as a result. Retailers noted some upward movement on prices in some categories; specifically those most impacted by energy and transportation costs. Also, retailers and manufacturers are feeling some anxiety over the looming effects of tariffs as they take effect as it remains unclear what exactly that might do to pricing of components and final products. In general, sales levels of most retailers in the region were improved compared to a year prior with increases spanning the mid-single-digit to double-digit levels. Retail outlook was positive, specifically with businesses related to tourism as the summer season begins. Median sales prices on residential real estate have continued to increase, although sales volume remains mixed due to a tight supply. Commercial real estate markets remain strong with good to robust office leasing activity throughout the region. A number of new projects are breaking ground throughout New England, spanning multiple industries such as hotels, student housing, and industrial complexes. The overall outlook for the near term remains positive for the New England region.
Noninterest Income The following table sets forth information regarding noninterest income for the periods shown:
Table 1516 - Noninterest Income | | | | Three Months Ended | Three Months Ended |
| | March 31 | | Change | June 30 | | Change |
| | 2018 | | 2017 | | Amount | | % | 2018 | | 2017 | | Amount | | % |
| | (Dollars in thousands) | | | (Dollars in thousands) | | |
| Deposit account fees | $ | 4,431 |
| | $ | 4,544 |
| | $ | (113 | ) | | (2.49 | )% | $ | 4,551 |
| | $ | 4,392 |
| | $ | 159 |
| | 3.62 | % |
| Interchange and ATM fees | 4,173 |
| | 3,922 |
| | 251 |
| | 6.40 | % | 4,769 |
| | 4,434 |
| | 335 |
| | 7.56 | % |
| Investment management | 6,142 |
| | 5,614 |
| | 528 |
| | 9.41 | % | 6,822 |
| | 5,995 |
| | 827 |
| | 13.79 | % |
| Mortgage banking income | 870 |
| | 957 |
| | (87 | ) | | (9.09 | )% | 1,038 |
| | 1,314 |
| | (276 | ) | | (21.00 | )% |
| Gain on sale of equity securities | — |
| | 4 |
| | (4 | ) | | nm |
| 2 |
| | 3 |
| | (1 | ) | | (33.33 | )% |
| Increase in cash surrender value of life insurance policies | 947 |
| | 964 |
| | (17 | ) | | (1.76 | )% | 998 |
| | 1,017 |
| | (19 | ) | | (1.87 | )% |
| Loan level derivative income | 447 |
| | 606 |
| | (159 | ) | | (26.24 | )% | 708 |
| | 1,337 |
| | (629 | ) | | (47.05 | )% |
| Other noninterest income | 2,853 |
| | 2,301 |
| | 552 |
| | 23.99 | % | 2,999 |
| | 2,906 |
| | 93 |
| | 3.20 | % |
| Total | $ | 19,863 |
| | $ | 18,912 |
| | $ | 951 |
| | 5.03 | % | $ | 21,887 |
| | $ | 21,398 |
| | $ | 489 |
| | 2.29 | % |
| | | | | | | | | |
| | | Six Months Ended |
| | | June 30 | | Change |
| | | 2018 | | 2017 | | Amount | | % |
| | | (Dollars in thousands) | | |
| Deposit account fees | | $ | 8,982 |
| | $ | 8,936 |
| | $ | 46 |
| | 0.51 | % |
| Interchange and ATM fees | | 8,942 |
| | 8,356 |
| | 586 |
| | 7.01 | % |
| Investment management | | 12,964 |
| | 11,609 |
| | 1,355 |
| | 11.67 | % |
| Mortgage banking income | | 1,908 |
| | 2,271 |
| | (363 | ) | | (15.98 | )% |
| Increase in cash surrender value of life insurance policies | | 1,945 |
| | 1,981 |
| | (36 | ) | | (1.82 | )% |
| Gain on sale of equity securities | | 2 |
| | 7 |
| | (5 | ) | | (71.43 | )% |
| Loan level derivative income | | 1,155 |
| | 1,943 |
| | (788 | ) | | (40.56 | )% |
| Other noninterest income | | 5,852 |
| | 5,207 |
| | 645 |
| | 12.39 | % |
| Total | | $ | 41,750 |
| | $ | 40,310 |
| | $ | 1,440 |
| | 3.57 | % |
nm - the percentage is not meaningful.
The primary reasons for the variances in the noninterest income category shown in the preceding tables include:
•Deposit account fees decreasedincreased due primarily to reduced overdraft fees.seasonality and increased household accounts.
Interchange and ATM fees have increased as a result of the continued growth of core checking accounts, and to a lesser degreedriven mainly by the Island Bancorp, Inc. ("Island Bancorp") acquisition which closed in May 2017.increased account activity.
Investment management income growth was driven primarily from growth in overall assets under administration, which were $3.5$3.6 billion as of March 31,June 30, 2018, an increase of $416.2$375.4 million, or 13.7%11.7%, compared to March 31,June 30, 2017.
Mortgage banking income decreased in the current year periods due to a decrease in loans closed during the first quarter of 2018 as compared to 2017, as well as higher percentage of closed loans being placed into the Company's portfolio in 2018.those periods.
Loan level derivative income decreased due toas a result of lower customer demand.
Other noninterest income increased primarily due to higher rental income related to equipment leasing.leasing, merchant processing income and a gain on sale of loans during the second quarter of 2018, offset by decreases in income associated with the Company's 1031 Tax Exchange program.
Noninterest Expense The following table sets forth information regarding non-interest expense for the periods shown:
Table 1617 - Noninterest Expense
| | | | Three Months Ended | Three Months Ended |
| | March 31 | | Change | June 30 | | Change |
| | 2018 | | 2017 | | Amount | | % | 2018 | | 2017 | | Amount | | % |
| | (Dollars in thousands) | | | (Dollars in thousands) | | |
| Salaries and employee benefits | $ | 31,100 |
| | $ | 28,324 |
| | $ | 2,776 |
| | 9.80 | % | $ | 30,288 |
| | $ | 28,654 |
| | $ | 1,634 |
| | 5.70 | % |
| Occupancy and equipment expenses | 7,408 |
| | 6,158 |
| | 1,250 |
| | 20.30 | % | 6,497 |
| | 6,059 |
| | 438 |
| | 7.23 | % |
| Data processing & facilities management | 1,286 |
| | 1,272 |
| | 14 |
| | 1.10 | % | 1,264 |
| | 1,188 |
| | 76 |
| | 6.40 | % |
| FDIC assessment | 798 |
| | 783 |
| | 15 |
| | 1.92 | % | 691 |
| | 778 |
| | (87 | ) | | (11.18 | )% |
| Advertising expense | 1,123 |
| | 1,294 |
| | (171 | ) | | (13.21 | )% | 1,166 |
| | 1,365 |
| | (199 | ) | | (14.58 | )% |
| Consulting expense | | 1,089 |
| | 1,262 |
| | (173 | ) | | (13.71 | )% |
| Debit card expense | | 841 |
| | 852 |
| | (11 | ) | | (1.29 | )% |
| Loss on sale of equity securities | — |
| | 3 |
| | (3 | ) | | nm |
| — |
| | 2 |
| | (2 | ) | | nm |
|
| Merger and acquisition expenses | — |
| | 484 |
| | (484 | ) | | nm |
| 434 |
| | 2,909 |
| | (2,475 | ) | | (85.08 | )% |
| Software maintenance | 972 |
| | 930 |
| | 42 |
| | 4.52 | % | 997 |
| | 896 |
| | 101 |
| | 11.27 | % |
| Other noninterest expenses | 10,764 |
| | 9,525 |
| | 1,239 |
| | 13.01 | % | 9,421 |
| | 8,844 |
| | 577 |
| | 6.52 | % |
| Total | $ | 53,451 |
| | $ | 48,773 |
| | $ | 4,678 |
| | 9.59 | % | $ | 52,688 |
| | $ | 52,809 |
| | $ | (121 | ) | | (0.23 | )% |
| | | | | | | | | |
| | | Six Months Ended |
| | | June 30 | | Change |
| | | 2018 | | 2017 | | Amount | | % |
| | | (Dollars in thousands) | | |
| Salaries and employee benefits | | $ | 61,388 |
| | $ | 56,978 |
| | $ | 4,410 |
| | 7.74 | % |
| Occupancy and equipment expenses | | 13,905 |
| | 12,217 |
| | 1,688 |
| | 13.82 | % |
| Data processing & facilities management | | 2,550 |
| | 2,460 |
| | 90 |
| | 3.66 | % |
| FDIC assessment | | 1,489 |
| | 1,561 |
| | (72 | ) | | (4.61 | )% |
| Advertising expense | | 2,289 |
| | 2,659 |
| | (370 | ) | | (13.92 | )% |
| Consulting expense | | 1,845 |
| | 1,816 |
| | 29 |
| | 1.60 | % |
| Debit card expense | | 1,650 |
| | 1,624 |
| | 26 |
| | 1.60 | % |
| Loss on sale of equity securities | | — |
| | 5 |
| | (5 | ) | | nm |
|
| Merger and acquisition expenses | | 434 |
| | 3,393 |
| | (2,959 | ) | | (87.21 | )% |
| Software maintenance | | 1,969 |
| | 1,826 |
| | 143 |
| | 7.83 | % |
| Other noninterest expenses | | 18,620 |
| | 17,043 |
| | 1,577 |
| | 9.25 | % |
| Total | | $ | 106,139 |
| | $ | 101,582 |
| | $ | 4,557 |
| | 4.49 | % |
nm - the percentage is not meaningful.
The primary reasons for the variances in the noninterest expense category shown in the preceding tables include:
The increase in salaries and employee benefits reflects overall increases in the employee base due to new hires and the 2017 second quarter Edgartown National Bank ("Island BancorpBancorp") acquisition, along with increases in expenses associated with merit and incentive programs, payroll taxes, medical insurance and medical insurance.commissions.
Occupancy and equipment expense increases were attributable to rent expense on leased properties, rental expense depreciation on equipment associated with the Company's equipment leasing initiative, as well as increases in snow removal costs and accelerated rent expenses associated with a branch closure in the first quarter of 2018.utility costs.
•Advertising expenses decreased due to timing of various campaigns.campaigns and strategic initiatives.
Merger and acquisition expense in March2018 reflects legal and professional fees associated with the pending acquisition of MNB which is anticipated to close in the fourth quarter of 2018. Merger and acquisition expense in 2017 is primarily related to compensation and severance agreements, as well as contract termination costs on the 2016 New EnglandIsland Bancorp Inc. ("NEB") acquisition. There were no such expenses for 2018.acquisition which closed in the second quarter of 2017.
Other noninterest expenses increased primarily due to unrealized losses on equity securities (governed by new accounting guidance effective in 2018 which requires income statement recognition of unrealized gains and losses on equity securities), and a change in classification of certain retirement plan expenses previously recognized in salaries and benefits (also due to new accounting guidance effective in 2018). Additionally, the change reflects increases in consultantdirector fees and higher provision for unfunded commitmentslegal fees as compared to the year ago period.periods.
Income Taxes The tax effect of all income and expense transactions is recognized by the Company in each year’s consolidated statements of income, regardless of the year in which the transactions are reported for income tax purposes. The following table sets forth information regarding the Company’s tax provision and applicable tax rates for the periods indicated:
Table 1718 - Tax Provision and Applicable Tax Rates
| | | | Three Months Ended | Three Months Ended | | Six Months Ended |
| | March 31 | June 30 | | June 30 |
| | 2018 | | 2017 | 2018 | | 2017 | | 2018 | | 2017 |
| | (Dollars in thousands) | (Dollars in thousands) |
| Combined federal and state income tax provision | $ | 6,828 |
| | $ | 9,014 |
| $ | 9,249 |
| | $ | 10,731 |
| | $ | 16,077 |
| | $ | 19,745 |
|
| Effective income tax rate | 19.86 | % | | 30.31 | % | 22.91 | % | | 34.29 | % | | 21.51 | % | | 32.35 | % |
| Blended statutory tax rate | 28.20 | % | | 40.86 | % | 28.20 | % | | 40.86 | % | | 28.20 | % | | 40.86 | % |
The Company's blended statutory and effective tax rates in 2018 are lower as compared to the year ago period due primarily to the impact of the Tax Cuts and Jobs Act ("Tax Act"), which decreased the maximum Federal corporate tax rate from 35% to 21%. Additionally, the effective tax rates in the table above are lower than the blended statutory tax rates due to certain tax preference assets such as life insurance policies and tax exempt bonds, as well as federal tax credits recognized primarily in connection with the New Markets Tax Credit program and investments in low income housing project investments. Lastly, the effective tax rate includes the impact of excess tax benefits associated with stock compensation transactions and other discrete items which can fluctuate year over year.
The Company's subsidiaries have received several awards of tax credit allocation authority under the federal New Markets Tax Credit program which enable the Company to recognize federal tax credits over a seven year period totaling 39.0% of the total award. The Company recognizes federal tax credits as capital investments that are made into its subsidiaries to fund below market interest rate loans to qualifying businesses in low income communities. The following table details the remaining tax credit recognition by year associated with this program:
Table 1819 - New Markets Tax Credit Recognition Schedule
|
| | | | | | | | | | | | | | | |
| Year and Amount of Investment | | 2018 | | 2019 | | Total Remaining Credits |
| | | | |
| 2012 | $ | 21,400 |
| | $ | 1,285 |
| | $ | — |
| | $ | 1,285 |
|
| 2013 | 44,600 |
| | 2,675 |
| | 2,675 |
| | 5,350 |
|
| Total | $ | 66,000 |
| | $ | 3,960 |
| | $ | 2,675 |
| | $ | 6,635 |
|
The Company invests in various low income housing projects which are real estate limited partnerships that acquire, develop, own and operate low and moderate-income housing developments. As a limited partner in these operating partnerships, the Company will receive tax credits and tax deductions for losses incurred by the underlying properties. The investments are accounted for using the proportional amortization method and will be amortized over various periods through 2032, which represents the period that the tax credits and other tax benefits will be utilized. The total committed investment in these partnerships is $47.4 million, of which $44.1$45.0 million has been funded.funded as of June 30, 2018. It is expected that the limited partnership investments will
generate a net tax benefit of approximately $1.2$1.1 million for the full calendar year of 2018 and a total of $6.8$6.7 million over the remaining life of the investments from the combination of the tax credits and operating losses.
Risk Management
The Company’s Board of Directors and Executive Management have identified significant risk categories which affect the Company. The risk categories include: credit risk, operations risk, compliance risk, strategic and reputation risk, market risk and liquidity risk. The Board of Directors has approved an Enterprise Risk Management Policy that addresses each category of risk. The Senior Portfolio Risk Officer, Chief Financial Officer, Chief Information Officer, Director of Residential Lending, Compliance Officer, Executive Vice President of Commercial Lending and other members of management provide regular reports to the Board of Directors, identifying key risk issues and plans to mitigate key risks. The Board of Directors seeks to ensure the level of risk is maintained within limits established by both the Risk Management Policy and other previously approved policies.
Credit Risk Credit risk represents the possibility that the Company's borrowing customers or other counterparties may not repay loans or other contractual obligations according to their terms due to changes in the financial capacity, ability and willingness of such borrowing customers or counterparties to meet their obligations. In some cases, the collateral securing the payment of the loans may be sufficient to assure repayment, but in other cases the Company may experience significant credit losses which could have an adverse effect on its operating results. The Company makes various assumptions and judgments about the collectability of its loan portfolio, including the creditworthiness of its borrowers and counterparties and the value of the real estate and other assets serving as collateral for the repayment of loans. For further discussion regarding the credit risk and the credit quality of the Company’s loan portfolio, see Note 4, “Loans, Allowance for Loan Losses, and Credit Quality” within Condensed Notes to Consolidated Financial Statements included in Item 1 hereof.
Operations Risk Operations risk is the risk of loss due to human behavior, inadequate or failed internal systems and controls, and external influences such as market conditions, fraudulent activities, natural disasters and security risks. The potential for operational risk exposure exists throughout the organization. Integral to the Company's performance is the continued effectiveness of the Company's technical systems, operational infrastructure, relationships with third parties and the associates and key executives in day-to-day and ongoing operations. Failure by any or all of these resources subjects the Company to risks that may vary in size, scale and scope. These risks include, but are not limited to, operational or technical failures, unlawful
tampering with technical systems, cyber security, terrorist activities, ineffectiveness or exposure due to interruption in third party support, as well as the loss of key individuals or failure on the part of the key individuals to perform properly. The Bank has an Operations Risk Management Committee that meets monthly and reports to the Board quarterly, or more frequently if warranted. The Committee is chaired by the Director of Risk Management and members of the Committee include representatives from Audit, Finance, Technology, Operations, Information Security, Compliance and periodic attendance from business units throughout the organization. An operations risk management report is updated quarterly and reviewed with the Board.
Compliance Risk Compliance risk represents the risk of regulatory sanctions or financial loss resulting from the Company’s failure to comply with rules and regulations issued by the various banking agencies, the U.S. Securities and Exchange Commission, the NASDAQ Stock Market, and standards of good banking practice. Activities which may expose the Company to compliance risk include, but are not limited to, those dealing with the prevention of money laundering, privacy and data protection, adherence to all applicable laws and regulations, community reinvestment initiatives and employment and tax matters. Compliance risk is mitigated through the use of written policies and procedures, training of staff, and monitoring of activities for adherence to those procedures. The Bank has a Compliance Committee that meets quarterly and updates the Board and management quarterly or more frequently if warranted. The Committee is chaired by the Director of Compliance, and members of the Committee include representatives from each of the principal business lines as well as Enterprise Risk Management, Audit, Finance, Technology and Information Security.
Strategic and Reputation Risk Strategic and reputation risk represent the risk of loss due to impairment of reputation, failure to fully develop and execute business plans, and failure to assess current and new opportunities and threats in business, markets, and products. Management seeks to mitigate strategic and reputational risk through annual strategic planning, frequent executive strategic reviews, ongoing competitive and technological observation, assessment processes of new product, new branch, and new business initiatives, adherence to ethical standards, a philosophy of customer advocacy, a structured process of customer complaint resolution, and ongoing reputational monitoring, crisis management planning, and management tools.
Market Risk Market risk is the sensitivity of income to changes in interest rates, foreign exchange rates, commodity prices and other market-driven rates or prices. Interest rate sensitivity is the most significant market risk to which the Company is exposed.
Interest rate risk is the sensitivity of income to changes in interest rates. Changes in interest rates, as well as fluctuations in the level and duration of assets and liabilities, affect net interest income, the Company’s primary source of revenue. Interest rate risk arises directly from the Company’s core banking activities. In addition to directly impacting net interest income, changes
in the level of interest rates can also affect the amount of loans originated, the timing of cash flows on loans and securities, and the fair value of securities and derivatives, as well as other effects.
The primary goal of interest rate risk management is to control this risk within limits approved by the Board of Directors. These limits reflect the Company’s tolerance for interest rate risk over both short-term and long-term horizons. The Company attempts to manage interest rate risk by identifying, quantifying, and where appropriate, hedging its exposure. If assets and liabilities do not re-price simultaneously and in equal volume, the potential for interest rate exposure exists. It is the Company's objective to maintain stability in the growth of net interest income through the maintenance of an appropriate mix of interest-earning assets and interest-bearing liabilities and, when necessary, within limits management determines to be prudent, through the use of off-balance sheet hedging instruments such as interest rate swaps, floors and caps.
The Company quantifies its interest rate exposures using net interest income simulation models, as well as simpler gap analysis, and Economic Value of Equity analysis. Key assumptions in these simulation analyses relate to behavior of interest rates and behavior of the Company’s deposit and loan customers. The most material assumptions relate to the prepayment of mortgage assets (including mortgage loans and mortgage-backed securities) and the life and sensitivity of nonmaturity deposits (e.g. DDA, NOW, savings and money market). In the case of prepayment of mortgage assets, assumptions are derived from published dealer median prepayment estimates for comparable mortgage loans. The risk of prepayment tends to increase when interest rates fall. Since future prepayment behavior of loan customers is uncertain, interest rate sensitivity of loans cannot be determined exactly and actual behavior may differ from assumptions.
The Company’s policy on interest-rate risk simulation specifies that for all "core" interest rate scenarios, estimated net interest income for the subsequent one-year period should not decline by more than 10%, and for the second year should not decline by more than 15.0%. The Company was within policy limits at June 30, 2018 and 2017.
The Company's core scenarios for March 31,June 30, 2018 included five instantaneous parallel shifts (“shocks”) to market interest rates and four gradual (12 to 24 months) shifts in interest. The Company also regularly analyzes other "noncore" scenarios as it deems appropriate.
The results of all scenarios and the impact to net interest income are outlined in the table below:
Table 1920 - Interest Rate Sensitivity
| | | | March 31 | June 30 |
| | 2018 | | 2017 | 2018 | | 2017 |
| | Year 1 | | Year 2 | | Year 1 | | Year 2 | Year 1 | | Year 2 | | Year 1 | | Year 2 |
| Parallel rate shocks (basis points) | | | | | | | | | | | | | | |
| -100 | (7.6 | )% | | (8.5 | )% | | (7.8 | )% | | (10.6 | )% | (7.7 | )% | | (9.1 | )% | | (9.3 | )% | | (12.0 | )% |
| +100 | 4.9 | % | | 10.0 | % | | 5.8 | % | | 9.5 | % | 4.9 | % | | 9.4 | % | | 5.4 | % | | 9.1 | % |
| +200 | 9.2 | % | | 16.4 | % | | 11.3 | % | | 17.6 | % | 9.3 | % | | 15.9 | % | | 10.5 | % | | 16.6 | % |
| +300 | 13.6 | % | | 23.0 | % | | 16.8 | % | | 25.8 | % | 13.8 | % | | 22.6 | % | | 15.5 | % | | 24.2 | % |
| +400 | 18.1 | % | | 29.5 | % | | 22.2 | % | | 33.8 | % | 18.3 | % | | 29.1 | % | | 20.6 | % | | 31.7 | % |
| | | | | | | | | | | | | | | |
| Gradual rate shifts (basis points) | | | | | | | | | | | | | | |
| -100 over 12 months | (3.1 | )% | | (7.0 | )% | | (4.0 | )% | | (9.3 | )% | (3.2 | )% | | (7.7 | )% | | (4.8 | )% | | (10.9 | )% |
| +200 over 12 months | 4.5 | % | | 14.8 | % | | 5.4 | % | | 15.6 | % | 4.5 | % | | 14.3 | % | | 5.0 | % | | 14.8 | % |
| +400 over 24 months | 4.5 | % | | 19.0 | % | | 5.4 | % | | 21.0 | % | 4.5 | % | | 18.6 | % | | 5.0 | % | | 19.7 | % |
| Flat +500 over 12 months | 5.4 | % | | 22.0 | % | | 6.8 | % | | 25.6 | % | 5.6 | % | | 22.3 | % | | 6.4 | % | | 24.4 | % |
| | | | | | | | | | | | | | | |
| Alternative scenarios | | | | | | | | | | | | | | |
| Flat up 200 basis points scenario | 4.2 | % | | 13.1 | % | | 5.5 | % | | 14.9 | % | 4.5 | % | | 13.6 | % | | 5.3 | % | | 14.8 | % |
In addition,As previously noted, the Company's policy on interest rate risk simulation specifies that estimated net interest income forresults in the second year of all “core scenarios” should not decline by more than 15.0%. The Company was within policy limits at March 31, 2018 and 2017. It should be emphasized, however, that the resultstable above are dependent on material assumptions such as those discussed above.assumptions. For instance, asymmetrical rate behavior can have a material impact on the simulation results. If competition for deposits prompts the Company to raise rates on those liabilities more quickly than is assumed in the simulation analysis without a corresponding increase in asset yields, net interest income would be negatively impacted. Alternatively, if the Company is able to lag increases in deposit rates as loans re-price upward, net interest income would be positively impacted.
The most significant factors affecting market risk exposure of the Company’s net interest income during the threesix months ended March 31,June 30, 2018 were the shape of the U.S. Government securities and interest rate swap yield curve, the U.S. prime interest rate and LIBOR rates, and the interest rates being offered on long-term fixed rate loans.
The Company manages the interest rate risk inherent in both its loan and borrowing portfolios by utilizing interest rate swap agreements and interest rate caps and floors. An interest rate swap is an agreement whereby one party agrees to pay a floating rate of interest on a notional principal amount in exchange for receiving a fixed rate of interest on the same notional amount for a predetermined period of time from a second party. Interest rate caps and floors are agreements whereby one party agrees to pay a floating rate of interest on a notional principal amount for a predetermined period of time to a second party if certain market interest rate thresholds are realized. The amounts relating to the notional principal amount are not actually exchanged. Additionally, the Company may manage the interest rate risk inherent in its mortgage banking operations by entering into forward sales contracts. Prior to closing and funding certain 1- 4 family residential mortgage loans, an interest rate lock commitment is generally extended to the borrower. During the period from commitment date to closing date, the Company is subject to the risk that market rates of interest may change. If market rates rise, investors generally will pay less to purchase such loans resulting in a reduction in the gain on sale of the loans or, possibly, a loss. In an effort to mitigate such risk, forward delivery sales commitments are executed, under which the Company agrees to deliver whole mortgage loans to various investors. See Note 8, “Derivative and Hedging Activities” within Condensed Notes to Consolidated Financial Statements included in Item 1 hereof for additional information regarding the Company’s Derivative Financial Instruments.
The Company’s earnings are not directly or materially impacted by movements in foreign currency rates or commodity prices. Movements in equity prices may have a modest impact on earnings by affecting the volume of activity or the amount of fees from investment-related business lines. See Note 3, “Securities” within Condensed Notes to Consolidated Financial Statements included in Item 1 hereof.
Liquidity Risk Liquidity risk is the risk that the Company will not have the ability to generate adequate amounts of cash in the most economical way for the institution to meet its ongoing obligations to pay deposit withdrawals, service borrowings, and to fund loan commitments. The Company’s primary sources of funds are deposits, borrowings, and the amortization,
prepayment and maturities of loans and securities. The Bank utilizes its extensive branch network to access retail customers who provide a base of in-market core deposits. These funds are principally comprised of demand deposits, interest checking accounts, savings accounts, and money market accounts. Deposit levels are greatly influenced by interest rates, economic conditions, and competitive factors.
The Company actively manages its liquidity position under the direction of the Asset-Liability Committee of the Bank ("ALCO"). The Company’s primary measure of short-term liquidity is the Total Basic Surplus/Deficit as a percentage of assets. This ratio, which is an analysis of the relationship between liquid assets plus available funding at the FHLB less short-term liabilities relative to total assets, was within policy limits at March 31,June 30, 2018. The Total Basic Surplus/Deficit measure is affected primarily by changes in deposits, securities and short-term investments, loans and borrowings. An increase in deposits, without a corresponding increase in nonliquid assets, will improve the Total Basic Surplus/Deficit measure, whereas, an increase in loans, with no increase in deposits, will decrease the measure. Other factors affecting the Total Basic Surplus/Deficit measure include collateral requirements at the FHLB, changes in the securities portfolio, and the mix of deposits.
The Bank seeks to increase deposits without adversely impacting the weighted average cost of those funds. As part of a prudent liquidity risk management practice, the Company maintains various liquidity sources, some of which are only accessed on a contingency basis. Accordingly, management has implemented funding strategies that include FHLB advances, Federal Reserve Bank borrowing capacity and repurchase agreement lines. These nondeposit funds are also viewed as a contingent source of liquidity and, when profitable lending and investment opportunities exist, access to such funds provides a means to grow the balance sheet.
Borrowing capacity at the FHLB and the Federal Reserve is impacted by the amount and type of assets available to be pledged. For example, a prime, one-to-four family, residential loan, may provide 75 cents of borrowing capacity for every $1.00 pledged, whereas, a commercial loan may provide a lower amount. As a result, the Company’s strategic lending decisions can also affect its liquidity position.
The Company can raise additional funds through the issuance of equity or unsecured debt privately or publicly and has done so in the past. Additionally, the Company is able to enter into additional repurchase agreements or acquire brokered deposits at its discretion. The availability and cost of equity or debt on an unsecured basis is dependent on many factors. Some factors that will impact this source of liquidity are the Company’s financial position, the market environment, and the Company’s credit rating. As such, the Company is careful to monitor the various factors that could impact its ability to raise liquidity through these channels.
The table below shows current and unused liquidity capacity from various sources as of the dates indicated:
Table 2021 - Sources of Liquidity
| | | | March 31, 2018 | | | December 31, 2017 | | June 30, 2018 | | | December 31, 2017 | |
| | Outstanding | | Additional Borrowing Capacity | | | Outstanding | | Additional Borrowing Capacity | | Outstanding | | Additional Borrowing Capacity | | | Outstanding | | Additional Borrowing Capacity | |
| | (Dollars in thousands) | | (Dollars in thousands) | |
| Federal Home Loan Bank of Boston | $ | 53,257 |
| | $ | 956,434 |
| (2 | ) | | $ | 53,264 |
| | $ | 954,789 |
| (2 | ) | $ | 50,775 |
| | $ | 971,184 |
| (1 | ) | | $ | 53,264 |
| | $ | 954,789 |
| (1 | ) |
| Federal Reserve Bank of Boston | — |
| | 688,252 |
| (3 | ) | | — |
| | 720,005 |
| (3 | ) | — |
| | 705,463 |
| (2 | ) | | — |
| | 720,005 |
| (2 | ) |
| Unpledged Securities | — |
| | 419,656 |
| | | — |
| | 375,155 |
| | — |
| | 433,809 |
| | | — |
| | 375,155 |
| |
| Customer repurchase agreements | 137,914 |
| | — |
| (4 | ) | | 162,679 |
| | — |
| (4 | ) | 142,235 |
| | — |
| (3 | ) | | 162,679 |
| | — |
| (3 | ) |
| Junior subordinated debentures | 73,075 |
| | — |
| (4 | ) | | 73,073 |
| | — |
| (4 | ) | 73,077 |
| | — |
| (3 | ) | | 73,073 |
| | — |
| (3 | ) |
| Subordinated debt | 34,693 |
| | — |
| (4 | ) | | 34,682 |
| | — |
| (4 | ) | 34,705 |
| | — |
| (3 | ) | | 34,682 |
| | — |
| (3 | ) |
| Brokered deposits (1) | 52,123 |
| | — |
| (4 | ) | | 54,541 |
| | — |
| (4 | ) | |
| Reciprocal deposits | | 51,895 |
| | — |
| (3 | ) | | — |
| | — |
| |
| Brokered deposits | | 6,000 |
| | — |
| (3 | ) | | 54,541 |
| (4 | ) | — |
| (3 | ) |
| | $ | 351,062 |
| | $ | 2,064,342 |
| | | $ | 378,239 |
| | $ | 2,049,949 |
| | $ | 358,687 |
| | $ | 2,110,456 |
| | | $ | 378,239 |
| | $ | 2,049,949 |
| |
| |
| (1) | Inclusive of $46.1 millionand $48.5 million of brokered deposits acquired through participation in the Promontory Interfinancial Network as of March 31, 2018 and December 31, 2017, respectively.
|
| |
(2) | Loans with a carrying value of $1.5 billion at both March 31,June 30, 2018 and December 31, 2017 have been pledged to the Federal Home Loan Bank of Boston resulting in this additional unused borrowing capacity. |
| |
(3)(2) | Loans with a carrying value of $1.2 billion at both March 31,June 30, 2018 and December 31, 2017 have been pledged to the Federal Reserve Bank of Boston resulting in this additional unused borrowing capacity. |
| |
(4)(3) | The additional borrowing capacity has not been assessed for these categories. |
| |
| (4) | Inclusive of $48.5 million of reciprocal deposits acquired through participation in the Promontory Interfinancial Network as of and December 31, 2017. The Economic Growth, Regulatory Relief, and Consumer Protection Act, which was promulgated during the second quarter of 2018, states that most reciprocal deposits are no longer treated as brokered deposits. As such, the Company is prospectively reporting deposits from the Promontory Interfinancial Network as nonbrokered. |
In addition to policies used for managing operational liquidity, the Board of Directors and the ALCO recognize the need to establish reasonable guidelines for managing through an environment of heightened liquidity risk. Catalysts for elevated liquidity risk can be Bank-specific issues and/or systemic industry-wide events. It is therefore the responsibility of the Board and the ALCO to institute systems and controls to provide advanced detection of potentially significant funding shortages, establish methods for assessing and monitoring risk levels, and institute prompt responses that may alleviate/circumvent a potential liquidity crisis. As such, the Board of Directors and the ALCO have put a Liquidity Contingency Plan in place. The overall goal of this plan is to provide a framework for the Bank to help detect liquidity problems promptly and appropriately address potential liquidity problems in a timely manner. In a period of perceived heightened liquidity risk, the Liquidity Contingency Plan provides for the establishment of a Liquidity Crisis Task Force. The Liquidity Crisis Task Force is responsible for monitoring the potential for a liquidity crisis and for establishing and executing an appropriate response.
Off-Balance Sheet Arrangements There were no material changes in off-balance sheet financial instruments during the three months ended March 31,June 30, 2018. See Note 8, "Derivative and Hedging Activities" and Note 13, "Commitments and Contingencies" within Condensed Notes to Consolidated Financial Statements included in Item 1 hereof for more information relating to the Company's off-balance sheet financial instruments.
Contractual Obligations, Commitments, and Contingencies There were no material changes in contractual obligations, commitments, or contingencies during the three months ended March 31,June 30, 2018. Please refer to the Company's Annual Report on Form 10-K for the fiscal year ended December 31, 2017 for a complete table of contractual obligations, commitments and contingencies.
Item 3. Quantitative and Qualitative Disclosures About Market Risk
Information required by this Item 3 is included in the "Risk Management" section of Item 2 of Part I of this Form 10-Q, “Management’s Discussion and Analysis of Financial Condition and Results of Operations.”
Item 4. Controls and Procedures
Conclusion Regarding the Effectiveness of Disclosure Controls and Procedures. The Company carried out an evaluation, under the supervision and with the participation of the Company’s management, including the Company’s Chief Executive Officer along with the Company’s Chief Financial Officer, of the effectiveness of the design and operation of the Company’s disclosure controls and procedures, as such term is defined under Rules 13a-15(e) and 15d-15(e) promulgated under the Securities Exchange Act of 1934, as amended. Based upon that evaluation, the Company’s Chief Executive Officer along with the Company’s Chief Financial Officer concluded that the Company’s disclosure controls and procedures are effective as of the end of the period covered by this quarterly report.
Changes in Internal Controls over Financial Reporting. There were no changes in the Company's internal controlcontrols over financial reporting that occurred during the firstsecond quarter of 2018 that have materially affected or are reasonably likely to materially affect the Company’s internal controls over financial reporting.
PART II. OTHER INFORMATION
Item 1. Legal Proceedings
At March 31,June 30, 2018, the Bank was involved in pending lawsuits that arose in the ordinary course of business. Management has reviewed these pending lawsuits with legal counsel and has taken into consideration the view of counsel as to their outcome. In the opinion of management, the final disposition of pending lawsuits is not expected to have a material adverse effect on the Company’s financial position or results of operations.
Item 1A. Risk Factors
As of the date of this report, there have been no material changes with regard to the Risk Factors disclosed in Item 1A of our Annual Report on Form 10-K for the fiscal year ended December 31, 2017, which are incorporated herein by reference.
Item 2. Unregistered Sales of Equity Securities and Use of Proceeds
(a) Not applicable.
(b) Not applicable.
(c) The following table sets forth information regarding the Company’s repurchases of its common stock during the three months ended March 31,June 30, 2018:
|
| | | | | | | | | | | | |
| | Issuer Purchases of Equity Securities |
| | Total Number of Shares Purchased (1) | | Average Price Paid Per Share | | Total Number of Shares Purchased as Part of Publicly Announced Plan or Program (2) | | Maximum Number of Shares That May Yet Be Purchased Under the Plan or Program |
| Period | | | | | | | |
| January 1 to January 31, 2018 | — |
| | $ | — |
| | — |
| | — |
|
| February 1 to February 28, 2018 | 21,536 |
| | $ | 70.37 |
| | — |
| | — |
|
| March 1 to March 31, 2018 | 3,050 |
| | $ | 72.78 |
| | — |
| | — |
|
| Total | 24,586 |
| | | | — |
| | — |
|
|
| | | | | | | | | | | | |
| | Issuer Purchases of Equity Securities |
| | Total Number of Shares Purchased (1) | | Average Price Paid Per Share | | Total Number of Shares Purchased as Part of Publicly Announced Plan or Program (2) | | Maximum Number of Shares That May Yet Be Purchased Under the Plan or Program |
| Period | | | | | | | |
| April 1 to April 30, 2018 | 169 |
| | $ | 73.20 |
| | — |
| | — |
|
| May 1 to May 31, 2018 | 54 |
| | $ | 74.00 |
| | — |
| | — |
|
| June 1 to June 30, 2018 | 51 |
| | $ | 80.68 |
| | — |
| | — |
|
| Total | 274 |
| | | | — |
| | — |
|
| |
| (1) | Shares repurchased relate to the surrendering of shares in connection with the exercise and/or vesting of equity compensation grants to satisfy related tax withholding obligations. |
| |
| (2) | The Company does not currently have a stock repurchase program or plan in place. |
Item 3. Defaults Upon Senior Securities—None
Item 4. Mine Safety Disclosures - Not Applicable
Item 5. Other Information—None
Item 6. Exhibits
Exhibit Index
|
| |
| 2.1 | |
| 10.1 | |
| 31.1 | |
| 31.2 | |
| 32.1 | |
| 32.2 | |
| 101 | Interactive Data File * |
SIGNATURES
Pursuant to the requirements of the Securities Exchange Act of 1934, the registrant has duly caused this report to be signed on its behalf by the undersigned thereunto duly authorized.
INDEPENDENT BANK CORP.
(registrant)
|
| | |
May 3,August 2, 2018 | | /s/ Christopher Oddleifson |
| | | Christopher Oddleifson President and Chief Executive Officer (Principal Executive Officer) |
|
| | |
May 3,August 2, 2018 | | /s/ Robert D. Cozzone |
| | | Robert D. Cozzone Chief Financial Officer (Principal Financial Officer) |