UNITED STATES
SECURITIES AND EXCHANGE COMMISSION
WASHINGTON, D.C. 20549
___________________________________________________
FORM 10-Q
|
| | | | |
| ☒ | QUARTERLY REPORT PURSUANT TO SECTION 13 OR 15(d) OF
THE SECURITIES EXCHANGE ACT OF 1934
|
For the quarterly period ended March 31, 20202021
|
| | | | |
| ☐ | TRANSITION REPORT PURSUANT TO SECTION 13 OR 15(d) OF THE SECURITIES EXCHANGE ACT OF 1934 |
For the transition period from to
|
| | | | |
| Commission File Number: | 1-9047 |
Independent Bank Corp.
(Exact name of registrant as specified in its charter)
___________________________________________________
|
| |
Massachusetts | 04-2870273 |
(State or other jurisdiction of
incorporation or organization)
| (I.R.S. Employer
Identification No.)
|
|
| | | | |
| MA | 04-2870273 |
(State or other jurisdiction of
incorporation or organization) | (I.R.S. Employer
Identification No.) |
| | | | | | | | | | | | | | |
| Office Address: | 2036 Washington Street, | Hanover, | MassachusettsMA | 02339 |
| Mailing Address: | 288 Union Street, | Rockland, | MassachusettsMA | 02370 |
| (Address of principal executive offices, including zip code) |
(781) 878-6100
(Registrant’s telephone number, including area code)
|
| | | | | | | |
| Securities registered pursuant to Section 12(b) of the Act: |
| Title of each Class | Trading Symbol | Name of each exchange on which registered |
| Common Stock, $0.01 par value per share | INDB | NASDAQThe Nasdaq Global Select Market |
Indicate by check mark whether the registrant (1) has filed all reports required to be filed by Section 13 or 15(d) of the Securities Exchange Act of 1934 during the preceding 12 months (or for such shorter period that the registrant was required to file such reports), and (2) has been subject to such filing requirements for the past 90 days. Yes x No o
Indicate by check mark whether the registrant has submitted electronically every Interactive Data File required to be submitted pursuant to Rule 405 of Regulation S-T (§232.405 of this chapter) during the preceding 12 months (or for such shorter period that the registrant was required to submit such files). Yes x No o
Indicate by check mark whether the registrant is a large accelerated filer, an accelerated filer, a non-accelerated filer, a smaller reporting company, or an emerging growth company. See the definitions of “large accelerated filer,” “accelerated filer,” “smaller reporting company” and "emerging growth company" in Rule 12b-2 of the Exchange Act.
| | | | | | | | | | | |
| Large Accelerated Filer | x | Accelerated Filer | ☐ |
| | | |
Large Accelerated Filer | x | Accelerated Filer | ☐ |
| | | |
| Non-accelerated Filer | ☐ | Smaller Reporting Company | ☐ |
| | | |
| | Emerging Growth Company | ☐ |
If an emerging growth company, indicate by check mark if the registrant has elected not to use the extended transition period for complying with any new or revised financial accounting standards provided pursuant to Section 13(a) of the Exchange Act. o
|
| | | | | | | | | | | | | |
| Indicate by check mark whether the registrant is a shell company (as defined in Rule 12b-2 of the Exchange Act.) | Yes | ☐ | No | ☒ |
As of May 6, 2020,4, 2021, there were 32,934,65633,030,954 shares of the issuer’s common stock outstanding, par value $0.01 per share.
| Table of Contents |
| |
| PAGE |
| |
| |
| |
| |
| |
| |
| |
| |
Condensed Notes to Consolidated Financial Statements - March 31, 20192021 | |
| |
| |
| |
| |
| |
| |
| |
| |
| |
| |
| |
| |
| |
| |
| |
| |
| |
| |
| |
| |
| |
| |
| |
| |
| |
| |
| |
| |
| |
| |
| |
| |
| |
| |
| |
| |
|
| | | | |
| |
| |
| |
| |
| |
| |
| |
| |
| |
| |
| |
| |
| |
| Exhibit 31.1 – Certification 302 | |
| Exhibit 31.2 – Certification 302 | |
| Exhibit 32.1 – Certification 906 | |
| Exhibit 32.2 – Certification 906 | |
PART 1. FINANCIAL INFORMATION
Item 1. Financial Statements
INDEPENDENT BANK CORP.
CONSOLIDATED BALANCE SHEETS
(Unaudited—Dollars in thousands)
| | | | | | | | | | | |
| March 31
2021 | | December 31
2020 |
| Assets |
| Cash and due from banks | $ | 126,651 | | | $ | 169,460 | |
| Interest-earning deposits with banks | 1,642,688 | | | 1,127,176 | |
| Securities | | | |
| Trading | 3,269 | | | 2,838 | |
| Equity | 22,419 | | | 22,107 | |
| Available for sale (amortized cost $593,167 and $395,453) | 600,213 | | | 412,860 | |
| Held to maturity (fair value $820,430 and $752,177) | 805,529 | | | 724,512 | |
| Total securities | 1,431,430 | | | 1,162,317 | |
| Loans held for sale (at fair value) | 41,632 | | | 58,104 | |
| Loans | | | |
| Commercial and industrial | 2,086,671 | | | 2,103,152 | |
| Commercial real estate | 4,177,617 | | | 4,173,927 | |
| Commercial construction | 516,362 | | | 553,929 | |
| Small business | 174,211 | | | 175,023 | |
| Residential real estate | 1,241,789 | | | 1,296,183 | |
| Home equity - first position | 610,907 | | | 633,142 | |
| Home equity - subordinate positions | 417,588 | | | 435,648 | |
| Other consumer | 21,546 | | | 21,862 | |
| Total loans | 9,246,691 | | | 9,392,866 | |
| Less: allowance for credit losses | (107,549) | | | (113,392) | |
| Net loans | 9,139,142 | | | 9,279,474 | |
| Federal Home Loan Bank stock | 10,250 | | | 10,250 | |
| Bank premises and equipment, net | 115,945 | | | 116,393 | |
| Goodwill | 506,206 | | | 506,206 | |
| Other intangible assets | 21,689 | | | 23,107 | |
| Cash surrender value of life insurance policies | 241,365 | | | 200,525 | |
| | | |
| Other assets | 496,916 | | | 551,289 | |
| Total assets | $ | 13,773,914 | | | $ | 13,204,301 | |
| Liabilities and Stockholders' Equity |
| Deposits | | | |
| Noninterest-bearing demand deposits | $ | 4,136,259 | | | $ | 3,762,306 | |
| Savings and interest checking accounts | 4,242,235 | | | 4,047,332 | |
| Money market | 2,346,985 | | | 2,232,903 | |
| Time certificates of deposit of $100,000 and over | 465,182 | | | 525,424 | |
| Other time certificates of deposits | 402,863 | | | 425,205 | |
| Total deposits | 11,593,524 | | | 10,993,170 | |
| Borrowings | | | |
| Federal Home Loan Bank borrowings | 35,717 | | | 35,740 | |
| | | |
| | | |
| | | |
| Long-term borrowings (less unamortized debt issuance costs of $26 and $40) | 28,099 | | | 32,773 | |
|
| | | | | | | |
| | March 31
2020 | | December 31
2019 |
| Assets |
| Cash and due from banks | $ | 125,638 |
| | $ | 114,686 |
|
| Interest-earning deposits with banks | 345,739 |
| | 36,288 |
|
| Securities | | | |
| Trading | 2,247 |
| | 2,179 |
|
| Equity | 19,439 |
| | 21,261 |
|
| Available for sale (amortized cost $419,452 and $420,703) | 437,296 |
| | 426,424 |
|
| Held to maturity (fair value $809,355 and $753,263) | 777,798 |
| | 740,806 |
|
| Total securities | 1,236,780 |
| | 1,190,670 |
|
| Loans held for sale (at fair value) | 43,756 |
| | 33,307 |
|
| Loans | | | |
| Commercial and industrial | 1,448,224 |
| | 1,395,036 |
|
| Commercial real estate | 4,061,347 |
| | 4,002,359 |
|
| Commercial construction | 527,138 |
| | 547,293 |
|
| Small business | 177,820 |
| | 174,497 |
|
| Residential real estate | 1,528,416 |
| | 1,590,569 |
|
| Home equity - first position | 656,994 |
| | 649,255 |
|
| Home equity - subordinate positions | 489,276 |
| | 484,543 |
|
| Other consumer | 27,215 |
| | 30,087 |
|
| Total loans | 8,916,430 |
| | 8,873,639 |
|
| Less: allowance for credit losses | (92,376 | ) | | (67,740 | ) |
| Net loans | 8,824,054 |
| | 8,805,899 |
|
| Federal Home Loan Bank stock | 23,274 |
| | 14,424 |
|
| Bank premises and equipment, net | 121,873 |
| | 123,674 |
|
| Goodwill | 506,206 |
| | 506,206 |
|
| Other intangible assets | 27,466 |
| | 29,286 |
|
| Cash surrender value of life insurance policies | 197,772 |
| | 197,372 |
|
| Other assets | 527,682 |
| | 343,353 |
|
| Total assets | $ | 11,980,240 |
| | $ | 11,395,165 |
|
| Liabilities and Stockholders' Equity |
| Deposits | | | |
| Noninterest-bearing demand deposits | $ | 2,820,312 |
| | $ | 2,662,591 |
|
| Savings and interest checking accounts | 3,428,546 |
| | 3,232,909 |
|
| Money market | 1,897,632 |
| | 1,856,552 |
|
| Time certificates of deposit of $100,000 and over | 629,528 |
| | 663,645 |
|
| Other time certificates of deposits | 640,180 |
| | 731,670 |
|
| Total deposits | 9,416,198 |
| | 9,147,367 |
|
| Borrowings | | | |
| Federal Home Loan Bank borrowings | 358,591 |
| | 115,748 |
|
| | | Long-term borrowings (less unamortized debt issuance costs of $80 and $94) | 74,920 |
| | 74,906 |
| |
| Junior subordinated debentures (less unamortized debt issuance costs of $39 and $40) | 62,849 |
| | 62,848 |
| |
| Subordinated debentures (less unamortized debt issuance costs of $375 and $399) | 49,625 |
| | 49,601 |
| |
| Junior subordinated debentures (less unamortized debt issuance costs of $37 and $37) | | Junior subordinated debentures (less unamortized debt issuance costs of $37 and $37) | 62,851 | | | 62,851 | |
| Subordinated debentures (less unamortized debt issuance costs of $280 and $304) | | Subordinated debentures (less unamortized debt issuance costs of $280 and $304) | 49,720 | | | 49,696 | |
| Total borrowings | 545,985 |
| | 303,103 |
| Total borrowings | 176,387 | | | 181,060 | |
| Other liabilities | 338,401 |
| | 236,552 |
| Other liabilities | 288,632 | | | 327,386 | |
| Total liabilities | 10,300,584 |
| | 9,687,022 |
| Total liabilities | 12,058,543 | | | 11,501,616 | |
| Commitments and contingencies | — |
| | — |
| Commitments and contingencies | 0 | | | 0 | |
| Stockholders' equity | | | | Stockholders' equity | |
| Preferred stock, $.01 par value, authorized: 1,000,000 shares, outstanding: none | — |
| | — |
| |
Common stock, $.01 par value, authorized: 75,000,000 shares,
issued and outstanding: 33,260,005 shares at March 31, 2020 and 34,377,388 shares at December 31, 2019 (includes 147,892 and 147,184 shares of unvested participating restricted stock awards, respectively) | 331 |
| | 342 |
| |
| Value of shares held in rabbi trust at cost: 133,857 shares at March 31, 2020 and 143,820 shares at December 31, 2019 | (4,604 | ) | | (4,735 | ) | |
| Preferred stock, $0.01 par value, authorized: 1,000,000 shares, outstanding: NaN | | Preferred stock, $0.01 par value, authorized: 1,000,000 shares, outstanding: NaN | 0 | | | 0 | |
Common stock, $0.01 par value, authorized: 75,000,000 shares, issued and outstanding: 33,024,882 shares at March 31, 2021 and 32,965,692 shares at December 31, 2020 (includes 144,790 and 135,205 shares of unvested participating restricted stock awards, respectively) | | Common stock, $0.01 par value, authorized: 75,000,000 shares, issued and outstanding: 33,024,882 shares at March 31, 2021 and 32,965,692 shares at December 31, 2020 (includes 144,790 and 135,205 shares of unvested participating restricted stock awards, respectively) | 329 | | | 328 | |
| Value of shares held in rabbi trust at cost: 83,629 shares at March 31, 2021 and 84,126 shares at December 31, 2020 | | Value of shares held in rabbi trust at cost: 83,629 shares at March 31, 2021 and 84,126 shares at December 31, 2020 | (3,080) | | | (3,066) | |
| Deferred compensation and other retirement benefit obligations | 4,604 |
| | 4,735 |
| Deferred compensation and other retirement benefit obligations | 3,080 | | | 3,066 | |
| Additional paid in capital | 962,513 |
| | 1,035,450 |
| Additional paid in capital | 946,002 | | | 945,638 | |
| Retained earnings | 667,084 |
| | 654,182 |
| Retained earnings | 741,883 | | | 716,024 | |
| Accumulated other comprehensive income, net of tax | 49,728 |
| | 18,169 |
| Accumulated other comprehensive income, net of tax | 27,157 | | | 40,695 | |
| Total stockholders’ equity | 1,679,656 |
| | 1,708,143 |
| Total stockholders’ equity | 1,715,371 | | | 1,702,685 | |
| Total liabilities and stockholders' equity | $ | 11,980,240 |
| | $ | 11,395,165 |
| Total liabilities and stockholders' equity | $ | 13,773,914 | | | $ | 13,204,301 | |
The accompanying condensed notes are an integral part of these unaudited consolidated financial statements.
INDEPENDENT BANK CORP.
CONSOLIDATED STATEMENTS OF INCOME
(Unaudited—Dollars in thousands, except per share data)
| | | | Three Months Ended | | | Three Months Ended |
| | March 31 | | | March 31 |
| | 2020 | | 2019 | | | 2021 | | 2020 |
| Interest income | | | | Interest income | | | | |
| Interest and fees on loans | $ | 99,022 |
| | $ | 83,608 |
| Interest and fees on loans | | $ | 92,383 | | | $ | 99,022 | |
| Taxable interest and dividends on securities | 7,957 |
| | 7,465 |
| Taxable interest and dividends on securities | | 6,627 | | | 7,957 | |
| Nontaxable interest and dividends on securities | 9 |
| | 13 |
| Nontaxable interest and dividends on securities | | 5 | | | 9 | |
| Interest on loans held for sale | 232 |
| | 31 |
| Interest on loans held for sale | | 296 | | | 232 | |
| Interest on federal funds sold and short-term investments | 160 |
| | 426 |
| Interest on federal funds sold and short-term investments | | 326 | | | 160 | |
| Total interest and dividend income | 107,380 |
| | 91,543 |
| Total interest and dividend income | | 99,637 | | | 107,380 | |
| Interest expense | | | | Interest expense | | | | |
| Interest on deposits | 10,892 |
| | 7,028 |
| Interest on deposits | | 2,711 | | | 10,892 | |
| Interest on borrowings | 2,184 |
| | 1,990 |
| Interest on borrowings | | 1,342 | | | 2,184 | |
| Total interest expense | 13,076 |
| | 9,018 |
| Total interest expense | | 4,053 | | | 13,076 | |
| Net interest income | 94,304 |
| | 82,525 |
| Net interest income | | 95,584 | | | 94,304 | |
| Provision for credit losses | 25,000 |
| | 1,000 |
| Provision for credit losses | | (2,500) | | | 25,000 | |
| Net interest income after provision for credit losses | 69,304 |
| | 81,525 |
| Net interest income after provision for credit losses | | 98,084 | | | 69,304 | |
| Noninterest income | | | | Noninterest income | | | | |
| Deposit account fees | 4,970 |
| | 4,406 |
| Deposit account fees | | 3,584 | | | 4,970 | |
| Interchange and ATM fees | 4,896 |
| | 4,516 |
| Interchange and ATM fees | | 2,720 | | | 4,896 | |
| Investment management | 6,829 |
| | 6,748 |
| Investment management | | 8,304 | | | 6,829 | |
| Mortgage banking income | 861 |
| | 806 |
| Mortgage banking income | | 5,740 | | | 861 | |
| Increase in cash surrender value of life insurance policies | | Increase in cash surrender value of life insurance policies | | 1,323 | | | 1,276 | |
| Gain on life insurance benefits | 357 |
| | — |
| Gain on life insurance benefits | | 258 | | | 357 | |
| Increase in cash surrender value of life insurance policies | 1,276 |
| | 972 |
| |
| Loan level derivative income | 3,597 |
| | 641 |
| Loan level derivative income | | 173 | | | 3,597 | |
| | Other noninterest income | 3,649 |
| | 3,444 |
| Other noninterest income | | 3,144 | | | 3,649 | |
| Total noninterest income | 26,435 |
| | 21,533 |
| Total noninterest income | | 25,246 | | | 26,435 | |
| Noninterest expenses | | | | Noninterest expenses | | | | |
| Salaries and employee benefits | 37,349 |
| | 33,117 |
| Salaries and employee benefits | | 39,889 | | | 37,349 | |
| Occupancy and equipment expenses | 9,317 |
| | 7,130 |
| Occupancy and equipment expenses | | 9,273 | | | 9,317 | |
| Data processing and facilities management | 1,658 |
| | 1,326 |
| Data processing and facilities management | | 1,665 | | | 1,658 | |
| FDIC assessment | — |
| | 616 |
| FDIC assessment | | 1,050 | | | — | |
| Advertising expense | 1,105 |
| | 1,213 |
| |
| | Consulting expense | 1,336 |
| | 764 |
| Consulting expense | | 2,391 | | | 1,336 | |
| Core deposit amortization | 1,531 |
| | 857 |
| Core deposit amortization | | 1,392 | | | 1,531 | |
| Merger and acquisition expense | — |
| | 1,032 |
| |
| | Software maintenance | 1,685 |
| | 1,165 |
| Software maintenance | | 1,970 | | | 1,685 | |
| Unrealized loss on equity securities | 1,799 |
| | — |
| Unrealized loss on equity securities | | 0 | | | 1,799 | |
| Other noninterest expenses | 11,060 |
| | 9,091 |
| Other noninterest expenses | | 12,052 | | | 12,165 | |
| Total noninterest expenses | 66,840 |
| | 56,311 |
| Total noninterest expenses | | 69,682 | | | 66,840 | |
| Income before income taxes | 28,899 |
| | 46,747 |
| Income before income taxes | | 53,648 | | | 28,899 | |
| Provision for income taxes | 2,148 |
| | 11,522 |
| Provision for income taxes | | 11,937 | | | 2,148 | |
| Net income | $ | 26,751 |
| | $ | 35,225 |
| Net income | | $ | 41,711 | | | $ | 26,751 | |
| Basic earnings per share | $ | 0.78 |
| | $ | 1.25 |
| Basic earnings per share | | $ | 1.26 | | | $ | 0.78 | |
| Diluted earnings per share | $ | 0.78 |
| | $ | 1.25 |
| Diluted earnings per share | | $ | 1.26 | | | $ | 0.78 | |
| Weighted average common shares (basic) | 34,184,431 |
| | 28,106,184 |
| Weighted average common shares (basic) | | 32,995,332 | | | 34,184,431 | |
| Common share equivalents | 36,827 |
| | 54,466 |
| Common share equivalents | | 30,098 | | | 36,827 | |
| Weighted average common shares (diluted) | 34,221,258 |
| | 28,160,650 |
| Weighted average common shares (diluted) | | 33,025,430 | | | 34,221,258 | |
| Cash dividends declared per common share | $ | 0.46 |
| | $ | 0.44 |
| Cash dividends declared per common share | | $ | 0.48 | | | $ | 0.46 | |
The accompanying condensed notes are an integral part of these unaudited consolidated financial statements.
INDEPENDENT BANK CORP.
CONSOLIDATED STATEMENTS OF COMPREHENSIVE INCOME
(Unaudited—Dollars in thousands)
| | | | Three Months Ended | | | Three Months Ended |
| | March 31 | | | March 31 |
| | 2020 | | 2019 | | | 2021 | | 2020 |
| Net income | $ | 26,751 |
| | $ | 35,225 |
| Net income | | $ | 41,711 | | | $ | 26,751 | |
| Other comprehensive income, net of tax | | | | Other comprehensive income, net of tax | | |
| Net change in fair value of securities available for sale | 9,347 |
| | 4,729 |
| Net change in fair value of securities available for sale | | (7,774) | | | 9,347 | |
| Net change in fair value of cash flow hedges | 22,984 |
| | 3,285 |
| Net change in fair value of cash flow hedges | | (6,583) | | | 22,984 | |
| Net change in other comprehensive income for defined benefit postretirement plans | (772 | ) | | 40 |
| Net change in other comprehensive income for defined benefit postretirement plans | | 819 | | | (772) | |
| Total other comprehensive income | 31,559 |
| | 8,054 |
| |
| Total other comprehensive income (loss) | | Total other comprehensive income (loss) | | (13,538) | | | 31,559 | |
| Total comprehensive income | $ | 58,310 |
| | $ | 43,279 |
| Total comprehensive income | | $ | 28,173 | | | $ | 58,310 | |
The accompanying condensed notes are an integral part of these unaudited consolidated financial statements.
INDEPENDENT BANK CORP.
CONSOLIDATED STATEMENTS OF STOCKHOLDERS’ EQUITY
Three Months Ended March 31, 20202021 and 20192020
(Unaudited—Dollars in thousands, except per share data)
| | | | | | | | | | | | | | | | | | | | | | | | | | | | | | | | | | | | | | | | | | | | | | | |
| Common Stock Outstanding | | Common Stock | | Value of Shares Held in Rabbi Trust at Cost | | Deferred Compensation Obligation | | Additional Paid in Capital | | Retained Earnings | | Accumulated Other
Comprehensive Income (Loss) | | Total |
| Balance December 31, 2020 | 32,965,692 | | $ | 328 | | | $ | (3,066) | | | $ | 3,066 | | | $ | 945,638 | | | $ | 716,024 | | | $ | 40,695 | | | $ | 1,702,685 | |
| | | | | | | | | | | | | | | |
| Net income | — | | | — | | | — | | | — | | | — | | | 41,711 | | | — | | | 41,711 | |
| Other comprehensive loss | — | | | — | | | — | | | — | | | — | | | — | | | (13,538) | | | (13,538) | |
| Common dividend declared ($0.48 per share) | — | | | — | | | — | | | — | | | — | | | (15,852) | | | — | | | (15,852) | |
| | | | | | | | | | | | | | | |
| Proceeds from exercise of stock options, net of cash paid | 4,744 | | | — | | | — | | | — | | | (57) | | | — | | | — | | | (57) | |
| Stock based compensation | — | | | — | | | — | | | — | | | 1,150 | | | — | | | — | | | 1,150 | |
| Restricted stock awards issued, net of awards surrendered | 48,106 | | | 1 | | | — | | | — | | | (1,221) | | | — | | | — | | | (1,220) | |
| Shares issued under direct stock purchase plan | 6,340 | | | — | | | — | | | — | | | 492 | | | — | | | — | | | 492 | |
| | | | | | | | | | | | | | | |
| Deferred compensation and other retirement benefit obligations | — | | | — | | | (14) | | | 14 | | | — | | | — | | | — | | | 0 | |
| Balance March 31, 2021 | 33,024,882 | | | $ | 329 | | | $ | (3,080) | | | $ | 3,080 | | | $ | 946,002 | | | $ | 741,883 | | | $ | 27,157 | | | $ | 1,715,371 | |
| | | | | | | | | | | | | | | |
| Balance December 31, 2019 | 34,377,388 | | | $ | 342 | | | $ | (4,735) | | | $ | 4,735 | | | $ | 1,035,450 | | | $ | 654,182 | | | $ | 18,169 | | | $ | 1,708,143 | |
| Cumulative effect accounting adjustment (1) | — | | | — | | | — | | | — | | | — | | | 1,553 | | | — | | | 1,553 | |
| | | | | | | | | | | | | | | |
| Net income | — | | | — | | | — | | | — | | | — | | | 26,751 | | | — | | | 26,751 | |
| Other comprehensive income | — | | | — | | | — | | | — | | | — | | | — | | | 31,559 | | | 31,559 | |
| Common dividend declared ($0.46 per share) | — | | | — | | | — | | | — | | | — | | | (15,402) | | | — | | | (15,402) | |
| | | | | | | | | | | | | | | |
| | | | | | | | | | | | | | | |
| Stock based compensation | — | | | — | | | — | | | — | | | 850 | | | — | | | — | | | 850 | |
| Restricted stock awards issued, net of awards surrendered | 42,531 | | | 1 | | | — | | | — | | | (1,133) | | | — | | | — | | | (1,132) | |
| Shares issued under direct stock purchase plan | 7,009 | | | 0 | | | — | | | — | | | 560 | | | — | | | — | | | 560 | |
| Shares repurchased under share repurchase program | (1,166,923) | | | (12) | | | — | | | — | | | (73,214) | | | — | | | — | | | (73,226) | |
| Deferred compensation and other retirement benefit obligations | — | | | — | | | 131 | | | (131) | | | — | | | — | | | — | | | 0 | |
| Balance March 31, 2020 | 33,260,005 | | | $ | 331 | | | $ | (4,604) | | | $ | 4,604 | | | $ | 962,513 | | | $ | 667,084 | | | $ | 49,728 | | | $ | 1,679,656 | |
|
| | | | | | | | | | | | | | | | | | | | | | | | | | | | | | |
| | Common Stock Outstanding | | Common Stock | | Value of Shares Held in Rabbi Trust at Cost | | Deferred Compensation Obligation | | Additional Paid in Capital | | Retained Earnings | | Accumulated Other
Comprehensive Income/(Loss) | | Total |
| Balance December 31, 2019 | 34,377,388 |
| | $ | 342 |
| | $ | (4,735 | ) | | $ | 4,735 |
| | $ | 1,035,450 |
| | $ | 654,182 |
| | $ | 18,169 |
| | $ | 1,708,143 |
|
| Cumulative effect accounting adjustment (1) | — |
| | — |
| | — |
| | — |
| | — |
| | 1,553 |
| | — |
| | 1,553 |
|
| Net income | — |
| | — |
| | — |
| | — |
| | — |
| | 26,751 |
| | — |
| | 26,751 |
|
| Other comprehensive income | — |
| | — |
| | — |
| | — |
| | — |
| | — |
| | 31,559 |
| | 31,559 |
|
| Common dividend declared ($0.46 per share) | — |
| | — |
| | — |
| | — |
| | — |
| | (15,402 | ) | | — |
| | (15,402 | ) |
| Stock based compensation | — |
| | — |
| | — |
| | — |
| | 850 |
| | — |
| | — |
| | 850 |
|
| Restricted stock awards issued, net of awards surrendered | 42,531 |
| | 1 |
| | — |
| | — |
| | (1,133 | ) | | — |
| | — |
| | (1,132 | ) |
| Shares issued under direct stock purchase plan | 7,009 |
| | — |
| | — |
| | — |
| | 560 |
| | — |
| | — |
| | 560 |
|
| Shares repurchased under share repurchase program | (1,166,923 | ) | | (12 | ) | | — |
| | — |
| | (73,214 | ) | | — |
| | — |
| | (73,226 | ) |
| Deferred compensation and other retirement benefit obligations | — |
| | — |
| | 131 |
| | (131 | ) | | — |
| | — |
| | — |
| | — |
|
| Balance March 31, 2020 | 33,260,005 |
| | $ | 331 |
|
| $ | (4,604 | ) |
| $ | 4,604 |
|
| $ | 962,513 |
|
| $ | 667,084 |
|
| $ | 49,728 |
|
| $ | 1,679,656 |
|
| | | | | | | | | | | | | | | | |
| Balance December 31, 2018 | 28,080,408 |
| | $ | 279 |
| | $ | (4,718 | ) | | $ | 4,718 |
| | $ | 527,648 |
| | $ | 546,736 |
| | $ | (1,173 | ) | | $ | 1,073,490 |
|
| Net income | — |
| | — |
| | — |
| | — |
| | — |
| | 35,225 |
| | — |
| | 35,225 |
|
| Other comprehensive loss | — |
| | — |
| | — |
| | — |
| | — |
| | — |
| | 8,054 |
| | 8,054 |
|
| Common dividend declared ($0.44 per share) | — |
| | — |
| | — |
| | — |
| | — |
| | (12,379 | ) | | — |
| | (12,379 | ) |
| Proceeds from exercise of stock options, net of cash paid | 6,000 |
| | — |
| | — |
| | — |
| | 165 |
| | — |
| | — |
| | 165 |
|
| Stock based compensation | — |
| | — |
| | — |
| | — |
| | 915 |
| | — |
| | — |
| | 915 |
|
| Restricted stock awards issued, net of awards surrendered | 44,407 |
| | 1 |
| | — |
| | — |
| | (1,420 | ) | | — |
| | — |
| | (1,419 | ) |
| Shares issued under direct stock purchase plan | 6,689 |
| | — |
| | — |
| | — |
| | 487 |
| | — |
| | — |
| | 487 |
|
| Deferred compensation and other retirement benefit obligations | — |
| | — |
| | 119 |
| | (119 | ) | | — |
| | — |
| | — |
| | — |
|
| Balance March 31, 2019 | 28,137,504 |
| | $ | 280 |
| | $ | (4,599 | ) | | $ | 4,599 |
| | $ | 527,795 |
| | $ | 569,582 |
| | $ | 6,881 |
| | $ | 1,104,538 |
|
| |
(1) | Represents adjustment needed to reflect the cumulative impact on retained earnings pursuant to the Company's adoption of Accounting Standards Update 2016-13. The adjustment presented includes $1.1 million ($817,000, net of tax) attributable to the change in accounting methodology for estimating the allowance for credit losses and $1.0 million ($736,000, net of tax) related to the reserve for unfunded commitments resulting from the Company's adoption of the standard. Amount shown in the table above is presented net of tax. |
The accompanying condensed notes are an integral part of these unaudited consolidated financial statements.
INDEPENDENT BANK CORP.
CONSOLIDATED STATEMENTS OF CASH FLOWS
(Unaudited—Dollars in thousands)
|
| | | | | | | |
| | Three Months Ended |
| | March 31 |
| | 2020 | | 2019 |
| Cash flow from operating activities | | | |
| Net income | $ | 26,751 |
| | $ | 35,225 |
|
| Adjustments to reconcile net income to net cash provided by (used in) operating activities | | | |
| Depreciation and amortization | 6,992 |
| | 4,101 |
|
| Change in unamortized net loan costs and premiums | (735 | ) | | (453 | ) |
| Provision for loan losses | 25,000 |
| | 1,000 |
|
| Deferred income tax expense | 3,108 |
| | 539 |
|
| Net (gain) loss on equity securities | 1,801 |
| | (907 | ) |
| Net loss on bank premises and equipment | 420 |
| | 25 |
|
| Realized gain on sale leaseback transaction | (145 | ) | | (145 | ) |
| Stock based compensation | 850 |
| | 915 |
|
| Increase in cash surrender value of life insurance policies | (1,276 | ) | | (972 | ) |
| Gain on life insurance benefits | (357 | ) | | — |
|
| Operating lease payments | (2,926 | ) | | (2,165 | ) |
| Change in fair value on loans held for sale | 914 |
| | (1 | ) |
| Net change in: | | | |
| Trading assets | (68 | ) | | (333 | ) |
| Loans held for sale | (11,363 | ) | | 846 |
|
| Other assets | (151,830 | ) | | 1,721 |
|
| Other liabilities | 92,461 |
| | (5,228 | ) |
| Total adjustments | (37,154 | ) | | (1,057 | ) |
| Net cash provided by (used in) operating activities | (10,403 | ) | | 34,168 |
|
| Cash flows provided by (used in) investing activities | | | |
| Purchases of equity securities | (108 | ) | | (105 | ) |
| Proceeds from maturities and principal repayments of securities available for sale | 31,280 |
| | 11,318 |
|
| Purchases of securities available for sale | (30,095 | ) | | — |
|
| Proceeds from maturities and principal repayments of securities held to maturity | 48,183 |
| | 19,003 |
|
| Purchases of securities held to maturity | (84,824 | ) | | (30,502 | ) |
| Net redemption (purchases) of Federal Home Loan Bank stock | (8,850 | ) | | 8,016 |
|
| Investments in low income housing projects | (5,934 | ) | | (292 | ) |
| Purchases of life insurance policies | (93 | ) | | (93 | ) |
| Proceeds from life insurance policies | 1,326 |
| | — |
|
| Net increase in loans | (41,283 | ) | | (70,378 | ) |
| Purchases of bank premises and equipment | (1,749 | ) | | (3,713 | ) |
| Proceeds from the sale of bank premises and equipment | 9 |
| | 13 |
|
| Net cash used in investing activities | (92,138 | ) | | (66,733 | ) |
| Cash flows provided by (used in) financing activities | | | |
| Net increase (decrease) in time deposits | (125,396 | ) | | 12,464 |
|
| Net increase in other deposits | 394,438 |
| | 24,034 |
|
| Net advances (repayments) of short-term Federal Home Loan Bank borrowings | 257,826 |
| | (122,046 | ) |
| | | | | | | | | | | |
| | Three Months Ended |
| March 31 |
| 2021 | | 2020 |
| Cash flow from operating activities | | | |
| Net income | $ | 41,711 | | | $ | 26,751 | |
| Adjustments to reconcile net income to net cash provided by (used in) operating activities | | | |
| Depreciation and amortization | 8,228 | | | 6,992 | |
| Change in unamortized net loan costs and premiums | (10,318) | | | (735) | |
| | | |
| Provision for credit losses | (2,500) | | | 25,000 | |
| Deferred income tax expense | 567 | | | 3,108 | |
| Net (gain) loss on equity securities | (316) | | | 1,801 | |
| | | |
| | | |
| Net loss on bank premises and equipment | 4 | | | 420 | |
| | | |
| | | |
| | | |
| | | |
| Realized gain on sale leaseback transaction | (145) | | | (145) | |
| Stock based compensation | 1,150 | | | 850 | |
| | | |
| Increase in cash surrender value of life insurance policies | (1,323) | | | (1,276) | |
| Gain on life insurance benefits | (258) | | | (357) | |
| Operating lease payments | (3,077) | | | (2,926) | |
| Change in fair value on loans held for sale | 1,764 | | | (255) | |
| Net change in: | | | |
| Trading assets | (431) | | | (68) | |
| | | |
| Loans held for sale | 14,708 | | | (10,194) | |
| Other assets | 70,901 | | | (151,830) | |
| Other liabilities | (53,201) | | | 92,461 | |
| Total adjustments | 25,753 | | | (37,154) | |
| Net cash provided by (used in) operating activities | 67,464 | | | (10,403) | |
| Cash flows used in investing activities | | | |
| | | |
| | | |
| Purchases of equity securities | (124) | | | (108) | |
| | | |
| Proceeds from maturities and principal repayments of securities available for sale | 26,092 | | | 31,280 | |
| Purchases of securities available for sale | (223,986) | | | (30,095) | |
| Proceeds from maturities and principal repayments of securities held to maturity | 68,497 | | | 48,183 | |
| Purchases of securities held to maturity | (149,453) | | | (84,824) | |
| Net purchases of Federal Home Loan Bank stock | 0 | | | (8,850) | |
| Investments in low income housing projects | (6,632) | | | (5,934) | |
| Purchases of life insurance policies | (40,093) | | | (93) | |
| Proceeds from life insurance policies | 576 | | | 1,326 | |
| Net (increase) decrease in loans | 153,150 | | | (41,283) | |
| | | |
| Purchases of bank premises and equipment | (2,524) | | | (1,749) | |
| Proceeds from the sale of bank premises and equipment | 4 | | | 9 | |
| | | |
| | | |
| | | |
| Net cash used in investing activities | (174,493) | | | (92,138) | |
| Cash flows provided by financing activities | | | |
| Net decrease in time deposits | (82,569) | | | (125,396) | |
| Net increase in other deposits | 682,938 | | | 394,438 | |
| | | |
| Net advances of short-term Federal Home Loan Bank borrowings | 0 | | | 257,826 | |
| | | |
| Repayments of long-term Federal Home Loan Bank borrowings | 0 | | | (15,000) | |
| | | |
| | | |
| | | |
| | | |
| | | |
|
| | | | | | | |
| Repayments of long-term Federal Home Loan Bank borrowings | (15,000 | ) | | — |
|
| Proceeds from line of credit, net of issuance costs | — |
| | 49,993 |
|
| Proceeds from long-term debt, net of issuance costs | — |
| | 74,914 |
|
| Repayments of junior subordinated debentures, net of issuance costs | — |
| | (3,093 | ) |
| Proceeds from subordinated debentures, net of issuance costs | — |
| | 49,556 |
|
| Net proceeds from exercise of stock options | — |
| | 165 |
|
| Restricted stock awards issued, net of awards surrendered | (1,132 | ) | | (1,419 | ) |
| Proceeds from shares issued under direct stock purchase plan | 560 |
| | 487 |
|
| Payments for shares repurchased under share repurchase program | (73,226 | ) | | — |
|
| Common dividends paid | (15,126 | ) | | (10,671 | ) |
| Net cash provided by financing activities | 422,944 |
| | 74,384 |
|
| Net increase in cash and cash equivalents | 320,403 |
| | 41,819 |
|
| Cash and cash equivalents at beginning of year | 150,974 |
| | 250,455 |
|
| Cash and cash equivalents at end of period | $ | 471,377 |
| | $ | 292,274 |
|
| Supplemental schedule of noncash activities | | | |
| Net increase in capital commitments relating to low income housing project investments | $ | 14,394 |
| | $ | — |
|
| Initial recognition of operating leases upon adoption of Accounting Standards Update 2016-02 (1) | $ | — |
| | $ | 32,777 |
|
| Recognition of operating lease at commencement | $ | 2,223 |
| | $ | 2,926 |
|
10
| |
(1) | Represents adjustment needed to reflect the opening balance of the Company's Right of Use ("ROU") assets and lease liabilities pursuant to the adoption of Accounting Standards Update 2016-02 effective January 1, 2019. Upon adoption, the Company recognized on its balance sheet ROU assets of approximately $32.8 million, with a corresponding operating lease liability of approximately $34.1 million, with an adjustment to remove the Company's existing deferred rent liability of approximately $1.3 million. |
| | | | | | | | | | | |
| Repayments of long-term debt, net of issuance costs | (4,688) | | | 0 | |
| | | |
| | | |
| Net proceeds from exercise of stock options | (57) | | | 0 | |
| Restricted stock awards issued, net of awards surrendered | (1,220) | | | (1,132) | |
| Proceeds from shares issued under direct stock purchase plan | 492 | | | 560 | |
| Payments for shares repurchased under share repurchase program | 0 | | | (73,226) | |
| Common dividends paid | (15,164) | | | (15,126) | |
| Net cash provided by financing activities | 579,732 | | | 422,944 | |
| Net increase in cash and cash equivalents | 472,703 | | | 320,403 | |
| Cash and cash equivalents at beginning of year | 1,296,636 | | | 150,974 | |
| Cash and cash equivalents at end of period | $ | 1,769,339 | | | $ | 471,377 | |
| Supplemental schedule of noncash activities | | | |
| | | |
| | | |
| Net increase in capital commitments relating to low income housing project investments | $ | 24,014 | | | $ | 14,394 | |
| | | |
| Right-of-use assets obtained in exchange for new lease obligations | $ | 0 | | | $ | 2,223 | |
| | | |
| | | |
| | | |
| | | |
The accompanying condensed notes are an integral part of these unaudited consolidated financial statements.
CONDENSED NOTES TO UNAUDITED CONSOLIDATED FINANCIAL STATEMENTS
NOTE 1 - BASIS OF PRESENTATION
Independent Bank Corp. (the “Company”) is a state chartered, federally registered bank holding company, incorporated in 1985. The Company is the sole stockholder of Rockland Trust Company (“Rockland Trust” or the “Bank”), a Massachusetts trust company chartered in 1907.
All material intercompany balances and transactions have been eliminated in consolidation. Certain previously reported amounts have been reclassified to conform to the current year’s presentation.
The accompanying unaudited consolidated financial statements have been prepared in accordance with accounting principles generally accepted in the United States of America ("GAAP") for interim financial information and with the instructions to Form 10-Q and Article 10 of Regulation S-X. Accordingly, they do not include all of the information and notes required by GAAP for complete financial statements. In the opinion of management, all adjustments considered necessary for a fair presentation of the financial statements, primarily consisting of normal recurring adjustments, have been included. Results for the quarterthree months ended March 31, 20202021 are not necessarily indicative of the results that may be expected for the year ending December 31, 20202021 or any other interim period.
For further information, refer to the consolidated financial statements and notes thereto included in the Company’s Annual Report on Form 10-K for the year ended December 31, 2019,2020, filed with the Securities and Exchange Commission.Commission (the "2020 Form 10-K").
NOTE 2 - RECENT ACCOUNTING STANDARDS UPDATES
Financial Accounting Standards Board ("FASB") Accounting Standards Codification ("ASC") Topic 326 "Financial Instruments - Credit Losses" Update No. 2016-13.The standard was issued in June 2016 and has been amended three times by the FASB (collectively, the "updates"). The purpose of the updates is to provide financial statement users with more decision-useful information about the expected credit losses on financial instruments and other commitments to extend credit held by a reporting entity at each reporting date. To achieve this objective, these updates replace the incurred loss impairment methodology in current GAAP with a methodology, referred to as the current expected credit losses ("CECL") methodology, that reflects expected credit losses and requires consideration of a broader range of reasonable and supportable information to inform credit loss estimates. The updates affect loans, debt securities, trade receivables, net investments in leases, off-balance sheet credit exposures, reinsurance receivables, and any other financial assets not excluded from the scope that have the contractual right to receive cash. The Company adopted the CECL standard effective January 1, 2020.
The Company adopted the standard using the modified retrospective method for all financial assets measured at amortized cost, net investment in leases and off-balance sheet credit exposures. Results for reporting periods beginning after January 1, 2020 are presented under the CECL standard, while prior period results are presented under standards previously applicable under GAAP. The cumulative effect of the Company's adoption resulted in an immaterial increase to retained earnings as of the January 1, 2020 adoption date. This transition adjustment was a result of the change in allowance methodology, including the impact to the reserve on unfunded commitments resulting from the application of new guidance under CECL, as well as the day one gross-up of purchased credit deteriorated ("PCD") assets. The standard was adopted using the prospective transition approach for PCD assets that were previously classified as purchased credit impaired ("PCI") assets. As prescribed by the standard, management did not reassess whether PCI assets met the criteria of PCD assets at the date of adoption. On January 1, 2020, the amortized cost basis of the PCD assets were adjusted to reflect estimated credit losses, with the remaining non-credit related discount, calculated based on the adjusted amortized cost, and will be accreted into interest income on a straight line basis over the remaining contractual term of the asset. See Note 3 Securities and Note 4 Loans, Allowance for Credit Losses and Credit Quality for further details surrounding the Company's adoption of CECL, related accounting policy updates and full disclosures required under the standard.
FASB ASC Topic 848 "Reference Rate Reform" Update No. 2020-04. Update No. 2020-04 was issued in March 2020 to provide optional expedients and exceptions for applying generally accepted accounting principles (GAAP)GAAP to certain contracts, hedging relationships, and other transactions affected by reference rate reform if certain criteria are met. The amendments in this update apply only to contracts, hedging relationships, and other transactions that reference the London Interbank Offered Rate ("LIBOR") or another reference rate expected to be discontinued because of reference rate reform. The expedients and exceptions provided by the amendments dowill not apply to contract modifications made and hedging relationship entered into or evaluated after December 31, 2022, except for hedging relationships existing as of December 31, 2022 thatfor which an entity has elected certain optional expedients for and that are retained through the end of the hedging relationship. The amendments in this update are effective for all entities as of March 12, 2020 through December 31, 2022 and do not apply to contract modifications made after December 31, 2022. FASB ASC Topic 848 "Reference Rate Reform" Update No. 2021-01 was subsequently issued in January 2021 and expanded application of the optional expedients to derivative transactions affected by the discounting transition. The Company has not yet adopted the amendments in this updatethese updates and is
currently in the process of reviewing its contracts and existing processes in order to assess the risks and potential impact of the transition away from LIBOR.
NOTE 3 - SECURITIES
Investment securities are classified at the time of purchase as available for sale, held to maturity, trading, or equity. Classification is constantly re-evaluated for consistency with corporate goals and objectives. Trading and equity securities are recorded at fair value with subsequent changes in fair value recorded in earnings. Debt securities that management has the positive intent and ability to hold to maturity are classified as held to maturity and recorded at amortized cost. Securities not classified as held to maturity or trading are classified as available for sale and recorded at fair value, with changes in fair value excluded from earnings and reported in other comprehensive income, net of related tax. Purchase premiums and discounts are recognized in interest income, using the interest method, to arrive at periodic interest income at a constant effective yield, thereby reflecting the securities market yield. Gains and losses on the sale of securities are recorded on the trade date and are determined using the specific identification method.
Accrued interest receivable balances are excluded from the amortized cost of held to maturity securities and the fair value of available for sale securities and are included within Other Assets on the consolidated balance sheet. Management has elected not to measure an allowance for credit losses on these balances as the Company employs a timely write-off policy. It is the Company's policy that a security is placed on nonaccrual status at the time any principal or interest payments become 90 days delinquent, and interest earned but not collected for a security placed on non-accrual is reversed against interest income.
Allowance for Credit Losses - Available for Sale Securities
The Company's available for sale securities are carried at fair value. For available for sale securities in an unrealized loss position, management will first evaluate whether there is intent to sell, or if it is more likely than not that the Company will be required to sell a security prior to anticipated recovery of its amortized cost basis. If either of these criteria are met, the Company will record a write-down of the security's amortized cost basis to fair value through income. For those available for sale securities which do not meet the intent or requirement to sell criteria, management will evaluate whether the decline in fair value is a result of credit related matters or other factors. In performing this assessment, Management considers the creditworthiness of the issuer including whether the security is guaranteed by the U.S. Federal Government or other government agency, the extent to which fair value is less than amortized cost, and changes in credit rating during the period, among other factors. If this assessment indicates the existence of credit losses, the security will be written down to fair value, as determined by a discounted cash flow analysis. To the extent the estimated cash flows do not support the amortized cost, the deficiency is considered to be due to credit loss and is recognized in earnings.
Changes in the allowance for credit losses are recorded as a provision for (or reversal of) credit loss expense. Losses are charged against the allowance when the uncollectibility of a security is confirmed, or when either of the aforementioned criteria surrounding intent or requirement to sell have been met.
Allowance for Credit Losses - Held to Maturity Securities
The Company measures expected credit losses on held to maturity securities on a collective basis by major security type. Management classifies the held-to maturity portfolio into the following major security types: U.S. Government Agency, U.S. Treasury, Agency Mortgage-Backed Securities, Agency Collateralized Mortgage Obligations, Small Business Administration Pooled Securities, and Single Issuer Trust Preferred Securities. Securities in the Company's held to maturity portfolio are primarily guaranteed by either the U.S. Federal Government or other government sponsored agencies with a long history of no credit losses. As a result, Management has determined these securities to have a zero loss expectation and therefore does not estimate an allowance for credit losses on these securities.
Trading Securities
The Company had trading securities of $2.2$3.3 million and $2.8 million as of March 31, 20202021 and December 31, 2019.2020, respectively. These securities are held in a rabbi trust and will be used for future payments associated with the Company’s nonqualifiednon-qualified 401(k) Restoration Plan and NonqualifiedNon-qualified Deferred Compensation Plan.
Equity Securities
The Company had equity securities of $19.4$22.4 million and $21.3$22.1 million as of March 31, 20202021 and December 31, 2019,2020, respectively. These securities consist primarily of mutual funds held in a rabbi trust and will be used for future payments associated with the Company’s supplemental executive retirement plans.
The following table represents a summary of the gains and losses recognized within non-interest income and non-interest expense within the consolidated statements of income that relate to equity securities for the periods indicated:
|
| | | | | | | |
| | Three Months Ended |
| | March 31 |
| | 2020 | | 2019 |
| Net gains (losses) recognized during the period on equity securities | $ | (1,801 | ) | | $ | 907 |
|
| Less: net gains recognized during the period on equity securities sold during the period | 6 |
| | 3 |
|
| Unrealized gains (losses) recognized during the reporting period on equity securities still held at the reporting date | $ | (1,807 | ) | | $ | 904 |
|
| | | | | | | | | | | | | | | |
| Three Months Ended | | |
| March 31 | | |
| 2021 | | 2020 | | | | |
| Dollars in thousands |
| Net gains (losses) recognized during the period on equity securities | $ | 316 | | | $ | (1,801) | | | | | |
| Less: net gains recognized during the period on equity securities sold during the period | 29 | | | 6 | | | | | |
| Unrealized gains (losses) recognized during the reporting period on equity securities still held at the reporting date | $ | 287 | | | $ | (1,807) | | | | | |
Available for Sale Securities
The following table summarizes the amortized cost, allowance for credit losses, and fair value of available for sale securities and the corresponding amounts of gross unrealized gains and losses recognized in accumulated other comprehensive income(loss)income (loss) as of the dates indicated:
| | | | | | | | | | | | | | | | | | | | | | | | | | | | | | | | | | | | | | | | | | | | | | | | | | | | | | | | | | | |
| | March 31, 2021 | | December 31, 2020 |
| | Amortized
Cost | | Gross
Unrealized
Gains | | Gross Unrealized
Losses | | Allowance for credit losses | | Fair
Value | | Amortized
Cost | | Gross
Unrealized
Gains | | Gross Unrealized
Losses | | Allowance for credit losses | | Fair
Value |
| | (Dollars in thousands) |
| | | | | | | | | | | | | | | | | | | |
| U.S. government agency securities | $ | 169,091 | | | $ | 1,209 | | | $ | (2,244) | | | $ | 0 | | | $ | 168,056 | | | $ | 22,476 | | | $ | 1,640 | | | $ | 0 | | | $ | 0 | | | $ | 24,116 | |
| Agency mortgage-backed securities | 286,512 | | | 7,561 | | | (3,898) | | | 0 | | | 290,175 | | | 224,293 | | | 9,337 | | | (1) | | | 0 | | | 233,629 | |
| Agency collateralized mortgage obligations | 78,952 | | | 2,688 | | | (11) | | | 0 | | | 81,629 | | | 88,687 | | | 3,083 | | | (87) | | | 0 | | | 91,683 | |
| | | | | | | | | | | | | | | | | | | |
| State, county, and municipal securities | 540 | | | 15 | | | 0 | | | 0 | | | 555 | | | 790 | | | 17 | | | 0 | | | 0 | | | 807 | |
| Single issuer trust preferred securities issued by banks | 489 | | | 0 | | | (1) | | | 0 | | | 488 | | | 489 | | | 0 | | | (1) | | | 0 | | | 488 | |
| Pooled trust preferred securities issued by banks and insurers | 1,412 | | | 0 | | | (348) | | | 0 | | | 1,064 | | | 1,429 | | | 0 | | | (373) | | | 0 | | | 1,056 | |
| Small business administration pooled securities | 56,171 | | | 2,075 | | | 0 | | | 0 | | | 58,246 | | | 57,289 | | | 3,792 | | | 0 | | | 0 | | | 61,081 | |
| Total available for sale securities | $ | 593,167 | | | $ | 13,548 | | | $ | (6,502) | | | $ | 0 | | | $ | 600,213 | | | $ | 395,453 | | | $ | 17,869 | | | $ | (462) | | | $ | 0 | | | $ | 412,860 | |
| | | | | | | | | | | | | | | | | | | |
| | | | | | | | | | | | | | | | | | | |
| | | | | | | | | | | | | | | | | | | |
| | | | | | | | | | | | | | | | | | | |
| | | | | | | | | | | | | | | | | | | |
| | | | | | | | | | | | | | | | | | | |
| | | | | | | | | | | | | | | | | | | |
| | | | | | | | | | | | | | | | | | | |
| | | | | | | | | | | | | | | | | | | |
| | | | | | | | | | | | | | | | | | | |
| | | | | | | | | | | | | | | | | | | |
|
| | | | | | | | | | | | | | | | | | | | | | | | | | | | | | | | | | | |
| | March 31, 2020 | | December 31, 2019 |
| | Amortized
Cost | | Gross
Unrealized
Gains | | Gross Unrealized
Losses | | Allowance for credit losses | | Fair
Value | | Amortized
Cost | | Gross
Unrealized
Gains | | Gross Unrealized
Losses | | Fair
Value |
| | (Dollars in thousands) |
| U.S. government agency securities | $ | 22,474 |
| | $ | 1,818 |
| | $ | — |
| | $ | — |
| | $ | 24,292 |
| | $ | 32,473 |
| | $ | 642 |
| | $ | — |
| | $ | 33,115 |
|
| Agency mortgage-backed securities | 247,675 |
| | 11,110 |
| | (1 | ) | | — |
| | 258,784 |
| | 243,548 |
| | 3,456 |
| | (4 | ) | | 247,000 |
|
| Agency collateralized mortgage obligations | 83,183 |
| | 4,027 |
| | — |
| | — |
| | 87,210 |
| | 87,305 |
| | 1,225 |
| | (19 | ) | | 88,511 |
|
| State, county, and municipal securities | 1,126 |
| | 18 |
| | — |
| | — |
| | 1,144 |
| | 1,377 |
| | 19 |
| | — |
| | 1,396 |
|
| Single issuer trust preferred securities issued by banks | 489 |
| | — |
| | (53 | ) | | — |
| | 436 |
| | 488 |
| | 5 |
| | — |
| | 493 |
|
| Pooled trust preferred securities issued by banks and insurers | 1,443 |
| | — |
| | (434 | ) | | — |
| | 1,009 |
| | 1,488 |
| | — |
| | (374 | ) | | 1,114 |
|
| Small business administration pooled securities | 63,062 |
| | 1,359 |
| | — |
| | — |
| | 64,421 |
| | 54,024 |
| | 771 |
| | — |
| | 54,795 |
|
| Total available for sale securities | $ | 419,452 |
| | $ | 18,332 |
| | $ | (488 | ) | | $ | — |
| | $ | 437,296 |
| | $ | 420,703 |
| | $ | 6,118 |
| | $ | (397 | ) | | $ | 426,424 |
|
As noted in the table above, theThe Company did not record an allowancea provision for estimated credit losses on any available for sale securities during the three months ended March 31, 2021 and 2020. Excluded from the table above is accrued interest on available for sale securities of $1.6$2.0 million and $1.2 million as of March 31, 2021 and December 31, 2020, respectively, which is included within Other Assetsother assets on the consolidated balance sheet.sheets. Additionally, the Company did not record any write-offs of accrued interest income on available for sale securities during the three months ended March 31, 2021 and 2020. NoFurthermore, 0 securities held by the Company were delinquent on contractual payments as of March 31, 2020, nor were any securities placed on non-accrual status during the three months then ended.as of March 31, 2021 and December 31, 2020.
When securities are sold, the adjusted cost of the specific security sold is used to compute the gain or loss on the sale. The Company had no sales of securities available for sale during the three months ended March 31, 20202021 and 2019,2020, and therefore no gains or losses were realized during the periods presented.
The following table showstables show the gross unrealized losses and fair value of the Company’s available for sale securities which are in an unrealized loss position, and for which the Company has not recorded an allowancea provision for credit losses as of March 31, 2020.losses. These available for sale securities are aggregated by major security type and length of time that individual securities have been in a continuous unrealized loss position:
|
| | | | | | | | | | | | | | | | | | | | | | | | | | |
| | March 31, 2020 |
| | | | Less than 12 months | | 12 months or longer | | Total |
| | # of holdings | | Fair Value | | Unrealized Losses | | Fair Value | | Unrealized Losses | | Fair Value | | Unrealized Losses |
| | (Dollars in thousands) |
| Agency mortgage-backed securities | 1 |
| | 86 |
| | (1 | ) | | — |
| | — |
| | 86 |
| | (1 | ) |
| Single issuer trust preferred securities issued by banks and insurers | 1 |
| | 436 |
| | (53 | ) | | — |
| | — |
| | 436 |
| | (53 | ) |
| Pooled trust preferred securities issued by banks and insurers | 1 |
| | — |
| | — |
| | 1,009 |
| | (434 | ) | | 1,009 |
| | (434 | ) |
| Total temporarily impaired available for sale securities | 3 |
| | $ | 522 |
| | $ | (54 | ) | | $ | 1,009 |
| | $ | (434 | ) | | $ | 1,531 |
| | $ | (488 | ) |
| | | | | | | | | | | | | | | | | | | | | | | | | | | | | | | | | | | | | | | | | |
| | March 31, 2021 |
| | | | Less than 12 months | | 12 months or longer | | Total |
| | # of
holdings | | Fair
Value | | Unrealized
Losses | | Fair
Value | | Unrealized
Losses | | Fair
Value | | Unrealized
Losses |
| | (Dollars in thousands) |
| U.S. government agency securities | 4 | | | $ | 113,171 | | | $ | (2,244) | | | $ | 0 | | | $ | 0 | | | $ | 113,171 | | | $ | (2,244) | |
| Agency mortgage-backed securities | 8 | | | 98,873 | | | (3,898) | | | 0 | | | 0 | | | 98,873 | | | (3,898) | |
| Agency collateralized mortgage obligations | 1 | | | 9,519 | | | (11) | | | 0 | | | 0 | | | 9,519 | | | (11) | |
| | | | | | | | | | | | | |
| Single issuer trust preferred securities issued by banks and insurers | 1 | | | 0 | | | 0 | | | 488 | | | (1) | | | 488 | | | (1) | |
| Pooled trust preferred securities issued by banks and insurers | 1 | | | 0 | | | 0 | | | 1,064 | | | (348) | | | 1,064 | | | (348) | |
| | | | | | | | | | | | | |
| Total impaired available for sale securities | 15 | | | $ | 221,563 | | | $ | (6,153) | | | $ | 1,552 | | | $ | (349) | | | $ | 223,115 | | | $ | (6,502) | |
| | | | | | | | | | | | | |
| December 31, 2020 |
| | | Less than 12 months | | 12 months or longer | | Total |
| # of
holdings | | Fair
Value | | Unrealized
Losses | | Fair
Value | | Unrealized
Losses | | Fair
Value | | Unrealized
Losses |
| (Dollars in thousands) |
| | | | | | | | | | | | | |
| Agency mortgage-backed securities | 3 | | | 437 | | | (1) | | | 0 | | | 0 | | | 437 | | | (1) | |
| Agency collateralized mortgage obligations | 2 | | | 23,323 | | | (87) | | | 0 | | | 0 | | | 23,323 | | | (87) | |
| | | | | | | | | | | | | |
| Single issuer trust preferred securities issued by banks and insurers | 1 | | | 488 | | | (1) | | | 0 | | | 0 | | | 488 | | | (1) | |
| Pooled trust preferred securities issued by banks and insurers | 1 | | | 0 | | | 0 | | | 1,056 | | | (373) | | | 1,056 | | | (373) | |
| | | | | | | | | | | | | |
| Total impaired available for sale securities | 7 | | | $ | 24,248 | | | $ | (89) | | | $ | 1,056 | | | $ | (373) | | | $ | 25,304 | | | $ | (462) | |
The Company does not intend to sell these investments and has determined, based upon available evidence, that it is more likely than not that the Company will not be required to sell each security before the recovery of its amortized cost basis. In addition, management does not believe that any of the securities are impaired due to reasons of credit quality. As a result, the Company did not recognize an allowancea provision for credit losses on these investments duringfor the three months ended March 31, 2021 and 2020. The Company made this determination by reviewing various qualitative and quantitative factors regarding each investment category, such as current market conditions, extent and nature of changes in fair value, issuer rating changes and trends, volatility of earnings, and current analysts’ evaluations.
As a result of the Company’s review of these qualitative and quantitative factors, the causes of the impairments listed in the table above by category arewere as follows at March 31, 2020:
| |
• | Agency Mortgage-Backed Securities: These portfolios have contractual terms that generally do not permit the issuer to settle the securities at a price less than the current par value of the investment. The decline in market value of these securities is attributable to changes in interest rates and not credit quality. Additionally, these securities are implicitly guaranteed by the U.S. Government or one of its agencies.
|
| |
• | Single Issuer Trust Preferred Securities: This portfolio consists of one security, which is investment grade. The unrealized loss on this security is attributable to the illiquid nature of the trust preferred market in the current economic environment. Management evaluates various financial metrics for the issuers, including regulatory capital ratios of the issuers.
|
| |
• | Pooled Trust Preferred Securities: This portfolio consists of one below investment grade security which is performing. The unrealized loss on this security is attributable to the illiquid nature of the trust preferred market in the current economic and regulatory environment. Management evaluates collateral credit and instrument structure, including current and expected deferral and default rates and timing. In addition, discount rates are determined by evaluating comparable spreads observed currently in the market for similar instruments.
|
•Pooled Trust Preferred Securities: This portfolio consists of one below investment grade security which is performing. The unrealized loss on this security is attributable to the illiquid nature of the trust preferred market in the current economic and regulatory environment. Management evaluates collateral credit and instrument
structure, including current and expected deferral and default rates and timing. In addition, discount rates are determined by evaluating comparable spreads observed currently in the market for similar instruments.
Held to Maturity Securities
The following table summarizes the amortized cost, fair value and allowance for credit losses of held to maturity securities and the corresponding amounts of gross unrealized gains and losses recognized in accumulated other comprehensive income(loss)income (loss) as of the dates indicated:
|
| | | | | | | | | | | | | | | | | | | | | | | | | | | | | | | | | | | |
| | March 31, 2020 | | December 31, 2019 |
| | Amortized
Cost | | Gross
Unrealized
Gains | | Gross Unrealized
Losses | | Allowance for credit losses | | Fair
Value | | Amortized
Cost | | Gross
Unrealized
Gains | | Gross Unrealized
Losses | | Fair
Value |
| | (Dollars in thousands) |
| U.S. government agency securities | $ | — |
| | $ | — |
| | $ | — |
| | $ | — |
| | $ | — |
| | $ | 12,874 |
| | $ | 123 |
| | $ | — |
| | $ | 12,997 |
|
| U.S. Treasury securities | 4,029 |
| | 110 |
| | — |
| | — |
| | 4,139 |
| | 4,032 |
| | 21 |
| | — |
| | 4,053 |
|
| Agency mortgage-backed securities | 463,632 |
| | 18,864 |
| | (133 | ) | | — |
| | 482,363 |
| | 397,414 |
| | 8,445 |
| | (57 | ) | | 405,802 |
|
| Agency collateralized mortgage obligations | 277,921 |
| | 11,981 |
| | — |
| | — |
| | 289,902 |
| | 293,662 |
| | 4,501 |
| | (849 | ) | | 297,314 |
|
| Single issuer trust preferred securities issued by banks | 1,500 |
| | — |
| | (10 | ) | | — |
| | 1,490 |
| | 1,500 |
| | — |
| | (10 | ) | | 1,490 |
|
| Small business administration pooled securities | 30,716 |
| | 745 |
| | — |
| | — |
| | 31,461 |
| | 31,324 |
| | 338 |
| | (55 | ) | | 31,607 |
|
| Total held to maturity securities | $ | 777,798 |
| | $ | 31,700 |
| | $ | (143 | ) | | $ | — |
| | $ | 809,355 |
| | $ | 740,806 |
| | $ | 13,428 |
| | $ | (971 | ) | | $ | 753,263 |
|
| | | | | | | | | | | | | | | | | | | | | | | | | | | | | | | | | | | | | | | | | | | | | | | | | | | | | | | | | | | |
| | March 31, 2021 | | December 31, 2020 |
| | Amortized
Cost | | Gross
Unrealized
Gains | | Gross Unrealized
Losses | | Allowance for credit losses | | Fair
Value | | Amortized
Cost | | Gross
Unrealized
Gains | | Gross Unrealized
Losses | | Allowance for credit losses | | Fair
Value |
| | (Dollars in thousands) |
| | | | | | | | | | | | | | | | | | | |
| U.S. Treasury securities | $ | 4,014 | | | $ | 43 | | | $ | 0 | | | $ | 0 | | | $ | 4,057 | | | $ | 4,017 | | | $ | 60 | | | $ | 0 | | | $ | 0 | | | $ | 4,077 | |
| Agency mortgage-backed securities | 417,811 | | | 13,069 | | | (4,252) | | | 0 | | | 426,628 | | | 356,085 | | | 18,036 | | | 0 | | | 0 | | | 374,121 | |
| Agency collateralized mortgage obligations | 355,686 | | | 7,474 | | | (2,158) | | | 0 | | | 361,002 | | | 335,993 | | | 8,466 | | | (340) | | | 0 | | | 344,119 | |
| | | | | | | | | | | | | | | | | | | |
| Single issuer trust preferred securities issued by banks | 1,500 | | | 8 | | | 0 | | | 0 | | | 1,508 | | | 1,500 | | | 0 | | | (2) | | | 0 | | | 1,498 | |
| Small business administration pooled securities | 26,518 | | | 717 | | | 0 | | | 0 | | | 27,235 | | | 26,917 | | | 1,445 | | | 0 | | | 0 | | | 28,362 | |
| | | | | | | | | | | | | | | | | | | |
| Total held to maturity securities | $ | 805,529 | | | $ | 21,311 | | | $ | (6,410) | | | $ | 0 | | | $ | 820,430 | | | $ | 724,512 | | | $ | 28,007 | | | $ | (342) | | | $ | 0 | | | $ | 752,177 | |
As noted in the table above, theThe Company did not record an allowancea provision for estimated credit losses on any held to maturity securities during the three months ended March 31, 2021 and 2020. Excluded from the table above is accrued interest on held to maturity securities of $2.0$1.6 million and $1.5 million as of March 31, 2021 and December 31, 2020, respectively, which is included within Other Assetsother assets on the consolidated balance sheet.sheets. Additionally, the Company did not record any write-offs of accrued interest income on held to maturity securities during the three months ended March 31, 2021 and 2020. NoFurthermore, 0 securities held by the Company were delinquent on contractual payments as of March 31, 2020, nor were any securities placed on non-accrual status during the three months then ended.as of March 31, 2021 and December 31, 2020.
When securities are sold, the adjusted cost of the specific security sold is used to compute the gain or loss on the sale. The Company had no sales of held to maturity securities during the three months ended March 31, 20202021 and 2019,2020, and therefore no gains or losses were realized during the periods presented.
The Company monitors the credit quality of held to maturity securities through the use of credit ratings. Credit ratings are monitored by the Company on at least a quarterly basis. As of March 31, 2020,2021, all held to maturity securities held by the Company were rated investment grade or higher.
The actual maturities of certain available for sale or held to maturity securities may differ from the contractual maturities because borrowers may have the right to call or prepay obligations with or without call or prepayment penalties. A schedule of the contractual maturities of available for sale and held to maturity securities as of March 31, 20202021 is presented below:
| | | | Due in one year or less | | Due after one year to five years | | Due after five to ten years | | Due after ten years | | Total | | Due in one year or less | | Due after one year to five years | | Due after five to ten years | | Due after ten years | | Total |
| | Amortized Cost | | Fair Value | | Amortized Cost | | Fair Value | | Amortized Cost | | Fair Value | | Amortized Cost | | Fair Value | | Amortized Cost | | Fair Value | | Amortized
Cost | | Fair
Value | | Amortized
Cost | | Fair
Value | | Amortized
Cost | | Fair
Value | | Amortized
Cost | | Fair
Value | | Amortized
Cost | | Fair
Value |
| | (Dollars in thousands) | | (Dollars in thousands) |
| Available for sale securities | | | | | | | | | | | | | | | | | | | | Available for sale securities | |
| U.S. government agency securities | $ | — |
| | $ | — |
| | $ | 10,002 |
| | $ | 10,351 |
| | $ | 12,472 |
| | $ | 13,941 |
| | $ | — |
| | $ | — |
| | $ | 22,474 |
| | $ | 24,292 |
| U.S. government agency securities | $ | 10,001 | | | $ | 10,180 | | | $ | 0 | | | $ | 0 | | | $ | 159,090 | | | $ | 157,876 | | | $ | 0 | | | $ | 0 | | | $ | 169,091 | | | $ | 168,056 | |
| Agency mortgage-backed securities | — |
| | — |
| | 72,092 |
| | 75,268 |
| | 41,885 |
| | 44,607 |
| | 133,698 |
| | 138,909 |
| | 247,675 |
| | 258,784 |
| Agency mortgage-backed securities | 0 | | | 0 | | | 80,169 | | | 82,809 | | | 98,747 | | | 96,914 | | | 107,596 | | | 110,452 | | | 286,512 | | | 290,175 | |
| Agency collateralized mortgage obligations | — |
| | — |
| | — |
| | — |
| | — |
| | — |
| | 83,183 |
| | 87,210 |
| | 83,183 |
| | 87,210 |
| Agency collateralized mortgage obligations | 0 | | | 0 | | | 0 | | | 0 | | | 0 | | | 0 | | | 78,952 | | | 81,629 | | | 78,952 | | | 81,629 | |
| | State, county, and municipal securities | 250 |
| | 250 |
| | 687 |
| | 691 |
| | 189 |
| | 203 |
| | — |
| | — |
| | 1,126 |
| | 1,144 |
| State, county, and municipal securities | 350 | | | 351 | | | 0 | | | 0 | | | 190 | | | 204 | | | 0 | | | 0 | | | 540 | | | 555 | |
| Single issuer trust preferred securities issued by banks | — |
| | — |
| | — |
| | — |
| | — |
| | — |
| | 489 |
| | 436 |
| | 489 |
| | 436 |
| Single issuer trust preferred securities issued by banks | 0 | | | 0 | | | 0 | | | 0 | | | 0 | | | 0 | | | 489 | | | 488 | | | 489 | | | 488 | |
| Pooled trust preferred securities issued by banks and insurers | — |
| | — |
| | — |
| | — |
| | — |
| | — |
| | 1,443 |
| | 1,009 |
| | 1,443 |
| | 1,009 |
| Pooled trust preferred securities issued by banks and insurers | 0 | | | 0 | | | 0 | | | 0 | | | 0 | | | 0 | | | 1,412 | | | 1,064 | | | 1,412 | | | 1,064 | |
| Small business administration pooled securities | — |
| | — |
| | — |
| | — |
| | — |
| | — |
| | 63,062 |
| | 64,421 |
| | 63,062 |
| | 64,421 |
| Small business administration pooled securities | 0 | | | 0 | | | 0 | | | 0 | | | 0 | | | 0 | | | 56,171 | | | 58,246 | | | 56,171 | | | 58,246 | |
| Total available for sale securities | $ | 250 |
| | $ | 250 |
| | $ | 82,781 |
| | $ | 86,310 |
| | $ | 54,546 |
| | $ | 58,751 |
| | $ | 281,875 |
| | $ | 291,985 |
| | $ | 419,452 |
| | $ | 437,296 |
| Total available for sale securities | $ | 10,351 | | | $ | 10,531 | | | $ | 80,169 | | | $ | 82,809 | | | $ | 258,027 | | | $ | 254,994 | | | $ | 244,620 | | | $ | 251,879 | | | $ | 593,167 | | | $ | 600,213 | |
| Held to maturity securities | | | | | | | | | | | | | | | | | | | | Held to maturity securities | | | | | | | | | | | | | | | | | | | |
| | U.S. Treasury securities | $ | — |
| | $ | — |
| | $ | 4,029 |
| | $ | 4,139 |
| | $ | — |
| | $ | — |
| | $ | — |
| | $ | — |
| | $ | 4,029 |
| | $ | 4,139 |
| U.S. Treasury securities | $ | 4,014 | | | $ | 4,057 | | | $ | 0 | | | $ | 0 | | | $ | 0 | | | $ | 0 | | | $ | 0 | | | $ | 0 | | | $ | 4,014 | | | $ | 4,057 | |
| Agency mortgage-backed securities | 8,619 |
| | 8,715 |
| | 1,902 |
| | 1,951 |
| | 48,123 |
| | 50,345 |
| | 404,988 |
| | 421,352 |
| | 463,632 |
| | 482,363 |
| Agency mortgage-backed securities | 0 | | | 0 | | | 4,614 | | | 4,869 | | | 128,958 | | | 127,901 | | | 284,239 | | | 293,858 | | | 417,811 | | | 426,628 | |
| Agency collateralized mortgage obligations | — |
| | — |
| | — |
| | — |
| | — |
| | — |
| | 277,921 |
| | 289,902 |
| | 277,921 |
| | 289,902 |
| Agency collateralized mortgage obligations | 0 | | | 0 | | | 0 | | | 0 | | | 0 | | | 0 | | | 355,686 | | | 361,002 | | | 355,686 | | | 361,002 | |
| | Single issuer trust preferred securities issued by banks | — |
| | — |
| | — |
| | — |
| | 1,500 |
| | 1,490 |
| | — |
| | — |
| | 1,500 |
| | 1,490 |
| Single issuer trust preferred securities issued by banks | 0 | | | 0 | | | 0 | | | 0 | | | 1,500 | | | 1,508 | | | 0 | | | 0 | | | 1,500 | | | 1,508 | |
| Small business administration pooled securities | — |
| | — |
| | — |
| | — |
| | — |
| | — |
| | 30,716 |
| | 31,461 |
| | 30,716 |
| | 31,461 |
| Small business administration pooled securities | 0 | | | 0 | | | 0 | | | 0 | | | 0 | | | 0 | | | 26,518 | | | 27,235 | | | 26,518 | | | 27,235 | |
| | Total held to maturity securities | $ | 8,619 |
| | $ | 8,715 |
| | $ | 5,931 |
| | $ | 6,090 |
| | $ | 49,623 |
| | $ | 51,835 |
| | $ | 713,625 |
| | $ | 742,715 |
| | $ | 777,798 |
| | $ | 809,355 |
| Total held to maturity securities | $ | 4,014 | | | $ | 4,057 | | | $ | 4,614 | | | $ | 4,869 | | | $ | 130,458 | | | $ | 129,409 | | | $ | 666,443 | | | $ | 682,095 | | | $ | 805,529 | | | $ | 820,430 | |
| Total | $ | 8,869 |
| | $ | 8,965 |
| | $ | 88,712 |
| | $ | 92,400 |
| | $ | 104,169 |
| | $ | 110,586 |
| | $ | 995,500 |
| | $ | 1,034,700 |
| | $ | 1,197,250 |
| | $ | 1,246,651 |
| Total | $ | 14,365 | | | $ | 14,588 | | | $ | 84,783 | | | $ | 87,678 | | | $ | 388,485 | | | $ | 384,403 | | | $ | 911,063 | | | $ | 933,974 | | | $ | 1,398,696 | | | $ | 1,420,643 | |
Included in the table above are $4.1$3.3 million of callable securities at March 31, 2020.2021.
The carrying value of securities pledged to secure public funds, trust deposits, and for other purposes, as required or permitted by law, was $459.5$420.2 million and $375.5$419.6 million at March 31, 20202021 and December 31, 2019,2020, respectively.
At March 31, 20202021 and December 31, 2019,2020, the Company had 0 investments in obligations of individual states, counties, or municipalities which exceeded 10% of consolidated stockholders’ equity.
Under previous accounting guidance, the Company reviewed both available for sale and held to maturity securities for other-than-temporary-impairment ("OTTI"). However, in accordance with the newly adopted CECL standard, the Company now utilizes separate impairment models for held to maturity and available for sale securities for purposes of estimating credit losses. The following table shows the gross unrealized losses and fair value of the Company’s investments in an unrealized loss position, which the Company had not deemed to be OTTI, aggregated by investment category and length of time that individual securities have been in a continuous unrealized loss position as of December 31, 2019:
|
| | | | | | | | | | | | | | | | | | | | | | | | | | |
| | December 31, 2019 |
| | | | Less than 12 months | | 12 months or longer | | Total |
| | # of holdings | | Fair Value | | Unrealized Losses | | Fair Value | | Unrealized Losses | | Fair Value | | Unrealized Losses |
| | (Dollars in thousands) |
| Agency mortgage-backed securities | 12 |
| | 34,009 |
| | (59 | ) | | 243 |
| | (2 | ) | | 34,252 |
| | (61 | ) |
| Agency collateralized mortgage obligations | 17 |
| | 48,476 |
| | (215 | ) | | 37,382 |
| | (653 | ) | | 85,858 |
| | (868 | ) |
| Single issuer trust preferred securities issued by banks and insurers | 1 |
| | — |
| | — |
| | 1,490 |
| | (10 | ) | | 1,490 |
| | (10 | ) |
| Pooled trust preferred securities issued by banks and insurers | 1 |
| | — |
| | — |
| | 1,114 |
| | (374 | ) | | 1,114 |
| | (374 | ) |
| Small business administration pooled securities | 1 |
| | 7,349 |
| | (55 | ) | | — |
| | — |
| | 7,349 |
| | (55 | ) |
| Total temporarily impaired securities | 32 |
| | $ | 89,834 |
| | $ | (329 | ) | | $ | 40,229 |
| | $ | (1,039 | ) | | $ | 130,063 |
| | $ | (1,368 | ) |
The Company did not intend to sell these investments and therefore determined, based upon available evidence, that it was more likely than not that the Company would not be required to sell each security before the recovery
NOTE 4 - LOANS, ALLOWANCE FOR CREDIT LOSSES AND CREDIT QUALITY
Loans Held for Sale
The Bank primarily classifies new residential real estate mortgage loans as held for sale based on intent, which is determined when loans are underwritten. Residential real estate mortgage loans not designated as held for sale are retained based upon available liquidity, for interest rate risk management and other business purposes.
The Company has elected the fair value option to account for originated closed loans intended for sale. Accordingly, changes in fair value relating to loans intended for sale are recorded in earnings and are offset by changes in fair value relating to interest rate lock commitments and forward sales commitments. Gains and losses on residential loan sales (sales proceeds minus carrying amount) are recorded in mortgage banking income. Upfront costs and fees related to items for which the fair value option is elected are recognized in earnings as incurred and are not deferred.
Loans
Loans that the Company has the intent and ability to hold until maturity or payoff are carried at amortized cost (net of the allowance for credit losses). Amortized cost is the principal amount outstanding, adjusted by partial charge-offs and net of deferred loan costs or fees. For originated loans, loan fees and certain direct origination costs are deferred and amortized into interest income over the expected term of the loan using the level-yield method. When a loan is paid off, the unamortized portion is recognized in interest income. Interest income on loans is accrued based upon the daily principal amount outstanding except for loans on nonaccrual status.
As a general rule, loans more than 90 days past due with respect to principal or interest are classified as nonaccrual loans, or sooner if management considers such action to be prudent. However, loans that are more than 90 days past due may be kept on an accruing status if the loan is well secured and in the process of collection. The Company may also put a junior lien mortgage on nonaccrual status as a result of delinquency with respect to the first position, which is held by the Bank or by another financial institution, while the junior lien is currently performing. Income accruals are suspended on all nonaccrual loans in a timely manner and all previously accrued and uncollected interest is reversed against current income. A loan remains on nonaccrual status until it becomes current with respect to principal and interest (and in certain instances remains current for up to six months), the loan is liquidated, or when the loan is determined to be uncollectible and is charged-off against the allowance for credit losses. When doubt exists as to the collectability of a loan, any payments received are applied to reduce the amortized cost of the loan to the
extent necessary to eliminate such doubt. For all loan portfolios, a charge-off occurs when the Company determines that a specific loan, or portion thereof, is uncollectible. This determination is made based on management's review of specific facts and circumstances of the individual loan, including assessing the viability of the customer’s business or project as a going concern, the expected cash flows to repay the loan, the value of the collateral and the ability and willingness of any guarantors to perform.
Allowance for Credit Losses - Loans Held for Investment
The allowance for credit losses is established based upon the Company's current estimate of expected lifetime credit losses on loans measured at amortized cost. Loan losses are charged against the allowance when Management's assessments confirm that the Company will not collect the full amortized cost basis of a loan. Subsequent recoveries, if any, are credited to the allowance.
Under the CECL methodology, the Company estimates credit losses for financial assets on a collective basis for loans sharing similar risk characteristics using a quantitative model combined with an assessment of certain qualitative factors designed to address forecast risk and model risk inherent in the quantitative model output. The quantitative model utilizes a factor based approach to estimate expected credit losses using Probability of Default ("PD"), Loss Given Default ("LGD") and Exposure at Default ("EAD"), which are derived from internal historical default and loss experience. The model estimates expected credit losses using loan level data over the estimated life of the exposure, considering the effect of prepayments. Economic forecasts are incorporated into the estimate over a reasonable and supportable forecast period, beyond which is a reversion to the Company's historical long-run average. Management has determined a reasonable and supportable period of 12 months, and a straight line reversion period of 6 months, to be appropriate for purposes of estimating expected credit losses. The qualitative risk factors impacting the expected risk of loss within the portfolio include the following:
Lending policies and procedures
Economic and business conditions
Nature and volume of loans
Changes in management
Changes in credit quality
Changes in loan review system
Changes to underlying collateral values
Concentrations of credit risk
Other external factors
Loans that do not share similar risk characteristics with any pools of assets are subject to individual assessment and are removed from the collectively assessed pools to avoid double counting. For the loans that will be individually assessed, the Company will use either a discounted cash flow (“DCF”) approach or a fair value of collateral approach. The latter approach will be used for loans deemed to be collateral dependent or when foreclosure is probable.
Accrued interest receivable amounts are excluded from balances of loans held at amortized cost and are included within other assets on the consolidated balance sheet. Management has elected not to measure an allowance for credit losses on these amounts as the Company employs a timely write-off policy. Consistent with the Company's policy for nonaccrual loans, accrued interest receivable is typically written off when loans reach 90 days past due and are placed on nonaccrual status.
In the ordinary course of business, the Company enters into commitments to extend credit, commercial letters of credit, and standby letters of credit. Such financial instruments are recorded in the financial statements when they become payable. The credit risk associated with these commitments is evaluated in a manner similar to the allowance for credit losses. The reserve for unfunded lending commitments is included in other liabilities on the consolidated balance sheet.
Acquired Loans
Prior to its adoption of CECL, and under legacy GAAP, the Company maintained a portfolio of acquired loans, which, at acquisition, were recorded at fair value with no carryover of the allowance for loan losses. Acquired loans were also reviewed to determine if the loan had evidence of deterioration in credit quality and also if it was probable, at acquisition, that all contractually required payments would not be collected. Loans meeting such criteria were deemed to be purchased credit impaired ("PCI") loans. Under the accounting model for PCI loans, the excess of cash flows expected to be collected over the carrying amount of the loans, referred to as the "accretable yield", was accreted into interest income over the life of the loans using the effective yield method. Accordingly, PCI loans were not subject to classification as nonaccrual in the same manner as originated loans. Rather, acquired PCI loans were generally considered to be accruing loans because their interest income related to the accretable yield recognized and not to contractual interest payments at the loan level. The difference between contractually required principal and interest payments and the cash flows expected to be collected, referred to as the "nonaccretable difference", included estimates of both the impact of prepayments and future credit losses expected to be incurred over the life of the loans.
Under the CECL standard, the concept of PCI assets was effectively replaced with purchased credit deteriorated ("PCD") assets, the balances of which should be treated in a manner consistent with loans held for investment for purposes of estimating an allowance for credit losses. As a result, upon the Company's adoption of CECL on January 1, 2020, loan balances previously classified as PCI assets were re-classified as PCD assets and will be prospectively accounted for in accordance with the standard. See Note 2 -Recent Accounting Standards Updates for further discussion surrounding the day one impact associated with adoption of CECL as it relates to PCI assets.
Loans Held for Investment and Allowance for Credit Losses
The following table summarizes the change in allowance for credit losses by loan category, and bifurcates the amount of loans allocated to each loan category for the period indicated:
| | | | | | | | | | | | | | | | | | | | | | | | | | | | | | | | | | | | | | | | | | | | | | | |
| | Three Months Ended March 31, 2021 |
| | (Dollars in thousands) |
| | Commercial and
Industrial | | Commercial
Real Estate | | Commercial
Construction | | Small
Business | | Residential
Real Estate | |
Home Equity | | Other Consumer | | Total |
| Allowance for credit losses | | | | | | | | | | | | | | | |
| Beginning balance | $ | 21,086 | | | $ | 45,009 | | | $ | 5,397 | | | $ | 5,095 | | | $ | 14,275 | | | $ | 22,060 | | | $ | 470 | | | $ | 113,392 | |
| | | | | | | | | | | | | | | |
| | | | | | | | | | | | | | | |
| Charge-offs | (3,331) | | | 0 | | | 0 | | | (66) | | | 0 | | | 0 | | | (289) | | | (3,686) | |
| Recoveries | 64 | | | 57 | | | 0 | | | 11 | | | 1 | | | 13 | | | 197 | | | 343 | |
| Provision for credit loss expense | 2,388 | | | (718) | | | (129) | | | (1,419) | | | (1,320) | | | (1,357) | | | 55 | | | (2,500) | |
| Ending balance (1) | $ | 20,207 | | | $ | 44,348 | | | $ | 5,268 | | | $ | 3,621 | | | $ | 12,956 | | | $ | 20,716 | | | $ | 433 | | | $ | 107,549 | |
| | | | | | | | | | | | | | | |
| | Three Months Ended March 31, 2020 |
| | (Dollars in thousands) |
| | Commercial and
Industrial | | Commercial
Real Estate | | Commercial
Construction | | Small
Business | | Residential
Real Estate | |
Home Equity | | Other Consumer | | Total |
| Allowance for credit losses | | | | | | | | | | | | | | | |
| Beginning balance, pre adoption of ASU 2016-13 | $ | 17,594 | | | $ | 32,935 | | | $ | 6,053 | | | $ | 1,746 | | | $ | 3,440 | | | $ | 5,576 | | | $ | 396 | | | $ | 67,740 | |
| Cumulative effect accounting adjustment (2) | (1,984) | | | (13,048) | | | (3,652) | | | 495 | | | 9,828 | | | 7,012 | | | 212 | | | (1,137) | |
| Cumulative effect accounting adjustment (3) | 49 | | | 337 | | | 0 | | | 0 | | | 423 | | | 319 | | | 29 | | | 1,157 | |
| Charge-offs | 0 | | | 0 | | | 0 | | | (109) | | | 0 | | | (138) | | | (487) | | | (734) | |
| Recoveries | 42 | | | 0 | | | 0 | | | 3 | | | 1 | | | 58 | | | 246 | | | 350 | |
| Provision for credit loss expense | 5,948 | | | 9,274 | | | 1,346 | | | 1,694 | | | 1,155 | | | 5,083 | | | 500 | | | 25,000 | |
| Ending balance (1) | $ | 21,649 | | | $ | 29,498 | | | $ | 3,747 | | | $ | 3,829 | | | $ | 14,847 | | | $ | 17,910 | | | $ | 896 | | | $ | 92,376 | |
|
| | | | | | | | | | | | | | | | | | | | | | | | | | | | | | | |
| | Three Months Ended March 31, 2020 |
| | (Dollars in thousands) |
| | Commercial and
Industrial | | Commercial
Real Estate | | Commercial
Construction | | Small
Business | | Residential
Real Estate | |
Home Equity | | Other Consumer | | Total |
| Allowance for credit losses | | | | | | | | | | | | | | | |
| Beginning balance, pre adoption of Topic 326 | $ | 17,594 |
| | $ | 32,935 |
| | $ | 6,053 |
| | $ | 1,746 |
| | $ | 3,440 |
| | $ | 5,576 |
| | $ | 396 |
| | $ | 67,740 |
|
| Cumulative effect accounting adjustment (1) | (1,984 | ) | | (13,048 | ) | | (3,652 | ) | | 495 |
| | 9,828 |
| | 7,012 |
| | 212 |
| | (1,137 | ) |
| Cumulative effect accounting adjustment (2) | 49 |
| | 337 |
| | — |
| | — |
| | 423 |
| | 319 |
| | 29 |
| | 1,157 |
|
| Charge-offs | — |
| | — |
| | — |
| | 109 |
| | — |
| | 138 |
| | 487 |
| | 734 |
|
| Recoveries | 42 |
| | — |
| | — |
| | 3 |
| | 1 |
| | 58 |
| | 246 |
| | 350 |
|
| Provision for credit loss expense | 5,948 |
| | 9,274 |
| | 1,346 |
| | 1,694 |
| | 1,155 |
| | 5,083 |
| | 500 |
| | 25,000 |
|
| Ending balance (3) | $ | 21,649 |
| | $ | 29,498 |
| | $ | 3,747 |
| | $ | 3,829 |
| | $ | 14,847 |
| | $ | 17,910 |
| | $ | 896 |
| | $ | 92,376 |
|
| | | | | | | | | | | | | | | | |
| |
(1) | Represents adjustment needed to reflect the cumulative day one impact pursuant to the Company's adoption of Accounting Standards Update 2016-13. The adjustment represents a $1.1 million decrease to the allowance attributable to the change in accounting methodology for estimating the allowance for credit losses resulting from the Company's adoption of the standard. |
| |
(2) | Represents adjustment needed to reflect the day one re-class of the Company's PCI loan balances to PCD and the associated gross-up, pursuant to the Company's adoption of Accounting Standards Update 2016-13. The adjustment represents a $1.2 million increase to the allowance resulting from the day one re-class. |
| |
(3) | Balances of accrued interest receivable excluded from amortized cost and the calculation of allowance for credit losses amounted to $25.9 million as of March 31, 2020. |
(2)Represents adjustment needed to reflect the cumulative day one impact pursuant to the Company's adoption of Accounting Standards Update 2016-13. The adjustment represents a $1.1 million decrease to the allowance attributable to the change in accounting methodology for estimating the allowance for credit losses resulting from the Company's adoption of the standard.
(3)Represents adjustment needed to reflect the day one reclassification of the Company's PCI loan balances to PCD and the associated gross-up, pursuant to the Company's adoption of Accounting Standards Update 2016-13. The adjustment represents a $1.2 million increase to the allowance resulting from the day one reclassification.
The balance of allowance for credit losses of $92.4$107.5 million as of March 31, 2020,2021 represents an increasea decrease of $24.6$5.8 million, or 36.3%, in comparison5.2% compared to the implementation balances at January 1,December 31, 2020. This increaseThe decrease in the allowance duringwas driven primarily by $3.3 million of charge-offs and $2.5 million of negative provision. The negative provision reflects improvements in asset quality metrics and overall macro-economic assumptions, as well as an overall reduction in loan balances for the first quarter was primarily driven by forecasted credit deterioration due to the ongoing COVID-19 pandemic. The model applies a reasonable and supportable forecast period of one year, with a reversion period of six months. This forecast was adjusted to use a more severe outlook at March 31, 2020 as compared to the baseline forecast that was used to calculate opening balances on January 1, 2020.
In addition, social distancing restrictions have led to a decline in consumer spending and a steep rise in unemployment, especially within certain industries. quarter. While management is unable to know with certainty the direct, indirect, and future impacts of the COVID-19 pandemic, it is expected itthat the pandemic will have a material adverse impact on manyfuture losses across a broad range of the Company's loan customers.segments. As such, the provision amounts were also qualitatively adjustedallowance for credit losses as of March 31, 2021 reflects increased reserve allocations to factorloan segments that are considered to have elevated loss exposure associated with the COVID-19 pandemic in comparison to March 31, 2020. These loan segments primarily include commercial relationships within industries that are subject to mandated closures and capacity limits that will potentially impede the borrowers’ ability to make loan payments, including loans in the anticipated impact of the COVID-19 pandemic. Management reviewed relationships which may be deemed "at risk" within industries expected to be impacted such as Education &following industry sections: Accommodations, Food Services, Retail Trade, Recreation and Entertainment, and Other Services Hospital & Health Care, Hospitality & Food Service, Motor Vehicles & Parts Dealers, Recreation & Entertainment, Retail- Good (excluding food) and Transportation sectors. The provisionPublic Administration). In addition to these industry exposures, additional risk of loss was qualitatively adjusted upwardattributable to ensure coverage fornon-owner occupied real estate borrowers with significant retail
tenant exposure, as well as home equity loans within a junior lien position. Leveraging actual historical loss given default (LGD) rates combined with stressing of assumptions over probability of default rates over these "at risk" relationships as a result of this review.higher risk segments, qualitative adjustments were made to the initially model-driven calculated loss reserves.
For the purpose of estimating the allowance for credit losses, management segregated the loan portfolio into the portfolio segments detailed in the above tables. Each of these loan categories possesses unique risk characteristics that are considered when determining the appropriate level of allowance for each segment. Some of the risk characteristics unique to each loan category include:
Commercial Portfolio
| |
• | •Commercial and Industrial: Loans in this category consist of revolving and term loan obligations extended to business and corporate enterprises for the purpose of financing working capital and/or capital investment. Collateral generally consists of pledges of business assets including, but not limited to: accounts receivable, inventory, plant and equipment, or real estate, if applicable. Repayment sources consist of primarily, operating cash flow, and secondarily, liquidation of assets. •Commercial Real Estate: Loans in this category consist of mortgage loans to finance investment in real property such as multi-family residential, commercial/retail, office, industrial, hotels, educational and healthcare facilities and other specific use properties. Loans are typically written with amortizing payment structures. Collateral values are determined based upon third party appraisals and evaluations. Loan to value ratios at origination are governed by established policy and regulatory guidelines. Repayment sources consist of, primarily, cash flow from operating leases and rents and, secondarily, liquidation of assets. •Commercial Construction: Loans in this category consist of short-term construction loans, revolving and nonrevolving credit lines and construction/permanent loans to finance the acquisition, development and construction or rehabilitation of real property. Project types include residential land development, 1-4 family, condominium, and multi-family home construction, commercial/retail, office, industrial, hotels, educational and healthcare facilities and other specific use properties. Loans may be written with nonamortizing or hybrid payment structures depending upon the type of project. Collateral values are determined based upon third party appraisals and evaluations. Loan to value ratios at origination are governed by established policy and regulatory guidelines. Repayment sources vary depending upon the type of project and may consist of sale or lease of units, operating cash flows or liquidation of other assets. •: Loans in this category consist of revolving and term loan obligations extended to business and corporate enterprises for the purpose of financing working capital and/or capital investment. Collateral generally consists of pledges of business assets including, but not limited to: accounts receivable, inventory, plant and equipment, or real estate, if applicable. Repayment sources consist of primarily, operating cash flow, and secondarily, liquidation of assets. |
| |
• | Commercial Real Estate: Loans in this category consist of mortgage loans to finance investment in real property such as multi-family residential, commercial/retail, office, industrial, hotels, educational and healthcare facilities and other specific use properties. Loans are typically written with amortizing payment structures. Collateral values are determined based upon third party appraisals and evaluations. Loan to value ratios at origination are governed by established policy and regulatory guidelines. Repayment sources consist of, primarily, cash flow from operating leases and rents and, secondarily, liquidation of assets.
|
| |
• | Commercial Construction: Loans in this category consist of short-term construction loans, revolving and nonrevolving credit lines and construction/permanent loans to finance the acquisition, development and construction or rehabilitation of real property. Project types include residential land development, 1-4 family, condominium, and multi-family home construction, commercial/retail, office, industrial, hotels, educational and healthcare facilities and other specific use properties. Loans may be written with nonamortizing or hybrid payment structures depending upon the type of project. Collateral values are determined based upon third party appraisals and evaluations. Loan to value ratios at origination are governed by established policy and regulatory guidelines. Repayment sources vary depending upon the type of project and may consist of sale or lease of units, operating cash flows or liquidation of other assets.
|
| |
• | Small Business: Loans in this category consist of revolving, term loan and mortgage obligations extended to sole proprietors and small businesses for purposes of financing working capital and/or capital investment. Collateral generally consists of pledges of business assets including, but not limited to, accounts receivable, inventory, plant and equipment, or real estate if applicable. Repayment sources consist primarily of operating cash flows and, secondarily, liquidation of assets. |
For the commercial portfolio it is the Company’s policy to obtain personal guarantees for payment from individuals holding material ownership interests in the borrowing entities.
Consumer Portfolio
| |
• | •Residential Real Estate: Residential mortgage loans held in the Company’s portfolio are made to borrowers who demonstrate the ability to make scheduled payments with full consideration to underwriting factors such as current and expected income, employment status, current assets, other financial resources, credit history and the value of the collateral. Collateral consists of mortgage liens on 1-4 family residential properties. Residential mortgage loans also include loans to construct owner-occupied 1-4 family residential properties. •: Residential mortgage loans held in the Company’s portfolio are made to borrowers who demonstrate the ability to make scheduled payments with full consideration to underwriting factors such as current and expected income, employment status, current assets, other financial resources, credit history and the value of the collateral. Collateral consists of mortgage liens on 1-4 family residential properties. Residential mortgage loans also include loans to construct owner-occupied 1-4 family residential properties. |
| |
• | Home Equity: Home equity loans and credit lines are made to qualified individuals and are primarily secured by senior or junior mortgage liens on owner-occupied 1-4 family homes, condominiums or vacation homes. Each home equity loan has a fixed rate and is billed in equal payments comprised of principal and interest. The majority of home equity lines of credit have a variable rate and are billed in interest-only payments during the draw period. At the end of the draw period, the home equity line of credit is billed as a percentage of the then outstanding principal balance plus all accrued interest over a predetermined repayment period, as set forth in the note. Additionally, the Company has the option of renewing each line of credit for additional draw periods. Borrower qualifications include favorable credit history combined with supportive income requirements and combined loan to value ratios within established policy guidelines. •Other Consumer: Other consumer loan products include personal lines of credit and amortizing loans made to qualified individuals for various purposes such as education, debt consolidation, personal expenses or overdraft protection. Borrower qualifications include favorable credit history combined with supportive income requirements and combined loan to value ratios within established policy guidelines. |
| |
• | Other Consumer: Other consumer loan products include personal lines of credit and amortizing loans made to qualified individuals for various purposes such as education, debt consolidation, personal expenses or overdraft protection. Borrower
|
qualifications include favorable credit history combined with supportive income and collateral requirements within established policy guidelines. These loans may be secured or unsecured.
Credit Quality
The Company continually monitors the asset quality of the loan portfolio using all available information. Based on this information, loans demonstrating certain payment issues or other weaknesses may be categorized as adversely risk-rated, delinquent, nonperforming and/or put on nonaccrual status. Additionally, in the course of resolving such loans, the Company may choose to restructure the contractual terms of certain loans to match the borrower’s ability to repay the loan based on their current financial condition.
The Company reviews numerous credit quality indicators when assessing the risk in its loan portfolio. For the commercial portfolio, the Company utilizes a 10-point credit risk-rating system, which assigns a risk-grade to each loan obligation based on a number of quantitative and qualitative factors associated with a commercial or small business loan transaction. Factors considered include industry and market conditions, position within the industry, earnings trends, operating cash flow, asset/liability values, debt capacity, guarantor strength, management and controls, financial reporting, collateral, and other considerations. The risk-ratingsrisk-rating categories for the commercial portfolio are defined as follows:
| |
• | •Pass: Risk-rating “1” through “6” comprises of loans ranging from ‘Substantially Risk Free’ which indicates borrowers are of unquestioned credit standing and the pinnacle of credit quality, well established companies with a very strong financial condition, and loans fully secured by cash collateral, through ‘Acceptable Risk’, which indicates borrowers may exhibit declining earnings, strained cash flow, increasing or above average leverage and/or weakening market fundamentals that indicate below average asset quality, margins and market share. Collateral coverage is protective. •Potential Weakness: Borrowers exhibit potential credit weaknesses or downward trends deserving management’s close attention. If not checked or corrected, these trends will weaken the Company’s asset and position. While potentially weak, currently these borrowers are marginally acceptable; no loss of principal or interest is envisioned. •Definite Weakness Loss Unlikely: Borrowers exhibit well defined weaknesses that jeopardize the orderly liquidation of debt. Loans may be inadequately protected by the current net worth and paying capacity of the obligor or by the collateral pledged, if any. Normal repayment from the borrower is in jeopardy, although no loss of principal is envisioned. However, there is a distinct possibility that a partial loss of interest and/or principal will occur if the deficiencies are not corrected. Collateral coverage may be inadequate to cover the principal obligation. •Partial Loss Probable: Borrowers exhibit well defined weaknesses that jeopardize the orderly liquidation of debt with the added provision that the weaknesses make collection of the debt in full, on the basis of currently existing facts, conditions, and values, highly questionable and improbable. Serious problems exist to the point where partial loss of principal is likely. •Risk-rating grades “1” through “6” comprise those loans ranging from ‘Substantially Risk Free’ which indicates borrowers are of unquestioned credit standing and the pinnacle of credit quality, well established companies with a very strong financial condition, and loans fully secured by cash collateral, through ‘Acceptable Risk’, which indicates borrowers may exhibit declining earnings, strained cash flow, increasing or above average leverage and/or weakening market fundamentals that indicate below average asset quality, margins and market share. Collateral coverage is protective. |
| |
• | Potential Weakness: Borrowers exhibit potential credit weaknesses or downward trends deserving management’s close attention. If not checked or corrected, these trends will weaken the Company’s asset and position. While potentially weak, currently these borrowers are marginally acceptable; no loss of principal or interest is envisioned.
|
| |
• | Definite Weakness Loss Unlikely: Borrowers exhibit well defined weaknesses that jeopardize the orderly liquidation of debt. Loans may be inadequately protected by the current net worth and paying capacity of the obligor or by the collateral pledged, if any. Normal repayment from the borrower is in jeopardy, although no loss of principal is envisioned. However, there is a distinct possibility that a partial loss of interest and/or principal will occur if the deficiencies are not corrected. Collateral coverage may be inadequate to cover the principal obligation.
|
| |
• | Partial Loss Probable: Borrowers exhibit well defined weaknesses that jeopardize the orderly liquidation of debt with the added provision that the weaknesses make collection of the debt in full, on the basis of currently existing facts, conditions, and values, highly questionable and improbable. Serious problems exist to the point where partial loss of principal is likely.
|
| |
• | Definite Loss: Borrowers deemed incapable of repayment. Loans to such borrowers are considered uncollectible and of such little value that continuation as active assets of the Company is not warranted. |
The credit quality of the commercial loan portfolio is actively monitored and any changes in credit quality are reflected in risk-rating changes. Risk-ratings are assigned or reviewed for all new loans, when advancing significant additions to existing relationships (over $50,000), at least quarterly for all actively managed loans, and any time a significant event occurs, including at renewal of the loan.
The Company utilizes a comprehensive, continuous strategy for evaluating and monitoring commercial credit quality. Initially, credit quality is determined at loan origination and is re-evaluated when subsequent actions, such as renewals, modifications or reviews, occur. Actively managed commercial borrowers are required to provide updated financial information at least annually which is carefully evaluated for any changes in credit quality. Larger loan relationships are subject to a full annual credit review by an experienced credit analysis group,professionals, while continuous portfolio monitoring techniques are employed to evaluate changes in credit quality for smaller loan relationships. Any changes in credit quality are reflected in risk-rating changes. Additionally, the Company retains an independent loan review firm to evaluate the credit quality of the commercial loan portfolio. The independent loan review process achieves significant penetration into the commercial loan portfolio and reports the results of these reviews to the Audit Committee of the Board of Directors on a quarterly basis. Commercial loan modifications granted by the Company allowing payment deferrals for qualifying borrowers in accordance with the Coronavirus Aid, Relief and Economic Security Act ("CARES Act") have been assessed for potential downgrades of risk ratings.
For the Company’s consumer portfolio, the quality of the loan is best indicated by the repayment performance of an individual borrower. As a result, for this portfolio the Company utilizes a pass/default risk-rating system, based on an age analysis (i.e., days past due) associated with each consumer loan. Under this structure, consumer loans less than 90 days past due are assigned a "pass" rating, while any consumer loans greater than 90 days or more past due are assigned a "default" rating. Consumer loan modifications granted by the Company allowing payment deferrals for qualifying borrowers in accordance with the CARES Act have not been categorized as delinquent loans.
The following table details the amortized cost balances of the Company's loan portfolios, presented by credit quality indicator and origination year as of the dates indicated below:
| | | | | | | | | | | | | | | | | | | | | | | | | | | | | | | | | | | | | | | | | | | | | | | | | | | | | |
| | March 31, 2021 |
| 2021 | | 2020 | | 2019 | | 2018 | | 2017 | | Prior | | Revolving Loans | | Revolving converted to Term | | Total |
| | (Dollars in thousands) |
Commercial and
industrial | | | | | | | | | | | | | | | | | |
| Pass (1) | $ | 420,682 | | | $ | 724,577 | | | $ | 127,454 | | | $ | 88,970 | | | $ | 25,737 | | | $ | 27,123 | | | $ | 589,448 | | | $ | — | | | $ | 2,003,991 | |
| Potential weakness | 3,424 | | | 14,991 | | | 2,636 | | | 2,148 | | | 4,288 | | | 3,205 | | | 12,252 | | | — | | | 42,944 | |
| Definite weakness - loss unlikely | 17,912 | | | 663 | | | 1,116 | | | 1,327 | | | 2,768 | | | 482 | | | 6,927 | | | 0 | | | 31,195 | |
| Partial loss probable | 0 | | | 0 | | | 0 | | | 0 | | | 0 | | | 143 | | | 8,398 | | | 0 | | | 8,541 | |
| Definite loss | 0 | | | 0 | | | 0 | | | 0 | | | 0 | | | 0 | | | 0 | | | 0 | | | — | |
| Total commercial and industrial | $ | 442,018 | | | $ | 740,231 | | | $ | 131,206 | | | $ | 92,445 | | | $ | 32,793 | | | $ | 30,953 | | | $ | 617,025 | | | $ | — | | | $ | 2,086,671 | |
| | | | | | | | | | | | | | | | | |
| | | | | | | | | | | | | | | | | |
| | | | | | | | | | | | | | | | | |
| | | | | | | | | | | | | | | | | |
| Commercial real estate | | | | | | | | | | | | | | | | | |
| Pass | $ | 214,573 | | | $ | 1,043,424 | | | $ | 687,959 | | | $ | 432,728 | | | $ | 524,194 | | | $ | 966,331 | | | $ | 16,196 | | | $ | — | | | $ | 3,885,405 | |
| Potential weakness | 390 | | | 29,218 | | | 53,849 | | | 31,274 | | | 18,981 | | | 86,160 | | | 13,612 | | | 0 | | | 233,484 | |
| Definite weakness - loss unlikely | 3,590 | | | 22,536 | | | 3,754 | | | 3,474 | | | 9,892 | | | 15,482 | | | 0 | | | 0 | | | 58,728 | |
| Partial loss probable | 0 | | | 0 | | | 0 | | | 0 | | | 0 | | | 0 | | | 0 | | | 0 | | | 0 | |
| Definite loss | 0 | | | 0 | | | 0 | | | 0 | | | 0 | | | 0 | | | 0 | | | 0 | | | 0 | |
| Total commercial real estate | $ | 218,553 | | | $ | 1,095,178 | | | $ | 745,562 | | | $ | 467,476 | | | $ | 553,067 | | | $ | 1,067,973 | | | $ | 29,808 | | | $ | 0 | | | $ | 4,177,617 | |
| | | | | | | | | | | | | | | | | |
| | | | | | | | | | | | | | | | | |
| | | | | | | | | | | | | | | | | |
| | | | | | | | | | | | | | | | | |
| Commercial construction | | | | | | | | | | | | | | | | | |
| Pass | $ | 28,323 | | | $ | 239,954 | | | $ | 142,076 | | | $ | 28,189 | | | $ | 23,313 | | | $ | 6,628 | | | $ | 19,934 | | | $ | — | | | $ | 488,417 | |
| Potential weakness | 0 | | | 17,544 | | | 9,691 | | | — | | | 0 | | | 0 | | | 190 | | | 0 | | | 27,425 | |
| Definite weakness - loss unlikely | 0 | | | 0 | | | — | | | 520 | | | 0 | | | 0 | | | — | | | 0 | | | 520 | |
| Partial loss probable | 0 | | | 0 | | | 0 | | | 0 | | | 0 | | | 0 | | | 0 | | | 0 | | | 0 | |
| Definite loss | 0 | | | 0 | | | 0 | | | 0 | | | 0 | | | 0 | | | 0 | | | 0 | | | 0 | |
| Total commercial construction | $ | 28,323 | | | $ | 257,498 | | | $ | 151,767 | | | $ | 28,709 | | | $ | 23,313 | | | $ | 6,628 | | | $ | 20,124 | | | $ | — | | | $ | 516,362 | |
| | | | | | | | | | | | | | | | | |
| | | | | | | | | | | | | | | | | |
| | | | | | | | | | | | | | | | | |
| | | | | | | | | | | | | | | | | |
| Small business | | | | | | | | | | | | | | | | | |
| Pass | $ | 10,307 | | | $ | 41,418 | | | $ | 25,817 | | | $ | 17,750 | | | $ | 12,624 | | | $ | 29,309 | | | $ | 33,658 | | | $ | 0 | | | $ | 170,883 | |
| Potential weakness | 0 | | | — | | | 389 | | | 204 | | | 10 | | | 202 | | | 634 | | | 0 | | | 1,439 | |
| Definite weakness - loss unlikely | 0 | | | 677 | | | 51 | | | 59 | | | 17 | | | 301 | | | 758 | | | 0 | | | 1,863 | |
| Partial loss probable | 0 | | | 0 | | | 0 | | | 0 | | | 0 | | | 0 | | | 26 | | | 0 | | | 26 | |
| Definite loss | 0 | | | 0 | | | 0 | | | 0 | | | 0 | | | 0 | | | 0 | | | 0 | | | 0 | |
| Total small business | $ | 10,307 | | | $ | 42,095 | | | $ | 26,257 | | | $ | 18,013 | | | $ | 12,651 | | | $ | 29,812 | | | $ | 35,076 | | | $ | 0 | | | $ | 174,211 | |
| | | | | | | | | | | | | | | | | |
| | | | | | | | | | | | | | | | | |
| | | | | | | | | | | | | | | | | |
| | | | | | | | | | | | | | | | | |
| Residential real estate | | | | | | | | | | | | | | | | | |
| Pass | $ | 80,657 | | | $ | 212,891 | | | $ | 126,359 | | | $ | 133,150 | | | $ | 130,580 | | | $ | 554,848 | | | $ | 0 | | | $ | 0 | | | $ | 1,238,485 | |
| Default | 0 | | | 0 | | | — | | | 427 | | | 0 | | | 2,877 | | | 0 | | | 0 | | | 3,304 | |
| | | | | | | | | | | | | | | | | |
| Total residential real estate | $ | 80,657 | | | $ | 212,891 | | | $ | 126,359 | | | $ | 133,577 | | | $ | 130,580 | | | $ | 557,725 | | | $ | 0 | | | $ | 0 | | | $ | 1,241,789 | |
| | | | | | | | | | | | | | | | | |
| | | | | | | | | | | | | | | | | |
| | | | | | | | | | | | | | | | | |
| | | | | | | | | | | | | | | | | |
| Home equity | | | | | | | | | | | | | | | | | |
| Pass | $ | 23,583 | | | $ | 77,497 | | | $ | 51,398 | | | $ | 46,648 | | | $ | 48,132 | | | $ | 140,376 | | | $ | 636,881 | | | $ | 1,762 | | | $ | 1,026,277 | |
| Default | 0 | | | 0 | | | 0 | | | — | | | 0 | | | 210 | | | 2,008 | | | — | | | 2,218 | |
| | | | | | | | | | | | | | | | | |
| Total home equity | $ | 23,583 | | | $ | 77,497 | | | $ | 51,398 | | | $ | 46,648 | | | $ | 48,132 | | | $ | 140,586 | | | $ | 638,889 | | | $ | 1,762 | | | $ | 1,028,495 | |
| | | | | | | | | | | | | | | | | |
| | | | | | | | | | | | | | | | | |
| | | | | | | | | | | | | | | | | |
| | | | | | | | | | | | | | | | | |
| Other consumer | | | | | | | | | | | | | | | | | |
| Pass | $ | 46 | | | $ | 540 | | | $ | 326 | | | $ | 146 | | | $ | 620 | | | $ | 6,800 | | | $ | 12,939 | | | $ | 0 | | | $ | 21,417 | |
| | | | | | | | | | | | | | | | | | | | | | | | | | | | | | | | | | | | | | | | | | | | | | | | | | | | | |
| Default | 0 | | | 0 | | | 0 | | | 0 | | | 15 | | | 111 | | | 3 | | | 0 | | | 129 | |
| | | | | | | | | | | | | | | | | |
| Total other consumer | $ | 46 | | | $ | 540 | | | $ | 326 | | | $ | 146 | | | $ | 635 | | | $ | 6,911 | | | $ | 12,942 | | | $ | 0 | | | $ | 21,546 | |
| | | | | | | | | | | | | | | | | |
| Total | $ | 803,487 | | | $ | 2,425,930 | | | $ | 1,232,875 | | | $ | 787,014 | | | $ | 801,171 | | | $ | 1,840,588 | | | $ | 1,353,864 | | | $ | 1,762 | | | $ | 9,246,691 | |
| | | | | | | | | | | | | | | | | |
| | | | | | | | | | | | | | | | | |
| | | | | | | | | | | | | | | | | |
| | | | | | | | | | | | | | | | | | | | | | | | | | | | | | | | | | | | | | | | | | | | | | | | | | | | | |
| March 31, 2020 |
| 2020 | | 2019 | | 2018 | | 2017 | | 2016 | | Prior | | Revolving Loans | | Revolving converted to Term | | Total |
| (Dollars in thousands) |
Commercial and
industrial | | | | | | | | | | | | | | | | | |
| Pass (1) | $ | 119,886 | | | $ | 213,925 | | | $ | 138,376 | | | $ | 50,323 | | | $ | 36,685 | | | $ | 33,576 | | | $ | 736,304 | | | $ | 327 | | | $ | 1,329,402 | |
| Potential weakness | 362 | | | 5,432 | | | 1,489 | | | 4,909 | | | 725 | | | 697 | | | 21,780 | | | 50 | | | 35,444 | |
| Definite weakness - loss unlikely | 495 | | | 2,128 | | | 26,006 | | | 5,589 | | | 2,604 | | | 1,575 | | | 44,932 | | | 0 | | | 83,329 | |
| Partial loss probable | 0 | | | 0 | | | 0 | | | 0 | | | 0 | | | 49 | | | 0 | | | 0 | | | 49 | |
| Definite loss | 0 | | | 0 | | | 0 | | | 0 | | | 0 | | | 0 | | | 0 | | | 0 | | | — | |
| Total commercial and industrial | $ | 120,743 | | | $ | 221,485 | | | $ | 165,871 | | | $ | 60,821 | | | $ | 40,014 | | | $ | 35,897 | | | $ | 803,016 | | | $ | 377 | | | $ | 1,448,224 | |
| | | | | | | | | | | | | | | | | |
| Commercial real estate | | | | | | | | | | | | | | | | | |
| Pass | $ | 260,217 | | | $ | 943,205 | | | $ | 586,125 | | | $ | 651,335 | | | $ | 468,824 | | | $ | 945,248 | | | $ | 48,056 | | | $ | 2,987 | | | $ | 3,905,997 | |
| Potential weakness | 1,809 | | | 8,303 | | | 33,755 | | | 8,506 | | | 9,851 | | | 42,382 | | | 0 | | | 0 | | | 104,606 | |
| Definite weakness - loss unlikely | 0 | | | 3,612 | | | 7,432 | | | 20,395 | | | 6,993 | | | 12,312 | | | 0 | | | 0 | | | 50,744 | |
| Partial loss probable | 0 | | | 0 | | | 0 | | | 0 | | | 0 | | | 0 | | | 0 | | | 0 | | | 0 | |
| Definite loss | 0 | | | 0 | | | 0 | | | 0 | | | 0 | | | 0 | | | 0 | | | 0 | | | 0 | |
| Total commercial real estate | $ | 262,026 | | | $ | 955,120 | | | $ | 627,312 | | | $ | 680,236 | | | $ | 485,668 | | | $ | 999,942 | | | $ | 48,056 | | | $ | 2,987 | | | $ | 4,061,347 | |
| | | | | | | | | | | | | | | | | |
| Commercial construction | | | | | | | | | | | | | | | | | |
| Pass | $ | 43,369 | | | $ | 221,773 | | | $ | 114,561 | | | $ | 73,493 | | | $ | 0 | | | $ | 6,867 | | | $ | 44,225 | | | $ | 325 | | | $ | 504,613 | |
| Potential weakness | 0 | | | 554 | | | 347 | | | 19,044 | | | 0 | | | 0 | | | 347 | | | 0 | | | 20,292 | |
| Definite weakness - loss unlikely | 0 | | | 0 | | | 1,887 | | | 0 | | | 0 | | | 0 | | | 346 | | | 0 | | | 2,233 | |
| Partial loss probable | 0 | | | 0 | | | 0 | | | 0 | | | 0 | | | 0 | | | 0 | | | 0 | | | 0 | |
| Definite loss | 0 | | | 0 | | | 0 | | | 0 | | | 0 | | | 0 | | | 0 | | | 0 | | | 0 | |
| Total commercial construction | $ | 43,369 | | | $ | 222,327 | | | $ | 116,795 | | | $ | 92,537 | | | $ | 0 | | | $ | 6,867 | | | $ | 44,918 | | | $ | 325 | | | $ | 527,138 | |
| | | | | | | | | | | | | | | | | |
| Small business | | | | | | | | | | | | | | | | | |
| Pass | $ | 8,414 | | | $ | 31,651 | | | $ | 25,184 | | | $ | 17,848 | | | $ | 17,594 | | | $ | 26,734 | | | $ | 47,109 | | | $ | 0 | | | $ | 174,534 | |
| Potential weakness | 0 | | | 12 | | | 18 | | | 13 | | | 753 | | | 259 | | | 597 | | | 0 | | | 1,652 | |
| Definite weakness - loss unlikely | 0 | | | 47 | | | 133 | | | 51 | | | 169 | | | 598 | | | 636 | | | 0 | | | 1,634 | |
| Partial loss probable | 0 | | | 0 | | | 0 | | | 0 | | | 0 | | | 0 | | | 0 | | | 0 | | | 0 | |
| Definite loss | 0 | | | 0 | | | 0 | | | 0 | | | 0 | | | 0 | | | 0 | | | 0 | | | 0 | |
| Total small business | $ | 8,414 | | | $ | 31,710 | | | $ | 25,335 | | | $ | 17,912 | | | $ | 18,516 | | | $ | 27,591 | | | $ | 48,342 | | | $ | 0 | | | $ | 177,820 | |
| | | | | | | | | | | | | | | | | |
| Residential real estate | | | | | | | | | | | | | | | | | |
| Pass | $ | 39,122 | | | $ | 204,524 | | | $ | 260,899 | | | $ | 210,662 | | | $ | 283,255 | | | $ | 523,742 | | | $ | 0 | | | $ | 0 | | | $ | 1,522,204 | |
| Default | 0 | | | 0 | | | 427 | | | 435 | | | 0 | | | 5,350 | | | 0 | | | 0 | | | 6,212 | |
| | | | | | | | | | | | | | | | | |
| Total residential real estate | $ | 39,122 | | | $ | 204,524 | | | $ | 261,326 | | | $ | 211,097 | | | $ | 283,255 | | | $ | 529,092 | | | $ | 0 | | | $ | 0 | | | $ | 1,528,416 | |
| | | | | | | | | | | | | | | | | |
| Home equity | | | | | | | | | | | | | | | | | |
| Pass | $ | 23,397 | | | $ | 75,161 | | | $ | 70,081 | | | $ | 67,740 | | | $ | 51,106 | | | $ | 138,733 | | | $ | 715,169 | | | $ | 1,853 | | | $ | 1,143,240 | |
| Default | 0 | | | 0 | | | 0 | | | 18 | | | 0 | | | 579 | | | 2,372 | | | 61 | | | 3,030 | |
| | | | | | | | | | | | | | | | | |
| Total home equity | $ | 23,397 | | | $ | 75,161 | | | $ | 70,081 | | | $ | 67,758 | | | $ | 51,106 | | | $ | 139,312 | | | $ | 717,541 | | | $ | 1,914 | | | $ | 1,146,270 | |
| | | | | | | | | | | | | | | | | | | | | | | | | | | | | | | | | | | | | | | | | | | | | | | | | | | | | |
| | | | | | | | | | | | | | | | | |
| Other consumer | | | | | | | | | | | | | | | | | |
| Pass | $ | 414 | | | $ | 705 | | | $ | 356 | | | $ | 1,049 | | | $ | 1,000 | | | $ | 10,850 | | | $ | 12,767 | | | $ | 0 | | | $ | 27,141 | |
| Default | 0 | | | 0 | | | 0 | | | 19 | | | 0 | | | 39 | | | 16 | | | 0 | | | 74 | |
| | | | | | | | | | | | | | | | | |
| Total other consumer | $ | 414 | | | $ | 705 | | | $ | 356 | | | $ | 1,068 | | | $ | 1,000 | | | $ | 10,889 | | | $ | 12,783 | | | $ | 0 | | | $ | 27,215 | |
| | | | | | | | | | | | | | | | | |
| Total | $ | 497,485 | | | $ | 1,711,032 | | | $ | 1,267,076 | | | $ | 1,131,429 | | | $ | 879,559 | | | $ | 1,749,590 | | | $ | 1,674,656 | | | $ | 5,603 | | | $ | 8,916,430 | |
(1)Loans originated as part of the Paycheck Protection Program ("PPP") established by the CARES Act are included within commercial and industrial under the 2021 and 2020 vintage year and "pass" category as these loans are 100% guaranteed by the U.S. Government. Outstanding PPP loans totaled $846.3 million as of March 31, 2020:
|
| | | | | | | | | | | | | | | | | | | | | | | | | | | | | | | | | | | |
| | March 31, 2020 |
| | 2020 | | 2019 | | 2018 | | 2017 | | 2016 | | Prior | | Revolving Loans | | Revolving converted to Term | | Total |
| | (Dollars in thousands) |
Commercial and
industrial | | | | | | | | | | | | | | | | |
|
|
| Pass | $ | 119,886 |
| | $ | 213,925 |
| | $ | 138,376 |
| | $ | 50,323 |
| | $ | 36,685 |
| | $ | 33,576 |
| | $ | 736,304 |
| | $ | 327 |
| | $ | 1,329,402 |
|
| Potential weakness | 362 |
| | 5,432 |
| | 1,489 |
| | 4,909 |
| | 725 |
| | 697 |
| | 21,780 |
| | 50 |
| | 35,444 |
|
| Definite weakness - loss unlikely | 495 |
| | 2,128 |
| | 26,006 |
| | 5,589 |
| | 2,604 |
| | 1,575 |
| | 44,932 |
| | — |
| | 83,329 |
|
| Partial loss probable | — |
| | — |
| | — |
| | — |
| | — |
| | 49 |
| | — |
| | — |
| | 49 |
|
| Definite loss | — |
| | — |
| | — |
| | — |
| | — |
| | — |
| | — |
| | — |
| | — |
|
| Total commercial and industrial | $ | 120,743 |
| | $ | 221,485 |
| | $ | 165,871 |
| | $ | 60,821 |
| | $ | 40,014 |
| | $ | 35,897 |
| | $ | 803,016 |
| | $ | 377 |
| | $ | 1,448,224 |
|
| | | | | | | | | | | | | | | | | | |
| Commercial real estate | | | | | | | | | | | | | | | | | |
| Pass | $ | 260,217 |
| | $ | 943,205 |
| | $ | 586,125 |
| | $ | 651,335 |
| | $ | 468,824 |
| | $ | 945,248 |
| | $ | 48,056 |
| | $ | 2,987 |
| | $ | 3,905,997 |
|
| Potential weakness | 1,809 |
| | 8,303 |
| | 33,755 |
| | 8,506 |
| | 9,851 |
| | 42,382 |
| | — |
| | — |
| | 104,606 |
|
| Definite weakness - loss unlikely | — |
| | 3,612 |
| | 7,432 |
| | 20,395 |
| | 6,993 |
| | 12,312 |
| | — |
| | — |
| | 50,744 |
|
| Partial loss probable | — |
| | — |
| | — |
| | — |
| | — |
| | — |
| | — |
| | — |
| | — |
|
| Definite loss | — |
| | — |
| | — |
| | — |
| | — |
| | — |
| | — |
| | — |
| | — |
|
| Total commercial real estate | $ | 262,026 |
| | $ | 955,120 |
| | $ | 627,312 |
| | $ | 680,236 |
| | $ | 485,668 |
| | $ | 999,942 |
| | $ | 48,056 |
| | $ | 2,987 |
| | $ | 4,061,347 |
|
| | | | | | | | | | | | | | | | | | |
| Commercial construction | | | | | | | | | | | | | | | | | |
| Pass | $ | 43,369 |
| | $ | 221,773 |
| | $ | 114,561 |
| | $ | 73,493 |
| | $ | — |
| | $ | 6,867 |
| | $ | 44,225 |
| | $ | 325 |
| | $ | 504,613 |
|
| Potential weakness | — |
| | 554 |
| | 347 |
| | 19,044 |
| | — |
| | — |
| | 347 |
| | — |
| | 20,292 |
|
| Definite weakness - loss unlikely | — |
| | — |
| | 1,887 |
| | — |
| | — |
| | — |
| | 346 |
| | — |
| | 2,233 |
|
| Partial loss probable | — |
| | — |
| | — |
| | — |
| | — |
| | — |
| | — |
| | — |
| | — |
|
| Definite loss | — |
| | — |
| | — |
| | — |
| | — |
| | — |
| | — |
| | — |
| | — |
|
| Total commercial construction | $ | 43,369 |
| | $ | 222,327 |
| | $ | 116,795 |
| | $ | 92,537 |
| | $ | — |
| | $ | 6,867 |
| | $ | 44,918 |
| | $ | 325 |
| | $ | 527,138 |
|
| | | | | | | | | | | | | | | | | | |
| Small business | | | | | | | | | | | | | | | | | |
| Pass | $ | 8,414 |
| | $ | 31,651 |
| | $ | 25,184 |
| | $ | 17,848 |
| | $ | 17,594 |
| | $ | 26,734 |
| | $ | 47,109 |
| | $ | — |
| | $ | 174,534 |
|
| Potential weakness | — |
| | 12 |
| | 18 |
| | 13 |
| | 753 |
| | 259 |
| | 597 |
| | — |
| | 1,652 |
|
| Definite weakness - loss unlikely | — |
| | 47 |
| | 133 |
| | 51 |
| | 169 |
| | 598 |
| | 636 |
| | — |
| | 1,634 |
|
| Partial loss probable | — |
| | — |
| | — |
| | — |
| | — |
| | — |
| | — |
| | — |
| | — |
|
| Definite loss | — |
| | — |
| | — |
| | — |
| | — |
| | — |
| | — |
| | — |
| | — |
|
| Total small business | $ | 8,414 |
| | $ | 31,710 |
| | $ | 25,335 |
| | $ | 17,912 |
| | $ | 18,516 |
| | $ | 27,591 |
| | $ | 48,342 |
| | $ | — |
| | $ | 177,820 |
|
| | | | | | | | | | | | | | | | | | |
| Residential real estate | | | | | | | | | | | | | | | | | |
| Pass | $ | 39,122 |
| | $ | 204,524 |
| | $ | 260,899 |
| | $ | 210,662 |
| | $ | 283,255 |
| | $ | 523,742 |
| | $ | — |
| | $ | — |
| | $ | 1,522,204 |
|
| Default | — |
| | — |
| | 427 |
| | 435 |
| | — |
| | 5,350 |
| | — |
| | — |
| | 6,212 |
|
| Total residential real estate | $ | 39,122 |
| | $ | 204,524 |
| | $ | 261,326 |
| | $ | 211,097 |
| | $ | 283,255 |
| | $ | 529,092 |
| | $ | — |
| | $ | — |
| | $ | 1,528,416 |
|
| | | | | | | | | | | | | | | | | | |
| Home equity | | | | | | | | | | | | | | | | | |
| Pass | $ | 23,397 |
| | $ | 75,161 |
| | $ | 70,081 |
| | $ | 67,740 |
| | $ | 51,106 |
| | $ | 138,733 |
| | $ | 715,169 |
| | $ | 1,853 |
| | $ | 1,143,240 |
|
| Default | — |
| | — |
| | — |
| | 18 |
| | — |
| | 579 |
| | 2,372 |
| | 61 |
| | 3,030 |
|
| Total home equity | $ | 23,397 |
| | $ | 75,161 |
| | $ | 70,081 |
| | $ | 67,758 |
| | $ | 51,106 |
| | $ | 139,312 |
| | $ | 717,541 |
| | $ | 1,914 |
| | $ | 1,146,270 |
|
|
| | | | | | | | | | | | | | | | | | | | | | | | | | | | | | | | | | | |
| | | | | | | | | | | | | | | | | | |
| Other consumer | | | | | | | | | | | | | | | | | |
| Pass | $ | 414 |
| | $ | 705 |
| | $ | 356 |
| | $ | 1,049 |
| | $ | 1,000 |
| | $ | 10,850 |
| | $ | 12,767 |
| | $ | — |
| | $ | 27,141 |
|
| Default | — |
| | — |
| | — |
| | 19 |
| | — |
| | 39 |
| | 16 |
| | — |
| | 74 |
|
| Total other consumer | $ | 414 |
| | $ | 705 |
| | $ | 356 |
| | $ | 1,068 |
| | $ | 1,000 |
| | $ | 10,889 |
| | $ | 12,783 |
| | $ | — |
| | $ | 27,215 |
|
| | | | | | | | | | | | | | | | | | |
| Total | $ | 497,485 |
| | $ | 1,711,032 |
| | $ | 1,267,076 |
| | $ | 1,131,429 |
| | $ | 879,559 |
| | $ | 1,749,590 |
| | $ | 1,674,656 |
| | $ | 5,603 |
| | $ | 8,916,430 |
|
For the Company’s consumer portfolio, the quality of the loan is best indicated by the repayment performance of an individual borrower. However, the Company does supplement performance data with current Fair Isaac Corporation (“FICO”) scores and Loan to Value (“LTV”) estimates. Current FICO data is purchased and appended to all consumer loans on a regular basis. In addition, automated valuation services and broker opinions of value are used to supplement original value data for the residential and home equity portfolios, periodically. The following table shows the weighted average FICO scores and the weighted average combined LTV ratios as ofat the periodsdates indicated below:
| | | | | | | | | | | |
| March 31
2021 | | December 31
2020 |
| Residential portfolio | | | |
| FICO score (re-scored)(1) | 749 | | | 749 | |
| LTV (re-valued)(2) | 56.5 | % | | 57.4 | % |
| Home equity portfolio | | | |
| FICO score (re-scored)(1) | 772 | | | 771 | |
| LTV (re-valued)(2)(3) | 45.9 | % | | 46.0 | % |
|
| | | | | |
| | March 31
2020 | | December 31
2019 |
| Residential portfolio | | | |
| FICO score (re-scored)(1) | 749 |
| | 749 |
|
| LTV (re-valued)(2) | 58.1 | % | | 59.0 | % |
| Home equity portfolio | | | |
| FICO score (re-scored)(1) | 768 |
| | 767 |
|
| LTV (re-valued)(2)(3) | 46.9 | % | | 46.6 | % |
| |
(1) | The average FICO scores at March 31, 2020 are based upon rescores available from February 2020 and origination score data for loans booked in March 2020. The average FICO scores at December 31, 2019 were based upon rescores available from November 2019 and origination score data for loans booked in December 2019. |
| |
(2) | The combined LTV ratios for March 31, 2020 are based upon updated automated valuations as of March 2020, when available, and/or the most current valuation data available. The combined LTV ratios for December 31, 2019 were based upon updated automated valuations as of November 2019, when available, and/or the most current valuation data available. The updated automated valuations provide new information on loans that may be available since the previous valuation was obtained. If no new information is available, the valuation will default to the previously obtained data or most recent appraisal. |
| |
(3) | For home equity loans and lines in a subordinate lien, the LTV data represents a combined LTV, taking into account the senior lien data for loans and lines. |
(2)The combined LTV ratios for March 31, 2021 are based upon updated automated valuations as of February 2021, when available, and/or the most current valuation data available. The combined LTV ratios for December 31, 2020 were based upon updated automated valuations as of November 2020, when available, and/or the most current valuation data available as of such date. The updated automated valuations provide new information on loans that may be available since the previous valuation was obtained. If no new information is available, the valuation will default to the previously obtained data or most recent appraisal.
(3)For home equity loans and lines in a subordinate lien, the LTV data represents a combined LTV, taking into account the senior lien data for loans and lines.
Unfunded Commitments
Management evaluates the need for a reserve on unfunded lending commitments in a manner consistent with loans held for investment. As of January 1, 2020, the Company's reserve for unfunded commitments was $1.1 million, as adjusted for adoption of CECL. At March 31, 2021, and December 31, 2020 the Company's estimated reserve for unfunded commitments amounted to $650,000.$1.0 million and $1.2 million, respectively.
Asset Quality
The Company’s philosophy toward managing its loan portfolios is predicated upon careful monitoring, which stresses early detection and response to delinquent and default situations. Delinquent loans are managed by a team of collection specialists and the Company seeks to make arrangements to resolve any delinquent or default situation over the shortest possible time frame. As a general rule, loans more than 90 days or more past due with respect to principal or interest are classified as nonaccrual loans. The Company also may use discretion regarding other loans over 90 days or more delinquent if the loan is well secured and/or in process of collection.
In response to the COVID-19 pandemic, the Company has granted loan modifications to allow deferral of payments for borrowers negatively impacted by the pandemic. The balance of loans with active deferrals as of March 31, 2021 and December 31, 2020 was $220.6 million and $173.6 million, respectively. The majority of these loans with active deferrals continue to be characterized as current loans. In accordance with regulatory guidance, these modifications are not considered to be troubled debt restructures ("TDRs") if they were performing prior to December 31, 2019. Additionally, a majority of these are characterized as current and therefore are not impacting nonaccrual or delinquency totals as of March 31, 2021 and December 31, 2020. The Company does, however, consider all active deferrals when estimating loss reserves. As loans reach their deferral maturity date, consideration of TDR and delinquency status will resume in accordance with the Company's accounting policy.
The following table shows information regarding nonaccrual loans as of the dates indicated:
| | | | Nonaccrual Balances | | | Nonaccrual Balances |
| | March 31, 2020 | | December 31, 2019 | | | March 31, 2021 | | December 31, 2020 |
| | With Allowance for Credit Losses | | Without Allowance for Credit Losses | | Total | | Total | | | With Allowance for Credit Losses | | Without Allowance for Credit Losses | | Total | | With Allowance for Credit Losses | | Without Allowance for Credit Losses | | Total |
| | (Dollars in thousands) | | | (Dollars in thousands) |
| Commercial and industrial | $ | 1,078 |
| | $ | 20,357 |
| | $ | 21,435 |
| | $ | 22,574 |
| | Commercial and industrial | $ | 3,606 | | | $ | 26,179 | | | $ | 29,785 | | | $ | 3,804 | | | $ | 30,925 | | | $ | 34,729 | |
| Commercial real estate | 1,305 |
| | 3,644 |
| | 4,949 |
| | 3,016 |
| | Commercial real estate | 9,635 | | | — | | | 9,635 | | | 10,195 | | | — | | | 10,195 | |
| Commercial construction | — |
| | — |
| | — |
| | — |
| | |
| | Small business | 450 |
| | — |
| | 450 |
| | 311 |
| | Small business | 660 | | | — | | | 660 | | | 815 | | | 10 | | | 825 | |
| Residential real estate | 11,001 |
| | 3,501 |
| | 14,502 |
| | 13,360 |
| | Residential real estate | 8,870 | | | 4,522 | | | 13,392 | | | 10,935 | | | 4,593 | | | 15,528 | |
| Home equity | 6,463 |
| | 108 |
| | 6,571 |
| | 6,570 |
| | Home equity | 5,592 | | | — | | | 5,592 | | | 5,427 | | | — | | | 5,427 | |
| Other consumer | 108 |
| | — |
| | 108 |
| | 61 |
| | Other consumer | 136 | | | — | | | 136 | | | 156 | | | — | | | 156 | |
| Total nonaccrual loans | $ | 20,405 |
| | $ | 27,610 |
| | $ | 48,015 |
| (1) | $ | 45,892 |
| (1) | |
| Total nonaccrual loans (1) | | Total nonaccrual loans (1) | $ | 28,499 | | | $ | 30,701 | | | $ | 59,200 | | | $ | 31,332 | | | $ | 35,528 | | | $ | 66,860 | |
(1)Included in these amounts were $23.8$21.2 million and $24.8$22.2 million of nonaccruing TDRs at March 31, 20202021 and December 31, 2019,2020, respectively.
It is the Company's policy to reverse any accrued interest when a loan is put on nonaccrual status, and, as such, the Company did not record any interest income on nonaccrual loans during the three months ended March 31, 2021 and March 31, 2020.
In accordance with government moratorium orders established in response to the COVID-19 pandemic, new foreclosures pursued by the Company were on hold as of March 31, 2021, and in turn, all loan foreclosures in process as of March 31, 2021 had begun prior to the commencement of the moratorium orders. The following table shows information regarding foreclosed residential real estate property at the dates indicated: |
| | | | | | | |
| | March 31, 2020 | | December 31, 2019 |
| | (Dollars in thousands) |
| Foreclosed residential real estate property held by the creditor | $ | — |
| | $ | — |
|
| Recorded investment in mortgage loans collateralized by residential real estate property that are in the process of foreclosure | $ | 4,580 |
| | $ | 3,294 |
|
| | | | | | | | | | | |
| March 31, 2021 | | December 31, 2020 |
| (Dollars in thousands) |
| Foreclosed residential real estate property held by the creditor | $ | 0 | | | $ | 0 | |
| Recorded investment in mortgage loans collateralized by residential real estate property that are in the process of foreclosure | $ | 1,628 | | | $ | 1,750 | |
The following tables show the age analysis of past due financing receivables as of the dates indicated:
| | | | March 31, 2020 | | | March 31, 2021 |
| | 30-59 days | | 60-89 days | | 90 days or more | | Total Past Due | | | | Total Financing Receivables | | Amortized Cost >90 Days and Accruing | | | 30-59 days | | 60-89 days | | 90 days or more | | Total Past Due | | | | Total
Financing
Receivables | | Amortized Cost
>90 Days
and Accruing |
| | Number of Loans | | Principal Balance | | Number of Loans | | Principal Balance | | Number of Loans | | Principal Balance | | Number of Loans | | Principal Balance | | Current | | | Number
of Loans | | Principal
Balance | | Number
of Loans | | Principal
Balance | | Number
of Loans | | Principal
Balance | | Number
of Loans | | Principal
Balance | | Current | |
| | (Dollars in thousands) | | | (Dollars in thousands) |
| Loan Portfolio | | | | | | | | | | | | | | | | | | | | | | | Loan Portfolio | |
| Commercial and industrial | 13 |
| | $ | 1,930 |
| | — |
| | $ | — |
| | 6 |
| | $ | 1,078 |
| | 19 |
| | $ | 3,008 |
| | $ | 1,445,216 |
| | $ | 1,448,224 |
| | $ | — |
| | Commercial and industrial | 6 | | | $ | 510 | | | 0 | | | $ | 0 | | | 10 | | | $ | 141 | | | 16 | | | $ | 651 | | | $ | 2,086,020 | | | $ | 2,086,671 | | | $ | 0 | |
| Commercial real estate | 18 |
| | 6,989 |
| | 2 |
| | 383 |
| | 7 |
| | 1,499 |
| | 27 |
| | 8,871 |
| | 4,052,476 |
| | 4,061,347 |
| | — |
| | Commercial real estate | 3 | | | 888 | | | 0 | | | 0 | | | 4 | | | 511 | | | 7 | | | 1,399 | | | 4,176,218 | | | 4,177,617 | | | 0 | |
| Commercial construction | 1 |
| | 331 |
| | — |
| | — |
| | — |
| | — |
| | 1 |
| | 331 |
| | 526,807 |
| | 527,138 |
| | — |
| | Commercial construction | 0 | | | 0 | | | 0 | | | 0 | | | 0 | | | 0 | | | 0 | | | 0 | | | 516,362 | | | 516,362 | | | 0 | |
| Small business | 12 |
| | 1,030 |
| | 8 |
| | 185 |
| | 5 |
| | 176 |
| | 25 |
| | 1,391 |
| | 176,429 |
| | 177,820 |
| | — |
| | Small business | 5 | | | 56 | | | 1 | | | 2 | | | 3 | | | 36 | | | 9 | | | 94 | | | 174,117 | | | 174,211 | | | 0 | |
| Residential real estate | 19 |
| | 2,614 |
| | 5 |
| | 994 |
| | 39 |
| | 6,258 |
| | 63 |
| | 9,866 |
| | 1,518,550 |
| | 1,528,416 |
| | — |
| | Residential real estate | 9 | | | 1,252 | | | 3 | | | 764 | | | 28 | | | 3,837 | | | 40 | | | 5,853 | | | 1,235,936 | | | 1,241,789 | | | 0 | |
| Home equity | 22 |
| | 1,507 |
| | 7 |
| | 801 |
| | 36 |
| | 3,030 |
| | 65 |
| | 5,338 |
| | 1,140,932 |
| | 1,146,270 |
| | — |
| | Home equity | 7 | | | 425 | | | 2 | | | 87 | | | 27 | | | 2,217 | | | 36 | | | 2,729 | | | 1,025,766 | | | 1,028,495 | | | 0 | |
| Other consumer (1) | 335 |
| | 386 |
| | 11 |
| | 67 |
| | 16 |
| | 99 |
| | 362 |
| | 552 |
| | 26,663 |
| | 27,215 |
| | 25 |
| | Other consumer (1) | 196 | | | 167 | | | 1 | | | 1 | | | 7 | | | 130 | | | 204 | | | 298 | | | 21,248 | | | 21,546 | | | 1 | |
| Total | 420 |
| | $ | 14,787 |
| | 33 |
| | $ | 2,430 |
| | 109 |
| | $ | 12,140 |
| | 562 |
| | $ | 29,357 |
| | $ | 8,887,073 |
| | $ | 8,916,430 |
| | $ | 25 |
| | Total | 226 | | | $ | 3,298 | | | 7 | | | $ | 854 | | | 79 | | | $ | 6,872 | | | 312 | | | $ | 11,024 | | | $ | 9,235,667 | | | $ | 9,246,691 | | | $ | 1 | |
| | | | | | | | | | | | | | | | | | | | | | | | | | | | | | | | | | | | | | | | | | | | | | | | | | | | | | | | | | | | | | | | | |
| | December 31, 2020 |
| | 30-59 days | | 60-89 days | | 90 days or more | | Total Past Due | | | | Total
Financing
Receivables | | Recorded
Investment
>90 Days
and Accruing |
| | Number
of Loans | | Principal
Balance | | Number
of Loans | | Principal
Balance | | Number
of Loans | | Principal
Balance | | Number
of Loans | | Principal
Balance | | Current | |
| | (Dollars in thousands) |
| Loan Portfolio | | | | | | | | | | | | | | | | | | | | | |
| Commercial and industrial | 2 | | | $ | 318 | | | 1 | | | $ | 672 | | | 8 | | | $ | 785 | | | 11 | | | $ | 1,775 | | | $ | 2,101,377 | | | $ | 2,103,152 | | | $ | 0 | |
| Commercial real estate | 3 | | | 409 | | | 0 | | | 0 | | | 4 | | | 515 | | | 7 | | | 924 | | | 4,173,003 | | | 4,173,927 | | | 0 | |
| Commercial construction | 0 | | | 0 | | | 2 | | | 2,794 | | | 0 | | | 0 | | | 2 | | | 2,794 | | | 551,135 | | | 553,929 | | | 0 | |
| Small business | 14 | | | 421 | | | 6 | | | 273 | | | 4 | | | 59 | | | 24 | | | 753 | | | 174,270 | | | 175,023 | | | 0 | |
| Residential real estate | 12 | | | 2,150 | | | 8 | | | 5,507 | | | 27 | | | 3,648 | | | 47 | | | 11,305 | | | 1,284,878 | | | 1,296,183 | | | 0 | |
| Home equity | 10 | | | 733 | | | 5 | | | 203 | | | 33 | | | 2,633 | | | 48 | | | 3,569 | | | 1,065,221 | | | 1,068,790 | | | 0 | |
| Other consumer (1) | 260 | | | 137 | | | 3 | | | 1 | | | 6 | | | 138 | | | 269 | | | 276 | | | 21,586 | | | 21,862 | | | 1 | |
| Total | 301 | | | $ | 4,168 | | | 25 | | | $ | 9,450 | | | 82 | | | $ | 7,778 | | | 408 | | | $ | 21,396 | | | $ | 9,371,470 | | | $ | 9,392,866 | | | $ | 1 | |
(1)Other consumer portfolio is inclusive of deposit account overdrafts recorded as loan balances.
|
| | | | | | | | | | | | | | | | | | | | | | | | | | | | | | | | | | | | | | | | | |
| | December 31, 2019 | |
| | 30-59 days | | 60-89 days | | 90 days or more | | Total Past Due | | | | Total Financing Receivables | | Recorded Investment >90 Days and Accruing | |
| | Number of Loans | | Principal Balance | | Number of Loans | | Principal Balance | | Number of Loans | | Principal Balance | | Number of Loans | | Principal Balance | | Current | | |
| | (Dollars in thousands) | |
| Loan Portfolio | | | | | | | | | | | | | | | | | | | | | | |
| Commercial and industrial | 1 |
| | $ | 253 |
| | 2 |
| | $ | 323 |
| | 5 |
| | $ | 760 |
| | 8 |
| | $ | 1,336 |
| | $ | 1,393,700 |
| | $ | 1,395,036 |
| | $ | — |
| |
| Commercial real estate | 7 |
| | 1,690 |
| | 1 |
| | 194 |
| | 8 |
| | 2,038 |
| | 16 |
| | 3,922 |
| | 3,998,437 |
| | 4,002,359 |
| | 218 |
| (2 | ) |
| Commercial construction | 1 |
| | 560 |
| | — |
| | — |
| | — |
| | — |
| | 1 |
| | 560 |
| | 546,733 |
| | 547,293 |
| | — |
| |
| Small business | 11 |
| | 837 |
| | 3 |
| | 15 |
| | 6 |
| | 115 |
| | 20 |
| | 967 |
| | 173,530 |
| | 174,497 |
| | — |
| |
| Residential real estate | 17 |
| | 2,237 |
| | 17 |
| | 3,055 |
| | 38 |
| | 7,020 |
| | 72 |
| | 12,312 |
| | 1,578,257 |
| | 1,590,569 |
| | 1,652 |
| (2 | ) |
| Home equity | 23 |
| | 1,689 |
| | 8 |
| | 524 |
| | 40 |
| | 3,854 |
| | 71 |
| | 6,067 |
| | 1,127,731 |
| | 1,133,798 |
| | 265 |
| (2 | ) |
| Other consumer (1) | 387 |
| | 245 |
| | 12 |
| | 44 |
| | 16 |
| | 32 |
| | 415 |
| | 321 |
| | 29,766 |
| | 30,087 |
| | 22 |
| |
| Total | 447 |
| | $ | 7,511 |
| | 43 |
| | $ | 4,155 |
| | 113 |
| | $ | 13,819 |
| | 603 |
| | $ | 25,485 |
| | $ | 8,848,154 |
| | $ | 8,873,639 |
| | $ | 2,157 |
| |
| |
(1) | Other consumer portfolio is inclusive of deposit account overdrafts recorded as loan balances. |
| |
(2) | Represents purchased credit impaired loans that were accruing interest due to expectations of future cash collections. |
Troubled Debt Restructurings
In the course of resolving nonperforming loans, the Bank may choose to restructure the contractual terms of certain loans. The Bank attempts to work out an alternative payment schedule with the borrower in order to avoid foreclosure actions. Any loans that are modified are reviewed by the Bank to identify if a TDR has occurred, which is when, for economic or legal reasons related to a borrower’s financial difficulties, the Bank grants a concession to the borrower that it would not otherwise consider. Terms may be modified to fit the ability of the borrower to repay in line with its current financial status and the restructuring of the loan may include the transfer of assets from the borrower to satisfy the debt, a modification of loan terms, or a combination of the two.
The following table shows the Company’s total TDRs and other pertinent information as of the dates indicated:
|
| | | | | | | | |
| | | March 31, 2020 | | December 31, 2019 |
| | (Dollars in thousands) |
| TDRs on accrual status | | $ | 18,129 |
| | $ | 19,599 |
|
| TDRs on nonaccrual | | 23,842 |
| | 24,766 |
|
| Total TDRs | | $ | 41,971 |
| | $ | 44,365 |
|
| Amount of specific reserves included in the allowance for loan loss associated with TDRs | | n/a |
| | $ | 855 |
|
| Additional commitments to lend to a borrower who has been a party to a TDR | | $ | 163 |
| | $ | 63 |
|
| | | | | | | | | | | | | | |
| | March 31, 2021 | | December 31, 2020 |
| | (Dollars in thousands) |
| TDRs on accrual status | | $ | 20,262 | | | $ | 16,983 | |
| TDRs on nonaccrual | | 21,167 | | | 22,209 | |
| Total TDRs | | $ | 41,429 | | | $ | 39,192 | |
| Additional commitments to lend to a borrower who has been a party to a TDR | | $ | 466 | | | $ | 263 | |
The Company’s policy is to have any restructured loan which is on nonaccrual status prior to being modified remain on nonaccrual status for six months subsequent to being modified before management considers its return to accrual status. If the restructured loan is on accrual status prior to being modified, it is reviewed to determine if the modified loan should remain on accrual status. Additionally, loans classified as TDRs are adjusted to reflect the changes in value of the recorded investment in the loan, if any, resulting from the granting of a concession. For all residential loan modifications, the borrower must perform during a 90 day trial period before the modification is finalized.
The following table shows the modificationstroubled debt restructurings which occurred during the periodperiods indicated and the change in the recorded investment subsequent to the modifications occurring:
| | | | | | | | | | | | | | | | | | | | | | | |
| | Three Months Ended | | |
| March 31, 2021 | | |
| | Number of
Contracts | | Pre-Modification
Outstanding
Recorded
Investment | | Post-Modification
Outstanding
Recorded
Investment | | | | | | |
| | (Dollars in thousands) |
| Troubled debt restructurings | | | | | | | | | | | |
| Commercial and industrial (1) | 1 | | | $ | 14,148 | | | $ | 14,148 | | | | | | | |
| Commercial real estate (1) | 5 | | | 3,964 | | | 3,964 | | | | | | | |
| Small business | 1 | | | 100 | | | 100 | | | | | | | |
| | | | | | | | | | | |
| | | | | | | | | | | |
| | | | | | | | | | | |
| Total | 7 | | | $ | 18,212 | | | $ | 18,212 | | | | | | | |
| | | | Three Months Ended | | | Three Months Ended |
| | March 31, 2020 | | | March 31, 2020 |
| | Number of Contracts | | Pre-Modification Outstanding Recorded Investment | | Post-Modification Outstanding Recorded Investment | | | Number of
Contracts | | Pre-Modification
Outstanding
Recorded
Investment | | Post-Modification
Outstanding
Recorded
Investment |
| | (Dollars in thousands) | | | (Dollars in thousands) |
| Troubled debt restructurings | | | | | | Troubled debt restructurings | | |
| Commercial and industrial | 2 |
| | $ | 268 |
| | $ | 268 |
| |
| Commercial real estate | 1 |
| | 604 |
| | 604 |
| |
| Commercial and industrial (1) | | Commercial and industrial (1) | | 2 | | | $ | 268 | | | $ | 268 | |
| Commercial real estate (1) | | Commercial real estate (1) | | 1 | | | 604 | | | 604 | |
| Small business | 1 |
| | 49 |
| | 25 |
| Small business | | 1 | | | 49 | | | 25 | |
| Residential real estate | 1 |
| | 177 |
| | 209 |
| Residential real estate | | 1 | | | 177 | | | 209 | |
| | Total | 5 |
| | $ | 1,098 |
| | $ | 1,106 |
| Total | | 5 | | | $ | 1,098 | | | $ | 1,106 | |
|
| | | | | | | | | | |
| | Three Months Ended |
| | March 31, 2019 |
| | Number of Contracts | | Pre-Modification Outstanding Recorded Investment | | Post-Modification Outstanding Recorded Investment |
| | (Dollars in thousands) |
| Troubled debt restructurings | | | | | |
| Commercial real estate | 1 |
| | 150 |
| | 150 |
|
| Home equity | 1 |
| | 75 |
| | 75 |
|
| Total | 2 |
| | $ | 225 |
| | $ | 225 |
|
The following table shows the Company’s post-modification balance of TDRs listed by type of modification duringfor the periodperiods indicated:
|
| | | | | | | | |
| | | Three Months Ended |
| | | March 31 |
| | | 2020 | | 2019 |
| | | (Dollars in thousands) |
| Adjusted interest rate | | $ | 604 |
| | $ | 150 |
|
| Court ordered concession | | 25 |
| | 75 |
|
| Extended maturity | | 477 |
| | — |
|
| Total | | $ | 1,106 |
| | $ | 225 |
|
| | | | | | | | | | | | | | | |
| | | Three Months Ended |
| | | | March 31 |
| | | | | | 2021 | | 2020 |
| | | | | | (Dollars in thousands) |
| Adjusted interest rate | | | | | $ | 0 | | | $ | 604 | |
| Combination rate and maturity | | | | | 14,148 | | | 0 | |
| Court ordered concession | | | | | 0 | | | 25 | |
| Extended maturity | | | | | 4,064 | | | 477 | |
| Total | | | | | $ | 18,212 | | | $ | 1,106 | |
The Company considers a loan to have defaulted when it reaches 90 days past due. During the three months ended March 31, 20202021 and March 31, 2019,2020 there were 0 loans modified during the pastprior twelve months that subsequently defaulted.defaulted during the respective periods.
NOTE 5 - LOANS AND ALLOWANCE FOR LOAN LOSSES
As disclosed in Note 4 - Loans, Allowance for Credit Losses and Credit Quality, the Company adopted the CECL standard, effective January 1, 2020. As required by disclosure guidance, the Company has included relevant disclosures from the prior year and prior to the adoption of CECL within this footnote, as it relates to loans and allowance for loan losses.
The following table bifurcates the amount of loans and the allowance allocated to each loan category based on the type of impairment analysis as of December 31, 2019: |
| | | | | | | | | | | | | | | | | | | | | | | | | | | | | | | | |
| | December 31, 2019 | |
| | Commercial
and
Industrial | | Commercial
Real Estate | | Commercial
Construction | | Small
Business | | Residential
Real
Estate | | Home
Equity | | Other Consumer | | Total | |
| | (Dollars in thousands) | |
| Financing receivables ending balance: | | | | | | | | | | | | | | | | |
| Collectively evaluated for impairment | $ | 1,370,580 |
| | $ | 3,987,848 |
| | $ | 547,293 |
| | $ | 173,960 |
| | $ | 1,571,848 |
| | $ | 1,127,963 |
| | $ | 29,663 |
| | $ | 8,809,155 |
| |
| Individually evaluated for impairment | 24,456 |
| | 8,337 |
| | — |
| | 537 |
| | 11,228 |
| | 4,948 |
| | 122 |
| | 49,628 |
| |
| Purchased credit impaired loans | — |
| | 6,174 |
| | — |
| | — |
| | 7,493 |
| | 887 |
| | 302 |
| | 14,856 |
| |
| Total loans by group | $ | 1,395,036 |
| | $ | 4,002,359 |
| | $ | 547,293 |
| | $ | 174,497 |
| | $ | 1,590,569 |
| | $ | 1,133,798 |
| | $ | 30,087 |
| | $ | 8,873,639 |
| (1) |
| | | | | | | | | | | | | | | | | |
| |
(1) | The amount of net deferred costs on originated loans included in the ending balance was $7.1 million at December 31, 2019. Net unamortized discounts on acquired loans not deemed to be purchased credit impaired ("PCI") included in the ending balance was $21.6 million at December 31, 2019. |
At December 31, 2019, the reserve for unfunded loan commitments was $2.1 million.
The following table summarizes changes in allowance for loan losses by loan category for the period indicated: |
| | | | | | | | | | | | | | | | | | | | | | | | | | | | | | | |
| | Three Months Ended March 31, 2019 |
| | (Dollars in thousands) |
| | Commercial and Industrial | | Commercial Real Estate | | Commercial Construction | | Small Business | | Residential Real Estate | |
Home Equity | | Other Consumer | | Total |
| Allowance for loan losses | | | | | | | | | | | | | | | |
| Beginning balance | $ | 15,760 |
| | $ | 32,370 |
| | $ | 5,158 |
| | $ | 1,756 |
| | $ | 3,219 |
| | $ | 5,608 |
| | $ | 422 |
| | $ | 64,293 |
|
| Charge-offs | — |
| | — |
| | — |
| | (145 | ) | | — |
| | (113 | ) | | (301 | ) | | (559 | ) |
| Recoveries | 124 |
| | 33 |
| | — |
| | 27 |
| | 1 |
| | 66 |
| | 155 |
| | 406 |
|
| Provision (benefit) | 988 |
| | (354 | ) | | 197 |
| | 146 |
| | 14 |
| | (54 | ) | | 63 |
| | 1,000 |
|
| Ending balance | $ | 16,872 |
| | $ | 32,049 |
| | $ | 5,355 |
| | $ | 1,784 |
| | $ | 3,234 |
| | $ | 5,507 |
| | $ | 339 |
| | $ | 65,140 |
|
| Ending balance: collectively evaluated for impairment | $ | 16,814 |
| | $ | 31,974 |
| | $ | 5,355 |
| | $ | 1,783 |
| | $ | 2,432 |
| | $ | 5,346 |
| | $ | 332 |
| | $ | 64,036 |
|
| Ending balance: individually evaluated for impairment | $ | 58 |
| | $ | 75 |
| | $ | — |
| | $ | 1 |
| | $ | 802 |
| | $ | 161 |
| | $ | 7 |
| | $ | 1,104 |
|
The following tables detail the amount of outstanding principal balances relative to each of the risk-rating categories for the Company’s loan portfolio as of December 31, 2019:
|
| | | | | | | | | | | | | | | | | | | | | |
| | | | December 31, 2019 |
| Category | Risk Rating | | Commercial and Industrial | | Commercial Real Estate | | Commercial Construction | | Small Business | | Total |
| | | | (Dollars in thousands) |
| Pass | 1 - 6 | | $ | 1,274,155 |
| | $ | 3,860,555 |
| | $ | 542,608 |
| | $ | 171,213 |
| | $ | 5,848,531 |
|
| Potential weakness | 7 | | 63,485 |
| | 97,268 |
| | 2,247 |
| | 1,416 |
| | 164,416 |
|
| Definite weakness-loss unlikely | 8 | | 57,396 |
| | 44,536 |
| | 2,438 |
| | 1,868 |
| | 106,238 |
|
| Partial loss probable | 9 | | — |
| | — |
| | — |
| | — |
| | — |
|
| Definite loss | 10 | | — |
| | — |
| | — |
| | — |
| | — |
|
| Total | | | $ | 1,395,036 |
| | $ | 4,002,359 |
| | $ | 547,293 |
| | $ | 174,497 |
| | $ | 6,119,185 |
|
Impaired Loans
Under previous accounting guidance, a loan was considered impaired when, based on current information and events, it was probable that the Company would be unable to collect the scheduled payments of principal or interest when due according to the contractual terms of the loan agreement. Factors considered by management in determining impairment included payment status, collateral value, and the probability of collecting scheduled principal and interest payments when due. Loans that experienced insignificant payment delays and payment shortfalls generally were not classified as impaired. Management determined the significance of payment delays and payment shortfalls on a case-by-case basis, taking into consideration all of the circumstances surrounding the loan and the borrower, including the length of the delay, the reasons for the delay, the borrower’s prior payment record, and the amount of the shortfall in relation to the principal and interest owed.
The table below sets forth information regarding the Company’s impaired loans by loan portfolio at the date indicated:
|
| | | | | | | | | | | |
| | December 31, 2019 |
| | Recorded Investment | | Unpaid Principal Balance | | Related Allowance |
| | (Dollars in thousands) |
| With no related allowance recorded | | | | | |
| Commercial and industrial | $ | 23,786 |
| | $ | 34,970 |
| | $ | — |
|
| Commercial real estate | 6,213 |
| | 12,101 |
| | — |
|
| Small business | 469 |
| | 484 |
| | — |
|
| Residential real estate | 4,976 |
| | 5,123 |
| | — |
|
| Home equity | 3,764 |
| | 3,893 |
| | — |
|
| Other consumer | 34 |
| | 34 |
| | — |
|
| Subtotal | 39,242 |
| | 56,605 |
| | — |
|
| With an allowance recorded | | | | | |
| Commercial and industrial | $ | 670 |
| | $ | 670 |
| | $ | 126 |
|
| Commercial real estate | 2,124 |
| | 2,124 |
| | 48 |
|
| Small business | 68 |
| | 105 |
| | 8 |
|
| Residential real estate | 6,252 |
| | 7,163 |
| | 637 |
|
| Home equity | 1,184 |
| | 1,382 |
| | 156 |
|
| Other consumer | 88 |
| | 91 |
| | 5 |
|
| Subtotal | 10,386 |
| | 11,535 |
| | 980 |
|
| Total | $ | 49,628 |
| | $ | 68,140 |
| | $ | 980 |
|
The following table sets forth information regarding interest income recognized on impaired loans, by portfolio, for the period indicated:
|
| | | | | | | |
| | Three Months Ended |
| | March 31, 2019 |
| | Average Recorded Investment | | Interest Income Recognized |
| | (Dollars in thousands) |
| With no related allowance recorded | | | |
| Commercial and industrial | $ | 30,198 |
| | $ | 35 |
|
| Commercial real estate | 8,873 |
| | 104 |
|
| Commercial construction | 311 |
| | — |
|
| Small business | 323 |
| | 2 |
|
| Residential real estate | 4,421 |
| | 54 |
|
| Home equity | 4,952 |
| | 55 |
|
| Other consumer | 53 |
| | 1 |
|
| Subtotal | 49,131 |
| | 251 |
|
| With an allowance recorded | | | |
| Commercial and industrial | $ | 498 |
| | $ | 3 |
|
| Commercial real estate | 1,682 |
| | 24 |
|
| Small business | 181 |
| | 2 |
|
| Residential real estate | 7,665 |
| | 64 |
|
| Home equity | 985 |
| | 12 |
|
| Other consumer | 138 |
| | 1 |
|
| Subtotal | 11,149 |
| | 106 |
|
| Total | $ | 60,280 |
| | $ | 357 |
|
Purchased Credit Impaired Loans
Under previous accounting guidance, certain loans acquired by the Company which may have shown evidence of deterioration of credit quality since origination at purchase date and was therefore deemed unlikely that the Company would be able to collect all contractually required payments. As such, these loans were deemed to be PCI loans and the carrying value and prospective income recognition are predicated upon future cash flows expected to be collected. The following table displays certain information pertaining to PCI loans at the date indicated:
|
| | | | |
| | | December 31, 2019 |
| | | (Dollars in thousands) |
| Outstanding balance | | $ | 18,358 |
|
| Carrying amount | | $ | 14,856 |
|
The following table summarizes activity in the accretable yield for the PCI loan portfolio for the period indicated:
|
| | | | |
| | | Three Months Ended March 31 |
| | | 2019 |
| | | (Dollars in thousands) |
| Beginning balance | | $ | 1,191 |
|
| Accretion | | (141 | ) |
| Other change in expected cash flows (1) | | 114 |
|
| Reclassification from nonaccretable difference for loans which have paid off | | — |
|
| Ending balance | | $ | 1,164 |
|
(1) Represents changes in cash flows expected to be collected and resulting in increased interest income as a prospective yield adjustment over the remaining life of the loan(s).
NOTE 6 - GOODWILL AND OTHER INTANGIBLE ASSETS
The following table sets forth the carrying value of goodwill and other intangible assets, net of accumulated amortization, at the periods indicated below:
|
| | | | | | | |
| | March 31, 2020 | | December 31, 2019 |
| | (Dollars in thousands) |
| Balances not subject to amortization | | | |
| Goodwill | $ | 506,206 |
| | $ | 506,206 |
|
| Balances subject to amortization | | | |
| Core deposit intangibles | 26,485 |
| | 28,016 |
|
| Other intangible assets | 981 |
| | 1,270 |
|
| Total other intangible assets | 27,466 |
| | 29,286 |
|
| Total goodwill and other intangible assets | $ | 533,672 |
| | $ | 535,492 |
|
The Company typically performs its goodwill impairment test during the third quarter of the year, unless certain indicators suggest earlier testing to be warranted. The Company determined that an interim impairment test was warranted due to the operational disruption and uncertainty associated with the COVID-19 pandemic which commenced during the first quarter of 2020. Accordingly, the Company performed an impairment test as of March 31, 2020 and determined that there was no impairment of its goodwill, as the fair value of the Company's single reporting unit was in excess of its carrying value. Other intangible assets are reviewed for impairment whenever events or changes in circumstances indicate that the carrying amount of the assets may not be recoverable. The Company also considered the impact of COVID-19 as it pertains to these intangible assets, and determined that there was no indication of impairment related to other intangible assets as of March 31, 2020.
NOTE 7 -EARNINGS PER SHARE
Earnings per share consisted of the following components for the periods indicated:
|
| | | | | | | |
| | Three Months Ended |
| | March 31 |
| | 2020 | | 2019 |
| | (Dollars in thousands, except per share data) |
| Net income | $ | 26,751 |
| | $ | 35,225 |
|
| | | | |
| Weighted Average Shares | |
| Basic shares | 34,184,431 |
| | 28,106,184 |
|
| Effect of dilutive securities | 36,827 |
| | 54,466 |
|
| Diluted shares | 34,221,258 |
| | 28,160,650 |
|
| | | | |
| Net income per share | | | |
| Basic EPS | $ | 0.78 |
| | $ | 1.25 |
|
| Effect of dilutive securities | — |
| | — |
|
| Diluted EPS | $ | 0.78 |
| | $ | 1.25 |
|
During the three months ended March 31, 2020 and 2019 there were 0 options to purchase common stock and 5,431 and 6,890 shares of performance-based restricted stock, respectively, that were excluded from the calculation of diluted earnings per share because they were anti-dilutive.
NOTE 85 - STOCK BASED COMPENSATION
Time Vested Restricted Stock Awards
During the three months ended March 31, 2020,2021, the Company had the following activity related to stock based compensation:
Time Vested Restricted Stock Awards
The Company made the following awards of time vested restricted stock:
|
| | | | | | | | | | | |
| Date | | Shares Granted | | Plan | | Grant Date Fair Value Per Share | | Vesting Period |
| 2/27/2020 | | 46,550 |
| | 2005 Employee Stock Plan | | $ | 70.24 |
| | Ratably over 5 years from grant date |
| | | | | | | | | | | | | | | | | | | | | | | | | | |
| Date | | Shares Granted | | Plan | | Grant Date Fair Value Per Share | | Vesting Period |
| 2/18/2021 | | 49,550 | | | 2005 Employee Stock Plan | | $ | 81.84 | | | Ratably over 5 years from grant date |
| | | | | | | | |
| | | | | | | | |
| | | | | | | | |
| | | | | | | | |
| | | | | | | | |
| | | | | | | | |
| | | | | | | | |
The fair value of the restricted stock awards is based upon the average of the high and low price at which the Company’s common stock traded on the date of grant. The holders of restricted stock awards are entitled to receive dividends and to vote from and as of the date of grant.
Performance-Based Restricted Stock Awards
On February 27, 2020,18, 2021, the Company granted 17,10018,900 performance-based restricted stock awards to certain executive level employees. These performance-based restricted stock awards were issued from the 2005 Employee Stock Plan and were determined to have a grant date fair value per share of $70.24,$81.84, determined by the average of the high and low price at which the Company's common stock traded on the date of grant. The number of shares to be vested is contingent upon the Company's attainment of certain performance measures outlined in the award agreement and will be measured as of the end of the three year performance period, January 1, 20202021 through December 31, 2022.2023. The awards will vest upon the earlier of the date on which it is determined if the performance goal is achieved subsequent to the performance period or March 31, 2023.2024. These awards are accounted for as equity awards due to the nature of these awards and the fact that these shares will not be settled in cash.
The holders of these awards are not entitled to receive dividends or vote until the shares are vested.
On March 3, 2020,12, 2021, the performance-based restricted stock awards that were awarded on February 16, 201715, 2018 vested at 100%85% of the maximum target shares awarded, or 14,40013,005 shares.
Stock Options
The Company did not grant any awards
NOTE 96 - DERIVATIVE AND HEDGING ACTIVITIES
The Company’s derivative financial instruments are used to manage differences in the amount, timing, and duration of the Company’s known or expected cash receipts and its known or expected cash payments principally to manage the Company’s interest rate risk. Additionally, the Company enters into interest rate derivatives, and foreign exchange contracts and risk participation agreements to accommodate the business requirements of its customers (“customer related positions”). The Company minimizes the market and liquidity risks of customer related positions by entering into similar offsetting positions with broker-dealers. Derivative instruments are carried at fair value in the Company's financial statements. The accounting for changes in the fair value of a derivative instrument is dependent upon whether or not it qualifies as a hedge for accounting purposes, and further, by the type of hedging relationship.
The Company does not enter into proprietary trading positions for any derivatives.
The Company is subject to over-the-counter derivative clearing requirements which require certain derivatives to be cleared through central clearing houses. Accordingly, the Company clears certain derivative transactions through the Chicago Mercantile Exchange Clearing House ("CME"). This clearing house requires the Company to post initial and variation margin to mitigate the risk of non-payment, the latter of which is received or paid daily based on the net asset or liability position of the contracts.
Interest Rate Positions
The Company may utilize various interest rate derivatives as hedging instruments against interest rate risk associated with the Company’s borrowings and loan portfolios. An interest rate derivative is an agreement whereby one party agrees to pay a floating rate of interest on a notional principal amount in exchange for receiving a fixed rate of interest on the same notional amount, for a predetermined period of time, from a second party. The amounts relating to the notional principal amount are not actually exchanged.
The following tables reflect the Company's derivative positions foras of the periodsdates indicated below for interest rate derivatives which qualify as cash flow hedges for accounting purposes:
| | | | | | | | | | | | | | | | | | | | | | | | | | | | | | | | |
| March 31, 2021 |
| | | | | | Weighted Average Rate | | |
| | Notional Amount | | Average Maturity | | Current
Rate
Received | | Pay Fixed
Swap Rate | | Fair Value |
| | (in thousands) | | (in years) | | | | | | (in thousands) |
| Interest rate swaps on borrowings | | $ | 75,000 | | | 0.93 | | 0.19 | % | | 1.53 | % | | $ | (1,075) | |
| | | | | | | | | | |
| | | | | | Current Rate Paid | | Receive Fixed
Swap Rate | | |
| Interest rate swaps on loans | | 550,000 | | | 3.33 | | 0.10 | % | | 2.16 | % | | 21,467 | |
| | | | | | | | | | |
| | | | | | Current Rate Paid | | Receive Fixed Swap Rate
Cap - Floor | | |
| Interest rate collars on loans | | 400,000 | | | 2.41 | | 0.11 | % | | 2.73% - 2.20% | | 17,942 | |
| | | | | | | | | | |
| Total | | $ | 1,025,000 | | | | | | | | | $ | 38,334 | |
| | | | | | | | | | |
| | | | | | | | | | |
| December 31, 2020 |
| | | | | | Weighted Average Rate | | |
| | Notional Amount | | Average Maturity | | Current
Rate
Received | | Pay Fixed
Swap Rate | | Fair Value |
| | (in thousands) | | (in years) | | | | | | (in thousands) |
| Interest rate swaps on borrowings | | $ | 75,000 | | | 1.18 | | 0.22 | % | | 1.53 | % | | $ | (1,341) | |
| | | | | | | | | | |
| | | | | | Current Rate Paid | | Receive Fixed
Swap Rate | | |
| Interest rate swaps on loans | | 450,000 | | | 2.66 | | 0.15 | % | | 2.37 | % | | 27,021 | |
| | | | | | | | | | |
| | | | | | Current Rate Paid | | Receive Fixed Swap Rate
Cap - Floor | | |
| Interest rate collars on loans | | 400,000 | | | 2.66 | | 0.15 | % | | 2.73% - 2.20% | | 21,764 | |
| | | | | | | | | | |
| Total | | $ | 925,000 | | | | | | | | | $ | 47,444 | |
|
| | | | | | | | | | | | | | | | |
| March 31, 2020 |
| | | | | | | Weighted Average Rate | | |
| | | Notional Amount | | Average Maturity | | Current
Rate
Received | | Pay Fixed
Swap Rate | | Fair Value (1) |
| | | (in thousands) | | (in years) | | | | | | (in thousands) |
| Interest rate swaps on borrowings | | $ | 175,000 |
| | 2.20 | | 1.28 | % | | 0.94 | % | | $ | (1,790 | ) |
| | | | | | | | | | | |
| | | | | | | Current Rate Paid | | Receive Fixed Swap Rate | | |
| Interest rate swaps on loans | | 450,000 |
| | 3.41 | | 0.86 | % | | 2.37 | % | | 31,701 |
|
| | | | | | | | | | | |
| | | | | | | Current Rate Paid | | Receive Fixed Swap Rate Cap - Floor | | |
| Interest rate collars on loans | | 400,000 |
| | 3.41 | | 0.81 | % | | 2.73% - 2.20% |
| | 25,573 |
|
| | | | | | | | | | | |
| Total | | $ | 1,025,000 |
| | | | | | | | $ | 55,484 |
|
| | | | | | | | | | | |
| | | | | | | | | | | |
| December 31, 2019 |
| | | | | | | Weighted Average Rate | | |
| | | Notional Amount | | Average Maturity | | Current
Rate
Received | | Pay Fixed
Swap Rate | | Fair Value (1) |
| | | (in thousands) | | (in years) | | | | | | (in thousands) |
| Interest rate swaps on borrowings | | $ | 75,000 |
| | 2.18 | | 1.90 | % | | 1.53 | % | | $ | 140 |
|
| | | | | | | | | | | |
| | |
| | | | Current Rate Paid | | Receive Fixed Swap Rate | |
|
| Interest rate swaps on loans | | 450,000 |
| | 3.66 | | 1.76 | % | | 2.37 | % | | 12,907 |
|
| | | | | | | | | | | |
| | | | | | | Current Rate Paid | | Receive Fixed Swap Rate Cap - Floor | | |
| Interest rate collars on loans | | 400,000 |
| | 3.66 | | 1.76 | % | | 2.73% - 2.20% |
| | 9,896 |
|
| | | | | | | | | | | |
| Total | | $ | 925,000 |
| | | | | | | | $ | 22,943 |
|
| |
(1) | Beginning in 2020, the Company made an election to include accrued interest within fair value balances. |
The maximum length of time over which the Company is currently hedging its exposure to the variability in future cash flows for forecasted transactions related to the payment of variable interest on existing financial instruments is 4.68.0 years.
For derivative instruments that are designated and qualify as cash flow hedging instruments, the effective portion of the gains or losses is reported as a component of other comprehensive income ("OCI"), and is subsequently reclassified into earnings in the period that the hedged forecasted transaction affects earnings. The Company expects approximately $16.8$19.4 million (pre-tax) to be reclassified as an increase to interest income and $587,000$844,000 (pre-tax) to be reclassified as an increase to interest expense, from OCI related to the
Company’s cash flow hedges in the next twelve months. This reclassification is due to anticipated payments that will be made and/or received on the swaps based upon the forward curve as of March 31, 2020.2021.
The Company had 0 fair value hedges as of March 31, 20202021 or December 31, 2019.2020.
Customer Related Positions
Loan level derivatives, primarily interest rate swaps, offered to commercial borrowers through the Company’s loan level derivative program do not qualify as hedges for accounting purposes. The Company believes that its exposure to commercial customer derivatives is limited because these contracts are simultaneously matched at inception with an offsetting dealer transaction. Derivatives with dealer counterparties are then either cleared through a clearinghouse or settled directly with a single counterparty. The commercial customer derivative program allows the Company to retain variable-rate commercial loans while allowing the customer to synthetically fix the loan rate by entering into a variable-to-fixed interest rate swap. The amounts relating to the notional principal amount are not actually exchanged.
Foreign exchange contracts offered to commercial borrowers through the Company’s derivative program do not qualify as hedges for accounting purposes. The Company acts as a seller and buyer of foreign exchange contracts to accommodate its customers. To mitigate the market and liquidity risk associated with these derivatives, the Company enters into similar offsetting positions. The amounts relating to the notional principal amount are exchanged.
The Company has entered into risk participation agreements with other dealer banks in commercial loan agreements. Participating banks guarantee the performance on borrower-related interest rate swap contracts. These derivatives are not designated as hedges and, therefore, changes in fair value are recognized in earnings. Under a risk participation-out agreement, a derivative asset, the Company participates out a portion of the credit risk associated with the interest rate swap position executed with the commercial borrower for a fee paid to the participating bank. Under a risk participation-in agreement, a derivative liability, the Company assumes, or participates in, a portion of the credit risk associated with the interest rate swap position with the commercial borrower for a fee received from the other bank.
The following table reflects the Company��sCompany’s customer related derivative positions as of the dates indicated below for those derivatives not designated as hedging:
| | | | | | | | | | | | | | | | | | | | | | | | | | | | | | | | | | | | | | | | | | | | | | | |
| | | | Notional Amount Maturing | | |
| | Number of Positions
(1) | | Less than 1 year | | Less than 2 years | | Less than 3 years | | Less than 4 years | | Thereafter | | Total | | Fair Value |
| March 31, 2021 |
| | (Dollars in thousands) |
| Loan level swaps | | | | | | | | | | | | | | | |
| Receive fixed, pay variable | 302 | | | $ | 72,391 | | | $ | 105,368 | | | $ | 137,041 | | | $ | 177,153 | | | $ | 1,149,151 | | | $ | 1,641,104 | | | $ | 66,621 | |
| Pay fixed, receive variable | 302 | | | 72,391 | | | 105,368 | | | 137,041 | | | 177,153 | | | 1,149,151 | | | 1,641,104 | | | (66,615) | |
| Foreign exchange contracts | | | | | | | | | | | | | | |
| Buys foreign currency, sells U.S. currency | 30 | | | 94,917 | | | 6,538 | | | 0 | | | 0 | | | 0 | | | 101,455 | | | 2,502 | |
| Buys U.S. currency, sells foreign currency | 30 | | | 94,917 | | | 6,538 | | | 0 | | | 0 | | | 0 | | | 101,455 | | | (2,493) | |
| Risk participation agreements | | | | | | | | | | | | | | |
| Participation out | 12 | | | 6,642 | | | 0 | | | 2,665 | | | 31,804 | | | 68,040 | | | 109,151 | | | 195 | |
| Participation in | 7 | | | 0 | | | 30,483 | | | 28,866 | | | — | | | 8,436 | | | 67,785 | | | (73) | |
| | | | | | | | | | | | | | | |
| | | Notional Amount Maturing | | |
| Number of Positions
(1) | | Less than 1 year | | Less than 2 years | | Less than 3 years | | Less than 4 years | | Thereafter | | Total | | Fair Value |
| December 31, 2020 |
| | (Dollars in thousands) |
| Loan level swaps | | | | | | | | | | | | | | | |
| Receive fixed, pay variable | 322 | | | $ | 102,999 | | | $ | 76,487 | | | $ | 149,265 | | | $ | 147,422 | | | $ | 1,222,557 | | | $ | 1,698,730 | | | $ | 127,226 | |
| Pay fixed, receive variable | 313 | | | 102,999 | | | 76,487 | | | 149,265 | | | 147,422 | | | 1,222,557 | | | 1,698,730 | | | (127,216) | |
| Foreign exchange contracts | | | | | | | | | | | | | | |
| Buys foreign currency, sells U.S. currency | 33 | | | 87,557 | | | 5,300 | | | 0 | | | 0 | | | 0 | | | 92,857 | | | (4,214) | |
| Buys U.S. currency, sells foreign currency | 33 | | | 87,557 | | | 5,300 | | | 0 | | | 0 | | | 0 | | | 92,857 | | | 4,224 | |
| Risk participation agreements | | | | | | | | | | | | | | |
| Participation out | 12 | | | 6,721 | | | 0 | | | 2,675 | | | 7,307 | | | 93,378 | | | 110,081 | | | 512 | |
| Participation in | 8 | | | 0 | | | 30,649 | | | 29,072 | | | 0 | | | 15,844 | | | 75,565 | | | (118) | |
|
| | | | | | | | | | | | | | | | | | | | | | | | | | | | | | |
| | | | Notional Amount Maturing | | |
| | Number of Positions (1) | | Less than 1 year | | Less than 2 years | | Less than 3 years | | Less than 4 years | | Thereafter | | Total | | Fair Value (2) |
| | March 31, 2020 |
| | (Dollars in thousands) |
| Loan level swaps | | | | | | | | | | | | | | | |
| Receive fixed, pay variable | 313 |
| | $ | 155,318 |
| | $ | 76,735 |
| | $ | 126,910 |
| | $ | 139,600 |
| | $ | 1,178,142 |
| | $ | 1,676,705 |
| | $ | 143,707 |
|
| Pay fixed, receive variable | 305 |
| | $ | 158,692 |
| | $ | 76,735 |
| | $ | 126,910 |
| | $ | 139,600 |
| | $ | 1,178,142 |
| | $ | 1,680,079 |
| | $ | (143,726 | ) |
| Foreign exchange contracts | | | | | | | | | | | | | | |
| Buys foreign currency, sells U.S. currency | 47 |
| | $ | 118,711 |
| | $ | — |
| | $ | — |
| | $ | — |
| | $ | — |
| | $ | 118,711 |
| | $ | (1,439 | ) |
| Buys U.S. currency, sells foreign currency | 47 |
| | $ | 118,711 |
| | $ | — |
| | $ | — |
| | $ | — |
| | $ | — |
| | $ | 118,711 |
| | $ | 1,499 |
|
| | | | Notional Amount Maturing | | |
| | Number of Positions (1) | | Less than 1 year | | Less than 2 years | | Less than 3 years | | Less than 4 years | | Thereafter | | Total | | Fair Value (2) |
| | December 31, 2019 |
| | (Dollars in thousands) |
| Loan level swaps | | | | | | | | | | | | | | | |
| Receive fixed, pay variable | 299 |
| | $ | 156,690 |
| | $ | 125,203 |
| | $ | 85,603 |
| | $ | 165,599 |
| | $ | 1,044,315 |
| | $ | 1,577,410 |
| | $ | 48,596 |
|
| Pay fixed, receive variable | 290 |
| | $ | 156,690 |
| | $ | 125,203 |
| | $ | 85,603 |
| | $ | 165,599 |
| | $ | 1,044,315 |
| | $ | 1,577,410 |
| | $ | (48,591 | ) |
| Foreign exchange contracts | | | | | | | | | | | | | | |
| Buys foreign currency, sells U.S. currency | 40 |
| | $ | 91,434 |
| | $ | — |
| | $ | — |
| | $ | — |
| | $ | — |
| | $ | 91,434 |
| | $ | (81 | ) |
| Buys U.S. currency, sells foreign currency | 40 |
| | $ | 91,434 |
| | $ | — |
| | $ | — |
| | $ | — |
| | $ | — |
| | $ | 91,434 |
| | $ | 123 |
|
| |
(1) | The Company may enter into one dealer swap agreement which offsets multiple commercial borrower swap agreements. |
31
| |
(2) | Beginning in 2020, the Company made an election to include accrued interest within fair value balances. |
Mortgage Derivatives
The Company enters into commitments to fund residential mortgage loans at specified rates and times in the future, with the intention that loans will likely be sold subsequently in the secondary market. Mortgage loan commitments are referred to as derivative loan commitments if the loan that will result from exercise of the commitment will be held for sale upon funding. These commitments are recognized at fair value on the consolidated balance sheet in other assets and other liabilities with changes in their fair values recorded within mortgage banking income. In addition, the Company has elected the fair value option to carry loans held for sale at fair value. The change in fair value of loans held for sale is recorded in current period earnings as a component of mortgage banking income in accordance with the Company's fair value election. The fair value of loans held for sale decreased by $914,000$1.8 million and increased by $1,000$255,000 for the three month periods ended March 31, 20202021 and 2019,2020, respectively. These amounts were offset in earnings by the change in the fair value of mortgage derivatives.
Outstanding loan commitments expose the Company to the risk that the price of the loans arising from exercise of the loan commitment might change from inception of the rate lock to funding of the loan due to changes in mortgage interest rates. If interest rates increase, the value of these loan commitments decreases. Conversely, if interest rates decrease, the value of these loan commitments increases. To protect against the price risk inherent in derivative loan commitments, the Company utilizes both "mandatory delivery" and "best efforts" forward loan sale commitments to mitigate the risk of potential decreases in the values of loans that would result from the exercise of the derivative loan commitments. Mandatory delivery contracts are accounted for as derivative instruments. Included in the mandatory delivery forward commitments are To Be Announced securities ("TBAs"). Certain assumptions, including pull through rates and rate lock periods, are used in managing the existing and future hedges. The accuracy of underlying assumptions will impact the ultimate effectiveness of any hedging strategies.
With mandatory delivery contracts, the Company commits to deliver a certain principal amount of mortgage loans to an investor at a specified price on or before a specified date. If the Company fails to deliver the amount of mortgages necessary to fulfill the commitment by the specified date, it is obligated to pay a "pair-off" fee, based on then-current market prices, to the investor/counterparty to compensate the investor for the shortfall. Generally the Company makes this type of commitment once mortgage loans have been funded and are held for sale, in order to minimize the risk of failure to deliver the requisite volume of loans to the investor and paying pair-off fees as a result. The Company also sells TBA securities to offset potential changes in the fair value of derivative loan commitments. Generally the Company sells TBA securities by entering into derivative loan commitments for settlement in 30 to 90 days. The Company expects that mandatory delivery contracts, including TBA securities, will experience changes in fair value opposite to the changes in the fair value of derivative loan commitments.
With best effort contracts, the Company commits to deliver an individual mortgage loan of a specified principal amount and quality to an investor if the loan to the underlying borrower closes. Generally best efforts cash contracts have no pair off risk regardless of market movement. The price the investor will pay the seller for an individual loan is specified prior to the loan being funded (e.g., on the same day the lender commits to lend funds to a potential borrower). The Company expects that these best efforts forward loan sale commitments will experience a net neutral shift in fair value with related derivative loan commitments.
The aggregate amount of net realized gains or losses on sales of such loans included within mortgage banking income was $4.5$8.1 million and $705,000$4.5 million for the three month periodsmonths ended March 31, 20202021 and 2019,2020, respectively.
Balance Sheet Offsetting
The Company does not offset fair value amounts recognized for derivative instruments. The Company does net the amount recognized for the right to reclaim cash collateral against the obligation to return cash collateral arising from derivative instruments executed with the same counterparty under a master netting arrangement. Collateral legally required to be maintained at dealer banks by the Company is monitored and adjusted as necessary.
A daily settlement occurs through the CME for changes in the fair value of centrally cleared derivatives. Not all of the derivatives are required to be cleared through the daily clearing agent. As a result, the total fair values of loan level derivative assets and liabilities recognized on the Company's financial statements are not equal and offsetting.
The table below presents the fair value of the Company’s derivative financial instruments as well as their classification on the balance sheet and the potential effect of netting arrangements on its financial position, at the dates indicated:
| | | | | | | | | | | | | | | | | | | | | | | | | | | | | | |
| | | | Asset Derivatives (1) | | | | Liability Derivatives (2) | |
| | | Fair Value at | | Fair Value at | | | | Fair Value at | | Fair Value at | |
| | | | March 31
2021 | | December 31
2020 | | | | March 31
2021 | | December 31
2020 | |
| | | | (Dollars in thousands) | |
| Derivatives designated as hedges | | | | | | | | | | | | |
| Interest rate derivatives | | | $ | 40,776 | | (3) | $ | 48,786 | | (3) | | | $ | 2,442 | | (4) | $ | 1,342 | | (4) |
| Derivatives not designated as hedges | | | | | | | | | | | | |
| Customer Related Positions | | | | | | | | | | | | |
| Loan level derivatives | | | 86,890 | | (3) | 127,228 | | (3) | | | 86,884 | | (4) | 127,218 | | (4) |
| Foreign exchange contracts | | | 2,691 | | | 4,359 | | | | | 2,682 | | | 4,349 | | |
| Risk participation agreements | | | 195 | | | 513 | | | | | 73 | | | 119 | | |
| Mortgage Derivatives | | | | | | | | | | | | |
| Interest rate lock commitments | | | 1,652 | | | 6,513 | | | | | 0 | | | 0 | | |
| Forward sale loan commitments | | | 370 | | | 0 | | | | | 0 | | | 1 | | |
| Forward sale hedge commitments | | | 1,131 | | | 0 | | | | | 0 | | | 1,035 | | |
| Total derivatives not designated as hedges | | | 92,929 | | | 138,613 | | | | | 89,639 | | | 132,722 | | |
| Total | | | 133,705 | | | 187,399 | | | | | 92,081 | | | 134,064 | | |
| | | | | | | | | | | | |
| Netting Adjustments (5) | | | (8,027) | | | 23 | | | | | 7,107 | | | 16,105 | | |
| Net Derivatives on the Balance Sheet | | | 125,678 | | | 187,422 | | | | | 84,974 | | | 117,959 | | |
| | | | | | | | | | | | |
| Financial instruments (6) | | | 50,189 | | | 48,786 | | | | | 50,189 | | | 48,786 | | |
| Cash collateral pledged (received) | | | 0 | | | 0 | | | | | 28,799 | | | 62,460 | | |
| Net Derivative Amounts | | | $ | 75,489 | | | $ | 138,636 | | | | | $ | 5,986 | | | $ | 6,713 | | |
|
| | | | | | | | | | | | | | | | |
| | Asset Derivatives (1) | | Liability Derivatives (2) | |
| | Fair Value at | | Fair Value at | | Fair Value at | | Fair Value at | |
| | March 31
2020 | | December 31
2019 | | March 31
2020 | | December 31
2019 | |
| | (Dollars in thousands) | |
| Derivatives designated as hedges | | | | | | | | |
| Interest rate derivatives | $ | 57,274 |
| (3) | $ | 23,140 |
| (3) | $ | 1,790 |
| (4) | $ | 197 |
| (4) |
| Derivatives not designated as hedges | | | | | | | | |
| Customer Related Positions | | | | | | | | |
| Loan level derivatives | 143,763 |
| (3) | 52,374 |
| (3) | 143,782 |
| (4) | 52,369 |
| (4) |
| Foreign exchange contracts | 2,047 |
| | 1,191 |
| | 1,987 |
| | 1,149 |
| |
| Mortgage Derivatives | | | | | | | | |
| Interest rate lock commitments | 2,332 |
| | 1,680 |
| | — |
| | — |
| |
| Forward sale loan commitments | 399 |
| | — |
| | — |
| | 12 |
| |
| Forward sale hedge commitments | — |
| | — |
| | 1,980 |
| | 196 |
| |
| Total derivatives not designated as hedges | 148,541 |
| | 55,245 |
| | 147,749 |
| | 53,726 |
| |
| Total | 205,815 |
| | 78,385 |
| | 149,539 |
| | 53,923 |
| |
| | | | | | | | | |
| Netting Adjustments (5) | — |
| | — |
| | 13,024 |
| | — |
| |
| Net Derivatives on the Balance Sheet | 205,815 |
| | 78,385 |
| | 136,515 |
| | 53,923 |
| |
| | | | | | | | | |
| Financial instruments (6) | 57,276 |
| | 24,882 |
| | 57,276 |
| | 24,882 |
| |
| Cash collateral pledged (received) | — |
| | — |
| | 73,771 |
| | 25,493 |
| |
| Net Derivative Amounts | $ | 148,539 |
| | $ | 53,503 |
| | $ | 5,468 |
| | $ | 3,548 |
| |
(2)All liability derivatives are located in other liabilities on the balance sheet.
(3)Approximately $1.2 million and $1.7 million of accrued interest receivable is included in the fair value of the interest rate and loan level asset derivatives, respectively, as of March 31, 2021. Accrued interest receivable of approximately and $1.2 million and $2.0 million is included in the fair value of the interest rate and loan level asset derivatives, respectively, as of December 31, 2020.
(4)Approximately $56,000 and $1.7 million of accrued interest payable is included in the fair value of the interest rate and loan level liability derivatives, respectively, as of March 31, 2021. Accrued interest payable of approximately $81,000 and $2.0 million is included in the fair value of the interest rate and loan level derivative liabilities, respectively, as of December 31, 2020.
(5)Netting adjustments represent the amounts recorded to convert derivative assets and liabilities cleared through CME from a gross basis to a net basis, inclusive of the variation margin payments, in accordance with applicable accounting guidance. As displayed in the table above, derivatives that cleared through the CME were either in a net asset position or a net liability position as of March 31, 2021.
(6)Reflects offsetting derivative positions with the same counterparty that are not netted on the balance sheet.
| |
(1) | All asset derivatives are located in other assets on the balance sheet. |
| |
(2) | All liability derivatives are located in other liabilities on the balance sheet. |
| |
(3) | Approximately $574,000and$1.1 million of accrued interest receivable is included in the fair value of the interest rate and loan level asset derivatives, respectively, as of March 31, 2020. Accrued interest receivable of approximately and $350,000 and$569,000 was excluded from the fair value of the interest rate and loan level asset derivatives, respectively, as of December 31, 2019.
|
| |
(4) | Approximately $14,000 and $1.1 million of accrued interest payable is included in the fair value of the interest rate and loan level derivative liabilities, respectively, as of March 31, 2020. Accrued interest payable of approximately $4,000 and $569,000 was excluded from the fair value of the interest rate and loan level derivative liabilities, respectively, as of December 31, 2019. |
| |
(5) | Netting adjustments represent the amounts recorded to convert derivative assets and liabilities cleared through CME from a gross basis to a net basis, inclusive of the variation margin payments, in accordance with applicable accounting guidance. All derivatives that cleared through the CME were in a net liability position as of March 31, 2020. |
| |
(6) | Reflects offsetting derivative positions with the same counterparty that are not netted on the balance sheet. |
The table below presents the effect of the Company’s derivative financial instruments included in OCI and current earnings for the periods indicated:
| | | | | | | | | | | | | | | |
| | | Three Months Ended |
| | | March 31 |
| | | | | | 2021 | | 2020 |
| | | | | | (Dollars in thousands) |
| Derivatives designated as hedges | | | | | | | |
| Gain (loss) in OCI on derivatives (effective portion), net of tax | | | | | $ | (6,583) | | | $ | 22,984 | |
| Gain reclassified from OCI into interest income or interest expense (effective portion) | | | | | $ | 4,380 | | | $ | 1,586 | |
| Loss reclassified from OCI into noninterest expense (loss on termination) | | | | | $ | 0 | | | $ | 0 | |
| Interest expense | | | | | $ | — | | | $ | — | |
| Other expense | | | | | — | | | — | |
| Total | | | | | $ | — | | | $ | — | |
| Derivatives not designated as hedges | | | | | | | |
| Changes in fair value of customer related positions | | | | | | | |
| Other income | | | | | $ | 6 | | | $ | 22 | |
| Other expense | | | | | (283) | | | (24) | |
| Changes in fair value of mortgage derivatives | | | | | | | |
| Mortgage banking income | | | | | (2,324) | | | (721) | |
| Total | | | | | $ | (2,601) | | | $ | (723) | |
|
| | | | | | | |
| | Three Months Ended |
| | March 31 |
| | 2020 | | 2019 |
| | (Dollars in thousands) |
| Derivatives designated as hedges | | | |
| Gain in OCI on derivatives (effective portion), net of tax | $ | 22,984 |
| | $ | 3,285 |
|
| Gain reclassified from OCI into interest income or interest expense (effective portion) | $ | 1,586 |
| | $ | 424 |
|
| Loss reclassified from OCI into noninterest expense (loss on termination) | $ | — |
| | $ | — |
|
| Interest expense | $ | — |
| | $ | — |
|
| Other expense | — |
| | — |
|
| Total | $ | — |
| | $ | — |
|
| Derivatives not designated as hedges | | | |
| Changes in fair value of customer related positions | | | |
| Other income | $ | 22 |
| | $ | 13 |
|
| Other expense | (24 | ) | | (1 | ) |
| Changes in fair value of mortgage derivatives | | | |
| Mortgage banking income (expense) | (721 | ) | | 59 |
|
| Total | $ | (723 | ) | | $ | 71 |
|
The Company's derivative agreements with institutional counterparties contain various credit-risk related contingent provisions, such as requiring the Company to maintain a well-capitalized capital position. If the Company fails to meet these conditions, the counterparties could request the Company make immediate payment or demand that the Company provide immediate and ongoing full collateralization on derivative positions in net liability positions. The aggregate fair value of all derivative instruments with credit-risk related contingent features that were in a net liability position was $88.3$28.5 million and $26.0$79.8 million at March 31, 20202021 and December 31, 2019,2020, respectively. Although none of the contingency provisions have applied as of March 31, 20202021 and December 31, 2019,2020, the Company has posted collateral to offset the net liability exposure with institutional counterparties.
By using derivatives, the Company is exposed to credit risk to the extent that counterparties to the derivative contracts do not perform as required. Should a counterparty fail to perform under the terms of a derivative contract, the Company's credit exposure on interest rate swaps is limited to the net positive fair value and accrued interest of all swaps with each counterparty. The Company seeks to minimize counterparty credit risk through credit approvals, limits, monitoring procedures, and obtaining collateral, where appropriate. Institutional counterparties must have an investment grade credit rating and be approved by the Company's Board of Directors. As such, management believes the risk of incurring credit losses on derivative contracts with institutional counterparties is remote. The Company's exposure relating to institutional counterparties was $57.3$50.9 million and $25.4$48.8 million at March 31, 20202021 and December 31, 2019,2020, respectively. The Company’s exposure relating to customer counterparties was approximately $143.7$76.8 million and $51.0$127.2 million at March 31, 20202021 and December 31, 2019,2020, respectively. Credit exposure may be reduced by the value of collateral pledged by the counterparty.
NOTE 10 - INCOME TAXES
The following table sets forth information regarding the Company’s tax provision and applicable tax rates for the periods indicated:
|
| | | | | | | |
| | Three Months Ended |
| | March 31 |
| | 2020 | | 2019 |
| | (Dollars in thousands) |
| Combined federal and state income tax provision | $ | 2,148 |
| | $ | 11,522 |
|
| Effective income tax rate | 7.43 | % | | 24.65 | % |
The Company's provision for income taxes was $2.1 million and $11.5 million for the three months ended March 31, 2020 and 2019, respectively. The lower tax provision in 2020 was due to a lower effective tax rate, which included a $4.7 million discrete tax benefit recognized in the quarter. This discrete benefit was associated with revised net operating loss (NOL) carryback provisions included in the federal Coronavirus, Aid, Relief and Economic Security Act ("CARES Act"), signed into law on March 27, 2020. The effect of any change in enacted tax rates on deferred assets and liabilities is recognized in income in the period that includes the enactment date, and accordingly, the discrete benefit was fully recognized during the first quarter of 2020.
NOTE 117 - FAIR VALUE MEASUREMENTS
Fair value is a market-based measure considered from the perspective of a market participant rather than an entity-specific measure. Therefore, even when market assumptions are not readily available, the assumptions applied by the Company when determining fair value reflect those that the Company determines market participants would use to price the asset or liability at the measurement date. If there has been a significant decrease in the volume and level of activity for the asset or liability, regardless of the valuation technique(s) used, the objective of a fair value measurement remains the same. Fair value is the price that would be received if the asset were to be sold or that would be or paid if the liability were to be transferred in an orderly market transaction (that is, not a forced liquidation or distressed sale) between market participants at the measurement date under current market conditions. When determining fair value, the Company considers pricing information and other inputs that are current as of the measurement date. In periods of market dislocation, the observability of prices and other inputs may be reduced for certain instruments, or not available at all. The unavailability or reduced availability of pricing or other input information could cause an instrument to be reclassified from one level to another.
The Fair Value Measurements and Disclosures Topic of the FASB ASC defines fair value and establishes a fair value hierarchy that prioritizes the inputs to valuation techniques used to measure fair value. The hierarchy gives the highest priority to unadjusted quoted prices in active markets for identical assets or liabilities (Level 1 measurements) and the lowest priority to unobservable inputs (Level 3 measurements). The three levels of the fair value hierarchy under the Fair Value Measurements and Disclosures Topic of the FASB ASC are described below:
Level 1 – Inputs are quoted prices (unadjusted) in active markets for identical assets or liabilities that the reporting entity has the ability to access at the measurement date.
Level 2 – Valuations based on quoted prices in markets that are not active or for which all significant inputs are observable, either directly or indirectly.
Level 3 – Prices or valuations that require inputs that are both significant to the fair value measurement and unobservable.
To the extent that valuation is based on models or inputs that are less observable or unobservable in the market, the determination of fair value requires more judgment. Accordingly, the degree of judgment exercised by the Company in determining fair value is greatest for instruments categorized in Level 3. A financial instrument’s level within the fair value hierarchy is based on the lowest level of any input that is significant to the fair value measurement.
Valuation Techniques
There have been no changes in the valuation techniques used during the current period.three months ended March 31, 2021.
Securities
Trading and Equity Securities
These equity securities are valued based on market quoted prices. These securities are categorized in Level 1 as they are actively traded and no valuation adjustments have been applied.
U.S. Government Agency Securities
Fair value is estimated using either multi-dimensional spread tables or benchmarks. The inputs used include benchmark yields, reported trades, and broker/dealer quotes. These securities are classified as Level 2.
Agency Mortgage-Backed Securities
Fair value is estimated using either a matrix or benchmarks. The inputs used include benchmark yields, reported trades, broker/dealer quotes, and issuer spreads. These securities are categorized as Level 2.
Agency Collateralized Mortgage Obligations and Small Business Administration Pooled Securities
The valuation model for these securities is volatility-driven and ratings based, and uses multi-dimensional spread tables. The inputs used include benchmark yields, reported trades, new issue data, broker dealer quotes, and collateral performance. If there is at least one significant model assumption or input that is not observable, these securities are categorized as Level 3 within the fair value hierarchy; otherwise, they are classified as Level 2.
State, County, and Municipal Securities
The fair value is estimated using a valuation matrix with inputs including bond interest rate tables, recent transactions, and yield relationships. These securities are categorized as Level 2.
Single and Pooled Issuer Trust Preferred Securities
The fair value of trust preferred securities, including pooled and single issuer preferred securities, is estimated using external pricing models, discounted cash flow methodologies or similar techniques. The inputs used in these valuations include benchmark yields, reported trades, new issue data, broker dealer quotes, and collateral performance. If there is at least one significant model assumption or input that is not observable, these securities are classified as Level 3 within the fair value hierarchy; otherwise, they are classified as Level 2.
Loans Held for Sale
The Company has elected the fair value option to account for originated closed loans intended for sale. The fair value is measured on an individual loan basis using quoted market prices and when not available, comparable market value or discounted cash flow analysis may be utilized. These assets are typically classified as Level 2.
Derivative Instruments
Derivatives
The valuation of these instruments is determined using widely accepted valuation techniques including discounted cash flow analysis on the expected cash flows of each derivative. This analysis reflects the contractual terms of the derivatives, including the period to maturity, and uses observable market-based inputs, including interest rate curves and implied volatilities.volatilizes. The Company incorporates credit valuation adjustments to appropriately reflect nonperformance risk in the fair value measurements. In adjusting the fair value of its derivative contracts for the effect of nonperformance risk, the Company has considered the impact of netting and any applicable credit enhancements, such as collateral postings. Additionally, in conjunction with fair value measurement guidance, the Company has made an accounting policy election to measure the credit risk of its derivative financial instruments that are subject to master netting agreements on a net basis by counterparty portfolio. Although the Company has determined that the majority of the inputs used to value its interest rate derivatives fall within Level 2 of the fair value hierarchy, the credit valuation adjustments associated with its interest rate derivatives and risk participation agreements may also utilize Level 3 inputs, such as estimates of current credit spreads to evaluate the likelihood of default by the Company and its counterparties. However, as of March 31, 20202021 and December 31, 2019,2020, the Company has assessed the significance of the impact of the credit valuation adjustments on the overall valuation of its derivative positions and has determined that the credit valuation adjustments are not significant to the overall valuation of its derivatives. As a result, the Company has determined that its derivative valuations in their entirety are properly classified as Level 2.
Mortgage Derivatives
The fair value of mortgage derivatives is determined based on current market prices for similar assets in the secondary market and, therefore, classified as Level 2 within the fair value hierarchy.
Individually Assessed Collateral Dependent Loans
In accordance with the CECL standard, expected credit losses on individually assessed loans deemed to be collateral dependent are valued based upon the lower of amortized cost or fair value of the underlying collateral less costs to sell. The inputs used in the appraisals of the collateral are not always observable, and in such cases the loans may be classified as Level 3 within the fair value hierarchy; otherwise, they are classified as Level 2.
Other Real Estate Owned and Other Foreclosed Assets
Other Real Estate Owned ("OREO") and Other Foreclosed Assets are valued at the lower of cost or fair value of the property, less estimated costs to sell. The fair values are generally estimated based upon recent appraisal values of the property less costs to sell the property. Certain inputs used in appraisals are not always observable, and therefore OREO and Other Foreclosed Assets may be classified as Level 3 within the fair value hierarchy.
Goodwill and Other Intangible Assets
Goodwill and other intangible assets are subject to impairment testing. The Company conducts an annual impairment test of goodwill in the third quarter of each year, or more frequently if necessary. Other intangible assets are reviewed for impairment whenever events or changes in circumstances indicate that the carrying amount of the assets may not be recoverable. To estimate the fair value of goodwill and, if necessary, other intangible assets, the Company utilizes both a comparable analysis of relevant price multiples in recent market transactions and a discounted cash flow analysis. Both valuation models require a significant degree of management judgment. In the event the fair value as determined by the valuation model is less than the carrying value, the intangibles may be impaired. If the impairment testing resulted in impairment, the Company would classify the impaired goodwill and other intangible assets subjected to nonrecurring fair value adjustments as Level 3.
Assets and liabilities measured at fair value on a recurring and nonrecurring basis were as follows as of the dates indicated:
| | | | | | | | | | | | | | | | | | | | | | | |
| | | | Fair Value Measurements at Reporting Date Using |
| Balance | | Quoted Prices
in Active
Markets for
Identical
Assets
(Level 1) | | Significant
Other
Observable
Inputs
(Level 2) | | Significant
Unobservable
Inputs
(Level 3) |
| | March 31, 2021 |
| | (Dollars in thousands) |
| Recurring fair value measurements | | | | | | | |
| Assets | | | | | | | |
| Trading securities | $ | 3,269 | | | $ | 3,269 | | | $ | — | | | $ | — | |
| Equity securities | 22,419 | | | 22,419 | | | 0 | | | 0 | |
| Securities available for sale | | | | | | | |
| U.S. government agency securities | 168,056 | | | — | | | 168,056 | | | — | |
| Agency mortgage-backed securities | 290,175 | | | — | | | 290,175 | | | — | |
| Agency collateralized mortgage obligations | 81,629 | | | — | | | 81,629 | | | — | |
| | | | | | | |
| State, county, and municipal securities | 555 | | | — | | | 555 | | | — | |
| Single issuer trust preferred securities issued by banks and insurers | 488 | | | — | | | 488 | | | — | |
| Pooled trust preferred securities issued by banks and insurers | 1,064 | | | — | | | 1,064 | | | — | |
| Small business administration pooled securities | 58,246 | | | 0 | | | 58,246 | | | 0 | |
| Loans held for sale | 41,632 | | | — | | | 41,632 | | | — | |
| Derivative instruments | 133,705 | | | — | | | 133,705 | | | — | |
| Liabilities | | | | | | | |
| Derivative instruments | 92,081 | | | — | | | 92,081 | | | — | |
| Total recurring fair value measurements | $ | 709,157 | | | $ | 25,688 | | | $ | 683,469 | | | $ | 0 | |
| | | | | | | |
| Nonrecurring fair value measurements | | | | | | | |
| Assets | | | | | | | |
| Individually assessed collateral dependent loans (1) | $ | 31,213 | | | $ | — | | | $ | — | | | $ | 31,213 | |
| | | | | | | |
| Total nonrecurring fair value measurements | $ | 31,213 | | | $ | 0 | | | $ | 0 | | | $ | 31,213 | |
| | | | | | Fair Value Measurements at Reporting Date Using | | | | Fair Value Measurements at Reporting Date Using |
| | Balance | | Quoted Prices in Active Markets for Identical Assets (Level 1) | | Significant Other Observable Inputs (Level 2) | | Significant Unobservable Inputs (Level 3) | | Balance | | Quoted Prices
in Active
Markets for
Identical
Assets
(Level 1) | | Significant
Other
Observable
Inputs
(Level 2) | | Significant
Unobservable
Inputs
(Level 3) |
| | March 31, 2020 | | December 31, 2020 |
| | (Dollars in thousands) | | (Dollars in thousands) |
| Recurring fair value measurements | | | | | | | | Recurring fair value measurements | |
| Assets | | | | | | | | Assets | |
| Trading securities | $ | 2,247 |
| | $ | 2,247 |
| | $ | — |
| | $ | — |
| Trading securities | $ | 2,838 | | | $ | 2,838 | | | $ | — | | | $ | — | |
| Equity securities | 19,439 |
| | 19,439 |
| | — |
| | — |
| Equity securities | 22,107 | | | 22,107 | | | 0 | | | 0 | |
| Securities available for sale | | | | | | | | Securities available for sale | |
| U.S. government agency securities | 24,292 |
| | — |
| | 24,292 |
| | — |
| U.S. government agency securities | 24,116 | | | — | | | 24,116 | | | — | |
| Agency mortgage-backed securities | 258,784 |
| | — |
| | 258,784 |
| | — |
| Agency mortgage-backed securities | 233,629 | | | — | | | 233,629 | | | — | |
| Agency collateralized mortgage obligations | 87,210 |
| | — |
| | 87,210 |
| | — |
| Agency collateralized mortgage obligations | 91,683 | | | — | | | 91,683 | | | — | |
| | State, county, and municipal securities | 1,144 |
| | — |
| | 1,144 |
| | — |
| State, county, and municipal securities | 807 | | | 0 | | | 807 | | | 0 | |
| Single issuer trust preferred securities issued by banks and insurers | 436 |
| | — |
| | 436 |
| | — |
| Single issuer trust preferred securities issued by banks and insurers | 488 | | | — | | | 488 | | | — | |
| Pooled trust preferred securities issued by banks and insurers | 1,009 |
| | — |
| | — |
| | 1,009 |
| Pooled trust preferred securities issued by banks and insurers | 1,056 | | | — | | | 1,056 | | | — | |
| Small business administration pooled securities | 64,421 |
| | — |
| | 64,421 |
| | — |
| Small business administration pooled securities | 61,081 | | | 0 | | | 61,081 | | | 0 | |
| Loans held for sale | 43,756 |
| | — |
| | 43,756 |
| | — |
| Loans held for sale | 58,104 | | | — | | | 58,104 | | | — | |
| Derivative instruments | 205,815 |
| | — |
| | 205,815 |
| | — |
| Derivative instruments | 187,399 | | | — | | | 187,399 | | | — | |
| Liabilities | | | | | | | | Liabilities | |
| Derivative instruments | 149,539 |
| | — |
| | 149,539 |
| | — |
| Derivative instruments | 134,064 | | | — | | | 134,064 | | | — | |
| Total recurring fair value measurements | $ | 559,014 |
| | $ | 21,686 |
| | $ | 536,319 |
| | $ | 1,009 |
| Total recurring fair value measurements | $ | 549,244 | | | $ | 24,945 | | | $ | 524,299 | | | $ | 0 | |
| | | | | | | | | | | | | | | | |
| Nonrecurring fair value measurements | | | | | | | | |
| Nonrecurring fair value measurements: | | Nonrecurring fair value measurements: | |
| Assets | | | | | | | | Assets | |
Individually assessed collateral dependent loans | $ | 39,444 |
| | $ | — |
| | $ | — |
| | $ | 39,444 |
| $ | 31,510 | | | $ | — | | | $ | — | | | $ | 31,510 | |
| | Total nonrecurring fair value measurements | $ | 39,444 |
| | $ | — |
| | $ | — |
| | $ | 39,444 |
| Total nonrecurring fair value measurements | $ | 31,510 | | | $ | 0 | | | $ | 0 | | | $ | 31,510 | |
|
| | | | | | | | | | | | | | | |
| | | | Fair Value Measurements at Reporting Date Using |
| | Balance | | Quoted Prices in Active Markets for Identical Assets (Level 1) | | Significant Other Observable Inputs (Level 2) | | Significant Unobservable Inputs (Level 3) |
| | December 31, 2019 |
| | (Dollars in thousands) |
| Recurring fair value measurements | | | | | | | |
| Assets | | | | | | | |
| Trading securities | $ | 2,179 |
| | $ | 2,179 |
| | $ | — |
| | $ | — |
|
| Equity securities | 21,261 |
| | 21,261 |
| | — |
| | — |
|
| Securities available for sale | | | | | | | |
| U.S. government agency securities | 33,115 |
| | — |
| | 33,115 |
| | — |
|
| Agency mortgage-backed securities | 247,000 |
| | — |
| | 247,000 |
| | — |
|
| Agency collateralized mortgage obligations | 88,511 |
| | — |
| | 88,511 |
| | — |
|
| State, county, and municipal securities | 1,396 |
| | — |
| | 1,396 |
| | — |
|
| Single issuer trust preferred securities issued by banks and insurers | 493 |
| | — |
| | 493 |
| | — |
|
| Pooled trust preferred securities issued by banks and insurers | 1,114 |
| | — |
| | — |
| | 1,114 |
|
| Small business administration pooled securities | 54,795 |
| | — |
| | 54,795 |
| | — |
|
| Loans held for sale | 33,307 |
| | — |
| | 33,307 |
| | — |
|
| Derivative instruments | 78,385 |
| | — |
| | 78,385 |
| | — |
|
| Liabilities | | | | | | | |
| Derivative instruments | 53,923 |
| | — |
| | 53,923 |
| | — |
|
| Total recurring fair value measurements | $ | 507,633 |
| | $ | 23,440 |
| | $ | 483,079 |
| | $ | 1,114 |
|
| | | | | | | | |
| Nonrecurring fair value measurements: | | | | | | | |
| Assets | | | | | | | |
| Collateral dependent impaired loans | $ | 25,515 |
| | $ | — |
| | $ | — |
| | $ | 25,515 |
|
| Total nonrecurring fair value measurements | $ | 25,515 |
| | $ | — |
| | $ | — |
| | $ | 25,515 |
|
(1) The table below presents a reconciliation for all assets and liabilities measured at fair value on a recurring basis using significant unobservable inputs (Level 3), which were valued using pricing models and discounted cash flow methodologies, asof individually assessed collateral dependent loans is generally determined through independent appraisals of the dates indicated:underlying collateral, which generally include various Level 3 inputs which are not identifiable. Appraisals may be adjusted by management for qualitative factors such as economic factors and estimated liquidation expenses. The range of these possible adjustments may vary.
|
| | | | | | | |
| | Three Months Ended |
| | March 31 |
| | 2020 | | 2019 |
| | (Dollars in thousands) |
| Pooled Trust Preferred Securities | | | |
| Beginning balance | $ | 1,114 |
| | $ | 1,329 |
|
| Gains and (losses) (realized/unrealized) | | | |
| Included in earnings | — |
| | — |
|
| Included in other comprehensive income | (60 | ) | | 3 |
|
| Settlements | (45 | ) | | (18 | ) |
| Ending balance | $ | 1,009 |
| | $ | 1,314 |
|
The following table sets forth certain unobservable inputs regarding the Company’s financial instruments that are classified as Level 3 for the periods indicated:
|
| | | | | | | | | | | | | | | | | | |
| | | March 31
2020 | | December 31
2019 | | | | March 31
2020 | | December 31
2019 | | March 31
2020 | | December 31
2019 |
| Valuation Technique | | Fair Value | | Unobservable Inputs | | Range | | Weighted Average |
| | | (Dollars in thousands) | | |
| Discounted cash flow methodology | | | | | | | | | | |
| Pooled trust preferred securities | | $ | 1,009 |
| | $ | 1,114 |
| | Cumulative prepayment | | 0% - 57% | | 0% - 57% | | 2.4% | | 2.6% |
| | | | | | | Cumulative default | | 4% - 100% | | 2% - 100% | | 13.5% | | 13.5% |
| | | | | | | Loss given default | | 85% - 100% | | 85% - 100% | | 93.6% | | 93.6% |
| | | | | | | Cure given default | | 0% - 75% | | 0% - 75% | | 60.9% | | 60.9% |
| Appraisals of collateral(1) | | | | | | | | | | |
| Individually assessed collateral dependent loans | | $ | 39,444 |
| | n/a |
| | | | | | | | | | |
| Collateral dependent impaired loans | | n/a |
| | $ | 25,515 |
| | | | | | | | | | |
38
| |
(1) | Fair value is generally determined through independent appraisals of the underlying collateral, which generally include various Level 3 inputs which are not identifiable. Appraisals may be adjusted by management for qualitative factors such as economic factors and estimated liquidation expenses. The range of these possible adjustments may vary. |
The significant unobservable inputs used in the fair value measurement of the Company’s pooled trust preferred securities are cumulative prepayment rates, cumulative default rates, loss given default rates and cure given default rates. Significant increases (decreases) in deferrals or defaults, in isolation, would result in a significantly lower (higher) fair value measurement. Alternatively, significant increases (decreases) in cure rates, in isolation, would result in a significantly higher (lower) fair value measurement.
The estimated fair values and related carrying amounts for assets and liabilities for which fair value is only disclosed are shown below as of the periodsdates indicated:
| | | | | | | | | | | | | | | | | | | | | | | | | | | | | |
| | | | | | Fair Value Measurements at Reporting Date Using |
| | Carrying
Value | | Fair
Value | | Quoted Prices
in Active
Markets for
Identical
Assets
(Level 1) | | Significant
Other
Observable
Inputs
(Level 2) | | Significant
Unobservable
Inputs
(Level 3) |
| March 31, 2021 |
| | (Dollars in thousands) |
| Financial assets | | | |
| Securities held to maturity (a) | | | | | | | | | |
| | | | | | | | | |
| U.S. Treasury securities | $ | 4,014 | | | $ | 4,057 | | | $ | — | | | $ | 4,057 | | | $ | — | |
| Agency mortgage-backed securities | 417,811 | | | 426,628 | | | — | | | 426,628 | | | — | |
| Agency collateralized mortgage obligations | 355,686 | | | 361,002 | | | — | | | 361,002 | | | — | |
| | | | | | | | | |
| Single issuer trust preferred securities issued by banks | 1,500 | | | 1,508 | | | — | | | 1,508 | | | — | |
| Small business administration pooled securities | 26,518 | | | 27,235 | | | 0 | | | 27,235 | | | 0 | |
| | | | | | | | | |
| Loans, net of allowance for credit losses (b) | 9,107,929 | | | 9,072,683 | | | — | | | — | | | 9,072,683 | |
| Federal Home Loan Bank stock (c) | 10,250 | | | 10,250 | | | 0 | | | 10,250 | | | 0 | |
| Cash surrender value of life insurance policies (d) | 241,365 | | | 241,365 | | | 0 | | | 241,365 | | | 0 | |
| Financial liabilities | | | | | | | | | |
| Deposit liabilities, other than time deposits (e) | $ | 10,725,479 | | | $ | 10,725,479 | | | $ | — | | | $ | 10,725,479 | | | $ | — | |
| Time certificates of deposits (f) | 868,045 | | | 871,056 | | | — | | | 871,056 | | | — | |
| Federal Home Loan Bank borrowings (f) | 35,717 | | | 35,799 | | | — | | | 35,799 | | | — | |
| | | | | | | | | |
| | | | | | | | | |
| | | | | | | | | |
| Long-term borrowings (f) | 28,099 | | | 27,572 | | | 0 | | | 27,572 | | | 0 | |
| Junior subordinated debentures (g) | 62,851 | | | 68,052 | | | — | | | 68,052 | | | — | |
| Subordinated debentures (f) | 49,720 | | | 47,027 | | | — | | | — | | | 47,027 | |
|
| | | | | | | | | | | | | | | | | | | |
| | | | | | Fair Value Measurements at Reporting Date Using |
| | Carrying Value | | Fair Value | | Quoted Prices in Active Markets for Identical Assets (Level 1) | | Significant Other Observable Inputs (Level 2) | | Significant Unobservable Inputs (Level 3) |
| March 31, 2020 |
| | (Dollars in thousands) |
| Financial assets | | | |
| Securities held to maturity(a) | | | | | | | | | |
| U.S. Treasury securities | $ | 4,029 |
| | $ | 4,139 |
| | $ | — |
| | $ | 4,139 |
| | $ | — |
|
| Agency mortgage-backed securities | 463,632 |
| | 482,363 |
| | — |
| | 482,363 |
| | — |
|
| Agency collateralized mortgage obligations | 277,921 |
| | 289,902 |
| | — |
| | 289,902 |
| | — |
|
| Single issuer trust preferred securities issued by banks | 1,500 |
| | 1,490 |
| | — |
| | 1,490 |
| | — |
|
| Small business administration pooled securities | 30,716 |
| | 31,461 |
| | — |
| | 31,461 |
| | — |
|
| Loans, net of allowance for credit losses(b) | 8,784,610 |
| | 8,626,697 |
| | — |
| | — |
| | 8,626,697 |
|
| Federal Home Loan Bank stock(c) | 23,274 |
| | 23,274 |
| | — |
| | 23,274 |
| | — |
|
| Cash surrender value of life insurance policies(d) | 197,772 |
| | 197,772 |
| | — |
| | 197,772 |
| | — |
|
| Financial liabilities | | | | | | | | | |
| Deposit liabilities, other than time deposits(e) | $ | 8,146,490 |
| | $ | 8,146,490 |
| | $ | — |
| | $ | 8,146,490 |
| | $ | — |
|
| Time certificates of deposits(f) | 1,269,708 |
| | 1,279,983 |
| | — |
| | 1,279,983 |
| | — |
|
| Federal Home Loan Bank borrowings(f) | 358,591 |
| | 359,249 |
| | — |
| | 359,249 |
| | — |
|
| Long-term borrowings(f) | 74,920 |
| | 73,572 |
| | — |
| | 73,572 |
| | — |
|
| Junior subordinated debentures(g) | 62,849 |
| | 61,528 |
| | — |
| | 61,528 |
| | — |
|
| Subordinated debentures(f) | 49,625 |
| | 51,896 |
| | — |
| | — |
| | 51,896 |
|
| | | | | | | | | | | | | | | | | | | | | | | | | | | | | |
| | | | | | Fair Value Measurements at Reporting Date Using |
| | Carrying
Value | | Fair
Value | | Quoted Prices
in Active
Markets for
Identical
Assets
(Level 1) | | Significant
Other
Observable
Inputs
(Level 2) | | Significant
Unobservable
Inputs
(Level 3) |
| December 31, 2020 |
| | (Dollars in thousands) |
| Financial assets | |
| Securities held to maturity (a) | | | | | | | | | |
| | | | | | | | | |
| U.S. Treasury securities | $ | 4,017 | | | $ | 4,077 | | | $ | — | | | $ | 4,077 | | | $ | — | |
| Agency mortgage-backed securities | 356,085 | | | 374,121 | | | — | | | 374,121 | | | — | |
| Agency collateralized mortgage obligations | 335,993 | | | 344,119 | | | — | | | 344,119 | | | — | |
| | | | | | | | | |
| Single issuer trust preferred securities issued by banks | 1,500 | | | 1,498 | | | — | | | 1,498 | | | — | |
| Small business administration pooled securities | 26,917 | | | 28,362 | | | 0 | | | 28,362 | | | 0 | |
| | | | | | | | | |
| Loans, net of allowance for credit losses (b) | 9,247,964 | | | 9,253,381 | | | — | | | — | | | 9,253,381 | |
| Federal Home Loan Bank stock (c) | 10,250 | | | 10,250 | | | 0 | | | 10,250 | | | 0 | |
| Cash surrender value of life insurance policies (d) | 200,525 | | | 200,525 | | | 0 | | | 200,525 | | | 0 | |
| Financial liabilities | | | | | | | | | |
| Deposit liabilities, other than time deposits (e) | $ | 10,042,541 | | | $ | 10,042,541 | | | $ | — | | | $ | 10,042,541 | | | $ | — | |
| Time certificates of deposits (f) | 950,629 | | | 955,598 | | | — | | | 955,598 | | | — | |
| Federal Home Loan Bank borrowings (f) | 35,740 | | | 35,885 | | | — | | | 35,885 | | | — | |
| Long-term borrowings (f) | 32,773 | | | 32,033 | | | 0 | | | 32,033 | | | 0 | |
| | | | | | | | | |
| | | | | | | | | |
| Junior subordinated debentures (g) | 62,851 | | | 70,238 | | | — | | | 70,238 | | | — | |
| Subordinated debentures (f) | 49,696 | | | 46,486 | | | — | | | — | | | 46,486 | |
(a)The fair values presented are based on quoted market prices, where available. If quoted market prices are not available, fair values are based on quoted market prices of comparable instruments and/or discounted cash flow analysis.
(b)Fair value of loans is measured using the exit price valuation method, determined primarily by discounting the future cash flows using the current rates at which similar loans would be made to borrowers with similar credit ratings and for the same remaining maturities or cash flows, while incorporating liquidity and credit assumptions. Additionally, this amount excludes individually assessed collateral dependent loans, which are deemed to be marked to fair value on a nonrecurring basis.
|
| | | | | | | | | | | | | | | | | | | |
| | | | | | Fair Value Measurements at Reporting Date Using |
| | Carrying Value | | Fair Value | | Quoted Prices in Active Markets for Identical Assets (Level 1) | | Significant Other Observable Inputs (Level 2) | | Significant Unobservable Inputs (Level 3) |
| December 31, 2019 |
| | (Dollars in thousands) |
| Financial assets | |
| Securities held to maturity(a) | | | | | | | | | |
| U.S. government agency securities | $ | 12,874 |
| | $ | 12,997 |
| | $ | — |
| | $ | 12,997 |
| | $ | — |
|
| U.S. Treasury securities | 4,032 |
| | 4,053 |
| | $ | — |
| | 4,053 |
| | $ | — |
|
| Agency mortgage-backed securities | 397,414 |
| | 405,802 |
| | — |
| | 405,802 |
| | — |
|
| Agency collateralized mortgage obligations | 293,662 |
| | 297,314 |
| | — |
| | 297,314 |
| | — |
|
| Single issuer trust preferred securities issued by banks | 1,500 |
| | 1,490 |
| | — |
| | 1,490 |
| | — |
|
| Small business administration pooled securities | 31,324 |
| | 31,607 |
| | — |
| | 31,607 |
| | — |
|
| Loans, net of allowance for credit losses(b) | 8,780,384 |
| | 8,613,635 |
| | — |
| | — |
| | 8,613,635 |
|
| Federal Home Loan Bank stock(c) | 14,424 |
| | 14,424 |
| | — |
| | 14,424 |
| | — |
|
| Cash surrender value of life insurance policies(d) | 197,372 |
| | 197,372 |
| | — |
| | 197,372 |
| | — |
|
| Financial liabilities | | | | | | | | | |
| Deposit liabilities, other than time deposits(e) | $ | 7,752,052 |
| | $ | 7,752,052 |
| | $ | — |
| | $ | 7,752,052 |
| | $ | — |
|
| Time certificates of deposits(f) | 1,395,315 |
| | 1,396,760 |
| | — |
| | 1,396,760 |
| | — |
|
| Federal Home Loan Bank borrowings(f) | 115,748 |
| | 115,881 |
| | — |
| | 115,881 |
| | — |
|
| Long-term borrowings (f) | 74,906 |
| | 72,219 |
| | — |
| | 72,219 |
| | — |
|
| Junior subordinated debentures(g) | 62,848 |
| | 65,603 |
| | — |
| | 65,603 |
| | — |
|
| Subordinated debentures(f) | 49,601 |
| | 52,870 |
| | — |
| | — |
| | 52,870 |
|
| |
(a) | The fair values presented are based on quoted market prices, where available. If quoted market prices are not available, fair values are based on quoted market prices of comparable instruments and/or discounted cash flow analysis. |
| |
(b) | Fair value of loans is measured using the exit price valuation method, determined primarily by discounting the future cash flows using the current rates at which similar loans would be made to borrowers with similar credit ratings and for the same remaining maturities or cash flows, while incorporating liquidity and credit assumptions. Additionally, this amount excludes collateral dependent impaired loans, which are deemed to be marked to fair value on a nonrecurring basis. |
| |
(c) | FHLB stock has no quoted market value and is carried at cost, therefore the carrying amount approximates fair value. |
| |
(d) | Cash surrender value of life insurance is recorded at its cash surrender value (or the amount that can be realized upon surrender of the policy), therefore carrying amount approximates fair value. |
| |
(e) | Fair value of demand deposits, savings and interest checking accounts and money market deposits is the amount payable on demand at the reporting date. |
| |
(f) | Fair value was determined by discounting anticipated future cash payments using rates currently available for instruments with similar remaining maturities. |
| |
(g) | Fair value was determined based upon market prices of securities with similar terms and maturities. |
(d)Cash surrender value of life insurance policies is recorded at its cash surrender value (or the amount that can be realized upon surrender of the policy), therefore, carrying amount approximates fair value.
(e)Fair value of demand deposits, savings and interest checking accounts and money market deposits is the amount payable on demand at the reporting date.
(f)Fair value was determined by discounting anticipated future cash payments using rates currently available for instruments with similar remaining maturities.
(g)Fair value was determined based upon market prices of securities with similar terms and maturities.
This summary excludes certain financial assets and liabilities for which the carrying value approximates fair value. For financial assets, these may include cash and due from banks, federal funds sold and short-term investments. For financial liabilities, these may include federal funds purchased. These instruments would all be considered to be classified as Level 1 within the fair value hierarchy. Also excluded from the summary are financial instruments measured at fair value on a recurring and nonrecurring basis, as previously described.
The Company considers its current use of financial instruments to be the highest and best use of the instruments.
NOTE 128 - REVENUE RECOGNITION
A portion of the Company's noninterest income is derived from contracts with customers, and as such, the revenue recognized depicts the transfer of promised goods or services to customers in an amount that reflects the consideration to which the entity expects to be entitled in exchange for those goods or services. The Company considers the terms of the contract and all relevant facts and circumstances when applying this guidance. To ensure its alignment with this core principle, the Company measures revenue and the timing of recognition by applying the following five steps:
| |
1. | Identify the contract(s) with customers |
| |
2. | Identify the performance obligations |
| |
3. | Determine the transaction price |
| |
4. | Allocate the transaction price to the performance obligations |
| |
5. | Recognize revenue when (or as) the entity satisfies a performance obligation |
1.Identify the contract(s) with customers
2.Identify the performance obligations
3.Determine the transaction price
4.Allocate the transaction price to the performance obligations
5.Recognize revenue when (or as) the entity satisfies a performance obligation
The Company has disaggregated its revenue from contracts with customers into categories that depict how the nature, amount, timing, and uncertainty of revenue and cash flows are affected by economic factors. The following table presents the revenue streams that the Company has disaggregated as of the periods indicated:
| | | | | | | | | | | | | | | |
| | | Three Months Ended |
| | | | | March 31
2021 | | March 31
2020 |
| | | | | (Dollars in thousands) |
| Deposit account fees (inclusive of cash management fees) | | | | | $ | 3,584 | | | $ | 4,970 | |
| Interchange fees | | | | | 1,903 | | | 4,104 | |
| ATM fees | | | | | 625 | | | 639 | |
| Investment management - wealth management and advisory services | | | | | 7,402 | | | 6,289 | |
| Investment management - retail investments and insurance revenue | | | | | 902 | | | 540 | |
| Merchant processing income | | | | | 320 | | | 393 | |
| Credit card income | | | | | 236 | | | 183 | |
| Other noninterest income | | | | | 1,125 | | | 1,212 | |
| Total noninterest income in-scope of ASC 606 | | | | | 16,097 | | | 18,330 | |
| Total noninterest income out-of-scope of ASC 606 | | | | | 9,149 | | | 8,105 | |
| Total noninterest income | | | | | $ | 25,246 | | | $ | 26,435 | |
|
| | | | | | | |
| | Three Months Ended |
| | March 31
2020 | | March 31
2019 |
| | (Dollars in thousands) |
| Deposit account fees (inclusive of cash management fees) | $ | 4,970 |
| | $ | 4,406 |
|
| Interchange fees | 4,104 |
| | 3,735 |
|
| ATM fees | 639 |
| | 666 |
|
| Investment management - wealth management and advisory services | 6,289 |
| | 6,069 |
|
| Investment management - retail investments and insurance revenue | 540 |
| | 679 |
|
| Merchant processing income | 393 |
| | 280 |
|
| Credit card income | 183 |
| | — |
|
| Other noninterest income | 1,212 |
| | 939 |
|
| Total noninterest income in-scope of ASC 606 | 18,330 |
| | 16,774 |
|
| Total noninterest income out-of-scope of ASC 606 | 8,105 |
| | 4,759 |
|
| Total noninterest income | $ | 26,435 |
| | $ | 21,533 |
|
In each of the revenue streams identified above, there were no significant judgments made in determining or allocating the transaction price, as the consideration and service requirements are generally explicitly identified in the associated contracts. Additional information related to each of the revenue streams is further noted below.
Deposit Account Fees
The Company offers various deposit account products to its customers governed by specific deposit agreements applicable to either personal customers or business customers. These agreements identify the general conditions and obligations of both parties, and include standard information regarding deposit account related fees.
Deposit account services include providing access to deposit accounts as well as access to the various deposit transactional services of the Company. These transactional services are primarily those that are identified in the standard fee schedule, and include, but are not limited to, services such as overdraft protection, wire transfer, and check collection. Revenue is recognized in conjunction with the various services being provided. For example, the Company may assess monthly fixed service fees associated with the customer having access to a deposit account, which can vary depending on the account type and daily account balance. In addition, the Company may also assess separate fixed fees associated with and at the time specific transactions are entered into by the customer. As such, the Company considers its performance obligations to be met concurrently with providing the account access or completing the requested deposit transaction.
Cash Management
Cash management services are a subset of the deposit account fees revenue stream. These services primarily include ACH transaction processing, positive pay and remote deposit services. These services are also governed by separate agreements entered into with the customer. The fee arrangement for these services is structured to assess fees under one of two scenarios, either a per transaction fee arrangement or an earnings credit analysis arrangement. Under the per transaction fee arrangement, fixed fees are assessed concurrently with customers executing the transactions, and as such, the Company considers its performance obligations to be met concurrently with completing the requested transaction. Under the earnings credit analysis arrangement, the Company provides a monthly earnings credit to the customer that is negotiated and determined based on various factors. The credit is then available to absorb the per transaction fees that are assessed on the customer's deposit account activity for the month. Any amount of the transactional fees in excess of the earnings credit is recognized as revenue in that month.
Interchange Fees
The Company earns interchange revenue from its issuance of credit and debit cards granted through its membership in various card payment networks. The Company provides credit cards and debit cards to its customers which are authorized and settled through these payment networks, and in exchange, the Company earns revenue as determined by each payment network's interchange program. The revenue is recognized concurrently with the settlement of card transactions within each network.
ATM Fees
The Company deploys automated teller machines (ATMs) as part of its overall branch network. Certain transactions performed at the ATMs require customers to acknowledge and pay a fee for the requested service. Certain ATM fees are disclosed in the deposit account agreement fee schedules, whereas those assessed to non-Rockland Trust deposit holders are solely determined during the transaction at the machine.
The ATM fee is a fixed dollar per transaction amount, and as such, is recognized concurrently with the overall daily processing and settlement of the ATM activity.
Investment Management - Wealth Management and Advisory Services
The Company offers investment management and trust services to individuals, institutions, small businesses and charitable institutions. Each investment management product is governed by its own contract along with a separate identifiable fee schedule unique to that product. The Company also offers additional services, such as estate settlement, financial planning, tax services and other special services quoted at the client's request.
The asset management and/or custody fees are based upon a percentage of the monthly valuation of the principal assets in the customer's account, whereas fees for additional or special services are fixed in nature and are charged as services are rendered. As the fees are dependent on assets under management, which are susceptible to market factors outside of the Company's control, this variable consideration is constrained and therefore no revenue is estimated at contract initiation. As such, all revenue is recognized in correlation to the monthly management fee determinations or as transactional services are provided. Due to the fact that payments are primarily made subsequent to the valuation period, the Company records a receivable for revenue earned but not received. The following table provides the amount of investment management revenue earned but not received as of the periodsdates indicated:
| | | | | | | | | | | |
| March 31, 2021 | | December 31, 2020 |
| (Dollars in thousands) |
| Receivables, included in other assets | $ | 4,826 | | | $ | 4,636 | |
|
| | | | | | | |
| | March 31, 2020 | | December 31, 2019 |
| | (Dollars in thousands) |
| Receivables, included in other assets | $ | 1,912 |
| | $ | 2,341 |
|
Investment Management - Retail Investments and Insurance Revenue
The Company offers the sale of mutual fund shares, unit investment trust shares, general securities, fixed and variable annuities and life insurance products through registered representatives who are both employed by the Company and licensed and contracted with various broker general agents to offer these products to the Company’s customer base. As such, the Company performs these services as an agent and earns a fixed commission on the sales of these products and services. To a lesser degree, production bonus commissions can also be earned based upon the Company meeting certain volume thresholds.
In general, the Company recognizes commission revenue at the point of sale, and for certain insurance products, may also earn and recognize annual residual commissions commensurate with annual premiums being paid.
Merchant Processing Income
The Company refers customers to third party merchant processing partners in exchange for commission and fee income. The income earned is comprised of multiple components, including a fixed referral fee per each referred customer, a rebate amount determined primarily as a percentage of net revenue earned by the third party from services provided to each referred customer, and overall production bonus commissions if certain new account production thresholds are met. Merchant processing income is recognized in conjunction with either completing the referral to earn the fixed fee amount or as the merchant activity is processed to derive the Company's rebate and/or production bonus amounts.
Credit Card Income
The Company provides consumer and business credit card solutions to its customers by soliciting new accounts on behalf of a third party credit card provider in exchange for a fee. The income earned is comprised of new account incentive payments as well as a percentage of interchange income earned by the third party provider offering the consumer and business purpose revolving credit accounts. The credit card income is recognized in conjunction with the establishment of each new credit card member or as the interchange is earned by the third party in connection with net purchase transactions made by the credit card member.
Other Noninterest Income
The Company earns various types of other noninterest income that fall within the scope of the new revenue recognition rules, and have been aggregated into one general revenue stream in the table noted above. This amount includes, but is not limited to, the following types of revenue with customers:
Safe Deposit Rent
The Company rents out the use of safe deposit boxes to its customers, which can be accessed when the bank is open for business. The safe deposit box rental fee is paid upfront and is recognized as revenue ratably over the annual term of the contract.
1031 Exchange Fee Revenue
The Company provides like-kind exchange services pursuant to Section 1031 of the Internal Revenue Code. Fee income is recognized in conjunction with completing the exchange transactions.
Foreign Currency
The Company earns fee income associated with various transactions related to foreign currency product offerings, including foreign currency bank notes and drafts and foreign currency wires. The majority of this income is derived from commissions earned related to customers executing the above mentioned foreign currency transactions through arrangements with third party correspondents.
NOTE 139 - OTHER COMPREHENSIVE INCOME (LOSS)
The following tables present a reconciliation of the changes in the components of other comprehensive income (loss) for the datesperiods indicated, including the amount of income tax (expense) benefit allocated to each component of other comprehensive income (loss):
|
| | | | | | | | | | | |
| | Three Months Ended
March 31, 2020 |
| | Pre Tax
Amount | | Tax (Expense)
Benefit | | After Tax
Amount |
| | (Dollars in thousands) |
| Change in fair value of securities available for sale | $ | 12,123 |
| | $ | (2,776 | ) | | $ | 9,347 |
|
| Less: net security losses reclassified into other noninterest expense | — |
| | — |
| | — |
|
| Net change in fair value of securities available for sale | 12,123 |
| | (2,776 | ) | | 9,347 |
|
| | | | | | |
| Change in fair value of cash flow hedges | 33,567 |
| | (9,443 | ) | | 24,124 |
|
| Less: net cash flow hedge gains reclassified into interest income or interest expense | 1,586 |
| | (446 | ) | | 1,140 |
|
| Net change in fair value of cash flow hedges | 31,981 |
| | (8,997 | ) | | 22,984 |
|
| | | | | | |
| Net unamortized loss related to defined benefit pension and other postretirement adjustments arising during the period | (1,389 | ) | | 391 |
| | (998 | ) |
| Amortization of net actuarial losses | 245 |
| | (69 | ) | | 176 |
|
| Amortization of net prior service costs | 69 |
| | (19 | ) | | 50 |
|
| Net change in other comprehensive income for defined benefit postretirement plans (1) | (1,075 | ) | | 303 |
| | (772 | ) |
| Total other comprehensive income | $ | 43,029 |
| | $ | (11,470 | ) | | $ | 31,559 |
|
| | | | | | | | | | | | | | | | | | | | | | | |
| | | Three Months Ended
March 31, 2021 |
| | | | | | | Pre Tax
Amount | | Tax (Expense)
Benefit | | After Tax
Amount |
| | | | | | | | (Dollars in thousands) |
| Change in fair value of securities available for sale | | | | | | | $ | (10,361) | | | $ | 2,587 | | | $ | (7,774) | |
| Less: net security losses reclassified into other noninterest expense | | | | | | | 0 | | | 0 | | | 0 | |
| Net change in fair value of securities available for sale | | | | | | | (10,361) | | | 2,587 | | | (7,774) | |
| | | | | | | | | | | |
| Change in fair value of cash flow hedges | | | | | | | (4,779) | | | 1,344 | | | (3,435) | |
| Less: net cash flow hedge gains reclassified into interest income or interest expense | | | | | | | 4,380 | | | (1,232) | | | 3,148 | |
| | | | | | | | | | | |
| Net change in fair value of cash flow hedges | | | | | | | (9,159) | | | 2,576 | | | (6,583) | |
| | | | | | | | | | | |
| Net unamortized gain related to defined benefit pension and other postretirement adjustments arising during the period | | | | | | | 653 | | | (184) | | | 469 | |
| | | | | | | | | | | |
| Amortization of net actuarial losses | | | | | | | 442 | | | (124) | | | 318 | |
| Amortization of net prior service costs | | | | | | | 44 | | | (12) | | | 32 | |
| | | | | | | | | | | |
| Net change in other comprehensive income for defined benefit postretirement plans (1) | | | | | | | 1,139 | | | (320) | | | 819 | |
| Total other comprehensive loss | | | | | | | $ | (18,381) | | | $ | 4,843 | | | $ | (13,538) | |
| | | | Three Months Ended
March 31, 2019 | | | Three Months Ended
March 31, 2020 |
| | Pre Tax
Amount | | Tax (Expense)
Benefit | | After Tax
Amount | | | Pre Tax
Amount | | Tax (Expense)
Benefit | | After Tax
Amount |
| | (Dollars in thousands) | | | (Dollars in thousands) |
| Change in fair value of securities available for sale | $ | 6,178 |
| | $ | (1,449 | ) | | $ | 4,729 |
| Change in fair value of securities available for sale | | $ | 12,123 | | | $ | (2,776) | | | $ | 9,347 | |
| Less: net security gains reclassified into other noninterest income (expense) | — |
| | — |
| | — |
| |
| Less: net security losses reclassified into other noninterest expense | | Less: net security losses reclassified into other noninterest expense | | 0 | | | 0 | | | 0 | |
| Net change in fair value of securities available for sale | 6,178 |
| | (1,449 | ) | | 4,729 |
| Net change in fair value of securities available for sale | | 12,123 | | | (2,776) | | | 9,347 | |
| | | | | | | | | | | | | |
| Change in fair value of cash flow hedges | 4,996 |
| | (1,406 | ) | | 3,590 |
| Change in fair value of cash flow hedges | | 33,567 | | | (9,443) | | | 24,124 | |
| Less: net cash flow hedge gains reclassified into interest income or interest expense | 424 |
| | (119 | ) | | 305 |
| Less: net cash flow hedge gains reclassified into interest income or interest expense | | 1,586 | | | (446) | | | 1,140 | |
| | Net change in fair value of cash flow hedges | 4,572 |
| | (1,287 | ) | | 3,285 |
| Net change in fair value of cash flow hedges | | 31,981 | | | (8,997) | | | 22,984 | |
| | | | | | | | | |
| Net unamortized loss related to defined benefit pension and other postretirement adjustments arising during the period | (11 | ) | | 3 |
| | (8 | ) | Net unamortized loss related to defined benefit pension and other postretirement adjustments arising during the period | | (1,389) | | | 391 | | | (998) | |
| Amortization of net actuarial gains | (2 | ) | | 1 |
| | (1 | ) | |
| | Amortization of net actuarial losses | | Amortization of net actuarial losses | | 245 | | | (69) | | | 176 | |
| Amortization of net prior service costs | 69 |
| | (20 | ) | | 49 |
| Amortization of net prior service costs | | 69 | | | (19) | | | 50 | |
| | Net change in other comprehensive income for defined benefit postretirement plans (1) | 56 |
| | (16 | ) | | 40 |
| Net change in other comprehensive income for defined benefit postretirement plans (1) | | (1,075) | | | 303 | | | (772) | |
| Total other comprehensive income | $ | 10,806 |
| | $ | (2,752 | ) | | $ | 8,054 |
| Total other comprehensive income | | $ | 43,029 | | | $ | (11,470) | | | $ | 31,559 | |
(1)The amortization of prior service costs is included in the computation of net periodic pension cost as disclosed in Note 15 "Employee Benefit Plans" within the Employee Benefit Plans footnoteNotes to the Consolidated Financial Statements included in Item 8 of the Company's Annual Report on2020 Form 10-K for the year ended December 31, 2019, filed with the Securities and Exchange Commission.10-K.
Information on the Company’s accumulated other comprehensive income (loss), net of tax, is comprised of the following components as of the periodsdates indicated:
| | | | | | | | | | | | | | | | | | | | | | | | | |
| Unrealized Gain (Loss)
on Securities | | Unrealized Gain on Cash Flow Hedge | | | | Defined Benefit Postretirement Plans | | Accumulated Other Comprehensive Income (Loss) |
| (Dollars in thousands) |
| 2021 |
| Beginning balance: January 1, 2021 | $ | 13,255 | | | $ | 33,276 | | | | | $ | (5,836) | | | $ | 40,695 | |
| Net change in other comprehensive income (loss) | (7,774) | | | (6,583) | | | | | 819 | | | (13,538) | |
| Ending balance: March 31, 2021 | $ | 5,481 | | | $ | 26,693 | | | | | $ | (5,017) | | | $ | 27,157 | |
| | 2020 |
| Beginning balance: January 1, 2020 | $ | 4,398 | | | $ | 16,479 | | | | | $ | (2,708) | | | $ | 18,169 | |
| | | | | | | | | |
| | | | | | | | | |
| Net change in other comprehensive income (loss) | 9,347 | | | 22,984 | | | | | (772) | | | 31,559 | |
| Ending balance: March 31, 2020 | $ | 13,745 | | | $ | 39,463 | | | | | $ | (3,480) | | | $ | 49,728 | |
|
| | | | | | | | | | | | | | | |
| | Unrealized Gain (Loss) on Securities | | Unrealized Gain on Cash Flow Hedge | | Defined Benefit Postretirement Plans | | Accumulated Other Comprehensive Income (Loss) |
| | (Dollars in thousands) |
| | 2020 |
| Beginning balance: January 1, 2020 | $ | 4,398 |
| | $ | 16,479 |
| | $ | (2,708 | ) | | $ | 18,169 |
|
| Net change in other comprehensive income (loss) | 9,347 |
| | 22,984 |
| | (772 | ) | | 31,559 |
|
| Ending balance: March 31, 2020 | $ | 13,745 |
| | $ | 39,463 |
| | $ | (3,480 | ) | | $ | 49,728 |
|
| | 2019 |
| Beginning balance: January 1, 2019 | $ | (5,947 | ) | | $ | 6,148 |
| | $ | (1,374 | ) | | $ | (1,173 | ) |
| Net change in other comprehensive income (loss) | 4,729 |
| | 3,285 |
| | 40 |
| | 8,054 |
|
| Ending balance: March 31, 2019 | $ | (1,218 | ) | | $ | 9,433 |
| | $ | (1,334 | ) | | $ | 6,881 |
|
NOTE 1410 - COMMITMENTS AND CONTINGENCIES
Financial Instruments with Off-Balance Sheet Risk
In the normal course of business, the Company enters into various transactions to meet the financing needs of its customers, which, in accordance with GAAP, are not included in its consolidated balance sheets. These transactions include commitments to extend credit and standby letters of credit, and loans soldloan exposures with recourse, which involve, to varying degrees, elements of credit risk and interest rate risk in excess of the amounts recognized in the consolidated balance sheets. The Company minimizes its exposure to loss under these commitments by subjecting them to credit approval and monitoring procedures.
The Company enters into contractual commitments to extend credit, normally with fixed expiration dates or termination clauses, at specified rates and for specific purposes. Substantially all of these commitments to extend credit are contingent upon customers maintaining specific credit standards at the time of loan funding.
The Company has certain loan exposures for which there is recourse. These loan relationships could require the Company to repurchase or cover certain losses per agreements for certain loans that are either sold or referred to third parties.
Standby letters of credit are written conditional commitments issued to guarantee the performance of a customer to a third party. In the event the customer does not perform in accordance with the terms of the agreement with the third party, the Company would be required to fund the commitment. The maximum potential amount of future payments the Company could be required to make is represented by the contractual amount of the commitment. If the commitment were funded, the Company would be entitled to seek recovery from the customer. The Company’s policies generally require that standby letter of credit arrangements contain security and debt covenants similar to those contained in loan agreements.
The fees collected in connection with the issuance of standby letters of credit are representative of the fair value of the Company's obligation undertaken in issuing the guarantee. In accordance with applicable accounting standards related to guarantees, fees collected in connection with the issuance of standby letters of credit are deferred. The fees are then recognized in income proportionately over the life of the standby letter of credit agreement. The deferred standby letter of credit fees represent the fair value of the Company's potential obligations under the standby letter of credit guarantees.
The following table summarizes the above financial instruments at the dates indicated:
| | | | | | | | | | | |
| March 31, 2021 | | December 31, 2020 |
| | (Dollars in thousands) |
| Commitments to extend credit | $ | 3,561,078 | | | $ | 3,301,692 | |
| Standby letters of credit | 20,385 | | | 20,686 | |
| Deferred standby letter of credit fees | 169 | | | 164 | |
| Loan exposures with recourse | 261,713 | | | 303,265 | |
|
| | | | | | | |
| | March 31, 2020 | | December 31, 2019 |
| | (Dollars in thousands) |
| Commitments to extend credit | $ | 3,296,926 |
| | $ | 3,337,930 |
|
| Standby letters of credit | 20,100 |
| | 21,565 |
|
| Deferred standby letter of credit fees | 166 |
| | 158 |
|
| Loans sold with recourse | 426,342 |
| | 404,532 |
|
Lease Commitments
The Company leases office space, space for ATM locations, and certain branch locations under noncancelablenoncancellable operating leases. SeveralSeveral of these leases contain renewal options to extend lease terms for a period of 1 to 10 years. During the fourth quarter of 2020, the Company committed to pay lease termination fees of $4.8 million, incurred in connection with two branch closure decisions. It is anticipated that these payments will be made in the second quarter of 2021.
There has been no significant change in the future minimum lease payments payable by the Company since December 31, 2019.2020. See the Company's Annual Report on2020 Form 10-K for the fiscal year ended December 31, 2019 for information regarding leases and other commitments.
Other Contingencies
At March 31, 2020, Rockland Trust2021, the Bank was involved in pending lawsuits that arose in the ordinary course of business. Management has reviewed these pending lawsuits with legal counsel and has taken into consideration the view of counsel as to their outcome. In the opinion of management, the final disposition of pending lawsuits is not expected to have a material adverse effect on the Company’s financial position or results of operations.
TheHistorically, the Bank iswas required to maintain certain reserve requirements of vault cash and/or deposits with the Federal Reserve Bank of Boston. ThereBoston, however the reserve requirement was reduced to zero by the Federal Reserve during the first quarter of 2020 in response to the COVID-19 pandemic, and as such, there was 0 reserve requirement at March 31, 2020 and2021. There was also 0 reserve requirement balance necessary at December 31, 2019, respectively.2020 due to cash balances held at the Federal Reserve that were in excess of reserve requirements.
NOTE 1511 - LOW INCOME HOUSING PROJECT INVESTMENTS
The Company has invested in low income housing projects that generate Low Income Housing Tax Credits (“LIHTC”) which provide the Company with tax credits and operating loss tax benefits over a period of approximately 15 years. None of the original investment is expected to be repaid.
The following table presents certain information related to the Company's investments in low income housing projects as of the dates indicated:
| | | | March 31
2020 | | December 31
2019 | | March 31
2021 | | December 31
2020 |
| | (Dollars in thousands) | | (Dollars in thousands) |
| Original investment value | $ | 110,669 |
| | $ | 96,275 |
| Original investment value | $ | 152,766 | | | $ | 128,752 | |
| Current recorded investment | 84,679 |
| | 72,510 |
| Current recorded investment | 117,915 | | | 97,435 | |
| Unfunded liability obligation | 43,427 |
| | 34,967 |
| Unfunded liability obligation | 66,968 | | | 49,586 | |
| Tax credits and benefits | 11,194 |
| (1) | 7,342 |
| Tax credits and benefits | 14,202 | | (1) | 9,404 | |
| Amortization of investments | 9,211 |
| (2) | 5,645 |
| Amortization of investments | 12,298 | | (1) | 7,552 | |
| Net income tax benefit | 1,983 |
| (3) | 1,696 |
| Net income tax benefit | 1,904 | | (1) | 1,851 | |
(1) This amount reflects anticipated tax credits and tax benefitsAmounts shown represent the full year impact for the full year ended December 31, 2020.2021.
(2) The amortization amount reduces the tax credits and benefits anticipated for the full year ended December 31, 2020.
(3) This amount represents the net tax benefit expected to be realized for the full year ended December 31, 2020 in determining the Company's effective tax rate.
NOTE 1612 - SUBSEQUENT EVENTS
Subsequent to March 31, 2020On April 22, 2021, the Company participated inannounced the government-sponsored Payroll Protection Program ("PPP"), helping to deploy stimulus funds to small businesses within the community. Assigning of the filing date, the Company has processed loans, with an aggregate dollar value of $818.9 million. The average and median loan sizes of the PPP loans fora definitive agreement under which the Company has obtained an SBA guarantee are approximately $160,000will
acquire Meridian Bancorp, Inc. ("Meridian") and $41,000, respectively. Additionally,Rockland Trust Company will merge with East Boston Savings Bank (the "Merger Agreement").
Under the Merger Agreement each share of Meridian common stock will be exchanged for 0.2750 shares of the Company's common stock. The transaction is intended to qualify as a tax-free reorganization for federal income tax purposes and to provide Meridian stockholders with a tax-free exchange for the Company common stock consideration they will receive in the merger.
The Company anticipates receiving $25.9issuing approximately 14.2 million shares of its common stock in process fee income for the loans that have been issued undermerger. Based upon the PPP, which will be deferred through net interest income over the lifeclosing price of $79.57 per share of the loans.
Additionally,Company's common stock on April 21, 2021, the transaction is valued at approximately $1.15 billion. The Boards of Directors of each company unanimously approved the transaction, which is subject to certain conditions, including the receipt of required regulatory approvals, approval of both the stockholders of Meridian and the shareholders of the Company, has been offering needs based payment relief options for commercial and small business loans, residential mortgages, and home equity loans and lines of credit and monitors loan modification requests daily. These modifications will not be accounted as TDRs if the borrower was in compliance with the terms of their loans as of December 31, 2019. The following table summarizes the loan modification requests through the date of this filing which are anticipated to be approved:other customary conditions.
|
| | | | | | | | | | | | | |
| Loan Modification Requests by Loan Category: |
| | | # of Loans | | % of Total Loans (#) | | Balance as of March 31, 2020 | | % of Total Loans ($) |
| | | | | | | (Dollars in thousands) |
| Commercial and industrial | | 308 |
| | 0.69 | % | | $ | 163,889 |
| | 1.84 | % |
| Commercial real estate | | 557 |
| | 1.27 | % | | 967,643 |
| | 10.86 | % |
| Construction | | 19 |
| | 0.04 | % | | 37,811 |
| | 0.42 | % |
| Small Business | | 289 |
| | 0.65 | % | | 21,781 |
| | 0.24 | % |
| Residential real estate | | 438 |
| | 0.99 | % | | 185,530 |
| | 2.08 | % |
| Home equity | | 308 |
| | 0.69 | % | | 44,695 |
| | 0.50 | % |
| Other consumer | | 22 |
| | 0.05 | % | | 559 |
| | 0.01 | % |
| Total | | 1,941 |
| | 4.38 | % | | $ | 1,421,908 |
| | 15.95 | % |
Item 2. Management’s Discussion and Analysis of Financial Condition and Results of Operations
The following discussion should be read in conjunction with the consolidated financial statements, notes and tables included in the Company’s Annual Report on Form 10-K for the fiscal year ended December 31, 2019,2020, filed with the Securities and Exchange Commission.Commission (the "2020 Form 10-K").
Cautionary Statement Regarding Forward-Looking Statements
This Quarterly Report on Form 10-Q (this "Report"), in the Management's Discussion and Analysis of Financial Condition and Results of Operations and elsewhere, contains forward-looking statements within the meaning of the Private Securities Litigation Reform Act of 1995. Such statements are not historical facts and include expressions about management’s confidence and strategies and management’s expectations about new and existing programs and products, acquisitions, relationships, opportunities, taxation, technology, market conditions and economic expectations. These statements may be identified by forward-looking terminology such as “should,” “expect,” “believe,” “view,” “opportunity,” “allow,” “continues,” “reflects,” “typically,” “usually,” “anticipate,” or similar statements or variations of such terms. Such forward-looking statements involve certain risks and uncertainties and our actual results may differ materially from such forward-looking statements. Factors that may cause actual results to differ materially from those contemplated by such forward-looking
statements, in addition to those risk factors listed under the “Risk Factors” section of the Company's Annual Report on2020 Form 10-K for the fiscal year ended December 31, 2019, include, but are not limited to:
•further weakening in the United States economy in general and the regional and local economies within the New England region and the Company’s market area, including future weakening caused by the COVID-19 pandemic;
•the length and extent of economic contraction as a result of the COVID-19 pandemic;
•unanticipated loan delinquencies, loss of collateral, decreased service revenues, and other potential negative effects on our business caused by severe weather, pandemics or other external events;
•adverse changes or volatility in the local real estate market;
•adverse changes in asset quality including anand any unanticipated credit deterioration in our loan portfolio including those related to one or more large commercial relationships;
•acquisitions may not produce results at levels or within time frames originally anticipated and may result in unforeseen integration issues or impairment of goodwill and/or other intangibles;
•additional regulatory oversight and related compliance costs, including the additional costs associated with the Company's increase in assets to over $10 billion;
•changes in trade, monetary and fiscal policies and laws, including interest rate policies of the Board of Governors of the Federal Reserve System;
•higher than expected tax expense, resulting from failure to comply with general tax laws or changes in tax laws, or failure to comply with requirements of the federal New Markets Tax Credit program;laws;
•changes in market interest rates for interest earning assets and/or interest bearing liabilities and changes related to the phase-out of LIBOR;
•increased competition in the Company’s market area;areas;
•adverse weather, changes in climate, natural disasters, the emergence of widespread health emergencies or pandemics, including the magnitude and duration of the COVID-19 pandemic, other public health crises or man-made events could negatively affect our local economies or disrupt our operations, which would have an adverse effect on our business or results of operations;
•a deterioration in the conditions of the securities markets;
•a deterioration of the credit rating for U.S. long-term sovereign debt;
•inability to adapt to changes in information technology, including changes to industry accepted delivery models driven by a migration to the internet as a means of service delivery;
•electronic fraudulent activity within the financial services industry, especially in the commercial banking sector;
•adverse changes in consumer spending and savings habits;
•failure to consummate or a delay in consummating the acquisition of Meridian Bancorp, Inc., which is subject to certain standard conditions, including the receipt of required regulatory approvals, approval by the stockholders of Meridian Bancorp, Inc. and the shareholders of the Company, and other customary conditions;
•the inability to realize expected revenue synergies from merger transactions in the amounts or in the timeframe anticipated;
•inability to retain customers and employees, including those of previous mergers;
•the effect of laws and regulations regarding the financial services industry;
•changes in laws and regulations (including laws and regulations concerning taxes, banking, securities and insurance) generally applicable to the Company’s business;
•the Company's potential judgments, claims, damages, penalties, fines and reputational damage resulting from pending or future litigation and regulatory and government actions, including as a result of our participation in and execution of government programs related to the COVID-19 pandemic;
•changes in accounting policies, practices and standards, as may be adopted by the regulatory agencies as well as the Public Company Accounting Oversight Board, the Financial Accounting Standards Board, and other accounting standard setters including, but not limited to, , changes to how the Company accounts for credit losses;
•cyber security attacks or intrusions that could adversely impact our businesses; and
•other unexpected material adverse changes in our operations or earnings.
Further, the foregoing factors may be exacerbated by the ultimate impact of the COVID-19 pandemic, which is unknown at this time. Statements about the COVID-19 pandemic and its potential impact on the Company's business, financial condition, liquidity and results of operations may constitute forward-looking statements and are subject to the risk that actual results may differ, possibly materially, from what is reflected in such statements due to factors and future developments that are uncertain, unpredictable and, in many cases, beyond the Company's control, including the scope, duration and extent of the pandemic and any resurgences, actions taken by governmental authorities in response to the pandemic and the direct and indirect impact on the Company’s employees, customers, business and third-parties with which the Company conducts business.
Except as required by law, the Company disclaims any intent or obligation to update publicly any such forward-looking statements, whether in response to new information, future events or otherwise. Any public statements or disclosures by the Company following this Quarterly Report on Form 10-Q which modify or impact any of the forward-looking statements contained in this Quarterly Report on Form 10-Q will be deemed to modify or supersede such statements in this Quarterly Report on Form 10-Q.Report.
Selected Quarterly Financial Data
The selected consolidated financial and other data of the Company set forth below does not purport to be complete and should be read in conjunction with, and is qualified in its entirety by, the more detailed information, including the Consolidated Financial Statements and related notes, appearing elsewhere in this Quarterly Report on Form 10-Q.Report.
| | | | | | | | | | | | | | | | | | | | | | | | | | | | | |
| | | Three Months Ended | | |
| March 31
2021 | | December 31
2020 | | September 30
2020 | | June 30
2020 | | March 31
2020 |
| | (Dollars in thousands, except per share data) |
| Financial condition data | | | | | | | | | |
| Securities | $ | 1,431,430 | | | $ | 1,162,317 | | | $ | 1,106,782 | | | $ | 1,174,894 | | | $ | 1,236,780 | |
| Loans | 9,246,691 | | | 9,392,866 | | | 9,405,193 | | | 9,359,648 | | | 8,916,430 | |
| Allowance for credit losses | (107,549) | | | (113,392) | | | (115,625) | | | (112,176) | | | (92,376) | |
| Goodwill and other intangible assets | 527,894 | | | 529,313 | | | 530,749 | | | 532,202 | | | 533,672 | |
| Total assets | 13,773,914 | | | 13,204,301 | | | 13,173,665 | | | 13,022,500 | | | 11,980,240 | |
| Total deposits | 11,593,524 | | | 10,993,170 | | | 10,851,308 | | | 10,716,821 | | | 9,416,198 | |
| Total borrowings | 176,387 | | | 181,060 | | | 295,734 | | | 295,701 | | | 545,985 | |
| Stockholders’ equity | 1,715,371 | | | 1,702,685 | | | 1,689,724 | | | 1,671,692 | | | 1,679,656 | |
| Nonperforming loans | 59,201 | | | 66,861 | | | 98,025 | | | 48,814 | | | 48,040 | |
| Nonperforming assets | 59,201 | | | 66,861 | | | 98,025 | | | 48,814 | | | 48,040 | |
| Income statement | | | | | | | | | |
| Interest income | $ | 99,637 | | | $ | 96,805 | | | $ | 97,919 | | | $ | 99,965 | | | $ | 107,380 | |
| Interest expense | 4,053 | | | 5,362 | | | 7,036 | | | 8,867 | | | 13,076 | |
| Net interest income | 95,584 | | | 91,443 | | | 90,883 | | | 91,098 | | | 94,304 | |
| Provision for credit losses | (2,500) | | | — | | | 7,500 | | | 20,000 | | | 25,000 | |
| Noninterest income | 25,246 | | | 27,468 | | | 29,347 | | | 28,190 | | | 26,435 | |
| Noninterest expenses | 69,682 | | | 73,727 | | | 66,658 | | | 66,607 | | | 66,840 | |
| Net income | 41,711 | | | 34,641 | | | 34,873 | | | 24,902 | | | 26,751 | |
| Per share data | | | | | | | | | |
| Net income—basic | $ | 1.26 | | | $ | 1.05 | | | $ | 1.06 | | | $ | 0.76 | | | $ | 0.78 | |
| Net income—diluted | 1.26 | | | 1.05 | | | 1.06 | | | 0.76 | | | 0.78 | |
| Cash dividends declared | 0.48 | | | 0.46 | | | 0.46 | | | 0.46 | | | 0.46 | |
| Book value per share | 51.94 | | | 51.65 | | | 51.27 | | | 50.75 | | | 50.50 | |
| Tangible book value per share (1) | 35.96 | | | 35.59 | | | 35.17 | | | 34.59 | | | 34.46 | |
| Performance ratios | | | | | | | | | |
| Return on average assets | 1.26 | % | | 1.04 | % | | 1.07 | % | | 0.79 | % | | 0.94 | % |
| Return on average common equity | 9.87 | % | | 8.10 | % | | 8.21 | % | | 5.97 | % | | 6.22 | % |
| Net interest margin (on a fully tax equivalent basis) | 3.25 | % | | 3.10 | % | | 3.13 | % | | 3.25 | % | | 3.74 | % |
| Equity to assets | 12.45 | % | | 12.89 | % | | 12.83 | % | | 12.84 | % | | 14.02 | % |
| Dividend payout ratio | 36.35 | % | | 43.76 | % | | 43.45 | % | | 61.85 | % | | 56.54 | % |
| Asset Quality Ratios | | | | | | | | | |
| Nonperforming loans as a percent of gross loans | 0.64 | % | | 0.71 | % | | 1.04 | % | | 0.52 | % | | 0.54 | % |
| Nonperforming assets as a percent of total assets | 0.43 | % | | 0.51 | % | | 0.74 | % | | 0.37 | % | | 0.40 | % |
| Allowance for credit losses as a percent of total loans | 1.16 | % | | 1.21 | % | | 1.23 | % | | 1.20 | % | | 1.04 | % |
| Allowance for credit losses as a percent of nonperforming loans | 181.67 | % | | 169.59 | % | | 117.95 | % | | 229.80 | % | | 192.29 | % |
|
| | | | | | | | | | | | | | | | | | | |
| | | | Three Months Ended | | |
| | March 31
2020 | | December 31
2019 | | September 30
2019 | | June 30
2019 | | March 31
2019 |
| | (Dollars in thousands, except per share data) |
| Financial condition data | | | | | | | | | |
| Securities | $ | 1,236,780 |
| | $ | 1,190,670 |
| | $ | 1,192,229 |
| | $ | 1,213,253 |
| | $ | 1,083,126 |
|
| Loans | 8,916,430 |
| | 8,873,639 |
| | 8,913,501 |
| | 8,950,787 |
| | 6,976,872 |
|
| Allowance for credit losses | (92,376 | ) | | (67,740 | ) | | (66,942 | ) | | (65,960 | ) | | (65,140 | ) |
| Goodwill and other intangible assets | 533,672 |
| | 535,492 |
| | 535,869 |
| | 537,896 |
| | 270,444 |
|
| Total assets | 11,980,240 |
| | 11,395,165 |
| | 11,538,639 |
| | 11,603,199 |
| | 8,997,457 |
|
| Total deposits | 9,416,198 |
| | 9,147,367 |
| | 9,326,091 |
| | 9,307,915 |
| | 7,463,602 |
|
| Total borrowings | 545,985 |
| | 303,103 |
| | 292,791 |
| | 499,702 |
| | 308,040 |
|
| Stockholders’ equity | 1,679,656 |
| | 1,708,143 |
| | 1,682,324 |
| | 1,636,003 |
| | 1,104,538 |
|
| Nonperforming loans | 48,040 |
| | 48,049 |
| | 45,702 |
| | 45,294 |
| | 43,331 |
|
| Nonperforming assets | 48,040 |
| | 48,049 |
| | 48,202 |
| | 48,183 |
| | 43,331 |
|
| Income statement | | | | | | | | | |
| Interest income | $ | 107,380 |
| | $ | 113,703 |
| | $ | 119,624 |
| | $ | 122,144 |
| | $ | 91,543 |
|
| Interest expense | 13,076 |
| | 13,710 |
| | 15,026 |
| | 16,125 |
| | 9,018 |
|
| Net interest income | 94,304 |
| | 99,993 |
| | 104,598 |
| | 106,019 |
| | 82,525 |
|
| Provision for loan losses | 25,000 |
| | 4,000 |
| | — |
| | 1,000 |
| | 1,000 |
|
| Noninterest income | 26,435 |
| | 33,297 |
| | 31,816 |
| | 28,648 |
| | 21,533 |
|
| Noninterest expenses | 66,840 |
| | 67,445 |
| | 67,533 |
| | 93,032 |
| | 56,311 |
|
| Net income | 26,751 |
| | 47,477 |
| | 51,845 |
| | 30,628 |
| | 35,225 |
|
| Per share data | | | | | | | | | |
| Net income—basic | $ | 0.78 |
| | $ | 1.38 |
| | $ | 1.51 |
| | $ | 0.89 |
| | $ | 1.25 |
|
| Net income—diluted | 0.78 |
| | 1.38 |
| | 1.51 |
| | 0.89 |
| | 1.25 |
|
| Cash dividends declared | 0.46 |
| | 0.44 |
| | 0.44 |
| | 0.44 |
| | 0.44 |
|
| Book value per share | 50.50 |
| | 49.69 |
| | 48.95 |
| | 47.67 |
| | 39.26 |
|
| Tangible book value per share (1) | 34.46 |
| | 34.11 |
| | 33.36 |
| | 32.00 |
| | 29.64 |
|
| Performance ratios | | | | | | | | | |
| Return on average assets | 0.94 | % | | 1.64 | % | | 1.78 | % | | 1.06 | % | | 1.62 | % |
| Return on average common equity | 6.22 | % | | 11.06 | % | | 12.33 | % | | 7.59 | % | | 13.10 | % |
| Net interest margin (on a fully tax equivalent basis) | 3.74 | % | | 3.90 | % | | 4.03 | % | | 4.09 | % | | 4.14 | % |
| Equity to assets | 14.02 | % | | 14.99 | % | | 14.58 | % | | 14.10 | % | | 12.28 | % |
| Dividend payout ratio | 56.54 | % | | 31.85 | % | | 29.13 | % | | 40.42 | % | | 30.29 | % |
| Asset Quality Ratios | | | | | | | | | |
| | | | | | | | | | | | | | | | | | | | | | | | | | | | | |
| Capital ratios | | | | | | | | | |
| Equity to assets | 12.45 | % | | 12.89 | % | | 12.83 | % | | 12.84 | % | | 14.02 | % |
| Tangible equity to tangible assets (1) | 8.96 | % | | 9.26 | % | | 9.17 | % | | 9.12 | % | | 10.01 | % |
| Tier 1 leverage capital ratio | 9.63 | % | | 9.56 | % | | 9.52 | % | | 9.57 | % | | 10.74 | % |
| Common equity tier 1 capital ratio | 13.16 | % | | 12.67 | % | | 12.41 | % | | 12.26 | % | | 11.95 | % |
| Tier 1 risk-based capital ratio | 13.85 | % | | 13.34 | % | | 13.08 | % | | 12.94 | % | | 12.60 | % |
| Total risk-based capital ratio | 15.61 | % | | 15.13 | % | | 14.87 | % | | 14.73 | % | | 14.13 | % |
(1) Represents a non-GAAP measure. For reconciliation to GAAP book value per share, see Item 2 "Management's Discussion and Analysis of Financial Condition and Results of Operations - Executive Level Overview - Non-GAAP Measures" below.
|
| | | | | | | | | | | | | | | | | | | |
| Nonperforming loans as a percent of gross loans | 0.54 | % | | 0.54 | % | | 0.51 | % | | 0.51 | % | | 0.62 | % |
| Nonperforming assets as a percent of total assets | 0.40 | % | | 0.42 | % | | 0.42 | % | | 0.42 | % | | 0.48 | % |
| Allowance for credit losses as a percent of total loans | 1.04 | % | | 0.76 | % | | 0.75 | % | | 0.74 | % | | 0.93 | % |
| Allowance for credit losses as a percent of nonperforming loans | 192.29 | % | | 140.98 | % | | 146.47 | % | | 145.63 | % | | 150.33 | % |
| Capital ratios | | | | | | | | | |
| Tier 1 leverage capital ratio | 10.74 | % | | 11.28 | % | | 10.83 | % | | 10.45 | % | | 10.64 | % |
| Common equity tier 1 capital ratio | 11.95 | % | | 12.86 | % | | 12.52 | % | | 12.08 | % | | 12.09 | % |
| Tier 1 risk-based capital ratio | 12.60 | % | | 13.53 | % | | 13.19 | % | | 12.75 | % | | 13.11 | % |
| Total risk-based capital ratio | 14.13 | % | | 14.83 | % | | 14.88 | % | | 14.42 | % | | 15.28 | % |
| |
(1) | Represents a non-GAAP measure. For reconciliation to GAAP book value per share, see Item 2 "Management's Discussion and Analysis of Financial Condition and Results of Operations - Executive Level Overview - Non-GAAP Measures" below.
|
Executive Level Overview
Management evaluates the Company's operating results and financial condition using measures that include net income, earnings per share, return on assets and equity, return on tangible common equity, net interest margin, tangible book value per share, asset quality indicators, and many others. These metrics are used by management to make key decisions regarding the Company's balance sheet, liquidity, interest rate sensitivity, and capital resources and assist with identifying opportunities for improving the Company's financial position or operating results. The results forCompany is focused on organic growth, but will also consider acquisition opportunities that can provide a satisfactory financial return.
On April 22, 2021 the firstCompany announced the signing of a definitive merger agreement with Meridian Bancorp, Inc. ("Meridian"), which is expected to close in the fourth quarter of 2020 were significantly impacted by $25.0 million of loan provision expense. Assumptions regarding the impact2021. The closing of the novel coronavirus ("COVID-19") pandemic were the primary driverMeridian acquisition is subject to certain conditions including approval of the sizetransaction by Meridian and the Company's shareholders, receipt of required regulatory approvals, and other standard conditions.
During the credit loss allowance. The full macroeconomic impacts ofongoing COVID-19 pandemic, the pandemic remain unknown and are continuing to unfold, however the social distancing restrictions that have been put in place for public safety have led to a decline in consumer spending, and historically high levels of unemployment, as workplaces have been forced to shut down or severely limit operations. The duration of these restrictions is unknown, therefore the Company is not able to provide any assurances that the Company’s earnings, asset quality, regulatory capital ratios and economic condition will not be materially adversely impacted on a short term or long term basis.
The Company has been and continues to remainremains committed to supporting and working with its customers as they navigate these unprecedented times. The Company has institutedabided by government mandates requiring a temporary moratorium on foreclosures and has offered a variety of relief measures to its customers consistent with prudent banking principles and regulatory guidance. These relief measures may include:have included: temporary deferrals of loan payments, waiving certain fees and permitting customers easier access to their deposits. Additionally, the Company is participating in the government-sponsored Paycheck Protection Program ("PPP") loan program designed to help deploy stimulus funds to businesses within the community. The Company’s charitable foundations have engaged and will continue to engage in outreach to local communities during this difficult time and have committed funds to be made available to key nonprofits with urgent needs, such as local food banks.
From a capital standpoint, The Company remains an active participant in the Company has deployed stress-testing scenarios incorporating adverse assumptions specificgovernment-sponsored Paycheck Protection Program ("PPP") designed to help deploy stimulus funds in the current environment. Management will continueform of loans to usebusinesses within the resultscommunity, funding an additional $340.0 million as part of these scenarios to guide the ongoing managementsecond round program during the first quarter of capital. Additionally, while the aforementioned modifications and2021, bringing total outstanding PPP loans will put a temporary strain onto $846.3 million at March 31, 2021.
While the Company's liquidity, management believes that there is sufficient sources of available liquidity through various existing channels primarily through the Federal Home Loan Bank and the Federal Reserve. While management is unable to know with certainty the direct, indirect, and futurefull macroeconomic impacts of the COVID-19 pandemic orhave yet to be fully determined, overall conditions have begun to improve as a result of vaccine availability, leading to the extentre-opening of those impacts, management will continue to monitorbusinesses and loosening of certain travel restrictions and social distancing measures. Despite the impactsobserved improvements, the future outlook of the COVID-19 pandemic remains highly dependent on the speed of vaccine administration, the efficacy of the vaccines and the possibility for resurgences of COVID-19 diligently.or other variants of the virus. As a result, the Company is not able to provide any assurances that the Company’s earnings, asset quality, regulatory capital ratios and economic condition will not be materially adversely impacted on a short term or long term basis.
Interest-Earning Assets
Management’s asset strategy typically emphasizes loan growth, primarily in the commercial and home equity portfolios. The results depicted in the following table reflect the trend of the Company's interest-earning assets over the past five quarters. ForManagement’s asset strategy typically emphasizes loan growth, primarily in the commercial and home equity portfolios however, during the first quarter of 2020,2021, the increase in interest-earning assets was primarily driven primarily by an increasegrowth in cash balances reflectingattributable to elevated deposits from PPP fundings and government stimulus payments, as well as purchases of investment securities made during the Company's proactive approachquarter to increasing on-balance sheet liquidity.effectively deploy the excess cash. Loan growth decreased slightly during the quarter as strong originations continued to be constrained by paydowns and refinancing activity.
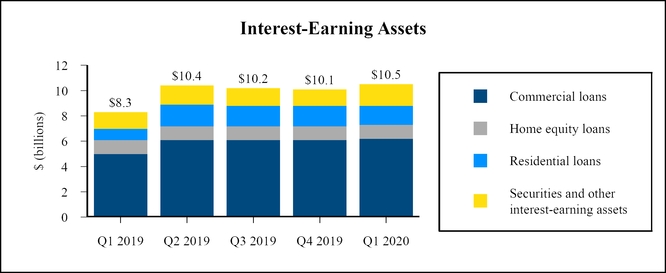
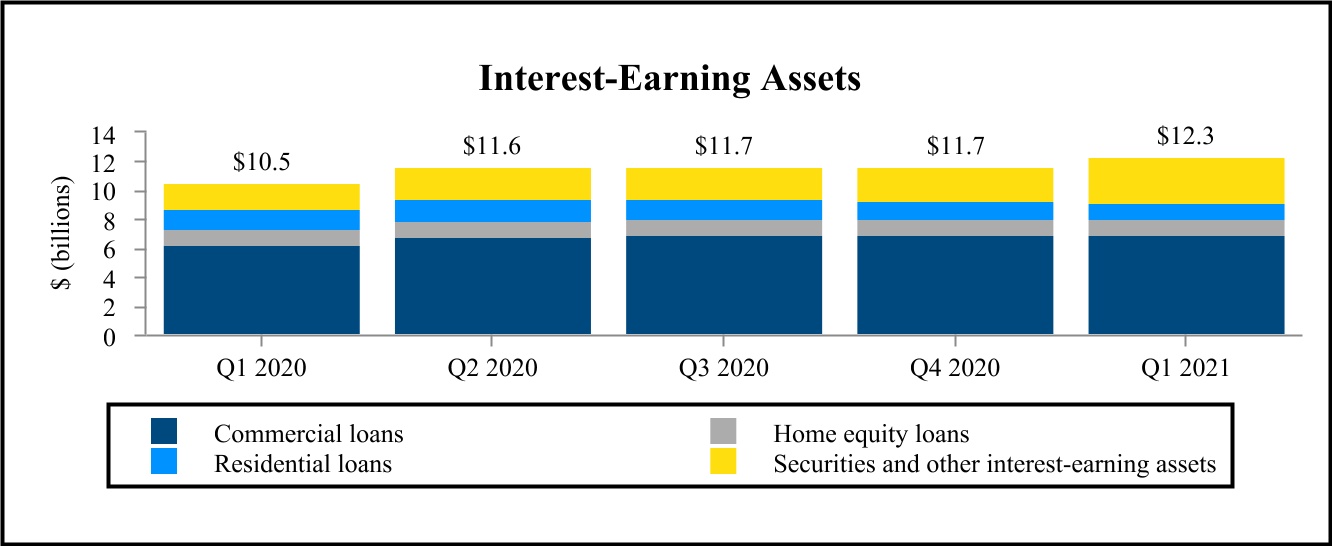
Management strives to be disciplined about loan pricing and considers interest rate sensitivity when generating loan assets. In addition, management takes a disciplined approach to credit underwriting, seeking to avoid undue credit risk and loan losses.
Funding and Net Interest Margin
The Company's overall sources of funding reflect strong business and retail deposit growth with a management emphasis overon core deposit growth to fund loans. However, duringDuring the first quarter of 2020,2021, the Company realized growth in deposits, which increased its borrowings$600.4 million, or 5.5%, from December 31, 2020 to $11.6 billion at March 31, 2021, primarily attributable to a combination of government stimulus payments and loan fundings under the second round of the PPP. Core deposits rose to 90.87% of total deposits at March 31, 2021, as part of its overall liquidity management within this uncertain environment.the higher-cost time deposits continued to run-off. The following chart shows the sources of funding and the percentage of core deposits to total deposits for the trailing five quarters:
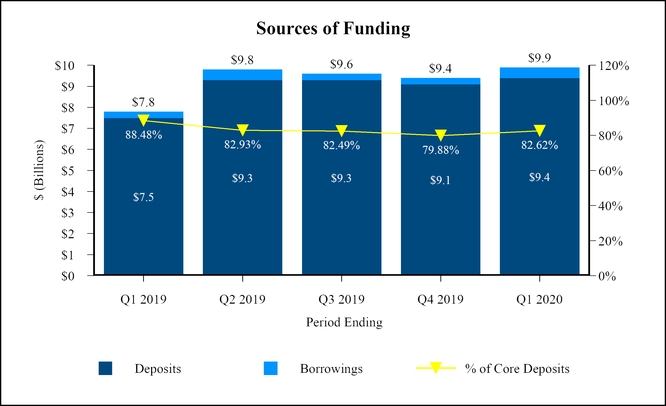
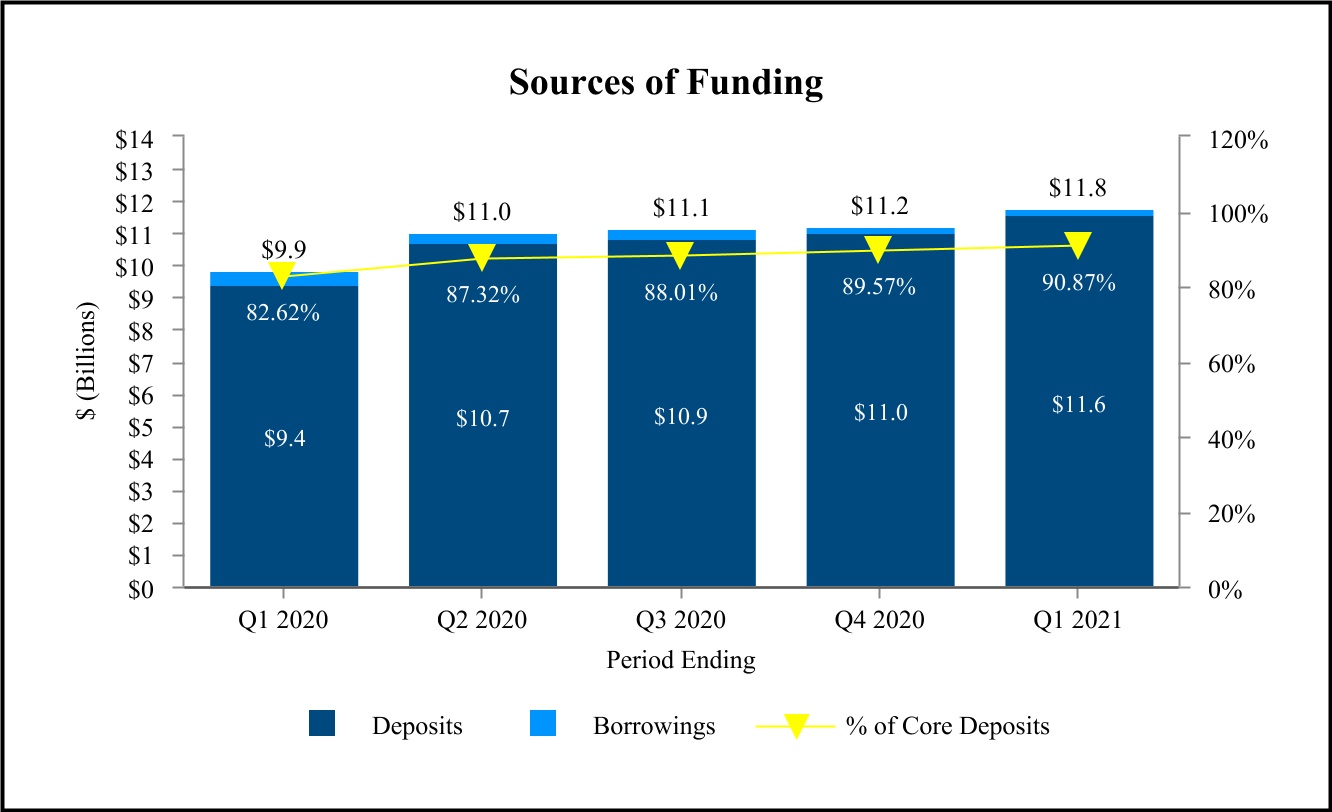
As of March 31, 2020, core deposits comprised 82.62% of total deposits, which is lower than the year ago period due to the acquisition of the time deposit base of Blue Hills Bancorp, Inc., parent of Blue Hills Bank (collectively "BHB"). The cost of deposits for the first quarter remained at 0.48%, when compared to the fourth quarter of 2019. The Company's net interest margin was 3.74%3.25% for the first quarter ended March 31, 2020,of 2021, reflecting a sixteen15 basis point decreaseincrease from the fourth quarter of 2019,2020. The increase was primarily driven by increased PPP fee recognition of $5.8 million during the quarter. Also benefiting the margin was the reduced cost of deposits, which was driven primarily by reduced purchase accounting loan accretiondecreased 4 basis points during the first quarter of 2021 to 0.10%. The table below illustrates the factors that contributed to this increase in the net interest margin for the first quarter 2021:
| | | | | | | | |
| Net interest margin for the three months ended December 31, 2020 | | 3.10 | % |
| Excess liquidity (cash) Levels | | (0.03) | % |
| Securities | | (0.05) | % |
| Loan yields | | (0.02) | % |
| Nonaccrual interest impact, net | | (0.03) | % |
| PPP loan impact | | 0.20 | % |
| Loan purchase accounting (fair value mark amortization/accretion) | | 0.03 | % |
| Decreased cost of funds | | 0.05 | % |
| Net interest margin for the three months ended March 31, 2021 | | 3.25 | % |
The following table shows the net interest margin and lower asset yields linked to Federal Reserve Rate cuts.cost of deposits trends for the trailing five quarters:
Noninterest Income
Management continues to focus on noninterest Noninterest income which is primarily comprised of deposit account fees, interchange and ATM fees, investment management fees and mortgage banking income. The following chart shows the components of noninterest income over the past five quarters:
Expense Control
Management seeks to take a balanced approach to noninterest expense control by monitoring ongoing operating expenses while making needed capital expenditures and prudently investing in growth initiatives. The Company’s primary expenses arise from Rockland Trust’s employee salaries and benefits, as well as expenses associated with buildings and equipment. The following chart depicts the Company's efficiency ratio on a GAAP basis (calculated by dividing noninterest expense by the sum of noninterest income and net interest income), as well as the Company's efficiency ratio on a non-GAAP operating basis, if applicable (calculated by dividing noninterest expense, excluding certain noncore items, by the sum of noninterest income, excluding certain noncore items, and net interest income), over the past five quarters:
*See "Non-GAAP Measures" below for a reconciliation to GAAP financial measures.
Tax Effectiveness
The Company participatesNoninterest expense for the fourth quarter of 2020 included approximately $5.2 million in federalpre-tax expenses primarily attributable to branch closing decisions and state tax credit programs designed to promote economic development, affordable housing, and job creation. The Company continues to make low-income housing tax creditloss on the sale of investments. The Company has also established security corporation subsidiaries and, through its subsidiaries, purchased tax-exempt bonds. Federal and state tax credit program participation and other tax strategies help the Company operate in a more tax effective manner and sometimes also create a competitive advantage for Rockland Trust and its community development subsidiaries. DuringNoninterest expenses decreased during the first quarter of 2020, the Company’s effective tax rate was 7.43%,2021, as compared to 23.23% at December 31, 2019. The tax rate for the fourth quarter includes a $4.7 million discrete tax benefit recognizedof 2020, but remained elevated primarily due to increases in the quarter associated with revised net operating loss (NOL) carryback provisions included in the Coronavirus, Aid, Reliefsalaries and Economic Security Act ("CARES Act").employee benefits and consultant fees.
Capital
The Company's approach with respect to revenue expense, and tax effectivenessexpense is designed to promote long-term earnings growth, which in turn contributes to capital growth. During the first quarter of 2020, the Company executedStrong earnings retention has contributed to capital growth, both on its previously announced stock repurchase plan for 1.5 million shares, repurchasing 1.2 million shares of common stock, at a $73.2 million cost. The Company repurchased the remaining 300,000 shares in early April, completing the repurchase of all 1.5 million shares under the plan at an averageabsolute level and per share price of $63.39.basis. The following chart shows the Company's book value and tangible book value per share over the past five quarters (see "Non-GAAP Measures" below for a reconciliation of non-GAAP measures):
*See "Non-GAAP Measures" below for a reconciliation to GAAP financial measures.
The Company's growth in capital enables the payment of cash dividends. The Company declared quarterly cash dividends of $0.46$0.48 per share for the first quarter of 2020,2021, representing an increase of 4.5%4.3% from the 20192020 quarterly dividend rate of $0.44$0.46 per share.
First Quarter 20202021 Results
Net income for the first quarter of 20202021 was $26.8$41.7 million, or $0.78$1.26 on a diluted earnings per share basis, and decreased 24.1%increased 55.9% and 37.6%61.5%, respectively, as compared to $35.2$26.8 million, or $1.25$0.78 on a diluted earnings per share basis, for the prior year first quarter. The firstFirst quarter 2021 results were positively impacted by a release of 2019provision for credit loss of $2.5 million as well as increased interest income from fee amortization related to forgiven PPP loans, whereas the prior year ago period included gain onprovision for credit loss of $25 million as a result of the sale of loans and merger and acquisition costs which the Company deems to be noncore. Excluding the gain on the sale of loans and merger and acquisition expenses, first quarter 2019 operating net income $36.7 million. There were no such operating items for the first quarter of 2020. See "Non-GAAP Measures" below for a reconciliation of non-GAAP measures.COVID-19 pandemic.
20202021 Outlook
During the Company’sCompany's first quarter 20202021 earnings call, the Company's Chief Financial Officer stated that givenprovided the profound uncertaintyfollowing key expectations regarding business activity to serve as near term guidance for the remainder of 2021:
•net loan growth is expected to the economic outlook and customer impacts, the Company can not confidently provide comprehensive forward looking guidance, however some near-term insights into a few key areas are as follows:
The Company estimatesremain challenged in the near termfuture as attrition continues to mitigate strong closing activity;
•excess liquidity and timing of PPP fee recognition will continue to create some level of volatility in net reported interest margin. Excluding those factors, core net interest margin is expected to compress modestly as asset repricing slightly outpaces the Company's ability to further assumingreduce funding costs;
•provisions for credit losses will continue to reflect a combination of charge-off activity, net loan growth and general economic assumptions. As such, a relatively stable economic environment should continue to provide a framework for very modest provision levels following the following:significant reserve build in 2020;
Full impact of•fee income from the March 2020 Federal Reserve interest rate cutswealth management business is expected to be partially offset by deposit rate adjustments, consistent with previous guidance;
No further adjustmentremain strong, while mortgage gain on sales margins is expected to the Federal Reserve target interest rate range;
Further compression of the one-month London Interbank Offered Rate ("LIBOR") index throughout the quarter;
Loan accretion income to be fairly consistent with Q1 level but below last quarter guidance of $2.0 - $2.5 million per quarter;
The Company's balance sheet cash position consistent withnormalize down from first quarter levels, and;
Omission of the impact from the Paycheck Protection Program ("PPP") loan program given the uncertainty over how much volume will qualify for debt forgiveness and trigger acceleration of the processing2021 levels. Continued challenges to swap fee income versus how much will be retained on the balance sheetare expected as fixed rate alternatives continue to be repaid over the two year term.provide a compelling offer;
Overall expenses•non-interest expense is expected to remain relatively consistent with first quarter results.2021 levels; and,
Tax•the tax rate is expected to normalize back to approximatelyapproximate 25%.
Loan provision levels for the first quarter addressed the harsh impactremainder of the COVID-19 pandemic. The provision for loan losses in the coming quarters will be highly correlated with any further deterioration2021.
Due to the impacts of the COVID-19 pandemic, the Company's prior outlook and expectations for 2020 included in the Company's 2019 year-end earnings release and in its 2019 Annual Report on Form 10-K for the year ended December 31, 2019 has been withdrawn and should not be relied upon.
Non-GAAP Measures
When management assesses the Company’s financial performance for purposes of making day-to-day and strategic decisions, it does so based upon the performance of its core banking business, which is primarily derived from the combination of net interest income and noninterest or fee income, reduced by operating expenses, the provision for loancredit losses, and the impact of income taxes and other noncore items shown in the tables that follow. There are items that impact the Company's results that management believes are unrelated to its core banking business such as merger and acquisition expenses and other items. Management, therefore, computes certain non-GAAP measures including net operating earnings and operating EPS, noninterest income on an operating basis and efficiency ratio on an operating basis, which exclude items management considers to be noncore. Management believes excluding these items facilitates greater visibility into the Company’s core banking business and underlying trends that may, to some extent, be obscured by inclusion of such items.
Management also supplements its evaluation of financial performance with analyses of tangible book value per share (which is computed by dividing stockholders' equity less goodwill and identifiable intangible assets, or "tangible common equity", by common shares outstanding) and the tangible common equity ratio (which is computed by dividing tangible common equity by "tangible assets", defined as total assets less goodwill and other intangibles). The Company has included information on tangible book value per share and the tangible common equity ratio because management believes that investors may find it useful to have access to the same analytical tools used by management. As a result of merger and acquisition activity, the Company has recognized goodwill and other intangible assets in conjunction with business combination accounting principles. Excluding the impact of goodwill and other intangibles in measuring asset and capital values for the ratios provided, along with other bank standard capital ratios, provides a framework to compare the capital adequacy of the Company to other companies in the financial services industry.
These non-GAAP measures should not be viewed as a substitute for operating results and other financial measures determined in accordance with GAAP. An item which management deems to be noncore and excludes when computing these non-GAAP measures can be of substantial importance to the Company’s results for any particular quarter or year. The Company’s non-GAAP performance measures, including operating earnings, operating EPS, operating return on average assets, operating return on average equity, tangible book value per share and the tangible common equity ratio, are not necessarily comparable to non-GAAP performance measures which may be presented by other companies.
| | | | | | | | | | | | | | | | | | | | | | | | | | | | | | | | | | | |
| Three Months Ended | |
| March 31
2021 | | December 31
2020 | | September 30
2020 | | June 30
2020 | | March 31
2020 | | |
| (Dollars in thousands) | |
| Net interest income (GAAP) | $ | 95,584 | | | $ | 91,443 | | | $ | 90,883 | | | $ | 91,098 | | | $ | 94,304 | | | (a) |
| | | | | | | | | | | |
| Noninterest income (GAAP) | $ | 25,246 | | | $ | 27,468 | | | $ | 29,347 | | | $ | 28,190 | | | $ | 26,435 | | | (b) |
| | | | | | | | | | | |
| | | | | | | | | | | |
| | | | | | | | | | | |
| | | | | | | | | | | |
| | | | | | | | | | | |
| | | | | | | | | | | |
| Noninterest expense (GAAP) | $ | 69,682 | | | $ | 73,727 | | | $ | 66,658 | | | $ | 66,607 | | | $ | 66,840 | | | (d) |
| Less: | | | | | | | | | | | |
| | | | | | | | | | | |
| | | | | | | | | | | |
| | | | | | | | | | | |
| | | | | | | | | | | |
| Loss on termination of derivative | — | | | — | | | 684 | | | — | | | — | | | |
| Noninterest expense on an operating basis (Non-GAAP) | $ | 69,682 | | | $ | 73,727 | | | $ | 65,974 | | | $ | 66,607 | | | $ | 66,840 | | | (e) |
| | | | | | | | | | | |
| Total revenue (GAAP) | $ | 120,830 | | | $ | 118,911 | | | $ | 120,230 | | | $ | 119,288 | | | $ | 120,739 | | | (a+b) |
| | | | | | | | | | | |
| | | | | | | | | | | |
| Ratios | | | | | | | | | | | |
| | | | | | | | | | | |
| | | | | | | | | | | |
| Efficiency ratio (GAAP based) | 57.67 | % | | 62.00 | % | | 55.44 | % | | 55.84 | % | | 55.36 | % | | (d/(a+b)) |
| Efficiency ratio on an operating basis (Non-GAAP) | 57.67 | % | | 62.00 | % | | 54.87 | % | | 55.84 | % | | 55.36 | % | | (e/(a+b)) |
The following tables summarize adjustments for noncore items for the time periods indicated below and reconcile non-GAAP measures:
|
| | | | | | | | | | | | | | | |
| | Three Months Ended March 31 |
| | Net Income | | Diluted Earnings Per Share |
| | 2020 | | 2019 | | 2020 | | 2019 |
| | (Dollars in thousands, except per share data) |
| Net income available to common shareholders (GAAP) | $ | 26,751 |
| | $ | 35,225 |
| | $ | 0.78 |
| | $ | 1.25 |
|
| Non-GAAP adjustments | | | | | | | |
| Noninterest expense components | | | | | | | |
| Merger and acquisition expenses | — |
| | 1,032 |
| | — |
| | 0.04 |
|
| Noncore increases to income before taxes | — |
| | 1,032 |
| | — |
| | 0.04 |
|
| Net tax benefit associated with noncore items (1) | — |
| | (198 | ) | | — |
| | (0.01 | ) |
| Add - adjustment for tax effect of previously incurred merger and acquisition expenses | $ | — |
| | $ | 650 |
| | $ | — |
| | $ | 0.02 |
|
| Total tax impact | $ | — |
| | $ | 452 |
| | $ | — |
| | $ | 0.01 |
|
| Noncore increases to net income | $ | — |
| | $ | 1,484 |
| | $ | — |
| | $ | 0.05 |
|
| Operating net income (Non-GAAP) | $ | 26,751 |
| | $ | 36,709 |
| | $ | 0.78 |
| | $ | 1.30 |
|
| |
(1) | The net tax benefit associated with noncore items is determined by assessing whether each noncore item is included or excluded from net taxable income and applying the Company's combined marginal tax rate to only those items included in net taxable income. |
|
| | | | | | | | | | | | | | | | | | | | | |
| | Three Months Ended | |
| | March 31
2020 | | December 31
2019 | | September 30
2019 | | June 30
2019 | | March 31
2019 | | |
| | (Dollars in thousands) | |
| Net interest income (GAAP) | $ | 94,304 |
| | $ | 99,993 |
| | $ | 104,598 |
| | $ | 106,019 |
| | $ | 82,525 |
| | (a) |
| | | | | | | | | | | | |
| Noninterest income (GAAP) | $ | 26,435 |
| | $ | 33,297 |
| | $ | 31,816 |
| | $ | 28,648 |
| | $ | 21,533 |
| | (b) |
| Less: | | | | | | | | | | | |
| Gain on sale of loans | — |
| | — |
| | 951 |
| | — |
| | — |
| | |
| Noninterest income on an operating basis (Non-GAAP) | $ | 26,435 |
| | $ | 33,297 |
| | $ | 30,865 |
| | $ | 28,648 |
| | $ | 21,533 |
| | (c) |
| | | | | | | | | | | | |
| Noninterest expense (GAAP) | $ | 66,840 |
| | $ | 67,445 |
| | $ | 67,533 |
| | $ | 93,032 |
| | $ | 56,311 |
| | (d) |
| Less: | | | | | | | | | | | |
| Merger and acquisition expense | — |
| | — |
| | 705 |
| | 24,696 |
| | 1,032 |
| | |
| Noninterest expense on an operating basis (Non-GAAP) | $ | 66,840 |
| | $ | 67,445 |
| | $ | 66,828 |
| | $ | 68,336 |
| | $ | 55,279 |
| | (e) |
| | | | | | | | | | | | |
| Total revenue (GAAP) | $ | 120,739 |
| | $ | 133,290 |
| | $ | 136,414 |
| | $ | 134,667 |
| | $ | 104,058 |
| | (a+b) |
| Total operating revenue (Non-GAAP)* | $ | 120,739 |
| | $ | 133,290 |
| | $ | 135,463 |
| | $ | 134,667 |
| | $ | 104,058 |
| | (a+c) |
| | | | | | | | | | | | |
| Ratios | | | | | | | | | | | |
| Noninterest income as a % of revenue (GAAP based) | 21.89 | % | | 24.98 | % | | 23.32 | % | | 21.27 | % | | 20.69 | % | | (b/(a+b)) |
| Noninterest income as a % of revenue on an operating basis (Non-GAAP)* | 21.89 | % | | 24.98 | % | | 22.78 | % | | 21.27 | % | | 20.69 | % | | (c/(a+c)) |
| Efficiency ratio (GAAP based) | 55.36 | % | | 50.60 | % | | 49.51 | % | | 69.08 | % | | 54.12 | % | | (d/(a+b)) |
| Efficiency ratio on an operating basis (Non-GAAP) | 55.36 | % | | 50.60 | % | | 49.33 | % | | 50.74 | % | | 53.12 | % | | (e/(a+c)) |
The following table summarizes the calculation of the Company's tangible common equity ratio and tangible book value per share foras of the periodsdates indicated:
| | | | | | | | | | | | | | | | | | | | | | | | | | | | | | | | |
| March 31
2021 | | December 31
2020 | | September 30
2020 | | June 30
2020 | | March 31
2020 | |
| (Dollars in thousands, except per share data) | |
| Tangible common equity | | | | | | | | | | |
| Stockholders' equity (GAAP) | $ | 1,715,371 | | | $ | 1,702,685 | | | $ | 1,689,724 | | | $ | 1,671,692 | | | $ | 1,679,656 | | (a) |
| Less: Goodwill and other intangibles | 527,895 | | | 529,313 | | | 530,749 | | | 532,202 | | | 533,672 | | |
| Tangible common equity (Non-GAAP) | 1,187,476 | | | 1,173,372 | | | 1,158,975 | | | 1,139,490 | | | 1,145,984 | | (b) |
| Tangible assets | | | | | | | | | | |
| Assets (GAAP) | 13,773,914 | | | 13,204,301 | | | 13,173,665 | | | 13,022,500 | | | 11,980,240 | | (c) |
| Less: Goodwill and other intangibles | 527,895 | | | 529,313 | | | 530,749 | | | 532,202 | | | 533,672 | | |
| Tangible assets (Non-GAAP) | $ | 13,246,019 | | | $ | 12,674,988 | | | $ | 12,642,916 | | | $ | 12,490,298 | | | $ | 11,446,568 | | (d) |
| Common shares | 33,024,882 | | | 32,965,692 | | | 32,955,547 | | | 32,942,110 | | | 33,260,005 | | (e) |
| | | | | | | | | | |
| Common equity to assets ratio (GAAP) | 12.45 | % | | 12.89 | % | | 12.83 | % | | 12.84 | % | | 14.02 | % | (a/c) |
| Tangible common equity to tangible assets ratio (Non-GAAP) | 8.96 | % | | 9.26 | % | | 9.17 | % | | 9.12 | % | | 10.01 | % | (b/d) |
| Book value per share (GAAP) | $ | 51.94 | | | $ | 51.65 | | | $ | 51.27 | | | $ | 50.75 | | | $ | 50.50 | | (a/e) |
| Tangible book value per share (Non-GAAP) | $ | 35.96 | | | $ | 35.59 | | | $ | 35.17 | | | $ | 34.59 | | | $ | 34.46 | | (b/e) |
|
| | | | | | | | | | | | | | | | | | | | |
| | March 31
2020 | | December 31
2019 | | September 30
2019 | | June 30
2019 | | March 31
2019 | |
| | (Dollars in thousands, except per share data) | |
| Tangible common equity | | | | | | | | | | |
| Stockholders' equity (GAAP) | $ | 1,679,656 |
| | $ | 1,708,143 |
| | $ | 1,682,324 |
| | $ | 1,636,003 |
| | $ | 1,104,538 |
| (a) |
| Less: Goodwill and other intangibles | 533,672 |
| | 535,492 |
| | 535,869 |
| | 537,896 |
| | 270,444 |
| |
| Tangible common equity (Non-GAAP) | 1,145,984 |
| | 1,172,651 |
| | 1,146,455 |
| | 1,098,107 |
| | 834,094 |
| (b) |
| Tangible assets | | | | | | | | |
| |
| Assets (GAAP) | 11,980,240 |
| | 11,395,165 |
| | 11,538,639 |
| | 11,603,199 |
| | 8,997,457 |
| (c) |
| Less: Goodwill and other intangibles | 533,672 |
| | 535,492 |
| | 535,869 |
| | 537,896 |
| | 270,444 |
| |
| Tangible assets (Non-GAAP) | $ | 11,446,568 |
| | $ | 10,859,673 |
| | $ | 11,002,770 |
| | $ | 11,065,303 |
| | $ | 8,727,013 |
| (d) |
| Common shares | 33,260,005 |
|
| 34,377,388 |
|
| 34,366,781 |
| | 34,321,061 |
| | 28,137,504 |
| (e) |
| | | | | | | | | | | |
| Common equity to assets ratio (GAAP) | 14.02 | % | | 14.99 | % | | 14.58 | % | | 14.10 | % | | 12.28 | % | (a/c) |
| Tangible common equity to tangible assets ratio (Non-GAAP) | 10.01 | % | | 10.80 | % | | 10.42 | % | | 9.92 | % | | 9.56 | % | (b/d) |
| Book value per share (GAAP) | $ | 50.50 |
| | $ | 49.69 |
| | $ | 48.95 |
| | $ | 47.67 |
| | $ | 39.26 |
| (a/e) |
| Tangible book value per share (Non-GAAP) | $ | 34.46 |
| | $ | 34.11 |
| | $ | 33.36 |
| | $ | 32.00 |
| | $ | 29.64 |
| (b/e) |
Critical Accounting Policies
Critical accounting policies are defined as those that are reflective of significant judgments and uncertainties, and could potentially result in materially different results under different assumptions and conditions. The Company believes that the most critical accounting policies are those which the Company’s financial condition depends upon, and which involve the most complex or subjective decisions or assessments.
There have been no material changes in critical accounting policies during the first three months of 2020 aside from the adoption of the CECL accounting standard effective January 1, 2020. The Company's critical accounting policy for the Allowance for Credit Losses is as follows:
Allowance for Credit Losses The Company’s allowance for credit losses provides for probable losses based upon current expected credit losses within the loan and securities portfolios. Arriving at an appropriate amount of allowance for credit losses involves a high degree of judgment.
For loans, the company estimates credit losses on a collective basis for loans sharing similar risk characteristics using a quantitative model combined with an assessment of certain qualitative factors designed to address forecast risk and model risk inherent in the quantitative model output. The quantitative model utilizes a factor based approach to estimate expected credit losses using a Probability of Default ("PD"), Loss Given Default ("LGD") and Exposure at Default ("EAD"), which are derived from internal historical default and loss experience. Management’s judgment is based upon its assessment of PD, LGD, and EAD. Changes in these estimates could be due to a number of circumstances which may have a direct impact on the provision for credit losses and may result in changes to the amount of allowance. The allowance is determined based upon the application of the Company’s methodology for assessing the adequacy of the allowance for credit losses, which considers historical and expected loss factors, loan portfolio composition and other relevant indicators. Economic forecasts are incorporated into the estimate over a reasonable and supportable forecast period, beyond which is a reversion2021. Refer to the Company's historical long-run average. This methodology involves management’s judgment regarding the application and use of such factors, including the effects of changes to the prevailing economic environment in its estimate of the required amounts of allowance. Additionally, the model estimates expected credit losses using loan level data over the contractual life of the exposure, considering the effect of prepayments, which is subject to management's judgment based on analysis to determine the appropriate level of assumed prepayments.
Loans that no longer share similar risk characteristics with any pools of assets are subject to individual assessment and are removed from the collectively assessed pools to avoid double counting. For the loans that will be individually assessed, the Company will use either a discounted cash flow (“DCF”) approach or a fair value of collateral approach. The latter approach will
be used for loans deemed to be collateral dependent or when foreclosure is probable. The allowance is increased by provisions for credit losses and by recoveries of loans previously charged-off and is reduced by loans charged-off. For additional discussion of the Company’s methodology of assessing the adequacy of the allowance for credit losses, see Note 4, "Loans, Allowance for Credit Losses and Credit Quality" within Condensed Notes to Consolidated Financial Statements included in Item 1 hereof.
For held-to-maturity securities, the Company measures expected credit losses on a collective basis by major security type. Management classifies the held-to maturity portfolio into the following major security types: U.S. Government Agency, U.S. Treasury, Agency Mortgage-Backed Securities, Agency Collateralized Mortgage Obligations, Small Business Administration Pooled Securities, and Single Issuer Trust Preferred Securities. Securities in the Company's held to maturity portfolio are guaranteed by either the U.S. Federal Government or other government sponsored agencies with a long history of no credit losses. As a result, management has determined these securities to have a zero loss expectation and therefore does not estimate an allowance for credit losses on these securities.
For available-for-sale securities, the Company reviews any holdings in an unrealized loss position, management will first evaluate whether there is intent to sell, or if it is more likely than not that the Company will be required to sell a security prior to anticipated recovery of its amortized cost basis. If either of these criteria are met, the Company will record a write-down of the security's amortized cost basis to fair value through income. For those available for sale securities which do not meet the intent or requirement to sell criteria, management will evaluate whether the decline in fair value is a result of credit related matters or other factors. In performing this assessment, Management considers the creditworthiness of the issuer including whether the security is guaranteed by the U.S. Federal Government or other government agency, the extent to which fair value is less than amortized cost, and changes in credit rating during the period, among other factors. If this assessment indicates the existence of credit losses, the security will be written down to fair value, as determined by a discounted cash flow analysis. To the extent the estimated cash flows do not support the amortized cost, the deficiency is considered to be due to credit loss and is recognized in earnings.
For additional discussion of the Company’s methodology of assessing the adequacy of the allowance for credit losses for its security portfolios, see Note 3, "Securities" within Condensed Notes to Consolidated Financial Statements included in Item 1 hereof.
Please refer to the Company's Annual Report on2020 Form 10-K for the fiscal year ended December 31, 2019 for a complete listing of critical accounting policies.
FINANCIAL POSITION
Securities Portfolio The Company’s securities portfolio consists of trading securities, equity securities, securities available for sale, and securities which management intends to hold until maturity. Securities increased by $46.1$269.1 million, or 3.9%23.2%, at March 31, 20202021 as compared to December 31, 2019,2020, reflecting $113.8$373.4 millionofpurchases offset by paydowns, called securities, and maturities. The ratio of securities to total assets was 10.32%10.4% and 10.45%8.8% at March 31, 20202021 and December 31, 2019,2020, respectively. The Company estimates expected credit losses for its available for sale and held to maturity securities in accordance with the current expected credit loss ("CECL") methodology. Further details regarding the Company's analysismeasurement of expected credit losses on securities can be found in Note 3 “Securities” within Condensed Notes to the Consolidated Financial Statements included in Part I. Item 1 hereof.of this Report.
Residential Mortgage Loan Sales The Company’s primary loan sale activity arises from the sale of government sponsored enterprise eligible residential mortgage loans. During the three months ended March 31, 2020 and 2019, theThe Company originatedoriginates residential loans with the intention of selling them in the secondary market or to hold in the Company's residential portfolio. When a loan is sold, the Company enters into agreements that contain representations and warranties about the characteristics of the loans sold and their origination. The Company may be required to either repurchase mortgage loans or to indemnify the purchaser from losses if representations and warranties are breached. The Company incurred minimalno material losses related to mortgage repurchases during the three month periodsmonths ended March 31, 2021 and 2020, and no losses during the three month period ended March 31, 2019 related to mortgage repurchases. Additionally, the Company sold residential loans with recourse totaling $35.3 million during the period ended March 31, 2020 and sold no such loans during the period ended March 31, 2019.respectively.
The following table shows the total residential loans that were closed and whether the amounts were held in the portfolio or sold/held for sale in the secondary market during the periods indicated:
Table 1 - Closed Residential Real Estate Loans
| | | | | | | | | | | | | | | |
| | | | Three Months Ended March 31 |
| | | | | | 2021 | | 2020 |
| | | | | | (Dollars in thousands) |
| Held in portfolio | | | | | $ | 81,921 | | | $ | 37,337 | |
| Sold or held for sale in the secondary market | | | | | 270,161 | | | 169,253 | |
| Total closed loans | | | | | $ | 352,082 | | | $ | 206,590 | |
|
| | | | | | | |
| | Three Months Ended March 31 |
| | 2020 | | 2019 |
| | (Dollars in thousands) |
| Held in portfolio | $ | 37,337 |
| | $ | 31,200 |
|
| Sold or held for sale in the secondary market | 169,253 |
| | 38,858 |
|
| Total closed loans | $ | 206,590 |
| | $ | 70,058 |
|
The table below reflects additional information related to the loans which were sold during the periods indicated:
Table 2 - Residential Mortgage Loan Sales
| | | | Three Months Ended March 31 | | | Three Months Ended March 31 |
| | 2020 | | 2019 | | | 2021 | | 2020 |
| | (Dollars in thousands) | | | (Dollars in thousands) |
| Sold with servicing rights released | $ | 121,784 |
| | $ | 39,708 |
| Sold with servicing rights released | | $ | 281,139 | | | $ | 121,784 | |
| Sold with servicing rights retained | 35,331 |
| | — |
| |
| Sold with servicing rights retained (1) | | Sold with servicing rights retained (1) | | 1,430 | | | 35,331 | |
| Total loans sold | $ | 157,115 |
| | $ | 39,708 |
| Total loans sold | | $ | 282,569 | | | $ | 157,115 | |
(1) All loans sold with servicing rights retained were sold with recourse during the three months ended March 31, 2021 and 2020, respectively.
When a loan is sold, the Company may decide to also sell the servicing of sold loans for a servicing release premium, simultaneoussimultaneously with the sale of the loan, or the Company may opt to sell the loan and retain the servicing. In the event of a sale with servicing rights retained, a mortgage servicing asset is established, which represents the then current estimated fair value based on market prices for comparable mortgage servicing contracts, when available, or alternatively is based on a valuation model that calculates the present value of estimated future net servicing income. The valuation model incorporates assumptions that market participants would use in estimating future net servicing income, such as the cost to service, the discount rate, an inflation rate, ancillary income, prepayment speeds and default rates and losses. Servicing rights are recorded in other assets in the consolidated balance sheets, are amortized in proportion to and over the period of estimated net servicing income, and are assessed for impairment based on fair value at each reporting date. Impairment is determined by stratifying the rights based on predominant characteristics, such as interest rate, loan type and investor type. Impairment is recognized through a valuation allowance, to the extent that fair value is less than the capitalized amount. If the Company later determines that all or a portion of the impairment no longer exists, a reduction of the allowance may be recorded as an increase to income. The principal balance of loans serviced by the Bank on behalf of investors was $610.4$401.2 million, $656.4$453.7 million and $234.1$610.4 million at March 31, 2020,2021, December 31, 2019,2020, and March 31, 2019,2020, respectively.
The following table shows the adjusted cost of the servicing rights associated with these loans and the changes for the periods indicated:
Table 3 - Mortgage Servicing Asset
| | | | Three Months Ended March 31 | | | Three Months Ended March 31 |
| | 2020 | | 2019 | | | 2021 | | 2020 |
| | (Dollars in thousands) | | | (Dollars in thousands) |
| Balance at beginning of period | $ | 5,116 |
| | $ | 1,445 |
| Balance at beginning of period | | $ | 2,365 | | | $ | 5,116 | |
| Additions | 333 |
| | — |
| Additions | | 13 | | | 333 | |
| | Amortization | (284 | ) | | (71 | ) | Amortization | | (243) | | | (284) | |
| Change in valuation allowance | (661 | ) | | — |
| Change in valuation allowance | | 406 | | | (661) | |
| Balance at end of period | $ | 4,504 |
| | $ | 1,374 |
| Balance at end of period | | $ | 2,541 | | | $ | 4,504 | |
See Note 9,6, “Derivative and Hedging Activities” within Condensedthe Notes to Consolidated Financial Statements included in Part I. Item 1 hereofof this Report for more information on mortgage activity and mortgage related derivatives.
Loan Portfolio The Company’sTotal loans at March 31, 2021 decreased by $146.2 million, or 1.6%, when compared to the prior quarter. Despite strong origination volumes and loan pipelines across all products, overall portfolio increasedgrowth continued to be constrained by $42.8 millionongoing paydowns and re-financing activity. Exclusive of PPP activity, total commercial loans decreased 1.70% during the first three months of 2020. The overall increase wasquarter, primarily reflecting a slowdown in new construction financing and notably lower line utilization levels within the result of strong closings in thecommercial and industrial ("C&I") portfolio, while commercial real estate and commercial and industrial portfolios, partially offset bybalances remained relatively stable. Within C&I, PPP loan originations from the new 2021 program of $340.0 million outpaced PPP loan payoffs of $285.6 million on the prior year balances, resulting in a decline innet PPP loan balance increase of $54.4 million for the construction portfolio. The consumer portfolio decreasedfirst quarter of 2021 as compared to the linkedfourth quarter asof 2020. Within the Company continues to sell aconsumer portfolios, the majority of its residentialmortgage production intocontinued to be sold in the secondary market, while the low interest-rate environment and excess consumer liquidity position continued to drive elevated payoff activity along with low home equity lending increased slightly.line utilization, resulting in reductions of 4.2% and 3.8% within the mortgage and home equity portfolios, respectively.
The Company's commercial loan portfolio is comprised primarily of commercial and industrial loans as well as commercial real estate loans. Management considers the Company’s commercial and industrial portfolio to be well-diversified with loans to various types of industries. The Company's participation in the PPP resulted in significant loan fundings within the commercial and industrial portfolio throughout 2020 and the first quarter of 2021, with outstanding balances totaling $846.3 million at March 31, 2021, comprising 40.6% of the total portfolio. Accordingly, the composition of the portfolio by sector is skewed as compared to periods prior to commencement of the PPP, as the PPP loans are reflected within the various sectors below. In connection with PPP loan originations during the current quarter, the Company received fee revenue of $13.1 million, which is deferred and amortized over the life of the loan. During the three months ended March 31, 2021, the Company amortized into income $9.5 million in PPP fee revenue related to forgiven loans. Balances of unamortized PPP loan fees will be amortized into income over the remaining loan maturities. The following pie chart shows the diversification of the commercial and industrial portfolio as of March 31, 2020:2021:
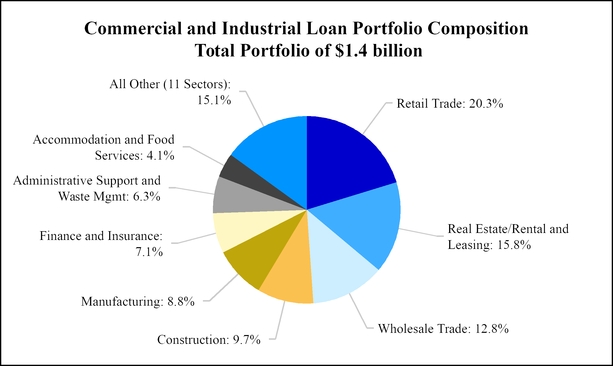
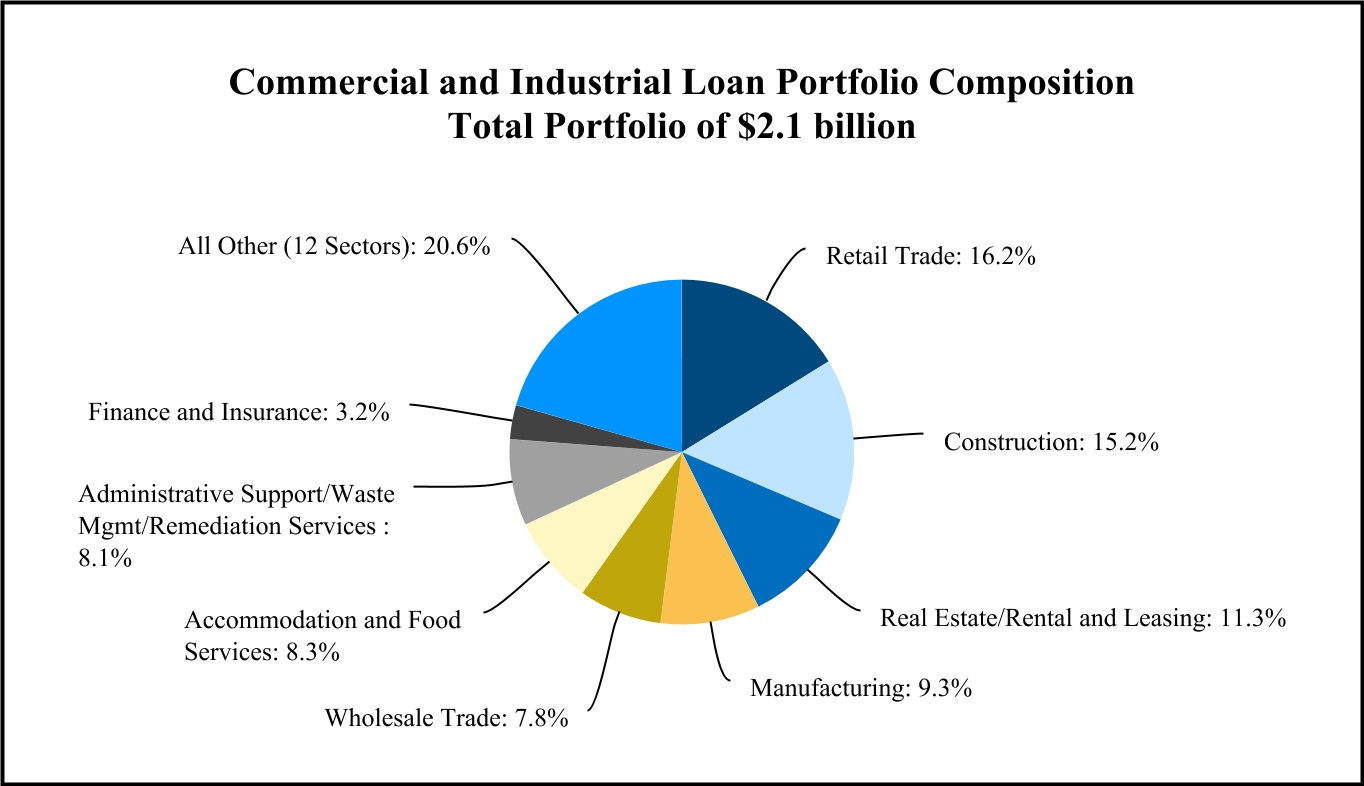
|
| | | |
| | (Dollars in thousands) |
| Average loan size (excluding floor plan tranches) | $ | 329 |
|
| Largest individual commercial and industrial loan outstanding | $ | 24,829 |
|
| Commercial and industrial nonperforming loans/commercial and industrial loans | 1.48 | % |
| | | | | |
| (Dollars in thousands) |
| Average loan size (excluding floor plan tranches) | $ | 126 | |
| Largest individual commercial and industrial loan outstanding | $ | 20,213 | |
| Commercial and industrial nonperforming loans/commercial and industrial loans | 1.43 | % |
The Company’s commercial real estate loan portfolio, inclusive of commercial construction, is the Company’s largest loan type concentration. The Company believes that this portfolio is also well-diversified with loans secured by a variety of property types, such as owner-occupied and nonowner-occupied commercial, retail, office, industrial, warehouse, and other special purpose properties, such as hotels, motels, nursing homes, restaurants, churches, recreational facilities, marinas, and golf courses. Commercial real estate also includes loans secured by certain residential-related property types including multi-family apartment buildings, residential development tracts and condominiums. The following pie chart shows the diversification of the commercial real estate loan portfolio as of March 31, 2020:
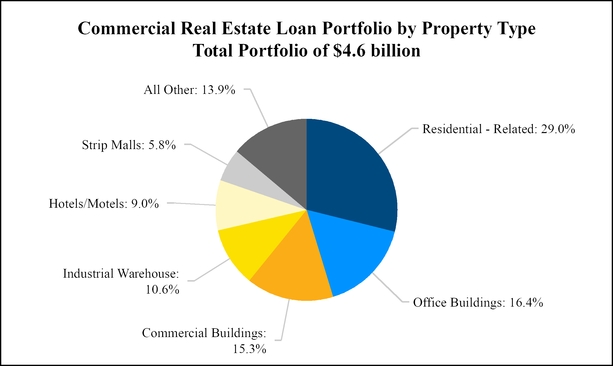
|
| | | |
| | (Dollars in thousands) |
| Average loan size | $ | 1,067 |
|
| Largest individual commercial real estate mortgage outstanding | $ | 32,000 |
|
| Commercial real estate nonperforming loans/commercial real estate loans | 0.11 | % |
| Owner occupied commercial real estate loans/commercial real estate loans | 14.6 | % |
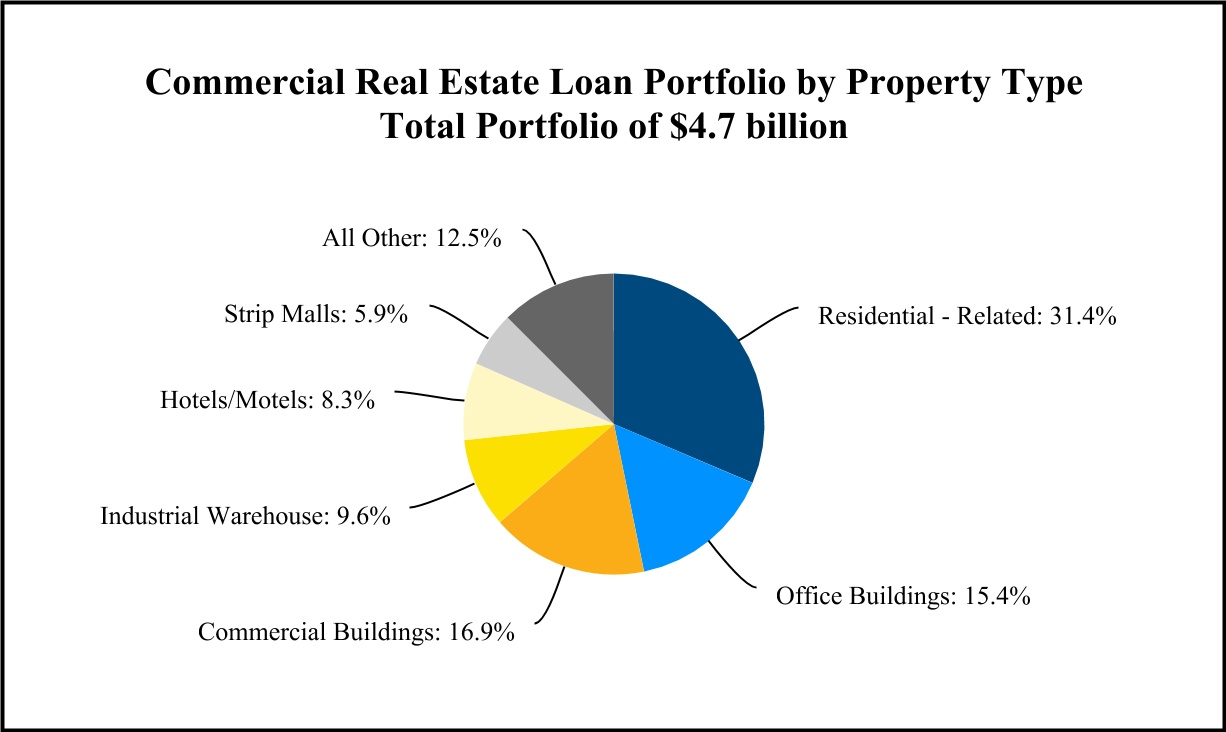
| | | | | |
| (Dollars in thousands) |
| Average loan size | $ | 1,107 | |
| Largest individual commercial real estate mortgage outstanding | $ | 32,000 | |
| Commercial real estate nonperforming loans/commercial real estate loans | 0.21 | % |
| Owner occupied commercial real estate loans/commercial real estate loans | 14.4 | % |
The Company's consumer portfolio consists of both fixed-rate and adjustable-rate residential real estate loans as well as residential construction lending related to single-home residential development within the Company's market area. The Company also provides home equity loans and lines that may be made as a fixed ratefixed-rate term loan or under a variable rate revolving line of credit secured by a first or junior mortgage on the borrower's residence or second home. Additionally, the Company makes loans for a wide variety of other personal needs. Other consumer loans primarily consist of installment loans and overdraft protections. The residential, home equity and other consumer portfolios totaled $2.7$2.3 billion at March 31, 2020,2021, as noted below:
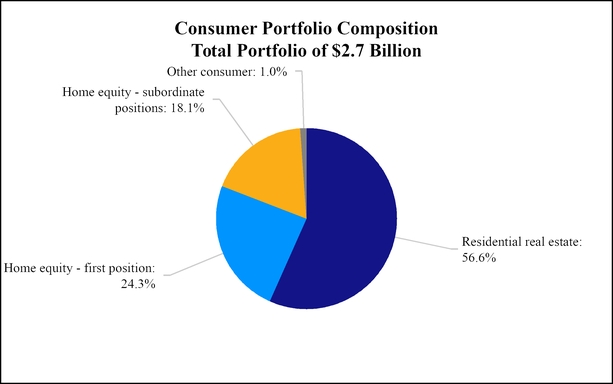
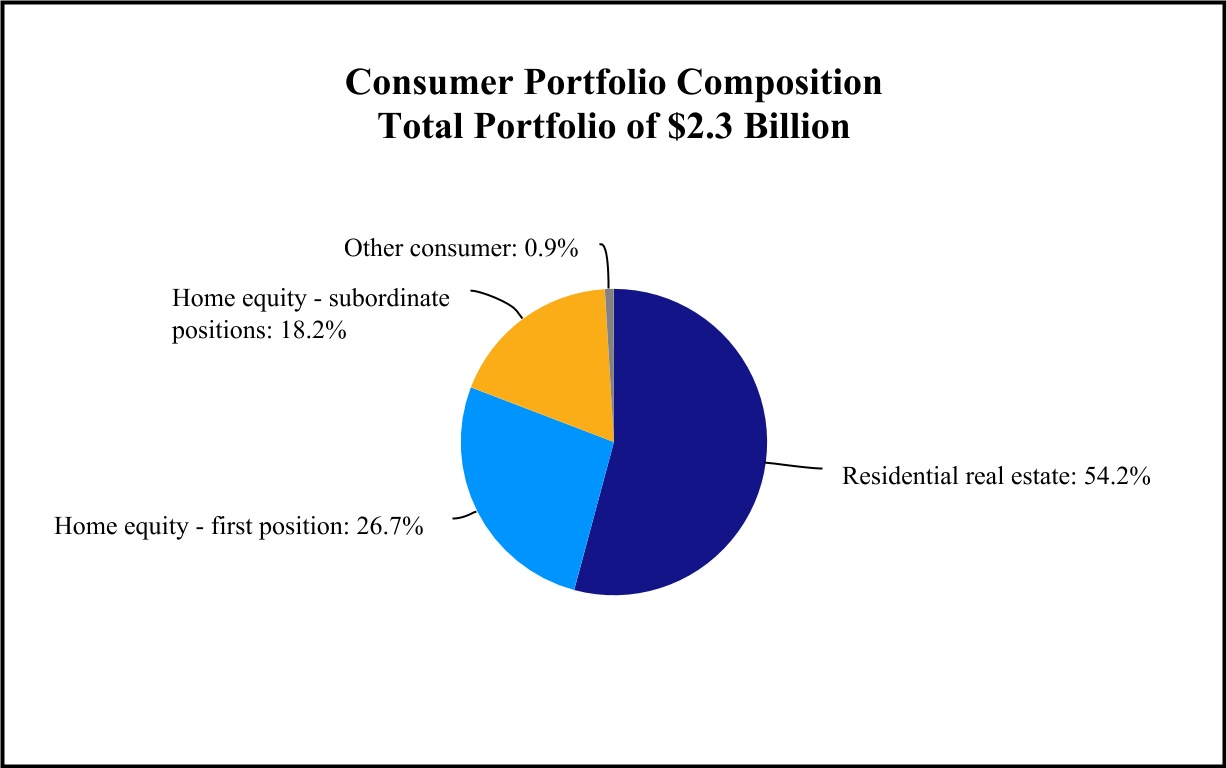
Asset Quality The Company continually monitors the asset quality of the loan portfolio using all available information. Based on this assessment, loans demonstrating certain payment issues or other weaknesses may be categorized as delinquent, nonperforming and/or put on nonaccrual status. Additionally, inIn the course of resolving such loans, the Company may choose to restructure the contractual terms of certain loans to match the borrower’s ability to repay the loan based on their current financial condition. If a restructured loan meets certain criteria, it may be categorized as a troubled debt restructuring ("TDR"). In addition, the Company has been offering need-based payment relief options for commercial and small business loans, residential mortgages, and home equity loans and lines of credit in response to the COVID-19 pandemic. In accordance with the Coronavirus Aid, Relief and Economic Security Act ("CARES Act"), these modifications are not accounted for as TDRs or reflected as delinquent or non-accrual loans if the borrower was in compliance with the loan terms as of December 31, 2019.
Delinquency The Company’s philosophy toward managing its loan portfolios is predicated upon careful monitoring, which stresses early detection and response to delinquent and default situations. The Company seeks to make arrangements to resolve any delinquent or default situation over the shortest possible time frame. Generally, the Company requires that a delinquency notice be mailed to a borrower upon expiration of a grace period (typically no longer than 15 days beyond the due date). Reminder notices may be sent and telephone calls may be made prior to the expiration of the grace period. If the delinquent status is not resolved within a reasonable time frame following the mailing of a delinquency notice, the Bank’s personnel charged with managing its loan portfolios contacts the borrower to ascertain the reasons for delinquency and the prospects for payment. Any subsequent actions taken to resolve the delinquency will depend upon the nature of the loan and the length of time that the loan has been delinquent. The borrower’s needs are considered as much as reasonably possible without jeopardizing the Bank’s position. A late charge is usually assessed on loans upon expiration of the grace period.
Nonaccrual Loans As a general rule, loans more than 90 days or more past due with respect to principal or interest are classified as nonaccrual loans. However, certain loans that are more than 90 days or more past due may be kept on an accruing status if the loans are well secured and/orand in the process of collection. The Company may also put a junior lien mortgage on nonaccrual status as a result of delinquency with respect to the first position, which is held by another financial institution, while the junior lien is currently
performing. Income accruals are suspended on all nonaccrual loans and all previously accrued and uncollected interest is reversed against current income. A loan remains on nonaccrual status until it becomes current with respect to principal and interest (and in certain instances remains current for up to six months), the loan is liquidated, or when the loan is determined to be uncollectible and is charged-off against the allowance for credit losses.
Troubled Debt Restructurings In the course of resolving problem loans, the Company may choose to restructure the contractual terms of certain loans. The Company attempts to work out an alternative payment schedule with the borrower in order to avoid or cure a default. Loans that are modified are reviewed by the Company to identify if a TDR has occurred, which is when, for economic or legal reasons related to a borrower’s financial difficulties, the Bank grants a concession to the borrower that it would not otherwise consider. Terms may be modified to fit the ability of the borrower to repay in line with its current financial status and the restructuring of the loan may include adjustments to interest rates, extensions of maturity, consumer loans where the borrower's obligations have been effectively discharged through Chapter 7 Bankruptcy and the borrower has not reaffirmed the debt to the Bank, and other actions intended to minimize economic loss and avoid foreclosure or repossession of collateral. If such efforts by the Bank do not result in satisfactory performance, the loan is referred to legal counsel, at which time foreclosure proceedings are initiated. At any time prior to a sale of the property at foreclosure, the Bank may terminate foreclosure proceedings if the borrower is able to work out a satisfactory payment plan.
It is the Company’s policy to have any restructured loans which are on nonaccrual status prior to being modified remain on nonaccrual status for six months, subsequent to being modified, before management considers their return to accrual status. If the restructured loan is on accrual status prior to being modified, it is reviewed to determine if the modified loan should remain on accrual status. Loans that are considered TDRs are classified as performing, unless they are on nonaccrual status or greater thanare delinquent for 90 days delinquent.or more. Loans classified as TDRs remain classified as such for the life of the loan, except in limited circumstances, when it may be determined that the borrower is performing under modified terms and the restructuring agreement specified an interest rate greater than or equal to an acceptable market rate for a comparable new loan at the time of the restructuring.
Purchased Credit Deteriorated Loans Purchased Credit Deteriorated ("PCD") loans are acquired loans which have shown a more-than-insignificant deterioration in credit quality since origination. PCD loans are recorded at amortized cost with an allowance for credit losses recorded upon purchase, as appropriate. PCD loans are not subject to the same classification as nonaccrual as originated loans.
Nonperforming Assets Nonperforming assets are typically comprised of nonperforming loans and other real estate owned. Nonperforming loans consist of nonaccrual loans and loans that are more than 90 days or more past due but still accruing interest.
The following table sets forth information regarding nonperforming assets held by the Company at the dates indicated:
Table 4 - Nonperforming Assets
| | | | | | | | | | | | | | | | | |
| March 31
2021 | | December 31
2020 | | March 31
2020 |
| | (Dollars in thousands) |
| Loans accounted for on a nonaccrual basis | | | | | |
| Commercial and industrial | $ | 29,785 | | | $ | 34,729 | | | $ | 21,435 | |
| Commercial real estate | 9,635 | | | 10,195 | | | 4,949 | |
| Small business | 660 | | | 825 | | | 450 | |
| Residential real estate | 13,392 | | | 15,528 | | | 14,502 | |
| Home equity | 5,592 | | | 5,427 | | | 6,571 | |
| Other consumer | 136 | | | 156 | | | 108 | |
| Total (1) | $ | 59,200 | | | $ | 66,860 | | | $ | 48,015 | |
| Loans past due 90 days or more but still accruing | | | | | |
| | | | | |
| | | | | |
| | | | | |
| Other consumer | 1 | | | 1 | | | 25 | |
| Total | $ | 1 | | | $ | 1 | | | $ | 25 | |
| Total nonperforming loans | $ | 59,201 | | | $ | 66,861 | | | $ | 48,040 | |
| | | | | |
| Other real estate owned | — | | | — | | | — | |
| | | | | |
| Total nonperforming assets | $ | 59,201 | | | $ | 66,861 | | | $ | 48,040 | |
| Nonperforming loans as a percent of gross loans | 0.64 | % | | 0.71 | % | | 0.54 | % |
| Nonperforming assets as a percent of total assets | 0.43 | % | | 0.51 | % | | 0.40 | % |
|
| | | | | | | | | | | |
| | March 31
2020 | | December 31
2019 | | March 31
2019 |
| | (Dollars in thousands) |
| Loans accounted for on a nonaccrual basis | | | | | |
| Commercial and industrial | $ | 21,435 |
| | $ | 22,574 |
| | $ | 25,879 |
|
| Commercial real estate | 4,949 |
| | 3,016 |
| | 1,539 |
|
| Small business | 450 |
| | 311 |
| | 180 |
|
| Residential real estate | 14,502 |
| | 13,360 |
| | 8,517 |
|
| Home equity | 6,571 |
| | 6,570 |
| | 7,202 |
|
| Other consumer | 108 |
| | 61 |
| | 9 |
|
| Total (1) | $ | 48,015 |
| | $ | 45,892 |
| | $ | 43,326 |
|
| Loans past due 90 days or more but still accruing | | | | | |
| Commercial real estate (2) | — |
| | 218 |
| | — |
|
| Residential real estate (2) | — |
| | 1,652 |
| | — |
|
| Home equity (2) | — |
| | 265 |
| | — |
|
| Other consumer | 25 |
| | 22 |
| | 5 |
|
| Total | $ | 25 |
| | $ | 2,157 |
| | $ | 5 |
|
| Total nonperforming loans | $ | 48,040 |
| | $ | 48,049 |
| | $ | 43,331 |
|
| Other real estate owned | — |
| | — |
| | — |
|
| Total nonperforming assets | $ | 48,040 |
| | $ | 48,049 |
| | $ | 43,331 |
|
| Nonperforming loans as a percent of gross loans | 0.54 | % | | 0.54 | % | | 0.62 | % |
| Nonperforming assets as a percent of total assets | 0.40 | % | | 0.42 | % | | 0.48 | % |
| |
(1) | Inclusive of TDRs on nonaccrual status of $23.8 million, $24.8 million, and $28.9 million at March 31, 2020, December 31, 2019, and March 31, 2019, respectively. |
| |
(2) | Represents purchased credit impaired loans that were accruing interest due to expectation of future cash collections. |
(1)Inclusive of TDRs on nonaccrual status of $21.2 million, $22.2 million, and $23.8 million at March 31, 2021, December 31, 2020, and March 31, 2020, respectively.
The following table summarizes the changes in nonperforming assets for the periods indicated:
Table 5 - Activity in Nonperforming Assets
| | | | | | | | | | | | | | | |
| Three Months Ended |
| March 31 |
| 2021 | | |
| Three Months Ended | | |
| March 31
2021 | | March 31
2020 | | | | |
| (Dollars in thousands) |
| Nonperforming assets beginning balance | $ | 66,861 | | | $ | 48,049 | | | | | |
| New to nonperforming | 2,359 | | | 6,515 | | | | | |
| | | | | | | |
| Loans charged-off | (3,686) | | | (734) | | | | | |
| Loans paid-off | (4,025) | | | (5,079) | | | | | |
| | | | | | | |
| Loans restored to performing status | (2,559) | | | (561) | | | | | |
| | | | | | | |
| | | | | | | |
| | | | | | | |
| | | | | | | |
| | | | | | | |
| | | | | | | |
| Other | 251 | | | (150) | | | | | |
| Nonperforming assets ending balance | $ | 59,201 | | | $ | 48,040 | | | | | |
|
| | | | | | | |
| | Three Months Ended |
| | March 31
2020 | | March 31
2019 |
| | (Dollars in thousands) |
| Nonperforming assets beginning balance | $ | 48,049 |
| | $ | 45,418 |
|
| New to nonperforming | 6,515 |
| | 1,857 |
|
| Loans charged-off | (734 | ) | | (559 | ) |
| Loans paid-off | (5,079 | ) | | (3,171 | ) |
| Loans restored to performing status | (561 | ) | | (232 | ) |
| Other | (150 | ) | | 18 |
|
| Nonperforming assets ending balance | $ | 48,040 |
| | $ | 43,331 |
|
The following table sets forth information regarding troubled debt restructured loans as of the dates indicated:
Table 6 - Troubled Debt Restructurings
| | | | | | | | | | | | | | | | | |
| March 31
2021 | | December 31
2020 | | March 31
2020 |
| | (Dollars in thousands) |
| Performing troubled debt restructurings | $ | 20,262 | | | $ | 16,983 | | | $ | 18,129 | |
| Nonaccrual troubled debt restructurings | 21,167 | | | 22,209 | | | 23,842 | |
| Total | $ | 41,429 | | | $ | 39,192 | | | $ | 41,971 | |
| Performing troubled debt restructurings as a % of total loans | 0.22 | % | | 0.18 | % | | 0.20 | % |
| Nonaccrual troubled debt restructurings as a % of total loans | 0.23 | % | | 0.24 | % | | 0.27 | % |
| Total troubled debt restructurings as a % of total loans | 0.45 | % | | 0.42 | % | | 0.47 | % |
|
| | | | | | | | | | | |
| | March 31
2020 | | December 31
2019 | | March 31
2019 |
| | (Dollars in thousands) |
| Performing troubled debt restructurings | $ | 18,129 |
| | $ | 19,599 |
| | $ | 23,053 |
|
| Nonaccrual troubled debt restructurings | 23,842 |
| | 24,766 |
| | 28,908 |
|
| Total | $ | 41,971 |
| | $ | 44,365 |
| | $ | 51,961 |
|
| Performing troubled debt restructurings as a % of total loans | 0.20 | % | | 0.22 | % | | 0.33 | % |
| Nonaccrual troubled debt restructurings as a % of total loans | 0.27 | % | | 0.28 | % | | 0.41 | % |
| Total troubled debt restructurings as a % of total loans | 0.47 | % | | 0.50 | % | | 0.74 | % |
In addition, the Company has been offering needs based payment relief options for commercial and small business loans, residential mortgages, and home equity loans and lines of credit in response to the COVID-19 pandemic. These modifications will not be accounted as TDRs if the borrower was in compliance with the terms of their loans as of December 31, 2020. For further information regarding these modifications see
Note 16, "Subsequent Events" within Condensed Notes to Consolidated Financial Statements included in Item 1 hereof .
The following table summarizes changes in TDRs for the periods indicated:
Table 7 - Activity in Troubled Debt Restructurings
| | | | | | | | | | | | | | | |
| | | Three Months Ended |
| | | | | March 31
2021 | | March 31
2020 |
| | | | | | (Dollars in thousands) |
| TDRs beginning balance | | | | | $ | 39,192 | | | $ | 44,365 | |
| New to TDR status | | | | | 3,836 | | | 185 | |
| | | | | | | |
| Paydowns | | | | | (1,599) | | | (2,557) | |
| Charge-offs | | | | | — | | | (22) | |
| TDRs ending balance | | | | | $ | 41,429 | | | $ | 41,971 | |
|
| | | | | | | |
| | Three Months Ended |
| | March 31
2020 | | March 31
2019 |
| | (Dollars in thousands) |
| TDRs beginning balance | $ | 44,365 |
| | $ | 53,197 |
|
| New to TDR status | 185 |
| | 225 |
|
| Paydowns | (2,601 | ) | | (1,461 | ) |
| Charge-offs | 22 |
| | — |
|
| TDRs ending balance | $ | 41,971 |
| | $ | 51,961 |
|
Income accruals are suspended on all nonaccrual loans and all previously accrued and uncollected interest is reversed against current income. The table below shows interest income that was recognized or collected on all nonaccrual loans and TDRs as offor the datesperiods indicated:
Table 8 - Interest Income - Nonaccrual Loans and Troubled Debt Restructurings
| | | | Three Months Ended | | | Three Months Ended |
| | March 31
2020 | | March 31
2019 | | | March 31
2021 | | March 31
2020 |
| | (Dollars in thousands) | | | (Dollars in thousands) |
| The amount of incremental gross interest income that would have been recorded if nonaccrual loans had been current in accordance with their original terms | $ | 709 |
| | $ | 565 |
| The amount of incremental gross interest income that would have been recorded if nonaccrual loans had been current in accordance with their original terms | | $ | 917 | | | $ | 709 | |
| The amount of interest income on nonaccrual loans and performing TDRs that was included in net income | $ | 1,041 |
| | $ | 1,271 |
| The amount of interest income on nonaccrual loans and performing TDRs that was included in net income | | $ | 264 | | | $ | 326 | |
Potential problem loans are any loans which are not included in nonaccrual or nonperforming loans, where known information about possible credit problems of the borrowers causes management to have concerns as to the ability of such borrowers to comply with present loan repayment terms. At March 31, 2020,2021, there were 11087 relationships, with an aggregate balance of $186.0$141.2 million, deemed to be potential problem loans. These potential problem loans continued to perform with respect to payments. Management actively monitors these loans and strives to minimize any possible adverse impact to the Company. A portion of the potential problem loans identified by management were granted a deferral during 2020 in accordance with the relief options offered in response to the COVID-19 pandemic. If applicable, these potential problem loans with an active deferral as of March 31, 2021 have been included in the table below.
In addition and
As previously noted, the Company has been offering need-based payment relief options to its customers in response to the COVID-19 pandemic, primarily in the form of payment deferrals. Loans that were modified are not accounted for as TDRs or reflected as delinquent or nonaccrual loans if the borrower was in compliance with their loan terms as of December 31, 2019. The following table summarizes active deferrals by modification type as of March 31, 2021:
Table 9 - Deferrals by Modification Type
| | | | | | | | | | | | | | | | | | | | | | | | | | | | | | | | | | | |
| Deferral of Principal and Interest | | Deferral of Principal Only | | Deferral of Interest Only | | Total Deferrals | | Total Portfolio | | % Deferral |
| (Dollars in thousands) | | |
| Commercial and industrial | $ | 2,300 | | | $ | 1,636 | | | $ | 1,765 | | | $ | 5,701 | | | $ | 2,086,671 | | | 0.3 | % |
| Commercial real estate (1) | 10,425 | | | 203,319 | | | — | | | 213,744 | | | 4,693,979 | | | 4.6 | % |
| Business Banking | 294 | | | 645 | | | — | | | 939 | | | 174,211 | | | 0.5 | % |
| Residential real estate | 87 | | | — | | | — | | | 87 | | | 1,241,789 | | | — | % |
| Home equity | 153 | | | — | | | — | | | 153 | | | 1,028,495 | | | — | % |
| Consumer | — | | | — | | | — | | | — | | | 21,546 | | | — | % |
| Total active deferrals as of March 31, 2021 | $ | 13,259 | | | $ | 205,600 | | | $ | 1,765 | | | $ | 220,624 | | | $ | 9,246,691 | | | 2.4 | % |
(1) Balances include commercial construction deferrals.
Additionally, as a result of the COVID-19 pandemic, management has also enhanced monitoring of loan portfolios in certain industries considered tothat have been or could be at an elevated "at risk".potentially highly impacted. While management is unable to predict the full impact of all industries affected by the COVID-19 pandemic, there are assumptions as to which industries will be more impacted due to social distancing and other measures put in place, as well as the duration of these restrictions. Management has identified approximately $1.7$1.3 billion of loans within potentially highly impacted industries, such as Accommodations, Food Services, Retail Trade, Health Care & Social Assistance, Other Services (except Public Administration), and Arts, EntertainmentsEntertainment & Recreation, Transportation & Warehousing, as well as Educational Services.Recreation. Loss exposure within these industries is mitigated by a number of factors such as collateral values, loan-to-value ratios, and other key indicators, however, some degree of credit loss is expected and has been incorporated into the first quarter allowance for loancredit loss recognition under the CECL model.
The table below provides total outstanding balances of commercial loans as of March 31, 2020the dates indicated within industries that could potentiallymanagement has deemed to be morehighly impacted by the COVID-19 pandemic:
Table 10 - Industries Highly Impacted By COVID-19 - Details
| | | | | |
| March 31, 2021 |
| (Dollars in thousands) |
| Accommodations | |
| Balance | $ | 402,259 | |
| Average borrower loan size | $ | 4,193 | |
| % secured by real estate | 99.8 | % |
| Weighted average loan to value | 54.3 | % |
| Other information: | |
–The accommodation portfolio consists of 68 properties representing a combination of flagged (59%) and non-flagged (41%) hotels, motels and inns. |
–Loans secured by hotel properties deemed to be located in areas of leisure comprise $167.5 million, or 42% of the hotel portfolio. |
–Approximately 89% of the balances outstanding are secured by properties located within the six New England states with the largest concentration in Massachusetts (58%). |
| |
| Food Services | |
| Balance | $ | 135,480 | |
| Average borrower loan size | $ | 363 | |
| % secured by real estate | 69.4 | % |
| Weighted average loan to value | 50.4 | % |
| Other information: | |
–The food services portfolio includes full-service restaurants (60%), limited service restaurants and fast food (38%), and other types of food service (caterers, bars, mobile food service 2%). |
| |
| Retail Trade | |
| Balance | $ | 530,544 | |
| Average borrower loan size | $ | 492 | |
| % secured by real estate | 42.7 | % |
| Weighted average loan to value | 56.6 | % |
| Other information: | |
–The retail trade portfolio consists broadly of food and beverage stores (43%), motor vehicle and parts dealers (28%), and gasoline stations (14%). All other retailers account for 15% of the current outstanding balance. |
–Collateral for these loans varies and may consist of real estate, motor vehicles inventories, other types of inventories and general business assets. |
| |
| Other Services (except Public Administration) | |
| Balance | $ | 147,968 | |
| | | | | |
| Average borrower loan size | $ | 259 | |
| % secured by real estate | 51.0 | % |
| Weighted average loan to value | 50.4 | % |
| Other information: | |
–The other services portfolio consists of various for-profit and not-for-profit services diversified across religious, civic and social service organizations (41%), repair and maintenance business (31%) and personal services, including car washes, beauty salons, laundry services, funeral homes, pet care and other types of services (28%). |
| |
| |
| |
| Arts, Entertainment, and Recreation | |
| Balance | $ | 99,919 | |
| Average borrower loan size | $ | 805 | |
| % secured by real estate | 83.9 | % |
| Weighted average loan to value | 52.9 | % |
| Other information: | |
–Amusement, gambling and recreational industries make up a majority of this category (94%) and include amusement/theme parks, bowling centers, fitness centers, golf courses, marinas, and other recreational industries. Other industries including museums, performing arts, and spectator sports account for the remaining outstanding balances (6%). |
| |
Table 9 - Potentially Impacted COVID-19 Industries
|
| | | | | | | | |
| | Balance | % of total Loans | % Secured by Real Estate | Additional commentary: |
| (Dollars in thousands) |
| Accommodation | $ | 411,384 |
| 4.6 | % | 98.0 | % | The accommodation portfolio consists of 70 properties representing a combination of flagged (60%) and non-flagged hotels, motels and inns (40%). Approximately 90% of the balances outstanding are secured by properties located within New England states with the largest concentration in Massachusetts (61%). The average borrower loan size is $4.1 million and the portfolio balance weighted average loan-to-value is 54.8%. |
| Food Services | 155,415 |
| 1.7 | % | 61.3 | % | The food services portfolio includes full-service restaurants (67%), limited service restaurants including fast food (30%) and other types of food service (caterers, bars, mobile food service, 3%). The average borrower loan size is approximately $388 thousand and approximately 61% of the loan balances outstanding are secured by real estate assets with a portfolio balance weighted average loan-to-value of 46.7%. |
| Retail Trade | 526,711 |
| 5.9 | % | 43.1 | % | The Retail Trade portfolio consists broadly of food and beverage stores (39%), motor vehicle and parts dealers (29%), gasoline stations (13%), non-store retail fuel dealers (7%), furniture and home furnishing stores (6%) and other types of retailers (7%). Collateral for these loans varies and may consist of real estate, motor vehicles inventories, other types of inventories and general business assets. Approximately 43% of the Retail Trade portfolio is secured by real estate with a portfolio balance weighted average loan-to-value of 54.0%. The average borrower loan size is $466 thousand. |
|
| | | | | | | | |
| Health Care and Social Assistance | 206,484 |
| 2.3 | % | 69.7 | % | The healthcare portfolio consists of nursing and residential care facilities (38%), ambulatory care (29%), social assistance (19%) and Hospitals (14%). Approximately 70% of this portfolio is secured by real estate with a portfolio balance weighted average loan-to-value of 46.9%. The average borrower loan size in the healthcare portfolio is $652 thousand. |
| Other Services (except Public Administration) | 160,159 |
| 1.8 | % | 49.1 | % | The other services portfolio consists of various for-profit and not-for-profit services diversified across religious, civic and social service organizations (45%), repair and maintenance businesses (29%) and personal services, including car washes, beauty salons, laundry services, funeral homes, pet care and other types of services (26%). Approximately 49% of the ‘other services’ portfolio is secured by real estate with a portfolio balance weighted average loan-to-value ratio of 46.5%. The average borrower loan size is $272 thousand. |
| Arts, Entertainment, and Recreation | 88,202 |
| 1.0 | % | 82.8 | % | The Arts Entertainment and Recreation portfolio segment includes fitness and recreational sports centers (30%), amusement and theme parks (18%), Bowling centers (12%), Golf Courses (11%), marinas (9%) and other types of recreation (20%). Real estate secures approximately 83% of balances outstanding at a portfolio balance weighted average loan-to-value of 44.0%. The average borrower loan size is $737 thousand. |
| Transportation and Warehousing | 84,805 |
| 1.0 | % | 56.0 | % | The transportation and Warehousing portfolio consists of warehousing and storage (52%), transit, ground passenger transportation and truck transportation (35%) and other transportation related activities (13%). The average borrower loan size is $611 thousand. Approximately 56% of the portfolio is secured by real estate with a portfolio balance weighted average loan-to-value of 52.2%. The average borrower loan size is $611 thousand. |
| Educational Services | 44,922 |
| 0.5 | % | 89.5 | % | The Educational Services portfolio consists of elementary and secondary schools (48%), colleges and universities (35%) and other types of for profit and not-for-profit educational and training schools (17%). Real estate collateral secures 89% of the outstanding balances in this portfolio segment with a portfolio balance weighted average loan-to-value of 31.8%. The average borrower loan size is $598 thousand. |
| Total | $ | 1,678,082 |
| 18.8 | % | 66.1 | % | |
| | | | | |
Allowance for Credit Losses The allowance for credit losses is maintained at a level that management considers appropriate to provide for the Company's current estimate of expected lifetime credit losses on loans measured at amortized cost. The allowance is increased by providing for credit losses through a charge to expense and by credits for recoveries of loans previously charged-off and is reduced by loans being charged-off.
In accordance with the CECL methodology, adopted January 1, 2020, the Company estimates credit losses for financial assets on a collective basis for loans sharing similar risk characteristics using a quantitative model combined with an assessment of certain qualitative factors designed to address forecast risk and model risk inherent in the quantitative model output. The model estimates expected credit losses using loan level data over the contractual life of the exposure, considering the effect of prepayments. Economic forecasts are incorporated into the estimate over a reasonable and supportable forecast period of one year, beyond which is a reversion to the Company's historical long-run average for a period of 6 months. The Company's qualitative assessment is structured based upon nine environmental factors impacting the expected risk of loss within the loan portfolio. Loans that no do
not share similar risk characteristics with any pools of assets are subject to individual assessment and are removed from the collectively assessed pools to avoid double counting. For the loans that will be individually assessed, the Company uses either a discounted cash flow (“DCF”) approach or a fair value of collateral approach. The latter approach is used for loans deemed to be collateral dependent or when foreclosure is probable.
The Company's adoptionallowance for credit losses of CECL had$107.5 million at March 31, 2021 represents a minimal impact to the allowance asdecrease of $5.8 million, or 5.2% compared to December 31, 2020. The Company recorded a release of provision for credit losses of $2.5 million during the previous incurred loss methodology.first quarter of 2021, reflecting improvements in asset quality metrics and overall macro-economic assumptions, along with lower loan levels.
While management is unable to know with certainty the direct, indirect, and future impacts of the COVID-19 pandemic, it is expected that the pandemic will have a material adverse impact on future losses across a broad range of loan segments. As of March 31, 2020,such, the allowance for credit losses totaled $92.4 million,at March 31, 2021 reflects increased reserve allocations to loan segments that are considered to have elevated loss exposure associated with the COVID-19 pandemic. In addition, management continues to reflect conservative assumptions, such as that the federal funds rates will remain near 0% through mid-2025 and that recent stimulus will be ineffective as consumers are reluctant to spend the funds, and some concerns about the speed of wide spread vaccine administration, the efficacy of the vaccines and the possibility for resurgences of COVID-19 or 1.04%other variants of total loans, as compared to $67.7 million, or 0.76% of total loans, at December 31, 2019. the virus.
The balance of allowance for credit losses as of March, 31, 2020, represents an increase of $24.6 million, or 36.3%, in comparisoncontinued to the implementation balances at January 1, 2020. This increase in the allowancebe qualitatively adjusted upward during the first quarter was primarily driven by forecasted credit deterioration due to the ongoing COVID-19 pandemic, which resultedof 2021, in the Company recording a $25.0 million provision for credit losses in order to reserve for current expected credit losses in the Company's loan portfolio. This forecast was adjusted to use a more severe outlook at March 31, 2020 as compared to the baseline forecast that was used to calculate opening balances on January 1, 2020. In determining the Company's allowance for credit losses as of March 31, 2020, the economic outlook included the following assumptions related to the COVID-19 pandemic:
Assumes the COVID-19 crisis will persist and continue to meaningfully impact the economy
Unemployment rate peaks at 16.9% in Q2 2020 and remains elevated throughout the remainder of the year
50% of industries will be on lock down throughout Q2 2020 creating additional downward pressure on spending
No sustained economic recovery expected until Q4 2021
Federal funds rates will remain at or near 0% for the foreseeable future.
In addition, the provision was qualitatively adjusted upward to ensure coverage for these "at risk"highly impacted relationships as a resultmanagement performed detailed analysis consisting of thisa review of maximum levels of historic loss given default ("LGD") and stressed probability of default ("PD") scenarios for loans that are withingwere deemed to be more at risk within the industries that are potentiallyhighly impacted by the COVID-19 pandemic. In addition to these industry exposures, qualitative adjustments were also made in order to provide coverage over the additional risk of loss
attributable to collateral values associated with non-owner occupied real estate with significant retail tenant exposure, as well as home equity loans within a junior lien position.
Refer to
Note 4, "Loans, Allowance for Credit Losses and Credit Quality"
The following table summarizes changes in the allowance for credit losses and other selected statistics for the periods presented:
Table 1011 - Summary of Changes in the Allowance for Credit Losses
| | | | | | | | | | | | | | | | | | | | | | | | | | | | | |
| Three Months Ended |
| March 31
2021 | | December 31
2020 | | September 30
2020 | | June 30
2020 | | March 31
2020 |
| | (Dollars in thousands) |
| Average total loans | $ | 9,343,769 | | | $ | 9,396,192 | | | $ | 9,375,522 | | | $ | 9,311,877 | | | $ | 8,871,346 | |
| Allowance for credit losses, beginning of period | $ | 113,392 | | | $ | 115,625 | | | $ | 112,176 | | | $ | 92,376 | | | $ | 67,740 | |
| Cumulative effect accounting adjustment (1) | — | | | — | | | — | | | — | | | (1,137) | |
| Cumulative effect accounting adjustment (2) | — | | | — | | | — | | | — | | | 1,157 | |
| Charged-off loans | | | | | | | | | |
| Commercial and industrial | 3,331 | | | 2,124 | | | 185 | | | — | | | — | |
| Commercial real estate | — | | | — | | | 3,885 | | | — | | | — | |
| Commercial construction | — | | | — | | | — | | | — | | | — | |
| Small business | 66 | | | 186 | | | 49 | | | 36 | | | 109 | |
| Residential real estate | — | | | 105 | | | — | | | — | | | — | |
| Home equity | — | | | — | | | — | | | 4 | | | 138 | |
| Other consumer | 289 | | | 283 | | | 185 | | | 670 | | | 487 | |
| Total charged-off loans | 3,686 | | | 2,698 | | | 4,304 | | | 710 | | | 734 | |
| Recoveries on loans previously charged-off | | | | | | | | | |
| Commercial and industrial | 64 | | | 242 | | | 1 | | | 4 | | | 42 | |
| Commercial real estate | 57 | | | — | | | 9 | | | — | | | — | |
| Commercial construction | — | | | — | | | — | | | — | | | — | |
| Small business | 11 | | | 25 | | | 2 | | | 3 | | | 3 | |
| Residential real estate | 1 | | | — | | | 1 | | | — | | | 1 | |
| Home equity | 13 | | | 36 | | | 21 | | | 95 | | | 58 | |
| Other consumer | 197 | | | 162 | | | 219 | | | 408 | | | 246 | |
| Total recoveries | 343 | | | 465 | | | 253 | | | 510 | | | 350 | |
| Net loans charged-off (recovered) | | | | | | | | | |
| Commercial and industrial | 3,267 | | | 1,882 | | | 184 | | | (4) | | | (42) | |
| Commercial real estate | (57) | | | — | | | 3,876 | | | — | | | — | |
| Commercial construction | — | | | — | | | — | | | — | | | — | |
| Small business | 55 | | | 161 | | | 47 | | | 33 | | | 106 | |
| Residential real estate | (1) | | | 105 | | | (1) | | | — | | | (1) | |
| Home equity | (13) | | | (36) | | | (21) | | | (91) | | | 80 | |
| Other consumer | 92 | | | 121 | | | (34) | | | 262 | | | 241 | |
| Total net loans charged-off | 3,343 | | | 2,233 | | | 4,051 | | | 200 | | | 384 | |
| Provision for credit losses | (2,500) | | | — | | | 7,500 | | | 20,000 | | | 25,000 | |
| Total allowance for credit losses, end of period | $ | 107,549 | | | $ | 113,392 | | | $ | 115,625 | | | $ | 112,176 | | | $ | 92,376 | |
| Net loans charged-off as a percent of average total loans (annualized) | 0.15 | % | | 0.09 | % | | 0.17 | % | | 0.01 | % | | 0.02 | % |
| Allowance for credit losses as a percent of total loans | 1.16 | % | | 1.21 | % | | 1.23 | % | | 1.20 | % | | 1.04 | % |
| Allowance for credit losses as a percent of nonperforming loans | 181.67 | % | | 169.59 | % | | 117.95 | % | | 229.80 | % | | 192.29 | % |
|
| | | | | | | | | | | | | | | | | | | |
| | Three Months Ended |
| | March 31
2020 | | December 31
2019 | | September 30
2019 | | June 30
2019 | | March 31
2019 |
| | (Dollars in thousands) |
| Average total loans | $ | 8,871,346 |
| | $ | 8,877,072 |
| | $ | 8,897,794 |
| | $ | 9,046,591 |
| | $ | 6,935,927 |
|
| Allowance for credit losses, beginning of period | $ | 67,740 |
| | $ | 66,942 |
| | $ | 65,960 |
| | $ | 65,140 |
| | $ | 64,293 |
|
| Cumulative effect accounting adjustment (1) | (1,137 | ) |
| — |
|
| — |
|
| — |
|
| — |
|
| Cumulative effect accounting adjustment (2) | 1,157 |
|
| — |
|
| — |
|
| — |
|
| — |
|
| Charged-off loans | | | | | | | | | |
| Commercial and industrial | — |
| | 244 |
| | — |
| | — |
| | — |
|
| Commercial real estate | — |
| | 2,532 |
| | 82 |
| | — |
| | — |
|
| Small business | 109 |
| | 190 |
| | 125 |
| | 49 |
| | 145 |
|
| Home equity | 138 |
| | 28 |
| | 28 |
| | 71 |
| | 113 |
|
| Other consumer | 487 |
| | 473 |
| | 472 |
| | 352 |
| | 301 |
|
| Total charged-off loans | 734 |
| | 3,467 |
| | 707 |
| | 472 |
| | 559 |
|
| Recoveries on loans previously charged-off | | | | | | | | | |
| Commercial and industrial | 42 |
| | 4 |
| | 1,003 |
| | — |
| | 124 |
|
| Commercial real estate | — |
| | — |
| | 106 |
| | 13 |
| | 33 |
|
| Small business | 3 |
| | 14 |
| | 61 |
| | 20 |
| | 27 |
|
| Residential real estate | 1 |
| | 1 |
| | 140 |
| | — |
| | 1 |
|
| Home equity | 58 |
| | 40 |
| | 194 |
| | 18 |
| | 66 |
|
| Other consumer | 246 |
| | 206 |
| | 185 |
| | 241 |
| | 155 |
|
| Total recoveries | 350 |
| | 265 |
| | 1,689 |
| | 292 |
| | 406 |
|
| Net loans charged-off (recovered) | | | | | | | | | |
| Commercial and industrial | (42 | ) | | 240 |
| | (1,003 | ) | | — |
| | (124 | ) |
| Commercial real estate | — |
| | 2,532 |
| | (24 | ) | | (13 | ) | | (33 | ) |
| Small business | 106 |
| | 176 |
| | 64 |
| | 29 |
| | 118 |
|
| Residential real estate | (1 | ) | | (1 | ) | | (140 | ) | | — |
| | (1 | ) |
| Home equity | 80 |
| | (12 | ) | | (166 | ) | | 53 |
| | 47 |
|
| Other consumer | 241 |
| | 267 |
| | 287 |
| | 111 |
| | 146 |
|
| Total net loans (recovered) charged-off | 384 |
| | 3,202 |
| | (982 | ) | | 180 |
| | 153 |
|
| Provision for credit losses | 25,000 |
| | 4,000 |
| | — |
| | 1,000 |
| | 1,000 |
|
| Total allowance for credit losses, end of period | $ | 92,376 |
| | $ | 67,740 |
| | $ | 66,942 |
| | $ | 65,960 |
| | $ | 65,140 |
|
| Net loans (recovered)/charged-off as a percent of average total loans (annualized) | 0.02 | % | | 0.14 | % | | (0.04 | )% | | 0.01 | % | | 0.01 | % |
| Allowance for credit losses as a percent of total loans | 1.04 | % | | 0.76 | % | | 0.75 | % | | 0.74 | % | | 0.93 | % |
| Allowance for credit losses as a percent of nonperforming loans | 192.29 | % | | 140.98 | % | | 146.47 | % | | 145.63 | % | | 150.33 | % |
| |
(1) | Represents adjustment needed to reflect the cumulative day one impact pursuant to the Company's adoption of Accounting Standards Update 2016-13. The adjustment represents a $1.1 million decrease to the allowance attributable to the the change in accounting methodology for estimating the allowance for credit losses resulting from the Company's adoption of the standard. |
(2)Represents adjustment needed to reflect the day one reclassification of the Company's PCI loan balances to PCD and the associated gross-up, pursuant to the adoption of Accounting Standards Update 2016-13. The adjustment represents a $1.2 million increase to the allowance resulting from the day one reclassification.
| |
(2) | Represents adjustment needed to reflect the day one re-class of the Company's PCI loan balances to PCD and the associated gross-up, pursuant to the adoption of Accounting Standards Update 2016-13. The adjustment represents a $1.2 million increase to the allowance resulting from the day one re-class. |
For purposes of the allowance for credit losses, management segregates the loan portfolio into the portfolio segments detailed in the table below. The allocation of the allowance for credit losses is made to each loan category using the analytical techniques and estimation methods described herein.in this Report. While these amounts represent management’s best estimate of credit losses at the evaluation dates, they are not necessarily indicative of either the categories in which actual losses may occur or the extent of such actual losses that may be recognized within each category. Each of these loan categories possessespossess unique risk characteristics that are considered when determining the appropriate level of allowance for each segment. The Company began estimating its allowance for credit losses in accordance with the CECL methodology as of January 1, 2020, while prior period amounts were estimated using the incurred loss methodology prescribed by previously applicable accounting guidance. The total allowance is available to absorb losses from any segment of the loan portfolio.
The following table sets forth the allocation of the allowance for credit losses by loan category at the dates indicated:
Table 1112 - Summary of Allocation of Allowance for Credit Losses
| | | | | | | | | | | | | | | | | | | | | | | |
| | March 31
2021 | | December 31
2020 |
| | Allowance
Amount | | Percent of
Loans
In Category
To Total Loans | | Allowance
Amount | | Percent of
Loans
In Category
To Total Loans |
| (Dollars in thousands) |
| Commercial and industrial (1) | $ | 20,207 | | | 22.6 | % | | $ | 21,086 | | | 22.4 | % |
| Commercial real estate | 44,348 | | | 45.2 | % | | 45,009 | | | 44.4 | % |
| Commercial construction | 5,268 | | | 5.6 | % | | 5,397 | | | 5.9 | % |
| Small business | 3,621 | | | 1.9 | % | | 5,095 | | | 1.9 | % |
| Residential real estate | 12,956 | | | 13.4 | % | | 14,275 | | | 13.8 | % |
| Home equity | 20,716 | | | 11.1 | % | | 22,060 | | | 11.4 | % |
| Other consumer | 433 | | | 0.2 | % | | 470 | | | 0.2 | % |
| Total allowance for credit losses | $ | 107,549 | | | 100.0 | % | | $ | 113,392 | | | 100.0 | % |
|
| | | | | | | | | | | | | | | | | | | | |
| | March 31
2020 | | January 1
2020 | | December 31
2019 |
| | Allowance Amount | | Percent of Loans In Category To Total Loans | | Allowance
Amount | | Percent of
Loans
In Category
To Total Loans | | Allowance Amount | | Percent of Loans In Category To Total Loans |
| | (Dollars in thousands) |
| Commercial and industrial | $ | 21,649 |
| | 16.2 | % | | $ | 15,659 |
| | 15.7 | % | | $ | 17,594 |
| | 15.7 | % |
| Commercial real estate | 29,498 |
| | 45.6 | % | | 20,224 |
| | 45.1 | % | | 32,935 |
| | 45.1 | % |
| Commercial construction | 3,747 |
| | 5.9 | % | | 2,401 |
| | 6.2 | % | | 6,053 |
| | 6.2 | % |
| Small business | 3,829 |
| | 2.0 | % | | 2,241 |
| | 2.0 | % | | 1,746 |
| | 2.0 | % |
| Residential real estate | 14,847 |
| | 17.1 | % | | 13,691 |
| | 17.9 | % | | 3,440 |
| | 17.9 | % |
| Home equity | 17,910 |
| | 12.9 | % | | 12,907 |
| | 12.8 | % | | 5,576 |
| | 12.8 | % |
| Other consumer | 896 |
| | 0.3 | % | | 637 |
| | 0.3 | % | | 396 |
| | 0.3 | % |
| Total allowance for credit losses | $ | 92,376 |
| | 100.0 | % | | $ | 67,760 |
| | 100.0 | % | | $ | 67,740 |
| | 100.0 | % |
As a result(1)Includes loans originated as part of the initial adoption of CECL on January 1, 2020, the total allowance amount did not change materially, although allocation of these amounts by category did change. These changes are due to the new model that incorporates estimates of loss for the life of the loan, and therefore requiring higher reserves for loans with longer anticipated lives. The increase from adoption to March 31, 2020 is largely drivenPPP established by the downturn ofCARES Act, which have been excluded from the economy in response tocredit loss calculations because these loans are 100% guaranteed by the impact of the COVID-19 pandemic and the resulting changes to the model inputs, as well as additional qualitative adjustments required for relationships in industries that are highly impacted by social distancing business closures and other mandated government requirements in response to the COVID-19 pandemic.U.S. Government.
To determine if a loan should be charged-off, all possible sources of repayment are analyzed. Possible sources of repayment include the potential for future cash flows, the value of the Bank’s collateral, and the strength of co-makers or guarantors. When available information confirms that specific loans or portions thereof are uncollectible, these amounts are promptly charged-off against the allowance for credit losses and any recoveries of such previously charged-off amounts are credited to the allowance.
Regardless of whether a loan is unsecured or collateralized, the Company charges off the amount of any confirmed loan loss in the period when the loans, or portions of loans, are deemed uncollectible. For troubled, collateral-dependent loans, loss-confirming events may include an appraisal or other valuation that reflects a shortfall between the value of the collateral and the carrying value of the loan or receivable, or a deficiency balance following the sale of the collateral.
For additional information regarding the Company’s allowance for credit losses, see Note 4 Loans,"Loans, Allowance for Credit Losses and Credit Quality and Note 5, “Loans and Allowance for Loan Losses”" within Condensedthe Notes to Consolidated Financial Statements included in ItemPart I.Item 1 hereof.of this Report.
Federal Home Loan Bank Stock The Bank held an investmentinvestments in FHLB of Boston stock of $23.3 million and $14.4$10.3 million at each of March 31, 20202021 and December 31, 2019, respectively.2020. The FHLB is a cooperative that provides services to its member banking
institutions. The primary reason for the FHLB of Boston membership is to gain access to a reliable source of wholesale funding as a tool to manage liquidity and interest rate risk. The purchase of stock in the FHLB is a requirement for a member to gain access to funding. The Company either purchases additional FHLB stock or is subject to redemption of FHLB stock proportional to the
volume of funding received. The Company views the holdings as a necessary long-term investment for the purpose of balance sheet liquidity and not for investment return.
Goodwill and Other Intangible Assets Goodwill and other intangible assets were $533.7$527.9 million and $535.5$529.3 million as ofat March 31, 20202021 and December 31, 2019,2020, respectively. The decrease was primarily due to amortization of definite-lived intangibles.
The Company typically performs its annual goodwill impairment testing during the third quarter of the year, unless certain indicators suggest earlier testing to be warranted. The Company determined that an interim impairment test was warranted due to the operational disruption and uncertainty associated with the COVID-19 pandemic which commenced during the first quarter of 2020. Accordingly, the Company last performed anits annual goodwill impairment test astesting during the third quarter of March 31, 2020 and determined that therethe Company's goodwill was no impairmentnot impaired as of its goodwill.September 30, 2020. Other intangible assets are also reviewed for impairment whenever events or changes in circumstances indicate that the carrying amount of the assets may not be recoverable. The Company also consideredThere were no events or changes during the impactfirst quarter of COVID-19 as it pertains to these intangible assets, and determined2021 that there was no indicationindicated impairment of impairment related to other intangible assets as of March 31, 2020.assets.
Cash Surrender Value of Life Insurance Policies The Bank holds life insurance policies for the purpose of offsetting its future obligations to its employees under its retirement and benefits plans. The cash surrender value of life insurance policies was $197.8$241.4 million and $197.4$200.5 million at March 31, 20202021 and December 31, 2019, respectively.2020, respectively, reflecting new policy purchases totaling $40.0 million during the first quarter of 2021. The Company recorded tax exempt income from life insurance policies of $1.3 million for each of the three month periods ended March 31, 2021 and $972,0002020. The Company also recorded gains on life insurance benefits of $258,000, and $357,000 for the three months ended March 31, 2021 and 2020, and 2019, respectively. Also during the first quarter of 2020 the Company recorded gains on life insurance benefits of $357,000.
Deposits As of March 31, 2020,2021, total deposits were $9.4$11.6 billion, representing a $268.8$600.4 million, or 2.9%5.5%, increase from December 31, 2019, driven primarily by increases from existing customers across all core deposit categories.2020, as a combination of government stimulus payments and loan fundings under the second round of the PPP fueled significant growth during the first quarter of 2021. The total cost of deposits was 0.48%0.10% and 0.39%0.48% for the three months ended March 31, 20202021 and 2019,2020, respectively. Core deposits represented 82.62%increased to 90.9% of total deposits as of March 31, 2020.2021, as noncore time deposits continued to runoff.
The Company also participates in the Promontory InterfinancialIntraFi Network, allowing the Bank to provide easy access to multi-million dollar Federal Deposit Insurance Corporation ("FDIC") deposit insurance protection on certificate of deposit and money market investments for consumers, businesses and public entities. This channel allows the Company to seek additional funding in potentially large quantities by attracting deposits from outside the Bank’s core market, and amounted to $219.0$233.2 million and $211.2$237.9 million at March 31, 20202021 and December 31, 2019,2020, respectively. In addition, the Company may occasionally raise funds through the use of brokered deposits outside of the Promontory InterfinancialIntraFi Network, which amounted to $197.4$7.8 million and $281.6$8.5 million at March 31, 20202021 and December 31, 2019,2020, respectively.
Borrowings The Company’s borrowings consist of both short-term and long-term borrowings and provide the Bank with one of its primary sources of funding. Maintaining available borrowing capacity provides the Bank with a contingent source of liquidity. Borrowings increased by $242.9 million, or 80.1%, at March 31, 2020, as compared to December 31, 2019, as the Company entered into an additional $300.0 million FHLB borrowing during the first quarter of 2020.
The following table presents the components of borrowings as of the periodsdates indicated:
| | | | | March 31
2020 | | December 31
2019 | | March 31
2021 | | December 31
2020 |
| | | | | | | (Dollars in thousands) |
| Federal Home Loan Bank borrowings | | $ | 358,591 |
| | $ | 115,748 |
| Federal Home Loan Bank borrowings | | $ | 35,717 | | | $ | 35,740 | |
| | Long-term borrowings | | 74,920 |
| | 74,906 |
| Long-term borrowings | | 28,099 | | | 32,773 | |
| Junior subordinated debentures | | 62,849 |
| | 62,848 |
| Junior subordinated debentures | | 62,851 | | | 62,851 | |
| Subordinated debentures | | 49,625 |
| | 49,601 |
| Subordinated debentures | | 49,720 | | | 49,696 | |
| Total borrowings | | $ | 545,985 |
| | $ | 303,103 |
| Total borrowings | | $ | 176,387 | | | $ | 181,060 | |
Additionally, the Bank had $3.5$4.0 billion and $4.0$4.1 billion of assets pledged as collateral against borrowings at March 31, 20202021 and December 31, 2019,2020, respectively. These assets are primarily pledged to the FHLB of Boston and the Federal Reserve Bank of Boston.
Capital Resources On March 19, 2020,18, 2021, the Company’s Board of Directors declared a cash dividend of $0.46$0.48 per share to stockholdersshareholders of record as of the close of business on March 30, 2020.29, 2021. This dividend was paid on April 9, 2020.2021.
The Company and the Bank are subject to various regulatory capital requirements administered by the federal banking agencies. Failure to meet minimum capital requirements can initiate certain mandatory and possibly additional discretionary actions by regulators that, if undertaken, could have a direct material effect on the Company’s financial statements. Under capital adequacy guidelines and the regulatory framework for prompt corrective action, the Company and the Bank must meet specific capital guidelines that involve quantitative measures of the Company’s and the Bank’s assets, liabilities and certain off-balance sheet items as calculated under regulatory accounting practices. The capital amounts and classifications are also subject to qualitative judgments by the regulators about components, risk weightings and other factors.
Quantitative measures established by regulation to ensure capital adequacy require the Company and the Bank to maintain minimum amounts and ratios (set forth in the table below) of Total, Tier 1 Capital and Common Equity Tier 1 Capital (as defined for regulatory purposes) to risk weighted assets (as defined for regulatory purposes) and Tier 1 Capital to average assets (as defined for regulatory purposes). At March 31, 20202021 and December 31, 2019,2020, the Company and the Bank exceeded the minimum requirements for all applicable ratios that were in effect during the respective periods. The Company’s and the Bank’s capital amounts and ratios are presented in the following table, along with the applicable minimum requirements foras of each perioddate indicated:
Table 1314 - Company and Bank's Capital Amounts and Ratios
| | | | | | | | | | | | | | | | | | | | | | | | | | | | | | | | | | | | | | | | | | | | | | | |
| | Actual | | For Capital Adequacy Purposes | | To Be Well Capitalized Under Prompt
Corrective Action Provisions |
| | Amount | | Ratio | | Amount | | | | Ratio | | Amount | | | | Ratio |
| | March 31, 2021 |
| | (Dollars in thousands) |
| Company (consolidated) | | | | | | | | | | | | | | | |
| Total capital (to risk weighted assets) | $ | 1,395,973 | | | 15.61 | % | | $ | 715,596 | | | ≥ | | 8.0 | % | | N/A | | | | N/A |
Common equity tier 1 capital
(to risk weighted assets) | 1,177,483 | | | 13.16 | % | | 402,522 | | | ≥ | | 4.5 | % | | N/A | | | | N/A |
| Tier 1 capital (to risk weighted assets) | 1,238,483 | | | 13.85 | % | | 536,697 | | | ≥ | | 6.0 | % | | N/A | | | | N/A |
| Tier 1 capital (to average assets) | 1,238,483 | | | 9.63 | % | | 514,262 | | | ≥ | | 4.0 | % | | N/A | | | | N/A |
| Bank | | | | | | | | | | | | | | | |
| Total capital (to risk weighted assets) | $ | 1,359,395 | | | 15.20 | % | | $ | 715,318 | | | ≥ | | 8.0 | % | | $ | 894,147 | | | ≥ | | 10.0 | % |
Common equity tier 1 capital
(to risk weighted assets) | 1,251,598 | | | 14.00 | % | | 402,366 | | | ≥ | | 4.5 | % | | 581,196 | | | ≥ | | 6.5 | % |
| Tier 1 capital (to risk weighted assets) | 1,251,598 | | | 14.00 | % | | 536,488 | | | ≥ | | 6.0 | % | | 715,318 | | | ≥ | | 8.0 | % |
| Tier 1 capital (to average assets) | 1,251,598 | | | 9.73 | % | | 514,356 | | | ≥ | | 4.0 | % | | 642,945 | | | ≥ | | 5.0 | % |
| | December 31, 2020 |
| (Dollars in thousands) |
| Company (consolidated) | | | | | | | | | | | | | | | |
| Total capital (to risk weighted assets) | $ | 1,374,349 | | | 15.13 | % | | $ | 726,482 | | | ≥ | | 8.0 | % | | N/A | | | | N/A |
Common equity tier 1 capital
(to risk weighted assets) | 1,150,177 | | | 12.67 | % | | 408,646 | | | ≥ | | 4.5 | % | | N/A | | | | N/A |
| Tier 1 capital (to risk weighted assets) | 1,211,177 | | | 13.34 | % | | 544,861 | | | ≥ | | 6.0 | % | | N/A | | | | N/A |
| Tier 1 capital (to average assets) | 1,211,177 | | | 9.56 | % | | 506,805 | | | ≥ | | 4.0 | % | | N/A | | | | N/A |
| Bank | | | | | | | | | | | | | | | |
| Total capital (to risk weighted assets) | $ | 1,320,056 | | | 14.54 | % | | $ | 726,313 | | | ≥ | | 8.0 | % | | $ | 907,892 | | | ≥ | | 10.0 | % |
Common equity tier 1 capital
(to risk weighted assets) | 1,206,566 | | | 13.29 | % | | 408,551 | | | ≥ | | 4.5 | % | | 590,130 | | | ≥ | | 6.5 | % |
| Tier 1 capital (to risk weighted assets) | 1,206,566 | | | 13.29 | % | | 544,735 | | | ≥ | | 6.0 | % | | 726,313 | | | ≥ | | 8.0 | % |
| Tier 1 capital (to average assets) | 1,206,566 | | | 9.54 | % | | 505,747 | | | ≥ | | 4.0 | % | | 632,184 | | | ≥ | | 5.0 | % |
|
| | | | | | | | | | | | | | | | | | | | | | | | |
| | Actual | | For Capital Adequacy Purposes | | To Be Well Capitalized Under Prompt
Corrective Action Provisions |
| | Amount | | Ratio | | Amount | | | | Ratio | | Amount | | | | Ratio |
| | March 31, 2020 |
| | (Dollars in thousands) |
| Company (consolidated) | | | | | | | | | | | | | | | |
| Total capital (to risk weighted assets) | $ | 1,318,370 |
| | 14.13 | % | | $ | 745,793 |
| | ≥ | | 8.0 | % | | N/A | | | | N/A |
Common equity tier 1 capital (to risk weighted assets) | 1,114,799 |
| | 11.95 | % | | 419,509 |
| | ≥ | | 4.5 | % | | N/A | | | | N/A |
| Tier 1 capital (to risk weighted assets) | 1,175,799 |
| | 12.60 | % | | 559,345 |
| | ≥ | | 6.0 | % | | N/A | | | | N/A |
| Tier 1 capital (to average assets) | 1,175,799 |
| | 10.74 | % | | 458,249 |
| | ≥ | | 4.0 | % | | N/A | | | | N/A |
| Bank | | | | | | | | | | | | | | | |
| Total capital (to risk weighted assets) | $ | 1,303,125 |
| | 13.96 | % | | $ | 746,962 |
| | ≥ | | 8.0 | % | | $ | 933,702 |
| | ≥ | | 10.0 | % |
Common equity tier 1 capital (to risk weighted assets) | 1,210,099 |
| | 12.96 | % | | 420,166 |
| | ≥ | | 4.5 | % | | 606,906 |
| | ≥ | | 6.5 | % |
| Tier 1 capital (to risk weighted assets) | 1,210,099 |
| | 12.96 | % | | 560,221 |
| | ≥ | | 6.0 | % | | 746,962 |
| | ≥ | | 8.0 | % |
| Tier 1 capital (to average assets) | 1,210,099 |
| | 11.06 | % | | 458,246 |
| | ≥ | | 4.0 | % | | 572,808 |
| | ≥ | | 5.0 | % |
| | December 31, 2019 |
| | (Dollars in thousands) |
| Company (consolidated) | | | | | | | | | | | | | | | |
| Total capital (to risk weighted assets) | $ | 1,352,341 |
| | 14.83 | % | | $ | 729,291 |
| | ≥ | | 8.0 | % | | N/A | | | | N/A |
Common equity tier 1 capital (to risk weighted assets) | 1,171,963 |
| | 12.86 | % | | 410,226 |
| | ≥ | | 4.5 | % | | N/A | | | | N/A |
| Tier 1 capital (to risk weighted assets) | 1,232,963 |
| | 13.53 | % | | 546,969 |
| | ≥ | | 6.0 | % | | N/A | | | | N/A |
| Tier 1 capital (to average assets) | 1,232,963 |
| | 11.28 | % | | 437,271 |
| | ≥ | | 4.0 | % | | N/A | | | | N/A |
| Bank | | | | | | | | | | | | | | | |
| Total capital (to risk weighted assets) | $ | 1,275,611 |
| | 14.00 | % | | $ | 728,868 |
| | ≥ | | 8.0 | % | | $ | 911,085 |
| | ≥ | | 10.0 | % |
Common equity tier 1 capital (to risk weighted assets) | 1,205,740 |
| | 13.23 | % | | 409,988 |
| | ≥ | | 4.5 | % | | 592,205 |
| | ≥ | | 6.5 | % |
| Tier 1 capital (to risk weighted assets) | 1,205,740 |
| | 13.23 | % | | 546,651 |
| | ≥ | | 6.0 | % | | 728,868 |
| | ≥ | | 8.0 | % |
| Tier 1 capital (to average assets) | 1,205,740 |
| | 11.06 | % | | 435,886 |
| | ≥ | | 4.0 | % | | 544,857 |
| | ≥ | | 5.0 | % |
In addition to the minimum risk-based capital requirements outlined in the table above, the Company is required to maintain a minimum capital conservation buffer, in the form of common equity, in order to avoid restrictions on capital distributions and discretionary bonuses. The required amount of the capital conservation buffer is 2.5%. At March 31, 2020,2021, the Company's capital levels exceeded the buffer.
Dividend Restrictions InThe Company is subject to capital and dividend requirements administered by federal and state bank regulators, and the Company will not declare a cash dividend that would cause the Company to violate regulatory requirements. The Company is, in the ordinary course of business, the Company is dependent upon the receipt of cash dividends from the Bank to provide funds for the payment ofpay cash dividends to shareholders and to provide forsatisfy the Company’s other cash requirements. Banking regulationsneeds. Federal and state law impose limits on capital distributions by the Bank. Massachusetts-chartered banks, such as the Bank, may limit the amount ofdeclare from net profits cash dividends thatnot more frequently than quarterly and non-cash dividends at any time. No dividends may be paid. Approval by regulatory authoritiesdeclared, credited, or paid if the Bank’s capital stock would be impaired. Massachusetts Bank Commissioner approval is required if the effecttotal of all dividends declared would cause the regulatory capital ofby the Bank to fall below specified minimum levels. Approval is also required if dividends declaredin any calendar year would exceed the total of its net profits for that year combined with theits retained net profits forof the preceding two years. Underyears, less any required transfer to surplus or a fund for the foregoing dividend restrictions and while maintaining its "well capitalized" status,retirement of any preferred stock. There were no dividends paid by the Bank to the Company totaled $28.4 million and $30.0 million for the three months ended March 31, 20202021 and 2019, respectively .$28.4 million in dividends were paid by the Bank to the Company for the three months ended March 31, 2020.
Trust Preferred Securities In accordance with the applicable accounting standard related to variable interest entities, the common stock of trusts which have issued trust preferred securities has not been included in the consolidated financial statements of the Company. At botheach of March 31, 20202021 and December 31, 20192020 there waswere $61.0 million respectively, in trust preferred securities which have been included in the Tier 1 capital of the Company for regulatory reporting purposes pursuant to the Federal Reserve's capital adequacy guidelines.
Common Stock Repurchase Program On October 17, 2019, the Company put into place a share repurchase program with the ability to repurchase up to 1.5 million shares of the Company's common stock. The program allowed for repurchases to be made from time to time on the open market and in privately negotiated transactions, including through the use of trading plans intended to qualify under Rule 10b5-1 under the Exchange Act. During the first quarter of 2020, the Company repurchased 1.2 million shares of common stock, at a cost of $73.2 million. Subsequently, in early April the Company repurchased the remaining shares available under the plan, thereby completing the repurchase of all 1.5 million shared authorized by the program at an average share price of $63.39.
Investment Management As of March 31, 2020,2021, the Rockland Trust Investment Management Group had assets under administration of $4.0$5.2 billion, representing 6,1716,216 trust, fiduciary, and agency accounts. At December 31, 2019,2020, assets under administration were $4.6$4.9 billion, representing approximately 6,1086,175 trust, fiduciary, and agency accounts. The decline in value reflects the overall market decline driven primarily by investor response to the COVID-19 pandemic, including a sharp decline in the U.S. stock market. Also, includedIncluded in these amounts as of March 31, 20202021 and December 31, 2019 are2020 were assets under administration of $278.4$395.8 million and $342.2$369.6 million, respectively, relating to the Company’s registered investment advisor, Bright Rock Capital Management, LLC, which provides institutional quality investment management services to institutional and high net worth clients. Revenue from the Investment Management Group was $6.3$7.4 million and $6.1$6.3 million for the three months ended March 31, 20202021 and 2019,2020, respectively.
Retail investments and insurance revenue waswere $902,000 and $540,000 and $679,000 for the three months ended March 31, 2021 and 2020, and 2019, respectively. This increase was primarily due to a strong sales volume.
Retail investments and insurance revenue includesinclude commission revenue from LPL Financial (“LPL”) and its affiliates and their insurance subsidiary, LPL Insurance Associates, Inc., which offers the sale of mutual fund shares, unit investment trust shares, general securities, fixed and variable annuities and life insurance. Registered representatives who are both employed by the Bank and licensed and contracted with LPL are onsite to offer these products to the Bank’s customer base. These same agents are also approved and appointed with various other broker general agents for the purpose of processing insurance solutions for clients.
RESULTS OF OPERATIONS
The following table provides a summary of results of operations for the three months ended March 31, 20202021 and 2019:2020:
Table 1415 - Summary of Results of Operations
| | | | Three Months Ended March 31 | | | Three Months Ended March 31 |
| | 2020 | | 2019 | | | 2021 | | 2020 |
| | (Dollars in thousands, except per share data) | | | (Dollars in thousands, except per share data) |
| Net income | $ | 26,751 |
| | $ | 35,225 |
| Net income | | $ | 41,711 | | | $ | 26,751 | |
| Diluted earnings per share | $ | 0.78 |
| | $ | 1.25 |
| Diluted earnings per share | | $ | 1.26 | | | $ | 0.78 | |
| Return on average assets | 0.94 | % | | 1.62 | % | Return on average assets | | 1.26 | % | | 0.94 | % |
| Return on average equity | 6.22 | % | | 13.10 | % | Return on average equity | | 9.87 | % | | 6.22 | % |
| Net interest margin | 3.74 | % | | 4.14 | % | Net interest margin | | 3.25 | % | | 3.74 | % |
The Company's results of operations were impacted primarily by the additional provision for loan losses recognized during the first quarter of 2020. The2021 were positively impacted by a release of provision for credit losses in the amount of $2.5 million as well as elevated interest income from forgiven PPP loans. In comparison, results from the first quarter of 2020 reflected an increased provision for credit loss of $25.0 million, was driven by anticipated credit losses related to the COVID-19 pandemic.
Net Interest Income The amount of net interest income is affected by changes in interest rates and by the volume, mix, and interest rate sensitivity of interest-earning assets and interest-bearing liabilities.
On a fully tax equivalent basis ("FTE"), net interest income for the first quarter of 20202021 was $94.6$95.8 million, representing an increase of $11.8$1.3 million, or 14.3%1.3%, when compared to the first quarter of 2019. The increase in net interest income from the year ago period is primarily due to increased interest earning assets, including those obtained in the BHB acquisition. Despite the increase in interest-earning assets, the yields on assets have decreased significantly due to the Federal Reserve rate cuts that have occurred in the second half2020.
The following tables present the Company’s average balances, net interest income, interest rate spread, and net interest margin for the three months endingended March 31, 20202021 and 2019, respectively.2020. Nontaxable income from loans and securities is presented on a FTE basis by adjusting tax-exempt income upward by an amount equivalent to the prevailing income taxestax rate that would have been paid if the income had been fully taxable.
Table 1516 - Average Balance, Interest Earned/Paid & Average Yields Quarter-to-Date
| | | | | | | | | | | | | | | | | | | | | | | | | | | | | | | | | | | |
| | | | | | | | | | | |
| | | | | | | | | | | |
| | Three Months Ended March 31 |
| | 2021 | | 2020 |
| | Average
Balance | | Interest
Earned/
Paid | | Yield/Rate | | Average
Balance | | Interest
Earned/
Paid | | Yield/Rate |
| | (Dollars in thousands) |
| Interest-earning assets | | | | | | | | | | | |
| Interest-earning deposits with banks, federal funds sold, and short term investments | $ | 1,321,430 | | | $ | 326 | | | 0.10 | % | | $ | 72,552 | | | $ | 160 | | | 0.89 | % |
| Securities | | | | | | | | | | | |
| Securities - trading | 2,939 | | | — | | | — | % | | 2,263 | | | — | | | — | % |
| Securities - taxable investments | 1,250,451 | | | 6,627 | | | 2.15 | % | | 1,189,965 | | | 7,957 | | | 2.69 | % |
| Securities - nontaxable investments (1) | 642 | | | 6 | | | 3.79 | % | | 1,237 | | | 12 | | | 3.90 | % |
| Total securities | $ | 1,254,032 | | | $ | 6,633 | | | 2.15 | % | | $ | 1,193,465 | | | $ | 7,969 | | | 2.69 | % |
| Loans held for sale | 49,652 | | | 296 | | | 2.42 | % | | 28,045 | | | 232 | | | 3.33 | % |
| Loans (2) | | | | | | | | | | | |
| Commercial and industrial (1) | 2,115,069 | | | 23,046 | | | 4.42 | % | | 1,403,199 | | | 16,940 | | | 4.86 | % |
| Commercial real estate (1) | 4,156,012 | | | 40,376 | | | 3.94 | % | | 4,012,125 | | | 45,851 | | | 4.60 | % |
| Commercial construction | 555,153 | | | 5,283 | | | 3.86 | % | | 555,741 | | | 6,901 | | | 4.99 | % |
| Small business | 174,320 | | | 2,281 | | | 5.31 | % | | 174,668 | | | 2,562 | | | 5.90 | % |
| Total commercial | 7,000,554 | | | 70,986 | | | 4.11 | % | | 6,145,733 | | | 72,254 | | | 4.73 | % |
| Residential real estate | 1,271,283 | | | 12,436 | | | 3.97 | % | | 1,560,839 | | | 14,619 | | | 3.77 | % |
| Home equity | 1,050,234 | | | 8,757 | | | 3.38 | % | | 1,136,931 | | | 11,827 | | | 4.18 | % |
| Total consumer real estate | 2,321,517 | | | 21,193 | | | 3.70 | % | | 2,697,770 | | | 26,446 | | | 3.94 | % |
| Other consumer | 21,698 | | | 432 | | | 8.07 | % | | 27,843 | | | 572 | | | 8.26 | % |
| Total loans | $ | 9,343,769 | | | $ | 92,611 | | | 4.02 | % | | $ | 8,871,346 | | | $ | 99,272 | | | 4.50 | % |
| Total interest-earning assets | $ | 11,968,883 | | | $ | 99,866 | | | 3.38 | % | | $ | 10,165,408 | | | $ | 107,633 | | | 4.26 | % |
| Cash and due from banks | 154,870 | | | | | | | 122,707 | | | | | |
| Federal Home Loan Bank stock | 10,250 | | | | | | | 14,699 | | | | | |
| Other assets | 1,241,651 | | | | | | | 1,166,775 | | | | | |
| Total assets | $ | 13,375,654 | | | | | | | $ | 11,469,589 | | | | | |
| Interest-bearing liabilities | | | | | | | | | | | |
| Deposits | | | | | | | | | | | |
| Savings and interest checking accounts | $ | 4,109,747 | | | $ | 423 | | | 0.04 | % | | $ | 3,270,719 | | | $ | 1,934 | | | 0.24 | % |
| Money market | 2,288,030 | | | 521 | | | 0.09 | % | | 1,872,003 | | | 3,173 | | | 0.68 | % |
| Time deposits | 906,613 | | | 1,767 | | | 0.79 | % | | 1,346,890 | | | 5,785 | | | 1.73 | % |
| Total interest-bearing deposits | $ | 7,304,390 | | | $ | 2,711 | | | 0.15 | % | | $ | 6,489,612 | | | $ | 10,892 | | | 0.68 | % |
| Borrowings | | | | | | | | | | | |
| Federal Home Loan Bank borrowings | $ | 35,785 | | | $ | 188 | | | 2.13 | % | | $ | 131,225 | | | $ | 528 | | | 1.62 | % |
| | | | | | | | | | | |
| | | | | | | | | | | |
| | | | | | | | | | | |
| Long-term borrowings | 28,247 | | | 111 | | | 1.59 | % | | 74,912 | | | 561 | | | 3.01 | % |
| Junior subordinated debentures | 62,851 | | | 426 | | | 2.75 | % | | 62,849 | | | 478 | | | 3.06 | % |
| Subordinated debentures | 49,705 | | | 617 | | | 5.03 | % | | 49,612 | | | 617 | | | 5.00 | % |
| Total borrowings | $ | 176,588 | | | $ | 1,342 | | | 3.08 | % | | $ | 318,598 | | | $ | 2,184 | | | 2.76 | % |
|
| | | | | | | | | | | | | | | | | | | | | |
| | Three Months Ended March 31 |
| | 2020 | | 2019 |
| | Average Balance | | Interest Earned/ Paid | | Yield/Rate | | Average Balance | | Interest Earned/ Paid | | Yield/Rate |
| | (Dollars in thousands) |
| Interest-earning assets | | | | | | | | | | | |
| Interest-earning deposits with banks, federal funds sold, and short term investments | $ | 72,552 |
| | $ | 160 |
| | 0.89 | % | | $ | 68,994 |
| | $ | 426 |
| | 2.50 | % |
| Securities | | | | | | | | | | | |
| Securities - trading | 2,263 |
| | — |
| | — | % | | 1,616 |
| | — |
| | — | % |
| Securities - taxable investments | 1,189,965 |
| | 7,957 |
| | 2.69 | % | | 1,084,747 |
| | 7,465 |
| | 2.79 | % |
| Securities - nontaxable investments (1) | 1,237 |
| | 12 |
| | 3.90 | % | | 1,738 |
| | 17 |
| | 3.97 | % |
| Total securities | $ | 1,193,465 |
| | $ | 7,969 |
| | 2.69 | % | | $ | 1,088,101 |
| | $ | 7,482 |
| | 2.79 | % |
| Loans held for sale | 28,045 |
| | 232 |
| | 3.33 | % | | 3,445 |
| | 31 |
| | 3.65 | % |
| Loans (2) | | | | | | | | | | | |
| Commercial and industrial (1) | 1,403,199 |
| | 16,940 |
| | 4.86 | % | | 1,113,819 |
| | 14,440 |
| | 5.26 | % |
| Commercial real estate (1) | 4,012,125 |
| | 45,851 |
| | 4.60 | % | | 3,240,346 |
| | 39,230 |
| | 4.91 | % |
| Commercial construction | 555,741 |
| | 6,901 |
| | 4.99 | % | | 386,736 |
| | 5,617 |
| | 5.89 | % |
| Small business | 174,668 |
| | 2,562 |
| | 5.90 | % | | 165,374 |
| | 2,484 |
| | 6.09 | % |
| Total commercial | 6,145,733 |
| | 72,254 |
| | 4.73 | % | | 4,906,275 |
| | 61,771 |
| | 5.11 | % |
| Residential real estate | 1,560,839 |
| | 14,619 |
| | 3.77 | % | | 926,945 |
| | 9,547 |
| | 4.18 | % |
| Home equity | 1,136,931 |
| | 11,827 |
| | 4.18 | % | | 1,086,620 |
| | 12,175 |
| | 4.54 | % |
| Total consumer real estate | 2,697,770 |
| | 26,446 |
| | 3.94 | % | | 2,013,565 |
| | 21,722 |
| | 4.38 | % |
| Other consumer | 27,843 |
| | 572 |
| | 8.26 | % | | 16,087 |
| | 313 |
| | 7.89 | % |
| Total loans | $ | 8,871,346 |
| | $ | 99,272 |
| | 4.50 | % | | $ | 6,935,927 |
| | $ | 83,806 |
| | 4.90 | % |
| Total interest-earning assets | $ | 10,165,408 |
| | $ | 107,633 |
| | 4.26 | % | | $ | 8,096,467 |
| | $ | 91,745 |
| | 4.60 | % |
| Cash and due from banks | 122,707 |
| | | | | | 105,194 |
| | | | |
| Federal Home Loan Bank stock | 14,699 |
| | | | | | 11,697 |
| | | | |
| Other assets | 1,166,775 |
| | | | | | 617,259 |
| | | | |
| Total assets | $ | 11,469,589 |
| | | | | | $ | 8,830,617 |
| | | | |
| Interest-bearing liabilities | | | | | | | | | | | |
| Deposits | | | | | | | | | | | |
| Savings and interest checking accounts | $ | 3,270,719 |
| | $ | 1,934 |
| | 0.24 | % | | $ | 2,891,613 |
| | $ | 1,954 |
| | 0.27 | % |
| Money market | 1,872,003 |
| | 3,173 |
| | 0.68 | % | | 1,464,151 |
| | 2,719 |
| | 0.75 | % |
| Time deposits | 1,346,890 |
| | 5,785 |
| | 1.73 | % | | 717,081 |
| | 2,355 |
| | 1.33 | % |
| Total interest-bearing deposits | $ | 6,489,612 |
| | $ | 10,892 |
| | 0.68 | % | | $ | 5,072,845 |
| | $ | 7,028 |
| | 0.56 | % |
| Borrowings | | | | | | | | | | | |
| Federal Home Loan Bank borrowings | $ | 131,225 |
| | $ | 528 |
| | 1.62 | % | | $ | 112,898 |
| | $ | 710 |
| | 2.55 | % |
| Line of credit | — |
| | — |
| | — | % | | 2,221 |
| | 21 |
| | 3.83 | % |
| Long-term borrowings | 74,912 |
| | 561 |
| | 3.01 | % | | 3,331 |
| | 32 |
| | 3.90 | % |
| Junior subordinated debentures | 62,849 |
| | 478 |
| | 3.06 | % | | 73,287 |
| | 684 |
| | 3.79 | % |
| Subordinated debentures | 49,612 |
| | 617 |
| | 5.00 | % | | 44,678 |
| | 543 |
| | 4.93 | % |
| | | | | | | | | | | | | | | | | | | | | | | | | | | | | | | | | | | |
| Total interest-bearing liabilities | $ | 7,480,978 | | | $ | 4,053 | | | 0.22 | % | | $ | 6,808,210 | | | $ | 13,076 | | | 0.77 | % |
| Noninterest bearing demand deposits | 3,895,447 | | | | | | | 2,680,718 | | | | | |
| Other liabilities | 285,857 | | | | | | | 251,469 | | | | | |
| Total liabilities | $ | 11,662,282 | | | | | | | $ | 9,740,397 | | | | | |
| Stockholders' equity | 1,713,372 | | | | | | | 1,729,192 | | | | | |
| Total liabilities and stockholders' equity | $ | 13,375,654 | | | | | | | $ | 11,469,589 | | | | | |
| Net interest income (1) | | | $ | 95,813 | | | | | | | $ | 94,557 | | | |
| Interest rate spread (3) | | | | | 3.16 | % | | | | | | 3.49 | % |
| Net interest margin (4) | | | | | 3.25 | % | | | | | | 3.74 | % |
| Supplemental information | | | | | | | | | | | |
| Total deposits, including demand deposits | $ | 11,199,837 | | | $ | 2,711 | | | | | $ | 9,170,330 | | | $ | 10,892 | | | |
| Cost of total deposits | | | | | 0.10 | % | | | | | | 0.48 | % |
| Total funding liabilities, including demand deposits | $ | 11,376,425 | | | $ | 4,053 | | | | | $ | 9,488,928 | | | $ | 13,076 | | | |
| Cost of total funding liabilities | | | | | 0.14 | % | | | | | | 0.55 | % |
(1)The total amount of adjustment to interest income and yield on a FTE basis was $229,000 and $253,000 for the three months ended March 31, 2021 and 2020, respectively. The FTE adjustment relates to tax exempt income relating to securities with average balances of $642,000 and $1.2 million and tax exempt income relating to loans with average balances of $70.2 million and $85.5 million, for the three months ended March 31, 2021 and 2020, respectively.
(2)Includes average nonaccruing loans.
(3)Interest rate spread represents the difference between the weighted average yield on interest-earning assets and the weighted average cost of interest-bearing liabilities.
(4)Net interest margin represents annualized net interest income as a percentage of average interest-earning assets.
|
| | | | | | | | | | | | | | | | | | | | | |
| Total borrowings | $ | 318,598 |
| | $ | 2,184 |
| | 2.76 | % | | $ | 236,415 |
| | $ | 1,990 |
| | 3.41 | % |
| Total interest-bearing liabilities | $ | 6,808,210 |
| | $ | 13,076 |
| | 0.77 | % | | $ | 5,309,260 |
| | $ | 9,018 |
| | 0.69 | % |
| Noninterest bearing demand deposits | 2,680,718 |
| | | | | | 2,317,209 |
| | | | |
| Other liabilities | 251,469 |
| | | | | | 113,688 |
| | | | |
| Total liabilities | $ | 9,740,397 |
| | | | | | $ | 7,740,157 |
| | | | |
| Stockholders' equity | 1,729,192 |
| | | | | | 1,090,460 |
| | | | |
| Total liabilities and stockholders' equity | $ | 11,469,589 |
| | | | | | $ | 8,830,617 |
| | | | |
| Net interest income (1) | | | $ | 94,557 |
| | | | | | $ | 82,727 |
| | |
| Interest rate spread (3) | | | | | 3.49 | % | | | | | | 3.91 | % |
| Net interest margin (4) | | | | | 3.74 | % | | | | | | 4.14 | % |
| Supplemental information | | | | | | | | | | | |
| Total deposits, including demand deposits | $ | 9,170,330 |
| | $ | 10,892 |
| | | | $ | 7,390,054 |
| | $ | 7,028 |
| | |
| Cost of total deposits | | | | | 0.48 | % | | | | | | 0.39 | % |
| Total funding liabilities, including demand deposits | $ | 9,488,928 |
| | $ | 13,076 |
| | | | $ | 7,626,469 |
| | $ | 9,018 |
| | |
| Cost of total funding liabilities | | | | | 0.55 | % | | | | | | 0.48 | % |
79
| |
(1) | The total amount of adjustment to present interest income and yield on a FTE basis is $253,000 and $202,000 for the three months ended March 31, 2020 and 2019, respectively. The FTE adjustment relates to tax exempt income relating to securities with average balances of $1.2 million and $1.7 million and tax exempt income relating to loans with average balances of $85.5 million and $65.0 million, for the three months ended March 31, 2020 and 2019, respectively. |
| |
(2) | Average nonaccruing loans are included in loans. |
| |
(3) | Interest rate spread represents the difference between the weighted average yield on interest-earning assets and the weighted average cost of interest-bearing liabilities. |
| |
(4) | Net interest margin represents annualized net interest income as a percentage of average interest-earning assets. |
The following table presents certain information on a FTE basis regarding changes in the Company’s interest income and interest expense for the periods indicated. For each category of interest-earning assets and interest-bearing liabilities, information is provided with respect to changes attributable to: (1) changes in rate (change in rate multiplied by prior period volume), (2) changes in volume (change in volume multiplied by old rate), and (3) changes in volume/rate (change in volume multiplied by change in rate) which is allocated to the change due to rate column:
Table 1617 - Volume Rate Analysis
| | | | | | | | | | | | | | | | | | | | | | | |
| Three Months Ended March 31 | | |
| 2021 Compared To 2020 | | |
| Change
Due to
Rate | | Change
Due to
Volume | | Total Change | | | | | | |
| | (Dollars in thousands) |
| Income on interest-earning assets | | | | | | | | | | | |
| Interest earning deposits, federal funds sold and short term investments | $ | (2,588) | | | $ | 2,754 | | | $ | 166 | | | | | | | |
| Securities | | | | | | | | | | | |
| | | | | | | | | | | |
| Securities - taxable investments | (1,734) | | | 404 | | | (1,330) | | | | | | | |
| Securities - nontaxable investments (1) | — | | | (6) | | | (6) | | | | | | | |
| Total securities | | | | | (1,336) | | | | | | | |
| Loans held for sale | (115) | | | 179 | | | 64 | | | | | | | |
| Loans | | | | | | | | | | | |
| Commercial and industrial (1) | (2,488) | | | 8,594 | | | 6,106 | | | | | | | |
| Commercial real estate (1) | (7,119) | | | 1,644 | | | (5,475) | | | | | | | |
| Commercial construction | (1,611) | | | (7) | | | (1,618) | | | | | | | |
| Small business | (276) | | | (5) | | | (281) | | | | | | | |
| Total commercial | | | | | (1,268) | | | | | | | |
| Residential real estate | 529 | | | (2,712) | | | (2,183) | | | | | | | |
| Home equity | (2,168) | | | (902) | | | (3,070) | | | | | | | |
| Total consumer real estate | | | | | (5,253) | | | | | | | |
| Other consumer | (14) | | | (126) | | | (140) | | | | | | | |
| Total loans (1)(2) | | | | | (6,661) | | | | | | | |
| Total income of interest-earning assets | | | | | $ | (7,767) | | | | | | | |
| Expense of interest-bearing liabilities | | | | | | | | | | | |
| Deposits | | | | | | | | | | | |
| Savings and interest checking accounts | $ | (2,007) | | | $ | 496 | | | $ | (1,511) | | | | | | | |
| Money market | (3,357) | | | 705 | | | (2,652) | | | | | | | |
| Time certificates of deposits | (2,127) | | | (1,891) | | | (4,018) | | | | | | | |
| Total interest bearing deposits | | | | | (8,181) | | | | | | | |
| Borrowings | | | | | | | | | | | |
| Federal Home Loan Bank borrowings | 44 | | | (384) | | | (340) | | | | | | | |
| | | | | | | | | | | |
| | | | | | | | | | | |
| Line of Credit | — | | | — | | | — | | | | | | | |
| Long-term borrowings | (101) | | | (349) | | | (450) | | | | | | | |
| Junior subordinated debentures | (52) | | | — | | | (52) | | | | | | | |
| Subordinated debentures | (1) | | | 1 | | | — | | | | | | | |
| Total borrowings | | | | | (842) | | | | | | | |
| Total expense of interest-bearing liabilities | | | | | (9,023) | | | | | | | |
| Change in net interest income | | | | | $ | 1,256 | | | | | | | |
|
| | | | | | | | | | | |
| | Three Months Ended March 31 |
| | 2020 Compared To 2019 |
| | Change
Due to
Rate | | Change Due to Volume | | Total Change |
| | (Dollars in thousands) |
| Income on interest-earning assets | | | | | |
| Interest earning deposits, federal funds sold and short term investments | $ | (288 | ) | | $ | 22 |
| | $ | (266 | ) |
| Securities | | | | | |
| Securities - taxable investments | (232 | ) | | 724 |
| | 492 |
|
| Securities - nontaxable investments (1) | — |
| | (5 | ) | | (5 | ) |
| Total securities | | | | | 487 |
|
| Loans held for sale | (20 | ) | | 221 |
| | 201 |
|
| Loans | | | | | |
| Commercial and industrial (1) | (1,252 | ) | | 3,752 |
| | 2,500 |
|
| Commercial real estate (1) | (2,723 | ) | | 9,344 |
| | 6,621 |
|
| Commercial construction | (1,171 | ) | | 2,455 |
| | 1,284 |
|
| Small business | (62 | ) | | 140 |
| | 78 |
|
| Total commercial | | | | | 10,483 |
|
| Residential real estate | (1,457 | ) | | 6,529 |
| | 5,072 |
|
| Home equity | (912 | ) | | 564 |
| | (348 | ) |
| Total consumer real estate | | | | | 4,724 |
|
| Other consumer | 30 |
| | 229 |
| | 259 |
|
| Total loans (1)(2) | | | | | 15,466 |
|
| Total income of interest-earning assets | | | | | $ | 15,888 |
|
| Expense of interest-bearing liabilities | | | | | |
| Deposits | | | | | |
| Savings and interest checking accounts | $ | (276 | ) | | $ | 256 |
| | $ | (20 | ) |
| Money market | (303 | ) | | 757 |
| | 454 |
|
| Time certificates of deposits | 1,362 |
| | 2,068 |
| | 3,430 |
|
| Total interest bearing deposits | | | | | 3,864 |
|
| Borrowings | | | | | |
| Federal Home Loan Bank borrowings | (297 | ) | | 115 |
| | (182 | ) |
| Customer repurchase agreements and other short-term borrowings | — |
| | — |
| | — |
|
| Line of Credit | — |
| | (21 | ) | | (21 | ) |
| Long-term borrowings | (159 | ) | | 688 |
| | 529 |
|
| Junior subordinated debentures | (109 | ) | | (97 | ) | | (206 | ) |
| Subordinated debentures | 14 |
| | 60 |
| | 74 |
|
| Total borrowings | | | | | 194 |
|
| Total expense of interest-bearing liabilities | | | | | 4,058 |
|
| Change in net interest income | | | | | $ | 11,830 |
|
(1)Reflects income determined on a FTE basis. See footnote (1) to tables 16 for the related adjustments.
| |
(1) | The table above reflects income determined on a FTE basis. See footnote (1) to tables 15 for the related adjustments. |
| |
(2) | Loans include portfolio loans and nonaccrual loans; however, unpaid interest on nonaccrual loans has not been included for purposes of determining interest income. |
Provision For Credit Losses The provision for credit losses represents the charge to expense that is required to maintain an appropriate level of allowance for credit losses. Provision was $25.0 millionThe Company recorded a release of provision for credit losses duringof $2.5 million for the three months ended March 31, 2021, primarily due to an improved economic outlook coupled with lower loan balances. The Company recorded a provision expense of $25.0 million for the three months ended March 31, 2020, as compared to $1.0 million for the comparable year-ago periods. The elevated provision for credit losses during the first quarter of 2020which was calculated under the newly adopted CECL methodology, which became effective January 1, 2020, and wasprimarily driven primarily by anticipated loan losses related to the COVID-19 pandemic. The Company’s allowance for credit losses, as a percentage of total loans, was 1.16% at March 31, 2021, 1.21% at December 31, 2020, and 1.04% at March 31, 2020, 0.76% at December 31, 2019, and 0.93% at March 31, 2019.2020. The Company recorded net charge-offs of $3.3 million and $384,000 for the three months ended March 31, 2020, as compared to net charge-offs of $153,000 for the three months ended2021 and March 31, 2019. Please refer2020, respectively. Refer to Note 4 Loans,"Loans, Allowance for Credit Losses and Credit Quality" within Condensedthe Notes to Consolidated Financial Statements included in Part I. Item 1 hereof,of this Report, for further details surrounding the Company's accounting policies under the CECL standard and primary drivers of the provision for credit losses duringfor the period.
Noninterest Income The following table sets forth information regarding noninterest income for the periods shown:
Table 1718 - Noninterest Income | | | | | | | | | | Three Months Ended | | Three Months Ended |
| | March 31 | | Change | | March 31 | | Change |
| | 2020 | | 2019 | | Amount | | % | | 2021 | | 2020 | | Amount | | % |
| | (Dollars in thousands) | | | | (Dollars in thousands) | | |
| Deposit account fees | $ | 4,970 |
| | $ | 4,406 |
| | $ | 564 |
| | 12.80 | % | Deposit account fees | $ | 3,584 | | | $ | 4,970 | | | $ | (1,386) | | | (27.89) | % |
| Interchange and ATM fees | 4,896 |
| | 4,516 |
| | 380 |
| | 8.41 | % | Interchange and ATM fees | 2,720 | | | 4,896 | | | (2,176) | | | (44.44) | % |
| Investment management | 6,829 |
| | 6,748 |
| | 81 |
| | 1.20 | % | Investment management | 8,304 | | | 6,829 | | | 1,475 | | | 21.60 | % |
| Mortgage banking income | 861 |
| | 806 |
| | 55 |
| | 6.82 | % | Mortgage banking income | 5,740 | | | 861 | | | 4,879 | | | 566.67 | % |
| Gain on life insurance benefits | 357 |
| | — |
| | 357 |
| | 100.00% |
| Gain on life insurance benefits | 258 | | | 357 | | | (99) | | | (27.73) | % |
| Increase in cash surrender value of life insurance policies | 1,276 |
| | 972 |
| | 304 |
| | 31.28 | % | Increase in cash surrender value of life insurance policies | 1,323 | | | 1,276 | | | 47 | | | 3.68 | % |
| | Loan level derivative income | 3,597 |
| | 641 |
| | 2,956 |
| | 461.15 | % | Loan level derivative income | 173 | | | 3,597 | | | (3,424) | | | (95.19) | % |
| Other noninterest income | 3,649 |
| | 3,444 |
| | 205 |
| | 5.95 | % | Other noninterest income | 3,144 | | | 3,649 | | | (505) | | | (13.84) | % |
| Total | $ | 26,435 |
| | $ | 21,533 |
| | $ | 4,902 |
| | 22.77 | % | Total | $ | 25,246 | | | $ | 26,435 | | | $ | (1,189) | | | (4.50) | % |
The primary reasons for the variances in the noninterest income categories shown in the preceding table include:
•Deposit account fees increased duedecreased for the three months ended March 31, 2021 in comparison to overall increased household accounts, including the impactyear ago period, driven primarily by reductions in overdraft fees as customers benefited from government stimulus payments during the first quarter of the BHB acquisition.2021.
•Interchange and ATM fees have increased, driven mainly by increased account activity and a larger customer base fromdecreased for the BHB acquisition.
Investment management income was consistent withthree months ended March 31, 2021 in comparison to the year ago period. Assets under administration were approximately $4.0period, which decrease primarily reflects the negative impact of the Durbin Amendment, which the Company became subject to effective July 1, 2020 as a result of crossing the $10 billion asset threshold, and an overall decrease in consumer spending as customers focused on retaining liquidity following the onset of March 31, 2020 and 2019, respectively, with the current quarter asset values negatively impacted by general stock market declines associated with COVID-19 concerns.
Mortgage banking income increased modestly despite significantly stronger closing volumespandemic late in the first quarter of 2020 as compared2020.
•Investment management income increased for the three months ended March 31, 2021 in comparison to the year ago period. Sharp reductions in ratesperiod primarily driven by more favorable market conditions during the first quarter of 2020 caused severe secondary market disruption and uncertainty over pipeline closing assumptions throughout2021, along with overall growth in assets under administration which increased 29.91% to $5.2 billion at March 31, 2021, from $4.0 billion at Mach 31, 2020.
•Mortgage banking income increased for the mortgage market, leading to significant declinesthree months ended March 31, 2021 in value over various hedging positions. In additioncomparison to the reduced hedge values, the Company also recorded a $661,000 loss related to the valuation of mortgage servicing assets.
The Company received proceeds on life insurance policies during the first quarter of 2020 resulting in gains of $357,000. There were no such gains during the first quarter of 2019.
The increase in cash surrender value of life insurance policies increasedyear ago period primarily due to policies obtained fromincreased loan volume and continued strong demand largely driven by the BHB acquisition.low interest rate environment.
•Loan level derivative income increaseddecreased for the three months ended March 31, 2021 primarily as a result of higherlower customer demand.demand in comparison to the year ago period.
•Other noninterest income increased duedecreased for the three months ended March 31, 2021, primarily attributable to higher credit card feedecreases in equipment rental income, income on called securities, merchant processing1031 exchange fee income and checkbook fees;FHLB dividend income, partially offset by decreasesincreases in unrealized gains on equity securities and reduced business credit card interchange fees.loan workout costs.
Noninterest Expense The following table sets forth information regarding non-interest expense for the periods shown:
Table 1819 - Noninterest Expense
| | | | | | | | | | | | | | | | | | | | | | | |
| | Three Months Ended |
| March 31 | | Change |
| | 2021 | | 2020 | | Amount | | % |
| | (Dollars in thousands) | | |
| Salaries and employee benefits | $ | 39,889 | | | $ | 37,349 | | | $ | 2,540 | | | 6.80 | % |
| Occupancy and equipment expenses | 9,273 | | | 9,317 | | | (44) | | | (0.47) | % |
| Data processing & facilities management | 1,665 | | | 1,658 | | | 7 | | | 0.42 | % |
| FDIC assessment | 1,050 | | | — | | | 1,050 | | | 100.00% |
| | | | | | | |
| Consulting expense | 2,391 | | | 1,336 | | | 1,055 | | | 78.97 | % |
| Core deposit amortization | 1,392 | | | 1,531 | | | (139) | | | (9.08) | % |
| | | | | | | |
| | | | | | | |
| | | | | | | |
| | | | | | | |
| | | | | | | |
| | | | | | | |
| | | | | | | |
| | | | | | | |
| Software maintenance | 1,970 | | | 1,685 | | | 285 | | | 16.91 | % |
| Unrealized loss on equity securities | — | | | 1,799 | | | (1,799) | | | (100.00) | % |
| Other noninterest expenses | 12,052 | | | 12,165 | | | (113) | | | (0.93) | % |
| Total | $ | 69,682 | | | $ | 66,840 | | | $ | 2,842 | | | 4.25 | % |
| | | | | | | |
| |
| | | |
| | | | | | | |
| | | |
| | | | | | | |
| | | | | | | |
| | | | | | | |
| | | | | | | |
| | | | | | | |
| | | | | | | |
| | | | | | | |
| | | | | | | |
| | | | | | | |
| | | | | | | |
| | | | | | | |
| | | | | | | |
| | | | | | | |
| | | | | | | |
| | | | | | | |
| | | | | | | |
| | | | | | | |
| | | | | | | |
|
| | | | | | | | | | | | | | |
| | Three Months Ended |
| | March 31 | | Change |
| | 2020 | | 2019 | | Amount | | % |
| | (Dollars in thousands) | | |
| Salaries and employee benefits | $ | 37,349 |
| | $ | 33,117 |
| | $ | 4,232 |
| | 12.78 | % |
| Occupancy and equipment expenses | 9,317 |
| | 7,130 |
| | 2,187 |
| | 30.67 | % |
| Data processing & facilities management | 1,658 |
| | 1,326 |
| | 332 |
| | 25.04 | % |
| FDIC assessment | — |
| | 616 |
| | (616 | ) | | (100.00 | )% |
| Advertising expense | 1,105 |
| | 1,213 |
| | (108 | ) | | (8.90 | )% |
| Consulting expense | 1,336 |
| | 764 |
| | 572 |
| | 74.87 | % |
| Core deposit amortization | 1,531 |
| | 857 |
| | 674 |
| | 78.65 | % |
| Merger and acquisition expenses | — |
| | 1,032 |
| | (1,032 | ) | | (100.00 | )% |
| Software maintenance | 1,685 |
| | 1,165 |
| | 520 |
| | 44.64 | % |
| Unrealized loss on equity securities | 1,799 |
| | — |
| | 1,799 |
| | 100.00% |
|
| Other noninterest expenses | 11,060 |
| | 9,091 |
| | 1,969 |
| | 21.66 | % |
| Total | $ | 66,840 |
| | $ | 56,311 |
| | $ | 10,529 |
| | 18.70 | % |
The primary reasons for the variances in the noninterest expense categories shown in the preceding table include:
•The increase in salaries and employee benefits reflects overallfor the three months ended March 31, 2021 is due primarily to increases in incentive compensation expenses, commissions, retirement costs and payroll taxes.
•FDIC assessment increased for the employee base, including the BHB acquisition, along with increasesthree months ended March 31, 2021, in expenses associated with medical insurance and retirement benefit costs offset somewhat by a decrease in incentive compensation.
Occupancy and equipment expenses increased mainly duecomparison to the acquired BHB branch network offset by a decrease in snow removal costs.
Data processing increases reflect overall increased levels of transactional activity in conjunction with the Company's growth.
year ago period. The Company incurredpreviously benefited from a small bank assessment credit, which resulted in no FDIC assessment expense during the first quarter of 2020, reflecting small bank2020. In addition, the Company's assessment credits allocatedbase increased due to the Company crossing the $10 billion asset threshold, resulting in conjunction with the Deposit Insurance Fund's attainment of a 1.38 percent reserve ratio.an increase to fees incurred.
•Consulting expense increased in conjunctionfor the three months ended March 31, 2021 associated with the Company's overall growth, and implementation of strategic initiatives.
The core deposit amortization increased due to additional core deposit intangibles associated with the BHB acquisition.
The mergerinitiatives, and acquisition expensesprojects and measures implemented in 2019 is primarily attributableresponse to the BHB acquisition, with a small remainder associated with the MNB Bancorp acquisition. The majority of these costs include legal, professional fees, and integration costs. There mere no merger and acquisition costs during the first quarter of 2020.COVID-19 pandemic.
•Software maintenance increased during 2020for the three months ended March 31, 2021 primarily due to the Company's continued investment in its technology infrastructure.
Unrealized loss on equity securities increased primarily due•Other noninterest expense remained relatively consistent when comparing the three months ended March 31, 2021 to the overall declineyear ago period, with decreases in general market conditions, driven primarily by COVID-19 pandemic uncertainty.
The increase in other noninterest expenses is primarily due to increases in losses on fixed asset disposals, recruitment expense,costs, amortization of other intangibles and appraisal fees, partiallysponsorships, offset by decreasesincreases in in the provision for unfunded commitments.commitments, contactless card issuance costs and contract labor.
Income Taxes The tax effect of all income and expense transactions is recognized by the Company in each year’s consolidated statements of income, regardless of the year in which the transactions are reported for income tax purposes. The following table sets forth information regarding the Company’s tax provision and applicable tax rates for the periods indicated:
Table 1920 - Tax Provision and Applicable Tax Rates
| | | | | | | | | | | | | | | |
| | | Three Months Ended |
| | | | March 31 |
| | | | | | 2021 | | 2020 |
| | | | | | (Dollars in thousands) |
| Combined federal and state income tax provision | | | | | $ | 11,937 | | | $ | 2,148 | |
| Effective income tax rate | | | | | 22.25 | % | | 7.43 | % |
| Blended statutory tax rate | | | | | 27.92 | % | | 27.88 | % |
|
| | | | | | | |
| | Three Months Ended |
| | March 31 |
| | 2020 | | 2019 |
| | (Dollars in thousands) |
| Combined federal and state income tax provision | $ | 2,148 |
| | $ | 11,522 |
|
| Effective income tax rate | 7.43 | % | | 24.65 | % |
| Blended statutory tax rate | 27.88 | % | | 28.23 | % |
The Company’s effective tax rate in 20202021 thus far is lowerhigher as compared to the year ago period primarily due to higher net income, as well as the impact of discrete items, which are subjectincluding tax benefits related to fluctuation year over year.low income housing tax credits and equity compensation. The current quarter discrete tax amounts for the three months ended March 31, 2020 include a significant benefit of $4.7 million associated with the net operating loss (NOL) carryback provision of the CARES Act. The NOL was generated in relation to the BHB acquisition. Additionally, the Company fully realized tax credit benefits from the New Market Tax Credit program asacquisition of December 31, 2019 and therefore, the current year effective tax rate reflects no benefit from these particular credits.Blue Hills Bancorp, Inc. in 2019. The effective tax rates in the table above are lower than the blended statutory tax rates due to the aforementioned discrete items as well as certain tax preference assets such as life insurance policies, tax exempt bonds, and federal tax credits. The Company’s blended statutory tax rate for the current quarterthree months ended March 31, 2021 is comparable to the year ago period.
The Company invests in various low income housing projects, which are real estate limited partnerships that acquire, develop, own and operate low and moderate-income housing developments. As a limited partner in these operating partnerships, the Company will receive tax credits and tax deductions for losses incurred by the underlying properties. The investments are accounted for using the proportional amortization method and will be amortized over various periods through 2037,2039, which represents the period that the tax credits and other tax benefits will be utilized. The total committed investment in these partnerships is $110.7$152.8 million, of which $67.2$85.8 million hashad been funded as of March 31, 2020.2021. It is expected that the limited partnership investments will generate a net tax benefit of approximately $2.0$1.9 million for the full calendarfiscal year of 20202021 and a total of $13.2$20.6 million over the remaining life of the investments from the combination of the tax credits and operating losses.
Risk Management
The Board of Directors and Managementmanagement have identified significant risks which affect the Company, including credit risk, market risk, liquidity risk, price risk, operations risk, cybersecurity risk, consumer compliance risk, reputation risk, and strategic risk. The Board of Directors has approved an Enterprise Risk Management Policy, and Managementmanagement has adopted a Risk Appetite Statement that addresses each risk category. Management reviews key risks and their mitigation on an ongoing basis and provides regular enterprise risk management reports to the Board of Directors. The Board of Directors, with the assistance of the Board’s Risk Committee, oversees Management’smanagement’s enterprise risk assessment and management.
Credit Risk Credit risk is the possibility that customers or other counterparties may not repay loans or other contractual obligations according to their terms. While the collateral securing loans may be sufficient in some cases to recover the amount due, in other cases the Company may experience significant credit losses which could have an adverse effect on its operating results. The Company makes assumptions and judgments about the collectability of its loan portfolio, including the creditworthiness of its borrowers and counterparties and the value of collateral for the repayment of loans. For further discussion regarding the credit risk and the credit quality of the Company’s loan portfolio, see Note 4, “Loans, Allowance for Credit Losses and Credit Quality” within Condensedthe Notes to Consolidated Financial Statements included in Part I. Item 1 of this Report.
OperationsOperational Risk OperationsOperational risk is the risk of loss from the Company’s operations due to human behavior, inadequate or failed internal process, people, systems and controls, and external influences such as market conditions, fraudulent activities, natural disasters, and security risks. Potential operational risk exposure exists throughout the Company. The continued effectiveness of colleagues, technical systems, operational infrastructure, and relationships with key third party service providers are integral to mitigating
operations operational risk, and any shortcomings subject the Company to risks that vary in size, scale and scope. OperationsOperational risks include, but are not limited to, operational or technical failures, unlawful tampering with technical systems, cyber security, terrorist activities, ineffectiveness or exposure due to interruption in third party support, as well as the loss of key individuals or failure on the part of the key individuals to perform properly. Management maintains an OperationsOperational Risk Committee to assess and mitigate operationsoperational risk which contributes to periodic enterprise risk management reporting to the Board.Board of Directors.
Compliance Risk Compliance risk is the risk of regulatory sanctions or financial loss resulting from the failure to comply with rules and regulations issued by the various banking agencies, the U.S. Securities and Exchange Commission, the NASDAQ Stock Market, and good banking practices. Activities which may expose the Company to compliance risk include money laundering, privacy and data protection, adherence to laws and regulations, community reinvestment initiatives, and employment and tax matters. Compliance risk is mitigated through the use of written policies and procedures, staff training, and continuous monitoring of activities for adherence to policies and procedures. Management maintains a Consumer Compliance CommitteeAdvisory Team to assess and mitigate compliance risk that contributes to periodic enterprise risk management reporting to Executive Management and the Board.Board of Directors.
Strategic and Reputation Risk Strategic and reputation risk is the risk of loss due to impairment of reputation, failure to fully develop and execute business plans, and failure to assess current and new opportunities and threats in business, markets, and products. Management seeks to mitigate strategic and reputational risk through annual strategic planning, frequent
executive review of strategic plan progress, ongoing competitive and technological observation, assessment processes of new product,products, new branches, and new business initiatives, adherence to ethical standards, a philosophy of customer advocacy, a structured process of customer complaint resolution, and ongoing reputational monitoring, crisis management planning, and management tools.
Market Risk Market risk is the sensitivity of income to changes in interest rates, equity prices, foreign exchange rates, commodity prices, and other market-driven rates or prices. The Company’s most significant market risk exposure is interest rate risk.
Interest rate risk is the sensitivity of income due to changes in interest rates. Interest rate changes, as well as fluctuations in the level and duration of assets and liabilities, affect net interest income, the Company’s primary source of revenue. Interest rate risk arises directly from the Company’s core banking activities. In addition to directly impacting net interest income, changes in the level of interest rates can also affect the amount of loans originated, the timing of cash flows on loans and securities, and the fair value of securities and derivatives, and have other effects.
Management maintains an Asset Liability Committee to manage interest rate risk, which strives to control interest rate risk within limits approved by the Board of Directors that reflect the Company’s tolerance for interest rate risk over short-term and long-term horizons. The Company attempts to manage interest rate risk by identifying, quantifying, and, where appropriate, hedging exposure. If assets and liabilities do not re-price simultaneously and in equal volume, the potential for interest rate exposure exists. It is the Company's objective to maintain stability in the growth of net interest income through the maintenance of an appropriate mix of interest-earning assets and interest-bearing liabilities and, when necessary, within limits Managementmanagement determines to be prudent, through the use of off-balance sheet hedging instruments such as interest rate swaps, floors, and caps.
The Company quantifies its interest rate exposures using net interest income simulation models, as well as simpler gap analysis, and an Economic Value of Equity analysis. Key assumptions in these simulation analyses relate to behavior of interest rates and behavior of the Company’s deposit and loan customers. The most material assumptions relate to the prepayment of mortgage assets (including mortgage loans and mortgage-backed securities) and the life and sensitivity of non-maturity deposits (e.g., demand deposit, negotiable order of withdrawal, savings, and money market accounts). In the case of prepayment of mortgage assets, assumptions are derived from published dealer median prepayment estimates for comparable mortgage loans. The risk of prepayment tends to increase when interest rates fall. Since future prepayment behavior of loan customers is uncertain, interest rate sensitivity of loans cannot be determined exactly and actual behavior may differ from assumptions.assumption.
Based upon the net interest income simulation models, the Company currently forecasts that the Bank’s assets re-price faster than the liabilities. As a result, the net interest income of the Bank will benefit as market rates increase, and contract if market rates decrease. The Company runs several scenarios to quantify and effectively assist in managing this position. These scenarios include instantaneous parallel shifts in market rates as well as gradual (12-24 months) shifts in market rates, and may also include other alternative scenarios as management deems necessary, given the interest rate environment.
The results of all scenarios and the impact to net interest income are outlined in the table below:
Table 2021 - Interest Rate Sensitivity
| | | | | | | | | | | | | | | | | | | | | | | |
| | March 31 |
| | 2021 | | 2020 |
| Year 1 | | Year 2 | | Year 1 | | Year 2 |
| Parallel rate shocks (basis points) | | | | | | | |
| | | | | | | |
| -100 | (2.8) | % | | (14.0) | % | | (1.1) | % | | (3.5) | % |
| +100 | 6.8 | % | | 2.0 | % | | 3.7 | % | | 4.6 | % |
| +200 | 14.5 | % | | 12.6 | % | | 8.1 | % | | 11.2 | % |
| +300 | 22.7 | % | | 23.6 | % | | 12.7 | % | | 17.6 | % |
| +400 | 30.5 | % | | 34.0 | % | | 17.0 | % | | 23.8 | % |
| | | | | | | |
| Gradual rate shifts (basis points) | | | | | | | |
| | | | | | | |
| -100 over 12 months | (1.1) | % | | 12.4 | % | | (0.1) | % | | (3.0) | % |
| +200 over 12 months | 6.6 | % | | 10.2 | % | | 3.5 | % | | 9.2 | % |
| +400 over 24 months | 6.7 | % | | 18.7 | % | | 3.5 | % | | 13.5 | % |
| | | | | | | |
| Alternative scenarios | | | | | | | |
| Yield Curve Twist (1) | n/a | | n/a | | 1.1 | % | | 5.6 | % |
| Flat up 200 basis points scenario | 6.8 | | | 9.7 | | | n/a | | n/a |
(1)In the yield curve twist scenario, rates increase 200 basis points over a two year horizon. The parallel shift occurs faster on the long end of the curve than it does on the short end, creating a temporary increase in the steepness of the curve during the interim period of the twist.
|
| | | | | | | | | | | |
| | March 31 |
| | 2020 | | 2019 |
| | Year 1 | | Year 2 | | Year 1 | | Year 2 |
| Parallel rate shocks (basis points) | | | | | | | |
| -100 | (1.1 | )% | | (3.5 | )% | | (4.5 | )% | | (7.4 | )% |
| +100 | 3.7 | % | | 4.6 | % | | 3.5 | % | | 6.4 | % |
| +200 | 8.1 | % | | 11.2 | % | | 6.4 | % | | 11.4 | % |
| +300 | 12.7 | % | | 17.6 | % | | 9.3 | % | | 16.4 | % |
| +400 | 17.0 | % | | 23.8 | % | | 12.2 | % | | 21.3 | % |
| | | | | | | | |
| Gradual rate shifts (basis points) | | | | | | | |
| -100 over 12 months | (0.1 | )% | | (3.0 | )% | | (2.0 | )% | | (6.1 | )% |
| +200 over 12 months | 3.5 | % | | 9.2 | % | | 3.0 | % | | 9.8 | % |
| +400 over 24 months | 3.5 | % | | 13.5 | % | | 3.0 | % | | 12.7 | % |
| | | | | | | | |
| Alternative scenarios | | | | | | | |
| Yield Curve Twist | 1.1 | % | | 5.6 | % | | 0.9 | % | | 6.8 | % |
The results depicted in the table above are dependent on material assumptions. For instance, asymmetrical rate behavior can have a material impact on the simulation results. If competition for deposits prompts the Company to raise rates on those liabilities more quickly than is assumed in the simulation analysis without a corresponding increase in asset yields, net interest income would be negatively impacted. Alternatively, if the Company is able to lag increases in deposit rates as loans re-price upward, net interest income would be positively impacted.
The most significant factors affecting market risk exposure of the Company’s net interest income during the three months ended March 31, 20202021 were the shape of the U.S. Government securities and interest rate swap yield curve, the U.S. prime interest rate and LIBOR rates, and the interest rates being offered on long-term fixed rate loans. Additionally, the full economic impact of the COVID-19 pandemic on these factors remains uncertain.
The Company manages the interest rate risk inherent in both its loan and borrowing portfolios by using interest rate swap agreements and interest rate caps and floors. An interest rate swap is an agreement whereby one party agrees to pay a floating rate of interest on a notional principal amount in exchange for receiving a fixed rate of interest on the same notional amount for a predetermined period of time from the other party. Interest rate caps and floors are agreements where one party agrees to pay a floating rate of interest on a notional principal amount for a predetermined period of time to a second party if certain market interest rate thresholds are realized. The amounts relating to the notional principal amount are not actually exchanged. Additionally, the Company may manage the interest rate risk inherent in its mortgage banking operations by entering into forward sales contracts. In an effort to mitigate that risk, forward delivery sales commitments are executed, under which the Company agrees to deliver whole mortgage loans to various investors. See Note 9,6, “Derivative and Hedging Activities” within Condensedthe Notes to Consolidated Financial Statements included in Part I. Item 1 hereofof this Report for additional information regarding the Company’s Derivative Financial Instruments.
The Company’s earnings are not directly or materially impacted by movements in foreign currency rates or commodity prices. Movements in equity prices may have a modest impact on earnings by affecting the volume of activity or the amount of fees from investment-related business lines. See Note 3, “Securities” within Condensedthe Notes to Consolidated Financial Statements included in Part I. Item 1.
Liquidity Risk Liquidity risk is the risk that the Company will not have the ability to generate adequate amounts of cash in the most economical way to meet its ongoing obligations to pay deposit withdrawals, repay borrowings, and fund loans. The Company’s primary sources of funds are deposits, borrowings, and the amortization, prepayment, and maturities of loans
and securities. The Bank utilizes its extensive branch network to access retail customers who provide a base of in-market core deposits.
These funds are principally comprised of demand deposits, interest checking accounts, savings accounts, and money market accounts. Deposit levels are greatly influenced by interest rates, economic conditions, and competitive factors.
Management maintains an Asset Liability Committee to manage liquidity risk. The Company’s primary measure of short-term liquidity is the Total Basic Surplus/Deficit as a percentage of assets. This ratio, which is an analysis of the relationship between liquid assets plus available funding at the FHLB, less short-term liabilities relative to total assets, was within policy limits at March 31, 2020.2021. The Total Basic Surplus/Deficit measure is affected primarily by changes in deposits, securities and short-term investments, loans, and borrowings. An increase in deposits, without a corresponding increase in nonliquid assets, will improve the Total Basic Surplus/Deficit measure, whereas, an increase in loans, with no increase in deposits, will decrease the measure. Other factors affecting the Total Basic Surplus/Deficit measure include collateral requirements at the FHLB, changes in the securities portfolio, and the mix of deposits.
The Bank seeks to increase deposits without adversely impacting the weighted average cost of those funds. As part of a prudent liquidity risk management practice, the Company maintains various liquidity sources, some of which are only accessed on a contingency basis. Accordingly, Management has implemented funding strategies that include FHLB advances, Federal Reserve Bank borrowing capacity, and repurchase agreement lines. These funding sources are a contingent source of liquidity and, when profitable lending and investment opportunities exist, access to them provides a means to grow the balance sheet.
Borrowing capacity at the FHLB and the Federal Reserve is impacted by the amount and type of assets available to be pledged. For example, a prime, one-to-four family, residential loan, may provide 75 cents of borrowing capacity for every $1.00 pledged, whereas, a commercial loan may provide a lower amount. As a result, the Company’s lending decisions can also affect its liquidity position.
The Company can raise additional funds through the issuance of equity or unsecured debt privately or publicly and has done so in the past. Additionally, the Company is able to enter into repurchase agreements or acquire brokered deposits at its discretion. The availability and cost of equity or debt on an unsecured basis is dependent on many factors. Some factors that will impact this source of liquidity are the Company’s financial position, the market environment, and the Company’s credit rating. The Company monitors the factors that could impact its ability to raise liquidity through these channels.
As a result of PPP loan funding, government stimulus programs and a customer focus on retaining liquidity, the Company continued to experience significant growth in deposits and a buildup of liquidity through these sources during the first quarter of 2021. In addition to this excess liquidity as of March 31, 2021, the Company also maintains sufficient alternative sources of funding from which it may draw, if necessary. The table below shows current and unused liquidity capacity from various sources as of the dates indicated:
Table 2122 - Sources of Liquidity
| | | | | | | | | | | | | | | | | | | | | | | |
| | March 31, 2021 | | December 31, 2020 |
| | Outstanding | | Additional
Borrowing
Capacity | | Outstanding | | Additional
Borrowing Capacity |
| | (Dollars in thousands) |
| Federal Home Loan Bank of Boston (1) | $ | 35,717 | | | $ | 1,261,506 | | | $ | 35,740 | | | $ | 1,372,671 | |
| Federal Reserve Bank of Boston (2) | — | | | 1,382,439 | | | — | | | 1,355,809 | |
| Unpledged Securities | — | | | 985,024 | | | — | | | 716,961 | |
| Line of Credit | — | | | 50,000 | | | — | | | 50,000 | |
| Long-term borrowing (3) | 28,099 | | | — | | | 32,773 | | | — | |
| | | | | | | |
| Junior subordinated debentures (3) | 62,851 | | | — | | | 62,851 | | | — | |
| Subordinated debt (3) | 49,720 | | | — | | | 49,696 | | | — | |
| Reciprocal deposits (3) | 233,179 | | | — | | | 237,902 | | | — | |
| Brokered deposits (3) | 7,792 | | | — | | | 8,538 | | | — | |
| $ | 417,358 | | | $ | 3,678,969 | | | $ | 427,500 | | | $ | 3,495,441 | |
|
| | | | | | | | | | | | | | | |
| | March 31, 2020 | | December 31, 2019 |
| | Outstanding | | Additional Borrowing Capacity | | Outstanding | | Additional Borrowing Capacity |
| | (Dollars in thousands) |
| Federal Home Loan Bank of Boston (1) | $ | 358,591 |
| | $ | 1,179,248 |
| | $ | 115,748 |
| | $ | 1,557,559 |
|
| Federal Reserve Bank of Boston (2) | — |
| | 692,179 |
| | — |
| | 954,748 |
|
| Unpledged Securities | — |
| | 754,494 |
| | — |
| | 790,304 |
|
| Line of Credit | — |
| | 50,000 |
| | — |
| | 50,000 |
|
| Long-term borrowing (3) | 74,920 |
| | — |
| | 74,906 |
| | — |
|
| Junior subordinated debentures (3) | 62,849 |
| | — |
| | 62,848 |
| | — |
|
| Subordinated debt (3) | 49,625 |
| | — |
| | 49,601 |
| | — |
|
| Reciprocal deposits (3) | 218,971 |
| | — |
| | 211,213 |
| | — |
|
| Brokered deposits (3) | 197,436 |
| | — |
| | 281,773 |
| | — |
|
| | $ | 962,392 |
| | $ | 2,675,921 |
| | $ | 796,089 |
| | $ | 3,352,611 |
|
(1)Loans with a carrying value of $2.1 billion at each of March 31, 2021 and December 31, 2020 were pledged to the Federal Home Loan Bank of Boston resulting in this additional unused borrowing capacity.
| |
(1) | Loans with a carrying value of $2.3 billion and $2.5 billion at March 31, 2020 and December 31, 2019, respectively, have been pledged to the Federal Home Loan Bank of Boston resulting in this additional unused borrowing capacity. |
| |
(2) | Loans with a carrying value of $1.2 billion and $1.5 billion at March 31, 2020 and December 31, 2019, respectively, have been pledged to the Federal Reserve Bank of Boston resulting in this additional unused borrowing capacity. |
| |
(3) | The additional borrowing capacity has not been assessed for these categories. |
(3)The additional borrowing capacity has not been assessed for these categories.
In addition to policies used for managing operational liquidity, the Board of Directors and Managementmanagement recognize the need to establish reasonable guidelines for managing through an environment of heightened liquidity risk. Catalysts for elevated liquidity risk can be Bank-specific issues and/or systemic industry-wide events, such as the COVID-19 pandemic.events. It is therefore the responsibility of Managementmanagement to institute systems and controls to provide advanced detection of potentially significant funding shortages, establish methods for assessing and monitoring risk levels, and institute prompt responses that may alleviate/alleviate or circumvent
a potential liquidity crisis. Management has established a Liquidity Contingency Plan to provide a framework for the Bank to help detect liquidity problems promptly and appropriately address potential liquidity problems in a timely manner. In a period of perceived heightened liquidity risk, the Liquidity Contingency Plan provides for the establishment of a Liquidity Crisis Task Force. The Liquidity Crisis Task Force is responsible for monitoring the potential for a liquidity crisis and for establishing and executing an appropriate response.
Off-Balance Sheet Arrangements There were no material changes in off-balance sheet financial instruments during the three months ended March 31, 2020.2021.
See Note 9,6, "Derivative and Hedging Activities" and Note 14,10, "Commitments and Contingencies" withinwithin Condensed the Notes to Consolidated Financial Statements included in Part I. Item 1 for more information relating to the Company's other off-balance sheet financial instruments.
Contractual Obligations, Commitments, and Contingencies There were no material changes in contractual obligations, commitments, or contingencies during the three months ended March 31, 2020.2021.
Please referRefer to the Company's Annual Report on2020 Form 10-K for the fiscal year ended December 31, 2019 for a complete table of contractual obligations, commitments and contingencies.
Item 3. Quantitative and Qualitative Disclosures About Market Risk
Information required by this Item 3 is included in the "Risk Management" section of Part I, Item 2 of Part I of this Form 10-Q, “Management’sManagement's Discussion and Analysis of Financial Condition and Results of Operations.”Operations of this Report and is incorporated herein by reference.
Item 4. Controls and Procedures
Conclusion Regarding the Effectiveness of Disclosure Controls and Procedures. The Company carried out an evaluation, under the supervision and with the participation of the Company’s management, including the Company’s Chief Executive Officer along with the Company’s Chief Financial Officer, of the effectiveness of the design and operation of the Company’s disclosure controls and procedures, as such term is defined under Rules 13a-15(e) and 15d-15(e) promulgated under the Securities Exchange Act of 1934, as amended. Based upon that evaluation, the Company’s Chief Executive Officer along with the Company’s Chief Financial Officer concluded that the Company’s disclosure controls and procedures arewere effective as of the end of the period covered by this quarterly report.
Changes in Internal ControlsControl over Financial Reporting. There were no changes in the Company's internal controlscontrol over financial reporting that occurred during the first quarter of 20202021 that have materially affected or are reasonably likely to materially affect the Company’s internal controlscontrol over financial reporting. The Company has not experienced any material impact to the Company’s internal controlscontrol over financial reporting due to the fact that most of the Company’s employees responsible for financial reporting are working remotely during the COVID-19 pandemic. The Company is continually monitoring and assessing the impact of the COVID-19 pandemic on the Company’s internal controlscontrol over financial reporting to minimize theany impact to theiron the design and operating effectiveness.
PART II. OTHER INFORMATION
Item 1. Legal Proceedings
At March 31, 2020,2021, the Bank was involved in pending lawsuits that arose in the ordinary course of business. Management has reviewed these pending lawsuits with legal counsel and has taken into consideration the view of counsel as to their outcome. In the opinion of management, the final disposition of pending lawsuits is not expected to have a material adverse effect on the Company’s financial position or results of operations.
Item 1A. Risk Factors
The section titled Risk Factors in Part I, Item 1A of the Company's 2019 Annual Report on2020 Form 10-K includes a discussion of the manymaterial risks and uncertainties the Company faces, any one or more of which could have a material adverse effect on the Company's business, results of operations, or financial condition (including capital and liquidity). The information presented below provides an update to, and should be read in conjunction with, the risk factors and other information contained in the Company's 2019 Annual Report2020 Form 10-K as well as any updated to our risk factors included in subsequent Quarterly Reports on Form 10-K.10-Q.
Except as presented below, there have been no material changes to the risk factors described in the Company's 2019 Annual Report2020 Form 10-K.
Failure to complete the acquisition of Meridian Bancorp, Inc. for any reason could negatively impact future business and financial results of the Company.
On April 22, 2021, the Company announced the entry into a definitive agreement (the “Merger Agreement”) under which the Company will acquire Meridian Bancorp, Inc. (“Meridian”) and Rockland Trust Company will acquire East Boston Savings Bank (the “Merger”). Completion of the Merger is subject to customary closing conditions, including, among others, (i) approval of the issuance of shares of the Company’s common stock pursuant to the Merger Agreement (the “Company share issuance”) and adoption and approval by Meridian’s stockholders of the Merger Agreement, (ii) authorization for listing on the Nasdaq Stock Market of the shares of the Company’s common stock to be issued in the Merger, subject to official notice of issuance, (iii) the receipt of all required regulatory approvals, including the approval of the Board of Governors of the Federal Reserve System, the Federal Deposit Insurance Corporation, the Massachusetts Commissioner of Banks, the Massachusetts Housing Partnership Fund and the Depositors Insurance Fund, without the imposition of a burdensome condition, (iv) the effectiveness of the registration statement on Form 10-K.S-4 to be filed with the Securities and Exchange Commission by the Company in connection with the transactions contemplated by the Merger Agreement and (v) the absence of any order, injunction, decree or other legal restraint preventing the completion of the transactions contemplated by the Merger Agreement or making them illegal. Each party’s obligation to complete the Merger is also subject to additional customary conditions, including, subject to certain exceptions, the accuracy of the representations and warranties of the other party and the performance in all material respects by each party of its obligations under the Merger Agreement.
The COVID-19 pandemic is adversely affectingMerger Agreement provides certain termination rights for both the Company and its customers, counterparties, employees, and third-party service providers, andMeridian, including that a termination fee of $44.2 million will be payable by either the full extentCompany or Meridian, as applicable, in connection with the termination of the adverse impacts onMerger Agreement under certain circumstances.
If the Company'sMerger is not completed for any reason, the business financial position, results of operations,the Company may be adversely affected and, prospectswithout realizing any of the benefits of having completed the Merger, the Company could be significant.
The spread of COVID-19 has created a global public-health crisis that has resulted in widespread volatility and deteriorations in business, economic, and market conditions and household incomes, including in the Commonwealth of Massachusetts where the Company conducts nearly all of its business. The extent of the impact of the COVID-19 pandemic on the Company's capital and liquidity, and on its business, results of operations, financial position and prospects generally will depend onsubject to a number of evolving factors,risks. In this regard, the Company faces risks and uncertainties due both to the pendency of the Merger and the potential failure to consummate the merger, including:
•The duration, extent, and severitythe occurrence of any event, change or other circumstances that could give rise to the termination of the pandemic. Merger Agreement;
•COVID-19 hasthe risk that Meridian’s stockholders may not yet been containedadopt and could affect significantly more households and businesses. The duration and severityapprove the Merger Agreement;
•the risk that the Company’s shareholders may not approve the Company share issuance;
•the risk that the necessary regulatory approvals may not be obtained or may be obtained subject to conditions that are not anticipated;
•delays in closing the Merger or other risks that any of the pandemic, includingclosing conditions to the Merger may not be satisfied in a timely manner;
•the diversion of management’s time and resources from ongoing business operations due to issues relating to the Merger;
•material adverse changes in the Company’s or Meridian’s operations or earnings; and
•potential for a seasonallitigation in connection with the Merger.
In addition, the Company has incurred and will incur substantial expenses in connection with the negotiation and completion of the transactions contemplated by the Merger Agreement. If the Merger is not consummated, the Company could have to recognize these and other expenses without realized the expected benefits of the Merger.
The acquisition of Meridian may be more difficult, costly or other resurgence after the initial containment, continue to be impossible to predict. Following any containment, there is also substantial uncertainty surrounding the pace of economic recoverytime consuming than expected, and the returnexpected benefits of businessthe merger may not be realized.
Cost or difficulties relating to integration matters might be greater than expected and consumer confidence.
The response of governmentalthe Company may be unable to realize expected cost savings and nongovernmental authorities. Many of their actions have been directed toward curtailing householdsynergies from the Merger in the amounts and business activity to contain COVID-19 while simultaneously deploying fiscal- and monetary-policy measures to partially mitigatein the adverse effects on individual households and businesses. These actions are not always coordinated or consistent across jurisdictions but, in general, have rapidly expanded in scope and intensity, contributing to substantial market volatility.
The effect ontimeframe anticipated. For example, it is possible that the Company's customers, counterparties, employees, and third-party service providers. COVID-19 and its associated consequences and uncertainties, including increased unemployment rates, are affecting individuals, households, and businesses differently and unevenly. Many, however, have already changed their behavior in response to governmental mandates and advisories to sharply restrain commercial and social interactions and discretionary spending. As aintegration process could result in the near term,loss of key employees, the Company's credit, operational,disruption of the Company’s ongoing business or inconsistencies in standards, controls, procedures and other risks have generally increasedpolicies that adversely affect the combined bank’s ability to maintain relationships with customers and foremployees or to achieve the foreseeable future, are expected to remain elevated or increase further.
anticipated benefits and cost savings of the Merger. The effect on economies and markets. Whether the actionsloss of governmental and nongovernmental authorities will be successful in mitigating the adverse effects of COVID-19 is unclear. National, regional, and local economies (including the local economies in the markets areas which the Company serves) and markets could suffer disruptions that are lasting. Governmental actions are meaningfully influencing the interest-rate environment and financial-market activity, whichkey employees could adversely affect the Company's results of operations and financial condition.
During the first quarter of 2020, the most notable impactCompany’s ability to the Company's results of operations was a higher provision expense for credit losses. The Company's provision expense was $25 million for the first quarter of 2020, compared to $1 million for the first quarter of 2019, and $4 million for the fourth quarter of 2019. With the spread of COVID-19successfully conduct its business in the United States having only begun to acceleratemarkets in March 2020,which Meridian now operates, which could have an adverse effect on the Company's forecastCompany’s financial results and the value of macroeconomic conditionsits common stock. The Company’s belief that cost savings and revenue enhancements are achievable is a forward-looking statement that is inherently uncertain. The combined company’s actual cost savings and revenue enhancements, if any, cannot be quantified at this time. Any actual cost savings or revenue enhancements will depend on future expense levels and operating results, including expected lifetime credit losses on the Company's loan portfolio is subject to meaningful uncertainty.
Governments have taken unprecedented steps to partially mitigate the adverse effectstiming of their containment measures. For example, on March 27, 2020, the CARES Act was enacted to inject more than $2 trillioncertain events and general industry, regulatory and business conditions. Many of financial assistance into the U.S. economy. The FRB has taken decisive and sweeping actions as well. Since March 15, 2020, these have included a reduction in the target range for the federal funds rate to 0 to 1/4 percent, a program to purchase an indeterminate amount of Treasury securities and agency mortgage-backed securities, and numerous facilities to support the flow of credit to households and businesses.
The degree to which the Company's actions and those of governments and others will directly or indirectly assist the Company's customers, counterparties, and third-party service providers and advance the Company's business and the economy generally is not yet clear. For example, while the Company's loan-deferral programs may better position customers to resume their regular payments to the Company in the future and enhance the Company's brand and customer loyalty, these programs may negatively impact the Company's revenue and other results of operations at least in the near term, may produce a higher degree of enrollment and other requests for extensions and rewrites than the Company anticipated, and the Company may not be as successful as expected in managing credit risk. In addition, while the FRB’s accommodative monetary policy may benefit the Company to some degree by supporting economic activity among its customers, this policy and sudden shifts in it may inhibit the Company's ability to grow or sustain net interest income and effectively manage interest-rate risk.
The Company is unable to estimate the near-term and ultimate impacts of COVID-19 on the Company's business and operations at this time. The pandemic could cause the Company to experience higher credit losses in its lending portfolio, additional increases in the allowance for credit losses, impairment of goodwill and other financial assets, diminished access to capital markets and other funding sources, further reduced demand for the Company's products and services, and other negative impacts on the Company's financial position, results of operations, and prospects. In addition, while the Company continues to anticipate that its
capital and liquidity positionsevents will be sufficient, sustained adverse effects may impair these positions, preventbeyond the Company from satisfying its minimum regulatory capital ratios and other supervisory requirements, and result in downgrades in its credit ratings.
The COVID-19 pandemic and related governmental mandates and advisories also have necessitated changes in the way the Company and its third party service providers continue operations, and the length of time that it may be required to operate under these circumstances, as well as the potential for conditions to worsen or for significant disruptions to occur, remains unpredictable. All of these risks and uncertainties can be expected to persist at least until the pandemic is demonstrably and sustainably contained, authorities cease curbing household and business activity, and consumer and business confidence recover. COVID-19 and the volatile economic conditions stemming from it or future resurgences could also precipitate or contribute to the other risk factors identified in the Company's 2019 Annual Report on Form 10-K, which in turn could materially adversely affect the Company's business, financial position, results of operations, prospects, and its stock price, and may also affect the Company's business in a manner that is not presently known to it or that the Company currently does not consider to present significant risks to its business, financial position, results of operations or prospects.
As a participating lender in the SBA Paycheck Protection Program (“PPP”), the Company is subject to additional risks of litigation from its customers or other parties regarding the processing of loans for the PPP and risks that the U.S. Small Business Administration (“SBA”) may not fund some or all PPP loan guaranties, which could have a significant adverse impact on the Company's business, financial position, results of operations, and prospects .
The CARES Act included a $349 billion loan program administered through the SBA referred to as the PPP. Under the PPP, small businesses and other entities and individuals can apply for loans from existing SBA lenders and other approved regulated lenders that enroll in the program, subject to numerous limitations and eligibility criteria. The Company is participating as a lender in the PPP. The PPP opened on April 3, 2020; however, becausecontrol of the short timeframe between the passing of the CARES Act and the opening of the PPP, there is some ambiguity in the laws, rules and guidance regarding the operation of the PPP, which exposes the Company to risks relating to noncompliance with the PPP. On or about April 16, 2020, the SBA notified lenders that the $349 billion earmarked for the PPP was exhausted. Congress has approved additional funding for the PPP and President Trump signed the new legislation on April 24, 2020. Since the opening of the PPP, several other larger banks have been subject to litigation regarding the process and procedures that such banks used in processing applications for the PPP. The Company may be exposed to the risk of litigation, from both clients and non-clients that approached us regarding PPP loans, regarding its process and procedures used in processing applications for the PPP. If any such litigation is filed against the Company and is not resolved in a manner favorable to the Company, it may result in significant financial liability or adversely affect the Company's reputation. In addition, litigation can be costly, regardless of outcome. Any financial liability, litigation costs or reputational damage caused by PPP-related litigation could have a material adverse impact on the Company's business, financial position, results of operations and prospects.combined company.
The Company may have a credit risk on PPP loans if a determination is made by the SBA that there is a deficiency in the manner in which the loan was originated, funded, or serviced by the Company, such as an issue with the eligibility of a borrower to receive a PPP loan, which may or may not be related to the ambiguity in the laws, rules and guidance regarding the operation of the PPP. In the event of a loss resulting from a default on a PPP loan and a determination by the SBA that there was a deficiency in the manner in which the PPP loan was originated, funded, or serviced by the Company, the SBA may deny its liability under the guaranty, reduce the amount of the guaranty, or, if it has already paid under the guaranty, seek recovery of any loss related to the deficiency from the Company, which could adversely impact the Company's business, financial position, results of operations and prospects.
Item 2. Unregistered Sales of Equity Securities and Use of Proceeds
(a) Not applicable.
(b) Not applicable.
(c) The following table sets forth information regarding the Company’s repurchases of its common stock during the three months ended March 31, 2020:2021:
| | | | | | | | | | | | | | | | | | | | | | | |
| | Issuer Purchases of Equity Securities |
| | Total Number of Shares Purchased (1) | | Average Price Paid Per Share | | Total Number of
Shares Purchased as
Part of Publicly
Announced Plan or
Program | | Maximum Number of Shares That May Yet Be Purchased Under the Plan or Program |
| Period | | | | | | | |
| January 1 to January 31, 2021 | 2,316 | | | $ | 76.97 | | | — | | | — | |
| February 1 to February 28, 2021 | 10,010 | | | $ | 81.88 | | | — | | | — | |
| March 1 to March 31, 2021 | 4,079 | | | $ | 98.36 | | | — | | | — | |
| Total | 16,405 | | | $ | 85.28 | | | — | | | |
|
| | | | | | | | | | | | |
| | Issuer Purchases of Equity Securities |
| | Total Number of Shares Purchased (1) | | Average Price Paid Per Share | | Total Number of Shares Purchased as Part of Publicly Announced Plan or Program (2) | | Maximum Number of Shares That May Yet Be Purchased Under the Plan or Program (2) |
| Period | | | | | | | |
| January 1 to January 31, 2020 | 13,389 |
| | $ | 72.00 |
| | 13,389 |
| | 1,486,611 |
|
| February 1 to February 29, 2020 | 133,107 |
| | $ | 71.06 |
| | 122,800 |
| | 1,363,811 |
|
| March 1 to March 31, 2020 | 1,035,656 |
| | $ | 61.74 |
| | 1,030,734 |
| | 333,077 |
|
| Total | 1,182,152 |
| | $ | 62.90 |
| | 1,166,923 |
| |
|
|
| |
(1) | The number of shares purchased related to the surrendering of shares in connection with the exercise and/or vesting of equity compensation grants to satisfy related tax withholding obligations was 10,307 shares in February 2020 and 4,922 shares in March 2020. |
| |
(2) | On October 17, 2019, the Company announced that its Board of Directors authorized a share repurchase program of up to 1.5 million shares of the Company's common stock. The remaining 333,077 shares as of March 31, 2020 were repurchased in April 2020. Accordingly, the share repurchase program was terminated. |
Item 3. Defaults Upon Senior Securities - NoneNone.
Item 4. Mine Safety Disclosures - Not ApplicableApplicable.
Item 5. Other Information - NoneNone.
Item 6. Exhibits
Exhibit Index
|
| | | | |
31.12.1 | |
| 31.1 | |
| 31.2 | |
| 32.1 | |
| 32.2 | |
32.2101 | |
101 | The instance document does not appear in the interactive data file because its XBRL tags are embedded within the inline XBRL document. |
| 104 | Cover page interactive data file (formatted as inline XBRL and contained in Exhibit 101). |
|
| | | | |
| + | Furnished herewith |
| |
# | Management contract or compensatory plan or arrangement |
SIGNATURES
Pursuant to the requirements of the Securities Exchange Act of 1934, the registrant has duly caused this report to be signed on its behalf by the undersigned thereunto duly authorized.
INDEPENDENT BANK CORP.
(registrant)
|
| | | | | | | |
May 7, 20206, 2021 | | /s/ Christopher Oddleifson |
| | Christopher Oddleifson
President and
Chief Executive Officer
(Principal Executive Officer)
|
|
| | | | | | | |
May 7, 20206, 2021 | | /s/ Mark J. Ruggiero |
| | Mark J. Ruggiero
Chief Financial Officer
(Principal Financial Officer)
|