UNITED STATES
SECURITIES AND EXCHANGE COMMISSION
Washington, D.C. 20549
Form 10-Q
|
| | | | | | | |
þ☑ | | QUARTERLY REPORT PURSUANT TO SECTION 13 OR 15(d) OF THE SECURITIES EXCHANGE ACT OF 1934 |
For the quarterly period ended September 30, 20172022
OR
|
| | | | | | | |
o☐ | | TRANSITION REPORT PURSUANT TO SECTION 13 OR 15(d) OF THE SECURITIES EXCHANGE ACT OF 1934 |
Commission File Number 1-09397 | | |
| Baker Hughes Holdings LLC |
Baker Hughes, a GE company, LLC
(Exact name of registrant as specified in its charter)
| | | | | | | | | | | |
| Delaware | 76-0207995 |
| (State or other jurisdiction | (I.R.S. Employer Identification No.) |
| of incorporation or organization) | |
| |
Delaware | 76-0207995 |
(State or other jurisdiction | (I.R.S. Employer Identification No.) |
of incorporation or organization) | |
| |
17021 Aldine Westfield Houston, Texas - 77073-5101, United States | |
| Houston, | Texas | 77073-5101 |
| (Address of principal executive offices) | (Zip Code) |
Registrant's telephone number, including area code: (713) 439-8600
Securities registered pursuant to Section 12(b) of the Act: | | | | | | | | |
| Title of each class | Trading Symbol | Name of each exchange on which registered |
| 5.125% Senior Notes due 2040 | - | The Nasdaq Stock Market LLC |
Indicate by check mark whether the registrant (1) has filed all reports required to be filed by Section 13 or 15(d) of the Securities Exchange Act of 1934 during the preceding 12 months (or for such shorter period that the registrant was required to file such reports), and (2) has been subject to such filing requirements for the past 90 days.
YES þ NO oYes ☑ No ☐
Indicate by check mark whether the registrant has submitted electronically and posted on its corporate website, if any, every Interactive Data File required to be submitted and posted pursuant to Rule 405 of Regulation S-T (§ 232.405 of this chapter) during the preceding 12 months (or for such shorter period that the registrant was required to submit and post such files).
YES þ NO oYes ☑ No ☐
Indicate by check mark whether the registrant is a large accelerated filer, an accelerated filer, a non-accelerated filer, a smaller reporting company or an emerging growth company. See the definitions of "large accelerated filer," "accelerated filer" "smaller reporting company"company," and "emerging growth company" in Rule 12b-2 of the Exchange Act. (Check one):
|
| | | | | | | | | | | | | | | | | | | | | | | | | | | | | | | | | | | | | | | | |
Large accelerated filerþ | ☐ | | Accelerated filero | ☐ | | Non-accelerated filero | ☑ | | Smaller reporting companyo | ☐ | | Emerging growth companyo |
| | (Do not check if a smaller reporting company) | ☐ |
If an emerging growth company, indicate by check mark if the registrant has elected not to use the extended transition period for complying with any new or revised financial accounting standards provided pursuant to Section 13(a) of the Exchange Act. o☐
Indicate by check mark whether the registrant is a shell company (as defined in Rule 12b-2 of the Exchange Act).
YES o NO þYes ☐ No ☑
As of October 18, 2017,13, 2022, the registrant had 1,145,286,805 outstanding Common Units, $0.0001 par value per unit.outstanding 1,008,467,549 common units. None of the common units are publicly traded.
Baker Hughes a GE company,Holdings LLC
Table of Contents
Baker Hughes Holdings LLC 2022 Third Quarter Form 10-Q | i
PART I — FINANCIAL INFORMATION
ITEM 1. FINANCIAL STATEMENTS (UNAUDITED)
Baker Hughes a GE company,Holdings LLC
Condensed Consolidated and Combined Statements of Income (Loss)
(Unaudited)
| | | | Three Months Ended September 30, | Nine Months Ended September 30, |
| Three Months Ended September 30, | Nine Months Ended September 30, |
| (In millions, except per unit amounts) | 2017 | 2016 | 2017 | 2016 | (In millions, except per unit amounts) | 2022 | 2021 | 2022 | 2021 |
| Revenue: | | Revenue: | |
| Sales of goods | $ | 3,097 |
| $ | 2,182 |
| $ | 7,541 |
| $ | 6,889 |
| Sales of goods | $ | 3,084 | | $ | 2,984 | | $ | 8,710 | | $ | 8,997 | |
| Sales of services | 2,278 |
| 842 |
| 3,955 |
| 2,864 |
| Sales of services | 2,285 | | 2,109 | | 6,541 | | 6,020 | |
| Total revenue | 5,375 |
| 3,024 |
| 11,496 |
| 9,753 |
| Total revenue | 5,369 | | 5,093 | | 15,251 | | 15,017 | |
| | | |
| Costs and expenses: | | Costs and expenses: | |
| Cost of goods sold | 2,589 |
| 1,800 |
| 6,341 |
| 5,760 |
| Cost of goods sold | 2,639 | | 2,561 | | 7,502 | | 7,769 | |
| Cost of services sold | 1,766 |
| 494 |
| 2,818 |
| 1,680 |
| Cost of services sold | 1,606 | | 1,522 | | 4,686 | | 4,404 | |
| Selling, general and administrative expenses | 792 |
| 475 |
| 1,750 |
| 1,476 |
| |
| Selling, general and administrative | | Selling, general and administrative | 620 | | 607 | | 1,865 | | 1,836 | |
| | Restructuring, impairment and other | 191 |
| 77 |
| 292 |
| 452 |
| Restructuring, impairment and other | 230 | | 14 | | 653 | | 219 | |
| Merger and related costs | 159 |
| 2 |
| 310 |
| 10 |
| |
| Separation related | | Separation related | 5 | | 11 | | 23 | | 53 | |
| Total costs and expenses | 5,497 |
| 2,848 |
| 11,511 |
| 9,378 |
| Total costs and expenses | 5,100 | | 4,715 | | 14,729 | | 14,281 | |
| Operating income (loss) | (122 | ) | 176 |
| (15 | ) | 375 |
| |
| Other non operating income (loss), net | (3 | ) | 6 |
| 65 |
| 18 |
| |
| Operating income | | Operating income | 269 | | 378 | | 522 | | 736 | |
| Other non-operating loss, net | | Other non-operating loss, net | (60) | | (102) | | (657) | | (791) | |
| Interest expense, net | (42 | ) | (21 | ) | (75 | ) | (74 | ) | Interest expense, net | (65) | | (67) | | (188) | | (205) | |
| Income (loss) before income taxes and equity in loss of affiliate | (167 | ) | 161 |
| (25 | ) | 319 |
| |
| Equity in loss of affiliate | (13 | ) | — |
| (13 | ) | — |
| |
| Income (loss) before income taxes | | Income (loss) before income taxes | 144 | | 209 | | (323) | | (260) | |
| Provision for income taxes | (96 | ) | (70 | ) | (125 | ) | (132 | ) | Provision for income taxes | (145) | | (189) | | (422) | | (422) | |
| Net income (loss) | (276 | ) | 91 |
| (163 | ) | 187 |
| Net income (loss) | (1) | | 20 | | (745) | | (682) | |
| Less: Net income (loss) attributable to noncontrolling interests | 1 |
| (5 | ) | 5 |
| (68 | ) | |
| Net income (loss) attributable to Baker Hughes, a GE company, LLC | $ | (277 | ) | $ | 96 |
| $ | (168 | ) | $ | 255 |
| |
| Less: Net income attributable to noncontrolling interests | | Less: Net income attributable to noncontrolling interests | 8 | | 5 | | 20 | | 24 | |
| Net income (loss) attributable to Baker Hughes Holdings LLC | | Net income (loss) attributable to Baker Hughes Holdings LLC | $ | (9) | | $ | 15 | | $ | (765) | | $ | (706) | |
| | | |
| | | |
| Cash distribution per Common Unit | $ | 0.17 |
|
|
| $ | 0.17 |
|
|
| |
| | | Cash distribution per common unit | | Cash distribution per common unit | $ | 0.18 | | $ | 0.18 | | $ | 0.54 | | $ | 0.54 | |
See accompanying Notes to Unaudited Condensed Consolidated and Combined Financial Statements.
Baker Hughes Holdings LLC 2022 Third Quarter Form 10-Q | 1
Baker Hughes a GE company,Holdings LLC
Condensed Consolidated and Combined Statements of Comprehensive Income (Loss)
(Unaudited)
|
| | | | | | | | | | | | |
| | Three Months Ended September 30, | Nine Months Ended September 30, |
| (In millions) | 2017 | 2016 | 2017 | 2016 |
| Net income (loss) | $ | (276 | ) | $ | 91 |
| $ | (163 | ) | $ | 187 |
|
| Less: Net income (loss) attributable to noncontrolling interests | 1 |
| (5 | ) | 5 |
| (68 | ) |
| Net income (loss) attributable to Baker Hughes, a GE company, LLC | (277 | ) | 96 |
| (168 | ) | 255 |
|
| Other comprehensive income (loss): | | | | |
| Investment securities | 1 |
| — |
| 2 |
| — |
|
| Foreign currency translation adjustments | 272 |
| (140 | ) | 207 |
| (161 | ) |
| Cash flow hedges | 9 |
| (1 | ) | 17 |
| (5 | ) |
| Benefit plans | (4 | ) | 31 |
| (6 | ) | 69 |
|
| Other comprehensive income (loss) | 278 |
| (110 | ) | 220 |
| (97 | ) |
| Less: Other comprehensive income attributable to noncontrolling interests | — |
| 3 |
| 4 |
| 2 |
|
Other comprehensive income (loss) attributable to Baker Hughes, a GE company, LLC
| 278 |
| (113 | ) | 216 |
| (99 | ) |
| Comprehensive income (loss) | 2 |
| (19 | ) | 57 |
| 90 |
|
| Less: Comprehensive income (loss) attributable to noncontrolling interests | 1 |
| (2 | ) | 9 |
| (66 | ) |
| Comprehensive income (loss) attributable to Baker Hughes, a GE company, LLC | $ | 1 |
| $ | (17 | ) | $ | 48 |
| $ | 156 |
|
| | | | | | | | | | | | | | |
| Three Months Ended September 30, | Nine Months Ended September 30, |
| (In millions) | 2022 | 2021 | 2022 | 2021 |
| Net income (loss) | $ | (1) | | $ | 20 | | $ | (745) | | $ | (682) | |
| Less: Net income attributable to noncontrolling interests | 8 | | 5 | | 20 | | 24 | |
| Net income (loss) attributable to Baker Hughes Holdings LLC | (9) | | 15 | | (765) | | (706) | |
| Other comprehensive income (loss): | | | | |
| | | | |
| Foreign currency translation adjustments | (321) | | (158) | | (474) | | (51) | |
| Cash flow hedges | — | | (2) | | 1 | | (13) | |
| Benefit plans | (27) | | 25 | | 5 | | 78 | |
| Other comprehensive income (loss) | (348) | | (135) | | (468) | | 14 | |
| Less: Other comprehensive income (loss) attributable to noncontrolling interests | 1 | | (1) | | (2) | | (1) | |
| Other comprehensive income (loss) attributable to Baker Hughes Holdings LLC | (349) | | (134) | | (466) | | 15 | |
| Comprehensive loss | (349) | | (115) | | (1,213) | | (668) | |
| Less: Comprehensive income attributable to noncontrolling interests | 9 | | 4 | | 18 | | 23 | |
| Comprehensive loss attributable to Baker Hughes Holdings LLC | $ | (358) | | $ | (119) | | $ | (1,231) | | $ | (691) | |
See accompanying Notes to Unaudited Condensed Consolidated and Combined Financial Statements.
Baker Hughes Holdings LLC 2022 Third Quarter Form 10-Q | 2
Baker Hughes a GE company,Holdings LLC
Condensed Consolidated and Combined Statements of Financial Position
| | | (In millions) | September 30, 2017 | December 31, 2016 | (In millions) | September 30,
2022 | December 31,
2021 |
| ASSETS | ASSETS | ASSETS |
| Current assets: |
| Current assets: | |
Cash and equivalents (a) | $ | 4,775 |
| $ | 981 |
| |
| Cash and cash equivalents | | Cash and cash equivalents | $ | 2,848 | | $ | 3,843 | |
| Current receivables, net | 5,310 |
| 2,563 |
| Current receivables, net | 5,722 | | 5,718 | |
| Inventories, net | 5,309 |
| 3,224 |
| Inventories, net | 4,111 | | 3,979 | |
| All other current assets | 1,279 |
| 633 |
| All other current assets | 1,790 | | 1,582 | |
| Total current assets | 16,673 |
| 7,401 |
| Total current assets | 14,471 | | 15,122 | |
Property, plant and equipment - less accumulated depreciation
| 6,255 |
| 2,325 |
| |
| Property, plant and equipment (net of accumulated depreciation of $4,961 and $5,003) | | Property, plant and equipment (net of accumulated depreciation of $4,961 and $5,003) | 4,381 | | 4,877 | |
| Goodwill | 20,086 |
| 6,680 |
| Goodwill | 5,196 | | 5,721 | |
| Other intangible assets, net | 6,826 |
| 2,449 |
| Other intangible assets, net | 3,980 | | 4,131 | |
| Contract assets | 2,761 |
| 1,967 |
| |
| Contract and other deferred assets | | Contract and other deferred assets | 1,526 | | 1,598 | |
| All other assets | 1,654 |
| 573 |
| All other assets | 2,976 | | 3,102 | |
| Deferred income taxes | 338 |
| 326 |
| Deferred income taxes | 701 | | 735 | |
| Total assets | $ | 54,593 |
| $ | 21,721 |
| Total assets | $ | 33,231 | | $ | 35,286 | |
| LIABILITIES AND EQUITY | LIABILITIES AND EQUITY | LIABILITIES AND EQUITY |
| Current liabilities: |
| Current liabilities: | |
| Accounts payable | $ | 3,217 |
| $ | 1,898 |
| Accounts payable | $ | 3,801 | | $ | 3,745 | |
Short-term debt and current portion of long-term debt (a) | 1,866 |
| 239 |
| |
| Progress collections | 1,543 |
| 1,596 |
| |
| Current portion of long-term debt | | Current portion of long-term debt | 43 | | 40 | |
| Progress collections and deferred income | | Progress collections and deferred income | 3,262 | | 3,232 | |
| All other current liabilities | 2,119 |
| 1,201 |
| All other current liabilities | 2,415 | | 2,163 | |
| Total current liabilities | 8,745 |
| 4,934 |
| Total current liabilities | 9,521 | | 9,180 | |
| Long-term debt | 3,039 |
| 38 |
| Long-term debt | 6,612 | | 6,687 | |
| Deferred income taxes | 341 |
| 880 |
| Deferred income taxes | 119 | | 73 | |
| Liabilities for pensions and other postretirement benefits | 1,262 |
| 519 |
| Liabilities for pensions and other postretirement benefits | 1,020 | | 1,110 | |
| All other liabilities | 996 |
| 495 |
| All other liabilities | 1,500 | | 1,510 | |
| Members' equity: | | |
| Members' capital (Common Units 1,145 & Nil, issued and outstanding as of September 30, 2017 and December 31, 2016, respectively ) | 42,024 |
| — |
| |
| Parent's net investment | — |
| 16,582 |
| |
| Members' Equity: | | Members' Equity: | |
| | Members' capital, common units, 1,019 and 1,026 issued and outstanding as of September 30, 2022 and December 31, 2021, respectively | | Members' capital, common units, 1,019 and 1,026 issued and outstanding as of September 30, 2022 and December 31, 2021, respectively | 34,560 | | 35,589 | |
| Retained loss | (277 | ) | — |
| Retained loss | (17,075) | | (16,311) | |
| Accumulated other comprehensive loss | (1,678 | ) | (1,894 | ) | Accumulated other comprehensive loss | (3,158) | | (2,691) | |
| Baker Hughes, a GE company, LLC members' equity | 40,069 |
| 14,688 |
| |
| Baker Hughes Holdings LLC equity | | Baker Hughes Holdings LLC equity | 14,327 | | 16,587 | |
| Noncontrolling interests | 141 |
| 167 |
| Noncontrolling interests | 132 | | 139 | |
| Total equity | 40,210 |
| 14,855 |
| Total equity | 14,459 | | 16,726 | |
| Total liabilities and equity | $ | 54,593 |
| $ | 21,721 |
| Total liabilities and equity | $ | 33,231 | | $ | 35,286 | |
| |
(a)
| Cash and equivalents includes $1,267 million of cash at September 30, 2017 held on behalf of GE, and a corresponding liability is reported in short-term borrowings. See "Note 14. Related Party Transactions" for further details. |
See accompanying Notes to Unaudited Condensed Consolidated and Combined Financial Statements.
Baker Hughes Holdings LLC 2022 Third Quarter Form 10-Q | 3
Baker Hughes a GE company,Holdings LLC
Condensed Consolidated and Combined Statements of Changes in Members' Equity
(Unaudited)
| | | | | | | | | | | | | | | | | | |
| (In millions, except per unit amounts) | | Members' Capital | Retained
Loss | Accumulated
Other
Comprehensive
Loss | Non-
controlling
Interests | Total Equity |
| Balance at December 31, 2021 | | $ | 35,589 | | $ | (16,311) | | $ | (2,691) | | $ | 139 | | $ | 16,726 | |
| Comprehensive loss: | | | | | | |
| Net income (loss) | | | (765) | | | 20 | | (745) | |
| Other comprehensive loss | | | | (466) | | (2) | | (468) | |
| Regular cash distribution to Members ($0.54 per unit) | | (552) | | | | | (552) | |
| | | | | | |
| | | | | | |
| Repurchase and cancellation of common units | | (727) | | | | | (727) | |
| Baker Hughes stock-based compensation cost | | 155 | | | | | 155 | |
| | | | | | |
| Other | | 95 | | 1 | | (1) | | (25) | | 70 | |
| Balance at September 30, 2022 | | $ | 34,560 | | $ | (17,075) | | $ | (3,158) | | $ | 132 | | $ | 14,459 | |
|
| | | | | | | | | | | | | | | | | | | | |
| (In millions) | Number of Common Units | Common Unitholders | Parent's Net Investment | Retained
Loss | Accumulated
Other
Comprehensive
Loss | Non-controlling
Interests | Total Equity |
| Balance at December 31, 2016 | — |
| $ | — |
| $ | 16,582 |
| $ | — |
| $ | (1,894 | ) | $ | 167 |
| $ | 14,855 |
|
| Net income |
|
| 109 |
|
|
| 4 |
| 113 |
|
| Other comprehensive income |
|
|
|
| (62 | ) | 4 |
| (58 | ) |
| Changes in Parent's net investment |
|
|
|
| 900 |
|
|
|
| 900 |
|
| Net activity related to noncontrolling interests |
|
|
|
|
|
|
| 4 |
| 4 |
|
| Cash contribution received from General Electric Company (GE) |
|
|
|
| 7,400 |
|
|
|
| 7,400 |
|
| Issuance of Common Units to GE on business combination | 717 |
| 24,991 |
| (24,991 | ) |
|
|
| — |
|
| Issuance of Common Units to Baker Hughes, a GE company (BHGE) on business combination | 428 |
| 24,798 |
|
|
|
|
|
| 77 |
| 24,875 |
|
| Distribution to BHGE |
| (7,498 | ) |
|
|
|
|
|
| (7,498 | ) |
| Activity after business combination of July 3, 2017: | | | | | | | |
| Net income (loss) |
|
|
|
| (277 | ) |
| 1 |
| (276 | ) |
| Other comprehensive income |
|
|
|
|
|
| 278 |
|
| 278 |
|
| Cash distribution to members ($0.17 per unit) |
| (198 | ) |
|
|
|
|
|
| (198 | ) |
| Net activity related to noncontrolling interests |
| (92 | ) |
|
|
| (116 | ) | (208 | ) |
| Other |
| 23 |
|
|
|
|
| 23 |
|
| Balance at September 30, 2017 | 1,145 |
| $ | 42,024 |
| $ | — |
| $ | (277 | ) | $ | (1,678 | ) | $ | 141 |
| $ | 40,210 |
|
| | | (In millions) | Number of Common Units | Common Unitholders | Parent's Net Investment | Retained Loss | Accumulated Other Comprehensive Loss | Non-controlling Interests | Total Equity | |
| Balance at December 31, 2015 | | $ | 15,920 |
|
| $ | (1,532 | ) | $ | 157 |
| $ | 14,545 |
| |
| (In millions, except per unit amounts) | | (In millions, except per unit amounts) | | Members' Capital | Retained
Loss | Accumulated
Other
Comprehensive
Loss | Non-
controlling
Interests | Total Equity |
| Balance at June 30, 2022 | | Balance at June 30, 2022 | | $ | 34,923 | | $ | (17,067) | | $ | (2,809) | | $ | 108 | | $ | 15,155 | |
| Comprehensive loss: | |
|
|
| | Comprehensive loss: | | |
| Net income (loss) | | 255 |
|
|
| (68 | ) | $ | 187 |
| Net income (loss) | | | (9) | | | 8 | | (1) | |
| Other comprehensive income (loss) | |
|
| (99 | ) | 2 |
| $ | (97 | ) | Other comprehensive income (loss) | | | (349) | | 1 | | (348) | |
| Changes in Parent's net investment | | 542 |
|
|
| $ | 542 |
| |
| Regular cash distribution to Members ($0.18 per unit) | | Regular cash distribution to Members ($0.18 per unit) | | (183) | | | (183) | |
| | Repurchase and cancellation of common units | | Repurchase and cancellation of common units | | (265) | | | (265) | |
| Baker Hughes stock-based compensation cost | | Baker Hughes stock-based compensation cost | | 52 | | | 52 | |
| Other | |
|
|
| 87 |
| $ | 87 |
| Other | | 33 | | 1 | | | 15 | | 49 | |
| Balance at September 30, 2016 | | $ | 16,717 |
| | $ | (1,631 | ) | $ | 178 |
| $ | 15,264 |
| |
| Balance at September 30, 2022 | | Balance at September 30, 2022 | | $ | 34,560 | | $ | (17,075) | | $ | (3,158) | | $ | 132 | | $ | 14,459 | |
See accompanying Notes to Unaudited Condensed Consolidated and Combined Financial Statements.
Baker Hughes Holdings LLC 2022 Third Quarter Form 10-Q | 4
Baker Hughes a GE company,Holdings LLC
Condensed Consolidated and Combined Statements of Cash FlowsChanges in Members' Equity
(Unaudited)
| | | | | | | | | | | | | | | | | | |
| (In millions, except per unit amounts) | | Members' Capital | Retained
Loss | Accumulated
Other
Comprehensive
Loss | Non-
controlling
Interests | Total Equity |
| Balance at December 31, 2020 | | $ | 36,512 | | $ | (15,939) | | $ | (2,542) | | $ | 132 | | $ | 18,163 | |
| Comprehensive income (loss): | | | | | | |
| Net income (loss) | | | (706) | | | 24 | | (682) | |
| Other comprehensive income (loss) | | | | 15 | | (1) | | 14 | |
| Regular cash distribution to Members ($0.54 per unit) | | (563) | | | | | (563) | |
| | | | | | |
| | | | | | |
| Repurchase and cancellation of common units | | (106) | | | | | (106) | |
| Baker Hughes stock-based compensation cost | | 153 | | | | | 153 | |
| | | | | | |
| Other | | 42 | | | | (13) | | 29 | |
| Balance at September 30, 2021 | | $ | 36,038 | | $ | (16,645) | | $ | (2,527) | | $ | 142 | | $ | 17,008 | |
|
| | | | | | |
| | Nine Months Ended September 30, |
| (In millions) | 2017 | 2016 |
| Cash flows from operating activities: | | |
| Net income (loss) | $ | (163 | ) | $ | 187 |
|
| Less: Net income (loss) attributable to noncontrolling interests | 5 |
| (68 | ) |
| Net income (loss) after noncontrolling interests | (168 | ) | 255 |
|
| Adjustments to reconcile net income (loss) to net cash flows from operating activities: | | |
| Depreciation and amortization | 716 |
| 439 |
|
| Provision for deferred income taxes | (17 | ) | (40 | ) |
| Changes in operating assets and liabilities: | | |
| Current receivables | (366 | ) | 343 |
|
| Inventories | 162 |
| 11 |
|
| Accounts payable | 98 |
| (271 | ) |
| Progress collections | (126 | ) | (566 | ) |
| Deferred charges | (600 | ) | (217 | ) |
| Other operating items, net | (284 | ) | (149 | ) |
| Net cash flows used in operating activities | (585 | ) | (195 | ) |
| Cash flows from investing activities: | | |
| Expenditures for capital assets | (417 | ) | (330 | ) |
| Proceeds from disposal of assets | 76 |
| 21 |
|
| Net cash paid for acquisitions | (3,365 | ) | (1 | ) |
| Other investing items, net | (173 | ) | (36 | ) |
| Net cash flows used in investing activities | (3,879 | ) | (346 | ) |
| Cash flows from financing activities: | | |
| Net repayments of short-term debt and other borrowings | (325 | ) | (188 | ) |
| Distribution to members | (198 | ) | — |
|
| Contribution received from GE | 7,400 |
| — |
|
| Net transfers from Parent | 1,574 |
| 552 |
|
| Other financing items, net | (241 | ) | (135 | ) |
| Net cash flows from financing activities | 8,210 |
| 229 |
|
| Effect of currency exchange rate changes on cash and equivalents | 48 |
| (122 | ) |
| Increase/ (decrease) in cash and equivalents | 3,794 |
| (434 | ) |
| Cash and equivalents, beginning of period | 981 |
| 1,432 |
|
| Cash and equivalents, end of period | $ | 4,775 |
| $ | 998 |
|
| Supplemental cash flows disclosures: | | |
| Income taxes paid (refunded), net | $ | 122 |
| $ | (7 | ) |
| Interest paid | $ | 31 |
| $ | 29 |
|
| | | | | | | | | | | | | | | | | | |
| (In millions, except per unit amounts) | | Members' Capital | Retained
Loss | Accumulated
Other
Comprehensive
Loss | Non-
controlling
Interests | Total Equity |
| Balance at June 30, 2021 | | $ | 36,266 | | $ | (16,660) | | $ | (2,393) | | $ | 142 | | $ | 17,355 | |
| Comprehensive income (loss): | | | | | | |
| Net income | | | 15 | | | 5 | | 20 | |
| Other comprehensive loss | | | | (134) | | (1) | | (135) | |
| Regular cash distribution to Members ($0.18 per unit) | | (188) | | | | | (188) | |
| | | | | | |
| | | | | | |
| Repurchase and cancellation of common units | | (106) | | | | | (106) | |
| Baker Hughes stock-based compensation cost | | 51 | | | | | 51 | |
| Other | | 15 | | | | (4) | | 11 | |
| Balance at September 30, 2021 | | $ | 36,038 | | $ | (16,645) | | $ | (2,527) | | $ | 142 | | $ | 17,008 | |
See accompanying Notes to Unaudited Condensed Consolidated and Combined Financial Statements.
Baker Hughes Holdings LLC 2022 Third Quarter Form 10-Q | 5
Baker Hughes a GE company,Holdings LLC
Condensed Consolidated Statements of Cash Flows
(Unaudited)
| | | | | | | | |
| Nine Months Ended September 30, |
| (In millions) | 2022 | 2021 |
| Cash flows from operating activities: | | |
| Net loss | $ | (745) | | $ | (682) | |
| Adjustments to reconcile net loss to net cash flows from operating activities: | | |
| Depreciation and amortization | 806 | | 832 | |
| Loss on assets held for sale | 426 | | — | |
| Loss on equity securities | 164 | | 955 | |
| Property, plant and equipment impairment, net | 168 | | 21 | |
| | |
| | |
| Inventory impairment | 31 | | — | |
| | |
| | |
| Changes in operating assets and liabilities: | | |
| Current receivables | (452) | | 319 | |
| Inventories | (626) | | 151 | |
| Accounts payable | 263 | | (10) | |
| Progress collections and deferred income | 705 | | (157) | |
| Contract and other deferred assets | (151) | | 178 | |
| Other operating items, net | 408 | | (9) | |
| Net cash flows from operating activities | 997 | | 1,598 | |
| Cash flows from investing activities: | | |
| Expenditures for capital assets | (720) | | (590) | |
| Proceeds from disposal of assets | 189 | | 178 | |
| | |
| | |
| | |
| Other investing items, net | (49) | | 200 | |
| Net cash flows used in investing activities | (580) | | (212) | |
| Cash flows from financing activities: | | |
| Net repayments of debt and other borrowings | (22) | | (60) | |
| Repayment of commercial paper | — | | (832) | |
| | |
| Distributions to Members | (552) | | (563) | |
| | |
| Repurchase of common units | (727) | | (106) | |
| | |
| Other financing items, net | 4 | | (24) | |
| Net cash flows used in financing activities | (1,297) | | (1,585) | |
| Effect of currency exchange rate changes on cash and cash equivalents | (115) | | (9) | |
| Decrease in cash and cash equivalents | (995) | | (208) | |
| Cash and cash equivalents, beginning of period | 3,843 | | 4,125 | |
| Cash and cash equivalents, end of period | $ | 2,848 | | $ | 3,917 | |
| Supplemental cash flows disclosures: | | |
| Income taxes paid, net of refunds | $ | 395 | | $ | 181 | |
| Interest paid | $ | 190 | | $ | 204 | |
See accompanying Notes to Unaudited Condensed Consolidated Financial Statements.
Baker Hughes Holdings LLC 2022 Third Quarter Form 10-Q | 6
Baker Hughes Holdings LLC
Notes to Unaudited Condensed Consolidated and Combined Financial Statements
NOTE 1. BASIS OF PRESENTATION AND SUMMARY OF SIGNIFICANT ACCOUNTING POLICIES
DESCRIPTION OF THE BUSINESS
Baker Hughes a GE company,Holdings LLC, a Delaware limited liability company (the Company, BHGE LLC, we, us,("the Company", "BHH LLC", "we", "us", or our "our") and the successor to Baker Hughes Incorporated ("BHI"), is an energy technology company with a Delaware corporation (Baker Hughes)diversified portfolio of technologies and services that span the energy and industrial value chain. As of September 30, 2022, General Electric ("GE") owns 0.7% of our common units and Baker Hughes Company ("Baker Hughes") owns directly or indirectly 99.3% of our common units (collectively, "the Members"). BHH LLC is a fullstream oilfield technology provider that has a unique mix of equipmentSecurities and service capabilities. We conduct business in more than 120 countriesExchange Commission ("SEC") Registrant with separate filing requirements with the SEC and employ over 65,000 employees.its separate financial information can be obtained from www.sec.gov.
BASIS OF PRESENTATION
On July 3, 2017, we closed our previously announced business combination (the Transactions) to combine the oil and gas business (GE O&G) of General Electric Company (GE) and Baker Hughes (refer to "Note 2. Business Acquisition" for further details on the Transactions). In connection with the Transactions, we entered into and are governed by an Amended & Restated Operating Agreement, dated as of July 3, 2017 (the BHGE LLC Agreement). Under the BHGE LLC Agreement, EHHC Newco, LLC (EHHC), a wholly owned subsidiary of Baker Hughes, a GE company (BHGE), is our sole managing member and BHGE is the sole managing member of EHHC. As our managing member, EHHC conducts, directs and exercises full control over all our activities, including our day-to-day business affairs and decision-making, without the approval of any other member. As such, EHHC is responsible for all our operational and administrative decisions and the day-to-day management of our business. GE owns approximately 62.5% of our Common Units and BHGE owns approximately 37.5% of our Common Units indirectly through two wholly owned subsidiaries.
The Transactions were treated as a "reverse acquisition" for accounting purposes and, as such, the historical financial statements of the accounting acquirer, GE O&G, are the historical financial statements of the Company.
The accompanying unaudited condensed consolidated and combined financial statements of the Company have been prepared in accordance with accounting principles generally accepted in the United States of America (U.S.("U.S." and such principles, U.S. GAAP)"U.S. GAAP") and pursuant to the rules and regulations of the Securities and Exchange Commission (SEC)SEC for interim financial information. All intercompany accountsAccordingly, certain information and transactionsdisclosures normally included in our annual financial statements have been eliminated. condensed or omitted. Therefore, these unaudited condensed consolidated financial statements should be read in conjunction with our audited consolidated financial statements included in our Annual Report on Form 10-K for the year ended December 31, 2021 ("2021 Annual Report").
In the opinion of management, the condensed consolidated and combined financial statements reflect all adjustments (consisting of normal recurring adjustments) considered necessary for a fair presentation of theby management to fairly state our results of operations, financial position and cash flows of the Company and its subsidiaries for the periods presented and are not indicative of the results that may be expected for a full year.
The Company's financial statements have been prepared on a consolidated basis, effective July 3, 2017. Under this basis of presentation, ourbasis. The condensed consolidated financial statements consolidateinclude the accounts of BHH LLC and all of ourits subsidiaries (entities inand affiliates which it controls or variable interest entities for which we have a controlling financial interest, most often becausedetermined that we hold a majority voting interest).are the primary beneficiary. All subsequent periods will also be presented on a consolidated basis. For all periods prior to July 3, 2017,intercompany accounts and transactions have been eliminated.
In the Company's financial statements were prepared on a combined basis. The combined financial statements combineand notes, certain accounts of GE and its subsidiaries that were historically managed as part of its Oil & Gas business. The condensed consolidated and combined statements of income reflect intercompany expense allocations made to us by GE for certain corporate functions and for shared services provided by GE. Where possible, these allocations were made on a specific identification basis, and in other cases, these expenses were allocated by GE based on relative percentages of net operating costs or some other basis depending on the nature of the allocated cost. See "Note 14. Related Party Transactions" for further information on expenses allocated by GE. The historical financial results in the condensed consolidated and combined financial statements presented may not be indicative of the results that wouldprior year amounts have been achieved had GE O&G operated as a separate, stand-alone entity during those periods.
The GE O&G numbers in the condensed consolidated and combined statements of income (loss) have been reclassedreclassified to conform to the current year presentation. We believe that the current presentation is a more appropriate presentation of the combined businesses. Merger and related costs includes all costs associated with the Transactions described in Note 2. Refer to "Note 2. Business Acquisition" for further details.
In the notes to the unaudited condensed consolidated and combined financial statements, all dollar and common unit amounts in tabulations are in millions of dollars and units, respectively, unless otherwise indicated.
Baker Hughes, a GE company, LLC
Notes Certain columns and rows in our financial statements and notes thereto may not add due to Unaudited Condensed Consolidated and Combined Financial Statements
the use of rounded numbers.
SUMMARY OF SIGNIFICANT ACCOUNTING POLICIES
UsePlease refer to "Note 1. Basis of Estimates
The preparationPresentation and Summary of Significant Accounting Policies," to our consolidated financial statements in conformity with U.S. GAAP requires management to make estimates and judgments that affect the reported amounts of assets and liabilities, disclosure of any contingent assets or liabilities at the date of the financial statements and the reported amounts of revenue and expenses during the reporting period. We basefrom our estimates and judgments on historical experience and on various other assumptions and information that we believe to be reasonable under the circumstances. Estimates and assumptions about future events and their effects cannot be perceived with certainty, and accordingly, these estimates may change as new events occur, as more experience is acquired, as additional information is obtained and as our operating environment changes. While we believe that the estimates and assumptions used in the preparation of the condensed consolidated and combined financial statements are appropriate, actual results could differ from those estimates. Estimates are used for, but are not limited to, determining the following: allowance for doubtful accounts and inventory valuation reserves; recoverability of long-lived assets, including revenue recognition on long term contracts, valuation of goodwill; useful lives used in depreciation and amortization; income taxes and related valuation allowances; accruals for contingencies; actuarial assumptions to determine costs and liabilities related to employee benefit plans; stock-based compensation expense, valuation of derivatives and the fair value of assets acquired and liabilities assumed in acquisitions, and expense allocations for certain corporate functions and shared services provided by GE.
Foreign Currency
Assets and liabilities of non‑U.S. operations with a functional currency other than the U.S. dollar have been translated into U.S. dollars at the quarterly exchange rates, and revenues, expenses, and cash flows have been translated at average rates2021 Annual Report for the respective periods. Any resulting translation gains and losses are included in other comprehensive income (loss).
Gains and losses from foreign currency transactions, such as those resulting from the settlement of receivables or payables in the non-functional currency and those resulting from remeasurements of monetary items, are included in the condensed consolidated and combined statement of income (loss).
Cost and Equity Method Investment
Investments in privately held companies in which we do not have the ability to exercise significant influence, most often because we hold a voting interest of 0% to 20% are accounted for using the cost method.
Associated companies are entities in which we do not have a controlling financial interest, but over which we have significant influence, most often because we hold a voting interest of 20% to 50%. Associated companies are accounted for as equity method investments. Results of associated companies are presented on a one-line basis in the caption "Equity in loss of affiliate" in our condensed consolidated and combined statements of income (loss). Investments in, and advances to, associated companies are presented on a one-line basis in the caption "All other assets" in our condensed consolidated and combined statement of financial position.
Sales of Goods and Services
We record all sales of goods and services only when a firm sales agreement is in place, delivery has occurred or services have been rendered and collectability of the fixed or determinable sales price is reasonably assured.
Except for goods sold under long-term construction type contracts and service agreements, we recognize sales of goods under the provisions of SEC Staff Accounting Bulletin (SAB) 104, Revenue Recognition. In situations where arrangements include customer acceptance provisions based on seller or customer-specified objective criteria, we recognize revenue when we have reliably demonstrated that all specified acceptance criteria have been met or when formal acceptance occurs, respectively. We do not provide for anticipated losses before we record sales.
Baker Hughes, a GE company, LLC
Notes to Unaudited Condensed Consolidated and Combined Financial Statements
We recognize revenue on larger construction and equipment contracts using long-term construction accounting. We estimate total long-term contract revenue net of price concessions as well as total contract costs. For larger construction and equipment contracts, we recognize sales based on our progress toward contract completion measured by actual costs incurred in relation to our estimate of total expected costs. We routinely update our estimates of future costs for agreements in process and report any cumulative effects of such adjustments in current operations. We provide for any loss that we expect to incur on these agreements when that loss is probable.
We sell product services under long-term product maintenance agreements, where costs of performing services are incurred on an other than straight-line basis. We recognize related sales based on the extentdiscussion of our progress toward completion measured by actual costs incurred in relation to our estimate of total expected costs. We routinely update our estimates of future costs for agreements in process and report any cumulative effects of such adjustments in current operations.
For our long-term product maintenance agreements, we regularly assess customer credit risk inherent in the carrying amounts of receivables and contract costs and estimated earnings, including the risk that contractual penalties may not be sufficient to offset our accumulated costs in the event of customer termination. We gain insight into future utilization and cost trends, as well as credit risk, through our knowledge of the installed base of equipment and the close interaction with our customers that comes with supplying critical services and parts over extended periods. Revisions, after applying the cumulative catch up basis ofsignificant accounting may affect a product services agreement's total estimated profitability resulting in an adjustment of earnings. We provide for probable losses when they become evident.
Arrangements for the sale of goods and services sometimes include multiple components. Our arrangements with multiple components usually involve an upfront deliverable of equipment and future service deliverables such as installation, commissioning, training or the future delivery of ancillary products. In most cases, the relative values of the undelivered components are not significant to the overall arrangement and are typically delivered within three to six months after the core product has been delivered. In such agreements, selling price is determined for each component and any difference between the total of the separate selling prices and total contract consideration (i.e., discount) is allocated pro rata across each of the components in the arrangement. The value assigned to each component is objectively determined and obtained primarily from sources such as the separate selling price for that or a similar item or from competitor prices for similar items. If such evidence is not available, we use our best estimate of selling price, which is established consistent with the pricing strategy of the business and considers product configuration, geography, customer type, and other market specific factors.
Research and Development
Research and development costs are expensed as incurred and relate to the research and development of new products and services. These costs amounted to $162 million and $343 million for the three and nine months ended September 30, 2017, respectively, and $87 million and $253 million for the three and nine months ended September 30, 2016, respectively. Research and development expenses were reported in cost of goods sold and cost of services sold.policies.
Cash and Cash Equivalents
Short-term investments with original maturities of three months or less are included in cash equivalents unless designated as available-for-sale and classified as investment securities.
As of September 30, 2017,2022 and December 31, 2016, $1,2472021, we had $611 million of which approximately $1 billion is related to cash held on behalf of GE, and $752$601 million, respectively, of cash and equivalents were held in bank accounts andthat cannot be readily released, transferred or otherwise converted into a currency that is regularly transacted internationally, due to lack of market liquidity, capital controls or similar monetary or exchange limitations limiting the flow of capital out of the jurisdiction. CashThese funds are available to fund operations and equivalents includes $1,267 million of cash at September 30, 2017 held on behalf of GE and a corresponding liability is reportedgrowth in short term borrowings. See "Note 14. Related Party Transactions" for further details.
Baker Hughes, a GE company, LLC
Notes to Unaudited Condensed Consolidated and Combined Financial Statements
Allowance for Doubtful Accounts
We establish an allowance for doubtful accounts based on various factors including the payment history and financial condition of our debtors and the economic environment. Provisions for doubtful accounts are recorded based on the aging status of the debtor accounts or when it becomes evident that the debtor will not make the required payments at either contractual due dates or in the future.
Concentration of Credit Risk
We grant credit to our customers who primarily operate in the oil and natural gas industry. Although this concentration affects our overall exposure to credit risk, our current receivables are spread over a diverse group of customers across many countries, which mitigates this risk. We perform periodic credit evaluations of our customers' financial conditions, including monitoring our customers' payment history and current credit worthiness to manage this risk. We do not generally require collateral in support of our current receivables, but we may require payment in advance or security in the form of a letter of credit or a bank guarantee.
Inventories
All inventories are stated at the lower of cost or net realizable values and they are measured on a first-in, first-out (FIFO) or average cost basis. As necessary, we record provisions and maintain reserves for excess, slow moving and obsolete inventory. To determine these reserve amounts, we regularly review inventory quantities on hand and compare them to estimates of future product demand, market conditions, production requirements and technological developments.
Property, Plant and Equipment (PP&E)
Property, plant and equipment is initially stated at cost and is depreciated over its estimated economic life. Subsequently, property, plant and equipment is measured at cost less accumulated depreciation and impairment losses. We manufacture a substantial portion of our tools and equipment and the cost of these items, which includes direct and indirect manufacturing costs, is capitalized and carried in inventory until it is completed.
Other Intangible Assets
We amortize the cost of other intangible assets over their estimated useful lives unless such lives are deemed indefinite. The cost of intangible assets is generally amortized on a straight-line basis over the asset's estimated economic life. Amortizable intangible assets are reviewed for impairment whenever events or changes in circumstances indicate that the related carrying amounts may not be recoverable. In these circumstances, they are tested for impairment based on undiscounted cash flows and, if impaired, written down to fair value based on either discounted cash flows or appraised values. Intangible assets with indefinite lives are tested annually for impairment and written down to fair value as required. Refer to the Impairment of Goodwill and Other Long-Lived Assets accountingpolicy.
Impairment of Goodwill and Other Long-lived Assets
We perform an annual impairment test of goodwill on a qualitative or quantitative basis for each of our reporting units as of July 1, or more frequently when circumstances indicate an impairment may exist at the reporting unit level. When performing the annual impairment test we have the option of first performing a qualitative assessment to determine the existence of events and circumstances that would lead to a determination that it is more likely than not that the fair value of a reporting unit is less than its carrying amount. If such a conclusion is reached, we would then be required to perform a quantitative impairment assessment of goodwill. However, if the assessment leads to a determination that it is more likely than not that the fair value of a reporting unit is greater than its carrying amount, then no further assessments are required. A quantitative assessment for the determination of impairment is made by comparing the carrying amount of each reporting unit with its fair value, which is generally calculated using a combination of market, comparable transaction and discounted cash flow approaches. See "Note 6. Goodwill and Other Intangible Assets" for further information on valuation methodology and impairment of goodwill.
Baker Hughes, a GE company, LLC
Notes to Unaudited Condensed Consolidated and Combined Financial Statements
We review PP&E, intangible assets and certain other long-lived assets for impairment whenever events or changes in circumstances indicate that the carrying amount may not be recoverable and at least annually for indefinite-lived intangible assets. When testing for impairment, we group our long-lived assets with other assets and liabilities at the lowest level for which identifiable cash flows are largely independent of the cash flows of other assets and liabilities (or asset group). The determination of recoverability is made based upon the estimated undiscounted future net cash flows. The amount of impairment loss, if any, is determined by comparing the fair value, as determined by a discounted cash flow analysis, with the carrying value of the related assets.
Financial Instruments
Our financial instruments include cash and equivalents, current receivables, investments, accounts payables, short and long-term debt, and derivative financial instruments.
We monitor our exposure to various business risks including commodity prices and foreign currency exchange rates and we regularly use derivative financial instruments to manage these risks. At the inception of a new derivative, we designate the derivative as a hedge or we determine the derivative to be undesignated as a hedging instrument. We document the relationships between the hedging instruments and the hedged items, as well as our risk management objectives and strategy for undertaking various hedge transactions. We assess whether the derivatives that are used in hedging transactions are highly effective in offsetting changes in cash flows of the hedged item at both the inception of the hedge and on an ongoing basis.
We have a program that utilizes foreign currency forward contracts to reduce the risks associated with the effects of certain foreign currency exposures. Under this program, our strategy is to have gains or losses on the foreign currency forward contracts mitigate the foreign currency transaction and translation gains or losses to the extent practical. These foreign currency exposures typically arise from changes in the value of assets (for example, current receivables) and liabilities (for example, current payables) which are denominated in currencies other than the functional currency of the respective entity. We record all derivatives as of the end of our reporting period in our consolidated and combined statement of financial position at fair value. For the forward contracts held as undesignated hedging instruments, we record the changes in fair value of the forward contracts in our condensed consolidated and combined statements of income along with the change in the fair value, related to foreign exchange movements, of the hedged item. Changes in the fair value of forward contracts designated as cash flow hedging instruments are recognized in other comprehensive income until the hedged item is recognized in earnings. If derivatives designated as a cash flow hedge are determined to be ineffective, the ineffective portion of that derivative's change in fair value is recognized in earnings.
Fair Value Measurements
For financial assets and liabilities measured at fair value on a recurring basis, fair value is the price we would receive to sell an asset or pay to transfer a liability in an orderly transaction with a market participant at the measurement date. In the absence of active markets for the identical assets or liabilities, such measurements involve developing assumptions based on market observable data and, in the absence of such data, internal information that is consistent with what market participants would use in a hypothetical transaction that occurs at the measurement date.
Observable inputs reflect market data obtained from independent sources, while unobservable inputs reflect our market assumptions. Preference is given to observable inputs. These two types of inputs create the following fair value hierarchy:
Level 1 - Quoted prices for identical instruments in active markets.
Level 2 - Quoted prices for similar instruments in active markets; quoted prices for identical or similar instruments in markets that are not active; and model-derived valuations whose inputs are observable or whose significant value drivers are observable.
Level 3 - Significant inputs to the valuation model are unobservable.
We maintain policies and procedures to value instruments using the best and most relevant data available. In addition, we perform reviews to assess the reasonableness of the valuations. With regard to Level 3 valuations
Baker Hughes, a GE company, LLC
Notes to Unaudited Condensed Consolidated and Combined Financial Statements
(including instruments valued by third parties), we perform a variety of procedures to assess the reasonableness of the valuations. Such reviews include an evaluation of instruments whose fair value change exceeds predefined thresholds (and/or does not change) and consider the current interest rate, currency and credit environment, as well as other published data, such as rating agency market reports and current appraisals.
Recurring Fair Value Measurements
Derivatives
We use closing prices for derivatives included in Level 1, which are traded either on exchanges or liquid over-the-counter markets. The majority of our derivatives are valued using internal models. The models maximize the use of market observable inputs including interest rate curves and both forward and spot prices for currencies and commodities. Derivative assets and liabilities included in Level 2 primarily represent foreign currency and commodity forward contracts for the Company.
Investments in Debt and Equity Securities
When available, we use quoted market prices to determine the fair value of investment securities, and they are included in Level 1. Level 1 securities primarily include publicly traded equity securities.
For investment securities for which market prices are observable for identical or similar investment securities but not readily accessible for each of those investments individually (that is, it is difficult to obtain pricing information for each individual investment security at the measurement date), we use pricing models that are consistent with what other market participants would use. The inputs and assumptions to the models are derived from market observable sources including: benchmark yields, reported trades, broker/dealer quotes, issuer spreads, benchmark securities, bids, offers, and other market-related data. Thus, certain securities may not be priced using quoted prices, but rather determined from market observable information. These investments are included in Level 2. When we use valuations that are based on significant unobservable inputs, we classify the investment securities in Level 3.
Non-Recurring Fair Value Measurements
Certain assets are measured at fair value on a non-recurring basis. These assets are not measured at fair value on an ongoing basis, but are subject to fair value adjustments only in certain circumstances. These assets can include long-lived assets that have been reduced to fair value when they are held for sale, cost and equity method investments and long-lived assets that are written down to fair value when they are impaired and the remeasurement of retained investments in formerly consolidated subsidiaries upon a change in control that results in a deconsolidation of a subsidiary, if we sell a controlling interest and retain a noncontrolling stake in the entity. Assets that are written down to fair value when impaired and retained investments are not subsequently adjusted to fair value unless further impairment occurs.
Cost and Equity Method Investments
Cost and equity method investments are valued using market observable data such as quoted prices when available. When market observable data is unavailable, investments are valued using a discounted cash flow model, comparative market multiples or a combination of both approaches as appropriate and other third-party pricing sources.
Long-lived Assets
Fair values of long-lived assets, including real estate, are primarily derived internally and are based on observed sales transactions for similar assets. In other instances, for example, collateral types for which we do not have comparable observed sales transaction data, collateral values are developed internally and corroborated by external appraisal information. Adjustments to third-party valuations may be performed in circumstances where market comparables are not specific to the attributes of the specific collateral or
Baker Hughes, a GE company, LLC
Notes to Unaudited Condensed Consolidated and Combined Financial Statements
appraisal information may not be reflective of current market conditions due to the passage of time and the occurrence of market events since receipt of the information.
Income Taxes
We are treated as a partnership for U.S. federal income tax purposes. As such, we will not be subject to U.S. federal income tax under current U.S. tax laws. Non-U.S. current and deferred income taxes owed by our subsidiaries are reflected in the financial statements.
We account for taxes under the asset and liability method. Under this method, deferred income taxes are recognized for temporary differences between the financial statement and tax return bases of assets and liabilities as well as from net operating losses and tax credit carryforwards, based on enacted tax rates expected to be in effect when taxes actually are paid or recovered and other provisions of the tax law. The effect of a change in tax laws or rates on deferred tax assets and liabilities is recognized in income in the period in which such change is enacted. Future tax benefits are recognized to the extent that realization of such benefits is more likely than not, and a valuation allowance is established for any portion of a deferred tax asset that management believes may not be realized.
We currently intend to indefinitely reinvest substantially all earnings of our foreign subsidiaries with operations outside the U.S. Most of these earnings have been reinvested in active non-U.S. business operationsjurisdictions, and we do not intendcurrently anticipate a need to repatriatetransfer these earningsfunds to fundthe U.S. operations. If the earnings of our foreign subsidiaries were repatriated, the tax consequence would be applicable at the partner level as we are treated as a pass-through entity for U.S. federal income tax purposes.
Significant judgment is required in determining our tax expense and in evaluating our tax positions, including evaluating uncertainties. We operate in more than 120 countries and our tax filings are subject to audit by the tax authorities in the jurisdictions where we conduct business. These audits may result in assessments of additional taxes that are resolved with the tax authorities or through the courts. We have provided for the amounts that we believe will ultimately result from these proceedings. We recognize uncertain tax positions that are “more likely than not” to be sustained if the relevant tax authority were to audit the position with full knowledge of all the relevant facts and other information. For those tax positions that meet this threshold, we measure the amount of tax benefit based on the largest amount of tax benefit that has a greater than 50% chance of realizing in a final settlement with the relevant authority. We classify interest and penalties associated with uncertain tax positions as income tax expense. The effects of tax adjustments and settlements from taxing authorities are presented in the combined financial statements in the period they are recorded.
Environmental Liabilities
We are involved in numerous remediation actions to clean up hazardous waste as required by federal and state laws. Liabilities for remediation costs exclude possible insurance recoveries and, when dates and amounts of such costs are not known, are not discounted. When there appears to be a range of possible costs with equal likelihood, liabilities are based on the low end of such range. It is reasonably possible that our environmental remediation exposure will exceed amounts accrued. However, due to uncertainties about the status of laws, regulations, technology and information related to individual sites, such amounts are not reasonably estimable. The determination of the required accruals for remediation costs is subject to uncertainty, including the evolving nature of environmental regulations and the difficulty in estimating the extent and type of remediation activity that is necessary.
NEW ACCOUNTING STANDARDS ADOPTED
On January 1, 2017, we adopted the Financial Accounting Standards Board (FASB) Accounting Standards Update (ASU) No. 2015-11, Simplifying the Measurement of Inventory, which was intended to simplify the subsequent measurement of inventory held by an entity not measured using last-in, first-out (LIFO) or retail inventory method. The amendments eliminated the requirement that entities consider the replacement cost of inventory and the net realizable value less a normal profit margin, which was historically used to establish a floor
Baker Hughes, a GE company, LLC
Notes to Unaudited Condensed Consolidated and Combined Financial Statements
and ceiling for an assessment of market value. The adoption of this standard was immaterial to our financial statements.
NEW ACCOUNTING STANDARDS TO BE ADOPTED
In May 2014, the FASB issued ASU No. 2014-09, Revenue from Contracts with Customers. The ASU will supersede most of the existing revenue recognition requirements in U.S. GAAP and will require entities to recognize revenue at an amount that reflects the consideration to which the Company expects to be entitled in exchange for transferring goods or services to a customer. The new standard also requires significantly expanded disclosures regarding the qualitative and quantitative information of an entity's nature, amount, timing, and uncertainty of revenue and cash flows arising from contracts with customers. The pronouncement is effective for annual reporting periods beginning after December 15, 2017, including interim periods within that reporting period.
The standard permits either a full retrospective method of adoption, in which the standard is applied to all the periods presented, or a modified retrospective method of adoption, in which the standard is applied only to the current period with a cumulative-effect adjustment reflected in retained earnings. We will adopt the standard on January 1, 2018, will apply it retrospectively to all periods presented, and will elect the practical expedient for contract modifications.
The new standard requires companies to identify contractual performance obligations and determine whether revenue should be recognized at a point in time or over time based on when control of goods and services transfer to a customer. As a result, we expect changes in the presentation of our financial statements, including: (1) timing of revenue recognition, and (2) changes in classification between revenue and costs. The new standard will have no cash impact and, as such, does not affect the economics of our underlying customer contracts. The effect of applying the new guidance to our existing book of contracts will result in lower reported earnings in 2018 (and comparative periods previously reported) and in the early years after adoption. However, we expect to experience an increase in reported earnings, on that existing book of contracts, as they mature.
We expect that the timing of revenue recognition on our long-term product service agreements will be significantly affected. Although we expect to continue to recognize revenue over time on these contracts, we also expect that there will be changes to how contract modifications, termination clauses and purchase options are accounted for by us. In particular, under our existing processes, the cumulative impact from a contract modification on revenue already recorded is recognized in the period in which the modification is agreed. Under the new standard, we expect the impact from certain types of modifications to be recognized over the remaining life of the contract.
Based on our assessment and best estimates to date, we expect a non-cash charge to our January 1, 2016 retained earnings balance of approximately $500 million. This amount includes significant estimates and will remain subject to change as we complete our evaluation of the new standard and reflect actual activity for 2017. We do not currently believe that the adoption of the ASU will have any material impact on post acquisition revenue and operating profits of legacy Baker Hughes, and will validate the impact as we continue the integration of the acquired business.
In February 2016, the FASB issued ASU No. 2016-02, Leases. The new standard establishes a right-of-use (ROU) model that requires a lessee to record a ROU asset and a lease liability on the balance sheet for all leases with terms longer than 12 months. Leases will be classified as either finance or operating, with classification affecting the pattern of expense recognition. Similarly, lessors will be required to classify leases as sales-type, finance or operating, with classification affecting the pattern of income recognition. Classification for both lessees and lessors will be based on an assessment of whether risks and rewards as well as substantive control have been transferred through a lease contract. The new standard is effective for fiscal years beginning after December 15, 2018, including interim periods within those fiscal years, with early adoption permitted. A modified retrospective transition approach is required for leases existing at, or entered into after, the beginning of the earliest comparative period presented in the financial statements, with certain practical expedients available. While we continue to evaluate the effect of the standard on our ongoing financial reporting, we anticipate that the adoption of the ASU may materially affect our condensed consolidated and combined financial statements.
Baker Hughes, a GE company, LLC
Notes to Unaudited Condensed Consolidated and Combined Financial Statements
In October 2016, the FASB issued ASU No. 2016-16, Accounting for Income Taxes: Intra-Entity Asset Transfers of Assets Other than Inventory. The ASU eliminates the deferral of tax effects of intra-entity asset transfers other than inventory. As a result, the tax expense from the intercompany sale of assets, other than inventory, and associated changes to deferred taxes will be recognized when the sale occurs even though the pre-tax effects of the transaction have not been recognized. The new standard is effective for annual periods beginning after December 15, 2017, and interim periods within those annual periods. The effect of the adoption of the standard will depend on the nature and amount of future transactions but is currently expected as an increase to retained earnings of approximately $300 million. Future earnings will be reduced in total by this amount. The effect of the change on future transactions will depend on the nature and amount of future transactions as it will affect the timing of recognition of both tax expenses and tax benefits, with no change in the associated cash flows.
In March 2017, the FASB issued ASU No. 2017-07, Improving the Presentation of Net Periodic Pension Cost and Net Periodic Postretirement Benefit Cost, which changes the income statement presentation of net periodic benefit cost by requiring separation between the service cost component and all other components. The service cost component is required to be presented as an operating expense with other similar compensation costs arising for services rendered by the pertinent employees during the period. The non-operating components must be presented outside of income from operations. This pronouncement is effective for annual reporting periods beginning after December 15, 2017, and the presentation disclosure should be applied using a retrospective approach. Early adoption is permitted. We are currently evaluating the impact of this ASU on our condensed consolidated and combined financial statements and related disclosures.
All other newNew accounting pronouncements that have been issued but not yet effective are currently being evaluated and at this time are not expected to have a material impact on our financial position or results of operations.
NOTE 2. BUSINESS ACQUISITION
On July 3, 2017, we closed the Transactions to combine GE O&G and Baker Hughes creating a fullstream oilfield technology provider that has a unique mix of equipment and service capabilities. The Transactions were executed using a partnership structure, pursuant to which GE O&G and Baker Hughes each contributed their operating assets to the Company. As a partnership, we will not be subject to U.S. federal income tax under current US tax laws and, accordingly, will not incur any material current or deferred U.S. federal income taxes. Our foreign subsidiaries, however, are expected to incur current and deferred foreign income taxes. GE holds an approximate 62.5% interest in us and former Baker Hughes shareholders hold an approximate 37.5% interest through the ownership of 100% of Class A Common Stock of BHGE. GE holds its voting interest through Class B Common Stock in BHGE and its economic interest through a corresponding number of our Common Units. Former Baker Hughes shareholders immediately after the completion of the Transactions also received a Special Dividend of $17.50 per share paid by BHGE to holders of record of the Company's Class A Common Stock. GE contributed $7.4 billion to us to fund substantially all of the Special Dividend.Holdings LLC 2022 Third Quarter Form 10-Q | 7
Prior to the Transactions, shares of Baker Hughes common stock were registered pursuant to Section 12(b) of the Securities Exchange Act of 1934, as amended (the Exchange Act) and listed on the New York Stock Exchange and the SIX Swiss Exchange. Shares of Baker Hughes common stock were suspended from trading on the New York Stock Exchange and the SIX Swiss Exchange prior to the open of trading on July 5, 2017. The New York Stock Exchange filed a Form 25 on Baker Hughes' behalf to provide notice to the SEC regarding the withdrawal of shares of Baker Hughes common stock from listing and to terminate the registration of such shares under Section 12(b) of the Exchange Act.
As a result of the Transactions, on July 3, 2017, the Company issued 428 million Common Units to BHGE and 717 million Common Units to GE.
Based on the relative voting rights of former Baker Hughes shareholders and GE immediately following completion of the Transactions, and after taking into consideration all relevant facts, GE O&G is considered to be the "acquirer" for accounting purposes. As a result,the Transactions are reported as a business combination using the acquisition method of accounting with GE O&G treated as the "acquirer" and Baker Hughes treated as the "acquired" company.
Baker Hughes a GE company,Holdings LLC
Notes to Unaudited Condensed Consolidated and Combined Financial Statements
NOTE 2. REVENUE RELATED TO CONTRACTS WITH CUSTOMERS
DISAGGREGATED REVENUE
We disaggregate our revenue from contracts with customers by primary geographic markets.
| | | | | | | | | | | | | | |
| Three Months Ended September 30, | Nine Months Ended September 30, |
| Total Revenue | 2022 | 2021 | 2022 | 2021 |
| U.S. | $ | 1,286 | | $ | 1,199 | | $ | 3,611 | | $ | 3,337 | |
| Non-U.S. | 4,083 | | 3,894 | | 11,640 | | 11,680 | |
| Total | $ | 5,369 | | $ | 5,093 | | $ | 15,251 | | $ | 15,017 | |
REMAINING PERFORMANCE OBLIGATIONS
The tables below presentAs of September 30, 2022 and 2021, the fair valueaggregate amount of the consideration exchangedtransaction price allocated to the unsatisfied (or partially unsatisfied) performance obligations was $24.7 billion and $23.5 billion, respectively. As of September 30, 2022, we expect to recognize revenue of approximately 55%, 68% and 87% of the total remaining performance obligations within 2, 5, and 15 years, respectively, and the preliminary estimates ofremaining thereafter. Contract modifications could affect both the fair value of assets acquired and liabilities assumed and the associated fair value of the noncontrolling interest relatedtiming to the acquired net assets of Baker Hughes. The final determination of fair value for certain assets and liabilities will be completedcomplete as soonwell as the information necessaryamount to completebe received as we fulfill the analysis is obtained. These amounts, which may differ materiality from these preliminary estimates, will be finalized as soon as possible, but no later than one year from the acquisition date. The primary areas of the preliminary estimates that are not yet finalized relate to inventory, property, plant and equipment, identifiable intangible assets, deferred income taxes, uncertain tax positions and contingencies.related remaining performance obligations.
|
| | | |
| Purchase consideration | |
| (In millions, except share and per share amounts) | July 3, 2017 |
| Baker Hughes shares outstanding | 426,097,407 |
|
| Restricted stock units vested upon closing | 1,611,566 |
|
| Total Baker Hughes shares outstanding for purchase consideration | 427,708,973 |
|
| Baker Hughes share price on July 3, 2017 per share | $ | 57.68 |
|
| Purchase consideration | $ | 24,670 |
|
| Rollover of outstanding options into options to purchase Class A shares of BHGE (fair value) | 114 |
|
| Precombination service of restricted stock units (fair value) | $ | 14 |
|
Total purchase consideration
| $ | 24,798 |
|
|
| | | |
| Preliminary identifiable assets acquired and liabilities assumed | Estimated fair value at July 3, 2017 |
| Assets | |
| Cash and equivalents | $ | 4,133 |
|
| Current receivables | 2,378 |
|
| Inventories | 1,975 |
|
| Property, plant and equipment | 4,048 |
|
Other intangible assets (a) | 4,400 |
|
All other assets | 1,395 |
|
| Liabilities | |
| Accounts payable | $ | (1,115 | ) |
| Borrowings | (3,373 | ) |
| Liabilities for pension and other postretirement benefits | (684 | ) |
All other liabilities (b) | (1,426 | ) |
| Total identifiable net assets | $ | 11,731 |
|
| Noncontrolling interest associated with net assets acquired | (77 | ) |
Goodwill (c) | 13,144 |
|
| Total purchase consideration | $ | 24,798 |
|
| |
(a)
| Intangible assets, as provided in the table below, are recorded at estimated fair value, as determined by management based on available information which includes a preliminary valuation. The estimated useful lives for intangible assets were determined based upon the remaining useful economic lives of the intangible assets that are expected to contribute directly or indirectly to future cash flows. We consider the Baker Hughes trade name to be an indefinite life intangible asset, which will not be amortized and will be subject to an annual impairment test. |
|
| | | | |
| | Estimated Fair Value | Estimated Weighted
Average Life (Years) |
Customer relationships
| $ | 1,300 |
| 15 |
| Trade name - Baker Hughes | 2,000 |
| Indefinite-lived |
| Trade names - other | 200 |
| 10 |
| Developed technology | 900 |
| 10 |
| Total | $ | 4,400 |
| |
Baker Hughes, a GE company, LLC
Notes to Unaudited Condensed Consolidated and Combined Financial Statements
| |
(b)
| All other liabilities includes approximately $188 million of net deferred tax liabilities related to the estimated fair value of intangible assets included in the preliminary purchase consideration and approximately $134 million of other net deferred tax assets. |
| |
(c)
| Goodwill represents the excess of the total purchase consideration over fair value of the net assets recognized and represents the future economic benefits that we believe will result from combining the operations of GE O&G and Baker Hughes, including expected future synergies and operating efficiencies. Goodwill resulting from the Transactions has been preliminarily allocated to the Oilfield Services segment of which $67 million is deductible for tax purposes. |
INCOME TAXES
We are treated as a partnership for U.S. federal income tax purposes. As such, we will not be subject to U.S. federal income tax under current U.S. tax laws. Our members will each be required to take into account for U.S. federal income tax purposes their distributive share of our items of income, gain, loss and deduction, which generally will include the U.S. operations of both Baker Hughes and GE O&G. BHGE and GE will each be taxed on their distributive share of income and gain, whether or not a corresponding amount of cash or other property is distributed to them. For assets held indirectly by us through subsidiaries, the taxes attributable to those subsidiaries will be reflected in our condensed consolidated and combined financial statements.
MERGER AND RELATED COSTS
During the three and nine months ended September 30, 2017, acquisition costs of $159 million and $310 million, respectively, were expensed as incurred and were reported as merger and related costs. Such costs include severance and other separation payments made to certain executive officers of Baker Hughes related to change-in-control with double trigger provisions in their existing employment agreements, professional fees of advisors and integration and synergy costs related to the combination of Baker Hughes and GE O&G. The double-trigger provisions resulted in payments to executives of Baker Hughes following two events: a change-in-control and termination or reduction in the responsibilities of the executives. We terminated the employment of certain executives following the business combination.
UNAUDITED ACTUAL AND PRO FORMA INFORMATION
The following unaudited pro forma information has been presented as if the Transactions occurred on January 1, 2016. This information has been prepared by combining the historical results of GE O&G and historical results of Baker Hughes. The unaudited pro forma combined financial data for all periods presented were adjusted to give effect to pro forma events that 1) are directly attributable to the aforementioned Transactions, 2) factually supportable, and 3) expected to have a continuing impact on the consolidated results of operations. The adjustments are based on information available to the Company at this time. Accordingly, the adjustments are subject to change and the impact of such changes may be material. The unaudited pro forma results do not include any incremental cost savings that may result from the integration.
The unaudited combined pro forma information is for informational purposes only and is not necessarily indicative of what the combined company's results actually would have been had the acquisition been completed as of the beginning of the periods as indicated. In addition, the unaudited pro forma information does not purport to project the future results of the combined company.
Significant adjustments to the pro forma information below include recognition of non-recurring direct incremental acquisition costs in the nine months ended September 30, 2016 and exclusion of those costs from all other periods presented; amortization associated with an estimate of the acquired intangible assets; and the reduction of interest expense for fair value adjustments to debt. A non-recurring contractually obligated termination fee of $3,500 million ($3,320 million net of related costs incurred) received by Baker Hughes due to an inability to obtain antitrust related approvals from a prior merger agreement is recognized in the nine months ended September 30, 2016.
Baker Hughes, a GE company, LLC
Notes to Unaudited Condensed Consolidated and Combined Financial Statements
|
| | | | | | | | | | | | |
| | Three Months Ended September 30, | Nine Months Ended September 30, |
| | 2017 | 2016 | 2017 | 2016 |
| Revenue | $ | 5,375 |
| $ | 5,375 |
| $ | 16,158 |
| $ | 17,178 |
|
| Net loss | (116 | ) | (363 | ) | (320 | ) | (2,317 | ) |
| Net loss attributable to the Company | (117 | ) | (357 | ) | (324 | ) | (2,248 | ) |
NOTE 3. CURRENT RECEIVABLES
Current receivables are summarized incomprised of the table below:following:
| | | | September 30, 2017 | December 31, 2016 | | September 30, 2022 | December 31, 2021 |
| Customer receivables | $ | 3,808 |
| $ | 1,699 |
| Customer receivables | $ | 4,655 | | $ | 4,724 | |
| Related parties | 696 |
| 236 |
| Related parties | 168 | | 548 | |
| Other | 1,037 |
| 814 |
| Other | 1,242 | | 846 | |
| Total current receivables | 5,541 |
| 2,749 |
| Total current receivables | 6,065 | | 6,118 | |
| Less: Allowance for doubtful accounts | (231 | ) | (186 | ) | |
| Less: Allowance for credit losses | | Less: Allowance for credit losses | (343) | | (400) | |
| Total current receivables, net | $ | 5,310 |
| $ | 2,563 |
| Total current receivables, net | $ | 5,722 | | $ | 5,718 | |
Customer receivables are recorded at the invoiced amount. Beyond factoring activities withRelated parties as of December 31, 2021 consists of amounts owed to us primarily by GE. As of June 30, 2022, GE is no longer considered a related parties (as described inparty. See "Note 14. Related Party Transactions"), the Company also sells certain current receivables externally, which are accounted for in accordance with ASC 860, Transfers and Servicing.further information. The "Other" category consists primarily consists of advance payments to suppliers, indirect taxes, amounts owed from GE for certain tax matters indemnified pursuant to the Tax Matters Agreement, and other tax receivables.customer retentions.
NOTE 4. INVENTORIES
Inventories, net of reserves of $398 million and $374 million as of September 30, 2022 and December 31, 2021, respectively, are comprised of the following:
| | | | | | | | |
| September 30, 2022 | December 31, 2021 |
| Finished goods | $ | 2,197 | | $ | 2,228 | |
| Work in process and raw materials | 1,914 | | 1,751 | |
| | |
| Total inventories, net | $ | 4,111 | | $ | 3,979 | |
Baker Hughes Holdings LLC 2022 Third Quarter Form 10-Q | 8
|
| | | | | | |
| | September 30, 2017 | December 31, 2016 |
| Finished goods | $ | 3,037 |
| $ | 1,585 |
|
| Work in process and raw material | 2,272 |
| 1,639 |
|
| Total inventories, net | $ | 5,309 |
| $ | 3,224 |
|
NOTE 5. PROPERTY, PLANT AND EQUIPMENT
Property, plant and equipment are compromised of the following:
|
| | | | | | |
| September 30, 2017 | December 31, 2016 |
| Land and improvements | $ | 348 |
| $ | 130 |
|
| Buildings, structures and related equipment | 2,793 |
| 1,344 |
|
| Machinery and equipment | 5,700 |
| 2,916 |
|
| Total cost | 8,841 |
| 4,390 |
|
| Less: Accumulated depreciation | (2,586 | ) | (2,065 | ) |
| Property, plant and equipment - less accumulated depreciation | $ | 6,255 |
| $ | 2,325 |
|
Depreciation on property, plant and equipment was $266 million and $67 million in the three months ended September 30, 2017 and 2016, respectively, and $405 million and $242 million in the nine months ended September 30, 2017 and 2016, respectively. See "Note 18. Restructuring, impairment and other" for additional information on property, plant and equipment impairments.
Baker Hughes a GE company,Holdings LLC
Notes to Unaudited Condensed Consolidated and Combined Financial Statements
NOTE 6.5. GOODWILL AND OTHER INTANGIBLE ASSETS
GOODWILL
The changes in the carrying value of goodwill are detailed below by segment:
| | | | | | | | | | | | | | | | | |
| Oilfield
Services | Oilfield
Equipment | Turbo-
machinery &
Process
Solutions | Digital
Solutions | Total |
| Balance at December 31, 2020, gross | $ | 15,362 | | $ | 4,162 | | $ | 2,234 | | $ | 2,452 | | $ | 24,210 | |
| Accumulated impairment at December 31, 2020 | (14,061) | | (4,156) | | — | | (254) | | (18,471) | |
| Balance at December 31, 2020 | 1,301 | | 6 | | 2,234 | | 2,198 | | 5,739 | |
| | | | | |
| Currency exchange and other | 10 | | (3) | | (62) | | 37 | | (18) | |
| Balance at December 31, 2021 | 1,311 | | 3 | | 2,172 | | 2,235 | | 5,721 | |
| Currency exchange, impairment and other | 3 | | (3) | | (92) | | (41) | | (133) | |
| Total | 1,314 | | — | | 2,080 | | 2,194 | | 5,588 | |
Classified as held for sale (1) | (161) | | — | | — | | (231) | | (392) | |
| Balance at September 30, 2022 | $ | 1,153 | | $ | — | | $ | 2,080 | | $ | 1,963 | | $ | 5,196 | |
|
| | | | | | | | | | | | | | | |
| Oilfield Services | Oilfield Equipment | Turbo-machinery & Process Solutions | Digital Solutions | Total |
| Balance at December 31, 2016, gross | $ | 3,203 |
| $ | 3,428 |
| $ | 1,814 |
| $ | 1,989 |
| $ | 10,434 |
|
| Accumulated impairment at December 31, 2016 | (2,997 | ) | (503 | ) | — |
| (254 | ) | (3,754 | ) |
| Balance at December 31, 2016 | 206 |
| 2,925 |
| 1,814 |
| 1,735 |
| 6,680 |
|
Acquisitions (a) | 13,144 |
| — |
| — |
| — |
| 13,144 |
|
| Dispositions, currency exchange and others | (47 | ) | 142 |
| 105 |
| 62 |
| 262 |
|
| Balance at September 30, 2017 | $ | 13,303 |
| $ | 3,067 |
| $ | 1,919 |
| $ | 1,797 |
| $ | 20,086 |
|
| |
(a)
| Includes goodwill associated with the acquisition of Baker Hughes. This amount and its allocations to segments are preliminary. |
Subsequent(1)The reduction in Oilfield Services ("OFS") and Digital Solutions ("DS") goodwill relates to the closetransferring our OFS Russia business and DS Nexus Controls business to held for sale, respectively. See "Note 17. Businesses Held for Sale" for further information.
We perform our annual goodwill impairment test for each of the acquisition of Baker Hughes, we realigned our reporting units to Oilfield Services (OFS), Oilfield Equipment (OFE), Turbomachinery & Process Solutions (TPS) and Digital Solutions (DS) (refer to "Note 13. Segment Information") and reallocated the goodwill that existed as of June 30, 2017 to the new reportable segments for all historical periods presented.The majority of Baker Hughes business was combined with the GE O&G Surface business to create the new Oilfield Services reporting segment.
We test goodwill for impairment annually in the third quarter of each year using data as of July 1 of that year. Theeach fiscal year, in conjunction with our annual strategic planning process. Our reporting units are the same as our four reportable segments. We also test goodwill for impairment test consists of two steps:whenever events or circumstances occur which, in step one, the carrying value of the reporting unit is compared with its fair value; in step two, which is applied only when the carrying value isour judgment, could more likely than its fair value, the amount of goodwill impairment, if any, is derived by deductingnot reduce the fair value of the reporting unit's assets and liabilities from the fair value of its equity, and comparing that amount with the carrying amount of goodwill. We determined fair values for each of theone or more reporting units using a combination of the market approach and the income approach. We assessed the valuation methodologies based upon the relevance and available data and have weightedbelow its carrying value. Potential impairment indicators include, but are not limited to, (i) the results appropriately.
Valuations using the market approach were derived from metrics of publicly traded companies or historically completed transactions of comparable businesses. The selection of comparable businesses was based on the markets in which the reporting units operate giving consideration to risk profiles, size, geography, and diversity of products and services. A market approach is limited to reporting units for which there are publicly traded companies that have the characteristics similar to our businesses.
Under the income approach, fair value was determined based on the present value of estimated future cash flows, discounted at an appropriate risk-adjusted rate. We used our internal forecasts to estimate future cash flows and included an estimate of long-term future growth rates based on our most recent viewsannual or interim impairment testing, in particular the magnitude of the long-term outlook for each business. Actual results may differ from those assumed in our forecasts. We derived our discount rates using a capital asset pricing model and analyzing published rates for industries relevant to our reporting units to estimate the costexcess of equity financing. We used discount rates that are commensurate with the risks and uncertainty inherent in the respective businesses and in our internally developed forecasts. Discount rates used in our reporting unit valuations ranged from 10% to 11%. Estimating the fair value over carrying value observed, (ii) downward revisions to internal forecasts, and the magnitude thereof, if any, and (iii) declines in Baker Hughes' market capitalization below its book value, and the magnitude and duration of reporting units requiresthose declines, if any.
During the usethird quarter of estimates and significant judgments that are based on a number of factors including actual operating results. It is reasonably possible that the judgments and estimates described above could change in future periods.
We performed2022, we completed our annual impairment test and determined that the fair value was substantially in excess of the carrying value for each reporting unit except for Oilfield Equipment resulting in an immaterial impairment of the residual amount of goodwill as of July 1, 2017 for all ofthis reporting unit. There can be no assurances that future sustained declines in macroeconomic or business conditions affecting our reporting units. Based on the results of our step one testing, the fair values of each of the reporting units exceeded their carrying values;industry will not occur, which could result in goodwill impairment charges in future periods.
Baker Hughes Holdings LLC 2022 Third Quarter Form 10-Q | 9
Baker Hughes a GE company,Holdings LLC
Notes to Unaudited Condensed Consolidated and Combined Financial Statements
therefore, the second step of the impairment test was not required to be performed for any of our reporting units and no goodwill impairment was recognized.
As of September 30, 2017, we believe that the goodwill is recoverable for all the reporting units; however, there can be no assurances that the goodwill will not be impaired in future periods.
OTHER INTANGIBLE ASSETS
Intangible assets are comprised of the following:
| | | | | | | | | | | | | | | | | | | | |
| September 30, 2022 | December 31, 2021 |
| Gross
Carrying
Amount | Accumulated
Amortization | Net | Gross
Carrying
Amount | Accumulated
Amortization | Net |
| Customer relationships | $ | 1,789 | | $ | (701) | | $ | 1,088 | | $ | 1,922 | | $ | (752) | | $ | 1,170 | |
| Technology | 1,089 | | (763) | | 326 | | 1,090 | | (747) | | 343 | |
| Trade names and trademarks | 288 | | (174) | | 114 | | 292 | | (169) | | 123 | |
| Capitalized software | 1,249 | | (999) | | 250 | | 1,311 | | (1,057) | | 254 | |
| | | | | | |
| | | | | | |
| Finite-lived intangible assets | 4,415 | | (2,637) | | 1,778 | | 4,615 | | (2,725) | | 1,890 | |
| Indefinite-lived intangible assets | 2,202 | | — | | 2,202 | | 2,241 | | — | | 2,241 | |
Total intangible assets (1) | $ | 6,617 | | $ | (2,637) | | $ | 3,980 | | $ | 6,856 | | $ | (2,725) | | $ | 4,131 | |
|
| | | | | | | | | | | | | | | | | | |
| | September 30, 2017 | December 31, 2016 |
| | Gross
Carrying
Amount | Accumulated
Amortization | Net | Gross
Carrying
Amount | Accumulated
Amortization | Net |
| Technology | $ | 1,538 |
| $ | (451 | ) | $ | 1,087 |
| $ | 596 |
| $ | (371 | ) | $ | 225 |
|
| Customer relationships | 3,267 |
| (771 | ) | 2,496 |
| 1,920 |
| (660 | ) | 1,260 |
|
| Capitalized software | 1,120 |
| (664 | ) | 456 |
| 896 |
| (535 | ) | 361 |
|
| Trade names and trademarks | 890 |
| (156 | ) | 734 |
| 681 |
| (130 | ) | 551 |
|
| Other | 2 |
| (1 | ) | 1 |
| 1 |
| (1 | ) | — |
|
| Finite-lived intangible assets | 6,817 |
| (2,043 | ) | 4,774 |
| 4,094 |
| (1,697 | ) | 2,397 |
|
Indefinite-lived intangible assets (a) | 2,052 |
| — |
| 2,052 |
| 52 |
| — |
| 52 |
|
| Total intangible assets | $ | 8,869 |
| $ | (2,043 | ) | $ | 6,826 |
| $ | 4,146 |
| $ | (1,697 | ) | $ | 2,449 |
|
| |
(a)
| Indefinite-lived intangible assets principally comprise trade names(1)During the three and trademarks acquired in business combinations. |
Finite-lived intangible assets increased by $2,377 million in the nine months ended September 30, 2017, primarily as a result2022, we recorded intangible asset impairments to customer relationships of the acquired Baker Hughes intangible assets offset by amortization during the periods (refer to$12 million and capitalized software of $5 million. See "Note 2. Business Acquisition").16. Restructuring, Impairment and Other" for further information.
Intangible assets are generally amortized on a straight-line basis with estimated useful lives ranging from 1 to 3035 years. Amortization expense for the three months ended September 30, 2022 and 2021 was $54 million and $59 million, respectively, and $164 million and $193 million for the nine months ended September 30, 2017 was $115 million2022 and $237 million, respectively, as compared to $65 million and $192 million, respectively, for the three and nine months ended September 30, 2016. We incurred additional2021, respectively.
Estimated amortization expense of $49 million during the three months ended September 30, 2017 due to the acquisition of Baker Hughes.
Indefinite-lived intangible assets increased in September 30, 2017 as a result of the acquisition of the Baker Hughes trade name which was preliminarily valued at $2 billion using the relief-from-royalty method. Indefinite-lived intangible assets as of December 31, 2016 comprise trademarks acquired in previous years (Vetco and Bently Nevada trademarks for $42 million and $10 million, respectively).
Amortization expense of intangible assets over the remainder of 20172022 and for each of the subsequent five fiscal years is expected to be as follows:
| | | | | |
| Year | Estimated Amortization Expense |
| Remainder of 2022 | $ | 54 | |
| 2023 | 207 | |
| 2024 | 194 | |
| 2025 | 154 | |
| 2026 | 109 | |
| 2027 | 87 | |
Baker Hughes Holdings LLC 2022 Third Quarter Form 10-Q | 10
|
| | | |
| Year | Estimated Amortization Expense |
| Remainder of 2017 | $ | 108 |
|
| 2018 | 422 |
|
| 2019 | 397 |
|
| 2020 | 361 |
|
| 2021 | 345 |
|
| 2022 | 329 |
|
Baker Hughes a GE company,Holdings LLC
Notes to Unaudited Condensed Consolidated and Combined Financial Statements
NOTE 7.6. CONTRACT AND OTHER DEFERRED ASSETS
Our long-term product service agreements relate to our Turbomachinery & Process Solutions segment. Contract assets reflect revenue earned in excess of billings on our long-term contracts to construct technically complex equipment, long-term product maintenance or extended warranty arrangements and other deferred contract related costs. Contract assets are comprised of the following:
| | | | | | | | |
| September 30, 2022 | December 31, 2021 |
| Long-term product service agreements | $ | 408 | | $ | 589 | |
Long-term equipment contracts (1) | 965 | | 825 | |
| Contract assets (total revenue in excess of billings) | 1,373 | | 1,414 | |
| Deferred inventory costs | 124 | | 156 | |
| Non-recurring engineering costs | 29 | | 28 | |
| | |
| Contract and other deferred assets | $ | 1,526 | | $ | 1,598 | |
|
| | | | | | |
| | September 30, 2017 | December 31, 2016 |
Long-term product service agreements (a) | $ | 1,408 |
| $ | 1,046 |
|
Long-term equipment contract revenue (b) | 1,050 |
| 703 |
|
| Total revenue in excess of billings | 2,458 |
| 1,749 |
|
Deferred inventory costs (c) | 303 |
| 218 |
|
| Contract assets | $ | 2,761 |
| $ | 1,967 |
|
| |
(a)
| Reflects revenues earned in excess of billings on our long-term product service agreements. |
| |
(b)
| Reflects revenues earned in excess of billings on our long-term contracts to construct technically complex equipment. |
| |
(c)
| Represents cost deferral for shipped goods and other costs for which the criteria for revenue recognition has not yet been met. |
(1)Reflects revenue earned in excess of billings on our long-term contracts to construct technically complex equipment and certain other service agreements. NOTE 8. BORROWINGS
Short-term and long-term borrowings consisted of the following:
|
| | | | | | |
| | September 30, 2017 | December 31, 2016 |
| Short-term borrowings | | |
| Short-term bank borrowings | $ | 202 |
| $ | 79 |
|
| Current portion of long-term borrowings | 274 |
| 34 |
|
| Short-term borrowings from GE | 1,364 |
| 121 |
|
| Other short-term borrowings | 26 |
| 5 |
|
| Total short-term borrowings | $ | 1,866 |
| $ | 239 |
|
| | | |
| Long-term borrowings | | |
7.5% Senior Notes due November 2018
| $ | 557 |
| $ | — |
|
3.2% Senior Notes due August 2021
| 527 |
| — |
|
8.55% Debentures due June 2024
| 142 |
| — |
|
6.875% Notes due January 2029
| 387 |
| — |
|
5.125% Notes due September 2040
| 1,310 |
| — |
|
| Capital leases | 89 |
| 1 |
|
| Other long-term borrowings | 27 |
| 37 |
|
| Total long-term borrowings | 3,039 |
| 38 |
|
| Total borrowings | $ | 4,905 |
| $ | 277 |
|
On July 3, 2017, in connection with the Transactions, we entered into a new five-year $3 billion committed unsecured revolving credit facility (the 2017 Credit Agreement) with commercial banks maturing in July 2022. The 2017 Credit Agreement contains certain customary representations and warranties, certain affirmative covenants and no negative covenants. Upon the occurrence of certain events of default, our obligations under the 2017 Credit Agreement may be accelerated. Such events of default include payment defaults to lenders under the 2017 Credit Agreement, and other customary defaults. No such events of default have occurred. DuringRevenue recognized during the three months ended September 30, 2017, there were no direct borrowings under2022 and 2021 from performance obligations satisfied (or partially satisfied) in previous periods related to our long-term service agreements was $2 million and $9 million, respectively, and $14 million and $18 million during the 2017 Credit Agreement.nine months ended September 30, 2022 and 2021, respectively. This includes revenue recognized from revisions to cost or billing estimates that may affect a contract’s total estimated profitability resulting in an adjustment of earnings.
Concurrent withNOTE 7. PROGRESS COLLECTIONS AND DEFERRED INCOME
Contract liabilities include progress collections, which reflects billings in excess of revenue, and deferred income on our long-term contracts to construct technically complex equipment, long-term product maintenance or extended warranty arrangements. Contract liabilities are comprised of the Transactions associated withfollowing:
| | | | | | | | |
| September 30, 2022 | December 31, 2021 |
| Progress collections | $ | 3,144 | | $ | 3,108 | |
| Deferred income | 118 | | 124 | |
| Progress collections and deferred income (contract liabilities) | $ | 3,262 | | $ | 3,232 | |
Revenue recognized during the acquisitionthree months ended September 30, 2022 and 2021 that was included in the contract liabilities at the beginning of the period was $467 million and $448 million, respectively, and $1,720 million and $2,033 million during the nine months ended September 30, 2022 and 2021, respectively.
Baker Hughes on July 3, 2017, Baker Hughes Co-Obligor, Inc. became a co-obligor, jointly and severally with us, on our registered debt securities. This co-obligor is our 100%-owned finance subsidiary that was incorporated for the sole purpose of serving as a co-obligor of debt securities and has no assets or operations other than those related to its sole purpose.Holdings LLC 2022 Third Quarter Form 10-Q | 11
Baker Hughes a GE company,Holdings LLC
Notes to Unaudited Condensed Consolidated and Combined Financial Statements
NOTE 8. LEASES
Our acquisitionleasing activities primarily consist of Baker Hughes assumed alloperating leases for administrative offices, manufacturing facilities, research centers, service centers, sales offices and certain equipment.
| | | | | | | | | | | | | | |
| Three Months Ended September 30, | Nine Months Ended September 30, |
| Operating Lease Expense | 2022 | 2021 | 2022 | 2021 |
| Long-term fixed lease | $ | 65 | | $ | 64 | | $ | 190 | | $ | 192 | |
| Long-term variable lease | 14 | | 7 | | 36 | | 24 | |
| Short-term lease | 127 | | 119 | | 351 | | 328 | |
| Total operating lease expense | $ | 206 | | $ | 190 | | $ | 577 | | $ | 544 | |
Cash flows used in operating activities for operating leases approximates our expense for the outstandingthree and nine months ended September 30, 2022 and 2021.
The weighted-average remaining lease term as of September 30, 2022 and December 31, 2021 was approximately eight years and nine years for our operating leases, respectively. The weighted-average discount rate used to determine the operating lease liability as of September 30, 2022 and December 31, 2021 was 3.2% and 3.3%, respectively.
NOTE 9. BORROWINGS
The Company's borrowings including all notes, senior notes, and debentures. A step-up adjustmentare comprised of $364 million was recorded upon the acquisition of Baker Hughes to present these borrowings at fair value.following:
| | | | | | | | |
| September 30, 2022 | December 31, 2021 |
| Current borrowings | | |
| | |
| | |
| | |
| | |
| Other borrowings | $ | 43 | | $ | 40 | |
| | |
| | |
| | |
| Long-term borrowings | | |
| 1.231% Senior Notes due December 2023 | 648 | | 647 | |
| 8.55% Debentures due June 2024 | 115 | | 118 | |
| 2.061% Senior Notes due December 2026 | 597 | | 597 | |
| 3.337% Senior Notes due December 2027 | 1,275 | | 1,335 | |
| 6.875% Notes due January 2029 | 275 | | 279 | |
| 3.138% Senior Notes due November 2029 | 523 | | 522 | |
| 4.486% Senior Notes due May 2030 | 497 | | 497 | |
| 5.125% Senior Notes due September 2040 | 1,288 | | 1,292 | |
| 4.080% Senior Notes due December 2047 | 1,337 | | 1,337 | |
| Other long-term borrowings | 57 | | 63 | |
| Total long-term borrowings | 6,612 | | 6,687 | |
| Total borrowings | $ | 6,655 | | $ | 6,727 | |
The estimated fair value of total borrowings at September 30, 20172022 and December 31, 20162021 was $4,975$5,696 million and $303$7,328 million, respectively. For a majority of our borrowings the fair value was determined using quoted period-end market prices. Where market prices are not available, we estimate fair values based on valuation methodologies using current market interest rate data adjusted for our non-performance risk.
See "Note 14. Related Party Transactions" for additional information on BHH LLC has a $3 billion committed unsecured revolving credit facility ("the short-term borrowings from GE, and see "Note 12. Financial Instruments" for additional information about borrowings and associated swaps.
NOTE 9. EMPLOYEE BENEFIT PLANS
Certain U.S. employees are covered under various U.S. GE employee benefit plans, including GE's retirement plans (pension, retiree health and life insurance, and savings benefit plans).Credit Agreement") with commercial banks maturing in December 2024. In addition, certain United Kingdom (UK) employees participate in the GE UK Pension Plan. We are allocated relevant participation costs for these GE employee benefit plans as part of multiemployer plans. As such, we have not recorded any liabilities associateda commercial paper program with our participation in these plans. Expenses associated with our participation in these plans was $22 million and $25 million in the three months ended September 30, 2017 and 2016, respectively, and $67 million and $73 million in the nine months ended September 30, 2017 and 2016, respectively.
In addition to the GE Plans, we have both funded and unfunded noncontributory defined benefit pension plans (Pension Benefits) covering certain employees primarily in the U.S., UK, Germany and Canada. Our pension plans include seven U.S. and six non-U.S. pension plans with pension assets or obligations greater than $20 million. We also provide certain postretirement health care benefits (Other Postretirement Benefits), through unfunded plans, to a closed group of U.S. employees who, when they retire, have met certain age and service requirements.
The components of net periodic cost of plans sponsored by us are as follows for the three months ended September 30:
Baker Hughes Holdings LLC 2022 Third Quarter Form 10-Q | 12
|
| | | | | | | | | | | | | | | | | | |
| U.S. Pension Benefits | Non-U.S. Pension Benefits | Other Postretirement Benefits |
| 2017 | 2016 | 2017 | 2016 | 2017 | 2016 |
| Service cost | $ | 12 |
| $ | 3 |
| $ | 4 |
| $ | 1 |
| $ | 1 |
| $ | — |
|
| Interest cost | 12 |
| 5 |
| 6 |
| 2 |
| 2 |
| — |
|
| Expected return on plan assets | (20 | ) | (8 | ) | (11 | ) | (1 | ) | — |
| — |
|
| Amortization of prior service credit | — |
| — |
| — |
| — |
| (1 | ) | 1 |
|
| Amortization of net actuarial loss | 2 |
| 2 |
| 2 |
| 1 |
| — |
| — |
|
| Other | — |
| — |
| — |
| — |
| — |
| (3 | ) |
| Net periodic cost (benefit) | $ | 6 |
| $ | 2 |
| $ | 1 |
| $ | 3 |
| $ | 2 |
| $ | (2 | ) |
The components of net periodic cost of plans sponsored by us are as follows for the nine months ended September 30:
Baker Hughes a GE company,Holdings LLC
Notes to Unaudited Condensed Consolidated and Combined Financial Statements
authorization up to $3 billion under which we may issue from time to time commercial paper with maturities of no more than 397 days. At September 30, 2022 and December 31, 2021, there were no borrowings under either the Credit Agreement or the commercial paper program.
Baker Hughes Co-Obligor, Inc. is a co-obligor, jointly and severally with BHH LLC on our long-term debt securities. This co-obligor is a 100%-owned finance subsidiary of BHH LLC that was incorporated for the sole purpose of serving as a corporate co-obligor of long-term debt securities and has no assets or operations other than those related to its sole purpose. As of September 30, 2022, Baker Hughes Co-Obligor, Inc. is a co-obligor of our long-term debt securities totaling $6,555 million.
|
| | | | | | | | | | | | | | | | | | |
| U.S. Pension Benefits | Non-U.S. Pension Benefits | Other Postretirement Benefits |
| 2017 | 2016 | 2017 | 2016 | 2017 | 2016 |
| Service cost | $ | 17 |
| $ | 8 |
| $ | 7 |
| $ | 5 |
| $ | 2 |
| $ | 1 |
|
| Interest cost | 23 |
| 17 |
| 9 |
| 9 |
| 4 |
| 4 |
|
| Expected return on plan assets | (38 | ) | (25 | ) | (13 | ) | (10 | ) | — |
| — |
|
| Amortization of prior service credit | — |
| — |
| — |
| — |
| (2 | ) | (2 | ) |
| Amortization of net actuarial loss | 4 |
| 6 |
| 5 |
| 5 |
| (2 | ) | — |
|
Curtailment/settlement gain (a) | — |
| — |
| — |
| (26 | ) | (3 | ) | (2 | ) |
| Other | — |
| — |
| — |
| — |
| — |
| (8 | ) |
| Net periodic cost (benefit) | $ | 6 |
| $ | 6 |
| $ | 8 |
| $ | (17 | ) | $ | (1 | ) | $ | (7 | ) |
| |
(a)
| The curtailment/settlement gain for the non-U.S. pension benefits for the nine months ended September 30, 2016 is primarily associated with two UK plans merging into the GE UK Pension Plan. |
For all pension plans sponsored by us, we make annual contributionsCertain Senior Notes contain covenants that restrict BHH LLC's ability to take certain actions, including, but not limited to, the planscreation of certain liens securing debt, the entry into certain sale-leaseback transactions, and engaging in amounts equal to or greater than amounts necessary to meet minimum government funding requirements. Duringcertain merger, consolidation and asset sale transactions in excess of specified limits. At September 30, 2022, we were in compliance with all debt covenants.
NOTE 10. INCOME TAXES
For the three and nine months ended September 30, 2017,2022, the provision for income taxes was $145 million and $422 million, respectively. The difference between the U.S. statutory tax rate of 21% and the effective tax rate is primarily related to losses with no tax benefit due to valuation allowances, restructuring charges for which a majority has no tax benefit, and earnings in jurisdictions with tax rates higher than the U.S. In addition, since we contributed approximately $49 million toare a partnership for U.S. federal tax purposes, any tax benefits associated with U.S. losses are recognized by our pensionMembers and postretirement benefit plans. not reflected in our tax expense.
For our defined contribution plans (including GE sponsored plans) during the three and nine months ended September 30, 2017 we contributed approximately $69 million.
NOTE 10. INCOME TAXES
Income2021, the provision for income taxes was $189 million and $422 million, respectively. The difference between the U.S. statutory tax expense was $96 million forrate of 21% and the three months ended September 30, 2017 comparedeffective tax rate is primarily related to $70 million for the prior year quarter. The increase was primarily attributable to us not being subject to U.S. tax after the Transactions and unable to recognize alosses with no tax benefit on U.S. losses as those losses are passed throughdue to our members. Consequently, the tax expense is primarily attributable to non-U.S. taxes related to our foreign subsidiaries. The positive impact of foreign tax rates lower than the U.S. rate of 35% is offset by adjustments to prior estimates, increased valuation allowances and withholding taxes. The prior year quarter reflects 100% of the taxes associated with U.S. and non-U.S. earnings of the historic GE O&G business.changes in unrecognized tax benefits related to uncertain tax positions.
For the nine months ended September 30, 2017, our income tax expense was $125 million compared to income tax expense of $132 million in the first nine months of 2016. The $7 million net decrease in tax expense is due to lower income before taxes partially offset by U.S. losses incurred in the current quarter that we are not able to benefit from as those losses are passed through to our member. The positive impact of foreign tax rates lower than the U.S. rate of 35% is offset by adjustments to prior estimates, increased valuation allowances and withholding taxes. The prior year nine months reflects 100% of the taxes associated with U.S. and non-U.S. earnings of the historic GE O&G business.
NOTE 11. MEMBERS' EQUITY
COMMON UNITS
The BHGEBHH LLC Agreement provides that initially there is one class of Common Units,common units ("Units"), which are currently held currently by BHGE, indirectly through EHHC and CFC Holdings, LLC (CFC Holdings), and by GE or GE's affiliates.the Members. If BHGEBaker Hughes issues a share of Class A Common Stock,common stock, including in connection with an equity incentive or similar plan, BHGE LLCwe will also issue a corresponding Common Unit to BHGEBaker Hughes or one of its direct subsidiaries. For the threenine months ended September 30, 2017,2022 and 2021, we issued 0.45 million Common9,069 thousand and 7,204 thousand Units, respectively, to BHGEBaker Hughes or one of its direct subsidiaries in connection with the issuance of its Class A Common Stockcommon stock. The Members are entitled through their Units to receive distributions on an equal amount of any dividend paid by BHGE.Baker Hughes to its Class A shareholders.
In 2021, Baker Hughes' Board of Directors authorized us to repurchase up to $2 billion of our Units. We expect to fund the repurchase program from cash generated from operations, and we expect to make Unit repurchases from time to time subject to the Company's capital plan, market conditions, and other factors, including regulatory restrictions. The repurchase program may be suspended or discontinued at any time and does not have a specified expiration date. During the three and nine months ended September 30, 2022, we repurchased and canceled 10.7 million and 25.5 million Units for $265 million and $727 million, representing an average price per Unit of $24.79 and $28.47, respectively. For the three months ended September 30, 2022, this includes 0.2 million Units totaling $7 million that were repurchased in June 2022 but not settled and canceled until July 2022. During the three months ended September 30, 2021, we repurchased and canceled 4.4 million Units for $106 million, representing an average price per Unit of $23.98. As of September 30, 2017, GE owns2022, we had authorization remaining to repurchase up to approximately 62.5%$0.8 billion of our Common Units and BHGE owns approximately 37.5% of the remaining Common Units.
Baker Hughes Holdings LLC 2022 Third Quarter Form 10-Q | 13
Baker Hughes a GE company,Holdings LLC
Notes to Unaudited Condensed Consolidated and Combined Financial Statements
The following table presents the changes in the number of Units outstanding (in thousands):
| | | | | | | | | | | | | | |
| Units Held
by Baker Hughes | Units Held
by GE |
| 2022 | 2021 | 2022 | 2021 |
| Balance at January 1 | 909,142 | | 723,999 | | 116,548 | | 311,433 | |
| Issue of Units to Baker Hughes under equity incentive plan | 9,069 | | 7,204 | | — | | — | |
| | | | |
| | | | |
Exchange of Units (1) | 109,548 | | 132,706 | | (109,548) | | (132,706) | |
| Repurchase and cancellation of Units | (25,532) | | (4,430) | | — | | — | |
| Balance at September 30 | 1,002,227 | | 859,480 | | 7,000 | | 178,726 | |
(1)When shares of Class B common stock, together with associated Units, are exchanged for shares of Class A common stock pursuant to the Exchange Agreement, such shares of Class B common stock, together with associated Units, are canceled.
ACCUMULATED OTHER COMPREHENSIVE LOSS (AOCL)
The following tables present the changes in accumulated other comprehensive loss, net of tax:
| | | | | | | | | | | | | | | |
| | Foreign Currency Translation Adjustments | Cash Flow Hedges | Benefit Plans | Accumulated Other Comprehensive Loss |
| Balance at December 31, 2021 | | $ | (2,398) | | $ | (12) | | $ | (281) | | $ | (2,691) | |
| Other comprehensive income before reclassifications | | (509) | | (2) | | (1) | | (512) | |
| Amounts reclassified from accumulated other comprehensive loss | | 35 | | 3 | | 19 | | 57 | |
| Deferred taxes | | — | | — | | (13) | | (13) | |
| Other comprehensive income (loss) | | (474) | | 1 | | 5 | | (468) | |
| Less: Other comprehensive loss attributable to noncontrolling interests | | (2) | | — | | — | | (2) | |
| | | | | |
| Less: Other adjustments | | — | | — | | 1 | | 1 | |
| Balance at September 30, 2022 | | $ | (2,870) | | $ | (11) | | $ | (277) | | $ | (3,158) | |
Baker Hughes Holdings LLC 2022 Third Quarter Form 10-Q | 14
Baker Hughes Holdings LLC
Notes to Unaudited Condensed Consolidated Financial Statements
|
| | | | | | | | | | | | | | | |
| | Investment Securities | Foreign Currency Translation Adjustments | Cash Flow Hedges | Benefit Plans | Accumulated Other Comprehensive Loss |
| Balance at December 31, 2016 | $ | — |
| $ | (1,801 | ) | $ | (10 | ) | $ | (83 | ) | $ | (1,894 | ) |
| Other comprehensive income (loss) before reclassifications | 40 |
| 217 |
| 12 |
| (12 | ) | 257 |
|
| Amounts reclassified from accumulated other comprehensive income (loss) | (39 | ) | — |
| 9 |
| — |
| (30 | ) |
| Deferred taxes | 1 |
| (10 | ) | (4 | ) | 6 |
| (7 | ) |
| Other comprehensive income (loss) | 2 |
| 207 |
| 17 |
| (6 | ) | 220 |
|
| Less: Other comprehensive income (loss) attributable to noncontrolling interests | 1 |
| 1 |
| — |
| 2 |
| 4 |
|
| Balance at September 30, 2017 | $ | 1 |
| $ | (1,595 | ) | $ | 7 |
| $ | (91 | ) | $ | (1,678 | ) |
|
| | | | | | | | | | | | | | | |
| | Investment Securities | Foreign Currency Translation Adjustments | Cash Flow Hedges | Benefit Plans | Accumulated Other Comprehensive Loss |
| Balance at December 31, 2015 | $ | — |
| $ | (1,384 | ) | $ | (2 | ) | $ | (146 | ) | $ | (1,532 | ) |
| Other comprehensive income (loss) before reclassifications | — |
| (158 | ) | (39 | ) | 120 |
| (77 | ) |
| Amounts reclassified from accumulated other comprehensive income (loss) | — |
| — |
| 33 |
| 2 |
| 35 |
|
| Deferred taxes | — |
| (3 | ) | 1 |
| (53 | ) | (55 | ) |
| Other comprehensive income (loss) | — |
| (161 | ) | (5 | ) | 69 |
| (97 | ) |
| Less: Other comprehensive income (loss) attributable to noncontrolling interests | — |
| (4 | ) | — |
| 6 |
| 2 |
|
| Balance at September 30, 2016 | $ | — |
| $ | (1,541 | ) | $ | (7 | ) | $ | (83 | ) | $ | (1,631 | ) |
| | | | | | | | | | | | | | | |
| | Foreign Currency Translation Adjustments | Cash Flow Hedges | Benefit Plans | Accumulated Other Comprehensive Loss |
| Balance at December 31, 2020 | | $ | (2,096) | | $ | 5 | | $ | (451) | | $ | (2,542) | |
| Other comprehensive income (loss) before reclassifications | | (82) | | (6) | | 47 | | (41) | |
| Amounts reclassified from accumulated other comprehensive loss | | 31 | | (7) | | 32 | | 56 | |
| Deferred taxes | | — | | — | | (1) | | (1) | |
| Other comprehensive income (loss) | | (51) | | (13) | | 78 | | 14 | |
| Less: Other comprehensive loss attributable to noncontrolling interests | | (1) | | | | (1) | |
| | | | | |
| | | | | |
| | | | | |
| Balance at September 30, 2021 | | $ | (2,146) | | $ | (8) | | $ | (373) | | $ | (2,527) | |
The amounts reclassified from accumulated other comprehensive loss during the nine months ended September 30, 20172022 and 20162021 represent realized(i) gains (losses) reclassified on investment securities, foreign exchange contracts on our cash flow hedges (see "Note 12. Financial Instruments" for additional details) andwhen the hedged transaction occurs, (ii) the amortization of net actuarial loss andgain (loss), prior service credit, settlements, and curtailments which are included in the computation of net periodic pension cost, and (iii) the release of foreign currency translation adjustments (see "Note 9. Employee Benefit Plans"16. Restructuring, Impairment, and Other" for additional details). These reclassifications are recorded across the various cost and expense line items within the condensed consolidated and combined statements of income (loss).
Baker Hughes, a GE company, LLC
Notes to Unaudited Condensed Consolidated and Combined Financial Statements
NOTE 12. FINANCIAL INSTRUMENTS
RECURRING FAIR VALUE MEASUREMENTS
Our assets and liabilities measured at fair value on a recurring basis consists of derivative instruments and investment securities.
|
| | | | | | | | | | | | | | | | | | | | | | | | |
| | September 30, 2017 | December 31, 2016 |
| | Level 1 | Level 2 | Level 3 | Net Balance | Level 1 | Level 2 | Level 3 | Net Balance |
| Assets | |
| |
| |
| | | | | |
| Derivatives | $ | — |
| $ | 212 |
| $ | — |
| $ | 212 |
| $ | — |
| $ | 318 |
| $ | — |
| $ | 318 |
|
| Investment securities | 99 |
| — |
| 171 |
| 270 |
| — |
| — |
| — |
| — |
|
| Total assets | 99 |
| 212 |
| 171 |
| 482 |
| — |
| 318 |
| — |
| 318 |
|
| | | | | | | | | |
| Liabilities | | | | | | | | |
| Derivatives | — |
| (196 | ) | — |
| (196 | ) | — |
| (375 | ) | — |
| (375 | ) |
| Total liabilities | $ | — |
| $ | (196 | ) | $ | — |
| $ | (196 | ) | $ | — |
| $ | (375 | ) | $ | — |
| $ | (375 | ) |
| | | | | | | | | | | | | | | | | | | | | | | | | | |
| September 30, 2022 | December 31, 2021 |
| Level 1 | Level 2 | Level 3 | Net Balance | Level 1 | Level 2 | Level 3 | Net Balance |
| Assets | | | | | | | | |
| Derivatives | $ | — | | $ | 60 | | $ | — | | $ | 60 | | $ | — | | $ | 29 | | $ | — | | $ | 29 | |
| Investment securities | 848 | | — | | 1 | | 849 | | 1,033 | | — | | 8 | | 1,041 | |
| Total assets | 848 | | 60 | | 1 | | 909 | | 1,033 | | 29 | | 8 | | 1,070 | |
| | | | | | | | |
| Liabilities | | | | | | | | |
| Derivatives | — | | (119) | | — | | (119) | | — | | (49) | | — | | (49) | |
| Total liabilities | $ | — | | $ | (119) | | $ | — | | $ | (119) | | $ | — | | $ | (49) | | $ | — | | $ | (49) | |
There were no transfers betweento, or from, Level 1, 2 and 3 during the three and nine months ended September 30, 2017.2022.
The following table provides a reconciliation of recurring Level 3 fair value measurements:measurements for investment securities:
| | | | | | | | |
| 2022 | 2021 |
| Balance at January 1 | $ | 8 | | $ | 30 | |
| | |
| Proceeds at maturity | (7) | | (21) | |
| | |
| Balance at September 30 | $ | 1 | | $ | 9 | |
The most significant unobservable input used in the valuation of our Level 3 instruments is the discount rate. Discount rates are determined based on inputs that market participants would use when pricing investments, including credit and liquidity risk. An increase in the discount rate would result in a decrease in the fair value of our
Baker Hughes Holdings LLC 2022 Third Quarter Form 10-Q | 15
Baker Hughes Holdings LLC
Notes to Unaudited Condensed Consolidated Financial Statements
|
| | | |
| Balance at December 31, 2016 | $ | — |
|
| Additions as a result of business combination | 179 |
|
| Purchases | 65 |
|
| Proceeds at maturity | (71 | ) |
| Unrealized losses recognized in accumulated other comprehensive income (loss) | (2 | ) |
| Balance at September 30, 2017 | $ | 171 |
|
investment securities. There are no unrealized gains or losses recognized in the condensed consolidated and combined statement of income (loss) on account of any Level 3 instrument still held at the reporting date.
| | | | | | | | | | | | | | | | | | | | | | | | | | |
| September 30, 2022 | December 31, 2021 |
| Amortized Cost | Gross Unrealized Gains | Gross Unrealized Losses | Estimated Fair Value | Amortized Cost | Gross Unrealized Gains | Gross Unrealized Losses | Estimated Fair Value |
Investment securities (1) | | | | | | | | |
Non-U.S. debt securities (2) | $ | 1 | | $ | — | | $ | — | | $ | 1 | | $ | 8 | | $ | — | | $ | — | | $ | 8 | |
| Equity securities | 556 | | 292 | | — | | 848 | | 579 | | 455 | | (1) | | 1,033 | |
| Total | $ | 557 | | $ | 292 | | $ | — | | $ | 849 | | $ | 587 | | $ | 455 | | $ | (1) | | $ | 1,041 | |
(1)Losses recorded to earnings related to these securities were $52 million and $141 million for the three months ended September 30, 2022 and 2021, respectively, and $170 million and $954 million for the nine months ended September 30, 2022 and 2021, respectively.
(2)As of September 30, 2022 and December 31, 2021, our non-U.S. debt securities are classified as available for sale securities and mature within one year.
As of September 30, 2022 and December 31, 2021, our equity securities with readily determinable fair values are comprised primarily of our investment in C3.ai, Inc. ("C3 AI") of $108 million and $270 million, respectively, and ADNOC Drilling of $738 million and $741 million, respectively. We measured our investments to fair value based on quoted prices in active markets.
As of September 30, 2022 and December 31, 2021, our investment in C3 AI consists of 8,650,476 shares, of C3 AI Class A common stock ("C3 AI Shares"). There were no C3 AI Shares sold during the three and nine months ended September 30, 2022 and the three months ended September 30, 2021. During the nine months ended September 30, 2021, we sold approximately 2.2 million of C3 AI Shares and received proceeds of $145 million. For the three months ended September 30, 2022 and 2021, we recorded a loss of $50 million and $140 million, respectively, and for the nine months ended September 30, 2022 and 2021, we recorded a loss of $162 million and $955 million, respectively, from the net change in fair value of our investment in C3 AI, which is reported in “Other non-operating loss, net” in our condensed consolidated statements of income (loss).
As of September 30, 2022 and December 31, 2021, our investment in ADNOC Drilling consists of 800,000,000 shares. We recorded a loss of $2 million for both the three and nine months ended September 30, 2022, from the net change in fair value of our investment in ADNOC Drilling, which is reported in “Other non-operating loss, net” in our condensed consolidated statements of income (loss).
As of September 30, 2022 and December 31, 2021, $849 million and $1,041 million of total investment securities are recorded in "All other current assets," respectively.
FAIR VALUE DISCLOSURE OF FINANCIAL INSTRUMENTS
Our financial instruments include cash and cash equivalents, current receivables, certain investments, accounts payable, short and long-term debt, and derivative financial instruments. Except for long-term debt, the estimated fair value of these financial instruments atas of September 30, 20172022 and December 31, 20162021 approximates their carrying value as reflected in our condensed consolidated and combined financial statements. For further information on the fair value of our debt, see "Note 8.9. Borrowings."
Baker Hughes Holdings LLC 2022 Third Quarter Form 10-Q | 16
Baker Hughes Holdings LLC
Notes to Unaudited Condensed Consolidated Financial Statements
DERIVATIVES AND HEDGING
In this section, we explain how weWe use derivatives to manage our risks and how these financial instruments are reflected in our condensed consolidated and combined financial statements. Our use of derivatives relates solely to risk management; we do not use derivatives for speculation.
The table below summarizes the fair value of all derivatives, including hedging instruments and embedded derivatives.
Baker Hughes, a GE company, LLC
Notes to Unaudited Condensed Consolidated and Combined Financial Statements
| | | | September 30, 2017 | December 31, 2016 | | September 30, 2022 | December 31, 2021 |
| | Assets | (Liabilities) | Assets | (Liabilities) | | Assets | Liabilities | Assets | Liabilities |
| Derivatives accounted for as hedges | | Derivatives accounted for as hedges | |
| Currency exchange contracts | $ | 10 |
| $ | — |
| $ | 2 |
| $ | (9 | ) | Currency exchange contracts | $ | — | | $ | (2) | | $ | — | | $ | (3) | |
| Interest rate swap contracts | | Interest rate swap contracts | — | | (70) | | — | | (10) | |
| | | |
| Derivatives not accounted for as hedges | | Derivatives not accounted for as hedges | |
| Currency exchange contracts | 202 |
| (196 | ) | 316 |
| (366 | ) | |
| Currency exchange contracts and other | | Currency exchange contracts and other | 60 | | (47) | | 29 | | (36) | |
| | Total derivatives | $ | 212 |
| $ | (196 | ) | $ | 318 |
| $ | (375 | ) | Total derivatives | $ | 60 | | $ | (119) | | $ | 29 | | $ | (49) | |
Derivatives are classified in the captions "All other current assets," "All other assets," "All other current liabilities," and "All other liabilities"condensed consolidated statements of financial position depending on their respective maturity date.
RISK MANAGEMENT STRATEGY
We buy, manufacture As of September 30, 2022 and sell componentsDecember 31, 2021, $59 million and products as well as provide services across global markets. These activities expose us to changes$28 million of derivative assets are recorded in foreign currency exchange rates"All other current assets" and commodity prices, which can adversely affect revenues earned$1 million and costs of operating our business. When the currency$1 million are recorded in which we sell equipment differs from the primary currency (known as its functional currency) and the exchange rate fluctuates, it will affect the revenue we earn on the sale. These sales and purchase transactions also create receivables and payables denominated in foreign currencies, along with"All other monetary assets and liabilities, which expose us to foreign currency gains and losses based on changes in exchange rates. Changesassets" in the pricecondensed consolidated statements of a raw material that we usefinancial position, respectively. As of September 30, 2022 and December 31, 2021, $46 million and $39 million of derivative liabilities are recorded in manufacturing can affect"All other current liabilities" and $73 million and $10 million are recorded in "All other liabilities" of the costcondensed consolidated statements of manufacturing. We use derivatives to mitigate or eliminate these exposures.financial position, respectively.
FORMS OF HEDGING
In this section, we explain the hedging methods we use and their effects on our condensed consolidated and combined financial statements.
Cash flow hedgesFlow Hedges
We use cash flow hedging primarily to reduce or eliminate the effects of foreign exchange rate changes on purchase and sale contracts. Accordingly, the vast majority of our derivative activity in this category consists of currency exchange contracts. We also use commodity derivatives to reduce or eliminate price risk on raw materials purchased for useChanges in manufacturing.
Under hedge accounting, the derivative carrying amount is measured at fair value each period and any resulting gain or loss isof cash flow hedges are recorded in a separate component of equity. Differences between the derivative and the hedged item may cause changes in their fair values to not offset completely, which is referredequity (referred to as ineffectiveness. When"Accumulated Other Comprehensive Income", or "AOCI") and are recorded in earnings in the period in which the hedged transaction occurs, these amounts are released from equity,occurs. See "Note 11. Members' Equity" for further information on activity in order that the transaction will be reflected in earnings at the rate locked in by the derivative. The effect of the hedge is reported in the same financial statement line item as the earnings effects of the hedged transaction. The table below summarizes how the derivative is reflected in the condensed consolidated and combined statement of financial position and income (loss) under hedge accounting. The effect of the hedged forecasted transaction is not presented in this table but offsets the earnings effect of the derivative.
Baker Hughes, a GE company, LLC
Notes to Unaudited Condensed Consolidated and Combined Financial Statements
|
| | | | | | | | | | | | |
| | Three months ended September 30, | Nine months ended September 30, |
| Financial statement effects - cash flow hedges | 2017 | 2016 | 2017 | 2016 |
| Condensed consolidated and combined statement of financial position changes: | | | | |
| Fair value of derivatives increase (decrease) | $ | 9 |
| $ | (4 | ) | $ | 12 |
| $ | (39 | ) |
| Equity (increase) decrease | (9 | ) | 4 |
| (12 | ) | 39 |
|
| | | | | |
| Income (loss) related to ineffectiveness | — |
| — |
| — |
| — |
|
Income (loss) effect of derivatives (a) | — |
| (3 | ) | (9 | ) | (33 | ) |
| |
(a)
| Offsets earnings effect of the hedged forecasted transaction |
The following table explains the effect of changes in market rates on the fair value of derivatives we use most commonly inAOCI for cash flow hedging arrangements.
|
| | | | |
Currency forwards/swaps | | U.S. dollar strengthens | | U.S. dollar weakens |
Pay U.S. dollars/receive foreign currency | | Fair value decreases | | Fair value increases |
We expect to transfer $4 million to earnings as an expense in the next 12 months contemporaneously with the earnings effectshedges. As of the related forecast transactions. At September 30, 20172022 and 2016,December 31, 2021, the maximum term of derivative instruments that hedge forecastforecasted transactions was three-yearsone year.
Fair Value Hedges
All of our long-term debt is comprised of fixed rate instruments. We are subject to interest rate risk on our debt portfolio and two-years, respectively. See "Note 11. Members' Equity" for additional information about reclassification outmay use interest rate swaps to manage the economic effect of accumulated other comprehensive income.fixed rate obligations associated with certain debt. Under these arrangements, we agree to exchange, at specified intervals, the difference between fixed and floating interest amounts calculated by reference to an agreed-upon notional principal amount.
For cash flow hedges, theAs of September 30, 2022 and December 31, 2021, we had interest rate swaps with a notional amount of ineffectiveness in the hedging relationship and$500 million that converted a portion of our $1,350 million aggregate principal amount of the3.337% fixed rate Senior Notes due 2027 into a floating rate instrument with an interest rate based on a LIBOR index as a hedge of its exposure to changes in fair value that are attributable to interest rate risk. We concluded that the interest rate swap met the criteria necessary to qualify for the short-cut method of hedge accounting, and as such, an assumption is made that the change in the fair value of the derivatives that are not includedhedged debt, due to changes in the measurementbenchmark rate, exactly offsets the change in the fair value of the interest rate swaps. Therefore, the derivative is considered to be effective at achieving offsetting changes in the fair value of the hedged liability, and no ineffectiveness were insignificant for each reporting period.is recognized. The mark-to-market of this fair value hedge is recorded as gains or losses in interest expense and is equally offset by the gain or loss of the underlying debt instrument, which also is recorded in interest expense.
Baker Hughes Holdings LLC 2022 Third Quarter Form 10-Q | 17
Baker Hughes Holdings LLC
Notes to Unaudited Condensed Consolidated Financial Statements
Economic Hedges
These derivatives are not designated as hedges from an accounting standpoint (and therefore we do not apply hedge accounting to the relationship) but otherwise serve the same economic purpose as other hedging arrangements. Some economicEconomic hedges are used when changes in the carrying amount of the hedged item are already recorded in earnings in the same period as the derivative, making hedge accounting unnecessary. For some other types of economic hedges, changes in the fair value of the derivative are recorded in earnings currently but changes in the value of the forecasted foreign currency cash flows are only recognized in earnings when they occur. As a result, even though the derivative is an effective economic hedge, there is a net effect on earnings in each period due to differences in the timing of earnings recognition between the derivative and the hedged item.
The table below provides information about the earnings effects of all derivatives that serve as economic hedges. These derivatives are marked to fair value through earnings each period.
The effects are reported in "Selling, general and administrative expenses"following table summarizes the gains (losses) from derivatives not designated as hedges in the condensed consolidated and combined statementstatements of income (loss). In general,:
| | | | | | | | | | | | | | | | | |
| Derivatives not designated as hedging instruments | Condensed consolidated statement of income caption | Three Months Ended September 30, | Nine Months Ended September 30, |
| 2022 | 2021 | 2022 | 2021 |
Currency exchange contracts (1) | Cost of goods sold | $ | 6 | | $ | (2) | | $ | (4) | | $ | 7 | |
| Currency exchange contracts | Cost of services sold | 22 | | 8 | | 36 | | — | |
| Commodity derivatives | Cost of goods sold | (10) | | — | | (7) | | 5 | |
| Other derivatives | Other non-operating loss, net | — | | — | | 2 | | — | |
Total (2) | | $ | 18 | | $ | 6 | | $ | 27 | | $ | 12 | |
(1)Excludes gains of $14 million and $2 million on embedded derivatives for the income (loss) effectsthree months ended September 30, 2022 and 2021, respectively, and gains of $14 million and $5 million during the hedged itemnine months ended September 30, 2022 and 2021, respectively, as embedded derivatives are recordednot considered to be hedging instruments in the same condensed consolidated and combined financial statement lineour economic hedges.
(2)The effect on earnings of derivatives not designated as the derivative. The income (loss) effect of economic hedges after considering offsets related to income (loss) effects of hedged assets and liabilities, is substantially offset by changesthe change in the fair value of forecasted transactions that have not yet affected income (loss).
Baker Hughes, a GE company, LLC
Notes to Unaudited Condensed Consolidatedthe economically hedged items in the current and Combined Financial Statements
|
| | | | | | | | | | | | |
| | Three months ended September 30, | Nine months ended September 30, |
Financial statement effects - economic hedges (a) | 2017 | 2016 | 2017 | 2016 |
| Condensed consolidated and combined statement of financial position changes: | | | | |
Change in fair value of economic hedge increase (decrease) (b) | $ | 59 |
| $ | (41 | ) | $ | 60 |
| $ | (126 | ) |
| Change in fair value of economic hedges which has current earnings offset from hedged assets/liabilities increase (decrease) | 53 |
| (1 | ) | 53 |
| (3 | ) |
Income (loss) effect of economic hedges on forecasted transactions with no current period earnings offset (c) | $ | 6 |
| $ | (40 | ) | $ | 7 |
| $ | (123 | ) |
| |
(a)
| Include both the realized and unrealized movements, as well as those which cover future cash flows yet to be recognized on the condensed consolidated and combined statement of financial position. |
| |
(b)
| Include fair value changes in embedded derivatives |
| |
(c)
| Offset by the future earnings effects of economically hedged item. |
The table below explains the effects of market rate changes on the fair value of derivatives we use most commonly as economic hedges.
|
| | | | |
Currency forwards/swaps | | U.S. dollar strengthens | | U.S. dollar weakens |
Pay U.S. dollars/receive foreign currency | | Fair value decreases | | Fair value increases |
Receive U.S. dollars/pay foreign currency | | Fair value increases | | Fair value decreases |
| | | | |
Commodity derivatives | | Price increases | | Price decreases |
Receive commodity/ pay fixed price | | Fair value increases | | Fair value decreases |
future periods.NOTIONAL AMOUNT OF DERIVATIVES
The notional amount of a derivative is the number of units of the underlying (for example, the notional principal amount of the debt in an interest rate swap). We generally disclose derivative notional amounts on a gross basis.underlying. A substantial majority of the outstanding notional amount of $11.5$3.7 billion and $7.1$3.9 billion at September 30, 20172022 and December 31, 2016,2021, respectively, is related to hedges of anticipated sales and purchases in foreign currency, commodity purchases, changes in interest rates, and contractual terms in contracts that are considered embedded derivatives and for intercompany borrowings in foreign currencies.
We generally disclose derivative notional amounts on a gross basis to indicate the total counterparty risk. Where we have gross purchase and sale derivative contracts for a particular currency, we look to execute these contracts with the same counterparty to reduce our exposure. The table below provides additional information about hownotional amount of these derivative instruments do not generally represent cash amounts exchanged by us and the counterparties, but rather the nominal amount upon which changes in the value of the derivatives are reflected in our condensed consolidated and combined financial statements.
|
| | | | | | |
| Carrying amount related to derivatives | September 30, 2017 | December 31, 2016 |
| Derivative assets | $ | 212 |
| $ | 318 |
|
| Derivative liabilities | (196 | ) | (375 | ) |
| Net derivatives | $ | 16 |
| $ | (57 | ) |
EFFECTS OF DERIVATIVES ON EARNINGS
All derivatives are marked to fair value on our condensed consolidated and combined statement of financial position, whether they are designated in a hedging relationship for accounting purposes or are used as economic hedges. As discussed in the previous sections, each type of hedge affects the financial statements differently. In some economic hedges, both the hedged item and the hedging derivative offset in earnings in the same period. In other economic hedges, the hedged item and the hedging derivative offset in earnings in different periods. In cash flow, the effective portion of the hedging derivative is offset in separate components of equity and ineffectiveness is recognized in earnings.
Baker Hughes, a GE company, LLC
Notes to Unaudited Condensed Consolidated and Combined Financial Statements
measured.
COUNTERPARTY CREDIT RISK
Fair values of our derivatives can change significantly from period to period based on, among other factors, market movements and changes in our positions. We manage counterparty credit risk (the risk that counterparties will default and not make payments to us according to the terms of our agreements) on an individual counterparty basis.
Baker Hughes Holdings LLC 2022 Third Quarter Form 10-Q | 18
Baker Hughes Holdings LLC
Notes to Unaudited Condensed Consolidated Financial Statements
NOTE 13. SEGMENT INFORMATION
OurAs of September 30, 2022, our reportable segments, which are the same as our operating segments, are organized based on the nature of markets and customers. Following the Transactions, we revised our segment structure and began to manage andWe report our operating results through our four operating segments as defined below. We have reflected this revised structure for all historical periods presented.that consist of similar products and services within each segment. These products and services operate across upstream oil and gas and broader energy and industrial markets.
OILFIELD SERVICES ("OFS")
Oilfield Services provides equipmentdiscrete products and services, as well as integrated well services for onshore and offshore operations across the lifecycle of a well, ranging from welldrilling, evaluation, to decommissioning.completion, production and intervention. Products and services include drilling services, including directional drilling, measurement while drilling & logging while drilling, diamond and tri-cone drill bits, drilling and completions fluids, wireline services, (including directional drilling technology, measurement while drilling & logging while drilling), downhole completion tools and systems, wellbore intervention tools and services, wireline services, drilling and completions fluids,pressure pumping, oilfield and industrial chemicals pressure pumping, and artificial lift technologies, (includingincluding electrical submersible pumps).pumps and surface pumping systems.
OILFIELD EQUIPMENT ("OFE")
Oilfield Equipment provides a broad portfolio of products and services required to facilitate the safe and reliable control and flow of hydrocarbons from the subsea wellhead to the surface.production facilities. The Oilfield Equipment portfolio has solutions for the subsea, offshore surface, and onshore operating environments. Products and services include subsea and surface wellheads, pressure control equipment and services, Subsea production systems and services, drilling equipment,flexible pipe systems for offshore and flexible pipeline systems. Oilfield Equipment operation designsonshore applications, and manufactures onshorelife-of-field solutions including well intervention and offshore drilling and production systems and equipment for floating production platforms and providesdecommissioning solutions, covering the entire life cycle of a full range of services related to onshore and offshore drilling activities.field.
TURBOMACHINERY & PROCESS SOLUTIONS ("TPS")
Turbomachinery & Process Solutions provides equipmenttechnology solutions and related services for mechanical-drive, compression and power-generation applications across the energy industry, including oil and gas, industryliquefied natural gas ("LNG") operations, downstream refining and petrochemical segments, as well as productslower carbon solutions to broader energy and services to serve the downstream segments of the industry including refining, petrochemical, distributed gas, flow and process control and other industrial applications.sectors. The Turbomachinery & Process Solutions portfolio includes drivers (aero-derivative gas turbines, heavy-duty gas turbines and synchronous and induction electric motors), compressors (centrifugal and axial, direct drive high speed, integrated, subsea compressors, turbo expanders and reciprocating), turn-keyturnkey solutions (industrial modules and waste heat recovery), pumps, valves, and compressed natural gas (CNG)("CNG") and small-scale liquefied natural gas (LNG) solutions used primarily for shale oil and gas field development.LNG solutions.
DIGITAL SOLUTIONS ("DS")
Digital Solutions provides equipment, software, and services for a wide range of industries, including oil &and gas, power generation, aerospace, metals, and transportation. The offerings include a number of products and solutions that provide industrial asset management capabilities, including sensor-based process measurement, machine health and condition monitoring, asset strategy and management, control systems, as well as non-destructive testing and inspection, turbine, generator and plant controls and condition monitoring, as well as pipeline integrity solutions.
Baker Hughes Holdings LLC 2022 Third Quarter Form 10-Q | 19
Baker Hughes Holdings LLC
Notes to Unaudited Condensed Consolidated Financial Statements
SEGMENT RESULTS
Segment revenue and profit are determined based on the internal performance measures used by the Company to assess the performance of each segment in a financial period. Summarized financial information is shown in the following tables. Consistent accounting policies have been applied by all segments within the Company, for all reporting periods.
Baker Hughes, a GE company, LLC
Notes to Unaudited Condensed Consolidated and Combined Financial Statements
| | | | | | | | | | | | | | |
| Three Months Ended September 30, | Nine Months Ended September 30, |
| Segment revenue | 2022 | 2021 | 2022 | 2021 |
| Oilfield Services | $ | 2,842 | | $ | 2,419 | | $ | 8,019 | | $ | 6,976 | |
| Oilfield Equipment | 561 | | 603 | | 1,630 | | 1,867 | |
| Turbomachinery & Process Solutions | 1,438 | | 1,562 | | 4,076 | | 4,675 | |
| Digital Solutions | 528 | | 510 | | 1,526 | | 1,499 | |
| Total | $ | 5,369 | | $ | 5,093 | | $ | 15,251 | | $ | 15,017 | |
The performance of our operating segments is evaluated based on segment operating income (loss), which is defined as income (loss) before income taxes and equity in loss of affiliate and before the following: net interest expense, net other non operating income (loss),non-operating loss, corporate expenses, restructuring, impairment and other charges, inventory impairments, merger andseparation related costs and certain gains and losses not allocated to the operating segments.
| | | | | | | | | | | | | | |
| Three Months Ended September 30, | Nine Months Ended September 30, |
| Segment income (loss) before income taxes | 2022 | 2021 | 2022 | 2021 |
| Oilfield Services | $ | 330 | | $ | 190 | | $ | 812 | | $ | 505 | |
| Oilfield Equipment | (6) | | 14 | | (26) | | 45 | |
| Turbomachinery & Process Solutions | 262 | | 278 | | 705 | | 705 | |
| Digital Solutions | 20 | | 26 | | 53 | | 75 | |
| Total segment | 606 | | 508 | | 1,544 | | 1,330 | |
| Corporate | (103) | | (105) | | (316) | | (324) | |
| | | | |
Inventory impairment (1) | — | | — | | (31) | | — | |
| Restructuring, impairment and other | (230) | | (14) | | (653) | | (219) | |
| Separation related | (5) | | (11) | | (23) | | (53) | |
| Other non-operating loss, net | (60) | | (102) | | (657) | | (791) | |
| Interest expense, net | (65) | | (67) | | (188) | | (205) | |
| Income (loss) before income taxes | $ | 144 | | $ | 209 | | $ | (323) | | $ | (260) | |
|
| | | | | | | | | | | | |
| | Three Months Ended | Three Months Ended |
| | September 30, 2017 | September 30, 2016 |
| Segments | Revenue | Income (Loss) before Income Taxes | Revenue | Income (Loss) before Income Taxes |
| Oilfield Services | $ | 2,635 |
| $ | 75 |
| $ | 192 |
| $ | (66 | ) |
| Oilfield Equipment | 600 |
| (43 | ) | 829 |
| 61 |
|
| Turbomachinery & Process Solutions | 1,511 |
| 210 |
| 1,480 |
| 258 |
|
| Digital Solutions | 629 |
| 87 |
| 523 |
| 101 |
|
| Total segment | 5,375 |
| 329 |
| 3,024 |
| 354 |
|
| Corporate | — |
| (89 | ) | — |
| (75 | ) |
Inventory impairment (a) | — |
| (12 | ) | — |
| (24 | ) |
| Restructuring, impairment and other | — |
| (191 | ) | — |
| (77 | ) |
| Merger and related costs | — |
| (159 | ) | — |
| (2 | ) |
| Other non operating income (loss), net | — |
| (3 | ) | — |
| 6 |
|
| Interest expense, net | — |
| (42 | ) | — |
| (21 | ) |
| Total | $ | 5,375 |
| $ | (167 | ) | $ | 3,024 |
| $ | 161 |
|
(1)Inventory impairments are reported in the "Cost of goods sold" caption of the condensed consolidated statements of income (loss).
Baker Hughes Holdings LLC 2022 Third Quarter Form 10-Q | 20
|
| | | | | | | | | | | | |
| | Nine Months Ended | Nine Months Ended |
| | September 30, 2017 | September 30, 2016 |
| Segments | Revenue | Income (Loss) before Income Taxes | Revenue | Income (Loss) before Income Taxes |
| Oilfield Services | $ | 3,077 |
| $ | (42 | ) | $ | 599 |
| $ | (164 | ) |
| Oilfield Equipment | 1,965 |
| 9 |
| 2,693 |
| 190 |
|
| Turbomachinery & Process Solutions | 4,841 |
| 707 |
| 4,950 |
| 942 |
|
| Digital Solutions | 1,613 |
| 226 |
| 1,511 |
| 240 |
|
| Total segment | 11,496 |
| 900 |
| 9,753 |
| 1,208 |
|
| Corporate | — |
| (282 | ) | — |
| (240 | ) |
Inventory impairment (a) | — |
| (31 | ) | — |
| (131 | ) |
| Restructuring, impairment and other | — |
| (292 | ) | — |
| (452 | ) |
| Merger and related costs | — |
| (310 | ) | — |
| (10 | ) |
| Other non operating income (loss), net | — |
| 65 |
| — |
| 18 |
|
| Interest expense, net | — |
| (75 | ) | — |
| (74 | ) |
| Total | $ | 11,496 |
| $ | (25 | ) | $ | 9,753 |
| $ | 319 |
|
| |
(a)
| Charges for inventory impairments are reported in the "Cost of goods sold" caption of the condensed consolidated and combined statements of income (loss). |
Baker Hughes a GE company,Holdings LLC
Notes to Unaudited Condensed Consolidated and Combined Financial Statements
The following table presents total assetsdepreciation and amortization by segment:
| | | | | | | | | | | | | | |
| Three Months Ended September 30, | Nine Months Ended September 30, |
| Segment depreciation and amortization | 2022 | 2021 | 2022 | 2021 |
| Oilfield Services | $ | 185 | | $ | 183 | | $ | 587 | | $ | 578 | |
| Oilfield Equipment | 20 | | 22 | | 60 | | 81 | |
| Turbomachinery & Process Solutions | 28 | | 30 | | 87 | | 90 | |
| Digital Solutions | 16 | | 22 | | 57 | | 66 | |
| Total segment | 249 | | 257 | | 791 | | 815 | |
| Corporate | 5 | | 5 | | 15 | | 17 | |
| Total | $ | 254 | | $ | 262 | | $ | 806 | | $ | 832 | |
OTHER EVENTS
In the third quarter of 2022, we announced a restructuring and reorganization effective October 1, 2022, to create two reportable segments focused on different growth profiles and designed to simplify our operations and enhance profitability while positioning the Company for strategic optionality. These two reportable segments, which will be the same as our operating segments, are detailed below:
Oilfield Services & Equipment (“OFSE”) integrates the current Oilfield Services and Oilfield Equipment segments.
Industrial & Energy Technology (“IET”) integrates the current Turbomachinery & Process Solutions and Digital Solutions segments.
|
| | | | | | |
| Segments | September 30, 2017 | December 31, 2016 |
Oilfield Services (a) | $ | 33,505 |
| $ | 3,266 |
|
| Oilfield Equipment | 8,887 |
| 9,406 |
|
| Turbomachinery & Process Solutions | 9,075 |
| 8,565 |
|
| Digital Solutions | 3,644 |
| 3,113 |
|
| Total segment | 55,111 |
| 24,350 |
|
Corporate and eliminations (b) | (518 | ) | (2,629 | ) |
| Total | $ | 54,593 |
| $ | 21,721 |
|
| |
(a)
| Goodwill acquired as a result of the Baker Hughes acquisition have preliminarily been allocated to Oilfield Services. See "Note 6. Goodwill and Other Intangible Assets" for further details. |
(b)Corporate and eliminations in total segment assets include adjustments of intercompany investments and receivables that are reflected within the total assets of the four reportable segments.NOTE 14. RELATED PARTY TRANSACTIONS
Our most significantRELATED PARTY TRANSACTIONS WITH GE
During the second quarter of 2022, GE's ownership interest in us was reduced to less than 5%. As a result, considering all aspects of our relationship with GE, as of June 30, 2022, we no longer consider GE a related party transactions are transactions thatparty. Below we have entered intoprovide our disclosures for purchases and sales with our members and their affiliates. GE and its affiliates have provided and continue to provide a variety of services to us. through June 30, 2022.
We also enter into certain transactions with BHGE as provided in the BHGE LLC Agreement.
In connection with the Transactions on July 3, 2017, we entered into various agreementshad purchases with GE and its affiliates that govern our relationship with GE followingof $293 million during the Transactions including an Intercompany Services Agreement pursuant to which GEsix months ended June 30, 2022, and its affiliates$232 million and the Company will provide certain services to each other. GE will provide certain administrative services, GE proprietary technology and use of certain GE trademarks in consideration for a payment of $55$567 million per year. Costs of $14 million related to the Intercompany Services Agreement were incurred during the three and nine months ended September 30, 2017. GE may also provide us with certain additional administrative services under the Intercompany Services Agreement, not included as consideration for the $55 million per year payment, and the fees for such services are based on actual usage of such services and historical GE intercompany pricing.2021, respectively. In addition, we will providesold products and services to GE and its affiliates for $83 million during the six months ended June 30, 2022, and $46 million and $131 million during the three and nine months ended September 30, 2021, respectively.
OTHER RELATED PARTIES
We have an aeroderivative joint venture ("Aero JV") we formed with confidential access to certainGE in 2019. The Aero JV is jointly controlled by GE and us, each with ownership interest of our proprietary technology50%, and therefore, we do not consolidate the JV nor does GE. We had purchases with the Aero JV of $106 million and $134 million during the three months ended September 30, 2022 and 2021, respectively, and $360 million and $421 million during the nine months ended September 30, 2022 and 2021, respectively. We have $51 million and $86 million of accounts payable at September 30, 2022 and December 31, 2021, respectively, for goods and services provided by the Aero JV in the ordinary course of business. Sales of products and services and related developments and enhancements thereto related to GE's operations, products or service offerings.
Prior to the Transactions, GE and its affiliates provided a variety of services and funding to us. The cost of these services was either (a) recognized through our allocated portion of GE's corporate overhead; or (b) billed directly to us (such as most of our employee benefit costs).
EMPLOYEE BENEFITS
Certain of our employees are covered under various GE sponsored employee benefit plans, including GE's retirement plans (pension, retiree health and life insurance, and savings benefit plans) and active health and life insurance benefit plans. Further details are provided in "Note 9. Employee Benefit Plans."
RELATED PARTY BALANCES
In connectionreceivables with the Transactions, asAero JV were immaterial for the three and nine months ended September 30, 2022 and 2021.
The Company also has $166 million and $67 million of July 3, 2017, we were required to repay any cash in excess of $100 million, net of any third-party debt in GE O&G, to GE. Due to the restricted nature of the majority of this excess cash, we continue to hold this cash on behalf of GE until such cash is unrestrictedcurrent receivables at September 30, 2022 and available for repayment to GE. The restriction arises as the majority of the cash cannot be released, transferred or otherwise converted into a non-restricted market currency due to the lack of market liquidity, capital controls or similar monetary or exchange limitations by a Government entity of the jurisdiction in which such cash is situated. Accordingly, on July 3, 2017, we executed a promissory note with GE. There is no maturity date on the promissory note, but we remain obligated toDecember 31, 2021, respectively, from Baker Hughes.
Baker Hughes Holdings LLC 2022 Third Quarter Form 10-Q | 21
Baker Hughes a GE company,Holdings LLC
Notes to Unaudited Condensed Consolidated and Combined Financial Statements
repay GE such excess cash together with any income or loss we may incur on it, therefore, this obligation is reflected as short-term borrowings. As of September 30, 2017, $1,267 million of such cash was held on behalf of GE, and a corresponding liability is reported in short-term borrowings both in the condensed consolidated and combined statements of financial position.
RECEIVABLES MONETIZATION
We monetize a portion of our current receivables through programs established for GE and various GE subsidiaries. We account for receivables monetized as true sales in accordance with ASC 860, Transfers and Servicing.
Our current receivables are legally transferred through receivable factoring programs established for GE and various GE subsidiaries administered by Working Capital Solutions (WCS), an operating unit of GE Capital.
We factor U.S. and non‑U.S. receivables to GE Capital on a recourse and nonrecourse basis pursuant to various factoring and services agreements, purchased directly by WCS, GE Capital or sold to external investors through WCS agent arranger or buy/sell structures. Under the factoring programs, GE Capital performs a risk analysis and allocates a nonrecourse credit limit for each customer. If the portfolio exceeds this credit limit, then the receivable is factored with recourse. The evaluation of whether recourse transactions qualify for accounting derecognition is based, in part, upon the legal jurisdiction of the sales, as such, the majority of recourse transactions outside the U.S. qualify for sale treatment. The Company has $147 million and $198 million at September 30, 2017 and December 31, 2016, respectively, of accounts payable to GE that relate to cash collected on current receivables under this monetization program.
In addition, prior to the Transactions, we participated in the GE Accounts Receivable (GEAR) program, in which we transferred our receivables into a securitization structure administered by GE Capital through the GE Receivables and Sale Contribution Agreement.
Transfers of receivables under WCS administered programs are generally accounted for as sales.
|
| | | | | | |
| | September 30, 2017 |
| December 31, 2016 |
|
| Transfers of receivables accounted for as sales | $ | 1,452 |
| $ | 2,168 |
|
Under the programs, we retain the responsibility for servicing the receivables and remitting collections to the owner and the lenders for a fee equal to the prevailing market rate for such services. We have outsourced our servicing responsibilities to GE Capital for a market-based fee and accordingly, no servicing asset or liability has been recorded on the condensed consolidated and combined statements of financial position as of September 30, 2017 and December 31, 2016. Under the programs, we incurred interest expense and finance charges of $17 million and $22 million for the three months ended September 30, 2017 and 2016, respectively, and $57 million and $66 million for the nine months ended September 30, 2017 and 2016, respectively, which is reflected on the condensed consolidated and combined statements of income (loss).
TRADE PAYABLES ACCELERATED PAYMENT PROGRAM
Our North American operations participate in accounts payable programs with GE Capital. We settle invoices with vendors per our payment terms to obtain cash discounts. GE Capital provides funding for the period from the date at which an invoice is eligible for a cash discount through the final termination date for invoice settlement. Our liability associated with the funded participation in the accounts payable programs, which is presented as accounts payable within the condensed consolidated and combined statements of financial position, was $139 million and $104 million as of September 30, 2017 and December 31, 2016, respectively.
Baker Hughes, a GE company, LLC
Notes to Unaudited Condensed Consolidated and Combined Financial Statements
PARENT'S NET INVESTMENT
At December 31, 2016, the remainder of GE's total investment in excess of our debt from GE is reflected as equity under the caption "Parent's net investment" in our condensed consolidated and combined statements of financial position. At September 30, 2017, GE's equity ownership is reflected in noncontrolling interest in our condensed consolidated and combined statements of financial position.
OTHER
The Company has $516 million and $228 million of accounts payable at September 30, 2017 and December 31, 2016, respectively, for services provided by GE in the ordinary course of business.
Prior to the Transactions, GE provided guarantees, letters of credit, and other support arrangements on our behalf. We provide guarantees to GE Capital on behalf of some customers who have entered into financing arrangements with GE Capital.
Prior to the Transactions, a certain number of our employees were granted GE stock options and RSUs under GE's 2007 Long-Term Incentive Plan. Our condensed consolidated and combined financial statements include compensation expense related to these awards for the portion of an employee's vesting period that accrued during employment with us.
INCOME TAXES
At closing, BHGE, GE and BHGE LLC entered into a Tax Matters Agreement. The Tax Matters Agreement governs the administration and allocation between the parties of tax liabilities and benefits arising prior to, as a result of, and subsequent to the Transactions, including certain restructuring transactions in connection therewith, and the respective rights, responsibilities and obligations of GE and BHGE, with respect to various other tax matters. GE will be responsible for certain taxes related to the formation of the transaction undertaken by GE and Baker Hughes and their respective subsidiaries. GE has assumed approximately $35 million of tax obligations of Baker Hughes related to the formation of the transaction.
Following the closing of the Transactions, BHGE or BHGE LLC (or their respective subsidiaries) may be included in group tax returns with GE. To the extent included in such group tax returns, (i) BHGE or BHGE LLC will be required to make tax sharing payments to GE in an amount intended to approximate the amount that such entity would have paid if it had not been included in such group tax returns and had filed separate tax returns, and (ii) GE will be required to pay BHGE or BHGE LLC to the extent such separate tax returns include net operating losses that are used to reduce taxes payable by GE with respect to the applicable group tax return.
The Tax Matters Agreement also provides for the sharing of certain tax benefits (i) arising from the Transactions, including restructuring transactions, and (ii) resulting from allocations of tax items by BHGE LLC. GE is entitled to 100% of these tax benefits to the extent that GE has borne certain taxes related to the formation of the transaction. Thereafter, these tax benefits will be shared by GE and BHGE in accordance with their economic ownership of BHGE LLC, which will initially be approximately 62.5% and approximately 37.5%, respectively. The sharing of tax benefits generally is expected to result in cash payments by BHGE LLC to its members. Any such cash payments may be subject to adjustment based on certain subsequent events, including tax audits or other determinations as to the availability of the tax benefits with respect to which such cash payments were previously made.
NOTE 15. COMMITMENTS AND CONTINGENCIES
LITIGATION
We are subject to a number of lawsuits and claimslegal proceedings arising out ofin the conductordinary course of our business. The abilityBecause legal proceedings are inherently uncertain, we are unable to predict the ultimate outcome of such matters involves judgments, estimates and inherent uncertainties.matters. We record a liability for those contingencies where the incurrence of a loss is probable and the amount can be reasonably
Baker Hughes, a GE company, LLC
Notes to Unaudited Condensed Consolidated and Combined Financial Statements
estimated, including accruals for self-insured losses which are calculated based on historical claim data, specific loss development factors and other information.
A range of total possible losses for all litigation matters cannot be reasonably estimated. Based on a considerationthe opinion of all relevant facts and circumstances,management, we do not expect the ultimate outcome of currently pending lawsuits or claims against us, other than those discussed below, willlegal proceedings to have a material adverse effect on our financial position, results of operations, financial position or cash flows; however,flows. However, there can be no assurance as to the ultimate outcome of these matters.
With respect to the litigation matters below, if there was an adverse outcome individually or collectively, there could be a material impact on our business, financial condition and results of operations expected for the year. These litigation matters are subject to inherent uncertainties and management's view of these matters may change in the future. Therefore, there can be no assurance as to the ultimate outcome of these matters.
During 2014, we received notification from a customer related to a possible equipment failure in a natural gas storage system in Northern Germany, which includes certain of our products. We are currently investigating the cause of the possible failure and, if necessary, possible repair and replacement options for our products. Similar products were utilized in other natural gas storage systems for this and other customers. The customer initiated arbitral proceedings against us on June 19, 2015, under the rules of the German Institute of Arbitration e.V. (DIS). On August 3, 2016, the customer amended its claims and now alleges damages of approximately $224 million plus interest at an annual rate of prime + 5%. Hearings before the arbitration panel were held January 16, 2017 through January 23, 2017, and March 20, 2017 through March 21, 2017. In addition, on September 21, 2015, TRIUVA Kapitalverwaltungsgesellschaft mbH filed a lawsuit in the United States District Court for the Southern District of Texas, Houston Division against the Company and Baker Hughes Oilfield Operations, Inc. alleging that the plaintiff is the owner of gas storage caverns in Etzel, Germany in which the Company provided certain equipment in connection with the development of the gas storage caverns. The plaintiff further alleges that the Company supplied equipment that was either defectively designed or failed to warn of risks that the equipment posed, and that these alleged defects caused damage to the plaintiff's property. The plaintiff seeks recovery of alleged compensatory and punitive damages of an unspecified amount, in addition to reasonable attorneys' fees, court costs and pre-judgment and post-judgment interest. The allegations in this lawsuit are related to the claims made in the June 19, 2015 German arbitration referenced above. At this time, we are not able to predict the outcome of these claims.
On April 30, 2015, a class and collective action lawsuit alleging that we failed to pay a nationwide class of workers overtime in compliance with the Fair Labor Standards Act and North Dakota law was filed titled Williams et al. v. Baker Hughes Oilfield Operations, Inc. in the U.S. District Court for the District of North Dakota. On February 8, 2016, the Court conditionally certified certain subclasses of employees for collective action treatment. The parties have agreed in principle to a settlement of the class claims, subject to Court approval. The amount of the class settlement, if approved by the Court, will not have a material impact in the financial results reported by the Company.
On July 31, 2015, Rapid Completions LLC filed a lawsuit in federal court in the Eastern District of Texas against Baker Hughes Incorporated, Baker Hughes Oilfield Operations, Inc., and others claiming infringement of U.S. Patent Nos. 6,907,936; 7,134,505; 7,543,634; 7,861,774; and 8,657,009. On August 6, 2015, Rapid Completions amended its complaint to allege infringement of U.S. Patent No. 9,074,451. On September 17, 2015, Rapid Completions and Packers Plus Energy Services Inc. sued Baker Hughes Canada Company in the Canada Federal Court on the related Canadian patent 2,412,072. On April 1, 2016, Rapid Completions removed U.S. Patent No. 6,907,936 from its claims in the lawsuit. On April 5, 2016, Rapid Completions filed a second lawsuit in federal court in the Eastern District of Texas against Baker Hughes Incorporated, Baker Hughes Oilfield Operations, Inc. and others claiming infringement of U.S. Patent No. 9,303,501. These patents relate primarily to certain specific downhole completions equipment. The plaintiff has requested a permanent injunction against further alleged infringement, damages in an unspecified amount, supplemental and enhanced damages, and additional relief such as attorney's fees and costs. During August and September 2016, the United States Patent and Trademark Office (USPTO) agreed to institute an inter-partes review of U.S. Patent Nos 7,861,774; 7,134,505; 7,534,634; 6,907,936; 8,657,009; and 9,074,451. On August 29, 2017, the USPTO issued its final written decisions in the inter-partes reviews of U.S. Patent Nos. 8,657,009; and 9,074,451 finding that all claims of those patents were unpatentable.
Baker Hughes, a GE company, LLC
Notes to Unaudited Condensed Consolidated and Combined Financial Statements
On August 31, 2017, the USPTO issued its final written decision in the inter-partes review of U.S. Patent 6,907,936 - the patent dropped from the lawsuit by the plaintiffs - finding that all claims of this patent were patentable. Trial on the validity of asserted claims from Canada patent 2,412,072, was completed March 9, 2017, with no decision from the Court. At this time, we are not able to predict the outcome of these claims.
On May 10, 2017, a putative class action complaint was filed on behalf of purported Baker Hughes stockholders in the U.S. District Court for the Southern District of Texas challenging the Transaction Agreement and Plan of Merger combining Baker Hughes with GE O&G. The complaint is captioned Booth Family Trust v. Baker Hughes Inc., et al., Civil Action No. 4:17-cv-01457 (S.D. Tex. 2017). The complaint asserted, among other things, claims under Sections 14(a) and 20(a) of the Securities Exchange Act of 1934, as amended (the Exchange Act) against Baker Hughes and the members of its board of directors and challenged the adequacy of the disclosures made in the combined proxy statement/prospectus dated as of May 9, 2017. In addition to certain unspecified damages and reimbursement of costs, the plaintiff sought to enjoin the consummation of the Transactions. On June 21, 2017, the parties reached an agreement in principle to settle the Booth Family Trust litigation in exchange for the Company making certain additional disclosures. Those disclosures were contained in an 8-K filed with the SEC on June 22, 2017. On September 14, 2017, the parties filed a Stipulation of Dismissal with the Court dismissing all remaining claims of the Booth Family Trust with prejudice. The parties agreed to an award of attorney’s fees in an amount that will not have a material impact on the financial results reported by the Company.
Following consummation of the Transactions, two purported holders of shares of Baker Hughes common stock, representing a total of 1,875,000 shares of common stock of Baker Hughes, filed petitions in the Court of Chancery of the State of Delaware seeking appraisal for their shares pursuant to Section 262 of the Delaware General Corporation Law. The action is captioned as follows: GKC Strategic Value Master Fund, LP F/K/A GKC Appraisal Rights Master Fund, LP and Walleye Trading LLC v. Baker Hughes Incorporated, Case No. 2017-0769. At this time, we are not able to predict the outcome of this action.
On February 17, 2017, GE Infrastructure Sensing, Inc. (now known as GE Infrastructure Sensing, LLC) (GEIS), a subsidiary of the Company, was served with a lawsuit filed in the Eastern District of New York by a company named Saniteq LLC claiming compensatory damages totalling $500 million plus punitive damages of an unspecified amount. The complaint is captioned Saniteq LLC v. GE Infrastructure Sensing, Inc., No. 17-cv-771 (E.D.N.Y 2017). The complaint generally alleges that GEIS breached a contract being negotiated between the parties and misappropriated unspecified trade secrets. At this time, we are not able to predict the outcome of these claims.
In January 2013, INEOS and Naphtachimie initiated expertise proceedings in Aix-en-Provence, France arising out of a fire at a chemical plant owned by INEOS in Lavera, France, which resulted in a 15-day plant shutdown and destruction of a steam turbine, which was part of a compressor train owned by Naphtachimie. INEOS and Naphtachimie claim approximately €195 million in losses as a resultThe most recent quantification of the incident.alleged damages is €250 million. Two of the Company's subsidiaries (and 17 other companies) were notified to participate in the proceedings. The proceedings are ongoing, and at this time, there is no indication that the Company's subsidiaries were involved in the incident. Although the outcome of the claims remains uncertain, our insurer has accepted coverage and is defending the Company in the expertise proceeding.
On July 31, 2018, International Engineering & Construction S.A. ("IEC") initiated arbitration proceedings in New York administered by the International Center for Dispute Resolution ("ICDR") against the Company and its subsidiaries arising out of a series of sales and service contracts entered between IEC and the Company’s subsidiaries for the sale and installation of LNG plants and related power generation equipment in Nigeria ("Contracts"). Prior to the filing of the IEC Arbitration, the Company’s subsidiaries made demands for payment due under the Contracts. On August 15, 2018, the Company’s subsidiaries initiated a separate demand for ICDR arbitration against IEC for claims of additional costs and amounts due under the Contracts. On October 10, 2018, IEC filed a Petition to Compel Arbitration in the United States District Court for the Southern District of New York against the Company seeking to compel non-signatory Baker Hughes entities to participate in the arbitration filed by IEC. The complaint is captioned International Engineering & Construction S.A. et al. v. Baker Hughes, a GE company, LLC, et al. No. 18-cv-09241 ("S.D.N.Y 2018"); this action was dismissed by the Court on August 13, 2019. In the arbitration, IEC alleges breach of contract and other claims against the Company and its subsidiaries and seeks recovery of alleged compensatory damages, in addition to reasonable attorneys' fees, expenses and arbitration costs. On March 15, 2019, IEC amended its request for arbitration to alleged damages of $591 million of lost profits plus unspecified additional costs based on alleged non-performance of the contracts in dispute. The arbitration hearing was held from December 9, 2019 to December 20, 2019. On March 3, 2020, IEC amended their damages claim to $700 million of alleged loss cash flow or, in the alternative, $244.9 million of lost profits and various costs based on alleged non-performance of the contracts in dispute, and in addition $4.8 million of liquidated damages, $58.6 million in take-or-pay costs of feed gas, and unspecified additional costs of rectification and take-or-pay future obligations, plus unspecified interest and attorneys' fees. On May 3, 2020, the arbitration panel dismissed IEC's request for take-or-pay damages. On May 29, 2020, IEC quantified their claim for legal fees at $14.2 million and reduced their alternative claim from $244.9 million to approximately $235 million. The Company and its subsidiaries have contested IEC’s claims and are pursuing claims for compensation under the contracts. On October 31, 2020, the ICDR notified the arbitration panel’s final award, which dismissed the majority of IEC’s claims and awarded a portion of the Company’s claims. On January 27, 2021, IEC filed a petition to vacate the arbitral award in the Supreme Court of New York, County of New York. On March 5, 2021, the Company filed a petition to confirm the arbitral award, and on March 8, 2021, the Company removed the matter to the United States District Court for the Southern District of New York. On November 16, 2021, the court granted the Company's petition to confirm the award and denied IEC's petition to vacate. During the second quarter of 2022, IEC paid the amounts owed under the arbitration award, which had an immaterial impact on the Company’s financial statements. On February 3, 2022, IEC initiated another arbitration proceeding in New York administered by the ICDR against certain of the Company’s subsidiaries arising out of the same project which formed the basis of the first arbitration. On March 25, 2022, the Company's subsidiaries initiated a separate demand for ICDR arbitration against IEC for claims of additional costs and amounts due. At this time, we are not able to predict the outcome of this proceeding.
On March 15, 2019 and March 18, 2019, the City of Riviera Beach Pension Fund and Richard Schippnick, respectively, filed in the Delaware Court of Chancery shareholder derivative lawsuits for and on Baker Hughes'
Baker Hughes Holdings LLC 2022 Third Quarter Form 10-Q | 22
Baker Hughes Holdings LLC
Notes to Unaudited Condensed Consolidated Financial Statements
behalf against GE, the then-current members of the Board of Directors of Baker Hughes and Baker Hughes as a nominal defendant, related to the decision to (i) terminate the contractual prohibition barring GE from selling any of Baker Hughes' shares before July 3, 2019; (ii) repurchase $1.5 billion in Baker Hughes' stock from GE; (iii) permit GE to sell approximately $2.5 billion in Baker Hughes' stock through a secondary offering; and (iv) enter into a series of other agreements and amendments that will govern the ongoing relationship between Baker Hughes and GE (collectively, the “2018 Transactions”). The complaints in both lawsuits allege, among other things, that GE, as Baker Hughes' controlling stockholder, and the members of Baker Hughes' Board of Directors breached their fiduciary duties by entering into the 2018 Transactions. The relief sought in the complaints includes a request for a declaration that the defendants breached their fiduciary duties, that GE was unjustly enriched, disgorgement of profits, an award of damages sustained by Baker Hughes, pre- and post-judgment interest, and attorneys’ fees and costs. On March 21, 2019, the Chancery Court entered an order consolidating the Schippnick and City of Riviera Beach complaints under consolidated C.A. No. 2019-0201-AGB, styled in re Baker Hughes, a GE company derivative litigation. On May 10, 2019, Plaintiffs voluntarily dismissed their claims against the members of Baker Hughes' Conflicts Committee, and on May 15, 2019, Plaintiffs voluntarily dismissed their claims against former Baker Hughes director Martin Craighead. On June 7, 2019, the defendants and nominal defendant filed a motion to dismiss the lawsuit on the ground that the derivative plaintiffs failed to make a demand on Baker Hughes' Board of Directors to pursue the claims itself, and GE and Baker Hughes' Board of Directors filed a motion to dismiss the lawsuit on the ground that the complaint failed to state a claim on which relief can be granted. The Chancery Court denied the motions on October 8, 2019, except granted GE’s motion to dismiss the unjust enrichment claim against it. On October 31, 2019, Baker Hughes' Board of Directors designated a Special Litigation Committee and empowered it with full authority to investigate and evaluate the allegations and issues raised in the derivative litigation. The Special Litigation Committee filed a motion to stay the derivative litigation during its investigation. On December 3, 2019, the Chancery Court granted the motion and stayed the derivative litigation until June 1, 2020. On May 20, 2020, the Chancery Court granted an extension of the stay to October 1, 2020, and on September 29, 2020, the Court granted a further extension of the stay to October 15, 2020. On October 13, 2020, the Special Litigation Committee filed its report with the Court. At this time, we are not able to predict the outcome of these claims.
On August 13, 2019, Tri-State Joint Fund filed in the Delaware Court of Chancery, a shareholder class action lawsuit for and on the behalf of itself and all similarly situated public stockholders of Baker Hughes Incorporated ("BHI") against the General Electric Company ("GE"), the former members of the Board of Directors of BHI, and certain former BHI Officers alleging breaches of fiduciary duty, aiding and abetting, and other claims in connection with the combination of BHI and the oil and gas business ("GE O&G") of GE ("the Transactions"). On October 28, 2019, City of Providence filed in the Delaware Court of Chancery a shareholder class action lawsuit for and on behalf of itself and all similarly situated public shareholders of BHI against GE, the former members of the Board of Directors of BHI, and certain former BHI Officers alleging substantially the same claims in connection with the Transactions. The relief sought in these complaints include a request for a declaration that Defendants breached their fiduciary duties, an award of damages, pre- and post-judgment interest, and attorneys’ fees and costs. The lawsuits have been consolidated, and plaintiffs filed a consolidated class action complaint on December 17, 2019 against certain former BHI officers alleging breaches of fiduciary duty and against GE for aiding and abetting those breaches. The December 2019 complaint omitted the former members of the Board of Directors of BHI, except for Mr. Craighead who also served as President and CEO of BHI. Mr. Craighead and Ms. Ross, who served as Senior Vice President and Chief Financial Officer of BHI, remain named in the December 2019 complaint along with GE. The relief sought in the consolidated complaint includes a declaration that the former BHI officers breached their fiduciary duties and that GE aided and abetted those breaches, an award of damages, pre- and post-judgment interest, and attorneys’ fees and costs. On or around February 12, 2020, the defendants filed motions to dismiss the lawsuit on the grounds that the complaint failed to state a claim on which relief could be granted. On or around October 27, 2020, the Chancery Court granted GE’s motion to dismiss, and granted in part the motion to dismiss filed by Mr. Craighead and Ms. Ross, thereby dismissing all of the claims against GE and Ms. Ross, and all but one of the claims against Mr. Craighead. At this time, we are not able to predict the outcome of the remaining claim.
On December 11, 2019, BMC Software, Inc. (“BMC”) filed a lawsuit in federal court in the Southern District of Texas against Baker Hughes, a GE company, LLC alleging trademark infringement, unfair competition, and unjust enrichment, arising out of the Company’s use of its new logo and affiliated branding. On January 1, 2020, BMC amended its complaint to add Baker Hughes Company. The relief sought in the complaint includes a request for
Baker Hughes Holdings LLC 2022 Third Quarter Form 10-Q | 23
Baker Hughes Holdings LLC
Notes to Unaudited Condensed Consolidated Financial Statements
injunctive relief, an award of damages (including punitive damages), pre- and post-judgment interest, and attorneys’ fees and costs. At this time, we are not able to predict the outcome of these claims.
In December 2020, Baker Hughes received notice that the SEC is conducting a formal investigation that Baker Hughes understands is related to its books and records and internal controls regarding sales of its products and services in projects impacted by U.S. sanctions. Baker Hughes is cooperating with the SEC and providing requested information. Baker Hughes has also initiated an internal review with the assistance of external legal counsel regarding internal controls and compliance related to U.S. sanctions requirements. While Baker Hughes' review remains ongoing, in September 2021, Baker Hughes voluntarily informed the Office of Foreign Assets Control ("OFAC")thatnon-U.S. Baker Hughes affiliates in two foreign countries appear to have received payments, involving U.S. touchpoints, that are subject to debt restrictions pursuant to applicable U.S. sanctions laws. In February 2022, OFAC informed Baker Hughes that it has issued a cautionary letter and that it will not pursue a civil monetary penalty or further enforcement action. The cautionary letter reflects OFAC’s final enforcement response to Baker Hughes' voluntary self-disclosure. Baker Hughes provided copies of its correspondence with OFAC to the SEC. As the SEC investigation is ongoing, Baker Hughes cannot anticipate the timing, outcome or possible impact of the SEC investigation or review, financial or otherwise.
We insure against risks arising from our business to the extent deemed prudent by our management and to the extent insurance is available, but no assurance can be given that the nature and amount of that insurance will be sufficient to fully indemnify us against liabilities arising out of pending or future legal proceedings or other claims. Most of our insurance policies contain deductibles or self-insured retentions in amounts we deem prudent and for which we are responsible for payment. In determining the amount of self-insurance, it is our policy to self-insure those losses that are predictable, measurable and recurring in nature, such as claims for automobile liability, general liability and workers compensation.
Baker Hughes, a GE company, LLC
Notes to Unaudited Condensed Consolidated and Combined Financial Statements
PRODUCT WARRANTIES
We provide for estimated product warranty expenses when we sell the related products. Because warranty estimates are forecasts that are based on the best available information, primarily historical claims experience, claims costs may differ from amounts provided. An analysis of changes in the liability for product warranties are as follows: |
| | | | | | |
| Balance at December 31, 2016, and 2015, respectively | $ | 74 |
| $ | 100 |
|
| Provisions | 27 |
| 21 |
|
| Expenditures | (33 | ) | (40 | ) |
Other (a) | 97 |
| (1 | ) |
| Balance at September 30, 2017, and 2016, respectively | $ | 165 |
| $ | 80 |
|
| |
(a)
| Includes an increase of $93 million in the nine months ended September 30, 2017 as a result of the Baker Hughes acquisition. |
OTHER
In the normal course of business with customers, vendors and others, we have entered into off-balance sheet arrangements, such as surety bonds for performance, letters of credit and other bank issued guarantees, which totalledguarantees. We also provide a guarantee to GE Capital on behalf of a customer who entered into a financing arrangement with GE Capital. Total off-balance sheet arrangements were approximately $3.6$4.3 billion at September 30, 2017.2022. It is not practicable to estimate the fair value of these financial instruments. NoneAs of September 30, 2022, none of the off-balance sheet arrangements either has, or is likely to have, a material effect on our financial position, results of operations or cash flows.
We sometimes enter into consortium or similar arrangements for certain projects primarily in our Oilfield Equipment segment. Under such arrangements, each party is responsible for performing a certain scope of work within the total scope of the contracted work, and the obligations expire when all contractual obligations are completed. The failure or inability, financially or otherwise, of any of the parties to perform their obligations could impose additional costs and obligations on us. These factors could result in unanticipated costs to complete the project, liquidated damages or contract disputes. NOTE 16. RESTRUCTURING, IMPAIRMENT AND OTHER
RESTRUCTURING CHARGES
In the currentWe recorded restructuring, impairment and prior periods, we approved various restructuring plans globally, mainly to consolidate manufacturing and service facilities, rationalize product lines and rooftops, and reduce headcount across various functions. As a result, we recognized a chargeother charges of $191$230 million and $49$653 million for the three months ended September 30, 2017 and 2016, respectively, and $264 million and $255 million for the nine months ended September 30, 2017 and 2016, respectively. These restructuring initiatives will generate charges post September 30, 2017, and the related estimated remaining charges are approximately $80 million.
These charges are included as part of "Restructuring, impairment and other" in the condensed consolidated and combined statements of income (loss).
The amount of costs not included in the reported segment results is as follows:
|
| | | | | | | | | | | | |
| | Three Months Ended September 30, | Nine Months Ended September 30, |
| | 2017 | 2016 | 2017 | 2016 |
| Oilfield Services | $ | 118 |
| $ | 13 |
| $ | 141 |
| $ | 119 |
|
| Oilfield Equipment | 31 |
| 2 |
| 41 |
| 38 |
|
| Turbomachinery & Process Solutions | 16 |
| 12 |
| 38 |
| 47 |
|
| Digital Solutions | 13 |
| 17 |
| 27 |
| 28 |
|
| Corporate | 13 |
| 5 |
| 17 |
| 23 |
|
| Total | $ | 191 |
| $ | 49 |
| $ | 264 |
| $ | 255 |
|
These costs were primarily related to product line terminations, plant closures and related expenses such as property, plant and equipment impairments, contract terminations and costs of assets' and employees' relocation, employee-related termination benefits, and other incremental costs that were a direct result of the restructuring plans.
Baker Hughes, a GE company, LLC
Notes to Unaudited Condensed Consolidated and Combined Financial Statements
|
| | | | | | | | | | | | |
| Three Months Ended September 30, | Nine Months Ended September 30, |
| 2017 | 2016 | 2017 | 2016 |
Property, plant & equipment, net (a) | $ | 68 |
| $ | 13 |
| $ | 80 |
| $ | 84 |
|
| Employee-related termination expenses | 87 |
| 18 |
| 126 |
| 96 |
|
| Asset relocation costs | 2 |
| 6 |
| 7 |
| 14 |
|
| EHS remediation costs | 1 |
| 2 |
| 8 |
| 19 |
|
| Contract termination fees | 16 |
| 5 |
| 21 |
| 31 |
|
| Other incremental costs | 17 |
| 5 |
| 22 |
| 11 |
|
| Total | $ | 191 |
| $ | 49 |
| $ | 264 |
| $ | 255 |
|
| |
(a)
| Includes $74 million for the nine months ended September 30, 2017 of accelerated depreciation related for certain activities associated with our restructuring plans. |
IMPAIRMENT CHARGES
We conduct impairment tests on long-lived assets whenever events or changes in circumstances indicate that the carrying value may not be recoverable based on estimated future cash flows. Duringduring the three and nine months ended September 30, 20172022, respectively, and 2016, we did not identify any indicators$14 million and $219 million during the three and nine months ended September 30, 2021, respectively.
Baker Hughes Holdings LLC 2022 Third Quarter Form 10-Q | 24
Baker Hughes Holdings LLC
Notes to Unaudited Condensed Consolidated Financial Statements
RESTRUCTURING AND IMPAIRMENT CHARGES
We recorded restructuring and impairment charges of potential impairment$146 million and $174 million for assets still in usethe three and nine months ended September 30, 2022, respectively. The charges relate primarily to employee termination expenses driven by actions taken by the Company to facilitate the reorganization into two segments that would require further examination. Impairmentsis effective October 1, 2022. In addition, property, plant and equipment ("PP&E") impairments and other costs were recorded related to assets removed from serviceexit activities at specific locations in our OFE and OFS segments to align with our current market outlook and rationalize our manufacturing supply chain footprint. See "Note 13. Segment Information" for further information on the change in segments.
We recorded restructuring and impairment charges of $14 million and $144 million for the three and nine months ended September 30, 2021, respectively. These charges were predominately in our OFS segment and related primarily to employee termination expenses, and product line rationalization, including facility closures and related expenses such as PP&E impairments, and includes any gains on the dispositions of certain PP&E impaired as a consequence of previous exit activities.
The following table presents restructuring and impairment charges by the impacted segment, however, these charges are not included in the reported segment results:
| | | | | | | | | | | | | | |
| Three Months Ended September 30, | Nine Months Ended September 30, |
| Segments | 2022 | 2021 | 2022 | 2021 |
| Oilfield Services | $ | 40 | | $ | 14 | | $ | 61 | | $ | 119 | |
| Oilfield Equipment | 62 | | 3 | | 58 | | 4 | |
| Turbomachinery & Process Solutions | 6 | | (3) | | 8 | | 11 | |
| Digital Solutions | 19 | | — | | 20 | | 3 | |
| Corporate | 19 | | — | | 27 | | 7 | |
| Total | $ | 146 | | $ | 14 | | $ | 174 | | $ | 144 | |
The following table presents restructuring and impairment charges above.by type:
| | | | | | | | | | | | | | |
| Three Months Ended September 30, | Nine Months Ended September 30, |
| Charges by Type | 2022 | 2021 | 2022 | 2021 |
| Property, plant & equipment, net | $ | 65 | | $ | (1) | | $ | 59 | | $ | 21 | |
| Employee-related termination costs | 77 | | 1 | | 106 | | 94 | |
| | | | |
| | | | |
| Other incremental costs | 4 | | 14 | | 9 | | 29 | |
| Total | $ | 146 | | $ | 14 | | $ | 174 | | $ | 144 | |
OTHER CHARGES
We recorded other charges of $84 million and $478 million for the three and nine months ended September 30, 2022, respectively.
Other charges included in "Restructuring, impairment and other" caption of the condensed consolidated and combined statements of income (loss) was nil and $28 million infor the three months ended September 30, 2017 and 2016, respectively, and $282022, were related to the impairment of certain long-lived assets, primarily PP&E of $62 million and $197intangibles of $17 million, in our OFE segment for the subsea production systems ("SPS") business due to a decrease in the estimated future cash flows driven by a decline in our long-term market outlook for this business.
Other charges for the nine months ended September 30, 20172022, were primarily associated with our Russia operations that were recorded in the second quarter of 2022. As a result of the ongoing conflict between Russia and 2016, respectively. Other charges include currency devaluationUkraine that began in February of 2022, governments in the U.S., United Kingdom, European Union, and other
Baker Hughes Holdings LLC 2022 Third Quarter Form 10-Q | 25
Baker Hughes Holdings LLC
Notes to Unaudited Condensed Consolidated Financial Statements
countries enacted sanctions against Russia and certain Russian interests. On March 19, 2022, we suspended any new investments in our Russia operations but attempted to continue to fulfill our contractual obligations while complying with all applicable laws and regulations. Over the course of the second quarter of 2022, we closely monitored the developments in Ukraine and Russia and changes to sanctions all of which continued to make ongoing operations increasingly complex and significantly more challenging. As a result, in the second quarter of 2022, we committed to a plan to sell our Oilfield Services Russia business. See “Note 17. Businesses Held for Sale” for further information. In addition, given that some of our activities are prohibited under applicable sanctions and almost all of our activities are unsustainable in the current environment, we took actions to suspend substantially all of our operational activities related to Russia. These actions resulted in other charges of nil$334 million recorded in the second quarter of 2022 primarily associated with the suspension of contracts including all our TPS LNG contracts, and $25the impairment of assets consisting primarily of contract assets, PP&E and reserve for accounts receivable. In addition to these charges, we recorded inventory impairments in the second quarter of 2022 of $31 million primarily in TPS as part of suspending our Russia operations, which are reported in the “Cost of goods sold” caption in the condensed consolidated statement of income (loss).
During the three months ended September 30, 2017 and 2016, respectively, and $12 million and $124 million for2021, there were no other charges incurred.During the nine months ended September 30, 20172021, we incurred other charges of $75 million primarily related to certain litigation matters in our TPS segment and 2016, respectively, largely driventhe release of foreign currency translation adjustments for certain restructured product lines in our DS segment.
NOTE 17. BUSINESSES HELD FOR SALE
The Company classifies assets and liabilities as held for sale (“disposal group”) when management commits to a plan to sell the disposal group and concludes that it meets the relevant criteria. Assets held for sale are measured at the lower of their carrying value or fair value less costs to sell. Any loss resulting from the measurement is recognized in the period the held for sale criteria are met. Conversely, gains are not recognized until the date of sale.
During the second quarter of 2022, the OFS Russia business met the criteria to be classified as held for sale and was measured and reported at the lower of its carrying value or fair value less costs to sell, which resulted in the recognition of a loss of $426 million, which included foreign currency translation adjustment gains partially offset by significant currency devaluationscosts associated with selling the business. The loss was recorded in Angola“Other non-operating loss, net” in our condensed consolidated statements of income (loss). On August 1, 2022, we entered into an agreement to sell our OFS Russia business to our local management. As of September 30, 2022, the OFS Russia business continues to meet the criteria to be classified as held for sale. We expect to complete the sale by the end of 2022 subject to regulatory approval.
In July 2022, we entered into an agreement with GE to sell our Nexus Controls business, a product line in our Digital Solutions segment, specializing in scalable industrial controls systems, safety systems, hardware, and Nigeria. These markets have minimal currency derivative liquidity which limitssoftware cybersecurity solutions and services.Based on preliminary estimates, the carrying value is expected to approximate the fair value of the business, less costs to sell. We expect to complete the sale in mid-2023 subject to customary conditions, including regulatory approvals.
Baker Hughes Holdings LLC 2022 Third Quarter Form 10-Q | 26
Baker Hughes Holdings LLC
Notes to Unaudited Condensed Consolidated Financial Statements
The following table presents financial information related to the assets and liabilities of the businesses classified as held for sale and reported in “All other current assets” and “All other current liabilities” in our ability to offset these exposures.condensed consolidated statement of financial position as of September 30, 2022.
| | | | | | | | | | | |
| Assets and liabilities of business held for sale | OFS Russia | DS Nexus Controls | Total |
| Assets | | | |
| Current receivables | $ | 57 | | $ | 49 | | $ | 106 | |
| | | |
| Inventories | 76 | | 36 | | 112 | |
| Property, plant and equipment | 161 | | 3 | | 164 | |
| Goodwill | 161 | | 231 | | 392 | |
| Other assets | 18 | | 8 | | 26 | |
| Loss on net assets of business held for sale | (426) | | — | | (426) | |
| Total assets of business held for sale | 47 | | 327 | | 374 | |
| | | |
| Liabilities | | | |
| | | |
| Accounts payable | 42 | | 33 | | 75 | |
| All other current liabilities | 4 | | 56 | | 60 | |
| Other liabilities | 1 | | 8 | | 9 | |
| Total liabilities of business held for sale | 47 | | 97 | | 144 | |
| Total net assets of business held for sale | $ | — | | $ | 230 | | $ | 230 | |
Baker Hughes Holdings LLC 2022 Third Quarter Form 10-Q | 27
ITEM 2. MANAGEMENT'S DISCUSSION AND ANALYSIS OF FINANCIAL CONDITION AND RESULTS OF OPERATIONS
Management's Discussion and Analysis of Financial Condition and Results of Operations (MD&A)("MD&A") should be read in conjunction with the condensed consolidated and combined financial statements and the related notes included in Item 1 thereto.
EXECUTIVE SUMMARY
On July 3, 2017, we closedWe are an energy technology company with a broad and diversified portfolio of technologies and services that span the Transactions to combine GE O&Genergy and Baker Hughes, creating a fullstream oilfield technology provider that has a unique mix of integrated oilfield products, servicesindustrial value chain. We conduct business in more than 120 countries and digital solutions. As a result of the Transactions, BHGE became the holding company of the combined businesses. The Transactions were executed using a partnership structure, pursuant to which GE O&G and Baker Hughes each contributed their operating assets to the Company. GE holds an approximate 62.5% controlling interest in us and former Baker Hughes shareholders hold an approximate 37.5% interest through the ownership of 100% of the Class A Common Stock of BHGE. GE's interest is held through a voting interest of Class B Common Stock in BHGE and its economic interest through a corresponding number of our Common Units. The results of operations for the Company include the results of Baker Hughes from July 3, 2017, the date of acquisition, through the end of the quarter endedemploy approximately 55,000 employees. Through September 30, 2017. We operate2022, we operated through our four business segments: Oilfield Services (OFS)("OFS"), Oilfield Equipment (OFE)("OFE"), Turbomachinery & ProcessingProcess Solutions (TPS)("TPS"), and Digital Solutions (DS)("DS"). BHGE employs approximately 65,000 employeesWe sell products and operatesservices primarily in more than 120the global oil and gas markets, within the upstream, midstream and downstream segments.
As we look to the fourth quarter of 2022 and into 2023, the macro outlook has grown increasingly uncertain. The global economy is dealing with strong inflationary pressures, a rising interest rate environment, and fluctuations in global currencies. Despite these economic challenges, we remain constructive on the outlook for oil and gas and believe that underlying fundamentals remain supportive of a multi-year upturn in global upstream spending. In the oil market, we expect continued price volatility as demand growth likely softens under the weight of higher interest rates and inflationary pressures. However, we expect supply constraints and production discipline to largely offset any demand weakness.
In the natural gas and LNG markets, prices remain elevated, as a multitude of factors increase tensions on an already stressed global gas market. Europe’s surging demand for LNG has redirected cargos from other regions and created a tight global market that could get even tighter in 2023. This situation has resulted in record high LNG prices but has also slowed down switching from coal-to-gas in some developing countries.
We believe that significant investment is still required over the next five to ten years to ensure natural gas’ position as a key part of the energy transition. However, while the current price environment is attractive for new projects, this is also a pivotal time for the industry, with price-related demand destruction occurring in some markets and LNG developers facing inflationary pressures and a higher cost of capital for new projects.
Given the dynamic macro backdrop, we are focused on preparing for a range of scenarios and executing on what is within our control. During the third quarter of 2022, we announced a restructuring and re-segmentation of the Company into two reporting segments, OFSE and IET, effective October 1, 2022. This re-segmentation is designed to simplify and streamline our organizational structure, and create better flexibility and economies of scale across the two business segments. For OFSE, one area of focus will be right sizing OFE through facility rationalization, removing management layers, and integrating multiple functions and capabilities with OFS. For IET, we expect commercial and technological benefits from closer integration as well as the benefit of cost out programs. We expect these changes to improve the long-term optionality and growth opportunities for Baker Hughes as our markets and customers continue to evolve.
In parallel, we continue to invest in the Baker Hughes portfolio through early-stage new energy investments and strategic acquisitions. In the third quarter of 2022, we announced several strategic acquisitions that will complement our current portfolio and enhance our strategic position. On October 7, 2022, the Company closed on an agreement to acquire the Power Generation division of BRUSH Group (“BRUSH”). BRUSH is an established equipment manufacturer that specializes in electric power generation and management for the industrial and energy sectors, which will compliment TPS’ existing portfolio. Other transactions announced include the acquisitions of Quest Integrity and AccessESP, which will enhance our inspection capabilities and broadens our electrical submersible pump ("ESP") technology portfolio.
In the third quarter of 2017,2022, we generated revenue of $5,375$5,369 million compared to $3,024$5,093 million forin the third quarter of 2016.2021. The increase in revenue was driven primarily by OFS as a result ofincreased activity in the acquisition of Baker Hughes, and to a lesser extent, by TPSOFS and DS segments, partially offset by declineslower volume in OFE. Lossthe TPS and OFE segments. Operating income in the third quarter of 2022 was $269 million compared to $378 million in the third quarter of 2021. The decrease in operating income was driven by higher restructuring, impairment and other charges, partially offset by higher segment operating income in OFS.
Baker Hughes Holdings LLC 2022 Third Quarter Form 10-Q | 28
Income before income taxes and equity in loss of affiliate was $167$144 million for the third quarter of 2017, and2022, which included restructuring, impairment and impairmentother charges of $191$230 million, and merger and related costsa loss of $159 million. These restructuring and impairment charges were$52 million from the change in fair value on certain equity securities, recorded as a result of our continued actions to adjust our operations and cost structure to reflect reduced activity levels. Forother non-operating loss. In the third quarter of 2016,2021, income before income taxes and equity in loss of affiliate was $161$209 million, which included restructuring, impairment and other charges of $14 million, and also included restructuringa $140 million loss from the change in fair value on certain equity securities, recorded as other non-operating loss.
The invasion of Ukraine by Russia and impairment chargesthe sanctions imposed in response to this crisis have increased the level of $77 million,economic and mergerpolitical uncertainty. As we announced on March 19, 2022, we suspended any new investments for our Russia operations. Over the course of the second quarter of 2022, changes to sanctions continued to make ongoing operations increasingly complex and significantly more challenging. As a result, we committed to a plan to sell our OFS Russia business, and we took actions to suspend substantially all of our operational activities related coststo Russia across the Company including suspending work on equipment and service contracts in Russia. During the third quarter of $2 million.2022, we announced we entered into an agreement to sell our OFS Russia business to local management. Russia represented approximately 1% and 2% of our total revenue for the three and nine months ended September 30, 2022, respectively.
Outlook
Our business is exposed to a number of different macro factors, which influence our outlook and expectations and outlook.given the current volatile conditions in the industry. All of our outlook expectations are purely based on the market as we see it today, and are subject to change given volatilechanging conditions in the industry.
•North America onshore activity: we expect the increased activity in North America onshore activity to continue to grow, however at a slower pace than seen in the first nine months of 2017. In the third quarter, we experienced a deceleration in rig count growth, as compared to the prior two quarters. We remain optimistic about the outlook, but expect the pace of growth to slow in the near term.
International onshore activity: we have seen a moderate increase in rig count activity and expect growth to continue, the pace at which is undetermined. We have seen signs of improvement, but due to continuous volatility, remain cautious as to growth expectations.
Offshore projects: due to the ongoing oil price volatility, we expect final investment decisions to continue to remain fluid. We have seen an increase in subsea tree awards in 2017, but do not expect a material amount of awardslevel off in the fourth quarter of 2017, and2022 as compared to the third quarter of 2022. Looking ahead to 2023, we expect growth in North America onshore activity should commodity prices remain at current levels.
•International onshore activity: we expect international activity to continue to expect delaysimprove in major customer capital expenditures for the near term.fourth quarter of 2022 across a broad range of markets compared to the third quarter of 2022 with further growth in 2023 should commodity prices remain at current levels.
Liquefied Natural Gas•Offshore projects: we believeexpect a recovery in offshore activity and the number of subsea tree awards to grow in 2022 as compared to 2021. Looking ahead to 2023, we expect continued recovery offshore as activity in several basins is set to further strengthen.
•LNG projects: we remain optimistic on the LNG market continueslong-term and view natural gas as a transition and destination fuel. We continue to be oversupplied, and will remain in its current state for the next few years. We expect some final investment decisions to move forward in the short term. We do, however, view the long termlong-term economics of the LNG industry as positive given our outlook for supply and demand.positive.
We have other segmentsbusinesses in our portfolio that are more correlated with differentvarious industrial metrics, including global GDP growth, such as our Digital Solutions business. segment.
We also have businesses within our portfolio that are exposed to new energy solutions, specifically focused around reducing carbon emissions of energy and broader industry, including hydrogen, geothermal, carbon capture, utilization and storage, and energy storage. We expect to see continued growth in these businesses as new energy solutions become a more prevalent part of the broader energy mix.
Overall, we believe our portfolio is uniquelywell positioned to compete across the energy value chain and deliver uniquecomprehensive solutions for our customers. We remain optimistic about the long termlong-term economics of the oil and gas industry, but we are continuing to operate with flexibility givenflexibility. Over time, we believe the world’s demand for energy will continue to rise, and that hydrocarbons will play a major role in meeting the world's energy needs for the foreseeable future. As such, we remain focused on delivering innovative, low-emission, and cost-effective solutions that deliver step changes in operating and economic performance for our expectations for volatilitycustomers.
CORPORATE RESPONSIBILITY
We believe we have an important role to play in society as an industry leader and changing assumptionspartner. We view environmental, social, and governance as a key lever to transform the performance of our Company and our industry. In January 2019, we made a commitment to reduce Scope 1 and 2 carbon emissions from our operations by 50% by 2030, achieving net zero emissions by 2050. We continue to make progress on emissions reductions, and reported in the near term.our 2021 Corporate Responsibility report a 23% reduction in our Scope 1 and 2 carbon emissions compared to our 2019 base year.
Baker Hughes Holdings LLC 2022 Third Quarter Form 10-Q | 29
BUSINESS ENVIRONMENT
The following discussion and analysis summarizes the significant factors affecting theour results of operations, financial condition and liquidity position of BHGE LLC as of and for the three months ended September 30, 2017 and 2016 and for the nine months ended September 30, 20172022 and 2016,2021, and should be read in conjunction with the condensed consolidated and combined financial statements and related notes of the Company.
We operate in more than 120 countries helping customers find, evaluate, drill, produce, transport and process hydrocarbon resources. Our revenue is predominately generated from the sale of products and services to major, national, and independent oil and natural gas companies worldwide, and is dependent on spending by our customers for oil and natural gas exploration, field development and production. This spending is driven by a number of factors, including our customers' forecasts of future energy demand and supply, their access to resources to develop and produce oil and natural gas, their ability to fund their capital programs, the impact of new government regulations and most importantly, their expectations for oil and natural gas prices as a key driver of their cash flows.
Oil and Natural Gas Prices
Oil and natural gas prices are summarized in the table below as averages of the daily closing prices during each of the periods indicated. | | | | | | | | | | | | | | |
| Three Months Ended September 30, | Nine Months Ended September 30, |
| 2022 | 2021 | 2022 | 2021 |
Brent oil price ($/Bbl) (1) | $ | 100.71 | | $ | 73.51 | | $ | 105.00 | | $ | 67.89 | |
WTI oil price ($/Bbl) (2) | 93.06 | | 70.58 | | 98.96 | | 65.05 | |
Natural gas price ($/mmBtu) (3) | 8.03 | | 4.35 | | 6.74 | | 3.61 | |
(1)Energy Information Administration (EIA) Europe Brent Spot Price per Barrel |
| | | | | | | | | | | | |
| Three Months Ended September 30, | Nine Months Ended September 30, |
| 2017 | 2016 | 2017 | 2016 |
Brent oil price ($/Bbl) (a) | $ | 52.11 |
| $ | 45.79 |
| $ | 51.82 |
| $ | 41.67 |
|
WTI oil price ($/Bbl) (b) | 48.16 |
| 44.85 |
| 49.39 |
| 41.14 |
|
Natural gas price ($/mmBtu) (c) | 2.95 |
| 2.88 |
| 3.01 |
| 2.34 |
|
| |
(a)(3)EIA Henry Hub Natural Gas Spot Price per million British Thermal Unit Oil and natural gas prices increased during the three and nine months ended September 30, 2022 largely driven by supply constraints which has also been amplified as a result of recent geopolitical events. Outside North America, customer spending is most heavily influenced by Brent oil prices, which increased from the same quarter last year, ranging from a high of $121.80/Bbl in July 2022 to a low of $82.55/Bbl in September 2022. For the nine months ended September 30, 2022, Brent oil prices averaged $105.00/Bbl, which represented an increase of $37.11/Bbl from the same period last year. | Energy Information Administration (EIA) Europe Brent Spot Price per Barrel |
| |
(b)
| EIA Cushing, OK WTI spot price |
| |
(c)
| EIA Henry Hub Natural Gas Spot Price per million British Thermal Unit |
In North America, customer spending is highly driven by West Texas Intermediate (WTI)WTI oil prices, which were upincreased from $44.85the same quarter last year. Overall, WTI oil prices ranged from a high of $110.30/Bbl in the third quarterJuly 2022 to a low of 2016 to $48.16$77.17/Bbl in the third quarter of 2017. This represented an increase of 7%.September 2022. For the nine months ended September 30, 20172022, WTI oil prices averaged $49.39,$98.96/Bbl, which represented an increase of $8.25$33.91/Bbl from the same period last year.
Outside ofIn North America, customer spending is drivennatural gas prices, as measured by Brent oil prices, which also grew year-over-year. Brent oil prices were $45.79the Henry Hub Natural Gas Spot Price, averaged $8.03/mmBtu in the third quarter of 2016 as compared to $52.11 in the third quarter of 2017. This represented an2022, representing a 85% increase of 14%. For the nine months ended September 30, 2017 Brent oil prices averaged $51.82, which represented an increase of $10.15 from the same period lastquarter in the prior year.
Although both WTI and Brent oil prices increased, there were fluctuations within Throughout the quarter, which drove uncertainty in the oil price outlook for customers. In the three months ended September 30, 2017, Brent oil prices reached a maximum of $59.77 and a minimum of $43.98, and WTI reached a maximum of $52.14 and a minimum of $42.48.
Natural gas prices in North America are measured using the Henry Hub Natural Gas Prices. Natural gas prices increasedSpot Prices ranged from $2.88a low of $5.65/mmBtu in the third quarterJuly 2022 to a high of 2016 to $2.95$9.85/mmBtu in the third quarter of 2017. This represented an increase of $0.07. For the nine months ended September 30, 2017, natural gas prices averaged $3.01, which represented an increase of $0.67 from the same period last year.August 2022.
Baker Hughes Rig Count
The Baker Hughes rig counts are an important business barometer for the drilling industry and its suppliers. When drilling rigs are active they consume products and services produced by the oil service industry. Rig count trends are driven by the exploration and development spending by oil and natural gas companies, which in turn is influenced by current and future price expectations for oil and natural gas. The counts may reflect the relative strength and stability of energy prices and overall market activity; however, these counts should not be solely relied on as other specific and pervasive conditions may exist that affect overall energy prices and market activity.
Baker Hughes Holdings LLC 2022 Third Quarter Form 10-Q | 30
We have been providing rig counts to the public since 1944. We gather all relevant data through our field service personnel, who obtain the necessary data from routine visits to the various rigs, customers, contractors and other outside sources as necessary. We base the classification of a well as either oil or natural gas primarily upon filings made by operators in the relevant jurisdiction. This data is then compiled and distributed to various wire services and trade associations and is published on our website. We believe the counting process and resulting data is reliable; however, it is subject to our ability to obtain accurate and timely information. Rig counts are compiled weekly for the U.S. and Canada and monthly for all international rigs. Published international rig counts do not include rigs drilling in certain locations, such as the Russia the Caspian region, Iran and onshore China because this information is not readily available.
Rigs in the U.S. and Canada are counted as active if, on the day the count is taken, the well being drilled has been started but drilling has not been completed and the well is anticipated to be of sufficient depth to be a potential consumer of our drill bits. In international areas, rigs are counted on a weekly basis and deemed active if drilling activities occurred during the majority of the week. The weekly results are then averaged for the month and published accordingly. The rig count does not include rigs that are in transit from one location to another, rigging up, being used in non-drilling activities including production testing, completion and workover, and are not expected to be significant consumers of drill bits.
The rig counts are summarized in the table below as averages for each of the periods indicated. | | | | Three Months Ended September 30, | | Nine Months Ended September 30, | | | Three Months Ended September 30, | | Nine Months Ended September 30, | |
| | 2017 | 2016 | % Change | 2017 | 2016 | % Change | | 2022 | 2021 | % Change | 2022 | 2021 | % Change |
| North America | 1,154 |
| 600 |
| 92 | % | 1,068 |
| 600 |
| 78 | % | North America | 960 | | 647 | | 48 | % | 876 | | 570 | | 54 | % |
| International | 947 |
| 936 |
| 1 | % | 948 |
| 966 |
| (2 | %) | International | 857 | | 770 | | 11 | % | 832 | | 735 | | 13 | % |
| Worldwide | 2,101 |
| 1,536 |
| 37 | % | 2,016 |
| 1,566 |
| 29 | % | Worldwide | 1,817 | | 1,417 | | 28 | % | 1,708 | | 1,305 | | 31 | % |
Rig count in North America increased 92% in the third quarter of 2017, compared to the same period last year. InternationalThe worldwide rig count increased 1%was 1,817 for the third quarter of 2017, as compared to the same period last year. In addition, North America rig count increased 78% in the nine months ended September 30, 2017, as compared to the same period last year. International rig count decreased 2% in the nine months ended September 30, 2017, as compared to the same period last year.
Overall rig count was 2,101 for the third quarter of 2017,2022, an increase of 37%28% as compared to the same period last year primarily due primarily to an increase in North American activity, and a slower increase internationally.America. Within North America, the increase was primarily driven by landthe U.S. rig count, which was up 101%53% when compared to the same period last year, and to a lesser extent, offshorean increase in the Canada rig count, which was up 5%.32% when compared to the same period last year. Internationally, the rig count increase was driven primarily by increasesan increase in Africa which was up 5%, the Latin America and Middle East regions of 25% and Asia-Pacific region, which were both up 2%17%, partially offset by the Europe region, which was down 6%.
Key Performances Indicators (millions)
Product services and backlog of product servicesrespectively.
The Company's condensed consolidated and combined statement of income (loss) displays sales and costs of sales in accordance with SEC regulations under which "goods" is required to include all sales of tangible products and "services" must include all other sales, including other service activities. For the amounts shown below, as well as in the orders and backlog charts included in this Management's Discussion and Analysis section, the Company distinguishes between "equipment" and "product services," where product services refer to sales under product services agreements, including sales of both goods (such as spare parts and equipment upgrades) and related services (such as monitoring, maintenance and repairs), which is an important part of its operations. We refer to "product services" simply as "services" within the Business Environment section of Management's Discussion and Analysis.
Backlog is defined as unfilled customer ordersworldwide rig count was 1,708 for products and services believed to be firm. For product services, an amount is included for the expected life of the contract.
Orders for the Three and Nine Months Ended, and Backlog as of September 30, 2017 and 2016 (millions)
Orders: For the three months ended September 30, 2017, we recognized orders of $5,722 million, an increase of $3,242 million, or 131%, from the three months ended September 30, 2016. The increase in orders was driven by the acquisition of Baker Hughes. Service orders were up 105% and equipment orders were up 183%.
For the nine months ended September 30, 2017, we recognized orders of $11,619 million,2022, an increase of $3,807 million, or 49%, from31% as compared to the nine months ended September 30, 2016. Thesame period last year primarily due to an increase in orders was mainly driven byNorth America. Within North America, the acquisition of Baker Hughes. Service orders were up 31% and equipment orders were up 90%, also mainly driven by the acquisition of Baker Hughes.
Backlog: As at September 30, 2017, backlog was $20,906 million, an increase of $293 million, or 1%, from June 30, 2017. Equipment backlog increased from June 30, 2017 primarily driven by a large order signed within the quarter. Service backlog increased from June 30, 2017 as a result of order intake. Backlog decreased $1,741 million, or 8%, from September 30, 2016. The decrease was primarily driven by equipment backlog,the U.S. rig count, which decreased $1,436 million, or 20% duewas up 58% when compared to lower order intake versus the same period last year, and an increase in the Canada rig count, which was up 40% when compared to the same period last year. Internationally, the rig count increase was driven primarily by an increase in the Africa and Latin America regions of 25% and 24%, respectively.
RESULTS OF OPERATIONS
The discussions below relating to significant line items from our unaudited condensed consolidated and combined statements of income (loss) are based on available information and represent our analysis of significant changes or events that impact the comparability of reported amounts. Where appropriate, we have identified specific events and changes that affect comparability or trends and, where reasonably practicable, have quantified the impact of such items. In addition, the discussions below for revenue and cost of revenue are on a total basis as the business drivers for product sales and services are similar. All dollar amounts in tabulations in this section are in millions of dollars, unless otherwise stated. Certain columns and rows may not add due to the use of rounded numbers.
The resultsOur condensed consolidated statement of operations forincome (loss) displays sales and costs of sales in accordance with SEC regulations under which "goods" is required to include all sales of tangible products and "services" must include all other sales, including other service activities. For the Company includeamounts shown below, we distinguish between "equipment" and "product services", where product services refer to sales under product services agreements, including sales of both goods (such as spare parts and equipment upgrades) and related services (such as monitoring, maintenance and repairs), which is an important part of our operations. We refer to "product services" simply as "services" within the resultsBusiness Environment section of Management's Discussion and Analysis.
Baker Hughes from July 3, 2017, the date of acquisition, through the end of the quarter ended September 30, 2017.Holdings LLC 2022 Third Quarter Form 10-Q | 31
The results of operations of the Company are evaluated by the Chief Executive Officer of the Company on a combined and consolidated basis as well as at the segment level.
The performance of our operating segments is evaluated based on segment operating income (loss), which is defined as income (loss) before income taxes and equity in loss of affiliate and before the following: net interest expense, net other non operating income (loss),non-operating loss, corporate expenses, restructuring, impairment and other charges, goodwill and inventory impairment, merger and relatedimpairments, separation-related costs, and certain gains and losses not allocated to the operating segments.
In evaluating the segment performance, the Company primarily uses the following:
Volume & Price:Volume: Volume is the increase or decrease in products and/or services sold period-over-period excluding the impact of foreign exchange and price. The volume impact on profit is calculated by multiplying the prior period profit rate by the change in revenue volume between the current and prior period. Price isIt also includes price, defined as the change in sales price for a comparable product or service period-over-period and is calculated as the period-over-period change in sales prices of comparable products and services.
Foreign Exchange (FX)("FX"):FX measures the translational foreign exchange impact, or the translation impact of the period-over-period change on sales and costs directly attributable to change in the foreign exchange rate compared to the USU.S. dollar. FX impact is calculated by multiplying the functional currency amounts (revenue or profit) with the period-over-period FX rate variance, using the average exchange rate for the respective period.
(Inflation)/Deflation: (Inflation)/deflation is defined as the increase or decrease in direct and indirect costs of the same type for an equal amount of volume. It is calculated as the year-over-year change in cost (i.e. price paid) of direct material, compensation &and benefits and overhead costs.
Productivity: Productivity is measured by the remaining variance in profit, after adjusting for the period-over-period impact of volume &and price, foreign exchange and (inflation)/deflation as defined above. Improved or lower period-over-period cost productivity is the result of cost efficiencies or inefficiencies, such as cost decreasing or increasing more than volume, or cost increasing or decreasing less than volume, or changes in sales mix among segments. This also includes the period-over-period variance of transactional foreign exchange, aside from those foreign currency devaluations that are reported separately for business evaluation purposes.
Orders and Remaining Performance Obligations
Orders: For the nine months ended September 30, 2022, we recognized orders of $18.8 billion, an increase of $3.7 billion, or 25%, from the nine months ended September 30, 2021. For the three months ended September 30, 2022, we recognized orders of $6.1 billion, an increase of $0.7 billion, or 13%, from the three months ended September 30, 2021. Equipment orders were up $0.5 billion, or 20%, and service orders were up $0.2 billion, or 7%. The increase in orders was driven by higher order intake in all segments.
Remaining Performance Obligations ("RPO"): As of September 30, 2022, the aggregate amount of the transaction price allocated to the unsatisfied (or partially unsatisfied) performance obligations was $24.7 billion.
Revenue and Segment Operating Income (Loss) Before Tax
Revenue and segment operating income (loss) for each of our four operating segments is provided below.
| | | | | | | | | | | | | | | | | | | | |
| Three Months Ended September 30, | $ Change | Nine Months Ended September 30, | $ Change |
| 2022 | 2021 | 2022 | 2021 |
| Segment revenue: | | | | | | |
| Oilfield Services | $ | 2,842 | | $ | 2,419 | | $ | 423 | | $ | 8,019 | | $ | 6,976 | | $ | 1,043 | |
| Oilfield Equipment | 561 | | 603 | | (42) | | 1,630 | | 1,867 | | (237) | |
| Turbomachinery & Process Solutions | 1,438 | | 1,562 | | (124) | | 4,076 | | 4,675 | | (599) | |
| Digital Solutions | 528 | | 510 | | 19 | | 1,526 | | 1,499 | | 27 | |
| Total | $ | 5,369 | | $ | 5,093 | | $ | 276 | | $ | 15,251 | | $ | 15,017 | | $ | 234 | |
Baker Hughes Holdings LLC 2022 Third Quarter Form 10-Q | 32
| | | | | | | | | | | | | | | | Three Months Ended September 30, | $ Change | Nine Months Ended September 30, | $ Change |
| | Three Months Ended September 30, | $ Change | Nine Months Ended September 30, | $ Change | | 2022 | 2021 | 2022 | 2021 |
| | 2017 | 2016 | 2017 | 2016 | |
| Revenue: | | |
| Segment operating income (loss): | | Segment operating income (loss): | |
| Oilfield Services | $ | 2,635 |
| $ | 192 |
| $ | 2,443 |
| $ | 3,077 |
| $ | 599 |
| $ | 2,478 |
| Oilfield Services | $ | 330 | | $ | 190 | | $ | 140 | | $ | 812 | | $ | 505 | | $ | 307 | |
| Oilfield Equipment | 600 |
| 829 |
| (229 | ) | 1,965 |
| 2,693 |
| (728 | ) | Oilfield Equipment | (6) | | 14 | | (20) | | (26) | | 45 | | (71) | |
| Turbomachinery & Process Solutions | 1,511 |
| 1,480 |
| 31 |
| 4,841 |
| 4,950 |
| (109 | ) | Turbomachinery & Process Solutions | 262 | | 278 | | (16) | | 705 | | 705 | | — | |
| Digital Solutions | 629 |
| 523 |
| 106 |
| 1,613 |
| 1,511 |
| 102 |
| Digital Solutions | 20 | | 26 | | (6) | | 53 | | 75 | | (22) | |
| Total | $ | 5,375 |
| $ | 3,024 |
| $ | 2,351 |
| $ | 11,496 |
| $ | 9,753 |
| $ | 1,743 |
| |
| Total segment operating income | | Total segment operating income | 606 | | 508 | | 98 | | 1,544 | | 1,330 | | 214 | |
| Corporate | | Corporate | (103) | | (105) | | 2 | | (316) | | (324) | | 8 | |
| | Inventory impairment | | Inventory impairment | — | | — | | — | | (31) | | — | | (31) | |
| Restructuring, impairment and other | | Restructuring, impairment and other | (230) | | (14) | | (216) | | (653) | | (219) | | (434) | |
| Separation related | | Separation related | (5) | | (11) | | 6 | | (23) | | (53) | | 30 | |
| Operating income | | Operating income | 269 | | 378 | | (109) | | 522 | | 736 | | (214) | |
| Other non-operating loss, net | | Other non-operating loss, net | (60) | | (102) | | 42 | | (657) | | (791) | | 134 | |
| Interest expense, net | | Interest expense, net | (65) | | (67) | | 2 | | (188) | | (205) | | 17 | |
| Income (loss) before income taxes | | Income (loss) before income taxes | 144 | | 209 | | (65) | | (323) | | (260) | | (63) | |
| | Provision for income taxes | | Provision for income taxes | (145) | | (189) | | 44 | | (422) | | (422) | | — | |
| Net income (loss) | | Net income (loss) | $ | (1) | | $ | 20 | | $ | (21) | | $ | (745) | | $ | (682) | | $ | (63) | |
|
| | | | | | | | | | | | | | | | | | |
| | Three Months Ended September 30, | $ Change | Nine Months Ended September 30, | $ Change |
| | 2017 | 2016 | 2017 | 2016 |
| Segment operating income (loss): | | | | | | |
| Oilfield Services | $ | 75 |
| $ | (66 | ) | $ | 141 |
| $ | (42 | ) | $ | (164 | ) | $ | 122 |
|
| Oilfield Equipment | (43 | ) | 61 |
| (104 | ) | 9 |
| 190 |
| (181 | ) |
| Turbomachinery & Process Solutions | 210 |
| 258 |
| (48 | ) | 707 |
| 942 |
| (235 | ) |
| Digital Solutions | 87 |
| 101 |
| (14 | ) | 226 |
| 240 |
| (14 | ) |
| Total segment operating income (loss) | 329 |
| 354 |
| (25 | ) | 900 |
| 1,208 |
| (308 | ) |
| Corporate | (89 | ) | (75 | ) | (14 | ) | (282 | ) | (240 | ) | (42 | ) |
| Inventory impairment | (12 | ) | (24 | ) | 12 |
| (31 | ) | (131 | ) | 100 |
|
| Restructuring, impairment and other | (191 | ) | (77 | ) | (114 | ) | (292 | ) | (452 | ) | 160 |
|
| Merger and related costs | (159 | ) | (2 | ) | (157 | ) | (310 | ) | (10 | ) | (300 | ) |
| Operating income (loss) | (122 | ) | 176 |
| (298 | ) | (15 | ) | 375 |
| (390 | ) |
| Other non operating income (loss), net | (3 | ) | 6 |
| (9 | ) | 65 |
| 18 |
| 47 |
|
| Interest expense, net | (42 | ) | (21 | ) | (21 | ) | (75 | ) | (74 | ) | (1 | ) |
| Income (loss) before income taxes and equity in loss of affiliate | (167 | ) | 161 |
| (328 | ) | (25 | ) | 319 |
| (344 | ) |
| Equity in loss of affiliate | (13 | ) | — |
| (13 | ) | (13 | ) | — |
| (13 | ) |
| Provision for income taxes | (96 | ) | (70 | ) | (26 | ) | (125 | ) | (132 | ) | 7 |
|
| Net income (loss) | $ | (276 | ) | $ | 91 |
| $ | (367 | ) | $ | (163 | ) | $ | 187 |
| $ | (350 | ) |
The following charts show segment revenues and segment operating income for each of our reportable segments for the three months ended September 30, 2017 and 2016:
Segment Revenues and Segment Operating Income (millions)
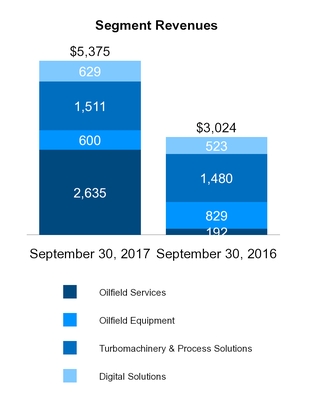
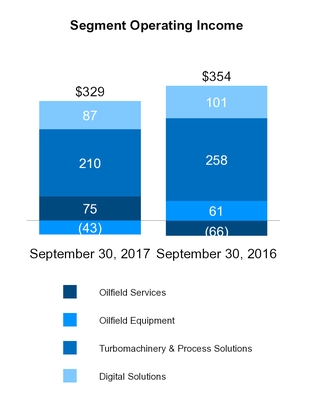
Third Quarter of 20172022 Compared to the Third Quarter of 2016
Consolidated Results2021
Revenue increased $2,351$276 million, or 78%5%, primarily driven by the acquisition of Baker Hughes. Oilfield Serviceshigher volume in OFS and DS, partially offset by lower volume in TPS and OFE. OFS increased $2,443 million, Turbomachinery & Process Solutions increased $31$423 million and Digital SolutionsDS increased $106$19 million, partially offset with the decrease in Oilfield Equipment of $229by TPS which decreased $124 million and OFE which decreased $42 million.
Total segment operating income increased $98 million. The increase was driven by OFS which increased $140 million, partially offset by OFE which decreased $25$20 million, TPS which decreased $16 million, and DS which decreased $6 million.
Oilfield Services
OFS revenue of $2,842 million increased $423 million, or 17%, in the third quarter of 2022 compared to the third quarter of 2021, as a result of increased activity in North America and internationally, as evidenced by an increase in the global rig count. North America revenue was $942 million in the third quarter of 2022, an increase of $229 million from the third quarter of 2021. International revenue was $1,899 million in the third quarter of 2022, an increase of $194 million from the third quarter of 2021, driven by the Middle East, Latin America, Sub-Sahara Africa and Asia Pacific regions, partially offset by declines in the Russia Caspian and Europe regions.
OFS segment operating income was $330 million in the third quarter of 2022 compared to $190 million in the third quarter of 2021. The increase in income was primarily driven by higher volume and price, partially offset by logistics and commodity cost inflation.
Oilfield Equipment
OFE revenue of $561 million decreased $42 million, or 7%, in the third quarter of 2022 compared to the third quarter of 2021. The decrease was primarily driven by Oilfield Equipment which decreased $104 million, Turbomachinery & Process Solutions which decreased $48 million,lower volume in the subsea production systems and Digital Solutions which decreased $14 million,from the removal of subsea drilling systems business from the consolidated OFE operations in the fourth quarter of 2021 due to the formation of a joint venture, partially offset by Oilfield Services which increased $141 million.higher volume in the flexible pipe, services and surface pressure control projects businesses.
Oilfield ServicesBaker Hughes Holdings LLC 2022 Third Quarter Form 10-Q | 33
Oilfield Services revenue increased $2,443
OFE segment operating loss was $6 million in the third quarter of 20172022 compared to segment operating income of $14 million in the third quarter of 2021. The decrease in income was primarily driven by lower volume, inflationary pressure, and decreased cost productivity.
Turbomachinery & Process Solutions
TPS revenue of $1,438 million decreased $124 million, or 8%, in the third quarter of 2022 compared to the third quarter of 2016,2021. The decrease was primarily as a resultdriven by lower equipment and projects revenue, and foreign currency translation impact. When compared to the prior year, equipment revenue was down 17%, and service revenue was flat. Equipment revenue in the quarter represented 41% and service revenue represented 59% of the acquisition of Baker Hughes on July 3, 2017 (up $2,427 million).total segment revenue.
Oilfield ServicesTPS segment operating income was $75$262 million in the third quarter of 20172022 compared to a loss of $66$278 million in the third quarter of 2016.2021. The acquisition of Baker Hughes added $136 million of segment operatingdecrease in income which includes the increased intangible amortization expense of $49 million. Organically, negative pricewas primarily driven by lower volume and mix werecost inflation, partially offset by strong cost productivity.favorable business mix.
Digital Solutions
Oilfield Equipment
Oilfield EquipmentDS revenue decreased $229of $528 million increased $19 million, or 28%4%, in the third quarter of 20172022 compared to the third quarter of 2016. The decrease in revenue can be attributed to activity reductions2021, driven by higher volume across the SPS and Drilling product lines, and to a lesser extent price deterioration.all businesses.
Oilfield EquipmentDS segment operating lossincome was $43$20 million in the third quarter of 20172022 compared to segment operating income of $61$26 million in the third quarter of 2016.2021. The declinedecrease in profitability was due to lower revenues and the impact of negative cost productivity, and only partially offset by deflation savings.
Turbomachinery & Process Solutions
Turbomachinery & Process Solutions revenue of $1,511 million increased $31 million, or 2%, in the third quarter of 2017 compared to the third quarter of 2016. The increase was primarily driven by fulfillment of long-term service contractslower cost productivity and inflationary pressure as well as gas and steam turbine installations,we continue to work through electronics shortages, partially offset by lower volume inincreased volume.
Corporate
In the Flow & Process Technologies business.
Turbomachinery & Process Solutions segment operating income was $210third quarter of 2022, corporate expenses were $103 million compared to $105 million in the third quarter of 20172021. The decrease of $2 million was primarily driven by cost efficiencies and past restructuring actions.
Restructuring, Impairment and Other
In the third quarter of 2022, we recognized $230 million of restructuring, impairment and other charges, compared to segment operating income of $258$14 million in the third quarter of 2016.2021. The decline in profitability is primarily due to lower variable cost productivity, unfavorable equipment mix and lower volume/price versus the prior year.
Digital Solutions
Digital Solutions revenue increased $106 million, or 20%,charges in the third quarter of 2017 compared2022 relate primarily to the third quarter of 2016,employee termination expenses and PP&E impairments driven by actions taken by the acquisition of Baker Hughes which added $108 million of revenues versusCompany to facilitate its reorganization into two segments, as well as global footprint optimization projects in certain OFS and OFE businesses. In addition, we impaired certain long-lived assets in OFE for the prior year.
Digital Solutions segment operating income was $87 millionSPS business due to a decrease in the estimated future cash flows driven bya decline in our long-term market outlook for this business. The charges in the third quarter of 2017 compared2021 primarily related to $101 millioninitiatives in our OFS segment that were the continuation of our overall strategy to right-size our structural costs for this segment.
Other Non-Operating Loss, Net
In the third quarter of 2016. The decrease2022, we incurred $60 million of other non-operating losses. Included in profitability is driven by the acquisitionthis amount was a loss of Baker Hughes down $6 million in the quarter, and by unfavorable organic cost productivity.
Corporate
Corporate expenses in the third quarter of 2017 totalled $89 million, an increase of $14 million compared to the third quarter of 2016, primarily due to an increase in costs of $29$52 million from the acquisition of Baker Hughes, partially offset by realized synergieschange in the period.
Restructuring, Impairmentfair value in our C3 AI and Other
ADNOC investments. For the third quarter of 2017,2021, we recognized $191incurred $102 million of other non-operating losses. Included in restructuring charges, an increasethis amount was a loss of $114$140 million from the change in fair value in our C3 AI investment.
Interest Expense, Net
In the third quarter of 2016. This increase was primarily due to integration driven synergy plans.
Merger and Related Costs
For the third quarter of 2017, we incurred merger and related costs of $159 million, an increase of $157 million from the third quarter of 2016, primarily related to the acquisition of Baker Hughes. Such costs include severance and other separation payments made to certain executive officers of Baker Hughes related to change-in-control with double trigger provisions in their existing employment agreements, professional fees of advisors, and integration and synergy costs related to the combination of Baker Hughes and GE O&G.
Interest Expense, Net
For the third quarter of 2017,2022, we incurred interest expense, net of interest income, of $42$65 million, an increase of $21which decreased $2 million fromcompared to the third quarter of 2016,2021. The reduction was primarily driven by the acquisition of Baker Hughes.
higher interest income.
Income Taxes
IncomeIn the third quarter of 2022, the provision for income taxes was $145 million. The difference between the U.S. statutory tax expense was $96 million forrate of 21% and the quarter ended September 30, 2017 comparedeffective tax rate is primarily related to $70 million for the three months ended September 30, 2016. The increase was primarily attributable to us not being subject to U.S. tax after the Transactions and unable to recognize alosses with no tax benefit ondue to valuation
Baker Hughes Holdings LLC 2022 Third Quarter Form 10-Q | 34
allowances, restructuring charges for which a majority has no tax benefit, and earnings in jurisdictions with tax rates higher than the U.S. In addition, since we are a partnership for U.S. federal tax purposes, any tax benefits associated with U.S. losses as those losses are passed through torecognized by our members. Consequently,Members and not reflected in our tax expense.
In the third quarter of 2021, the provision for income taxes was $189 million. The difference between the U.S. statutory tax expenserate of 21% and the effective tax rate is primarily attributable to non-U.S. taxes related to our foreign subsidiaries. The positive impact oflosses with no tax rates below the U.S. rate of 35% is offset by adjustmentsbenefit due to prior estimates, increased valuation allowances and withholding taxes. The prior year quarter reflects 100% of the taxes associated with U.S. and non-U.S. earnings of the historic GE O&G business.
Segment Revenues and Segment Operating Income (millions)
The following charts show segment revenues and segment operating income for each of our reportable segments for the nine months ended September 30, 2017 and 2016:
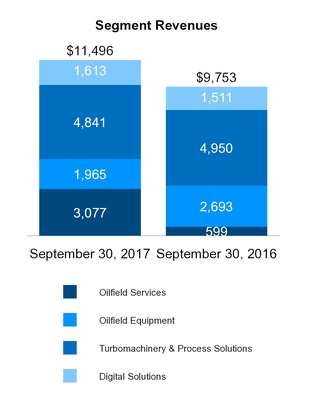
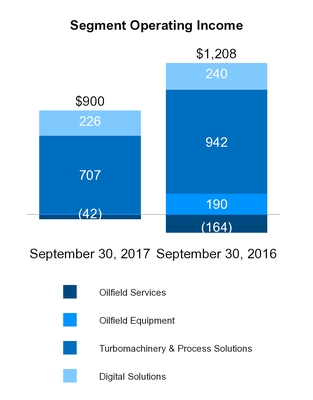
The First Nine Months of 20172022 Compared to the First Nine Months of 2016
Consolidated Results2021
Revenue increased $1,743$234 million, or 18%, primarily driven by the acquisition of Baker Hughes. Oilfield Serviceshigher volume in OFS and, to a lesser extent, DS, partially offset by lower volume in TPS and OFE. OFS increased $2,478$1,043 million Digital Solutionsand DS increased $102$27 million, partially offset by Turbomachinery and Process SolutionsTPS which decreased $109$599 million and Oilfield EquipmentOFE which decreased $728$237 million.
SegmentTotal segment operating income decreased $308increased $214 million. The decreaseincrease was primarily driven by Turbomachinery and Process SolutionsOFS which decreased $235 million, Oilfield Equipment which decreased $181 million, and Digital Solutions which decreased $14increased $307 million, partially offset by Oilfield ServicesOFE which increased $122decreased $71 million and DS which decreased $22 million.
Oilfield Services
Oilfield Services
OFS revenue of $8,019 million increased $2,478$1,043 million, or 15%, in the first nine months of 20172022 compared to the first nine months of 2016, primarily2021, as a result of the acquisition of Baker Hughes on July 3, 2017 (up $2,427 million).
Oilfield Services segment operating loss was $42 millionincreased activity in North America and internationally, as evidenced by an increase in the global rig count. North America revenue was $2,585 million in the first nine months of 2017 compared to a loss2022, an increase of $164 $554 millionin from the first nine months of 2016. The acquisition2021. International revenue was $5,434 million in the first nine months of Baker Hughes contributed $1362022, an increase of $489 million from the first nine months of 2021, driven by the Middle East, Latin America, Sub-Sahara Africa, and Asia Pacific regions, partially offset by declines in the Russia Caspian and Europe regions.
OFS segment operating income which includeswas $812 million in the increased intangible amortization expensefirst nine months of $49 million. Organically negative2022 compared to $505 million in the first nine months of 2021. The increase in income was primarily driven by higher volume and price, and volume were only partially offset by deflation benefitslogistics and improvedcommodity cost productivity.
Oilfield Equipmentinflation.
Oilfield Equipment
OFE revenue of $1,630 milliondecreased $728$237 million, or 27%13%, in the first nine months of 20172022 compared to the first nine months of 2016.2021. The decrease was primarily driven by lower volume in the subsea production systems and surface pressure control projects businesses, and from the removal of subsea drilling systems business from the consolidated OFE operations in the fourth quarter of 2021 due to the formation of a joint venture, partially offset by higher volume in the services and flexible pipe businesses.
Oilfield EquipmentOFE segment operating incomeloss was $9$26 million in the first nine months of 20172022 compared to segment operating income of $190$45 million in the first nine months of 2016. 2021. The impact from the declinedecrease in revenueincome was primarily driven by lower volume, cost inflation, and partial price erosion, together with the impact of negativedecreased cost productivity, was only partially offset by the benefit of cost deflation.
Turbomachinery & Process Solutionsproductivity.
Turbomachinery & Process Solutions
TPS revenue of $4,076 million decreased $109$599 million, or 13%, in the first nine months of 2022 compared to the first nine months of 2021. The decrease was primarily driven by lower equipment and projects revenue, partially offset by higher volume in industrial valves, pumps and gears. Equipment revenue was down 25% and service revenue was down 2% when compared to the prior year. Equipment revenue in the first nine months of 2022 represented 41% and service revenue represented 59% of total segment revenue.
TPS segment operating income was $705 million for the first nine months of 2022 and 2021. The income performance in 2022 was driven by favorable business mix and increased cost productivity, offset by lower volume, unfavorable foreign currency translation impact, and inflationary pressure.
Baker Hughes Holdings LLC 2022 Third Quarter Form 10-Q | 35
Digital Solutions
DS revenue of $1,526 million increased $27 million, or 2%, in the first nine months of 20172022 compared to the first nine months of 2016 primarily2021, mainly driven by pricing pressures on equipment deals.volume increases in Precision Sensors and Instrumentation, Waygate Technologies, and Process & Pipeline Services, partially offset by declines in the Bently Nevada and Nexus Controls businesses.
Turbomachinery & Process SolutionsDS segment operating income was $707$53 million in the first nine months of 2022 compared to $75 million in the first nine months of 2021. The decrease in profitability was primarily driven by lower cost productivity and inflationary pressure, as the segment continues to work through electronic shortages, partially offset by higher volume.
Corporate
In the first nine months of 2022, corporate expenses were $316 million compared to $324 million in the first nine months of 2017 compared to segment operating income2021. The decrease of $942$8 million inwas primarily driven by cost efficiencies and past restructuring actions.
Restructuring, Impairment and Other
In the first nine months of 2016. The2022, we recognized $653 million of restructuring, impairment and other charges, primarily related to the suspension of substantially all of our operations in Russia in the second quarter of 2022 as well as charges for employee terminations and PP&E impairments driven by actions taken by the Company to facilitate its reorganization into two segments, and global footprint optimization projects in certain OFS and OFE businesses. In addition, we impaired certain long-lived assets in our OFE segment for the SPS business due to a decrease in profitability is primarilythe estimated future cash flows driven by year-over-year top line pricing pressures, unfavorable equipment mix and lower variable cost productivity, only partially offset by cost deflation savings and foreign exchange favorability.
Digital Solutions
Digital Solutions revenue increased $102 million or 7%a decline in our long-term market outlook for this business. In the first nine months of 2017 compared2021, we recognized $219 million in restructuring, impairment and other charges, primarily related to initiatives in our OFS segment that were the continuation of our overall strategy to right-size our structural costs in this segment.
Other Non-Operating Loss, Net
In the first nine months of 2016. The Baker Hughes acquisition contributed $1082022, we incurred $657 million of revenue comparedother non-operating losses. Included in this amount was a loss of $426 million related to the prior year.
Digital Solutions segment operating incomeOFS business in Russia, which was $226classified as held for sale in the second quarter, and a loss of $164 million related to marking our investments in C3 AI and ADNOC to fair value. For the first nine months of 2017 compared2021, we incurred $791 million of other non-operating losses. Included in this amount were net losses of $955 million related to $240marking our investment in C3 AI to fair value, partially offset by the reversal of current accruals of $121 million indue to the settlement of certain legal matters.
Interest Expense, Net
In the first nine months of 2016. The decrease in profitability is driven by the acquisition of Baker Hughes in the quarter and by pricing and FX pressure on the organic performance.
Corporate
Corporate expenses were $282 million in the first nine months of 2017, an increase of $42 million compared to the first nine months of 2016. This is attributed to the acquisition of Baker Hughes, which is $29 million, and lower organic cost productivity.
Restructuring, Impairment and Other
For the nine months ended September 30, 2017, we recognized $292 million in restructuring charges, a decrease of $160 million from the nine months ended September 30, 2016. This decrease was primarily due to a reduction in market driven restructuring programs, partially offset by synergy driven restructuring items. We continue to evaluate the market and make cost rationalization decisions based on changes to short and long-term market indicators.
Merger and Related Costs
For the nine months ended September 30, 2017, we incurred merger and related costs of $310 million, an increase of $300 million from the prior year, primarily related to the acquisition of Baker Hughes. Such costs include severance and other separation payments made to certain executive officers of Baker Hughes with change-in-control agreements, professional fees of advisors, and integration and synergy costs related to the combination of Baker Hughes and GE O&G.
Interest Expense, Net
For the nine months ended September 30, 2017,2022, we incurred interest expense, net of interest income, of $75$188 million, an increase of $1 million from the prior year. The acquisition of Baker Hughes has driven an increase in expense, offset by a reduction in organic interest expenses.
Income Taxes
For the nine months ended September 30, 2017, BHGE LLC income tax expense was $125which decreased $17 million compared to income tax expense of $132 million in the first nine months of 2016.2021, primarily driven by higher interest income.
Income Taxes
In the first nine months of 2022, the provision for income taxes was $422 million. The $7 million net decrease indifference between the U.S. statutory tax expenserate of 21% and the effective tax rate is primarily related to losses with no tax benefit due to valuation allowances, restructuring charges for which a decreasemajority has no tax benefit, and earnings in income before taxes, including U.S. losses incurred in the current quarter that BHGE LLC is not able to benefit as those losses are passed through to our member. The positive impact of foreignjurisdictions with tax rates lowerhigher than the U.S.
In the first nine months of 2021, the provision for income taxes was $422 million. The difference between the U.S. statutory tax rate of 35%21% and the effective tax rate is offset by adjustmentsprimarily related to prior estimates, increasedlosses with no tax benefit due to valuation allowances and withholding taxes. The prior year nine months reflects 100% of the taxes associated with U.S. and non-U.S. earnings of the historic GE O&G business.changes in unrecognized tax benefits related to uncertain tax positions.
LIQUIDITY AND CAPITAL RESOURCES
Our objective in financing our business is to maintain sufficient liquidity, adequate financial resources and financial flexibility in order to fund the requirements of our business. We continue to maintain solid financial strength
Baker Hughes Holdings LLC 2022 Third Quarter Form 10-Q | 36
and liquidity. At September 30, 2017,2022, we had cash and cash equivalents of $4,775 million$2.8 billion compared to $981 million of cash and equivalents held$3.8 billion at December 31, 2016.2021.
AtIn the U.S. we held cash and cash equivalents of approximately $0.8 billion and $1.6 billion and outside the U.S. of approximately $2.1 billion and $2.2 billion as of September 30, 2017, approximately $4,167 million of our cash2022 and equivalents was held by foreign subsidiaries compared to approximately $878 million at December 31, 2016.2021, respectively. A substantial portion of the cash held by foreign subsidiariesoutside the U.S. at September 30, 2017 was2022 has been reinvested in our international operations as our intent is to use this cash to, among other things, fund the operations of our foreign subsidiaries.active non-U.S. business operations. If we decide at a later date to repatriate those funds to the U.S., we may incur other additional taxes that would not be requiredsignificant to provide taxes on certain of those funds based on applicable U.S.the total tax rates net of foreign tax credits.provision.
On July 3, 2017, in connection with the Transactions, we entered intoWe have a new five-year $3 billion committed unsecured revolving credit facility (the "2017("the Credit Agreement") with commercial banks maturing in July 2022. AsDecember 2024. In addition, we have a commercial paper program with authorization up to $3 billion under which we may issue from time to time commercial paper with maturities of no more than 397 days. At September 30, 2017,2022 and December 31, 2021, there were no direct borrowings under either the Credit Agreement or the commercial paper program.
Certain Senior Notes contain covenants that restrict our ability to take certain actions. See "Note 9. Borrowings" of the Notes to Unaudited Condensed Consolidated Financial Statements in this Quarterly Report for further details. At September 30, 2022, we were in compliance with all debt covenants. Our next debt maturity is December 2023.
We continuously review our liquidity and capital resources. If market conditions were to change, for instance due to the uncertainty created by geopolitical events, a global pandemic or a significant decline in oil and gas prices, and our revenue was reduced significantly or operating costs were to increase significantly, our cash flows and liquidity could be negatively impacted. Additionally, it could cause the rating agencies to lower our credit ratings. There are no ratings triggers that would accelerate the maturity of any borrowings under our committed credit facility; however, a downgrade in our credit ratings could increase the cost of borrowings under the credit facility and could also limit or preclude our ability to issue commercial paper. Should this occur, we could seek alternative sources of funding, including borrowing under the credit facility.
During the nine months ended September 30, 2017,2022, we useddispersed cash to fund a variety of activities including certain working capital needs, and restructuring costs, capital expenditures, business acquisitionsdistributions to Members, and the paymentrepurchases of dividends. We believe that cash on hand, cash flows generated from operations and the available credit facility will provide sufficient liquidity to manage our global cash needs.Units.
Cash Flows
Cash flows provided by (used in) each type of activity were as follows for the nine months ended September 30:
| | | (In millions) | 2017 | 2016 | (In millions) | 2022 | 2021 |
| Operating activities | $ | (585 | ) | $ | (195 | ) | Operating activities | $ | 997 | | $ | 1,598 | |
| Investing activities | (3,879 | ) | (346 | ) | Investing activities | (580) | | (212) | |
| Financing activities | 8,210 |
| 229 |
| Financing activities | (1,297) | | (1,585) | |
Operating Activities
Our largest source of operating cash is payments from customers, of which the largest component is collecting cash related to product orour sales of products and services sales including advance payments or progress collections for work to be performed. The primary use of operating cash is to pay our suppliers, employees, tax authorities, and others for a wide range of materialgoods and services.
Cash flows from operating activities usedgenerated cash of $585$997 million inand $1,598 million for the nine months ended September 30, 2017. These2022 and 2021, respectively.
For the nine months ended September 30, 2022, cash outflowsgenerated from operating activities were primarily driven by $129net income adjusted for certain noncash items (including depreciation, amortization, loss on assets held for sale, loss on equity securities, and the impairment of certain assets). Net working capital cash usage was $261 million increase in net working capital,for the nine months ended September 30, 2022, mainly due to lower collectionsthe increase in receivables, and inventory as we build for revenue growth, partially offset by increased inventory liquidations. Otherstrong progress collections on equipment contracts.
Baker Hughes Holdings LLC 2022 Third Quarter Form 10-Q | 37
For the nine months ended September 30, 2021, cash generated from operating activities were primarily driven by net losses adjusted for certain noncash items that used cash were restructuring(including depreciation, amortization, and deal related outflows, including severance, employee incentive compensation paymentsloss on equity securities) and working capital, which includes contract and other integration costs;deferred assets. Net working capital generation was $481 million for the nine months ended September 30, 2021, mainly due to receivables, inventory, and tax payments in foreign jurisdictions.contract assets, partially offset by progress collections, as we continued to improve our working capital processes.
Investing Activities
Cash flows from investing activities used cash of $3,879$580 million and $346$212 million for the nine months ended September 30, 20172022 and 2016,2021, respectively.
Our principal recurring investing activity is the funding of capital expenditures including property, plant and equipment and software, to support and generate revenue from operations. Expenditures for capital assets were $417$720 million and $330$590 million for the nine months ended September 30, 20172022 and 2016, respectively; partially offset by cash flows2021, respectively. Proceeds from the sale of property, plant and equipment of $76were $189 million and $21$178 million for the nine months ended September 30, 20172022 and 2016,2021, respectively. Proceeds from the disposal of assets related primarily to equipment that was lost-in-hole, and to property, machinery and equipment
There were no longer used in operations that wasC3 AI Shares sold throughout the period.
Forduring the nine months ended September 30, 2017, cash flow from investing activities also includes $7,4982022. During the nine months ended September 30, 2021, we sold approximately 2.2 million of distribution to BHGE to fund the special dividend by BHGE to former Baker Hughes shareholders on the completionC3 AI Shares and received proceeds of the Transactions, net of $4,133$145 million, of cash received from the acquisition.which is included in other investing activities.
Financing Activities
Cash flows from financing activities providedused cash of $8,210$1,297 million and $229$1,585 million for the nine months ended September 30, 20172022 and 2016,2021, respectively.
DuringWe had net repayments of debt and other borrowings of $22 million and $60 million for the nine months ended September 30, 2017,2022 and 2021, respectively. In April 2021, we received $7,400repaid $832 million contribution from GE to fund substantially all(£600 million) of commercial paper originally issued in May 2020 under the distribution paid to BHGE. Additionally, weCOVID Corporate Financing Facility established by the Bank of England.
We made distributions of $198 million to our members.
Cash flows from financing activities also includes net transfers from GEMembers of $1,574 million primarily driven by the cash pooling activity with GE prior to the Transactions. Other financing items includes a payment of $193 million to complete the purchase of the non-controlling interest in the Pipeline Inspection and Integrity business within Digital Solutions.
Total debt outstanding was $4,905$552 million and $277$563 million at September 30, 2017 and December 31, 2016, respectively. The total debt-to-capital (defined as total debt plus equity) ratio was 10.87% and 1.83% at September 30, 2017 and at December 31, 2016, respectively. The increase was driven by the debt assumed in the Baker Hughes acquisition.
Available Credit Facility
On July 3, 2017, in connection with the Transactions, we entered into a new five-year $3 billion committed unsecured revolving credit facility (the "2017 Credit Agreement") with commercial banks maturing in July 2022. The 2017 Credit Agreement contains certain customary representations and warranties, certain affirmative covenants and no negative covenants. Upon the occurrence of certain events of default, our obligations under the 2017 Credit Agreement may be accelerated. Such events of default include payment defaults to lenders under the 2017 Credit
Agreement, and other customary defaults. We were in compliance with all of the credit facility's covenants, and there were no direct borrowings under the credit facility during the quarternine months ended September 30, 2017.2022 and 2021, respectively.
If market conditions were to change and our revenue was reduced significantly or operating costs were to increase, our cash flows and liquidity could be reduced. Additionally, it could cause the rating agencies to lower our credit rating. There are no ratings triggers that would accelerate the maturityIn 2021, Baker Hughes' Board of any borrowings under our committed credit facility. However, a downgrade in our credit ratings could increase the cost of borrowings under the credit facility and could also limit or preclude our ability to issue commercial paper. Should this occur, we would seek alternative sources of funding, including borrowing under the credit facility.
We believe our current credit ratings would allowDirectors authorized us to obtain interim financing overrepurchase up to $2 billion of our Units. For the nine months ended September 30, 2022, we repurchased and above our existing credit facilitycanceled 25.5 million Units for any currently unforeseen significant needs.a total of $727 million. For the nine months ended September 30, 2021, we repurchased and canceled 4.4 million Units for a total of $106 million.
Cash Requirements
We currently believe cash on hand, cash flows from operating and financing activities, and the available revolving credit facility, access to both our commercial paper program or our uncommitted lines of credit, and availability under our existing shelf registrations of debt will provide us with sufficient capital resources and liquidity in the short-term and long-term to manage our working capital needs, meet contractual obligations, fund capital expenditures and dividends,distributions, repay debt, repurchase our common units, and support the development of our short-term and long-term operating strategies. When necessary, we issue commercial paper or other short-term debt to fund cash needs in the U.S. in excess of the cash generated in the U.S.
Our capital expenditures can be adjusted and managed by us to match market demand and activity levels. We continue to believe that based on current market conditions, capital expenditures in 2022 are expected to be made at a rate that would equal up to 5% of annual revenue. The expenditures are expected to be used primarily for normal, recurring items necessary to support our business. We currently anticipate making income tax payments in the range of $525 million to $625 million in 2022.
Baker Hughes Holdings LLC 2022 Third Quarter Form 10-Q | 38
Other factors affecting liquidityFactors Affecting Liquidity
Customer receivables:In line with industry practice, we may bill our customers for services provided in arrears dependent upon contractual terms. In a challenging economic environment, we may experience delays in the payment of our invoices due to customers' lower cash flow from operations or their more limited access to credit markets. While historically there have not been material non-payment events, we attempt to mitigate this risk through the sale of our receivables in monetization programs or working with our customers to restructure their debts; however, not all countries and programs allow monetization on a non-recourse basis.debts. A customer's failure or delay in payment could have a material adverse effect on our short-term liquidity and results fromof operations. AsOur gross customer receivables in the U.S. were 14% as of September 30, 2017, we have no2022. In Mexico, our gross customer balances which exceed 7% of our net customer receivables. Asreceivables were 11% as of September 30, 2017, 18% of our gross trade receivables were from customers in the United States and 4% were from customers in Venezuela. As of December 31, 2016, 13% of our gross trade receivables were from customers in the United States and 1% were from customers in Venezuela. Other than the United States, no2022. No other country or single customer accounted for more than 15%10% of our gross tradecustomer receivables at these dates.this date.
Venezuela: Although we continue to experience delays in collecting payments on our receivables from our primary customer in Venezuela, our outstanding receivables are not disputed, and we continue to believe that they are recoverable. In assessing the collectability of these receivables, we considered our collection experience with this customer. To date we have had no material write-offs related to this customer historically and we have collected $86 million in 2017. In addition, we consider the continued importance to the Venezuelan economy of oil production, our strategic relationship with this customer, our current activity levels and our current intention to continue to provide services to this customer, and an evaluation of this customer’s financial solvency. We continue to actively manage our relationship with this customer, with ongoing dialogue between key executives of both companies, including discussions regarding this customer's intention to pay trade receivables.
We also have outstanding trade receivables with a gross amount of approximately $266 million, and a net amount of approximately $40 million as well as approximately $60 million of on-hand inventory that we may not be able to redeploy to other customers should the contracts with this customer be terminated unexpectedly.
We believe our collectability assumptions to be reasonable according to the current facts and circumstances. However, differences in actual experience or changes in facts and circumstances may materially affect our financial position or results of operations. Our assumptions and related judgments are sensitive to the political and economic conditions in Venezuela. If conditions in Venezuela worsen or if low commodity prices persist for an extended period of time, we may be required to record adjustments to our receivables balance. Our financial results can be affected, positively or negatively, by changes in our assessment of the collectability of these trade receivables.
International operations:ourOur cash that is held outside the United States, which comprised 87%U.S. is 72% of the total cash balance as of September 30, 2017, is in certain circumstances subject2022. We may not be able to use this cash quickly and efficiently due to exchange or cash controls that could
make it challenging to quickly access.challenging. As a result, our cash balance may not represent itsour ability to quickly and efficiently use this cash.
Cash heldSupply chain finance programs: Under supply chain finance programs, administered by a third party, our suppliers are given the opportunity to sell receivables from us to participating financial institutions at their sole discretion at a rate that leverages our credit rating and thus might be more beneficial to our suppliers. Our responsibility is limited to making payment on behalfthe terms originally negotiated with our supplier, regardless of GE: In connectionwhether the supplier sells its receivable to a financial institution. The range of payment terms we negotiate with our suppliers is consistent, irrespective of whether a supplier participates in the Transactions, as of July 3, 2017, we were required to repay any cash in excess of $100 million, net of any third-party debt in GE O&G, to GE. Due to the restricted nature of the majority of this excess cash, weprogram. These liabilities continue to hold this cash on behalfbe presented as accounts payable in our condensed consolidated statements of GE until cash is unrestrictedfinancial position and available for repayment to GE. Accordingly, on July 3, 2017, we executed a promissory note with GE. There is no maturity date on the promissory note, but we remain obligated to repay GE such excess cash together with any income or loss we may incur on it, therefore, this obligation is reflected as short-term borrowings. The restriction arises as the majority of the cash cannot be released, transferred or otherwise converted into a non-restricted market currency due to the lack of market liquidity, capital controls or similar monetary or exchange limitations by a government entity of the jurisdiction in which such cash is situated.
OTHER ITEMS
Iran Threat Reduction And Syria Human Rights Act Of 2012
The Company is making the following disclosure pursuant to Section 13(r) of the Securities Exchange Act of 1934. Under Section 13(r) of the Securities Exchange Act of 1934, enacted in 2012, BHGE is required to disclose in its periodic reports if it or any of its affiliates knowingly engaged in businessflow from operating activities relating to Iran, even if those activities are conducted in accordance with authorizations subsequently issued by the U.S. Government. Reportable activities include investmentswhen settled. We do not believe that significantly enhance Iran's ability to develop petroleum resources valued at $20 million or morechanges in the aggregate duringavailability of supply chain financing programs would have a twelve-month period. Reporting is also required for transactions related to Iran's domestic productionmaterial impact on our liquidity.
CRITICAL ACCOUNTING ESTIMATES
Our critical accounting estimation processes are consistent with those described in Item 7 of refined petroleum products or Iran's ability to import refined petroleum products valued at $5 million or more in the aggregate during a twelve-month period.
In January 2016, the U.S. DepartmentPart II, "Management's discussion and analysis of Treasury’s Officefinancial condition and results of Foreign Assets Control (OFAC) issued General License H authorizing U.S.-owned or controlled foreign entities to engage in transactions with Iran if these entities meet the requirementsoperations" of the general license. Pursuant to this authorization, a non-U.S. affiliate of the Company received five purchase orders during the third quarter of 2017 for the sale of goods pursuant to General License H that could potentially enhance Iran’s ability to develop petroleum resources. The purchase orders cover the sale of valves and parts for industrial machinery and equipment used in gas plants, petrochemical plants and gas production projects in Iran. These purchase orders are valued at €0.1million ($0.1 million), €0.5 million ($0.5 million), €0.2 million ($0.2 million), €0.1 million ($0.1 million), €1.3 million ($1.5 million). This non-US affiliate also booked a modification of a previously reported contract for the sale of spare parts for gas turbines to add additional scope valued at €0.1 million ($0.1 million) and a further modification to another previously reported contract for the sale of spare parts to reduce the value of the contract by €1.6 million ($1.8 million). This non-US affiliate attributed €1.5 million ($1.8 million) in gross revenues and €0.8 million ($0.9 million) in net profits against previously reported transactions during the quarter ended September 30, 2017.
A second non-U.S. affiliate of the Company received two purchase orders during the third quarter of 2017 for the sale of consumable parts, instruments and a digital recording system to be applied to industrial machinery and equipment on gas plants. The purchase orders are valued at €0.1 million ($0.1 million) and €0.1 million ($0.1 million). This non-US affiliate attributed €0.3 million ($0.3 million) in gross revenues and €0.1 million ($0.1 million) in net profits to these transactions during the quarter ended September 30, 2017.
All of these non-U.S. affiliates intend to continue the activities described above and as permitted by all applicable laws and regulations.our 2021 Annual Report.
FORWARD-LOOKING STATEMENTS
This Quarterly Report on Form 10-Q, contains "forward-looking"forward-looking statements as that term is defined inwithin the meaning of Section 27A of the Securities Act of 1933, as amended, and Section 21E of the Exchange Act.Act of 1934, as amended, (each a "forward-looking statement"). All statements, other than historical facts, including statements regarding the presentation of the Company's operations in future reports and any assumptions underlying any of the foregoing, are forward-looking statements. Forward-looking statements concern future circumstances and results and other statements that are not historical facts and are sometimes identified by
the words "may," "will," "should," "potential," "intend," "expect," "endeavor,"would," "seek," "anticipate," "estimate," "overestimate," "underestimate," "believe," "could," "project," "predict," "continue," "target", "goal" or other similar words or expressions. Forward-looking statements are based upon current plans, estimates and expectations that are subject to risks, uncertainties and assumptions. Should one or more of these risks or uncertainties materialize, or should underlying assumptions prove incorrect, actual results may vary materially from those indicated or anticipated by such forward-looking statements. The inclusion of such statements should not be regarded as a representation that such plans, estimates or expectations will be achieved. Important factors that could cause actual results to differ materially from such plans, estimates or expectations include, among others, the risk factors identified in the "Risk Factors" section of the Registration Statement on Form S-4 (File No. 333-216991), as amended, filed by the Company with the SECPart II of Item 1A of this report and declared effective on May 30, 2017; the Company’s subsequent quarterly report on Form 10-Q for the quarterly period ended June 30, 2017Part 1 of Item 1A of our 2021 Annual Report and those set forth from time-to-time in other filings by the Company with the SEC. These documents are available through our website or through the SEC's Electronic Data Gathering and Analysis Retrieval (EDGAR) system at http://www.sec.gov.
Any forward-looking statements speak only as of the date of this Quarterly Report on Form 10-Q. The Company does not undertake any obligation to update any forward-looking statements, whether as a result of new information or developments, future events or otherwise, except as required by law. Readers are cautioned not to place undue reliance on any of these forward-looking statements.
Baker Hughes Holdings LLC 2022 Third Quarter Form 10-Q | 39
ITEM 3. QUANTITATIVE AND QUALITATIVE DISCLOSURES ABOUT MARKET RISK
We are exposed to certainFor quantitative and qualitative disclosures about market risks that are inherentrisk affecting us, see Item 7A. “Quantitative and Qualitative Disclosures about Market Risk,” in our financial instruments and arise from changes in interest rates and foreign currency exchange rates. We may enter into derivative financial instrument transactions2021 Annual Report. Our exposure to manage or reduce market risk but dohas not enter into derivative financial instrument transactions for speculative purposes. (See "Note 12. Financial Instruments" in Item 1 of Part 1 for further details). A discussion of our primary market risk exposure in financial instruments is presented below.changed materially since December 31, 2021.
Foreign currency exchange risk
We conduct our operations around the world in a number of different currencies, and we are exposed to market risks resulting from fluctuations in foreign currency exchange rates. Many of our significant foreign subsidiaries have designated the local currency as their functional currency. As such, future earnings are subject to change due to fluctuations in foreign currency exchange rates when transactions are denominated in currencies other than our functional currencies.
Additionally, we buy, manufacture and sell components and products across global markets. These activities expose us to changes in foreign currency exchange rates, commodity prices and interest rates which can adversely affect revenues earned and costs of its operating businesses. When the currency in which equipment is sold differs from the primary currency of the legal entity and the exchange rate fluctuates, it will affect the revenue earned on the sale. These sales and purchase transactions also create receivables and payables denominated in foreign currencies and exposure to foreign currency gains and losses based on changes in exchange rates. Changes in the price of raw materials used in manufacturing can affect the cost of manufacturing. We use derivatives to mitigate or eliminate these exposures, where appropriate.
We use cash flow hedging primarily to reduce or eliminate the effects of foreign currency exchange rate changes on purchase and sale contracts. Accordingly, most derivative activity in this category consists of currency exchange contracts. We had outstanding foreign currency forward contracts with notional amounts aggregating $11,476 million to hedge exposure to currency fluctuations in various foreign currencies at September 30, 2017. Based on quoted market prices as of September 30, 2017 or 2016 for forward contracts with similar terms and maturity dates, we recorded gains/(losses), both realized and unrealized in nature, of $59 million and ($127 million), respectively, to adjust these forward contracts to their fair market value.
Interest rate risk
We have debt in fixed and floating rate instruments. We are subject to interest rate risk on our debt and investment portfolio. We maintain an interest rate risk management strategy which primarily uses a mix of fixed and variable rate debt that is intended to mitigate the risk exposure to changes in interest rates in the aggregate. We may use interest rate swaps to manage the economic effect of fixed rate obligations associated with certain debt. There were no outstanding interest rate swap agreements as of September 30, 2017 or 2016.
ITEM 4. CONTROLS AND PROCEDURES
Evaluation of disclosure controls and procedures
Our management, with the participation of our Chief Executive Officer and Chief Financial Officer, has evaluated the effectiveness of the design and operation of our disclosure controls and procedures (as defined in Rule 15d-15(e) under the Exchange Act) as of the end of the period covered by this report. Based upon that evaluation, the Chief Executive Officer and Chief Financial Officer have concluded that, as of the end of the period covered by this quarterly report, our disclosure controls and procedures (as defined in Rule 15d-15(e) of the Exchange Act) were effective at a reasonable assurance level.
There has been no change in our internal controls over financial reporting during the quarter ended September 30, 20172022 that has materially affected, or is reasonably likely to materially affect, our internal controls over financial reporting.
Change of Independent Registered Public Accounting FirmBaker Hughes Holdings LLC 2022 Third Quarter Form 10-Q | 40
In connection with the consummation of the Transactions, on July 3, 2017, the Audit Committee approved the engagement of KPMG LLP (KPMG) as the Company's independent registered public accountants to audit the financial statements of the Company and its consolidated subsidiaries for the period beginning July 3, 2017 and ending on December 31, 2017, such engagement to be effective on July 28, 2017. Deloitte was the independent auditor that audited Baker Hughes' financial statements for the fiscal years ended December 31, 2016 and 2015 and the subsequent interim period from January 1, 2017 through July 3, 2017.
PART II - OTHER INFORMATION
ITEM 1. LEGAL PROCEEDINGS
See discussion of legal proceedings in "Note 15. Commitments And Contingencies" of the Notes to Unaudited Condensed Consolidated and Combined Financial Statements in this Quarterly Report, Item 3 of Part I of our 2021 Annual Report and Note 17 of the Notes to Consolidated Financial Statements included in Item 8 of our 2021 Annual Report.
ITEM 1A. RISK FACTORS
The Company is subject to those risk factors set forth under the caption "Risk Factors" in the Prospectus that is partAs of the Registration Statement on Form S-4 (File No. 333-216991), as amended, filed with the SEC bydate of this filing, the Company and declared effectiveits operations continue to be subject to the risk factors previously discussed in the "Risk Factors" sections contained in the 2021 Annual Report and our Quarterly Report on May 30, 2017.Form 10-Q for the quarter ended March 31, 2022.
ITEM 2. UNREGISTERED SALES OF EQUITY SECURITIES AND USE OF PROCEEDS
None.
None
ITEM 3. DEFAULTS UPON SENIOR SECURITIES
None.
ITEM 4. MINE SAFETY DISCLOSURES
Our barite mining operations, in support of our drilling fluids products and services business, are subject to regulation by the federal Mine Safety and Health Administration under the Federal Mine Safety and Health Act of 1977. We have no mine safety violations or other regulatory matters required by Section 1503(a) of the Dodd-Frank Wall Street Reform and Consumer Protection Act and Item 104 of Regulation S-K to report for the current quarter.
ITEM 5. OTHER INFORMATION
None.
ITEM 6. EXHIBITS
Each exhibit identified below is filed as a part of this report. Exhibits designated with an "*" are filed as an exhibit to this Quarterly Report on Form 10-Q and Exhibits designated with an "**" are furnished as an exhibit to this Quarterly Report on Form 10-Q. Exhibits designated with ana "+" are identified as management contracts or compensatory plans or arrangements.
Exhibits previously filed are incorporated by reference. | | | | | | | | |
| | |
| | |
| | |
| | |
| | |
| | |
| | |
| | |
| | |
101.INS* | | |
| 101.INS* | | XBRL Instance Document - the instance document does not appear in the Interactive Data File because its XBRL tags are embedded within the Inline XBRL document. |
| 101.SCH* | | XBRL Schema Document |
| 101.CAL* | | XBRL Calculation Linkbase Document |
101.LAB*101.DEF* | | XBRL Definition Linkbase Document |
| 101.LAB* | | XBRL Label Linkbase Document |
| 101.PRE* | | XBRL Presentation Linkbase Document |
101.DEF* | | XBRL Definition Linkbase Document |
Baker Hughes Holdings LLC 2022 Third Quarter Form 10-Q | 41
SIGNATURES
Pursuant to the requirements of the Securities Exchange Act of 1934, the registrant has duly caused this report to be signed on its behalf by the undersigned thereunto duly authorized.
| | | | | | | | | | | |
| | Baker Hughes Holdings LLC
(Registrant) |
| | | |
| Date: | October 20, 2022 | Baker Hughes, a GE company, LLC (Registrant) |
| | | |
Date: | October 30, 2017 | By: | /s/ BRIAN WORRELL |
| | Brian Worrell |
| | Chief Financial Officer |
| | | |
| Date: | October 30, 201720, 2022 | By: | /s/ KURT CAMILLERI |
| | Kurt Camilleri |
| | Senior Vice President, Controller and Chief Accounting Officer |
Baker Hughes Holdings LLC 2022 Third Quarter Form 10-Q | 42