UNITED STATES SECURITIES AND EXCHANGE COMMISSION
Washington, D.C. 20549
Form 10-Q
|
| | | |
| þ | | Quarterly Report pursuant to Section 13 or 15(d) of the Securities Exchange Act of 1934 for the quarterly period ended May 31,November 30, 2017. |
| or |
| o | | Transition Report pursuant to Section 13 or 15(d) of the Securities Exchange Act of 1934 for the transition period from to |
Commission file number: 001-36079
CHS Inc.
(Exact name of registrant as specified in its charter)
|
| | |
Minnesota (State or other jurisdiction of incorporation or organization) | | 41-0251095 (I.R.S. Employer Identification Number) |
| | | |
5500 Cenex Drive Inver Grove Heights, Minnesota 55077 (Address of principal executive offices, including zip code) | | (651) 355-6000 (Registrant’s telephone number, including area code) |
Indicate by check mark whether the Registrant (1) has filed all reports required to be filed by Section 13 or 15(d) of the Securities Exchange Act of 1934 during the preceding 12 months (or for such shorter period that the registrant was required to file such reports), and (2) has been subject to such filing requirements for the past 90 days.
YES þ NO o
Indicate by check mark whether the Registrant has submitted electronically and posted on its corporate website, if any, every Interactive Data File required to be submitted and posted pursuant to Rule 405 of Regulation S-T (§232.405 of this chapter) during the preceding 12 months (or for such shorter period that the Registrant was required to submit and post such files).
YES þ NO o
Indicate by check mark whether the Registrant is a large accelerated filer, an accelerated filer, a non-accelerated filer, smaller reporting company, or an emerging growth company. See the definitions of “large accelerated filer,” “accelerated filer,” “smaller reporting company,” and "emerging growth company" in Rule 12b-2 of the Exchange Act.
|
| | | | |
Large accelerated filer o | Accelerated filer o | Non-accelerated filer þ | Smaller reporting company o | Emerging growth company o |
| | | (Do not check if a smaller reporting company) | | |
If an emerging growth company, indicate by check mark if the Registrant has elected not to use the extended transition period for complying with any new or revised financial accounting standards provided pursuant to Section 13(a) of the Exchange Act. o
Indicate by check mark whether the Registrant is a shell company (as defined in Rule 12b-2 of the Exchange Act).
YES o NO þ
Indicate the number of shares outstanding of each of the Registrant’s classes of common stock, as of the latest practicable date: The Registrant has no common stock outstanding.
INDEX
Unless the context otherwise requires, for purposes of this Quarterly Report on Form 10-Q, the words “we,” “us,” “our,” the “Company” and “CHS” refer to CHS Inc., a Minnesota cooperative corporation, and its subsidiaries as of May 31,November 30, 2017.
FORWARD-LOOKING STATEMENTS
This Quarterly Report on Form 10-Q contains and our other publicly available documents may contain, and our officers, directors and other representatives may from time to time make, "forward-looking statements" within the meaning of the safe harbor provisions of the U.S. Private Securities Litigation Reform Act of 1995. Forward-looking statements can be identified by words such as "anticipate," "intend," "plan," "goal," "seek," "believe," "project," "estimate," "expect," "strategy," "future," "likely," "may," "should," "will" and similar references to future periods. Forward-looking statements are neither historical facts nor assurances of future performance. Instead, they are based only on our current beliefs, expectations and assumptions regarding the future of our businesses, financial condition and results of operations, future plans and strategies, projections, anticipated events and trends, the economy and other future conditions. Because forward-looking statements relate to the future, they are subject to inherent uncertainties, risks and changes in circumstances that are difficult to predict and many of which are outside of our control. Our actual results and financial condition may differ materially from those indicated in the forward-looking statements. Therefore, you should not place undue reliance on any of these forward-looking statements. Important factors that could cause our actual results and financial condition to differ materially from those indicated in the forward-looking statements are discussed or identified in our public filings made with the U.S. Securities and Exchange Commission ("SEC"), including in the "Risk Factors" discussion in Item 1A of our Annual Report on Form 10-K for the year ended August 31, 2016.2017. Any forward-looking statements made by us in this Quarterly Report on Form 10-Q are based only on information currently available to us and speak only as of the date on which the statement is made. We undertake no obligation to publicly update any forward-looking statement, whether written or oral, that may be made from time to time, whether as a result of new information, future developments or otherwise, except as required by applicable law.
PART I. FINANCIAL INFORMATION
ITEM 1. FINANCIAL STATEMENTS
CHS INC. AND SUBSIDIARIES
CONSOLIDATED BALANCE SHEETS
(Unaudited)
| | | | May 31,
2017 | | August 31,
2016 | November 30,
2017 | | August 31,
2017 |
| | (Dollars in thousands) | (Dollars in thousands) |
| ASSETS | | | | | | |
| Current assets: | |
| |
|
| |
| |
|
|
| Cash and cash equivalents | $ | 267,229 |
| | $ | 279,313 |
| $ | 252,129 |
| | $ | 181,379 |
|
| Receivables | 2,722,325 |
| | 2,880,763 |
| 2,059,623 |
| | 1,869,632 |
|
| Inventories | 2,684,087 |
| | 2,370,699 |
| 3,046,101 |
| | 2,576,585 |
|
| Derivative assets | 388,188 |
| | 543,821 |
| 283,256 |
| | 232,017 |
|
| Margin deposits | 251,695 |
| | 310,276 |
| 206,955 |
| | 206,062 |
|
| Supplier advance payments | 431,433 |
| | 347,600 |
| 542,139 |
| | 249,234 |
|
| Other current assets | 255,236 |
| | 202,708 |
| 289,250 |
| | 299,618 |
|
| Total current assets | 7,000,193 |
| | 6,935,180 |
| 6,679,453 |
| | 5,614,527 |
|
| Investments | 3,841,749 |
| | 3,795,976 |
| 3,777,000 |
| | 3,750,993 |
|
| Property, plant and equipment | 5,409,151 |
| | 5,488,323 |
| 5,266,408 |
| | 5,356,434 |
|
| Other assets | 970,704 |
| | 1,092,656 |
| 1,061,562 |
| | 1,251,802 |
|
| Total assets | $ | 17,221,797 |
| | $ | 17,312,135 |
| $ | 16,784,423 |
| | $ | 15,973,756 |
|
| LIABILITIES AND EQUITIES | | | | | | |
| Current liabilities: | |
| | |
| |
| | |
|
| Notes payable | $ | 3,321,808 |
| | $ | 2,731,479 |
| $ | 2,480,264 |
| | $ | 1,988,215 |
|
| Current portion of long-term debt | 193,096 |
| | 214,329 |
| 71,022 |
| | 156,345 |
|
| Customer margin deposits and credit balances | 132,479 |
| | 208,991 |
| 139,868 |
| | 157,914 |
|
| Customer advance payments | 390,576 |
| | 412,823 |
| 414,441 |
| | 413,163 |
|
| Accounts payable | 1,809,868 |
| | 1,819,049 |
| 2,380,998 |
| | 1,951,292 |
|
| Derivative liabilities | 284,212 |
| | 513,599 |
| 226,279 |
| | 316,018 |
|
| Accrued expenses | 422,371 |
| | 422,494 |
| 409,522 |
| | 437,527 |
|
| Dividends and equities payable | 134,718 |
| | 198,031 |
| 121,209 |
| | 12,121 |
|
| Total current liabilities | 6,689,128 |
| | 6,520,795 |
| 6,243,603 |
| | 5,432,595 |
|
| Long-term debt | 2,046,264 |
| | 2,082,876 |
| 1,936,744 |
| | 2,023,448 |
|
| Long-term deferred tax liabilities | 350,966 |
| | 487,762 |
| 350,841 |
| | 333,221 |
|
| Other liabilities | 276,483 |
| | 354,452 |
| 315,460 |
| | 278,667 |
|
| Commitments and contingencies |
|
| |
|
| |
| Commitments and contingencies (Note 12) | |
|
| |
|
|
| Equities: | |
| | |
| |
| | |
|
| Preferred stock | 2,264,063 |
| | 2,244,132 |
| 2,264,038 |
| | 2,264,038 |
|
| Equity certificates | 4,214,657 |
| | 4,237,174 |
| 4,319,840 |
| | 4,341,649 |
|
| Accumulated other comprehensive loss | (209,700 | ) | | (211,726 | ) | (178,445 | ) | | (183,670 | ) |
| Capital reserves | 1,577,469 |
| | 1,582,380 |
| 1,520,218 |
| | 1,471,217 |
|
| Total CHS Inc. equities | 7,846,489 |
| | 7,851,960 |
| 7,925,651 |
| | 7,893,234 |
|
| Noncontrolling interests | 12,467 |
| | 14,290 |
| 12,124 |
| | 12,591 |
|
| Total equities | 7,858,956 |
| | 7,866,250 |
| 7,937,775 |
| | 7,905,825 |
|
| Total liabilities and equities | $ | 17,221,797 |
| | $ | 17,312,135 |
| $ | 16,784,423 |
| | $ | 15,973,756 |
|
The accompanying notes are an integral part of the consolidated financial statements (unaudited).
CHS INC. AND SUBSIDIARIES
CONSOLIDATED STATEMENTS OF OPERATIONS
(Unaudited)
| | | | For the Three Months Ended
May 31, | | For the Nine Months Ended
May 31, | For the Three Months Ended
November 30, |
| | 2017 | | 2016 | | 2017 | | 2016 | 2017 | | 2016 |
| | (Dollars in thousands) | (Dollars in thousands) |
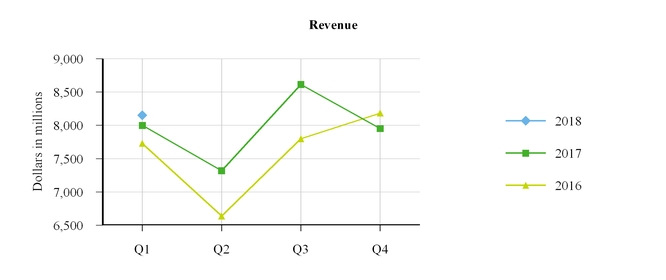
| Revenues | $ | 8,614,090 |
| | $ | 7,796,588 |
| | $ | 23,982,746 |
| | $ | 22,164,710 |
| $ | 8,048,889 |
| | $ | 8,048,250 |
|
| Cost of goods sold | 8,366,988 |
| | 7,479,076 |
| | 23,142,205 |
| | 21,346,376 |
| 7,735,627 |
| | 7,695,553 |
|
| Gross profit | 247,102 |
| | 317,512 |
| | 840,541 |
| | 818,334 |
| 313,262 |
| | 352,697 |
|
| Marketing, general and administrative | 153,498 |
| | 143,436 |
| | 459,831 |
| | 468,394 |
| 140,168 |
| | 147,849 |
|
| Reserve and impairment charges | 323,901 |
| | 26,016 |
| | 414,009 |
| | 33,869 |
| |
| Reserve and impairment charges (recoveries), net | | (3,787 | ) | | 18,357 |
|
| Operating earnings (loss) | (230,297 | ) | | 148,060 |
| | (33,299 | ) | | 316,071 |
| 176,881 |
| | 186,491 |
|
| (Gain) loss on investments | (393 | ) | | (700 | ) | | 4,226 |
| | (9,422 | ) | (2,819 | ) | | 7,401 |
|
| Interest expense | 39,201 |
| | 37,466 |
| | 117,411 |
| | 71,553 |
| 40,702 |
| | 38,265 |
|
| Other income | (11,554 | ) | | (10,774 | ) | | (70,409 | ) | | (22,155 | ) | |
| Other (income) loss | | (22,195 | ) | | (44,401 | ) |
| Equity (income) loss from investments | (48,393 | ) | | (72,453 | ) | | (124,521 | ) | | (131,819 | ) | (38,362 | ) | | (40,328 | ) |
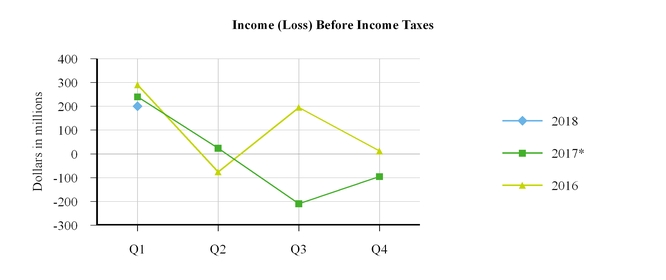
| Income (loss) before income taxes | (209,158 | ) | | 194,521 |
| | 39,994 |
| | 407,914 |
| 199,555 |
| | 225,554 |
|
| Income tax expense (benefit) | (163,018 | ) | | 4,838 |
| | (137,781 | ) | | (17,761 | ) | 19,936 |
| | 16,612 |
|
| Net income (loss) | (46,140 | ) | | 189,683 |
| | 177,775 |
| | 425,675 |
| 179,619 |
| | 208,942 |
|
| Net income (loss) attributable to noncontrolling interests | (955 | ) | | (592 | ) | | (757 | ) | | (92 | ) | (464 | ) | | (208 | ) |
| Net income (loss) attributable to CHS Inc. | $ | (45,185 | ) | | $ | 190,275 |
| | $ | 178,532 |
| | $ | 425,767 |
| $ | 180,083 |
| | $ | 209,150 |
|
The accompanying notes are an integral part of the consolidated financial statements (unaudited).
CHS INC. AND SUBSIDIARIES
CONSOLIDATED STATEMENTS OF COMPREHENSIVE INCOME
(Unaudited)
| | | | For the Three Months Ended
May 31, | | For the Nine Months Ended
May 31, | For the Three Months Ended
November 30, |
| | 2017 | | 2016 | | 2017 | | 2016 | 2017 | | 2016 |
| | (Dollars in thousands) | (Dollars in thousands) |
| Net income (loss) | $ | (46,140 | ) | | $ | 189,683 |
| | $ | 177,775 |
| | $ | 425,675 |
| $ | 179,619 |
| | $ | 208,942 |
|
| Other comprehensive income (loss), net of tax: | | | | | | | | | | |
| Postretirement benefit plan activity, net of tax expense (benefit) of $2,257, $2,122, $6,580 and $5,911, respectively | 3,635 |
| | 3,378 |
| | 10,599 |
| | 9,806 |
| |
| Unrealized net gain (loss) on available for sale investments, net of tax expense (benefit) of $(72), $744, $1,010 and $303, respectively | (117 | ) | | 1,201 |
| | 1,627 |
| | 462 |
| |
| Cash flow hedges, net of tax expense (benefit) of $233, $1,595, $1,238 and $(2,456), respectively | 375 |
| | 2,574 |
| | 1,993 |
| | (3,945 | ) | |
| Foreign currency translation adjustment, net of tax expense (benefit) of $(334), $0, $(329) and $0, respectively | (2,151 | ) | | 7,761 |
| | (12,193 | ) | | (5,910 | ) | |
| Postretirement benefit plan activity, net of tax expense (benefit) of $2,620 and $2,011, respectively | | 4,196 |
| | 3,239 |
|
| Unrealized net gain (loss) on available for sale investments, net of tax expense (benefit) of $404 and $482, respectively | | 3,640 |
| | 777 |
|
| Cash flow hedges, net of tax expense (benefit) of $(2) and $406, respectively | | (4 | ) | | 654 |
|
| Foreign currency translation adjustment, net of tax expense (benefit) of $(443) and $(209), respectively | | (2,607 | ) | | (19,164 | ) |
| Other comprehensive income (loss), net of tax | 1,742 |
| | 14,914 |
| | 2,026 |
| | 413 |
| 5,225 |
| | (14,494 | ) |
| Comprehensive income (loss) | (44,398 | ) | | 204,597 |
| | 179,801 |
| | 426,088 |
| 184,844 |
| | 194,448 |
|
| Less: comprehensive income (loss) attributable to noncontrolling interests | (955 | ) | | (592 | ) | | (757 | ) | | (92 | ) | (464 | ) | | (208 | ) |
| Comprehensive income (loss) attributable to CHS Inc. | $ | (43,443 | ) | | $ | 205,189 |
| | $ | 180,558 |
| | $ | 426,180 |
| $ | 185,308 |
| | $ | 194,656 |
|
The accompanying notes are an integral part of the consolidated financial statements (unaudited).
CHS INC. AND SUBSIDIARIES
CONSOLIDATED STATEMENTS OF CASH FLOWS
(Unaudited)
| | | | For the Nine Months Ended May 31, | For the Three Months Ended November 30, |
| | 2017 | | 2016 | 2017 | | 2016 |
| | (Dollars in thousands) | (Dollars in thousands) |
| Cash flows from operating activities: | |
| | |
| |
| | |
|
| Net income | $ | 177,775 |
| | $ | 425,675 |
| |
| Net income (loss) | | $ | 179,619 |
| | $ | 208,942 |
|
| Adjustments to reconcile net income to net cash provided by (used in) operating activities: | |
| | |
| |
| | |
|
| Depreciation and amortization | 362,118 |
| | 324,952 |
| 120,148 |
| | 121,372 |
|
| Amortization of deferred major repair costs | 50,565 |
| | 55,074 |
| 16,418 |
| | 18,302 |
|
| (Income) loss from equity investments | (124,521 | ) | | (131,819 | ) | |
| Equity (income) loss from investments | | (38,362 | ) | | (40,328 | ) |
| Distributions from equity investments | | 12,514 |
| | 16,393 |
|
| Provision for doubtful accounts | 198,304 |
| | 33,869 |
| (3,601 | ) | | 27,812 |
|
| Distributions from equity investments | 105,558 |
| | 75,435 |
| |
| Unrealized (gain) loss on crack spread contingent liability | (13,273 | ) | | (51,321 | ) | |
| Long-lived asset impairment | 85,431 |
| | 14,428 |
| |
| Reserve against supplier advance payments | 130,705 |
| | — |
| |
| Deferred taxes | (145,357 | ) | | (16,356 | ) | 15,044 |
| | 6,199 |
|
| Other, net | 25,559 |
| | (23,414 | ) | 2,976 |
| | 6,093 |
|
| Changes in operating assets and liabilities, net of acquisitions: | |
| | |
| |
| | |
|
| Receivables | (55,498 | ) | | 120,613 |
| (80,637 | ) | | (16,555 | ) |
| Inventories | (344,914 | ) | | (164,652 | ) | (472,180 | ) | | (754,253 | ) |
| Derivative assets | 120,294 |
| | (65,651 | ) | 67,365 |
| | 110,306 |
|
| Margin deposits | 58,581 |
| | (23,988 | ) | (893 | ) | | (2,623 | ) |
| Supplier advance payments | (214,538 | ) | | (208,679 | ) | (292,905 | ) | | (133,109 | ) |
| Other current assets and other assets | 19,289 |
| | 91,095 |
| 2,689 |
| | 12,082 |
|
| Customer margin deposits and credit balances | (76,355 | ) | | 2,657 |
| (18,045 | ) | | (28,141 | ) |
| Customer advance payments | (23,700 | ) | | (54,136 | ) | 1,278 |
| | 131,444 |
|
| Accounts payable and accrued expenses | 152,094 |
| | (72,161 | ) | 441,071 |
| | 743,427 |
|
| Derivative liabilities | (229,881 | ) | | 9,315 |
| (97,329 | ) | | (195,545 | ) |
| Other liabilities | (53,471 | ) | | (78,511 | ) | 4,376 |
| | 6,599 |
|
| Net cash provided by (used in) operating activities | 204,765 |
| | 262,425 |
| (140,454 | ) | | 238,417 |
|
| Cash flows from investing activities: | |
| | |
| |
| | |
|
| Acquisition of property, plant and equipment | (298,015 | ) | | (557,689 | ) | (85,824 | ) | | (116,986 | ) |
| Proceeds from disposition of property, plant and equipment | 17,702 |
| | 7,023 |
| 56,079 |
| | 2,574 |
|
| Proceeds from sale of business | | 29,457 |
| | — |
|
| Expenditures for major repairs | (1,146 | ) | | (19,338 | ) | (1,039 | ) | | (239 | ) |
| Investments in joint ventures and other | (13,853 | ) | | (2,833,968 | ) | |
| Investments redeemed | 7,698 |
| | 24,912 |
| 5,195 |
| | — |
|
| Proceeds from sale of investments | 6,170 |
| | 19,477 |
| |
| Changes in CHS Capital notes receivable, net | (104,773 | ) | | (230,874 | ) | (69,227 | ) | | (218,296 | ) |
| Financing extended to customers | (57,783 | ) | | (31,681 | ) | (15,778 | ) | | (14,353 | ) |
| Payments from customer financing | 67,126 |
| | 23,005 |
| 16,520 |
| | 21,523 |
|
| Business acquisitions, net of cash acquired | (2,253 | ) | | (10,139 | ) | |
| Other investing activities, net | 4,975 |
| | 4,911 |
| 1,847 |
| | (1,245 | ) |
| Net cash provided by (used in) investing activities | (374,152 | ) | | (3,604,361 | ) | (62,770 | ) | | (327,022 | ) |
| Cash flows from financing activities: | |
| | |
| |
| | |
|
| Proceeds from lines of credit and long-term borrowings | 29,890,570 |
| | 21,377,619 |
| 8,006,980 |
| | 10,300,476 |
|
| Payments on lines of credit, long term-debt and capital lease obligations | (29,362,970 | ) | | (18,090,681 | ) | (7,657,713 | ) | | (9,936,369 | ) |
| Mandatorily redeemable noncontrolling interest payments | — |
| | (153,022 | ) | |
| Changes in checks and drafts outstanding | (118,844 | ) | | 1,680 |
| (31,417 | ) | | 14,334 |
|
| Preferred stock dividends paid | (125,475 | ) | | (121,499 | ) | (42,167 | ) | | (41,825 | ) |
| Retirements of equities | (25,503 | ) | | (17,117 | ) | (3,682 | ) | | (9,528 | ) |
| Cash patronage dividends paid | (103,879 | ) | | (253,150 | ) | |
| Other financing activities, net | 1,539 |
| | (3,246 | ) | (263 | ) | | 384 |
|
| Net cash provided by (used in) financing activities | 155,438 |
| | 2,740,584 |
| 271,738 |
| | 327,472 |
|
| Effect of exchange rate changes on cash and cash equivalents | 1,865 |
| | (6,060 | ) | 2,236 |
| | (2,696 | ) |
| Net increase (decrease) in cash and cash equivalents | (12,084 | ) | | (607,412 | ) | 70,750 |
| | 236,171 |
|
| Cash and cash equivalents at beginning of period | 279,313 |
| | 953,813 |
| 181,379 |
| | 279,313 |
|
| Cash and cash equivalents at end of period | $ | 267,229 |
| | $ | 346,401 |
| $ | 252,129 |
| | $ | 515,484 |
|
The accompanying notes are an integral part of the consolidated financial statements (unaudited).
CHS INC. AND SUBSIDIARIES
NOTES TO CONSOLIDATED FINANCIAL STATEMENTS (Unaudited)
Note 1 Organization, Basis of Presentation and Significant Accounting Policies
Basis of Presentation
The unaudited Consolidated Balance Sheet as of May 31,November 30, 2017, the Consolidated Statements of Operations for the three and nine months ended May 31,November 30, 2017, and 2016, the Consolidated Statements of Comprehensive Income for the three and nine months ended May 31,November 30, 2017, and 2016, and the Consolidated Statements of Cash Flows for the ninethree months ended May 31,November 30, 2017, and 2016, reflect in the opinion of our management, all normal recurring adjustments necessary for a fair statement of the financial position, results of operations and cash flows for the interim periods presented. The results of operations and cash flows for interim periods are not necessarily indicative of results for a full fiscal year because of, among other things, the seasonal nature of our businesses. Our Consolidated Balance Sheet data as of August 31, 20162017, has been derived from our audited consolidated financial statements, but does not include all disclosures required by accounting principles generally accepted in the United States of America ("U.S. GAAP").
The Consolidated StatementsOver the course of Operations include a separate line called “Reserve and impairment charges” for the three and nine months ended May 31,fiscal year 2017, and 2016, duewe incurred charges relating to the materiality of certain charges incurred during the periods presented. The charges relate to reserves recorded as a result of a trading partner of ours in Brazil, enteringwhich entered into bankruptcybankruptcy-like proceedings under Brazilian law, intangible and fixed asset impairment charges associated with moving certain assets within our Ag segmentmeeting the criteria to be classified as held for sale, a fixed asset impairment charge relatedcharges due to an asset inthe cancellation of a capital project at one of our Energy segmentrefineries and all bad debt and loan loss reserve charges of which a significant portion relatesrelating to a single large producer borrowerborrower. Charges and impairments of this nature, as well as any recoveries related to amounts previously reserved, are included in the Consolidated Statements of Operations in the line item, "Reserve and impairment charges (recoveries), net" for the three months ended November 30, 2017, and 2016. The timing and amounts of these charges and impairments, and any recoveries were determined utilizing facts and circumstances that were present in the respective quarters in which the majority of chargescharge, impairments or recoveries were recorded in the first and second quarters of the current fiscal year.recorded. Prior year information has been revised to conform to the current year presentation. See additional information related to the reserves and impairment charges in Note 2, Receivables and Note 5, Goodwill and Other Intangible Assets.
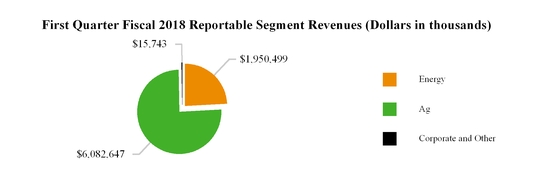
The notes to our consolidated financial statements make reference to our Energy, Ag, Nitrogen Production and Foods reportable segments, as well as our Corporate and Other category, which represents an aggregation of individually immaterial operating segments. The Nitrogen Production reportable segment resulted from our investment in CF Industries Nitrogen, LLC ("CF Nitrogen") in February 2016. The Foods segment resulted from our investment in Ventura Foods, LLC ("Ventura Foods") becoming a significant operating segment in fiscal 2016. See Note 10,9, Segment Reporting for more information.
Our consolidated financial statements include the accounts of CHS and all of our wholly owned and majority owned subsidiaries. The effects of all significant intercompany transactions have been eliminated.
These unaudited consolidated financial statements should be read in conjunction with the consolidated financial statements and notes thereto for the year ended August 31, 2016,2017, included in our Annual Report on Form 10-K, filed with the Securities and Exchange Commission (the "SEC").
Recent Accounting Pronouncements
Adopted
In January 2017,October 2016, the Financial Accounting Standards Board (the “FASB”("FASB") issued Accounting Standards Update ("ASU") No. 2017-04, Simplifying2016-16, Income Taxes - Intra-Entity Transfers of Assets Other Than Inventory (Topic 740). This ASU is intended to improve the Testaccounting for Goodwill Impairment. The amendments within this ASU eliminate Step 2the income tax consequences of the goodwill impairment test, which requiresintra-entity transfers of assets other than inventory by requiring an entity to determine goodwill impairment by calculatingrecognize the implied fair valueincome tax consequences when a transfer occurs, instead of goodwill by hypothetically assigningwhen an asset is sold to an outside party. This ASU is effective for periods beginning after December 15, 2017; however, early adoption of this ASU is permitted during the fair value offirst interim period if an entity issues interim financial statements and the amendments in this ASU should be applied on a reporting unitmodified retrospective basis through a cumulative-effect adjustment directly to all of its assets and liabilitiesretained earnings as if that reporting unit had been acquired in a business combination. Under the amended standard, goodwill impairment is instead measured using Step 1 of the goodwill impairment test with goodwill impairment being equal tobeginning of the amount by which a reporting unit’s carrying value exceeds its fair value, not to exceed the carrying valueperiod of goodwill.adoption. We elected to early adopt ASU No. 2017-042016-16 during the secondfirst quarter of fiscal 2017.2018. The amendmentsadoption did not have been applied to the annual goodwill impairment testing performed as of May 31, 2017, and will be applied prospectively to all future goodwill impairment tests performeda material impact on an interim or annual basis.our consolidated financial statements.
Not Yet Adopted
In April 2015,August 2017, the FASB issued ASU No. 2015-03, Interest-Imputation of Interest (Subtopic 835-30): Simplifying the Presentation of Debt Issuance Costs2017-12, which simplifiesDerivatives and Hedging (Topic 815): Targeted Improvements to Accounting for Hedging Activities. This ASU is intended to improve the financial reporting of hedging relationships to better represent the economic results of an entity’s risk management activities in its financial statements and make certain improvements to simplify the application of the hedge accounting guidance. The amendments in this ASU will make more financial and nonfinancial hedging strategies eligible for hedge accounting, amend the presentation and disclosure requirements and change how entities assess effectiveness. Entities are required to apply this ASU's provisions as a cumulative-effect adjustment to retained earnings as of debt issuance costs.the beginning of the first reporting period in which the guidance is adopted. This ASU requires the presentation of debt issuance costs on the balance sheet as a deduction from the carrying amount of the related debt liability instead of a deferred financing cost. This ASU wasis effective for us beginning September 1, 2016,2019, for our fiscal year 20172020 and for interim periods within that fiscal year. As a result, $5.6 million of deferred issuance costs related to private placement debt and bank financingWe are currently evaluating the impact the adoption will have been reclassified from other assets to long-term debt as of August 31, 2016.
In August 2015, the FASB issued ASU No. 2015-15, Interest-Imputation of Interest (Subtopic 835-30): Presentation and Subsequent Measurement of Debt Issuance Costs Associated with Line-of-Credit Arrangements, which codifies an SEC staff announcement that entities are permitted to defer and present debt issuance costs related to line of credit arrangements as assets. ASU No. 2015-15 was effective immediately. At August 31, 2016, we had unamortized deferred financing costs related toon our line of credit arrangements, and we will continue to present debt issuance costs related to line of credit arrangements as an asset in our Consolidated Balance Sheets.consolidated financial statements.
Not Yet Adopted
In March 2017, the FASB issued ASU No. 2017-07, Compensation - Retirement Benefits (Topic 715): Improving the Presentation of Net Periodic Pension Costs and Net Postretirement Benefit Cost. This ASU is intended to improvechanges the presentation of net periodic pension cost and net periodic postretirement benefit cost.cost in the income statement. This ASU requires that the service cost component should be included in the same income statement line item as other compensation costs arising from services rendered by the employees during the period. The other components of net periodic benefit cost should be presented in the income statement separately outside of operating income if that subtotal is presented. Additionally, only service cost may be capitalized in assets. This ASU is effective for us beginning September 1, 2018, for our fiscal year 2019 and for interim periods within that fiscal year. Early adoption is permitted asThe guidance on the presentation of the beginningcomponents of an annual period for which interim financial statementsnet periodic benefit cost in the income statement should be applied retrospectively and the guidance regarding the capitalization of the service cost component in assets should be applied prospectively. The adoption of this amended guidance is not expected to have not been issued or made available for issuance. We are currently evaluating thea material impact the adoption will have on our consolidated financial statements.
In January 2017, the FASB issued ASU No. 2017-01, Business Combinations (Topic 805): Clarifying the Definition of a Business. The amendments within this ASU narrow the existing definition of a business and provide a more robust framework for evaluating whether a transaction should be accounted for as an acquisition (or disposal) of assets or a business. The definition of a business impacts various areas of accounting, including acquisitions, disposals and goodwill. Under the new guidance, fewer acquisitions are expected to be considered businesses. This ASU is effective for us beginning September 1, 2018, for our fiscal year 2019 and for interim periods within that fiscal year. Early adoption is permitted and the guidance should be applied prospectively to transactions following the adoption date. We are currently evaluating theThe adoption of this amended guidance is not expected to have a material impact the adoption will have on our consolidated financial statements.
In November 2016, the FASB issued ASU No. 2016-18, Statement of Cash Flows (Topic 230): Restricted Cash. This ASU is intended to reduce diversity in practice by adding or clarifying guidance on classification and presentation of changes in restricted cash on the statement of cash flows. This ASU is effective for us beginning September 1, 2018, for our fiscal year 2019 and for interim periods within that fiscal year. Early adoption is permitted, including in an interim period. The amendments in this ASU should be applied retrospectively to all periods presented. We are currently evaluating theThe adoption of this amended guidance is not expected to have a material impact the adoption will have on our consolidated financial statements.
In October 2016, the FASB issued ASU No. 2016-16, Income Taxes - Intra-Entity Transfersstatement of Assets Other Than Inventory (Topic 740). This ASU is intended to improve the accounting for the income tax consequences of intra-entity transfers of assets other than inventory by requiring an entity to recognize the income tax consequences when a transfer occurs, instead of when an asset is sold to an outside party. The amendments in this ASU should be applied on a modified retrospective basis through a cumulative-effect adjustment directly to retained earnings as of the beginning of the period of adoption. This ASU is effective for us beginning September 1, 2018, for our fiscal year 2019 and for interim periods within that fiscal year. Early adoption is permitted as of the beginning of an annual reporting period for which interim or annual financial statements have not been issued. We are currently evaluating the impact the adoption will have on our consolidated financial statements.cash flows.
In August 2016, the FASB issued ASU No. 2016-15, Statement of Cash Flows (Topic 230): Classification of Certain Cash Receipts and Cash Payments. This ASU is intended to reduce existing diversity in practice in how certain cash receipts and payments are presented and classified in the statement of cash flows. This ASU is effective for us beginning September 1, 2018, for our fiscal year 2019 and for interim periods within that fiscal year. EarlyThe adoption of this amended guidance is permitted, including in an interim period. We are currently evaluating thenot expected to have a material impact the adoption will have on our consolidated financial statements.statement of cash flows.
In June 2016, the FASB issued ASU No. 2016-13, Financial Instruments - Credit Losses (Topic 326): Measurement of Credit Losses on Financial Instruments. The amendments in this ASU introduce a new approach, based on expected losses, to estimate credit losses on certain types of financial instruments. This ASU is intended to provide financial statement users with more decision-useful information about the expected credit losses associated with most financial assets measured at amortized
cost and certain other instruments, including trade and other receivables, loans, held-to-maturity debt securities, net investments in leases, and off-balance-sheet credit exposures. Entities are required to apply the standard’sthis ASU’s provisions as a cumulative-effect adjustment to retained earnings as of the beginning of the first reporting period in which the guidance is adopted. This ASU is effective for us beginning September 1, 2020, for our fiscal year 2021 and for interim periods within that fiscal year. We are currently evaluating the impact the adoption will have on our consolidated financial statements.
In February 2016, the FASB issued ASU No. 2016-02, Leases (Topic(Topic 842), which replaces the existing guidance in Accounting Standards Codification ("ASC") 840 - Leases. The amendments within this ASU introduce a lessee model requiring
entities to recognize assets and liabilities for most leases, but continue recognizing the associated expenses in a manner similar to existing accounting guidance. This ASU does not make fundamental changes to existing lessor accounting; however, it does modify what constitutes a sales-type or direct financing lease and the related accounting, and aligns a number of the underlying principles with those of the new revenue standard, ASU No. 2014-09. The guidance also eliminates existing real estate-specific provisions and requires expanded qualitative and quantitative disclosures.Entities are required to apply the standard’s provisions using a modified retrospective approach at the beginning of the earliest comparative period presented in the year of adoption. This ASU is effective for us beginning September 1, 2019, for our fiscal year 2020 and for interim periods within that fiscal year.year, and the ASU’s provisions are required to be applied using a modified retrospective approach. We have initiated a preliminary assessment of the new lease standard, including the implementation of a new lease software that will improve the collection, maintenance, and aggregation of lease data necessary for the reporting and disclosure requirements under the new lease standard. One of the more significant changes arising from the new lease standard relates to a number of operating lease agreements not currently recognized on our Consolidated Balance Sheets. The new lease guidance will require these lease agreements to be recognized on the Consolidated Balance Sheets as a right-of-use asset along with a corresponding lease liability. As a result, our preliminary assessment indicates the provisions of ASU No. 2016-02 are currently evaluatingexpected to have a material impact on our Consolidated Balance Sheets. Although we expect the new lease guidance to have a material impact on our Consolidated Balance Sheets, we are continuing to evaluate the extent of potential impact the adoptionnew lease guidance will have on our consolidated financial statements.
In May 2014, the FASB issued ASU No. 2014-09, Revenue from Contracts with Customers. The amendments within this ASU, as well as within additional clarifying ASUs issued by the FASB, provide a single comprehensive model to be used in the accounting for revenue arising from contracts with customers and supersedes most current revenue recognition guidance, including industry-specific guidance. This ASUThe new revenue recognition guidance includes a five stepfive-step model for the recognition of revenue, including (1) identifying the contract with a customer, (2) identifying the performance obligations in the contract, (3) determining the transaction price, (4) allocating the transaction price to the performance obligations, and (5) recognizing revenue when (or as) an entity satisfies a performance obligation. This ASUThe new revenue recognition guidance also specifies the accounting for certain costs to obtain or fulfill a contract with a customer and requires expanded disclosures about the nature, amount, timing and uncertainty of revenue and cash flows arising from contracts with customers. In August 2015,We have completed an initial assessment of our revenue streams and do not believe that the FASB issued ASU No. 2015-14 delayingnew revenue recognition guidance will have a material impact on our consolidated financial statements. Certain revenue streams are expected to fall within the effective datescope of adoptionthe new revenue recognition guidance; however, a substantial portion of our revenue falls outside the scope of the new revenue recognition guidance and will continue to follow existing guidance, primarily ASC 815, Derivatives and Hedging. We are continuing to evaluate the impact of the new revenue recognition guidance, including potential changes to business practices and/or contractual terms for CHS to September 1, 2018. The FASB issued four subsequent ASUs in 2016 containing implementation guidancescope revenue streams, as well as the scope of expanded disclosures related to ASU No. 2014-09, including: ASU No. 2016-08, Revenue from Contracts with Customers (Topic 606): Principal versus Agent Considerations (ReportingRevenue Gross versus Net), which is intendedrevenue. We expect to improve the operabilitycomplete our final evaluation and understandabilityimplementation of the implementationnew revenue recognition guidance on principal versus agent considerations; ASU No. 2016-10, Revenue from Contracts with Customers (Topic 606): IdentifyingPerformance Obligations and Licensing,throughout fiscal 2018, which is intended to clarify two aspects of Topic 606: identifying performance obligations and the licensing implementation guidance; ASU No. 2016-12, Revenue from Contracts with Customers (Topic606): Narrow-Scope Improvements and Practical Expedients, which contains certain provision and practical expedients in response to identified implementation issues; and ASU No. 2016-20, Technical Corrections and Improvements to Topic 606, Revenue from Contracts with Customers, which contains certain corrections and clarifications to increase stakeholders’ awareness of the proposals and to expedite improvements. ASU No. 2014-09 permits the use of either a full or modified retrospective method upon adoption. Although early application as of the original date is permitted, we expectwill allow us to adopt ASU No. 2014-09 and the related ASUs on September 1, 2018, in the first quarter of fiscal 2019. We are continuing to evaluate2019, using the effect this guidance will have on our consolidated financial statements, including potential impacts on the timing of revenue recognition and additional information that may be necessary for expanded disclosures regarding revenue. We have completed an initial assessment of our revenue streams and are currently evaluating the quantitative and qualitative impacts of the new standard on our businesses. We expect to complete our evaluation by the end of fiscal 2017, which will allow us to select an adoption method and determine the impact that the new standard will have on our businesses.modified retrospective method.
Note 2 Receivables
| | | | May 31, 2017 | | August 31, 2016 | November 30, 2017 | | August 31, 2017 |
| | (Dollars in thousands) | (Dollars in thousands) |
| Trade accounts receivable | $ | 1,739,027 |
| | $ | 1,804,646 |
| $ | 1,329,887 |
| | $ | 1,234,500 |
|
| CHS Capital notes receivable | 766,731 |
| | 858,805 |
| 184,301 |
| | 164,807 |
|
| Deferred purchase price receivable | | 216,996 |
| | 202,947 |
|
| Other | 464,051 |
| | 380,956 |
| 556,275 |
| | 493,104 |
|
| | 2,969,809 |
| | 3,044,407 |
| 2,287,459 |
| | 2,095,358 |
|
| Less allowances and reserves | 247,484 |
| | 163,644 |
| 227,836 |
| | 225,726 |
|
| Total receivables | $ | 2,722,325 |
| | $ | 2,880,763 |
| $ | 2,059,623 |
| | $ | 1,869,632 |
|
Trade accounts receivable are initially recorded at a selling price, which approximates fair value, upon the sale of goods or services to customers. Subsequently, trade accounts receivable are carried at net realizable value, which includes an allowance for estimated uncollectible amounts. We calculate this allowance based on our history of write-offs, level of past due accounts, and our relationships with, and the economic status of, our customers.
CHS Capital
Notes Receivable
CHS Capital, LLC ("CHS Capital"), our wholly-owned subsidiary, has short-term notes receivable from commercial and producer borrowers. The short-term notes receivable have maturity terms of 12 months or less and are reported at their outstanding unpaid principal balances, adjusted for the allowance of loan losses, as CHS Capital has the intent and ability to hold the applicable loans for the foreseeable future or until maturity or pay-off. The carrying value of CHS Capital LLC ("CHS Capital") short-term notes receivable approximates fair value, given the notes' short duration and the use of market pricing adjusted for risk. Other receivables is comprised of certain other amounts recorded in the normal course of business, including receivables related to valued added taxes and production cost financing.
During the third quarter of fiscal 2017, a trading partner of ours in Brazil entered bankruptcy proceedings under Brazilian law, resulting in a $98.7 million increase to our accounts receivable reserve. We also recorded a reserve of approximately $130.7 million related to supplier advance payments held by this trading partner. We have initiated efforts to recover these losses; however, as such actions are in the early stages and are considered neither probable nor estimable, no recoveries have been recorded as of the date of this Quarterly Report on Form 10-Q.
CHS Capital has notes receivable from commercial and producer borrowers. The short-term notes receivable generally have terms of 12-14 months and are reported at their outstanding principal balances as CHS Capital has the ability and intent to hold these notes to maturity. The notes receivable from commercial borrowers are collateralized by various combinations of mortgages, personal property, accounts and notes receivable, inventories and assignments of certain regional cooperatives'cooperative’s capital stock. These loans are primarily originated in the states of Minnesota, Wisconsin and North Dakota. CHS Capital also has loans receivable from producer borrowers which are collateralized by various combinations of growing crops, livestock, inventories, accounts receivable, personal property and supplemental mortgages and are originated in the same states as the commercial notes with the addition of Michigan.
In addition to the short-term balances included in the table above, CHS Capital had long-term notes receivable, with durations of generally not more than 10 years, of $252.4totaling $14.8 million and $322.4$17.0 million as of May 31,at November 30, 2017, and August 31, 2016,2017, respectively. The long-term notes receivable are included in otherOther assets on our Consolidated Balance Sheets. As of May 31,November 30, 2017, and August 31, 2016,2017, the commercial notes represented 52%32% and 26%17%, respectively, and the producer notes represented 48%68% and 74%83%, respectively, of the total CHS Capital notes receivable. As of November 30, 2017, and August 31, 2016, a single producer borrower2017, CHS Capital had no third-party borrowers that accounted for 20%more than 10% of the total outstanding CHS Capital notes receivable. During the third quarter of fiscal 2017, CHS Capital concluded a transaction with the single producer borrower whereby CHS Capital obtained from the borrower title to approximately 14,000 acres of land and improvements that, prior to the transaction, was owned by the borrower and served as collateral for the outstanding loans to CHS Capital. The amount corresponding to the fair value of the land and improvements, approximately $139.0 million, was credited against the notes receivable from this single producer borrower. As a result of this arrangement, all remaining outstanding notes receivable balances and corresponding reserves related to this single producer borrower were removed from the balance sheet of CHS Capital. However, we continue to enforce our rights under the various agreements between us and the producer borrower to pursue future potential recoveries. The collateral received in connection with the arrangement has been recorded in “Property, plant and equipment” on the Consolidated Balance Sheet.outstanding.
CHS Capital evaluateshas commitments to extend credit to customers if there are no violations of any contractually established conditions. As of November 30, 2017, CHS Capital's customers have additional available credit of $529.4 million.
Allowance for Loan Losses and Impairments
CHS Capital maintains an allowance for loan losses which is the collectabilityestimate of both commercialpotential incurred losses inherent in the loans receivable portfolio. In accordance with FASB ASC 450-20, Accounting for Loss Contingencies, and producer notes onASC 310-10, Accounting by Creditors for Impairment of a Loan, the allowance for loan losses consists of general and specific identification basis, based on the amount and quality of the collateral obtained, and records specific loan loss reserves when appropriate. Acomponents. The general reservecomponent is also maintained based on historical loss experience and various qualitative factors. Further,factors addressing operational risks and industry trends. The specific component relates to loans receivable that are classified as impaired. Additions to the allowance for loan losses are reflected within reserve and impairment charges (recoveries), net in the Consolidated Statements of Operations. The portion of loans receivable deemed uncollectible is charged off against the allowance. Recoveries of previously charged off amounts increase the allowance for loan losses. The amount of CHS Capital notes that were past due was not significant at any reporting date presented.
Interest Income
Interest income is recognized on the accrual basis using a method that computes simple interest daily. The accrual of interest incomeon commercial loans receivable is discontinued at the time the commercial loan receivable is 90 days past due unless the credit is well-collateralized and in process of collection. Past due amounts were approximately 5.0% and 2.5%status is based on contractual terms of the totalloan. Producer loans receivable are placed in non-accrual status based on estimates and analysis due to the annual debt service terms inherent to CHS Capital notes outstanding asCapital’s producer loans. In all cases, loans are placed in nonaccrual status or charged off at an earlier date if collection of May 31, 2017, and August 31, 2016, respectively.principal or interest is considered doubtful.
SpecificSale of Receivables
Receivables Securitization Facility
On July 18, 2017, we amended an existing receivables and loans securitization facility (“Securitization Facility”) with certain unaffiliated financial institutions (the "Purchasers"). Under the Securitization Facility, we and certain of our subsidiaries sell trade accounts and notes receivable (the “Receivables”) to Cofina Funding, LLC (“Cofina”), a wholly-owned bankruptcy-remote indirect subsidiary of CHS. Cofina in turn sells the purchased Receivables in their entirety to the Purchasers. Prior to amending the Securitization Facility in July 2017, the transfer of Receivables was accounted for as a secured borrowing. Under the terms of the amended Securitization Facility CHS accounts for Receivables sold under the Facility as a sale of financial
assets pursuant to ASC 860, Transfers and Servicing and derecognizes the sold Receivables from its Consolidated Balance Sheets.
Sales of Receivables by Cofina occur continuously and are settled with the Purchasers on a monthly basis. The proceeds from the sale of these Receivables comprise a combination of cash and a deferred purchase price (“DPP”) receivable. The DPP receivable is ultimately realized by CHS following the collection of the underlying Receivables sold to the Purchasers. The amount available under the Securitization Facility fluctuates over time based on the total amount of eligible Receivables generated during the normal course of business, with maximum availability of $700.0 million. As of November 30, 2017, the total availability under the Securitization Facility was $700.0 million, of which all has been utilized. The Securitization Facility terminates on July 17, 2018, but may be extended. We use the proceeds from the sale of Receivables under the Securitization Facility for general loan loss reserves related to CHS Capital totaled $17.2 million and $45.8 million as of May 31, 2017, and August 31, 2016, respectively. The reductioncorporate purposes.
We have no retained interests in the reservetransferred Receivables, other than our right to the DPP receivable and collection and administrative services. The DPP receivable is substantially allrecorded at fair value within the Consolidated Balance Sheets, including a current portion within receivables and a long-term portion within other assets. Subsequent cash receipts related to the single producer borrower agreement discussedDPP receivable have been reflected as investing activities and additional sales of Receivables under the Securitization Facility are reflected in operating or investing activities, based on the underlying Receivable, in our Consolidated Statements of Cash Flows. Losses incurred on the sale of Receivables are recorded in interest expense and fees received related to the servicing of the Receivables are recorded in other income (loss) in the Consolidated Statements of Operations. We consider the fees received adequate compensation for services rendered, and accordingly have recorded no servicing asset or liability.
The fair value of the DPP receivable is determined by discounting the expected cash flows to be received based on unobservable inputs consisting of the face amount of the Receivables adjusted for anticipated credit losses. The DPP receivable is being measured like an investment in debt securities classified as available for sale, with changes to the fair value being recorded in other comprehensive income in accordance with ASC 320 - Investments - debt and equity securities. Our risk of loss following the transfer of Receivables under the Securitization Facility is limited to the DPP receivable outstanding and any short-falls in collections for specified non-credit related reasons after sale. Payment of the DPP receivable is not subject to significant risks other than delinquencies and credit losses on accounts receivable sold under the Securitization Facility.
The following table is a reconciliation of the beginning and ending balances of the DPP receivable for the quarter ended November 30, 2017:
|
| | | | |
| | | (Dollars in thousands) |
| Balance - as of August 31, 2017 | | $ | 548,602 |
|
| Monthly settlements, net | | (27,100 | ) |
| Balance - as of November 30, 2017 | | $ | 521,502 |
|
There was no DPP receivable as of November 30, 2016, and therefore, no comparative period is included in the table above.
CHS Capital has commitments
Other Receivables
Other receivables are comprised of certain other amounts recorded in the normal course of business, including receivables related to extend creditvalued added taxes and pre-crop financing, primarily to customers as long as there are no violationsBrazilian farmers, to finance a portion of supplier production costs. We do not bear any contractually established conditions. As of May 31, 2017, customersthe costs or operational risks associated with the related growing crops. The financing is largely collateralized by future crops and physical assets of CHS Capital had additional available credit of approximately $966.2 million.
the suppliers, carries a local market interest rate and settles when the farmer’s crop is harvested and sold.
| | | | May 31, 2017 | | August 31, 2016 | November 30, 2017 | | August 31, 2017 |
| | (Dollars in thousands) | (Dollars in thousands) |
| Grain and oilseed | $ | 1,171,408 |
| | $ | 937,258 |
| $ | 1,545,313 |
| | $ | 1,145,285 |
|
| Energy | 750,170 |
| | 729,695 |
| 720,938 |
| | 755,886 |
|
| Crop nutrients | 181,380 |
| | 217,521 |
| 222,053 |
| | 248,699 |
|
| Feed and farm supplies | 530,081 |
| | 417,431 |
| 483,805 |
| | 353,130 |
|
| Processed grain and oilseed | 27,991 |
| | 48,930 |
| 54,916 |
| | 49,723 |
|
| Other | 23,057 |
| | 19,864 |
| 19,076 |
| | 23,862 |
|
| Total inventories | $ | 2,684,087 |
| | $ | 2,370,699 |
| $ | 3,046,101 |
| | $ | 2,576,585 |
|
As of May 31,November 30, 2017, we valued approximately 19%15% of inventories, primarily related to our Energy segment, using the lower of cost, determined on the LIFO method, or marketnet realizable value (19% as of August 31, 2016)2017). If the FIFO method of accounting had been used, inventories would have been higher than the reported amount by $140.9$99.0 million and $93.9$186.2 million as of May 31,November 30, 2017, and August 31, 2016,2017, respectively. An actual valuation of inventory under the LIFO method can be made only at the end of each year based on the inventory levels and costs at that time. Interim LIFO calculations are based on management's estimates of expected year-end inventory levels, and are subject to the final year-end LIFO inventory valuation.
Note 4 Investments
| | | | 2017 | | 2016 | November 30, 2017 | | August 31, 2017 |
| | (Dollars in thousands) | (Dollars in thousands) |
| Equity method investments: | | | | | | |
| CF Industries Nitrogen, LLC | $ | 2,808,993 |
| | $ | 2,796,323 |
| $ | 2,776,412 |
| | $ | 2,756,076 |
|
| Ventura Foods, LLC | 374,006 |
| | 369,487 |
| 350,602 |
| | 347,016 |
|
| Ardent Mills, LLC | 195,869 |
| | 194,986 |
| 209,926 |
| | 206,529 |
|
| TEMCO, LLC | 41,581 |
| | 44,578 |
| 39,235 |
| | 41,323 |
|
| Other equity method investments | 290,391 |
| | 263,025 |
| 265,621 |
| | 268,444 |
|
| Cost method investments | 130,909 |
| | 127,577 |
| 135,204 |
| | 131,605 |
|
| Total investments | $ | 3,841,749 |
| | $ | 3,795,976 |
| $ | 3,777,000 |
| | $ | 3,750,993 |
|
Equity Method Investments
Joint ventures and other investments, in which we have significant ownership and influence, but not control, are accounted for in our consolidated financial statements using the equity method of accounting. Our primary equity method investments are described below.
On February 1, 2016, we invested $2.8 billion in CF Nitrogen, commencing our strategic venture with CF Industries Holdings, Inc. ("CF Industries"). The investment consists of an 11.4% membership interest (based on product tons) in CF Nitrogen. We also entered into an 80-year supply agreement that entitles us to purchase up to 1.1 million tons of granular urea and 580,000 tons of urea ammonium nitrate ("UAN") annually from CF Nitrogen for ratable delivery. Our purchases under the supply agreement are based on prevailing market prices and we receive semi-annual cash distributions (in January and July of each year) from CF Nitrogen via our membership interest. These distributions are based on actual volumes purchased from CF Nitrogen under the strategic venture and will have the effect of reducing our investment to zero over 80 years on a straight-line basis. We account for this investment using the hypothetical liquidation at book value method, recognizing our share of the earnings and losses of CF Nitrogen based upon our contractual claims on the entity's net assets pursuant to the liquidation provisions of CF Nitrogen's limited liability company agreement, adjusted for the semi-annual cash distributions.distributions we receive as a result of our membership interest in CF Nitrogen. For the three months ended May 31,November 30, 2017, and 2016, this amount was $24.5$20.3 million and $41.3 million, respectively. For the nine months ended May 31, 2017, and 2016, this amount was $60.8 million and $53.1$14.7 million, respectively. These amounts are included as equity income from investments in our Nitrogen Production segment.
We have a 50% interest in Ventura Foods, a joint venture which produces and distributes primarily vegetable oil-based products, and which constitutes our Foods segment. We account for Ventura Foods as an equity method investment, and as of
May 31, November 30, 2017,, our carrying value of Ventura Foods exceeded our share of its equity by $12.9 million, which represents equity method goodwill. The earnings are reported as equity income from investments in our Foods segment.
We have a 12% interest in Ardent Mills, LLC ("Ardent Mills"), a joint venture with Cargill Incorporated ("Cargill") and ConAgra Foods, Inc., which combines the North American flour milling operations of the three parent companies. We account for Ardent Mills as an equity method investment included in Corporate and Other.
TEMCO, LLC ("TEMCO") is owned and governed by Cargill (50%) and CHS (50%). Both owners have committed to sell all of their feedgrains, wheat, oilseeds and by-product origination that are tributary to the Pacific Northwest, United States ("Pacific Northwest") to TEMCO and to use TEMCO as their exclusive export-marketing vehicle for such grains exported through the Pacific Northwest through January 2037. We account for TEMCO as an equity method investment included in our Ag segment.
The following table provides aggregate summarized unaudited financial information for our equity method investments in CF Nitrogen, Ventura Foods and Ardent Mills for the three and nine months ended May 31, 2017, and 2016:
|
| | | | | | | | | | | | | | | | |
| | | For the Three Months Ended May 31, | | For the Nine Months Ended May 31, |
| | | 2017 | | 2016 | | 2017 | | 2016 |
| | | (Dollars in thousands) |
| Net sales | | $ | 2,043,628 |
| | $ | 1,623,696 |
| | $ | 5,807,777 |
| | $ | 4,673,341 |
|
| Gross profit | | 234,055 |
| | 255,191 |
| | 651,705 |
| | 638,093 |
|
| Net earnings | | 133,132 |
| | 121,022 |
| | 317,674 |
| | 283,996 |
|
| Earnings attributable to CHS Inc. | | 38,662 |
| | 64,615 |
| | 104,568 |
| | 118,845 |
|
Note 5 Goodwill and Other Intangible Assets
Goodwill of $153.3$153.7 million and $160.4$154.1 million as of May 31,November 30, 2017, and August 31, 2016,2017, respectively, is included in other assets on our Consolidated Balance Sheets. Changes in the net carrying amount of goodwill for the ninethree months ended May 31,November 30, 2017, by segment, are as follows:
|
| | | | | | | | | | | | | | | |
| | Energy | | Ag | | Corporate
and Other | | Total |
| | (Dollars in thousands) |
| Balances, August 31, 2016 | $ | 552 |
| | $ | 148,916 |
| | $ | 10,946 |
| | $ | 160,414 |
|
| Effect of foreign currency translation adjustments | — |
| | (868 | ) | | — |
| | (868 | ) |
| Impairment | — |
| | (5,542 | ) | | — |
| | (5,542 | ) |
| Other | — |
| | (298 | ) | | (372 | ) | | (670 | ) |
| Balances, May 31, 2017 | $ | 552 |
| | $ | 142,208 |
| | $ | 10,574 |
| | $ | 153,334 |
|
|
| | | | | | | | | | | | | | | |
| | Energy | | Ag | | Corporate
and Other | | Total |
| | (Dollars in thousands) |
| Balances, August 31, 2017 | $ | 552 |
| | $ | 142,929 |
| | $ | 10,574 |
| | $ | 154,055 |
|
| Effect of foreign currency translation adjustments | — |
| | (389 | ) | | — |
| | (389 | ) |
| Balances, November 30, 2017 | $ | 552 |
| | $ | 142,540 |
| | $ | 10,574 |
| | $ | 153,666 |
|
No goodwill has been allocated to our Nitrogen Production or Foods segments, which consist of investments accounted for under the equity method.
All long-lived assets, including property, plant and equipment, goodwill, investments in unconsolidated affiliates and other identifiable intangible assets, are evaluated for impairment in accordance with GAAP. Goodwill is evaluated for impairment annually as of May 31. All long-lived assets, including goodwill, are also evaluated for impairment whenever events or changes in circumstances indicate that the carrying amount of an asset group or reporting unit may not be recoverable. No impairments were identified as a result of the Company’s annual goodwill analyses performed as of May 31, 2017.
During the three months ended May 31, 2017, certain assets and liabilities associated with a disposal group in our Ag segment were classified as held for sale, including $5.5 million of goodwill allocated to the disposal group on a relative fair value basis. As a result of an impairment test performed over the disposal group, an impairment charge of $51.8 million which includes the allocated goodwill discussed above, was recorded in the Reserve and impairment charges line item in the Consolidated Statements of Operations for the three and nine months ended May 31, 2017. Following the impairment charge,
the assets remaining within the disposal group primarily include property, plant and equipment of $32.4 million, inventories of $23.9 million, accounts receivable of $8.7 million, and intangible assets of $2.4 million. The disposal group represents assets being sold as part of a broader asset portfolio review project. Negotiations for the sale of these assets is ongoing and we believe their sale will be consummated within the next 12 months. The held for sale assets and liabilities are recorded in other current assets and accounts payable in our Consolidated Balance Sheet as of May 31, 2017.
Intangible assets subject to amortization primarily include customer lists, trademarks and non-compete agreements, and are amortized over their respective useful lives (ranging from 2 to 30 years). Information regarding intangible assets that are included in other assets on our Consolidated Balance Sheets is as follows:
| | | | May 31,
2017 | | August 31,
2016 | November 30,
2017 | | August 31,
2017 |
| | Carrying Amount | | Accumulated Amortization | | Net | | Carrying Amount | | Accumulated Amortization | | Net | Carrying Amount | | Accumulated Amortization | | Net | | Carrying Amount | | Accumulated Amortization | | Net |
| | (Dollars in thousands) | (Dollars in thousands) |
| Customer lists | $ | 48,975 |
| | $ | (14,568 | ) | | $ | 34,407 |
| | $ | 51,554 |
| | $ | (15,550 | ) | | $ | 36,004 |
| $ | 42,391 |
| | $ | (11,695 | ) | | $ | 30,696 |
| | $ | 46,180 |
| | $ | (14,695 | ) | | $ | 31,485 |
|
| Trademarks and other intangible assets | 23,618 |
| | (21,713 | ) | | 1,905 |
| | 35,015 |
| | (26,253 | ) | | 8,762 |
| 6,536 |
| | (4,752 | ) | | 1,784 |
| | 23,623 |
| | (21,778 | ) | | 1,845 |
|
| Total intangible assets | $ | 72,593 |
| | $ | (36,281 | ) | | $ | 36,312 |
| | $ | 86,569 |
| | $ | (41,803 | ) | | $ | 44,766 |
| $ | 48,927 |
| | $ | (16,447 | ) | | $ | 32,480 |
| | $ | 69,803 |
| | $ | (36,473 | ) | | $ | 33,330 |
|
Total amortization expense for intangible assets during the three and nine months ended May 31,November 30, 2017, and 2016, was $1.0$0.9 million and $3.3 million, respectively. Total amortization expense for intangible assets during the three and nine months ended May 31, 2016, was $1.1 million and $4.9$1.3 million, respectively. The estimated annual amortization expense related to intangible assets subject to amortization for the next five years is as follows:
| | | | (Dollars in thousands) | (Dollars in thousands) |
| Year 1 | $ | 3,654 |
| $ | 3,395 |
|
| Year 2 | 3,653 |
| 3,373 |
|
| Year 3 | 3,487 |
| 3,095 |
|
| Year 4 | 3,344 |
| 3,037 |
|
| Year 5 | 3,170 |
| 2,755 |
|
Note 6 Notes Payable and Long-Term Debt
Our notes payable and long-term debt are subject to various restrictive requirements for maintenance of minimum consolidated net worth and other financial ratios. We were in compliance with our debt covenants as of May 31,November 30, 2017.
| |
| May 31, 2017 |
| August 31, 2016 | November 30, 2017 |
| August 31, 2017 |
| (Dollars in thousands) | (Dollars in thousands) |
| Notes payable | $ | 2,465,333 |
|
| $ | 1,803,174 |
| $ | 2,182,243 |
|
| $ | 1,695,423 |
|
| CHS Capital notes payable | 856,475 |
|
| 928,305 |
| 298,021 |
|
| 292,792 |
|
| Total notes payable | $ | 3,321,808 |
|
| $ | 2,731,479 |
| $ | 2,480,264 |
|
| $ | 1,988,215 |
|
On May 31,November 30, 2017, our primary line of credit was a five-year, unsecured revolving credit facility with a committed amount of $3.0 billion which expires in September 2020. The outstanding balance on this facility was $1.1 billion and $700.0$480.0 million as of May 31,November 30, 2017, and August 31, 2016,2017, respectively.
During the nine months ended May 31, 2017, we re-advanced $130.0 million under the revolving provision of our ten-year term loan with a syndication of banks that was originally arranged in September 2015. The terms of the re-advance are the same as the terms of the original term loan, with principal due on September 4, 2025, and interest calculated at a London Interbank Offered Rate ("LIBOR") plus an applicable margin ranging between 1.50% and 2.00%.
Interest expense for the three months ended May 31,November 30, 2017, and 2016, was $39.2$40.7 million and $37.5$38.3 million, respectively, net of capitalized interest of $1.6$1.8 million and $6.5 million, respectively. Interest expense for the nine months
ended May 31, 2017, and 2016, was $117.4 million and $71.6 million, respectively, net of capitalized interest of $4.7 million and $27.3$1.6 million, respectively.
Note 7 Income Taxes
During the three months ended May 31, 2017, our Board of Directors adopted a resolution to treat equity redemptions of non-qualified equity certificates issued in fiscal 2013 and fiscal 2014 in the same manner as qualified equity certificates are treated and redeemed under the “Eligible Annual Association Equity” provision of the Board's Policy for the Redemption of CHS Inc. Equities. Previously we had not established an intent regarding the redemption of non-qualified equity certificates issued to cooperative association members and other corporate entity non-qualified equity participants, thus the tax benefit associated with redemption would have been recognized in future periods as those redemptions occurred. As a result of the new resolution, we recorded a $75.0 million deferred tax benefit during the third quarter of fiscal 2017 related to the future redemption, at the discretion of our Board of Directors, of non-qualified equity certificates to cooperative association members and other corporate entity non-qualified equity participants.
During the three months ended May 31, 2017, we incurred losses associated with a trading partner of ours in Brazil entering into bankruptcy proceedings under Brazilian law, and we will be required to fund approximately $230.0 million of losses in our Brazilian operations via guarantees in place with our Brazilian subsidiary and its lending syndicate. Performance of these guarantees results in a bad debt deduction on our U.S. tax return, subject to the insurance and subrogation recovery provisions within the U.S. Tax Code. As a result of performance on the guarantee, we recorded an $84.4 million deferred tax benefit during the third quarter of fiscal 2017.
These two tax benefits are the primary contributors to our tax benefit position for the three and nine month periods ended May 31, 2017, within the Consolidated Statements of Operations.
Note 8 Equities
Changes in Equities
Changes in equities for the ninethree months ended May 31,November 30, 2017, are as follows:
|
| | | | | | | | | | | | | | | | | | | | | | | | | | | | | | | |
| | Equity Certificates | | | | Accumulated
Other
Comprehensive
Loss | | | | | | |
| | Capital
Equity
Certificates | | Nonpatronage
Equity
Certificates | | Nonqualified Equity Certificates | | Preferred
Stock | | | Capital
Reserves | | Noncontrolling
Interests | | Total
Equities |
| | (Dollars in thousands) |
| Balance, August 31, 2016 | $ | 3,932,513 |
| | $ | 22,894 |
| | $ | 281,767 |
| | $ | 2,244,132 |
| | $ | (211,726 | ) | | $ | 1,582,380 |
| | $ | 14,290 |
| | $ | 7,866,250 |
|
| Reversal of prior year patronage and redemption estimates | (121,892 | ) | | — |
| | — |
| | — |
| | — |
| | 278,968 |
| | — |
| | 157,076 |
|
| Distribution of 2016 patronage refunds | 153,589 |
| | — |
| | — |
| | — |
| | — |
| | (257,468 | ) | | — |
| | (103,879 | ) |
| Redemptions of equities | (43,949 | ) | | (154 | ) | | (1,386 | ) | | — |
| | — |
| | — |
| | — |
| | (45,489 | ) |
| Equities issued, net | 3,176 |
| | — |
| | — |
| | 19,986 |
| | — |
| | — |
| | — |
| | 23,162 |
|
| Preferred stock dividends | — |
| | — |
| | — |
| | — |
| | — |
| | (139,760 | ) | | — |
| | (139,760 | ) |
| Other, net | (7,560 | ) | | 7,300 |
| | (391 | ) | | (55 | ) | | — |
| | 3,046 |
| | (1,066 | ) | | 1,274 |
|
| Net income | — |
| | — |
| | — |
| | — |
| | — |
| | 178,532 |
| | (757 | ) | | 177,775 |
|
| Other comprehensive income (loss), net of tax | — |
| | — |
| | — |
| | — |
| | 2,026 |
| | — |
| | — |
| | 2,026 |
|
| Estimated 2017 cash patronage refunds | — |
| | — |
| | — |
| | — |
| | — |
| | (68,229 | ) | | — |
| | (68,229 | ) |
| Estimated 2017 equity redemptions | (11,250 | ) | | — |
| | — |
| | — |
| | — |
| | — |
| | — |
| | (11,250 | ) |
| Balance, May 31, 2017 | $ | 3,904,627 |
| | $ | 30,040 |
| | $ | 279,990 |
| | $ | 2,264,063 |
| | $ | (209,700 | ) | | $ | 1,577,469 |
| | $ | 12,467 |
| | $ | 7,858,956 |
|
|
| | | | | | | | | | | | | | | | | | | | | | | | | | | | | | | |
| | Equity Certificates | | | | Accumulated
Other
Comprehensive
Loss | | | | | | |
| | Capital
Equity
Certificates | | Nonpatronage
Equity
Certificates | | Nonqualified Equity Certificates | | Preferred
Stock | | | Capital
Reserves | | Noncontrolling
Interests | | Total
Equities |
| | (Dollars in thousands) |
| Balance, August 31, 2017 | $ | 3,906,426 |
| | $ | 29,836 |
| | $ | 405,387 |
| | $ | 2,264,038 |
| | $ | (183,670 | ) | | $ | 1,471,217 |
| | $ | 12,591 |
| | $ | 7,905,825 |
|
| Reversal of prior year redemption estimates | 1,561 |
| | — |
| | — |
| | — |
| | — |
| | — |
| | — |
| | 1,561 |
|
| Redemptions of equities | (1,449 | ) | | (53 | ) | | (59 | ) | | — |
| | — |
| | — |
| | — |
| | (1,561 | ) |
| Preferred stock dividends | — |
| | — |
| | — |
| | — |
| | — |
| | (84,334 | ) | | — |
| | (84,334 | ) |
| Other, net | (1,498 | ) | | (66 | ) | | (344 | ) | | — |
| | — |
| | 3,954 |
| | (3 | ) | | 2,043 |
|
| Net income (loss) | — |
| | — |
| | — |
| | — |
| | — |
| | 180,083 |
| | (464 | ) | | 179,619 |
|
| Other comprehensive income (loss), net of tax | — |
| | — |
| | — |
| | — |
| | 5,225 |
| | — |
| | — |
| | 5,225 |
|
| Estimated 2018 cash patronage refunds | — |
| | — |
| | — |
| | — |
| | — |
| | (50,702 | ) | | — |
| | (50,702 | ) |
| Estimated 2018 equity redemptions | (19,901 | ) | | — |
| | — |
| | — |
| | — |
| | — |
| | — |
| | (19,901 | ) |
| Balance, November 30, 2017 | $ | 3,885,139 |
| | $ | 29,717 |
| | $ | 404,984 |
| | $ | 2,264,038 |
| | $ | (178,445 | ) | | $ | 1,520,218 |
| | $ | 12,124 |
| | $ | 7,937,775 |
|
Accumulated Other Comprehensive Loss
Changes in accumulated other comprehensive income (loss) by component, net of tax, are as follows for the ninethree months endedMay 31, November 30, 2017,, and 2016:
|
| | | | | | | | | | | | | | | | | | | |
| | Pension and Other Postretirement Benefits | | Unrealized Net Gain on Available for Sale Investments | | Cash Flow Hedges | | Foreign Currency Translation Adjustment | | Total |
| | (Dollars in thousands) |
| Balance as of August 31, 2016 | $ | (165,146 | ) | | $ | 5,656 |
| | $ | (9,196 | ) | | $ | (43,040 | ) | | $ | (211,726 | ) |
| Current period other comprehensive income (loss), net of tax | (309 | ) | | 1,627 |
| | 1,184 |
| | (12,208 | ) | | (9,706 | ) |
| Amounts reclassified from accumulated other comprehensive income (loss), net of tax | 10,908 |
| | — |
| | 809 |
| | 15 |
| | 11,732 |
|
| Net other comprehensive income (loss), net of tax | 10,599 |
| | 1,627 |
| | 1,993 |
| | (12,193 | ) | | 2,026 |
|
| Balance as of May 31, 2017 | $ | (154,547 | ) | | $ | 7,283 |
| | $ | (7,203 | ) | | $ | (55,233 | ) | | $ | (209,700 | ) |
|
| | | | | | | | | | | | | | | | | | | |
| | Pension and Other Postretirement Benefits | | Unrealized Net Gain on Available for Sale Investments | | Cash Flow Hedges | | Foreign Currency Translation Adjustment | | Total |
| | (Dollars in thousands) |
| Balance as of August 31, 2017, net of tax | $ | (135,046 | ) | | $ | 10,041 |
| | $ | (6,954 | ) | | $ | (51,711 | ) | | $ | (183,670 | ) |
| Other comprehensive income (loss), before tax: | | | | | | | | | |
| Amounts before reclassifications | — |
| | 4,044 |
| | (435 | ) | | (1,008 | ) | | 2,601 |
|
| Amounts reclassified out | 6,816 |
| | — |
| | 429 |
| | (2,042 | ) | | 5,203 |
|
| Total other comprehensive income (loss), before tax | 6,816 |
| | 4,044 |
| | (6 | ) | | (3,050 | ) | | 7,804 |
|
| Tax effect | (2,620 | ) | | (404 | ) | | 2 |
| | 443 |
| | (2,579 | ) |
| Other comprehensive income (loss), net of tax | 4,196 |
| | 3,640 |
| | (4 | ) | | (2,607 | ) | | 5,225 |
|
| Balance as of November 30, 2017, net of tax | $ | (130,850 | ) | | $ | 13,681 |
| | $ | (6,958 | ) | | $ | (54,318 | ) | | $ | (178,445 | ) |
|
| | | | | | | | | | | | | | | | | | | |
| | Pension and Other Postretirement Benefits | | Unrealized Net Gain on Available for Sale Investments | | Cash Flow Hedges | | Foreign Currency Translation Adjustment | | Total |
| | (Dollars in thousands) |
| Balance as of August 31, 2015 | $ | (171,729 | ) | | $ | 4,156 |
| | $ | (5,324 | ) | | $ | (41,310 | ) | | $ | (214,207 | ) |
| Current period other comprehensive income (loss), net of tax | 135 |
| | 462 |
| | (6,805 | ) | | (6,380 | ) | | (12,588 | ) |
| Amounts reclassified from accumulated other comprehensive income (loss), net of tax | 9,671 |
| | — |
| | 2,860 |
| | 470 |
| | 13,001 |
|
| Net other comprehensive income (loss), net of tax | 9,806 |
| | 462 |
| | (3,945 | ) | | (5,910 | ) | | 413 |
|
| Balance as of May 31, 2016 | $ | (161,923 | ) | | $ | 4,618 |
| | $ | (9,269 | ) | | $ | (47,220 | ) | | $ | (213,794 | ) |
|
| | | | | | | | | | | | | | | | | | | |
| | Pension and Other Postretirement Benefits | | Unrealized Net Gain on Available for Sale Investments | | Cash Flow Hedges | | Foreign Currency Translation Adjustment | | Total |
| | (Dollars in thousands) |
| Balance as of August 31, 2016, net of tax | $ | (165,146 | ) | | $ | 5,656 |
| | $ | (9,196 | ) | | $ | (43,040 | ) | | $ | (211,726 | ) |
| Other comprehensive income (loss), before tax: | | | | | | | | | |
| Amounts before reclassifications | — |
| | 1,259 |
| | 620 |
| | (18,940 | ) | | (17,061 | ) |
| Amounts reclassified out | 5,250 |
| | — |
| | 440 |
| | (15 | ) | | 5,675 |
|
| Total other comprehensive income (loss), before tax | 5,250 |
| | 1,259 |
| | 1,060 |
| | (18,955 | ) | | (11,386 | ) |
| Tax effect | (2,011 | ) | | (482 | ) | | (406 | ) | | (209 | ) | | (3,108 | ) |
| Other comprehensive income (loss), net of tax | 3,239 |
| | 777 |
| | 654 |
| | (19,164 | ) | | (14,494 | ) |
| Balance as of November 30, 2016, net of tax | $ | (161,907 | ) | | $ | 6,433 |
| | $ | (8,542 | ) | | $ | (62,204 | ) | | $ | (226,220 | ) |
Amounts reclassified from accumulated other comprehensive income (loss) were primarily related to pension and other post-retirement benefits. Pension and other post-retirement reclassifications include amortization of net actuarial loss, prior service credit and transition amounts and are recorded as marketing, general and administrative expenses (see Note 9,8, Benefit Plans for further information).
Note 98 Benefit Plans
We have various pension and other defined benefit and defined contribution plans, in which substantially all employees may participate. We also have non-qualified supplemental executive and Board retirement plans.
Components of net periodic benefit costs for the three and nine months ended May 31,November 30, 2017, and 2016, are as follows:
| | | | Qualified Pension Benefits | | Non-Qualified Pension Benefits | | Other Benefits | Qualified Pension Benefits | | Non-Qualified Pension Benefits | | Other Benefits |
| | 2017 | | 2016 | | 2017 | | 2016 | | 2017 | | 2016 | 2017 | | 2016 | | 2017 | | 2016 | | 2017 | | 2016 |
| Components of net periodic benefit costs for the three months ended May 31 are as follows: | (Dollars in thousands) | |
| Components of net periodic benefit costs for the three months ended November 30 are as follows: | | (Dollars in thousands) |
| Service cost | $ | 10,537 |
| | $ | 9,383 |
| | $ | 302 |
| | $ | 258 |
| | $ | 290 |
| | $ | 353 |
| $ | 9,919 |
| | $ | 9,383 |
| | $ | 137 |
| | $ | 259 |
| | $ | 236 |
| | $ | 353 |
|
| Interest cost | 5,753 |
| | 7,691 |
| | 210 |
| | 352 |
| | 232 |
| | 427 |
| 6,002 |
| | 7,692 |
| | 178 |
| | 352 |
| | 227 |
| | 427 |
|
| Expected return on assets | (12,058 | ) | | (12,013 | ) | | — |
| | — |
| | — |
| | — |
| (12,040 | ) | | (12,014 | ) | | — |
| | — |
| | — |
| | — |
|
| Prior service cost (credit) amortization | 385 |
| | 402 |
| | 4 |
| | 57 |
| | (141 | ) | | (30 | ) | 359 |
| | 402 |
| | 8 |
| | 57 |
| | (141 | ) | | (30 | ) |
| Actuarial (gain) loss amortization | 5,708 |
| | 4,765 |
| | 136 |
| | 172 |
| | (199 | ) | | (116 | ) | 6,888 |
| | 4,765 |
| | 15 |
| | 173 |
| | (306 | ) | | (116 | ) |
| Net periodic benefit cost | $ | 10,325 |
| | $ | 10,228 |
| | $ | 652 |
| | $ | 839 |
| | $ | 182 |
| | $ | 634 |
| $ | 11,128 |
| | $ | 10,228 |
| | $ | 338 |
| | $ | 841 |
| | $ | 16 |
| | $ | 634 |
|
| Components of net periodic benefit costs for the nine months ended May 31 are as follows: | |
| | |
| | |
| | |
| | |
| | |
| |
| Service cost | $ | 31,612 |
| | $ | 28,149 |
| | $ | 905 |
| | $ | 776 |
| | $ | 870 |
| | $ | 1,059 |
| |
| Interest cost | 17,257 |
| | 23,075 |
| | 632 |
| | 1,055 |
| | 698 |
| | 1,282 |
| |
| Expected return on assets | (36,173 | ) | | (36,040 | ) | | — |
| | — |
| | — |
| | — |
| |
| Prior service cost (credit) amortization | 1,155 |
| | 1,205 |
| | 14 |
| | 171 |
| | (424 | ) | | (90 | ) | |
| Actuarial (gain) loss amortization | 17,123 |
| | 14,294 |
| | 409 |
| | 518 |
| | (598 | ) | | (348 | ) | |
| Net periodic benefit cost | $ | 30,974 |
| | $ | 30,683 |
| | $ | 1,960 |
| | $ | 2,520 |
| | $ | 546 |
| | $ | 1,903 |
| |
Employer Contributions
Total contributions to be made during fiscal 20172018 will depend primarily on market returns on the pension plan assets and minimum funding level requirements. During the ninethree months ended May 31,November 30, 2017, we made no contributions to the pension plans. At this time, we do not anticipate being required to make a contribution for our benefit plans in fiscal 2017.2018.
Note 109 Segment Reporting
We define our operating segments in accordance with ASC Topic 280, Segment Reporting, to reflect the manner in which our chief operating decision maker, our Chief Executive Officer, evaluates performance and allocates resources in managing our business. We have aggregated those operating segments into four reportable segments: Energy, Ag, Nitrogen Production and Foods.
Our Energy segment produces and provides primarily for the wholesale distribution of petroleum products and transportation of those products. Our Ag segment purchases and further processes or resells grains and oilseeds originated by our country operations business, by our member cooperatives and by third parties; serves as a wholesaler and retailer of crop inputs; and produces and markets ethanol. Our Nitrogen Production segment consists solely of our equity method investment in CF Nitrogen, which was completed in February 2016 and which entitles us, pursuant to a supply agreement that we entered into with CF Nitrogen, to purchase up to a specified annual quantity of granular urea and UANurea ammonium nitrate annually from CF Nitrogen. The addition of our Nitrogen Production segment had no impact on historically reported segment results and balances as this segment came into existence in fiscal 2016. Our Foods segment consists solely of our equity method investment in Ventura Foods. In prior periods, Ventura Foods was reported as a component of Corporate and Other. Historically reported segment results and balances have been revised to reflect the addition of our Foods segment. There were no changes to the composition of our Energy or Ag segments as a result of the addition of our Nitrogen Production and Foods segments. Corporate and Other primarily represents our non-consolidated wheat milling operations, as well as our business solutions operations, which primarily consists of commoditiesfinancing, hedging and insurance and financial services related to crop production.
Corporate administrative expenses and interest are allocated to each business segment, and Corporate and Other, based on direct usage for services, that can be tracked, such as information technology and legal, and other factors or considerations relevant to the costs incurred.
Many of our business activities are highly seasonal and operating results vary throughout the year. For example, in our Ag segment, our crop nutrients and country operations businesses generally experience higher volumes and income during the spring planting season and in the fall, which corresponds to harvest. Our grain marketing operations are also subject to fluctuations in volume and earnings based on producer harvests, world grain prices and demand. Our Energy segment generally experiences higher volumes and profitability in certain operating areas, such as refined products, in the summer and early fall when gasoline and diesel fuel usage is highest and is subject to global supply and demand forces. Other energy products, such as propane, may experience higher volumes and profitability during the winter heating and fall crop drying seasons.
Our revenues, assets and cash flows can be significantly affected by global market prices for commodities such as petroleum products, natural gas, ethanol, grains, oilseeds, crop nutrients and flour. Changes in market prices for commodities that we purchase without a corresponding change in the selling prices of those products can affect revenues and operating earnings. Commodity prices are affected by a wide range of factors beyond our control, including the weather, crop damage
due to disease or insects, drought, the availability and adequacy of supply, government regulations and policies, world events, and general political and economic conditions.
While our revenues and operating results are derived from businesses and operations which are wholly owned and majority owned, a portion of our business operations are conducted through companies in which we hold ownership interests of 50% or less and do not control the operations. See Note 4, Investments for more information on these entities.
Reconciling Amounts represent the elimination of revenues and interest between segments. Such transactions are executed at market prices to more accurately evaluate the profitability of the individual business segments.
Segment information for the three and nine months ended May 31,November 30, 2017, and 2016, is presented in the tables below. |
| | | | | | | | | | | | | | | | | | | | | | | | | | | |
| Energy | | Ag | | Nitrogen Production | | Foods | | Corporate
and Other | | Reconciling
Amounts | | Total |
| For the Three Months Ended May 31, 2017: | (Dollars in thousands) |
| Revenues | $ | 1,638,107 |
|
| $ | 7,053,991 |
|
| $ | — |
| | $ | — |
| | $ | 26,820 |
|
| $ | (104,828 | ) |
| $ | 8,614,090 |
|
| Operating earnings (loss) | (5,723 | ) |
| (226,668 | ) |
| (5,619 | ) | | (3,101 | ) | | 10,814 |
|
| — |
|
| (230,297 | ) |
| (Gain) loss on investments | — |
|
| (393 | ) |
| — |
| | — |
| | — |
|
| — |
|
| (393 | ) |
| Interest expense | 4,343 |
|
| 16,609 |
|
| 10,708 |
| | (231 | ) | | 8,358 |
|
| (586 | ) |
| 39,201 |
|
| Other income | (332 | ) | | (12,493 | ) | | (477 | ) | | — |
| | 1,162 |
| | 586 |
| | (11,554 | ) |
| Equity (income) loss from investments | (391 | ) |
| (9,199 | ) |
| (24,534 | ) | | (9,920 | ) | | (4,349 | ) |
| — |
|
| (48,393 | ) |
| Income (loss) before income taxes | $ | (9,343 | ) |
| $ | (221,192 | ) |
| $ | 8,684 |
| | $ | 7,050 |
| | $ | 5,643 |
|
| $ | — |
|
| $ | (209,158 | ) |
| Intersegment revenues | $ | (97,876 | ) |
| $ | (7,545 | ) |
| $ | — |
| | $ | — |
| | $ | 593 |
|
| $ | 104,828 |
|
| $ | — |
|
| | | | | | | | | | | | | | |
| | Energy | | Ag | | Nitrogen Production | | Foods | | Corporate
and Other | | Reconciling
Amounts | | Total |
| For the Three Months Ended May 31, 2016: | (Dollars in thousands) |
| Revenues | $ | 1,322,624 |
| | $ | 6,526,714 |
| | $ | — |
| | $ | — |
| | $ | 25,114 |
| | $ | (77,864 | ) | | $ | 7,796,588 |
|
| Operating earnings (loss) | 103,614 |
| | 24,432 |
| | 253 |
| | (2,243 | ) | | 22,004 |
| | — |
| | 148,060 |
|
| (Gain) loss on investments | — |
| | (881 | ) | | — |
| | — |
| | 181 |
| | — |
| | (700 | ) |
| Interest expense | (4,270 | ) | | 24,518 |
| | 16,549 |
| | 645 |
| | 7,951 |
| | (7,927 | ) | | 37,466 |
|
| Other income | (217 | ) | | (17,473 | ) | | — |
| | — |
| | (1,011 | ) | | 7,927 |
| | (10,774 | ) |
| Equity (income) loss from investments | (1,300 | ) | | (5,931 | ) | | (41,257 | ) | | (19,922 | ) | | (4,043 | ) | | — |
| | (72,453 | ) |
| Income (loss) before income taxes | $ | 109,401 |
| | $ | 24,199 |
| | $ | 24,961 |
| | $ | 17,034 |
| | $ | 18,926 |
| | $ | — |
| | $ | 194,521 |
|
| Intersegment revenues | $ | (76,114 | ) | | $ | (3,016 | ) | | $ | — |
| | $ | — |
| | $ | 1,266 |
| | $ | 77,864 |
| | $ | — |
|
| | | | | | | | | | | | | | |
| | | | Energy | | Ag | | Nitrogen Production | | Foods | | Corporate
and Other | | Reconciling
Amounts | | Total | Energy | | Ag | | Nitrogen Production | | Foods | | Corporate
and Other | | Reconciling
Amounts | | Total |
| For the Nine Months Ended May 31, 2017: | (Dollars in thousands) | |
| For the Three Months Ended November 30, 2017: | | (Dollars in thousands) |
| Revenues | $ | 4,867,321 |
| | $ | 19,345,316 |
| | $ | — |
| | $ | — |
| | $ | 85,691 |
| | $ | (315,582 | ) | | $ | 23,982,746 |
| $ | 2,087,703 |
|
| $ | 6,086,680 |
|
| $ | — |
| | $ | — |
| | $ | 18,775 |
|
| $ | (144,269 | ) |
| $ | 8,048,889 |
|
| Operating earnings (loss) | 86,563 |
| | (131,363 | ) | | (14,033 | ) | | (8,370 | ) | | 33,904 |
| | — |
| | (33,299 | ) | 117,173 |
|
| 60,822 |
|
| (3,135 | ) | | (2,467 | ) | | 4,488 |
|
| — |
|
| 176,881 |
|
| (Gain) loss on investments | — |
| | 6,302 |
| | — |
| | — |
| | (2,076 | ) | | — |
| | 4,226 |
| — |
|
| (2,819 | ) |
| — |
| | — |
| | — |
|
| — |
|
| (2,819 | ) |
| Interest expense | 12,176 |
| | 49,798 |
| | 35,626 |
| | (231 | ) | | 27,743 |
| | (7,701 | ) | | 117,411 |
| 5,635 |
|
| 17,604 |
|
| 13,272 |
| | — |
| | 4,581 |
|
| (390 | ) |
| 40,702 |
|
| Other income | (828 | ) | | (48,103 | ) | | (30,047 | ) | | — |
| | 868 |
| | 7,701 |
| | (70,409 | ) | |
| Other (income) loss | | (393 | ) | | (20,228 | ) | | (1,738 | ) | | — |
| | (226 | ) | | 390 |
| | (22,195 | ) |
| Equity (income) loss from investments | (2,039 | ) | | (18,071 | ) | | (60,787 | ) | | (28,850 | ) | | (14,774 | ) | | — |
| | (124,521 | ) | (1,152 | ) |
| (8,254 | ) |
| (20,335 | ) | | (3,440 | ) | | (5,181 | ) |
| — |
|
| (38,362 | ) |
| Income (loss) before income taxes | $ | 77,254 |
| | $ | (121,289 | ) | | $ | 41,175 |
| | $ | 20,711 |
| | $ | 22,143 |
| | $ | — |
| | $ | 39,994 |
| $ | 113,083 |
|
| $ | 74,519 |
|
| $ | 5,666 |
| | $ | 973 |
| | $ | 5,314 |
|
| $ | — |
|
| $ | 199,555 |
|
| Intersegment revenues | $ | (297,057 | ) | | $ | (16,068 | ) | | $ | — |
| | $ | — |
| | $ | (2,457 | ) | | $ | 315,582 |
| | $ | — |
| $ | (137,204 | ) |
| $ | (4,033 | ) |
| $ | — |
| | $ | — |
| | $ | (3,032 | ) |
| $ | 144,269 |
|
| $ | — |
|
| Total assets at May 31, 2017 | $ | 4,292,789 |
| | $ | 7,028,635 |
| | $ | 2,834,040 |
| | $ | 374,007 |
| | $ | 2,692,326 |
| | $ | — |
| | $ | 17,221,797 |
| |
| | | | | | | | | | | | | | | | | | | | | | | | | | | |
| | Energy | | Ag | | Nitrogen Production | | Foods | | Corporate
and Other | | Reconciling
Amounts | | Total | Energy | | Ag | | Nitrogen Production | | Foods | | Corporate
and Other | | Reconciling
Amounts | | Total |
| For the Nine Months Ended May 31, 2016: | (Dollars in thousands) | |
| For the Three Months Ended November 30, 2016: | | (Dollars in thousands) |
| Revenues | $ | 4,162,685 |
| | $ | 18,221,420 |
| | $ | — |
| | $ | — |
| | $ | 68,210 |
| | $ | (287,605 | ) | | $ | 22,164,710 |
| $ | 1,700,180 |
| | $ | 6,435,994 |
| | $ | — |
| | $ | — |
| | $ | 27,441 |
| | $ | (115,365 | ) | | $ | 8,048,250 |
|
| Operating earnings (loss) | 214,827 |
| | 77,605 |
| | (5,506 | ) | | (6,319 | ) | | 35,464 |
| | — |
| | 316,071 |
| 72,780 |
| | 109,597 |
| | (4,029 | ) | | (2,797 | ) | | 10,940 |
| | — |
| | 186,491 |
|
| (Gain) loss on investments | — |
| | (6,595 | ) | | — |
| | — |
| | (2,827 | ) | | — |
| | (9,422 | ) | — |
| | 7,385 |
| | — |
| | — |
| | 16 |
| | — |
| | 7,401 |
|
| Interest expense | (20,723 | ) | | 57,785 |
| | 21,286 |
| | 2,246 |
| | 18,886 |
| | (7,927 | ) | | 71,553 |
| 4,268 |
| | 16,339 |
| | 12,736 |
| | — |
| | 7,974 |
| | (3,052 | ) | | 38,265 |
|
| Other income | (174 | ) | | (27,778 | ) | | — |
| | — |
| | (2,130 | ) | | 7,927 |
| | (22,155 | ) | |
| Other (income) loss | | (309 | ) | | (17,923 | ) | | (29,106 | ) | | — |
| | (115 | ) | | 3,052 |
| | (44,401 | ) |
| Equity (income) loss from investments | (3,487 | ) | | (8,152 | ) | | (53,112 | ) | | (55,449 | ) | | (11,619 | ) | | — |
| | (131,819 | ) | (1,162 | ) | | (5,417 | ) | | (14,696 | ) | | (13,369 | ) | | (5,684 | ) | | — |
| | (40,328 | ) |
| Income (loss) before income taxes | $ | 239,211 |
| | $ | 62,345 |
| | $ | 26,320 |
| | $ | 46,884 |
| | $ | 33,154 |
| | $ | — |
| | $ | 407,914 |
| $ | 69,983 |
| | $ | 109,213 |
| | $ | 27,037 |
| | $ | 10,572 |
| | $ | 8,749 |
| | $ | — |
| | $ | 225,554 |
|
| Intersegment revenues | $ | (250,425 | ) | | $ | (36,032 | ) | | $ | — |
| | $ | — |
| | $ | (1,148 | ) | | $ | 287,605 |
| | $ | — |
| $ | (110,087 | ) | | $ | (3,765 | ) | | $ | — |
| | $ | — |
| | $ | (1,513 | ) | | $ | 115,365 |
| | $ | — |
|
| | | | | | | | | | | | | | | |
Note 1110 Derivative Financial Instruments and Hedging Activities
Our derivative instruments primarily consist of commodity and freight futures and forward contracts and, to a minorlesser degree, may include foreign currency and interest rate swap contracts. These contracts are economic hedges of price risk, but we do not apply hedge accounting under ASC Topic 815, Derivatives and Hedging, except with respect to certain interest rate swap contracts which are accounted for as cash flow or fair value hedges. Derivative instruments are recorded on our Consolidated Balance Sheets at fair value as described in Note 12,11, Fair Value Measurements.
The following tables present the gross fair values of derivative assets, derivative liabilities, and margin deposits (cash collateral) recorded on our Consolidated Balance Sheets along with the related amounts permitted to be offset in accordance with GAAP. We have elected not to offset derivative assets and liabilities when we have the right of offset under ASC Topic 210-20, Balance Sheet - Offsetting; or when the instruments are subject to master netting arrangements under ASC Topic 815-10-45, Derivatives and Hedging - Overall.
| | | | May 31, 2017 | November 30, 2017 |
| | | | Amounts Not Offset on the Consolidated Balance Sheet but Eligible for Offsetting | | | | | Amounts Not Offset on the Consolidated Balance Sheet but Eligible for Offsetting | | |
| | Gross Amounts Recognized | | Cash Collateral | | Derivative Instruments | | Net Amounts | Gross Amounts Recognized | | Cash Collateral | | Derivative Instruments | | Net Amounts |
| | (Dollars in thousands) | (Dollars in thousands) |
| Derivative Assets: | | | | | | | | | | | | | | |
| Commodity and freight derivatives | $ | 363,627 |
| | $ | — |
| | $ | 27,711 |
| | $ | 335,916 |
| $ | 324,867 |
| | $ | — |
| | $ | 36,052 |
| | $ | 288,815 |
|
| Foreign exchange derivatives | 10,558 |
| | — |
| | 3,895 |
| | 6,663 |
| 4,297 |
| | — |
| | 2,741 |
| | 1,556 |
|
| Interest rate derivatives - hedge | 9,496 |
| | — |
| | — |
| | 9,496 |
| 3,596 |
| | — |
| | — |
| | 3,596 |
|
| Embedded derivative asset - current | 4,507 |
| | — |
| | — |
| | 4,507 |
| |
| Total current derivatives | $ | 388,188 |
| | $ | — |
| | $ | 31,606 |
| | $ | 356,582 |
| |
| Embedded derivative asset - long term | 20,540 |
| | — |
| | — |
| | 20,540 |
| |
| Embedded derivative asset | | 22,271 |
| | — |
| | — |
| | 22,271 |
|
| Total | $ | 408,728 |
| | $ | — |
| | $ | 31,606 |
| | $ | 377,122 |
| $ | 355,031 |
| | $ | — |
| | $ | 38,793 |
| | $ | 316,238 |
|
| Derivative Liabilities: | | | | | | | | | | | | | | |
| Commodity and freight derivatives | $ | 271,337 |
| | $ | 3,136 |
| | $ | 27,711 |
| | $ | 240,490 |
| $ | 224,656 |
| | $ | 10,358 |
| | $ | 36,052 |
| | $ | 178,246 |
|
| Foreign exchange derivatives | 11,689 |
| | — |
| | 3,895 |
| | 7,794 |
| 7,556 |
| | — |
| | 2,741 |
| | 4,815 |
|
| Interest rate derivatives - hedge | 1,182 |
| | — |
| | — |
| | 1,182 |
| 2,641 |
| | — |
| | — |
| | 2,641 |
|
| Interest rate derivatives - non-hedge | 4 |
| | — |
| | — |
| | 4 |
| |
| Total | $ | 284,212 |
| | $ | 3,136 |
| | $ | 31,606 |
| | $ | 249,470 |
| $ | 234,853 |
| | $ | 10,358 |
| | $ | 38,793 |
| | $ | 185,702 |
|
| | | | August 31, 2016 | August 31, 2017 |
| | | | Amounts Not Offset on the Consolidated Balance Sheet but Eligible for Offsetting | | | | | Amounts Not Offset on the Consolidated Balance Sheet but Eligible for Offsetting | | |
| | Gross Amounts Recognized | | Cash Collateral | | Derivative Instruments | | Net Amounts | Gross Amounts Recognized | | Cash Collateral | | Derivative Instruments | | Net Amounts |
| | (Dollars in thousands) | (Dollars in thousands) |
| Derivative Assets: | | | | | | | | | | | | | | |
| Commodity and freight derivatives | $ | 500,192 |
| | $ | — |
| | $ | 23,689 |
| | $ | 476,503 |
| $ | 384,648 |
| | $ | — |
| | $ | 35,080 |
| | $ | 349,568 |
|
| Foreign exchange derivatives | 21,551 |
| | — |
| | 9,187 |
| | 12,364 |
| 8,771 |
| | — |
| | 3,636 |
| | 5,135 |
|
| Interest rate derivatives - hedge | 22,078 |
| | — |
| | — |
| | 22,078 |
| 9,978 |
| | — |
| | — |
| | 9,978 |
|
| Embedded derivative asset | | 25,533 |
| | — |
| | — |
| | 25,533 |
|
| Total | $ | 543,821 |
| | $ | — |
| | $ | 32,876 |
| | $ | 510,945 |
| $ | 428,930 |
| | $ | — |
| | $ | 38,716 |
| | $ | 390,214 |
|
| Derivative Liabilities: | | | | | | | | | | | | | | |
| Commodity and freight derivatives | $ | 491,302 |
| | $ | 811 |
| | $ | 23,689 |
| | $ | 466,802 |
| $ | 309,762 |
| | $ | 3,898 |
| | $ | 35,080 |
| | $ | 270,784 |
|
| Foreign exchange derivatives | 22,289 |
| | — |
| | 9,187 |
| | 13,102 |
| 19,931 |
| | — |
| | 3,636 |
| | 16,295 |
|
| Interest rate derivatives - non-hedge | 8 |
| | — |
| | — |
| | 8 |
| |
| Interest rate derivatives - hedge | | 707 |
| | — |
| | — |
| | 707 |
|
| Total | $ | 513,599 |
| | $ | 811 |
| | $ | 32,876 |
| | $ | 479,912 |
| $ | 330,400 |
| | $ | 3,898 |
| | $ | 38,716 |
| | $ | 287,786 |
|
The amount of long-term derivative assets and liabilities recorded on the Consolidated Balance Sheet at November 30, 2017, were $71.8 million and $8.6 million, respectively. The amount of long-term derivative assets and liabilities recorded on the Consolidated Balance Sheet at August 31, 2017, were $196.9 million and $14.4 million, respectively.
Derivatives Not Designated as Hedging Instruments
The majority of our derivative instruments have not been designated as hedging instruments for accounting purposes. The following table sets forth the pretax gains (losses) on derivatives not accounted for as hedging instruments that have been included in our Consolidated Statements of Operations for the three and nine months ended May 31,November 30, 2017, and 2016.
| | | | | For the Three Months Ended May 31, | | For the Nine Months Ended May 31, | | For the Three Months Ended November 30, |
| | Location of Gain (Loss) | | 2017 | | 2016 | | 2017 | | 2016 | Location of Gain (Loss) | | 2017 | | 2016 |
| | | (Dollars in thousands) | | (Dollars in thousands) |
| Commodity and freight derivatives | Cost of goods sold | | $ | 102,327 |
| | $ | (193,548 | ) | | $ | 177,633 |
| | $ | (103,532 | ) | Cost of goods sold | | $ | 27,752 |
| | $ | 18,410 |
|
| Foreign exchange derivatives | Cost of goods sold | | (7,168 | ) | | 2,249 |
| | (4,573 | ) | | (7,550 | ) | Cost of goods sold | | 6,766 |
| | 6,024 |
|
| Foreign exchange derivatives | Marketing, general and administrative | | 22 |
| | (12,820 | ) | | (784 | ) | | 2,308 |
| Marketing, general and administrative | | (495 | ) | | 145 |
|
| Interest rate derivatives | Interest expense | | — |
| | (5,096 | ) | | 4 |
| | (6,299 | ) | Interest expense | | (1 | ) | | 2 |
|
| Embedded derivative | Other Income | | 477 |
| | — |
| | 30,051 |
| | — |
| Other income | | 1,738 |
| | 29,106 |
|
| Total | Total | | $ | 95,658 |
| | $ | (209,215 | ) | | $ | 202,331 |
| | $ | (115,073 | ) | Total | | $ | 35,760 |
| | $ | 53,687 |
|
Commodity and Freight Contracts
As of May 31,November 30, 2017, and August 31, 2016,2017, we had outstanding commodity futures, options and freight contracts that were used as economic hedges, as well as fixed-price forward contracts related to physical purchases and sales of commodities. The table below presents the notional volumes for all outstanding commodity and freight contracts accounted for as derivative instruments.
| | | | May 31, 2017 | | August 31, 2016 | November 30, 2017 | | August 31, 2017 |
| | Long | | Short | | Long | | Short | Long | | Short | | Long | | Short |
| | (Units in thousands) | (Units in thousands) |
| Grain and oilseed - bushels | 663,358 |
| | 860,178 |
| | 774,279 |
| | 995,396 |
| 588,263 |
| | 805,041 |
| | 570,673 |
| | 768,540 |
|
| Energy products - barrels | 13,694 |
| | 8,151 |
| | 14,740 |
| | 6,470 |
| 16,254 |
| | 19,300 |
| | 15,072 |
| | 18,252 |
|
| Processed grain and oilseed - tons | 327 |
| | 2,188 |
| | 541 |
| | 2,060 |
| 196 |
| | 1,700 |
| | 299 |
| | 2,347 |
|
| Crop nutrients - tons | 70 |
| | 241 |
| | 108 |
| | 135 |
| 25 |
| | 4 |
| | 9 |
| | 15 |
|
| Ocean and barge freight - metric tons | 4,110 |
| | 876 |
| | 4,406 |
| | 877 |
| 4,785 |
| | 3,144 |
| | 2,777 |
| | 1,766 |
|
| Rail freight - rail cars | 210 |
| | 97 |
| | 205 |
| | 79 |
| 151 |
| | 68 |
| | 176 |
| | 75 |
|
| Natural gas - MMBtu | 3,275 |
| | — |
| | 3,550 |
| | 300 |
| 1,500 |
| | — |
| | 500 |
| | — |
|
Foreign Exchange Contracts
We are exposed to risk regarding foreign currency fluctuations even though a substantial amount of international sales are denominated in U.S. dollars. In addition to specific transactional exposure, foreign currency fluctuations can impact the ability of foreign buyers to purchase U.S. agricultural products and the competitiveness of U.S. agricultural products compared to the same products offered by alternative sources of world supply. From time to time, we enter into foreign currency hedge contracts to minimize the impact of currency fluctuations on our transactional exposures. The notional amounts of our foreign exchange derivative contracts were $789.4$646.3 million and $802.2$776.7 million as of May 31,November 30, 2017, and August 31, 2016,2017, respectively.
Embedded Derivative Asset
Under the terms of our strategic investment in CF Nitrogen, if CF Industries' credit rating is reduced below certain levels by two of three specified credit ratings agencies, we are entitled to receive a non-refundable annual payment of $5.0 million from CF Industries. The payment would continue on an annual basisIndustries in November of each year until the date that CF Industries' credit rating is upgraded to or above certain levels by two of the three specified credit ratings agencies or February 1, 2026, whichever is earlier.
During the three months ended November 30, 2016, CF Industries' credit rating was reduced below the specified levels and we recorded a gain of $29.1 million in other income in our Consolidated Statement of Operations. During November 2016 we received a $5.0 million payment from CF Industries, which reduced the fair valuewas recorded as a gain in our Consolidated Statement
of Operations. We also recorded an embedded derivative asset toof $24.1 million as of November 30, 2016. In addition, during the three months ended February 28, 2017, we recorded adjustments of $0.5 million in other incomeon our Consolidated Balance Sheet and a corresponding gain in our Consolidated Statement of Operations to reflectfor the $24.6 million fair value of the embedded derivative asset during the three months ended November 30, 2016. During the three months ended November 30, 2017, we received a second $5.0 million payment from CF Industries. The fair value of the embedded derivative asset recorded on our Consolidated Balance Sheet as of February 28, 2017. During the three months ended May 31,November 30, 2017, we recorded adjustments of $0.5 million in other income in our Consolidated Statement of Operationswas equal to reflect the $25.0 million fair value of the embedded derivative asset on our Consolidated Balance Sheet as of May 31, 2017.$22.3 million. The current and long-term portions of the embedded derivative asset are included in derivative assets and other assets on our Consolidated Balance Sheet,Sheets, respectively. See Note 12,11, Fair Value Measurements for more information on the valuation of the embedded derivative.derivative asset.
Derivatives Designated as Cash Flow or Fair Value Hedging Strategies
As of May 31,November 30, 2017, and August 31, 2016,2017, we had certain derivatives designated as cash flow and fair value hedges.
Interest Rate Contracts
We have outstanding interest rate swaps with an aggregate notional amount of $495.0 million designated as fair value hedges of portions of our fixed-rate debt. Our objective in entering into these transactions is to offset changes in the fair value of the debt associated with the risk of variability in the three-month U.S. dollar LIBOR interest rate, in essence converting the fixed-rate debt to variable-rate debt. Offsetting changes in the fair values of both the swap instruments and the hedged debt are recorded contemporaneously each period and only create an impact to earnings to the extent that the hedge is ineffective. During the ninethree months ended May 31,November 30, 2017,, and 2016, we recorded offsetting fair value adjustments of $13.8$8.3 million and $7.6$13.3 million, respectively, with no ineffectiveness recorded in earnings.
In fiscal 2015, we entered into forward-starting interest rate swaps with an aggregate notional amount of $300.0 million designated as cash flow hedges of the expected variability of future interest payments on our anticipated issuance of fixed-rate debt. During the first quarter of fiscal 2016, we determined that certain of the anticipated debt issuances would be delayed; and we consequently recorded the losses on the ineffective portion of the related swaps in earnings. Additionally, we paid $6.4 million in cash to settle two of the interest rate swaps upon their scheduled termination dates. During the second quarter of fiscal 2016, we settled an additional two interest rate swaps, paying $5.3 million in cash upon their scheduled termination. In January 2016, we issued the fixed-rate debt associated with these swaps and will amortize the amounts which were previously deferred to other comprehensive income into earnings over the life of the debt. The amounts to be included in earnings are not expected to be material during any 12-month period. During the third quarter of fiscal 2016, we settled the remaining two interest rate swaps, paying $5.1 million in cash upon their scheduled termination. We did not issue additional fixed-rate debt as previously planned, and we reclassified all amounts previously recorded to other comprehensive income into earnings. As of May 31, 2017, we had no outstanding cash flow hedges.
The following table presents the pretax gains (losses) recorded in other comprehensive income relating to cash flow hedges for the three and nine months ended May 31, 2017, and 2016.
|
| | | | | | | | | | | | | | | | |
| | | For the Three Months Ended May 31, | | For the Nine Months Ended May 31, |
| | | 2017 | | 2016 | | 2017 | | 2016 |
| | | (Dollars in thousands) |
| Interest rate derivatives | | $ | — |
| | $ | — |
| | $ | — |
| | $ | (10,070 | ) |
The following table presents the pretax gains (losses) relating to cash flow hedges that were reclassified from accumulated other comprehensive loss into income for the three and nine months ended May 31, 2017, and 2016.
|
| | | | | | | | | | | | | | | | | |
| | | | For the Three Months Ended May 31, | | For the Nine Months Ended May 31, |
| | Location of Gain (Loss) | | 2017 | | 2016 | | 2017 | | 2016 |
| | | | (Dollars in thousands) |
| Interest rate derivatives | Interest expense | | $ | (435 | ) | | $ | (4,166 | ) | | $ | (1,311 | ) | | $ | (4,631 | ) |
Note 1211 Fair Value Measurements
ASC Topic 820, Fair Value Measurements and Disclosures defines fair value as the price that would be received for an asset or paid to transfer a liability (an exit price) in the principal or most advantageous market for the asset or liability in an orderly transaction between market participants on the measurement date. The standard also establishes a hierarchy for inputs used in measuring fair value, which requires an entity to maximize the use of observable inputs and minimize the use of unobservable inputs when measuring fair value. Observable inputs are inputs or market data that a market participant would obtain from sources independent of ussources to value the asset or liability. Unobservable inputs are inputs that reflect our assumptions about the factors market participants would use in valuing the asset or liability developed based upon the best information available in the circumstances. The fair value hierarchy consists of three levels. Level 1 inputs are quoted prices (unadjusted) in active markets for identical assets or liabilities. Level 2 inputs include quoted prices for similar assets or liabilities in active markets, quoted prices for identical or similar assets or liabilities in markets that are not active, and inputs (other than quoted prices) that are observable for the asset or liability, either directly or indirectly. Level 3 inputs are unobservable inputs for the asset or liability. Categorization within the valuation hierarchy is based upon the lowest level of input that is significant to the fair value measurement.
Recurring fair value measurements at May 31, 2017, and August 31, 2016, are as follows:
|
| | | | | | | | | | | | | | | |
| | May 31, 2017 |
| | Quoted Prices in Active Markets for Identical Assets (Level 1) | | Significant Other Observable Inputs (Level 2) | | Significant Unobservable Inputs (Level 3) | | Total |
| | (Dollars in thousands) |
| Assets: | |
| | |
| | |
| | |
|
| Commodity and freight derivatives | $ | 25,493 |
| | $ | 338,134 |
| | $ | — |
| | $ | 363,627 |
|
| Foreign currency derivatives | — |
| | 10,558 |
| | — |
| | 10,558 |
|
| Interest rate swap derivatives | — |
| | 9,496 |
| | — |
| | 9,496 |
|
| Deferred compensation assets | 51,710 |
| | — |
| | — |
| | 51,710 |
|
| Embedded derivative asset | — |
| | 25,047 |
| | — |
| | 25,047 |
|
| Other assets | 13,760 |
| | — |
| | — |
| | 13,760 |
|
| Total | $ | 90,963 |
| | $ | 383,235 |
| | $ | — |
| | $ | 474,198 |
|
| Liabilities: | |
| | |
| | | | |
|
| Commodity and freight derivatives | $ | 31,941 |
| | $ | 239,396 |
| | $ | — |
| | $ | 271,337 |
|
| Foreign currency derivatives | — |
| | 11,689 |
| | — |
| | 11,689 |
|
| Interest rate swap derivatives | — |
| | 1,186 |
| | — |
| | 1,186 |
|
| Crack spread contingent consideration liability | — |
| | — |
| | 1,778 |
| | 1,778 |
|
| Total | $ | 31,941 |
| | $ | 252,271 |
| | $ | 1,778 |
| | $ | 285,990 |
|
Recurring fair value measurements at November 30, 2017, and August 31, 2017, are as follows:
| | | | August 31, 2016 | November 30, 2017 |
| | Quoted Prices in Active Markets for Identical Assets (Level 1) | | Significant Other Observable Inputs (Level 2) | | Significant Unobservable Inputs (Level 3) | | Total | Quoted Prices in Active Markets for Identical Assets (Level 1) | | Significant Other Observable Inputs (Level 2) | | Significant Unobservable Inputs (Level 3) | | Total |
| | (Dollars in thousands) | (Dollars in thousands) |
| Assets: | | | | | | | | |
| | |
| | |
| | |
|
| Commodity and freight derivatives | $ | 62,538 |
| | $ | 437,654 |
| | $ | — |
| | $ | 500,192 |
| $ | 29,637 |
| | $ | 295,230 |
| | $ | — |
| | $ | 324,867 |
|
| Foreign currency derivatives | — |
| | 21,551 |
| | — |
| | 21,551 |
| — |
| | 4,297 |
| | — |
| | 4,297 |
|
| Interest rate swap derivatives | — |
| | 22,078 |
| | — |
| | 22,078 |
| — |
| | 3,596 |
| | — |
| | 3,596 |
|
| Deferred compensation assets | 50,099 |
| | — |
| | — |
| | 50,099 |
| 53,348 |
| | — |
| | — |
| | 53,348 |
|
| Deferred purchase price receivable | | — |
| | — |
| | 521,502 |
| | 521,502 |
|
| Embedded derivative asset | | — |
| | 22,271 |
| | — |
| | 22,271 |
|
| Other assets | 12,678 |
| | — |
| | — |
| | 12,678 |
| 17,784 |
| | — |
| | — |
| | 17,784 |
|
| Total | $ | 125,315 |
| | $ | 481,283 |
| | $ | — |
| | $ | 606,598 |
| $ | 100,769 |
| | $ | 325,394 |
| | $ | 521,502 |
| | $ | 947,665 |
|
| Liabilities: | | | | | | | | |
| | |
| | | | |
|
| Commodity and freight derivatives | $ | 22,331 |
| | $ | 468,971 |
| | $ | — |
| | $ | 491,302 |
| $ | 25,299 |
| | $ | 199,357 |
| | $ | — |
| | $ | 224,656 |
|
| Foreign currency derivatives | — |
| | 22,289 |
| | — |
| | 22,289 |
| — |
| | 7,556 |
| | — |
| | 7,556 |
|
| Interest rate swap derivatives | — |
| | 8 |
| | — |
| | 8 |
| — |
| | 2,641 |
| | — |
| | 2,641 |
|
| Crack spread contingent consideration liability | — |
| | — |
| | 15,051 |
| | 15,051 |
| |
| Total | $ | 22,331 |
| | $ | 491,268 |
| | $ | 15,051 |
| | $ | 528,650 |
| $ | 25,299 |
| | $ | 209,554 |
| | $ | — |
| | $ | 234,853 |
|
|
| | | | | | | | | | | | | | | |
| | August 31, 2017 |
| | Quoted Prices in Active Markets for Identical Assets (Level 1) | | Significant Other Observable Inputs (Level 2) | | Significant Unobservable Inputs (Level 3) | | Total |
| | (Dollars in thousands) |
| Assets: | | | | | | | |
| Commodity and freight derivatives | $ | 48,491 |
| | $ | 336,157 |
| | $ | — |
| | $ | 384,648 |
|
| Foreign currency derivatives | — |
| | 8,771 |
| | — |
| | 8,771 |
|
| Interest rate swap derivatives | — |
| | 9,978 |
| | — |
| | 9,978 |
|
| Deferred compensation assets | 52,414 |
| | — |
| | — |
| | 52,414 |
|
| Deferred purchase price receivable | — |
| | — |
| | 548,602 |
| | 548,602 |
|
| Embedded derivative asset | — |
| | 25,533 |
| | — |
| | 25,533 |
|
| Other assets | 14,846 |
| | — |
| | — |
| | 14,846 |
|
| Total | $ | 115,751 |
| | $ | 380,439 |
| | $ | 548,602 |
| | $ | 1,044,792 |
|
| Liabilities: | | | | | | | |
| Commodity and freight derivatives | $ | 31,189 |
| | $ | 278,573 |
| | $ | — |
| | $ | 309,762 |
|
| Foreign currency derivatives | — |
| | 19,931 |
| | — |
| | 19,931 |
|
| Interest rate swap derivatives | — |
| | 707 |
| | — |
| | 707 |
|
| Total | $ | 31,189 |
| | $ | 299,211 |
| | $ | — |
| | $ | 330,400 |
|
Commodity, freight and foreign currency derivatives — Exchange-traded futures and options contracts are valued based on unadjusted quoted prices in active markets and are classified within Level 1. Our forward commodity purchase and sales contracts with fixed-price components, ocean freight contracts and other over-the-counter ("OTC") derivatives are determined using inputs that are generally based on exchange traded prices and/or recent market bids and offers, adjusted for location specific inputs, and are classified within Level 2. The location specific inputs are generally broker or dealer quotations, or market transactions in either the listed or OTC markets. Changes in the fair values of these contracts are recognized in our Consolidated Statements of Operations as a component of cost of goods sold.
Interest rate swap derivatives — Fair values of our interest rate swap derivatives are determined utilizing valuation models that are widely accepted in the market to value these OTC derivative contracts. The specific terms of the contracts, as well as market observable inputs, such as interest rates and credit risk assumptions, are factored into the models. As all significant inputs are market observable, all interest rate swaps are classified within Level 2. Changes in the fair values of contracts not designated as hedging instruments for accounting purposes are recognized in our Consolidated Statements of Operations as a component of interest expense. See Note 11,10, Derivative Financial Instruments and Hedging Activities for additional information about interest rates swaps designated as fair value and cash flow hedges.
Deferred compensation and other assets — Our deferred compensation investments, Rabbi Trust assets and available-for-sale investments in common stock of other companies are valued based on unadjusted quoted prices on active exchanges and are classified within Level 1. Changes in the fair values of these other assets are primarily recognized in our Consolidated Statements of Operations as a component of marketing, general and administrative expenses.
Deferred purchase price receivable — The fair value of the DPP receivable included in receivables, net and other assets, is determined by discounting the expected cash flows to be received. The expected cash flows are primarily based on unobservable inputs consisting of the face amount of the Receivables adjusted for anticipated credit losses. Significant changes in the anticipated credit losses could result in a significantly higher (or lower) fair value measurement. Due to the use of significant unobservable inputs in the pricing model, including management's assumptions related to anticipated credit losses, the DPP receivable is classified as a Level 3 fair value measurement. The reconciliation of the DPP receivable for the period ended November 30, 2017, is included in Note 2, Receivables.
Embedded derivative asset — As of May 31, 2017, we had anThe embedded derivative asset of $25.0 millionrelates to reflect the fair value of an embedded derivativecontingent payments inherent to the agreement relating toin our investment in CF Nitrogen. The inputs into the fair value measurement include the probability of future upgrades and downgrades of CF Industries' credit rating based on historical credit rating movements of other public companies and the discount rates to be applied to potential annual payments based on applicable historical and current yield coupon rates. Based on these observable inputs, our fair value measurement is classified within Level 2. See Note 11,10, Derivative Financial Instruments and Hedging Activities for additional information.
Crack spread contingent consideration liability — The fair value of the contingent consideration liability related to the purchase of CHS McPherson Refinery Inc., the sole owner of our McPherson, Kansas refinery, was calculated utilizing an average price option model, an adjusted Black-Scholes pricing model commonly used in the energy industry to value options. The model uses market observable inputs and unobservable inputs. Due to significant unobservable inputs used in the pricing model, the liability is classified within Level 3.
|
| | | | | | | | |
| Quantitative Information about Level 3 Fair Value Measurements |
| Item | | Fair Value May 31, 2017 (Dollars in thousands) | | Valuation Technique | | Unobservable Input | | Input Used |
| Crack spread contingent consideration liability | | $1,778 | | Adjusted Black-Scholes option pricing model | | Forward crack spread margin quotes on May 31, 2017 (a) | | $14.56 |
| | Contractual target crack spread margin (b) | | $17.50 |
| | Expected volatility (c) | | 78.71% |
| | Risk-free interest rate (d) | | 0.94% |
| | Expected life - years (e) | | 0.25 |
(a) Represents forward crack spread margin quotes and management estimates based on the future settlement date.
(b) Represents the minimum contractual threshold that would require settlement with the counterparties.
(c) Represents quarterly adjusted volatility estimates derived from daily historical market data.
(d) Represents yield curves for U.S. Treasury securities.
(e) Represents the number of years remaining related to the final contingent payment.
Valuation processes for Level 3 measurements — Management is responsible for determining the fair value of our Level 3 financial instruments. Option pricing methods are utilized, as indicated above. Inputs used in the option pricing models are based on quotes obtained from third party vendors. Each reporting period, management reviews the unobservable inputs provided by third-party vendors for reasonableness utilizing relevant information available to us. Management also takes into consideration current and expected market trends and compares the liability’s fair value to hypothetical payments using known historical market data to assess reasonableness of the resulting fair value.
Sensitivity analysis of Level 3 measurements — The significant unobservable inputs that are susceptible to periodic fluctuations used in the fair value measurement of the accrued liability for contingent crack spread payments related to the purchase of noncontrolling interests are the adjusted forward crack spread margin and the expected volatility. Significant increases (decreases) in either of these inputs in isolation would result in a significantly higher (lower) fair value measurement. Although changes in the expected volatility are driven by fluctuations in the underlying crack spread margin, changes in expected volatility are not necessarily accompanied by a directionally similar change in the forward crack spread margin. Directional changes in the expected volatility can be affected by a multitude of factors including the magnitude of daily fluctuations in the underlying market data, market trends, timing of fluctuations, and other factors.
The following table represents a reconciliation of liabilities measured at fair value using significant unobservable inputs (Level 3) for the three months ended May 31, 2017, and 2016.
|
| | | | | | | | |
| | | Level 3 Liabilities |
| | | Crack spread contingent consideration liability |
| | | 2017 | | 2016 |
| | | (Dollars in thousands) |
| Balances, February 28, 2017, and February 29, 2016, respectively | | $ | 2,172 |
| | $ | 24,155 |
|
| Total (gains) losses included in cost of goods sold | | (394 | ) | | 506 |
|
| Balances, May 31, 2017, and 2016, respectively | | $ | 1,778 |
| | $ | 24,661 |
|
The following table represents a reconciliation of liabilities measured at fair value using significant unobservable inputs (Level 3) for the nine months ended May 31, 2017, and 2016.
|
| | | | | | | | |
| | | Level 3 Liabilities |
| | | Crack spread contingent consideration liability |
| | | 2017 | | 2016 |
| | | (Dollars in thousands) |
| Balances, August 31, 2016, and 2015, respectively | | $ | 15,051 |
| | $ | 75,982 |
|
| Total (gains) losses included in cost of goods sold | | (13,273 | ) | | (51,321 | ) |
| Balances, May 31, 2017, and 2016, respectively | | $ | 1,778 |
| | $ | 24,661 |
|
There were no material transfers between Level 1, Level 2 and Level 3 assets and liabilities during the three and nine months ended May 31, 2017, and 2016.November 30, 2017.
Note 1312 Commitments and Contingencies
Environmental
We are required to comply with various environmental laws and regulations incidental to our normal business operations. In order to meet our compliance requirements, we establish reserves for the probable future costs of remediation of identified issues, which are included in cost of goods sold and marketing, general and administrative in our Consolidated Statements of Operations. The resolution of any such matters may affect consolidated net income for any fiscal period; however, we believe any resulting liabilities, individually or in the aggregate, will not have a material effect on our consolidated financial position, results of operations or cash flows during any fiscal year.
Other Litigation and Claims
We are involved as a defendant in various lawsuits, claims and disputes, which are in the normal course of our business. The resolution of any such matters may affect consolidated net income for any fiscal period; however, we believe any resulting liabilities, individually or in the aggregate, will not have a material effect on our consolidated financial position, results of operations or cash flows during any fiscal year.
Guarantees
We are a guarantor for lines of credit and performance obligations of related, non-consolidated companies. As of May 31,November 30, 2017, our bank covenants allowed maximum guarantees of $1.0 billion, of which $101.5$101.4 million were outstanding. We have collateral for a portion of these contingent obligations. We have not recorded a liability related to the contingent obligations as we do not expect to pay out any cash related to them, and the fair values are considered immaterial. The underlying loans to the counterparties for which we provide these guarantees were current as of May 31,November 30, 2017.
Lease Commitments
On November 30, 2017, we completed a sale-leaseback transaction for our primary corporate office building located in Inver Grove Heights, Minnesota. Simultaneous with the closing of the sale, the Company entered into a 20-year operating lease arrangement with base annual rent of approximately $3.4 million during the first year, followed by annual increases of 2% through the remainder of the lease period.
Note 13 Subsequent Events
United States Tax Reform
On December 22, 2017, the Tax Cuts and Jobs Act was signed into law. The law includes significant changes to the U.S. corporate tax system, including a Federal corporate rate reduction from 35% to 21%, repeal of the Section 199 Domestic Production Activities Deduction and enactment of the Deduction for Qualified Business Income of Pass-Thru Entities. We are in the process of analyzing the legislation and determining an estimate of the financial impact. Currently, we expect to record a material tax benefit due to the revaluation of our net deferred tax liability position included in our Consolidated Balance Sheets.
ITEM 2. MANAGEMENT’S DISCUSSION AND ANALYSIS OF FINANCIAL CONDITION AND RESULTS OF OPERATIONS
GeneralThis Management's Discussion and Analysis of Financial Condition and Results of Operations ("MD&A") is intended to provide a reader of our financial statements with a narrative from the perspective of our management on our financial condition and results of operations, liquidity and certain other factors that may affect our future results. Our MD&A is presented in the following sections:
We areOverview
Business Strategy
Fiscal 2018 First Quarter Highlights
Fiscal 2018 Priorities Update
Fiscal 2018 Trends Update
Results of Operations
Liquidity and Capital Resources
Off Balance Sheet Financing Arrangements
Contractual Obligations
Critical Accounting Policies
Effect of Inflation and Foreign Currency Transactions
Recent Accounting Pronouncements
Our MD&A should be read in conjunction with our Annual Report on Form 10-K for the fiscal year ended August 31, 2017 (including the information presented therein under Risk Factors), as well as the consolidated financial statements and the related notes included in Item 1 of Part I of this Quarterly Report on Form 10-Q.
Overview
CHS Inc. is a diversified company whichthat provides grain, foods and energy resources to businesses and consumers on a global basis.scale. As a cooperative, we are owned by farmers, ranchers and their member cooperatives across the United States. We also have preferred stockholdersshareholders that own shares of our five series of preferred stock, all of which are each listed and traded on the NASDAQNasdaq Global Select Market. We operate in the following four reportable segments:
We provide a full rangeEnergy Segment - produces and provides primarily for the wholesale distribution of production agricultural inputs such as refined fuels, propane, farm supplies, animal nutritionpetroleum products and agronomy products, as well as services, which include hedging, financingtransportation of those products.
Ag Segment - purchases and insurance services. We ownfurther processes or resells grains and operate petroleum refineries and pipelines and market and distribute refined fuels and other energy products under the Cenex® brand through a network ofoilseeds originated by our country operations business, by our member cooperatives and independents retailers. We purchase grainsby third parties and oilseeds directlyalso serves as a wholesaler and indirectly from agricultural producers primarilyretailer of crop inputs.
Nitrogen Production Segment - consists solely of our equity method investment in the midwesternCF Industries Nitrogen, LLC ("CF Nitrogen") and western United States. These grainsproduces and oilseeds are either sold to domesticdistributes nitrogen fertilizer, a commodity chemical.
Foods Segment - consists solely of our equity method investment in Ventura Foods, LLC ("Ventura Foods") and international customers or further processed by us intois a varietyprocessor and distributor of grain-basededible oils used in food products or renewable fuels.
The following discussion makes reference toIn addition, other operating activities, primarily our Energy, Ag, Nitrogen Production and Foods reportable segments,non-consolidated wheat milling joint venture, as well as our financing, hedging and insurance operations, have been aggregated within Corporate and Other.
The consolidated financial statements include the accounts of CHS and all of our wholly-owned and majority-owned subsidiaries and limited liability companies. The effects of all significant intercompany transactions have been eliminated.
Corporate administrative expenses and interest are allocated to each reporting segment, along with Corporate and Other, category. See Note 10, based on direct usage for services, such as information technology and legal, and other factors or considerations relevant to the costs incurred.
Management's FocusSegment Reporting. , toWhen evaluating our unaudited consolidatedoperating performance, management focuses on gross profit and income before income taxes. As a company that operates heavily in commodities, there is significant unpredictability and volatility in pricing and costs. As such, we focus on managing the margin we can earn and the resulting income before income taxes. Management also focuses on ensuring the strength of the balance sheet through the appropriate management of financial statements included in this Quarterly Report on Form 10-Q for more information regarding our reportable segments.liquidity, working capital, capital deployment, capital resources and overall leverage.
Seasonality. Many of our business activities are highly seasonal and our operating results vary throughout the year. Our revenues and income are generally lowest during the second and fourth fiscal quarters and highest during the first and third fiscal quarters. For example, in our Ag segment, our crop nutrients and country operations businesses generally experience higher volumes and income during the spring planting season and in the fall, which corresponds to harvest. Our grain marketing operations are also subject to fluctuations in volume and earnings based on producer harvests, world grain prices and demand. Our Energy segment generally experiences higher volumes and profitability in certain operating areas, such as refined products, in the summer and early fall when gasoline and diesel fuel usage by our agricultural producers is highest and is subject to global supply and demand forces. Other energy products, such as propane, may experience higher volumes and profitability during the winter heating and fall crop drying seasons. The graphs below depict the seasonality inherent in our business.
* It should be noted the third quarter of fiscal 2017 was impacted by material charges that caused income (loss) before income taxes for that period to deviate from historical trends.
Pricing. Our revenues, assets and cash flows can be significantly affected by global market prices for commodities such as petroleum products, natural gas, ethanol, grains, oilseeds,oilseed products and crop nutrients and flour.nutrients. Changes in market prices for commodities that we purchase without a corresponding change in the selling prices of those products can affect revenues and operating earnings. Commodity prices are affected by a wide range of factors beyond our control, including the weather, crop damage due to disease or insects, drought, the availability and availability/adequacy of supply of the related commodity, government regulations and regulations/policies, world events and general politicalpolitical/economic conditions.
Business Strategy
Our business strategy is to help our owners grow by maximizing returns and optimizing our various operations to ensure that our core businesses are strategically positioned today and for the future. We are focusing on improving efficiency and, when necessary, disposing of assets that that are not strategic and/or do not meet our internal measurement expectations. We are also focused on maintaining financial flexibility by optimizing debt levels and ensuring adequate financial liquidity so we can effectively operate throughout the agriculture and energy economic conditions.cycles.
Fiscal 2018 First Quarter Highlights
Margins were lower in our Ag segment compared to prior year results; however, we did see improvements in our Energy business compared to the prior year.
Long-term debt (including the current portion) was reduced by $172.0 million by monetizing certain assets and actively managing cash flow.
Continued our active management of the balance sheet which resulted in the decision that no cash patronage would be issued in fiscal 2018 for fiscal 2017 results, and equity retirements would be limited to $10 million for estates.
Fiscal 2018 Priorities Update
During the three months ended November 30, 2017, we continue to make improvements in our management of risk and the granting of credit through enhancements in the related policies, practices and operations. We finalized decisions to dispose of certain assets within our Ag segment that were determined to not be strategic and were not meeting our performance expectations. We also continued our focus on restoring financial flexibility by monetizing certain assets and paying down long-term debt.
Fiscal 2018 Trends Update
Our business is cyclical and the Ag and Energy industries are currently in ana challenging environment characterized by reduced commodity prices, lower margins, reduced liquidity and increased debt.leverage. We are unable to predict how long this current environment will last or how severe it may be.will ultimately be; however, at this time, although there was an increase in Energy margins in the first quarter of fiscal 2018, we do not foresee significant changes to the core economic environment during the remainder of fiscal 2018. During this period, we along with our competitors and customers, expect our revenues, margins and cash flows from our core operations to continue to be under pressure.
As we operate in this challenging environment, we have taken and continue to take prudent actions to restore our financial flexibility. These actions include actively managing expenses, reducing debt balances, optimizing working capital, and limiting capital investment beyond that needed to maintain the safety and compliance
Results of Operations
ComparisonConsolidated Statements of the three months ended May 31, 2017, and May 31, 2016Operations
|
| | | | | | | |
| | For the Three Months Ended November 30 |
| | 2017 | | 2016 |
| | (Dollars in thousands)
|
| Revenues | $ | 8,048,889 |
| | $ | 8,048,250 |
|
| Cost of goods sold | 7,735,627 |
| | 7,695,553 |
|
| Gross profit | 313,262 |
| | 352,697 |
|
| Marketing, general and administrative | 140,168 |
| | 147,849 |
|
| Reserve and impairment charges (recoveries), net | (3,787 | ) | | 18,357 |
|
| Operating earnings (loss) | 176,881 |
| | 186,491 |
|
| (Gain) loss on investments | (2,819 | ) | | 7,401 |
|
| Interest expense | 40,702 |
| | 38,265 |
|
| Other (income) loss | (22,195 | ) | | (44,401 | ) |
| Equity (income) loss from investments | (38,362 | ) | | (40,328 | ) |
| Income (loss) before income taxes | 199,555 |
| | 225,554 |
|
| Income tax expense (benefit) | 19,936 |
| | 16,612 |
|
| Net income (loss) | 179,619 |
| | 208,942 |
|
| Net income (loss) attributable to noncontrolling interests | (464 | ) | | (208 | ) |
| Net income (loss) attributable to CHS Inc. | $ | 180,083 |
| | $ | 209,150 |
|
General. We recorded a lossThe charts below detail revenues and income (loss) before income taxes by reportable segment for the first quarter of $209.2 million during the three months ended May 31, 2017, compared to income before income taxes of $194.5 million during the three months ended May 31, 2016, a decrease of $403.7 million. Operating results reflected decreases in pretax income in our Energy, Ag,fiscal 2018. Our Nitrogen Production and Foods reportable segments along with Corporaterepresent equity methods investments, and Other.as such record earnings and allocated expenses but not revenue.
Our 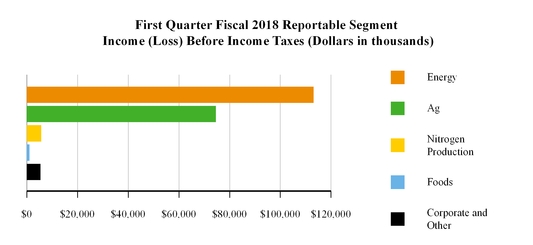
Income (Loss) Before Income Taxes by Segment
Energy segment generated a loss
|
| | | | | | | | | | | | | | |
| | For the Three Months Ended November 30
| | Change |
| | 2017 | | 2016 | | Dollars | | Percent |
| | (Dollars in thousands) |
| Income (loss) before income taxes | $ | 113,083 |
| | $ | 69,983 |
| | $ | 43,100 |
| | 61.6 | % |
The following table and commentary present the primary reasons for the changes in income (loss) before income taxes of $9.3 million("IBIT") for the Energy segment for the three months ended May 31,November 30, 2017, compared to generatingthe prior year:
|
| | | | |
| | | Change |
| | | Three Months Ended November 30 |
| | | (Dollars in millions) |
| Volume | | $ | (1 | ) |
| Price | | 37 |
|
| Other* | | 2 |
|
Non-gross profit related activity+ | | 5 |
|
| Total change in Energy IBIT | | $ | 43 |
|
* Other includes retail and non-commodity type activities.
+ See commentary related to these changes in the marketing, general and administrative expenses, (gain) loss on investments, interest expense, other income before income taxes(loss) and equity (income) loss from investments sections of $109.4 millionthis Results of Operations.
Comparison of Energy segment IBIT for the three months ended May 31,November 30, 2017, and 2016 representing a decrease of $118.7
The $43.1 million primarilyincrease in the Energy segment IBIT reflects the following:
Primarily driven by improved margins within refined fuels, caused by lower market inventories in the energy industry due to significantly reduced refining margins, a $32.7 million impairment charge incurred during the third quarter of fiscal year 2017 associated with the cancellation of a capital project and a $80.2 million benefitan active hurricane season in the third fiscal quarterGulf of Mexico which resulted in oil production and refining operations being temporarily suspended in major centers of production along a critical portion of the prior year associated with the recovery of lower of cost or market charges that did not reoccur in the current year. Our propane, transportation, and lube businesses experienced decreases in earnings compared to the same periodGulf coast of the prior year. United States, driving prices higher.
This increase was partially offset by a 3% decrease in volumes in Refined Fuels.
We are subject to the Renewable Fuels Standard program ("RFS"), which requires all refiners to blend renewable fuels (e.g., ethanol, biodiesel) into their finished transportation fuels or purchase renewable energy credits, known as Renewable Identification Numbers ("RINs"), in lieu of blending. The Environmental Protection Agency ("EPA") generally establishes new annual renewable fuelsfuel percentage standards for each compliance year in the preceding year. We generate RINs under the RFS in our renewable fuels operations and through our blending activities at our terminals, howeverterminals. However, we cannot generate enough RINs to meet the needs of our refining capacity and therefore RINs must be purchased on the open market. The price of RINs can be volatile. On November 23, 2016,30, 2017, the EPA released the final mandate for 2017, and as a result the RINs market price increased in our first fiscal quarter. Subsequent changes in the price of RINs resulted in no material impact on our financial results.year 2018.
Ag
Table of Contents |
| | | | | | | | | | | | | | |
| | For the Three Months Ended November 30
| | Change |
| | 2017 | | 2016 | | Dollars | | Percent |
| | (Dollars in thousands) |
| Income (loss) before income taxes | $ | 74,519 |
| | $ | 109,213 |
| | $ | (34,694 | ) | | (31.8 | )% |
Our Ag segment generated a loss before income taxes of $221.2 million and income before income taxes of $24.2 million for the three months ended May 31, 2017, and May 31, 2016, respectively, which represents a decrease of $245.4 million. Our grain marketing earnings decreased by $231.2 million during the three months ended May 31, 2017, compared with the three months ended May 31, 2016, due almost entirely to increased bad debt expense and the recording of a reserve, both associated with a trading partner of ours in Brazil entering bankruptcy proceedings under Brazilian law. Our processing and food ingredients business earnings decreased by $9.2 million during the three months ended May 31, 2017, compared with the three months ended May 31, 2016, primarily due to impairment charges taken on certain assets in the three months ended May 31, 2017 that were greater than the bad debt charge associated with a specific customer in the same three-month period of the previous year. Our wholesale crop nutrients business earnings decreased by $5.8 million for the three months ended May 31, 2017, compared with the three months ended May 31, 2016, primarily due to decreased margins. Earnings from our renewable fuels marketing and production operations decreased $2.0 million for the three months ended May 31, 2017, compared with the three months ended May 31, 2016, due primarily to lower margins in our production operations. Our country operations earnings increased $3.2 million during the three months ended May 31, 2017, compared to the same three-month period of the previous year, due primarily to increased volumes.
Our Nitrogen Production segment generated income before income taxes of $8.7 million during the three months ended May 31, 2017, compared to income before income taxes of $25.0 million during the three months ended May 31, 2016. The decrease of $16.3 million is primarily due to lower equity income. This segment consists solely of our equity method investment in CF Nitrogen. See Note 4, Investments, to our unaudited consolidated financial statements included in this Quarterly Report on Form 10-Q for more information on this investment.
Our Foods segment, which was previously reported as a component of Corporate and Other, generated income before income taxes of $7.1 million during the three months ended May 31, 2017, representing a decrease of $9.9 million compared to income before income taxes of $17.0 million in the same period of the prior year, primarily due to reduced margins. This segment consists solely of our equity method investment in Ventura Foods.
Corporate and Other generated income before income taxes of $5.6 million during the three months ended May 31, 2017, compared to $18.9 million during the three months ended May 31, 2016, a decrease in earnings of $13.3 million. Our equity earnings from our Ardent Mills joint venture increased $1.2 million, net of allocated expenses, while earnings from Business Solutions decreased $2.6 million and Other earnings decreased by $11.9 million.
Net Income/Loss attributable to CHS Inc. Consolidated net loss attributable to CHS Inc. for the three months ended May 31, 2017, was $45.2 million compared to a net gain attributable to CHS Inc. of $190.3 million for the three months ended May 31, 2016, which represents a $235.5 million decrease, and is driven by the factors described above.
Revenues. Consolidated revenues were $8.6 billion for the three months ended May 31, 2017, compared to $7.8 billion for the three months ended May 31, 2016, representing an increase of $817.5 million (10%).
Our Energy segment revenues of $1.5 billion, after elimination of intersegment revenues, increased by $293.7 million (24%) during the three months ended May 31, 2017, compared to the three months ended May 31, 2016. See Note 10, Segment Reporting, to our unaudited consolidated financial statements included in this Quarterly Report on Form 10-Q for eliminated amounts. Refined fuels revenues increased $270.8 million (27%) when compared to the same period of the prior year, of which $201.2 million was related to higher prices with the remaining increase attributed to higher volumes. The sales price of refined fuels increased $0.26 (19%) per gallon and volumes increased approximately 7% when compared to the same period of the prior year. Propane revenues increased $15.1 million (16%), all of which related to higher net average selling prices when compared to the same period in fiscal 2016. The average selling price of propane increased $0.09 (16%) per gallon when compared to the same period of the prior year.
Our Ag segment revenues of $7.1 billion, after elimination of intersegment revenues, increased $522.7 million (8%) during the three months ended May 31, 2017, compared to the three months ended May 31, 2016. See Note 10, Segment Reporting, to our unaudited consolidated financial statements included in this Quarterly Report on Form 10-Q for eliminated amounts.
Grain revenues in our Ag segment were $4.4 billion and $3.7 billion for the three months ended May 31, 2017, and 2016, respectively. The increase in grain revenues was the result of higher average sales prices of $142.9 million and an increase in net volume of $585.0 million during the three months ended May 31, 2017, compared to the same period of the prior year. Wheat, corn and soybean volumes increased by approximately 6% compared to the three months ended May 31, 2016.
Our processing and food ingredients revenues in our Ag segment of $337.2 million decreased $56.5 million (14%) during the three months ended May 31, 2017, compared to the three months ended May 31, 2016. For the three months ended May 31, 2017, the net decrease in revenues is comprised of a $36.1 million decrease due to the sale of an international location in the prior year plus a $148.1 million (38%) decrease in volumes, which was primarily associated with the disposal of our overseas processing and food ingredient operations in the current year. This decrease was partially offset by an increase in the average selling price of our oilseed products of $127.7 million compared to the three months ended May 31, 2016. The average sales price of all oilseed commodities sold reflected an increase of $5.35 (52%) per bushel compared to the same period of the previous year.
Wholesale crop nutrient revenues in our Ag segment totaled $681.9 million, a decrease of $88.1 million (11%) during the three months ended May 31, 2017, compared to the three months ended May 31, 2016. The wholesale crop nutrient revenues decrease consisted of $116.6 million associated with lower average selling prices, partially offset by an increase of $28.5 million in volume during the three months ended May 31, 2017, compared to the same period of the previous year. The average sales price of all fertilizers sold decreased $43.42 (15%) per ton compared to the same period of the previous year. Our wholesale crop nutrient volumes increased 4% compared with the three months ended May 31, 2016.
Our renewable fuels revenue from our marketing and production operations decreased by $7.3 million during the three months ended May 31, 2017, when compared with the same period from the previous year. Our lower renewable fuels revenues were the result of decreased volumes of $20.3 million (5%), partially offset by an increase in average selling prices of $13.0 million (4%) during the three months ended May 31, 2017, compared to the same period of the prior year.
Our Ag segment other product revenues, primarily feed and farm supplies, of $1.2 billion decreased by $56.0 million (5%) during the three months ended May 31, 2017, compared to the three months ended May 31, 2016. The reduction was primarily the result of a decrease in our country operations feed, plant food and sunflower sales due to decreased volumes related to lower demand, particularly in the sunflower market.
Total revenues also include other revenues generated primarily within our Ag segment and Corporate and Other. Our Ag segment’s country operations elevators and agri-service centers derive other revenues from activities related to production agriculture, which include grain storage, grain cleaning, fertilizer spreading, crop protection spraying and other services of this nature, and our grain marketing operations receive other revenues at our export terminals from activities related to loading vessels. Corporate and Other derives revenues primarily from our financing, hedging and insurance operations.
Cost of Goods Sold. Consolidated cost of goods sold was $8.4 billion for the three months ended May 31, 2017, compared to $7.5 billion for the three months ended May 31, 2016, representing an $887.9 million (12%) increase.
Our Energy segment cost of goods sold of $1.5 billion, after elimination of intersegment costs, increased by $382.1 million (35%) during the three months ended May 31, 2017, compared to the three months ended May 31, 2016. The refined fuels increase of $341.4 (38%) million was driven by a $0.36 (29%) increase to the average cost per gallon ($280.1 million) and an increase in volumes ($61.3 million or 7%). For the three months ended May 31, 2017, cost of goods sold for propane increased $20.9 million (22%), primarily from an average cost increase of $0.13 (22%) per gallon when compared to the three months ended May 31, 2016.
Our Ag segment cost of goods sold of $6.9 billion, after elimination of intersegment costs, increased $494.9 million (8%) during the three months ended May 31, 2017, compared to the three months ended May 31, 2016. Grain cost of goods sold in our Ag segment totaled $4.3 billion and $3.6 billion during the three months ended May 31, 2017, and 2016, respectively. The cost of grains and oilseed procured through our Ag segment increased $731.3 million (20%) compared to the three months ended May 31, 2016. This is primarily the result of a $575.6 million increase in volumes and an increase in average cost of $155.7 million. The average month-end market price per bushel of spring wheat increased while the average month-end market price per bushel of corn and soybeans decreased compared to the same period of the previous year.
Our processing and food ingredients cost of goods sold in our Ag segment of $324.6 million decreased $75.8 million (19%) during the three months ended May 31, 2017, compared to the three months ended May 31, 2016. The net decrease is comprised of a $32.4 million decrease due to the sale of an international location in the prior year plus a decrease in volumes of $150.6 million, partially offset by a $107.2 million increase associated with a higher average cost. Typically, changes in costs are primarily due to changes in the cost of oilseeds purchased.
Wholesale crop nutrients cost of goods sold in our Ag segment totaled $651.0 million and decreased $84.3 million (11%) during the three months ended May 31, 2017, compared to the three months ended May 31, 2016. The net decrease is
comprised of a $111.4 million decrease related to average cost, partially offset by a $27.2 million increase associated with higher volumes, when compared toThe following table and commentary present the same period ofprimary reasons for the previous year.
Renewable fuels cost of goods sold from our marketing and production operations decreased $13.0 million (3%) duringchanges in IBIT for the three months ended May 31, 2017, due to a decrease in volumes sold of 5%, partially offset by an increase in average cost per gallon of 2%, when compared with the same period of the previous year.
Our Ag segment other product cost of goods sold, primarily feed and farm supplies, decreased $331.8 million (30%) during the three months ended May 31, 2017, compared to the three months ended May 31, 2016. This decrease was due mostly to lower volumes when compared to the same period of the previous year.
Marketing, General and Administrative. Marketing, general and administrative expenses of $153.5 million for the three months ended May 31,November 30, 2017, increased by $10.1 million (7%) compared to the three months ended May 31, 2016. This change was primarily driven by increased compensation costs which was mostly dueprior year:
|
| | | | |
| | | Change |
| | | Three Months Ended November 30 |
| | | (Dollars in millions) |
| Volume | | $ | (7 | ) |
| Price | | (41 | ) |
| Other* | | (18 | ) |
Impairment+ | | 22 |
|
Non-gross profit related activity+ | | 9 |
|
| Total change in Ag IBIT | | $ | (35 | ) |
* Other includes retail and non-commodity type activities.
+ See commentary related to separationthese changes in the marketing, general and administrative expenses, associated with the departure of our chief executive officer and to a lesser extent, higher consulting fees.
Reserve and impairment charges. Reservereserve and impairment charges (recoveries), net, (gain) loss on investments, interest expense, other income (loss) and equity (income) loss from investments sections of $323.9 millionthis Results of Operations.
Comparison of Ag segment IBIT for the three months ended May 31,November 30, 2017, and 2016
The $34.7 million decrease in Ag segment IBIT reflects the following:
Grain marketing IBIT decreased primarily due to lower grain volumes and associated margins.
Country operations IBIT increased by $297.9due to improved margins along with a gain of approximately $7.1 million compareddue to the same periodsale of a non-strategic North American location, a gain on the sale of a domestic investment of $2.2 million, and recognition of approximately $5.3 million associated with the recovery of a loan that was written off in the prior fiscal year. The fiscal 2016
Processing and food ingredients IBIT decreased primarily caused by lower margins along with one-time severance charges relate solely to bad debt expense. The increaseand other costs associated with held for sale assets.
Crop nutrients IBIT increased, driven by higher associated margins.
Renewable fuels marketing and production operations IBIT decreased primarily resulting from lower margins.
All Other Segments
|
| | | | | | | | | | | | | | |
| | For the Three Months Ended November 30
| | Change |
| | 2017 | | 2016 | | Dollars | | Percent |
| | (Dollars in thousands) |
| Nitrogen Production IBIT | $ | 5,666 |
| | $ | 27,037 |
| | $ | (21,371 | ) | | (79.0 | )% |
| Foods IBIT | $ | 973 |
| | $ | 10,572 |
| | $ | (9,599 | ) | | (90.8 | )% |
| Corporate and Other IBIT | $ | 5,314 |
| | $ | 8,749 |
| | $ | (3,435 | ) | | (39.3 | )% |
Comparison of All Other Segments IBIT for the three months ended May 31, 2017, primarily relates to a Brazil trading partner in our Ag segment entering into bankruptcy proceedings under Brazilian law during our third quarter of fiscal 2017, which resulted in charges of $229.4 million. Additionally, we recorded a $32.7 million impairment charge associated with the cancellation of a capital project in our Energy segment during the third quarter of fiscalNovember 30, 2017, and a charge of $51.8 million related to the impairment of long-lived assets and goodwill in our Ag segment.
Gain/Loss on Investments. Gain on investments for the three months ended May 31, 2017, was $0.4 million compared to $0.7 million for the three months ended May 31, 2016.
Interest expense. Interest expense of $39.2 million for the three months ended May 31, 2017, increased $1.7 million compared to the three months ended May 31, 2016. The majority of the increase was primarily due to lower capitalized interest of $4.9 million associated with our ongoing capital projects, partially offset by lower interest expense of $3.2 million associated with lower debt balances.
Other income. Other income totaled $11.6 million for the three months ended May 31, 2017, an increase of $0.8 million compared to the three months ended May 31, 2016.
Equity Income from Investments. Equity income from investments of $48.4 million for the three months ended May 31, 2017, decreased $24.1 million compared to the three months ended May 31, 2016. The decrease was primarily related to lower equity income recognized by our equity method investments in CF Nitrogen and Ventura Foods, partially offset by higher equity income recognized by our equity method investments in TEMCO and Ardent Mills. See Note 4, Investments, to our unaudited consolidated financial statements included in this Quarterly Report on Form 10-Q for more information. We record equity income or loss primarily from the investments in which we have an ownership interest of 50% or less and have significant influence, but not control, for our proportionate share of income or loss reported by the entity, without consolidating the revenues and expenses of the entity in our Consolidated Statements of Operations.
Income Taxes. We recorded an income tax benefit of $163.0 million for the three months ended May 31, 2017, compared with an income tax expense of $4.8 million for the three months ended May 31, 2016 resulting in effective tax rates of (77.9%) and 2.5%, respectively. The tax benefit for the three months ended May 31, 2017, is primarily due to the recognition of deferred tax benefits related to the issuance of non-qualified equity certificates in fiscal 2013 and 2014 and the bad debt deduction in our U.S. tax returns related to the performance of guarantees caused by an approximately $230.0 million loss related to a Brazilian trading partner of ours entering into bankruptcy proceedings under Brazilian law. The federal and state statutory rate applied to nonpatronage business activity was 38.3% for both the three months ended May 31, 2017, and 2016. The income taxes and effective tax rate vary each year based upon profitability and nonpatronage business activity during each of the comparable years.
Comparison of the nine months ended May 31, 2017, and May 31, 2016
General. We recorded income before income taxes of $40.0 million during the nine months ended May 31, 2017, compared to $407.9 million during the nine months ended May 31, 2016, a decrease of $367.9 million. Operating results reflect decreases in pretax income in our Energy, Ag, and Foods segments along with Corporate and Other, partially offset by an increase in pretax income in our Nitrogen Production segment.
Our Energy segment generated income before income taxes of $77.3 million for the nine months ended May 31, 2017, compared to $239.2 million in the nine months ended May 31, 2016, representing a decrease of $161.9 million (68%), primarily due to significantly reduced refining margins and a $32.7 million impairment charge associated with the cancellation of a capital project during the third quarter of fiscal 2017. Our lubricants and transportation businesses earnings remained flat, partially offset by increased earnings in our propane business compared to the same period of the prior year. We are subject to the RFS which requires all refiners to blend renewable fuels (e.g. ethanol, biodiesel) into their finished transportation fuels or purchase renewable energy credits, known as RINs, in lieu of blending. The EPA generally establishes new annual renewable fuels percentage standards for each compliance year in the preceding year. We generate RINs under the RFS in our renewable fuels operations and through our blending activities at our terminals, however we cannot generate enough RINs to meet the needs of our refining capacity and therefore RINs must be purchased on the open market. The price of RINs can be volatile. On November 23, 2016, the EPA released the final mandate for 2017, and as a result the RINs market price increased in our first fiscal quarter. Subsequent changes in the price of RINs resulted in no material impact on our financial results.
Our Ag segment generated a loss before income taxes of $121.3 million for the nine months ended May 31, 2017, compared to income before income taxes of $62.4 million in the nine months ended May 31, 2016, a decrease in earnings of $183.7 million. Our grain marketing earnings decreased $168.9 million during the nine months ended May 31, 2017, compared with the same period in the prior year, primarily due to increased bad debt expense and the recording of a reserve, both associated with a trading partner of ours in Brazil entering bankruptcy proceedings under Brazilian law. Our country operations earnings decreased $40.3 million during the nine months ended May 31, 2017, compared with the same period in the prior year, due primarily to the increase in a specific loan loss reserve related to a single producer borrower. Our processing and food ingredients businesses experienced a decrease in earnings of $13.3 million for the nine months ended May 31, 2017, compared to the same period of the previous year, primarily due to impairment charges taken on certain assets in the current year that were greater than the bad debt charge associated with a specific customer in the prior year that did not recur in the current year. Earnings from our wholesale crop nutrients business increased $25.2 million for the nine months ended May 31, 2017, compared with the same period in fiscal 2016, primarily due to increased volumes and margins. Earnings from our renewable fuels marketing and production operations increased $12.8 million for the nine months ended May 31, 2017, compared with the nine months ended May 31, 2016, primarily due to higher margins.
Our Nitrogen Production segment generated income before income taxes of $41.2 million during the nine months ended May 31, 2017, compared to $26.3 million in the nine months ended May 31, 2016, an increase of $14.9 million. The increase is primarilyIBIT decreased due to a gain in the prior year of $30.1$29.1 million associated with an embedded derivative asset inherent in the agreement relating to our investment in CF Nitrogen for which there was no comparable gain in the priorcurrent fiscal year. This was partially offset by lowerhigher equity income.method income in the current year driven by improved prices on urea and urea ammonium nitrate, which are produced and sold by CF Nitrogen. See Note 4, Investments, of the notes to our unauditedthe consolidated financial statements that are included in this Quarterly Report on Form 10-Q for more informationadditional information. Our Foods segment IBIT decreased in the first quarter of fiscal 2018 due to lower margins earned by Ventura Foods, as its customers put significant pressure on this investment.pricing and it experienced acquisition integration challenges. Corporate and Other IBIT decreased due to lower earnings from our wheat milling joint venture and reduced interest revenue from our financing group resulting from the sale of loans receivable.
Our Foods
Revenues by Segment
Energy
|
| | | | | | | | | | | | | | |
| | For the Three Months Ended November 30
| | Change |
| | 2017 | | 2016 | | Dollars | | Percent |
| | (Dollars in thousands) |
| Revenue | $ | 1,950,499 |
| | $ | 1,590,093 |
| | $ | 360,406 |
| | 22.7 | % |
The following table and commentary present the primary reasons for the changes in revenue for the Energy segment which was previously reported as a component of Corporate and Other, generated income before income taxes of $20.7 million duringfor the ninethree months ended May 31,November 30, 2017, representing a decrease of $26.2 million compared to income before income taxesthe prior year: |
| | | | |
| | | Change |
| | | Three Months Ended November 30 |
| | | (Dollars in millions) |
| Volume | | $ | (36 | ) |
| Price | | 377 |
|
| Other* | | 19 |
|
| Total change in Energy revenue | | $ | 360 |
|
* Other includes retail and non-commodity type activities.
Comparison of $46.9Energy segment revenue for the three months ended November 30, 2017, and 2016
The $360.4 million increase in Energy revenue reflects the following:
Refined fuels revenues rose $257.7 million (20%), of which approximately $298.0 million related to an increase in the same period ofnet average selling price, partially offset by $40.3 million related to lower sales volumes, compared to the prior year. The decreaseselling price of refined fuels products increased an average of $0.36 (24%) per gallon, and sales volumes decreased 3%, compared to the previous year.
Propane revenues increased $87.9 million (57%), of which $78.0 million was driven mainly by reduced margins. This segment consists solelyattributable to a rise in the net average selling price and $9.9 million was attributable to higher volumes. Propane sales volume increased 6% and the average selling price of our equity method investment in Ventura Foods.propane increased $0.31 (47%) per gallon, when compared to the previous year.
CorporateAg
|
| | | | | | | | | | | | | | |
| | For the Three Months Ended November 30
| | Change |
| | 2017 | | 2016 | | Dollars | | Percent |
| | (Dollars in thousands) |
| Revenue | $ | 6,082,647 |
| | $ | 6,432,229 |
| | $ | (349,582 | ) | | (5.4 | )% |
The following table and Other generated income before income taxes of $22.1 millioncommentary present the primary reasons for the ninechanges in revenue for the Ag segment for the three months ended May 31,November 30, 2017, compared to $33.2 million during the same period of the previous year, a decrease in earnings of $11.1 million. Our equity earnings from our Ardent Mills joint venture increased $6.9 million, net of allocated expenses, while earnings from Business Solutions decreased $2.8 millionprior year:
|
| | | | |
| | | Change |
| | | Three Months Ended November 30 |
| | | (Dollars in millions) |
| Volume | | $ | (360 | ) |
| Price | | 4 |
|
| Other* | | 6 |
|
| Total change in Ag revenue | | $ | (350 | ) |
* Other includes retail and earnings from Other decreased $15.2 million.non-commodity type activities.
Net Income attributable to CHS Inc. Consolidated net income attributable to CHS Inc. for the nine months ended May 31, 2017, was $178.5 million compared to $425.8 million for the nine months ended May 31, 2016, which represents a decrease of $247.3 million and is driven by the factors described above.
Revenues. Consolidated revenues were $24.0 billion for the nine months ended May 31, 2017, compared to $22.2 billion for the nine months ended May 31, 2016, which represents a $1.8 billion increase (8%).
Our EnergyComparison of Ag segment revenues of $4.6 billion, after elimination of intersegment revenues, increased by $658.0 million (17%) duringrevenue for the ninethree months ended May 31,November 30, 2017 comparedand 2016
The $349.6 million decrease in Ag segment revenue reflects the following:
Grain and oilseed revenues attributable to country operations and grain marketing totaled $4.4 billion and $4.7 billion for the ninethree months ended May 31, 2016. See Note 10, Segment Reporting, to our unaudited consolidated financial statements included in this Quarterly Report on Form 10-Q for eliminated amounts. Refined fuels revenues increased $546.7 million (18%) during the nine months ended May 31, 2017, of which approximately $412.7 million related to an increase in the net average selling price and $134.0 million related to an increase in sales volumes, compared to the same period in the previous year. The sales price of refined fuels products increased $0.18 (13%) per gallon, and sales volumes increased by 4%, when compared to the same nine-month period of the previous year. Propane revenues increased $90.3 million (21%), of which $75.5 million was related to an increase in the net average selling price and $14.8 million was attributable to an increase in volumes. Propane sales volume increased 4%, and the average selling price of propane increased $0.11 (17%) per gallon in comparison to the same period of the previous year.
Our Ag segment revenues of $19.3 billion, after elimination of intersegment revenues, increased $1.1 billion (6%) during the nine months ended May 31, 2017, compared to the nine months ended May 31, 2016. See Note 10, Segment Reporting, to our unaudited consolidated financial statements included in this Quarterly Report on Form 10-Q for eliminated amounts.
Grain revenues in our Ag segment totaled $13.5 billion and $11.9 billion during the nine months ended May 31,November 30, 2017, and 2016, respectively. Of theThe grain revenues increaseand oilseed revenue decrease of $1.5 billion (13%), approximately $305.2$338.1 million is due(7%) was attributable to increaseda decline in volumes of $368.6 million, partially offset by $30.5 million in higher average grain selling prices and $1.2 billion is due to an increase in volume during the nine months ended May 31, 2017, compared to the same period in the prior year.prices. The average sales price of all grain and oilseed commodities sold reflected an increase of $0.12 (2%)increased $0.04 per bushel over the same nine-month period in the previous year.bushel. Wheat, corn and soybean volumes increaseddecreased by approximately 5%8% compared to the nine months ended May 31, 2016.
Our processing and food ingredients revenues in our Ag segment of $1.1 billion decreased $133.3 million (11%) during the nine months ended May 31, 2017, compared to the nine months ended May 31, 2016.prior year. The net decrease in revenues is comprised of a $140.8 million decrease due to the sale of an international location in the prior year plus a $343.1 million (29%) decrease in volumes partially offset by an increase in the average selling price of our oilseed products of $350.6 million compared to the nine months ended May 31, 2016. The average sales price of all oilseed commodities sold reflected an increase of $4.67 (42%) per bushel compared to the same period of the previous year.
Wholesale crop nutrient revenues in our Ag segment totaled $1.5 billion, which decreased $104.2 million (6%) during the nine months ended May 31, 2017, compared to the nine months ended May 31, 2016. Of the decrease noted, $392.9 million was relateddue to lower average fertilizer selling prices, partially offset by an increase of $288.8 million due to higher volumes during the nine months ended May 31, 2017,export activity compared to the same period in the prior year.year caused by increased global competition.
Our processing and food ingredients revenue decreased $26.8 million, primarily due to a $11.7 million decline resulting from the prior-year sale of an international location, along with a decline in volumes of $24.5 million (7%). These declines were partially offset by an average sales price increase of $0.39 (3%) per bushel or $9.4 million related to our oilseed commodities.
Wholesale crop nutrient revenues attributable to crop nutrients and grain marketing decreased $3.9 million due to lower average fertilizer selling prices of $21.2 million, partially offset by higher volumes of $17.3 million. Our wholesale crop nutrient volumes increased 18% compared with4% and the same period in the previous year. The average sales price of all fertilizers sold reflected a decrease of $64.18$12.72 (5%) per ton (20%) compared withto the same period ofprior year. The increase in volumes was due to improved market conditions from the previous year.
prior year as well as supply chain management improvements.
Our renewable fuels revenuerevenues from our marketing and production operations decreased $4.8$13.7 million (less than 1%) during the nine months ended May 31, 2017, when compared with the same period from the previous year. Our lower renewable fuels revenues areprimarily the result of a volume decreaselower average sales price of $66.2$0.11 (7%) per gallon or $24.1 million, (6%), mostlypartially offset by a $61.4 million (6%) increase in3% higher volumes or $10.3 million. Market supply and demand forces decreased average selling prices during the nine months ended May 31, 2017.sales prices.
OurThe remaining Ag segment other product revenues related primarily to feed and farm supplies increased $26.5 million mainly due to increases in diesel sold and a rise in propane sold for home heating due to colder temperatures.
All Other Segments
|
| | | | | | | | | | | | | | |
| | For the Three Months Ended November 30
| | Change |
| | 2017 | | 2016 | | Dollars | | Percent |
| | (Dollars in thousands) |
| Corporate and Other revenue | $ | 15,743 |
| | $ | 25,928 |
| | $ | (10,185 | ) | | (39.3 | )% |
Comparison of $1.9 billion decreased by $177.4 million duringAll Other Segments revenue for the ninethree months ended May 31,November 30, 2017, compared to the nine months ended May 31, 2016. The decrease was primarily the result of lower volumes in our country operations feed, plant food and sunflower sales.2016
Total revenues include other revenues generated primarily within our Ag segment and Corporate and Other. Our Ag segment's country operations elevators and agri-service centers derive other revenues from activities related to production agriculture, which include grain storage, grain cleaning, fertilizer spreading, crop protection spraying and other services of this nature, and our grain marketing operations receive other revenues at our export terminals from activities related to loading vessels. Corporate and Other derives revenues primarily from our financing, hedgingrevenue decreased due to the sale of loans receivable upon which interest was previously being recognized. Our Nitrogen Production and insurance operations.Foods reportable segments represent equity method investments, and as such record earnings and allocated expenses but not revenue.
Cost of Goods Sold. Consolidated cost of goods sold was $23.1 billion for the nine months ended May 31, 2017, compared to $21.3 billion for the nine months ended May 31, 2016, which represents a $1.8 billion (8%) increase. by Segment
Our Energy segment cost of goods sold of $4.3 billion, after elimination of intersegment costs, increased by $769.9 million (22%) during the nine months ended May 31, 2017, compared to the same period of the prior year. Refined fuels cost of goods sold increased $668.8 million (23%) and reflects a $0.24 (18%) per gallon increase in the average cost of refined fuels, a 4% increase in volumes, when compared to the same period the previous year. For the nine months ended May 31, 2017, the
|
| | | | | | | | | | | | | | |
| | For the Three Months Ended November 30
| | Change |
| | 2017 | | 2016 | | Dollars | | Percent |
| | (Dollars in thousands) |
| Cost of goods sold | $ | 1,800,404 |
| | $ | 1,478,610 |
| | $ | 321,794 |
| | 21.8 | % |
The following table and commentary present the primary reasons for the changes in cost of goods sold related("COGS") for the Energy segment for the three months ended November 30, 2017, compared to propane increased $59.5the prior year:
|
| | | | |
| | | Change |
| | | Three Months Ended November 30 |
| | | (Dollars in millions) |
| Volume | | $ | (35 | ) |
| Price | | 340 |
|
| Other* | | 17 |
|
| Total change in Energy cost of goods sold | | $ | 322 |
|
* Other includes retail and non-commodity type activities.
Comparison of Energy segment COGS for the three months ended November 30, 2017, and 2016
The $321.8 million (15%), primarily from a 4% increase in volumes and an averageEnergy segment COGS reflects the following:
Refined fuels cost increase of $0.13 (23%goods sold increased $196.1 million (16%), which reflects a $0.28 (19%) per gallon or $234.6 million rise in the average cost of refined fuels, partially offset by certain manufacturing changes which helped lower costs recorded by $46.0 million, when compared to the nine months ended May 31, 2016.a decrease of 3% in volume or $38.5 million.
Our Ag segmentThe increase in propane cost of goods sold of $18.8 billion, after elimination$112.1 million was attributable to a 6% rise in volumes or $7.8 million and an increase in average cost of intersegment costs, increased $1.0 billion (6%$0.32 (62%) duringper gallon or $79.7 million. In addition, there were certain manufacturing changes that reduced cost of goods sold by $24.6 million in fiscal 2017 that did not reoccur in fiscal 2018.
Ag
|
| | | | | | | | | | | | | | |
| | For the Three Months Ended November 30
| | Change |
| | 2017 | | 2016 | | Dollars | | Percent |
| | (Dollars in thousands) |
| Cost of goods sold | $ | 5,936,062 |
| | $ | 6,220,190 |
| | $ | (284,128 | ) | | (4.6 | )% |
The following table and commentary present the nineprimary reasons for the changes in COGS for the Ag segment for the three months ended May 31,November 30, 2017, compared to the same periodprior year:
|
| | | | |
| | | Change |
| | | Three Months Ended November 30 |
| | | (Dollars in millions) |
| Volume | | $ | (353 | ) |
| Price | | 45 |
|
| Other* | | 24 |
|
| Total change in Ag cost of goods sold | | $ | (284 | ) |
* Other includes retail and non-commodity type activities.
Comparison of Ag segment COGS for the prior year. three months ended November 30, 2017, and 2016
The $284.1 million decrease in Ag segment COGS reflects the following:
Grain and oilseed cost of goods sold in our Ag segmentattributable to country operations and grain marketing totaled $13.2$4.3 billion and $11.7$4.6 billion duringfor the ninethree months ended May 31,November 30, 2017, and 2016, respectively. The costcosts of grains and oilseed procured through our Ag segment increased $1.5 billion (13%) compared todecreased $299.2 million. The majority of the nine months ended May 31, 2016. This is the result ofdecline was driven by an increase8% decrease in volumes of 10% and an increase in the$360.9 million, partially offset by a higher average cost per bushel of $0.11 (2%$0.08 (1%) for the nine months ended May 31, 2017, whenor $61.7 million. The decrease in volumes was due to lower export activity compared to the same period in the prior year. The average month-end market price per bushel of soybeans and spring wheat increased while corn decreased slightly compared to the same period of the previous year.
Our processingProcessing and food ingredients cost of goods sold in our Ag segment of $1.0 billion decreased $143.0increased $5.5 million (12%(2%) during the nine months ended May 31, 2017, compared to the nine months ended May 31, 2016. The net decreaseand is comprised of $47.4 million from a $141.2higher average cost of oilseeds purchased for further processing, partially offset by $22.2 million decreasein lower volumes, plus a $19.7 million decline due to the sale of an international location in the prior year plus $335.3 million due to lower volumes, partially offset by $333.5 million associated with a higher average cost. Typically, changesyear. Changes in costscost are primarily due to changes in the cost of oilseeds purchased.
Wholesale crop nutrients cost of goods sold in our Ag segment totaled $1.5 billion and decreased $141.2 million (9%) during the nine months ended May 31, 2017, compared to the same period of the prior year. The decrease is comprised of a decrease in the average cost of fertilizer of $69.52 (22%) per ton, partially offset by an 18% increase in the tons sold, when compared to the same period in the previous year.
Renewable fuels cost of goods sold associated with our marketing and production operations decreased $15.1 million (1%) during the nine months ended May 31, 2017, due to a decrease in volumes sold of 6% that was partially offset by an increase in the average cost per gallon of 5%, when compared with the same period of the previous year.
Our Ag segment other product cost of goods sold, primarily feed and farm supplies, decreased $434.6 million (25%) during the nine months ended May 31, 2017, compared to the nine months ended May 31, 2016. The decrease was due mostly to lower volumes when compared to the same period the previous year.
Marketing, General and Administrative. Marketing, general and administrative expenses of $459.8 million for the nine months ended May 31, 2017, decreased $8.6 million (1.8%) compared to the nine months ended May 31, 2016. This change was primarilytypically driven by lower accruals for incentive compensation compared to the prior year, partially offset by increased foreign currency exchange expenses. The lower incentive accruals reflect current estimated performance against targets for the full year.
Reserve and impairment charges. Reserve and impairment chargesmarket price of $414.0 million for the nine months ended May 31, 2017, increased $380.1 million from the same nine-month period in fiscal 2016. The fiscal 2016 charges relate solely to bad debt expense. The increase for the nine months ended May 31, 2017, primarily relates to a Brazil trading partner in our Ag segment entering into bankruptcy proceedings under Brazilian law during our third quarter of fiscal 2017, which resulted in charges of $229.4 million. Additionally, we recorded a $32.7 million impairment charge associated with the cancellation of a capital project in our Energy segment during the third quarter of fiscal 2017. In addition, in fiscal 2017 we also recorded a charge of $51.8 million related to the impairment of long-lived assets and goodwill in our Ag segment. The remaining increase is attributable to loan loss reserve expense primarily related to a single producer borrower.
Gain/Loss on Investments. Loss on investments for the nine months ended May 31, 2017, was $4.2 million compared to a gain of $9.4 million for the nine months ended May 31, 2016. The decrease is mainly attributed to the sale of an international location during the first quarter of fiscal 2017 which resulted in a loss. The nine months ended May 31, 2016 also experienced gains on bond transactions specific to our international operations that did not reoccur during the nine months ended May 31, 2017, which also contributed to the decrease.
Interest expense. Interest expense of $117.4 million for the nine months ended May 31, 2017, increased $45.9 million compared to the same period of the previous year. The increase was due to higher interest expense of $23.3 million associated with increased debt balances, as well as lower capitalized interest of $22.6 million associated with our ongoing capital projects.
Other income. Other income totaled $70.4 million for the nine months ended May 31, 2017, an increase of $48.3 million compared to the nine months ended May 31, 2016. The increase was partially related to higher financing fees receivedsoybeans purchased.
Wholesale crop nutrients cost of goods sold attributable to crop nutrients and grain marketing increased by $1.2 million (less than 1%), caused primarily by an increase of 4%, or $16.5 million, in tons sold. The increase was partially offset by a decline of 4%, or $15.3 million, in average cost per ton of product. The increase in volumes and decrease in the prices paid for goods were due to better market conditions compared to the prior year, as well as beneficial changes in supply chain management.
Renewable fuels cost of goods sold decreased $3.6 million (1%) resulting from various customer activities and receivables totaling $19.3a decrease in the average cost per gallon of $0.06 (4%) or $13.2 million, which was mostly offset by an increase in volume of 3% or $9.7 million.
The remaining Ag segment product cost of goods sold, primarily feed and farm supplies, decreased $11.7 million due to lower costs incurred related to crop protection services and sunflower processing.
Total Ag cost of goods sold include "Other" cost of goods sold, which are generated from our country operations elevators and agri-service centers that incur costs from activities related to production agriculture. These cost of goods sold activities include grain storage, grain cleaning, fertilizer spreading, crop protection spraying and other associated services of this nature. In addition, our grain marketing operations incur "Other" costs at our export terminals from activities related to loading vessels.
All Other Segments
|
| | | | | | | | | | | | | | |
| | For the Three Months Ended November 30
| | Change |
| | 2017 | | 2016 | | Dollars | | Percent |
| | (Dollars in thousands) |
| Nitrogen Production COGS | $ | 219 |
| | $ | (884 | ) | | $ | 1,103 |
| | 124.8 | % |
| Corporate and Other COGS | $ | (1,058 | ) | | $ | (2,363 | ) | | $ | 1,305 |
| | 55.2 | % |
Comparison of All Other Segments COGS for the three months ended November 30, 2017, and 2016
The increase in COGS for our Nitrogen Production segment for fiscal 2018 was due to an unfavorable variance on our natural gas hedges. The increase in COGS for Corporate and Other for fiscal 2018 was due to increased commission expense as a result of higher volumes of transactions in our financing, hedging and insurance operations. Our Foods reportable segment represents an equity method investment, and as such records earnings and allocated expenses but not COGS.
Marketing, General and Administrative Expenses
|
| | | | | | | | | | | | | | |
| | For the Three Months Ended November 30
| | Change |
| | 2017 | | 2016 | | Dollars | | Percent |
| | (Dollars in thousands) |
| Marketing, general and administrative expenses | $ | 140,168 |
| | $ | 147,849 |
| | $ | (7,681 | ) | | (5.2 | )% |
Comparison of marketing, general and administrative expenses for the three months ended November 30, 2017, and 2016
The $7.7 million decrease in marketing, general and administrative expenses is primarily due to lower compensation expenses and lower brokerage commissions.
Reserve and Impairment Charges (Recoveries), net
|
| | | | | | | | | | | | | | |
| | For the Three Months Ended November 30
| | Change |
| | 2017 | | 2016 | | Dollars | | Percent |
| | (Dollars in thousands) |
| Reserve and impairment charges (recoveries), net | $ | (3,787 | ) | | $ | 18,357 |
| | $ | (22,144 | ) | | (120.6 | )% |
Comparison of reserve and impairment charges (recoveries), net for the three months ended November 30, 2017, and 2016
The $22.1 million decrease in reserve and impairment charges (recoveries), net reflects the following:
During fiscal 2017, an allowance for doubtful accounts of $18.4 million was recorded, including loan loss reserves related to a single producer borrower.
In fiscal 2018, we recovered approximately $5.3 million associated with a loan that was previously written off in the prior fiscal year, partially offset by increases in bad debt expense of approximately $1.5 million. As a result, the current fiscal year to date reflects a net recovery.
Gain (Loss) on Investments
|
| | | | | | | | | | | | | | |
| | For the Three Months Ended November 30
| | Change |
| | 2017 | | 2016 | | Dollars | | Percent |
| | (Dollars in thousands) |
| Gain (loss) on investments | $ | 2,819 |
| | $ | (7,401 | ) | | $ | 10,220 |
| | 138.1 | % |
Comparison of gain (loss) on investments for the three months ended November 30, 2017, and 2016
The increase in gain (loss) on investments is mainly attributable to a gain on the sale of a domestic investment of $2.2 million in fiscal 2018, compared to a $7.4 million loss on the sale of an international investment during fiscal 2017 which did not reoccur in fiscal 2018.
Interest Expense
|
| | | | | | | | | | | | | | |
| | For the Three Months Ended November 30
| | Change |
| | 2017 | | 2016 | | Dollars | | Percent |
| | (Dollars in thousands) |
| Interest expense | $ | 40,702 |
| | $ | 38,265 |
| | $ | 2,437 |
| | 6.4 | % |
Comparison of interest expense for the three months ended November 30, 2017, and 2016
The $2.4 million increase in interest expense for fiscal 2018 was primarily due to higher interest expense associated with higher interest rates.
Other Income (Loss)
|
| | | | | | | | | | | | | | |
| | For the Three Months Ended November 30
| | Change |
| | 2017 | | 2016 | | Dollars | | Percent |
| | (Dollars in thousands) |
| Other income (loss) | $ | 22,195 |
| | $ | 44,401 |
| | $ | (22,206 | ) | | (50.0 | )% |
Comparison of other income (loss) for the three months ended November 30, 2017, and 2016
The $22.2 million decrease in other income (loss) reflects the following:
During fiscal 2017, we recorded a gain of $29.1 million associated with an embedded derivative within the contract relating to our strategic investment in CF Nitrogen.Nitrogen that did not reoccur during fiscal 2018. See Note 11,10, Derivative Financial Instruments and Hedging Activities, of the notes to our unauditedthe consolidated financial statements that are included in this Quarterly Report on Form 10-Q for more information on this embedded derivative.additional information.
In fiscal year 2018, we sold a non-strategic North American location in our Ag segment that resulted in a gain of approximately $7.1 million.
Equity Income (Loss) from Investments
|
| | | | | | | | | | | | | | |
| | For the Three Months Ended November 30
| | Change |
| | 2017 | | 2016 | | Dollars | | Percent |
| | (Dollars in thousands) |
| Equity income (loss) from investments | $ | 38,362 |
| | $ | 40,328 |
| | $ | (1,966 | ) | | (4.9 | )% |
Comparison of equity income (loss) from investments for the three months ended November 30, 2017, and 2016
Equity Income from Investments. Equity income (loss) from investments of $124.5 million for the nine months ended May 31, 2017,primarily decreased $7.3 million (5.5%) compared to the nine months ended May 31, 2016. The decrease was primarily relateddue to lower equity income recognized from our equity method investmentinvestments in Ventura Foods, TEMCO, LLC, and Ardent Mills, LLC caused by lower margins, which was partially offset by higher equity income recognized from our equity method investmentsinvestment in CF Nitrogen, TEMCO, and Ardent Mills.Nitrogen. See Note 4, Investments, of the notes to our unauditedthe consolidated financial statements that are included in this Quarterly Report on Form 10-Q for moreadditional information. We record equity income or loss from the investments in which we have an ownership interest of 50% or less and have significant influence, but not control, for our proportionate share of income or loss reported by the entity, without consolidating the revenues and expenses of the entity in our Consolidated Statements of Operations.
Income Taxes. We recordedTaxes
|
| | | | | | | | | | | | | | |
| | For the Three Months Ended November 30
| | Change |
| | 2017 | | 2016 | | Dollars | | Percent |
| | (Dollars in thousands) |
| Income taxes | $ | (19,936 | ) | | $ | (16,612 | ) | | $ | (3,324 | ) | | (20.0 | )% |
Comparison of income taxes for the three months ended November 30, 2017, and 2016
During the first quarter of fiscal 2018, we had an increase in income tax benefit of $137.8 million for the nine months ended May 31, 2017,expense when compared to an income tax benefitthe first quarter of $17.8 million for the nine months ended May 31, 2016,fiscal 2017, resulting in effective tax rates of (344.5)%10.0% and (4.4%)7.4%, respectively. The tax benefit for the nine months ended May 31, 2017, is primarily due to the recognition of deferred tax benefits related to the issuance of non-qualified equity certificates in fiscal 2013 and 2014 and the bad debt deduction in our U.S. tax returns related to the performance of guarantees caused by an approximately $230.0 million loss related to a Brazilian trading partner of ours entering into bankruptcy proceedings under Brazilian law. The federal and state statutory rate applied to nonpatronage business activity was 38.4% and 38.3% for both the nine monthsperiods ended May 31,November 30, 2017, and 2016.2016, respectively. The income taxes and effective tax rate vary each year based upon profitability and nonpatronage business activity during each of the comparable years.
Liquidity and Capital Resources
Summary
In assessing our financial condition, we consider factors such as working capital and internal benchmarking related to our applicable covenants and other financial covenants.criteria. We fund our operations primarily through a combination of cash flows from operations and revolving credit facilities. We fund our capital expenditures and growth primarily through cash, operating cash flow and long-term debt financing.
On May 31,November 30, 2017, we had working capital, defined as current assets less current liabilities, of $311.1$435.9 million and a current ratio, defined as current assets divided by current liabilities, of 1.1 compared to working capital of $181.9 million and a current ratio of 1.0 on August 31, 2017. On November 30, 2016, we had working capital of $378.6 million and a current ratio of 1.0 compared to working capital of $414.4 million and a current ratio of 1.1 on August 31, 2016. On May 31, 2016, we had working capital of $825.5 million and a current ratio of 1.1 compared to working capital of $2.8 billion and a current ratio of 1.5 on August 31, 2015. The decrease in working capital as of May 31, 2017, was driven primarily by the impairment of two large receivables during the fiscal year and increased short-term borrowings primarily associated with seasonal increases in inventory levels. We have and will continue to take action to extend accounts payable terms to be more in line with industry peers, which is part of our actions to actively manage working capital.
As of May 31,November 30, 2017, we had cash and cash equivalents of $267.2$252.1 million, total equities of $7.9 billion, long-term debt of $2.2$2.0 billion and notes payable of $3.3$2.5 billion. Our capital allocation priorities include maintaining the safety and compliance of our assets,operations, paying our dividends, paying downreducing funded debt and taking advantage of strategic opportunities that benefit our owners. For the nine months ended May 31, 2017, cash flow from operations and proceeds from lines of credit were used primarily to finance the purchases of inventory.
We expect the down cycle in the Ag industry to continue and while we maintain appropriate levels of liquidity, we will continue to consider opportunities to further diversify and enhance our sources and amountamounts of liquidity. These opportunities include reducing operating expenses, deploying and/or financing working capital more efficiently and identifying and disposing of non-strategicnonstrategic or under-performingunderperforming assets. We believe that cash generated by operating activities, along with available borrowing capacity under our credit facilities, will be sufficient to support our operations for the foreseeable future and we expect to continue to beremain in compliance with our various loan covenants.
Fiscal 2018 and 2017 Activity
On July 18, 2017, we amended an existing receivables and loans securitization facility (“Securitization Facility” or the "Facility") with certain unaffiliated financial institutions (the "Purchasers"). Under the Securitization Facility, CHS Capital and CHS both sell eligible trade accounts and notes receivable (“Receivables”) they have originated to Cofina Funding, LLC (“Cofina Funding”), a wholly-owned bankruptcy-remote indirect subsidiary of CHS. Cofina Funding in turn sells the purchased Receivables in their entirety to the Purchasers. Prior to amending the Securitization Facility in July 2017, the transfer of Receivables was accounted for as a secured borrowing. Under the terms of the amended Securitization Facility, CHS accounts for Receivables sold under the facility as a sale of financial assets and derecognizes the sold Receivables from its Consolidated Balance Sheets. The amount available under the Facility fluctuates over time based on the total amount of eligible Receivables generated during the normal course of business, with maximum availability of $700.0 million. As of November 30, 2017, the total availability under the Securitization Facility was $700.0 million, all of which had been utilized.
The Facility agreement contains certain customary representations and warranties and affirmative covenants, including as to the eligibility of the Receivables being sold, and contains customary program termination events and non-reinvestment events. We were in compliance with all covenants associated with our Securitization Facility as of November 30, 2017.
Cash Flows
The following table presents summarized cash flow data for the three months ended November 30, 2017, and 2016:
|
| | | | | | | | | | | | | | |
| | | | Change |
| | 2017 | | 2016 | | Dollars | | Percent |
| | (Dollars in thousands) |
| Net cash provided by (used in) operating activities | $ | (140,454 | ) | | $ | 238,417 |
| | $ | (378,871 | ) | | (158.9 | )% |
| Net cash provided by (used in) investing activities | (62,770 | ) | | (327,022 | ) | | 264,252 |
| | 80.8 | % |
| Net cash provided by (used in) financing activities | 271,738 |
| | 327,472 |
| | (55,734 | ) | | (17.0 | )% |
| Effect of exchange rate changes on cash and cash equivalents | 2,236 |
| | (2,696 | ) | | 4,932 |
| | 182.9 | % |
| Net increase (decrease) in cash and cash equivalents | $ | 70,750 |
| | $ | 236,171 |
| | $ | (165,421 | ) | | (70.0 | )% |
Comparison of cash flow for the three months ended November 30, 2017, and 2016
The $378.9 million decrease in cash from operating activities reflects the following:
Reduced seasonal purchases of inventory offset by decreased accounts payable and accrued expenses.
Increased supplier advances due to timing of payments made in the first quarter of fiscal 2018 compared to payments made in the second quarter of fiscal 2017.
Decreased customer advance payments in the Ag segment due to lower sales volumes and drought conditions in the upper midwest.
The $264.3 million increase in cash from investing activities reflects the following:
Decreased CHS Capital notes receivable activity of $149.1 million.
Proceeds of $54.7 million due to sale of our primary corporate office building in Inver Grove Heights, Minnesota which was subsequently leased back to us. The proceeds received were used to pay down long-term debt.
Reduced acquisitions of property, plant and equipment and other business acquisitions primarily related to our plan to reduce our capital investments to allow us to actively reduce our funded debt obligations.
Cash from financing activities decreased $55.7 million, primarily due to changes in checks and drafts outstanding compared to the three months ended November 30, 2016.
Future Uses of Cash
We expect to utilize cash and cash equivalents, along with cash generated by operating activities to fund capital expenditures and payments for debt, interest, dividends and guarantees. The following is a summary of our primary cash requirements for fiscal 2017 capital2018:
Capital expenditures. For fiscal 2017, we We expect total capital expenditures for fiscal 2018 to be approximately $500.0$602.0 million, but the levelcompared to capital expenditures of expenditures remains under review by management.$446.7 million in fiscal 2017. Included in that amount is approximately $227.0 million for the acquisition of property, plant and equipment and major repairs at our Laurel, Montana and McPherson, Kansas refineries. In fiscal 2013, we began a $366.7 million expansion at our McPherson, Kansas refinery which was completed and operational in the first quarter of fiscal 2017. We incurred $5.3 million of costs related to the expansion during the first three quarters of fiscal 2017 and $49.2 million during fiscal 2016.2018 is
approximately $221.0 million for the acquisition of property, plant and equipment at our Laurel, Montana and McPherson, Kansas refineries. During the three months ended November 30, 2017, we acquired plant, property and equipment of $85.8 million.
In addition,Major repairs. Refineries have planned major maintenance to overhaul, repair, inspect and replace process materials and equipment (referred to as a "turnaround") which typically occur for a five- to six-week period every 2-5 years. Our Laurel, Montana refinery has planned maintenance scheduled for fiscal 2018 for approximately $92.0 million.
Debt and interest. We expect to repay the remaining $25.0 million of current maturities of long term debt during fiscal 2018. During the three months ended November 30, 2017, we repaid $160.0 million of long term debt consisting of scheduled debt maturities and optional prepayments.
Preferred stock dividends. We had approximately $2.3 billion of preferred stock outstanding at November 30, 2017. We expect to pay dividends on our preferred stock of approximately $168.7 million during fiscal 2018.
Guarantees. We intend to fund a total of approximately $170.0 million in loan guarantees to our Brazilian operations in the first nine months of fiscal 2018 as a result of losses in the prior fiscal year caused by a trading partner of ours in Brazil entering into bankruptcybankruptcy-like proceedings under Brazilian law,law. During the three months ended November 30, 2017, we intend to fund approximately $230funded $25.0 million in loan guarantees toguarantees.
Future Sources of Cash
We fund our Brazilian operations in the next 12 months. It is our intention to fund thisprimarily through a combination of sources including cash flowflows from operations and the liquidity enhancement actions noted above.
As of May 31, 2017,committed and August 31, 2016, we had a five-year, unsecured revolving credit facility with a syndication of domestic and international banks and a committed amount of $3.0 billion which expires in September 2020. As of May 31, 2017, we had $1.1 billion outstanding under this facility.
During the year ended August 31, 2016, we entered into three bilateral, uncommitted revolving credit facilities, with an aggregate capacity of $1.3 billion. Amounts borrowed underincluding our Securitization Facility. We believe these short-term lines are usedsources will provide adequate liquidity to fundmeet our working capital needs. We fund certain of our long-term capital needs, primarily those related to acquisitions of property, plant and bear interest at base rates (or London Interbank Offered Rates ("LIBOR")) plus applicable margins ranging from 0.25% to 1.00%. As of May 31, 2017, one credit facility remained with an aggregate capacity of $250.0 million with $250.0 million of outstanding borrowings.
equipment by issuing privately placed long-term debt and term loans. In addition, our wholly ownedwholly-owned subsidiary, CHS Capital, LLC ("CHS Capital"), makes seasonal and term loans to member cooperatives, businesses and individual producers of agricultural products included in our cash flows from investing activities, and has its own financing sources as explaineddetailed below in further detail below under “Cash Flows from Financing Activities.”
On May 31, 2017, we had a securitization facility (“Securitization Facility” or the "Facility”) of $750 million. The facility provides us the option to fund through securitization certain of our accounts receivable, as well as CHS Capital loans receivable and certain related property. The Facility is with two financial institutions, with one acting as administrative agent, and various conduit purchasers, committed purchasers, and purchase agents. The Securitization Facility provides us with the option for an additional source of liquidity, thereby increasing our financial flexibility. The amount of funding outstanding against the facility at May 31, 2017, was $618.0 million, of which $194.2 million was outstanding against our securitized accounts receivable.Financing
Cash Flows from Operations
Cash flows provided from operations are generally affected by commodity prices and the seasonality of our businesses. These commodity prices are influenced by a wide range of factors beyond our control, including weather, crop conditions, drought, the availability and the adequacy of supply and transportation, government regulations and policies, world events and general political and economic conditions. These factors may affect net operating assets and liabilities and liquidity.
Our operating activities generated net cash of $204.8 million during the nine months ended May 31, 2017. The cash provided by operating activities resulted from an increase in cash flows due to net non-cash expenses and cash distributions from equity investments of $675.1 million and net income of $177.8 million, partially offset by a decrease in cash flows due to changes in net operating assets and liabilities of $648.1 million. The primary components of net non-cash expenses and cash distributions from equity investments included depreciation and amortization, including amortization of major repair costs, of $412.7 million, provision for doubtful accounts of $198.3 million, deferred tax benefits of $145.4 million, long-lived asset impairments of $85.4 million and net equity investment activity of $19.0 million. The decreased cash flows from changes in net operating assets and liabilities were caused primarily by increased inventory purchases, additional supplier advance payments and decreases in derivative liabilities, partially offset by increases in accounts payable and accrued expenses and decreases in derivative assets. Cash expenditures for grain and oilseed inventory purchases increased primarily due to increasing commodity prices during the nine months ended May 31, 2017. On May 31, 2017, the per-bushel market prices of wheat and corn had increased by $0.86 (18%) and $0.71 (23%), respectively, when compared to spot prices on August 31, 2016. Additionally, crude oil market prices increased by $3.62 (8%) per barrel on May 31, 2017, compared to the price on August 31, 2016. Fertilizer commodity prices were mixed.
Our operating activities generated net cash of $262.4 million during the nine months ended May 31, 2016. The cash provided by operating activities resulted from net income of $425.7 million and net non-cash expenses and cash distributions from equity investments of $280.8 million, partially offset by a decrease in cash flows due to changes in net operating assets and liabilities of $443.7 million. The primary components of net non-cash expenses and cash distributions from equity investments included depreciation and amortization, including amortization of major repair costs, of $380.0 million, partially offset by net equity investment activity of $56.4 million and gains on our crack spread contingent consideration liability of $51.3 million. The decrease in cash flows from changes in net operating assets and liabilities was caused primarily by an increase in grain and oilseed inventory and supplier advances, partially offset by a decrease in receivables. Grain and oilseed
inventory increases were driven by increases in volumes on hand (7% increase primarily due to decreased demand for grain exports) combined with increasing commodity prices. On May 31, 2016, the per-bushel market prices of wheat, soybeans and corn had increased by $0.24 (5%), $1.81 (20%), and $0.13 (3%), respectively, when compared to spot prices on August 31, 2015. Comparing the same periods, fertilizer commodity prices affecting our wholesale crop nutrients and country operations retail businesses experienced decreases ranging from 9% to 36%, depending on the product. Additionally, crude oil market prices decreased by $0.10 (0.2%) per barrel on May 31, 2016, compared to the price on August 31, 2015.
Our operating cash needs have historically been the lowest during our fourth fiscal quarter as by that time, we have sold a large portion of our seasonal agronomy-related inventories in our Ag segment operations and continue to collect cash from the related receivables. We cannot ensure this historical trend will continue. We believe that we have adequate capacity through our current cash balances and committed credit facilities to meet any increase in net operating assets and liabilities.
Cash Flows from Investing Activities
For the nine months ended May 31, 2017, and 2016, the net cash used in our investing activities totaled $374.2 million and $3.6 billion, respectively.
We acquired property, plant and equipment totaling $298.0 million and $557.7 million during the nine months ended May 31, 2017, and 2016, respectively.
For the nine months ended May 31, 2017, and 2016, turnaround expenditures were $1.1 million and $19.3 million, respectively. Refineries have planned major maintenance to overhaul, repair, inspect and replace process materials and equipment which typically occur for a five to six week period every two to four years.
Investments in joint ventures and other entities during the nine months ended May 31, 2017, and 2016, totaled $13.9 million and $2.8 billion, respectively. The primary driver of the change from fiscal 2016 to fiscal 2017 was our $2.8 billion investment in CF Nitrogen that was consummated on February 1, 2016.
Changes in notes receivable and customer financing during the nine months ended May 31, 2017, and 2016, resulted in net decreases in cash flows of $95.4 million and $239.6 million, respectively. The primary cause of the change in cash flows during both periods relates to increased CHS Capital lending.
Cash Flows from Financing Activities
For the nine months ended May 31, 2017, and 2016, our financing activities provided net cash of $155.4 million and $2.7 billion, respectively..
Working Capital Financing
We finance our working capital needs through committed and uncommitted lines of credit with domestic and international banks. On May 31, 2017, we had a five-year, unsecured, revolving facility with aWe believe our current cash balances and our available capacity on our committed amountlines of $3.0 billion and $1.1 billion outstanding.credit will provide adequate liquidity to meet our working capital needs. The following table summarizes our primary lines of credit as of November 30, 2017:
|
| | | | | | | | | | | | |
| Revolving Credit Facilities | | Maturities | | Total Capacity | | Borrowings Outstanding | | Interest Rates |
| | | | | November 30, 2017 | | |
| | | | | (Dollars in thousands) | |
| Committed Five-Year Unsecured Facility | | 2020 | | $ | 3,000,000 |
| | $ | 1,080,000 |
| | LIBOR+0.00% to 1.45% |
| Uncommitted Bilateral Facilities | | 2018 | | 250,000 |
| | 250,000 |
| | LIBOR+0.00% to 1.05% |
In addition to our primary revolving linelines of credit, we have a three-year $325.0 million committed revolving pre-export credit facility for CHS Agronegocio Industria e Comercio Ltda ("CHS Agronegocio"), our wholly-owned subsidiary in Brazil,Brazil. CHS Agronegocio uses the facility, which expires in April 2019, to provide financing forfinance its working capital needs arising fromrelated to its purchases and sales of grains, fertilizers and other agricultural products which expires in April 2019.products. As of May 31,November 30, 2017, the outstanding balance under thisthe facility was $245.0$260.0 million.
During the year ended August 31, 2016, we entered into threeIn addition to our uncommitted bilateral uncommitted revolving credit facilities with an aggregate capacityfacility above, as of $1.3 billion. As of May 31, 2017, one credit facility remained with an aggregate capacity of $250.0 million with $250.0 million of outstanding borrowings.
As of May 31,November 30, 2017, our wholly-owned subsidiaries, CHS Europe S.a.r.l and CHS Agronegocio, had uncommitted lines of credit of $537.2with $420.0 million outstanding. In addition, our other international subsidiaries had lines of credit totaling $265.0with a total of $167.3 million outstanding at May 31,as of November 30, 2017, of which $12.6$38.7 million was collateralized.
On May 31,November 30, 2017, and August 31, 2016,2017, we had total short-term indebtedness outstanding on these various primary and other facilities, andas well as other miscellaneous short-term notes payable, totaling $2.5in the amount of $2.2 billion and $1.8$1.7 billion, respectively.
Long-term Debt Financing
The following table presents summarized long-term debt data as of November 30, 2017, and August 31, 2017:
|
| | | | | | | |
| | November 30,
2017 | | August 31,
2017 |
| | (Dollars in thousands) |
| Private placement debt | $ | 1,530,955 |
| | $ | 1,643,886 |
|
| Bank financing | 391,000 |
| | 445,000 |
|
| Capital lease obligations | 28,917 |
| | 33,075 |
|
| Other notes and contract payable | 61,542 |
| | 62,652 |
|
| Deferred financing costs | (4,648 | ) | | (4,820 | ) |
| | $ | 2,007,766 |
| | $ | 2,179,793 |
|
CHS Capital Financing
Cofina Funding, LLC ("Cofina Funding"),For a wholly-owned subsidiarydescription of CHS Capital, had available credit totaling $750.0 million as of May 31,the Securitization Facility, see above in Fiscal 2018 and 2017 under note purchase agreements with various purchasers and through the issuance of short-term notes payable. CHS Capital and CHS Inc. both sell eligible receivables they have originated to Cofina Funding, which are then pledged as collateral under the note purchase agreements. The notes payable issued by Cofina Funding bear interest at variable rates based on commercial paper with a weighted average rate of 1.82% as of May 31, 2017. There were $618.0 million in borrowings by Cofina Funding utilizing the issuance of commercial paper under the note purchase agreements as of May 31, 2017. activity.
CHS Capital has available credit under master participation agreements with numerous counterparties. BorrowingsPrior to the fourth quarter of fiscal 2017, all borrowings under these agreements arewere accounted for as secured borrowings. During the fourth quarter of fiscal 2017, certain of these agreements were amended resulting in the Company accounting for the participations as the sale of financial assets. As of November 30, 2017, the remaining participations accounted for as secured borrowings and bear interest at variable rates ranging from 2.63%2.94% to 4.45% as of May 31, 2017.. As of May 31,November 30, 2017, the total funding commitment under these agreements was $170.7$93.6 million, of which $53.5$58.5 million was borrowed.
CHS Capital sells loan commitments it has originated to ProPartners Financial ("ProPartners") on a limited recourse basis. The total capacity for commitments under the ProPartners program is $265.0 million. The total outstanding commitments under the program totaled $201.2$192.1 million as of May 31,November 30, 2017, of which $92.9$135.2 million was borrowed under these commitments with an interest rate of 2.28%2.42%.
CHS Capital borrows funds under short-term notes issued as part of a surplus funds program. Borrowings under this program are unsecured and bear interest at variable rates ranging from 0.10% to 0.90% as of May 31,November 30, 2017, and are due upon demand. Borrowings under these notes totaled $92.1$104.2 million as of May 31,November 30, 2017.
Long-term Debt Financing
We use long-term debt agreements with various insurance companies and banks to finance certain of our long-term capital needs, primarily those related to the acquisition of property, plant and equipment.Covenants
On May 31, 2017, we had total long-term debt outstanding of $2.2 billion, of which $1.6 billion was private placement debt, $460.6 million was bank financing, $80.7 million was capital lease obligations and $60.2 million was other notes and contracts payable. On August 31, 2016, we had total long-term debt outstanding of $2.3 billion. Our long-term debt is unsecured; however, restrictive covenants under various debt agreements have requirements for maintenance of minimum consolidated net worth and other financial ratios. We were in compliance with all debt covenants and restrictions as of May 31,November 30, 2017. Based on our current 2018 projections, we expect continued covenant compliance in the near term.
In September 2015, we amended all outstanding notes to conform the financial covenants applicable thereto to those of our amended and restated five-year, unsecured, revolving credit facility. The amended notes provide that if our ratio of consolidated funded debt to consolidated cash flow is greater than a ratio of 3.0 to 1.0, the interest rate on all outstanding notes will be increased by 0.25% until the ratio becomes 3.0 or less. During the ninethree months ended May 31, 2017, we re-advanced $130.0 million under the revolving provision of our ten-year term loan with a syndication of banks that was originally arranged in September 2015. The terms of the re-advance are the same as the original term loan, with principal due on September 4, 2025, and interest calculated at LIBOR plus an applicable margin ranging between 1.50% and 2.00%. During the nine months ended May 31, 2016, we consummated a private placement of long-term notes in the aggregate principal amount of $680.0 million. In addition, we entered into the aforementioned $600.0 million ten-year term loan. During the nine months ended May 31,November 30, 2017, and 2016, we repaid long-termour ratio of funded debt of $148.0 millionto consolidated cash flow remained below 3.0 to 1.0.
Patronage and $220.1 million, respectively.
Other Financing
Equity Redemptions
During the nine months ended May 31, 2016, pursuant to our agreement to acquire the remaining noncontrolling interests in CHS McPherson Refinery, Inc. (formerly National Cooperative Refinery Association), we made a payment of $153.0 million, increasing our ownership to 100.0%. There was no corresponding payment during the nine months ended May 31, 2017.
Changes in checks and drafts outstanding resulted in a decrease in cash flows of $118.8 million for the nine months ended May 31, 2017, and a $1.7 million increase in cash flows during the nine months ended May 31, 2016.
In accordance with our bylaws and upon approval byof our Board of Directors, annual net earnings from patronage sources are distributed to consenting patrons following the close of each fiscal year. Patronage refunds are calculated based on amounts using financial statement earnings. TheFor the year ended August 31, 2017, our Board of Directors authorized only non-qualified distributions, with no cash portion of a patronage distribution, if any, is determined annuallypatronage.
As authorized by our Board of Directors within September 2017, we intend to redeem individual member owned equity in fiscal 2018, in an amount not to exceed $10 million. During the balance issuedthree months ended November 30, 2017, $1.6 million of that amount was redeemed in cash, compared to $9.5 million redeemed in cash during the formthree months ended November 31, 2016. In addition, $2.1 million of qualified and/or non-qualified capital equity certificates. Consenting patrons have agreedequities related to take both the cash and qualified capital equity certificate portion allocatedBoard of Director authorized fiscal 2017 redemption were redeemed during the three months ended November 30, 2017, due to them from our previous fiscal year’s income into their taxable income; and as a result, we are allowed a deduction from our taxable income for both the administrative timing of the payments.
cash distribution and the allocated qualified capital equity certificates, as long as the cash distribution is at least 20% of the total qualified patronage distribution. Patronage earnings from the year ended August 31, 2016, were distributed during the nine months ended May 31, 2017. The cash portion of this distribution, deemed by our Board of Directors to be 40%, was $103.9 million. During the nine months ended May 31, 2016, we distributed cash patronage of $253.2 million.
Redemptions of capital equity certificates approved by our Board of Directors are divided into two pools, one for non-individuals (primarily member cooperatives) who may participate in an annual redemption program for qualified equities held by them and another for individual members who are eligible for equity redemptions at age 70 or upon death. Beginning with fiscal 2017 patronage (for which distributions will be made in fiscal 2018), individual members will also be able to participate in an annual redemption program similar to the one that was previously only available to non-individual members. In accordance with authorization from our Board of Directors, we expect total redemptions related to the year ended August 31, 2016, and 2015, that will be redeemed in fiscal 2017, to be approximately $58.6 million, of which $25.5 million was redeemed in cash during the nine months ended May 31, 2017, compared to $17.1 million redeemed in cash during the nine months ended May 31, 2016.
On March 30, 2017, we issued an additional 695,390 shares of Class B Series 1 Preferred Stock to redeem approximately $20.0 million of qualified equity certificates to eligible owners. Each share of Class B Series 1 Preferred Stock was issued in redemption of $28.74 of qualified equity certificates.
During the three months ended May 31, 2017, our Board of Directors adopted a resolution to treat equity redemptions for non-qualified equity certificates issued in fiscal 2013 and fiscal 2014 in the same manner as qualified equity certificates under the Board's Policy for the Redemption of CHS Inc. Equities.
The following is a summary of our outstanding preferred stock as of May 31,November 30, 2017, each seriesall shares of which isare listed on the Global Select Market of NASDAQ:Nasdaq:
|
| | | | | | | | | | | | | | | | | | |
| | | NASDAQ symbol | | Issuance date | | Shares outstanding | | Redemption value | | Dividend rate (a) (b) | | Dividend payment frequency | | Redeemable beginning (c) |
| | | | | | | | | (Dollars in millions) | | | | | |
| 8% Cumulative Redeemable | | CHSCP | | (d) | | 12,272,003 |
| | $ | 306.8 |
| | 8.000 | % | | Quarterly | | 7/18/2023 |
| Class B Cumulative Redeemable Series 1 | | CHSCO | | (e) | | 21,459,948 (f) |
| | $ | 536.5 |
| | 7.875 | % | | Quarterly | | 9/26/2023 |
| Class B Reset Rate Cumulative Redeemable Series 2 | | CHSCN | | 3/11/2014 | | 16,800,000 |
| | $ | 420.0 |
| | 7.100 | % | | Quarterly | | 3/31/2024 |
| Class B Reset Rate Cumulative Redeemable Series 3 | | CHSCM | | 9/15/2014 | | 19,700,000 |
| | $ | 492.5 |
| | 6.750 | % | | Quarterly | | 9/30/2024 |
| Class B Cumulative Redeemable Series 4 | | CHSCL | | 1/21/2015 | | 20,700,000 |
| | $ | 517.5 |
| | 7.500 | % | | Quarterly | | 1/21/2025 |
|
| | | | | | | | | | | | | | | | | | | | | | |
| | | Nasdaq symbol | | Issuance date | | Shares outstanding | | Redemption value | | Net proceeds (a) | | Dividend rate (b) (c) | | Dividend payment frequency | | Redeemable beginning (d) |
| | | | | | | | | (Dollars in millions) | | | | | | |
| 8% Cumulative Redeemable | | CHSCP | | (e) | | 12,272,003 |
| | $ | 306.8 |
| | $ | 311.2 |
| | 8.00 | % | | Quarterly | | 7/18/2023 |
| Class B Cumulative Redeemable, Series 1 | | CHSCO | | (f) | | 21,459,066 |
| | $ | 536.5 |
| | $ | 569.3 |
| | 7.875 | % | | Quarterly | | 9/26/2023 |
| Class B Reset Rate Cumulative Redeemable, Series 2 | | CHSCN | | 3/11/2014 | | 16,800,000 |
| | $ | 420.0 |
| | $ | 406.2 |
| | 7.10 | % | | Quarterly | | 3/31/2024 |
| Class B Reset Rate Cumulative Redeemable, Series 3 | | CHSCM | | 9/15/2014 | | 19,700,000 |
| | $ | 492.5 |
| | $ | 476.7 |
| | 6.75 | % | | Quarterly | | 9/30/2024 |
| Class B Cumulative Redeemable, Series 4 | | CHSCL | | 1/21/2015 | | 20,700,000 |
| | $ | 517.5 |
| | $ | 501.0 |
| | 7.50 | % | | Quarterly | | 1/21/2025 |
| |
(a) | Includes patrons' equities redeemed with preferred stock. |
| |
(b) | The Class B Reset Rate Cumulative Redeemable Preferred Stock, Series 2 accumulates dividends at a rate of 7.10% per year until March 31, 2024, and then at a rate equal to the three-month U.S. Dollar LIBOR plus 4.298%, not to exceed 8.00% per annum, subsequent to March 31, 2024. |
| |
(b)(c)
| The Class B Reset Rate Cumulative Redeemable Preferred Stock, Series 3 accumulates dividends at a rate of 6.75% per year until September 30, 2024, and then at a rate equal to the three-month U.S. Dollar LIBOR plus 4.155%, not to exceed 8.00% per annum, subsequent to September 30, 2024. |
| |
(c)(d)
| Preferred stock is redeemable for cash at our option, in whole or in part, at a per share price equal to the per share liquidation preference of $25.00 per share, plus all dividends accumulated and unpaid on that share to and including the date of redemption, beginning on the dates set forth in this column. |
| |
(d)(e)
| The 8% Cumulative Redeemable Preferred Stock was issued at various times from 2003-2010. |
| |
(e)
| 11,319,175 shares of Class B Cumulative Redeemable Preferred Stock, Series 1 (the "Class B Series 1 Preferred Stock") were issued on September 26, 2013; 6,752,188 shares were issued on August 25, 2014; 2,693,195 shares were issued on March 31, 2016; and 695,390 shares were issued on March 30, 2017.2003 through 2010. |
| |
(f) | 882 shares thatShares of Class B Cumulative Redeemable Preferred Stock, Series 1 were issued on September 26, 2013, August 25, 2014, March 31, 2016, and March 30, 2017, have been canceled. See Part II, Item 2 of this Current Report on Form 10-Q for more information.2017. |
Dividends paid on our preferred stock during the ninethree months ended May 31,November 30, 2017, and 2016, were $125.5$42.2 million and $121.5$41.8 million, respectively.
Off Balance Sheet Financing Arrangements
Operating Leases
Our minimumMinimum future lease payments required under noncancelable operating leases presented in Management’s Discussion and Analysisas of Financial Condition and Results of Operations in our Annual Report on Form 10-K for the year ended August 31, 2016, have not materially changed during the nine months endedMay 31,November 30, 2017,. were $317.1 million.
Guarantees
We are a guarantor for lines of credit and performance obligations of related companies. As of May 31,November 30, 2017, our bank covenants allowed maximum guarantees of $1.0 billion, of which $101.5$101.4 million were outstanding. We have collateral for a portion of these contingent obligations. We have not recorded a liability related to the contingent obligations as we do not expect to pay out any cash related to them, and the fair values are considered immaterial. The underlying loans to the counterparties for which we provide guarantees were current as of May 31, 2017.November 30, 2017.
Debt
We have no material off balance sheet debt.
Receivables Securitization Facility and Loan Participations
In fiscal 2017, we engaged in off-balance sheet arrangements through our Securitization Facility and certain loan participation agreements. Refer to further details about these arrangements in Note 2, Receivables, of the notes to the consolidated financial statements that are included in this Quarterly Report on Form 10-Q and our Annual Report on Form 10-K for the year ended August 31, 2017, for additional information.
Contractual Obligations
Our contractual obligations presented in Management’s Discussion and Analysis of Financial Condition and Results of Operations in our Annual Report on Form 10-K for the year ended August 31, 2016,2017, have not materially changed during the ninethree months endedMay 31, 2017. November 30, 2017.
Critical Accounting Policies
Our critical accounting policies presented in Management’s Discussion and Analysis of Financial Condition and Results of Operations in our Annual Report on Form 10-K for the year ended August 31, 2016,2017, have not materially changed during the ninethree months endedMay 31, 2017. November 30, 2017.
Effect of Inflation and Foreign Currency Transactions
We believe that inflation and foreign currency fluctuations have not had a material effect on our operations since we conduct an insignificant portion of our business in foreign currencies.
Recent Accounting Pronouncements
See Note 1, Organization, Basis of Presentation and Significant Accounting Policies, to our unaudited consolidated financial statements included in this Quarterly Report on Form 10-Q for a description of the recent accounting pronouncements that are applicable to us.
ITEM 3. QUANTITATIVE AND QUALITATIVE DISCLOSURES ABOUT MARKET RISK
We did not experience any material changes in market risk exposures for the period ended May 31,November 30, 2017,, that affect the quantitative and qualitative disclosures presented in our Annual Report on Form 10-K for the year ended August 31, 2016.
2017.
ITEM 4. CONTROLS AND PROCEDURES
Under the supervision and with the participation of our management, including our Chief Executive Officer and Chief Financial Officer, we evaluated the effectiveness of our disclosure controls and procedures (as defined in Rule 13a-15(e)) under the Securities Exchange Act of 1934 (the "Exchange Act") as of May 31, 2017.November 30, 2017. Based on that evaluation, our Chief Executive Officer and Chief Financial Officer concluded that, as of that date, our disclosure controls and procedures were effective.
On December 1, 2015, we began implementation of a new enterprise resource planning (“ERP”) system. The new ERP system is expected to take several years to fully implement, and has and will continue to require significant capital and human resources to deploy. The implementation of the new ERP system will affect the processes that constitute our internal control over financial reporting (as defined in Rule 13a-15(f) under the Exchange Act), and our management has taken steps to ensure that appropriate controls are designed and implemented as each functional area of the new ERP system is enacted.
Other than as described above, there were no changes in our internal control over financial reporting during the quarter ended May 31,November 30, 2017, that have materially affected, or are reasonably likely to materially affect, our internal control over financial reporting.
PART II. OTHER INFORMATION
ITEM 1. LEGAL PROCEEDINGS
As previously reportedWe are involved as a defendant in various lawsuits, claims and disputes, which are in the normal course of our Annual Reportbusiness. The resolution of any such matters may affect consolidated net income for any fiscal period; however, our management believes any resulting liabilities, individually or in the aggregate, will not have a material effect on Form 10-K forour consolidated financial position, results of operations or cash flows during any fiscal year.
Laurel
On May 17, 2016, and October 12, 2016, the year ended August 31, 2016, on July 11, 2016, we received a letter from theMontana Department of Environmental Protection Agency (the “EPA”Quality (“MDEQ”) respondingissued violation letters to 21 reportsus, alleging that we had previously submitted to the EPA detailing prior flaring incidentscertain specified air emissions at our Laurel, Montana refinery. These reports were submitted byrefinery exceeded amounts allowable under the refinery’s permits and applicable law. On June 1, 2016, and November 3, 2016, we responded to MDEQ and described the actions that we had taken in connection with those allegations. On August 30, 2017, MDEQ sent us pursuanta letter requesting that we execute an administrative order on consent, and pay an administrative penalty of $184,550. On September 27, 2017, we sent MDEQ a letter providing additional information and requesting that MDEQ reconsider the alleged violations and reduce the proposed penalty with respect to four of the alleged violations described in the violation letters. We also requested changes to the requirementsadministrative order on consent to remove references to the Administrative Rules of a 2004 consent decree among us, the United States and the State of Montana. In itsWe are currently awaiting MDEQ’s response letter, the EPA stated that it was requesting stipulated penalties totaling $886,905, to be paid 50% to the EPA and 50% to the State of Montana, in connection with 15 of the incidents covered by the reports. We then paid $34,965 of the requested stipulated penalties relating to four incidents, and disputed the EPA’s conclusions with respect to, and the stipulated penalties requested for, 11 of the incidents. On September 29, 2016, we met with representatives of the EPA to address the unresolved issues relating to the remaining 11 incidents. At that meeting, we presented arguments supporting our position that certain requested stipulated penalties should be reduced, and the EPA agreed to reduce the requested stipulated penalties for 8 of the 11 remaining incidents. In an October 13, 2016, letter to the EPA, we reiterated the arguments and positions we presented at the September 29, 2016, meeting. On March 7, 2017 we received a notice from the EPA revising the requested stipulated penalties with respect to the remaining 11 incidents to an aggregate of $198,775. We then paid the $198,775 of requested stipulated penalties, with 50% of the payments being made to the EPA on March 24, 2017 and 50% of the payments being made to the State of Montana, on March 14, 2017.letter.
For information regarding our other reportable legal proceedings, see Item 3 of our Annual Report on Form 10-K for the year ended August 31, 2016.2017.
ITEM 1A. RISK FACTORS
There were no material changes to our risk factors during the period covered by this report. See the discussion of risk factors in Item 1A of our Annual Report on Form 10-K for the year ended August 31, 2016.2017.
ITEM 2.UNREGISTERED SALES OF EQUITY SECURITIES AND USE OF PROCEEDS
The table below presents purchases made by or on behalf of CHS Inc. or any “affiliated purchaser” (as defined in Rule 10b-18(a)(3) under the Exchange Act) of our preferred stock during the three months ended May 31, 2017.
|
| | | | |
| (a) | (b) | (c) | (d) |
Period | Total Number of Shares Purchased | Average Price Paid per Share | Total Number of Shares Purchased as Part of Publicly Announced Plans or Programs | Maximum Number (or Approximate Dollar Value) of Shares that May Yet Be Purchased Under the Plans or Programs |
March 1 - 31, 2017
| 882(1)
| $28.74(2)
| — | — |
April 1 - 30, 2017
| — | — | — | — |
May 1 - 31, 2017
| — | — | — | — |
Total | 882(1)
| $28.74(2)
| — | — |
| |
(1)
| On March 30, 2017, pursuant to a registration statement on Form S-1 that was declared effective by the Securities and Exchange Commission, we issued695,390 shares of our Class B Series 1 Preferred Stock to redeem approximately $20,000,000 of our patrons’ equities that were held in the form of qualified capital equity certificates. Of these 695,390 shares, 882 shares were issued to Farmers Union Oil Company. We had previously acquired Farmers Union Oil Company in January 2017. The shares of Class B Series 1 Preferred Stock issued to Farmers Union Oil Company have been canceled.
|
| |
(2) | Each share of Class B Series 1 Preferred Stock issued to Farmers Union Oil Company was issued to redeem $28.74 of patrons’ equities. |
We did not have any unregistered sales of our equity securities during the three months ended May 31, 2017.
ITEM 6. EXHIBITS
|
| |
| Exhibit | Description |
10.1 | |
10.2 | |
10.3 | |
31.1 | |
| |
| |
| |
| The following financial information from CHS Inc.’s Quarterly Report on Form 10-Q for the quarterly period ended May 31,November 30, 2017, formatted in Extensible Business Reporting Language (XBRL): (i) the Consolidated Statements of Operations, (ii) the Consolidated Statements of Comprehensive Income, (iii) the Consolidated Balance Sheets, (iv) the Consolidated Statements of Cash Flows, and (v) the Notes to the Consolidated Financial Statements. |
SIGNATURES
Pursuant to the requirements of the Securities Exchange Act of 1934, as amended, the registrant has duly caused this report to be signed on its behalf by the undersigned, thereunto duly authorized.
CHS Inc.
(Registrant)
|
| | | | | |
| Date: | July 14, 2017January 10, 2018 | | By: | | /s/ Timothy Skidmore |
| | | | | | Timothy Skidmore |
| | | | | | Executive Vice President and Chief Financial Officer |