UNITED STATES SECURITIES AND EXCHANGE COMMISSION
Washington, D.C. 20549
Form 10-Q
|
| | | |
| þ | | Quarterly Report pursuant to Section 13 or 15(d) of the Securities Exchange Act of 1934 for the quarterly period ended November 30, 2017.2018. |
| or |
| o | | Transition Report pursuant to Section 13 or 15(d) of the Securities Exchange Act of 1934 for the transition period from to |
Commission file number: 001-36079
CHS Inc.
(Exact name of registrant as specified in its charter)
|
| | |
Minnesota (State or other jurisdiction of incorporation or organization) | | 41-0251095 (I.R.S. Employer Identification Number) |
| | | |
5500 Cenex Drive Inver Grove Heights, Minnesota 55077 (Address of principal executive offices, including zip code) | | (651) 355-6000 (Registrant’s telephone number, including area code) |
Indicate by check mark whether the Registrant (1) has filed all reports required to be filed by Section 13 or 15(d) of the Securities Exchange Act of 1934 during the preceding 12 months (or for such shorter period that the registrant was required to file such reports), and (2) has been subject to such filing requirements for the past 90 days.
YES þ NO o
Indicate by check mark whether the Registrant has submitted electronically and posted on its corporate website, if any, every Interactive Data File required to be submitted and posted pursuant to Rule 405 of Regulation S-T (§232.405 of this chapter) during the preceding 12 months (or for such shorter period that the Registrant was required to submit and post such files).
YES þ NO o
Indicate by check mark whether the Registrant is a large accelerated filer, an accelerated filer, a non-accelerated filer, a smaller reporting company, or an emerging growth company. See the definitions of “large"large accelerated filer,” “accelerated" "accelerated filer,” “smaller" "smaller reporting company,”" and "emerging growth company" in Rule 12b-2 of the Exchange Act.
|
| | | | |
Large accelerated filer o | Accelerated filer o | Non-accelerated filer þ | Smaller reporting company o | Emerging growth company o |
| | (Do not check if a smaller reporting company) | | |
If an emerging growth company, indicate by check mark if the Registrant has elected not to use the extended transition period for complying with any new or revised financial accounting standards provided pursuant to Section 13(a) of the Exchange Act. o
Indicate by check mark whether the Registrant is a shell company (as defined in Rule 12b-2 of the Exchange Act).
YES o NO þ
Indicate the number of shares outstanding of each of the Registrant’s classes of common stock, as of the latest practicable date: The Registrant has no common stock outstanding.
INDEX
Unless the context otherwise requires, for purposes of this Quarterly Report on Form 10-Q, the words “we,” “us,” “our,”"we," "us," "our," the “Company”"Company" and “CHS”"CHS" refer to CHS Inc., a Minnesota cooperative corporation, and its subsidiaries as of November 30, 20172018.
FORWARD-LOOKING STATEMENTS
This Quarterly Report on Form 10-Q contains and our other publicly available documents may contain, and our officers, directors and other representatives may from time to time make, "forward-looking statements" within the meaning of the safe harbor provisions of the U.S. Private Securities Litigation Reform Act of 1995. Forward-looking statements can be identified by words such as "anticipate," "intend," "plan," "goal," "seek," "believe," "project," "estimate," "expect," "strategy," "future," "likely," "may," "should," "will" and similar references to future periods. Forward-looking statements are neither historical facts nor assurances of future performance. Instead, they are based only on our current beliefs, expectations and assumptions regarding the future of our businesses, financial condition and results of operations, future plans and strategies, projections, anticipated events and trends, the economy and other future conditions. Because forward-looking statements relate to the future, they are subject to inherent uncertainties, risks and changes in circumstances that are difficult to predict and many of which are outside of our control. Our actual results and financial condition may differ materially from those indicated in the forward-looking statements. Therefore, you should not place undue reliance on any of these forward-looking statements. Important factors that could cause our actual results and financial condition to differ materially from those indicated in the forward-looking statements are discussed or identified in our public filings made with the U.S. Securities and Exchange Commission, ("SEC"), including in the "Risk Factors" discussion in Item 1A of our Annual Report on Form 10-K for the year ended August 31, 2017.2018. Any forward-looking statements made by us in this Quarterly Report on Form 10-Q are based only on information currently available to us and speak only as of the date on which the statement is made. We undertake no obligation to publicly update any forward-looking statement, whether written or oral, that may be made from time to time, whether as a result of new information, future developments or otherwise, except as required by applicable law.
PART I. FINANCIAL INFORMATION
ITEM 1. FINANCIAL STATEMENTS
CHS INC. AND SUBSIDIARIES
CONSOLIDATED BALANCE SHEETS
(Unaudited)
| | | | November 30,
2017 | | August 31,
2017 | November 30,
2018 | | August 31,
2018 |
| | (Dollars in thousands) | (Dollars in thousands) |
| ASSETS | | | | | | |
| Current assets: | |
| |
|
| |
| |
|
|
| Cash and cash equivalents | $ | 252,129 |
| | $ | 181,379 |
| $ | 266,152 |
| | $ | 450,617 |
|
| Receivables | 2,059,623 |
| | 1,869,632 |
| 2,686,095 |
| | 2,460,401 |
|
| Inventories | 3,046,101 |
| | 2,576,585 |
| 3,184,449 |
| | 2,768,649 |
|
| Derivative assets | 283,256 |
| | 232,017 |
| 202,932 |
| | 329,757 |
|
| Margin deposits | 206,955 |
| | 206,062 |
| |
| Margin and related deposits | | 214,594 |
| | 151,150 |
|
| Supplier advance payments | 542,139 |
| | 249,234 |
| 399,095 |
| | 288,423 |
|
| Other current assets | 289,250 |
| | 299,618 |
| 234,406 |
| | 244,208 |
|
| Total current assets | 6,679,453 |
| | 5,614,527 |
| 7,187,723 |
| | 6,693,205 |
|
| Investments | 3,777,000 |
| | 3,750,993 |
| 3,774,536 |
| | 3,711,925 |
|
| Property, plant and equipment | 5,266,408 |
| | 5,356,434 |
| 5,078,307 |
| | 5,141,719 |
|
| Other assets | 1,061,562 |
| | 1,251,802 |
| 813,190 |
| | 834,329 |
|
| Total assets | $ | 16,784,423 |
| | $ | 15,973,756 |
| $ | 16,853,756 |
| | $ | 16,381,178 |
|
| LIABILITIES AND EQUITIES | | | | | | |
| Current liabilities: | |
| | |
| |
| | |
|
| Notes payable | $ | 2,480,264 |
| | $ | 1,988,215 |
| $ | 2,401,553 |
| | $ | 2,272,196 |
|
| Current portion of long-term debt | 71,022 |
| | 156,345 |
| 167,423 |
| | 167,565 |
|
| Customer margin deposits and credit balances | 139,868 |
| | 157,914 |
| 133,698 |
| | 137,395 |
|
| Customer advance payments | 414,441 |
| | 413,163 |
| 325,817 |
| | 409,088 |
|
| Accounts payable | 2,380,998 |
| | 1,951,292 |
| 2,202,487 |
| | 1,844,489 |
|
| Derivative liabilities | 226,279 |
| | 316,018 |
| 282,557 |
| | 438,465 |
|
| Accrued expenses | 409,522 |
| | 437,527 |
| 428,940 |
| | 511,032 |
|
| Dividends and equities payable | 121,209 |
| | 12,121 |
| 311,461 |
| | 153,941 |
|
| Total current liabilities | 6,243,603 |
| | 5,432,595 |
| 6,253,936 |
| | 5,934,171 |
|
| Long-term debt | 1,936,744 |
| | 2,023,448 |
| 1,739,956 |
| | 1,762,690 |
|
| Long-term deferred tax liabilities | 350,841 |
| | 333,221 |
| 209,767 |
| | 182,770 |
|
| Other liabilities | 315,460 |
| | 278,667 |
| 358,005 |
| | 336,519 |
|
| Commitments and contingencies (Note 12) |
|
| |
|
| |
| Commitments and contingencies (Note 15) | |
|
| |
|
|
| Equities: | |
| | |
| |
| | |
|
| Preferred stock | 2,264,038 |
| | 2,264,038 |
| 2,264,038 |
| | 2,264,038 |
|
| Equity certificates | 4,319,840 |
| | 4,341,649 |
| 4,558,940 |
| | 4,609,456 |
|
| Accumulated other comprehensive loss | (178,445 | ) | | (183,670 | ) | (204,232 | ) | | (199,915 | ) |
| Capital reserves | 1,520,218 |
| | 1,471,217 |
| 1,663,971 |
| | 1,482,003 |
|
| Total CHS Inc. equities | 7,925,651 |
| | 7,893,234 |
| 8,282,717 |
| | 8,155,582 |
|
| Noncontrolling interests | 12,124 |
| | 12,591 |
| 9,375 |
| | 9,446 |
|
| Total equities | 7,937,775 |
| | 7,905,825 |
| 8,292,092 |
| | 8,165,028 |
|
| Total liabilities and equities | $ | 16,784,423 |
| | $ | 15,973,756 |
| $ | 16,853,756 |
| | $ | 16,381,178 |
|
The accompanying notes are an integral part of the consolidated financial statements (unaudited).
CHS INC. AND SUBSIDIARIES
CONSOLIDATED STATEMENTS OF OPERATIONS
(Unaudited)
| | | | For the Three Months Ended
November 30, | For the Three Months Ended
November 30, |
| | 2017 | | 2016 | 2018 | | (As Restated) 2017 |
| | (Dollars in thousands) | (Dollars in thousands) |
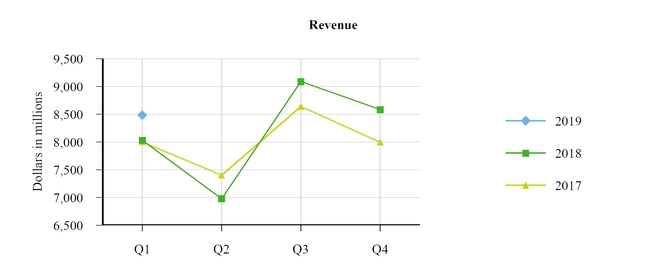
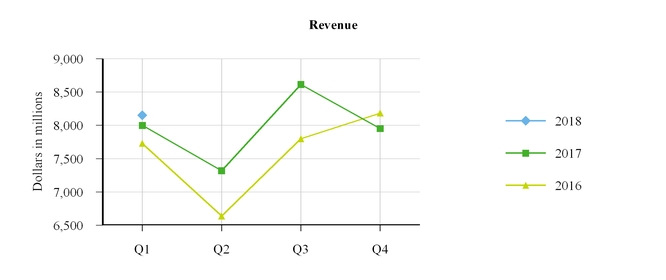
| Revenues | $ | 8,048,889 |
| | $ | 8,048,250 |
| $ | 8,484,289 |
| | $ | 8,031,884 |
|
| Cost of goods sold | 7,735,627 |
| | 7,695,553 |
| 8,013,648 |
| | 7,711,392 |
|
| Gross profit | 313,262 |
| | 352,697 |
| 470,641 |
| | 320,492 |
|
| Marketing, general and administrative | 140,168 |
| | 147,849 |
| 162,496 |
| | 140,346 |
|
| Reserve and impairment charges (recoveries), net | (3,787 | ) | | 18,357 |
| (6,353 | ) | | (3,787 | ) |
| Operating earnings (loss) | 176,881 |
| | 186,491 |
| 314,498 |
| | 183,933 |
|
| (Gain) loss on investments | (2,819 | ) | | 7,401 |
| |
| Interest expense | 40,702 |
| | 38,265 |
| 38,908 |
| | 40,702 |
|
| Other (income) loss | (22,195 | ) | | (44,401 | ) | (25,134 | ) | | (26,195 | ) |
| Equity (income) loss from investments | (38,362 | ) | | (40,328 | ) | (66,508 | ) | | (38,362 | ) |
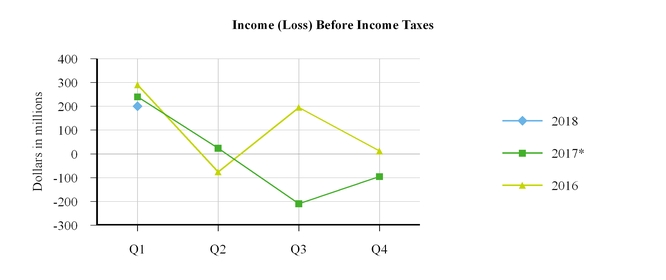
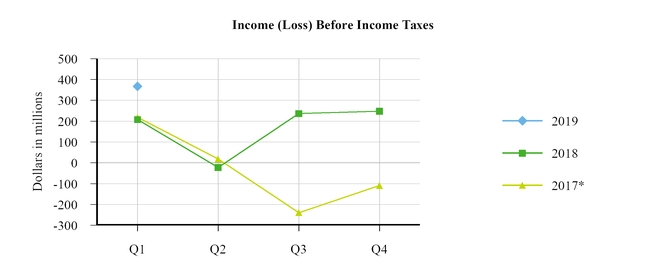
| Income (loss) before income taxes | 199,555 |
| | 225,554 |
| 367,232 |
| | 207,788 |
|
| Income tax expense (benefit) | 19,936 |
| | 16,612 |
| 20,117 |
| | 20,606 |
|
| Net income (loss) | 179,619 |
| | 208,942 |
| 347,115 |
| | 187,182 |
|
| Net income (loss) attributable to noncontrolling interests | (464 | ) | | (208 | ) | (389 | ) | | (464 | ) |
| Net income (loss) attributable to CHS Inc. | $ | 180,083 |
| | $ | 209,150 |
| $ | 347,504 |
| | $ | 187,646 |
|
The accompanying notes are an integral part of the consolidated financial statements (unaudited).
CHS INC. AND SUBSIDIARIES
CONSOLIDATED STATEMENTS OF COMPREHENSIVE INCOME
(Unaudited)
| | | | For the Three Months Ended
November 30, | For the Three Months Ended
November 30, |
| | 2017 | | 2016 | 2018 | | (As Restated) 2017 |
| | (Dollars in thousands) | (Dollars in thousands) |
| Net income (loss) | $ | 179,619 |
| | $ | 208,942 |
| $ | 347,115 |
| | $ | 187,182 |
|
| Other comprehensive income (loss), net of tax: | | | | | | |
| Postretirement benefit plan activity, net of tax expense (benefit) of $2,620 and $2,011, respectively | 4,196 |
| | 3,239 |
| |
| Unrealized net gain (loss) on available for sale investments, net of tax expense (benefit) of $404 and $482, respectively | 3,640 |
| | 777 |
| |
| Cash flow hedges, net of tax expense (benefit) of $(2) and $406, respectively | (4 | ) | | 654 |
| |
| Foreign currency translation adjustment, net of tax expense (benefit) of $(443) and $(209), respectively | (2,607 | ) | | (19,164 | ) | |
| Postretirement benefit plan activity | | 2,101 |
| | 1,594 |
|
| Unrealized net gain (loss) on available for sale investments | | — |
| | 3,640 |
|
| Cash flow hedges | | (1,307 | ) | | (4 | ) |
| Foreign currency translation adjustment | | (405 | ) | | (2,211 | ) |
| Other comprehensive income (loss), net of tax | 5,225 |
| | (14,494 | ) | 389 |
| | 3,019 |
|
| Comprehensive income (loss) | 184,844 |
| | 194,448 |
| 347,504 |
| | 190,201 |
|
| Less: comprehensive income (loss) attributable to noncontrolling interests | (464 | ) | | (208 | ) | (389 | ) | | (464 | ) |
| Comprehensive income (loss) attributable to CHS Inc. | $ | 185,308 |
| | $ | 194,656 |
| $ | 347,893 |
| | $ | 190,665 |
|
The accompanying notes are an integral part of the consolidated financial statements (unaudited).
CHS INC. AND SUBSIDIARIES
CONSOLIDATED STATEMENTS OF CASH FLOWS
(Unaudited)
| | | | For the Three Months Ended November 30, | For the Three Months Ended November 30, |
| | 2017 | | 2016 | 2018 | | (As Restated) 2017 |
| | (Dollars in thousands) | (Dollars in thousands) |
| Cash flows from operating activities: | |
| | |
| |
| | |
|
| Net income (loss) | $ | 179,619 |
| | $ | 208,942 |
| $ | 347,115 |
| | $ | 187,182 |
|
| Adjustments to reconcile net income to net cash provided by (used in) operating activities: | |
| | |
| |
| | |
|
| Depreciation and amortization | 120,148 |
| | 121,372 |
| 118,603 |
| | 120,148 |
|
| Amortization of deferred major repair costs | 16,418 |
| | 18,302 |
| 19,176 |
| | 16,418 |
|
| Equity (income) loss from investments | (38,362 | ) | | (40,328 | ) | (66,508 | ) | | (38,362 | ) |
| Distributions from equity investments | 12,514 |
| | 16,393 |
| 18,887 |
| | 12,514 |
|
| Provision for doubtful accounts | (3,601 | ) | | 27,812 |
| 5,009 |
| | (3,601 | ) |
| Deferred taxes | 15,044 |
| | 6,199 |
| 26,555 |
| | 16,346 |
|
| Other, net | 2,976 |
| | 6,093 |
| (3,162 | ) | | 375 |
|
| Changes in operating assets and liabilities, net of acquisitions: | |
| | |
| |
| | |
|
| Receivables | (80,637 | ) | | (16,555 | ) | (182,767 | ) | | (56,700 | ) |
| Inventories | (472,180 | ) | | (754,253 | ) | (416,196 | ) | | (513,023 | ) |
| Derivative assets | 67,365 |
| | 110,306 |
| 139,694 |
| | 63,926 |
|
| Margin deposits | (893 | ) | | (2,623 | ) | |
| Margin and related deposits | | (63,476 | ) | | (893 | ) |
| Supplier advance payments | (292,905 | ) | | (133,109 | ) | (110,672 | ) | | (293,536 | ) |
| Other current assets and other assets | 2,689 |
| | 12,082 |
| 12,541 |
| | 6,323 |
|
| Customer margin deposits and credit balances | (18,045 | ) | | (28,141 | ) | (3,697 | ) | | (18,045 | ) |
| Customer advance payments | 1,278 |
| | 131,444 |
| (83,271 | ) | | (10,251 | ) |
| Accounts payable and accrued expenses | 441,071 |
| | 743,427 |
| 299,741 |
| | 453,219 |
|
| Derivative liabilities | (97,329 | ) | | (195,545 | ) | (159,385 | ) | | (99,956 | ) |
| Other liabilities | 4,376 |
| | 6,599 |
| 7,015 |
| | 4,376 |
|
| Net cash provided by (used in) operating activities | (140,454 | ) | | 238,417 |
| (94,798 | ) | | (153,540 | ) |
| Cash flows from investing activities: | |
| | |
| |
| | |
|
| Acquisition of property, plant and equipment | (85,824 | ) | | (116,986 | ) | (104,750 | ) | | (85,824 | ) |
| Proceeds from disposition of property, plant and equipment | 56,079 |
| | 2,574 |
| 5,752 |
| | 56,079 |
|
| Proceeds from sale of business | 29,457 |
| | — |
| 1,730 |
| | 29,457 |
|
| Expenditures for major repairs | (1,039 | ) | | (239 | ) | (3,441 | ) | | (1,039 | ) |
| Investments redeemed | 5,195 |
| | — |
| 1,499 |
| | 5,195 |
|
| Changes in CHS Capital notes receivable, net | (69,227 | ) | | (218,296 | ) | (126,865 | ) | | (69,227 | ) |
| Financing extended to customers | (15,778 | ) | | (14,353 | ) | (3,928 | ) | | (15,778 | ) |
| Payments from customer financing | 16,520 |
| | 21,523 |
| 71,137 |
| | 16,520 |
|
| Other investing activities, net | 1,847 |
| | (1,245 | ) | 4,090 |
| | 1,847 |
|
| Net cash provided by (used in) investing activities | (62,770 | ) | | (327,022 | ) | (154,776 | ) | | (62,770 | ) |
| Cash flows from financing activities: | |
| | |
| |
| | |
|
| Proceeds from lines of credit and long-term borrowings | 8,006,980 |
| | 10,300,476 |
| 4,429,276 |
| | 8,006,980 |
|
| Payments on lines of credit, long term-debt and capital lease obligations | (7,657,713 | ) | | (9,936,369 | ) | (4,317,479 | ) | | (7,654,661 | ) |
| Changes in checks and drafts outstanding | (31,417 | ) | | 14,334 |
| |
| Preferred stock dividends paid | (42,167 | ) | | (41,825 | ) | (42,167 | ) | | (42,167 | ) |
| Retirements of equities | (3,682 | ) | | (9,528 | ) | (24,072 | ) | | (3,682 | ) |
| Other financing activities, net | (263 | ) | | 384 |
| 3,503 |
| | (21,257 | ) |
| Net cash provided by (used in) financing activities | 271,738 |
| | 327,472 |
| 49,061 |
| | 285,213 |
|
| Effect of exchange rate changes on cash and cash equivalents | 2,236 |
| | (2,696 | ) | (1,535 | ) | | 2,236 |
|
| Net increase (decrease) in cash and cash equivalents | 70,750 |
| | 236,171 |
| |
| Cash and cash equivalents at beginning of period | 181,379 |
| | 279,313 |
| |
| Cash and cash equivalents at end of period | $ | 252,129 |
| | $ | 515,484 |
| |
| Net increase (decrease) in cash and cash equivalents and restricted cash | | (202,048 | ) | | 71,139 |
|
| Cash and cash equivalents and restricted cash at beginning of period | | 543,940 |
| | 272,272 |
|
| Cash and cash equivalents and restricted cash at end of period | | $ | 341,892 |
| | $ | 343,411 |
|
The accompanying notes are an integral part of the consolidated financial statements (unaudited).
CHS INC. AND SUBSIDIARIES
NOTES TO CONSOLIDATED FINANCIAL STATEMENTS (Unaudited)
Note 1 Organization, Basis of Presentation and Significant Accounting Policies
Basis of Presentation
The unaudited Consolidated Balance Sheet as of November 30, 20172018, the Consolidated Statements of Operations for the three months ended November 30, 20172018, and 2016,2017, the Consolidated Statements of Comprehensive Income for the three months ended November 30, 20172018, and 2016,2017, and the Consolidated Statements of Cash Flows for the three months ended November 30, 20172018, and 2016,2017, reflect in the opinion of our management, all normal recurring adjustments necessary for a fair statement of the financial position, results of operations and cash flows for the interim periods presented. The results of operations and cash flows for interim periods are not necessarily indicative of results for a full fiscal year because of, among other things, the seasonal nature of our businesses. Our Consolidated Balance Sheet data as of August 31, 20172018, has been derived from our audited consolidated financial statements, but does not include all disclosures required by accounting principles generally accepted in the United States of America ("U.S. GAAP").
OverAs described in Note 2, Restatement of Previously Issued Financial Information, the course of fiscal year 2017, we incurred charges relating to a trading partner of ours in Brazil, which entered into bankruptcy-like proceedings under Brazilian law, intangible and fixed asset impairment charges associated with certain assets meeting the criteria to be classified as held for sale, fixed asset impairment charges due to the cancellation of a capital project at one of our refineries and bad debt and loan loss reserve charges relating to a single large producer borrower. Charges and impairments of this nature, as well as any recoveries related to amounts previously reserved, are included in the Consolidated Statements of Operations in the line item, "Reserve and impairment charges (recoveries), net"consolidated financial statements for the three months ended November 30, 2017, and 2016. The timing andhave been restated to reflect the correction of misstatements. We have also restated all relevant amounts of these charges and impairments, and any recoveries were determined utilizing facts and circumstances that were present inimpacted within the respective quarters in which the charge, impairments or recoveries were recorded. Prior year information has been revised to conformnotes to the current year presentation. consolidated financial statements.
The notes to our consolidated financial statements reference our Energy, Ag and Nitrogen Production and Foods reportable segments, as well as our Corporate and Other category, which represents an aggregation of individually immaterial operating segments. The Nitrogen Production reportable segment resulted from our investment in CF Industries Nitrogen, LLC ("CF Nitrogen") in February 2016. The Foods segment resulted from our investment in Ventura Foods, LLC ("Ventura Foods") becoming a significant operating segment in fiscal 2016. See Note 9,12, Segment Reporting, for more information.information related to our reportable segments.
Our consolidated financial statements include the accounts of CHS and all of our wholly owned and majority owned subsidiaries. The effects of all significant intercompany transactions have been eliminated.
These unaudited consolidated financial statements should be read in conjunction with the consolidated financial statements and notes thereto for the year ended August 31, 2017,2018, included in our Annual Report on Form 10-K, filed with the Securities and Exchange Commission (the "SEC").
RecentSignificant Accounting Pronouncements
AdoptedPolicies
In October 2016, the Financial Accounting Standards Board ("FASB") issued Accounting Standards Update ("ASU") No. 2016-16, Income Taxes - Intra-Entity Transfers of Assets Other Than Inventory (Topic 740). This ASU is intended to improve theThe following significant accounting policies have been updated since our Annual Report on Form 10-K for the income tax consequencesyear ended August 31, 2018, as a result of intra-entity transfersthe adoption of assets other than inventory by requiring an entity to recognize the income tax consequences when a transfer occurs, instead of when an asset is sold to an outside party. This ASU iscertain new accounting pronouncements effective for periods beginning after December 15, 2017; however, early adoption of this ASU is permittedus during the first interim period if an entity issues interim financial statementsthree months ended November 30, 2018.
Restricted Cash
Restricted cash is included in our Consolidated Balance Sheets within other current assets (current portion) and other assets (non-current portion), as appropriate, and primarily relates to customer deposits for futures and option contracts associated with regulated commodities held in separate accounts as required under federal and other regulations. Pursuant to the amendments in this ASU should be applied on a modified retrospective basis through a cumulative-effect adjustment directly to retained earnings asrequirements of the beginning of the period of adoption. We electedCommodity Exchange Act, such funds must be carried in separate accounts that are designated as segregated customer accounts, as applicable. Restricted cash also includes funds held in escrow pursuant to early adopt ASU No. 2016-16 during the first quarter of fiscal 2018. The adoption did not have a material impact on our consolidated financial statements.applicable regulations limiting their usage.
Not Yet AdoptedThe following table provides a reconciliation of cash and cash equivalents and restricted cash as reported within our Consolidated Balance Sheets that aggregates to the amount presented in our Consolidated Statements of Cash Flows. During the three months ended November 30, 2018, we updated the presentation of our Consolidated Statements of Cash Flows to include restricted cash with cash and cash equivalents when reconciling the beginning-of-period and end-of-period total amounts shown on our Consolidated Statements of Cash Flows.
|
| | | | | | | | | | | | | | | |
| | November 30, 2018 | | August 31, 2018 | | November 30, 2017 | | August 31, 2017 |
| | (Dollars in thousands)
|
| Cash and cash equivalents | $ | 266,152 |
| | $ | 450,617 |
| | $ | 249,767 |
| | $ | 181,379 |
|
| Restricted cash included in other current assets | 72,687 |
| | 90,193 |
| | 88,525 |
| | 83,561 |
|
| Restricted cash included in other assets | 3,053 |
| | 3,130 |
| | 5,119 |
| | 7,332 |
|
| Total Cash and cash equivalents and restricted cash | $ | 341,892 |
| | $ | 543,940 |
| | $ | 343,411 |
| | $ | 272,272 |
|
Investments
In August 2017,As described in the FASB issued ASU"Recent Accounting Pronouncements" section below, we adopted Accounting Standards Update ("ASU") No. 2017-122016-01, Recognition and Measurement of Financial Assets and Financial Liabilities, Derivatives and Hedging (Topic 815): Targeted Improvements to Accounting for Hedging Activities. This ASU is intended to improve the financial reporting of hedging relationships to better represent the economic results of an entity’s risk management activities in its financial statements and make certain improvements to simplify the application of the hedge accounting guidance. The amendments in this ASU will make more financial and nonfinancial hedging strategies eligible for hedge accounting, amend the presentation and disclosure requirements and change how entities assess effectiveness. Entities are required to apply this ASU's provisions as a cumulative-effect adjustment to retained earnings as of the beginning of the first reporting period in which the guidance is adopted. This ASU iswas effective for us beginning September 1, 2019,2018. As a result, all equity securities that do not result in consolidation and are not accounted for under the equity method are measured at fair value with changes therein reflected in net income. We have elected to utilize the measurement alternative for equity investments that do not have readily determinable fair values and measure these investments at cost less impairment plus or minus observable price changes in orderly transactions.
Investments in other cooperatives are recorded in a manner similar to equity investments without readily determinable fair values, plus patronage dividends received in the form of capital stock and other equities. Patronage dividends are recorded as a reduction to cost of goods sold at the time qualified written notices of allocation are received. Investments in debt and equity instruments are carried at amounts that approximate fair values.
Revenue Recognition
We provide a wide variety of products and services, ranging from agricultural inputs such as fuels, farm supplies and crop nutrients, to agricultural outputs that include grain and oilseed, processed grains and oilseeds and food products, and ethanol production and marketing. Revenue is recognized when performance obligations under the terms of a contract with a customer are satisfied, which generally occurs when control of the goods has transferred to the customer. For the majority of our fiscal year 2020contracts with customers, control transfers to customers at a point-in-time when the goods/services have been delivered, as that is generally when legal title, physical possession and risks and rewards of goods/services transfers to the customer. In limited arrangements, control transfers over time as the customer simultaneously receives and consumes the benefits of the service as we complete the performance obligation(s).
Revenue is recognized at the transaction price that we expect to be entitled to in exchange for interim periodstransferring goods or services to a customer, excluding amounts collected on behalf of third parties. We follow a policy of recognizing revenue at the point-in-time or over the period of time we satisfy our performance obligation by transferring control over a product or service to a customer in accordance with the underlying contract. For physically settled derivative sales contracts that are outside the scope of the revenue guidance, we recognize revenue when control of the inventory is transferred within that fiscal year. We are currently evaluating the impact the adoption will have on our consolidated financial statements.meaning of Accounting Standards Codification ("ASC") Topic 606.
Recent Accounting Pronouncements
Adopted
In March 2017, the FASBFinancial Accounting Standards Board (the "FASB") issued ASUAccounting Standards Update ("ASU") No. 2017-07, Compensation - Retirement Benefits (Topic 715): Improving the Presentation of Net Periodic Pension Costs and Net Postretirement Benefit Cost. This ASU changes the presentation of net periodic pension cost and net periodic postretirement benefit cost in the income statement.Consolidated Statements of Operations. This ASU requiresprovides that the service cost component should be included in the same income statement line item as other compensation costs arising from services rendered by the employees during the period. The other components of net periodic benefit cost should(such as interest, expected return on plan assets, prior service cost amortization and actuarial gain/loss amortization) are required to be presented in the income statementConsolidated
Statements of Operations separately outside of operating income if that subtotal is presented.income. Additionally, only service cost may be capitalized in assets. This ASU iswas effective for us beginning September 1, 2018, for our fiscal year 2019 and for interim periods within that fiscal year. The guidance on the presentation of the components of net periodic benefit cost in the income statement should beConsolidated Statements of Operations has been applied retrospectively, and the guidance regarding the capitalization of the service cost component in assets should behas been applied prospectively. The adoption of this guidance had no impact on previously reported income (loss) before income taxes or net income attributable to CHS; however, non-service cost components of net periodic benefit costs in prior periods have been reclassified from operating expenses and are now reported outside of operating income within other (income) loss. Specifically, the retrospective adjustments recorded as a result of the adoption of this guidance resulted in an increase to cost of goods sold and marketing, general and administrative expense of $0.3 million and $0.8 million, respectively, and a corresponding increase of $1.2 million to other income during the three months ended November 30, 2017. There was no impact to previously reported income before income taxes and net income attributable to CHS as a result of adoption. The adoption of this amended guidance isdid not expected to have a material impact on our consolidated financial statements.
In January 2017, the FASB issued ASU No. 2017-01, Business Combinations (Topic 805):: Clarifying the Definition of a Business. The amendments within this ASU narrow the existing definition of a business and provide a more robust framework for evaluating whether a transaction should be accounted for as an acquisition (or disposal) of assets or a business. The definition of a business impacts various areas of accounting, including acquisitions, disposals and goodwill. Under the new guidance, fewer acquisitions are expected to be considered businesses. This ASU iswas effective for us beginning September 1, 2018, for our fiscal year 2019 and for interim periods within that fiscal year. Early adoption is permitted and theThe guidance should behas been applied prospectively to transactions following the adoption date.prospectively. The adoption of this amended guidance isdid not expected to have a material impact on our consolidated financial statements.
In November 2016, the FASB issued ASU No. 2016-18, Statement of Cash Flows (Topic 230): Restricted Cash. This ASU is intended to reduce diversity in practice by adding or clarifying guidance on classification and presentation of changes inrequires restricted cash and restricted cash equivalents to be included with cash and cash equivalents when reconciling the beginning-of-period and end-of-period total amounts shown on the statementConsolidated Statements of Cash Flows as well as disclosure about the nature of restrictions on cash, cash equivalents and amounts generally described as restricted cash. Additionally, the guidance requires disclosure of the total amount of cash, flows.cash equivalents and restricted cash for each comparative period for which a Consolidated Balance Sheet is presented. This ASU iswas effective for us beginning September 1, 2018, for our fiscal year 2019 and for interim periods within that fiscal year. Early adoption is permitted, including in an interim period. The amendments in this ASU should bewere applied retrospectively to all periods presented. Refer to the additional disclosures pertaining to restricted cash within the Restricted Cash significant accounting policy above. The adoption of this amended guidance isdid not expectedhave a material impact on our Consolidated Statements of Cash Flows.
In January 2016, the FASB issued ASU No. 2016-01, Recognition and Measurement of Financial Assets and Financial Liabilities, which requires equity investments (except those accounted for under the equity method of accounting or those that result in consolidation of the investee) to be measured at fair value with changes in fair value recognized in net income. This guidance eliminates the previous cost method of accounting for certain equity securities that did not have readily determinable fair values. This guidance also simplifies the impairment assessment and allows for a fair value measurement alternative for equity investments without readily determinable fair values and includes presentation and disclosure changes. This ASU was effective for us beginning September 1, 2018, for our fiscal year 2019 and for interim periods within that fiscal year and was applied following a prospective basis. We have elected to utilize the measurement alternative for equity investments that do not have readily determinable fair values and measure these investments at cost less impairment plus or minus observable price changes in orderly transactions. As a result of the adoption of this amended guidance, we reclassified approximately $4.7 million from accumulated other comprehensive loss to the opening balance of capital reserves within our Consolidated Balance Sheet as of September 1, 2018, which did not have a material impact on our consolidated statement of cash flows.financial statements.
In August 2016, the FASB issued ASU No. 2016-15, Statement of Cash Flows (Topic 230): Classification of Certain Cash Receipts and Cash Payments. This ASU is intended to reduce existing diversity in practice in how certain cash receipts and payments are presented and classified in the statementConsolidated Statements of cash flows.Cash Flows. This ASU iswas effective for us beginning September 1, 2018, for our fiscal year 2019 and for interim periods within that fiscal year. The adoption of this amended guidance did not have a material impact on our Consolidated Statements of Cash Flows.
In May 2014, the FASB issued ASU No. 2014-09, Revenue from Contracts withCustomers (Topic 606). The amendments within this ASU, as well as within the additional clarifying ASUs issued by the FASB, provide a single comprehensive model to be used to determine the measurement of revenue and timing of recognition for revenue arising from contracts with customers. The core principle of the amended guidance is that an entity should recognize revenue to depict the transfer of promised goods or services to customers in an amount that reflects the consideration to which the entity expects to be entitled in exchange for those goods or services. The new revenue recognition guidance includes a five-step model for the recognition of revenue, including (1) identifying the contract with a customer, (2) identifying the performance obligations in the
contract, (3) determining the transaction price, (4) allocating the transaction price to the performance obligations, and (5) recognizing revenue when (or as) an entity satisfies a performance obligation. This ASU was effective for us beginning September 1, 2018, for our fiscal year 2019 and for interim periods within that fiscal year, and we elected to apply the modified retrospective method of adoption to all contracts as of the date of initial application. The majority of our revenues are attributable to forward commodity sales contracts, which are considered to be physically settled derivatives under ASC 815, Derivatives and Hedging (Topic 815). Revenues arising from derivative contracts accounted for under ASC 815 are specifically outside the scope of ASC Topic 606 and therefore not subject to the provisions of the new revenue recognition guidance. As such, the impact of adoption of the new revenue guidance has only been assessed for our revenue contracts that are not accounted for as derivative arrangements. The primary impact of adoption was changes to the timing of revenue recognition for certain revenue streams that had an immaterial impact. Following the modified retrospective method of adoption, we determined the cumulative effect of adoption for all contracts with customers that had not been completed as of the adoption date was less than $1.0 million. Additionally, the impact of applying ASC Topic 606 compared to previous guidance during the three months ended November 30, 2018, was an overall decrease to revenues of $13.1 million. Our revenue recognition accounting policy and additional information related to our revenue streams and related performance obligations required to be satisfied in order to recognize revenue can be found within Note 3, Revenues.
Not Yet Adopted
In August 2018, the FASB issued ASU No. 2018-15, Intangibles - Goodwill and Other - Internal-Use Software: Customer’s Accounting for Implementation Costs Incurred in a Cloud Computing Arrangement That Is a Service Contract. This ASU reduces the complexity of accounting for implementation, setup, and other upfront costs incurred in a cloud computing service arrangement that is hosted by a vendor. This ASU aligns the accounting for implementation costs of hosting arrangements, irrespective of whether the arrangements convey a license to the hosted software. This ASU permits either a prospective or retrospective transition approach. This ASU is effective for us beginning September 1, 2020, for our fiscal year 2021 and for interim periods within that fiscal year, with early adoption permitted. The adoption of this amended guidance is not expected to have a material impact on our consolidated statementfinancial statements.
In August 2018, the FASB issued ASU No. 2018-14, Disclosure Framework - Changes to the Disclosure Requirements for Defined Benefit Plans, which amends ASC 715-20, Compensation - Retirement Benefits - Defined Benefit Plans - General. This ASU modifies the disclosure requirements for employers that sponsor defined benefit pension or other postretirement plans by removing and adding certain disclosures for these plans. The eliminated disclosures include (a) the amounts in accumulated other comprehensive income expected to be recognized in net periodic benefit costs over the next fiscal year and (b) the effects of a one-percentage-point change in assumed health care cost trend rates on the net periodic benefit costs and the benefit obligation for postretirement health care benefits. The new disclosures include the interest crediting rates for cash flows.balance plans and an explanation of significant gains and losses related to changes in benefit obligations. This ASU is effective for us beginning September 1, 2021, for our fiscal year 2022 and for interim periods within that fiscal year, with early adoption permitted. The adoption of this amended guidance is not expected to have a material impact on our consolidated financial statements.
In August 2018, the FASB issued ASU No. 2018-13, Disclosure Framework - Changes to the Disclosure Requirements for Fair Value Measurement, which amends ASC 820, Fair Value Measurement. This ASU modifies the disclosure requirements for fair value measurements by removing, modifying and adding certain disclosures. Specifically, the guidance removes the requirement to disclose the amount and reasons for any transfers between Level 1 and Level 2 of the fair value hierarchy and removes the requirement to disclose a description of the valuation processes used to value Level 3 fair value measurements. The guidance also requires additional disclosures surrounding Level 3 changes in unrealized gains/losses included in other comprehensive income as well as the range and weighted average significant unobservable inputs calculation. This ASU is effective for us beginning September 1, 2020, for our fiscal year 2021 and for interim periods within that fiscal year. Early adoption is permitted. We elected to remove the disclosures permitted by ASU No. 2018-13 during the fourth quarter of fiscal 2018 but have not early adopted the new required additional disclosures, which is permitted by the guidance. The adoption of this amended guidance is not expected to have a material impact on our consolidated financial statements.
In June 2016, the FASB issued ASU No. 2016-13, Financial Instruments - Credit Losses(Topic (Topic 326): : Measurement of Credit Losses on Financial Instruments. The amendments in this ASU introduce a new approach, based on expected losses, to estimate credit losses on certain types of financial instruments. This ASU is intended to provide financial statementusers with more decision-useful information about the expected credit losses associated with most financial assets measured at amortized cost and certain other instruments, including trade and other receivables, loans, held-to-maturity debt securities, net investments in leases, and off-balance-sheet credit exposures. Entities are required to apply the provisions of this ASU’s provisionsASU as a cumulative-effect adjustment to retained earnings as of the beginning of the first reporting period in which the guidance is adopted. This
ASU is effective for us beginning September1, 2020, for our fiscal year 2021 and for interim periods within that fiscal year. We are currently evaluating the impact the adoption will have on our consolidated financial statements.
In February 2016, the FASB issued ASU No. 2016-02, Leases (Topic 842), which replaces the existing guidance in Accounting Standards Codification ("ASC")within ASC 840 - Leases. The amendments within this ASU, as well as within additional clarifying ASUs issued by the FASB, introduce a lessee model requiring
entities to recognize assets and liabilities for most leases, but continue recognizing the associated expenses in a manner similar to existing accounting guidance. This ASU does not make fundamental changes to existing lessor accounting; however, it does modify what constitutes a sales-type or direct financing lease andIn July 2018, the related accounting, and aligns a number of the underlying principles with those of the new revenue standard,FASB issued ASU No. 2014-09. The guidance also eliminates existing real estate-specific provisions and requires expanded qualitative and quantitative disclosures.2018-10, Codification Improvements to Topic 842, Leases, which amends ASU No. 2016-02, Leases. This ASU is effective for us beginning September 1, 2019, for our fiscal year 2020 and for interim periods within that fiscal year, and the ASU’s provisions are required to be applied using a modified retrospective approach.year. We have initiated a preliminaryour assessment of the new lease standard, including the utilization of surveys to gather more information about existing leases and the implementation of a new lease software that willto improve the collection, maintenance and aggregation of lease data necessary for the expanded reporting and disclosure requirements under the new lease standard. OneIt is expected that the primary impact upon adoption will be the recognition, on a discounted basis, of the more significant changes arising from the new lease standard relates to a numberour minimum commitments under noncancelable operating leases as right of operating lease agreements not currently recognizeduse assets and liabilities on our Consolidated Balance Sheets. The new lease guidanceThis will require these lease agreements to be recognized on the Consolidated Balance Sheets asresult in a right-of-use asset along with a corresponding lease liability. As a result, our preliminary assessment indicates the provisions of ASU No. 2016-02 are expected to have a material impactsignificant increase in assets and liabilities recorded on our Consolidated Balance Sheets. Although we expect the new lease guidance towill have a material impact on our Consolidated Balance Sheets, we are continuing to evaluate the practical expedient guidance provisions available and the extent of potential impact the new lease guidance will haveimpacts on our consolidated financial statements, processes and internal controls.
Note 2 Restatement of Previously Issued Financial Information
The consolidated financial statements for the three months ended November 30, 2017, have been restated to reflect the correction of misstatements. We have also restated all amounts impacted within the notes to the consolidated financial statements. A description of the adjustments and their impact on the previously issued financial information are included below.
Descriptions of Restatement Adjustments
Restatement Background
During the preparation of our Annual Report on Form 10-K for the year ended August 31, 2018, we noted potentially excessive valuations in the net derivative asset valuations relating to certain rail freight contracts purchased in connection with our North American grain marketing operations. An investigation concluded that the rail freight misstatements included in our consolidated financial statements were due to intentional misconduct by a former employee in our rail freight trading operations, as well as due to rail freight contracts and certain non-rail contracts not meeting the technical accounting requirements to qualify as derivative financial instruments. The misconduct consisted of the former employee manipulating the mark-to-market valuation of rail cars that were the subject of rail freight purchase contracts and manipulating the quantity of rail cars included in the monthly mark-to-market valuation. In addition, the investigation revealed intentional misstatements were made by the former employee to our independent registered public accounting firm in connection with its audit of our consolidated financial statements for the fiscal year ended August 31, 2017. During the course of, and as a result of, the investigation, we terminated the former employee and have taken additional personnel actions.
As described in additional detail in the Explanatory Note in our Annual Report on Form 10-K for the year ended August 31, 2018, the Company restated its audited consolidated financial statements for the fiscal years ended August 31, 2017 and 2016, and our unaudited consolidated financial statements for the quarterly periods ended November 30, 2017 and 2016, February 28, 2018 and 2017, and May 31, 2018 and 2017. As a result of the misstatements, we restated our interim consolidated financial statements for the three months ended November 30, 2017. In addition to the adjustments related to freight derivatives and related misstatements, we also made adjustments related to certain intercompany balances and other historical misstatements unrelated to the freight derivatives and related misstatements.
Consolidated financial statement adjustment tables
The following tables present the impacts of the restatement adjustments to our unaudited Consolidated Statement of Operations, unaudited Consolidated Statement of Comprehensive Income and unaudited Consolidated Statement of Cash Flows for the three months ended November 30, 2017. The restatement references identified in the following tables directly correlate to the restatement adjustments detailed below.
The categories of restatement adjustments and their impact on previously reported consolidated financial statements are described below.
In May 2014,(a) Freight derivatives and related misstatements - Corrections for freight derivatives and related misstatements were
driven by the FASB issued ASU No. 2014-09, Revenue from Contractsmisstatement of amounts associated with Customers. The amendments within this ASU,both the value and quantity of rail freight contracts, as well as due to rail and certain non-rail freight contracts not meeting the technical accounting requirements to qualify as derivative financial instruments. In addition to the elimination of the underlying freight derivative assets and liabilities and related impacts on revenues and cost of goods sold, additional adjustments were recorded to account for prepaid freight capacity balances in relevant periods. Additional details related to the impact of the freight derivatives and related misstatements and their impact on each period are discussed in restatement reference (a).
(b) Intercompany misstatements - As a result of the work performed in relation to the freight misstatement, additional misstatements related to the incorrect elimination of intercompany balances were also identified and corrected within additional clarifying ASUs issued by the FASB, provideconsolidated financial statements. Certain of these intercompany misstatements resulted in a single comprehensive modelmisstatement of various financial statement line items; however, the intercompany misstatements did not result in a material misstatement of income (loss) before income taxes or net income (loss). Additional details related to be usedthe impact of the intercompany misstatements and their impact on each period are discussed in restatement reference (b).
(c) Other misstatements - We made adjustments for other previously identified misstatements unrelated to the freight derivatives and related misstatements that were not material, individually or in the accounting for revenue arising from contracts with customers and supersedes most current revenue recognition guidance, including industry-specific guidance. The new revenue recognition guidance includes a five-step model for the recognition of revenue, including (1) identifying the contract with a customer, (2) identifying the performance obligations in the contract, (3) determining the transaction price, (4) allocating the transaction priceaggregate, to the performance obligations, and (5) recognizing revenue when (or as) an entity satisfies a performance obligation. The new revenue recognition guidance also specifies the accounting for certain costs to obtain or fulfill a contract with a customer and requires expanded disclosures about the nature, amount, timing and uncertainty of revenue and cash flows arising from contracts with customers. We have completed an initial assessment of our revenue streams and do not believe that the new revenue recognition guidance will have a material impact on our consolidated financial statements. CertainThese other misstatements related primarily to certain misclassifications, adjustments to revenues and cost of goods sold, and adjustments to various income tax and indirect tax accrual accounts. Additional details related to the impact of the other misstatements and their impact on each period are discussed in restatement reference (c).
CHS INC. AND SUBSIDIARIES
CONSOLIDATED STATEMENT OF OPERATIONS
(Unaudited)
|
| | | | | | | | | | | | | | | | | | | | | |
| | For the Three Months Ended November 30, 2017 | | |
| | As Previously Reported | | Restatement Adjustments | | As Restated | | Accounting Changes* | | As Presented | | Restatement References |
| | (Dollars in thousands) | | |
| Revenues | $ | 8,048,889 |
| | $ | (17,005 | ) | | $ | 8,031,884 |
| | $ | — |
| | $ | 8,031,884 |
| | a, b, c |
| Cost of goods sold | 7,735,627 |
| | (24,570 | ) | | 7,711,057 |
| | 335 |
| | 7,711,392 |
| | a, b, c |
| Gross profit | 313,262 |
| | 7,565 |
| | 320,827 |
| | (335 | ) | | 320,492 |
| | |
| Marketing, general and administrative | 140,168 |
| | (668 | ) | | 139,500 |
| | 846 |
| | 140,346 |
| | c |
| Reserve and impairment charges (recoveries), net | (3,787 | ) | | — |
| | (3,787 | ) | | — |
| | (3,787 | ) | | |
| Operating earnings (loss) | 176,881 |
| | 8,233 |
| | 185,114 |
| | (1,181 | ) | | 183,933 |
| | |
| Interest expense | 40,702 |
| | — |
| | 40,702 |
| | — |
| | 40,702 |
| | |
| Other (income) loss | (25,014 | ) | | — |
| | (25,014 | ) | | (1,181 | ) | | (26,195 | ) | | |
| Equity (income) loss from investments | (38,362 | ) | | — |
| | (38,362 | ) | | — |
| | (38,362 | ) | | |
| Income (loss) before income taxes | 199,555 |
|
| 8,233 |
| | 207,788 |
| | — |
| | 207,788 |
| | |
| Income tax expense (benefit) | 19,936 |
| | 670 |
| | 20,606 |
| | — |
| | 20,606 |
| | a |
| Net income (loss) | 179,619 |
| | 7,563 |
| | 187,182 |
| | — |
| | 187,182 |
| | |
| Net income (loss) attributable to noncontrolling interests | (464 | ) | | — |
| | (464 | ) | | — |
| | (464 | ) | | |
| Net income (loss) attributable to CHS Inc. | $ | 180,083 |
| | $ | 7,563 |
| | $ | 187,646 |
| | $ | — |
| | $ | 187,646 |
| | |
* Previously reported amounts have been revised to reflect the impact of adopting ASU 2017-17 retrospectively during the first quarter of fiscal 2019. Refer to details related to the adoption of new ASUs within Note 1, Basis of Presentation and Significant Accounting Policies.
Freight derivatives and related misstatements
(a) The correction of freight derivatives and related misstatements resulted in a $0.5 million reduction of income before income taxes and a $1.2 million reduction of net income. These adjustments related to a $0.5 million increase of cost of goods sold and a $0.7 million increase of income tax expense related to the tax effect of the freight derivatives and related misstatements.
Intercompany misstatements
(b) The correction of intercompany misstatements had no impact on income (loss) before income taxes or net income (loss); however, the correction resulted in an $11.4 million decrease of both revenues and cost of goods sold due to different practices of eliminating intercompany sales between CHS's businesses that existed in previous periods.
Other misstatements
(c) The correction of other misstatements resulted in an $8.8 million increase of income before income taxes and net income. The $8.8 million increase of income before income taxes relates primarily to a $6.2 million decrease of cost of goods sold related to the valuation of crack spread derivatives and a $2.6 million decrease in costs related to postretirement benefit plan activity that resulted from a timing difference associated with recording certain benefit plan expenses (included in cost of goods sold and marketing, general and administrative expenses).
Additionally, certain misclassification and offsetting adjustments were made between line items included in the Consolidated Statements of Operations primarily due to the application of differing accounting policies between businesses. These misclassification adjustments resulted in a $5.7 million decrease of revenues and cost of goods sold.
CHS INC. AND SUBSIDIARIES
CONSOLIDATED STATEMENT OF COMPREHENSIVE INCOME
(Unaudited)
|
| | | | | | | | | | | | | |
| | For the Three Months Ended November 30, 2017 | | |
| | As Previously Reported | | Restatement Adjustments | | As Restated | | Restatement References |
| | (Dollars in thousands) | | |
| Net income (loss) | $ | 179,619 |
| | $ | 7,563 |
| | $ | 187,182 |
| | a, c |
| Other comprehensive income (loss), net of tax: | | | | | | | |
| Postretirement benefit plan activity | 4,196 |
| | (2,602 | ) | | 1,594 |
| | c |
| Unrealized net gain (loss) on available for sale investments | 3,640 |
| | — |
| | 3,640 |
| | |
| Cash flow hedges | (4 | ) | | — |
| | (4 | ) | | |
| Foreign currency translation adjustment | (2,607 | ) | | 396 |
| | (2,211 | ) | | a |
| Other comprehensive income (loss), net of tax | 5,225 |
| | (2,206 | ) | | 3,019 |
| | |
| Comprehensive income | 184,844 |
| | 5,357 |
| | 190,201 |
| | |
| Less comprehensive income attributable to noncontrolling interests | (464 | ) | | — |
| | (464 | ) | | |
| Comprehensive income attributable to CHS Inc. | $ | 185,308 |
| | $ | 5,357 |
| | $ | 190,665 |
| | |
Freight derivatives and related misstatements
(a) The correction of freight derivatives and related misstatements resulted in a $1.2 million reduction of net income. Refer to descriptions of the adjustments and their impact on net income (loss) in the Consolidated Statement of Operations section for the three months ended November 30, 2017, above. The adjustment related to foreign currency translation is attributable to the foreign currency impact associated with goodwill that was impaired during fiscal 2015.
Intercompany misstatements
(b) None
Other misstatements
(c) The correction of other misstatements resulted in an $8.8 million increase of net income. Refer to descriptions of the adjustments and their impact on net income (loss) in the Consolidated Statement of Operations section for the three months ended November 30, 2017, above. The adjustment related to postretirement benefit plan activity is attributable to a timing difference associated with recording certain benefit plan expenses.
CHS INC. AND SUBSIDIARIES
CONSOLIDATED STATEMENTS OF CASH FLOWS
(Unaudited)
|
| | | | | | | | | | | | | | | | | | | | | |
| | For the Three Months Ended November 30, 2017 | | |
| | As Previously Reported | | Restatement Adjustments | | As Restated | | Accounting Changes* | | As Presented | | Restatement References |
| | (Dollars in thousands) | | | |
| Cash flows from operating activities: | |
| | | | | | |
| | | | |
| Net income (loss) | $ | 179,619 |
| | $ | 7,563 |
| | $ | 187,182 |
| | $ | — |
| | $ | 187,182 |
| | a, c |
| Adjustments to reconcile net income to net cash provided by (used in) operating activities: | |
| | | | | | | |
|
| | |
| Depreciation and amortization | 120,148 |
| | — |
| | 120,148 |
| | — |
| | 120,148 |
| | |
| Amortization of deferred major repair costs | 16,418 |
| | — |
| | 16,418 |
| | — |
| | 16,418 |
| | |
| Equity (income) loss from investments | (38,362 | ) | | — |
| | (38,362 | ) | | — |
| | (38,362 | ) | | |
| Distributions from equity investments | 12,514 |
| | — |
| | 12,514 |
| | — |
| | 12,514 |
| | |
| Provision for doubtful accounts | (3,601 | ) | | — |
| | (3,601 | ) | | — |
| | (3,601 | ) | | |
| Deferred taxes | 15,044 |
| | 1,302 |
| | 16,346 |
| | — |
| | 16,346 |
| | a |
| Other, net | 2,976 |
| | (2,601 | ) | | 375 |
| | — |
| | 375 |
| | c |
| Changes in operating assets and liabilities, net of acquisitions: | |
| | | | | | | |
|
| | |
| Receivables | (80,637 | ) | | 23,937 |
| | (56,700 | ) | | — |
| | (56,700 | ) | | c |
| Inventories | (472,180 | ) | | (40,843 | ) | | (513,023 | ) | | — |
| | (513,023 | ) | | c |
| Derivative assets | 67,365 |
| | (3,439 | ) | | 63,926 |
| | — |
| | 63,926 |
| | a, c |
| Margin and related deposits | (893 | ) | | — |
| | (893 | ) | | — |
| | (893 | ) | | |
| Supplier advance payments | (292,905 | ) | | (631 | ) | | (293,536 | ) | | — |
| | (293,536 | ) | | b |
| Other current assets and other assets | 2,689 |
| | 883 |
| | 3,572 |
| | 2,751 |
| | 6,323 |
| | a |
| Customer margin deposits and credit balances | (18,045 | ) | | — |
| | (18,045 | ) | | — |
| | (18,045 | ) | | |
| Customer advance payments | 1,278 |
| | (11,529 | ) | | (10,251 | ) | | — |
| | (10,251 | ) | | b, c |
| Accounts payable and accrued expenses | 441,071 |
| | 12,148 |
| | 453,219 |
| | — |
| | 453,219 |
| | a, c |
| Derivative liabilities | (97,329 | ) | | (2,627 | ) | | (99,956 | ) | | — |
| | (99,956 | ) | | a, c |
| Other liabilities | 4,376 |
| | — |
| | 4,376 |
| | — |
| | 4,376 |
| | |
| Net cash provided by (used in) operating activities | (140,454 | ) | | (15,837 | ) | | (156,291 | ) | | 2,751 |
| | (153,540 | ) | | |
| Cash flows from investing activities: | |
| | | | | | | |
|
| | |
| Acquisition of property, plant and equipment | (85,824 | ) | | — |
| | (85,824 | ) | | — |
| | (85,824 | ) | | |
| Proceeds from disposition of property, plant and equipment | 56,079 |
| | — |
| | 56,079 |
| | — |
| | 56,079 |
| | |
| Proceeds from sale of business | 29,457 |
| | — |
| | 29,457 |
| | — |
| | 29,457 |
| | |
| Expenditures for major repairs | (1,039 | ) | | — |
| | (1,039 | ) | | — |
| | (1,039 | ) | | |
| Investments redeemed | 5,195 |
| | — |
| | 5,195 |
| | — |
| | 5,195 |
| | |
| Changes in CHS Capital notes receivable, net | (69,227 | ) | | — |
| | (69,227 | ) | | — |
| | (69,227 | ) | | |
| Financing extended to customers | (15,778 | ) | | — |
| | (15,778 | ) | | — |
| | (15,778 | ) | | |
| Payments from customer financing | 16,520 |
| | — |
| | 16,520 |
| | — |
| | 16,520 |
| | |
| Other investing activities, net | 1,847 |
| | — |
| | 1,847 |
| | — |
| | 1,847 |
| | |
| Net cash provided by (used in) investing activities | (62,770 | ) | | — |
| | (62,770 | ) | | — |
| | (62,770 | ) | | |
| Cash flows from financing activities: | |
| | | | | | | |
|
| | |
| Proceeds from lines of credit and long-term borrowings | 8,006,980 |
| | — |
| | 8,006,980 |
| | — |
| | 8,006,980 |
| | |
| Payments on lines of credit, long-term borrowings and capital lease obligations | (7,657,713 | ) | | 3,052 |
| | (7,654,661 | ) | | — |
| | (7,654,661 | ) | | c |
| Preferred stock dividends paid | (42,167 | ) | | — |
| | (42,167 | ) | | — |
| | (42,167 | ) | | |
| Redemptions of equities | (3,682 | ) | | — |
| | (3,682 | ) | | — |
| | (3,682 | ) | | |
| Other financing activities, net | (31,680 | ) | | 10,423 |
| | (21,257 | ) | | — |
| | (21,257 | ) | | c |
| Net cash provided by (used in) financing activities | 271,738 |
| | 13,475 |
| | 285,213 |
| | — |
| | 285,213 |
| | |
| Effect of exchange rate changes on cash and cash equivalents | 2,236 |
| | — |
| | 2,236 |
| | — |
| | 2,236 |
| | |
| Net increase (decrease) in cash and cash equivalents and restricted cash | 70,750 |
| | (2,362 | ) | | 68,388 |
| | 2,751 |
| | 71,139 |
| | b |
| Cash and cash equivalents and restricted cash at beginning of period | 181,379 |
| | — |
| | $ | 181,379 |
| | 90,893 |
| | 272,272 |
| | |
| Cash and cash equivalents and restricted cash at end of period | $ | 252,129 |
| | $ | (2,362 | ) | | $ | 249,767 |
| | $ | 93,644 |
| | $ | 343,411 |
| | |
* Previously reported amounts have been revised to reflect the impact of adopting ASU 2016-18 retrospectively during the first quarter of fiscal 2019. Refer to details related to the adoption of new ASUs within Note 1, Basis of Presentation and Significant Accounting Policies.
Freight derivatives and related misstatements
(a) The correction of freight derivatives and related misstatements resulted in a $1.2 million reduction of net income for the three months ended November 30, 2017. Refer to descriptions of the adjustments and their impact on net income (loss) in the Consolidated Statement of Operations section for the three months ended November 30, 2017, above. The impact of the adjustments to the Consolidated Balance Sheets as of August 31, 2017, and November 30, 2017, resulted in certain misclassifications of less than $3.0 million between operating activity line items in the Consolidated Statements of Cash Flows; however, none of the freight derivatives and related misstatements impacted the classifications between operating, investing or financing activities.
Intercompany misstatements
(b) The correction of intercompany misstatements did not impact net income for the three months ended November 30, 2017; however, the impact of adjustments to the Consolidated Balance Sheets as of August 31, 2017, and November 30, 2017, resulted in certain misclassification adjustments of less than $3.0 million between line items in the Consolidated Statements of Cash Flows. None of the intercompany misstatements impacted the classifications between operating, investing or financing activities within the Consolidated Statements of Cash Flows; however, a timing difference related to the application of supplier advance payments resulted in a $2.4 million decrease of cash as of November 30, 2017.
Other misstatements
(c) The correction of other misstatements resulted in an $8.8 million increase of net income for the three months ended November 30, 2017. Refer to further details of the adjustments and their impact on net income (loss) in the Consolidated Statement of Operations section for the three months ended November 30, 2017, above. The impact of the adjustments to the Consolidated Balance Sheets as of August 31, 2017, and November 30, 2017, resulted in certain misclassification adjustments between line items in the Consolidated Statements of Cash Flows. As a result, two misclassification adjustments were made between operating and financing activities, including a $3.1 million reduction of notes payable resulting from a duplicative entry and the misclassification of a $10.4 million negative cash balance associated with a timing difference for the application of in-transit cash. In addition, various misclassification adjustments were made between operating activity lines, the most significant of which related to (1) a $24.1 million decrease of inventory and increase in accounts receivable as of August 31, 2017, due to a timing difference related to the settlement of a single ocean vessel and (2) the $18.3 million net impact associated with the decrease of inventory and increase of accounts payable that resulted from the misclassification adjustment for certain items previously included within a contra-inventory account to accounts payable as of August 31, 2017, and November 30, 2017.
Note 3 Revenues
Adoption of New Revenue Guidance
As described in Note 1, Basis of Presentation and Significant Accounting Policies, we adopted the guidance within ASU 2014-09 as of September 1, 2018, using the modified retrospective transition approach. Consistent with other companies that actively trade commodities, a majority of our revenues are attributable to forward commodity sales contracts that are considered to be physically settled derivatives under ASC 815, Derivatives and Hedging (ASC Topic 815) and therefore fall outside the scope of ASC Topic 606. As a result, these revenues are not subject to the provisions of the new revenue guidance and the impact of adoption is limited to our revenue streams are expected tothat fall within the scope of the new revenue recognition guidance; however, a substantial portionguidance.
The majority of our revenue falls outsidestreams that fall within the scope of the new revenue guidance are recognized at a point-in-time; however, the adoption of ASU 2014-09 resulted in a minimal number of changes to the timing of revenue recognition guidancefor certain revenue streams. Under the modified retrospective method of adoption, we determined the cumulative effect of adoption for all contracts with customers that had not been completed as of the adoption date and will continuerecognized an adjustment of less than $1.0 million to follow existing guidance, primarily ASC 815, Derivatives and Hedging. We are continuing to evaluatethe opening capital reserves balance within the Consolidated Balance Sheet as of September 1, 2018. Additionally, the impact of applying ASC Topic 606 compared to previous guidance during the newthree months ended November 30, 2018, was an overall decrease to revenues of $13.1 million.
The change in accounting for revenue recognition under ASU 2014-09 did not have a material impact on our Consolidated Statement of Operations for the three months ended November 30, 2018, or Consolidated Balance Sheet as of November 30, 2018.
Revenue Recognition Accounting Policy and Performance Obligations
We provide a wide variety of products and services, from agricultural inputs such as fuels, farm supplies and crop nutrients, to agricultural outputs that include grain and oilseed, processed grains and oilseeds and food products, and ethanol production and marketing. We primarily conduct our operations and derive revenues within our Energy and Ag businesses. Our Energy business derives its revenues through refining, wholesaling and retailing of petroleum products. Our Ag business derives its revenues through the origination and marketing of grain, including service activities conducted at export terminals; through wholesale sales of crop nutrients and processed sunflowers; from sales of soybean meal, soybean refined oil and soyflour products; through the production and marketing of renewable fuels; and through retail sales of petroleum and agronomy products, and feed and farm supplies.
Revenue is recognized when performance obligations under the terms of a contract with a customer are satisfied, which generally occurs when control of the goods has transferred to customers. For the majority of our contracts with customers, control transfers to customers at a point-in-time when goods/services have been delivered, as that is generally when legal title, physical possession and risks and rewards of goods/services transfers to the customer. In limited arrangements, control transfers over time as the customer simultaneously receives and consumes the benefits of the service as we complete our performance obligation(s).
Revenue is recognized at the transaction price that we expect to be entitled to in exchange for transferring goods or services to a customer, excluding amounts collected on behalf of third parties. We follow a policy of recognizing revenue at the point-in-time or over the period of time that we satisfy our performance obligation by transferring control over a product or service to a customer in accordance with the underlying contract. For physically settled derivative sales contracts that are outside the scope of the revenue guidance, including potential changeswe recognize revenue when control of the inventory is transferred within the meaning of ASC Topic 606.
The amount of revenue recognized during the three months ended November 30, 2018, for performance obligations that were fully satisfied in previous periods was not material.
Shipping and Handling Costs
Shipping and handling amounts billed to business practices and/a customer as part of a sales transaction are included in revenues, and the related costs are included in cost of goods sold. Shipping and handling is treated as a fulfillment activity rather than a promised service, and therefore is not considered a separate performance obligation.
Taxes Collected from Customers and Remitted to Governmental Authorities
Revenue is recorded net of taxes collected from customers that are remitted to governmental authorities, with the collected taxes recorded as current liabilities until remitted to the relevant government authority.
Contract Costs
Commissions related to contracts with a duration of less than one year are expensed as incurred. We recognize incremental costs of obtaining contracts as an expense when incurred if the amortization period of the assets we otherwise would have recognized is one year or contractual terms for in scope revenue streams,less.
Disaggregation of Revenues
The following table presents revenues recognized under ASC Topic 606 disaggregated by reportable segment, as well as the amount of revenues recognized under ASC Topic 815 and other applicable accounting guidance for the three months ended November 30, 2018. Other applicable accounting guidance primarily includes revenues recognized under ASC Topic 840, Leases and ASC Topic 470, Debt that fall outside the scope of expanded disclosuresASC Topic 606.
|
| | | | | | | | | | | | | | | | |
| | | ASC 606 | | ASC 815 | | Other Guidance | | Total Revenues |
| For the Three Months Ended November 30, 2018: | | (Dollars in thousands) |
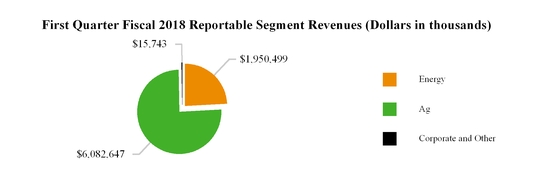
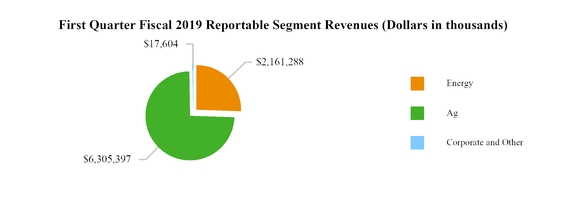
| Energy | | $ | 1,940,190 |
| | $ | 221,098 |
| | $ | — |
| | $ | 2,161,288 |
|
| Ag | | 1,355,826 |
| | 4,913,428 |
| | 36,143 |
| | 6,305,397 |
|
| Corporate and Other | | 5,234 |
| | — |
| | 12,370 |
| | 17,604 |
|
| Total revenues | | $ | 3,301,250 |
| | $ | 5,134,526 |
| | $ | 48,513 |
| | $ | 8,484,289 |
|
Less than 1% of revenues accounted for under ASC Topic 606 included within the table above are recorded over time; these revenues are primarily related to revenue.service contracts.
Our Energy segment derives its revenues through refining, wholesaling and retailing of petroleum products. Our Energy segment produces and sells (primarily wholesale) gasoline, diesel fuel, propane, asphalt, lubricants and other related products and provides transportation services. We expectare the nation’s largest cooperative energy company, with operations that include petroleum refining and pipelines; the supply, marketing and distribution of refined fuels (gasoline, diesel fuel and other energy products); the blending, sale and distribution of lubricants; and the wholesale supply of propane and other natural gas liquids. For the majority of revenues arising from sales to completeEnergy customers, we satisfy our final evaluationperformance obligation of providing energy products such as gasoline, diesel fuel, propane, asphalt, lubricants and implementationother related products at the point-in-time that the finished petroleum product is delivered or made available to the wholesale or retail customer, at which point control is considered to have been transferred to the customer and revenue can be recognized, as there are no remaining performance obligations that we need to satisfy in order to be entitled to the agreed-upon transaction price as stated in the contract. For fixed and provisionally-priced derivative sales contracts that are accounted for under the provisions of the newderivative accounting guidance and are outside the scope of the revenue recognition guidance, throughout fiscal 2018,we recognize revenue when control of the inventory is transferred within the meaning of ASC 606.
Our Ag segment derives its revenues through the origination and marketing of grain, including service activities conducted at export terminals; through wholesale sales of crop nutrients and processed sunflowers; from sales of soybean meal, soybean refined oil and soyflour products; through the production and marketing of renewable fuels; and through retail sales of petroleum and agronomy products, and feed and farm supplies. For the majority of revenues arising from sales to Ag customers, we satisfy our performance obligation of delivering a commodity or other agricultural end product to a customer at the point-in-time that the commodity or other end-product (wholesale grain, crop nutrients/agronomy products, soybean products, ethanol or country operations retail products) has been delivered or is made available to the customer, at which will allow uspoint control is considered to adopt ASU No. 2014-09have been transferred to the customer and revenue can be recognized, as there are no remaining performance obligations that need to be satisfied in order to be entitled to the related ASUs on September 1, 2018,agreed-upon transaction price as stated in the first quartercontract. The amount of fiscal 2019, usingrevenue recognized follows the modified retrospective method.contractually specified price, which may include freight or other contractually specified cost components. For fixed and provisionally-priced derivative sales contracts that are accounted for under the provisions of the derivative accounting guidance and are outside the scope of the revenue recognition guidance, we recognize revenue when control of the inventory is transferred within the meaning of ASC Topic 606.
Corporate and Other primarily consists of our financing and hedging businesses, which are presented together due to the similar nature of their products and services as well as the relatively lower amount of revenues for those businesses compared to our Ag and Energy businesses. Prior to its sale on May 4, 2018, our insurance business was also included in Corporate and Other. Revenues arising from Corporate and Other are primarily comprised of revenues generated by our hedging and financing businesses. Revenues from our hedging business are primarily recognized at the point-in-time that the hedging transaction is completed after we have fully satisfied all performance obligations under the contract, and revenues arising from our financing business are recognized in accordance with ASC Topic 470, Debt, and fall outside the scope of ASC Topic 606.
Contract Assets and Contract Liabilities
Contract assets relate to unbilled amounts arising from goods that have already been transferred to the customer where the right to payment is not conditional upon the passage of time. This results in the recognition of an asset, as the amount of revenue recognized at a certain point in time exceeds the amount billed to the customer. Contract assets are recorded in accounts receivable within our Consolidated Balance Sheets and were immaterial as of November 30, 2018, and August 31, 2018.
Contract liabilities relate to advance payments from customers for goods and services that we have yet to provide. Contract liabilities of $187.9 million and $177.9 million as of November 30, 2018, and August 31, 2018, respectively, are recorded within customer advance payments on our Consolidated Balance Sheets. For the three months ended November 30, 2018, we recognized revenues of $95.2 million, which were included in the customer advance payments balance at the beginning of the period.
Practical expedients
We applied ASC Topic 606 utilizing the following allowable exemptions or practical expedients:
Election to not disclose the unfulfilled performance obligation balance for contracts with an original duration of one year or less.
Recognition of the incremental costs of obtaining a contract as an expense when incurred if the amortization period of the asset that would otherwise have been recognized is one year or less.
Election to present revenues net of sales taxes and other similar taxes.
Practical expedient to treat shipping and handling as a fulfillment activity rather than a promised service, resulting in the conclusion that shipping and handling is not a separate performance obligation.
Note 24 Receivables
| | | | November 30, 2017 | | August 31, 2017 | November 30, 2018 | | August 31, 2018 |
| | (Dollars in thousands) | (Dollars in thousands) |
| Trade accounts receivable | $ | 1,329,887 |
| | $ | 1,234,500 |
| $ | 1,743,258 |
| | $ | 1,578,764 |
|
| CHS Capital notes receivable | 184,301 |
| | 164,807 |
| 683,407 |
| | 569,379 |
|
| Deferred purchase price receivable | 216,996 |
| | 202,947 |
| |
| Other | 556,275 |
| | 493,104 |
| 486,398 |
| | 534,071 |
|
| | 2,287,459 |
| | 2,095,358 |
| 2,913,063 |
| | 2,682,214 |
|
| Less allowances and reserves | 227,836 |
| | 225,726 |
| |
| Less: allowances and reserves | | 226,968 |
| | 221,813 |
|
| Total receivables | $ | 2,059,623 |
| | $ | 1,869,632 |
| $ | 2,686,095 |
| | $ | 2,460,401 |
|
Trade Accounts
Trade accounts receivable are initially recorded at a selling price, which approximates fair value, upon the sale of goods or services to customers. Subsequently, trade accounts receivable are carried at net realizable value, which includes an allowance for estimated uncollectible amounts. We calculate this allowance based on our history of write-offs, level of past due accounts, and our relationships with, and the economic status of, our customers.
CHS Capital
Notes Receivable
CHS Capital, LLC ("CHS Capital"), our wholly-owned subsidiary, has short-term notes receivable from commercial and producer borrowers. The short-term notes receivable have maturity terms of 12 months or less and are reported at their outstanding unpaid principal balances, adjusted for the allowance of loan losses, as CHS Capital has the intent and ability to hold the applicable loans for the foreseeable future or until maturity or pay-off. The carrying value of CHS Capital short-term notes receivable approximates fair value, given the notes' short duration and the use of market pricing adjusted for risk.
The notes receivable from commercial borrowers are collateralized by various combinations of mortgages, personal property, accounts and notes receivable, inventories and assignments of certain regional cooperative’s capital stock. These loans are primarily originated in the states of Minnesota, Wisconsin and North Dakota. CHS Capital also has loans receivable from producer borrowers whichthat are collateralized by various combinations of growing crops, livestock, inventories, accounts receivable, personal property and supplemental mortgages and are originated in the same states as the commercial notes with the addition ofas well as in Michigan.
In addition to the short-term balances included in the table above, CHS Capital had long-term notes receivable, with durations of generally not more than 10 years, totaling $14.8$211.3 million and $17.0$203.0 million at November 30, 2017,2018, and August 31, 2017,2018, respectively. The long-term notes receivable are included in Other assets on our Consolidated Balance Sheets. As of November 30, 2017,2018, and August 31, 2017,2018, the commercial notes represented 32%52% and 17%40%, respectively, and the producer notes represented 68%48% and 83%60%, respectively, of the total CHS Capital notes receivable. As of November 30, 2017, and August 31, 2017, CHS Capital had no third-party borrowers that accounted for more than 10% of the total CHS Capital notes receivable outstanding.
CHS Capital has commitments to extend credit to customers if there are no violations of any contractually established conditions. As of November 30, 2017,2018, CHS Capital's customers havehad additional available credit of $529.4$567.4 million.
Allowance for Loan Losses and Impairments
CHS Capital maintains an allowance for loan losses which is the estimate of potential incurred losses inherent in the loans receivable portfolio. In accordance with FASB ASC 450-20, Accounting for Loss Contingencies, and ASC 310-10, Accounting by Creditors for Impairment of a Loan, the allowance for loan losses consists of general and specific components. The general component is based on historical loss experience and qualitative factors addressing operational risks and industry trends. The specific component relates to loans receivable that are classified as impaired. Additions to the allowance for loan losses are reflected within reserve and impairment charges (recoveries), net in the Consolidated Statements of Operations. The portion of loans receivable deemed uncollectible is charged off against the allowance. Recoveries of previously charged off amounts increase the allowance for loan losses. The amount of CHS Capital notes that were past due was not significant at any reporting date presented.
Interest Income
Interest income is recognized on the accrual basis using a method that computes simple interest daily. The accrual of interest on commercial loans receivable is discontinued at the time the commercial loan receivable is 90 days past due unless the credit is well-collateralized and in process of collection. Past due status is based on contractual terms of the loan. Producer loans receivable are placed in non-accrual status based on estimates and analysis due to the annual debt service terms inherent to CHS Capital’s producer loans. In all cases, loans are placed in nonaccrual status or charged off at an earlier date if collection of principal or interest is considered doubtful.
Sale of Receivables
Receivables Securitization Facility
On July 18, 2017, we amended an existing receivables and loans securitization facility (“Securitization Facility”) with certain unaffiliated financial institutions (the "Purchasers"). Under the Securitization Facility, we and certain of our subsidiaries sell trade accounts and notes receivable (the “Receivables”) to Cofina Funding, LLC (“Cofina”), a wholly-owned bankruptcy-remote indirect subsidiary of CHS. Cofina in turn sells the purchased Receivables in their entirety to the Purchasers. Prior to amending the Securitization Facility in July 2017, the transfer of Receivables was accounted for as a secured borrowing. Under the terms of the amended Securitization Facility CHS accounts for Receivables sold under the Facility as a sale of financial
assets pursuant to ASC 860, Transfers and Servicing and derecognizes the sold Receivables from its Consolidated Balance Sheets.
Sales of Receivables by Cofina occur continuously and are settled with the Purchasers on a monthly basis. The proceeds from the sale of these Receivables comprise a combination of cash and a deferred purchase price (“DPP”) receivable. The DPP receivable is ultimately realized by CHS following the collection of the underlying Receivables sold to the Purchasers. The amount available under the Securitization Facility fluctuates over time based on the total amount of eligible Receivables generated during the normal course of business, with maximum availability of $700.0 million. As of November 30, 2017, the total availability under the Securitization Facility was $700.0 million, of which all has been utilized. The Securitization Facility terminates on July 17, 2018, but may be extended. We use the proceeds from the sale of Receivables under the Securitization Facility for general corporate purposes.
We have no retained interests in the transferred Receivables, other than our right to the DPP receivable and collection and administrative services. The DPP receivable is recorded at fair value within the Consolidated Balance Sheets, including a current portion within receivables and a long-term portion within other assets. Subsequent cash receipts related to the DPP receivable have been reflected as investing activities and additional sales of Receivables under the Securitization Facility are reflected in operating or investing activities, based on the underlying Receivable, in our Consolidated Statements of Cash Flows. Losses incurred on the sale of Receivables are recorded in interest expense and fees received related to the servicing of the Receivables are recorded in other income (loss) in the Consolidated Statements of Operations. We consider the fees received adequate compensation for services rendered, and accordingly have recorded no servicing asset or liability.
The fair value of the DPP receivable is determined by discounting the expected cash flows to be received based on unobservable inputs consisting of the face amount of the Receivables adjusted for anticipated credit losses. The DPP receivable is being measured like an investment in debt securities classified as available for sale, with changes to the fair value being recorded in other comprehensive income in accordance with ASC 320 - Investments - debt and equity securities. Our risk of loss following the transfer of Receivables under the Securitization Facility is limited to the DPP receivable outstanding and any short-falls in collections for specified non-credit related reasons after sale. Payment of the DPP receivable is not subject to significant risks other than delinquencies and credit losses on accounts receivable sold under the Securitization Facility.
The following table is a reconciliation of the beginning and ending balances of the DPP receivable for the quarter ended November 30, 2017:
|
| | | | |
| | | (Dollars in thousands) |
| Balance - as of August 31, 2017 | | $ | 548,602 |
|
| Monthly settlements, net | | (27,100 | ) |
| Balance - as of November 30, 2017 | | $ | 521,502 |
|
There was no DPP receivable as of November 30, 2016, and therefore, no comparative period is included in the table above.
Other Receivables
Other receivables are comprised of certain other amounts recorded in the normal course of business, including receivables related to valued addedvalue-added taxes and pre-crop financing, primarily to Brazilian farmers, to finance a portion of supplier production costs. We do not bear any of the costs or operational risks associated with the related growing crops.crops, though our ability to be paid depends on the crops actually produced. The financing is largely collateralized by future crops, land and physical assets of the suppliers, carries a local market interest rate and settles when the farmer’s crop is harvested and sold.
| | | | November 30, 2017 | | August 31, 2017 | November 30, 2018 | | August 31, 2018 |
| | (Dollars in thousands) | (Dollars in thousands) |
| Grain and oilseed | $ | 1,545,313 |
| | $ | 1,145,285 |
| $ | 1,525,151 |
| | $ | 1,298,522 |
|
| Energy | 720,938 |
| | 755,886 |
| 680,807 |
| | 715,161 |
|
| Crop nutrients | 222,053 |
| | 248,699 |
| 325,189 |
| | 246,326 |
|
| Feed and farm supplies | 483,805 |
| | 353,130 |
| 522,490 |
| | 391,906 |
|
| Processed grain and oilseed | 54,916 |
| | 49,723 |
| 113,138 |
| | 99,426 |
|
| Other | 19,076 |
| | 23,862 |
| 17,674 |
| | 17,308 |
|
| Total inventories | $ | 3,046,101 |
| | $ | 2,576,585 |
| $ | 3,184,449 |
| | $ | 2,768,649 |
|
As of November 30, 2017,2018, we valued approximately 15%14% of inventories, primarily related to our Energy segment, using the lower of cost, determined on the LIFO method, or net realizable value (19%(16% as of August 31, 2017)2018). If the FIFO method of accounting had been used, inventories would have been higher than the reported amount by $99.0$115.6 million and $186.2$345.0 million as of November 30, 2017,2018, and August 31, 2017,2018, respectively. An actual valuation of inventory under the LIFO method can be made only at the end of each year based on the inventory levels and costs at that time. Interim LIFO calculations are based on management's estimates of expected year-end inventory levels and are subject to the final year-end LIFO inventory valuation.
Note 46 Investments
| | | | November 30, 2017 | | August 31, 2017 | November 30, 2018 | | August 31, 2018 |
| | (Dollars in thousands) | (Dollars in thousands) |
| Equity method investments: | | | | | | |
| CF Industries Nitrogen, LLC | $ | 2,776,412 |
| | $ | 2,756,076 |
| $ | 2,775,989 |
| | $ | 2,735,073 |
|
| Ventura Foods, LLC | 350,602 |
| | 347,016 |
| 367,429 |
| | 360,150 |
|
| Ardent Mills, LLC | 209,926 |
| | 206,529 |
| 212,887 |
| | 205,898 |
|
| TEMCO, LLC | 39,235 |
| | 41,323 |
| |
| Other equity method investments | 265,621 |
| | 268,444 |
| 294,130 |
| | 288,016 |
|
| Cost method investments | 135,204 |
| | 131,605 |
| 124,101 |
| | 122,788 |
|
| Total investments | $ | 3,777,000 |
| | $ | 3,750,993 |
| $ | 3,774,536 |
| | $ | 3,711,925 |
|
Equity Method Investments
Joint ventures and other investments, in which we have significant ownership and influence, but not control, are accounted for in our consolidated financial statements using the equity method of accounting. Our primary equity method investments are described below.
CF Nitrogen
On February 1, 2016, we invested $2.8 billion in CF Industries Nitrogen, LLC ("CF Nitrogen"), commencing our strategic venture with CF Industries Holdings, Inc. ("CF Industries"). The investment consists of an 11.4%approximate 10% membership interest (based on product tons) in CF Nitrogen. We account for this investment using the hypothetical liquidation at book value method, recognizing our share of the earnings and losses of CF Nitrogen based upon our contractual claims on the entity's net assets pursuant to the liquidation provisions of CF Nitrogen's limited liability company agreement, adjusted for the semi-annual cash distributions we receive as a result of our membership interest in CF Nitrogen. For the three months ended November 30, 2017,2018, and 2016,2017, this amount was $20.3$40.9 million and $14.7$20.3 million, respectively. These amounts are included as equity income from investments in our Nitrogen Production segment.
We have a 50% interest in Ventura Foods, a joint venture which produces and distributes primarily vegetable oil-based products, and which constitutes our Foods segment. We account for Ventura Foods as an equity method investment, and as of November 30, 2017, our carrying value of Ventura Foods exceeded our share of its equity by $12.9 million, which represents equity method goodwill. The earnings are reported as equity income from investments in our Foods segment.
Ventura Foods and Ardent Mills
We have a 50% interest in Ventura Foods, LLC ("Ventura Foods"), which is a joint venture that produces and distributes primarily vegetable oil-based products, and we have a 12% interest in Ardent Mills, LLC ("Ardent Mills"), which is a joint venture with Cargill Incorporated ("Cargill") and ConAgra Foods, Inc., which that combines the North American flour milling operations of the three parent companies. We account for Ventura Foods and Ardent Mills as an equity method investmentinvestments included in Corporate and Other.
TEMCO, LLC ("TEMCO") is owned and governed by Cargill (50%) and CHS (50%). Both owners have committed to sell all of their feedgrains, wheat, oilseeds and by-product origination that are tributary to the Pacific Northwest, United States ("Pacific Northwest") to TEMCO and to use TEMCO as their exclusive export-marketing vehicleThe following table provides aggregate summarized unaudited financial information for such grains exported through the Pacific Northwest through January 2037. We account for TEMCO as anour equity method investment includedinvestments in CF Nitrogen, Ventura Foods and Ardent Mills for the three months ended November 30, 2018, and 2017:
|
| | | | | | | |
| | For the Three Months Ended
November 30, |
| | 2018 | | 2017 |
| | (Dollars in thousands) |
| Net sales | $ | 2,241,539 |
| | $ | 2,081,514 |
|
| Gross profit | 339,937 |
| | 211,432 |
|
| Net earnings | 272,736 |
| | 112,071 |
|
| Earnings attributable to CHS Inc. | 67,668 |
| | 28,766 |
|
Our investments in other equity method investees are not significant in relation to our Ag segment.consolidated financial statements, either individually or in the aggregate.
Note 57 Goodwill and Other Intangible Assets
Goodwill of $153.7$138.5 million and $154.1 million as of November 30, 2017, and August 31, 2017, respectively, is included in other assets on our Consolidated Balance Sheets. ChangesSheets as of November 30, 2018, and August 31, 2018. There were no changes in the net carrying amount of goodwill for the three months ended November 30, 2017, by segment, are as follows:
|
| | | | | | | | | | | | | | | |
| | Energy | | Ag | | Corporate
and Other | | Total |
| | (Dollars in thousands) |
| Balances, August 31, 2017 | $ | 552 |
| | $ | 142,929 |
| | $ | 10,574 |
| | $ | 154,055 |
|
| Effect of foreign currency translation adjustments | — |
| | (389 | ) | | — |
| | (389 | ) |
| Balances, November 30, 2017 | $ | 552 |
| | $ | 142,540 |
| | $ | 10,574 |
| | $ | 153,666 |
|
No goodwill has been allocated to our Nitrogen Production or Foods segments, which consist of investments accounted for under the equity method.2018.
Intangible assets subject to amortization primarily include customer lists, trademarks and non-compete agreements, and are amortized over their respective useful lives (ranging from 2 to 30 years). Information regarding intangible assets that are included in other assets on our Consolidated Balance Sheets is as follows:
| | | | November 30,
2017 | | August 31,
2017 | November 30,
2018 | | August 31,
2018 |
| | Carrying Amount | | Accumulated Amortization | | Net | | Carrying Amount | | Accumulated Amortization | | Net | Gross Carrying Amount | | Accumulated Amortization | | Net | | Gross Carrying Amount | | Accumulated Amortization | | Net |
| | (Dollars in thousands) | (Dollars in thousands) |
| Customer lists | $ | 42,391 |
| | $ | (11,695 | ) | | $ | 30,696 |
| | $ | 46,180 |
| | $ | (14,695 | ) | | $ | 31,485 |
| $ | 40,815 |
| | $ | (13,791 | ) | | $ | 27,024 |
| | $ | 40,815 |
| | $ | (13,082 | ) | | $ | 27,733 |
|
| Trademarks and other intangible assets | 6,536 |
| | (4,752 | ) | | 1,784 |
| | 23,623 |
| | (21,778 | ) | | 1,845 |
| 6,536 |
| | (4,990 | ) | | 1,546 |
| | 6,536 |
| | (4,931 | ) | | 1,605 |
|
| Total intangible assets | $ | 48,927 |
| | $ | (16,447 | ) | | $ | 32,480 |
| | $ | 69,803 |
| | $ | (36,473 | ) | | $ | 33,330 |
| $ | 47,351 |
| | $ | (18,781 | ) | | $ | 28,570 |
| | $ | 47,351 |
| | $ | (18,013 | ) | | $ | 29,338 |
|
Total amortization expense for intangible assets during the three months ended November 30, 2018, and 2017, and 2016, was $0.9$0.8 million and $1.3$0.9 million, respectively. The estimated annual amortization expense related to intangible assets subject to amortization for the next five years is as follows:
| | | | (Dollars in thousands) | (Dollars in thousands) |
| Year 1 | $ | 3,395 |
| $ | 3,070 |
|
| Year 2 | 3,373 |
| 2,991 |
|
| Year 3 | 3,095 |
| 2,933 |
|
| Year 4 | 3,037 |
| 2,751 |
|
| Year 5 | 2,755 |
| 2,667 |
|
Note 68 Notes Payable and Long-Term Debt
Our notes payable and long-term debt are subject to various restrictive requirements for maintenance of minimum consolidated net worth and other financial ratios. We were in compliance with our debt covenants as of November 30, 2017.2018. The table below summarizes our notes payable as of November 30, 2018, and August 31, 2018.
| |
| November 30, 2017 |
| August 31, 2017 | November 30, 2018 |
| August 31, 2018 |
| (Dollars in thousands) | (Dollars in thousands) |
| Notes payable | $ | 2,182,243 |
|
| $ | 1,695,423 |
| $ | 1,496,122 |
|
| $ | 1,437,264 |
|
| CHS Capital notes payable | 298,021 |
|
| 292,792 |
| 905,431 |
|
| 834,932 |
|
| Total notes payable | $ | 2,480,264 |
|
| $ | 1,988,215 |
| $ | 2,401,553 |
|
| $ | 2,272,196 |
|
On November 30, 2017,2018, our primary line of credit was a five-year, unsecured revolving credit facility with a committed amount of $3.0 billion whichthat expires in September 2020. The outstanding balance on this facility was $1.1 billion$403.0 million at November 30, 2018. There was no outstanding balance at August 31, 2018.
On June 28, 2018, we amended our existing receivables and $480.0loans securitization facility (the "Securitization Facility") with certain unaffiliated financial institutions (the "Purchasers"). Under the Securitization Facility, we and certain of our subsidiaries (the "Originators") sell trade accounts and notes receivable (the "Receivables") to Cofina Funding, LLC ("Cofina"), a wholly-owned bankruptcy-remote indirect subsidiary of CHS. Cofina in turn transfers the Receivables to the Purchasers, which is accounted for as a secured borrowing. During the period from July 2017 through the amendment of the Securitization Facility in June 2018, CHS accounted for Receivables sold under the Securitization Facility as a sale of financial assets pursuant to Accounting Standards Codification 860, Transfers and Servicing, and the Receivables sold were derecognized from our Consolidated Balance Sheets. We use the proceeds from the sale of Receivables under the Securitization Facility for general corporate purposes and settlements are made on a monthly basis. The Securitization Facility terminates on June 17, 2019, but may be extended.
On September 4, 2018, we entered into a repurchase facility ("the Repurchase Facility") related to the Securitization Facility. Under the Repurchase Facility, we can borrow up to $150 million, ascollateralized by a subordinated note issued by Cofina in favor of the Originators and representing a portion of the outstanding balance of the Receivables sold by the Originators to Cofina under the Securitization Facility. As of November 30, 2017, and August 31, 2017, respectively.2018, the outstanding balance under the Repurchase Facility was $150 million.
Interest expense for the three months ended November 30, 2018, and 2017, and 2016, was $40.7$38.9 million and $38.3$40.7 million, respectively, net of capitalized interest of $1.8$2.1 million and $1.6$1.8 million, respectively.
Note 79 Equities
Changes in Equities
Changes in equities for the three months ended November 30, 2018, and 2017 are as follows:
|
| | | | | | | | | | | | | | | | | | | | | | | | | | | | | | | |
| | Equity Certificates | | | | Accumulated
Other
Comprehensive
Loss | | | | | | |
| | Capital
Equity
Certificates | | Nonpatronage
Equity
Certificates | | Nonqualified Equity Certificates | | Preferred
Stock | | | Capital
Reserves | | Noncontrolling
Interests | | Total
Equities |
| | (Dollars in thousands) |
| Balance, August 31, 2017 | $ | 3,906,426 |
| | $ | 29,836 |
| | $ | 405,387 |
| | $ | 2,264,038 |
| | $ | (183,670 | ) | | $ | 1,471,217 |
| | $ | 12,591 |
| | $ | 7,905,825 |
|
| Reversal of prior year redemption estimates | 1,561 |
| | — |
| | — |
| | — |
| | — |
| | — |
| | — |
| | 1,561 |
|
| Redemptions of equities | (1,449 | ) | | (53 | ) | | (59 | ) | | — |
| | — |
| | — |
| | — |
| | (1,561 | ) |
| Preferred stock dividends | — |
| | — |
| | — |
| | — |
| | — |
| | (84,334 | ) | | — |
| | (84,334 | ) |
| Other, net | (1,498 | ) | | (66 | ) | | (344 | ) | | — |
| | — |
| | 3,954 |
| | (3 | ) | | 2,043 |
|
| Net income (loss) | — |
| | — |
| | — |
| | — |
| | — |
| | 180,083 |
| | (464 | ) | | 179,619 |
|
| Other comprehensive income (loss), net of tax | — |
| | — |
| | — |
| | — |
| | 5,225 |
| | — |
| | — |
| | 5,225 |
|
| Estimated 2018 cash patronage refunds | — |
| | — |
| | — |
| | — |
| | — |
| | (50,702 | ) | | — |
| | (50,702 | ) |
| Estimated 2018 equity redemptions | (19,901 | ) | | — |
| | — |
| | — |
| | — |
| | — |
| | — |
| | (19,901 | ) |
| Balance, November 30, 2017 | $ | 3,885,139 |
| | $ | 29,717 |
| | $ | 404,984 |
| | $ | 2,264,038 |
| | $ | (178,445 | ) | | $ | 1,520,218 |
| | $ | 12,124 |
| | $ | 7,937,775 |
|
|
| | | | | | | | | | | | | | | | | | | | | | | | | | | | | | | |
| | Equity Certificates | | | | Accumulated
Other
Comprehensive
Loss | | | | | | |
| | Capital
Equity
Certificates | | Nonpatronage
Equity
Certificates | | Nonqualified Equity Certificates | | Preferred
Stock | | | Capital
Reserves | | Noncontrolling
Interests | | Total
Equities |
| | (Dollars in thousands) |
| Balance, August 31, 2018 | $ | 3,837,580 |
| | $ | 29,498 |
| | $ | 742,378 |
| | $ | 2,264,038 |
| | $ | (199,915 | ) | | $ | 1,482,003 |
| | $ | 9,446 |
| | $ | 8,165,028 |
|
| Reversal of prior year redemption estimates | 24,072 |
| | — |
| | — |
| | — |
| | — |
| | — |
| | — |
| | 24,072 |
|
| Redemptions of equities | (22,004 | ) | | (183 | ) | | (1,885 | ) | | — |
| | — |
| | — |
| | — |
| | (24,072 | ) |
| Preferred stock dividends | — |
| | — |
| | — |
| | — |
| | — |
| | (84,334 | ) | | — |
| | (84,334 | ) |
| Reclassification of unrealized (gain) loss on investments | — |
| | — |
| | — |
| | — |
| | (4,706 | ) | | 4,706 |
| | — |
| | — |
|
| Other, net | (409 | ) | | — |
| | (26 | ) | | — |
| | — |
| | 3,436 |
| | 318 |
| | 3,319 |
|
| Net income (loss) | — |
| | — |
| | — |
| | — |
| | — |
| | 347,504 |
| | (389 | ) | | 347,115 |
|
| Other comprehensive income (loss), net of tax | — |
| | — |
| | — |
| | — |
| | 389 |
| | — |
| | — |
| | 389 |
|
| Estimated 2019 cash patronage refunds | — |
| | — |
| | — |
| | — |
| | — |
| | (89,344 | ) | | — |
| | (89,344 | ) |
| Estimated 2019 equity redemptions | (50,081 | ) | | — |
| | — |
| | — |
| | — |
| | — |
| | — |
| | (50,081 | ) |
| Balance, November 30, 2018 | $ | 3,789,158 |
| | $ | 29,315 |
| | $ | 740,467 |
| | $ | 2,264,038 |
| | $ | (204,232 | ) | | $ | 1,663,971 |
| | $ | 9,375 |
| | $ | 8,292,092 |
|
|
| | | | | | | | | | | | | | | | | | | | | | | | | | | | | | | | |
| | Equity Certificates | | | | Accumulated
Other
Comprehensive
Loss* | | | | | | |
| | Capital
Equity
Certificates | | Nonpatronage
Equity
Certificates | | Nonqualified Equity Certificates | | Preferred
Stock | | | Capital
Reserves* | | Noncontrolling
Interests* | | Total
Equities* |
| | (Dollars in thousands) |
| Balance, August 31, 2017 | $ | 3,906,426 |
| | $ | 29,836 |
| | $ | 405,387 |
| | $ | 2,264,038 |
| | $ | (180,360 | ) | | $ | 1,267,808 |
| | $ | 12,505 |
| | $ | 7,705,640 |
|
| Reversal of prior year redemption estimates | 1,561 |
| | — |
| | — |
| | — |
| | — |
| | — |
| | — |
| | 1,561 |
|
| Redemptions of equities | (1,449 | ) | | (53 | ) | | (59 | ) | | — |
| | — |
| | — |
| | — |
| | (1,561 | ) |
| Preferred stock dividends | — |
| | — |
| | — |
| �� | — |
| | — |
| | (84,334 | ) | | — |
| | (84,334 | ) |
| Other, net | (1,498 | ) | | (66 | ) | | (344 | ) | | — |
| | — |
| | 3,954 |
| | (2 | ) | | 2,044 |
|
| Net income (loss) | — |
| | — |
| | — |
| | — |
| | — |
| | 187,646 |
| | (464 | ) | — |
| 187,182 |
|
| Other comprehensive income (loss), net of tax | — |
| | — |
| | — |
| | — |
| | 3,019 |
| | — |
| | — |
| | 3,019 |
|
| Estimated 2018 cash patronage refunds | — |
| | — |
| | — |
| | — |
| | — |
| | (50,702 | ) | | — |
| | (50,702 | ) |
| Estimated 2018 equity redemptions | (19,901 | ) | | — |
| | — |
| | — |
| | — |
| | — |
| | — |
| | (19,901 | ) |
| Balance, November 30, 2017 (As restated) | $ | 3,885,139 |
| | $ | 29,717 |
| | $ | 404,984 |
| | $ | 2,264,038 |
| | $ | (177,341 | ) | | $ | 1,324,372 |
| | $ | 12,039 |
| | $ | 7,742,948 |
|
* Certain amounts associated with Accumulated Other Comprehensive Loss, Capital Reserves and Noncontrolling Interests in the changes in equities table above were restated to reflect the impact of the misstatements associated with the restatement of previously issued financial statements. Note that the majority of the restatement adjustments within the changes in equities table above relate to the opening restatement adjustments to the August 31, 2017, balances. Additionally, the misstatements for activity in the changes in equities table above relates primarily to net income (loss) during the first quarter of fiscal 2018. Refer to further details included within Note 2, Restatement of Previously Issued Financial Information.
Accumulated Other Comprehensive Loss
Changes in accumulated other comprehensive income (loss) by component, net of tax, are as follows for the three months ended November 30, 2017,2018, and 2016:2017:
| | | | Pension and Other Postretirement Benefits | | Unrealized Net Gain on Available for Sale Investments | | Cash Flow Hedges | | Foreign Currency Translation Adjustment | | Total | Pension and Other Postretirement Benefits | | Unrealized Net Gain on Available for Sale Investments | | Cash Flow Hedges | | Foreign Currency Translation Adjustment | | Total |
| | (Dollars in thousands) | (Dollars in thousands) |
| Balance as of August 31, 2017, net of tax | $ | (135,046 | ) | | $ | 10,041 |
| | $ | (6,954 | ) | | $ | (51,711 | ) | | $ | (183,670 | ) | |
| Balance as of August 31, 2018, net of tax | | $ | (140,335 | ) | | $ | 8,861 |
| | $ | (5,882 | ) | | $ | (62,559 | ) | | $ | (199,915 | ) |
| Other comprehensive income (loss), before tax: | | | | | | | | | | | | | | | | | | |
| Amounts before reclassifications | — |
| | 4,044 |
| | (435 | ) | | (1,008 | ) | | 2,601 |
| 175 |
| | — |
| | (317 | ) | | (25 | ) | | (167 | ) |
| Amounts reclassified out | 6,816 |
| | — |
| | 429 |
| | (2,042 | ) | | 5,203 |
| 2,565 |
| | — |
| | (1,475 | ) | | — |
| | 1,090 |
|
| Total other comprehensive income (loss), before tax | 6,816 |
| | 4,044 |
| | (6 | ) | | (3,050 | ) | | 7,804 |
| 2,740 |
| | — |
| | (1,792 | ) | | (25 | ) | | 923 |
|
| Tax effect | (2,620 | ) | | (404 | ) | | 2 |
| | 443 |
| | (2,579 | ) | (639 | ) | | — |
| | 485 |
| | (380 | ) | | (534 | ) |
| Other comprehensive income (loss), net of tax | 4,196 |
| | 3,640 |
| | (4 | ) | | (2,607 | ) | | 5,225 |
| 2,101 |
| | — |
| | (1,307 | ) | | (405 | ) | | 389 |
|
| Balance as of November 30, 2017, net of tax | $ | (130,850 | ) | | $ | 13,681 |
| | $ | (6,958 | ) | | $ | (54,318 | ) | | $ | (178,445 | ) | |
| Reclassifications | | 416 |
| | (8,861 | ) | | 983 |
| | 2,756 |
| | (4,706 | ) |
| Balance as of November 30, 2018, net of tax | | $ | (137,818 | ) | | $ | — |
| | $ | (6,206 | ) | | $ | (60,208 | ) | | $ | (204,232 | ) |
| | | | Pension and Other Postretirement Benefits | | Unrealized Net Gain on Available for Sale Investments | | Cash Flow Hedges | | Foreign Currency Translation Adjustment | | Total | Pension and Other Postretirement Benefits | | Unrealized Net Gain on Available for Sale Investments | | Cash Flow Hedges | | Foreign Currency Translation Adjustment | | Total |
| | (Dollars in thousands) | (Dollars in thousands) |
| Balance as of August 31, 2016, net of tax | $ | (165,146 | ) | | $ | 5,656 |
| | $ | (9,196 | ) | | $ | (43,040 | ) | | $ | (211,726 | ) | |
| Balance as of August 31, 2017, net of tax | | $ | (132,444 | ) | | $ | 10,041 |
| | $ | (6,954 | ) | | $ | (51,003 | ) | | $ | (180,360 | ) |
| Other comprehensive income (loss), before tax: | | | | | | | | | | | | | | | | | | |
| Amounts before reclassifications | — |
| | 1,259 |
| | 620 |
| | (18,940 | ) | | (17,061 | ) | — |
| | 4,044 |
| | (435 | ) | | (612 | ) | | 2,997 |
|
| Amounts reclassified out | 5,250 |
| | — |
| | 440 |
| | (15 | ) | | 5,675 |
| 4,214 |
| | — |
| | 429 |
| | (2,042 | ) | | 2,601 |
|
| Total other comprehensive income (loss), before tax | 5,250 |
| | 1,259 |
| | 1,060 |
| | (18,955 | ) | | (11,386 | ) | 4,214 |
| | 4,044 |
| | (6 | ) | | (2,654 | ) | | 5,598 |
|
| Tax effect | (2,011 | ) | | (482 | ) | | (406 | ) | | (209 | ) | | (3,108 | ) | (2,620 | ) | | (404 | ) | | 2 |
| | 443 |
| | (2,579 | ) |
| Other comprehensive income (loss), net of tax | 3,239 |
| | 777 |
| | 654 |
| | (19,164 | ) | | (14,494 | ) | 1,594 |
| | 3,640 |
| | (4 | ) | | (2,211 | ) | | 3,019 |
|
| Balance as of November 30, 2016, net of tax | $ | (161,907 | ) | | $ | 6,433 |
| | $ | (8,542 | ) | | $ | (62,204 | ) | | $ | (226,220 | ) | |
| Balance as of November 30, 2017, net of tax | | $ | (130,850 | ) | | $ | 13,681 |
| | $ | (6,958 | ) | | $ | (53,214 | ) | | $ | (177,341 | ) |
Amounts reclassified from accumulated other comprehensive income (loss) were primarily related to pension and other post-retirement benefits.postretirement benefits, cash flow hedges, available for sale investments and foreign currency translation adjustments. Pension and other post-retirementpostretirement reclassifications include amortization of net actuarial loss, prior service credit and transition amounts and are recorded as cost of goods sold and marketing, general and administrative expenses (see Note 8,11, Benefit Plans, for further information). Amortization related to gains or losses on cash flow hedges was recorded to interest expense. Gains or losses on the sale of available for sale investments are recorded to other income. Foreign currency translation reclassifications related to sales of businesses are recorded to other income.
Note 10 Income Taxes
On December 22, 2017, the Tax Cuts and Jobs Act of 2017 (the "Tax Act") was enacted into law. The Tax Act provides for significant U.S. tax law changes and reduces the federal corporate statutory tax rate from 35% to 21% as of January 1, 2018. As a fiscal year-end taxpayer, our annual statutory federal corporate tax rate applicable to fiscal 2018 is a blended rate of 25.7%. Beginning in fiscal 2019, our annual statutory federal corporate tax rate is 21%.
The Tax Act also requires companies to pay a one-time repatriation tax on certain unrepatriated earnings of foreign subsidiaries that were previously tax deferred ("transition tax"). We have not recorded a liability for the transition tax.
The Tax Act initially repealed the Domestic Production Activities Deduction ("DPAD") and enacted the Deduction for Qualified Business Income of Pass-Thru Entities ("QBI Deduction"); however, the Consolidated Appropriations Act, 2018 (the "Appropriations Act") enacted into law on March 23, 2018, impacted these deductions. The Appropriations Act modifies the QBI Deduction under Section 199A of the Tax Act to reenact DPAD for agricultural and horticultural cooperatives as it existed prior to the enactment of the Tax Act, and it also modifies the QBI Deduction available to cooperative patrons as enacted by the Tax Act.
As of August 31, 2018, the effects of the Tax Act were provisional in accordance with the SEC's Staff Accounting Bulletin 118. No adjustments were recorded for the three months ended November 30, 2018, associated with the remeasurement of deferred tax balances or the one-time transition tax, and in accordance with Staff Accounting Bulletin 118, the amounts are no longer provisional.
Note 811 Benefit Plans
We have various pension and other defined benefit and defined contribution plans, in which substantially all employees may participate. We also have non-qualified supplemental executive and Board retirement plans.
Components of net periodic benefit costs for the three months ended November 30, 20172018, and 2016,2017, are as follows:
| | | | Qualified Pension Benefits | | Non-Qualified Pension Benefits | | Other Benefits | Qualified Pension Benefits | | Non-Qualified Pension Benefits | | Other Benefits |
| | 2017 | | 2016 | | 2017 | | 2016 | | 2017 | | 2016 | 2018 | | 2017 | | 2018 | | 2017 | | 2018 | | 2017 |
| Components of net periodic benefit costs for the three months ended November 30 are as follows: | (Dollars in thousands) | (Dollars in thousands) |
| Service cost | $ | 9,919 |
| | $ | 9,383 |
| | $ | 137 |
| | $ | 259 |
| | $ | 236 |
| | $ | 353 |
| $ | 9,648 |
| | $ | 9,919 |
| | $ | 78 |
| | $ | 137 |
| | $ | 263 |
| | $ | 236 |
|
| Interest cost | 6,002 |
| | 7,692 |
| | 178 |
| | 352 |
| | 227 |
| | 427 |
| 7,099 |
| | 6,002 |
| | 187 |
| | 178 |
| | 274 |
| | 227 |
|
| Expected return on assets | (12,040 | ) | | (12,014 | ) | | — |
| | — |
| | — |
| | — |
| (11,242 | ) | | (12,040 | ) | | — |
| | — |
| | — |
| | — |
|
| Prior service cost (credit) amortization | 359 |
| | 402 |
| | 8 |
| | 57 |
| | (141 | ) | | (30 | ) | 42 |
| | 359 |
| | (19 | ) | | 8 |
| | (139 | ) | | (141 | ) |
| Actuarial (gain) loss amortization | 6,888 |
| | 4,765 |
| | 15 |
| | 173 |
| | (306 | ) | | (116 | ) | 3,087 |
| | 4,518 |
| | — |
| | 15 |
| | (407 | ) | | (306 | ) |
| Net periodic benefit cost | $ | 11,128 |
| | $ | 10,228 |
| | $ | 338 |
| | $ | 841 |
| | $ | 16 |
| | $ | 634 |
| $ | 8,634 |
| | $ | 8,758 |
| | $ | 246 |
| | $ | 338 |
| | $ | (9 | ) | | $ | 16 |
|
The service cost component of defined benefit net periodic benefit cost is recorded in cost of goods sold and marketing, general and administrative expenses. The other components of net periodic benefit cost are reflected in other (income) loss.
Employer Contributions
Total contributions to be made during fiscal 20182019 will depend primarily on market returns on the pension plan assets and minimum funding level requirements. During the three months ended November 30, 2017,2018, we made no contributions to the pension plans. At this time, we do not anticipate being required to make a contribution for our benefit plans in fiscal 2018.2019.
Note 912 Segment Reporting
We define our operating segments in accordance with ASC Topic 280, Segment Reporting, to reflect the manner in which our chief operating decision maker, our Chief Executive Officer, evaluates performance and allocates resources in managing our business. We have aggregated those operating segments into fourthree reportable segments: Energy, Ag and Nitrogen Production and Foods.Production.
Our Energy segment produces and provides primarily for the wholesale distribution of petroleum products and transportation of those products. Our Ag segment purchases and further processes or resells grains and oilseeds originated by our country operations business, by our member cooperatives and by third parties; serves as a wholesaler and retailer of crop inputs; and produces and markets ethanol. Our Nitrogen Production segment consists solely of our equity method investment in CF Nitrogen, which entitles us, pursuant to a supply agreement that we entered into with CF Nitrogen, to purchase up to a specified annual quantity of granular urea and urea ammonium nitrate annually from CF Nitrogen. Our Foods segment consists solely of our equity method investment in Ventura Foods.Insignificant operating segments have been aggregated within Corporate and Other primarily represents our non-consolidated wheat milling operations, as well as our financing, hedging and insurance operations.Other.
Corporate administrative expenses and interest are allocated to each business segment, and Corporate and Other, based on direct usage for services, such as information technology and legal, and other factors or considerations relevant to the costs incurred.
Many of our business activities are highly seasonal and operating results vary throughout the year. For example, in our Ag segment, our crop nutrients and country operations businesses generally experience higher volumes and income during the spring planting season and in the fall, which corresponds to harvest. Our grain marketing operations are also subject to fluctuations in volume and earnings based on producer harvests, world grain prices and demand. Our Energy segment generally experiences higher volumes and profitability in certain operating areas, such as refined products, in the summer and early fall when gasoline and diesel fuel usage is highest and is subject to global supply and demand forces. Other energy products, such as propane, may experience higher volumes and profitability during the winter heating and fall crop drying seasons.
Our revenues, assets and cash flows can be significantly affected by global trade and associated market prices for commodities such as petroleum products, natural gas, ethanol, grains, oilseeds, crop nutrients and flour. Changes in market prices for commodities that we purchase without a corresponding change in the selling prices of those products can affect revenues and operating earnings. Commodity prices are affected by a wide range of factors beyond our control, including the weather, crop damage
due to disease or insects, drought, the availability and adequacy of supply, government regulations and policies, world events, global trade disputes, and general political and economic conditions.
While our revenues and operating results are derived from businesses and operations whichthat are wholly owned and majority owned, a portion of our business operations are conducted through companies in which we hold ownership interests of 50% or less and do not control the operations. See Note 4,6, Investments, for more information on these entities.
Reconciling Amounts represent the elimination of revenues and interest between segments. Such transactions are executed at market prices to more accurately evaluate the profitability of the individual business segments.
Segment information for the three months ended November 30, 2017,2018, and 2016,2017, is presented in the tables below. | |
| Energy | | Ag | | Nitrogen Production | | Foods | | Corporate
and Other | | Reconciling
Amounts | | Total | Energy | | Ag | | Nitrogen Production | | Corporate
and Other | | Reconciling
Amounts | | Total |
| For the Three Months Ended November 30, 2017: | (Dollars in thousands) | |
| Revenues | $ | 2,087,703 |
|
| $ | 6,086,680 |
|
| $ | — |
| | $ | — |
| | $ | 18,775 |
|
| $ | (144,269 | ) |
| $ | 8,048,889 |
| |
| For the Three Months Ended November 30, 2018: | | (Dollars in thousands) |
| Revenues, including intersegment revenues | | $ | 2,310,080 |
|
| $ | 6,308,714 |
|
| $ | — |
| | $ | 19,067 |
|
| $ | (153,572 | ) |
| $ | 8,484,289 |
|
| Operating earnings (loss) | 117,173 |
|
| 60,822 |
|
| (3,135 | ) | | (2,467 | ) | | 4,488 |
|
| — |
|
| 176,881 |
| 235,639 |
|
| 80,127 |
|
| (5,128 | ) | | 3,860 |
|
| — |
|
| 314,498 |
|
| (Gain) loss on investments | — |
|
| (2,819 | ) |
| — |
| | — |
| | — |
|
| — |
|
| (2,819 | ) | |
| Interest expense | 5,635 |
|
| 17,604 |
|
| 13,272 |
| | — |
| | 4,581 |
|
| (390 | ) |
| 40,702 |
| 4,237 |
|
| 21,000 |
|
| 13,679 |
| | 763 |
|
| (771 | ) |
| 38,908 |
|
| Other (income) loss | (393 | ) | | (20,228 | ) | | (1,738 | ) | | — |
| | (226 | ) | | 390 |
| | (22,195 | ) | (986 | ) | | (22,400 | ) | | (1,571 | ) | | (948 | ) | | 771 |
| | (25,134 | ) |
| Equity (income) loss from investments | (1,152 | ) |
| (8,254 | ) |
| (20,335 | ) | | (3,440 | ) | | (5,181 | ) |
| — |
|
| (38,362 | ) | (73 | ) |
| 1,209 |
|
| (40,915 | ) | | (26,729 | ) |
| — |
|
| (66,508 | ) |
| Income (loss) before income taxes | $ | 113,083 |
|
| $ | 74,519 |
|
| $ | 5,666 |
| | $ | 973 |
| | $ | 5,314 |
|
| $ | — |
|
| $ | 199,555 |
| $ | 232,461 |
|
| $ | 80,318 |
|
| $ | 23,679 |
| | $ | 30,774 |
|
| $ | — |
|
| $ | 367,232 |
|
| Intersegment revenues | $ | (137,204 | ) |
| $ | (4,033 | ) |
| $ | — |
| | $ | — |
| | $ | (3,032 | ) |
| $ | 144,269 |
|
| $ | — |
| $ | (148,792 | ) |
| $ | (3,317 | ) |
| $ | — |
| | $ | (1,463 | ) |
| $ | 153,572 |
|
| $ | — |
|
| Total assets at November 30, 2018 | | $ | 4,100,190 |
| | $ | 6,951,297 |
| | $ | 2,796,154 |
| | $ | 3,006,115 |
| | $ | — |
| | $ | 16,853,756 |
|
| | | | | | | | | | | | | | | | | | | | | | | | | |
| | Energy | | Ag | | Nitrogen Production | | Foods | | Corporate
and Other | | Reconciling
Amounts | | Total | | | | | | | | | | | |
| For the Three Months Ended November 30, 2016: | (Dollars in thousands) | |
| Revenues | $ | 1,700,180 |
| | $ | 6,435,994 |
| | $ | — |
| | $ | — |
| | $ | 27,441 |
| | $ | (115,365 | ) | | $ | 8,048,250 |
| |
| | | Energy | | Ag | | Nitrogen Production | | Corporate
and Other | | Reconciling
Amounts | | Total |
| For the Three Months Ended November 30, 2017: (As Restated) | | (Dollars in thousands) |
| Revenues, including intersegment revenues | | $ | 2,074,000 |
| | $ | 6,081,027 |
| | $ | — |
| | $ | 18,775 |
| | $ | (141,918 | ) | | $ | 8,031,884 |
|
| Operating earnings (loss) | 72,780 |
| | 109,597 |
| | (4,029 | ) | | (2,797 | ) | | 10,940 |
| | — |
| | 186,491 |
| 124,031 |
| | 60,909 |
| | (3,135 | ) | | 2,128 |
| | — |
| | 183,933 |
|
| (Gain) loss on investments | — |
| | 7,385 |
| | — |
| | — |
| | 16 |
| | — |
| | 7,401 |
| |
| Interest expense | 4,268 |
| | 16,339 |
| | 12,736 |
| | — |
| | 7,974 |
| | (3,052 | ) | | 38,265 |
| 5,635 |
| | 17,604 |
| | 13,272 |
| | 4,580 |
| | (389 | ) | | 40,702 |
|
| Other (income) loss | (309 | ) | | (17,923 | ) | | (29,106 | ) | | — |
| | (115 | ) | | 3,052 |
| | (44,401 | ) | (888 | ) | | (23,586 | ) | | (1,738 | ) | | (372 | ) | | 389 |
| | (26,195 | ) |
| Equity (income) loss from investments | (1,162 | ) | | (5,417 | ) | | (14,696 | ) | | (13,369 | ) | | (5,684 | ) | | — |
| | (40,328 | ) | (1,152 | ) | | (8,254 | ) | | (20,335 | ) | | (8,621 | ) | | — |
| | (38,362 | ) |
| Income (loss) before income taxes | $ | 69,983 |
| | $ | 109,213 |
| | $ | 27,037 |
| | $ | 10,572 |
| | $ | 8,749 |
| | $ | — |
| | $ | 225,554 |
| $ | 120,436 |
| | $ | 75,145 |
| | $ | 5,666 |
| | $ | 6,541 |
| | $ | — |
| | $ | 207,788 |
|
| Intersegment revenues | $ | (110,087 | ) | | $ | (3,765 | ) | | $ | — |
| | $ | — |
| | $ | (1,513 | ) | | $ | 115,365 |
| | $ | — |
| $ | (134,854 | ) | | $ | (4,033 | ) | | $ | — |
| | $ | (3,031 | ) | | $ | 141,918 |
| | $ | — |
|
| | | | | | | | | | | | | | | |
Note 1013 Derivative Financial Instruments and Hedging Activities
Our derivative instruments primarily consist of commodity and freight futures and forward contracts and, to a lesserminor degree, may include foreign currency and interest rate swap contracts. These contracts are economic hedges of price risk, but we do not apply hedge accounting under ASC Topic 815, Derivatives and Hedging, except with respect to certain interest rate swap contracts whichthat are
accounted for as cash flow or fair value hedges. Derivative instruments are recorded on our Consolidated Balance Sheets at fair value as described in Note 11,14, Fair Value Measurements.
Derivatives Not Designated as Hedging Instruments
The following tables present the gross fair values of derivative assets, derivative liabilities and margin deposits (cash collateral) for derivatives not accounted for as hedging instruments, recorded on our Consolidated Balance Sheets along with the related amounts permitted to be offset in accordance with U.S. GAAP. We have elected not to offset derivative assets and liabilities when we have the right of offset under ASC Topic 210-20, Balance Sheet - Offsetting; or when the instruments are subject to master netting arrangements under ASC Topic 815-10-45, Derivatives and Hedging - Overall.
| | | | November 30, 2017 | November 30, 2018 |
| | | | Amounts Not Offset on the Consolidated Balance Sheet but Eligible for Offsetting | | | | | Amounts Not Offset on the Consolidated Balance Sheet but Eligible for Offsetting | | |
| | Gross Amounts Recognized | | Cash Collateral | | Derivative Instruments | | Net Amounts | Gross Amounts Recognized | | Cash Collateral | | Derivative Instruments | | Net Amounts |
| | (Dollars in thousands) | (Dollars in thousands) |
| Derivative Assets: | | | | | | | | | | | | | | |
| Commodity and freight derivatives | $ | 324,867 |
| | $ | — |
| | $ | 36,052 |
| | $ | 288,815 |
| |
| Commodity derivatives | | $ | 176,292 |
| | $ | — |
| | $ | 33,094 |
| | $ | 143,198 |
|
| Foreign exchange derivatives | 4,297 |
| | — |
| | 2,741 |
| | 1,556 |
| 15,877 |
| | — |
| | 6,581 |
| | 9,296 |
|
| Interest rate derivatives - hedge | 3,596 |
| | — |
| | — |
| | 3,596 |
| |
| Embedded derivative asset | 22,271 |
| | — |
| | — |
| | 22,271 |
| 20,166 |
| | — |
| | — |
| | 20,166 |
|
| Total | $ | 355,031 |
| | $ | — |
| | $ | 38,793 |
| | $ | 316,238 |
| $ | 212,335 |
| | $ | — |
| | $ | 39,675 |
| | $ | 172,660 |
|
| Derivative Liabilities: | | | | | | | | | | | | | | |
| Commodity and freight derivatives | $ | 224,656 |
| | $ | 10,358 |
| | $ | 36,052 |
| | $ | 178,246 |
| |
| Commodity derivatives | | $ | 276,899 |
| | $ | 23,121 |
| | $ | 33,094 |
| | $ | 220,684 |
|
| Foreign exchange derivatives | 7,556 |
| | — |
| | 2,741 |
| | 4,815 |
| 9,471 |
| | — |
| | 6,581 |
| | 2,890 |
|
| Interest rate derivatives - hedge | 2,641 |
| | — |
| | — |
| | 2,641 |
| |
| Total | $ | 234,853 |
| | $ | 10,358 |
| | $ | 38,793 |
| | $ | 185,702 |
| $ | 286,370 |
| | $ | 23,121 |
| | $ | 39,675 |
| | $ | 223,574 |
|
| | | | August 31, 2017 | August 31, 2018 |
| | | | Amounts Not Offset on the Consolidated Balance Sheet but Eligible for Offsetting | | | | | Amounts Not Offset on the Consolidated Balance Sheet but Eligible for Offsetting | | |
| | Gross Amounts Recognized | | Cash Collateral | | Derivative Instruments | | Net Amounts | Gross Amounts Recognized | | Cash Collateral | | Derivative Instruments | | Net Amounts |
| | (Dollars in thousands) | (Dollars in thousands) |
| Derivative Assets: | | | | | | | | | | | | | | |
| Commodity and freight derivatives | $ | 384,648 |
| | $ | — |
| | $ | 35,080 |
| | $ | 349,568 |
| |
| Commodity derivatives | | $ | 313,033 |
| | $ | — |
| | $ | 26,781 |
| | $ | 286,252 |
|
| Foreign exchange derivatives | 8,771 |
| | — |
| | 3,636 |
| | 5,135 |
| 15,401 |
| | — |
| | 8,703 |
| | 6,698 |
|
| Interest rate derivatives - hedge | 9,978 |
| | — |
| | — |
| | 9,978 |
| |
| Embedded derivative asset | 25,533 |
| | — |
| | — |
| | 25,533 |
| 23,595 |
| | — |
| | — |
| | 23,595 |
|
| Total | $ | 428,930 |
| | $ | — |
| | $ | 38,716 |
| | $ | 390,214 |
| $ | 352,029 |
| | $ | — |
| | $ | 35,484 |
| | $ | 316,545 |
|
| Derivative Liabilities: | | | | | | | | | | | | | | |
| Commodity and freight derivatives | $ | 309,762 |
| | $ | 3,898 |
| | $ | 35,080 |
| | $ | 270,784 |
| |
| Commodity derivatives | | $ | 421,054 |
| | $ | 12,983 |
| | $ | 26,781 |
| | $ | 381,290 |
|
| Foreign exchange derivatives | 19,931 |
| | — |
| | 3,636 |
| | 16,295 |
| 24,701 |
| | — |
| | 8,703 |
| | 15,998 |
|
| Interest rate derivatives - hedge | 707 |
| | — |
| | — |
| | 707 |
| |
| Total | $ | 330,400 |
| | $ | 3,898 |
| | $ | 38,716 |
| | $ | 287,786 |
| $ | 445,755 |
| | $ | 12,983 |
| | $ | 35,484 |
| | $ | 397,288 |
|
Derivative assets and liabilities with maturities of 12 months or less are recorded in derivative assets and derivative liabilities, respectively, on our Consolidated Balance Sheets. Derivative assets and liabilities with maturities greater than 12 months are recorded in other assets and other liabilities, respectively, on our Consolidated Balance Sheets. The amount of long-term derivative assets and liabilities, excluding derivatives accounted for as fair value hedges, recorded on theour Consolidated Balance Sheet at November 30, 2017,2018, were $71.8$18.7 million and $8.6$16.1 million, respectively. The amount of long-term derivative assets and liabilities, excluding derivatives accounted for as fair value hedges, recorded on theour Consolidated Balance Sheet at August 31, 2017,2018, were $196.9$23.1 million and $14.4$7.9 million, respectively.
Derivatives Not Designated as Hedging Instruments
The majority of our derivative instruments have not been designated as hedging instruments for accounting purposes. The following table sets forth the pretax gains (losses) on derivatives not accounted for as hedging instruments that have been included in our Consolidated Statements of Operations for the three months ended November 30, 20172018, and 2016.2017.
| | | | | For the Three Months Ended November 30, | | For the Three Months Ended
November 30, |
| | Location of Gain (Loss) | | 2017 | | 2016 | Location of Gain (Loss) | | 2018 | | (As Restated) 2017 |
| | | (Dollars in thousands) | | (Dollars in thousands) |
| Commodity and freight derivatives | Cost of goods sold | | $ | 27,752 |
| | $ | 18,410 |
| |
| Commodity derivatives | | Cost of goods sold | | $ | (6,448 | ) | | $ | 32,917 |
|
| Foreign exchange derivatives | Cost of goods sold | | 6,766 |
| | 6,024 |
| Cost of goods sold | | 16,056 |
| | 6,766 |
|
| Foreign exchange derivatives | Marketing, general and administrative | | (495 | ) | | 145 |
| Marketing, general and administrative | | (832 | ) | | (495 | ) |
| Interest rate derivatives | Interest expense | | (1 | ) | | 2 |
| Interest expense | | — |
| | (1 | ) |
| Embedded derivative | Other income | | 1,738 |
| | 29,106 |
| Other income | | 1,571 |
| | 1,738 |
|
| Total | Total | | $ | 35,760 |
| | $ | 53,687 |
| Total | | $ | 10,347 |
| | $ | 40,925 |
|
Commodity and Freight Contracts
As of November 30, 2017,2018, and August 31, 2017,2018, we had outstanding commodity futures options and freightoptions contracts that were used as economic hedges, as well as fixed-price forward contracts related to physical purchases and sales of commodities. The table below presents the notional volumes for all outstanding commodity and freight contracts accounted for as derivative instruments.
| | | | November 30, 2017 | | August 31, 2017 | November 30, 2018 | | August 31, 2018 |
| | Long | | Short | | Long | | Short | Long | | Short | | Long | | Short |
| | (Units in thousands) | (Units in thousands) |
| Grain and oilseed - bushels | 588,263 |
| | 805,041 |
| | 570,673 |
| | 768,540 |
| 560,843 |
| | 837,696 |
| | 715,866 |
| | 929,873 |
|
| Energy products - barrels | 16,254 |
| | 19,300 |
| | 15,072 |
| | 18,252 |
| 16,632 |
| | 7,670 |
| | 17,011 |
| | 8,329 |
|
| Processed grain and oilseed - tons | 196 |
| | 1,700 |
| | 299 |
| | 2,347 |
| 374 |
| | 3,077 |
| | 1,064 |
| | 2,875 |
|
| Crop nutrients - tons | 25 |
| | 4 |
| | 9 |
| | 15 |
| 44 |
| | 91 |
| | 11 |
| | 76 |
|
| Ocean and barge freight - metric tons | 4,785 |
| | 3,144 |
| | 2,777 |
| | 1,766 |
| |
| Rail freight - rail cars | 151 |
| | 68 |
| | 176 |
| | 75 |
| |
| Ocean freight - metric tons | | — |
| | — |
| | 227 |
| | 45 |
|
| Natural gas - MMBtu | 1,500 |
| | — |
| | 500 |
| | — |
| — |
| | — |
| | 610 |
| | — |
|
Foreign Exchange Contracts
We are exposed to risk regarding foreign currency fluctuations even though a substantial amount of our international sales are denominated in U.S. dollars. In addition to specific transactional exposure, foreign currency fluctuations can impact the ability of foreign buyers to purchase U.S. agricultural products and the competitiveness of U.S. agricultural products compared to the same products offered by alternative sources of world supply. From time to time, we enter into foreign currency hedge contracts to minimize the impact of currency fluctuations on our transactional exposures. The notional amounts of our foreign exchange derivative contracts were $646.3$762.4 million and $776.7$988.8 million as of November 30, 2017,2018, and August 31, 2017,2018, respectively.
Embedded Derivative Asset
Under the terms of our strategic investment in CF Nitrogen, if CF Industries' credit rating is reduced below certain levels by two of three specified credit ratings agencies, we are entitled to receive a non-refundable annual payment of $5.0 million from CF Industries in November of each year until the date that CF Industries' credit rating is upgraded to or above certain levels by two of the three specified credit ratings agencies or February 1, 2026, whichever is earlier.
During the three months ended November 30, 2016, CF Industries' credit rating was reduced below the specified levels and we received a $5.0 million payment from CF Industries, which was recorded as a gain in our Consolidated Statement
of Operations. We also recorded an embedded derivative asset of $24.1 million on our Consolidated Balance Sheet and a corresponding gain in our Consolidated Statement of Operations for the fair value of the embedded derivative asset during the three months ended November 30, 2016. During the three months ended November 30, 2017, we received a second $5.0 million payment from CF Industries. The fair value of the embedded derivative asset recorded on our Consolidated Balance Sheet as of November 30, 2017,2018, was equal to $22.3$20.1 million. The current and long-term portions of the embedded derivative asset are included in derivative assets and other assets on our Consolidated Balance Sheets, respectively. See Note 11,14, Fair Value Measurements, for more information on the valuation of the embedded derivative asset.
Derivatives Designated as Cash Flow or Fair Value Hedging Strategies
Fair Value Hedges
As of November 30, 2017,2018, and August 31, 2017,2018, we havehad outstanding interest rate swaps with an aggregate notional amount of $495.0 million designated as fair value hedges of portions of our fixed-rate debt.debt that is due between fiscal 2019 and fiscal 2025. Our objective in entering into these transactions is to offset changes in the fair value of the debt associated with the risk of variability in the three-month U.S. dollar LIBOR interest rate ("LIBOR"), in essence converting the fixed-rate debt to variable-rate debt. Under these interest rate swaps, we receive fixed-rate interest payments and make interest payments based on the three-month LIBOR. Offsetting changes in the fair values of both the swap instruments and the hedged debt are recorded contemporaneously each period and only create an impact to earnings to the extent that the hedge is ineffective. During
The following table presents the fair value of our derivative interest rate swap instruments designated as fair value hedges and the line items on our Consolidated Balance Sheets in which they are recorded.
|
| | | | | | | | |
| | | Derivative Liabilities |
| Balance Sheet Location | | November 30, 2018 | | August 31, 2018 |
| | | (Dollars in thousands) |
| Derivative liabilities | | $ | 687 |
| | $ | 771 |
|
| Other liabilities | | 9,720 |
| | 8,681 |
|
| Total | | $ | 10,407 |
| | $ | 9,452 |
|
The following table sets forth the pretax gains (losses) on derivatives accounted for as hedging instruments that have been included in our Consolidated Statements of Operations for the three months ended November 30, 2017,2018, and 2016,2017.
|
| | | | | | | | | | |
| | | | | For the Three Months Ended November 30, |
| Gain (Loss) on Fair Value Hedging Relationships: | | Location of Gain (Loss) | | 2018 | | 2017 |
| | | | | (Dollars in thousands) |
| Interest rate swaps | | Interest expense | | $ | (955 | ) | | $ | (8,317 | ) |
| Hedged item | | Interest expense | | 955 |
| | 8,317 |
|
| Total | | $ | — |
| | $ | — |
|
The following table provides the location and carrying amount of hedged liabilities in our Consolidated Balance Sheets as of November 30, 2018, and August 31, 2018.
|
| | | | | | | | | | | | | | | | |
| | | November 30, 2018 | | August 31, 2018 |
| Balance Sheet Location | | Carrying Amount of Hedged Liabilities | | Cumulative Amount of Fair Value Hedging Adjustments Included in the Carrying Amount of Hedged Liabilities | | Carrying Amount of Hedged Liabilities | | Cumulative Amount of Fair Value Hedging Adjustments Included in the Carrying Amount of Hedged Liabilities |
| | | (Dollars in thousands) |
| Long-term debt | | $ | 484,593 |
| | $ | 10,407 |
| | $ | 485,548 |
| | $ | 9,452 |
|
Cash Flow Hedges
In the fourth quarter of fiscal 2018, our Energy segment began designating certain of its pay-fixed, receive-variable, cash-settled swaps as cash flow hedges of future crude oil purchases. We also began designating certain pay-variable, receive-fixed, cash-settled swaps as cash flow hedges of future refined product sales. These hedging instruments and the related hedged items are exposed to significant market price risk and potential volatility. As part of our risk management strategy, we recorded offsetting fair value adjustmentslook to hedge a portion of $8.3our expected future crude oil needs and the resulting refined product output based on prevailing futures prices, management's expectations about future commodity price changes and our risk appetite. As of November 30, 2018, and August 31, 2018, the aggregate notional amount of cash flow hedges was 5.4 million and $13.31.1 million respectively, with no ineffectiveness recorded in earnings.barrels, respectively.
The following table presents the fair value of our commodity derivative instruments designated as cash flow hedges and the line items on our Consolidated Balance Sheets in which they are recorded.
|
| | | | | | | | | | | | | | | | | | |
| | | Derivative Assets | | | | Derivative Liabilities |
| Balance Sheet Location | | November 30, 2018 | | August 31, 2018 | | Balance Sheet Location | | November 30, 2018 | | August 31, 2018 |
| | | (Dollars in thousands) | | | | (Dollars in thousands) |
| Derivative assets | | $ | 9,336 |
| | $ | 812 |
| | Derivative liabilities | | $ | 11,622 |
| | $ | 634 |
|
The following table presents the pretax gains (losses) recorded in other comprehensive income relating to cash flow hedges for the three months ended November 30, 2018, and 2017:
|
| | | | | | | | |
| | | For the Three Months Ended
November 30, |
| | | 2018 | | 2017 |
| | | (Dollars in thousands) |
| Commodity derivatives | | $ | (2,463 | ) | | $ | — |
|
The following table presents the pretax gains (losses) relating to cash flow hedges that were reclassified from accumulated other comprehensive loss into our Consolidated Statements of Operations for the three months ended November 30, 2018, and 2017:
|
| | | | | | | | | |
| | | | For the Three Months Ended
November 30, |
| | Location of Gain (Loss) | | 2018 | | 2017 |
| | | | (Dollars in thousands) |
| Commodity derivatives | Cost of goods sold | | $ | 1,900 |
| | $ | — |
|
Note 1114 Fair Value Measurements
ASC Topic 820, Fair Value Measurements and Disclosures defines fair value as the price that would be received for an asset or paid to transfer a liability (an exit price) in the principal or most advantageous market for the asset or liability in an orderly transaction between market participants on the measurement date. The standard also establishes a hierarchy for inputs used in measuring fair value, which requires an entity to maximize the use of observable inputs and minimize the use of unobservable inputs when measuring fair value. Observable inputs are inputs or market data that a market participant would obtain from independent sources to value the asset or liability. Unobservable inputs are inputs that reflect our assumptions about the factors market participants would use in valuing the asset or liability developed based upon the best information available in the circumstances. The fair value hierarchy consists of three levels. Level 1 inputs are quoted prices (unadjusted) in active markets for identical assets or liabilities. Level 2 inputs include quoted prices for similar assets or liabilities in active markets, quoted prices for identical or similar assets or liabilities in markets that are not active, and inputs (other than quoted prices) that are observable for the asset or liability, either directly or indirectly. Level 3 inputs are unobservable inputs for the asset or liability. Categorization within the valuation hierarchy is based upon the lowest level of input that is significant to the fair value measurement.
Recurring fair value measurements at November 30, 2017,2018, and August 31, 2017,2018, are as follows:
| | | | November 30, 2017 | November 30, 2018 |
| | Quoted Prices in Active Markets for Identical Assets (Level 1) | | Significant Other Observable Inputs (Level 2) | | Significant Unobservable Inputs (Level 3) | | Total | Quoted Prices in Active Markets for Identical Assets (Level 1) | | Significant Other Observable Inputs (Level 2) | | Significant Unobservable Inputs (Level 3) | | Total |
| | (Dollars in thousands) | (Dollars in thousands) |
| Assets: | |
| | |
| | |
| | |
| |
| | |
| | |
| | |
|
| Commodity and freight derivatives | $ | 29,637 |
| | $ | 295,230 |
| | $ | — |
| | $ | 324,867 |
| |
| Commodity derivatives | | $ | 27,029 |
| | $ | 158,600 |
| | $ | — |
| | $ | 185,629 |
|
| Foreign currency derivatives | — |
| | 4,297 |
| | — |
| | 4,297 |
| — |
| | 15,877 |
| | — |
| | 15,877 |
|
| Interest rate swap derivatives | — |
| | 3,596 |
| | — |
| | 3,596 |
| |
| Deferred compensation assets | 53,348 |
| | — |
| | — |
| | 53,348 |
| 37,713 |
| | — |
| | — |
| | 37,713 |
|
| Deferred purchase price receivable | — |
| | — |
| | 521,502 |
| | 521,502 |
| |
| Embedded derivative asset | — |
| | 22,271 |
| | — |
| | 22,271 |
| — |
| | 20,166 |
| | — |
| | 20,166 |
|
| Other assets | 17,784 |
| | — |
| | — |
| | 17,784 |
| 5,767 |
| | — |
| | — |
| | 5,767 |
|
| Total | $ | 100,769 |
| | $ | 325,394 |
| | $ | 521,502 |
| | $ | 947,665 |
| $ | 70,509 |
| | $ | 194,643 |
| | $ | — |
| | $ | 265,152 |
|
| Liabilities: | |
| | |
| | | | |
| |
| | |
| | | | |
|
| Commodity and freight derivatives | $ | 25,299 |
| | $ | 199,357 |
| | $ | — |
| | $ | 224,656 |
| |
| Commodity derivatives | | $ | 40,398 |
| | $ | 248,122 |
| | $ | — |
| | $ | 288,520 |
|
| Foreign currency derivatives | — |
| | 7,556 |
| | — |
| | 7,556 |
| — |
| | 9,471 |
| | — |
| | 9,471 |
|
| Interest rate swap derivatives | — |
| | 2,641 |
| | — |
| | 2,641 |
| — |
| | 10,407 |
| | — |
| | 10,407 |
|
| Total | $ | 25,299 |
| | $ | 209,554 |
| | $ | — |
| | $ | 234,853 |
| $ | 40,398 |
| | $ | 268,000 |
| | $ | — |
| | $ | 308,398 |
|
| | | | August 31, 2017 | August 31, 2018 |
| | Quoted Prices in Active Markets for Identical Assets (Level 1) | | Significant Other Observable Inputs (Level 2) | | Significant Unobservable Inputs (Level 3) | | Total | Quoted Prices in Active Markets for Identical Assets (Level 1) | | Significant Other Observable Inputs (Level 2) | | Significant Unobservable Inputs (Level 3) | | Total |
| | (Dollars in thousands) | (Dollars in thousands) |
| Assets: | | | | | | | | | | | | | | |
| Commodity and freight derivatives | $ | 48,491 |
| | $ | 336,157 |
| | $ | — |
| | $ | 384,648 |
| |
| Commodity derivatives | | $ | 54,487 |
| | $ | 259,359 |
| | $ | — |
| | $ | 313,846 |
|
| Foreign currency derivatives | — |
| | 8,771 |
| | — |
| | 8,771 |
| — |
| | 15,401 |
| | — |
| | 15,401 |
|
| Interest rate swap derivatives | — |
| | 9,978 |
| | — |
| | 9,978 |
| |
| Deferred compensation assets | 52,414 |
| | — |
| | — |
| | 52,414 |
| 39,073 |
| | — |
| | — |
| | 39,073 |
|
| Deferred purchase price receivable | — |
| | — |
| | 548,602 |
| | 548,602 |
| |
| Embedded derivative asset | — |
| | 25,533 |
| | — |
| | 25,533 |
| — |
| | 23,595 |
| | — |
| | 23,595 |
|
| Other assets | 14,846 |
| | — |
| | — |
| | 14,846 |
| 5,334 |
| | — |
| | — |
| | 5,334 |
|
| Total | $ | 115,751 |
| | $ | 380,439 |
| | $ | 548,602 |
| | $ | 1,044,792 |
| $ | 98,894 |
| | $ | 298,355 |
| | $ | — |
| | $ | 397,249 |
|
| Liabilities: | | | | | | | | | | | | | | |
| Commodity and freight derivatives | $ | 31,189 |
| | $ | 278,573 |
| | $ | — |
| | $ | 309,762 |
| |
| Commodity derivatives | | $ | 31,778 |
| | $ | 389,911 |
| | $ | — |
| | $ | 421,689 |
|
| Foreign currency derivatives | — |
| | 19,931 |
| | — |
| | 19,931 |
| — |
| | 24,701 |
| | — |
| | 24,701 |
|
| Interest rate swap derivatives | — |
| | 707 |
| | — |
| | 707 |
| — |
| | 9,452 |
| | — |
| | 9,452 |
|
| Total | $ | 31,189 |
| | $ | 299,211 |
| | $ | — |
| | $ | 330,400 |
| $ | 31,778 |
| | $ | 424,064 |
| | $ | — |
| | $ | 455,842 |
|
Commodity freight and foreign currency derivatives — Exchange-traded futures and options contracts are valued based on unadjusted quoted prices in active markets and are classified within Level 1. Our forward commodity purchase and sales contracts with fixed-price components, select ocean freight contracts and other over-the-counter ("OTC") derivatives are determined using inputs that are generally based on exchange traded prices and/or recent market bids and offers, adjusted for location specificlocation-specific inputs, and are classified within Level 2. The location specificlocation-specific inputs are driven by local market supply and demand, and are generally based on broker or dealer quotations, or market transactions in either the listed or OTC markets. Changes in the fair values of these contracts are recognized in our Consolidated Statements of Operations as a component of cost of goods sold.
Interest rate swap derivatives — Fair values of our interest rate swap derivatives are determined utilizing valuation models that are widely accepted in the market to value these OTC derivative contracts. The specific terms of the contracts, as well as market observable inputs, such as interest rates and credit risk assumptions, are factored into the models. As all
significant inputs are market observable, all interest rate swaps are classified within Level 2. Changes in the fair values of contracts not designated as hedging instruments for accounting purposes are recognized in our Consolidated Statements of Operations as a component of interest expense. See Note 10,13, Derivative Financial Instruments and Hedging Activities, for additional information about interest rates swaps designated as fair value and cash flow hedges.
Deferred compensation and other assets — Our deferred compensation investments, Rabbi Trust assets and available-for-sale investments in common stock of other companies are valued based on unadjusted quoted prices on active exchanges and are classified within Level 1. Changes in the fair values of these other assets are primarily recognized in our Consolidated Statements of Operations as a component of marketing, general and administrative expenses.
Deferred purchase price receivable — The fair value of the DPP receivable included in receivables, net and other assets, is determined by discounting the expected cash flows to be received. The expected cash flows are primarily based on unobservable inputs consisting of the face amount of the Receivables adjusted for anticipated credit losses. Significant changes in the anticipated credit losses could result in a significantly higher (or lower) fair value measurement. Due to the use of significant unobservable inputs in the pricing model, including management's assumptions related to anticipated credit losses, the DPP receivable is classified as a Level 3 fair value measurement. The reconciliation of the DPP receivable for the period ended November 30, 2017, is included in Note 2, Receivables.
Embedded derivative asset — The embedded derivative asset relates to contingent payments inherent in our investment in CF Nitrogen. The inputs into the fair value measurement include the probability of future upgrades and downgrades of CF Industries' credit rating based on historical credit rating movements of other public companies and the discount rates to be applied to potential annual payments based on applicable historical and current yield coupon rates. Based on these observable inputs, our fair value measurement is classified within Level 2. See Note 10,13, Derivative Financial Instruments and Hedging Activities, for additional information.
There were no material transfers between Level 1, Level 2 and Level 3 assets and liabilities during the three months ended November 30, 2017.2018.
Note 1215 Commitments and Contingencies
Environmental
We are required to comply with various environmental laws and regulations incidental to our normal business operations. In order to meet our compliance requirements, we establish reserves for the probable future costs of remediation of identified issues, which are included in cost of goods sold and marketing, general and administrative in our Consolidated Statements of Operations. The resolution of any such matters may affect consolidated net income for any fiscal period; however, we believe any resulting liabilities, individually or in the aggregate, will not have a material effect on our consolidated financial position, results of operations or cash flows during any fiscal year.
Other Litigation and Claims
We are involved as a defendant in various lawsuits, claims and disputes, which are in the normal course of our business. The resolution of any such matters may affect consolidated net income for any fiscal period; however, we believe any resulting liabilities, individually or in the aggregate, will not have a material effect on our consolidated financial position, results of operations or cash flows during any fiscal year.
Guarantees
We are a guarantor for lines of credit and performance obligations of related, non-consolidated companies. As of November 30, 2017,2018, our bank covenants allowed maximum guarantees of $1.0 billion, of which $101.4$151.3 million were outstanding. We have collateral for a portion of these contingent obligations. We have not recorded a liability related to the contingent obligations as we do not expect to pay out any cash related to them, and the fair values are considered immaterial. The underlying loans to the counterparties for which we provide these guarantees were current as of November 30, 2017.2018.
Lease CommitmentsGain Contingency
OnAs of November 30, 2017, we completed2018, a sale-leaseback transactiongain contingency resulted from applying ASC Topic 450-30, Gain Contingencies, to the facts and circumstances surrounding the potential for certain excise tax credits associated with manufacturing changes within our primary corporate office building located in Inver Grove Heights, Minnesota. Simultaneous withEnergy business. Refer to Note 16, Subsequent Events, for details related to the closing of the sale, the Company entered into a 20-year operating lease arrangement with base annual rent of approximately $3.4 milliongain contingency realized during the first year, followed by annual increasessecond quarter of 2% through the remainder of the lease period.fiscal 2019.
Note 1316 Subsequent Events
United States Tax Reform
On December 22, 2017,As described in Note 15, Commitments and Contingencies, a gain contingency existed as of November 30, 2018, following the Tax Cuts and Jobs Act was signed into law. The law includes significant changesapplication of ASC Topic 450-30, Gain Contingencies, to the U.S. corporatefacts and circumstances surrounding the potential for certain excise tax system, including a Federal corporate rate reduction from 35% to 21%, repeal of the Section 199 Domestic Production Activities Deduction and enactment of the Deduction for Qualified Business Income of Pass-Thru Entities. We are in the process of analyzing the legislation and determining an estimate of the financial impact. Currently, we expect to record a material tax benefit due to the revaluation ofcredits associated with manufacturing changes within our net deferred tax liability position included in our Consolidated Balance Sheets.Energy business. The gain contingency was
resolved subsequent to November 30, 2018, and a gain of approximately $80.8 million will be recognized primarily as a reduction of cost of goods sold in the Consolidated Statement of Operations during the second quarter of fiscal 2019.
ITEM 2. MANAGEMENT’S DISCUSSION AND ANALYSIS OF FINANCIAL CONDITION AND RESULTS OF OPERATIONS
This Management's Discussion and Analysis of Financial Condition and Results of Operations ("MD&A") is intended to provide a reader of our financial statements with a narrative from the perspective of our management on our financial condition and results of operations, liquidity and certain other factors that may affect our future results. Our MD&A is presented in the following sections:
Restatement
Overview
Business Strategy
Fiscal 20182019 First Quarter Highlights
Fiscal 2018 Priorities Update
Fiscal 20182019 Trends Update
Results of Operations
Liquidity and Capital Resources
Off BalanceOff-Balance Sheet Financing Arrangements
Contractual Obligations
Critical Accounting Policies
Effect of Inflation and Foreign Currency Transactions
Recent Accounting Pronouncements
Our MD&A should be read in conjunction with our Annual Report on Form 10-K for the fiscal year ended August 31, 20172018 (including the information presented therein under Risk Factors), as well as the consolidated financial statements and the related notes included in Item 1 of Part I of this Quarterly Report on Form 10-Q.
The accompanying MD&A gives effect to certain adjustments made to our previously reported financial information for the three months ended November 30, 2017. Due to the restatement of this period, the data set forth in the accompanying MD&A may not be comparable to discussions and data included in our previously filed Quarterly Report on Form 10-Q for the quarterly period ended November 30, 2017.
Refer to Note 2, Restatement of Previously Issued Financial Information, of the accompanying unaudited financial statements for further details related to the restatement and its impact on our consolidated financial statements.
Overview
CHS Inc. is a diversified company that provides grain, foods and energy resources to businesses and consumers on a global scale. As a cooperative, we are owned by farmers, ranchers and member cooperatives across the United States. We also have preferred shareholders that own our five series of preferred stock, all of which are listed and traded on the Nasdaq Global Select Market. We operate in the following fourthree reportable segments:
Energy Segment - produces and provides primarily for the wholesale distribution of petroleum products and transportation of thosepetroleum products.
Ag Segment - purchases and further processes or resells grains and oilseeds originated by our country operations business, by our member cooperatives and by third parties and also serves as a wholesaler and retailer of crop inputs.
Nitrogen Production Segment - consists solely of our equity method investment in CF Industries Nitrogen LLC ("CF Nitrogen") and produces and distributes nitrogen fertilizer, a commodity chemical.
Foods Segment - consists solely of our equity method investment in Ventura Foods, LLC ("Ventura Foods") and is a processor and distributor of edible oils used in food preparation and a packager of food products.
In addition, other operating activities, primarilyour financing and hedging businesses, along with our non-consolidated wheat milling and food production and distribution joint venture, as well asventures, have been aggregated within Corporate and Other. Prior to its sale on May 4, 2018, our financing, hedging and insurance operations have been aggregatedwere also included within Corporate and Other.
The consolidated financial statements include the accounts of CHS and all of our wholly-owned and majority-owned subsidiaries and limited liability companies. The effects of all significant intercompany transactions have been eliminated.
Corporate administrative expenses and interest are allocated to each reporting segment, along with Corporate and Other, based on direct usage for services, such as information technology and legal, and other factors or considerations relevant to the costs incurred.
Management's Focus. When evaluating our operating performance, management focuses on gross profit and income (loss) before income taxes.taxes ("IBIT"). As a company that operates heavily in global commodities, there is significant unpredictability and volatility in pricing, costs and costs.global trade volumes. As such, we focus on managing the margin we can earn and the resulting income before income taxes. Management also focuses on ensuring the strength of the balance sheet through the appropriate management of financial liquidity, workingleverage, capital capital deployment, capital resourcesallocation and overall leverage.cash flow optimization.
Seasonality. Many of our business activities are highly seasonal and our operating results vary throughout the year. Our revenues and income are generally lowesttrend lower during the second and fourth fiscal quarters and highesthigher during the first and third fiscal quarters. For example, in our Ag segment, our crop nutrients and country operations businesses generally experience higher volumes and income during the fall harvest and spring planting season, which correspond to our first and in the fall, which corresponds to harvest.third fiscal quarters, respectively. Our grain marketing operations are also subject to fluctuations in volume and earnings based on producer harvests, world grain prices, demand and demand.global trade volumes. Our Energy segment generally experiences higher volumes and profitability in certain operating areas, such as refined products, in the summer and early fall when gasoline and diesel fuel usage by our agricultural producers is highest and is subject to global supply and demand forces. Other energy products, such as propane, mayalso generally experience higher volumes and profitability during the winter heating and fall crop drying seasons. The graphs below depict the seasonality inherent in our business.
* It should be noted the third quarter of fiscal 2017 was impacted by material charges that caused income (loss) before income taxes for that period to deviate from historical trends.
Pricing. Our revenues, assets and cash flows can be significantly affected by global market prices for commodities such as petroleum products, natural gas, grains, oilseed products and crop nutrients. Changes in market prices for commodities that we purchase without a corresponding change in the selling prices of those products can affect revenues and operating
earnings. Commodity prices are affected by a wide range of factors beyond our control, including the weather, crop damage due to disease or insects, drought, availability/adequacy of supply of the related commodity, government regulations/policies, world events, global trade disputes and general political/economic conditions.
Business Strategy
Our business strategy is to help our owners grow by maximizing returns and optimizing our various operations to ensure that our core businesses are strategically positioned today and for the future. We are focusing on improving efficiency and, when necessary, disposing of assets that that are not strategic and/or do not meet our internal measurement expectations. We are also focusing on making selective growth capital investments that will help to drive future growth opportunities. In addition, we are focused on maintaining financial flexibility by optimizing debt levels and ensuring adequate financial liquidity so we can effectively operate throughout the agriculture and energy economic cycles.
Fiscal 20182019 First Quarter Highlights
MarginsRefining margins were lowerhigher in our AgEnergy segment compared to prior year results; however, we did see improvementsresults due to favorable heavy Canadian crude oil pricing which is processed by our refineries.
We experienced higher margins in our Energycrop nutrients business compared to the prior year due to improved market conditions.
Our equity method investments in CF Nitrogen, Ardent Mills and Ventura Foods had improved earnings compared to the prior year.
Long-term debt (including the current portion) was reduced by $172.0 million by monetizing certain assetsWe are dedicating significant internal and actively managing cash flow.
Continuedexternal leadership and resources to improving our active management of the balance sheet which resulted in the decision that no cash patronage would be issued in fiscal 2018 for fiscal 2017 results, and equity retirements would be limited to $10 million for estates.control environment.
Fiscal 2018 Priorities Update
During the three months ended November 30, 2017, we continue to make improvements in our management of risk and the granting of credit through enhancements in the related policies, practices and operations. We finalized decisions to dispose of certain assets within our Ag segment that were determined to not be strategic and were not meeting our performance expectations. We also continued our focus on restoring financial flexibility by monetizing certain assets and paying down long-term debt.
Fiscal 20182019 Trends Update
Our business is cyclical and the Ag and Energy industries are currentlybusinesses operate in cyclical environments. The Energy industry experienced favorable crude oil prices in particular for heavy Canadian crude oil which is processed by our refineries; which led to higher margins and improved earnings in our first quarter of fiscal 2019. We believe the favorable market conditions experienced in the first quarter of fiscal 2019 will become less favorable as fiscal 2019 progresses. The Ag industry continues to operate in a challenging environment characterized by reduced commodity prices, lower margins, reduced liquidity and increased leverage.leverage that have resulted from reduced commodity prices. In addition, trade disputes between the United States and foreign trading partners, particularly those that purchase large quantities of agricultural commodities, are resulting in unpredictable impacts to commodity prices within the Ag industry now and in the future. We are unable to predict how long thisthe current environment will last or how severe it will ultimately be; however,be at this time, although there was an increase in Energy margins in the first quarter of fiscal 2018, we do not foresee significant changes to the core economic environment during the remainder of fiscal 2018. During this period,time. As a result, we expect our revenues, margins and cash flows from our core operations in our Ag segment to continue to be under pressure.pressure during the remainder of fiscal 2019.
Results of Operations
Consolidated Statements of Operations
| | | | For the Three Months Ended November 30 | For the Three Months Ended November 30, |
| | 2017 | | 2016 | 2018 | | (As Restated) 2017 |
| | (Dollars in thousands)
| (Dollars in thousands) |
| Revenues | $ | 8,048,889 |
| | $ | 8,048,250 |
| $ | 8,484,289 |
| | $ | 8,031,884 |
|
| Cost of goods sold | 7,735,627 |
| | 7,695,553 |
| 8,013,648 |
| | 7,711,392 |
|
| Gross profit | 313,262 |
| | 352,697 |
| 470,641 |
| | 320,492 |
|
| Marketing, general and administrative | 140,168 |
| | 147,849 |
| 162,496 |
| | 140,346 |
|
| Reserve and impairment charges (recoveries), net | (3,787 | ) | | 18,357 |
| (6,353 | ) | | (3,787 | ) |
| Operating earnings (loss) | 176,881 |
| | 186,491 |
| 314,498 |
| | 183,933 |
|
| (Gain) loss on investments | (2,819 | ) | | 7,401 |
| |
| Interest expense | 40,702 |
| | 38,265 |
| 38,908 |
| | 40,702 |
|
| Other (income) loss | (22,195 | ) | | (44,401 | ) | (25,134 | ) | | (26,195 | ) |
| Equity (income) loss from investments | (38,362 | ) | | (40,328 | ) | (66,508 | ) | | (38,362 | ) |
| Income (loss) before income taxes | 199,555 |
| | 225,554 |
| 367,232 |
| | 207,788 |
|
| Income tax expense (benefit) | 19,936 |
| | 16,612 |
| 20,117 |
| | 20,606 |
|
| Net income (loss) | 179,619 |
| | 208,942 |
| 347,115 |
| | 187,182 |
|
| Net income (loss) attributable to noncontrolling interests | (464 | ) | | (208 | ) | (389 | ) | | (464 | ) |
| Net income (loss) attributable to CHS Inc. | $ | 180,083 |
| | $ | 209,150 |
| $ | 347,504 |
| | $ | 187,646 |
|
The charts below detail revenues and income (loss) before income taxes by reportable segment for the first quarter of fiscal 2018. Our Nitrogen Production and Foods reportable segments represent equity methods investments, and as such record earnings and allocated expenses but not revenue.
Income (Loss) Before Income TaxesThe charts below detail revenues, net of intersegment revenues, and IBIT by Segment
Energy
|
| | | | | | | | | | | | | | |
| | For the Three Months Ended November 30
| | Change |
| | 2017 | | 2016 | | Dollars | | Percent |
| | (Dollars in thousands) |
| Income (loss) before income taxes | $ | 113,083 |
| | $ | 69,983 |
| | $ | 43,100 |
| | 61.6 | % |
The following table and commentary present the primary reasons for the changes in income (loss) before income taxes ("IBIT") for the Energyreportable segment for the three months ended November 30, 2017, compared2018. Our Nitrogen Production reportable segment represents an equity method investment, and as such records earnings and allocated expenses but not revenue.
Energy Segment Operating Metrics
Our Energy segment operations primarily include our Laurel, Montana and McPherson, Kansas refineries, which process crude oil to the prior year:produce refined products, including gasoline, distillates and other products. The following tables provide information about our consolidated refinery operations.
|
| | | | |
| | | Change |
| | | Three Months Ended November 30 |
| | | (Dollars in millions) |
| Volume | | $ | (1 | ) |
| Price | | 37 |
|
| Other* | | 2 |
|
Non-gross profit related activity+ | | 5 |
|
| Total change in Energy IBIT | | $ | 43 |
|
* Other includes retail and non-commodity type activities.
+ See commentary related to these changes in the marketing, general and administrative expenses, (gain) loss on investments, interest expense, other income (loss) and equity (income) loss from investments sections of this Results of Operations. |
| | | | | |
| | For the Three Months Ended November 30, |
| | 2018 | | 2017 |
| Refinery throughput volumes | (Barrels per day) |
| Heavy, high-sulfur crude oil | 101,096 |
| | 87,093 |
|
| All other crude oil | 62,881 |
| | 69,269 |
|
| Other feedstocks and blendstocks | 17,919 |
| | 21,230 |
|
| Total refinery throughput volumes | 181,896 |
| | 177,592 |
|
| Refined fuel yields | | | |
| Gasolines | 89,297 |
| | 91,154 |
|
| Distillates | 72,450 |
| | 68,186 |
|
Comparison of Energy segment IBIT for the three months ended November 30, 2017, and 2016
The $43.1 million increase in the Energy segment IBIT reflects the following:
Primarily driven by improved margins within refined fuels, caused by lower market inventories in the energy industry due to an active hurricane season in the Gulf of Mexico which resulted in oil production and refining operations being temporarily suspended in major centers of production along a critical portion of the Gulf coast of the United States, driving prices higher.
This increase was partially offset by a 3% decrease in volumes in Refined Fuels.
We are subject to the Renewable Fuels Standard program ("RFS"), which requires refiners to blend renewable fuels (e.g., ethanol, biodiesel) into their finished transportation fuels or purchase renewable energy credits, known as Renewable Identification Numbers ("RINs"), in lieu of blending. The Environmental Protection Agency ("EPA") generally establishes new annual renewable fuel percentage standards for each compliance year in the preceding year. We generate RINsRINS under the RFS in our renewable fuels operations and through our blending activities at our terminals. However,terminals; but we cannot generate enough RINs to meet the needs of our refining capacity and RINs must be purchased on the open market. The price of RINs can be volatile. On November 30, 2017, the EPA released the final mandate for year 2018.volatile and can impact profitability.
AgIn addition to our internal operational reliability, the profitability of our Energy segment is largely driven by crack spreads (e.g., the price differential between refined products and inputs such as crude oil), which are driven by the supply and demand of global refined product markets. Crack spreads continued to remain higher during the first quarter of fiscal 2019 as a result of the tightening supply and demand in the global and North American refined product markets. The table below provides information about the average market reference prices and differentials that impact our Energy segment.
|
| | | | | | | | | | | | | | |
| | For the Three Months Ended November 30
| | Change |
| | 2017 | | 2016 | | Dollars | | Percent |
| | (Dollars in thousands) |
| Income (loss) before income taxes | $ | 74,519 |
| | $ | 109,213 |
| | $ | (34,694 | ) | | (31.8 | )% |
|
| | | |
| | For the Three Months Ended November 30, |
| | 2018 | | 2017 |
| Market indicators | | | |
| West Texas Intermediate (WTI) crude oil (dollars per barrel) | $65.85 | | $54.62 |
| WTI - Western Canadian Select (WCS) crude oil differential (dollars per barrel) | $34.97 | | $10.91 |
| Group 3 2:1:1 crack spread (dollars per barrel)* | $20.10 | | $22.54 |
| Group 3 5:3:2 crack spread (dollars per barrel)* | $18.57 | | $21.99 |
| D6 ethanol RIN (dollars per RIN) | $0.1292 | | $0.8515 |
| D4 ethanol RIN (dollars per RIN) | $0.3708 | | $1.0245 |
* Group 3 refers to the oil refining and distribution system serving the Midwest markets from the Gulf Coast through the Plains States.
Income (Loss) Before Income Taxes by Segment
Energy
|
| | | | | | | | | | | | | | |
| | For the Three Months Ended November 30, | | Change |
| | 2018 | | (As Restated) 2017 | | Dollars | | Percent |
| | (Dollars in thousands) |
| Income (loss) before income taxes | $ | 232,461 |
| | $ | 120,436 |
| | $ | 112,025 |
| | 93.0 | % |
The following table and commentary present the primary reasons for the changes in IBIT for the Energy segment for the three months ended November 30, 2018, compared to the prior year: |
| | | | |
| | | Year-Over-Year Change |
| | | Three Months Ended November 30, |
| | | (Dollars in millions) |
| Volume | | $ | 2,038 |
|
| Price | | 118,772 |
|
| Transportation, retail and other | | 6,729 |
|
Non-gross profit related activity+ | | (15,514 | ) |
| Total change in Energy IBIT | | $ | 112,025 |
|
+ See commentary related to these changes in the marketing, general and administrative expenses, reserve and impairment charges (recoveries), interest expense, other income (loss) and equity (income) loss from investments sections of this Results of Operations.
Comparison of Energy segment IBIT for the three months ended November 30, 2018, and 2017
The $112.0 million increase in Energy segment IBIT reflects the following:
Improved market conditions in our refined fuels business, primarily driven by favorable pricing on heavy Canadian crude oil which is processed by our refineries. The favorable crude oil pricing contributed to a $119.7 million IBIT increase, inclusive of a $17.3 million increase to unrealized hedging loss. A 2% volume increase for refined fuels also contributed to the increased IBIT.
The increases driven by improved pricing and volume were partially offset by higher incentive compensation accruals associated with improved earnings.
Ag
|
| | | | | | | | | | | | | | |
| | For the Three Months Ended November 30, | | Change |
| | 2018 | | (As Restated) 2017 | | Dollars | | Percent |
| | (Dollars in thousands) |
| Income (loss) before income taxes | $ | 80,318 |
| | $ | 75,145 |
| | $ | 5,173 |
| | 6.9 | % |
The following table and commentary present the primary reasons for the changes in IBIT for the Ag segment for the three months ended November 30, 2017,2018, compared to the prior year:
|
| | | | |
| | | Change |
| | | Three Months Ended November 30 |
| | | (Dollars in millions) |
| Volume | | $ | (7 | ) |
| Price | | (41 | ) |
| Other* | | (18 | ) |
Impairment+ | | 22 |
|
Non-gross profit related activity+ | | 9 |
|
| Total change in Ag IBIT | | $ | (35 | ) |
* Other includes retail and non-commodity type activities. |
| | | | |
| | | Year-Over-Year Change |
| | | Three Months Ended November 30, |
| | | (Dollars in millions) |
| Volume | | $ | 3,434 |
|
| Price | | 15,504 |
|
Non-gross profit related activity+ | | (13,765 | ) |
| Total change in Ag IBIT | | $ | 5,173 |
|
+ See commentary related to these changes in the marketing, general and administrative expenses, reserve and impairment charges (recoveries), net, (gain) loss on investments, interest expense, other income (loss) and equity (income) loss from investments sections of this Results of Operations.
Comparison of Ag segment IBIT for the three months ended November 30, 2017,2018, and 20162017
The $34.7$5.2 million decreaseincrease in Ag segment IBIT reflects the following:
Grain marketing IBIT decreasedImproved pricing attributed primarily due to lower grain volumescrop nutrients and associated margins.
Country operations IBIT increased due to improved margins along with a gain of approximately $7.1 million due to the sale of a non-strategic North American location, a gain on the sale of a domestic investment of $2.2 million, and recognition of approximately $5.3 million associated with the recovery of a loan that was written off in the prior fiscal year.
Processingprocessing and food ingredients IBITand volume increases attributable to grain and oilseed.
The improved pricing attributed to crop nutrients and processing and food ingredients was partially offset by non-gross profit related activity, including lower earnings from equity method investments within the Ag segment, increased interest expense and decreased primarily caused by lower margins along with one-time severance charges and other costs associated with held for sale assets.
Crop nutrients IBIT increased, driven by higher associated margins.
Renewable fuels marketing and production operations IBIT decreased primarily resulting from lower margins.interest income.
All Other Segments
|
| | | | | | | | | | | | | | |
| | For the Three Months Ended November 30
| | Change |
| | 2017 | | 2016 | | Dollars | | Percent |
| | (Dollars in thousands) |
| Nitrogen Production IBIT | $ | 5,666 |
| | $ | 27,037 |
| | $ | (21,371 | ) | | (79.0 | )% |
| Foods IBIT | $ | 973 |
| | $ | 10,572 |
| | $ | (9,599 | ) | | (90.8 | )% |
| Corporate and Other IBIT | $ | 5,314 |
| | $ | 8,749 |
| | $ | (3,435 | ) | | (39.3 | )% |
|
| | | | | | | | | | | | | | |
| | For the Three Months Ended November 30, | | Change |
| | 2018 | | (As Restated) 2017 | | Dollars | | Percent |
| | (Dollars in thousands) |
| Nitrogen Production IBIT* | $ | 23,679 |
| | $ | 5,666 |
| | $ | 18,013 |
| | 317.9 | % |
| Corporate and Other IBIT | $ | 30,774 |
| | $ | 6,541 |
| | $ | 24,233 |
| | 370.5 | % |
Comparison of All Other Segments IBIT for the three months ended November 30, 2017, and 2016
Our Nitrogen Production segment IBIT decreased due to a gain in the prior year of $29.1 million associated with an embedded derivative asset inherent in the agreement relating to our investment in CF Nitrogen for which there was no comparable gain in the current fiscal year. This was partially offset by higher equity method income in the current year driven by improved prices on urea and urea ammonium nitrate, which are produced and sold by CF Nitrogen.* See Note 4, 6, Investments,, of the notes to the consolidated financial statements that are included in this Quarterly Report on Form 10-Q for additional information.
Comparison of All Other Segments IBIT for the three months ended November 30, 2018, and 2017
Our FoodsNitrogen Production segment IBIT decreased inincreased as a result of significantly higher equity method income during the first quarter of fiscal 2018 due2019 attributed to lower margins earnedincreased market pricing of urea and UAN, which are produced and sold by Ventura Foods, as its customers put significant pressure on pricing and it experienced acquisition integration challenges.CF Nitrogen. Corporate and Other IBIT decreased due to lowerincreased primarily as a result of higher earnings from our wheat milling joint ventureinvestments in Ventura Foods and reducedArdent Mills, as well as increased interest revenue from our financing group resulting from the sale of loans receivable.
Revenues by Segment
Energy
|
| | | | | | | | | | | | | | |
| | For the Three Months Ended November 30
| | Change |
| | 2017 | | 2016 | | Dollars | | Percent |
| | (Dollars in thousands) |
| Revenue | $ | 1,950,499 |
| | $ | 1,590,093 |
| | $ | 360,406 |
| | 22.7 | % |
The following table and commentary present the primary reasons for the changes in revenue for the Energy segment for the three months ended November 30, 2017, compared to the prior year: |
| | | | |
| | | Change |
| | | Three Months Ended November 30 |
| | | (Dollars in millions) |
| Volume | | $ | (36 | ) |
| Price | | 377 |
|
| Other* | | 19 |
|
| Total change in Energy revenue | | $ | 360 |
|
* Other includes retail and non-commodity type activities.
Comparison of Energy segment revenue for the three months ended November 30, 2017, and 2016
The $360.4 million increase in Energy revenue reflects the following:
Refined fuels revenues rose $257.7 million (20%), of which approximately $298.0 million related to an increase in the net average selling price, partially offset by $40.3 million related to lower sales volumes, compared to the prior year. The selling price of refined fuels products increased an average of $0.36 (24%) per gallon, and sales volumes decreased 3%, compared to the previous year.
Propane revenues increased $87.9 million (57%), of which $78.0 million was attributable to a rise in the net average selling price and $9.9 million was attributable to higher volumes. Propane sales volume increased 6% and the average selling price of propane increased $0.31 (47%) per gallon, when compared to the previous year.
Ag
|
| | | | | | | | | | | | | | |
| | For the Three Months Ended November 30
| | Change |
| | 2017 | | 2016 | | Dollars | | Percent |
| | (Dollars in thousands) |
| Revenue | $ | 6,082,647 |
| | $ | 6,432,229 |
| | $ | (349,582 | ) | | (5.4 | )% |
|
| | | | | | | | | | | | | | |
| | For the Three Months Ended November 30, | | Change |
| | 2018 | | (As Restated) 2017 | | Dollars | | Percent |
| | (Dollars in thousands) |
| Revenues | $ | 2,161,288 |
| | $ | 1,939,146 |
| | $ | 222,142 |
| | 11.5 | % |
The following table and commentary present the primary reasons for the changes in revenuerevenues for the AgEnergy segment for the three months ended November 30, 2017,2018, compared to the prior year:
|
| | | | |
| | | Change |
| | | Three Months Ended November 30 |
| | | (Dollars in millions) |
| Volume | | $ | (360 | ) |
| Price | | 4 |
|
| Other* | | 6 |
|
| Total change in Ag revenue | | $ | (350 | ) |
* Other includes retail and non-commodity type activities.
|
| | | | |
| | | Year-Over-Year Change |
| | | Three Months Ended November 30, |
| | | (Dollars in millions) |
| Volume | | $ | 32,833 |
|
| Price | | 228,915 |
|
| Transportation, retail and other | | (39,606 | ) |
| Total change in Energy revenues | | $ | 222,142 |
|
Comparison of AgEnergy segment revenuerevenues for the three months ended November 30, 20172018, and 20162017
The $349.6$222.1 million decreaseincrease in AgEnergy segment revenuerevenues reflects the following:
Grain and oilseed revenues attributable to country operations and grain marketing totaled $4.4 billion and $4.7 billion for the three months ended November 30, 2017, and 2016, respectively. The grain and oilseed revenue decrease of $338.1 million (7%) was attributableIncreased refined fuels pricing contributed to a decline in volumes$243.3 million increase of $368.6 million, partially offset by $30.5 million in higher average grain selling prices. The average sales price of all grainrevenues and oilseed commodities sold increased $0.04 per bushel. Wheat, corn and soybean volumes decreased by approximately 8% compared to the prior year. The decrease in volumes was due to lower export activity compared to the same period in the prior year caused by increased global competition.
Our processing and food ingredients revenue decreased $26.8 million, primarily duea 2% volume increase contributed to a $11.7$37.7 million decline resulting from the prior-year saleincrease of an international location, along with a decline in volumes of $24.5 million (7%). These declinesrevenues.
The increased revenues driven by price and volume increases for refined fuels were partially offset by an average sales price increase of $0.39 (3%) per bushel or $9.4decreased propane prices that contributed to a $16.2 million related to our oilseed commodities.
Wholesale crop nutrient revenues attributable to crop nutrients and grain marketing decreased $3.9 million due to lower average fertilizer selling prices of $21.2 million, partially offset by higher volumes of $17.3 million. Our wholesale crop nutrient volumes increased 4% and the average sales price of all fertilizers sold reflected a decrease of $12.72 (5%) per ton comparedrevenues and a 19% decrease of lubricant volumes that contributed to the prior year. The increase in volumes was due to improved market conditions from the prior yeara $6.6 million decrease of revenues.
Transportation, retail and other revenues decreased primarily as well as supply chain management improvements.
Our renewable fuels revenues from our marketing and production operations decreased $13.7 million primarily thea result of a lower average sales pricethe sale of $0.11 (7%34 Zip Trip stores located in the Pacific Northwest, United States ("Pacific Northwest") per gallon or $24.1 million, partially offset by 3% higher volumes or $10.3 million. Market supply and demand forces decreased average sales prices.
The remaining Ag segment product revenues related primarily to feed and farm supplies increased $26.5 million mainly due to increasesthat were sold during the third quarter of fiscal 2018. Revenues for these stores were included in diesel sold and a risethe results during the first quarter of fiscal 2018 but were not present in propane sold for home heating due to colder temperatures.the first quarter of fiscal 2019 results.
All Other SegmentsAg
|
| | | | | | | | | | | | | | |
| | For the Three Months Ended November 30
| | Change |
| | 2017 | | 2016 | | Dollars | | Percent |
| | (Dollars in thousands) |
| Corporate and Other revenue | $ | 15,743 |
| | $ | 25,928 |
| | $ | (10,185 | ) | | (39.3 | )% |
Comparison of All Other Segments revenue for the three months ended November 30, 2017, and 2016
Corporate and Other revenue decreased due to the sale of loans receivable upon which interest was previously being recognized. Our Nitrogen Production and Foods reportable segments represent equity method investments, and as such record earnings and allocated expenses but not revenue.
Cost of Goods Sold by Segment
Energy
|
| | | | | | | | | | | | | | |
| | For the Three Months Ended November 30
| | Change |
| | 2017 | | 2016 | | Dollars | | Percent |
| | (Dollars in thousands) |
| Cost of goods sold | $ | 1,800,404 |
| | $ | 1,478,610 |
| | $ | 321,794 |
| | 21.8 | % |
|
| | | | | | | | | | | | | | |
| | For the Three Months Ended November 30, | | Change |
| | 2018 | | (As Restated) 2017 | | Dollars | | Percent |
| | (Dollars in thousands) |
| Revenues | $ | 6,305,397 |
| | $ | 6,076,994 |
| | $ | 228,403 |
| | 3.8 | % |
The following table and commentary present the primary reasons for the changes in costrevenues for the Ag segment for the three months ended November 30, 2018, compared to the prior year:
|
| | | | |
| | | Year-Over-Year Change |
| | | Three Months Ended November 30, |
| | | (Dollars in millions) |
| Volume | | $ | 236,577 |
|
| Price | | (8,174 | ) |
| Total change in Ag revenues | | $ | 228,403 |
|
Comparison of goods sold ("COGS")Ag segment revenues for the three months ended November 30, 2018, and 2017
The $228.4 million increase in Ag segment revenues reflects the following:
A 5% volume increase for grain and oilseed, which contributed to a $234.6 million increase of revenues. The increased volumes associated with grain and oilseed were partially offset by decreased prices that contributed to a $127.7 million decrease of revenues.
A 1% volume increase for crop nutrients that contributed to a $4.7 million increase of revenues and an increase in crop nutrient pricing that contributed to a $113.6 million increase of revenues.
Increased pricing for feed and farm supplies and processing and food ingredients contributed to increased revenues of $23.4 million and $30.2 million, respectively, which was mostly offset by decreased pricing for renewable fuels that contributed to a $47.6 million decrease of revenues.
All Other Segments
|
| | | | | | | | | | | | | | |
| | For the Three Months Ended November 30, | | Change |
| | 2018 | | (As Restated) 2017 | | Dollars | | Percent |
| | (Dollars in thousands) |
| Corporate and Other revenues* | $ | 17,604 |
| | $ | 15,744 |
| | $ | 1,860 |
| | 11.8 | % |
* Our Nitrogen Production reportable segment represents an equity method investment, and as such records earnings and allocated expenses, but not revenues.
Comparison of All Other Segments revenues for the three months ended November 30, 2018, and 2017
There were no significant changes in Corporate and Other revenues during the first quarter of fiscal 2019.
Cost of Goods Sold by Segment
Energy
|
| | | | | | | | | | | | | | |
| | For the Three Months Ended November 30, | | Change |
| | 2018 | | (As Restated) 2017 | | Dollars | | Percent |
| | (Dollars in thousands) |
| Cost of goods sold | $ | 1,876,671 |
| | $ | 1,782,068 |
| | $ | 94,603 |
| | 5.3 | % |
The following table and commentary present the primary reasons for the changes in COGS for the Energy segment for the three months ended November 30, 2017,2018, compared to the prior year:
|
| | | | |
| | | Change |
| | | Three Months Ended November 30 |
| | | (Dollars in millions) |
| Volume | | $ | (35 | ) |
| Price | | 340 |
|
| Other* | | 17 |
|
| Total change in Energy cost of goods sold | | $ | 322 |
|
* Other includes retail and non-commodity type activities. |
| | | | |
| | | Year-Over-Year Change |
| | | Three Months Ended November 30, |
| | | (Dollars in millions) |
| Volume | | $ | 30,795 |
|
| Price | | 110,143 |
|
| Transportation, retail and other | | (46,335 | ) |
| Total change in Energy cost of goods sold | | $ | 94,603 |
|
Comparison of Energy segment COGS for the three months ended November 30, 2017,2018, and 20162017
The $321.8$94.6 million increase in Energy segment COGS reflects the following:
RefinedIncreased refined fuels costs contributed to a $123.6 million increase of COGS and a 2% volume increase contributed to a $34.4 million increase of COGS.
The increased costs driven by price and volume increases for refined fuels were partially offset by decreased propane costs that contributed to a $15.8 million decrease of COGS and a 19% decrease of lubricant volumes that contributed to a $5.3 million decrease of COGS.
Transportation, retail and other cost of goods sold increased $196.1 million (16%), which reflectsdecreased primarily as a $0.28 (19%) per gallon or $234.6 million riseresult of the sale of 34 Zip Trip stores located in the average costPacific Northwest that were sold during the third quarter of refined fuels, partially offset by a decreasefiscal 2018. Costs associated with these stores were included in the results during the first quarter of 3%fiscal 2018 but were not present in volume or $38.5 million.the first quarter fiscal 2019 results.
The increase in propane cost
Ag
|
| | | | | | | | | | | | | | |
| | For the Three Months Ended November 30
| | Change |
| | 2017 | | 2016 | | Dollars | | Percent |
| | (Dollars in thousands) |
| Cost of goods sold | $ | 5,936,062 |
| | $ | 6,220,190 |
| | $ | (284,128 | ) | | (4.6 | )% |
|
| | | | | | | | | | | | | | |
| | For the Three Months Ended November 30, | | Change |
| | 2018 | | (As Restated) 2017 | | Dollars | | Percent |
| | (Dollars in thousands) |
| Cost of goods sold | $ | 6,139,585 |
| | $ | 5,930,121 |
| | $ | 209,464 |
| | 3.5 | % |
The following table and commentary present the primary reasons for the changes in COGS for the Ag segment for the three months ended November 30, 2017,2018, compared to the prior year:
|
| | | | |
| | | Change |
| | | Three Months Ended November 30 |
| | | (Dollars in millions) |
| Volume | | $ | (353 | ) |
| Price | | 45 |
|
| Other* | | 24 |
|
| Total change in Ag cost of goods sold | | $ | (284 | ) |
* Other includes retail and non-commodity type activities. |
| | | | |
| | | Year-Over-Year Change |
| | | Three Months Ended November 30, |
| | | (Dollars in millions) |
| Volume | | $ | 233,143 |
|
| Price | | (23,679 | ) |
| Total change in Ag cost of goods sold | | $ | 209,464 |
|
Comparison of Ag segment COGS for the three months ended November 30, 2017,2018, and 20162017
The $284.1$209.5 million decreaseincrease in Ag segment COGS reflects the following:
GrainA 5% volume increase for grain and oilseed, costwhich contributed to a $231.7 million increase of goods sold attributable to country operations andCOGS. The increased volumes associated with grain marketing totaled $4.3 billion and $4.6 billion for the three months ended November 30, 2017, and 2016, respectively. The costs of grains and oilseed procured through our Ag segment decreased $299.2 million. The majority of the decline was driven by an 8% decrease in volumes of $360.9 million, partiallywere offset by decreased costs that contributed to a higher average cost per bushel$129.5 million decrease of $0.08 (1%) or $61.7 million. The decrease in volumes was due to lower export activity compared to the same period in the prior year.COGS.
Processing and food ingredients cost of goods sold increased $5.5 million (2%) and is comprised of $47.4 million from a higher average cost of oilseeds purchasedA 1% volume increase for further processing, partially offset by $22.2 million in lower volumes, plus a $19.7 million decline due to the sale of an international location in the prior year. Changes in cost are typically driven by the market price of soybeans purchased.
Wholesale crop nutrients cost of goods sold attributablethat contributed to crop nutrients and grain marketing increased by $1.2a $4.6 million (less than 1%), caused primarily by an increase of 4%, or $16.5 million, in tons sold. The increase was partially offset by a decline of 4%, or $15.3 million, in average cost per ton of product. The increase in volumesCOGS and decrease in the prices paid for goods were due to better market conditions compared to the prior year, as well as beneficial changes in supply chain management.
Renewable fuels cost of goods sold decreased $3.6 million (1%) resulting from a decrease in the average cost per gallon of $0.06 (4%) or $13.2 million, which was mostly offset by an increase in volumecrop nutrient costs that contributed to a $106.6 million increase of 3% or $9.7 million.COGS.
The remaining Ag segment product cost of goods sold, primarilyIncreased costs for feed and farm supplies and processing and food ingredients contributed to increased COGS of $31.7 million and $4.4 million, respectively, which was offset by decreased $11.7costs for renewable fuels that contributed to a $36.9 million due to lower costs incurred related to crop protection services and sunflower processing.
Total Ag costdecrease of goods sold include "Other" cost of goods sold, which are generated from our country operations elevators and agri-service centers that incur costs from activities related to production agriculture. These cost of goods sold activities include grain storage, grain cleaning, fertilizer spreading, crop protection spraying and other associated services of this nature. In addition, our grain marketing operations incur "Other" costs at our export terminals from activities related to loading vessels.COGS.
All Other Segments
| | | | For the Three Months Ended November 30
| | Change | For the Three Months Ended November 30, | | Change |
| | 2017 | | 2016 | | Dollars | | Percent | 2018 | | (As Restated) 2017 | | Dollars | | Percent |
| | (Dollars in thousands) | (Dollars in thousands) |
| Nitrogen Production COGS | $ | 219 |
| | $ | (884 | ) | | $ | 1,103 |
| | 124.8 | % | $ | (2,073 | ) | | $ | 219 |
| | $ | (2,292 | ) | | NM* |
| Corporate and Other COGS | $ | (1,058 | ) | | $ | (2,363 | ) | | $ | 1,305 |
| | 55.2 | % | $ | (535 | ) | | $ | (1,016 | ) | | $ | 481 |
| | NM* |
* NM - Not Meaningful
Comparison of All Other Segments COGS for the three months ended November 30, 2017,2018, and 20162017
The increase inThere were no significant changes to COGS for our Nitrogen Production segment for fiscal 2018 was due to an unfavorable variance on our natural gas hedges. The increase in COGS foror Corporate and Other forduring the first quarter of fiscal 2018 was due to increased commission expense as a result of higher volumes of transactions in our financing, hedging and insurance operations. Our Foods reportable segment represents an equity method investment, and as such records earnings and allocated expenses but not COGS.2019.
Marketing, General and Administrative Expenses
|
| | | | | | | | | | | | | | |
| | For the Three Months Ended November 30
| | Change |
| | 2017 | | 2016 | | Dollars | | Percent |
| | (Dollars in thousands) |
| Marketing, general and administrative expenses | $ | 140,168 |
| | $ | 147,849 |
| | $ | (7,681 | ) | | (5.2 | )% |
|
| | | | | | | | | | | | | | |
| | For the Three Months Ended November 30, | | Change |
| | 2018 | | (As Restated) 2017 | | Dollars | | Percent |
| | (Dollars in thousands) |
| Marketing, general and administrative expenses | $ | 162,496 |
| | $ | 140,346 |
| | $ | 22,150 |
| | 15.8 | % |
Comparison of marketing, general and administrative expenses for the three months ended November 30, 2017,2018, and 20162017
The $7.7 million decreaseincrease in marketing, general and administrative expenses is primarily due to lowerhigher incentive compensation expensesaccruals as a result of improved financial performance and lower brokerage commissions.increased outside service expenses.
Reserve and Impairment Charges (Recoveries), net
|
| | | | | | | | | | | | | | |
| | For the Three Months Ended November 30
| | Change |
| | 2017 | | 2016 | | Dollars | | Percent |
| | (Dollars in thousands) |
| Reserve and impairment charges (recoveries), net | $ | (3,787 | ) | | $ | 18,357 |
| | $ | (22,144 | ) | | (120.6 | )% |
|
| | | | | | | | | | | | | | |
| | For the Three Months Ended November 30, | | Change |
| | 2018 | | (As Restated) 2017 | | Dollars | | Percent |
| | (Dollars in thousands) |
| Reserve and impairment charges (recoveries), net | $ | (6,353 | ) | | $ | (3,787 | ) | | $ | (2,566 | ) | | (67.8 | )% |
Comparison of reserve and impairment charges (recoveries), net for the three months ended November 30, 2017,2018, and 20162017
The $22.1 million decrease in reserveReserve and impairment charges (recoveries), net reflects the following:
During fiscal 2017, an allowance for doubtful accounts of $18.4 million was recorded, including loan loss reserves related to a single producer borrower.
In fiscal 2018, we recovered approximately $5.3 million associated with a loan that was previously written off in the prior fiscal year, partially offset by increases in bad debt expense of approximately $1.5 million. As a result, the current fiscal year to date reflects a net recovery.
Gain (Loss) on Investments
|
| | | | | | | | | | | | | | |
| | For the Three Months Ended November 30
| | Change |
| | 2017 | | 2016 | | Dollars | | Percent |
| | (Dollars in thousands) |
| Gain (loss) on investments | $ | 2,819 |
| | $ | (7,401 | ) | | $ | 10,220 |
| | 138.1 | % |
Comparison of gain (loss) on investments for did not change significantly during the three months ended November 30, 2017, and 2016
The increase in gain (loss) on investments is mainly attributable2018; however, the increased recoveries relate primarily to a gain oninsurance recoveries recognized during the salefirst quarter of a domestic investment of $2.2 million in fiscal 2018, compared to a $7.4 million loss on the sale of an international investment during fiscal 2017 which did not reoccur in fiscal 2018.2019.
Interest Expense
|
| | | | | | | | | | | | | | |
| | For the Three Months Ended November 30
| | Change |
| | 2017 | | 2016 | | Dollars | | Percent |
| | (Dollars in thousands) |
| Interest expense | $ | 40,702 |
| | $ | 38,265 |
| | $ | 2,437 |
| | 6.4 | % |
|
| | | | | | | | | | | | | | |
| | For the Three Months Ended November 30, | | Change |
| | 2018 | | (As Restated) 2017 | | Dollars | | Percent |
| | (Dollars in thousands) |
| Interest expense | $ | 38,908 |
| | $ | 40,702 |
| | $ | (1,794 | ) | | (4.4 | )% |
Comparison of interest expense for the three months ended November 30, 2017,2018, and 20162017
The $2.4 million increase in interestInterest expense fordid not change significantly during the three months ended November 30, 2018; however, the decrease is the result of lower outstanding debt balances during the first quarter of fiscal 2018 was primarily due to higher interest expense associated with higher interest rates.2019.
Other Income (Loss)
|
| | | | | | | | | | | | | | |
| | For the Three Months Ended November 30
| | Change |
| | 2017 | | 2016 | | Dollars | | Percent |
| | (Dollars in thousands) |
| Other income (loss) | $ | 22,195 |
| | $ | 44,401 |
| | $ | (22,206 | ) | | (50.0 | )% |
|
| | | | | | | | | | | | | | |
| | For the Three Months Ended November 30, | | Change |
| | 2018 | | (As Restated) 2017 | | Dollars | | Percent |
| | (Dollars in thousands) |
| Other income (loss) | $ | 25,134 |
| | $ | 26,195 |
| | $ | (1,061 | ) | | (4.1 | )% |
Comparison of other income (loss) for the three months ended November 30, 2017,2018, and 20162017
The $22.2 million decrease in otherOther income (loss) reflects the following:
During fiscal 2017, we recorded a gain of $29.1 million associated with an embedded derivative within the contract relating to our strategic investment in CF Nitrogen that did not reoccurchange significantly during the three months ended November 30, 2018; however, the decrease relates primarily to less interest income generated during the first quarter of fiscal 2018.2019.
Equity Income (Loss) from Investments
|
| | | | | | | | | | | | | | |
| | For the Three Months Ended November 30, | | Change |
| | 2018 | | (As Restated) 2017 | | Dollars | | Percent |
| | (Dollars in thousands) |
| Equity income (loss) from investments* | $ | 66,508 |
| | $ | 38,362 |
| | $ | 28,146 |
| | 73.4 | % |
* See Note 10, Derivative Financial Instruments and Hedging Activities,6, Investments, of the notes to the consolidated financial statements that are included in this Quarterly Report on Form 10-Q for additional information.
In fiscal year 2018, we sold a non-strategic North American location in our Ag segment that resulted in a gain of approximately $7.1 million.
Equity Income (Loss) from Investments
|
| | | | | | | | | | | | | | |
| | For the Three Months Ended November 30
| | Change |
| | 2017 | | 2016 | | Dollars | | Percent |
| | (Dollars in thousands) |
| Equity income (loss) from investments | $ | 38,362 |
| | $ | 40,328 |
| | $ | (1,966 | ) | | (4.9 | )% |
Comparison of equity income (loss) from investments for the three months ended November 30, 2017,2018, and 20162017
Equity income (loss) from investments primarily decreased due to lower equity income recognized from our equity method investments in Ventura Foods, TEMCO, LLC, and Ardent Mills, LLC caused by lower margins, which was partially offset by higher equity income recognized from our equity method investment in CF Nitrogen. See Note 4, Investments, of the notes to the consolidated financial statements that are included in this Quarterly Report on Form 10-Q for additional information. We record equity income or loss from thefor investments in which we have an ownership interest of 50% or less and have significant influence, but not control, for our proportionate share of income or loss reported by the entity, without consolidating the revenues and expenses of the entity in our Consolidated Statements of Operations. Equity income (loss) from investments increased primarily due to higher equity income associated with our equity method investments in CF Nitrogen and Ventura Foods, which increased by approximately $20.6 million and $12.6 million, respectively. These increases were driven by improved urea pricing for CF Nitrogen and improved product margins and volumes for Ventura Foods.
Income TaxesTax Expense (Benefit)
|
| | | | | | | | | | | | | | |
| | For the Three Months Ended November 30
| | Change |
| | 2017 | | 2016 | | Dollars | | Percent |
| | (Dollars in thousands) |
| Income taxes | $ | (19,936 | ) | | $ | (16,612 | ) | | $ | (3,324 | ) | | (20.0 | )% |
|
| | | | | | | | | | | | | |
| | For the Three Months Ended November 30, | | Change |
| | 2018 | | (As Restated) 2017 | | Dollars | | Percent |
| | (Dollars in thousands) |
| Income tax expense (benefit) | $ | 20,117 |
| | $ | 20,606 |
| | $ | (489 | ) | | (2.4)% |
Comparison of income taxestax expense (benefit) for the three months ended November 30, 2017,2018, and 20162017
During the first quarter of fiscalthree months ended November 30, 2018, we had an increase ina slight decrease of income tax expense when compared to the first quartersame period of the prior fiscal 2017,year, resulting in effective tax rates of 10.0%5.5% and 7.4%9.9%, respectively. Although income tax expense did not change significantly, the decreased effective tax rate resulted primarily from a decreased annual statutory federal corporate tax rate from 35% to 21%. The federal and state statutory raterates applied to nonpatronage business activity was 38.4%were 24.6% and 38.3% for the three-month periods ended November 30, 2017,2018, and 2016,2017, respectively. The income taxes and effective tax rate vary each year based upon profitability and nonpatronage business activity during each of the comparable years.
Liquidity and Capital Resources
Summary
In assessing our financial condition, we consider factors such as working capital and internal benchmarking related to our applicable covenants and other financial criteria. We fund our operations primarily through a combination of cash flows from operations andsupplemented with borrowings under our revolving credit facilities. We fund our capital expenditures and growth primarily through cash, operating cash flow and long-term debt financing.
On November 30, 2017,2018, we had working capital, defined as current assets less current liabilities, of $435.9$933.8 million and a current ratio, defined as current assets divided by current liabilities, of 1.1 compared to working capital of $181.9$759.0 million and a current ratio of 1.01.1 on August 31, 2017.2018. On November 30, 2016,2017, we had working capital of $378.6$303.0 million and a current ratio of 1.0 compared to working capital of $414.4$148.6 million and a current ratio of 1.11.0 on August 31, 2016.2017.
As of November 30, 2017,2018, we had cash and cash equivalents of $252.1$266.2 million, total equities of $7.9$8.3 billion, long-term debt of $2.0$1.9 billion and notes payable of $2.5$2.4 billion. Our capital allocation priorities include paying our dividends, maintaining the safety and compliance of our operations, returning cash to our member-owners in the form of cash patronage and equity redemptions, paying our dividends, reducing fundeddown debt and taking advantage of strategic investment opportunities that benefit our owners. We expect the down cycle in the Ag industry to continue and while we maintain appropriate levels
We will continue to consider opportunities to further diversify and enhance our sources and amounts of liquidity. These opportunities include reducing operating expenses, deploying and/or financing working capital more efficiently and identifying and disposing of nonstrategic or underperforming assets. We believe that cash generated by operating and investing activities, along with available borrowing capacity under our credit facilities, will be sufficient to support our operations for the foreseeable future and we expect to remain in compliance with our loan covenants.
Fiscal 2019 and 2018 Activity
FiscalOn June 28, 2018, and 2017 Activity
On July 18, 2017, we amended anthe Company’s existing receivables and loans securitization facility (“Securitization Facility” or the "Facility"(the "Securitization Facility") with certain unaffiliated financial institutions (the "Purchasers"). Under the Securitization Facility, CHS Capitalwe and CHS bothcertain of our subsidiaries (the "Originators") sell eligible trade accounts and notes receivable (“Receivables”(the "Receivables") they have originated to Cofina Funding, LLC (“Cofina Funding”("Cofina"), a wholly-owned bankruptcy-remote indirect subsidiary of CHS. Cofina Funding in turn sellstransfers the purchased Receivables in their entirety to the Purchasers. Prior to amending the Securitization Facility in July 2017, the transfer of Receivables wasPurchasers, which is accounted for as a secured borrowing. UnderDuring the termsperiod from July 2017 through the amendment of the amended Securitization Facility in June 2018, CHS accountsaccounted for Receivables sold under the facilitySecuritization Facility as a sale of financial assets pursuant to Accounting Standards Codification 860, Transfers and derecognizesServicing, and the Receivables sold Receivableswere derecognized from itsour Consolidated Balance Sheets. The amount availableWe use the proceeds from the sale of Receivables under the Securitization Facility fluctuates over time basedfor general corporate purposes and settlements are made on a monthly basis. The Securitization Facility terminates on June 17, 2019, but may be extended.
On September 4, 2018, we entered into a repurchase facility ("the total amountRepurchase Facility") related to the Securitization Facility. Under the Repurchase Facility, the Company is able to borrow up to $150 million, collateralized by a subordinated note issued by Cofina in favor of eligiblethe Originators and representing a portion of the outstanding balance of the Receivables generated duringsold by the normal course of business, with maximum availability of $700.0 million.Originators to Cofina under the Securitization Facility. As of November 30, 2017,2018, the total availabilityoutstanding balance under the SecuritizationRepurchase Facility was $700.0 million, all of which had been utilized.
The Facility agreement contains certain customary representations and warranties and affirmative covenants, including as to the eligibility of the Receivables being sold, and contains customary program termination events and non-reinvestment events. We were in compliance with all covenants associated with our Securitization Facility as of November 30, 2017.$150 million.
Cash Flows
The following table presents summarized cash flow data for the three months ended November 30, 2017,2018, and 2016:2017:
| | | | | | Change | | | Change |
| | 2017 | | 2016 | | Dollars | | Percent | 2018 | | 2017 | | Dollars | | Percent |
| | (Dollars in thousands) | (Dollars in thousands) |
| Net cash provided by (used in) operating activities | $ | (140,454 | ) | | $ | 238,417 |
| | $ | (378,871 | ) | | (158.9 | )% | $ | (94,798 | ) | | $ | (153,540 | ) | | $ | 58,742 |
| | 38.3 | % |
| Net cash provided by (used in) investing activities | (62,770 | ) | | (327,022 | ) | | 264,252 |
| | 80.8 | % | (154,776 | ) | | (62,770 | ) | | (92,006 | ) | | (146.6 | )% |
| Net cash provided by (used in) financing activities | 271,738 |
| | 327,472 |
| | (55,734 | ) | | (17.0 | )% | 49,061 |
| | 285,213 |
| | (236,152 | ) | | (82.8 | )% |
| Effect of exchange rate changes on cash and cash equivalents | 2,236 |
| | (2,696 | ) | | 4,932 |
| | 182.9 | % | (1,535 | ) | | 2,236 |
| | (3,771 | ) | | (168.6 | )% |
| Net increase (decrease) in cash and cash equivalents | $ | 70,750 |
| | $ | 236,171 |
| | $ | (165,421 | ) | | (70.0 | )% | |
| Net increase (decrease) in cash and cash equivalents and restricted cash | | $ | (202,048 | ) | | $ | 71,139 |
| | $ | (273,187 | ) | | (384.0 | )% |
Comparison of cash flowflows for the three months ended November 30, 2017,2018, and 20162017
The $378.9$58.7 million decreaseincrease in cash fromprovided by operating activities reflects increased net income and a reduction of supplier advance payments, particularly related to soybeans as a result of trade disputes between the following:
Reduced seasonal purchases of inventoryUnited States and foreign trade partners. This increase was partially offset by decreaseda decrease in accounts payable and accrued expenses.
Increased supplier advances due to timing of payments made in the first quarter of fiscal 2018 compared to payments made in the second quarter of fiscal 2017.
Decreased customer advance payments in the Ag segment due to lower sales volumesagriculture and drought conditions in the upper midwest.energy commodity prices.
The $264.3$92.0 million increasedecrease in cash from investing activities reflects the following:
DecreasedIncreased CHS Capital notes receivable activity of $149.1$57.6 million.
ProceedsHigher cash receipts in the prior year from the sale of $54.7 million due tocertain assets, including the sale of our primary corporate office building in Inver Grove Heights, Minnesota in the first quarter of fiscal 2018, which was subsequently leased back to us. The proceeds received were used to pay down long-term debt.
ReducedIncreased acquisitions of property, plant and equipment and other business acquisitions primarily related to our plan to reduce our capital investments to allow us to actively reduce our funded debt obligations.equipment.
CashThe $236.2 million decrease in cash from financing activities decreased $55.7 million, primarily due to changes in checksreflects reduced net borrowings from our lines of credit and drafts outstanding compared to the three months ended November 30, 2016.long term-debt facilities.
Future Uses of Cash
We expect to utilize cash and cash equivalents, along with cash generated by operating activities to fund capital expenditures, major repairs, debt and interest payments, for debt, interest,preferred stock dividends, patronage and guarantees.equity redemptions. The following is a summary of our primary cash requirements for fiscal 2018:2019:
Capital expenditures.We expect total capital expenditures for fiscal 20182019 to be approximately $602.0$634.0 million, compared to capital expenditures of $446.7$355.4 million in fiscal 2017.2018. Included in that amount for fiscal 20182019 is
approximately $221.0$151.0 million for the acquisition of property, plant and equipment at our Laurel, Montana and McPherson, Kansas refineries.refineries and approximately $118.0 million for selective growth capital investments. During the three months ended November 30, 2017,2018, we acquired property, plant property and equipment of $85.8$104.8 million.
Major repairs. Refineries have planned major maintenance to overhaul, repair, inspect and replace process materials and equipment (referred to as a "turnaround") whichthat typically occur for a five- to six-weekfive-to-six-week period every 2-52-4 years. Our Laurel, MontanaMcPherson, Kansas refinery has planned maintenance scheduled for fiscal 20182019 for approximately $92.0$177.0 million.
Debt and interest. We expect to repay the remaining $25.0 million of current maturities of long term debt during fiscal 2018. During the three months ended November 30, 2017,2018, we repaid $160.0$20 million of long termscheduled long-term debt consisting ofmaturities. We have scheduled long-term debt maturities and optional prepayments.of approximately $143 million during the remainder of fiscal 2019.
Preferred stock dividends. We had approximately $2.3 billion of preferred stock outstanding at November 30, 2017.2018. We expect to pay dividends on our preferred stock of approximately $168.7 million during fiscal 2018.2019.
GuaranteesPatronage.Our Board of Directors authorized approximately $75.0 million of our fiscal 2018 patronage sourced earnings to be paid to our member owners during fiscal 2019.
Equity redemptions. We intend to fund aexpect total redemptions of approximately $170.0$79.0 million to be distributed in loan guaranteesfiscal 2019 and to our Brazilian operationsbe in the first nine monthsform of redemptions of qualified and non-qualified equity owned by individual producer members and associations. This amount includes approximately $4.0 million of authorized redemptions from fiscal 2018 as a result of lossesto be paid in the prior fiscal year caused by a trading partner of ours in Brazil entering into bankruptcy-like proceedings under Brazilian law.2019. During the three months ended November 30, 2017,2018, we funded $25.0redeemed $24.1 million in guarantees.of member equity.
Future Sources of Cash
We fund our current operations primarily through a combination of cash flows from operations and committed and uncommitted revolving credit facilities, including our Securitization Facility. We believe these sources will provide adequate liquidity to meet our working capital needs. We fund certain of our long-term capital needs, primarily those related to acquisitions of property, plant and equipment from cash flows from operations and by issuing privately placed long-term debt and term loans. In addition, our wholly-owned subsidiary, CHS Capital, makes loans to member cooperatives, businesses and individual producers of agricultural products included in our cash flows from investing activities, and has financing sources as detailed below in CHS Capital Financing.Financing.
Working Capital Financing
We finance our working capital needs through committed and uncommitted lines of credit with domestic and international banks. We believe our current cash balances and our available capacity on our committed lines of credit will provide adequate liquidity to meet our working capital needs. The following table summarizes our primary lines of credit as of November 30, 2017:2018:
| | | Revolving Credit Facilities | | Maturities | | Total Capacity | | Borrowings Outstanding | | Interest Rates | |
| | | November 30, 2017 | | |
| Primary Revolving Credit Facilities | | | Maturities | | Total Capacity | | Borrowings Outstanding | | Interest Rates |
| | | (Dollars in thousands) | | | Fiscal Year | | (Dollars in thousands) | |
| Committed Five-Year Unsecured Facility | | 2020 | | $ | 3,000,000 |
| | $ | 1,080,000 |
| | LIBOR+0.00% to 1.45% | | 2021 | | $ | 3,000,000 |
| | $ | 403,000 |
| | LIBOR or Base Rate + 0.00% to 1.45% |
| Uncommitted Bilateral Facilities | | 2018 | | 250,000 |
| | 250,000 |
| | LIBOR+0.00% to 1.05% | | 2019 | | 515,000 |
| | 450,000 |
| | LIBOR or Base Rate + 0.00% to 1.05% |
In addition to our primary revolving lines of credit, we have a three-year $325.0 million committed revolving pre-export credit facility for CHS Agronegocio Industria e Comercio Ltda ("CHS Agronegocio"), our wholly-owned subsidiary in Brazil. CHS Agronegocio uses the facility, which expires in April 2019,2020, to finance its working capital needs related to its purchases and sales of grains, fertilizers and other agricultural products. As of November 30, 2017,2018, the outstanding balance under the facility was $260.0$98.9 million.
In addition to our uncommitted bilateral facilityfacilities above, as of November 30, 2017,2018, our wholly-owned subsidiaries, CHS Europe S.a.r.l and CHS Agronegocio, had uncommitted lines of credit with $420.0$293.2 million outstanding. In addition, our
other international subsidiaries had lines of credit with a total of $167.3$183.4 million outstanding as of November 30, 2017,2018, of which $38.7$47.7 million was collateralized.
On November 30, 2017,2018, and August 31, 2017,2018, we had total short-term indebtedness outstanding on these various primary and other facilities, as well as other miscellaneous short-term notes payable, in the amount of $2.2totaling $1.5 billion and $1.7$1.4 billion, respectively.
Long-term Debt Financing
The following table presents summarized long-term debt data as of November 30, 2017,2018, and August 31, 2017:2018:
| | | | November 30,
2017 | | August 31,
2017 | November 30,
2018 | | August 31,
2018 |
| | (Dollars in thousands) | (Dollars in thousands) |
| Private placement debt | $ | 1,530,955 |
| | $ | 1,643,886 |
| $ | 1,489,593 |
| | $ | 1,510,547 |
|
| Bank financing | 391,000 |
| | 445,000 |
| 366,000 |
| | 366,000 |
|
| Capital lease obligations | 28,917 |
| | 33,075 |
| 24,416 |
| | 25,280 |
|
| Other notes and contract payable | 61,542 |
| | 62,652 |
| 31,393 |
| | 32,607 |
|
| Deferred financing costs | (4,648 | ) | | (4,820 | ) | (4,023 | ) | | (4,179 | ) |
| | $ | 2,007,766 |
| | $ | 2,179,793 |
| $ | 1,907,379 |
| | $ | 1,930,255 |
|
CHS Capital Financing
For a description of the Securitization Facility, see above in Fiscal 2019 and 2018 and 2017Activity activity..
CHS Capital has available credit under master participation agreements with numerousseveral counterparties. Prior to the fourth quarter of fiscal 2017, all borrowingsBorrowings under these agreements wereare accounted for as secured borrowings. During the fourth quarter of fiscal 2017, certain of these agreements were amended resulting in the Company accounting for the participations as the sale of financial assets. As of November 30, 2017, the remaining participations accounted for as secured borrowings and bear interest at variable rates ranging from 2.94%3.71% to 4.45%.4.24% as of November 30, 2018. As of November 30, 2017,2018, the total funding commitment under these agreements was $93.6$89.0 million, of which $58.5$42.7 million was borrowed.
CHS Capital sells loan commitments it has originated to ProPartners Financial ("ProPartners") on a recourse basis. The total capacity for commitments under the ProPartners program is $265.0 million. The total outstanding commitments under the primary program totaled $192.1$138.0 million as of November 30, 2017,2018, of which $135.2$86.8 million was borrowed under these commitments with an interest rate of 2.42%3.49%.
CHS Capital borrows funds under short-term notes issued as part of a surplus funds program. Borrowings under this program are unsecured and bear interest at variable rates ranging from 0.10%0.35% to 0.90%1.4% as of November 30, 2017,2018, and are due upon demand. Borrowings under these notes totaled $104.2$51.7 million as of November 30, 2017.2018.
Covenants
Our long-term debt is unsecured; however, restrictive covenants under various debt agreements have requirements for maintenance of minimum consolidated net worth and other financial ratios. We were in compliance with all debt covenants and restrictions as of November 30, 2017.2018. Based on our current 20182019 projections, we expect continued covenant compliance in the near term.
In September 2015, we amended all outstanding notes to conform the financial covenants applicable thereto to those of our amended and restated five-year, unsecured, revolving credit facility. The amended notes provide that if our ratio of consolidated funded debt to consolidated cash flow is greater than a ratio of 3.0 to 1.0, the interest rate on all outstanding notes will be increased by 0.25% until the ratio becomes 3.0 or less. During the three months ended November 30, 2017,2018, and 2016,2017, our ratio of funded debt to consolidated cash flow remained below 3.0 to 1.0.
Patronage and Equity Redemptions
In accordance with our bylaws and upon approval ofby our Board of Directors, annual net earnings from patronage sources are distributed to consenting patrons following the close of each fiscal year. For the year ended August 31, 2017,2018, our Board of Directors authorized onlydistributions of $420.3 million, with qualified cash distributions of $75.0 million and non-qualified equity distributions of $345.3 million.
In accordance with no cash patronage.
As authorized byauthorization from our Board of Directors, in September 2017, we intendexpect total redemptions related to redeem individual member owned equitythe year ended August 31, 2018, that will be distributed in fiscal 2018, in an amount not2019, to exceed $10be approximately $75.0 million. During the three months ended November 30, 2017, $1.62018, $24.1 million of that amount was redeemed in cash, compared to $9.5$3.7 million redeemed in cash during the three months ended November 31, 2016. In addition, $2.1 million of equities related to the Board of Director authorized fiscal 2017 redemption were redeemed during the three months ended November 30, 2017, due to the administrative timing of the payments.
Preferred Stock
The following is a summary of our outstanding preferred stock as of November 30, 2017,2018, all shares of which are listed on the Global Select Market of Nasdaq:
|
| | | | | | | | | | | | | | | | | | | | | | |
| | | Nasdaq symbol | | Issuance date | | Shares outstanding | | Redemption value | | Net proceeds (a) | | Dividend rate (b) (c) | | Dividend payment frequency | | Redeemable beginning (d) |
| | | | | | | | | (Dollars in millions) | | | | | | |
| 8% Cumulative Redeemable | | CHSCP | | (e) | | 12,272,003 |
| | $ | 306.8 |
| | $ | 311.2 |
| | 8.00 | % | | Quarterly | | 7/18/2023 |
| Class B Cumulative Redeemable, Series 1 | | CHSCO | | (f) | | 21,459,066 |
| | $ | 536.5 |
| | $ | 569.3 |
| | 7.875 | % | | Quarterly | | 9/26/2023 |
| Class B Reset Rate Cumulative Redeemable, Series 2 | | CHSCN | | 3/11/2014 | | 16,800,000 |
| | $ | 420.0 |
| | $ | 406.2 |
| | 7.10 | % | | Quarterly | | 3/31/2024 |
| Class B Reset Rate Cumulative Redeemable, Series 3 | | CHSCM | | 9/15/2014 | | 19,700,000 |
| | $ | 492.5 |
| | $ | 476.7 |
| | 6.75 | % | | Quarterly | | 9/30/2024 |
| Class B Cumulative Redeemable, Series 4 | | CHSCL | | 1/21/2015 | | 20,700,000 |
| | $ | 517.5 |
| | $ | 501.0 |
| | 7.50 | % | | Quarterly | | 1/21/2025 |
| |
(a) | Includes patrons' equities redeemed with preferred stock. |
| |
(b) | The Class B Reset Rate Cumulative Redeemable Preferred Stock, Series 2 accumulates dividends at a rate of 7.10% per year until March 31, 2024, and then at a rate equal to the three-month LIBOR plus 4.298%, not to exceed 8.00% per annum, subsequent to March 31, 2024. |
| |
(c) | The Class B Reset Rate Cumulative Redeemable Preferred Stock, Series 3 accumulates dividends at a rate of 6.75% per year until September 30, 2024, and then at a rate equal to the three-month LIBOR plus 4.155%, not to exceed 8.00% per annum, subsequent to September 30, 2024. |
| |
(d) | Preferred stock is redeemable for cash at our option, in whole or in part, at a per share price equal to the per share liquidation preference of $25.00 per share, plus all dividends accumulated and unpaid on that share to and including the date of redemption, beginning on the dates set forth in this column. |
| |
(e) | The 8% Cumulative Redeemable Preferred Stock was issued at various times from 2003 through 2010. |
| |
(f) | Shares of Class B Cumulative Redeemable Preferred Stock, Series 1 were issued on September 26, 2013,2013; August 25, 2014,2014; March 31, 2016,2016; and March 30, 2017. |
Dividends paid on our preferred stock during each of the three months ended November 30, 2017,2018, and 2016,2017, were $42.2 million and $41.8 million, respectively.million.
Off-Balance Sheet Financing Arrangements
Operating Leases
MinimumOur minimum future lease payments required under noncancelable operating leases aspresented in Management’s Discussion and Analysis of Financial Condition and Results of Operations in our Annual Report on Form 10-K for the year ended August 31, 2018, have not materially changed during the three months ended November 30, 2017, were $317.1 million.2018.
Guarantees
We are a guarantor for lines of credit and performance obligations of related companies. As of November 30, 2017,2018, our bank covenants allowed maximum guarantees of $1.0 billion, of which $101.4$151.3 million were outstanding. We have collateral for a portion of these contingent obligations. We have not recorded a liability related to the contingent obligations as we do not expect to pay out any cash related to them, and the fair values are considered immaterial. The underlying loans to the counterparties for which we provide guarantees were current as of November 30, 2017.
Debt
We have no material off balanceoff-balance sheet debt.
Receivables Securitization Facility and Loan Participations
InDuring fiscal 2017,2018, we engaged in off-balance sheet arrangements through our Securitization Facility and certain loan participation agreements. In the fourth quarter of fiscal 2018, we amended the Securitization Facility so that the transfer of Receivables is accounted for as a secured borrowing. Refer to further details about these arrangements in Note 2,4, Receivables, of the notes to the consolidated financial statements that are included in this Quarterly Report on Form 10-Q and our Annual Report on Form 10-K for the year ended August 31, 2017, for additional information.2018,
Contractual Obligations
Our contractual obligations presented in Management’s Discussion and Analysis of Financial Condition and Results of Operations in our Annual Report on Form 10-K for the year ended August 31, 2017,2018, have not materially changed during the three months ended November 30, 2017.2018.
Critical Accounting Policies
OurOther than as described within the Changes to Significant Accounting Policies section of Note 1, Basis of Presentation and Significant Accounting Policies, included in the notes to these consolidated financial statements, our critical accounting policies as presented in Management’s Discussion and Analysis of Financial Condition and Results of Operations in our Annual Report on Form 10-K for the year ended August 31, 2017,2018, have not materially changed during the three months ended November 30, 2017.2018.
Effect of Inflation and Foreign Currency Transactions
We believe that inflation and foreign currency fluctuations have not had a material effect on our operations since we conduct an insignificant portion of our business in foreign currencies.
Recent Accounting Pronouncements
See Note 1, Organization, Basis of Presentation and Significant Accounting Policies, to our unaudited consolidated financial statements included in this Quarterly Report on Form 10-Q for a description of the recent accounting pronouncements that are applicable to us.
ITEM 3. QUANTITATIVE AND QUALITATIVE DISCLOSURES ABOUT MARKET RISK
We did not experience any material changes in market risk exposures for the period ended November 30, 2017,2018, that affect the quantitative and qualitative disclosures presented in our Annual Report on Form 10-K for the year ended August 31, 2017.2018.
ITEM 4. CONTROLS AND PROCEDURES
Evaluation of Disclosure Controls and Procedures
Under the supervision and with the participation of our management, including our Chief Executive Officer and Chief Financial Officer, we evaluated the effectiveness of our disclosure controls and procedures (as defined in Rule 13a-15(e)) under the Securities Exchange Act of 1934 (the "Exchange Act") as of November 30, 2017.2018. Based on that evaluation, our Chief Executive Officer and Chief Financial Officer concluded that, as of that date, our disclosure controls and procedures were effective.not effective because of the material weaknesses in our internal control over financial reporting disclosed within Management's Annual Report on Internal Control Over Financial Reporting in Item 9A of our Annual Report on Form 10-K for the year ended August 31, 2018.
On December 1, 2015,Status of Remediation of Material Weaknesses in Internal Control Over Financial Reporting
We are in the process of identifying, developing and deploying various actions to make the necessary improvements to our internal controls to remediate the existing material weaknesses. The actions we began implementationare taking are subject to ongoing senior management review, as well as oversight by the Audit Committee and Board of a newDirectors. These remediation actions include: (i) redesigning and/or enhancing control activities related to preparation and review of account reconciliations and journal entries related to our grain marketing operations; (ii) redesigning and implementing enhanced control activities related to intercompany transactions; (iii) developing additional training programs for our finance, accounting, operations, information technology ("IT") and other necessary personnel; (iv) evaluating the quality of and sufficiency of our finance, accounting and other internal control personnel and resources; (v) establishing the appropriate roles and responsibilities within our organization to improve our knowledge and expertise over internal control over financial reporting; (vi) establishing IT project testing oversight and management; and (vii) evaluating the manual and automated IT control environment surrounding critical enterprise resource planning (“ERP”("ERP") systems, including the new ERP system, to determine potential improvements to those internal controls.
We believe the measures described above will remediate the material weaknesses we have identified and strengthen our internal control over financial reporting. We are committed to continuing to improve our internal control processes and will continue to review, optimize and enhance our financial reporting controls and procedures. As we continue to evaluate and work to improve our internal control over financial reporting, we may take additional measures to address control deficiencies, or we may modify, or in appropriate circumstances not complete, certain of the remediation measures described above. These material weaknesses will not be considered remediated until the applicable remedial controls operate for a sufficient period of time and management has concluded, through testing, that these controls are operating effectively.
Changes in Internal Control Over Financial Reporting
There were no changes in our internal control over financial reporting (as defined in Rule 13a-15(f) under the Exchange Act) during the quarter ended November 30, 2018, that have materially affected, or are reasonably likely to materially affect, our internal control over financial reporting.
We are in the process of implementing an ERP system. The new ERP system is expected to take several years to fully implement and has and will continue to require significant capital and human resources to deploy. The implementation of the new ERP system will affect the processes that constitute our internal control over financial reporting (as defined in Rule 13a-15(f) under the Exchange Act), and our management has taken steps to ensure that appropriate controls are designed and implemented as each functional area of the new ERP system is enacted.deployed.
Other than as described above, there were no changes in our internal control over financial reporting during the quarter ended November 30, 2017, that have materially affected, or are reasonably likely to materially affect, our internal control over financial reporting.
PART II. OTHER INFORMATION
ITEM 1. LEGAL PROCEEDINGS
We are involved as a defendant in various lawsuits, claims and disputes, which are in the normal course of our business. The resolution of any such matters may affect consolidated net income for any fiscal period; however, our management believes any resulting liabilities, individually or in the aggregate, will not have a material effect on our consolidated financial position, results of operations or cash flows during any fiscal year.
Laurel
On May 17, 2016, and October 12, 2016, the Montana Department of Environmental Quality (“MDEQ”) issued violation letters to us, alleging that certain specified air emissions at our Laurel, Montana refinery exceeded amounts allowable under the refinery’s permits and applicable law. On June 1, 2016, and November 3, 2016, we responded to MDEQ and described the actions that we had taken in connection with those allegations. On August 30, 2017, MDEQ sent us a letter requesting that we execute an administrative order on consent, and pay an administrative penalty of $184,550. On September 27, 2017, we sent MDEQ a letter providing additional information and requesting that MDEQ reconsider the alleged violations and reduce the proposed penalty with respect to four of the alleged violations described in the violation letters. We also requested changes to the administrative order on consent to remove references to the Administrative Rules of the State of Montana. We are currently awaiting MDEQ’s response to the September 2017 letter.
For information regarding our other reportable legal proceedings, see Item 3 of our Annual Report on Form 10-K for the year ended August 31, 2017.
ITEM 1A. RISK FACTORS
There were no material changes to our risk factors during the period covered by this report. See the discussion of risk factors in Item 1A of our Annual Report on Form 10-K for the year ended August 31, 2017.2018.
ITEM 6. EXHIBITS
|
| |
| Exhibit | Description |
| Omnibus Amendment No. 3, dated as of September 4, 2018, by and among Cofina Funding, LLC, as seller, CHS Inc., as servicer and as an originator, CHS Capital, LLC, as an originator, the conduit purchasers, committed purchasers and purchaser agents set forth on the signature pages thereto, the Bank of Tokyo-Mitsubishi UFJ, Ltd., New York Branch, as administrative agent, and U.S. Bank National Association, as custodian. (Incorporated by reference to Exhibit 10.36C to our Form 10-K for the year ended August 31, 2018, filed December 3, 2018).
|
| Master Framework Agreement, dated as of September 4, 2018 (the "Framework Agreement"), by and among, MUFG Bank, Ltd. (f/k/a The Bank of Tokyo-Mitsubishi UFJ, Ltd.) and each other financial institution from time to time party thereto, as MFA Buyers, MUFG Bank, Ltd., as agent for the MFA Buyers, CHS Inc. and CHS Capital, LLC, as sellers, and CHS Inc., as agent for the sellers. (Incorporated by reference to Exhibit 10.39 to our Form 10-K for the year ended August 31, 2018, filed December 3, 2018).
|
| 1996 SIFMA Master Repurchase Agreement, dated as of September 4, 2018, between CHS Inc. and the buyer under the Framework Agreement, including Annex I thereto (and as amended thereby). (Incorporated by reference to Exhibit 10.40 to our Form 10-K for the year ended August 31, 2018, filed December 3, 2018).
|
| 1996 SIFMA Master Repurchase Agreement, dated as of September 4, 2018, between CHS Capital, LLC and the buyer under the Framework Agreement, including Annex I thereto (and as amended thereby). (Incorporated by reference to Exhibit 10.41 to our Form 10-K for the year ended August 31, 2018, filed December 3, 2018).
|
| Guaranty, dated as of September 4, 2018, by CHS Inc. in favor of the buyer under the Framework Agreement. (Incorporated by reference to Exhibit 10.42 to our Form 10-K for the year ended August 31, 2018, filed December 3, 2018).
|
| Certification of the Chief Executive Officer Pursuant to Section 302 of the Sarbanes-Oxley Act of 2002 |
| Certification of the Chief Financial Officer Pursuant to Section 302 of the Sarbanes-Oxley Act of 2002 |
| Certification of the Chief Executive Officer Pursuant to 18 U.S.C. Section 1350, as Adopted Pursuant to Section 906 of the Sarbanes-Oxley Act of 2002 |
| Certification of the Chief Financial Officer Pursuant to 18 U.S.C. Section 1350, as Adopted Pursuant to Section 906 of the Sarbanes-Oxley Act of 2002 |
| The following financial information from CHS Inc.’s Quarterly Report on Form 10-Q for the quarterly period ended November 30, 2017,2018, formatted in Extensible Business Reporting Language (XBRL): (i) the Consolidated Statements of Operations,Balance Sheets, (ii) the Consolidated Statements of Comprehensive Income,Operations, (iii) the Consolidated Balance Sheets,Statements of Comprehensive Income, (iv) the Consolidated Statements of Cash Flows, and (v) the Notes to the Consolidated Financial Statements. |
SIGNATURES
Pursuant to the requirements of the Securities Exchange Act of 1934, as amended, the registrant has duly caused this report to be signed on its behalf by the undersigned, thereunto duly authorized.
CHS Inc.
(Registrant)
|
| | | | | |
| Date: | January 10, 20182019 | | By: | | /s/ Timothy Skidmore |
| | | | | | Timothy Skidmore |
| | | | | | Executive Vice President and Chief Financial Officer |