UNITED STATES SECURITIES AND EXCHANGE COMMISSION
Washington, D.C. 20549
Form 10-Q
|
| | | |
| þ | | Quarterly Report pursuant to Section 13 or 15(d) of the Securities Exchange Act of 1934 for the quarterly period ended February 28,November 30, 2019. |
| or |
| o | | Transition Report pursuant to Section 13 or 15(d) of the Securities Exchange Act of 1934 for the transition period from to |
Commission file number: 001-36079
CHS Inc.
(Exact name of registrantRegistrant as specified in its charter)
|
| | |
Minnesota (State or other jurisdiction of incorporation or organization) | | 41-0251095 (I.R.S. Employer Identification Number) |
| | | |
5500 Cenex Drive Inver Grove Heights, Minnesota 55077 (Address of principal executive offices, including zip code) | | (651) 355-6000 (Registrant’s telephone number, including area code) |
Securities registered pursuant to Section 12(b) of the Act:
|
| | |
| Title of each class | Trading Symbol(s) | Name of each exchange on which registered |
| 8% Cumulative Redeemable Preferred Stock | CHSCP | The Nasdaq Stock Market LLC |
| Class B Cumulative Redeemable Preferred Stock, Series 1 | CHSCO | The Nasdaq Stock Market LLC |
| Class B Reset Rate Cumulative Redeemable Preferred Stock, Series 2 | CHSCN | The Nasdaq Stock Market LLC |
| Class B Reset Rate Cumulative Redeemable Preferred Stock, Series 3 | CHSCM | The Nasdaq Stock Market LLC |
| Class B Cumulative Redeemable Preferred Stock, Series 4 | CHSCL | The Nasdaq Stock Market LLC |
Indicate by check mark whether the Registrant (1) has filed all reports required to be filed by Section 13 or 15(d) of the Securities Exchange Act of 1934 during the preceding 12 months (or for such shorter period that the registrantRegistrant was required to file such reports), and (2) has been subject to such filing requirements for the past 90 days.
YES þ NO o
Indicate by check mark whether the Registrant has submitted electronically every Interactive Data File required to be submitted pursuant to Rule 405 of Regulation S-T (§232.405 of this chapter) during the preceding 12 months (or for such shorter period that the Registrant was required to submit such files).
YES þ NO o
Indicate by check mark whether the Registrant is a large accelerated filer, an accelerated filer, a non-accelerated filer, a smaller reporting company, or an emerging growth company. See the definitions of "large accelerated filer," "accelerated filer," "smaller reporting company," and "emerging growth company" in Rule 12b-2 of the Exchange Act.
|
| | | | |
Large accelerated filer o | Accelerated filer o | Non-accelerated filer þ | Smaller reporting company o | Emerging growth company o |
If an emerging growth company, indicate by check mark if the Registrant has elected not to use the extended transition period for complying with any new or revised financial accounting standards provided pursuant to Section 13(a) of the Exchange Act. o
Indicate by check mark whether the Registrant is a shell company (as defined in Rule 12b-2 of the Exchange Act).
YES o NO þ
Indicate the number of shares outstanding of each of the Registrant’sRegistrant's classes of common stock, as of the latest practicable date:
The Registrant has no common stock outstanding.
INDEX
Unless the context otherwise requires, for purposes of this Quarterly Report on Form 10-Q, the words "CHS," "we," "us," "our," the "Company" and "CHS""us" or "our" refer to CHS Inc., a Minnesota cooperative corporation, and its subsidiaries as of February 28, 2019.November 30, 2019.
FORWARD-LOOKING STATEMENTS
This Quarterly Report on Form 10-Q contains and our other publicly available documents may contain, and our officers, directors and other representatives may from time to time make, "forward-looking statements" within the meaning of the safe harbor provisions of the U.S. Private Securities Litigation Reform Act of 1995. Forward-looking statements can be identified by words such as "anticipate," "intend," "plan," "goal," "seek," "believe," "project," "estimate," "expect," "strategy," "future," "likely," "may," "should," "will" and similar references to future periods. Forward-looking statements are neither historical facts nor assurances of future performance. Instead, they are based only on our current beliefs, expectations and assumptions regarding the future of our businesses, financial condition and results of operations, future plans and strategies, projections, anticipated events and trends, the economy and other future conditions. Because forward-looking statements relate to the future, they are subject to inherent uncertainties, risks and changes in circumstances that are difficult to predict and many of which are outside of our control. Our actual results and financial condition may differ materially from those indicated in the forward-looking statements. Therefore, you should not place undue reliance on any of these forward-looking statements. Important factors that could cause our actual results and financial condition to differ materially from those indicated in the forward-looking statements are discussed or identified in our public filings made with the U.S. Securities and Exchange Commission, including in the "Risk Factors" discussion in Item 1A of our Annual Report on Form 10-K for the year ended August 31, 2018.2019. Any forward-looking statements made by us in this Quarterly Report on Form 10-Q are based only on information currently available to us and speak only as of the date on which the statement is made. We undertake no obligation to publicly update any forward-looking statement, whether written or oral, that may be made from time to time, whether as a result of new information, future developments or otherwise, except as required by applicable law.
PART I. FINANCIAL INFORMATION
ITEM 1. FINANCIAL STATEMENTS
CHS INC. AND SUBSIDIARIES
CONDENSED CONSOLIDATED BALANCE SHEETS
(Unaudited)
| | | | February 28,
2019 | | August 31,
2018 | November 30,
2019 | | August 31,
2019 |
| | (Dollars in thousands) | (Dollars in thousands) |
| ASSETS | | | | | | |
| Current assets: | |
| |
|
| |
| |
|
|
| Cash and cash equivalents | $ | 367,307 |
| | $ | 450,617 |
| $ | 192,761 |
| | $ | 211,179 |
|
| Receivables | 2,227,064 |
| | 2,460,401 |
| 2,631,374 |
| | 2,731,209 |
|
| Inventories | 3,554,780 |
| | 2,768,649 |
| 3,368,868 |
| | 2,854,288 |
|
| Derivative assets | 251,645 |
| | 329,757 |
| |
| Margin and related deposits | 141,179 |
| | 151,150 |
| |
| Supplier advance payments | 603,370 |
| | 288,423 |
| |
| Other current assets | 245,354 |
| | 244,208 |
| 980,904 |
| | 865,919 |
|
| Total current assets | 7,390,699 |
| | 6,693,205 |
| 7,173,907 |
| | 6,662,595 |
|
| Investments | 3,718,097 |
| | 3,711,925 |
| 3,713,201 |
| | 3,683,996 |
|
| Property, plant and equipment | 5,016,202 |
| | 5,141,719 |
| 5,086,628 |
| | 5,088,708 |
|
| Other assets | 811,176 |
| | 834,329 |
| 1,240,555 |
| | 1,012,195 |
|
| Total assets | $ | 16,936,174 |
| | $ | 16,381,178 |
| $ | 17,214,291 |
| | $ | 16,447,494 |
|
| LIABILITIES AND EQUITIES | | | | | | |
| Current liabilities: | |
| | |
| |
| | |
|
| Notes payable | $ | 2,643,191 |
| | $ | 2,272,196 |
| $ | 2,170,924 |
| | $ | 2,156,108 |
|
| Current portion of long-term debt | 167,804 |
| | 167,565 |
| 28,231 |
| | 39,210 |
|
| Customer margin deposits and credit balances | 132,633 |
| | 137,395 |
| |
| Customer advance payments | 735,875 |
| | 409,088 |
| |
| Accounts payable | 1,629,511 |
| | 1,844,489 |
| 2,447,610 |
| | 1,931,415 |
|
| Derivative liabilities | 215,720 |
| | 438,465 |
| |
| Accrued expenses | 393,933 |
| | 511,032 |
| 467,765 |
| | 555,323 |
|
| Dividends and equities payable | 339,585 |
| | 153,941 |
| |
| Other current liabilities | | 1,066,902 |
| | 901,651 |
|
| Total current liabilities | 6,258,252 |
| | 5,934,171 |
| 6,181,432 |
| | 5,583,707 |
|
| Long-term debt | 1,744,502 |
| | 1,762,690 |
| 1,725,837 |
| | 1,749,901 |
|
| Long-term deferred tax liabilities | 220,857 |
| | 182,770 |
| |
| Other liabilities | 310,334 |
| | 336,519 |
| 684,106 |
| | 496,356 |
|
| Commitments and contingencies (Note 15) |
|
| |
|
| |
| Commitments and contingencies (Note 13) | |
|
| |
|
|
| Equities: | |
| | |
| |
| | |
|
| Preferred stock | 2,264,038 |
| | 2,264,038 |
| 2,264,038 |
| | 2,264,038 |
|
| Equity certificates | 4,524,928 |
| | 4,609,456 |
| 4,897,197 |
| | 4,988,877 |
|
| Accumulated other comprehensive loss | (189,348 | ) | | (199,915 | ) | (228,571 | ) | | (226,933 | ) |
| Capital reserves | 1,794,279 |
| | 1,482,003 |
| 1,681,597 |
| | 1,584,158 |
|
| Total CHS Inc. equities | 8,393,897 |
| | 8,155,582 |
| 8,614,261 |
| | 8,610,140 |
|
| Noncontrolling interests | 8,332 |
| | 9,446 |
| 8,655 |
| | 7,390 |
|
| Total equities | 8,402,229 |
| | 8,165,028 |
| 8,622,916 |
| | 8,617,530 |
|
| Total liabilities and equities | $ | 16,936,174 |
| | $ | 16,381,178 |
| $ | 17,214,291 |
| | $ | 16,447,494 |
|
The accompanying notes are an integral part of the condensed consolidated financial statements (unaudited).
CHS INC. AND SUBSIDIARIES
CONDENSED CONSOLIDATED STATEMENTS OF OPERATIONS
(Unaudited)
|
| | | | | | | | | | | | | | | |
| | For the Three Months Ended
February 28, | | For the Six Months Ended February 28, |
| | 2019 | | (As Restated) 2018 | | 2019 | | (As Restated) 2018 |
| | (Dollars in thousands) |
| Revenues | $ | 6,483,539 |
| | $ | 6,980,153 |
| | $ | 14,967,828 |
| | $ | 15,012,037 |
|
| Cost of goods sold | 6,056,126 |
| | 6,845,184 |
| | 14,069,774 |
| | 14,556,576 |
|
| Gross profit | 427,413 |
| | 134,969 |
| | 898,054 |
| | 455,461 |
|
| Marketing, general and administrative | 177,429 |
| | 187,558 |
| | 339,925 |
| | 327,904 |
|
| Reserve and impairment charges (recoveries), net | 339 |
| | (11,346 | ) | | (6,014 | ) | | (15,133 | ) |
| Operating earnings (loss) | 249,645 |
| | (41,243 | ) | | 564,143 |
| | 142,690 |
|
| (Gain) loss on disposal of business | — |
| | (7,705 | ) | | (1,412 | ) | | (7,705 | ) |
| Interest expense | 41,269 |
| | 40,176 |
| | 80,177 |
| | 80,878 |
|
| Other (income) loss | (11,763 | ) | | (12,544 | ) | | (35,485 | ) | | (38,739 | ) |
| Equity (income) loss from investments | (41,716 | ) | | (39,441 | ) | | (108,224 | ) | | (77,803 | ) |
| Income (loss) before income taxes | 261,855 |
| | (21,729 | ) | | 629,087 |
| | 186,059 |
|
| Income tax expense (benefit) | 13,551 |
| | (187,688 | ) | | 33,668 |
| | (167,082 | ) |
| Net income (loss) | 248,304 |
| | 165,959 |
| | 595,419 |
| | 353,141 |
|
| Net income (loss) attributable to noncontrolling interests | (462 | ) | | (48 | ) | | (851 | ) | | (512 | ) |
| Net income (loss) attributable to CHS Inc. | $ | 248,766 |
| | $ | 166,007 |
| | $ | 596,270 |
| | $ | 353,653 |
|
|
| | | | | | | |
| | Three Months Ended November 30, |
| | 2019 | | 2018 |
| | (Dollars in thousands) |
| Revenues | $ | 7,621,485 |
| | $ | 8,484,289 |
|
| Cost of goods sold | 7,295,942 |
| | 8,013,648 |
|
| Gross profit | 325,543 |
| | 470,641 |
|
| Marketing, general and administrative expenses | 168,331 |
| | 156,143 |
|
| Operating earnings | 157,212 |
| | 314,498 |
|
| Interest expense | 34,971 |
| | 38,908 |
|
| Other income | (13,498 | ) | | (25,134 | ) |
| Equity income from investments | (49,662 | ) | | (66,508 | ) |
| Income before income taxes | 185,401 |
| | 367,232 |
|
| Income tax expense | 6,664 |
| | 20,117 |
|
| Net income | 178,737 |
| | 347,115 |
|
| Net income (loss) attributable to noncontrolling interests | 855 |
| | (389 | ) |
| Net income attributable to CHS Inc. | $ | 177,882 |
| | $ | 347,504 |
|
The accompanying notes are an integral part of the condensed consolidated financial statements (unaudited).
CHS INC. AND SUBSIDIARIES
CONDENSED CONSOLIDATED STATEMENTS OF COMPREHENSIVE INCOME
(Unaudited)
|
| | | | | | | | | | | | | | | |
| | For the Three Months Ended
February 28, | | For the Six Months Ended February 28, |
| | 2019 | | (As Restated) 2018 | | 2019 | | (As Restated) 2018 |
| | (Dollars in thousands) |
| Net income (loss) | $ | 248,304 |
| | $ | 165,959 |
| | $ | 595,419 |
| | $ | 353,141 |
|
| Other comprehensive income (loss), net of tax: | | | | | | | |
| Postretirement benefit plan activity | 2,002 |
| | 3,142 |
| | 4,103 |
| | 4,736 |
|
| Unrealized net gain (loss) on available for sale investments | — |
| | 3,554 |
| | — |
| | 7,194 |
|
| Cash flow hedges | 9,969 |
| | 1,063 |
| | 8,662 |
| | 1,059 |
|
| Foreign currency translation adjustment | 2,913 |
| | 2,352 |
| | 2,508 |
| | 141 |
|
| Other comprehensive income (loss), net of tax | 14,884 |
| | 10,111 |
| | 15,273 |
| | 13,130 |
|
| Comprehensive income (loss) | 263,188 |
| | 176,070 |
| | 610,692 |
| | 366,271 |
|
| Less: comprehensive income (loss) attributable to noncontrolling interests | (462 | ) | | (48 | ) | | (851 | ) | | (512 | ) |
| Comprehensive income (loss) attributable to CHS Inc. | $ | 263,650 |
| | $ | 176,118 |
| | $ | 611,543 |
| | $ | 366,783 |
|
|
| | | | | | | |
| | Three Months Ended November 30, |
| | 2019 | | 2018 |
| | (Dollars in thousands) |
| Net income | $ | 178,737 |
| | $ | 347,115 |
|
| Other comprehensive (loss) income, net of tax: | | | |
| Pension and other postretirement benefits | 5,073 |
| | 2,101 |
|
| Cash flow hedges | (5,872 | ) | | (1,307 | ) |
| Foreign currency translation adjustment | (839 | ) | | (405 | ) |
| Other comprehensive (loss) income, net of tax | (1,638 | ) | | 389 |
|
| Comprehensive income | 177,099 |
| | 347,504 |
|
| Comprehensive income (loss) attributable to noncontrolling interests | 855 |
| | (389 | ) |
| Comprehensive income attributable to CHS Inc. | $ | 176,244 |
| | $ | 347,893 |
|
The accompanying notes are an integral part of the condensed consolidated financial statements (unaudited).
CHS INC. AND SUBSIDIARIES
CONDENSED CONSOLIDATED STATEMENTS OF CASH FLOWS
(Unaudited)
|
| | | | | | | |
| | For the Six Months Ended February 28, |
| | 2019 | | (As Restated) 2018 |
| | (Dollars in thousands) |
| Cash flows from operating activities: | |
| | |
|
| Net income (loss) | $ | 595,419 |
| | $ | 353,141 |
|
| Adjustments to reconcile net income to net cash provided by (used in) operating activities: | |
| | |
|
| Depreciation and amortization | 233,628 |
| | 240,349 |
|
| Amortization of deferred major repair costs | 38,283 |
| | 32,839 |
|
| Equity (income) loss from investments | (108,224 | ) | | (77,803 | ) |
| Distributions from equity investments | 113,164 |
| | 78,461 |
|
| Provision for doubtful accounts | 6,988 |
| | (3,625 | ) |
| Gain and recovery on disposal of business | (1,534 | ) | | (24,236 | ) |
| Deferred taxes | 33,439 |
| | (169,455 | ) |
| Other, net | 3,332 |
| | 16,236 |
|
| Changes in operating assets and liabilities, net of acquisitions: | |
| | |
|
| Receivables | 177,334 |
| | 199,227 |
|
| Inventories | (786,527 | ) | | (1,077,185 | ) |
| Derivative assets | 89,524 |
| | (24,527 | ) |
| Margin and related deposits | 9,939 |
| | 17,895 |
|
| Supplier advance payments | (314,947 | ) | | (409,581 | ) |
| Other current assets and other assets | 12,543 |
| | (1,654 | ) |
| Customer margin deposits and credit balances | (4,762 | ) | | (51,591 | ) |
| Customer advance payments | 326,788 |
| | 332,872 |
|
| Accounts payable and accrued expenses | (291,812 | ) | | (72,047 | ) |
| Derivative liabilities | (229,145 | ) | | 56,538 |
|
| Other liabilities | (28,681 | ) | | (58,252 | ) |
| Net cash provided by (used in) operating activities | (125,251 | ) | | (642,398 | ) |
| Cash flows from investing activities: | |
| | |
|
| Acquisition of property, plant and equipment | (177,991 | ) | | (142,886 | ) |
| Proceeds from disposition of property, plant and equipment | 25,680 |
| | 59,680 |
|
| Proceeds from sale of business | 1,730 |
| | 53,552 |
|
| Expenditures for major repairs | (2,634 | ) | | (2,832 | ) |
| Investments redeemed | 7,036 |
| | 6,496 |
|
| Changes in CHS Capital notes receivable, net | (30,508 | ) | | (25,846 | ) |
| Financing extended to customers | (6,660 | ) | | (66,014 | ) |
| Payments from customer financing | 79,809 |
| | 30,893 |
|
| Other investing activities, net | 5,275 |
| | (10,203 | ) |
| Net cash provided by (used in) investing activities | (98,263 | ) | | (97,160 | ) |
| Cash flows from financing activities: | |
| | |
|
| Proceeds from lines of credit and long-term debt borrowings | 12,360,325 |
| | 18,414,973 |
|
| Payments on lines of credit, long-term debt and capital lease obligations | (12,000,939 | ) | | (17,509,212 | ) |
| Preferred stock dividends paid | (84,334 | ) | | (84,334 | ) |
| Retirements of equities | (30,753 | ) | | (4,742 | ) |
| Cash patronage paid | (74,980 | ) | | — |
|
| Other financing activities, net | (30,332 | ) | | (55,861 | ) |
| Net cash provided by (used in) financing activities | 138,987 |
| | 760,824 |
|
| Effect of exchange rate changes on cash and cash equivalents | (2,051 | ) | | (2,372 | ) |
| Net increase (decrease) in cash and cash equivalents and restricted cash | (86,578 | ) | | 18,894 |
|
| Cash and cash equivalents and restricted cash at beginning of period | 543,940 |
| | 272,272 |
|
| Cash and cash equivalents and restricted cash at end of period | $ | 457,362 |
| | $ | 291,166 |
|
|
| | | | | | | |
| | Three Months Ended November 30, |
| | 2019 | | 2018 |
| | (Dollars in thousands) |
| Cash flows from operating activities: | |
| | |
|
| Net income | $ | 178,737 |
| | $ | 347,115 |
|
| Adjustments to reconcile net income to net cash provided by (used in) operating activities: | |
| | |
|
| Depreciation and amortization, including amortization of deferred major maintenance | 136,643 |
| | 137,779 |
|
| Equity income from investments, net of distributions received | (30,468 | ) | | (47,621 | ) |
| Provision for doubtful accounts | 1,775 |
| | 5,009 |
|
| Deferred taxes | (3,579 | ) | | 26,555 |
|
| Other, net | 8,341 |
| | (3,162 | ) |
| Changes in operating assets and liabilities, net of acquisitions: | |
| | |
|
| Receivables | 108,495 |
| | (182,767 | ) |
| Inventories | (514,580 | ) | | (416,196 | ) |
| Accounts payable and accrued expenses | 386,021 |
| | 299,741 |
|
| Other, net | (110,684 | ) | | (261,251 | ) |
| Net cash provided by (used in) operating activities | 160,701 |
| | (94,798 | ) |
| Cash flows from investing activities: | |
| | |
|
| Acquisition of property, plant and equipment | (131,808 | ) | | (104,750 | ) |
| Proceeds from disposition of property, plant and equipment | 3,015 |
| | 5,752 |
|
| Expenditures for major maintenance | (7,691 | ) | | (3,441 | ) |
| Changes in CHS Capital notes receivable, net | 15,195 |
| | (126,865 | ) |
| Financing extended to customers | (915 | ) | | (3,928 | ) |
| Payments from customer financing | 4,209 |
| | 71,137 |
|
| Other investing activities, net | 3,046 |
| | 7,319 |
|
| Net cash used in investing activities | (114,949 | ) | | (154,776 | ) |
| Cash flows from financing activities: | |
| | |
|
| Proceeds from notes payable and long-term debt | 5,414,395 |
| | 4,429,276 |
|
| Payments on notes payable, long-term debt and capital lease obligations | (5,445,420 | ) | | (4,317,479 | ) |
| Preferred stock dividends paid | (42,167 | ) | | (42,167 | ) |
| Redemptions of equities | (5,447 | ) | | (24,072 | ) |
| Other financing activities, net | 6,757 |
| | 3,503 |
|
| Net cash (used in) provided by financing activities | (71,882 | ) | | 49,061 |
|
| Effect of exchange rate changes on cash and cash equivalents | (1,153 | ) | | (1,535 | ) |
| Decrease in cash and cash equivalents and restricted cash | (27,283 | ) | | (202,048 | ) |
| Cash and cash equivalents and restricted cash at beginning of period | 299,675 |
| | 543,940 |
|
| Cash and cash equivalents and restricted cash at end of period | $ | 272,392 |
| | $ | 341,892 |
|
The accompanying notes are an integral part of the condensed consolidated financial statements (unaudited).
CHS INC. AND SUBSIDIARIES
NOTES TO CONDENSED CONSOLIDATED FINANCIAL STATEMENTS (Unaudited)
Note 1 Basis of Presentation and Significant Accounting Policies
Basis of Presentation
TheThese unaudited Consolidated Balance Sheet as of February 28, 2019, the Consolidated Statements of Operations for the three and six months ended February 28, 2019, and 2018, the Consolidated Statements of Comprehensive Income for the three and six months ended February 28, 2019, and 2018, and the Consolidated Statements of Cash Flows for the six months ended February 28, 2019, and 2018,condensed consolidated financial statements reflect, in the opinion of our management, all normal recurring adjustments necessary for a fair statement of theour financial position, results of operations and cash flows for the interim periods presented. The results of operations and cash flows for interim periods are not necessarily indicative of results for a full fiscal year because of among other things, the seasonal nature of our businesses.businesses, among other things. Our Consolidated Balance Sheet data as of August 31, 2018, has been derived from our auditedunaudited condensed consolidated financial statements but does not include all disclosures requiredand notes are presented as permitted by accounting principles generally accepted in the United States of America ("U.S. GAAP").
As described in Note 2, Restatement of Previously Issued Financial Information, the consolidated financial statementsrequirements for the threeQuarterly Reports on Form 10-Q and six months ended February 28, 2018, have been restated to reflect the correction of misstatements. We have also restated all relevant amounts impacted within the notes to the consolidated financial statements.
The notes to our consolidated financial statements reference our Energy, Ag and Nitrogen Production reportable segments, as well as our Corporate and Other category, which represents an aggregation of individually immaterial operating segments. See Note 12, Segment Reporting, for more information related to our reportable segments.
Our consolidated financial statements include the accounts of CHS and all of our wholly owned and majority owned subsidiaries. The effects of all significant intercompany transactions have been eliminated.
These unaudited consolidated financial statements should be read in conjunction with the consolidated financial statements and notes thereto for the year ended August 31, 2018,2019, included in our Annual Report on Form 10-K, filed with the Securities and Exchange Commission (the "SEC"("SEC").
Certain captions within the Condensed Consolidated Balance Sheets, Condensed Consolidated Statements of Operations and Condensed Consolidated Statements of Cash Flows have been combined within other captions as allowed by SEC financial statement reporting requirements under Regulation S-X. Prior year information has been revised to conform with the current presentation.
Significant Accounting Policies
The following significant accounting policies have beenpolicy was updated or changed since our Annual Report on Form 10-K for the year ended August 31, 2018, as a result of the adoption of certain new accounting pronouncements effective for us during the six months ended February 28, 2019.
Restricted CashLeases
Restricted cash is included in our Consolidated Balance Sheets within other current assets (current portion) and other assets (non-current portion), as appropriate, and primarily relates to customer deposits for futures and option contracts associated with regulated commodities held in separate accounts as required under federal and other regulations. Pursuant to the requirements of the Commodity Exchange Act, such funds must be carried in separate accounts that are designated as segregated customer accounts, as applicable. Restricted cash also includes funds held in escrow pursuant to applicable regulations limiting their usage.
The following table provides a reconciliation of cash and cash equivalents and restricted cash as reported within our Consolidated Balance Sheets that aggregates to the amount presented in our Consolidated Statements of Cash Flows. During the six months ended February 28, 2019, we updated the presentation of our Consolidated Statements of Cash Flows to include restricted cash with cash and cash equivalents when reconciling the beginning-of-period and end-of-period total amounts shown on our Consolidated Statements of Cash Flows.
|
| | | | | | | | | | | | | | | |
| | February 28, 2019 | | August 31, 2018 | | February 28, 2018 | | August 31, 2017 |
| | (Dollars in thousands) |
| Cash and cash equivalents | $ | 367,307 |
| | $ | 450,617 |
| | $ | 219,273 |
| | $ | 181,379 |
|
| Restricted cash included in other current assets | 89,371 |
| | 90,193 |
| | 68,600 |
| | 83,561 |
|
| Restricted cash included in other assets | 684 |
| | 3,130 |
| | 3,293 |
| | 7,332 |
|
| Total cash and cash equivalents and restricted cash | $ | 457,362 |
| | $ | 543,940 |
| | $ | 291,166 |
| | $ | 272,272 |
|
Investments
As described in the "Recent Accounting Pronouncements" section, below, we adopted Accounting Standards Update ("ASU") No. 2016-01,2016-02, Recognition and Measurement of Financial Assets and Financial LiabilitiesLeases, which was effective for us September 1, 2018. As a result, all equity securities that do not result in consolidation and are not accounted for under the equity method are measured at fair value with changes therein reflected in net income. We have elected to utilize the measurement alternative for equity investments that do not have readily determinable fair values and measure these investments at cost less impairment plus or minus observable price changes in orderly transactions.
Investments in other cooperatives are recorded in a manner similar to equity investments without readily determinable fair values, plus patronage dividends received in the form of capital stock and other equities. Patronage dividends are recorded as a reduction to cost of goods sold at the time qualified written notices of allocation are received. Investments in debt and equity instruments are carried at amounts that approximate fair values.
Revenue Recognition
We provide a wide variety of products and services, ranging from agricultural inputs such as fuels, farm supplies and crop nutrients, to agricultural outputs that include grain and oilseed, processed grains and oilseeds and food products, and ethanol production and marketing. Revenue is recognized when performance obligations under the terms of a contract with a customer are satisfied, which generally occurs when control of the goods has transferred to the customer. For the majority of our contracts with customers, control transfers to customers at a point-in-time when the goods/services have been delivered, as that is generally when legal title, physical possession and risks and rewards of goods/services transfer to the customer. In limited arrangements, control transfers over time as the customer simultaneously receives and consumes the benefits of the service as we complete the performance obligation(s).
Revenue is recognized at the transaction price that we expect to be entitled to in exchange for transferring goods or services to a customer, excluding amounts collected on behalf of third parties. We follow a policy of recognizing revenue at the point-in-time or over the period of time we satisfy our performance obligation by transferring control over a product or service to a customer in accordance with the underlying contract. For physically settled derivative sales contracts that are outside the scope of the revenue guidance, we recognize revenue when control of the inventory is transferred within the meaning of Accountingamended (collectively "Accounting Standards Codification ("ASC") Topic 606.842"), on September 1, 2019, using the modified retrospective approach. Our accounting policies and additional disclosures with respect to ASC Topic 842 are included in Note 14, Leases.
Recent Accounting Pronouncements
Except for the recent accounting pronouncements described below, other recent accounting pronouncements are not expected to have a material impact on our condensed consolidated financial statements.
Adopted
We adopted ASC Topic 842 as of September 1, 2019, using the modified retrospective approach. In March 2017,addition, we used the Financial Accounting Standards Board (the "FASB") issued ASU No. 2017-07, Compensation - Retirement Benefits (Topic 715): Improving the Presentationadditional optional transition method and package of Net Periodic Pension Costs and Net Postretirement Benefit Cost. This ASU changes the presentation of net periodic pension cost and net periodic postretirement benefit costpractical expedients in the Consolidated Statementsperiod of Operations. This ASU provides thatadoption without retrospective adjustment to previous periods presented, although we elected not to apply the service cost component should be included inhindsight practical expedient available under the same income statement line item as other compensation costs arising from services rendered bystandard. As a result of using the employees during the period. The other components of net periodic benefit cost (such as interest, expected return on plan assets, prior service cost amortization and actuarial gain/loss amortization) are required to be presented in the Consolidated Statements of Operations separately
outside of operating income. Additionally, only service cost may be capitalized in assets. This ASU was effective for us beginning September 1, 2018, for our fiscal year 2019 and for interim periods within that fiscal year. The guidance on the presentation of the components of net periodic benefit cost in the Consolidated Statements of Operations has been applied retrospectively, and the guidance regarding the capitalization of the service cost component in assets has been applied prospectively. The adoption of this guidance had no impact on previously reported income (loss) before income taxes or net income attributable to CHS; however, non-service cost components of net periodic benefit costs inmodified retrospective method, prior periods have not been reclassified from costrestated, and a $33.7 million cumulative-effect adjustment was recorded to increase the opening balance of goods sold and marketing, general and administrative expenses, and are now reported outside of operating income within other (income) loss. Refer to Note 2, Restatement of Previously Issued Financial Information, for the amounts of the retrospective adjustments recordedcapital reserves as a result of the adoption date related to recognition of this guidance.
In January 2017,previously deferred gains associated with the FASB issued ASU No. 2017-01, Business Combinations (sale-leaseback of our primary corporate office building located in Inver Grove Heights, Minnesota. Additionally, adoption of ASC Topic 805): Clarifying842 resulted in the Definitionrecognition of a Business. The amendments within this ASU narrow the existing definitionoperating lease right of a businessuse assets and provide a more robust framework for evaluating whether a transaction should be accounted forassociated lease liabilities of $268.4 million and $267.0 million, respectively, as an acquisition (or disposal) of assets or a business. The definition of a business impacts various areas of accounting, including acquisitions, disposals and goodwill. Under the new guidance, fewer acquisitions are expected to be considered businesses. This ASU was effective for us beginning September 1, 2018, for our fiscal year 2019 and for interim periods within that fiscal year. The guidance has been applied prospectively. The adoption2019. Adoption of this amended guidanceASC Topic 842 did not have a material impact on our consolidated financial statements.
In November 2016, the FASB issued ASU No. 2016-18, Statement of Cash Flows (Topic 230): Restricted Cash. This ASU requires restricted cash and restricted cash equivalents to be included with cash and cash equivalents when reconciling the beginning-of-period and end-of-period total amounts shown on theCondensed Consolidated Statements of Cash Flows as well as disclosure about the nature of restrictions on cash, cash equivalents and amounts generally described as restricted cash. Additionally, the guidance requires disclosure of the total amount of cash, cash equivalents and restricted cash for each comparative period for which a Consolidated Balance Sheet is presented. This ASU was effective for us beginning September 1, 2018, for our fiscal year 2019 and for interim periods within that fiscal year. The amendments in this ASU were applied retrospectively to all periods presented. Refer to the additional disclosures pertaining to restricted cash within the Restricted Cash significant accounting policy above. The adoption of this amended guidance did not have a material impact on our Consolidated Statements of Cash Flows.
In August 2016, the FASB issued ASU No. 2016-15, Statement of Cash Flows (Topic 230): Classification of Certain Cash Receipts and Cash Payments. This ASU is intended to reduce existing diversity in practice in how certain cash receipts and payments are presented and classified in theOperations or Condensed Consolidated Statements of Cash Flows. This ASU was effective for us beginning September 1, 2018, for our fiscal year 2019Additional information and for interim periods within that fiscal year. The adoption of this amended guidance did not have a material impact on our Consolidated Statements of Cash Flows.
In January 2016, the FASB issued ASU No. 2016-01, Recognition and Measurement of Financial Assets and Financial Liabilities, which requires equity investments (except those accounted for under the equity method of accounting or those that result in consolidation of the investee) to be measured at fair value with changes in fair value recognized in net income. This guidance eliminates the previous cost method of accounting for certain equity securities that did not have readily determinable fair values. This guidance also simplifies the impairment assessment and allows for a fair value measurement alternative for equity investments without readily determinable fair values and includes presentation and disclosure changes. This ASU was effective for us beginning September 1, 2018, for our fiscal year 2019 and for interim periods within that fiscal year and was applied following a prospective basis. We have elected to utilize the measurement alternative for equity investments that do not have readily determinable fair values and measure these investments at cost less impairment plus or minus observable price changes in orderly transactions. As a result of the adoption of this amended guidance, we reclassified approximately $4.7 million from accumulated other comprehensive loss to the opening balance of capital reserves within our Consolidated Balance Sheet as of September 1, 2018, which did not have a material impact on our consolidated financial statements.
In May 2014, the FASB issued ASU No. 2014-09, Revenue from Contracts withCustomers (Topic 606). The amendments within this ASU, as well as within the additional clarifying ASUs issued by the FASB, provide a single comprehensive model to be used to determine the measurement of revenue and timing of recognition for revenue arising from contracts with customers. The core principle of the amended guidance is that an entity should recognize revenue to depict the transfer of promised goods or services to customers in an amount that reflects the consideration to which the entity expects to be entitled in exchange for those goods or services. The new revenue recognition guidance includes a five-step model for the recognition of revenue, including (1) identifying the contract with a customer, (2) identifying the performance obligations in the contract, (3) determining the transaction price, (4) allocating the transaction price to the performance obligations, and (5) recognizing revenue when (or as) an entity satisfies a performance obligation. This ASU was effective for us beginning September 1, 2018, for our fiscal year 2019 and for interim periods within that fiscal year, and we elected to apply the modified
retrospective method of adoption to all contracts as of the date of initial application. The majority of our revenues are attributable to forward commodity sales contracts, which are considered to be physically settled derivatives under ASC 815, Derivatives and Hedging (Topic 815). Revenues arising from derivative contracts accounted for under ASC 815 are specifically outside the scope of ASC Topic 606 and therefore not subject to the provisions of the new revenue recognition guidance. As such, the impact of adoption of the new revenue guidance has only been assessed for our revenue contracts that are not accounted for as derivative arrangements. The primary impact of adoption was changes to the timing of revenue recognition for certain revenue streams that had an immaterial impact. Following the modified retrospective method of adoption, we determined the cumulative effect of adoption for all contracts with customers that had not been completed as of the adoption date was less than $1.0 million. Additionally, the impact of applying ASC Topic 606 compared to previous guidance during the three and six months ended February 28, 2019, was an overall decrease to revenues of $9.6 million and $22.6 million, respectively. Other financial statement impacts related to the adoption of ASC Topic 606 were not material. Our revenue recognition accounting policy and additional informationfurther disclosures related to our revenue streamsleases and related performance obligations required to be satisfied in order to recognize revenue can be found within the Significant Accounting Policies section above andlease-related financial statement amounts is included within Note 3,14, Revenues.Leases.
Not Yet Adopted
In August 2018, the FASB issued ASU No. 2018-15, Intangibles - Goodwill and Other - Internal-Use Software: Customer’s Accounting for Implementation Costs Incurred in a Cloud Computing Arrangement That Is a Service Contract. This ASU reduces the complexity of accounting for implementation, setup and other upfront costs incurred in a cloud computing service arrangement that is hosted by a vendor. This ASU aligns the accounting for implementation costs of hosting arrangements, irrespective of whether the arrangements convey a license to the hosted software. This ASU permits either a prospective or retrospective transition approach. This ASU is effective for us beginning September 1, 2020, for our fiscal year 2021 and for interim periods within that fiscal year, with early adoption permitted. The adoption of this amended guidance is not expected to have a material impact on our consolidated financial statements.
In August 2018, the FASB issued ASU No. 2018-14, Disclosure Framework - Changes to the Disclosure Requirements for Defined Benefit Plans, which amends ASC 715-20, Compensation - Retirement Benefits - Defined Benefit Plans - General. This ASU modifies the disclosure requirements for employers that sponsor defined benefit pension or other postretirement plans by removing and adding certain disclosures for these plans. The eliminated disclosures include (a) the amounts in accumulated other comprehensive income expected to be recognized in net periodic benefit costs over the next fiscal year and (b) the effects of a one-percentage-point change in assumed health care cost trend rates on the net periodic benefit costs and the benefit obligation for postretirement health care benefits. The new disclosures include the interest crediting rates for cash balance plans and an explanation of significant gains and losses related to changes in benefit obligations. This ASU is effective for us beginning September 1, 2021, for our fiscal year 2022 and for interim periods within that fiscal year, with early adoption permitted. The adoption of this amended guidance is not expected to have a material impact on our consolidated financial statements.
In August 2018, the FASB issued ASU No. 2018-13, Disclosure Framework - Changes to the Disclosure Requirements for Fair Value Measurement, which amends ASC 820, Fair Value Measurement. This ASU modifies the disclosure requirements for fair value measurements by removing, modifying and adding certain disclosures. Specifically, the guidance removes the requirement to disclose the amount and reasons for any transfers between Level 1 and Level 2 of the fair value hierarchy and removes the requirement to disclose a description of the valuation processes used to value Level 3 fair value measurements. The guidance also requires additional disclosures surrounding Level 3 changes in unrealized gains/losses included in other comprehensive income as well as the range and weighted average of significant unobservable inputs calculation. This ASU is effective for us beginning September 1, 2020, for our fiscal year 2021 and for interim periods within that fiscal year. Early adoption is permitted. We elected to remove the disclosures permitted by ASU No. 2018-13 during the fourth quarter of fiscal 2018 but have not early adopted the new required additional disclosures, which is permitted by the guidance. The adoption of this amended guidance is not expected to have a material impact on our consolidated financial statements.
In June 2016, the FASBFinancial Accounting Standards Board issued ASU No. 2016-13, Financial Instruments - Credit Losses (Topic(ASC Topic 326): Measurement of Credit Losses on Financial Instruments. The amendments in this ASU introduce a new approach, based on expected losses, to estimate credit losses on certain types of financial instruments. This ASU is intended to provide financial statement users with more decision-useful information about the expected credit losses associated with most financial assets measured at amortized cost and certain other instruments, including trade and other receivables,
loans, held-to-maturity debt securities, net investments in leases and off-balance-sheet credit exposures. Entities are required to apply the provisions of this ASU as a cumulative-effect adjustment to retained earningscapital reserves as of the beginning of the first reporting period in which the guidance is adopted. This ASU is
effective for us beginning September 1, 2020, for our fiscal year 2021 and for interim periods within that fiscal year. We are currently evaluating the impact the adoption will have on our condensed consolidated financial statements.
In February 2016, the FASB issued ASU No. 2016-02, Leases (Topic 842), which replaces the existing guidance within ASC 840, Leases. The amendments within this ASU, as well as within additional clarifying ASUs issued by the FASB, introduce a lessee model requiring entities to recognize assets and liabilities for most leases, but continue recognizing the associated expenses in a manner similar to existing accounting guidance. In July 2018, the FASB issued ASU No. 2018-10, Codification Improvements to Topic 842, Leases, which amends ASU No. 2016-02, Leases. This ASU is effective for us beginning September 1, 2019, for our fiscal year 2020 and for interim periods within that fiscal year. We have initiated our assessment of the new lease standard, including the utilization of surveys to gather more information about existing leases and the implementation of a new lease software to improve the collection, maintenance and aggregation of lease data necessary for the expanded reporting and disclosure requirements under the new lease standard. It is expected that the primary impact upon adoption will be the recognition, on a discounted basis, of our minimum commitments under noncancelable operating leases as right of use assets and liabilities on our Consolidated Balance Sheets. This will result in a material increase in assets and liabilities recorded on our Consolidated Balance Sheets. Although we expect the new lease guidance will have a material impact on our Consolidated Balance Sheets, we are continuing to evaluate the practical expedient guidance provisions available and the extent of potential impacts on our consolidated financial statements, processes and internal controls.
Note 2 Restatement of Previously Issued Financial Information
The consolidated financial statements for the three and six months ended February 28, 2018, have been restated to reflect the correction of misstatements. We have also restated all amounts impacted within the notes to the consolidated financial statements. A description of the adjustments and their impact on the previously issued financial information are included below.
Descriptions of Restatement Adjustments
Restatement Background
During the preparation of our Annual Report on Form 10-K for the year ended August 31, 2018, we noted potentially excessive valuations in the net derivative asset valuations relating to certain rail freight contracts purchased in connection with our North American grain marketing operations. An investigation concluded that the rail freight misstatements included in our consolidated financial statements were due to intentional misconduct by a former employee in our rail freight trading operations, as well as due to rail freight contracts and certain non-rail contracts not meeting the technical accounting requirements to qualify as derivative financial instruments. The misconduct consisted of the former employee manipulating the mark-to-market valuation of rail cars that were the subject of rail freight purchase contracts and manipulating the quantity of rail cars included in the monthly mark-to-market valuation. In addition, the investigation revealed intentional misstatements were made by the former employee to our independent registered public accounting firm in connection with its audit of our consolidated financial statements for the fiscal year ended August 31, 2017. During the course of, and as a result of, the investigation, we terminated the former employee and have taken additional personnel actions.
As described in additional detail in the Explanatory Note in our Annual Report on Form 10-K for the year ended August 31, 2018, the Company restated its audited consolidated financial statements for the fiscal years ended August 31, 2017 and 2016, and our unaudited consolidated financial statements for the quarterly periods ended November 30, 2017 and 2016, February 28, 2018 and 2017, and May 31, 2018 and 2017. As a result of the misstatements, we restated our interim consolidated financial statements for the three and six months ended February 28, 2018. In addition to the adjustments related to freight derivatives and related misstatements, we also made adjustments related to certain intercompany balances and other historical misstatements unrelated to the freight derivatives and related misstatements.
Consolidated Financial Statement Adjustment Tables
The following tables present the impacts of the restatement adjustments to our unaudited Consolidated Statements of Operations and unaudited Consolidated Statements of Comprehensive Income for the three and six months ended February 28, 2018, and to our unaudited Consolidated Statement of Cash Flows for the six months ended February 28, 2018. The restatement references identified in the following tables directly correlate to the restatement adjustments detailed below.
The categories of restatement adjustments and their impact on previously reported consolidated financial statements are described below.
(a) Freight derivatives and related misstatements - Corrections for freight derivatives and related misstatements were driven by the misstatement of amounts associated with both the value and quantity of rail freight contracts, as well as due to rail and certain non-rail freight contracts not meeting the technical accounting requirements to qualify as derivative financial instruments. In addition to the elimination of the underlying freight derivative assets and liabilities and related impacts on revenues and cost of goods sold, additional adjustments were recorded to account for prepaid freight capacity balances in relevant periods. Additional details related to the impact of the freight derivatives and related misstatements and their impact on each period are discussed in restatement reference (a).
(b) Intercompany misstatements - As a result of the work performed in relation to the freight misstatement, additional misstatements related to the incorrect elimination of intercompany balances were also identified and corrected within the consolidated financial statements. Certain of these intercompany misstatements resulted in a misstatement of various financial statement line items; however, the intercompany misstatements did not result in a material misstatement of income (loss) before income taxes or net income (loss). Additional details related to the impact of the intercompany misstatements and their impact on each period are discussed in restatement reference (b).
(c) Other misstatements - We made adjustments for other previously identified misstatements unrelated to the freight derivatives and related misstatements that were not material, individually or in the aggregate, to our consolidated financial statements. These other misstatements related primarily to certain misclassifications, adjustments to revenues and cost of goods sold, and adjustments to various income tax and indirect tax accrual accounts. Additional details related to the impact of the other misstatements and their impact on each period are discussed in restatement reference (c).
CHS INC. AND SUBSIDIARIES
CONSOLIDATED STATEMENTS OF OPERATIONS
(Unaudited)
|
| | | | | | | | | | | | | | | | | | | | | |
| | For the Three Months Ended February 28, 2018 | | |
| | As Previously Reported | | Restatement Adjustments | | As Restated | | Accounting Changes* | | As Presented | | Restatement References |
| | (Dollars in thousands) | | |
| Revenues | $ | 6,851,093 |
| | $ | 129,060 |
| | $ | 6,980,153 |
| | $ | — |
| | $ | 6,980,153 |
| | a, b, c |
| Cost of goods sold | 6,708,610 |
| | 136,239 |
| | 6,844,849 |
| | 335 |
| | 6,845,184 |
| | a, b, c |
| Gross profit | 142,483 |
| | (7,179 | ) | | 135,304 |
| | (335 | ) | | 134,969 |
| | |
| Marketing, general and administrative | 186,716 |
| | (3 | ) | | 186,713 |
| | 845 |
| | 187,558 |
| | c |
| Reserve and impairment charges (recoveries), net | (11,349 | ) | | 3 |
| | (11,346 | ) | | — |
| | (11,346 | ) | | c |
| Operating earnings (loss) | (32,884 | ) | | (7,179 | ) | | (40,063 | ) | | (1,180 | ) | | (41,243 | ) | | |
| (Gain) loss on disposal of business | (7,705 | ) | | — |
| | (7,705 | ) | | — |
| | (7,705 | ) | | |
| Interest expense | 40,176 |
| | — |
| | 40,176 |
| | — |
| | 40,176 |
| | |
| Other (income) loss | (11,364 | ) | | — |
| | (11,364 | ) | | (1,180 | ) | | (12,544 | ) | | |
| Equity (income) loss from investments | (39,441 | ) | | — |
| | (39,441 | ) | | — |
| | (39,441 | ) | | |
| Income (loss) before income taxes | (14,550 | ) |
| (7,179 | ) | | (21,729 | ) | | — |
| | (21,729 | ) | | |
| Income tax expense (benefit) | (181,176 | ) | | (6,512 | ) | | (187,688 | ) | | — |
| | (187,688 | ) | | a, c |
| Net income (loss) | 166,626 |
| | (667 | ) | | 165,959 |
| | — |
| | 165,959 |
| | |
| Net income (loss) attributable to noncontrolling interests | (48 | ) | | — |
| | (48 | ) | | — |
| | (48 | ) | | |
| Net income (loss) attributable to CHS Inc. | $ | 166,674 |
| | $ | (667 | ) | | $ | 166,007 |
| | $ | — |
| | $ | 166,007 |
| | |
* Previously reported amounts have been revised to reflect the impact of adopting ASU 2017-17 retrospectively during the first quarter of fiscal 2019. Refer to details related to the adoption of new ASUs within Note 1, Basis of Presentation and Significant Accounting Policies.
For the three months ended February 28, 2018
Freight derivatives and related misstatements
(a) The correction of freight derivatives and related misstatements resulted in a $22.5 million reduction of income before income taxes and a $22.6 million reduction of net income. These adjustments related to a $22.5 million increase of cost of goods sold and a $0.1 million increase of income tax expense related to the tax effect of the freight derivatives and related misstatements.
Intercompany misstatements
(b) The correction of intercompany misstatements had no impact on income (loss) before income taxes or net income (loss); however, the correction resulted in a $161.5 million increase of both revenues and cost of goods sold due to different practices of eliminating intercompany sales between CHS businesses that existed in previous periods.
Other misstatements
(c) The correction of other misstatements resulted in a $15.3 million increase of income before income taxes and a $21.9 million increase of net income. The $15.3 million increase of income before income taxes relates primarily to a $13.7 million decrease of cost of goods sold arising from the use of a unit of measure assumption in the calculation of an excise tax credit that was changed during fiscal 2018. The remaining increase relates to a $1.6 million decrease of cost of goods sold as a result of the valuation of crack spread derivatives. In addition to the increase of income before income taxes, an income tax benefit of $6.6 million was recorded to adjust for the impact of other identified misstatements, as well as income tax items that had previously been identified and recorded as out of period adjustments in subsequent periods.
Additionally, certain misclassification and offsetting adjustments were made between line items included in the Consolidated Statements of Operations, primarily due to the application of differing accounting policies between businesses. These misclassification adjustments resulted in a $27.7 million decrease of revenues and cost of goods sold.
|
| | | | | | | | | | | | | | | | | | | | | |
| | For the Six Months Ended February 28, 2018 | | |
| | As Previously Reported | | Restatement Adjustments | | As Restated | | Accounting Changes* | | As Presented | | Restatement References |
| | (Dollars in thousands) | | |
| Revenues | $ | 14,899,982 |
| | $ | 112,055 |
| | $ | 15,012,037 |
| | $ | — |
| | $ | 15,012,037 |
| | a, b, c |
| Cost of goods sold | 14,444,237 |
| | 111,669 |
| | 14,555,906 |
| | 670 |
| | 14,556,576 |
| | a, b, c |
| Gross profit | 455,745 |
| | 386 |
| | 456,131 |
| | (670 | ) | | 455,461 |
| | |
| Marketing, general and administrative | 326,881 |
| | (668 | ) | | 326,213 |
| | 1,691 |
| | 327,904 |
| | c |
| Reserve and impairment charges (recoveries), net | (15,133 | ) | | — |
| | (15,133 | ) | | — |
| | (15,133 | ) | | |
| Operating earnings (loss) | 143,997 |
| | 1,054 |
| | 145,051 |
| | (2,361 | ) | | 142,690 |
| | |
| (Gain) loss on disposal of business | (7,705 | ) | | — |
| | (7,705 | ) | | — |
| | (7,705 | ) | | |
| Interest expense | 80,878 |
| | — |
| | 80,878 |
| | — |
| | 80,878 |
| | |
| Other (income) loss | (36,378 | ) | | — |
| | (36,378 | ) | | (2,361 | ) | | (38,739 | ) | | |
| Equity (income) loss from investments | (77,803 | ) | | — |
| | (77,803 | ) | | — |
| | (77,803 | ) | | |
| Income (loss) before income taxes | 185,005 |
| | 1,054 |
| | 186,059 |
| | — |
| | 186,059 |
| | |
| Income tax expense (benefit) | (161,240 | ) | | (5,842 | ) | | (167,082 | ) | | — |
| | (167,082 | ) | | a, c |
| Net income (loss) | 346,245 |
| | 6,896 |
| | 353,141 |
| | — |
| | 353,141 |
| | |
| Net income (loss) attributable to noncontrolling interests | (512 | ) | | — |
| | (512 | ) | | — |
| | (512 | ) | | |
| Net income (loss) attributable to CHS Inc. | $ | 346,757 |
| | $ | 6,896 |
| | $ | 353,653 |
| | $ | — |
| | $ | 353,653 |
| | |
* Previously reported amounts have been revised to reflect the impact of adopting ASU 2017-17 retrospectively during the first quarter of fiscal 2019. Refer to details related to the adoption of new ASUs within Note 1, Basis of Presentation and Significant Accounting Policies.
For the six months ended February 28, 2018
Freight derivatives and related misstatements
(a) The correction of freight derivatives and related misstatements resulted in a $23.0 million reduction of income before income taxes and a $23.8 million reduction of net income. These adjustments related to a $23.0 million increase of cost of goods sold and a $0.8 million increase of income tax expense related to the tax effect of the freight derivatives and related misstatements.
Intercompany misstatements
(b) The correction of intercompany misstatements had no impact on income (loss) before income taxes or net income (loss); however, the correction resulted in a $150.2 million increase of both revenues and cost of goods sold due to different practices of eliminating intercompany sales between CHS businesses that existed in previous periods.
Other misstatements
(c) The correction of other misstatements resulted in a $24.1 million increase of income before income taxes and a $30.7 million increase of net income. The $24.1 million increase of income before income taxes relates primarily to a $13.7 million decrease of cost of goods sold that arose from a unit of measure assumption in the calculation of an excise tax credit that was changed during fiscal 2018. The remaining increase relates to a $7.9 million decrease of cost of goods sold related to the valuation of crack spread derivatives and a $2.6 million increase to expense related to postretirement benefit plan activity that resulted from a timing difference associated with the recording of certain benefit plan expenses (included in cost of goods sold and marketing, general and administrative expenses). In addition to the increase of income before income taxes, an income tax benefit of $6.6 million was recorded to adjust for the impact of other identified misstatements, as well as income tax items that had previously been identified and recorded as out of period adjustments in subsequent periods.
Additionally, certain misclassification and offsetting adjustments were made between line items included in the Consolidated Statements of Operations, primarily due to the application of differing accounting policies between businesses. These misclassification adjustments resulted in a $33.4 million decrease of revenues and cost of goods sold.
CHS INC. AND SUBSIDIARIES
CONSOLIDATED STATEMENTS OF COMPREHENSIVE INCOME
(Unaudited)
|
| | | | | | | | | | | | | | | | | | | | | | | | | |
| | For the Three Months Ended February 28, 2018 | | For the Six Months Ended February 28, 2018 | | |
| | As Previously Reported | | Restatement Adjustments | | As Restated | | As Previously Reported | | Restatement Adjustments | | As Restated | | Restatement References |
| | (Dollars in thousands) | | |
| Net income (loss) | $ | 166,626 |
| | $ | (667 | ) | | $ | 165,959 |
| | $ | 346,245 |
| | $ | 6,896 |
| | $ | 353,141 |
| | a, c |
| Other comprehensive income (loss), net of tax: | | | | | | | | | | | | | |
| Postretirement benefit plan activity | 3,141 |
| | 1 |
| | 3,142 |
| | 7,338 |
| | (2,602 | ) | | 4,736 |
| | c |
| Unrealized net gain (loss) on available for sale investments | 3,554 |
| | — |
| | 3,554 |
| | 7,194 |
| | — |
| | 7,194 |
| | |
| Cash flow hedges | 1,063 |
| | — |
| | 1,063 |
| | 1,059 |
| | — |
| | 1,059 |
| | |
| Foreign currency translation adjustment | 2,461 |
| | (109 | ) | | 2,352 |
| | (146 | ) | | 287 |
| | 141 |
| | a |
| Other comprehensive income (loss), net of tax | 10,219 |
| | (108 | ) | | 10,111 |
| | 15,445 |
| | (2,315 | ) | | 13,130 |
| | |
| Comprehensive income | 176,845 |
| | (775 | ) | | 176,070 |
| | 361,690 |
| | 4,581 |
| | 366,271 |
| | |
| Less comprehensive income attributable to noncontrolling interests | (48 | ) | | — |
| | (48 | ) | | (512 | ) | | — |
| | (512 | ) | | |
| Comprehensive income attributable to CHS Inc. | $ | 176,893 |
| | $ | (775 | ) | | $ | 176,118 |
| | $ | 362,202 |
| | $ | 4,581 |
| | $ | 366,783 |
| | |
For the three months ended February 28, 2018
Freight derivatives and related misstatements
(a) The correction of freight derivatives and related misstatements resulted in a $22.6 million reduction of net income. Refer to descriptions of the adjustments and their impact on net income (loss) in the Consolidated Statements of Operations section for the three months ended February 28, 2018, above. The adjustment related to foreign currency translation is attributable to the foreign currency impact associated with goodwill that was impaired during fiscal 2015.
Intercompany misstatements
(b) None.
Other misstatements
(c) The correction of other misstatements resulted in a $21.9 million increase of net income. Refer to descriptions of the adjustments and their impact on net income (loss) in the Consolidated Statements of Operations section for the three months ended February 28, 2018, above.
For the six months ended February 28, 2018
Freight derivatives and related misstatements
(a) The correction of freight derivatives and related misstatements resulted in a $23.8 million reduction of net income. Refer to descriptions of the adjustments and their impact on net income (loss) in the Consolidated Statements of Operations section for the six months ended February 28, 2018, above. The adjustment related to foreign currency translation is attributable to the foreign currency impact associated with goodwill that was impaired during fiscal 2015.
Intercompany misstatements
(b) None.
Other misstatements
(c) The correction of other misstatements resulted in a $30.7 million increase of net income. Refer to descriptions of the adjustments and their impact on net income (loss) in the Consolidated Statements of Operations section for the six months ended February 28, 2018, above. The adjustment related to postretirement benefit plan activity is attributable to a timing difference associated with recording certain benefit plan expenses.
CHS INC. AND SUBSIDIARIES
CONSOLIDATED STATEMENT OF CASH FLOWS
(Unaudited)
|
| | | | | | | | | | | | | | | | | | | | | |
| | For the Six Months Ended February 28, 2018 | | |
| | As Previously Reported | | Restatement Adjustments | | As Restated | | Accounting Changes* | | As Presented | | Restatement References |
| | (Dollars in thousands) | | | |
| Cash flows from operating activities: | |
| | | | | | |
| | | | |
| Net income (loss) | $ | 346,245 |
| | $ | 6,896 |
| | $ | 353,141 |
| | $ | — |
| | $ | 353,141 |
| | a, c |
| Adjustments to reconcile net income to net cash provided by (used in) operating activities: | |
| | | | | | | |
|
| | |
| Depreciation and amortization | 240,349 |
| | — |
| | 240,349 |
| | — |
| | 240,349 |
| | |
| Amortization of deferred major repair costs | 32,839 |
| | — |
| | 32,839 |
| | — |
| | 32,839 |
| | |
| Equity (income) loss from investments | (77,803 | ) | | — |
| | (77,803 | ) | | — |
| | (77,803 | ) | | |
| Distributions from equity investments | 78,461 |
| | — |
| | 78,461 |
| | — |
| | 78,461 |
| | |
| Provision for doubtful accounts | (3,625 | ) | | — |
| | (3,625 | ) | | — |
| | (3,625 | ) | | |
| Gain and recovery on disposal of business | (24,236 | ) | | — |
| | (24,236 | ) | | — |
| | (24,236 | ) | | |
| Deferred taxes | (166,511 | ) | | (2,944 | ) | | (169,455 | ) | | — |
| | (169,455 | ) | | a, c |
| Other, net | 18,840 |
| | (2,604 | ) | | 16,236 |
| | — |
| | 16,236 |
| | c |
| Changes in operating assets and liabilities, net of acquisitions: | |
| | | | | | | |
|
| | |
| Receivables | 169,359 |
| | 29,868 |
| | 199,227 |
| | — |
| | 199,227 |
| | c |
| Inventories | (1,076,037 | ) | | (1,148 | ) | | (1,077,185 | ) | | — |
| | (1,077,185 | ) | | b, c |
| Derivative assets | (33,757 | ) | | 9,230 |
| | (24,527 | ) | | — |
| | (24,527 | ) | | a, c |
| Margin and related deposits | 17,895 |
| | — |
| | 17,895 |
| | — |
| | 17,895 |
| | |
| Supplier advance payments | (409,581 | ) | | — |
| | (409,581 | ) | | — |
| | (409,581 | ) | | |
| Other current assets and other assets | 21,344 |
| | (4,000 | ) | | 17,344 |
| | (18,998 | ) | | (1,654 | ) | | a, c |
| Customer margin deposits and credit balances | (51,591 | ) | | — |
| | (51,591 | ) | | — |
| | (51,591 | ) | | |
| Customer advance payments | 314,372 |
| | 18,500 |
| | 332,872 |
| | — |
| | 332,872 |
| | c |
| Accounts payable and accrued expenses | (44,413 | ) | | (27,634 | ) | | (72,047 | ) | | — |
| | (72,047 | ) | | b, c |
| Derivative liabilities | 50,922 |
| | 5,616 |
| | 56,538 |
| | — |
| | 56,538 |
| | a, c |
| Other liabilities | (58,252 | ) | | — |
| | (58,252 | ) | | — |
| | (58,252 | ) | | |
| Net cash provided by (used in) operating activities | (655,180 | ) | | 31,780 |
| | (623,400 | ) | | (18,998 | ) | | (642,398 | ) | | |
| Cash flows from investing activities: | |
| | | | | | | |
|
| | |
| Acquisition of property, plant and equipment | (142,886 | ) | | — |
| | (142,886 | ) | | — |
| | (142,886 | ) | | |
| Proceeds from disposition of property, plant and equipment | 59,680 |
| | — |
| | 59,680 |
| | — |
| | 59,680 |
| | |
| Proceeds from sale of business | 53,552 |
| | — |
| | 53,552 |
| | — |
| | 53,552 |
| | |
| Expenditures for major repairs | (2,832 | ) | | — |
| | (2,832 | ) | | — |
| | (2,832 | ) | | |
| Investments redeemed | 6,496 |
| | — |
| | 6,496 |
| | — |
| | 6,496 |
| | |
| Changes in CHS Capital notes receivable, net | (25,846 | ) | | — |
| | (25,846 | ) | | — |
| | (25,846 | ) | | |
| Financing extended to customers | (66,014 | ) | | — |
| | (66,014 | ) | | — |
| | (66,014 | ) | | |
| Payments from customer financing | 30,893 |
| | — |
| | 30,893 |
| | — |
| | 30,893 |
| | |
| Other investing activities, net | (10,203 | ) | | — |
| | (10,203 | ) | | — |
| | (10,203 | ) | | |
| Net cash provided by (used in) investing activities | (97,160 | ) | | — |
| | (97,160 | ) | | — |
| | (97,160 | ) | | |
| Cash flows from financing activities: | |
| | | | | | | |
|
| | |
| Proceeds from lines of credit and long-term borrowings | 18,414,973 |
| | — |
| | 18,414,973 |
| | — |
| | 18,414,973 |
| | |
| Payments on lines of credit, long-term borrowings and capital lease obligations | (17,512,264 | ) | | 3,052 |
| | (17,509,212 | ) | | — |
| | (17,509,212 | ) | | c |
| Preferred stock dividends paid | (84,334 | ) | | — |
| | (84,334 | ) | | — |
| | (84,334 | ) | | |
| Redemptions of equities | (4,742 | ) | | — |
| | (4,742 | ) | | — |
| | (4,742 | ) | | |
| Other financing activities, net | (49,874 | ) | | (5,987 | ) | | (55,861 | ) | | — |
| | (55,861 | ) | | c |
| Net cash provided by (used in) financing activities | 763,759 |
| | (2,935 | ) | | 760,824 |
| | — |
| | 760,824 |
| | |
| Effect of exchange rate changes on cash and cash equivalents | (2,372 | ) | | — |
| | (2,372 | ) | | — |
| | (2,372 | ) | | |
| Net increase (decrease) in cash and cash equivalents and restricted cash | 9,047 |
| | 28,845 |
| | 37,892 |
| | (18,998 | ) | | 18,894 |
| | c |
| Cash and cash equivalents and restricted cash at beginning of period | 181,379 |
| | — |
| | 181,379 |
| | 90,893 |
| | 272,272 |
| | |
| Cash and cash equivalents and restricted cash at end of period | $ | 190,426 |
| | $ | 28,845 |
| | $ | 219,271 |
| | $ | 71,895 |
| | $ | 291,166 |
| | |
* Previously reported amounts have been revised to reflect the impact of adopting ASU 2016-18 retrospectively during the first quarter of fiscal 2019. Refer to details related to the adoption of new ASUs within Note 1, Basis of Presentation and Significant Accounting Policies.
Freight derivatives and related misstatements
(a) The correction of freight derivatives and related misstatements resulted in a $23.8 million reduction of net income for the six months ended February 28, 2018. Refer to descriptions of the adjustments and their impact on net income (loss) in the Consolidated Statements of Operations section for the three and six months ended February 28, 2018, above. The impact of the adjustments to the Consolidated Balance Sheets as of August 31, 2017, and February 28, 2018, resulted in certain misclassifications of less than $13.0 million between operating activity line items in the Consolidated Statement of Cash Flows; however, none of the freight derivatives and related misstatements impacted the classifications between operating, investing or financing activities.
Intercompany misstatements
(b) The correction of intercompany misstatements did not impact net income for the six months ended February 28, 2018; however, the impact of adjustments to the Consolidated Balance Sheets as of August 31, 2017, and February 28, 2018, resulted in certain misclassification adjustments of less than $6.0 million between line items in the Consolidated Statement of Cash Flows. None of the intercompany misstatements impacted the classifications between operating, investing or financing activities within the Consolidated Statement of Cash Flows.
Other misstatements
(c) The correction of other misstatements resulted in a $30.7 million increase of net income for the six months ended February 28, 2018. Refer to further details of the adjustments and their impact on net income (loss) in the Consolidated Statement of Operations section for the three and six months ended February 28, 2018, above. The impact of the adjustments to the Consolidated Balance Sheets as of August 31, 2017, and February 28, 2018, resulted in certain misclassification adjustments between line items in the Consolidated Statements of Cash Flows. As a result, two misclassification adjustments were made between operating and financing activities, including a $3.1 million reduction of notes payable resulting from a duplicative entry and the misclassification of $6.0 million of cash associated with a timing difference for the application of in-transit cash. In addition, various misclassification adjustments were made between operating activity lines, the most significant of which related to (1) a $24.1 million decrease of inventory and increase in accounts receivable as of August 31, 2017, due to a timing difference related to the settlement of a single ocean vessel and (2) the $21.2 million net impact associated with the decrease of inventory and increase of accounts payable that resulted from the misclassification adjustment for certain items previously included within a contra-inventory account to accounts payable as of August 31, 2017, and February 28, 2018.
Note 3 Revenues
Adoption of New Revenue Guidance
As described in Note 1, Basis of Presentation and Significant Accounting Policies, we adopted the guidance within ASU 2014-09 as of September 1, 2018, using the modified retrospective transition approach. Consistent with other companies that actively trade commodities, a majority of our revenues are attributable to forward commodity sales contracts that are considered to be physically settled derivatives under ASC 815, Derivatives and Hedging (ASC Topic 815) and therefore fall outside the scope of ASC Topic 606. As a result, these revenues are not subject to the provisions of the new revenue guidance and the impact of adoption is limited to our revenue streams that fall within the scope of the new revenue guidance.
The majority of our revenue streams that fall within the scope of the new revenue guidance are recognized at a point-in-time; however, the adoption of ASU 2014-09 resulted in a minimal number of changes to the timing of revenue recognition for certain revenue streams. Under the modified retrospective method of adoption, we determined the cumulative effect of adoption for all contracts with customers that had not been completed as of the adoption date and recognized an adjustment of less than $1.0 million to the opening capital reserves balance within the Consolidated Balance Sheet as of September 1, 2018. Additionally, the impact of applying ASC Topic 606 compared to previous guidance during the three and six months ended February 28, 2019, was an overall decrease to revenues of $9.6 million and $22.6 million, respectively, which was primarily related to the change in revenue recognition for certain contracts from a gross basis to a net basis.
The change in accounting for revenue recognition under ASU 2014-09 did not have a material impact on our Consolidated Statements of Operations for the three and six months ended February 28, 2019, or Consolidated Balance Sheet as of February 28, 2019.
Revenue Recognition Accounting Policy and Performance Obligations
We provide a wide variety of products and services, from agricultural inputs such as fuels, farm supplies and crop nutrients, to agricultural outputs that include grain and oilseed, processed grains and oilseeds and food products, and ethanol production and marketing. We primarily conduct our operations and derive revenues within our Energy and Ag businesses. Our Energy business derives its revenues through refining, wholesaling and retailing of petroleum products. Our Ag business derives its revenues through the origination and marketing of grain, including service activities conducted at export terminals; through wholesale sales of crop nutrients and processed sunflowers; from sales of soybean meal, soybean refined oil and soyflour products; through the production and marketing of renewable fuels; and through retail sales of petroleum and agronomy products, and feed and farm supplies.
Revenue is recognized when performance obligations under the terms of a contract with a customer are satisfied, which generally occurs when control of the goods has transferred to customers. For the majority of our contracts with customers, control transfers to customers at a point-in-time when goods/services have been delivered, as that is generally when legal title, physical possession and risks and rewards of goods/services transfer to the customer. In limited arrangements, control transfers over time as the customer simultaneously receives and consumes the benefits of the service as we complete our performance obligation(s).
Revenue is recognized at the transaction price that we expect to be entitled to in exchange for transferring goods or services to a customer, excluding amounts collected on behalf of third parties. We follow a policy of recognizing revenue at the point-in-time or over the period of time that we satisfy our performance obligation by transferring control over a product or service to a customer in accordance with the underlying contract. For physically settled derivative sales contracts that are outside the scope of the revenue guidance, we recognize revenue when control of the inventory is transferred within the meaning of ASC Topic 606.
The amount of revenue recognized during the three and six months ended February 28, 2019, for performance obligations that were fully satisfied in previous periods was not material.
Shipping and Handling Costs
Shipping and handling amounts billed to a customer as part of a sales transaction are included in revenues, and the related costs are included in cost of goods sold. Shipping and handling is treated as a fulfillment activity rather than a promised service, and therefore is not considered a separate performance obligation.
Taxes Collected from Customers and Remitted to Governmental Authorities
Revenue is recorded net of taxes collected from customers that are remitted to governmental authorities, with the collected taxes recorded as current liabilities until remitted to the relevant government authority.
Contract Costs
Commissions related to contracts with a duration of less than one year are expensed as incurred. We recognize incremental costs of obtaining contracts as an expense when incurred if the amortization period of the assets we otherwise would have recognized is one year or less.
Disaggregation of Revenues
The following table presents revenues recognized under ASC Topic 606,Revenue from Contracts with Customers ("ASC Topic 606"), disaggregated by reportable segment, as well as the amount of revenues recognized under ASC Topic 815, Derivatives and Hedging ("ASC Topic 815"), and other applicable accounting guidance for the three and six months ended February 28, 2019.November 30, 2019 and 2018. Other applicable accounting guidance primarily includes revenues recognized under ASC Topic 840,842, Leases, and ASC Topic 470, Debt, that fall outside the scope of ASC Topic 606.
| | | | | ASC 606 | | ASC 815 | | Other Guidance | | Total Revenues | | ASC Topic 606 | | ASC Topic 815 | | Other Guidance | | Total Revenues |
| For the Three Months Ended February 28, 2019: | | (Dollars in thousands) | |
| Three Months Ended November 30, 2019: | | | (Dollars in thousands) |
| Energy | | $ | 1,310,529 |
| | $ | 164,248 |
| | $ | — |
| | $ | 1,474,777 |
| | $ | 1,693,848 |
| | $ | 201,575 |
| | $ | — |
| | $ | 1,895,423 |
|
| Ag | | 984,000 |
| | 3,976,765 |
| | 33,780 |
| | 4,994,545 |
| | 1,358,626 |
| | 4,316,087 |
| | 37,142 |
| | 5,711,855 |
|
| Corporate and Other | | 4,744 |
| | — |
| | 9,473 |
| | 14,217 |
| | 5,541 |
| | — |
| | 8,666 |
| | 14,207 |
|
| Total revenues | | $ | 2,299,273 |
| | $ | 4,141,013 |
| | $ | 43,253 |
| | $ | 6,483,539 |
| | $ | 3,058,015 |
| | $ | 4,517,662 |
| | $ | 45,808 |
| | $ | 7,621,485 |
|
| | | | | | | | | | | | | | | | | |
| For the Six Months Ended February 28, 2019: | | | | | | | | | |
| Three Months Ended November 30, 2018: | | | | | | | | | |
| Energy | | $ | 3,173,056 |
| | $ | 463,009 |
| | $ | — |
| | $ | 3,636,065 |
| | $ | 1,940,190 |
| | $ | 221,098 |
| | $ | — |
| | $ | 2,161,288 |
|
| Ag | | 2,339,825 |
| | 8,890,193 |
| | 69,924 |
| | 11,299,942 |
| | 1,355,826 |
| | 4,913,428 |
| | 36,143 |
| | 6,305,397 |
|
| Corporate and Other | | 9,978 |
| | — |
| | 21,843 |
| | 31,821 |
| | 5,234 |
| | — |
| | 12,370 |
| | 17,604 |
|
| Total revenues | | $ | 5,522,859 |
| | $ | 9,353,202 |
| | $ | 91,767 |
| | $ | 14,967,828 |
| | $ | 3,301,250 |
| | $ | 5,134,526 |
| | $ | 48,513 |
| | $ | 8,484,289 |
|
Less than 1% of revenues accounted for under ASC Topic 606 included within the table above are recorded over time; these revenues are primarily related to service contracts.
Our Energy segment derives its revenues through refining, wholesaling and retailing of petroleum products. Our Energy segment produces and sells (primarily wholesale) gasoline, diesel fuel, propane, asphalt, lubricants and other related products and provides transportation services. We are the nation's largest cooperative energy company, with operations that include petroleum refining and pipelines; the supply, marketing and distribution of refined fuels (gasoline, diesel fuel and other energy products); the blending, sale and distribution of lubricants; and the wholesale supply of propane and other natural gas liquids. For the majority of revenues arising from sales to Energy customers, we satisfy our performance obligation of providing energy products such as gasoline, diesel fuel, propane, asphalt, lubricants and other related products at the point-in-time that the finished petroleum product is delivered or made available to the wholesale or retail customer, at which point control is considered to have been transferred to the customer and revenue can be recognized, as there are no remaining performance obligations that we need to satisfy in order to be entitled to the agreed-upon transaction price as stated in the contract. For fixed and provisionally-priced derivative sales contracts that are accounted for under the provisions of the derivative accounting guidance and are outside the scope of the revenue recognition guidance, we recognize revenue when control of the inventory is transferred within the meaning of ASC Topic 606.
Our Ag segment derives its revenues through the origination and marketing of grain, including service activities conducted at export terminals; through wholesale sales of crop nutrients and processed sunflowers; from sales of soybean meal, soybean refined oil and soyflour products; through the production and marketing of renewable fuels; and through retail sales of petroleum and agronomy products, and feed and farm supplies. For the majority of revenues arising from sales to Ag customers, we satisfy our performance obligation of delivering a commodity or other agricultural end product to a customer at the point-in-time that the commodity or other end-product (wholesale grain, crop nutrients/agronomy products, soybean products, ethanol or country operations retail products) has been delivered or is made available to the customer, at which point control is considered to have been transferred to the customer and revenue can be recognized, as there are no remaining
performance obligations that need to be satisfied in order to be entitled to the agreed-upon transaction price as stated in the contract. The amount of revenue recognized follows the contractually specified price, which may include freight or other contractually specified cost components. For fixed and provisionally-priced derivative sales contracts that are accounted for under the provisions of the derivative accounting guidance and are outside the scope of the revenue recognition guidance, we recognize revenue when control of the inventory is transferred within the meaning of ASC Topic 606.
Corporate and Other primarily consists of our financing and hedging businesses, which are presented together due to the similar nature of their products and services as well as the relatively lower amount of revenues for those businesses compared to our Ag and Energy businesses. Prior to its sale on May 4, 2018, our insurance business was also included in Corporate and Other. Revenues arising from Corporate and Other are primarily comprised of revenues generated by our hedging and financing businesses. Revenues from our hedging business are primarily recognized at the point-in-time that the hedging transaction is completed after we have fully satisfied all performance obligations under the contract, and revenues arising from our financing business are recognized in accordance with ASC Topic 470, Debt, and fall outside the scope of ASC Topic 606.
Contract Assets and Contract Liabilities
Contract assets relate to unbilled amounts arising from goods that have already been transferred to the customer where the right to payment is not conditional upon the passage of time. This results in the recognition of an asset, as the amount of revenue recognized at a certain point-in-time exceeds the amount billed to the customer. Contract assets are recorded in accounts receivablereceivables within our Condensed Consolidated Balance Sheets and were immaterialnot material as of February 28,November 30, 2019, and August 31, 2018.2019.
Contract liabilities relate to advance payments from customers for goods and services that we have yet to provide. Contract liabilities of $560.4$205.0 million and $167.2$207.5 million as of February 28,November 30, 2019, and August 31, 2018,2019, respectively, are recorded within customer advance paymentsother current liabilities on our Condensed Consolidated Balance Sheets. For the three and six months ended February 28,November 30, 2019 and 2018, we recognized revenues of $45.8$92.0 million and $130.1$95.2 million, respectively, which were included in the customer advance paymentsother current liabilities balance at the beginning of the period.
Practical Expedients
We applied ASC Topic 606 utilizing the following allowable exemptions or practical expedients:
Election to not disclose the unfulfilled performance obligation balance for contracts with an original duration of one year or less.
Recognition of the incremental costs of obtaining a contract as an expense when incurred if the amortization period of the asset that would otherwise have been recognized is one year or less.
Election to present revenues net of sales taxes and other similar taxes.
Practical expedient to treat shipping and handling as a fulfillment activity rather than a promised service, resulting in the conclusion that shipping and handling is not a separate performance obligation.
Note 43 Receivables
| | | | February 28, 2019 | | August 31, 2018 | November 30, 2019 | | August 31, 2019 |
| | (Dollars in thousands) | (Dollars in thousands) |
| Trade accounts receivable | $ | 1,415,994 |
| | $ | 1,578,764 |
| $ | 1,706,564 |
| | $ | 1,803,284 |
|
| CHS Capital notes receivable | 592,985 |
| | 569,379 |
| |
| CHS Capital short-term notes receivable | | 606,605 |
| | 592,909 |
|
| Other | 441,710 |
| | 534,071 |
| 497,880 |
| | 511,821 |
|
| | 2,450,689 |
| | 2,682,214 |
| |
| Gross receivables | | 2,811,049 |
| | 2,908,014 |
|
| Less: allowances and reserves | 223,625 |
| | 221,813 |
| 179,675 |
| | 176,805 |
|
| Total receivables | $ | 2,227,064 |
| | $ | 2,460,401 |
| $ | 2,631,374 |
| | $ | 2,731,209 |
|
Trade Accounts
Trade accounts receivableReceivables are initially recorded at a selling price, which approximates fair value, upon the salecomprised of goods or services to customers. Subsequently, trade accounts receivable, are carried at net realizable value, which includes an allowance for estimated uncollectible amounts. We calculate this allowance based onshort-term notes receivable in our history of write-offs, level of past due accounts, and our relationships with, and the economic status of, our customers.
CHS Capital
Notes Receivable
wholly-owned subsidiary, CHS Capital, LLC ("CHS Capital"), our wholly-owned subsidiary, has short-term notes receivable from commercial and producer borrowers. The short-term notes receivable have maturity terms of 12 months orother receivables, less and are reported at their outstanding unpaid principal balances, adjustedan allowance for the allowance of loan losses, as CHS Capital has the intent and ability to hold the applicable loans for the foreseeable future or until maturity or pay-off. The carrying value of CHS Capital short-term notes receivable approximates fair value, given the notes' short duration and the use of market pricing adjusted for risk.doubtful accounts.
The notesNotes receivable from commercial borrowers are collateralized by various combinations of mortgages, personal property, accounts and notes receivable, inventories and assignments of capital stock from certain regional cooperative's capital stock.cooperatives. These loans are primarily originated in various states, primarily in the statesUpper Midwest region of the United States, the most significant of which include Minnesota, WisconsinNorth Dakota and NorthSouth Dakota. CHS Capital also has loans receivable from producer borrowers that are collateralized by various combinations of growing crops, livestock, inventories, accounts receivable, personal property and supplemental mortgages and are originated in the same states as the commercial notes as well as in Michigan.notes.
In addition to the short-term balances included in the table above, CHS Capital had long-term notes receivable, with durations of generally not more than 10 years, totaling $197.6$164.3 million and $203.0$180.0 million at February 28,November 30, 2019, and August 31, 2018,2019, respectively. The long-term notes receivable are included in other assets on our Condensed Consolidated Balance Sheets. As of February 28,November 30, 2019, and August 31, 2018,2019, the commercial notes represented 66%45% and 40%41%, respectively, and the producer notes represented 34%55% and 60%59%, respectively, of the total CHS Capital notes receivable.
CHS Capital has commitments to extend credit to customers if there are no violations of any contractually established conditions. As of February 28,November 30, 2019, CHS Capital's customers had additional available credit of $551.1$538.8 million.
Allowance No significant troubled debt restructuring activity occurred and no third-party customer or borrower accounted for Loan Losses and Impairments
CHS Capital maintains an allowance for loan losses which is the estimate of potential incurred losses inherent in the loans receivable portfolio. In accordance with FASB ASC 450-20, Accounting for Loss Contingencies, and ASC 310-10, Accounting by Creditors for Impairment of a Loan, the allowance for loan losses consists of general and specific components. The general component is based on historical loss experience and qualitative factors addressing operational risks and industry trends. The specific component relates to loans receivable that are classified as impaired. Additions to the allowance for loan losses are reflected within reserve and impairment charges (recoveries), net in the Consolidated Statements of Operations. The portion of loans receivable deemed uncollectible is charged off against the allowance. Recoveries of previously charged off amounts increase the allowance for loan losses. The amount of CHS Capital notes that were past due was not significant at any reporting date presented.
Interest Income
Interest income is recognized on the accrual basis using a method that computes simple interest daily. The accrual of interest on commercial loans receivable is discontinued at the time the commercial loan receivable is 90 days past due unless the credit is well-collateralized and in process of collection. Past due status is based on contractual termsmore than 10% of the loan. Producer loans receivable are placed in nonaccrual status based on estimates and analysis due to the annual debt service terms inherent to CHS Capital’s producer loans. In all cases, loans are placed in nonaccrual statustotal receivables balance as of November 30, 2019, or charged off at an earlier date if collection of principal or interest is considered doubtful.
Other Receivables
Other receivables are comprised of certain other amounts recorded in the normal course of business, including receivables related to value-added taxes and pre-crop financing, primarily to Brazilian farmers, to finance a portion of supplier production costs. We do not bear any of the costs or operational risks associated with the related growing crops, though our
ability to be paid depends on the crops actually produced. The financing is collateralized by future crops, land and physical assets of the suppliers, carries a local market interest rate and settles when the farmer’s crop is harvested and sold.August 31, 2019.
| | | | February 28, 2019 | | August 31, 2018 | November 30, 2019 | | August 31, 2019 |
| | (Dollars in thousands) | (Dollars in thousands) |
| Grain and oilseed | $ | 1,350,927 |
| | $ | 1,298,522 |
| $ | 1,451,865 |
| | $ | 1,024,645 |
|
| Energy | 827,468 |
| | 715,161 |
| 721,887 |
| | 717,378 |
|
| Crop nutrients | 469,946 |
| | 246,326 |
| |
| Feed and farm supplies | 771,810 |
| | 391,906 |
| |
| Agronomy | | 1,051,970 |
| | 954,037 |
|
| Processed grain and oilseed | 114,177 |
| | 99,426 |
| 102,483 |
| | 109,900 |
|
| Other | 20,452 |
| | 17,308 |
| 40,663 |
| | 48,328 |
|
| Total inventories | $ | 3,554,780 |
| | $ | 2,768,649 |
| $ | 3,368,868 |
| | $ | 2,854,288 |
|
As of February 28,November 30, 2019, we valued approximately 18%14% of inventories, primarily related tocrude oil and refined fuels within our Energy segment, using the lower of cost, determined on the LIFO method, or net realizable value (16% as of August 31, 2018)2019). If the FIFO method of accounting had been used, inventories would have been higher than the reported amount by $219.8$247.2 million and $345.0$215.0 million as of February 28,November 30, 2019, and August 31, 2018,2019, respectively. An actualActual valuation of inventory under the LIFO method can be made only at the end of each year based on the inventory levels and costs at that time. Interim LIFO calculations are based on management's estimates of expected year-end inventory levels and are subject to the final year-end LIFO inventory valuation.
Note 65 Investments
| | | | February 28, 2019 | | August 31, 2018 | November 30, 2019 | | August 31, 2019 |
| | (Dollars in thousands) | (Dollars in thousands) |
| Equity method investments: | | | | | | |
| CF Industries Nitrogen, LLC | $ | 2,725,095 |
| | $ | 2,735,073 |
| $ | 2,743,776 |
| | $ | 2,708,942 |
|
| Ventura Foods, LLC | 372,220 |
| | 360,150 |
| 378,463 |
| | 374,516 |
|
| Ardent Mills, LLC | 208,989 |
| | 205,898 |
| 209,956 |
| | 209,027 |
|
| Other equity method investments | 288,513 |
| | 288,016 |
| 256,042 |
| | 267,247 |
|
| Other investments | 123,280 |
| | 122,788 |
| 124,964 |
| | 124,264 |
|
| Total investments | $ | 3,718,097 |
| | $ | 3,711,925 |
| $ | 3,713,201 |
| | $ | 3,683,996 |
|
Equity Method Investments
Joint ventures and other investments, in which we have significant ownership and influence, but not control, are accounted for in our condensed consolidated financial statements using the equity method of accounting. Our primary equity method investments are described below. In addition to recognition of our share of income from our equity method investments, our equity method investments are evaluated for indicators of other-than-temporary impairment on an ongoing basis in accordance with accounting principles generally accepted in the United States ("U.S. GAAP"). Other investments consist primarily of investments in cooperatives without readily determinable fair values and are generally measured at cost, unless an impairment or other observable market price change occurs requiring an adjustment.
CF Nitrogen
On February 1, 2016, we invested $2.8We have a $2.7 billion investment in CF Industries Nitrogen, LLC ("CF Nitrogen"), commencing oura strategic venture with CF Industries Holdings, Inc. ("CF Industries"). The investment consists of an approximate 10% membership interest (based on product tons) in CF Nitrogen. We account for this investment using the hypothetical liquidation at book value method, recognizing our share of the earnings and losses of CF Nitrogen based upon our contractual claims on the entity's net assets pursuant to the liquidation provisions of the CF Nitrogen's limited liability company agreement,Nitrogen Limited Liability Company Agreement, adjusted for the semi-annual cash distributions we receive as a result of our membership interest in CF Nitrogen. For the three months ended February 28,November 30, 2019 and 2018, this amount was $35.5equity earnings were $34.8 million and $24.0$40.9 million, respectively. For the six months ended February 28, 2019,respectively, and 2018, this amount was $76.5 million and $44.3 million, respectively. These amounts are included as equity income from investments in our Nitrogen Production segment.
Ventura Foods and Ardent Mills
We have a 50% interest in Ventura Foods, LLC ("Ventura Foods"), which is a joint venture with Wilsey Foods, Inc., a majority-owned subsidiary of MK USA Holdings, Inc., that produces and distributes primarily vegetable oil-based products, andproducts. Additionally, we have a 12% interest in Ardent Mills, LLC ("Ardent Mills"), which is a joint venture with Cargill Incorporated and ConAgra Foods, Inc. that, and combines the North American flour milling operations of the three parent companies. We account for Ventura Foods and Ardent Mills as equity method investments, and our share of the results of these equity methods investments are included in Corporate and Other.
The following table provides aggregate summarized unaudited financial information for our equity method investments in CF Nitrogen, Ventura Foods and Ardent Mills for the sixthree months ended February 28,November 30, 2019 and 2018:
| | | | For the Six Months Ended
February 28, | Three Months Ended
November 30, |
| | 2019 | | 2018 | 2019 | | 2018 |
| | (Dollars in thousands) | (Dollars in thousands) |
| Net sales | $ | 4,385,722 |
| | $ | 3,788,709 |
| $ | 2,098,284 |
| | $ | 2,241,539 |
|
| Gross profit | 615,772 |
| | 420,912 |
| 346,027 |
| | 339,937 |
|
| Net earnings | 382,852 |
| | 227,988 |
| 214,004 |
| | 272,736 |
|
| Earnings attributable to CHS Inc. | 108,552 |
| | 61,432 |
| 53,462 |
| | 67,668 |
|
Our investments in other equity method investees are not significant in relation to our condensed consolidated financial statements, either individually or in the aggregate.
Note 7 Goodwill and Other Intangible Assets
Goodwill of $138.5 million is included in other assets on our Consolidated Balance Sheets as of February 28, 2019, and August 31, 2018. There were no changes in the net carrying amount of goodwill for the six months ended February 28, 2019.
Intangible assets subject to amortization primarily include customer lists, trademarks and non-compete agreements, and are amortized over their respective useful lives (ranging from 2 to 30 years). Information regarding intangible assets that are included in other assets on our Consolidated Balance Sheets is as follows:
|
| | | | | | | | | | | | | | | | | | | | | | | |
| | February 28,
2019 | | August 31,
2018 |
| | Gross Carrying Amount | | Accumulated Amortization | | Net | | Gross Carrying Amount | | Accumulated Amortization | | Net |
| | (Dollars in thousands) |
| Customer lists | $ | 40,815 |
| | $ | (14,500 | ) | | $ | 26,315 |
| | $ | 40,815 |
| | $ | (13,082 | ) | | $ | 27,733 |
|
| Trademarks and other intangible assets | 6,536 |
| | (5,038 | ) | | 1,498 |
| | 6,536 |
| | (4,931 | ) | | 1,605 |
|
| Total intangible assets | $ | 47,351 |
| | $ | (19,538 | ) | | $ | 27,813 |
| | $ | 47,351 |
| | $ | (18,013 | ) | | $ | 29,338 |
|
Total amortization expense for intangible assets during the three and six months ended February 28, 2019, was $0.8 million and $1.5 million, respectively. Total amortization expense for intangible assets during the three and six months ended February 28, 2018, was $0.8 million and $1.7 million, respectively. The estimated annual amortization expense related to intangible assets subject to amortization for the next five years is as follows:
|
| | | |
| | (Dollars in thousands) |
| Year 1 | $ | 3,034 |
|
| Year 2 | 2,958 |
|
| Year 3 | 2,877 |
|
| Year 4 | 2,787 |
|
| Year 5 | 2,667 |
|
Note 86 Notes Payable and Long-Term Debt
Our notes payable and long-term debt are subject to various restrictive requirements for maintenance of minimum consolidated net worth and other financial ratios. We were in compliance with our debt covenants as of February 28,November 30, 2019. The table below summarizes our notes payable as of February 28,November 30, 2019, and August 31, 2018.2019.
| |
| February 28, 2019 |
| August 31, 2018 | November 30, 2019 |
| August 31, 2019 |
| (Dollars in thousands) | (Dollars in thousands) |
| Notes payable | $ | 1,857,728 |
|
| $ | 1,437,264 |
| $ | 1,357,062 |
|
| $ | 1,330,550 |
|
| CHS Capital notes payable | 785,463 |
|
| 834,932 |
| 813,862 |
|
| 825,558 |
|
| Total notes payable | $ | 2,643,191 |
|
| $ | 2,272,196 |
| $ | 2,170,924 |
|
| $ | 2,156,108 |
|
As of November 30, 2019, our primary line of credit was a five-year unsecured revolving credit facility with a syndicate of domestic and international banks. The credit facility provides a committed amount of $3.0$2.75 billion that expires in September 2020. Theon July 16, 2024. As of November 30, 2019, and August 31, 2019, the outstanding balance on this facility was $604.0$245.0 million at February 28,and $335.0 million, respectively. Additionally, on September 30, 2019, CHS Capital entered into a credit agreement with a revolving note. Under this agreement, CHS Capital has available capacity of $150.0 million of which no amount was outstanding as of November 30, 2019. There was no outstanding balance at August 31, 2018.
On June 28, 2018, we amended our existingWe have a receivables and loans securitization facility (the "Securitization("Securitization Facility") with certain unaffiliated financial institutions (the "Purchasers"("Purchasers"). Under the Securitization Facility, we and certain of our subsidiaries (the "Originators"("Originators") sell trade accounts and notes receivable (the "Receivables"("Receivables") to Cofina Funding, LLC ("Cofina"), a wholly-owned bankruptcy-remote indirect subsidiary of CHS. Cofina in turn transfers the Receivables to the Purchasers, whichand this arrangement is accounted for as a secured borrowing. During the period from July 2017 through the amendment of the Securitization Facility in June 2018, CHS accounted for Receivables sold under the Securitization Facility as a sale of financial assets pursuant to ASC 860, Transfers and Servicing, and the Receivables sold were derecognized from our Consolidated Balance Sheets. We use the proceeds from the sale of Receivables under the Securitization Facility for general corporate purposes and settlements are made on a monthly basis. The Securitization Facility terminates on June 17, 2019,26, 2020, but may be extended.
On September 4, 2018,6, 2019, we entered into arenewed our repurchase facility (the "Repurchase("Repurchase Facility") related to the Securitization Facility. Under the Repurchase Facility, we can borrow up to $150$150.0 million, collateralized by a subordinated note issued by Cofina in favor of the Originators and representing a portion of the outstanding balance of the Receivables sold by the Originators to Cofina under the Securitization Facility. As of February 28,November 30, 2019, and August 31, 2019, the outstanding balance under the Repurchase Facility was $150$150.0 million.
Interest expense for the three months ended February 28,November 30, 2019 and 2018, was $41.3$35.0 million and $40.2$38.9 million, respectively, net of capitalized interest of $2.6$2.8 million and $1.3 million, respectively. Interest expense for the six months ended February 28, 2019, and 2018, was $80.2 million and $80.9 million, respectively, net of capitalized interest of $4.6 million and $3.1$2.1 million, respectively.
Note 97 Equities
Changes in Equities
Changes in equities for the sixthree months ended February 28,November 30, 2019 and 2018, are as follows:
|
| | | | | | | | | | | | | | | | | | | | | | | | | | | | | | | |
| | Equity Certificates | | | | Accumulated
Other
Comprehensive
Loss | | | | | | |
| | Capital
Equity
Certificates | | Nonpatronage
Equity
Certificates | | Nonqualified Equity Certificates | | Preferred
Stock | | | Capital
Reserves | | Noncontrolling
Interests | | Total
Equities |
| | (Dollars in thousands) |
| Balance, August 31, 2018 | $ | 3,837,580 |
| | $ | 29,498 |
| | $ | 742,378 |
| | $ | 2,264,038 |
| | $ | (199,915 | ) | | $ | 1,482,003 |
| | $ | 9,446 |
| | $ | 8,165,028 |
|
| Reversal of prior year redemption estimates | 24,072 |
| | — |
| | — |
| | — |
| | — |
| | — |
| | — |
| | 24,072 |
|
| Redemptions of equities | (22,004 | ) | | (183 | ) | | (1,885 | ) | | — |
| | — |
| | — |
| | — |
| | (24,072 | ) |
| Preferred stock dividends | — |
| | — |
| | — |
| | — |
| | — |
| | (84,334 | ) | | — |
| | (84,334 | ) |
| Reclassification of unrealized (gain) loss on investments | — |
| | — |
| | — |
| | — |
| | (4,706 | ) | | 4,706 |
| | — |
| | — |
|
| Other, net | (409 | ) | | — |
| | (26 | ) | | — |
| | — |
| | 3,436 |
| | 318 |
| | 3,319 |
|
| Net income (loss) | — |
| | — |
| | — |
| | — |
| | — |
| | 347,504 |
| | (389 | ) | | 347,115 |
|
| Other comprehensive income (loss), net of tax | — |
| | — |
| | — |
| | — |
| | 389 |
| | — |
| | — |
| | 389 |
|
| Estimated 2019 cash patronage refunds | — |
| | — |
| | — |
| | — |
| | — |
| | (89,344 | ) | | — |
| | (89,344 | ) |
| Estimated 2019 equity redemptions | (50,081 | ) | | — |
| | — |
| | — |
| | — |
| | — |
| | — |
| | (50,081 | ) |
| Balance, November 30, 2018 | $ | 3,789,158 |
| | $ | 29,315 |
| | $ | 740,467 |
| | $ | 2,264,038 |
| | $ | (204,232 | ) | | $ | 1,663,971 |
| | $ | 9,375 |
| | $ | 8,292,092 |
|
| Reversal of prior year patronage and redemption estimates | 6,681 |
| | — |
| | (345,330 | ) | | — |
| | — |
| | 420,330 |
| | — |
| | 81,681 |
|
| Distribution of 2018 patronage refunds | — |
| | — |
| | 349,353 |
| | — |
| | — |
| | (424,333 | ) | | — |
| | (74,980 | ) |
| Redemptions of equities | (5,988 | ) | | (74 | ) | | (619 | ) | | — |
| | — |
| | — |
| | — |
| | (6,681 | ) |
| Preferred stock dividends | — |
| | — |
| | — |
| | — |
| | — |
| | (42,167 | ) | | — |
| | (42,167 | ) |
| Other, net | (774 | ) | | — |
| | 2,589 |
| | — |
| | — |
| | (2,888 | ) | | (581 | ) | | (1,654 | ) |
| Net income (loss) | — |
| | — |
| | — |
| | — |
| | — |
| | 248,766 |
| | (462 | ) | | 248,304 |
|
| Other comprehensive income (loss), net of tax | — |
| | — |
| | — |
| | — |
| | 14,884 |
| | — |
| | — |
| | 14,884 |
|
| Estimated 2019 cash patronage refunds | — |
| | — |
| | — |
| | — |
| | — |
| | (69,400 | ) | | — |
| | (69,400 | ) |
| Estimated 2019 equity redemptions | (39,850 | ) | | — |
| | — |
| | — |
| | — |
| | — |
| | — |
| | (39,850 | ) |
| Balance, February 28, 2019 | $ | 3,749,227 |
| | $ | 29,241 |
| | $ | 746,460 |
| | $ | 2,264,038 |
| | $ | (189,348 | ) | | $ | 1,794,279 |
| | $ | 8,332 |
| | $ | 8,402,229 |
|
|
| | | | | | | | | | | | | | | | | | | | | | | | | | | | | | | |
| | Equity Certificates | | | | Accumulated
Other
Comprehensive
Loss | | | | | | |
| | Capital
Equity
Certificates | | Nonpatronage
Equity
Certificates | | Nonqualified Equity Certificates | | Preferred
Stock | | | Capital
Reserves | | Noncontrolling
Interests | | Total
Equities |
| | (Dollars in thousands) |
| Balance as of August 31, 2019 | $ | 3,753,493 |
| | $ | 29,074 |
| | $ | 1,206,310 |
| | $ | 2,264,038 |
| | $ | (226,933 | ) | | $ | 1,584,158 |
| | $ | 7,390 |
| | $ | 8,617,530 |
|
| Reversal of prior year redemption estimates | 5,447 |
| | — |
| | — |
| | — |
| | — |
| | — |
| | — |
| | 5,447 |
|
| Redemptions of equities | (4,721 | ) | | (54 | ) | | (672 | ) | | — |
| | — |
| | — |
| | — |
| | (5,447 | ) |
| Preferred stock dividends | — |
| | — |
| | — |
| | — |
| | — |
| | (84,334 | ) | | — |
| | (84,334 | ) |
| ASC Topic 842 cumulative-effect adjustment | — |
| | — |
| | — |
| | — |
| | — |
| | 33,707 |
| | — |
| | 33,707 |
|
| Other, net | (8 | ) | | — |
| | (39 | ) | | — |
| | — |
| | (1,312 | ) | | 410 |
| | (949 | ) |
| Net income | — |
| | — |
| | — |
| | — |
| | — |
| | 177,882 |
| | 855 |
| | 178,737 |
|
| Other comprehensive loss, net of tax | — |
| | — |
| | — |
| | — |
| | (1,638 | ) | | — |
| | — |
| | (1,638 | ) |
| Estimated 2020 cash patronage refunds | — |
| | — |
| | — |
| | — |
| | — |
| | (28,504 | ) | | — |
| | (28,504 | ) |
| Estimated 2020 equity redemptions | (91,633 | ) | | — |
| | — |
| | — |
| | — |
| | — |
| | — |
| | (91,633 | ) |
| Balance as of November 30, 2019 | $ | 3,662,578 |
| | $ | 29,020 |
| | $ | 1,205,599 |
| | $ | 2,264,038 |
| | $ | (228,571 | ) | | $ | 1,681,597 |
| | $ | 8,655 |
| | $ | 8,622,916 |
|
|
| | | | | | | | | | | | | | | | | | | | | | | | | | | | | | | |
| | Equity Certificates | | | | Accumulated
Other
Comprehensive
Loss* | | | | | | |
| | Capital
Equity
Certificates | | Nonpatronage
Equity
Certificates | | Nonqualified Equity Certificates | | Preferred
Stock | | | Capital
Reserves* | | Noncontrolling
Interests* | | Total
Equities* |
| | (Dollars in thousands) |
| Balance, August 31, 2017 | $ | 3,906,426 |
| | $ | 29,836 |
| | $ | 405,387 |
| | $ | 2,264,038 |
| | $ | (180,360 | ) | | $ | 1,267,808 |
| | $ | 12,505 |
| | $ | 7,705,640 |
|
| Reversal of prior year redemption estimates | 1,561 |
| | — |
| | — |
| | — |
| | — |
| | — |
| | — |
| | 1,561 |
|
| Redemptions of equities | (1,449 | ) | | (53 | ) | | (59 | ) | | — |
| | — |
| | — |
| | — |
| | (1,561 | ) |
| Preferred stock dividends | — |
| | — |
| | — |
| | — |
| | — |
| | (84,334 | ) | | — |
| | (84,334 | ) |
| Other, net | (1,498 | ) | | (66 | ) | | (344 | ) | | — |
| | — |
| | 3,954 |
| | (2 | ) | | 2,044 |
|
| Net income (loss) | — |
| | — |
| | — |
| | — |
| | — |
| | 187,646 |
| | (464 | ) | | 187,182 |
|
| Other comprehensive income (loss), net of tax | — |
| | — |
| | — |
| | — |
| | 3,019 |
| | — |
| | — |
| | 3,019 |
|
| Estimated 2018 cash patronage refunds | — |
| | — |
| | — |
| | — |
| | — |
| | (50,702 | ) | | — |
| | (50,702 | ) |
| Estimated 2018 equity redemptions | (19,901 | ) | | — |
| | — |
| | — |
| | — |
| | — |
| | — |
| | (19,901 | ) |
| Balance, November 30, 2017 (As Restated) | $ | 3,885,139 |
| | $ | 29,717 |
| | $ | 404,984 |
| | $ | 2,264,038 |
| | $ | (177,341 | ) | | $ | 1,324,372 |
| | $ | 12,039 |
| | $ | 7,742,948 |
|
| Reversal of prior year patronage and redemption estimates | 1,060 |
| | — |
| | (126,333 | ) | | — |
| | — |
| | 126,333 |
| | — |
| | 1,060 |
|
| Distribution of 2017 patronage refunds | — |
| | — |
| | 128,858 |
| | — |
| | — |
| | (128,858 | ) | | — |
| | — |
|
| Redemptions of equities | (953 | ) | | (16 | ) | | (91 | ) | | — |
| | — |
| | — |
| | — |
| | (1,060 | ) |
| Preferred stock dividends | — |
| | — |
| | — |
| | — |
| | — |
| | (42,167 | ) | | — |
| | (42,167 | ) |
| Other, net | (2,652 | ) | | (45 | ) | | (1 | ) | | — |
| | — |
| | 816 |
| | (60 | ) | | (1,942 | ) |
| Net income (loss) | — |
| | — |
| | — |
| | — |
| | — |
| | 166,007 |
| | (48 | ) | | 165,959 |
|
| Other comprehensive income (loss), net of tax | — |
| | — |
| | — |
| | — |
| | 10,111 |
| | — |
| | — |
| | 10,111 |
|
| Estimated 2018 cash patronage refunds | — |
| | — |
| | — |
| | — |
| | — |
| | 3,823 |
| | — |
| | 3,823 |
|
| Estimated 2018 equity redemptions | (12,375 | ) | | — |
| | — |
| | — |
| | — |
| | — |
| | — |
| | (12,375 | ) |
| Balance, February 28, 2018 (As Restated) | $ | 3,870,219 |
| | $ | 29,656 |
| | $ | 407,417 |
| | $ | 2,264,038 |
| | $ | (167,230 | ) | | $ | 1,450,326 |
| | $ | 11,931 |
| | $ | 7,866,357 |
|
* Certain amounts associated with Accumulated Other Comprehensive Loss, Capital Reserves and Noncontrolling Interests in the changes in equities table above were restated to reflect the impact of the misstatements associated with the restatement of previously issued financial statements. Note that the majority of the restatement adjustments within the changes in equities table above relate to the opening restatement adjustments to the August 31, 2017, balances. Additionally, the misstatements for activity in the changes in equities table above relates primarily to net income (loss) during the first quarter of fiscal 2018. Refer to further details included within Note 2, Restatement of Previously Issued Financial Information. |
| | | | | | | | | | | | | | | | | | | | | | | | | | | | | | | |
| | Equity Certificates | | | | Accumulated
Other
Comprehensive
Loss | | | | | | |
| | Capital
Equity
Certificates | | Nonpatronage
Equity
Certificates | | Nonqualified Equity Certificates | | Preferred
Stock | | | Capital
Reserves | | Noncontrolling
Interests | | Total
Equities |
| | (Dollars in thousands) |
| Balance as of August 31, 2018 | $ | 3,837,580 |
| | $ | 29,498 |
| | $ | 742,378 |
| | $ | 2,264,038 |
| | $ | (199,915 | ) | | $ | 1,482,003 |
| | $ | 9,446 |
| | $ | 8,165,028 |
|
| Reversal of prior year redemption estimates | 24,072 |
| | — |
| | — |
| | — |
| | — |
| | — |
| | — |
| | 24,072 |
|
| Redemptions of equities | (22,004 | ) | | (183 | ) | | (1,885 | ) | | — |
| | — |
| | — |
| | — |
| | (24,072 | ) |
| Preferred stock dividends | — |
| | — |
| | — |
| | — |
| | — |
| | (84,334 | ) | | — |
| | (84,334 | ) |
| Reclassification of unrealized (gain) loss on investments | — |
| | — |
| | — |
| | — |
| | (4,706 | ) | | 4,706 |
| | — |
| | — |
|
| Other, net | (409 | ) | | — |
| | (26 | ) | | — |
| | — |
| | 3,436 |
| | 318 |
| | 3,319 |
|
| Net income (loss) | — |
| | — |
| | — |
| | — |
| | — |
| | 347,504 |
| | (389 | ) | | 347,115 |
|
| Other comprehensive income, net of tax | — |
| | — |
| | — |
| | — |
| | 389 |
| | — |
| | — |
| | 389 |
|
| Estimated 2019 cash patronage refunds | — |
| | — |
| | — |
| | — |
| | — |
| | (89,344 | ) | | — |
| | (89,344 | ) |
| Estimated 2019 equity redemptions | (50,081 | ) | | — |
| | — |
| | — |
| | — |
| | — |
| | — |
| | (50,081 | ) |
| Balance as of November 30, 2018 | $ | 3,789,158 |
| | $ | 29,315 |
| | $ | 740,467 |
| | $ | 2,264,038 |
| | $ | (204,232 | ) | | $ | 1,663,971 |
| | $ | 9,375 |
| | $ | 8,292,092 |
|
Preferred Stock Dividends
The following is a summary of dividends per share by class of preferred stock for the three and six months ended February 28,November 30, 2019 and 2018. Note that dueDue to the timing of dividend declarations during the first quarter of each fiscal year, the per share amount of dividends is comprised of two quarterly dividend declarations for those periods.
|
| | | | | | | |
| | | | Three Months Ended
November 30, |
| | Nasdaq symbol | | 2019 | | 2018 |
| Class of preferred stock: | | | (Dollars per share) |
| 8% Cumulative Redeemable | CHSCP | | 1.00 |
| | 1.00 |
|
| Class B Cumulative Redeemable, Series 1 | CHSCO | | 0.98 |
| | 0.98 |
|
| Class B Reset Rate Cumulative Redeemable, Series 2 | CHSCN | | 0.88 |
| | 0.88 |
|
| Class B Reset Rate Cumulative Redeemable, Series 3 | CHSCM | | 0.84 |
| | 0.84 |
|
| Class B Cumulative Redeemable, Series 4 | CHSCL | | 0.94 |
| | 0.94 |
|
|
| | | | | | | | | | | | | | |
| | | | For the Three Months Ended February 28, | | For the Six Months Ended February 28, |
| | Nasdaq symbol | | 2019 | | 2018 | | 2019 | | 2018 |
| | (Dollars per share) |
| 8% Cumulative Redeemable | CHSCP | | $ | 0.50 |
| | 0.50 |
| | 1.50 |
| | 1.50 |
|
| Class B Cumulative Redeemable, Series 1 | CHSCO | | $ | 0.49 |
| | 0.49 |
| | 1.48 |
| | 1.48 |
|
| Class B Reset Rate Cumulative Redeemable, Series 2 | CHSCN | | $ | 0.44 |
| | 0.44 |
| | 1.33 |
| | 1.33 |
|
| Class B Reset Rate Cumulative Redeemable, Series 3 | CHSCM | | $ | 0.42 |
| | 0.42 |
| | 1.27 |
| | 1.27 |
|
| Class B Cumulative Redeemable, Series 4 | CHSCL | | $ | 0.47 |
| | 0.47 |
| | 1.41 |
| | 1.41 |
|
Accumulated Other Comprehensive Income (Loss)
Changes in accumulated other comprehensive income (loss) by component, net of tax, are as follows for the sixthree months ended February 28,November 30, 2019 and 2018:
| | | | Pension and Other Postretirement Benefits | | Unrealized Net Gain on Available for Sale Investments | | Cash Flow Hedges | | Foreign Currency Translation Adjustment | | Total | Pension and Other Postretirement Benefits | | Cash Flow Hedges | | Foreign Currency Translation Adjustment | | Total |
| | (Dollars in thousands) | (Dollars in thousands) |
| Balance as of August 31, 2018, net of tax | $ | (140,335 | ) | | $ | 8,861 |
| | $ | (5,882 | ) | | $ | (62,559 | ) | | $ | (199,915 | ) | |
| Balance as of August 31, 2019, net of tax | | $ | (172,478 | ) | | $ | 15,297 |
| | $ | (69,752 | ) | | $ | (226,933 | ) |
| Other comprehensive income (loss), before tax: | | | | | | | | | | | | | | | | |
| Amounts before reclassifications | 175 |
| | — |
| | (317 | ) | | (25 | ) | | (167 | ) | (85 | ) | | (3,331 | ) | | (2,411 | ) | | (5,827 | ) |
| Amounts reclassified out | 2,565 |
| | — |
| | (1,475 | ) | | — |
| | 1,090 |
| 4,977 |
| | (4,473 | ) | | — |
| | 504 |
|
| Total other comprehensive income (loss), before tax | 2,740 |
| | — |
| | (1,792 | ) | | (25 | ) | | 923 |
| 4,892 |
| | (7,804 | ) | | (2,411 | ) | | (5,323 | ) |
| Tax effect | (639 | ) | | — |
| | 485 |
| | (380 | ) | | (534 | ) | 181 |
| | 1,932 |
| | 1,572 |
| | 3,685 |
|
| Other comprehensive income (loss), net of tax | 2,101 |
| | — |
| | (1,307 | ) | | (405 | ) | | 389 |
| 5,073 |
| | (5,872 | ) | | (839 | ) | | (1,638 | ) |
| Reclassifications | 416 |
| | (8,861 | ) | | 983 |
| | 2,756 |
| | (4,706 | ) | |
| Balance as of November 30, 2018, net of tax | $ | (137,818 | ) | | $ | — |
| | $ | (6,206 | ) | | $ | (60,208 | ) | | $ | (204,232 | ) | |
| Other comprehensive income (loss), before tax: | | | | | | | | | | |
| Amounts before reclassifications | 102 |
| | — |
| | 18,954 |
| | 3,176 |
| | 22,232 |
| |
| Amounts reclassified out | 2,564 |
| | — |
| | (5,677 | ) | | — |
| | (3,113 | ) | |
| Total other comprehensive income (loss), before tax | 2,666 |
| | — |
| | 13,277 |
| | 3,176 |
| | 19,119 |
| |
| Tax effect | (664 | ) | | — |
| | (3,308 | ) | | (263 | ) | | (4,235 | ) | |
| Other comprehensive income (loss), net of tax | 2,002 |
| | — |
| | 9,969 |
| | 2,913 |
| | 14,884 |
| |
| Balance as of February 28, 2019, net of tax | $ | (135,816 | ) | | $ | — |
| | $ | 3,763 |
| | $ | (57,295 | ) | | $ | (189,348 | ) | |
| Balance as of November 30, 2019, net of tax | | $ | (167,405 | ) | | $ | 9,425 |
| | $ | (70,591 | ) | | $ | (228,571 | ) |
|
| | | | | | | | | | | | | | | | | | | |
| | Pension and Other Postretirement Benefits | | Unrealized Net Gain on Available for Sale Investments | | Cash Flow Hedges | | Foreign Currency Translation Adjustment | | Total |
| | (Dollars in thousands) |
| Balance as of August 31, 2017, net of tax | $ | (132,444 | ) | | $ | 10,041 |
| | $ | (6,954 | ) | | $ | (51,003 | ) | | $ | (180,360 | ) |
| Other comprehensive income (loss), before tax: | | | | | | | | | |
| Amounts before reclassifications | — |
| | 4,044 |
| | (435 | ) | | (612 | ) | | 2,997 |
|
| Amounts reclassified out | 4,214 |
| | — |
| | 429 |
| | (2,042 | ) | | 2,601 |
|
| Total other comprehensive income (loss), before tax | 4,214 |
| | 4,044 |
| | (6 | ) | | (2,654 | ) | | 5,598 |
|
| Tax effect | (2,620 | ) | | (404 | ) | | 2 |
| | 443 |
| | (2,579 | ) |
| Other comprehensive income (loss), net of tax | 1,594 |
| | 3,640 |
| | (4 | ) | | (2,211 | ) | | 3,019 |
|
| Balance as of November 30, 2017, net of tax (As Restated) | $ | (130,850 | ) | | $ | 13,681 |
| | $ | (6,958 | ) | | $ | (53,214 | ) | | $ | (177,341 | ) |
| Other comprehensive income (loss), before tax: | | | | | | | | | |
| Amounts before reclassifications | — |
| | 6,562 |
| | 1,081 |
| | 2,774 |
| | 10,417 |
|
| Amounts reclassified out | 4,451 |
| | (1,527 | ) | | 425 |
| | — |
| | 3,349 |
|
| Total other comprehensive income (loss), before tax | 4,451 |
| | 5,035 |
| | 1,506 |
| | 2,774 |
| | 13,766 |
|
| Tax effect | (1,309 | ) | | (1,481 | ) | | (443 | ) | | (422 | ) | | (3,655 | ) |
| Other comprehensive income (loss), net of tax | 3,142 |
| | 3,554 |
| | 1,063 |
| | 2,352 |
| | 10,111 |
|
| Balance as of February 28, 2018, net of tax (As Restated) | $ | (127,708 | ) | | $ | 17,235 |
| | $ | (5,895 | ) | | $ | (50,862 | ) | | $ | (167,230 | ) |
|
| | | | | | | | | | | | | | | | | | | |
| | Pension and Other Postretirement Benefits | | Unrealized Net Gain on Available for Sale Investments | | Cash Flow Hedges | | Foreign Currency Translation Adjustment | | Total |
| | (Dollars in thousands) |
| Balance as of August 31, 2018, net of tax | $ | (140,335 | ) | | $ | 8,861 |
| | $ | (5,882 | ) | | $ | (62,559 | ) | | $ | (199,915 | ) |
| Other comprehensive income (loss), before tax: | | | | | | | | | |
| Amounts before reclassifications | 175 |
| | — |
| | (317 | ) | | (25 | ) | | (167 | ) |
| Amounts reclassified out | 2,565 |
| | — |
| | (1,475 | ) | | — |
| | 1,090 |
|
| Total other comprehensive income (loss), before tax | 2,740 |
| | — |
| | (1,792 | ) | | (25 | ) | | 923 |
|
| Tax effect | (639 | ) | | — |
| | 485 |
| | (380 | ) | | (534 | ) |
| Other comprehensive income (loss), net of tax | 2,101 |
| | — |
| | (1,307 | ) | | (405 | ) | | 389 |
|
| Reclassifications | 416 |
| | (8,861 | ) | | 983 |
| | 2,756 |
| | (4,706 | ) |
| Balance as of November 30, 2018, net of tax | $ | (137,818 | ) | | $ | — |
| | $ | (6,206 | ) | | $ | (60,208 | ) | | $ | (204,232 | ) |
Amounts reclassified from accumulated other comprehensive income (loss) were related to pension and other postretirement benefits, cash flow hedges, available for saleavailable-for-sale investments and foreign currency translation adjustments. Pension and other postretirement reclassifications include amortization of net actuarial loss, prior service credit and transition amounts and are recorded as cost of goods sold, and marketing, general and administrative expenses and other income (see Note 11,8, Benefit Plans, for further information). Amortization related to gainsGains or losses onassociated with cash flow hedges wasare recorded to interest expense.as cost of goods sold (see Note 11, Derivative Financial Instruments and Hedging Activities, for further information). Gains or losses on the sale of available for saleavailable-for-sale investments are recorded to other income. Foreignand foreign currency translation reclassifications related to sales of businesses are recorded toas other income.
Note 10 Income Taxes
On December 22, 2017, the Tax Cuts and Jobs Act of 2017 (the "Tax Act") was enacted into law. The Tax Act provides for significant U.S. tax law changes and reduces the federal corporate statutory tax rate from 35% to 21% as of January 1, 2018. As a fiscal year-end taxpayer, our annual statutory federal corporate tax rate applicable to fiscal 2018 is a blended rate of 25.7%. Beginning in fiscal 2019, our annual statutory federal corporate tax rate is 21%.
The Tax Act also requires companies to pay a one-time repatriation tax on certain unrepatriated earnings of foreign subsidiaries that were previously tax deferred ("transition tax"). We do not have any unrepatriated earnings for foreign subsidiaries and have not recorded a liability for the transition tax.
The Tax Act initially repealed the Domestic Production Activities Deduction ("DPAD") and enacted the Deduction for Qualified Business Income of Pass-Thru Entities ("QBI Deduction"); however, the Consolidated Appropriations Act, 2018 (the "Appropriations Act") enacted into law on March 23, 2018, impacted these deductions. The Appropriations Act modifies the QBI Deduction under Section 199A of the Tax Act to reenact DPAD for agricultural and horticultural cooperatives as it existed prior to the enactment of the Tax Act, and it also modifies the QBI Deduction available to cooperative patrons as enacted by the Tax Act.
As of August 31, 2018, the effects of the Tax Act were provisional in accordance with the SEC's Staff Accounting Bulletin No.118. No adjustments were recorded for the six months ended February 28, 2019, associated with the remeasurement of deferred tax balances or the one-time transition tax, and in accordance with Staff Accounting Bulletin No.118, the amounts are no longer provisional.
Note 118 Benefit Plans
We have various pension and other defined benefit and defined contribution plans, in which substantially all employees may participate. We also have non-qualifiednonqualified supplemental executive and Board retirement plans.
Components of net periodic benefit costs for the three and six months ended February 28,November 30, 2019, and 2018, are as follows:
| | | | Qualified Pension Benefits | | Non-Qualified Pension Benefits | | Other Benefits | Three Months Ended November 30, |
| | 2019 | | 2018 | | 2019 | | 2018 | | 2019 | | 2018 | Qualified Pension Benefits | | Nonqualified Pension Benefits | | Other Benefits |
| Components of net periodic benefit costs for the three months ended February 28 are as follows: | (Dollars in thousands) | |
| | | 2019 | | 2018 | | 2019 | | 2018 | | 2019 | | 2018 |
| Components of net periodic benefit costs: | | (Dollars in thousands) |
| Service cost | $ | 9,648 |
| | $ | 9,920 |
| | $ | 78 |
| | $ | 137 |
| | $ | 263 |
| | $ | 236 |
| $ | 10,538 |
| | $ | 9,648 |
| | $ | 101 |
| | $ | 78 |
| | $ | 262 |
| | $ | 263 |
|
| Interest cost | 7,099 |
| | 5,991 |
| | 187 |
| | 178 |
| | 274 |
| | 227 |
| 5,431 |
| | 7,099 |
| | 107 |
| | 187 |
| | 187 |
| | 274 |
|
| Expected return on assets | (11,242 | ) | | (12,049 | ) | | — |
| | — |
| | — |
| | — |
| (11,671 | ) | | (11,242 | ) | | — |
| | — |
| | — |
| | — |
|
| Prior service cost (credit) amortization | 42 |
| | 360 |
| | (19 | ) | | 7 |
| | (139 | ) | | (142 | ) | 45 |
| | 42 |
| | (28 | ) | | (19 | ) | | (111 | ) | | (139 | ) |
| Actuarial (gain) loss amortization | 3,087 |
| | 4,511 |
| | 1 |
| | 16 |
| | (407 | ) | | (306 | ) | |
| Settlement (gain) loss | 169 |
| | — |
| | — |
| | — |
| | — |
| | — |
| |
| Actuarial loss (gain) amortization | | 5,396 |
| | 3,087 |
| | 25 |
| | — |
| | (348 | ) | | (407 | ) |
| Net periodic benefit cost | $ | 8,803 |
| | $ | 8,733 |
| | $ | 247 |
| | $ | 338 |
| | $ | (9 | ) | | $ | 15 |
| $ | 9,739 |
| | $ | 8,634 |
| | $ | 205 |
| | $ | 246 |
| | $ | (10 | ) | | $ | (9 | ) |
| Components of net periodic benefit costs for the six months ended February 28 are as follows: | | |
| Service cost | $ | 19,296 |
| | $ | 19,839 |
| | $ | 155 |
| | $ | 274 |
| | $ | 527 |
| | $ | 472 |
| |
| Interest cost | 14,198 |
| | 11,992 |
| | 374 |
| | 356 |
| | 547 |
| | 454 |
| |
| Expected return on assets | (22,484 | ) | | (24,089 | ) | | — |
| | — |
| | — |
| | — |
| |
| Prior service cost (credit) amortization | 85 |
| | 719 |
| | (37 | ) | | 15 |
| | (278 | ) | | (283 | ) | |
| Actuarial (gain) loss amortization | 6,174 |
| | 11,399 |
| | 1 |
| | 30 |
| | (814 | ) | | (612 | ) | |
| Settlement (gain) loss | 169 |
| | — |
| | — |
| | — |
| | — |
| | — |
| |
| Net periodic benefit cost | $ | 17,438 |
| | $ | 19,860 |
| | $ | 493 |
| | $ | 675 |
| | $ | (18 | ) | | $ | 31 |
| |
The service cost component of defined benefit net periodic benefit cost is recorded in cost of goods sold and marketing, general and administrative expenses. The other components of net periodic benefit cost are reflectedrecorded in other (income) loss.income.
Employer Contributions
TotalAny contributions to be made during fiscal 20192020 will depend primarily on market returns on the pension plan assets and minimum funding level requirements. During the six months ended February 28, 2019, weNo contributions were made no contributions to the pension plans. At this time,plans during the three months ended November 30, 2019, and we do not currently anticipate being required to make a contribution for our benefit plans in fiscal 2019.2020.
Note 9 Income Taxes
Our effective tax rate for the three months ended November 30, 2019, was 3.6%, compared to 5.5% for the three months ended November 30, 2018. The decreased effective tax rate reflects the equity management assumptions used in fiscal 2020.
It is reasonably possible that the amount of unrecognized tax benefits could significantly change within the next 12 months. We have ongoing federal, state and international income tax audits in various jurisdictions and are evaluating uncertain tax positions that may be challenged by local tax authorities and not fully sustained. These uncertain tax positions are reviewed on an ongoing basis and adjusted in light of facts and circumstances, including progression of tax audits, developments in case law and closing of statutes of limitation. The total amounts of unrecognized tax benefits that, if recognized, would affect the effective tax rate as of November 30, 2019, and August 31, 2019, are $98.7 million and $93.3 million, respectively.
Note 1210 Segment Reporting
We are an integrated agricultural enterprise, providing grain, foods and energy resources to businesses and consumers on a global basis. We provide a wide variety of products and services, from initial agricultural inputs such as fuels, farm supplies, crop nutrient and crop protection products, to agricultural outputs that include grains and oilseeds, grain and oilseed processing and food products, and the production and marketing of ethanol. We define our operating segments in accordance with ASC Topic 280, Segment Reporting, to reflect the manner in which our chief operating decision maker, our Chief Executive Officer, evaluates performance and allocates resources in managing our business.businesses. We have aggregated those operating segments into three reportable segments: Energy, Ag and Nitrogen Production.
Our Energy segment produces and provides primarily for the wholesale distribution of petroleum products and transportation of those products. Our Ag segment purchases and further processes or resells grains and oilseeds originated by our country operations business, by our member cooperatives and by third parties; serves as a wholesaler and retailer of crop inputs; and produces and markets ethanol. Our Nitrogen Production segment consists solely of our equity method investment in CF Nitrogen, which entitles us, pursuant to a supply agreement that we entered into with CF Nitrogen, to purchase up to a specified annual quantity of granular urea and urea ammonium nitrate ("UAN") annually from CF Nitrogen. Insignificant operating segments have been aggregated withinCorporate and Other represents our financing and hedging businesses, which primarily consist of commodities hedging and financial services related to crop production. Our non-consolidated investments in Ventura Foods and Ardent Mills are also included in Corporate and Other.
Corporate administrative expenses and interest are allocated to each business segment and Corporate and Other, based on direct usage for services that can be tracked, such as information technology and legal, and other factors or considerations relevant to the costs incurred.
Many of our business activities are highly seasonal and operating results vary throughout the year. For example, in our Ag segment, our crop nutrients and country operations businessesbusiness generally experienceexperiences higher volumes and income during the spring planting season and induring the fall which corresponds to harvest.harvest season, and our agronomy business generally experiences higher volumes and income during the spring planting season. Our global grain marketing operations are also subject to fluctuations in volume and earnings based on producer harvests, world grain prices and demand. Our Energy segment generally experiences higher volumes and profitability in certain operating areas, such as refined products, in the summer and early fall when gasoline and diesel fuel usage is highest and is subject to global supply and demand forces. Other energy products, such as propane, may experience higher volumes and profitability during the winter heating and fall crop dryingcrop-drying seasons.
Our revenues, assets and cash flows can be significantly affected by global trade and associated market prices for commodities such as petroleum products, natural gas, ethanol, grains, oilseeds, crop nutrients and flour. Changes in market prices for commodities that we purchase without a corresponding change in the selling prices of those products can affect revenues and operating earnings. Commodity prices are affected by a wide range of factors beyond our control, including the weather, crop damage due to plant disease or insects, drought, the availability and adequacy of supply, government regulations and policies, world events, global trade disputes, and general political and economic conditions.
While our revenues and operating results are derived primarily from businesses and operations that are wholly ownedwholly-owned or subsidiaries and majority owned,limited liability companies in which we have a controlling interest, a portion of our business operations are conducted through companies in which we hold ownership interests of 50% or less andor do not control the operations. See Note 6,5, Investments, for more information on these entities.
Reconciling Amountsamounts primarily represent the elimination of revenues and interest between segments. Such transactions are executed at market prices to more accurately evaluate the profitability of the individual business segments.
Segment information for the three and six months ended February 28,November 30, 2019 and 2018, is presented in the tables below. Fiscal 2020 results for our Ag segment include results associated with our acquisition of the remaining 75% ownership interest in West Central Distribution, LLC ("WCD") that we did not previously own on March 1, 2019, which are not included in our prior period results. Refer to further details related to our acquisition of the remaining 75% ownership interest in WCD that we did not previously own within Note 15, Acquisitions. | |
| Energy | | Ag | | Nitrogen Production | | Corporate
and Other | | Reconciling
Amounts | | Total | Energy | | Ag | | Nitrogen Production | | Corporate
and Other | | Reconciling
Amounts | | Total |
| For the Three Months Ended February 28, 2019: | (Dollars in thousands) | |
| Three Months Ended November 30, 2019: | | (Dollars in thousands) |
| Revenues, including intersegment revenues | $ | 1,570,968 |
|
| $ | 4,998,137 |
|
| $ | — |
| | $ | 16,694 |
|
| $ | (102,260 | ) |
| $ | 6,483,539 |
| $ | 2,027,895 |
|
| $ | 5,715,994 |
|
| $ | — |
| | $ | 15,950 |
|
| $ | (138,354 | ) |
| $ | 7,621,485 |
|
| Operating earnings (loss) | 301,721 |
|
| (47,129 | ) |
| (9,880 | ) | | 4,933 |
|
| — |
|
| 249,645 |
| 161,199 |
|
| (417 | ) |
| (7,823 | ) | | 4,253 |
|
| — |
|
| 157,212 |
|
| Interest expense | (1,652 | ) |
| 25,398 |
|
| 15,342 |
| | 3,299 |
|
| (1,118 | ) |
| 41,269 |
| 374 |
|
| 20,741 |
|
| 12,130 |
| | 3,838 |
|
| (2,112 | ) |
| 34,971 |
|
| Other (income) loss | (2,217 | ) | | (10,257 | ) | | (392 | ) | | (15 | ) | | 1,118 |
| | (11,763 | ) | |
| Other income | | (964 | ) | | (11,453 | ) | | (1,569 | ) | | (1,624 | ) | | 2,112 |
| | (13,498 | ) |
| Equity (income) loss from investments | (995 | ) |
| 128 |
|
| (35,542 | ) | | (5,307 | ) |
| — |
|
| (41,716 | ) | (364 | ) |
| 4,157 |
|
| (34,834 | ) | | (18,621 | ) |
| — |
|
| (49,662 | ) |
| Income (loss) before income taxes | $ | 306,585 |
|
| $ | (62,398 | ) |
| $ | 10,712 |
| | $ | 6,956 |
|
| $ | — |
|
| $ | 261,855 |
| $ | 162,153 |
|
| $ | (13,862 | ) |
| $ | 16,450 |
| | $ | 20,660 |
|
| $ | — |
|
| $ | 185,401 |
|
| Intersegment revenues | $ | (96,191 | ) |
| $ | (3,592 | ) |
| $ | — |
| | $ | (2,477 | ) |
| $ | 102,260 |
|
| $ | — |
| $ | (132,472 | ) |
| $ | (4,139 | ) |
| $ | — |
| | $ | (1,743 | ) |
| $ | 138,354 |
|
| $ | — |
|
| Total assets as of November 30, 2019 | | $ | 4,449,652 |
| | $ | 7,108,507 |
| | $ | 2,761,709 |
| | $ | 2,894,423 |
| | $ | — |
| | $ | 17,214,291 |
|
| | | | | | | | | | | | | | | | | | | | | | | |
| | | | | | | | | | | | | Energy | | Ag | | Nitrogen Production | | Corporate
and Other | | Reconciling
Amounts | | Total |
| | Energy | | Ag | | Nitrogen Production | | Corporate
and Other | | Reconciling
Amounts | | Total | |
| For the Three Months Ended February 28, 2018: (As Restated) | (Dollars in thousands) | |
| Three Months Ended November 30, 2018: | | (Dollars in thousands) |
| Revenues, including intersegment revenues | $ | 1,771,809 |
| | $ | 5,300,503 |
| | $ | — |
| | $ | 13,168 |
| | $ | (105,327 | ) | | $ | 6,980,153 |
| $ | 2,310,080 |
| | $ | 6,308,714 |
| | $ | — |
| | $ | 19,067 |
| | $ | (153,572 | ) | | $ | 8,484,289 |
|
| Operating earnings (loss) | 25,318 |
| | (53,125 | ) | | (7,239 | ) | | (6,197 | ) | |
|
| | (41,243 | ) | 235,639 |
| | 80,127 |
| | (5,128 | ) | | 3,860 |
| | — |
| | 314,498 |
|
| (Gain) loss on disposal of business | — |
| | (7,705 | ) | | — |
| | — |
| | — |
| | (7,705 | ) | |
| Interest expense | 2,629 |
| | 22,784 |
| | 12,676 |
| | 2,665 |
| | (578 | ) | | 40,176 |
| 4,237 |
| | 21,000 |
| | 13,679 |
| | 763 |
| | (771 | ) | | 38,908 |
|
| Other (income) loss | (1,122 | ) | | (9,112 | ) | | (433 | ) | | (2,455 | ) | | 578 |
| | (12,544 | ) | |
| Other income | | (986 | ) | | (22,400 | ) | | (1,571 | ) | | (948 | ) | | 771 |
| | (25,134 | ) |
| Equity (income) loss from investments | (660 | ) | | (5,567 | ) | | (24,012 | ) | | (9,202 | ) | | — |
| | (39,441 | ) | (73 | ) | | 1,209 |
| | (40,915 | ) | | (26,729 | ) | | — |
| | (66,508 | ) |
| Income (loss) before income taxes | $ | 24,471 |
| | $ | (53,525 | ) | | $ | 4,530 |
| | $ | 2,795 |
| | $ | — |
| | $ | (21,729 | ) | |
| Income before income taxes | | $ | 232,461 |
| | $ | 80,318 |
| | $ | 23,679 |
| | $ | 30,774 |
| | $ | — |
| | $ | 367,232 |
|
| Intersegment revenues | $ | (100,010 | ) | | $ | (3,575 | ) | | $ | — |
| | $ | (1,742 | ) | | $ | 105,327 |
| | $ | — |
| $ | (148,792 | ) | | $ | (3,317 | ) | | $ | — |
| | $ | (1,463 | ) | | $ | 153,572 |
| | $ | — |
|
|
| | | | | | | | | | | | | | | | | | | | | | | |
| | Energy | | Ag | | Nitrogen Production | | Corporate
and Other | | Reconciling
Amounts | | Total |
| For the Six Months Ended February 28, 2019: | (Dollars in thousands) |
| Revenues, including intersegment revenues | $ | 3,881,048 |
| | $ | 11,306,851 |
| | $ | — |
| | $ | 35,761 |
| | $ | (255,832 | ) | | $ | 14,967,828 |
|
| Operating earnings (loss) | 537,360 |
| | 32,998 |
| | (15,008 | ) | | 8,793 |
| | — |
| | 564,143 |
|
| (Gain) loss on disposal of business | — |
| | (1,412 | ) | | — |
| | — |
| | — |
| | (1,412 | ) |
| Interest expense | 2,585 |
| | 46,398 |
| | 29,021 |
| | 4,062 |
| | (1,889 | ) | | 80,177 |
|
| Other (income) loss | (3,203 | ) | | (31,245 | ) | | (1,963 | ) | | (963 | ) | | 1,889 |
| | (35,485 | ) |
| Equity (income) loss from investments | (1,068 | ) | | 1,337 |
| | (76,457 | ) | | (32,036 | ) | | — |
| | (108,224 | ) |
| Income (loss) before income taxes | $ | 539,046 |
| | $ | 17,920 |
| | $ | 34,391 |
| | $ | 37,730 |
| | $ | — |
| | $ | 629,087 |
|
| Intersegment revenues | $ | (244,983 | ) | | $ | (6,909 | ) | | $ | — |
| | $ | (3,940 | ) | | $ | 255,832 |
| | $ | — |
|
| Total assets at February 28, 2019 | $ | 4,349,524 |
| | $ | 6,969,518 |
| | $ | 2,745,652 |
| | $ | 2,871,480 |
| | $ | — |
| | $ | 16,936,174 |
|
| | | | | | | | | | | | |
| | Energy | | Ag | | Nitrogen Production | | Corporate
and Other | | Reconciling
Amounts | | Total |
| For the Six Months Ended February 28, 2018: (As Restated) | (Dollars in thousands) |
| Revenues, including intersegment revenues | $ | 3,845,809 |
| | $ | 11,381,530 |
| | $ | — |
| | $ | 31,943 |
| | $ | (247,245 | ) | | $ | 15,012,037 |
|
| Operating earnings (loss) | 149,349 |
| | 7,784 |
| | (10,374 | ) | | (4,069 | ) | | — |
| | 142,690 |
|
| (Gain) loss on disposal of business | — |
| | (7,705 | ) | | — |
| | — |
| | — |
| | (7,705 | ) |
| Interest expense | 8,264 |
| | 40,388 |
| | 25,948 |
| | 7,245 |
| | (967 | ) | | 80,878 |
|
| Other (income) loss | (2,010 | ) | | (32,698 | ) | | (2,171 | ) | | (2,827 | ) | | 967 |
| | (38,739 | ) |
| Equity (income) loss from investments | (1,812 | ) | | (13,821 | ) | | (44,347 | ) | | (17,823 | ) | | — |
| | (77,803 | ) |
| Income (loss) before income taxes | $ | 144,907 |
| | $ | 21,620 |
| | $ | 10,196 |
| | $ | 9,336 |
| | $ | — |
| | $ | 186,059 |
|
| Intersegment revenues | $ | (234,864 | ) | | $ | (7,608 | ) | | $ | — |
| | $ | (4,773 | ) | | $ | 247,245 |
| | $ | — |
|
Note 1311 Derivative Financial Instruments and Hedging Activities
Our derivative instruments primarily consist of commodity and forward contracts and, to a minor degree, may include foreign currency and interest rate swap contracts. These contracts are economic hedges of price risk, but we do not apply hedge accounting under ASC Topic 815, Derivatives and Hedging, except with respect to certain interest rate swap contracts that are accounted for as fair value hedges and certain future crude oil purchases that are accounted for as cash flow hedges. Derivative instruments are primarily recorded within other current assets and other current liabilities on our Condensed Consolidated Balance Sheets at fair value as described in Note 14,12, Fair Value Measurements.
Derivatives Not Designated as Hedging Instruments
The following tables present the gross fair values of derivative assets, derivative liabilities and margin deposits (cash collateral) for derivatives not accounted for as hedging instruments, recorded on our Condensed Consolidated Balance Sheets, along with the related amounts permitted to be offset in accordance with U.S. GAAP. We have elected not to offset derivative assets and liabilities when we have the right of offset under ASC Topic 210-20, Balance Sheet - Offsetting,; or when the instruments are subject to master netting arrangements under ASC Topic 815-10-45, Derivatives and Hedging - Overall.
| | | | February 28, 2019 | November 30, 2019 |
| | | | Amounts Not Offset on the Consolidated Balance Sheet but Eligible for Offsetting | | | | | Amounts Not Offset on Condensed Consolidated Balance Sheet but Eligible for Offsetting | | |
| | Gross Amounts Recognized | | Cash Collateral | | Derivative Instruments | | Net Amounts | Gross Amount Recognized | | Cash Collateral | | Derivative Instruments | | Net Amount |
| | (Dollars in thousands) | (Dollars in thousands) |
| Derivative Assets: | | | | | | | | |
| Derivative Assets | | | | | | | | |
| Commodity derivatives | $ | 223,133 |
| | $ | — |
| | $ | 27,357 |
| | $ | 195,776 |
| $ | 159,617 |
| | $ | — |
| | $ | 27,199 |
| | $ | 132,418 |
|
| Foreign exchange derivatives | 18,814 |
| | — |
| | 3,792 |
| | 15,022 |
| 5,518 |
| | — |
| | 3,632 |
| | 1,886 |
|
| Embedded derivative asset | 20,557 |
| | — |
| | — |
| | 20,557 |
| 17,933 |
| | — |
| | — |
| | 17,933 |
|
| Total | $ | 262,504 |
| | $ | — |
| | $ | 31,149 |
| | $ | 231,355 |
| $ | 183,068 |
| | $ | — |
| | $ | 30,831 |
| | $ | 152,237 |
|
| Derivative Liabilities: | | | | | | | | |
| Derivative Liabilities | | | | | | | | |
| Commodity derivatives | $ | 212,028 |
| | $ | 5,446 |
| | $ | 27,357 |
| | $ | 179,225 |
| $ | 183,025 |
| | $ | 3,030 |
| | $ | 37,749 |
| | $ | 142,246 |
|
| Foreign exchange derivatives | 4,582 |
| | — |
| | 3,792 |
| | 790 |
| 19,297 |
| | — |
| | 3,632 |
| | 15,665 |
|
| Total | $ | 216,610 |
| | $ | 5,446 |
| | $ | 31,149 |
| | $ | 180,015 |
| $ | 202,322 |
| | $ | 3,030 |
| | $ | 41,381 |
| | $ | 157,911 |
|
| | | | August 31, 2018 | August 31, 2019 |
| | | | Amounts Not Offset on the Consolidated Balance Sheet but Eligible for Offsetting | | | | | Amounts Not Offset on Condensed Consolidated Balance Sheet but Eligible for Offsetting | | |
| | Gross Amounts Recognized | | Cash Collateral | | Derivative Instruments | | Net Amounts | Gross Amount Recognized | | Cash Collateral | | Derivative Instruments | | Net Amount |
| | (Dollars in thousands) | (Dollars in thousands) |
| Derivative Assets: | | | | | | | | |
| Derivative Assets | | | | | | | | |
| Commodity derivatives | $ | 313,033 |
| | $ | — |
| | $ | 26,781 |
| | $ | 286,252 |
| $ | 215,030 |
| | $ | — |
| | $ | 58,726 |
| | $ | 156,304 |
|
| Foreign exchange derivatives | 15,401 |
| | — |
| | 8,703 |
| | 6,698 |
| 10,334 |
| | — |
| | 7,108 |
| | 3,226 |
|
| Embedded derivative asset | 23,595 |
| | — |
| | — |
| | 23,595 |
| 21,364 |
| | — |
| | — |
| | 21,364 |
|
| Total | $ | 352,029 |
| | $ | — |
| | $ | 35,484 |
| | $ | 316,545 |
| $ | 246,728 |
| | $ | — |
| | $ | 65,834 |
| | $ | 180,894 |
|
| Derivative Liabilities: | | | | | | | | |
| Derivative Liabilities | | | | | | | | |
| Commodity derivatives | $ | 421,054 |
| | $ | 12,983 |
| | $ | 26,781 |
| | $ | 381,290 |
| $ | 223,410 |
| | $ | 4,191 |
| | $ | 41,647 |
| | $ | 177,572 |
|
| Foreign exchange derivatives | 24,701 |
| | — |
| | 8,703 |
| | 15,998 |
| 20,609 |
| | — |
| | 7,108 |
| | 13,501 |
|
| Total | $ | 445,755 |
| | $ | 12,983 |
| | $ | 35,484 |
| | $ | 397,288 |
| $ | 244,019 |
| | $ | 4,191 |
| | $ | 48,755 |
| | $ | 191,073 |
|
Derivative assets and liabilities with maturities of 12 months or less are recorded in derivativeother current assets and derivativeother current liabilities, respectively, on our Condensed Consolidated Balance Sheets. Derivative assets and liabilities with maturities greater than 12 months are recorded in other assets and other liabilities, respectively, on our Condensed Consolidated Balance Sheets. The amount of long-term derivative assets, and liabilities, excluding derivatives accounted fordesignated as cash flow or fair value hedges, recorded on our Condensed Consolidated Balance SheetSheets at February 28,November 30, 2019, were $25.4and August 31, 2019, was $18.6 million and $3.2$26.6 million, respectively. The amount of long-term derivative assets and liabilities, excluding derivatives accounted fordesignated as cash flow or fair value hedges, recorded on our Consolidated Balance Sheet at August 31, 2018, were $23.1 million and $7.9 million, respectively.
hedges, recorded on our Condensed Consolidated Balance Sheets at November 30, 2019, and August 31, 2019, was $6.8 million and $7.4 million, respectively.
The majority of our derivative instruments have not been designated as hedging instruments. The following table sets forth the pretax gains (losses) on derivatives not accounted for as hedging instruments that have been included in our Condensed Consolidated Statements of Operations for the three and six months ended February 28,November 30, 2019, and 2018.
| | | | | For the Three Months Ended
February 28, | | For the Six Months Ended February 28, | | Three Months Ended
November 30, |
| | Location of Gain (Loss) | | 2019 | | (As Restated) 2018 | | 2019 | | (As Restated) 2018 | Location of Gain (Loss) | | 2019 | | 2018 |
| | | (Dollars in thousands) | | (Dollars in thousands) |
| Commodity derivatives | Cost of goods sold | | $ | 72,010 |
| | $ | (113,961 | ) | | $ | 65,563 |
| | $ | (81,045 | ) | Cost of goods sold | | $ | 42,674 |
| | $ | (6,448 | ) |
| Foreign exchange derivatives | Cost of goods sold | | 8,284 |
| | (5,818 | ) | | 27,981 |
| | 948 |
| Cost of goods sold | | (10,161 | ) | | 16,056 |
|
| Foreign exchange derivatives | Marketing, general and administrative | | (583 | ) | | 344 |
| | (1,414 | ) | | (151 | ) | Marketing, general and administrative expenses | | 1,743 |
| | (832 | ) |
| Interest rate derivatives | Interest expense | | — |
| | (1 | ) | | — |
| | (1 | ) | |
| Embedded derivative | Other income | | 392 |
| | 433 |
| | 1,963 |
| | 2,171 |
| Other income | | 1,569 |
| | 1,571 |
|
| Total | Total | | $ | 80,103 |
| | $ | (119,003 | ) | | $ | 94,093 |
| | $ | (78,078 | ) | Total | | $ | 35,825 |
| | $ | 10,347 |
|
Commodity Contracts
As of February 28,November 30, 2019, and August 31, 2018,2019, we had outstanding commodity futures and options contracts that were used as economic hedges, as well as fixed-price forward contracts related to physical purchases and sales of commodities. The table below presents the notional volumes for all outstanding commodity and freight contracts accounted for as derivative instruments.
|
| | | | | | | | | | | |
| | February 28, 2019 | | August 31, 2018 |
| | Long | | Short | | Long | | Short |
| | (Units in thousands) |
| Grain and oilseed - bushels | 584,349 |
| | 776,597 |
| | 715,866 |
| | 929,873 |
|
| Energy products - barrels | 18,674 |
| | 8,884 |
| | 17,011 |
| | 8,329 |
|
| Processed grain and oilseed - tons | 1,676 |
| | 1,593 |
| | 1,064 |
| | 2,875 |
|
| Crop nutrients - tons | 12 |
| | 58 |
| | 11 |
| | 76 |
|
| Ocean freight - metric tons | 85 |
| | 90 |
| | 227 |
| | 45 |
|
| Natural gas - MMBtu | — |
| | — |
| | 610 |
| | — |
|
|
| | | | | | | | | | | |
| | November 30, 2019 | | August 31, 2019 |
| | Long | | Short | | Long | | Short |
| | (Units in thousands) |
| Grain and oilseed (bushels) | 546,758 |
| | 733,722 |
| | 547,096 |
| | 717,522 |
|
| Energy products (barrels) | 9,705 |
| | 5,363 |
| | 13,895 |
| | 4,663 |
|
| Processed grain and oilseed (tons) | 454 |
| | 2,753 |
| | 597 |
| | 2,454 |
|
| Crop nutrients (tons) | 73 |
| | 29 |
| | 76 |
| | 23 |
|
| Ocean freight (metric tons) | 200 |
| | 55 |
| | 295 |
| | 85 |
|
| Natural gas (MMBtu) | 60 |
| | — |
| | 130 |
| | — |
|
Foreign Exchange Contracts
We conduct a substantial portion of our business in U.S. dollars, but we are exposed to risk regardingrisks relating to foreign currency fluctuations even though a substantial amountprimarily due to global grain marketing transactions in South America, the Asia Pacific region and Europe, and purchases of our international sales are denominated in U.S. dollars. In addition to specific transactional exposure,products from Canada. We use foreign currency derivative instruments to mitigate the impact of exchange rate fluctuations. Although we have some risk exposure relating to foreign currency transactions, a larger impact with exchange rate fluctuations can impactis the ability of foreign buyers to purchase U.S. agricultural products and the competitiveness of U.S. agricultural products compared to the same products offered by alternative sources of world supply. From time to time, we enter into foreign currency hedge contracts to minimize the impact of currency fluctuations on our transactional exposures. The notional amounts of our foreign exchange derivative contracts were $839.5$972.2 million and $988.8$894.7 million as of February 28,November 30, 2019, and August 31, 2018,2019, respectively.
Embedded Derivative Asset
Under the terms of our strategic investment in CF Nitrogen, if the CF Industries'Industries credit rating is reduced below certain levels by two of three specified credit ratings agencies, we are entitled to receive a non-refundablenonrefundable annual payment of $5.0 million from CF Industries each yearIndustries. These payments will continue on an annual basis until the date that the CF Industries'Industries credit rating is upgraded to or above certain levels by two of the three specified credit ratings agencies or February 1, 2026, whichever is earlier.
Since the CF Industries credit rating was reduced below the specified levels during fiscal 2017, we have received an annual payment of $5.0 million from CF Industries. Gains totaling $1.6 million were recognized in other income in our Condensed Consolidated Statements of Operations for the periods ended November 30, 2019 and 2018. The fair value of the embedded derivative asset recorded on our Condensed Consolidated Balance Sheet as of February 28,November 30, 2019, was equal to $20.6$17.9 million. The current and long-term portions of the embedded derivative asset are included in derivativeother current assets and other assets on our Consolidated Balance Sheets, respectively. See Note 14, Fair Value Measurements, for more information on the valuation of the embedded derivative asset.
other assets on our Condensed Consolidated Balance Sheets, respectively. See Note 12, Fair Value Measurements, for additional information regarding valuation of the embedded derivative asset.
Derivatives Designated as Fair Value or Cash Flow or Fair Value Hedging Strategies
Fair Value Hedges
As of February 28,November 30, 2019, and August 31, 2018,2019, we had outstanding interest rate swaps with an aggregate notional amount of $495.0$365.0 million designated as fair value hedges of portions of our fixed-rate debt that is due between fiscal 20192021 and fiscal 2025. Our objective in entering into these transactions is to offset changes in the fair value of the debt associated with the risk of variability in the three-month U.S. dollar LIBOR interest rate ("LIBOR"), in essence converting the fixed-rate debt to variable-rate debt. Under these interest rate swaps, we receive fixed-rate interest payments and make interest payments based on the three-month LIBOR. Offsetting changes in the fair values of both the swap instruments and the hedged debt are recorded contemporaneously each period and only create an impact to earnings to the extent that the hedge is ineffective.
The following table presents the fair value of our derivative interest rate swap instruments designated as fair value hedges and the line itemsitem on our Condensed Consolidated Balance Sheets in which they are recorded.
| | | | | Derivative Assets | | Derivative Liabilities | | | | | |
| Balance Sheet Location | | February 28, 2019 | | August 31, 2018 | | Balance Sheet Location | | February 28, 2019 | | August 31, 2018 | | November 30, 2019 | | August 31, 2019 |
| | | (Dollars in thousands) | | (Dollars in thousands) | | (Dollars in thousands) |
| Derivative assets | | $ | — |
| | $ | — |
| | Derivative liabilities | | $ | 332 |
| | $ | 771 |
| |
| Other assets | | 377 |
| | — |
| | Other liabilities | | 4,401 |
| | 8,681 |
| | $ | 6,886 |
| | $ | 9,841 |
|
| Total | | $ | 377 |
| | $ | — |
| | Total | | $ | 4,733 |
| | $ | 9,452 |
| |
The following table sets forth the pretax gains (losses) on derivatives accounted for as hedging instruments that have been included in our Condensed Consolidated Statements of Operations for the three and six months ended February 28,November 30, 2019 and 2018.
| | | | | For the Three Months Ended February 28, | | For the Six Months Ended February 28, | | Three Months Ended
November 30, |
| Gain (Loss) on Fair Value Hedging Relationships: | | Location of Gain (Loss) | | 2019 | | 2018 | | 2019 | | 2018 | |
| Gain (Loss) on Fair Value Hedging Relationships | | | Location of Gain (Loss) | | 2019 | | 2018 |
| | | (Dollars in thousands) | | (Dollars in thousands) |
| Interest rate swaps | | Interest expense | | $ | (6,052 | ) | | $ | (9,571 | ) | | $ | (7,007 | ) | | $ | (17,888 | ) | | Interest expense | | $ | (2,955 | ) | | $ | (955 | ) |
| Hedged item | | Interest expense | | 6,052 |
| | 9,571 |
| | 7,007 |
| | 17,888 |
| | Interest expense | | 2,955 |
| | 955 |
|
| Total | Total | | $ | — |
| | $ | — |
| | $ | — |
| | $ | — |
| Total | | $ | — |
| | $ | — |
|
The following table provides the location and carrying amount of hedged liabilities in our Condensed Consolidated Balance Sheets as of February 28,November 30, 2019, and August 31, 2018.2019.
| | | | | February 28, 2019 | | August 31, 2018 | | November 30, 2019 | | August 31, 2019 |
| Balance Sheet Location | | Carrying Amount of Hedged Liabilities | | Cumulative Amount of Fair Value Hedging Adjustments Included in the Carrying Amount of Hedged Liabilities | | Carrying Amount of Hedged Liabilities | | Cumulative Amount of Fair Value Hedging Adjustments Included in the Carrying Amount of Hedged Liabilities | | Carrying Amount of Hedged Liabilities | | Cumulative Amount of Fair Value Hedging Adjustments Included in Carrying Amount of Hedged Liabilities | | Carrying Amount of Hedged Liabilities | | Cumulative Amount of Fair Value Hedging Adjustments Included in Carrying Amount of Hedged Liabilities |
| | | (Dollars in thousands) | | (Dollars in thousands) |
| Long-term debt | | $ | 478,541 |
| | $ | 16,459 |
| | $ | 485,548 |
| | $ | 9,452 |
| | $ | 331,435 |
| | $ | 33,565 |
| | $ | 334,389 |
| | $ | 30,611 |
|
Cash Flow Hedges
In the fourth quarter of fiscal 2018, our Energy segment began designating certain of its pay-fixed, receive-variable, cash-settled swaps as cash flow hedges of future crude oil purchases. We also began designating certain pay-variable, receive-fixed, cash-settled swaps as cash flow hedges of future refined product sales. These hedging instruments and the related hedged items are exposed to significant market price risk and potential volatility. As part of our risk management strategy, we look to hedge a portion of our expected future crude oil needs and the resulting refined product output based on prevailing futures prices, management's expectations about future commodity price changes and our risk appetite. As of February 28,November 30, 2019, and August 31, 2018,2019, the aggregate notional amount of cash flow hedges was 5.99.1 million and 1.17.7 million barrels, respectively.
The following table presents the fair value of our commodity derivative instruments designated as cash flow hedges and the line items on our Condensed Consolidated Balance Sheets in which they are recorded.
| | | | | Derivative Assets | | Derivative Liabilities | | Derivative Assets | | Derivative Liabilities |
| Balance Sheet Location | | February 28, 2019 | | August 31, 2018 | | Balance Sheet Location | | February 28, 2019 | | August 31, 2018 | | November 30, 2019 | | August 31, 2019 | | Balance Sheet Location | | November 30, 2019 | | August 31, 2019 |
| | | (Dollars in thousands) | | (Dollars in thousands) | | (Dollars in thousands) | | (Dollars in thousands) |
| Derivative assets | | $ | 13,822 |
| | $ | 812 |
| | Derivative liabilities | | $ | 1,937 |
| | $ | 634 |
| |
| Other current assets | | | $ | 26,112 |
| | $ | 33,179 |
| | Other current liabilities | | $ | 5,387 |
| | $ | 5,351 |
|
The following table presents the pretax gains (losses)losses recorded in other comprehensive income relating to cash flow hedges for the three and six months ended February 28,November 30, 2019 and 2018:
|
| | | | | | | | | | | | | | | | |
| | | For the Three Months Ended February 28, | | For the Six Months Ended February 28, |
| | | 2019 | | 2018 | | 2019 | | 2018 |
| | | (Dollars in thousands) |
| Commodity derivatives | | $ | 14,170 |
| | $ | — |
| | $ | 11,707 |
| | $ | — |
|
|
| | | | | | | | |
| | | Three Months Ended
November 30, |
| | | 2019 | | 2018 |
| | | (Dollars in thousands) |
| Commodity derivatives | | $ | (7,103 | ) | | $ | (2,463 | ) |
The following table presents the pretax gains (losses) relating to cash flow hedges that were reclassified from accumulated other comprehensive loss into our Condensed Consolidated Statements of Operations for the three and six months ended February 28,November 30, 2019 and 2018:
|
| | | | | | | | | | | | | | | | | |
| | | | For the Three Months Ended February 28, | | For the Six Months Ended February 28, |
| | Location of Gain (Loss) | | 2019 | | 2018 | | 2019 | | 2018 |
| | | | (Dollars in thousands) |
| Commodity derivatives | Cost of goods sold | | $ | 6,102 |
| | $ | — |
| | $ | 8,002 |
| | $ | — |
|
|
| | | | | | | | | |
| | | | Three Months Ended
November 30, |
| | Location of Gain | | 2019 | | 2018 |
| | | | (Dollars in thousands) |
| Commodity derivatives | Cost of goods sold | | $ | 4,852 |
| | $ | 1,900 |
|
Note 1412 Fair Value Measurements
ASC Topic 820, Fair Value Measurements and Disclosures, defines fair value as the price that would be received for an asset or paid to transfer a liability (an exit price) in the principal or most advantageous market for the asset or liability in an orderly transaction between market participants on the measurement date. The standard also establishes a hierarchy for inputs used in measuring fair value, which requires an entity to maximize the use of observable inputs and minimize the use of unobservable inputs when measuring fair value. Observable inputs are inputs or market data that a market participant would obtain from independent sources to value the asset or liability. Unobservable inputs are inputs that reflect our assumptions about the factors market participants would use in valuing the asset or liability developed based uponon the best information available in the circumstances. The fair value hierarchy consists of three levels.levels: Level 1 inputs are quoted prices (unadjusted) in active markets for identical assets or liabilities. Level 2 inputs include quoted prices for similar assets or liabilities in active markets, quoted prices for identical or similar assets or liabilities in markets that are not active, and inputs (other than quoted prices) that are observable for the asset or liability, either directly or indirectly. Level 3 inputs are unobservable inputs for the asset or liability. Categorization within the valuation hierarchy is based upon the lowest level of input that is significant to the fair value measurement.
Recurring fair value measurements at February 28,November 30, 2019, and August 31, 2018,2019, are as follows:
| | | | February 28, 2019 | November 30, 2019 |
| | Quoted Prices in Active Markets for Identical Assets (Level 1) | | Significant Other Observable Inputs (Level 2) | | Significant Unobservable Inputs (Level 3) | | Total | Quoted Prices in Active Markets for Identical Assets (Level 1) | | Significant Other Observable Inputs (Level 2) | | Significant Unobservable Inputs (Level 3) | | Total |
| | (Dollars in thousands) | (Dollars in thousands) |
| Assets: | |
| | |
| | |
| | |
| |
| Assets | | |
| | |
| | |
| | |
|
| Commodity derivatives | $ | 52,318 |
| | $ | 184,637 |
| | $ | — |
| | $ | 236,955 |
| $ | 26,343 |
| | $ | 159,387 |
| | $ | — |
| | $ | 185,730 |
|
| Foreign currency derivatives | — |
| | 18,893 |
| | — |
| | 18,893 |
| |
| Foreign exchange derivatives | | — |
| | 5,606 |
| | — |
| | 5,606 |
|
| Interest rate swap derivatives | — |
| | 377 |
| | — |
| | 377 |
| — |
| | 6,886 |
| | — |
| | 6,886 |
|
| Deferred compensation assets | 38,703 |
| | — |
| | — |
| | 38,703 |
| 46,754 |
| | — |
| | — |
| | 46,754 |
|
| Embedded derivative asset | — |
| | 20,557 |
| | — |
| | 20,557 |
| — |
| | 17,933 |
| | — |
| | 17,933 |
|
| Segregated investments | | 91,080 |
| | — |
| | — |
| | 91,080 |
|
| Other assets | 5,495 |
| | — |
| | — |
| | 5,495 |
| 6,082 |
| | — |
| | — |
| | 6,082 |
|
| Total | $ | 96,516 |
| | $ | 224,464 |
| | $ | — |
| | $ | 320,980 |
| $ | 170,259 |
| | $ | 189,812 |
| | $ | — |
| | $ | 360,071 |
|
| Liabilities: | |
| | |
| | | | |
| |
| Liabilities | | |
| | |
| | | | |
|
| Commodity derivatives | $ | 22,743 |
| | $ | 191,222 |
| | $ | — |
| | $ | 213,965 |
| $ | 36,032 |
| | $ | 152,380 |
| | $ | — |
| | $ | 188,412 |
|
| Foreign currency derivatives | — |
| | 4,592 |
| | — |
| | 4,592 |
| |
| Interest rate swap derivatives | — |
| | 4,733 |
| | — |
| | 4,733 |
| |
| Foreign exchange derivatives | | — |
| | 19,297 |
| | — |
| | 19,297 |
|
| Total | $ | 22,743 |
| | $ | 200,547 |
| | $ | — |
| | $ | 223,290 |
| $ | 36,032 |
| | $ | 171,677 |
| | $ | — |
| | $ | 207,709 |
|
| | | | August 31, 2018 | August 31, 2019 |
| | Quoted Prices in Active Markets for Identical Assets (Level 1) | | Significant Other Observable Inputs (Level 2) | | Significant Unobservable Inputs (Level 3) | | Total | Quoted Prices in Active Markets for Identical Assets (Level 1) | | Significant Other Observable Inputs (Level 2) | | Significant Unobservable Inputs (Level 3) | | Total |
| | (Dollars in thousands) | (Dollars in thousands) |
| Assets: | | | | | | | | |
| Assets | | | | | | | | |
| Commodity derivatives | $ | 54,487 |
| | $ | 259,359 |
| | $ | — |
| | $ | 313,846 |
| $ | 67,817 |
| | $ | 180,392 |
| | $ | — |
| | $ | 248,209 |
|
| Foreign currency derivatives | — |
| | 15,401 |
| | — |
| | 15,401 |
| |
| Foreign exchange derivatives | | — |
| | 10,339 |
| | — |
| | 10,339 |
|
| Interest rate swap derivatives | | — |
| | 9,841 |
| | — |
| | 9,841 |
|
| Deferred compensation assets | 39,073 |
| | — |
| | — |
| | 39,073 |
| 40,368 |
| | — |
| | — |
| | 40,368 |
|
| Embedded derivative asset | — |
| | 23,595 |
| | — |
| | 23,595 |
| — |
| | 21,364 |
| | — |
| | 21,364 |
|
| Segregated investments | | 77,777 |
| | — |
| | — |
| | 77,777 |
|
| Other assets | 5,334 |
| | — |
| | — |
| | 5,334 |
| 6,519 |
| | — |
| | — |
| | 6,519 |
|
| Total | $ | 98,894 |
| | $ | 298,355 |
| | $ | — |
| | $ | 397,249 |
| $ | 192,481 |
| | $ | 221,936 |
| | $ | — |
| | $ | 414,417 |
|
| Liabilities: | | | | | | | | |
| Liabilities | | | | | | | | |
| Commodity derivatives | $ | 31,778 |
| | $ | 389,911 |
| | $ | — |
| | $ | 421,689 |
| $ | 40,305 |
| | $ | 188,455 |
| | $ | — |
| | $ | 228,760 |
|
| Foreign currency derivatives | — |
| | 24,701 |
| | — |
| | 24,701 |
| |
| Interest rate swap derivatives | — |
| | 9,452 |
| | — |
| | 9,452 |
| |
| Foreign exchange derivatives | | — |
| | 20,701 |
| | — |
| | 20,701 |
|
| Total | $ | 31,778 |
| | $ | 424,064 |
| | $ | — |
| | $ | 455,842 |
| $ | 40,305 |
| | $ | 209,156 |
| | $ | — |
| | $ | 249,461 |
|
Commodity and foreign currencyexchange derivatives —. Exchange-traded futures and options contracts are valued based on unadjusted quoted prices in active markets and are classified within Level 1. Our forward commodity purchase and sales contracts with fixed-price components, select ocean freight contracts and other over-the-counter ("OTC") derivatives are determined using inputs that are generally based on exchange traded prices and/or recent market bids and offers, adjusted for location-specificlocation specific inputs, and are classified within Level 2. The location-specificLocation-specific inputs are driven by local market supply and demand and are generally based on broker or dealer quotations or market transactions in either the listed or OTC markets. Changes in the fair values of these contracts are recognized in our Condensed Consolidated Statements of Operations as a component of cost of goods sold.
Interest rate swap derivatives —. Fair values of our interest rate swap derivatives are determined utilizingusing valuation models that are widely accepted in the market to value these OTC derivative contracts. The specific terms of the contracts, as well as
well as market observable inputs, such as interest rates and credit risk assumptions, are factored into the models. As all significant inputs are market observable, all interest rate swaps are classified within Level 2. Changes in the fair values of contracts not designated as hedging instruments for accounting purposes are recognized in our Condensed Consolidated Statements of Operations as a component of interest expense. See Note 13,11, Derivative Financial Instruments and Hedging Activities, for additional information about interest rate swaps designated as fair value and cash flow hedges.
Deferred compensation and other assets —. Our deferred compensation investments Rabbi Trustconsist primarily of rabbi trust assets and available-for-sale investments in common stock of other companiesthat are valued based on unadjusted quoted prices on active exchanges and are classified within Level 1. Changes in the fair values of these other assets are primarily recognized in our Condensed Consolidated Statements of Operations as a component of marketing, general and administrative expenses.
Embedded derivative asset —. The embedded derivative asset relates to contingent payments inherent into our investment in CF Nitrogen. The inputs intoused in the fair value measurement include the probability of future upgrades and downgrades of the CF Industries'Industries credit rating based on historical credit rating movements of other public companies and the discount rates to be applied to potential annual payments based on applicable historical and current yield coupon rates. Any actual upgrades or downgrades to CF Industries' credit rating could also impact the fair value of the embedded derivative asset. Based on these observable inputs, our fair value measurement is classified within Level 2. See Note 13,11, Derivative Financial Instruments and Hedging Activities, for additional information.
Segregated investments. Our segregated investments are comprised of U.S. Treasury securities, which are valued using quoted market prices and classified within Level 1.
There were no material transfers between Level 1, Level 2 and Level 3 assets and liabilities during the three or six months ended February 28,November 30, 2019.
Note 1513 Commitments and Contingencies
Environmental
We are required to comply with various environmental laws and regulations incidental to our normal business operations. In order toTo meet our compliance requirements, we establish reserves for the probable future costs of remediation of identified issues, which are included in cost of goods sold and marketing, general and administrative expenses in our Condensed Consolidated Statements of Operations. The resolution of any such matters may affect consolidated net income for any fiscal period; however, we believe any resulting liabilities, individually or in the aggregate, will not have a material effect on our condensed consolidated financial position, results of operations or cash flowsstatements during any fiscal year.
Other Litigation and Claims
We are involved as a defendant in various lawsuits, claims and disputes, which are in the normal course of our business. The resolution of any such matters may affect consolidated net income for any fiscal period; however, we believe any resulting liabilities, individually or in the aggregate, will not have a material effect on our condensed consolidated financial position, results of operations or cash flowsstatements during any fiscal year.
Guarantees
We are a guarantor for lines of credit and performance obligations of related, non-consolidated companies. As of February 28, 2019, ourOur bank covenants allowedallow maximum guarantees of $1.0 billion, of which $197.1$178.3 million were outstanding.outstanding on November 30, 2019. We have collateral for a portion of these contingent obligations. We have not recorded a liability related to the contingent obligations as we do not expect to pay out any cash related to them, and the fair values are considered immaterial. The underlying loans to the counterparties for which we provide these guarantees were current as of February 28,November 30, 2019.
Note 16 Subsequent Events14 Leases
We adopted ASC Topic 842 on September 1, 2019, using the modified retrospective approach. In addition, we used the additional optional transition method and package of practical expedients in the period of adoption without retrospective adjustment to previous periods presented, although we elected not to apply the hindsight practical expedient. As a result of using the additional optional transition method and following a modified retrospective approach, prior periods have not been restated, and a $33.7 million cumulative-effect adjustment was recorded to increase the opening balance of capital reserves as of the adoption date related to recognition of previously deferred gains associated with the sale-leaseback of our primary corporate office building located in Inver Grove Heights, Minnesota. Our accounting for finance leases (previously referred to
as capital leases) remains substantially unchanged; however, adoption of ASC Topic 842 resulted in recognition of operating lease right of use assets and associated lease liabilities of $268.4 million and $267.0 million, respectively, as of September 1, 2019. Adoption of ASC Topic 842 did not have a material impact on our Condensed Consolidated Statements of Operations or Condensed Consolidated Statements of Cash Flows.
We assess arrangements at inception to determine whether they contain a lease. An arrangement is considered to contain a lease if it conveys the right to control the use of an asset for a period of time in exchange for consideration. The right to control the use of an asset must include both (a) the right to obtain substantially all economic benefits associated with an identified asset and (b) the right to direct how and for what purpose the identified asset is used. Certain arrangements provide us with the right to use an identified asset; however, most of these arrangements are not considered to represent a lease as we do not control how and for what purpose the identified asset is used. For example, our supply agreements, warehousing and distribution services agreements, and transportation services agreements generally do not contain leases.
We lease property, plant and equipment used in our operations primarily under operating lease agreements and, to a lesser extent, under finance lease agreements. Our operating leases are primarily for railcars, equipment, vehicles and office space, many of which contain renewal options and escalation clauses. Renewal options are included as part of the right of use asset and liability when it is reasonably certain that we will exercise the renewal option; however, renewal options are generally not included as we are not reasonably certain to exercise such options.
Operating lease right of use assets and liabilities for operating leases are recognized at the lease commencement date for leases in excess of 12 months based on the present value of lease payments over the lease term. For measurement and classification of lease agreements, lease and non-lease components are grouped into a single lease component for all asset classes. Variable lease payments are excluded from measurement of right of use assets and liabilities and generally include payments for non-lease components such as maintenance costs, payments for leased assets beyond their noncancelable lease term and payments for other non-lease components such as sales tax. The discount rate used to calculate present value is our collateralized incremental borrowing rate or, if available, the rate implicit in the lease. The incremental borrowing rate is determined for each lease based primarily on its lease term. Certain lease arrangements include rental payments adjusted annually based on changes in an inflation index. Our lease arrangements generally do not contain residual value guarantees or material restrictive covenants.
Lease expense is recognized on a straight-line basis over the lease term. The components of lease expense recognized in our Condensed Consolidated Statements of Operations are as follows:
|
| | | |
| | Three Months Ended November 30, 2019 |
| | (Dollars in thousands) |
| Operating lease expense | $ | 16,480 |
|
| Finance lease expense: | |
| Amortization of assets | 2,189 |
|
| Interest on lease liabilities | 224 |
|
| Short-term lease expense | 3,343 |
|
| Variable lease expense | 116 |
|
| Total net lease expense* | $ | 22,352 |
|
*Income related to sub-lease activity is not material and has been excluded from the table above.
Supplemental balance sheet information related to operating and finance leases is as follows:
|
| | | | | |
| | Balance Sheet Location | | November 30, 2019 |
| | | | (Dollars in thousands) |
| Operating leases | | | |
| Assets | | | |
| Operating lease right of use assets | Other assets | | $ | 259,028 |
|
| Liabilities | | | |
| Current operating lease liabilities | Accrued expenses | | 53,868 |
|
| Long-term operating lease liabilities | Other liabilities | | 204,305 |
|
| Total operating lease liabilities | | $ | 258,173 |
|
| | | | |
| Finance leases | | | |
| Assets | | | |
| Finance lease assets | Property, plant and equipment | | $ | 40,536 |
|
| Liabilities | | | |
| Current finance lease liabilities | Current portion of long-term debt | | 6,049 |
|
| Long-term finance lease liabilities | Long-term debt | | 21,092 |
|
| Total finance lease liabilities | | $ | 27,141 |
|
| | | | |
| Weighted average remaining lease term (in years) | | | |
| Operating leases | | 8.4 |
|
| Finance leases | | 6.3 |
|
| | | | |
| Weighted average discount rate | | | |
| Operating leases | | 3.13 | % |
| Finance leases | | 3.34 | % |
Supplemental cash flow and other information related to operating and finance leases is as follows: |
| | | |
| | Three Months Ended November 30, 2019 |
| | (Dollars in thousands) |
| Cash paid for amounts included in measurement of lease liabilities: | |
| Operating cash flows from operating leases | $ | 15,722 |
|
| Operating cash flows from finance leases | 224 |
|
| Financing cash flows from finance leases | 1,673 |
|
| | |
| Supplemental noncash information: | |
| Right of use assets obtained in exchange for lease liabilities | 4,724 |
|
Maturities of lease liabilities as of November 30, 2019, were as follows:
|
| | | | | | | |
| | November 30, 2019 |
| | Finance Leases | | Operating Leases |
| | (Dollars in thousands) |
| Remainder of fiscal 2020 | $ | 4,790 |
| | $ | 45,821 |
|
| Fiscal 2021 | 6,190 |
| | 53,054 |
|
| Fiscal 2022 | 5,045 |
| | 40,159 |
|
| Fiscal 2023 | 4,452 |
| | 31,851 |
|
| Fiscal 2024 | 2,685 |
| | 24,958 |
|
| After fiscal 2024 | 7,228 |
| | 105,730 |
|
| Total maturities of lease liabilities | 30,390 |
| | 301,573 |
|
| Less amounts representing interest | 3,249 |
| | 43,400 |
|
| Present value of future minimum lease payments | 27,141 |
| | 258,173 |
|
| Less current obligations | 6,049 |
| | 53,868 |
|
| Long-term obligations | $ | 21,092 |
| | $ | 204,305 |
|
Disclosures Related to Periods Prior to Adoption of New Lease Standard
The following pertains to previously disclosed information from Note 6, Property, Plant and Equipment, and Note 15, Commitments and Contingencies, contained in our Annual Report on Form 10-K for the fiscal year ended August 31, 2019, which incorporates information about leases now in the scope of ASC Topic 842 discussed above. Total rental expense for operating leases was $113.3 million, $88.5 million and $81.3 million for the years ended August 31, 2019, 2018 and 2017, respectively. Various leases under capital lease totaled $62.7 million and $50.0 million as of August 31, 2019 and 2018, respectively. Accumulated amortization on assets under capital leases was $20.6 million and $18.9 million as of August 31, 2019 and 2018, respectively. Minimum future lease payments required under noncancelable capital and operating leases as of August 31, 2019, were as follows:
|
| | | | | | | |
| | August 31, 2019 |
| | Capital Leases | | Operating Leases |
| | (Dollars in thousands) |
| Fiscal 2020 | $ | 6,761 |
| | $ | 87,168 |
|
| Fiscal 2021 | 6,199 |
| | 57,381 |
|
| Fiscal 2022 | 5,021 |
| | 43,665 |
|
| Fiscal 2023 | 4,548 |
| | 34,328 |
|
| Fiscal 2024 | 2,638 |
| | 26,793 |
|
| Thereafter | 6,517 |
| | 92,653 |
|
| Total minimum future lease payments | 31,684 |
| | $ | 341,988 |
|
| Less amount representing interest | 3,445 |
| | |
| Present value of net minimum lease payments | $ | 28,239 |
| | |
Note 15 Acquisitions
On March 1, 2019, we completed our acquisition of West Central Distribution, LLC,the remaining 75% ownership interest in WCD, a full-service wholesale distributor of agronomy products headquarteredthat operates primarily in Willmar, Minnesota,the United States. The purchase price was equal to $113.4 million, including $6.7 million that was previously paid and $106.7 million paid on March 1, 2019.2019, of which the net cash flows were reduced by $8.0 million of cash acquired. Prior to completing this acquisition and through February 28, 2019, we had a 25% ownership interest in West Central Distribution, LLC,WCD, which was accounted for under the equity method of accounting.accounting whereby we shared in the economics of WCD earnings on a pro-rata basis. By acquiring the remaining ownership interest in WCD, we were able to expand our agronomy platform, position ourselves as a leading supply partner to cooperatives and retailers serving growers throughout the United States and add value for our owners. The WCD enterprise value was determined using a discounted cash flow model in which the fair value of the business was estimated based on the earning capacity of WCD. We estimated the fair value of the previously held equity interest to be equal to 25% of the total fair value of WCD, which was implied based on the price we paid for the remaining 75% interest. The acquisition-date fair value of the previous equity interest was $37.8 million
and is included in measurement of the consideration transferred. We recognized a gain of approximately $19.1 million as a result of remeasuring our prior equity interest in WCD held before acquisition of the remaining 75% interest. The gain was included in other income in our Condensed Consolidated Statements of Operations for the third quarter of fiscal 2019.
Preliminary allocation of the purchase price for this transaction resulted in goodwill of $61.4 million, which is nondeductible for tax purposes, and definite-lived intangible assets of $47.2 million. As this acquisition is not considered to have a material impact on our financial statements, pro forma results of operations are not presented. The acquisition resulted in fair value measurements that are not on a recurring basis and did not have a material impact on our Condensed Consolidated Statements of Operations. Purchase accounting has not been finalized and preliminary fair values assigned to the net assets acquired are as follows:
|
| | | |
| | (Dollars in thousands) |
| Cash | $ | 8,033 |
|
| Current assets | 708,764 |
|
| Property, plant and equipment | 44,064 |
|
| Goodwill | 61,358 |
|
| Intangible assets | 47,200 |
|
| Other assets | 55 |
|
| Liabilities | (718,262 | ) |
| Total net assets acquired | $ | 151,212 |
|
Operating results for WCD are included in our Condensed Consolidated Statements of Operations from the day of the acquisition on March 1, 2019, including revenues and a loss before income taxes of $77.8 million and $0.3 million, respectively, for the three months ended November 30, 2019.
ITEM 2. MANAGEMENT’SMANAGEMENT'S DISCUSSION AND ANALYSIS OF FINANCIAL CONDITION AND RESULTS OF OPERATIONS
This Management's Discussion and Analysis of Financial Condition and Results of Operations ("MD&A") is intended to provide a reader of our financial statements with a narrative from the perspective of our management on our financial condition and results of operations, liquidity and certain other factors that may affect our future results. Our MD&A is presented in the following sections:
Restatement
Overview
Business Strategy
Fiscal 2019 Second2020 First Quarter Highlights
Fiscal 20192020 Trends Update
Results of Operations
Liquidity and Capital Resources
Off-Balance Sheet Financing Arrangements
Contractual Obligations
Critical Accounting Policies
Effect of Inflation and Foreign Currency Transactions
Recent Accounting Pronouncements
Our MD&A should be read in conjunction with our Annual Report on Form 10-K for the year ended August 31, 20182019 (including the information presented therein under Risk Factors), as well as the condensed consolidated financial statements and the related notes included in Item 1 of Part I of this Quarterly Report on Form 10-Q.
Restatement
The accompanying MD&A gives effect to certain adjustments made to our previously reported financial information for the three and six months ended February 28, 2018. Due to the restatements of these periods, the data set forth in the accompanying MD&A may not be comparable to discussions and data included in our previously filed Quarterly Report on Form 10-Q for the quarterly period ended February 28, 2018.
Refer to Note 2, Restatement of Previously Issued Financial Information, of the accompanying unaudited financial statements for further details related to the restatement and its impact on our consolidated financial statements.
Overview
CHS Inc. is a diversified company that provides grain, foodsfood, agronomy and energy resources to businesses and consumers on a global scale. As a cooperative, we are owned by farmers, ranchers and member cooperatives across the United States. We also have preferred shareholders that own our five series of preferred stock, all of which are listed and traded on the Nasdaq Global Select Market. We operate in the following three reportable segments:
Energy - produces. Produces and provides primarily for the wholesale distribution and transportation of petroleum products.
Ag - purchases. Purchases and further processes or resells grains and oilseeds originated by our country operations business, by our member cooperatives and by third parties andparties; also serves as a wholesaler and retailer of crop inputs.agronomy products.
Nitrogen Production- consists. Consists solely of our equity method investment in CF Nitrogen and produces and distributes nitrogen fertilizer, a commodity chemical.
In addition, our financing and hedging businesses, along with our non-consolidated wheat milling and food production and distribution joint ventures, have been aggregated within Corporate and Other. Prior to its sale on May 4, 2018, our insurance operations were also included within Corporate and Other.
The condensed consolidated financial statements include the accounts of CHS and all of our wholly-owned and majority-owned subsidiaries and limited liability companies.companies in which we have a controlling interest. The effects of all significant intercompany transactions have been eliminated.
Corporate administrative expenses and interest are allocated to each reporting segment, along with Corporate and Other, based on direct usage foruse of services, such as information technology and legal, and other factors or considerations relevant to the costs incurred.
Management's Focus. When evaluating our operating performance, management focuses on gross profit and income (loss) before income taxes ("IBIT"). As a company that operates heavily in global commodities, there is significant unpredictability and volatility in pricing, costs and global trade volumes. As such,Consequently, we focus on managing the margin we can earn and the resulting income before income taxes.IBIT. Management also focuses on ensuring the strength of the balance sheet strength through the appropriate management of financial liquidity, leverage, capital allocation and cash flow optimization.
Seasonality. Many of our business activities are highly seasonal and our operating results vary throughout the year. Our revenues and income generally trend lower during the second and fourth fiscal quarters and higher during the first and third fiscal quarters.quarters; however, weather or other events may impact this trend, particularly for IBIT. For example, in our Ag segment, our crop nutrients and country operations businessesbusiness generally experienceexperiences higher volumes and income during the fall harvest and spring planting season,seasons, which generally correspond to our first and third fiscal quarters, respectively. Additionally, our agronomy
business generally experiences higher volumes and income during the spring planting season. Our global grain marketing operations are also subject to fluctuations in volume and earningsincome based on producer harvests, world grain prices, demand and global trade volumes. Our Energy segment generally experiences higher volumes and profitability in certain operating areas, such as refined products, in the spring, summer and early fall when gasoline and diesel fuel usageuse by our agricultural producers is highest and is subject to global supply and demand forces. Other energy products, such as propane, also generally experience higher volumes and profitability during the winter heating and fall crop dryingcrop-drying seasons. The graphs below depict the seasonality inherent in our business.businesses, particularly revenue trends that are not impacted as significantly by other events.
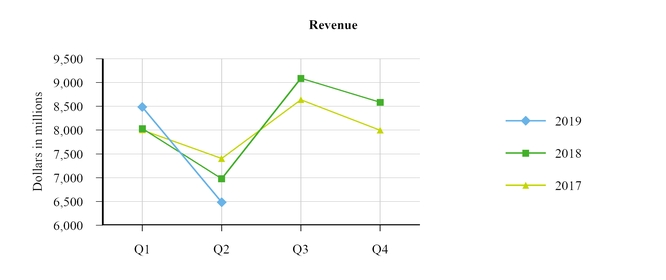
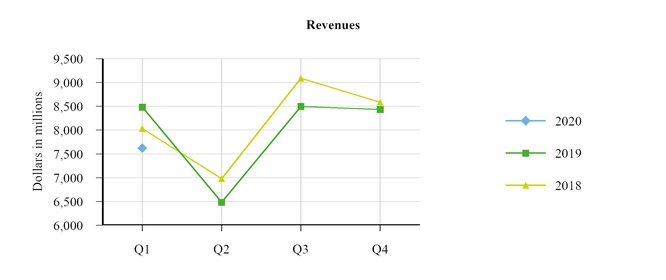
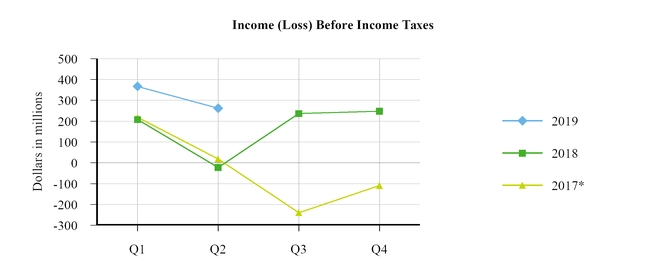
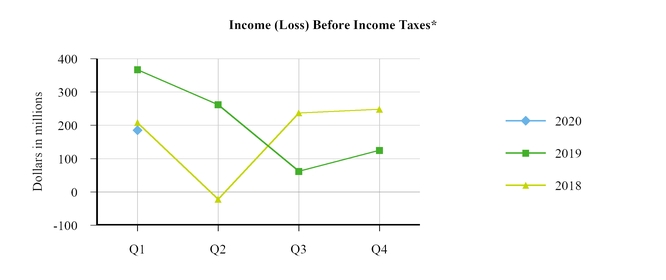
* It should be noted the third quarter of fiscal 2017 was impacted by material charges that caused incomeIncome (loss) before income taxes for that period to deviateexperienced deviations from historical trends.
gains on sales of noncore assets, recoveries of previously recorded losses and a combination of other factors, including poor weather conditions that negatively impacted our Ag segment operations.
Pricing and Volumes. Our revenues, assets and cash flows can be significantly affected by global market prices forand sales volumes of commodities such as petroleum products, natural gas, grains, oilseed products and crop nutrients.agronomy products. Changes in market prices for commodities that we purchase without a corresponding change in the selling prices of those products can affect revenues and operating earnings. Similarly, increased or decreased sales volumes without a corresponding change in the purchase and selling prices of those products can affect revenues and operating earnings. Commodity prices and sales volumes are affected by a wide range of factors beyond our control, including the weather, crop damage due to plant disease or insects, drought, availability/adequacy of supply of the relateda commodity, availability of reliable rail and river transportation network, government regulations/policies, world events, global trade disputes and general political/economic conditions.
Business Strategy
Our business strategy isstrategies focus on an enterprise-wide effort to helpcreate an experience that empowers customers to make CHS their first choice, expands market access to add value for our owners, grow by maximizing returns and optimizing our various operations to ensure thattransforms and evolves our core businesses are strategically positioned today and for the future. We are focusingby capitalizing on improving efficiency and, when necessary, disposing of assets that are not strategic and/or do not meet our internal measurement expectations. We are also focusingchanging market dynamics. To execute on making selective growth capital investments that will help to drive future growth opportunities. In addition,these strategies, we are focused on the implementing agile, efficient and sustainable new technology platforms; building robust and efficient supply chains; hiring, developing and retaining high-performing, diverse and passionate teams; achieving operational excellence and continuous improvement; and maintaining financial flexibility by optimizing debt levels and ensuring adequate financial liquidity so we can effectively operate throughout the agriculture and energy economic cycles.a strong balance sheet.
Fiscal 2019 Second2020 First Quarter Highlights
Margins were higherLess advantageous market conditions in our Energy segmentrefined fuels business resulted in a significant decrease in IBIT compared to the same period during the prior year, results due to favorableprimarily driven by decreased Western Canadian Select ("WCS") crude oil differentials experienced on heavy Canadian crude oil, pricing which is processed by our refineries.
Our equity method investments in CF Nitrogen and Ventura Foods had improved earnings compared to the prior year.
A gain contingency was resolved in the second quarter which allowed us to recognize a $80.8 million gain. This gain was recordedStrong supply chain performance in our Energy segmentpropane business was a significant positive contributor to our results. We were able to efficiently source propane for our customers during a period of significant propane demand for crop drying and home heating.
Poor weather conditions during fiscal 2019 continued to negatively impact our Ag segment's operations, including lower crop yields and poor grain quality following a late harvest, as a reduction of cost of goods sold ("COGS")well as a result of certain excise tax credits associated with changes we made in our manufacturing processes which allowed us to take advantage of these credits. We are uncertain about whether similar gains may reoccur inlower crop nutrient sales that traditionally occur during the future.fall.
We experiencedcontinued to experience significant pressure on grain volumevolumes and marginmargins due to slowerslow movement of grain, related to price, weather and logistics as well aswhich was associated with uncertainty in the grain markets duerelated to unresolved trade issues between the United States and its trading partners.
We continued to devote considerable resources toward implementation of our new enterprise resource planning ("ERP") software, which will provide an improved platform to execute upon our business strategies.
As more fully described in Item 4 of Part I of this Quarterly Report on Form 10-Q, we continued dedicating significant internal and external resources, as well as executive and board focus, to improving our control environment.
Fiscal 20192020 Trends Update
Our Ag and Energy businesses operate in cyclical environments. The energy industry continued to experience favorable market conditions experienced by the Energy business during the first half of fiscal 2019, most notably heavy Canadian crude oil prices, during the second quarter of fiscal 2019, which ledprice differentials, returned to higher margins and improved earnings at our refineries. The favorable market conditions experienced by the energy industry as a whole in the first half of fiscal 2019 are expected to generally remain favorable during the second half of fiscal 2019; however, we believe that these market conditions will not be as favorablelower, more normalized levels during the second half of fiscal 2019 asand the first halfquarter of fiscal 2019.2020. Although unforeseen market conditions could positively or negatively impact the energy industry, we expect the normalized market conditions experienced by our Energy segment during the first quarter of fiscal 2020 to remain throughout fiscal 2020. The agricultural industry continues to operate in a challenging environment characterized by lower margins, reduced liquidity and increased leverage that have resulted from reduced commodity prices. In particular, the ethanol industry continues to suffer from excess capacity which has resulted in an overall over supply of product in the market. In addition, trade disputesrelations between the United States and foreign tradingtrade partners, particularly those that purchase large quantities of agricultural commodities, are strained, resulting in unpredictable impacts to agricultural commodity prices within the agricultural industry now and in the future.volumes sold. We are unable to predict how long the current environment will last or how severe itthe effects will ultimately be at this time.be. In addition to global supply and demand impacts, regional factors including heavy snowfall and flooding in the Upper Midwest, United States, have resulted in the closure of certain fertilizer plants and port facilities thatsuch as unpredictable weather conditions, could continue to impact our operations. As a result, we expect our revenues, margins and cash flows from our core operations in our Ag segment to continue to beremain under pressure throughout fiscal 2020, which also will continue to put pressure on the associated asset valuations.
Results of Operations
Condensed Consolidated Statements of Operations
|
| | | | | | | | | | | | | | | |
| | For the Three Months Ended February 28, | | For the Six Months Ended February 28, |
| | 2019 | | (As Restated) 2018 | | 2019 | | (As Restated) 2018 |
| | (Dollars in thousands) |
| Revenues | $ | 6,483,539 |
| | $ | 6,980,153 |
| | $ | 14,967,828 |
| | $ | 15,012,037 |
|
| Cost of goods sold | 6,056,126 |
| | 6,845,184 |
| | 14,069,774 |
| | 14,556,576 |
|
| Gross profit | 427,413 |
| | 134,969 |
| | 898,054 |
| | 455,461 |
|
| Marketing, general and administrative | 177,429 |
| | 187,558 |
| | 339,925 |
| | 327,904 |
|
| Reserve and impairment charges (recoveries), net | 339 |
| | (11,346 | ) | | (6,014 | ) | | (15,133 | ) |
| Operating earnings (loss) | 249,645 |
| | (41,243 | ) | | 564,143 |
| | 142,690 |
|
| (Gain) loss on disposal of business | — |
| | (7,705 | ) | | (1,412 | ) | | (7,705 | ) |
| Interest expense | 41,269 |
| | 40,176 |
| | 80,177 |
| | 80,878 |
|
| Other (income) loss | (11,763 | ) | | (12,544 | ) | | (35,485 | ) | | (38,739 | ) |
| Equity (income) loss from investments | (41,716 | ) | | (39,441 | ) | | (108,224 | ) | | (77,803 | ) |
| Income (loss) before income taxes | 261,855 |
| | (21,729 | ) | | 629,087 |
| | 186,059 |
|
| Income tax expense (benefit) | 13,551 |
| | (187,688 | ) | | 33,668 |
| | (167,082 | ) |
| Net income (loss) | 248,304 |
| | 165,959 |
| | 595,419 |
| | 353,141 |
|
| Net income (loss) attributable to noncontrolling interests | (462 | ) | | (48 | ) | | (851 | ) | | (512 | ) |
| Net income (loss) attributable to CHS Inc. | $ | 248,766 |
| | $ | 166,007 |
| | $ | 596,270 |
| | $ | 353,653 |
|
|
| | | | | | | | | | | | | |
| | Three Months Ended November 30, |
| | 2019 | | % of Revenues | | 2018 | | % of Revenues |
| | (Dollars in thousands) |
| Revenues | $ | 7,621,485 |
| | 100.0 | % | | $ | 8,484,289 |
| | 100.0 | % |
| Cost of goods sold | 7,295,942 |
| | 95.7 |
| | 8,013,648 |
| | 94.5 |
|
| Gross profit | 325,543 |
| | 4.3 |
| | 470,641 |
| | 5.5 |
|
| Marketing, general and administrative expenses | 168,331 |
| | 2.2 |
| | 156,143 |
| | 1.8 |
|
| Operating earnings | 157,212 |
| | 2.1 |
| | 314,498 |
| | 3.7 |
|
| Interest expense | 34,971 |
| | 0.5 |
| | 38,908 |
| | 0.5 |
|
| Other income | (13,498 | ) | | (0.2 | ) | | (25,134 | ) | | (0.3 | ) |
| Equity income from investments | (49,662 | ) | | (0.7 | ) | | (66,508 | ) | | (0.8 | ) |
| Income before income taxes | 185,401 |
| | 2.4 |
| | 367,232 |
| | 4.3 |
|
| Income tax expense | 6,664 |
| | 0.1 |
| | 20,117 |
| | 0.2 |
|
| Net income | 178,737 |
| | 2.3 |
| | 347,115 |
| | 4.1 |
|
| Net income (loss) attributable to noncontrolling interests | 855 |
| | — |
| | (389 | ) | | — |
|
| Net income attributable to CHS Inc. | $ | 177,882 |
| | 2.3 | % | | $ | 347,504 |
| | 4.1 | % |
41
The charts below detail revenues, net of intersegment revenues, and IBIT by reportable segment for the three and six months ended February 28,November 30, 2019. Our Nitrogen Production reportable segment represents an equity method investment and as suchthat records earnings and allocated expenses, but not revenue.revenues.
Energy Segment Operating Metrics
Our Energy segment operations primarily include our Laurel, Montana, and McPherson, Kansas, refineries, which process crude oil to produce refined products, including gasoline,gasolines, distillates and other products. The following table provides information about our consolidated refinery operations.
| | | | For the Three Months Ended February 28, | | For the Six Months Ended February 28, | Three Months Ended
November 30, |
| | 2019 | | 2018 | | 2019 | | 2018 | 2019 | | 2018 |
| Refinery throughput volumes | (Barrels per day) | (Barrels per day) |
| Heavy, high-sulfur crude oil | 94,198 |
| | 97,136 |
| | 92,912 |
| | 90,989 |
| 84,957 |
| | 101,096 |
|
| All other crude oil | 70,078 |
| | 66,990 |
| | 63,035 |
| | 65,166 |
| 78,819 |
| | 62,881 |
|
| Other feedstocks and blendstocks | 10,356 |
| | 14,158 |
| | 17,092 |
| | 19,173 |
| 17,285 |
| | 17,919 |
|
| Total refinery throughput volumes | 174,632 |
| | 178,284 |
| | 173,039 |
| | 175,328 |
| 181,061 |
| | 181,896 |
|
| Refined fuel yields | | | | | | | | | | |
| Gasolines | 78,403 |
| | 83,880 |
| | 87,266 |
| | 89,221 |
| 92,282 |
| | 89,297 |
|
| Distillates | 77,179 |
| | 74,802 |
| | 67,817 |
| | 68,002 |
| 72,929 |
| | 72,450 |
|
We are subject to the Renewable Fuels Standard, ("RFS"), which requires refiners to blend renewable fuels (e.g., ethanol, biodiesel) into their finished transportation fuels or purchase renewable energy credits, known as Renewable Identification Numbers ("RINs"), in lieu of blending. The U.S. Environmental Protection Agency generally establishes new annual renewable fuel percentage standards for each compliance year in the preceding year. We generate RINS under the RFS in our renewable fuels operations andRINs through our blending activities, at our terminals; but
we cannot generate enough RINs to meet the needs of our refining capacity and RINs must be purchased on the open market. The price of RINs can be volatile and can impact profitability.
In addition to our internal operational reliability, the profitability of our Energy segment is largely driven by crack spreads (e.g., the price differential between refined products and inputs such as crude oil) and WCS crude oil differentials (e.g., the price differential between West Texas Intermediate ("WTI") crude oil and WCS crude oil), which are driven by the supply and demand of global refined product markets. Crack spreads and WCS crude oil differentials each decreased during the secondfirst quarter of fiscal 2020 compared to the first quarter of fiscal 2019, comparedcontributing to a significant decline in IBIT for the same period of the prior year as a result of supply and demand in the global and North American refined product markets.Energy segment. The table below provides information about the average market reference prices and differentials that impact our Energy segment.
| | | | For the Three Months Ended February 28, | | For the Six Months Ended February 28, | Three Months Ended
November 30, |
| | 2019 | | 2018 | | 2019 | | 2018 | 2019 | | 2018 |
| Market indicators | | | | |
| West Texas Intermediate (WTI) crude oil (dollars per barrel) | $51.80 | | $61.82 | | $58.83 | | $58.22 | |
| WTI - Western Canadian Select (WCS) crude oil differential (dollars per barrel) | $23.76 | | $20.18 | | $29.36 | | $15.55 | |
| WTI crude oil (dollars per barrel) | | $ | 56.11 |
| | $ | 65.85 |
|
| WTI - WCS crude oil differential (dollars per barrel) | | $ | 12.98 |
| | $ | 34.97 |
|
| Group 3 2:1:1 crack spread (dollars per barrel)* | $14.90 | | $16.51 | | $17.50 | | $19.52 | $ | 18.47 |
| | $ | 20.10 |
|
| Group 3 5:3:2 crack spread (dollars per barrel)* | $13.08 | | $15.72 | | $15.85 | | $18.85 | $ | 17.43 |
| | $ | 18.57 |
|
| D6 ethanol RIN (dollars per RIN) | $0.2079 | | $0.6844 | | $0.1686 | | $0.7683 | $ | 0.1668 |
| | $ | 0.1292 |
|
| D4 ethanol RIN (dollars per RIN) | $0.5256 | | $0.8196 | | $0.4482 | | $0.9225 | $ | 0.5588 |
| | $ | 0.3708 |
|
*Group 3 refers to the oil refining and distribution system serving the Midwest markets from the Gulf Coast through the Plains States.
Ag
Our Ag segment operations work together to facilitate the production, purchase, sale and eventual use of grain and other agricultural commodities within the United States, as well as internationally. Profitability in our Ag segment is largely driven by throughput and production volumes, as well as commodity price spreads; however, revenues and cost of goods sold ("COGS") are largely affected by market-driven commodity prices that are outside our control. The table below provides information about average market prices for agricultural commodities and our sales/throughput volumes that impact our Ag segment for the three months ended November 30, 2019 and 2018.
|
| | | | | | | |
| | | | Three Months Ended
November 30, |
| | Market Source* | | 2019 | | 2018 |
| Commodity prices | | | | | |
| Corn (dollars per bushel) | Chicago Board of Trade | | $3.83 | | $3.62 |
| Soybeans (dollars per bushel) | Chicago Board of Trade | | $9.00 | | $8.60 |
| Wheat (dollars per bushel) | Chicago Board of Trade | | $5.17 | | $5.08 |
| Urea (dollars per ton) | Green Markets NOLA | | $225.00 | | $295.00 |
| UAN (dollars per ton) | Green Markets NOLA | | $151.00 | | $212.00 |
| Ethanol (dollars per gallon) | Chicago Platts | | $1.60 | | $1.24 |
| | | | | | |
| Volumes | | | | | |
| Grain and oilseed (thousands of bushels) | | 619,539 |
| | 698,929 |
|
| North American grain and oilseed port throughput (thousands of bushels) | | 136,856 |
| | 287,173 |
|
| Crop nutrients (thousands of tons) | | 1,851 |
| | 1,661 |
|
| Ethanol (thousands of gallons) | | 222,276 |
| | 287,173 |
|
*Market source information represents the average month-end price during the period.
Income Before Income Taxes by Segment
Energy
|
| | | | | | | | | | | | | | |
| | Three Months Ended
November 30, | | Change |
| | 2019 | | 2018 | | Dollars | | Percent |
| | (Dollars in thousands) | | | | |
| Income before income taxes | $ | 162,153 |
| | $ | 232,461 |
| | $ | (70,308 | ) | | (30.2 | )% |
The following waterfall analysis and commentary present the changes in our Energy segment IBIT for the three months ended November 30, 2019, compared to the same period during the prior year.
+See commentary related to these changes in the marketing, general and administrative expenses, interest expense, other income and equity income from investments sections of this Results of Operations.
The $70.3 million decrease in Energy segment IBIT reflects the following:
Significantly less advantageous market conditions in our refined fuels business compared to the same period of the prior year, primarily driven by decreased WCS crude oil differentials experienced on heavy Canadian crude oil, which is processed by our refineries and, to a lesser extent, decreased crack spreads.
The decreased IBIT resulting from less advantageous market conditions for refined fuels was partially offset by hedging gains recognized for refined fuels and propane during the first quarter of fiscal 2020, as well as improved propane margins due to significant propane demand for crop drying and home heating.
Income (Loss) Before Income Taxes by Segment
Energy
|
| | | | | | | | | | | | | | | | | | | | | | | | | | | | | |
| | For the Three Months Ended February 28, | | Change | | For the Six Months Ended February 28, | | Change |
| | 2019 | | (As Restated) 2018 | | Dollars | | Percent | | 2019 | | (As Restated) 2018 | | Dollars | | Percent |
| | (Dollars in thousands) |
| Income (loss) before income taxes | $ | 306,585 |
| | $ | 24,471 |
| | $ | 282,114 |
| | 1,152.9 | % | | $ | 539,046 |
| | $ | 144,907 |
| | $ | 394,139 |
| | 272.0 | % |
The following table and commentary present the primary reasons for the changes in IBIT for the Energy segment for the three and six months ended February 28, 2019, compared to the prior year: |
| | | | | | | | |
| | | Year-Over-Year Change |
| | | Three Months Ended February 28 | | Six Months Ended February 28 |
| | | (Dollars in thousands) |
| Volume | | $ | 43 |
| | $ | 1,811 |
|
| Price | | 286,045 |
| | 405,087 |
|
| Transportation, retail and other | | (8,845 | ) | | (2,116 | ) |
Non-gross profit related activity+ | | 4,871 |
| | (10,643 | ) |
| Total change in Energy IBIT | | $ | 282,114 |
| | $ | 394,139 |
|
+ See commentary related to these changes in the marketing, general and administrative expenses, reserve and impairment charges (recoveries), interest expense, other income (loss) and equity income (loss) from investments sections of this Results of Operations.
Comparison of Energy segment IBIT for the three months ended February 28, 2019, and 2018
The $282.1 million increase in Energy segment IBIT reflects the following:
Improved market conditions in our refined fuels business, primarily driven by favorable pricing on heavy Canadian crude oil which is processed by our refineries. The favorable crude oil pricing, as well as hedging gains and decreased renewable energy credit costs, contributed to a $213.5 million IBIT increase.
Manufacturing changes within our Energy business have allowed us to benefit from certain federal excise tax credits. Following the resolution of the underlying gain contingencies associated with the tax credits during the second quarter of fiscal 2019, a gain of $80.8 million was recognized primarily as a reduction of COGS in our Consolidated Statements of Operations.
The increases to IBIT were partially offset by decreased margins for other energy products.
Comparison of Energy segment IBIT for the six months ended February 28, 2019, and 2018
The $394.1 million increase in Energy segment IBIT reflects the following:
Improved market conditions in our refined fuels business, primarily driven by favorable pricing on heavy Canadian crude oil which is processed by our refineries. The favorable crude oil pricing, as well as hedging gains and decreased renewable energy credit costs, contributed to a $333.4 million IBIT increase. A 2% volume increase for refined fuels also contributed to the increased IBIT.
A gain of $80.8 million recognized as a reduction of COGS in our Consolidated Statements of Operations that resulted from manufacturing changes in our Energy business that have allowed us to benefit from certain federal excise tax credits, as described in greater detail above.
The increases to IBIT were partially offset by decreased margins for other energy products, as well as increased non-gross profit related activities, primarily marketing, general and administrative expenses.
Ag
|
| | | | | | | | | | | | | | | | | | | | | | | | | | | | | |
| | For the Three Months Ended February 28, | | Change | | For the Six Months Ended February 28, | | Change |
| | 2019 | | (As Restated) 2018 | | Dollars | | Percent | | 2019 | | (As Restated) 2018 | | Dollars | | Percent |
| | (Dollars in thousands) |
| Income (loss) before income taxes | $ | (62,398 | ) | | $ | (53,525 | ) | | $ | (8,873 | ) | | 16.6 | % | | $ | 17,920 |
| | $ | 21,620 |
| | $ | (3,700 | ) | | 17.1 | % |
|
| | | | | | | | | | | | | | |
| | Three Months Ended
November 30, | | Change |
| | 2019 | | 2018 | | Dollars | | Percent |
| | (Dollars in thousands) | | | | |
| Income (loss) before income taxes | $ | (13,862 | ) | | $ | 80,318 |
| | $ | (94,180 | ) | | (117.3 | )% |
The following tablewaterfall analysis and commentary present the primary reasons for the changes in our Ag segment IBIT for the Ag segment for the three and six months ended February 28,November 30, 2019, compared to the same period during the prior year:year.
|
| | | | | | | | |
| | | Year-Over-Year Change |
| | | Three Months Ended February 28 | | Six Months Ended February 28 |
| | | (Dollars in thousands) |
| Volume | | $ | 12,584 |
| | $ | 20,597 |
|
| Price | | 555 |
| | 11,480 |
|
Non-gross profit related activity+ | | (22,012 | ) | | (35,777 | ) |
| Total change in Ag IBIT | | $ | (8,873 | ) | | $ | (3,700 | ) |
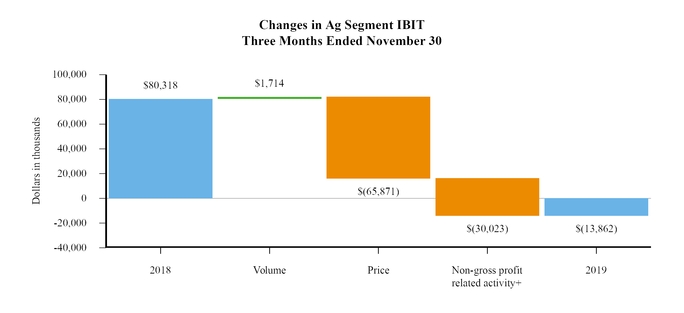
+See commentary related to these changes in the marketing, general and administrative expenses, reserve and impairment charges (recoveries), gain (loss) on disposal of business, interest expense, other income (loss) and equity income (loss) from investments sections of this Results of Operations.
Comparison of Ag segment IBIT for the three months ended February 28, 2019, and 2018
The $8.9$94.2 million decrease in Ag segment IBIT reflects the following:
A combination of higher non-gross profit related expenses contributed to a $22.0 million IBIT decrease, primarily related to increased marketing, general and administrative costs, decreased income from equity method investments as well as a gain on the disposal of a business during the second quarter of fiscal 2018 that did not reoccurPoor weather conditions experienced during fiscal 2019.
Decreased2019 in the agricultural region of the United States and continuing global trade tensions between the United States and foreign trading partners continued to negatively impact volumes and margins for feed and farm supplies contributed to a $32.9 million IBIT decrease, which was partially offset by increased volumes of feed and farm supplies that contributed to a $15.3 million IBIT increase.
Improved margins for processing and food ingredients contributed to a $32.3 million IBIT increase.
Comparison of Ag segment IBIT for the six months ended February 28, 2019, and 2018
The $3.7 million decrease in Ag segment IBIT reflects the following:
A combination of higher non-gross profit related expenses contributed to a $35.8 million IBIT decrease, primarily related to increased marketing, general and administrative costs, increased interest expense,within agricultural markets. In particular, decreased income from equity method investments and a gain on the disposal of a business during the second quarter of fiscal 2018 that did not reoccur during fiscal 2019.
Increased volumes of feed and farm supplies contributed to a $19.5 million IBIT increase, which was partially offset by less significant volume changes in other Ag businesses.
The year-over-year price increase was attributed primarily to improved margins for crop nutrients and processing and food ingredients, which was partially offset by decreased marginsdemand for feed and farm supplies and renewable fuels.crop nutrient products during the late and smaller harvest in the fall of 2019 resulted in lower margins.
increased competition and lower crop yields, which made it more difficult to source soybeans for our processing facilities.
All Other Segments
| | | | For the Three Months Ended February 28, | | Change | | For the Six Months Ended February 28, | | Change | Three Months Ended
November 30, | | Change |
| | 2019 | | (As Restated) 2018 | | Dollars | | Percent | | 2019 | | (As Restated) 2018 | | Dollars | | Percent | 2019 | | 2018 | | Dollars | | Percent |
| | (Dollars in thousands) | (Dollars in thousands) | | | | |
| Nitrogen Production IBIT* | $ | 10,712 |
| | $ | 4,530 |
| | $ | 6,182 |
| | 136.5 | % | | $ | 34,391 |
| | $ | 10,196 |
| | $ | 24,195 |
| | 237.3 | % | $ | 16,450 |
| | $ | 23,679 |
| | $ | (7,229 | ) | | (30.5 | )% |
| Corporate and Other IBIT | $ | 6,956 |
| | $ | 2,795 |
| | $ | 4,161 |
| | 148.9 | % | | $ | 37,730 |
| | $ | 9,336 |
| | $ | 28,394 |
| | 304.1 | % | $ | 20,660 |
| | $ | 30,774 |
| | $ | (10,114 | ) | | (32.9 | )% |
*See Note 6,5, Investments, of the notes to the condensed consolidated financial statements that are included in this Quarterly Report on Form 10-Q for additional information.
Comparison of All Other Segments IBIT for the three and six months ended February 28, 2019, and 2018
Our Nitrogen Production segment IBIT increaseddecreased as a result of significantly higherlower equity method income from our investment in CF Nitrogen which is attributedduring the three months ended November 30, 2019, attributable to increaseddecreased market pricing of urea and urea ammonium nitrate,UAN, which are produced and sold by CF Nitrogen. Corporate and Other IBIT increaseddecreased primarily as a result of higherlower earnings from our investmentinvestments in Ardent Mills and Ventura Foods, and increasedas well as decreased interest revenueincome from our financing business.and hedging businesses due to lower interest rates and lower trading activity, respectively.
Revenues by Segment
Energy
|
| | | | | | | | | | | | | | | | | | | | | | | | | | | | | |
| | For the Three Months Ended February 28, | | Change | | For the Six Months Ended February 28, | | Change |
| | 2019 | | (As Restated) 2018 | | Dollars | | Percent | | 2019 | | (As Restated) 2018 | | Dollars | | Percent |
| | (Dollars in thousands) |
| Revenues | $ | 1,474,777 |
| | $ | 1,671,799 |
| | $ | (197,022 | ) | | (11.8 | )% | | $ | 3,636,065 |
| | $ | 3,610,945 |
| | $ | 25,120 |
| | 0.7 | % |
|
| | | | | | | | | | | | | | |
| | Three Months Ended
November 30, | | Change |
| | 2019 | | 2018 | | Dollars | | Percent |
| | (Dollars in thousands) | | | | |
| Revenues | $ | 1,895,423 |
| | $ | 2,161,288 |
| | $ | (265,865 | ) | | (12.3 | )% |
The following tablewaterfall analysis and commentary present the primary reasons for the changes in revenues for the Energy segment for the three and six months ended February 28, 2019, compared to the prior year:
|
| | | | | | | | |
| | | Year-Over-Year Change |
| | | Three Months Ended February 28 | | Six Months Ended February 28 |
| | | (Dollars in thousands) |
| Volume | | $ | 24,866 |
| | $ | 57,727 |
|
| Price | | (166,701 | ) | | 62,187 |
|
| Transportation, retail and other | | (55,187 | ) | | (94,794 | ) |
| Total change in Energy revenues | | $ | (197,022 | ) | | $ | 25,120 |
|
Comparison ofour Energy segment revenues for the three months ended February 28,November 30, 2019, and 2018compared to the same period during the prior year.
The $197.0$265.9 million decrease in Energy segment revenues reflects the following:
Decreased selling prices for refined fuels and propane were driven by global market conditions and product mix, and contributed to $122.0$207.5 million and $45.5$71.9 million decreases ofin revenues, respectively.
The decreased selling prices for refined fuels andA 16% increase of propane werevolumes contributed to a $35.5 million increase of revenues, which was partially offset by a 2% volume increase1% decrease of refined fuels volumes that contributed to a $21.2$19.7 million increasedecrease of revenues and a 3% volume increaserevenues. Increased volumes of propane that contributedresulted from significant propane demand for crop drying and home heating; decreased volumes of refined fuels was attributable primarily to an $8.3 million increase of revenues.
Transportation, retail and other revenues decreased primarilylower demand during the fall harvest as a result of poor weather conditions that prevented planting of crops during fiscal 2019 across much of the saleagricultural region of 34 Zip Trip stores located in the Pacific Northwest, United States ("Pacific Northwest") that were sold during the third quarter of fiscal 2018. Revenues for these stores were included in the results during the second quarter of fiscal 2018 but were not present in the second quarter of fiscal 2019.which we operate.
Comparison of Energy segment revenues for the six months ended February 28, 2019, and 2018
The $25.1 million increase in Energy segment revenues reflects the following:
Increased refined fuels selling prices contributed to a $121.2 million increase of revenues and a 2% volume increase contributed to a $58.9 million increase of revenues.
The increased revenues driven by price and volume increases for refined fuels were partially offset by decreased propane prices that contributed to a $61.8 million decrease of revenues.
Transportation, retail and other revenues decreased primarily as a result of the sale of 34 Zip Trip stores located in the Pacific Northwest, that were sold during the third quarter of fiscal 2018. Revenues for these stores were included in the results during the six months ended February 28, 2018, but were not present in the six months ended February 28, 2019.
Ag
|
| | | | | | | | | | | | | | | | | | | | | | | | | | | | | |
| | For the Three Months Ended February 28, | | Change | | For the Six Months Ended February 28, | | Change |
| | 2019 | | (As Restated) 2018 | | Dollars | | Percent | | 2019 | | (As Restated) 2018 | | Dollars | | Percent |
| | (Dollars in thousands) |
| Revenues | $ | 4,994,545 |
| | $ | 5,296,928 |
| | $ | (302,383 | ) | | (5.7 | )% | | $ | 11,299,942 |
| | $ | 11,373,922 |
| | $ | (73,980 | ) | | (0.7 | )% |
|
| | | | | | | | | | | | | | |
| | Three Months Ended
November 30, | | Change |
| | 2019 | | 2018 | | Dollars | | Percent |
| | (Dollars in thousands) | | | | |
| Revenues | $ | 5,711,855 |
| | $ | 6,305,397 |
| | $ | (593,542 | ) | | (9.4 | )% |
The following tablewaterfall analysis and commentary present the primary reasons for the changes in revenues for the Ag segment for the three and six months ended February 28, 2019, compared to the prior year:
|
| | | | | | | | |
| | | Year-Over-Year Change |
| | | Three Months Ended February 28 | | Six Months Ended February 28 |
| | | (Dollars in thousands) |
| Volume | | $ | 310,411 |
| | $ | 594,922 |
|
| Price | | (612,794 | ) | | (668,902 | ) |
| Total change in Ag revenues | | $ | (302,383 | ) | | $ | (73,980 | ) |
Comparison ofour Ag segment revenues for the three months ended February 28,November 30, 2019, and 2018compared to the same period during the prior year.
The $302.4$593.5 million decrease in Ag segment revenues reflects the following:
Decreased sellingGrain and oilseed volumes and prices associated withdecreased by 10% and 3%, respectively, compared to the prior year. As the primary drivers of lower Ag segment revenues during the current fiscal year, lower grain and oilseed volumes and prices contributed to a $366.7$473.6 million decreaseand $108.6 million decreases of revenues, which wasrespectively. Decreased volumes and prices resulted from a combination of product mix and challenges experienced in the agricultural commodity market, including poor weather conditions during fiscal 2019 in the agricultural region of the United States that contributed to lower crop yields and fewer acres planted/harvested, and continuing global trade tensions between the United States and foreign trading partners.
Our other Ag segment businesses generally experienced a decline in revenues due to similar volume and pricing decreases that resulted from continued challenges being experienced in the agricultural commodity market. These decreases were partially offset by a 4% volume increase for grain and oilseed that contributed to a $136.9 million increase of revenues.
Decreased selling prices for feed and farm supplies, renewable fuelsincreased volumes associated with certain agronomy products and processing and food ingredients, contributed to decreased revenuesmost of $131.6 million, $27.2 million and $155.5 million, respectively, which were partially offset by increased selling prices for crop nutrients that contributedwas attributable to a $68.2$77.8 million increase of revenues.
Volume increasesrevenues that resulted from the March 1, 2019, acquisition of 38% and 39% for feed and farm supplies and processing and food ingredients contributed to $124.3 million and $142.2 million increasesthe remaining 75% ownership interest in West Central Distribution, LLC ("WCD") that we did not previously own, the results of revenues, respectively. These volume increaseswhich were partially offset by 17% and 7% decreasesnot included in crop nutrient and renewable fuels volumes, respectively, that contributed to $70.7 million and $22.2 million decreasesthe comparable period of revenues, respectively.
Comparison of Ag segment revenues for the six months ended February 28, 2019, and 2018
prior year. The $74.0 million decrease in Ag segment revenues reflects the following:
Decreased selling prices associated with grain and oilseed contributed to a $492.1 million decrease of revenues, which was also partially offset by a 4% volume16% pricing increase for grain and oilseed that contributed to a $369.3 million increase of revenues.
Decreased selling prices for feed and farm supplies, renewable fuels and processing and food ingredients contributed to decreased revenues of $149.6 million, $73.2 million and $132.4 million, respectively, which were partially offset by increased selling prices for crop nutrients that contributed to a $178.4 million increase of revenues.
Volume increases of 19% and 17% for feed and farm supplies and processing and food ingredients contributed to $162.5 million and $124.4 million increases of revenues, respectively. These volume increases were partially offset by a 7% decrease in crop nutrient volumes driven by poor spring weather conditions that contributed to a $62.7 million decrease of revenues.
global market conditions.
All Other Segments
|
| | | | | | | | | | | | | | | | | | | | | | | | | | | | | |
| | For the Three Months Ended February 28, | | Change | | For the Six Months Ended February 28, | | Change |
| | 2019 | | (As Restated) 2018 | | Dollars | | Percent | | 2019 | | (As Restated) 2018 | | Dollars | | Percent |
| | (Dollars in thousands) |
| Corporate and Other revenues* | $ | 14,217 |
| | $ | 11,426 |
| | $ | 2,791 |
| | 24.4 | % | | $ | 31,821 |
| | $ | 27,170 |
| | $ | 4,651 |
| | 17.1 | % |
|
| | | | | | | | | | | | | | |
| | Three Months Ended
November 30, | | Change |
| | 2019 | | 2018 | | Dollars | | Percent |
| | (Dollars in thousands) | | | | |
| Corporate and Other revenues* | $ | 14,207 |
| | $ | 17,604 |
| | $ | (3,397 | ) | | (19.3 | )% |
*Our Nitrogen Production reportable segment represents an equity method investment and as suchthat records earnings and allocated expenses, but not revenues.
Comparison of All Other Segments revenues for the three and six months ended February 28, 2019, and 2018
There were no significant changes to revenues in Corporate and Other revenues during the three or six months ended February 28, 2019, or 2018; however, higher interest income associated withNovember 30, 2019. The overall decrease resulted primarily from lower revenues in our financing business contributedand hedging businesses due to the increased revenues.market-driven interest rate reductions and lower trading activity, respectively.
Cost of Goods Sold by Segment
Energy
|
| | | | | | | | | | | | | | | | | | | | | | | | | | | | | |
| | For the Three Months Ended February 28, | | Change | | For the Six Months Ended February 28, | | Change |
| | 2019 | | (As Restated) 2018 | | Dollars | | Percent | | 2019 | | (As Restated) 2018 | | Dollars | | Percent |
| | (Dollars in thousands) |
| Cost of goods sold | $ | 1,122,626 |
| | $ | 1,596,891 |
| | $ | (474,265 | ) | | (29.7 | )% | | $ | 2,999,297 |
| | $ | 3,378,959 |
| | $ | (379,662 | ) | | (11.2 | )% |
|
| | | | | | | | | | | | | | |
| | Three Months Ended
November 30, | | Change |
| | 2019 | | 2018 | | Dollars | | Percent |
| | (Dollars in thousands) | | | | |
| Cost of goods sold | $ | 1,686,162 |
| | $ | 1,876,671 |
| | $ | (190,509 | ) | | (10.2 | )% |
The following tablewaterfall analysis and commentary present the primary reasons for the changes in COGS for the Energy segment for the three and six months ended February 28, 2019, compared to the prior year:
|
| | | | | | | | |
| | | Year-Over-Year Change |
| | | Three Months Ended February 28 | | Six Months Ended February 28 |
| | | (Dollars in thousands) |
| Volume | | $ | 24,822 |
| | $ | 55,916 |
|
| Price | | (452,745 | ) | | (342,900 | ) |
| Transportation, retail and other | | (46,342 | ) | | (92,678 | ) |
| Total change in Energy cost of goods sold | | $ | (474,265 | ) | | $ | (379,662 | ) |
Comparison ofour Energy segment COGS for the three months ended February 28,November 30, 2019, and 2018compared to the same period during the prior year.
The $474.3$190.5 million decrease in Energy segment COGS reflects the following:
Decreased pricing for propane and refined fuels were driven by global market conditions and propane costsproduct mix, and contributed to $335.5$106.1 million and $38.7$100.7 million decreases of COGS, respectively. The
A 16% increase of propane volumes contributed to a $34.0 million increase of COGS, which was partially offset by a 1% decrease of refined fuels volumes that contributed to a $16.9 million decrease of COGS. Increased volumes of propane resulted from significant propane demand for crop drying and home heating, and decreased COGS forvolumes of refined fuels was drivenattributable primarily by favorable pricing on heavy Canadian crude oil which is processed by our refineries, as well as hedging gains and decreased renewable energy credit costs. These decreases were partially offset by 2% and 3% volume increases that contributed to $20.5 million and $8.0 million increases of COGS for refined fuels and propane, respectively.
A gain of $80.8 million recognized as a reduction of COGS in our Consolidated Statements of Operations that resulted from manufacturing changes in our Energy business that have allowed us to benefit from certain federal excise tax credits, as described in greater detail above.
Transportation, retail and other COGS decreased primarilylower demand during the fall harvest as a result of the salepoor weather conditions that prevented planting of 34 Zip Trip stores locatedcrops during fiscal 2019 across the agricultural region of the United States in the Pacific Northwest that were sold during the third quarter of fiscal 2018. Costs associated with these stores were included in the results during the second quarter of fiscal 2018 but were not present in any period of fiscal 2019.which we operate.
Comparison of Energy segment COGS for the six months ended February 28, 2019, and 2018Ag
The $379.7 million decrease in Energy segment COGS reflects the following:
Decreased refined fuels and propane costs contributed to $212.2 million and $54.5 million decreases of COGS, respectively. The decreased COGS for refined fuels was driven primarily by favorable pricing on heavy Canadian crude oil which is processed by our refineries, as well as hedging gains and decreased renewable energy credit costs. These decreases were partially offset by 2% volume increases that contributed to $55.2 million and $9.7 million increases of COGS for refined fuels and propane, respectively.
A gain of $80.8 million recognized as a reduction of COGS in our Consolidated Statements of Operations that resulted from manufacturing changes in our Energy business that have allowed us to benefit from certain federal excise tax credits, as described in greater detail above.
Transportation, retail and other COGS decreased primarily as a result of the sale of 34 Zip Trip stores located in the Pacific Northwest that were sold during the third quarter of fiscal 2018. Costs associated with these stores were included in the results during the six months ended February 28, 2018 but were not present in the six months ended February 28, 2019.
Ag
|
| | | | | | | | | | | | | | | | | | | | | | | | | | | | | |
| | For the Three Months Ended February 28, | | Change | | For the Six Months Ended February 28, | | Change |
| | 2019 | | (As Restated) 2018 | | Dollars | | Percent | | 2019 | | (As Restated) 2018 | | Dollars | | Percent |
| | (Dollars in thousands) |
| Cost of goods sold | $ | 4,933,484 |
| | $ | 5,249,005 |
| | $ | (315,521 | ) | | (6.0 | )% | | $ | 11,073,069 |
| | $ | 11,179,126 |
| | $ | (106,057 | ) | | (0.9 | )% |
|
| | | | | | | | | | | | | | |
| | Three Months Ended
November 30, | | Change |
| | 2019 | | 2018 | | Dollars | | Percent |
| | (Dollars in thousands) | | | | |
| Cost of goods sold | $ | 5,610,200 |
| | $ | 6,139,585 |
| | $ | (529,385 | ) | | (8.6 | )% |
The following tablewaterfall analysis and commentary present the primary reasons for the changes in COGS for the Ag segment for the three and six months ended February 28, 2019, compared to the prior year:
|
| | | | | | | | |
| | | Year-Over-Year Change |
| | | Three Months Ended February 28 | | Six Months Ended February 28 |
| | | (Dollars in thousands) |
| Volume | | $ | 297,827 |
| | $ | 574,326 |
|
| Price | | (613,348 | ) | | (680,383 | ) |
| Total change in Ag cost of goods sold | | $ | (315,521 | ) | | $ | (106,057 | ) |
Comparison ofour Ag segment COGS for the three months ended February 28,November 30, 2019, and 2018compared to the same period during the prior year.
The $315.5$529.4 million decrease in Ag segment COGS reflects the following:
Decreased costs associated with grainGrain and oilseed volumes and pricing decreased by 10% and 3%, respectively, compared to the prior year and were the primary drivers of lower COGS in our Ag segment. Lower volumes and pricing contributed to decreased COGS of $467.4 million and $119.1 million, respectively. Decreased volumes and pricing resulted from a $372.5 million decreasecombination of product mix and challenges experienced in the agricultural commodity market, including poor weather conditions experienced during fiscal 2019 in the agricultural regions of the United States that contributed to lower crop yields and fewer acres planted/harvested, and continuing global trade tensions between the United States and foreign trading partners.
Our other Ag segment businesses generally experienced a decline in COGS which wasdue to similar volume and pricing decreases as a result of continued challenges being experienced in the agricultural commodity market. These decreases were partially offset by a 4% volume increase for grain and oilseed that contributed to a $136.5 million increase of COGS.
Decreased costs of feed and farm supplies, renewable fuelsincreased volumes associated with certain agronomy products and processing and food ingredients, contributedmost of which was attributable to decreasedan increase of COGS that resulted from the March 1, 2019, acquisition of $98.8 million, $20.8 million and $187.8 million, respectively,the remaining 75% ownership interest in WCD that we did not previously own, the results of which were partially offset by increased costs for crop nutrients that contributed to a $66.5 million increasenot included in the comparable period of COGS.
Volume increases of 38% and 39% for feed and farm supplies and processing and food ingredients contributed to $109.0 million and $145.4 million increases of COGS, respectively. These volume increases were partially offset by 17% and 7% decreases in crop nutrient and renewable fuels volumes that contributed to $71.1 million and $21.9 million decreases of COGS, respectively.
Comparison of Ag segment COGS for the six months ended February 28, 2019, and 2018
prior year. The $106.1 million decrease in Ag segment COGS reflects the following:
Decreased costs associated with grain and oilseed contributed to a $500.1 million decrease of COGS, which was also partially offset by a 4% volume14% pricing increase for grain and oilseed that contributed to a $366.2 million increase of COGS.
Decreased costs of feed and farm supplies, renewable fuels andinputs due to lower crop yields, which made it more difficult to source corn for our ethanol processing and food ingredients contributed to decreased COGS of $104.0 million, $56.6 million and $187.9 million, respectively, which were partially offset by increased costs for crop nutrients that contributed to a $168.2 million increase of COGS.
Volume increases of 19% and 17% for feed and farm supplies and processing and food ingredients contributed to $143.0 million and $125.4 million increases of COGS, respectively. These volume increases were partially offset by a 7% decrease in crop nutrient volumes that contributed to a $61.7 million decrease of COGS.facilities.
All Other Segments
| | | | For the Three Months Ended February 28, | | Change | | For the Six Months Ended February 28, | | Change | Three Months Ended
November 30, | | Change |
| | 2019 | | (As Restated) 2018 | | Dollars | | Percent | | 2019 | | (As Restated) 2018 | | Dollars | | Percent | 2019 | | 2018 | | Dollars | | Percent |
| | (Dollars in thousands) | (Dollars in thousands) | | | |
| Nitrogen Production COGS | $ | 2,534 |
| | $ | 1,133 |
| | $ | 1,401 |
| | NM* | | $ | 461 |
| | $ | 1,352 |
| | $ | (891 | ) | | NM* | $ | 538 |
| | $ | (2,073 | ) | | $ | 2,611 |
| | NM* |
| Corporate and Other COGS | $ | (2,518 | ) | | $ | (1,845 | ) | | $ | (673 | ) | | NM* | | $ | (3,053 | ) | | $ | (2,861 | ) | | $ | (192 | ) | | NM* | $ | (957 | ) | | $ | (535 | ) | | $ | (422 | ) | | NM* |
*NM - Not Meaningful
Comparison of All Other Segments COGS for the three and six months ended February 28, 2019, and 2018not meaningful
There were no significant changes to COGS forin our Nitrogen Production segment or Corporate and Other during the three or six months ended February 28, 2019, and 2018.
Marketing, General and Administrative Expenses
|
| | | | | | | | | | | | | | | | | | | | | | | | | | | | | |
| | For the Three Months Ended February 28, | | Change | | For the Six Months Ended February 28, | | Change |
| | 2019 | | (As Restated) 2018 | | Dollars | | Percent | | 2019 | | (As Restated) 2018 | | Dollars | | Percent |
| | (Dollars in thousands) |
| Marketing, general and administrative expenses | $ | 177,429 |
| | $ | 187,558 |
| | $ | (10,129 | ) | | (5.4 | )% | | $ | 339,925 |
| | $ | 327,904 |
| | $ | 12,021 |
| | 3.7 | % |
Comparison of marketing, general and administrative expenses for the three months ended February 28, 2019, and 2018
The decrease in marketing, general and administrative expenses is primarily due to decreased advertising expenses and the impact of favorable foreign currency exchange rates compared to the prior year.
Comparison of marketing, general and administrative expenses for the six months ended February 28, 2019, and 2018
The increase in marketing, general and administrative expenses is primarily due to higher incentive compensation expense as a result of improved financial performance and increased outside service expenses.
Reserve and Impairment Charges (Recoveries), net
|
| | | | | | | | | | | | | | | | | | | | | | | | | | | | | |
| | For the Three Months Ended February 28, | | Change | | For the Six Months Ended February 28, | | Change |
| | 2019 | | (As Restated) 2018 | | Dollars | | Percent | | 2019 | | (As Restated) 2018 | | Dollars | | Percent |
| | (Dollars in thousands) |
| Reserve and impairment charges (recoveries), net | $ | 339 |
| | $ | (11,346 | ) | | $ | 11,685 |
| | 103.0 | % | | $ | (6,014 | ) | | $ | (15,133 | ) | | $ | 9,119 |
| | 60.3 | % |
November 30, 2019.
Comparison of reserveMarketing, General and impairment charges (recoveries), net for the threeAdministrative Expenses
|
| | | | | | | | | | | | | | |
| | Three Months Ended
November 30, | | Change |
| | 2019 | | 2018 | | Dollars | | Percent |
| | (Dollars in thousands) | | | | |
| Marketing, general and administrative expenses | $ | 168,331 |
| | $ | 156,143 |
| | $ | 12,188 |
| | 7.8 | % |
Increased marketing, general and six months ended February 28, 2019, and 2018
Reserve and impairment charges (recoveries) did not change significantlyadministrative expenses during the three or six months ended February 28, 2019; however,November 30, 2019, were primarily due to increased maintenance expenses associated with our information technology platforms, increased consulting expenses related to implementation of our new ERP software and increased payroll expenses for employees that joined CHS following our acquisition of WCD, which were not included in the decreased recoveries relate to the timingcomparable period of recognition for certain recoveries of previously written-off assets during the prior year, including assets that were sold and loan loss reserves, that did not reoccur during the current year.
Gain (Loss) on Disposal of Business
|
| | | | | | | | | | | | | | | | | | | | | | | | | | | | | |
| | For the Three Months Ended February 28, | | Change | | For the Six Months Ended February 28, | | Change |
| | 2019 | | (As Restated) 2018 | | Dollars | | Percent | | 2019 | | (As Restated) 2018 | | Dollars | | Percent |
| | (Dollars in thousands) |
| Gain (loss) on disposal of business | $ | — |
| | $ | 7,705 |
| | $ | (7,705 | ) | | (100.0 | )% | | $ | 1,412 |
| | $ | 7,705 |
| | $ | (6,293 | ) | | (81.7 | )% |
Comparison of gain (loss) on disposal of business for the three and six months ended February 28, 2019, and 2018
Gain (loss) on disposal of business did not change significantly during the three or six months ended February 28, 2019; however, the decrease is the result of gains recognized during the second quarter of fiscal 2018 that did not reoccur during fiscal 2019.
Interest Expense
|
| | | | | | | | | | | | | | | | | | | | | | | | | | | | | |
| | For the Three Months Ended February 28, | | Change | | For the Six Months Ended February 28, | | Change |
| | 2019 | | (As Restated) 2018 | | Dollars | | Percent | | 2019 | | (As Restated) 2018 | | Dollars | | Percent |
| | (Dollars in thousands) |
| Interest expense | $ | 41,269 |
| | $ | 40,176 |
| | $ | 1,093 |
| | 2.7 | % | | $ | 80,177 |
| | $ | 80,878 |
| | $ | (701 | ) | | (0.9 | )% |
|
| | | | | | | | | | | | | | |
| | Three Months Ended
November 30, | | Change |
| | 2019 | | 2018 | | Dollars | | Percent |
| | (Dollars in thousands) | | | | |
| Interest expense | $ | 34,971 |
| | $ | 38,908 |
| | $ | (3,937 | ) | | (10.1 | )% |
ComparisonThere were no significant changes to the amount of interest expense for the three and six months ended February 28, 2019, and 2018
Interest expense did not change significantly during the three or six months ended February 28,November 30, 2019; however, the changes in interest expenseoverall decrease resulted from changes tolower interest rates during the three months ended November 30, 2019, and decreased average outstanding debt balances and interest rates duringcompared to the first and second quarterssame period of fiscal 2019.the prior year.
Other Income (Loss)
|
| | | | | | | | | | | | | | | | | | | | | | | | | | | | | |
| | For the Three Months Ended February 28, | | Change | | For the Six Months Ended February 28, | | Change |
| | 2019 | | (As Restated) 2018 | | Dollars | | Percent | | 2019 | | (As Restated) 2018 | | Dollars | | Percent |
| | (Dollars in thousands) |
| Other income (loss) | $ | 11,763 |
| | $ | 12,544 |
| | $ | (781 | ) | | (6.2 | )% | | $ | 35,485 |
| | $ | 38,739 |
| | $ | (3,254 | ) | | (8.4 | )% |
Comparison of other income (loss) for the three and six months ended February 28, 2019, and 2018 |
| | | | | | | | | | | | | | |
| | Three Months Ended
November 30, | | Change |
| | 2019 | | 2018 | | Dollars | | Percent |
| | (Dollars in thousands) | | | | |
| Other income | $ | 13,498 |
| | $ | 25,134 |
| | $ | (11,636 | ) | | (46.3 | )% |
Other income (loss) did not change significantlydecreased primarily as a result of non-operating gains recognized during the three or six months ended February 28, 2019; however, the decreases relate primarily to less interest income generatedNovember 30, 2018, that did not reoccur during the first and second quarters of fiscalthree months ended November 30, 2019.
Equity Income (Loss) from Investments
|
| | | | | | | | | | | | | | | | | | | | | | | | | | | | | |
| | For the Three Months Ended February 28, | | Change | | For the Six Months Ended February 28, | | Change |
| | 2019 | | (As Restated) 2018 | | Dollars | | Percent | | 2019 | | (As Restated) 2018 | | Dollars | | Percent |
| | (Dollars in thousands) |
| Equity income (loss) from investments* | $ | 41,716 |
| | $ | 39,441 |
| | $ | 2,275 |
| | 5.8 | % | | $ | 108,224 |
| | $ | 77,803 |
| | $ | 30,421 |
| | 39.1 | % |
|
| | | | | | | | | | | | | | |
| | Three Months Ended
November 30, | | Change |
| | 2019 | | 2018 | | Dollars | | Percent |
| | (Dollars in thousands) | | | | |
| Equity income from investments* | $ | 49,662 |
| | $ | 66,508 |
| | $ | (16,846 | ) | | (25.3 | )% |
*See Note 6,5, Investments, of the notes to the condensed consolidated financial statements that are included in this Quarterly Report on Form 10-Q for additional information.
Comparison of equity income (loss) from investments for the three and six months ended February 28, 2019, and 2018
We record equity income or loss for investments in which we have an ownership interest of 50% or less and have significant influence, but not control, for our proportionate share of income or loss reported by the entity, without consolidating the revenues and expenses of the entity in our Condensed Consolidated Statements of Operations. Equity income (loss) from investments did not increase significantlydecreased during the three or six months ended February 28, 2019; however,November 30, 2019, compared to the increasesame period during the six months ended February 28, 2019, wasprior year, primarily due to higherlower equity income associated with our equity method investments in CF Nitrogen, Ardent Mills and Ventura Foods, which increaseddecreased by approximately $32.1 million and $14.4 million, respectively. These increases werea total of $14.2 million. The decreased equity method income for these investments was driven by improvedreduced urea and UAN pricing for CF Nitrogen, and improvedlower product margins and volumes as a result of customer consolidation for Ardent Mills and increased marketing, general and administrative expenses for Ventura Foods. The increased equity income from CF Nitrogen and Ventura Foods was partially offset by lower equity income from various other equity method investments.
Income Tax Expense (Benefit)
|
| | | | | | | | | | | | | | | | | | | | | | | | | | | |
| | For the Three Months Ended February 28, | | Change | | For the Six Months Ended February 28, | | Change |
| | 2019 | | (As Restated) 2018 | | Dollars | | Percent | | 2019 | | (As Restated) 2018 | | Dollars | | Percent |
| | (Dollars in thousands) |
| Income tax expense (benefit) | $ | 13,551 |
| | $ | (187,688 | ) | | $ | 201,239 |
| | (107.2)% | | $ | 33,668 |
| | $ | (167,082 | ) | | $ | 200,750 |
| | (120.2)% |
Comparison of income tax expense (benefit) for the three and six months ended February 28, 2019, and 2018 |
| | | | | | | | | | | | | | |
| | Three Months Ended
November 30, | | Change |
| | 2019 | | 2018 | | Dollars | | Percent |
| | (Dollars in thousands) | | | | |
| Income tax expense | $ | 6,664 |
| | $ | 20,117 |
| | $ | (13,453 | ) | | (66.9 | )% |
During the three and six months ended February 28,November 30, 2019, we hadexperienced a significant increase ofdecrease in income tax expense when compared to the same periodsperiod of the prior fiscal year, primarily as a result of the decrease in annual statutory federal corporate tax rate that occurreddecreased taxable income during the second quarter ofthree months ended November 30, 2019, as well as the equity management assumptions used in fiscal 2018 which did not reoccur during the second quarter of fiscal 2019. The effective2020. Effective tax rates for the three and six months ended February 28,November 30, 2019 was equal to 5.2% and 5.4%2018, were 3.6% and 5.5%, respectively, compared to significant income tax benefits recognized during the three and six months ended February 28, 2018. The federalrespectively. Federal and state statutory rates applied to nonpatronage business activity were 24.6%24.7% and 38.3%24.6% for the three and six months ended February 28,November 30, 2019 and 2018, respectively. The incomeIncome taxes and effective tax rate vary each year based uponon profitability and nonpatronage business activity during each of the comparable years.
Liquidity and Capital Resources
Summary
In assessing our financial condition, we consider factors such as working capital and internal benchmarking related to our applicable covenants and other financial criteria. We fund our operations primarily through a combination of cash flows from operations supplemented with borrowings under our revolving credit facilities. We fund our capital expenditures and growth primarily through cash, operating cash flow and long-term debt financing.
On February 28,November 30, 2019, we had working capital, defined as current assets less current liabilities, of $1.1 billion$992.5 million, and a current ratio, defined as current assets divided by current liabilities, of 1.2 compared to working capital of $1.1 billion and a current ratio of 1.2 on August 31, 2019. On November 30, 2018, we had working capital of $933.8 million and a current ratio of 1.1 compared to working capital of $759.0 million and a current ratio of 1.1 on August 31, 2018. On February 28, 2018, we had working capital of $336.6 million and a current ratio of 1.0 compared to working capital of $148.6 million and a current ratio of 1.0 on August 31, 2017.
As of February 28,November 30, 2019, we had cash and cash equivalents of $367.3$192.8 million, total equities of $8.4$8.6 billion, long-term debt (including current maturities) of $1.9$1.8 billion and notes payable of $2.6$2.2 billion. Our capital allocation priorities include paying ourinterest on debt and preferred stock dividends,
maintaining the safety and compliance of our operations, returning cash to our member-owners in the form of cash patronage and equity redemptions, paying down debtmaintaining the safety and compliance of our operations, and taking advantage of strategic investment opportunities that benefit our owners. We will continue to consider opportunities to further diversify and enhance our sources and amounts of liquidity. These opportunities include reducing operating expenses, deploying and/or financing working capital more efficiently and identifying and disposing of nonstrategic or underperforming assets. We believe that cash generated by operating and investing activities, along with available borrowing capacity under our credit facilities, will be sufficient to support our operations for the foreseeable future and we expect to remain in compliance with our loan covenants.
Fiscal 2020 and 2019 Activity
During fiscal 2019, we completed the acquisition of the remaining 75% ownership interest in WCD that we did not previously own by paying $106.7 million, of which net cash flows were reduced by $8.0 million of cash acquired. WCD is now included in our Ag segment and 2018 Activitydeepens our presence in the agronomy products market. See Note 15, Acquisitions, of the notes to our condensed consolidated financial statements included in this Quarterly Report on Form 10-Q for additional information.
Also during fiscal 2019, we completed planned major maintenance activities, which contributed to cash outflows of $232.1 million for the year ended August 31, 2019.
On June 28, 2018,27, 2019, we amended the Company’sextended our existing receivables and loans securitization facility (the "Securitization("Securitization Facility") with certain unaffiliated financial institutions (the "Purchasers"("Purchasers"). Under the Securitization Facility, we and certain of our subsidiaries (the "Originators"("Originators") sell trade accounts and notes receivable (the "Receivables"("Receivables") to Cofina Funding, LLC ("Cofina"), a wholly-owned bankruptcy-remote indirect subsidiary of CHS. Cofina in turn transfers the Receivables to the Purchasers, which is accounted for as a secured borrowing. During the period from July 2017 through the amendment of the Securitization Facility in June 2018, CHS accounted for Receivables sold under the Securitization Facility as a sale of financial assets pursuant to Accounting Standards Codification 860, Transfers and Servicing, and the Receivables sold were derecognized from our Consolidated Balance Sheets. We use the proceeds from the sale of Receivables under the Securitization Facility for general corporate purposes and settlements are made on a monthly basis. The Securitization Facility terminatesis scheduled to terminate on June 17, 2019,26, 2020, but may be extended.
The amount available under the Securitization Facility fluctuates over time based on the total amount of eligible Receivables generated during the normal course of business, with maximum availability of $700.0 million. As of November 30, 2019, total availability under the Securitization Facility was $601.5 million, of which $601.0 million had been utilized.
On September 4, 2018,6, 2019, we entered into arenewed our repurchase facility (the "Repurchase("Repurchase Facility") related to the Securitization Facility. Under the Repurchase Facility, the Company is able towe can borrow up to $150$150.0 million, collateralized by a subordinated note issued by Cofina in favor of the Originators and representing a portion of the outstanding balance of the Receivables sold by the Originators to Cofina under the Securitization Facility. As of February 28,November 30, 2019, and August 31, 2019, the outstanding balance under the Repurchase Facility was $150$150.0 million.
Cash Flows
The following table presents summarized cash flow data for the sixthree months ended February 28,November 30, 2019 and 2018:
| | | | | | Change | Three Months Ended
November 30, | | Change |
| | 2019 | | 2018 | | Dollars | | Percent | 2019 | | 2018 | | Dollars | | Percent |
| | (Dollars in thousands) | (Dollars in thousands) | | | | |
| Net cash provided by (used in) operating activities | $ | (125,251 | ) | | $ | (642,398 | ) | | $ | 517,147 |
| | 80.5 | % | $ | 160,701 |
| | $ | (94,798 | ) | | $ | 255,499 |
| | 269.5 | % |
| Net cash provided by (used in) investing activities | (98,263 | ) | | (97,160 | ) | | (1,103 | ) | | (1.1 | )% | (114,949 | ) | | (154,776 | ) | | 39,827 |
| | 25.7 | % |
| Net cash provided by (used in) financing activities | 138,987 |
| | 760,824 |
| | (621,837 | ) | | (81.7 | )% | (71,882 | ) | | 49,061 |
| | (120,943 | ) | | (246.5 | )% |
| Effect of exchange rate changes on cash and cash equivalents | (2,051 | ) | | (2,372 | ) | | 321 |
| | (13.5 | )% | (1,153 | ) | | (1,535 | ) | | 382 |
| | 24.9 | % |
| Net increase (decrease) in cash and cash equivalents and restricted cash | $ | (86,578 | ) | | $ | 18,894 |
| | $ | (105,472 | ) | | (558.2 | )% | $ | (27,283 | ) | | $ | (202,048 | ) | | $ | 174,765 |
| | 86.5 | % |
ComparisonCash flows from operating activities can fluctuate significantly from period to period as a result of various factors, including seasonality and timing differences associated with purchases, sales, taxes and other business decisions. The $255.5 million increase of cash flows for the six months ended February 28, 2019, and 2018
The $517.1 million increase in cash providedgenerated by operating activities reflects a combination of working capital decreases, primarily associated with decreased receivables, and increased accounts payable and accruals, which was partially offset by other changes, including decreased net income and a reduction of inventories and supplier advance payments, related to corn and soybeans as a result of trade disputes between the United States and foreign trade partners.income.
The $1.1$39.8 million decrease in cash fromused in investing activities primarily reflects the following:
Higher cash receipts in the prior year from the saleincreased collections of certain assets, including the sale of our primary corporate office building in Inver Grove Heights, Minnesota, in the first quarter of fiscal 2018,$142.1 million associated with CHS Capital notes receivable, which was subsequently leased back to us.
Increasedpartially offset by increased acquisitions of property, plant and equipment.equipment and decreased collections associated with financing extended to non-CHS Capital customers.
The $621.8$120.9 million decrease in cash from financing activities primarily reflects lowerincreased net cash needs that resulted in reduced net borrowings fromoutflows associated with our linesnotes payable and long-term debt facilities, which was partially offset by decreased equity redemption payments of credit and long term-debt facilities and $75.0 million of cash patronage paid.
Future Uses of Cash
We expect to utilize cash and cash equivalents, along with cash generated by operating activities to fund capital expenditures, major repairs, debt and interest payments, preferred stock dividends, patronage and equity redemptions. The following is a summary of our primary cash requirements for fiscal 2019:2020:
Capital expenditures. We expect total capital expenditures for fiscal 20192020 to be approximately $628.3$532.0 million, compared to capital expenditures of $355.4$443.2 million in fiscal 2018. Included in that amount for fiscal 2019 is approximately $137.1 million for the acquisition of property, plant and equipment at our Laurel, Montana and McPherson, Kansas, refineries and approximately $118.0 million for selective growth capital investments.2019. During the sixthree months ended February 28,November 30, 2019, we acquired property, plant and equipment of $178.0 million.
Major repairs. Refineries have planned major maintenance to overhaul, repair, inspect and replace process materials and equipment (referred to as "turnaround") that typically occurs for a five-to-six-week period every 2-5 years. Our McPherson, Kansas, refinery has planned maintenance scheduled for fiscal 2019 for approximately $200.0$131.8 million.
Debt and interest. During the six months ended February 28, 2019, we repaid $20We expect to repay approximately $39.2 million of scheduled long-term debt maturities. We have scheduledand finance lease obligations and incur interest payments related to long-term debt maturities of approximately $143$76.2 million during the remainder of fiscal 2019.2020.
Preferred stock dividends. We had approximately $2.3 billion of preferred stock outstanding at February 28,November 30, 2019. We expect to pay dividends on our preferred stock of approximately $168.7 million during fiscal 2019.2020.
Patronage. Our Board of Directors authorized approximately $90.0 million of our fiscal 2019 patronage sourced earnings to be paid to our member owners during fiscal 2020.
Equity redemptions. WeOur Board of Directors authorized and we expect total redemptions of approximately $79.0$90.0 million to be distributed in fiscal 2019 and to be2020 in the form of redemptions of qualified and non-qualifiednonqualified equity owned by individual producer members and associations. This amount includes approximately $4.0 million of authorized redemptions from fiscal 2018 to be paid in fiscal 2019. During the six months ended February 28, 2019, we redeemed $30.8 million of member equity.association members.
Future Sources of Cash
We fund our current operations primarily through a combination of cash flows from operations and committed and uncommitted revolving credit facilities, including our Securitization Facility and Repurchase Facility. We believe these sources
will provide adequate liquidity to meet our working capital needs. We fund certain of our long-term capital needs, primarily those related to acquisitions of property, plant and equipment, fromwith cash flows from operations and by issuing privately placed long-term debt and term loans. In addition, our wholly-owned subsidiary, CHS Capital, makes loans to member cooperatives, businesses and individual producers of agricultural products included in our cash flows from investing activities, and has financing sources as detailed below in CHS Capital Financing.Financing.
Working Capital Financing
We finance our working capital needs through committed and uncommitted lines of credit with domestic and international banks. We believe our current cash balances and our available capacity on our committed lines of credit will provide adequate liquidity to meet our working capital needs. The following table summarizes our primary lines of credit as of February 28,November 30, 2019:
| | | Primary Revolving Credit Facilities | | Maturities | | Total Capacity | | Borrowings Outstanding | | Interest Rates | | Maturities | | Total Capacity | | Borrowings Outstanding | | Interest Rates |
| | | Fiscal Year | | (Dollars in thousands) | | | Fiscal Year | | (Dollars in thousands) | |
| Committed Five-Year Unsecured Facility | | 2021 | | $ | 3,000,000 |
| | $ | 604,000 |
| | LIBOR or Base Rate + 0.00% to 1.45% | | 2024 | | $ | 2,750,000 |
| | $ | 245,000 |
| | LIBOR or Base Rate + 0.00% to 1.45% |
| Uncommitted Bilateral Facilities | | 2019 | | 615,000 |
| | 615,000 |
| | LIBOR or Base Rate + 0.00% to 1.05% | | 2020 | | 630,000 |
| | 530,000 |
| | LIBOR or Base Rate + 0.00% to 1.05% |
Our primary line of credit is a five-year unsecured revolving credit facility with a syndicate of domestic and international banks. The credit facility provides a committed amount of $2.75 billion that expires on July 16, 2024.
In addition to our primary revolving lines of credit, as of November 30, 2019, we havehad a three-year $315.0 million committed revolving pre-export credit facility for CHS Agronegocio Industria e Comercio Ltda ("CHS Agronegocio"), our wholly-owned subsidiary, in Brazil. CHS Agronegocio uses the facility, which expires in April 2020, to financeprovide financing for its working capital needs related toarising from its purchases and sales of grains, fertilizers and other agricultural products. As of February 28, 2019, theproducts that was scheduled to expire in April 2020. No amounts were outstanding balance under the facility was $88.9 million.as of November 30, 2019, and we exited this line of credit on December 31, 2019.
In addition to our uncommitted bilateral facilities above, as of February 28, 2019, our wholly-owned subsidiaries CHS Europe S.a.r.l and CHS Agronegocio had uncommitted lines of credit with $286.9$359.2 million outstanding.outstanding as of November 30, 2019. In addition, our other international subsidiaries had lines of credit with a totaloutstanding of $201.9$149.0 million outstanding as of February 28,November 30, 2019, of which $36.5$49.8 million was collateralized.
On February 28, 2019, and August 31, 2018, we had total short-term indebtedness outstanding on these various primary and other facilities, as well as other miscellaneous short-term notes payable, totaling $1.9 billion and $1.4 billion, respectively.
Long-term Debt Financing
The following table presents summarized long-term debt data (including current maturities) as of February 28,November 30, 2019, and August 31, 2018:
2019:
| | | | February 28,
2019 | | August 31,
2018 | November 30,
2019 | | August 31,
2019 |
| | (Dollars in thousands) | (Dollars in thousands) |
| Private placement debt | $ | 1,495,644 |
| | $ | 1,510,547 |
| $ | 1,356,886 |
| | $ | 1,379,840 |
|
| Bank financing | 366,000 |
| | 366,000 |
| 366,000 |
| | 366,000 |
|
| Capital lease obligations | 23,368 |
| | 25,280 |
| |
| Finance lease obligations | | 27,141 |
| | 28,239 |
|
| Other notes and contract payable | 31,161 |
| | 32,607 |
| 7,468 |
| | 18,601 |
|
| Deferred financing costs | (3,867 | ) | | (4,179 | ) | (3,427 | ) | | (3,569 | ) |
| | $ | 1,912,306 |
| | $ | 1,930,255 |
| $ | 1,754,068 |
| | $ | 1,789,111 |
|
CHS Capital Financing
For a description of the Securitization Facility, see above in Fiscal 20192020 and 20182019 Activity.
CHS Capital has available credit under master participation agreements with several counterparties. Borrowings under these agreements are accounted for as secured borrowings and bear interest at variable rates ranging from 3.86% to 4.46% as of February 28, 2019. As of February 28, 2019, the total funding commitment under these agreements was $115.0 million, of which $68.0 million was borrowed.
CHS Capital sells loan commitments it has originated to ProPartners Financial on a recourse basis. The totalTotal outstanding commitments under the primary program totaled $31.8were $122.5 million as of February 28,November 30, 2019, of which $25.7$73.6 million was borrowed under these commitments with an interest rate of 3.68%2.98%.
CHS Capital borrows funds under short-term notes issued as part of a surplus funds program. Borrowings under this program are unsecured and bear interest at variable rates ranging from 0.35% to 1.4% as of February 28,November 30, 2019, and are due upon demand. Borrowings under these notes totaled $31.7$62.2 million as of February 28,November 30, 2019.
On September 30, 2019, CHS Capital entered into a credit agreement with a revolving note. Under this agreement, CHS Capital has available capacity of $150.0 million of which no amount was outstanding as of November 30, 2019.
Covenants
Our long-term debt is mostly unsecured; however, restrictive covenants under various debt agreements have requirements forrequire maintenance of minimum consolidated net worth and other financial ratios. We were in compliance with all debt covenants and restrictions as of February 28,November 30, 2019. Based on our current 20192020 projections, we expect continued covenant compliance in the near term.compliance.
In September 2015, we amended allAll outstanding private placement notes to conform theto financial covenants applicable thereto to those of our amended and restated five-year unsecured revolving credit facility. The amended notes provide that if our ratio of consolidated funded debt to consolidated cash flowflows is greater than a ratio of 3.0 to 1.0, the interest rate on all outstanding notes will be increased by 0.25% until the ratio becomes 3.0 or less. During the sixthree months ended February 28,November 30, 2019 and 2018, our ratio of funded debt to consolidated cash flowflows remained below 3.0 to 1.0.
Patronage and Equity Redemptions
In accordance with our bylaws and upon approval by our Board of Directors, annual net earnings from patronage sources are distributed to consenting patrons following the close of each fiscal year. Patronage earnings for the year ended August 31, 2018, were distributed during the six months ended February 28, 2019, including the $75.0 million cash portion of this distribution.and are based on amounts using financial statement earnings. For the year ended August 31, 2017,2019, our Board of Directors authorized only non-qualified distributions of $562.4 million, with qualified cash distributions of $90.0 million and no cash patronage was distributed during the six months ended February 28, 2018.nonqualified equity distributions of $472.4 million.
In accordance with authorization from our Board of Directors, we expect total redemptions related to the year ended August 31, 2018,2019, that will be distributed in fiscal 2019,2020, to be approximately $75.0 million.$90.0 million and to be in the form of qualified and nonqualified equity owned by individual producer members and associations. During the sixthree months ended February 28,November 30, 2019, $30.8$5.4 million of that amount was redeemed in cash, compared to $4.7$24.1 million redeemed in cash during the sixthree months ended February 28,November 30, 2018.
Preferred Stock
The following is a summary of our outstanding preferred stock as of February 28,November 30, 2019, all shares of which are listed on the Global Select Market of Nasdaq:
| | | | | Nasdaq symbol | | Issuance date | | Shares outstanding | | Redemption value | | Net proceeds (a) | | Dividend rate (b) (c) | | Dividend payment frequency | | Redeemable beginning (d) | | Nasdaq Symbol | | Issuance Date | | Shares Outstanding | | Redemption Value | | Net Proceeds (a) | | Dividend Rate (b) (c) | | Dividend Payment Frequency | | Redeemable Beginning (d) |
| | | | | (Dollars in millions) | | | | | | | (Dollars in millions) | | | |
| 8% Cumulative Redeemable | | CHSCP | | (e) | | 12,272,003 |
| | $ | 306.8 |
| | $ | 311.2 |
| | 8.00 | % | | Quarterly | | 7/18/2023 | | CHSCP | | (e) | | 12,272,003 |
| | $ | 306.8 |
| | $ | 311.2 |
| | 8.00 | % | | Quarterly | | 7/18/2023 |
| Class B Cumulative Redeemable, Series 1 | | CHSCO | | (f) | | 21,459,066 |
| | $ | 536.5 |
| | $ | 569.3 |
| | 7.875 | % | | Quarterly | | 9/26/2023 | | CHSCO | | (f) | | 21,459,066 |
| | $ | 536.5 |
| | $ | 569.3 |
| | 7.875 | % | | Quarterly | | 9/26/2023 |
| Class B Reset Rate Cumulative Redeemable, Series 2 | | CHSCN | | 3/11/2014 | | 16,800,000 |
| | $ | 420.0 |
| | $ | 406.2 |
| | 7.10 | % | | Quarterly | | 3/31/2024 | | CHSCN | | 3/11/2014 | | 16,800,000 |
| | $ | 420.0 |
| | $ | 406.2 |
| | 7.10 | % | | Quarterly | | 3/31/2024 |
| Class B Reset Rate Cumulative Redeemable, Series 3 | | CHSCM | | 9/15/2014 | | 19,700,000 |
| | $ | 492.5 |
| | $ | 476.7 |
| | 6.75 | % | | Quarterly | | 9/30/2024 | | CHSCM | | 9/15/2014 | | 19,700,000 |
| | $ | 492.5 |
| | $ | 476.7 |
| | 6.75 | % | | Quarterly | | 9/30/2024 |
| Class B Cumulative Redeemable, Series 4 | | CHSCL | | 1/21/2015 | | 20,700,000 |
| | $ | 517.5 |
| | $ | 501.0 |
| | 7.50 | % | | Quarterly | | 1/21/2025 | | CHSCL | | 1/21/2015 | | 20,700,000 |
| | $ | 517.5 |
| | $ | 501.0 |
| | 7.50 | % | | Quarterly | | 1/21/2025 |
| |
(a) | Includes patrons' equities redeemed with preferred stock. |
| |
(b) | The Class B Reset Rate Cumulative Redeemable Preferred Stock, Series 2, accumulates dividends at a rate of 7.10% per year until March 31, 2024, and then at a rate equal to the three-month LIBOR plus 4.298%, not to exceed 8.00% per annum, subsequent to March 31, 2024. |
| |
(c) | The Class B Reset Rate Cumulative Redeemable Preferred Stock, Series 3, accumulates dividends at a rate of 6.75% per year until September 30, 2024, and then at a rate equal to the three-month LIBOR plus 4.155%, not to exceed 8.00% per annum, subsequent to September 30, 2024. |
| |
(d) | Preferred stock is redeemable for cash at our option, in whole or in part, at a per share price equal to the per share liquidation preference of $25.00 per share, plus all dividends accumulated and unpaid on that share to and including the date of redemption, beginning on the dates set forth in this column. |
| |
(e) | The 8% Cumulative Redeemable Preferred Stock was issued at various times from 2003 through 2010. |
| |
(f) | Shares of Class B Cumulative Redeemable Preferred Stock, Series 1, were issued on September 26, 2013; August 25, 2014; March 31, 2016; and March 30, 2017. |
Dividends paid on our preferred stock during each of the sixthree months ended February 28,November 30, 2019 and 2018, were $84.3$42.2 million.
Off-Balance Sheet Financing Arrangements
Operating Leases
Our minimum future lease payments required under noncancelable operating leases presented in Management’s Discussion and Analysis of Financial Condition and Results of Operations in our Annual Report on Form 10-K for the year ended August 31, 2018, have not materially changed during the six months ended February 28, 2019.
Guarantees
We are a guarantor for lines of credit and performance obligations of related companies. As of February 28,November 30, 2019, our bank covenants allowed maximum guarantees of $1.0 billion, of which $197.1$178.3 million were outstanding. We have collateral for a portion of these contingent obligations. We have not recorded a liability related to the contingent obligations as we do not expect to pay out any cash related to them, and the fair values are considered immaterial. The underlying loans to the counterparties for which we provide guarantees were current as of February 28,November 30, 2019.
Debt
We have no material off-balance sheet debt.
Receivables Securitization Facility and Loan Participations
During fiscal 2018, weWe engaged in off-balance sheet arrangements through our Securitization Facility and certain loan participation agreements. In the fourth quarter of fiscal 2018, we amended the Securitization Facility so that the transfer of Receivables is accounted for as a secured borrowing. Refer to further details about these arrangements in Note 4,3, Receivables, of the notes to the consolidated financial statements in our Annual Report on Form 10-K for the year ended August 31, 2018.2019.
Contractual Obligations
Our contractual obligations presented in Management’sManagement's Discussion and Analysis of Financial Condition and Results of Operations in our Annual Report on Form 10-K for the year ended August 31, 2018,2019, have not materially changed during the sixthree months ended February 28,November 30, 2019.
Critical Accounting Policies
Other than as described within the Significant Accounting Policies section of Note 1, Basis of Presentation and Significant Accounting Policies, to our unaudited condensed consolidated financial statements included in this Quarterly Report on Form 10-Q, our critical accounting policies as presented in Management’sManagement's Discussion and Analysis of Financial Condition and Results of Operations in our Annual Report on Form 10-K for the year ended August 31, 2018,2019, have not materially changed during the sixthree months ended February 28,November 30, 2019.
Effect of Inflation and Foreign Currency Transactions
We believe that inflation and foreign currency fluctuations have not had a material effect on our operations, since we conduct an insignificant portion of our business in foreign currencies.
Recent Accounting Pronouncements
See Note 1, Basis of Presentation and Significant Accounting Policies, to our unaudited condensed consolidated financial statements included in this Quarterly Report on Form 10-Q for a description of the recent accounting pronouncements that are applicableapply to us.
ITEM 3. QUANTITATIVE AND QUALITATIVE DISCLOSURES ABOUT MARKET RISK
We did not experience any material changes in market risk exposures for the period ended February 28,November 30, 2019, that would affect the quantitative and qualitative disclosures presented in our Annual Report on Form 10-K for the year ended August 31, 2018.2019.
ITEM 4. CONTROLS AND PROCEDURES
Evaluation of Disclosure Controls and Procedures
Under the supervision and with the participation of our management, including our Chief Executive Officer and Interim Chief Financial Officer, we evaluated the effectiveness of our disclosure controls and procedures (as defined in Rule 13a-15(e) under the Securities Exchange Act of 1934 (the "Exchange Act")), as of February 28,November 30, 2019. Based on that evaluation, our Chief Executive Officer and Interim Chief Financial Officer concluded that, as of that date, our disclosure controls and procedures were not effective because of the material weaknesses in our internal control over financial reporting disclosed within Management's Annual Report on Internal Control Over Financial Reporting in Item 9A of our Annual Report on Form 10-K for the year ended August 31, 2018.2019.
Status of Remediation of Material Weaknesses in Internal Control Over Financial Reporting
Remediation Actions Taken During the Quarter Ended February 28,November 30, 2019
The following remediation efforts were taken during the quarter ended February 28,November 30, 2019:
Formed a
Held bi-weekly steering committee meetings consisting of senior finance, legal, information technology ("IT"), operational and human resources leaders who are charged with overseeingto oversee the design and implementation of remediation plansplans.
Continued developing, executing and who operate under the oversight of the Audit Committee of our Board of Directors.
Engaged outside consultants who are recognized experts in the areas of internal controls, technical accounting, IT systems, process improvement and project management to assist management in re-evaluating the design of internal controls and accounting processes.
Completed the developmentmonitoring of detailed remediation plans in response to each of the material weaknessesremaining previously identified and began executing those plans.
Revised and issued new policies related to the preparation and review of journal entries and account reconciliations.
Completed trainings by the end of January 2019, by division on the newly revised and issued policies on proper preparation and approval of account reconciliations and journal entries.
Formed an intercompany transactions task force focused on designing and implementing controls to ensure all transactions are properly identified as intercompany/non-intercompany and eliminated as appropriate. As a result, processes have been changed and improved, including improved communication and identification of intercompany and non-intercompany transactions.
Instituted additional training programs that will continue on a regular basis related to internal control over financial reporting for our finance and accounting personnel.
Conducted training for accounting and finance personnel on proper identification and accounting for derivatives under ASC 815.
Enhanced and supplemented the Grain Marketing finance and accounting team by increasing the number of roles, reassigning responsibilities, and established a plan for the hiring additional individuals with an appropriate level of knowledge and experience in internal control over financial reporting commensurate with the financial reporting complexities of the organization.
In the process of adding additional resources in our IT and accounting areas, with several notable positions expected to be filled in the third quarter of fiscal 2019.
A new segregation of duties policy was drafted and will be issued in the third quarter of fiscal 2019.
Outside experts started an assessment of IT user access controls in identified key systems.material weaknesses.
Ongoing Remediation Efforts
We are continuing to enhance our overall financial control environment through the following:
Continued execution of our plans designed to remediate the previously-identifiedtwo remaining previously identified material weaknesses.weaknesses, including (1) implementing and reinforcing an adequate process for monitoring proper functioning of internal controls to verify that our accounting policies and procedures are consistently and adequately being performed as relevant by a sufficient number of resources with appropriate knowledge and training and (2) designing and maintaining effective controls over certain IT general controls for information systems that are relevant to the preparation of our financial statements and testing the effectiveness of remediated controls.
Evaluating existing
Continued hiring for our teams in accounting, finance, IT and otherfunctional areas as necessary to ensure the size and skill set of those teams is adequate given the size, scale and complexity of our organization, industry and the required internal controls over financial reporting.
Changes in Internal Control Over Financial Reporting
The remediation activities described above representThere have been no changes in internal control over financial reporting during the quarter ended February 28,November 30, 2019, that have materially affected, or are reasonably likely to materially affect, our internal control over financial reporting.
PART II. OTHER INFORMATION
ITEM 1. LEGAL PROCEEDINGS
We are involved as a defendant in various lawsuits, claims and disputes, which are in the normal course of our business. The resolution of any such matters may affect consolidated net income for any fiscal period; however, our management believes any resulting liabilities, individually or in the aggregate, will not have a material effect on our condensed consolidated financial position, results of operations or cash flowsstatements during any fiscal year.
ITEM 1A. RISK FACTORS
There were no material changes to our risk factors during the period covered by this report. See the discussion of risk factors in Item 1A of our Annual Report on Form 10-K for the year ended August 31, 2018.2019.
ITEM 5. OTHER INFORMATION
As previously discussed in the Company’s Annual Report on Form 10-K for the year ended August 31, 2018, our Board of Directors determined that the threshold performance metric under the CHS Long Term Incentive Plan for the fiscal 2016-2018 performance period (the “2016-2018 LTIP”) was not satisfied and, accordingly, no awards were earned by any participant in the 2016-2018 LTIP. To preserve key leadership continuity and bench strength, as well as a total direct compensation opportunity amount that is competitive to market, on April 2, 2019, our Board of Directors approved a potential retention incentive award for certain senior officers of the Company, including each of the “Named Executive Officers” set forth in the Company’s Annual Report on Form 10-K for the year ended August 31, 2018, who were both (1) active participants in the 2016-2018 LTIP, and (2) active employees of the Company on the date the award was approved. The potential award value is equal to the percentage of base salary used for the 2016-2018 LTIP at the target level, based on each participant’s job level as of August 31, 2018, multiplied by the participant’s base salary as of August 31, 2018, and will be earned only if the participant continues active employment through January 1, 2021, or meets the limited pro ration criteria provided in the award.
ITEM 6. EXHIBITS
|
| |
| Exhibit | Description |
| Amendment No. 1 to Master Framework Agreement, dated as of September 4, 2018 (“Framework Agreement”), by and among MUFG Bank, Ltd. (f/k/a The Bank of Tokyo-Mitsubishi UFJ, Ltd.) and each other financial institution from time to time party thereto, as MFA Buyers, MUFG Bank, Ltd., as agent for the MFA Buyers, CHS Inc. Senior Leadership Team Retention Award Document.and CHS Capital, LLC, as sellers, and CHS Inc., as agent for the sellers. |
| Amendment No. 2 to the Framework Agreement, dated as of September 4, 2018. |
| Amendment No. 3 to the CHS Inc. Deferred Compensation Plan (2015 Restatement). |
| Certification of the Chief Executive Officer Pursuant to Section 302 of the Sarbanes-Oxley Act of 20022002. |
| Certification of the Interim Chief Financial Officer Pursuant to Section 302 of the Sarbanes-Oxley Act of 20022002. |
| Certification of the Chief Executive Officer Pursuant to 18 U.S.C. Section 1350, as Adopted Pursuant to Section 906 of the Sarbanes-Oxley Act of 20022002. |
| Certification of the Interim Chief Financial Officer Pursuant to 18 U.S.C. Section 1350, as Adopted Pursuant to Section 906 of the Sarbanes-Oxley Act of 20022002. |
| 101 | The following financial information from the CHS Inc.’s Quarterly Report on Form 10-Q for the quarterly period ended February 28,November 30, 2019, formatted in Extensible Business Reporting Language (XBRL): (i) the Condensed Consolidated Balance Sheets, (ii) the Condensed Consolidated Statements of Operations, (iii) the Condensed Consolidated Statements of Comprehensive Income, (iv) the Condensed Consolidated Statements of Cash Flows, and (v) the Notes to the Condensed Consolidated Financial Statements. |
SIGNATURES
Pursuant to the requirements of the Securities Exchange Act of 1934, as amended, the registrant has duly caused this report to be signed on its behalf by the undersigned, thereunto duly authorized.
CHS Inc.
(Registrant)
|
| | | | | |
| Date: | April 3, 2019January 8, 2020 | | By: | | /s/ Timothy SkidmoreAngela Olsonawski |
| | | | | | Timothy SkidmoreAngela Olsonawski |
| | | | | | ExecutiveSenior Vice President, andInterim Chief Financial Officer and Corporate Treasurer |