ITEM 2. MANAGEMENT’S DISCUSSION AND ANALYSIS OF FINANCIAL CONDITION AND RESULTS OF OPERATIONS
The following discussion should be read in conjunction with our unaudited financial statements and the accompanying notes included in Part 1,I, Item 1. “Financial Statements” in this Quarterly Report on Form 10-Q and our audited financial statements and the accompanying notes included in Part II, Item 8 in our Annual Report on Form 10-K for the year ended December 31, 2016.2019 (the “2019 Form 10-K”). References herein to “Dynex,” the “Company,” “we,” “us,” and “our” include Dynex Capital, Inc. and its consolidated subsidiaries, unless the context otherwise requires. In addition to current and historical information, the following discussion and analysis contains forward-looking statements within the meaning of the Private Securities Litigation Reform Act of 1995. These statements relate to our future business, financial condition or results of operations. For a description of certain factors that may have a significant impact on our future business, financial condition or results of operations, see “Forward-Looking Statements” at the end of this discussion and analysis.
For more information about our business including our operating policies, investment philosophy and strategy, financing and hedging strategies, and other important information, please refer to Part I, Item 1 of our Annual Report on2019 Form 10-K for the year ended December 31, 2016.10-K.
EXECUTIVE OVERVIEW
Markets stabilized in the second quarter of 2020 after a volatile first quarter due to strong intervention by the Federal Reserve and the economic relief provided by the CARES Act. As markets adjusted to these policies, credit spreads on risk assets rallied and U.S. Treasury interest rates settled into a tighter range and ended the second quarter virtually unchanged from March 31, 2020. Funding markets were also have two series of preferred stock outstanding,more stable in the second quarter compared to the prior quarter. While there has not been a direct impact from COVID-19 on our 8.50% Series A Cumulative Redeemable Preferred Stock (the "Series A Preferred Stock") which is tradedoperations other than the need to shift to a remote work environment, the impact on the NYSE underU.S. and the symbol "DXPRA",global economy from COVID-19 continues to have the potential to materially disrupt cash flows on U.S. real estate, and in particular rents on multifamily and commercial real estate which could impact our 7.625% Series B Cumulative Redeemable Preferred Stock (the "Series B Preferred Stock") which is traded on the NYSE under the symbol "DXPRB".
Against this backdrop, we sold $1.8 billion of residential MBS (“RMBS”), commercial MBS (“CMBS”)Agency CMBS early in the second quarter, realizing a gain of $181.4 million. At the end of April, we had reduced our investment portfolio down to approximately $2.2 billion and CMBS interest-only ("IO") securities. Agency MBS have a guaranty of principal payment by an agencyleverage to approximately 3.9 times shareholders’ equity. As markets stabilized, over the balance of the U.S. government or a U.S. government-sponsored entity ("GSE") such as Fannie Mae and Freddie Mac. Non-Agency MBS have no such guaranty of payment. Our investments in non-Agency MBS are generally higher quality senior or mezzanine classes (typically rated 'A' or better by one or more of the nationally recognized statistical rating organizations) because they are typically more liquid (i.e., they are more easily converted into cash either through sales or pledges as collateral for repurchase agreement borrowings) and have less exposure to credit losses than lower-rated non-Agency MBS.
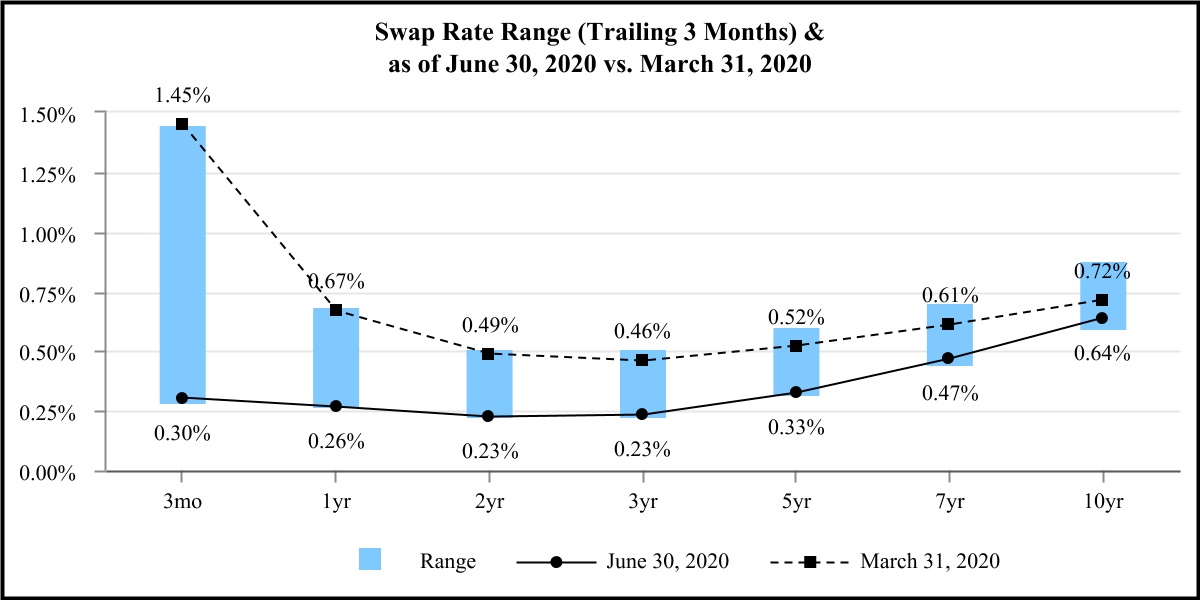
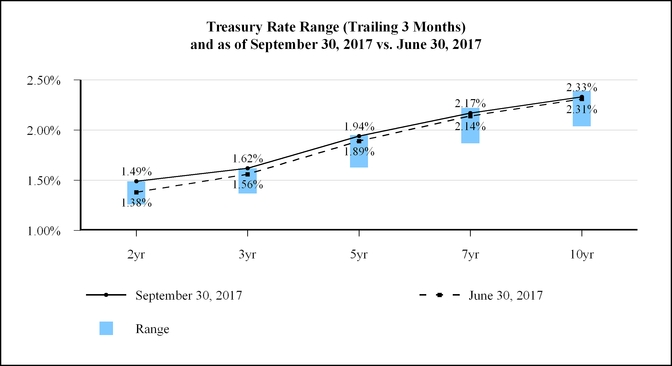
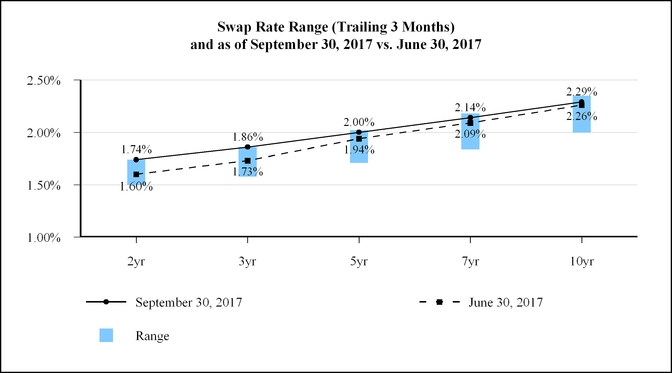
The charts below show the highest and lowest U.S. Treasury and swap rates during the quarter ended June 30, 2020 as well as adjustable-rate mortgage loans ("ARMs"), which have interestthe rates that generally adjust at least annually to an increment over a specified interest rate index. Agency ARMs also include hybrid adjustable-rate mortgage loans ("hybrid ARMs"), which are loans that have a fixed rateas of interest for a specified period (typically three to ten years)June 30, 2020 and then adjust their interest rate at least annually to an increment over a specified interest rate index. Substantially all of our ARMs reset based on the one-year LIBOR index. We sold the majority of our non-Agency RMBSDecember 31, 2019:

Second Quarter 2020 Results
Our book value per common share increased $0.62 during the second quarter of 20172020 primarily because these investments were within a year of their maturity. We are not currently re-investing capital into non-Agencyspread tightening on Agency RMBS, dueAgency CMBS, and CMBS IO. The resulting increase in fair value of our MBS was the primary component of our overall comprehensive income to the lackcommon shareholders of available securities of this type with attractive risk-adjusted returns.
quarter of 2020 when the Company monetized gains on the underlying Agency securities over the roll period (interest income less implied financing cost). We account for TBA securities as derivative instruments because we cannot assert that it is probable at inception and throughout the termmost of an individual TBA contract that its settlement will result in physical delivery of the underlying Agency RMBS orand reduced its leverage as asset prices began to fall during the individual TBA contract will not settle inmarket's initial response to the shortest time period possible.COVID-19 pandemic. During June, the proceeds from the first and second quarter sales were mostly re-invested back into Agency RMBS.
Current Outlook
Our financial performance may bemacroeconomic opinion for the long-term has not changed. We believe the global economy remains fragile and vulnerable to sudden exogenous shocks. The global economy is largely supported by central banks and global debt continues to increase excessively. Our current short-term view, however, has been impacted by multiple factors, including but not limitedthe health crisis, the resulting economic crisis, and a host of new policy risks that have been introduced in order to macroeconomic conditions, geopolitical conditions, central banksupport the global economy. Though the Federal Reserve has taken action to support the financial markets, and government policy, the absolute level of interest ratesCongress and the relative slopeU.S. Treasury have passed the CARES Act, we believe the efficacy and outcome of interest rate curves, changesthese actions are unknown and the risk for policy mistakes is very high. Measures of market volatility currently are low, however, notwithstanding the spike in COVID-19 cases in the U.S. and somewhat softening economic indicators.
As noted above, we expect that we will out earn our $0.13 per common share monthly dividend in the third quarter with the favorable funding environment. This outlook assumes we do not rapidly reduce our investment portfolio from an exogenous event as occurred in March. The risk of such an event remains high, but we have constructed our investment portfolio so that we remain flexible and can quickly de-lever our balance sheet. We believe we are in a strong position of liquidity and leverage that will allow us to evaluate the market expectations of future interest rates, actualenvironment for the best risk and estimated future prepayment ratesreturn opportunities without undue pressure on our investments, competitionbalance sheet and capital position. We maintain our belief that the demographics behind the housing sector continue to support our investment thesis of investing in high quality, highly liquid U.S.-based housing assets. We continue to take a balanced and measured approach to our strategy, so that we are prepared to manage our business under a variety of scenarios.
Other Factors Impacting Our Financial Condition and Results of Operations
In recent filings, we have discussed the potential for investments, economic conditions and their impact on the credit performanceupcoming cessation of our investments, and market required yieldsLIBOR as reflected by market spreads. All of these factors are influenced by market forces beyond our control and may be exacerbated during periods of market volatility.
Non-GAAP Financial Measures
In addition to the Company's operating results presented in accordance with GAAP, the information presented within Item 2, "Management's Discussion and Analysis of Financial Condition and Results of Operations" of this Quarterly Report on Form 10-Q contains the following non-GAAP financial measures: core net operating income to common shareholders (including per common share), adjusted interest expense, adjusted net interest income and the related metrics adjusted cost of funds andmetric adjusted net interest spread. Management views core net operating income to common shareholders as an estimate of the net interest earnings and drop income from our investments after operating expenses and preferred stock dividends. In addition to the reconciliation set forth below, which derives core net operating income to common shareholders from GAAP net income to common shareholders as the nearest GAAP equivalent measure, core net operating income to common shareholders can also be determined by adjusting net interest income to include interest rate swap periodic interest costs, drop income on TBA securities, general and administrative expenses (GAAP), and preferred dividends. Management includes drop income in core net operating income to common shareholders and in adjusted net interest income because TBA securities are viewed by management as economically equivalent to holding and financing Agency RMBS using short-term repurchase agreements. Management also includes periodic interest costs from its interest rate swaps, which are included in "gain (loss) on derivative instruments" on the
peers, although the Company's presentation of its non-GAAP financial measures include or exclude, as applicable, certain items usedmay not be comparable to compute GAAPother similarly-titled measures of other companies. Reconciliations of core net operating income to common shareholders GAAPand adjusted net interest income orto the related GAAP financial measures are provided below and within “Results of Operations”.
Management views core net operating income to common shareholders as an estimate of the Company’s financial performance based on the effective yield of its investments, net of financing costs and other normal recurring operating income/expense, net. In addition to the non-GAAP reconciliation set forth below, which derives core net operating income to common shareholders from GAAP comprehensive income (loss) to common shareholders, core net operating income to common shareholders can also be determined by adjusting net interest income to include interest rate swap periodic interest benefit/cost, drop income on TBA securities, general and administrative expenses, and preferred dividends. Drop income generated by TBA dollar roll positions, which is included in "gain (loss) on derivatives instruments, net" on the Company's consolidated statements of comprehensive income, is included in core net operating income and in adjusted net interest income because management views drop income as the economic equivalent of net interest income (interest income less implied financing cost) on the underlying Agency security from trade date to settlement date. Management also includes interest rate swap periodic interest benefit/cost, which is also included in "gain (loss) on derivatives instruments, net", in adjusted net interest income because interest rate swaps are used by the Company to economically hedge the impact of changing interest rates on its borrowing costs from repurchase agreements, and therefore represent a cost of financing in addition to GAAP interest expense,expense. However, these non-GAAP financialmeasures do not provide a full perspective on our results of operations, and therefore, their usefulness is limited. For example, these non-GAAP measures do not include gains or losses from available-for-sale investments, changes in fair value of and costs of terminating interest rate swaps, as well as realized and unrealized gains or losses from other instruments used by management to economically hedge the impact of changing interest rates on the fair value of its portfolio and book value per common share. As a result, these non-GAAP measures should be considered as a supplement to, and not as a substitute for, the Company's GAAP results as reported on its consolidated statements of comprehensive income.
| Three Months Ended | |||||||||||||||||
| ($ in thousands, except per share amounts) | June 30, 2020 | March 31, 2020 | |||||||||||||||
| Comprehensive income (loss) to common shareholders | $ | 26,538 | $ | (33,262) | |||||||||||||
| Less: | |||||||||||||||||
| Change in fair value of available for sale investments | (28,052) | (157,755) | |||||||||||||||
Change in fair value of derivative instruments, net (1) | 10,252 | 198,370 | |||||||||||||||
| Preferred stock redemption charge to common shareholders | — | 3,914 | |||||||||||||||
| Fair value adjustments, net | (332) | 372 | |||||||||||||||
| Core net operating income to common shareholders | $ | 8,406 | $ | 11,639 | |||||||||||||
| Weighted average common shares | 23,056,812 | 22,963,084 | |||||||||||||||
| Comprehensive income (loss) per common share | $ | 1.15 | $ | (1.45) | |||||||||||||
| Core net operating income per common share | $ | 0.36 | $ | 0.51 | |||||||||||||
(1) Amount includes unrealized gains and losses from changes in fair value of derivatives and realized gains and losses on terminated derivatives and excludes net periodic interest benefit on effective interest rate swaps outstanding during the period.
26
| Three Months Ended | |||||||||||||||||
| ($ in thousands) | June 30, 2020 | March 31, 2020 | |||||||||||||||
| Net interest income | $ | 15,003 | $ | 17,721 | |||||||||||||
Add: TBA drop income (1) | 1,796 | 739 | |||||||||||||||
Add: net periodic interest (cost) benefit (2) | (107) | 2,064 | |||||||||||||||
| Adjusted net interest income | $ | 16,692 | $ | 20,524 | |||||||||||||
| Other operating expense, net | (222) | (423) | |||||||||||||||
| General and administrative expenses | (4,811) | (4,621) | |||||||||||||||
| Preferred stock dividends | (3,253) | (3,841) | |||||||||||||||
| Core net operating income to common shareholders | $ | 8,406 | $ | 11,639 | |||||||||||||
(1) TBA drop income is calculated by multiplying the notional amount of the TBA dollar roll positions by the difference in price between two TBA securities with the same terms but different settlement dates. The impact of TBA drop income on adjusted net interest spread includes the implied average funding cost of TBA dollar roll transactions during the periods indicated.
(2) Amount represents net periodic interest benefit/cost of effective interest rate swaps outstanding during the period and excludes realized and unrealized gains and losses from changes in fair value of derivatives.
FINANCIAL CONDITION
Investment Portfolio
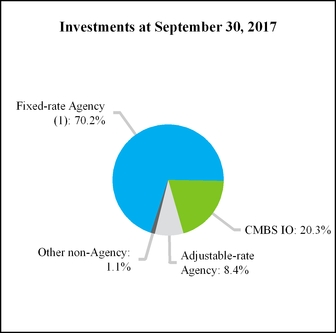
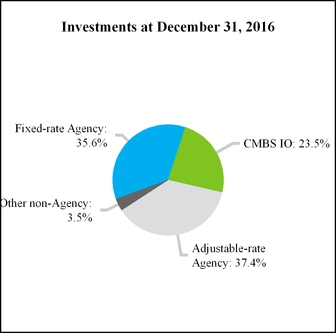
Our investment portfolio as of June 30, 2020 was $4.8 billion including TBA securities, an increase of over 50% versus March 31, 2020 and within 10% of the size of our portfolio as of December 31, 2019. We remain primarily invested in Agency fixed-rate investments which have more a more favorable risk-return profile and higher liquidity in the current
27
macroeconomic environment due to their lower credit risk versus other types of MBS. The following chart compares the composition of our MBS portfolio including TBA securities as of the dates indicated:
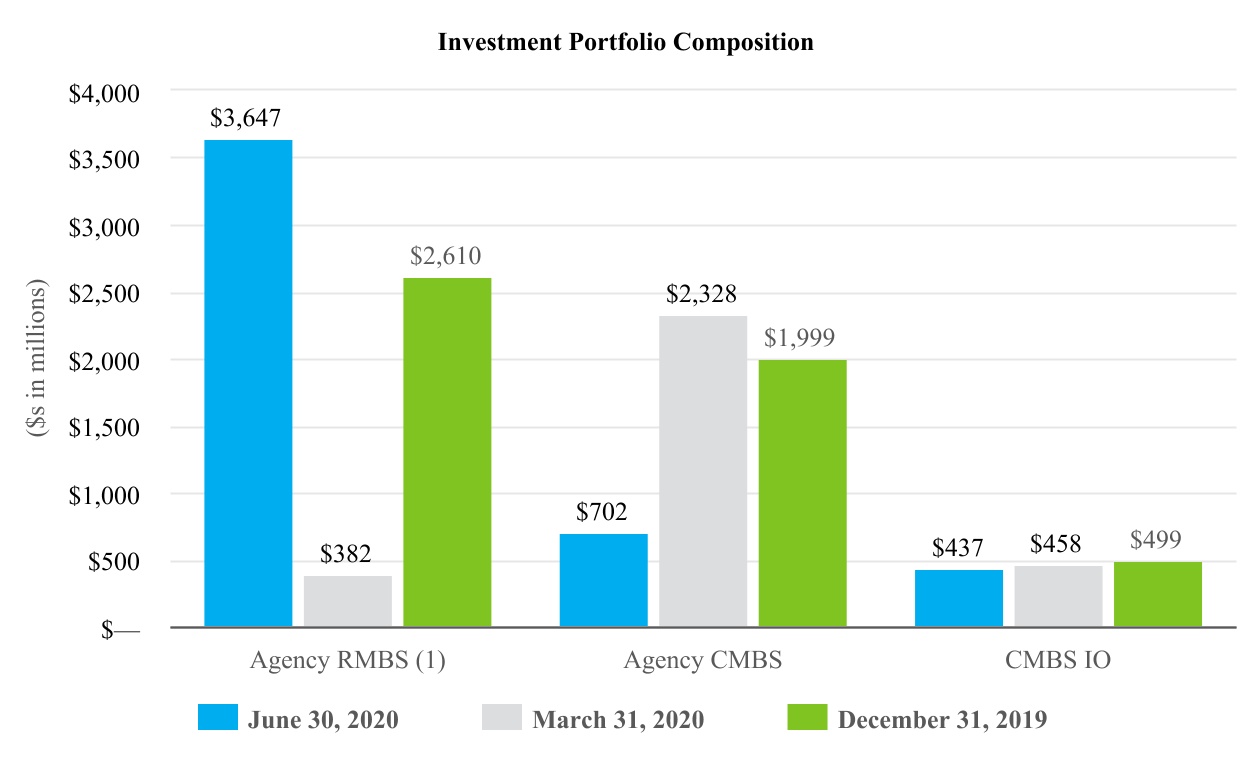
(1) Includes TBA positions at their implied market value as if settled which are accounted for as “derivative assets (liabilities)” on our consolidated balance sheet.
RMBS.The majority of our Agency RMBS are pass-through securities collateralized primarily by pools of fixed-rate single-family mortgage loans. Monthly payments of principal and interest made by the individual borrowers on the mortgage loans underlying the pools are "passed through" to the security holders, after deducting GSE or U.S. Government agency guarantee and servicer fees. In general, mortgage pass-through certificates distribute cash flows from the underlying collateral on a pro-rata basis among the security holders. Security holders also receive guarantor advances of principal and interest for delinquent loans in the mortgage pools.
Since December 31, 2019, we have shifted our RMBS portfolio into lower coupon investments to mitigate the risk of loss of premiums due to early prepayment given the lower interest rate environment. The following tables compare our fixed-rate Agency RMBS investments including TBA dollar roll positions as of the dates indicated:
28
| June 30, 2020 | ||||||||||||||||||||||||||||||||||||||||||||||||||||||||||||||||||||||||||
| Par | Amortized Cost/ Implied Cost Basis (1)(3) | Fair Value (2)(3) | Weighted Average | |||||||||||||||||||||||||||||||||||||||||||||||||||||||||||||||||||||||
| Coupon | Loan Age (in months) (4) | 3 Month CPR (4)(5) | Estimated Duration (6) | |||||||||||||||||||||||||||||||||||||||||||||||||||||||||||||||||||||||
| 30-year fixed-rate: | ($ in thousands) | |||||||||||||||||||||||||||||||||||||||||||||||||||||||||||||||||||||||||
| 2.0% | $ | 790,107 | $ | 808,631 | $ | 812,199 | 2 | — | % | 5.50 | ||||||||||||||||||||||||||||||||||||||||||||||||||||||||||||||||
| 2.5% | 1,003,210 | 1,039,921 | 1,052,948 | 4 | 1.2 | % | 3.80 | |||||||||||||||||||||||||||||||||||||||||||||||||||||||||||||||||||
| 4.0% | 455,435 | 467,789 | 491,659 | 26 | 29.4 | % | 2.21 | |||||||||||||||||||||||||||||||||||||||||||||||||||||||||||||||||||
| TBA 2.0% | 500,000 | 509,691 | 511,084 | n/a | n/a | 4.51 | ||||||||||||||||||||||||||||||||||||||||||||||||||||||||||||||||||||
| TBA 2.5% | 500,000 | 517,891 | 520,830 | n/a | n/a | 1.33 | ||||||||||||||||||||||||||||||||||||||||||||||||||||||||||||||||||||
| 15-year fixed-rate: | ||||||||||||||||||||||||||||||||||||||||||||||||||||||||||||||||||||||||||
| TBA 2.0% | 250,000 | 257,738 | 258,164 | n/a | n/a | 2.46 | ||||||||||||||||||||||||||||||||||||||||||||||||||||||||||||||||||||
| Total | $ | 1,495,542 | $ | 1,534,158 | $ | 1,562,022 | 8 | 6.8 | % | 5.92 | ||||||||||||||||||||||||||||||||||||||||||||||||||||||||||||||||
| December 31, 2019 | ||||||||||||||||||||||||||||||||||||||||||||||||||||||||||||||||||||||||||
| Par | Amortized Cost/ Implied Cost Basis (1)(3) | Fair Value (2)(3) | Weighted Average | |||||||||||||||||||||||||||||||||||||||||||||||||||||||||||||||||||||||
| Coupon | Loan Age (in months) (4) | 3 Month CPR (4)(5) | Estimated Duration (6) | |||||||||||||||||||||||||||||||||||||||||||||||||||||||||||||||||||||||
| 30-year fixed-rate: | ($ in thousands) | |||||||||||||||||||||||||||||||||||||||||||||||||||||||||||||||||||||||||
| 2.5% | $ | 110,610 | $ | 109,341 | $ | 109,409 | 3 | — | % | 5.15 | ||||||||||||||||||||||||||||||||||||||||||||||||||||||||||||||||
| 3.0% | 307,380 | 310,486 | 314,159 | 25 | 9.4 | % | 4.04 | |||||||||||||||||||||||||||||||||||||||||||||||||||||||||||||||||||
| 3.5% | 538,551 | 549,735 | 562,921 | 11 | 10.9 | % | 2.64 | |||||||||||||||||||||||||||||||||||||||||||||||||||||||||||||||||||
| 4.0% | 1,352,730 | 1,384,913 | 1,429,547 | 20 | 23.5 | % | 2.28 | |||||||||||||||||||||||||||||||||||||||||||||||||||||||||||||||||||
| 4.5% | 254,413 | 264,979 | 272,037 | 13 | 29.9 | % | 1.55 | |||||||||||||||||||||||||||||||||||||||||||||||||||||||||||||||||||
| TBA 2.5% | 135,000 | 133,059 | 133,513 | n/a | n/a | 5.10 | ||||||||||||||||||||||||||||||||||||||||||||||||||||||||||||||||||||
| TBA 3.0% | 300,000 | 308,268 | 308,648 | n/a | n/a | 1.90 | ||||||||||||||||||||||||||||||||||||||||||||||||||||||||||||||||||||
| TBA 4.0% | (500,000) | (519,143) | (520,117) | n/a | n/a | 1.28 | ||||||||||||||||||||||||||||||||||||||||||||||||||||||||||||||||||||
| Total 30-year fixed-rate | $ | 2,498,684 | $ | 2,541,638 | $ | 2,610,117 | 17 | 18.9 | % | 2.91 | ||||||||||||||||||||||||||||||||||||||||||||||||||||||||||||||||
(1) Implied cost basis of TBAs represents the forward price to be paid (received) for the underlying Agency MBS.
(2) Fair value of TBAs is the implied market value of the underlying Agency security as of the end of the period.
(3) TBAs are included on the consolidated balance sheet within “derivative assets/liabilities” at their net carrying value which is the difference between their implied market value and implied cost basis. Please refer to Note 4 of the Notes to the Unaudited Consolidated Financial Statements for additional information.
(4) TBAs are excluded from this calculation as they do not have a defined weighted-average loan balance or age until mortgages have been assigned to the pool.
(5) Constant prepayment rate (“CPR”) represents the 3-month CPR of Agency RMBS held as of date indicated. Securities with no prepayment history are excluded from this calculation.
(6) Duration measures the sensitivity of a security's price to the change in interest rates and represents the percent change in price of a security for a 100-basis point increase in interest rates. We calculate duration using third-party financial models and empirical data. Different models and methodologies can produce different estimates of duration for the same securities.
CMBS. The majority of our Agency CMBS are backed by multifamily housing loans. Loans underlying CMBS are generally fixed-rate with scheduled principal payments generally assuming a 30-year amortization period, but typically requiring balloon payments on average approximately 10 years from origination. These loans typically have some form of prepayment protection provisions, such as yield maintenance or defeasance provisions, which provide us compensation if
29
underlying loans prepay prior to us earning our expected return on our investment. Yield maintenance and prepayment penalty requirements are intended to create an economic disincentive for the loans to prepay, which makes the fair value of CMBS less costly to hedge relative to RMBS.
The following table presents information about our CMBS investments (including securities pending settlement) by year of origination as of the dates indicated:
| June 30, 2020 | December 31, 2019 | ||||||||||||||||||||||||||||||||||||||||||||||||||||||||||||||||||||||||||||||||||
| ($ in thousands) | Par Value | Amortized Cost | Months to Estimated Maturity (1) | WAC (2) | Par Value | Amortized Cost | Months to Estimated Maturity (1) | WAC (2) | |||||||||||||||||||||||||||||||||||||||||||||||||||||||||||||||||||||||||||
| Year of Origination: | |||||||||||||||||||||||||||||||||||||||||||||||||||||||||||||||||||||||||||||||||||
| Prior to 2009 | $ | 12,967 | $ | 12,712 | 27 | 5.60 | % | $ | 13,441 | $ | 13,080 | 30 | 5.74 | % | |||||||||||||||||||||||||||||||||||||||||||||||||||||||||||||||||||||
| 2009 to 2012 | 16,200 | 16,957 | 43 | 5.05 | % | 28,141 | 29,153 | 34 | 4.99 | % | |||||||||||||||||||||||||||||||||||||||||||||||||||||||||||||||||||||||||
| 2013 to 2014 | 11,183 | 11,391 | 50 | 3.37 | % | 11,294 | 11,528 | 59 | 3.65 | % | |||||||||||||||||||||||||||||||||||||||||||||||||||||||||||||||||||||||||
| 2015 | 156,489 | 157,966 | 76 | 3.30 | % | 175,219 | 177,023 | 87 | 2.86 | % | |||||||||||||||||||||||||||||||||||||||||||||||||||||||||||||||||||||||||
| 2016 | — | — | — | — | % | 19,910 | 19,742 | 109 | 2.62 | % | |||||||||||||||||||||||||||||||||||||||||||||||||||||||||||||||||||||||||
| 2017 | 50,781 | 51,219 | 94 | 3.08 | % | 340,638 | 342,158 | 101 | 3.07 | % | |||||||||||||||||||||||||||||||||||||||||||||||||||||||||||||||||||||||||
| 2018 | — | — | — | — | % | 330,180 | 329,984 | 127 | 3.68 | % | |||||||||||||||||||||||||||||||||||||||||||||||||||||||||||||||||||||||||
| 2019 | 29,502 | 29,897 | 149 | 3.05 | % | 972,646 | 983,435 | 134 | 3.27 | % | |||||||||||||||||||||||||||||||||||||||||||||||||||||||||||||||||||||||||
| 2020 | 379,951 | 382,850 | 127 | 1.80 | % | — | — | — | — | % | |||||||||||||||||||||||||||||||||||||||||||||||||||||||||||||||||||||||||
| $ | 657,073 | $ | 662,992 | 108 | 2.50 | % | $ | 1,891,469 | $ | 1,906,103 | 120 | 3.30 | % | ||||||||||||||||||||||||||||||||||||||||||||||||||||||||||||||||||||||
(1) Months to estimated maturity is an average weighted by the amortized cost of the investment.
(2) The weighted average coupon (“WAC”) is the gross interest rate of the security weighted by the outstanding principal balance.
CMBS IO. We invest in both Agency-issued and non-Agency issued CMBS IO which are interest-only securities issued as part of a CMBS securitization and represent the right to receive a portion of the monthly interest payments (but not principal cash flows) on the unpaid principal balance of the underlying pool of commercial mortgage loans, commonly referred to as the notional amount. The weighted average interest rate for our CMBS IO was 0.64% as of June 30, 2020 and 0.65% as of December 31, 2019. The loans collateralizing Agency-issued CMBS IO pools are similar in composition to the
30
pools of loans that collateralize CMBS as discussed above. Non-Agency issued CMBS IO are backed by loans secured by a number of different property types which are shown in the table below as of June 30, 2020:
| June 30, 2020 | ||||||||||||||||||||
| ($ in thousands) | Fair Value | Percentage of Portfolio | ||||||||||||||||||
| Property Type: | ||||||||||||||||||||
| Retail | $ | 45,815 | 27.8 | % | ||||||||||||||||
| Office | 34,987 | 21.2 | % | |||||||||||||||||
| Multifamily | 30,106 | 18.3 | % | |||||||||||||||||
| Hotel | 21,766 | 13.2 | % | |||||||||||||||||
| Mixed use | 10,715 | 6.5 | % | |||||||||||||||||
Other (1) | 21,371 | 13.0 | % | |||||||||||||||||
| Total non-Agency CMBS IO | $ | 164,760 | 100.0 | % | ||||||||||||||||
(1) Other property types collateralizing non-Agency CMBS IO do not comprise more than 5% individually.
Yields on CMBS IO securities are dependent upon the performance of the underlying loans. Similar to CMBS described above, the Company receives prepayment compensation as most loans in these securities have some form of prepayment protection from early repayment. Our return on these investments may be negatively impacted, however, by involuntary prepayments including defaults, foreclosures, or liquidations resulting in amounts being partially or wholly repaid prior to its contractual maturity date because of loss mitigation actions taken by the underlying loan servicer. Since the economic impacts of COVID-19 began in March, servicers are reporting an increase in delinquencies on loans underlying our non-Agency CMBS IO. The increase in delinquencies has been primarily in the retail and hotel sectors.
In order to manage our exposure to credit performance, we have generally invested in senior tranches of these securities where we have evaluated the credit profile of the underlying loan pool and can monitor credit performance. As of June 30, 2020 and December 31, 2019, approximately 62% of our CMBS IO are Agency-issued securities which generally contain higher credit quality loans that are expected to have a lower risk of default than non-Agency CMBS IO. In addition, becausethe majority of our non-Agency CMBS IO investments are investment grade-rated with the majority rated ‘AAA’ by at least one of the nationally recognized statistical rating organizations. All of our non-Agency CMBS IO were originated prior to 2017, the majority of which we believe have had underlying property value appreciation, and the weighted average life of contractual cash flows remaining on our non-Agency CMBS IO is 25 months. Considering these characteristics of our non-Agency CMBS IO and the actions taken by servicers so far to work with borrowers through various relief measures, we have not all companiesseen evidence of and do not currently expect a material adverse effect on our future cash flows for non-Agency CMBS IO. However, the ultimate impact of COVID-19 on the global economy and on the loans underlying any of our securities remains uncertain and cannot be predicted at this time.
31
The following table presents our CMBS IO investments by year of origination as of June 30, 2020:
| Agency | Non-Agency | ||||||||||||||||||||||||||||||||||||||||||||||||||||||||||
| ($ in thousands) | Amortized Cost | Fair Value | Remaining WAL (1) | Amortized Cost | Fair Value | Remaining WAL (1) | |||||||||||||||||||||||||||||||||||||||||||||||||||||
| Year of Origination: | |||||||||||||||||||||||||||||||||||||||||||||||||||||||||||
| 2010-2012 | $ | 19,270 | $ | 19,348 | 10 | $ | 5,379 | $ | 5,525 | 9 | |||||||||||||||||||||||||||||||||||||||||||||||||
| 2013 | 29,382 | 30,414 | 15 | 13,639 | 13,578 | 16 | |||||||||||||||||||||||||||||||||||||||||||||||||||||
| 2014 | 29,462 | 30,148 | 22 | 59,856 | 59,866 | 21 | |||||||||||||||||||||||||||||||||||||||||||||||||||||
| 2015 | 36,778 | 38,265 | 27 | 59,975 | 59,708 | 28 | |||||||||||||||||||||||||||||||||||||||||||||||||||||
| 2016 | 25,564 | 26,200 | 32 | 18,421 | 17,805 | 16 | |||||||||||||||||||||||||||||||||||||||||||||||||||||
| 2017 | 28,537 | 28,931 | 43 | 8,509 | 8,278 | 36 | |||||||||||||||||||||||||||||||||||||||||||||||||||||
| 2018 | 3,968 | 3,986 | 63 | — | — | — | |||||||||||||||||||||||||||||||||||||||||||||||||||||
| 2019 | 93,152 | 91,309 | 61 | — | — | — | |||||||||||||||||||||||||||||||||||||||||||||||||||||
| 2020 | 3,379 | 3,309 | 54 | — | — | — | |||||||||||||||||||||||||||||||||||||||||||||||||||||
| $ | 269,492 | $ | 271,910 | 39 | $ | 165,779 | $ | 164,760 | 25 | ||||||||||||||||||||||||||||||||||||||||||||||||||
(1) Remaining weighted average life (“WAL”) represents an estimate of the number of months of contractual cash flows remaining for the investments by year of origination.
Repurchase Agreements
We use identical calculations,leverage to enhance the Company's presentationreturns on our invested capital by pledging our investments as collateral for borrowings primarily through the use of uncommitted repurchase agreements with major financial institutions and broker-dealers. Repurchase agreements generally have original terms to maturity of overnight to six months, though in some instances we may enter into longer-dated maturities depending on market conditions. We pay interest on our repurchase agreement borrowings at a rate usually based on a spread to a short-term interest rate such as LIBOR and fixed for the term of the borrowing.
Please refer to Note 3 of the Notes to the Unaudited Consolidated Financial Statements contained within this Quarterly Report on Form 10-Q as well as “Results of Operations” and “Liquidity and Capital Resources” contained within this Item 7 for additional information relating to our repurchase agreement borrowings.
Derivative Assets and Liabilities
We use derivative instruments to economically hedge our exposure to adverse changes in interest rates resulting from our ownership of primarily fixed-rate investments financed with short-term repurchase agreements. Changes in interest rates can impact net interest income, the market value of our investments, and book value per common share. We regularly monitor and frequently adjust our hedging portfolio in response to many factors including, but not limited to, changes in our investment portfolio as well as our expectation of future interest rates, including the absolute level of rates and the slope of the yield curve versus market expectations. Please refer to “Quantitative and Qualitative Disclosures about Market Risk” in Part I, Item 3 of this Quarterly Report on Form 10-Q for more information.
32
Prior to the end of the first quarter of 2020, we primarily used interest rate swaps to hedge a portion of our earnings and book value exposure to fluctuations in interest rates. Because we sold a substantial portion of our Agency RMBS when interest rates rallied, we terminated the majority of our interest rate swaps. We partially replaced these terminated hedges by increasing our options on U.S. Treasury futures and adding short positions in U.S. Treasury futures. Although we were substantially re-invested into Agency RMBS by the end of the second quarter, we have not entered into additional interest rate swaps to hedge interest earnings given our expectations of low stable funding rates on repurchase agreement borrowings in the near term. Our focus is on the impact of changing interest rates on our book value and management believes U.S. Treasury futures and options are more effective as hedges as they have better liquidity and more favorable margin requirements than interest rate swaps. Please refer to Note 4 of the Notes to the Unaudited Consolidated Financial Statements for details on our interest rate derivative instruments as of June 30, 2020 and December 31, 2019.
RESULTS OF OPERATIONS
The discussion below includes both GAAP and non-GAAP financial measures maythat management utilizes in its internal analysis of financial and operating performance. Please read the section “Non-GAAP Financial Measures” at the end of “Executive Overview” contained in Item 2 of this Quarterly Report on Form 10-Q for additional important information about these measures.
Net Interest Income for the Three Months Ended June 30, 2020 Compared to the Three Months Ended June 30, 2019
The following table presents certain information about our interest-earning assets and interest-bearing liabilities and their performance for the three months ended June 30, 2020 and June 30, 2019:
| Three Months Ended | |||||||||||||||||||||||||||||||||||||||||||||||||||||||||||||||||
| June 30, | |||||||||||||||||||||||||||||||||||||||||||||||||||||||||||||||||
| 2020 | 2019 | ||||||||||||||||||||||||||||||||||||||||||||||||||||||||||||||||
| ($ in thousands) | Interest Income/Expense | Average Balance (1)(2) | Effective Yield/ Cost of Funds (3)(4) | Interest Income/Expense | Average Balance (1)(2) | Effective Yield/ Cost of Funds (3)(4) | |||||||||||||||||||||||||||||||||||||||||||||||||||||||||||
| Interest-earning assets: | |||||||||||||||||||||||||||||||||||||||||||||||||||||||||||||||||
| Agency RMBS | $ | 9,605 | $ | 1,632,531 | 2.35 | % | $ | 25,456 | $ | 2,949,516 | 3.45 | % | |||||||||||||||||||||||||||||||||||||||||||||||||||||
| Agency CMBS | 4,700 | 720,048 | 2.58 | % | 11,665 | 1,463,427 | 3.15 | % | |||||||||||||||||||||||||||||||||||||||||||||||||||||||||
CMBS IO (5) | 5,313 | 448,572 | 4.05 | % | 4,886 | 492,314 | 3.78 | % | |||||||||||||||||||||||||||||||||||||||||||||||||||||||||
Non-Agency MBS and other investments (6) | 235 | 9,613 | 7.26 | % | 1,741 | 12,088 | 4.82 | % | |||||||||||||||||||||||||||||||||||||||||||||||||||||||||
| Total: | $ | 19,853 | $ | 2,810,764 | 2.70 | % | $ | 43,748 | $ | 4,917,345 | 3.43 | % | |||||||||||||||||||||||||||||||||||||||||||||||||||||
Interest-bearing liabilities: (7) | 4,850 | $ | 2,582,230 | 0.74 | % | $ | 30,813 | $ | 4,566,160 | 2.67 | % | ||||||||||||||||||||||||||||||||||||||||||||||||||||||
| Net interest income/net interest spread | $ | 15,003 | 1.96 | % | $ | 12,935 | 0.76 | % | |||||||||||||||||||||||||||||||||||||||||||||||||||||||||
(1) Average balance for assets is calculated as a simple average of the daily amortized cost and excludes unrealized gains and losses as well as securities pending settlement if applicable.
(2) Average balance for liabilities is calculated as a simple average of the daily borrowings outstanding during the period.
(3) Effective yield is calculated by dividing the sum of gross interest income and scheduled premium amortization/discount accretion (both of which are annualized for any reporting period less than 12 months) and prepayment compensation and premium amortization/discount accretion adjustments (collectively, "prepayment adjustments"), which are not be comparable to other similarly-titled measuresannualized, by the average balance of other companies.asset type outstanding during the reporting period.
33
(5) Includes Agency and non-Agency issued securities.
(6) Interest income for non-Agency and other investments includes $0.6 million of interest income from cash and cash equivalents for the three months ended June 30, 2019. Average balance and yield excludes cash and cash equivalents.
(7) Interest-bearing liabilities consist primarily of repurchase agreement borrowings.
Rate/Volume Analysis. The following table presents the estimated impact on our net interest income due to changes in rate (effective yield/cost of funds) and changes in volume (average balance) of our interest-earning assets and interest-bearing liabilities for the periods indicated:
| Three Months Ended | |||||||||||||||||||||||||||||||||||||||||
| June 30, 2020 Compared to June 30, 2019 | |||||||||||||||||||||||||||||||||||||||||
| Increase (Decrease) Due to Change In | Total Change in Interest Income/Expense | ||||||||||||||||||||||||||||||||||||||||
| ($ in thousands) | Rate | Volume | Prepayment Adjustments (1) | ||||||||||||||||||||||||||||||||||||||
| Interest-earning assets: | |||||||||||||||||||||||||||||||||||||||||
| Agency RMBS | $ | (4,483) | $ | (11,368) | $ | — | $ | (15,851) | |||||||||||||||||||||||||||||||||
| Agency CMBS | (1,054) | (5,928) | 17 | (6,965) | |||||||||||||||||||||||||||||||||||||
CMBS IO (2) | 111 | (404) | 720 | 427 | |||||||||||||||||||||||||||||||||||||
| Non-Agency MBS and other investments | (21) | (632) | (853) | (1,506) | |||||||||||||||||||||||||||||||||||||
| Change in interest income | $ | (5,447) | $ | (18,332) | $ | (116) | $ | (23,895) | |||||||||||||||||||||||||||||||||
| Change in interest expense | (12,580) | (13,383) | — | (25,963) | |||||||||||||||||||||||||||||||||||||
| Total net change in net interest income | $ | 7,133 | $ | (4,949) | $ | (116) | $ | 2,068 | |||||||||||||||||||||||||||||||||
(1) Prepayment adjustments represent effective interest amortization adjustments related to changes in actual prepayment speeds and prepayment compensation, net of amortization adjustments for CMBS and CMBS IO and are not annualized in the calculation of effective yield.
(2) Includes Agency and non-Agency issued securities.
Net interest income increased for the three months ended June 30, 2020 compared to the three months ended June 30, 2019 because the decline in interest expense exceeded the decline in interest income. The decline in interest income is due primarily to a smaller average balance of lower yielding investments for the second quarter of 2020 compared to the same period in the prior year. The decline in interest expense was due to a smaller average balance of borrowings at a lower financing rate for the second quarter of 2020 compared to the same period in 2019. Management expects net interest income to increase in the third quarter of 2020 compared to the second quarter of 2020 as the average balance of our investment portfolio on which we earn interest income is expected to increase and we anticipate financing costs to remain low.
Net Interest Income for the Six Months Ended June 30, 2020 Compared to the Six Months Ended June 30, 2019
The following table presents certain information about our interest-earning assets and interest-bearing liabilities and their performance for the six months ended June 30, 2020 and June 30, 2019:
34
| Six Months Ended | |||||||||||||||||||||||||||||||||||||||||||||||||||||||||||||||||
| June 30, | |||||||||||||||||||||||||||||||||||||||||||||||||||||||||||||||||
| 2020 | 2019 | ||||||||||||||||||||||||||||||||||||||||||||||||||||||||||||||||
| ($ in thousands) | Interest Income/Expense | Average Balance (1)(2) | Effective Yield/ Cost of Funds (3)(4) | Interest Income/Expense | Average Balance (1)(2) | Effective Yield/ Cost of Funds (3)(4) | |||||||||||||||||||||||||||||||||||||||||||||||||||||||||||
| Interest-earning assets: | |||||||||||||||||||||||||||||||||||||||||||||||||||||||||||||||||
| Agency RMBS | $ | 28,895 | $ | 2,073,379 | 2.79 | % | $ | 49,090 | $ | 2,794,017 | 3.52 | % | |||||||||||||||||||||||||||||||||||||||||||||||||||||
| Agency CMBS | 19,922 | 1,309,637 | 3.00 | % | 20,797 | 1,332,700 | 3.10 | % | |||||||||||||||||||||||||||||||||||||||||||||||||||||||||
CMBS IO (5) | 9,968 | 461,988 | 4.03 | % | 11,282 | 505,020 | 4.10 | % | |||||||||||||||||||||||||||||||||||||||||||||||||||||||||
Non-Agency MBS and other investments (6) | 891 | 9,944 | 7.83 | % | 2,537 | 12,571 | 15.63 | % | |||||||||||||||||||||||||||||||||||||||||||||||||||||||||
| Total: | $ | 59,676 | $ | 3,854,948 | 3.02 | % | $ | 83,706 | $ | 4,644,308 | 3.49 | % | |||||||||||||||||||||||||||||||||||||||||||||||||||||
Interest-bearing liabilities: (7) | $ | 26,952 | $ | 3,642,871 | 1.46 | % | $ | 57,089 | $ | 4,252,190 | 2.67 | % | |||||||||||||||||||||||||||||||||||||||||||||||||||||
| Net interest income/net interest spread | $ | 32,724 | 1.56 | % | $ | 26,617 | 0.82 | % | |||||||||||||||||||||||||||||||||||||||||||||||||||||||||
(1) Average balance for assets is calculated as a simple average of the daily amortized cost and excludes unrealized gains and losses as well as securities pending settlement if applicable.
(2) Average balance for liabilities is calculated as a simple average of the daily borrowings outstanding during the period.
(3) Effective yield is calculated by dividing the sum of gross interest income and scheduled premium amortization/discount accretion (both of which are annualized for any reporting period less than 12 months) and prepayment compensation and premium amortization/discount accretion adjustments (collectively, "prepayment adjustments"), which are not annualized, by the average balance of asset type outstanding during the reporting period.
(4) Cost of funds is calculated by dividing annualized interest expense by the total average balance of borrowings outstanding during the period with an assumption of 360 days in a year.
(5) Includes Agency and non-Agency issued securities.
(6) Interest income for non-Agency and other investments includes $0.5 million and $1.1 million interest income from cash and cash equivalents for the six months ended June 30, 2020 and June 30, 2019, respectively. Average balance and yields excludes cash and cash equivalents.
(7) Interest-bearing liabilities consist primarily of repurchase agreement borrowings.
Rate/Volume Analysis. The following table presents the estimated impact on our net interest income due to changes in rate (effective yield/cost of funds) and changes in volume (average balance) of our interest-earning assets and interest-bearing liabilities for the periods indicated:
35
| Six Months Ended | |||||||||||||||||||||||||||||||||||||||||
| June 30, 2020 Compared to June 30, 2019 | |||||||||||||||||||||||||||||||||||||||||
| Increase (Decrease) Due to Change In | Total Change in Interest Income/Expense | ||||||||||||||||||||||||||||||||||||||||
| ($ in thousands) | Rate | Volume | Prepayment Adjustments (1) | ||||||||||||||||||||||||||||||||||||||
| Interest-earning assets: | |||||||||||||||||||||||||||||||||||||||||
| Agency RMBS | $ | (7,580) | $ | (12,698) | $ | 83 | $ | (20,195) | |||||||||||||||||||||||||||||||||
| Agency CMBS | (694) | (362) | 181 | (875) | |||||||||||||||||||||||||||||||||||||
CMBS IO (2) | (794) | 23 | (543) | (1,314) | |||||||||||||||||||||||||||||||||||||
| Non-Agency MBS and other investments | (716) | (92) | (838) | (1,646) | |||||||||||||||||||||||||||||||||||||
| Change in interest income | $ | (9,784) | $ | (13,129) | $ | (1,117) | $ | (24,030) | |||||||||||||||||||||||||||||||||
| Change in interest expense | (21,962) | (8,161) | (14) | (30,137) | |||||||||||||||||||||||||||||||||||||
| Total net change in net interest income | $ | 12,178 | $ | (4,968) | $ | (1,103) | $ | 6,107 | |||||||||||||||||||||||||||||||||
(1) Prepayment adjustments represent effective interest amortization adjustments related to changes in actual prepayment speeds and prepayment compensation, net of amortization adjustments for CMBS and CMBS IO and are not annualized in the calculation of effective yield.
(2) Includes Agency and non-Agency issued securities.
Net interest income increased for the six months ended June 30, 2020 compared to the six months ended June 30, 2019 because the decline in interest expense exceeded the decline in interest income. The decline in interest income is due primarily to a smaller average balance of lower yielding investments and lower income from prepayment compensation for the second quarter of 2020 compared to the same period in the prior year. The decline in interest expense was due to a smaller average balance of borrowings at a lower financing rate for the second quarter of 2020 compared to the same period in 2019.
Adjusted Net Interest Income for the Three and Six Months Ended June 30, 2020 Compared to the Three and Six Months Ended June 30, 2019
Management includes drop income from TBA dollar roll positions and net periodic interest benefit of interest rate swaps in a non-GAAP financial measure “adjusted net interest income” when evaluating the economic performance of its investments and financings. Please refer to “Non-GAAP Financial Measures” at the end of “Executive Overview” of this Item 2 of this Quarterly Report on Form 10-Q for additional information.
36
| Three Months Ended | |||||||||||||||||||||||||||||||||||||||||
| June 30, | |||||||||||||||||||||||||||||||||||||||||
| 2020 | 2019 | ||||||||||||||||||||||||||||||||||||||||
| ($ in thousands) | Amount | Rate | Amount | Rate | |||||||||||||||||||||||||||||||||||||
| Net interest income | $ | 15,003 | 1.96 | % | $ | 12,935 | 0.76 | % | |||||||||||||||||||||||||||||||||
Add: TBA drop income (1) (2) | 1,796 | 0.02 | % | 1,282 | (0.04) | % | |||||||||||||||||||||||||||||||||||
Add: net periodic interest (cost) benefit (3) | (107) | (0.02) | % | 3,553 | 0.31 | % | |||||||||||||||||||||||||||||||||||
| Adjusted net interest income | $ | 16,692 | 1.96 | % | $ | 17,770 | 1.03 | % | |||||||||||||||||||||||||||||||||
| Six Months Ended | |||||||||||||||||||||||||||||||||||||||||
| June 30, | |||||||||||||||||||||||||||||||||||||||||
| 2020 | 2019 | ||||||||||||||||||||||||||||||||||||||||
| Amount | Rate | Amount | Rate | ||||||||||||||||||||||||||||||||||||||
| Net interest income | $ | 32,724 | 1.56 | % | $ | 26,617 | 0.82 | % | |||||||||||||||||||||||||||||||||
Add: TBA drop income (1) (2) | 2,535 | — | % | 3,245 | (0.03) | % | |||||||||||||||||||||||||||||||||||
Add: net periodic interest benefit (3) | 1,957 | 0.10 | % | 7,450 | 0.35 | % | |||||||||||||||||||||||||||||||||||
De-designated cash flow hedge accretion (4) | — | — | % | (165) | (0.01) | % | |||||||||||||||||||||||||||||||||||
| Adjusted net interest income | $ | 37,216 | 1.66 | % | $ | 37,147 | 1.13 | % | |||||||||||||||||||||||||||||||||
(1) TBA drop income is calculated by multiplying the notional amount of the TBA dollar roll positions by the difference in price between two TBA securities with the same terms but different settlement dates.
(2) The impact of TBA drop income on adjusted net interest spread includes the implied average funding cost of TBA dollar roll transactions during the periods indicated.
(3) Amount represents net periodic interest cost/benefit of effective interest rate swaps outstanding during the period and excludes realized and unrealized gains and losses from changes in fair value of derivatives.
(4) Amount recorded as a portion of "interest expense" in accordance with GAAP related to the accretion of the balance remaining in accumulated other comprehensive loss as a result of the Company's discontinuation of cash flow hedge accounting effective June 30, 2013.
Management expects adjusted net interest income to increase in the third quarter of 2020 as we expect an increase in the average balance of our investment portfolio on which we earn interest income and, as mentioned previously, we expect financing costs to remain low for the near term.
Gain (Loss) on Sale of Investments, Net
We sell our investments in the ordinary course of business as we manage our risk, capital and liquidity profiles, and as we reallocate capital to various investments. When interest rates rallied early to mid-March of 2020 as the markets initially responded to the COVID-19 pandemic, we chose to realize gains on our Agency RMBS as asset prices began to fall and we de-levered our balance sheet. We used a portion of those proceeds to re-invest in Agency CMBS, but retained the majority of the proceeds to increase our liquidity. During the three months ended June 30, 2020, we sold the majority of our Agency CMBS in order to realize gains as asset premiums increased and to shift our portfolio allocation back to predominantly Agency RMBS. As of the end of June 2020, we had substantially re-invested proceeds received from these sales. None of our investment sales during the six months ended June 30, 2020 or June 30, 2019 were made under duress. The following tables provide information related to our realized gains (losses) on sales of investments for the periods indicated (1):
37
| Three Months Ended | |||||||||||||||||||||||||||||||||||||||||
| June 30, | |||||||||||||||||||||||||||||||||||||||||
| 2020 | 2019 | ||||||||||||||||||||||||||||||||||||||||
| ($ in thousands) | Amortized cost basis sold | Gain (loss) on sale of investments, net | Amortized cost basis sold | Gain (loss) on sale of investments, net | |||||||||||||||||||||||||||||||||||||
| Agency RMBS | $ | 359,377 | $ | 11,729 | $ | 209,446 | $ | (3,953) | |||||||||||||||||||||||||||||||||
| Agency CMBS | 1,838,858 | 181,370 | 219,691 | (6,493) | |||||||||||||||||||||||||||||||||||||
| Agency CMBS IO | — | — | 13,775 | 86 | |||||||||||||||||||||||||||||||||||||
| $ | 2,198,235 | $ | 193,099 | $ | 442,912 | $ | (10,360) | ||||||||||||||||||||||||||||||||||
| Six Months Ended | |||||||||||||||||||||||||||||||||||||||||
| June 30, | |||||||||||||||||||||||||||||||||||||||||
| 2020 | 2019 | ||||||||||||||||||||||||||||||||||||||||
| ($ in thousands) | Amortized cost basis sold | Gain (loss) on sale of investments, net | Amortized cost basis sold | Gain (loss) on sale of investments, net | |||||||||||||||||||||||||||||||||||||
| Agency RMBS | $ | 2,112,633 | $ | 75,823 | $ | 209,446 | $ | (3,953) | |||||||||||||||||||||||||||||||||
| Agency CMBS | 1,991,853 | 202,059 | 219,691 | (6,493) | |||||||||||||||||||||||||||||||||||||
| Agency CMBS IO | — | — | 13,775 | 86 | |||||||||||||||||||||||||||||||||||||
| $ | 4,104,486 | $ | 277,882 | $ | 442,912 | $ | (10,360) | ||||||||||||||||||||||||||||||||||
(1) Information regarding unrealized gains (losses) on investments during the periods indicated are included under "Results
of Operations-Other Comprehensive Income (Loss)" within this Item 2.
Loss on Derivative Instruments, Net
Changes in the fair value of derivative instruments and net periodic interest benefits/costs are impacted by changing market interest rates and adjustments that we may make to our hedging positions in any given period. Because of the changes made to our derivatives portfolio from one reporting period to the next, results of any given reporting period are generally not comparable to results of another.
38
The following table provides information on our financial instruments accounted for as derivative instruments for the periods indicated:
| Three Months Ended | Six Months Ended | ||||||||||||||||||||||||||||||||||
| June 30, | June 30, | ||||||||||||||||||||||||||||||||||
| ($ in thousands) | 2020 | 2019 | 2020 | 2019 | |||||||||||||||||||||||||||||||
| Interest rate derivatives: | |||||||||||||||||||||||||||||||||||
| Interest rate swaps: | |||||||||||||||||||||||||||||||||||
| Net periodic interest (cost) benefit | $ | (107) | $ | 3,553 | $ | 1,957 | $ | 7,450 | |||||||||||||||||||||||||||
Change in fair value (1) | (1,565) | (127,766) | (185,809) | (203,428) | |||||||||||||||||||||||||||||||
| Total interest rate swap loss, net | (1,672) | (124,213) | (183,852) | (195,978) | |||||||||||||||||||||||||||||||
| Interest rate swaptions: | |||||||||||||||||||||||||||||||||||
Change in fair value (1) | — | — | (573) | — | |||||||||||||||||||||||||||||||
| Futures: | |||||||||||||||||||||||||||||||||||
Change in fair value (1) | (10,928) | (102) | (19,377) | (211) | |||||||||||||||||||||||||||||||
| Total interest rate derivative loss, net | (12,600) | (124,315) | (203,802) | (196,189) | |||||||||||||||||||||||||||||||
| TBA dollar roll positions: | |||||||||||||||||||||||||||||||||||
Change in fair value (2) | 8,921 | 5,498 | 14,543 | 13,711 | |||||||||||||||||||||||||||||||
TBA drop income (3) | 1,796 | 1,282 | 2,535 | 3,245 | |||||||||||||||||||||||||||||||
| Total TBA dollar roll gain, net | 10,717 | 6,780 | 17,078 | 16,956 | |||||||||||||||||||||||||||||||
| Options on U.S. Treasury futures | |||||||||||||||||||||||||||||||||||
Change in fair value (1) | (6,680) | — | (17,406) | — | |||||||||||||||||||||||||||||||
| Total loss on derivative instruments, net | $ | (8,563) | $ | (117,535) | $ | (204,130) | $ | (179,233) | |||||||||||||||||||||||||||
(1) Changes in fair value for interest rate derivatives and options include unrealized gains (losses) from current and forward starting derivative instruments and realized gains (losses) from terminated derivative instruments.
(2) Changes in fair value for TBA dollar roll positions include unrealized gains (losses) from open TBA contracts and realized gains (losses) on paired off or terminated positions.
(3) TBA drop income represents a portion of the change in fair value and is calculated by multiplying the notional amount of the net TBA dollar roll positions by the difference in price between two TBA securities with the same terms but different settlement dates.
We typically use interest rate swaps to hedge the impact of changing interest rates on our repurchase agreement borrowings and the fair value of our Agency RMBS. Because we had substantial sales of Agency RMBS in early March and interest rates rallied, we chose to terminate the majority of our interest rate swaps before the end of the first quarter as noted previously. In addition, we continue to expect more stable repurchase agreement financing rates relative to the recent past, further reducing our need to use interest rate swaps as economic hedges of interest rate risk on our net interest earnings for the near term. As a result of these terminations, our net periodic interest benefit from interest rate swaps for the three and six months ended June 30, 2020 decreased to a net cost of $(0.1) million and net benefit of $2.0 million, respectively, compared to net benefits of $3.6 million and $7.5 million for the three and six months ended June 30, 2019, respectively. This decline was also partially due to a decrease of 30 and 9 basis points in our average net receive rate for the three and six months ended June 30, 2020 compared to the same periods in 2019. The table below shows our interest rate swap hedge position as a percentage of our average repurchase agreement borrowings and long TBAs outstanding and details about our net receive rates for the periods indicated:
39
| Three Months Ended | Six Months Ended | ||||||||||||||||||||||||||||||||||
| June 30, | June 30, | ||||||||||||||||||||||||||||||||||
| ($ in thousands) | 2020 | 2019 | 2020 | 2019 | |||||||||||||||||||||||||||||||
| Average repurchase agreement borrowings outstanding | $ | 2,580,296 | $ | 4,562,992 | $ | 3,640,653 | $ | 4,248,909 | |||||||||||||||||||||||||||
Average TBA long positions outstanding - at cost (1) | 424,453 | 579,353 | 403,082 | 650,414 | |||||||||||||||||||||||||||||||
| Average borrowings and TBA long positions outstanding | 3,004,749 | 5,142,345 | 4,043,735 | 4,899,323 | |||||||||||||||||||||||||||||||
| Average notional amount of interest rate swaps outstanding | 350,824 | 4,765,220 | 1,614,613 | 4,461,685 | |||||||||||||||||||||||||||||||
Ratio of average interest rate swaps to average borrowings and TBA long positions outstanding (1) | 0.1 | 0.9 | 0.4 | 0.9 | |||||||||||||||||||||||||||||||
| Average interest rate swap pay-fixed rate | (0.93) | % | (2.33) | % | (1.48) | % | (2.35) | % | |||||||||||||||||||||||||||
| Average interest rate swap receive-floating rate | 0.80 | % | 2.60 | % | 1.71 | % | 2.67 | % | |||||||||||||||||||||||||||
| Average interest rate swap net (pay) receive rate | (0.13) | % | 0.27 | % | 0.23 | % | 0.32 | % | |||||||||||||||||||||||||||
(1) We include TBA long positions in this ratio because we use interest rate swaps to hedge a portion of the impact of changing interest rates on the fair value and implied financing cost of our TBA long positions and our repurchase agreement financing costs. This ratio calculation does not include TBA net short positions which the Company may also use to hedge the impact of changing interest rates on its specified pools of Agency RMBS and TBA long positions.
Changes in fair value of our derivative instruments consist of unrealized gains (losses) on instruments held as of the end of the period and realized gains (losses) from instruments terminated or paired off during the period. The following tables provide information regarding realized gains (losses) on derivative instruments for the periods indicated:
| Three Months Ended | |||||||||||||||||||||||||||||||||||||||||
| June 30, | |||||||||||||||||||||||||||||||||||||||||
| 2020 | 2019 | ||||||||||||||||||||||||||||||||||||||||
| ($ in thousands) | Realized Gain (Loss) | Notional | Realized Gain (Loss) | Notional | |||||||||||||||||||||||||||||||||||||
| Interest rate swaps | $ | — | $ | — | $ | (132,738) | $ | 2,935,000 | |||||||||||||||||||||||||||||||||
| U.S. Treasury futures-short positions | (15,158) | 477,500 | — | — | |||||||||||||||||||||||||||||||||||||
| Options on U.S. Treasury futures | (10,812) | 1,700,000 | — | — | |||||||||||||||||||||||||||||||||||||
| TBA long positions | 3,930 | 2,156,000 | 12,461 | 2,455,000 | |||||||||||||||||||||||||||||||||||||
| TBA short positions | (3,173) | 2,702,000 | — | — | |||||||||||||||||||||||||||||||||||||
| Total | $ | (25,213) | $ | 7,035,500 | $ | (120,277) | $ | 5,390,000 | |||||||||||||||||||||||||||||||||
| Six Months Ended | |||||||||||||||||||||||||||||||||||||||||
| June 30, | |||||||||||||||||||||||||||||||||||||||||
| 2020 | 2019 | ||||||||||||||||||||||||||||||||||||||||
| Realized Gain (Loss) | Notional | Realized Gain (Loss) | Notional | ||||||||||||||||||||||||||||||||||||||
| Interest rate swaps | $ | (183,773) | $ | 6,065,000 | $ | (139,532) | $ | 3,810,000 | |||||||||||||||||||||||||||||||||
| Interest rate swaptions | (1,934) | 750,000 | — | — | |||||||||||||||||||||||||||||||||||||
| U.S. Treasury futures-net short positions | (15,168) | 475,000 | (1,327) | 50,000 | |||||||||||||||||||||||||||||||||||||
| Options on U.S. Treasury futures | (13,234) | 3,350,000 | — | — | |||||||||||||||||||||||||||||||||||||
| TBA long positions | 23,196 | 4,496,000 | 22,958 | 5,320,000 | |||||||||||||||||||||||||||||||||||||
| TBA short positions | (11,016) | 3,517,000 | — | — | |||||||||||||||||||||||||||||||||||||
| Total | $ | (201,929) | $ | 18,653,000 | $ | (117,901) | $ | 9,180,000 | |||||||||||||||||||||||||||||||||
40
Please refer to “Liquidity and Capital Resources” for information regarding recognition of deferred tax hedge losses for terminated derivative instruments.
General and Administrative Expenses
General and administrative expenses increased $0.5 million and $1.2 million for the three and six months ended June 30, 2020 compared to the three and six months ended June 30, 2019 due primarily to an increase in the accrual for incentive compensation related to changes to the executive compensation plan and an increase in the expected achievement of goals on which the bonuses are based.
LIQUIDITY AND CAPITAL RESOURCES
Our primary sources of liquidity include borrowings under repurchase arrangements and monthly principal and interest payments we receive on our investments. Additional sources may also include proceeds from the sale of investments, equity offerings, and payments received from counterparties from interest rate swap agreements and other derivative instruments. We use our liquidity to purchase investments and to pay our operating expenses and dividends on our common and preferred stock. We also use our liquidity to meet margin requirements for our repurchase agreements and derivative transactions, including TBA contracts, under the terms of the related agreements. We may also use liquidity to repurchase shares of our common stock periodically.
Our liquidity fluctuates based on our investment activities, our financing and capital raising activities, and changes in the fair value of our investments and derivative instruments. We seek to maintain sufficient liquidity to support our operations and to meet our anticipated liquidity demands, including potential margin calls (or “haircuts” as described in our 2019 Form 10-K). Our most liquid assets include unrestricted cash and cash equivalents and unencumbered Agency RMBS, CMBS, and CMBS IO which were $242.1 million as of June 30, 2020 compared to $224.0 million as of December 31, 2019.
We perform sensitivity analysis on our liquidity based on changes in the fair value of our investments due to, among other things, changes in the absolute level of interest rates and the shape of the yield curve, credit spreads, lender haircuts, and prepayment speeds as well as changes in the fair value of our derivative instruments due to changes in the absolute level of interest rates and the shape of the yield curve. In performing this analysis, we will also consider the current state of the fixed income markets and the repurchase agreement markets in order to determine if market forces such as supply-demand imbalances or structural changes to these markets could change the liquidity of MBS or the availability of financing. The objective of our analysis is to assess the adequacy of our liquidity to withstand potential adverse events, such as the current pandemic. We may change our leverage targets based on market conditions and our perceptions of the liquidity of our investments.
As we noted in our Quarterly Report on Form 10-Q for the three months ended March 31, 2020, prices on our investments declined during the latter half of the first quarter as a result of the market’s initial response to the COVID-19 pandemic. Though we experienced margin calls from our lenders, we were able to fund all margin calls and increased collateral requirements on a timely basis and entered the second quarter in a strong position of liquidity. As noted in “Executive Overview” of this Quarterly Report on Form 10-Q, price volatility declined during the second quarter of 2020 and asset prices improved as a result of the Federal Reserve’s announcement of purchase programs. As such, we have substantially re-invested our capital and ended the second quarter with leverage of 8.1 times shareholders’ equity.
Our weighted average haircut for borrowings collateralized with CMBS IO increased to 16.1% as of June 30, 2020 compared to 12.8% as of December 31, 2019 as certain repurchase agreement counterparties have increased their related GAAPrequired haircut for CMBS IO between 5% and 10% since the onset of the pandemic. Our weighted average haircut for borrowings collateralized with Agency CMBS or RMBS remained relatively unchanged at 4.8% as of June 30, 2020.
Our repurchase agreement borrowings are principally uncommitted with terms renewable at the discretion of our lenders and have short-term maturities. As such, we attempt to maintain unused capacity under our existing repurchase agreement credit lines with multiple counterparties, which helps protect us in the event of a counterparty's failure to renew existing repurchase agreements. We were able to renew repurchase agreement borrowings during the six months ended
41
June 30, 2020 without exception. In addition, and as part of our continuous evaluation of counterparty risk, we reduced our exposure to favor broker dealer subsidiaries of regulated financial measuresinstitutions whom we believe are provided within "Results of Operations". better capitalized entities.
The following table presents a reconciliationinformation regarding the balances of our repurchase agreement borrowings for the periods indicated:
| Repurchase Agreements | |||||||||||||||||||||||||||||
| ($ in thousands) | Balance Outstanding As of Quarter End | Average Balance Outstanding For the Quarter Ended | Maximum Balance Outstanding During the Quarter Ended | ||||||||||||||||||||||||||
| June 30, 2020 | $ | 3,314,991 | $ | 2,580,296 | $ | 4,408,106 | |||||||||||||||||||||||
| March 31, 2020 | 4,408,106 | 4,701,010 | 4,917,731 | ||||||||||||||||||||||||||
| December 31, 2019 | 4,752,348 | 4,806,826 | 4,891,341 | ||||||||||||||||||||||||||
| September 30, 2019 | 4,872,869 | 4,955,825 | 5,191,378 | ||||||||||||||||||||||||||
| June 30, 2019 | 4,815,452 | 4,562,992 | 4,815,452 | ||||||||||||||||||||||||||
| March 31, 2019 | 4,252,893 | 3,931,335 | 4,266,684 | ||||||||||||||||||||||||||
The counterparties with whom we have the greatest amounts of equity at risk may vary significantly during any given period due to the short-term and generally uncommitted nature of the repurchase agreement borrowings. Equity at risk represents the potential loss to the Company if the counterparty is unable or unwilling to return collateral securing the repurchase agreement borrowing at its maturity. As of June 30, 2020, the Company had repurchase agreement amounts outstanding with 19 of its 37 available repurchase agreement counterparties. Please refer to Note 3 of the Notes to the Unaudited Consolidated Financial Statements for information regarding counterparties with whom we have the greatest amount of equity at risk as of June 30, 2020.
We have various financial and operating covenants in certain of our repurchase agreements including, among other things, requirements that we maintain minimum shareholders' equity (usually a set minimum, or a percentage of the highest amount of shareholders' equity since the date of the agreement), limits on maximum decline in shareholders' equity (expressed as a percentage decline in any given period), limits on maximum leverage (as a multiple of shareholders' equity), and requirements to maintain our status as a REIT and to maintain our listing on the New York Stock Exchange. Violations of one or more of these covenants could result in the lender declaring an event of default which would result in the termination of the repurchase agreement and immediate acceleration of amounts due thereunder. In addition, some of the agreements contain cross default features, whereby default with one lender simultaneously causes default under agreements with other lenders. Violations could also restrict us from paying dividends or engaging in other transactions that are necessary for us to maintain our REIT status.
We monitor and evaluate on an ongoing basis the impact these customary financial covenants may have on our operating and financing flexibility. Currently, we do not believe we are subject to any covenants that materially restrict our financing flexibility. Although the recent market disruption caused by the global response to the COVID-19 pandemic has resulted in the industry issues described above, we were in full compliance with our debt covenants as of June 30, 2020, and we are not aware of any circumstances which could potentially result in our non-compliance in the foreseeable future.
Derivative Instruments
We are party to certain types of financial instruments that are accounted for as derivative instruments including interest rate swaps, futures, options, and long and short positions in TBA securities. Certain of these derivative instruments may require us to post initial margin at inception and daily variation margin based on subsequent changes in their fair value. In the case of interest rate swaps, our clearing counterparty has the right to require higher initial margin in volatile market conditions. The collateral posted as margin by us is typically in the form of cash or Agency MBS. Counterparties may have to post variation margin to us. Generally, as interest rates decline, we will be required to post collateral with counterparties on
42
our interest rate derivatives and vice versa as interest rates increase. As of June 30, 2020, we had cash of $59.2 million posted as collateral under these agreements.
Our TBA contracts are subject to master securities forward transaction agreements published by the Securities Industry and Financial Markets Association as well as supplemental terms and conditions with each counterparty. Under the terms of these agreements, we may be required to pledge collateral to, or have the right to receive collateral from, our counterparties when initiated or in the event the fair value of our TBA contracts declines. Declines in the fair value of TBA contracts are generally related to such factors as rising interest rates, increases in expected prepayment speeds, or widening spreads. Our TBA contracts generally provide that valuations for our TBA contracts and any pledged collateral are to be obtained from a generally recognized source agreed to by both parties. However, in certain circumstances, our counterparties have the sole discretion to determine the value of the TBA contract and any pledged collateral. In such instances, our counterparties are required to act in good faith in making determinations of value. In the event of a margin call, we must generally provide additional collateral on the same business day.
Dividends
As a REIT, we are required to distribute to our shareholders amounts equal to at least 90% of our REIT taxable income for each taxable year after consideration of our tax NOL carryforwards, the majority of which expire by the end of this year. We generally fund our dividend distributions through our cash flows from operations. If we make dividend distributions in excess of our operating cash flows during the period, whether for purposes of meeting our REIT distribution requirements or other strategic reasons, those distributions are generally funded either through our existing cash balances or through the return of principal from our investments (either through repayment or sale). Please refer to Item 1A, “Risk Factors” of our Quarterly Report on Form 10-Q for the three months ended March 31, 2020 as well as the following sections of our 2019 Form 10-K for additional important information regarding dividends declared on our taxable income:
•"Federal Income Tax Considerations" within Part I, Item 1, "Business”
•Part II, Item 5, "Market For Registrant's Common Equity, Related Stockholder Matters, and Issuer
Purchases of Equity Securities"
There may be differences between taxable income and GAAP net income (loss)due to common shareholderstiming differences in the recognition of certain revenues and expenses including, for example, losses we realize from terminating derivatives prior to their maturity, which occurs as part of our portfolio and hedge management activities. Deferred tax hedge losses on terminated derivative instruments are recognized over the original periods designated by those terminated derivatives. If any of our deferred tax hedge losses result in dividend distributions to our core net operatingshareholders in excess of REIT taxable income, the excess dividends distributed will be considered a return of capital to common shareholders for the periods presented:shareholder. The following table provides the tax hedge losses as of the dates indicated that have already been recognized in our GAAP earnings but which will reduce taxable income over the next twelve years:
| Tax Year of Recognition of Hedge Losses | June 30, 2020 | December 31, 2019 | ||||||||||||
| ($ in thousands) | ||||||||||||||
| 2020 | $ | 65,346 | $ | 37,954 | ||||||||||
| 2021 | 52,364 | 28,370 | ||||||||||||
| 2022 and thereafter | 259,017 | 127,347 | ||||||||||||
| $ | 376,727 | $ | 193,671 | |||||||||||
43
| Three Months Ended | |||||||
| ($ in thousands, except per share amounts) | September 30, 2017 | June 30, 2017 | |||||
| GAAP net income (loss) to common shareholders | $ | 7,503 | $ | (10,073 | ) | ||
| Less: | |||||||
Accretion of de-designated cash flow hedges (1) | (48 | ) | (73 | ) | |||
Change in fair value of derivative instruments, net (2) | (3,222 | ) | 15,801 | ||||
| Loss on sale of investments, net | 5,211 | 3,709 | |||||
| Fair value adjustments, net | (23 | ) | (30 | ) | |||
| Core net operating income to common shareholders | $ | 9,421 | $ | 9,334 | |||
| Weighted average common shares outstanding | 49,832 | 49,218 | |||||
| Core net operating income per common share | $ | 0.19 | $ | 0.19 | |||
Contractual Obligations and Other Matters
There have been no material changes in our contractual obligations since December 31, 2019. As of June 30, 2020, we do not believe that any off-balance sheet arrangements exist that are reasonably likely to have a material effect on our current or future financial condition, results of operations, or liquidity other than as discussed above. In addition, we do not have any material commitments for capital expenditures and have not obtained any commitments for funds to fulfill any capital obligations.
RECENT ACCOUNTING PRONOUNCEMENTS
There were no accounting pronouncements issued during the six months ended June 30, 2020 that are expected to have a material impact on the Company’s financial condition or results of operations. Please refer to Note 1 of the Notes to the Unaudited Consolidated Financial Statements contained within Item 1 of this Quarterly Report on Form 10-Q for additional information.
CRITICAL ACCOUNTING POLICIES
The discussion and analysis of our financial condition and results of operations are based in large part upon our consolidated financial statements, which have been prepared in accordance with GAAP. The preparation of our consolidated financial statements requires management to make estimates, judgments and assumptions that affect the reported amounts of assets, liabilities, revenues and expenses and disclosure of contingent assets and liabilities. We base these estimates and judgments on historical experience and assumptions believed to be reasonable under current facts and circumstances. Actual results, however, may differ from the estimated amounts we have recorded.
Critical accounting policies are defined as those that require management's most difficult, subjective or complex judgments, and which may result in materially different results under different assumptions and conditions. Our accounting policies that require the most significant management estimates, judgments, or assumptions, or that management believes includes the most significant uncertainties, and are considered most critical to our results of operations or financial position relate to fair value measurements, amortization of investment premiums, and other-than-temporary impairments. Our critical accounting policies are discussed in Part II, Item 7, “Management’s Discussion and Analysis of Financial Condition and Results of
Operations” of our Annual Report on2019 Form 10-K for the year ended December 31, 2016 under “Critical Accounting Policies”.Policies.” There have been no significant changes in our critical accounting policies during the three and six months ended SeptemberJune 30, 2017.2020.
| Agency CMBS | Agency RMBS | CMBS IO (2) | Non-Agency Other (3) | Total | |||||||||||||||||||
| ($ in thousands) | 30-Year Fixed (1) | Adjustable-Rate | |||||||||||||||||||||
| Balance as of December 31, 2016 | $ | 1,144,555 | $ | — | $ | 1,201,205 | $ | 754,546 | $ | 111,778 | $ | 3,212,084 | |||||||||||
| Purchases | 234,094 | 544,050 | — | 71,803 | — | 849,947 | |||||||||||||||||
| Principal payments | (45,217 | ) | (1,549 | ) | (172,650 | ) | — | (20,263 | ) | (239,679 | ) | ||||||||||||
| Sales | (37,215 | ) | (1,111 | ) | (727,841 | ) | — | (50,871 | ) | (817,038 | ) | ||||||||||||
| (Amortization) accretion | (3,587 | ) | (128 | ) | (8,568 | ) | (112,580 | ) | 2,279 | (122,584 | ) | ||||||||||||
| Change in fair value | 14,859 | (1,903 | ) | 11,636 | 16,698 | (2,576 | ) | 38,714 | |||||||||||||||
| Balance as of September 30, 2017 | $ | 1,307,489 | $ | 539,359 | $ | 303,782 | $ | 730,467 | $ | 40,347 | $ | 2,921,444 | |||||||||||
| September 30, 2017 | December 31, 2016 | |||||||||||||||
| Amortized Cost | Fair Value | Amortized Cost | Fair Value | |||||||||||||
| RMBS: | ||||||||||||||||
| Agency RMBS, 30 year fixed-rate | $ | 541,262 | $ | 539,359 | $ | — | $ | — | ||||||||
TBA securities, 30 year fixed-rate (1) | 683,813 | 683,680 | — | — | ||||||||||||
| Agency RMBS - adjustable rate | 305,265 | 303,782 | 1,214,324 | 1,201,205 | ||||||||||||
| Non-Agency RMBS | 1,113 | 1,142 | 33,548 | 33,562 | ||||||||||||
| 1,531,453 | 1,527,963 | 1,247,872 | 1,234,767 | |||||||||||||
| CMBS and CMBS IO: | ||||||||||||||||
| Fixed-rate Agency CMBS | $ | 1,314,925 | $ | 1,307,489 | $ | 1,166,454 | $ | 1,144,555 | ||||||||
| Non-Agency CMBS | 36,328 | 39,205 | 72,749 | 78,216 | ||||||||||||
| Agency CMBS IO | 394,380 | 401,808 | 411,737 | 411,898 | ||||||||||||
| Non-Agency CMBS IO | 322,735 | 328,659 | 346,155 | 342,648 | ||||||||||||
| 2,068,368 | 2,077,161 | 1,997,095 | 1,977,317 | |||||||||||||
| Total MBS portfolio including TBA securities | $ | 3,599,821 | $ | 3,605,124 | $ | 3,244,967 | $ | 3,212,084 | ||||||||
| September 30, 2017 | December 31, 2016 | |||||||||||||||||||
| ($ in thousands) | Par Value | Amortized Cost | Months to Estimated Maturity (1) | Par Value | Amortized Cost | Months to Estimated Maturity (1) | ||||||||||||||
| Year of Origination: | ||||||||||||||||||||
| 2008 and prior | $ | 41,058 | $ | 37,869 | 38 | $ | 57,771 | $ | 53,161 | 34 | ||||||||||
| 2009 to 2012 | 135,326 | 138,475 | 26 | 193,061 | 198,916 | 33 | ||||||||||||||
| 2013 to 2014 | 20,324 | 20,701 | 85 | 42,760 | 43,176 | 95 | ||||||||||||||
| 2015 | 661,113 | 664,321 | 102 | 683,680 | 687,214 | 111 | ||||||||||||||
| 2016 | 254,375 | 256,161 | 113 | 254,781 | 256,736 | 122 | ||||||||||||||
| 2017 | 230,821 | 233,728 | 119 | — | — | — | ||||||||||||||
| $ | 1,343,017 | $ | 1,351,255 | 97 | $ | 1,232,053 | $ | 1,239,203 | 97 | |||||||||||
| September 30, 2017 | December 31, 2016 | ||||||||||||||||||||
| ($ in thousands) | Amortized Cost | Fair Value | Remaining WAL (1) | Amortized Cost | Fair Value | Remaining WAL (1) | |||||||||||||||
| Year of Origination: | |||||||||||||||||||||
| 2010 | $ | 7,157 | $ | 7,364 | 15 | $ | 9,456 | $ | 9,858 | 19 | |||||||||||
| 2011 | 27,848 | 29,353 | 20 | 35,130 | 36,897 | 23 | |||||||||||||||
| 2012 | 77,728 | 79,667 | 23 | 102,378 | 103,675 | 27 | |||||||||||||||
| 2013 | 109,705 | 111,451 | 29 | 128,891 | 129,011 | 33 | |||||||||||||||
| 2014 | 179,440 | 182,447 | 36 | 201,802 | 200,260 | 39 | |||||||||||||||
| 2015 | 177,176 | 180,448 | 41 | 198,016 | 194,886 | 45 | |||||||||||||||
| 2016 | 84,943 | 86,048 | 48 | 82,219 | 79,959 | 87 | |||||||||||||||
| 2017 | 53,118 | 53,689 | 54 | — | — | — | |||||||||||||||
| $ | 717,115 | $ | 730,467 | 37 | $ | 757,892 | $ | 754,546 | 42 | ||||||||||||
| September 30, 2017 | |||||||||||||||||||||||||
| Weighted Average Based on Par | |||||||||||||||||||||||||
| Coupon | Par | Fair Value (1)(3) | Amortized Cost/Cost Basis (2)(3) | Loan Balance (4) | Loan Age (in months) (4) | 3 Month CPR (4)(5) | Duration (6) | ||||||||||||||||||
| ($ in thousands) | |||||||||||||||||||||||||
| 30-year fixed-rate: | |||||||||||||||||||||||||
| 3.0% | $ | 248,773 | $ | 249,981 | $ | 250,632 | $ | 233,336 | 10 | 2.5 | % | 6.34 | |||||||||||||
| 4.0% | 273,326 | 289,378 | 290,630 | 240,621 | 2 | — | % | 4.38 | |||||||||||||||||
| TBA 4.0% | 650,000 | 683,680 | 683,813 | n/a | n/a | n/a | 3.32 | ||||||||||||||||||
| Total 30-year fixed-rate | $ | 1,172,099 | $ | 1,223,039 | $ | 1,225,075 | $ | 237,150 | 6 | 1.2 | % | 4.21 | |||||||||||||
| Adjustable-rate: | |||||||||||||||||||||||||
3.1% (7) | $ | 294,254 | $ | 303,782 | $ | 305,265 | $ | 270,208 | 72 | 17.1 | % | 2.21 | |||||||||||||
| Total Agency RMBS (including TBA securities) | $ | 1,466,353 | $ | 1,526,821 | $ | 1,530,340 | $ | 249,066 | 30 | 6.9 | % | 3.81 | |||||||||||||
| September 30, 2017 | December 31, 2016 | ||||||||||||||||||||||
| ($ in thousands) | Par Value | Amortized Cost | Fair Value | Par Value | Amortized Cost | Fair Value | |||||||||||||||||
| Adjustable-rate Agency RMBS by MTR: | |||||||||||||||||||||||
| 0-12 MTR | $ | 47,126 | $ | 48,440 | $ | 49,580 | $ | 335,476 | $ | 355,069 | $ | 353,887 | |||||||||||
| 13-36 MTR | 2,875 | 3,057 | 3,030 | 225,272 | 237,642 | 235,137 | |||||||||||||||||
| 37-60 MTR | 157,359 | 164,286 | 162,810 | 151,578 | 160,948 | 157,945 | |||||||||||||||||
| Greater than 60 MTR | 86,894 | 89,482 | 88,362 | 444,932 | 460,665 | 454,236 | |||||||||||||||||
| Total adjustable-rate Agency RMBS | $ | 294,254 | $ | 305,265 | $ | 303,782 | $ | 1,157,258 | $ | 1,214,324 | $ | 1,201,205 | |||||||||||
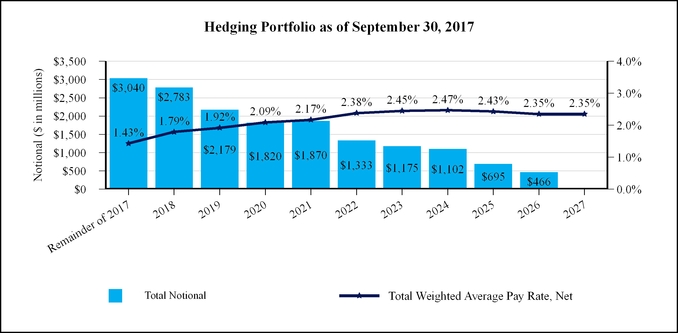

| Nine Months Ended | |||
| ($ in thousands) | September 30, 2017 | ||
Balance as of December 31, 2016 (1) | $ | 21,612 | |
| Net receipt on termination | (3,126 | ) | |
| Periodic net cash payments | (3,364 | ) | |
Settlement of variation margin (2) | 3,300 | ||
| Change in fair value | (14,955 | ) | |
| Accrued interest payable | (3,099 | ) | |
Balance as of September 30, 2017 (1) | $ | 368 | |
| September 30, 2017 | December 31, 2016 | ||||||||||||||||||||||
| ($ in thousands) | Fair Value | Amount Pledged | Related Borrowings | Fair Value | Amount Pledged | Related Borrowings | |||||||||||||||||
| Non-Agency CMBS: | |||||||||||||||||||||||
| AAA | $ | — | $ | — | $ | — | $ | 35,405 | $ | 35,313 | $ | 32,266 | |||||||||||
| AA | 14,013 | — | — | 14,127 | 14,105 | 11,665 | |||||||||||||||||
| A | 18,366 | 18,365 | 15,625 | 18,614 | 18,549 | 15,831 | |||||||||||||||||
| Below A/Not Rated | 6,826 | — | — | 10,070 | 9,873 | 7,119 | |||||||||||||||||
| $ | 39,205 | $ | 18,365 | $ | 15,625 | $ | 78,216 | $ | 77,840 | $ | 66,881 | ||||||||||||
| Non-Agency CMBS IO: | |||||||||||||||||||||||
| AAA | $ | 273,308 | $ | 273,302 | $ | 232,717 | $ | 290,092 | $ | 289,608 | $ | 246,412 | |||||||||||
| AA | 44,474 | 43,797 | 37,694 | 46,986 | 45,995 | 40,026 | |||||||||||||||||
| A | 753 | 753 | 663 | — | — | — | |||||||||||||||||
| Below A/Not Rated | 10,124 | 10,124 | 8,907 | 5,570 | 5,536 | 4,761 | |||||||||||||||||
| $ | 328,659 | $ | 327,976 | $ | 279,981 | $ | 342,648 | $ | 341,139 | $ | 291,199 | ||||||||||||
| Non-Agency RMBS: | |||||||||||||||||||||||
| Below A/Not Rated | $ | 1,142 | $ | — | $ | — | $ | 33,562 | $ | 31,952 | $ | 26,149 | |||||||||||
| $ | 1,142 | $ | — | $ | — | $ | 33,562 | $ | 31,952 | $ | 26,149 | ||||||||||||
| ($ in thousands) | September 30, 2017 | December 31, 2016 | |||||
| Agency CMBS | $ | (7,436 | ) | $ | (22,295 | ) | |
| Non-Agency CMBS | 2,877 | 5,467 | |||||
| Agency CMBS IO | 7,428 | 161 | |||||
| Non-Agency CMBS IO | 5,924 | (3,507 | ) | ||||
| Agency RMBS | (3,386 | ) | (13,119 | ) | |||
| Non-Agency RMBS | 29 | 14 | |||||
| De-designated cash flow hedges | 450 | 670 | |||||
| Accumulated other comprehensive income (loss) | $ | 5,886 | $ | (32,609 | ) | ||
| Three Months Ended | |||||||||||||
| September 30, | |||||||||||||
| 2017 | 2016 | ||||||||||||
| ($ in thousands) | Amount | Yield | Amount | Yield | |||||||||
| CMBS: | |||||||||||||
| Coupon and scheduled amortization | $ | 9,976 | 2.90 | % | $ | 7,903 | 3.19 | % | |||||
Prepayment adjustments (1) | 176 | 0.01 | % | (154 | ) | (0.02 | )% | ||||||
| $ | 10,152 | 2.91 | % | $ | 7,749 | 3.17 | % | ||||||
Average balance (2) | $ | 1,352,681 | $ | 974,240 | |||||||||
| CMBS IO: | |||||||||||||
| Coupon and scheduled amortization | $ | 6,841 | 3.73 | % | $ | 6,895 | 3.81 | % | |||||
Prepayment adjustments (1) | 1,209 | 0.16 | % | 546 | 0.07 | % | |||||||
| $ | 8,050 | 3.89 | % | $ | 7,441 | 3.88 | % | ||||||
Average balance (2) | $ | 734,282 | $ | 724,859 | |||||||||
| RMBS: | |||||||||||||
| Coupon and scheduled amortization | $ | 4,693 | 2.19 | % | $ | 6,689 | 1.92 | % | |||||
Prepayment adjustments (1) | (124 | ) | (0.01 | )% | (982 | ) | (0.07 | )% | |||||
| $ | 4,569 | 2.18 | % | $ | 5,707 | 1.85 | % | ||||||
Average balance (2) | $ | 856,705 | $ | 1,390,401 | |||||||||
| Total MBS interest income and effective yield: | $ | 22,771 | 2.94 | % | $ | 20,897 | 2.75 | % | |||||
Total average balance (2): | $ | 2,943,668 | $ | 3,089,500 | |||||||||
| Nine Months Ended | |||||||||||||
| September 30, | |||||||||||||
| 2017 | 2016 | ||||||||||||
| Amount | Yield | Amount | Yield | ||||||||||
| CMBS: | |||||||||||||
| Coupon and scheduled amortization | $ | 28,991 | 2.93 | % | $ | 24,241 | 3.23 | % | |||||
Prepayment adjustments (1) | 2,255 | 0.17 | % | 1,016 | 0.10 | % | |||||||
| $ | 31,246 | 3.10 | % | $ | 25,257 | 3.33 | % | ||||||
Average balance (2) | $ | 1,308,811 | $ | 990,440 | |||||||||
| CMBS IO: | |||||||||||||
| Coupon and scheduled amortization | $ | 21,059 | 3.75 | % | $ | 21,279 | 3.79 | % | |||||
Prepayment adjustments (1) | 3,619 | 0.48 | % | 1,363 | 0.18 | % | |||||||
| $ | 24,678 | 4.23 | % | $ | 22,642 | 3.97 | % | ||||||
Average balance (2) | $ | 749,343 | $ | 748,097 | |||||||||
| RMBS: | |||||||||||||
| Coupon and scheduled amortization | $ | 15,341 | 2.02 | % | $ | 21,525 | 1.91 | % | |||||
Prepayment adjustments (1) | (1,753 | ) | (0.17 | )% | (1,104 | ) | (0.07 | )% | |||||
| $ | 13,588 | 1.84 | % | $ | 20,421 | 1.84 | % | ||||||
Average balance (2) | $ | 1,014,283 | $ | 1,499,309 | |||||||||
| Total MBS interest income and effective yield: | $ | 69,512 | 2.96 | % | $ | 68,320 | 2.79 | % | |||||
Total average balance (2): | $ | 3,072,437 | $ | 3,237,846 | |||||||||
| Three Months Ended | |||||||||||||||
| September 30, 2017 vs. September 30, 2016 | |||||||||||||||
| Increase (Decrease) in Interest Income | Due to Change In | ||||||||||||||
| ($ in thousands) | Average Balance | Coupon and Scheduled Amortization | Prepayment Adjustments (1) | ||||||||||||
| CMBS | $ | 2,402 | $ | 2,013 | $ | 59 | $ | 330 | |||||||
| CMBS IO | 609 | 134 | (188 | ) | 663 | ||||||||||
| RMBS | (1,137 | ) | (2,069 | ) | 74 | 858 | |||||||||
| Total | $ | 1,874 | $ | 78 | $ | (55 | ) | $ | 1,851 | ||||||
| Nine Months Ended | |||||||||||||||
| September 30, 2017 vs. September 30, 2016 | |||||||||||||||
| Increase (Decrease) in Interest Income | Due to Change In | ||||||||||||||
| ($ in thousands) | Average Balance | Coupon and Scheduled Amortization | Prepayment Adjustments (1) | ||||||||||||
| CMBS | $ | 5,989 | $ | 4,800 | $ | (50 | ) | $ | 1,239 | ||||||
| CMBS IO | 2,036 | 57 | (277 | ) | 2,256 | ||||||||||
| RMBS | (6,833 | ) | (6,488 | ) | 304 | (649 | ) | ||||||||
| Total | $ | 1,192 | $ | (1,631 | ) | $ | (23 | ) | $ | 2,846 | |||||
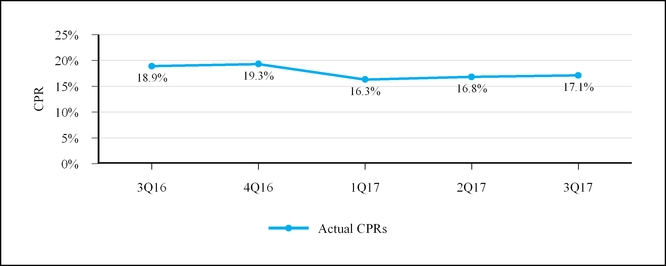
| Three Months Ended | Nine Months Ended | ||||||||||||||
| September 30, | September 30, | ||||||||||||||
| ($ in thousands) | 2017 | 2016 | 2017 | 2016 | |||||||||||
| Interest expense on repurchase agreement borrowings | $ | 9,910 | $ | 5,800 | $ | 26,269 | $ | 17,440 | |||||||
| Interest expense on FHLB advances | — | 343 | — | 1,118 | |||||||||||
Accretion of de-designated cash flow hedges (1) | (48 | ) | (99 | ) | (220 | ) | (152 | ) | |||||||
| Non-recourse collateralized financing | 27 | 24 | 73 | 72 | |||||||||||
| Total interest expense | $ | 9,889 | $ | 6,068 | $ | 26,122 | $ | 18,478 | |||||||
| Average balance of repurchase agreements | $ | 2,616,250 | $ | 2,536,562 | $ | 2,736,834 | $ | 2,623,225 | |||||||
| Average balance of FHLB advances | — | 263,000 | — | 308,022 | |||||||||||
| Average balance of non-recourse collateralized financing | 5,817 | 7,386 | 6,058 | 7,892 | |||||||||||
| Average balance of borrowings | $ | 2,622,067 | $ | 2,806,948 | $ | 2,742,892 | $ | 2,939,139 | |||||||
Cost of funds (2) | 1.48 | % | 0.85 | % | 1.26 | % | 0.83 | % | |||||||
| ($ in thousands) | Three Months Ended September 30, 2017 vs. September 30, 2016 | Nine Months Ended September 30, 2017 vs. September 30, 2016 | |||||
| Change in borrowing rates on repurchase agreements and FHLB advances | $ | 4,169 | $ | 8,927 | |||
| Change in average balance of repurchase agreements and FHLB advances | (402 | ) | (1,216 | ) | |||
| Decrease (increase) in accretion of de-designated cash flow hedges | 51 | (68 | ) | ||||
| Decrease in non-recourse collateralized financing and other interest expense | 3 | 1 | |||||
| Total change in interest expense | $ | 3,821 | $ | 7,644 | |||
| Three Months Ended | Nine Months Ended | ||||||||||||||
| September 30, | September 30, | ||||||||||||||
| ($ in thousands) | 2017 | 2016 | 2017 | 2016 | |||||||||||
| Interest expense | $ | 9,889 | $ | 6,068 | $ | 26,122 | $ | 18,478 | |||||||
Add: net periodic interest costs of derivative instruments (1) | 1,131 | 155 | 3,099 | 2,321 | |||||||||||
Less: de-designated hedge accretion (2) | 48 | 99 | 220 | 152 | |||||||||||
| Adjusted interest expense | $ | 11,068 | $ | 6,322 | $ | 29,441 | $ | 20,951 | |||||||
| Three Months Ended | |||||||||||||
| September 30, | |||||||||||||
| 2017 | 2016 | ||||||||||||
| ($ in thousands) | Amount | Yield | Amount | Yield | |||||||||
| Interest income | $ | 23,103 | 2.95 | % | $ | 21,135 | 2.75 | % | |||||
| Interest expense | 9,889 | 1.48 | % | 6,068 | 0.85 | % | |||||||
| Net interest income/spread | 13,214 | 1.47 | % | 15,067 | 1.90 | % | |||||||
Average interest earning assets (1) | $ | 2,960,595 | $ | 3,110,884 | |||||||||
Average balance of borrowings (2) | $ | 2,622,067 | $ | 2,806,948 | |||||||||
| Nine Months Ended | |||||||||||||
| September 30, | |||||||||||||
| 2017 | 2016 | ||||||||||||
| ($ in thousands) | Amount | Yield | Amount | Yield | |||||||||
| Interest income | $ | 70,378 | 2.97 | % | $ | 69,040 | 2.80 | % | |||||
| Interest expense | 26,122 | 1.26 | % | 18,478 | 0.83 | % | |||||||
| Net interest income/spread | $ | 44,256 | 1.71 | % | $ | 50,562 | 1.97 | % | |||||
Average interest earning assets (1) | $ | 3,090,313 | $ | 3,260,510 | |||||||||
Average balance of borrowings (2) | $ | 2,742,892 | $ | 2,939,139 | |||||||||
| Three Months Ended | Nine Months Ended | ||||||||||||||
| September 30, | September 30, | ||||||||||||||
| ($ in thousands) | 2017 | 2016 | 2017 | 2016 | |||||||||||
| Net interest income | $ | 13,214 | $ | 15,067 | $ | 44,256 | $ | 50,562 | |||||||
| Add: drop income | 3,902 | — | 5,253 | — | |||||||||||
Add: net periodic interest costs (1) | (1,131 | ) | (155 | ) | (3,099 | ) | (2,321 | ) | |||||||
Less: de-designated hedge accretion (2) | (48 | ) | (99 | ) | (220 | ) | (152 | ) | |||||||
| Adjusted net interest income | $ | 15,937 | $ | 14,813 | $ | 46,190 | $ | 48,089 | |||||||
| Three Months Ended | ||||||||||||||||||||||||
| September 30, | ||||||||||||||||||||||||
| ($ in thousands) | 2017 | 2016 | ||||||||||||||||||||||
| Type of Derivative Instrument | Net Periodic Interest Costs | Change in Fair Value (1)(2) | Total | Net Periodic Interest Costs | Change in Fair Value (1) | Total | ||||||||||||||||||
| Interest rate swaps | $ | (1,131 | ) | $ | 421 | $ | (710 | ) | $ | (155 | ) | $ | (266 | ) | $ | (421 | ) | |||||||
| TBA securities | — | 6,703 | 6,703 | — | — | — | ||||||||||||||||||
| Eurodollar futures | — | — | — | — | 2,830 | 2,830 | ||||||||||||||||||
| Loss on derivative instruments, net | $ | (1,131 | ) | $ | 7,124 | $ | 5,993 | $ | (155 | ) | $ | 2,564 | $ | 2,409 | ||||||||||
| Nine Months Ended | ||||||||||||||||||||||||
| September 30, | ||||||||||||||||||||||||
| 2017 | 2016 | |||||||||||||||||||||||
| Type of Derivative Instrument | Net Periodic Interest Costs | Change in Fair Value (1)(2) | Total | Net Periodic Interest Costs | Change in Fair Value (1) | Total | ||||||||||||||||||
| Interest rate swaps | $ | (3,099 | ) | $ | (14,954 | ) | $ | (18,053 | ) | $ | (2,321 | ) | $ | (46,290 | ) | $ | (48,611 | ) | ||||||
| TBA securities | — | 8,419 | 8,419 | — | — | — | ||||||||||||||||||
| Eurodollar futures | — | — | — | — | (13,542 | ) | (13,542 | ) | ||||||||||||||||
| Loss on derivative instruments, net | $ | (3,099 | ) | $ | (6,535 | ) | $ | (9,634 | ) | $ | (2,321 | ) | $ | (59,832 | ) | $ | (62,153 | ) | ||||||
| Three Months Ended | Nine Months Ended | ||||||||||||||
| September 30, | September 30, | ||||||||||||||
| ($ in thousands) | 2017 | 2016 | 2017 | 2016 | |||||||||||
| Average notional balance | $ | 2,668,478 | $ | 305,000 | $ | 2,011,355 | $ | 549,617 | |||||||
| Weighted average net pay-fixed rate | 1.37 | % | 0.64 | % | 1.30 | % | 1.06 | % | |||||||
| Three Months Ended | Nine Months Ended | |||||||||||||||
| September 30, 2017 | September 30, 2017 | |||||||||||||||
| ($ in thousands) | Average Cost Basis | Drop Income (1) | Average Cost Basis | Drop Income (1) | ||||||||||||
| TBA securities: | ||||||||||||||||
| 3.0% 30-year | $ | 119,528 | $ | 563 | $ | 69,539 | $ | 960 | ||||||||
| 4.0% 30-year | 677,956 | 3,339 | 287,298 | 4,293 | ||||||||||||
| Total TBA securities | $ | 797,484 | $ | 3,902 | $ | 356,837 | $ | 5,253 | ||||||||
| Three Months Ended | |||||||||||||||
| September 30, | |||||||||||||||
| 2017 | 2016 | ||||||||||||||
| ($ in thousands) | Amortized cost basis sold | Gain (loss) on sale of investments, net | Amortized cost basis sold | Gain (loss) on sale of investments, net | |||||||||||
| Agency RMBS | $ | 398,662 | $ | (5,160 | ) | $ | — | $ | — | ||||||
| Agency CMBS | 13,484 | (51 | ) | — | — | ||||||||||
| $ | 412,146 | $ | (5,211 | ) | $ | — | $ | — | |||||||
| Nine Months Ended | |||||||||||||||
| September 30, | |||||||||||||||
| 2017 | 2016 | ||||||||||||||
| ($ in thousands) | Amortized cost basis sold | Gain (loss) on sale of investments, net | Amortized cost basis sold | Gain (loss) on sale of investments, net | |||||||||||
| Agency RMBS | $ | 728,952 | $ | (12,392 | ) | $ | 57,188 | $ | (3,010 | ) | |||||
| Agency CMBS | 206,470 | 523 | — | — | |||||||||||
| Non-Agency CMBS | 34,506 | 1,199 | 34,868 | (1,228 | ) | ||||||||||
| Non-Agency RMBS | 16,365 | 42 | — | — | |||||||||||
| $ | 986,293 | $ | (10,628 | ) | $ | 92,056 | $ | (4,238 | ) | ||||||
| Three Months Ended | Nine Months Ended | ||||||||||||||
| September 30, | September 30, | ||||||||||||||
| ($ in thousands) | 2017 | 2016 | 2017 | 2016 | |||||||||||
| Agency CMBS | $ | 2,334 | $ | (1,226 | ) | $ | 14,859 | $ | 40,093 | ||||||
| Non-Agency CMBS | (403 | ) | (377 | ) | (2,591 | ) | 2,036 | ||||||||
| Agency CMBS IO | 1,032 | 1,616 | 7,268 | 4,187 | |||||||||||
| Non-Agency CMBS IO | 1,101 | 2,131 | 9,431 | 5,832 | |||||||||||
| Agency RMBS | 2,120 | (1,765 | ) | 9,734 | 12,548 | ||||||||||
| Non-Agency RMBS | 8 | 390 | 14 | 802 | |||||||||||
| Unrealized gain on available-for-sale investments | $ | 6,192 | $ | 769 | $ | 38,715 | $ | 65,498 | |||||||
| Repurchase Agreements | Net TBA Position (1) | ||||||||||||||||||
| ($ in thousands) | Balance Outstanding As of Quarter End | Average Balance Outstanding For the Quarter Ended | Maximum Balance Outstanding During the Quarter Ended | Balance Outstanding As of Quarter End | Average Balance Outstanding For the Quarter Ended | ||||||||||||||
| September 30, 2017 | $ | 2,519,230 | $ | 2,616,250 | $ | 2,801,418 | $ | 683,813 | $ | 745,270 | |||||||||
| June 30, 2017 | 2,540,759 | 2,753,019 | 2,826,005 | 416,312 | 305,720 | ||||||||||||||
| March 31, 2017 | 2,825,945 | 2,843,733 | 2,913,617 | — | — | ||||||||||||||
| December 31, 2016 | 2,898,952 | 2,768,769 | 2,938,745 | — | — | ||||||||||||||
| September 30, 2016 | 2,478,278 | 2,536,562 | 2,599,491 | — | — | ||||||||||||||
| September 30, 2017 | June 30, 2017 | March 31, 2017 | December 31, 2016 | September 30, 2016 | ||||||||||
| Agency CMBS and RMBS | 5.0 | % | 5.0 | % | 5.0 | % | 5.0 | % | 5.1 | % | ||||
| Non-Agency CMBS and RMBS | 15.0 | % | 18.0 | % | 15.8 | % | 16.3 | % | 17.0 | % | ||||
| CMBS IO | 15.0 | % | 15.0 | % | 15.3 | % | 15.4 | % | 15.4 | % | ||||
| September 30, 2017 | |||||||
| ($ in thousands) | Amount Outstanding | Equity at Risk | |||||
| Well Fargo Bank, N.A. and affiliates | $ | 349,965 | $ | 57,992 | |||
| JP Morgan Securities, LLC | 270,883 | 30,803 | |||||
| $ | 620,848 | $ | 88,795 | ||||
| December 31, 2016 | |||||||
| ($ in thousands) | Amount Outstanding | Equity at Risk | |||||
| Well Fargo Bank, N.A. and affiliates | $ | 342,160 | $ | 62,041 | |||
| South Street Financial Corporation | 597,394 | 38,770 | |||||
| JP Morgan Securities, LLC | 212,921 | 35,658 | |||||
| $ | 1,152,475 | $ | 136,469 | ||||
| September 30, 2017 | December 31, 2016 | ||||||||||||||
| ($ in thousands) | Amount Outstanding | Market Value of Collateral Pledged | Amount Outstanding | Market Value of Collateral Pledged | |||||||||||
| North America | $ | 1,685,493 | $ | 1,840,749 | $ | 2,105,337 | $ | 2,309,391 | |||||||
| Asia | 521,832 | 548,717 | 421,991 | 443,098 | |||||||||||
| Europe | 311,905 | 328,537 | 371,624 | 397,351 | |||||||||||
| $ | 2,519,230 | $ | 2,718,003 | $ | 2,898,952 | $ | 3,149,840 | ||||||||
| ($ in thousands) | Tax Hedge Loss Deduction | ||
| 2017 | $ | 21,542 | |
| 2018 | 21,175 | ||
| 2019 | 16,937 | ||
| 2020 - 2026 | 12,383 | ||
| $ | 72,037 | ||
| ($ in thousands) | Payments due by period | |||||||||||||||||||
| Contractual Obligations: | Total | < 1 year | 1-3 years | 3-5 years | > 5 years | |||||||||||||||
Repurchase agreements (1) | $ | 2,557,279 | $ | 2,557,279 | $ | — | $ | — | $ | — | ||||||||||
Non-recourse collateralized financing (2) | 5,786 | 1,669 | 2,199 | 1,207 | 711 | |||||||||||||||
| Operating lease obligations | 544 | 214 | 330 | — | — | |||||||||||||||
| Total | $ | 2,563,609 | $ | 2,559,162 | $ | 2,529 | $ | 1,207 | $ | 711 | ||||||||||
FORWARD-LOOKING STATEMENTS
Certain written statements in this Quarterly Report on Form 10-Q that are not historical facts constitute “forward-looking statements” within the meaning of Section 27A of the 1933 Act and Section 21E of the Exchange Act. Statements in this report addressing expectations, assumptions, beliefs, projections, future plans and strategies, future events, developments that we expect or anticipate will occur in the future, and future operating results, capital management, and dividend policy are forward-looking statements. Forward-looking statements are based upon management’s beliefs, assumptions, and expectations as of the date of this report regarding future events and operating performance, taking into account all information currently available to us, and are applicable only as of the date of this report. Forward-looking statements generally can be identified by use of words such as “believe”, “expect”, “anticipate”, “estimate”, “plan”, “may”, “will”, “intend”, “should”, “could” or similar expressions. We caution readers not to place undue reliance on our forward-looking statements, which are not historical facts and may be based on projections, assumptions, expectations, and anticipated events that do not materialize. Except as required by law, we are not obligated to, and do not intend to, update or revise any forward-looking statement whether as a result of new information, future events, or otherwise.
Forward-looking statements in this Quarterly Report on Form 10-Q may include, but are not limited to:to statements about:
•Our business and investment strategy including our ability to generate acceptable risk-adjusted returns and our target investment allocations;allocations, and our views on the future performance of MBS and other investments;
•Our views on conditions in the investment, credit, and derivatives markets;
44
•Our views on the effect of actual or proposed actions of the U.S. Federal Reserve, and the FOMC, or other central banks with respect to monetary policy (including the targeted Federal Funds Rate), and the potential impact of these actions on interest rates, inflation or unemployment;
•The effect of regulatory initiatives of the Federal Reserve (including the FOMC), other financial regulators, and other financial regulators;central banks;
•Our financing strategy including our target leverage ratios, our use of TBA dollar roll transactions, and anticipated trends in financing costs, and our hedging strategy including changes to the derivative instruments to which we are a party, and changes to government regulation of hedging instruments and our use of these instruments;
•Our investment portfolio composition and target investments;
•Our investment portfolio performance, including the fair value, yields, and forecasted prepayment speeds of our investments;
•The impact of COVID-19 on the economy, as well as certain actions taken by federal, state and local governments in response to the pandemic, on delinquencies in loans underlying our investments;
•Our liquidity and ability to access financing, and the anticipated availability and cost of financing;
•Our capital stock repurchase activity andincluding the impact of stock issuances and repurchases;
•The amount, timing, and funding of future dividends;
•Our use of and restrictions on using our tax NOL carryforward;
•The status of pending litigation;
•The competitive environment in the future, including competition for investments and the availability of financing;
•Estimates of future interest expenses, including related to the Company'sCompany’s repurchase agreements and derivative instruments;
•The status and effect of legislative reforms and regulatory rule-making or review processes, and the status of reform efforts and other business developments in the repurchase agreement financing market;
•Market, industry and economic trends, and how these trends and related economic data may impact the behavior of market participants and financial regulators; and
•Market interest rates and market spreads.spreads; and
•Possible future effects of the COVID-19 pandemic.
Forward-looking statements are inherently subject to risks, uncertainties and other factors that could cause our actual results to differ materially from historical results or from any results expressed or implied by such forward-looking statements. Not all of these risks and other factors are known to us. New risks and uncertainties arise over time, and it is not possible to predict those events or how they may affect us. The projections, assumptions, expectations or beliefs upon which the forward-looking statements are based can also change as a result of these risks or other factors. If such a risk or other factor materializes in future periods, our business, financial condition, liquidity and results of operations may vary materially from those expressed or implied in our forward-looking statements.
While it is not possible to identify all factors, some of the factors that may cause actual results to differ from historical results or from any results expressed or implied by forward-looking statements, or that may cause our projections, assumptions, expectations or beliefs to change, some of those factors include the following:
•the risks and uncertainties referenced in this Quarterly Report on Form 10-Q, particularlyespecially those set forth under and incorporated by reference into Part II, Item 1A, “Risk Factors”;, and in particular the potential adverse effects of the ongoing COVID-19 pandemic and any governmental or societal responses thereto,
•our ability to find suitable reinvestment opportunities;
•changes in domestic economic conditions;
•changes in interest rates and interest rate spreads, including the repricing of interest-earning assets and interest-bearing liabilities;
•our investment portfolio performance particularly as it relates to cash flow, prepayment rates and credit performance;
•the impact on markets and asset prices from changes in the Federal Reserve's balance sheet normalization process throughReserve’s policies regarding the reduction in its holdingspurchases of Agency RMBS, Agency CMBS, and U.S. TreasuriesTreasuries;
45
•actual or anticipated changes in Federal Reserve monetary policy;policy or the monetary policy of other central banks;
•adverse reactions in U.S. financial markets related to actions of foreign central banks or the economic performance of foreign economies including in particular China, Japan, the European Union, and the United Kingdom;
•uncertainty concerning the long-term fiscal health and stability of the United States;
•the cost and availability of financing, including the future availability of financing due to changes to regulation of, and capital requirements imposed upon, financial institutions;
•the cost and availability of new equity capital;
•changes in our use of leverage;
•changes to our investment strategy, operating policies, dividend policy or asset allocations;
•the quality of performance of third-party servicer providers of our loans and loans underlying our securities;
•the level of defaults by borrowers on loans we have securitized;
•changes in our industry;
•increased competition;
•changes in government regulations affecting our business;
•changes or volatility in the repurchase agreement financing markets and other credit markets;
•changes to the market for interest rate swaps and other derivative instruments, including changes to margin requirements on derivative instruments;
•uncertainty regarding continued government support of the U.SU.S. financial system and U.S. housing and real estate markets;markets, or to reform the U.S. housing finance system including the resolution of the conservatorship of Fannie Mae and Freddie Mac;
•the composition of the Board of Governors of the Federal Reserve System;
•exposure to current and future claims and litigation.
ITEM 3. QUANTITATIVE AND QUALITATIVE DISCLOSURES ABOUT MARKET RISK
Market risk is the exposure to losses resulting from changes in market factors. Our business strategy exposes us to a variety of market risks, including interest rate, spread, prepayment, reinvestment, credit, and liquidity risks. These risks can and do cause fluctuations in our liquidity, comprehensive income and book value as discussed below.
Interest Rate Risk
Investing in interest-rate sensitive investments such as MBS and TBA securities subjects us to interest rate risk. Interest rate risk results from investing in securities that have a fixed coupon or when the coupon may not immediately adjust for changes in interest rates. Interest rate risk also results from the mismatch between the duration of our assets versus the duration of our liabilities and hedges. With respect to MBS, mismatch in duration is usually the result of interest-rate reset or maturity dates and differing cash flow profiles of our assets versus our liabilities. Borrowing costs on our liabilities are generally based on prevailing short-term market rates and reset more frequently than interest rates on our assets. Changes in interest rates and changes in the forward curve also impact the market value of our investment portfolio and our derivative instruments (including TBA securities and interest rate swaps).
We attempt to manage our exposure to changes in interest rates that results from the duration mismatch between our assets and liabilities by entering into interest rate swaps to hedge this risk. We managehedging instruments. These instruments help offset the impact of changing interest rate risk within tolerances set by our Board of Directors. Our portfolio duration changes basedrates on the compositionmarket value of our investment portfolioassets and our hedge positions as well as market factors. We calculate our portfolio duration based on model projected cash flows, and such calculated duration can be an imprecise measure of actual interest rate risk. In the case of Agency RMBS and TBA securities, the primary input to the calculated duration is the anticipated prepayment speed of the underlying mortgage loans, which is sensitive to futurefinancing costs. Changes in interest rates and borrowers' behavior. Estimates of prepayment speeds can vary significantly by investor for the same security and therefore estimates of security and portfolio duration can vary significantly.
We manage interest rate risk within tolerances set by our adjustable-rate Agency RMBS resetBoard of Directors. Our hedging techniques are highly complex and are partly based on one-year LIBOR and have limitsassumed levels of prepayments of our assets. If prepayments are slower or caps onfaster than assumed, the initial, aggregate, or periodic amount that an interest rate may reset while our liabilities do not have interest rate reset caps. As of September 30, 2017, we had a positive net duration gap in our investment portfolio, which means our liabilities mature or reset sooner thanmaturity our investments and we had not fully hedged this difference. Therefore, increases in interest rates, particularly rapid increases, will negatively impactalso differ from our expectations, which could reduce the market valueeffectiveness of our investments, thereby reducinghedging strategies and may cause losses on such transactions and adversely affect our book value. In addition tocash flow. Estimates of prepayment speeds can vary significantly by investor for the information set forth in the tables below, see "Spread Risk" below for further discussionsame security, and therefore estimates of the risks to the market value of our investments. For further discussion of the reset features of our hybrid ARMs, please refer to "Financial Condition-RMBS" within Part I, Item 2 of this Quarterly Report on Form 10-Q.security and portfolio duration can vary significantly.
46
Changes in types of our investments, the returns earned on these investments, future interest rates, credit spreads, the shape of the yield curve, the availability of financing, and/or the mix of our investments and financings including derivative instruments may cause actual results to differ significantly from the modeled results.results shown in the tables below. There can be no assurance that assumed events used forto model the modelresults shown below will occur, or that other events will not occur, that will affect the outcomes; therefore, the modeled results shown in the tables below and all related disclosures constitute forward-looking statements.
| September 30, 2017 | December 31, 2016 | |||||||||||
| Percentage Change in | Percentage Change in | |||||||||||
| Parallel Shift in Interest Rates | Market Value of Investments (1) | Shareholders' Equity | Net Interest Income and Net Periodic Interest Costs (2) | Market Value of Investments (1) | Shareholders' Equity | Net Interest Income and Net Periodic Interest Costs (2) | ||||||
| +100 | (1.3)% | (9.1)% | 10.3% | (0.6)% | (4.4)% | (42.4)% | ||||||
| +50 | (0.5)% | (3.7)% | 5.6% | (0.3)% | (1.9)% | (20.7)% | ||||||
| -50 | 0.3% | 2.1% | (7.2)% | 0.2% | 1.2% | 18.7% | ||||||
| Projected Change in Net Interest Income and Net Periodic Interest Benefit/Cost Due To | |||||||||||||||||||||||||||||||||||||||||
| Decrease in Interest Rates of | Increase in Interest Rates of | ||||||||||||||||||||||||||||||||||||||||
| 50 Basis Points | 25 Basis Points | 25 Basis Points | 50 Basis Points | ||||||||||||||||||||||||||||||||||||||
| June 30, 2020 | (1) | 1.7 | % | (7.2) | % | (15.3) | % | ||||||||||||||||||||||||||||||||||
| December 31, 2019 | 2.3 | % | 1.3 | % | (2.2) | % | (4.8) | % | |||||||||||||||||||||||||||||||||
(1) Model used for projected results cannot assume financing rates less than 0%.
The projected impactsensitivity to changes in interest rates on our net interest related earnings in an increasingincome and net periodic interest rate environment changedbenefit/cost from a projected decline as of December 31, 2016 to a projected increase as of September 30, 2017 because we made adjustments to our hedging portfolio during the nine months ended September 30, 2017. When the yield curve flattened during the second quarter of 2017, we entered into approximately $1.0 billion of interest rate swaps shown in order to "lock-in"the table above as of June 30, 2020 has increased since December 31, 2019 because we terminated the majority of our financing costs over the near term in an attempt to avoid potential volatility in our net interest earnings. We also entered into additional interest rate swaps late in the first quarter of 2020 due to hedge the significant rally in interest rates. Given current FOMC monetary policy, management anticipates more stable funding costs in the near-term, and as such, we have shifted our interest rate risk relatedhedging strategy to include options and futures with the principal intention of capital preservation.
The table below shows the projected sensitivity of the market value of our TBA securities we began investingfinancial instruments(1) and the percentage change in duringshareholders’ equity assuming an instantaneous parallel shift in market interest rates as of the second quarterdates indicated:
47
| June 30, 2020 | ||||||||||||||||||||||||||||||||||||||||||||||||||||||||||||||||||||||||||||||||||||||||||||
| Decrease in Interest Rates of | Increase in Interest Rates of | |||||||||||||||||||||||||||||||||||||||||||||||||||||||||||||||||||||||||||||||||||||||||||
| 100 Basis Points | 50 Basis Points | 50 Basis Points | 100 Basis Points | |||||||||||||||||||||||||||||||||||||||||||||||||||||||||||||||||||||||||||||||||||||||||
Type of Instrument (1) | % of Market Value | % of Total Equity | % of Market Value | % of Total Equity | % of Market Value | % of Total Equity | % of Market Value | % of Total Equity | ||||||||||||||||||||||||||||||||||||||||||||||||||||||||||||||||||||||||||||||||||||
| RMBS | 0.8 | % | 5.2 | % | 0.9 | % | 5.3 | % | (1.6) | % | (9.9) | % | (3.6) | % | (22.3) | % | ||||||||||||||||||||||||||||||||||||||||||||||||||||||||||||||||||||||||||||
| CMBS | 0.9 | % | 5.7 | % | 0.7 | % | 4.5 | % | (0.8) | % | (4.6) | % | (1.5) | % | (9.0) | % | ||||||||||||||||||||||||||||||||||||||||||||||||||||||||||||||||||||||||||||
| CMBS IO | 0.1 | % | 0.7 | % | 0.1 | % | 0.7 | % | (0.2) | % | (1.0) | % | (0.3) | % | (1.9) | % | ||||||||||||||||||||||||||||||||||||||||||||||||||||||||||||||||||||||||||||
| TBAs | 0.2 | % | 1.2 | % | 0.3 | % | 1.5 | % | (0.7) | % | (4.2) | % | (1.7) | % | (10.4) | % | ||||||||||||||||||||||||||||||||||||||||||||||||||||||||||||||||||||||||||||
| Interest rate hedges | (2.3) | % | (14.0) | % | (2.1) | % | (13.0) | % | 3.0 | % | 18.7 | % | 6.7 | % | 41.3 | % | ||||||||||||||||||||||||||||||||||||||||||||||||||||||||||||||||||||||||||||
| Total | (0.2) | % | (1.2) | % | (0.1) | % | (0.9) | % | (0.2) | % | (1.0) | % | (0.4) | % | (2.3) | % | ||||||||||||||||||||||||||||||||||||||||||||||||||||||||||||||||||||||||||||
| December 31, 2019 | ||||||||||||||||||||||||||||||||||||||||||||||||||||||||||||||||||||||||||||||||||||||||||||
| Decrease in Interest Rates by | Increase in Interest Rates by | |||||||||||||||||||||||||||||||||||||||||||||||||||||||||||||||||||||||||||||||||||||||||||
| 100 Basis Points | 50 Basis Points | 50 Basis Points | 100 Basis Points | |||||||||||||||||||||||||||||||||||||||||||||||||||||||||||||||||||||||||||||||||||||||||
Type of Instrument (1) | % of Market Value | % of Total Equity | % of Market Value | % of Total Equity | % of Market Value | % of Total Equity | % of Market Value | % of Total Equity | ||||||||||||||||||||||||||||||||||||||||||||||||||||||||||||||||||||||||||||||||||||
| RMBS | 0.4 | % | 3.8 | % | 0.5 | % | 4.2 | % | (0.9) | % | (7.8) | % | (2.1) | % | (18.3) | % | ||||||||||||||||||||||||||||||||||||||||||||||||||||||||||||||||||||||||||||
| CMBS | 3.3 | % | 29.1 | % | 1.6 | % | 14.2 | % | (1.5) | % | (13.5) | % | (3.0) | % | (26.4) | % | ||||||||||||||||||||||||||||||||||||||||||||||||||||||||||||||||||||||||||||
| CMBS IO | 0.3 | % | 2.4 | % | 0.1 | % | 1.1 | % | (0.1) | % | (1.1) | % | (0.2) | % | (2.2) | % | ||||||||||||||||||||||||||||||||||||||||||||||||||||||||||||||||||||||||||||
| TBAs | 0.1 | % | 1.0 | % | 0.1 | % | 0.5 | % | (0.1) | % | (0.5) | % | (0.1) | % | (1.1) | % | ||||||||||||||||||||||||||||||||||||||||||||||||||||||||||||||||||||||||||||
| Interest rate hedges | (3.0) | % | (26.5) | % | (1.5) | % | (13.2) | % | 2.3 | % | 20.8 | % | 5.2 | % | 46.5 | % | ||||||||||||||||||||||||||||||||||||||||||||||||||||||||||||||||||||||||||||
| Total | 1.1 | % | 9.8 | % | 0.8 | % | 6.8 | % | (0.3) | % | (2.1) | % | (0.2) | % | (1.5) | % | ||||||||||||||||||||||||||||||||||||||||||||||||||||||||||||||||||||||||||||
(1)Changes in market value of 2017.our financings are excluded because they are not carried at fair value on our balance sheet. The projections for market value do not assume any change in credit spreads.
Management also considers changes in the shape of the interest rate curves in assessing and managing portfolio interest rate risk. Often interest rates do not move in a parallel fashion from quarter to quarter. The table below shows the percentage change in projected market value of our investment portfolio net of derivativefinancial instruments(1) for instantaneous changes in the shape of the U.S. Treasury ("UST"(“UST”) curve (with similar changes to the interest rate swap curves) as of the periodsdates indicated:
| June 30, 2020 | December 31, 2019 | |||||||||||||||||||||||||||||||||||||||||||||||||
| Basis Point Change in | Percentage Change in | Percentage Change in | ||||||||||||||||||||||||||||||||||||||||||||||||
| 2-year UST | 10-year UST | Market Value of Investments (1) | Shareholders’ Equity | Market Value of Investments (1) | Shareholders’ Equity | |||||||||||||||||||||||||||||||||||||||||||||
| +25 | +50 | (0.2) | % | (1.0) | % | (0.3) | % | (2.9) | % | |||||||||||||||||||||||||||||||||||||||||
| +50 | +25 | (0.3) | % | (1.6) | % | (0.2) | % | (1.9) | % | |||||||||||||||||||||||||||||||||||||||||
| +50 | +100 | (0.5) | % | (2.9) | % | (0.4) | % | (3.4) | % | |||||||||||||||||||||||||||||||||||||||||
| -25 | 0 | 0.3 | % | 2.1 | % | — | % | (0.3) | % | |||||||||||||||||||||||||||||||||||||||||
| -25 | -75 | (0.1) | % | (0.5) | % | 1.0 | % | 9.0 | % | |||||||||||||||||||||||||||||||||||||||||
| -50 | -10 | 0.3 | % | 1.6 | % | 0.1 | % | 1.0 | % | |||||||||||||||||||||||||||||||||||||||||
(1)Includes changes in market value of our investments and derivative instruments, including TBA securities, but excludes changes in market value of our financings which are not carried at fair value on our balance sheet due to their short-term maturities. The projections for market value do not assume any change in credit spreads.
48
| September 30, 2017 | December 31, 2016 | |||||||||
| Basis Point Change in | Percentage Change in | |||||||||
| 2-year UST | 10-year UST | Market Value of Investments (1) | Shareholders' Equity | Market Value of Investments (1) | Shareholders' Equity | |||||
| +25 | +50 | (0.5)% | (3.6)% | 0.1% | 0.5% | |||||
| +25 | +0 | (0.1)% | (0.6)% | (0.4)% | (2.5)% | |||||
| +50 | +25 | (0.3)% | (2.3)% | (0.5)% | (3.2)% | |||||
| +50 | +100 | (1.2)% | (8.1)% | 0.1% | 0.4% | |||||
| -10 | -50 | (0.2)% | 1.5% | (0.3)% | (2.3)% | |||||
Spread Risk
Spread risk is the risk of loss from an increase in the market spread between the yield on an investment versus its benchmark index. Changes in market spreads represent the market's valuation of the perceived riskiness of an asset relative to risk-free rates, and widening spreads reduce the market value of our investments as market participants require additional yield to hold riskier assets. Market spreads could change based on macroeconomic or systemic factors as well as the factors specific to a particular security such as prepayment performance or credit performance. Other factors that could impact credit spreads include technical issues such as supply and demand for a particular type of security or FOMC monetary policy. Likewise, most of our investments are fixed-rate or reset in rate over a period of time, and as interest rates rise, we would expect the market value of these investments to decrease. We do not hedge spread risk given the complexity of hedging credit spreads and the lack of liquid instruments available to use as hedges.
Fluctuations in spreads typically vary based on the type of investment. Sensitivity to changes in market spreads is derived from models that are dependent on various assumptions, and actual changes in market value in response to changes in market spreads could differ materially from the projected sensitivity if actual conditions differ from these assumptions.
The Company's exposure to changes to market spreads did not materially shift as of June 30, 2020 versus December 31, 2019. The table below is an estimateshows the projected sensitivity of the percentage change in projected market value of our investments (including TBA securities)(1) given the indicated change in market spreads as of the periodsdates indicated:
| June 30, 2020 | December 31, 2019 | |||||||||||||||||||||||||||||||||||||
| Percentage Change in | Percentage Change in | |||||||||||||||||||||||||||||||||||||
| Basis Point Change in Market Spreads | Market Value of Investments (1) | Shareholders’ Equity | Market Value of Investments (1) | Shareholders’ Equity | ||||||||||||||||||||||||||||||||||
+20/+50 (2) | (1.5) | % | (9.1) | % | (1.2) | % | (11.1) | % | ||||||||||||||||||||||||||||||
| +10 | (0.7) | % | (4.3) | % | (0.6) | % | (5.2) | % | ||||||||||||||||||||||||||||||
| -10 | 0.7 | % | 4.3 | % | 0.6 | % | 5.4 | % | ||||||||||||||||||||||||||||||
-20/-50 (2) | 1.5 | % | 9.1 | % | 1.3 | % | 11.6 | % | ||||||||||||||||||||||||||||||
| Basis Point Change in Market Spreads | Percentage Change in Projected Market Value of Investments | |||
| September 30, 2017 | December 31, 2016 | |||
| +50 | (2.6)% | (2.2)% | ||
| +25 | (1.3)% | (1.1)% | ||
| -25 | 1.3% | 1.1% | ||
| -50 | 2.6% | 2.3% | ||
(2) Assumes a 20-basis point shift in Agency and non-Agency RMBS and CMBS and a 50-basis point shift in Agency
and non-Agency CMBS IO.
Prepayment and Reinvestment Risk
Prepayment risk is the risk of an early, unscheduled return of principal on an investment. We are subject to prepayment risk from premiums paid on investments, which are amortized as a reduction in interest income using the effective yield method under GAAP. Our comprehensive income and book value per common share may also be negatively impacted by prepayments if the fair value materially exceeds the par balance of the underlying security. Principal prepayments on our investments are influenced by changes in market interest rates and a variety of economic, geographic, government policy, and other factors beyond our control.control, including GSE policy with respect to loan forbearance and delinquent loan buy-outs.
Loans underlying our CMBS and CMBS IO securities typically have some form of prepayment protection provisions (such as prepayment lock-outs) or prepayment compensation provisions (such as yield maintenance or prepayment penalties). Yield maintenance and prepayment penalty requirements are intended to create an economic disincentive for the loans to prepay; however, the amount of the prepayment penalty required to be paid may decline over time, and as loans age, interest rates decline, or market values of collateral supporting the loans increase, prepayment penalties may lessen as an economic disincentive to the borrower. Generally, our experience has been that prepayment lock-out and yield maintenance provisions result in stable prepayment performance from period to period. There are no prepayment protections, however, if the loan defaults and is partially or wholly repaid earlier as a result of loss mitigation actions taken by the underlying loan servicer. Historically, we have experienced low default rates on loans underlying CMBS and CMBS IO.
Because CMBS IO consist of rights to interest on the underlying commercial mortgage loan pools and do not have rights to principal payments on the underlying loans, prepayment risk on these securities would beis particularly acute without these prepayment protection provisions. CMBS IOThere are no prepayment protectionprotections if the loan defaults and compensation provisions varyis partially or wholly repaid earlier as a result of loss mitigation actions taken by issuer of the security (i.e. Freddie Mac, Fannie Mae, Ginnie Mae, or non-Agency). The majority of our Agency CMBS IO are issued by Freddie Mac and these securities generally have initial prepayment lock-outs followed by a defeasance period which on average extends to within six months of the stated maturities of the underlying loans. Non-Agency CMBS IO generally have prepayment protectionloan servicer. The slowdown in the form of prepayment lock-outs and defeasance provisions. The following table details the fair value of our CMBS IO portfolio by issuer as ofeconomic activity experienced at the end of the periods indicated:
| ($ in thousands) | September 30, 2017 | December 31, 2016 | |||||
| Fannie Mae | $ | 11,200 | $ | 18,957 | |||
| Freddie Mac | 390,608 | 392,941 | |||||
| Non-Agency CMBS IO | 328,659 | 342,648 | |||||
| $ | 730,467 | $ | 754,546 | ||||
49
producing properties such as retail shopping centers, office buildings, multifamily apartments and hotels. Over the last several years, we have not experienced material defaults on CMBS IO loans age,in our portfolio; however, the ultimate impact on the economy and with respectcommercial real estate performance and market values from the COVID-19 pandemic, and correspondingly loan defaults, is currently unknown. Please refer to ARMS, as the loans near their respective interest rate reset dates, particularly the initial reset date, or if expectations are that interest rates will rise in the future. Our prepayment models anticipate an acceleration of prepayments in these events. To the extent the actual prepayments exceed our modeled prepayments, or, with respect to adjustable-rate RMBS, if we change our future prepayment expectations, we will record adjustments to our premium amortization which may negatively impact our net interest income. In addition, changes in market expectations of prepayments could impact the fair value of our RMBS.“Financial Condition-CMBS IO” for additional information.
| September 30, 2017 | June 30, 2017 | March 31, 2017 | December 31, 2016 | ||||||||||||||||||||
| ($ in thousands) | Net Premium | WAC | Net Premium | WAC | Net Premium | WAC | Net Premium | WAC | |||||||||||||||
| 0-12 MTR | $ | 1,313 | 3.44% | $ | 7,637 | 3.36% | $ | 17,671 | 3.24% | $ | 19,593 | 3.17% | |||||||||||
| 13-36 MTR | 182 | 4.52% | 3,278 | 3.14% | 7,307 | 3.07% | 12,369 | 3.18% | |||||||||||||||
| 37-60 MTR | 6,928 | 3.16% | 11,074 | 3.07% | 11,651 | 3.38% | 10,441 | 3.51% | |||||||||||||||
| > 60 MTR | 2,588 | 2.58% | 7,085 | 2.57% | 11,744 | 2.68% | 14,663 | 2.73% | |||||||||||||||
| 30-year fixed-rate | 19,163 | 3.52% | — | —% | — | —% | — | —% | |||||||||||||||
| Total | $ | 30,174 | 3.35% | $ | 29,074 | 2.98% | $ | 48,373 | 3.04% | $ | 57,066 | 3.05% | |||||||||||
| Par balance | $ | 816,353 | $ | 715,015 | $ | 1,033,735 | $ | 1,157,258 | |||||||||||||||
| Premium, net as a % of par value | 3.7 | % | 4.1 | % | 4.7 | % | 4.9 | % | |||||||||||||||
We seek to manage our prepayment risk on our MBS by diversifying our investments, seeking investments which we believe will have superior prepayment performance, and investing in securities which have some sort of prepayment prohibition or yield maintenance (as is the case with CMBS and CMBS IO). With respect to RMBS, when we invest in RMBS at a premium to the security'ssecurity’s par value, we tend to favor securities in which we believe the underlying borrowers have some disincentive to refinance as a result of the size of each loan'sloan’s principal balance, credit characteristics of the borrower, or geographic location of the property, among other factors.
Credit Risk
Credit risk is the risk that we will not receive all contractual amounts due on investments that we own due to default by the borrower or due to a deficiency in proceeds from the liquidation of the collateral securing the obligation. Credit losses on loans could result in lower or negative yields on our investments.
Agency RMBS and Agency CMBS have credit risk to the extent that Fannie Mae or Freddie Mac fails to remit payments on the MBS for which they have issued a guaranty of payment. Given the improved financial performance and conservatorship of these entities and the continued support of the U.S. government, we believe this risk is low. Since
As noted above, Agency and non-Agency CMBS IO represent the right to excess interest and not principal on the underlying loans, theseloans. These securities are exposed to the loss of investment basis in the event a loan collateralizing the security liquidates without paying yield maintenance or prepayment penalty, whichpenalty. This will typically occursoccur when an involuntarily liquidatingthe underlying loan repays all or a portionis in default and proceeds from the disposition of its related principal balance.
a shortfall in cash flows.
Liquidity Risk
We have liquidity risk principally from the use of recourse repurchase agreements to finance our ownership of securities. In general, our repurchase agreements provide a source of uncommitted short-term financing for longer-term assets, thereby creating a mismatch between the maturities of the asset and the associated financing. Our repurchase agreements are renewable at the discretion of our lenders and do not contain guaranteed roll-over terms. If we fail to repay the lender at maturity, the lender has the right to immediately sell the collateral and pursue us for any shortfall if the sales proceeds are inadequate to cover the repurchase agreement financing. In addition, declines in the market value of our investments pledged as collateral for repurchase agreement borrowings may result in counterparties initiating margin calls for additional collateral .collateral.
Our use of TBA dollar roll transactionslong positions as a means of investing in and financing Agency RMBS also exposes us to liquidity risk in the event that we are unable to roll or terminate our TBA dollar roll transactionscontracts prior to their settlement date. If we are unable to roll or terminate our TBA dollar roll transactions,long positions, we could be required to take physical delivery of the underlying securities and settle our obligations for cash, which could negatively impact our liquidity position or force us to sell assets under adverse conditions if financing is not available to us on acceptable terms.
For further information, including how we attempt to mitigate liquidity risk and monitor our liquidity position and in particular, during the current economic crisis, please refer to “Liquidity and Capital Resources” in Part I, Item 2 of this Quarterly Report on Form 10-Q.
Reinvestment Risk
We are subject to reinvestment risk as a result of the prepayment, repayment and sales of our investments. In order to maintain our investment portfolio size and our earnings, we need to reinvest capital received from these events into new interest-earning assets or TBA securities. Market yields on new investments are substantially lower than the investments we sold in March. As such, we expect new assets that we add at lower yields than the investments sold will lower our interest
50
income in the near future. In addition, based on market conditions, our leverage, and our liquidity profile, we may decide to not reinvest the cash flows we receive from our investment portfolio even when attractive reinvestment opportunities are available, or we may decide to reinvest in assets with lower yield but greater liquidity. If we retain capital or pay dividends to return capital to shareholders rather than reinvest capital, or if we invest capital in lower yielding assets for liquidity reasons, the size of our investment portfolio and the amount of income generated by our investment portfolio will likely decline.
ITEM 4. CONTROLS AND PROCEDURES
Disclosure controlsControls and procedures.Procedures
Our management evaluated, with the participation of our Principal Executive Officer and Principal Financial Officer, the effectiveness of our disclosure controls and procedures, as defined in Exchange Act Rule 13a-15(e), as of the end of the period covered by this report. Based on that evaluation, our Principal Executive Officer and Principal Financial Officer concluded that our disclosure controls and procedures were effective as of SeptemberJune 30, 20172020 to ensure that information required to be disclosed in the reports that we file or submit under the Exchange Act is recorded, processed, summarized and reported, within the time periods specified in the SEC’s rules and forms, and that such information is accumulated and communicated to our management, including our Principal Executive Officer and Principal Financial Officer, as appropriate, to allow timely decisions regarding required disclosure.
Changes in internal controlInternal Control over financial reporting.Financial Reporting
PART II. OTHER INFORMATION
With respect to time,the litigation filed by Basic Capital Management, Inc., et al. (the “DCI Plaintiffs”) against the Company and its subsidiaries are parties to various legal proceedings. As of September 30, 2017, neither the Company nor any of its subsidiaries were a party to any material legal proceedings.
The Company records a contingent liability when, in the opinion of management, it is probable that a loss has been incurred and the amount of the loss can be reasonably estimated. After consultation with litigation counsel, the Company believes, based upon information currently available and its evaluation of Texas and Virginia law, as applicable, that the likelihood of loss in connection with the DCI Litigation is remote and that the likelihood of loss in connection with the Receiver Litigation is not probable, and given the range of potential claims for damages by the Company to offset the Receiver's claims, the amount of possible loss in the Receiver Litigation cannot be reasonably estimated and, therefore, no contingent liability has been recorded for either matter.
The Company believes that the above matters will be resolved without a material adverse effect on the Company’s consolidated financial statements as a whole. The outcome, however, of any legal proceeding, including the above matters, cannot be predicted with certainty. As such, no assurances can be given that the Company will be successful in its defense of these actions on the merits or otherwise. If the Company is not successful in its defense efforts, the resolution of these matters could have a material adverse effect on the Company’s consolidated financial statements in a given future reporting period.
51
Other than as previously disclosed in the Company's periodic reports,described above, to the Company’s knowledge, there are no pending or threatened legal proceedings, the resolution of which, in management’s opinion, individually or in the aggregate, wouldcould have a material adverse effect on the Company’s results of operations or financial condition.
ITEM 1A. RISK FACTORS
Risks and uncertainties identified in our forward-looking statements contained in this Quarterly Report on Form 10-Q together with those previously disclosed in the AnnualQuarterly Report on Form 10-K10-Q for the yearthree months ended DecemberMarch 31, 20162020 or those that are presently unforeseen could result in significant adverse effects on our financial condition, results of operations and cash flows. See “Forward-Looking Statements” contained in Part I, Item 2, “Management’s Discussion and Analysis of Financial Condition and Results of Operations” within this Quarterly Report on Form 10-Q as well as Part I,II, Item 1A, “Risk Factors” in our AnnualQuarterly Report on Form 10-K for the year ended December 31, 2016, and Part II, Item 1A, "Risk Factors" in our Quarterly Reports on Form 10-Q for the quartersthree months ended March 31, 2017 and June 30, 2017.2020.
ITEM 2. UNREGISTERED SALES OF EQUITY SECURITIES AND USE OF PROCEEDS
Issuer Purchases of Equity Securities
| Total Number of Shares | Average Price Paid per Share | Total Number of Shares Purchased as Part of Publicly Announced Plans or Programs | Maximum Number (or Approximate Dollar Value) of Shares that May Yet Be Purchased Under the Plans or Programs | ||||||||||||||||||||
| ($ in thousands) | |||||||||||||||||||||||
| April 1 - 30, 2020 | — | $ | — | — | $ | 40,000 | |||||||||||||||||
| May 1 - 31, 2020 | 14,143 | 11.72 | 14,143 | 39,834 | |||||||||||||||||||
| June 1 - 30, 2020 | — | — | — | 39,834 | |||||||||||||||||||
| 14,143 | $ | — | 14,143 | ||||||||||||||||||||
On April 14, 2020, the Company did notwas also authorized by its Board of Directors to spend up to $40 million to repurchase anyoutstanding shares of common stock under this repurchase authorization.Preferred Stock through March 31, 2022.
ITEM 3. DEFAULTS UPON SENIOR SECURITIES
None.
ITEM 4. MINE SAFETY DISCLOSURES
None.
52
ITEM 5. OTHER INFORMATION
None.
53
ITEM 6. EXHIBITS
| Exhibit No. | Description | ||||
| 3.1 | |||||
| 3.1.2 | |||||
| 3.2 | |||||
| 4.3 | |||||
| 4.4 | |||||
| 10.40 | |||||
| 31.1 | |||||
| 31.2 | |||||
| 32.1 | |||||
| 101 | The following materials from Dynex Capital, Inc.'s Quarterly Report on Form 10-Q for the three months ended | ||||
| 104 | The cover page from Dynex Capital, Inc.'s Quarterly Report on Form 10-Q for the three months ended June 30, 2020, formatted in iXBRL (Inline Extensible Business Reporting Language) (included with Exhibit 101). | ||||
SIGNATURES
Pursuant to the requirements of Section 13 or 15(d) of the Securities Exchange Act of 1934, the registrant has duly caused this report to be signed on its behalf by the undersigned, thereunto duly authorized.
| DYNEX CAPITAL, INC. | ||||||||
| Date: | August 3, 2020 | /s/ Byron L. Boston | ||||||
| Byron L. Boston | ||||||||
| Chief Executive Officer, President, | ||||||||
| Co-Chief Investment Officer, and Director | ||||||||
| (Principal Executive Officer) | ||||||||
| Date: | August 3, 2020 | |||||||
| /s/ Stephen J. Benedetti | ||||||||
| Stephen J. Benedetti | ||||||||
| Executive Vice President, Chief Financial Officer and Chief Operating Officer | ||||||||
| (Principal Financial Officer) | ||||||||
55