UNITED STATES
SECURITIES AND EXCHANGE COMMISSION
Washington, DC 20549
FORM 10-Q
|
| | | | |
x
☒ | Quarterly Report Pursuant to Section 13 or 15(d) of the Securities Exchange Act of 1934 |
For the quarterly period ended September 30, 2017March 31, 2021
or
|
| | | | |
o
☐ | Transition Report Pursuant to Section 13 or 15(d) of the Securities Exchange Act of 1934 |
Commission File Number: 1-9819
DYNEX CAPITAL, INC.
(Exact name of registrant as specified in its charter) |
| | | | | | | | | | | | | | | | | | | |
| Virginia | | 52-1549373 |
| (State or other jurisdiction of | (I.R.S. Employer |
| incorporation or organization) | | (I.R.S. Employer Identification No.) |
| |
4991 Lake Brook Drive, Suite 100 Glen Allen, Virginia | 23060-9245 | | |
| Glen Allen, | Virginia | | 23060-9245 |
| (Address of principal executive offices) | | (Zip Code) |
| | | (804) | 217-5800 | |
(804) 217-5800
(Registrant’s telephone number, including area code) |
| | | | | | | | | | | | | | |
| Securities registered pursuant to Section 12(b) of the Act: | | |
| Title of each class | | Trading Symbol(s) | | Name of each exchange on which registered |
| Common Stock, par value $0.01 per share | | DX | | New York Stock Exchange |
| 7.625% Series B Cumulative Redeemable Preferred Stock, par value $0.01 per share | | N/A | | None |
| 6.900% Series C Fixed-to-Floating Rate Cumulative Redeemable Preferred Stock, par value $0.01 per share | | DXPRC | | New York Stock Exchange |
Indicate by check mark whether the registrant (1) has filed all reports required to be filed by Section 13 or 15(d) of the Securities Exchange Act of 1934 during the preceding 12 months (or for such shorter period that the registrant was required to file such reports), and (2) has been subject to such filing requirements for the past 90 days.
Yes x☒ No o☐
Indicate by check mark whether the registrant has submitted electronically and posted on its corporate Web site, if any, every Interactive Data File required to be submitted and posted pursuant to Rule 405 of Regulation S-T (§232.405 of this chapter) during the preceding 12 months (or for such shorter period that the registrant was required to submit and post such files).
Yes x☒ No o☐
Indicate by check mark whether the registrant is a large accelerated filer, an accelerated filer, a non-accelerated filer, a smaller reporting company, or an emerging growth company. See the definitions of “large accelerated filer,” “accelerated filer,” “smaller reporting company,” and "emerging growth company" in Rule 12b-2 of the Exchange Act.
|
| | | | | | | | | | |
| Large accelerated filer | o☐ | Accelerated filer | x☒ |
| Non-accelerated filer | o (Do not check if a smaller reporting company)
☐ | Smaller reporting company | o☐ |
| | Emerging growth company | o☐ |
If an emerging growth company, indicate by check mark if the registrant has elected not to use the extended transition period for complying with any new or revised financial accounting standards provided pursuant to Section 13(a) of the Exchange Act. o☐
Indicate by check mark whether the registrant is a shell company (as defined in Rule 12b-2 of the Exchange Act).
Yes o☐ No x☒
On October 31, 2017,April 30, 2021, the registrant had 53,219,28630,879,569 shares outstanding of common stock, $0.01 par value, which is the registrant’s only class of common stock.
DYNEX CAPITAL, INC.
FORM 10-Q
INDEX
| | | | | | | | | | | |
| | | Page |
| PART I. FINANCIAL INFORMATION | |
| | | |
| Item 1. | Financial Statements | Page |
| | |
| | | |
| | | |
| | | |
| | Consolidated Balance Sheets as of September 30, 2017March 31, 2021 (unaudited) and December 31, 20162020 | |
| | | |
| | Consolidated Statements of Comprehensive Income (Loss) for the three and nine months ended September 30, 2017
March 31, 2021 (unaudited) and September 30, 2016March 31, 2020 (unaudited) | |
| | | |
| | Consolidated StatementStatements of Shareholders' Equity for the ninethree months ended September 30, 2017
March 31, 2021 (unaudited) and March 31, 2020 (unaudited) | |
| | | |
| | Consolidated Statements of Cash Flows for the ninethree months ended September 30, 2017
March 31, 2021 (unaudited) and September 30, 2016March 31, 2020 (unaudited) | |
| | | |
| | | |
| | | |
| | | |
| | | |
| | | |
| | | |
| | | |
| | | |
| | |
| | | |
| Item 1. | Legal Proceedings | | | |
| Item 1A. | | |
| Risk Factors | | | |
| | | |
| | | |
| | | |
| | | |
| | | |
| | | |
| Item 5. | | |
| Other Information | | | |
| Item 6. | | |
| Exhibits | | | |
| | | |
| |
PART I. FINANCIAL INFORMATION
ITEM 1. FINANCIAL STATEMENTS
DYNEX CAPITAL, INC.
CONSOLIDATED BALANCE SHEETS
(amounts in thousands except share data) | | | | September 30, 2017 | | December 31, 2016 | | March 31, 2021 | | December 31, 2020 |
| ASSETS | (unaudited) | |
| ASSETS | (unaudited) | | |
| Mortgage-backed securities (including pledged of $2,714,312 and $3,150,610, respectively) | $ | 2,921,444 |
| | $ | 3,212,084 |
| |
| Mortgage loans held for investment, net | 16,523 |
| | 19,036 |
| |
| Cash and cash equivalents | 117,702 |
| | 74,120 |
| |
| Restricted cash | 43,987 |
| | 24,769 |
| |
| Cash | | Cash | $ | 328,936 | | | $ | 295,602 | |
| Cash collateral posted to counterparties | | Cash collateral posted to counterparties | 49,180 | | | 14,758 | |
| Mortgage-backed securities (including pledged of $2,173,333 and $2,467,859, respectively), at fair value | | Mortgage-backed securities (including pledged of $2,173,333 and $2,467,859, respectively), at fair value | 2,380,373 | | | 2,596,255 | |
| Mortgage loans held for investment, at fair value | | Mortgage loans held for investment, at fair value | 5,749 | | | 6,264 | |
| Receivable for sales pending settlement | | Receivable for sales pending settlement | 5,067 | | | 150,432 | |
| Derivative assets | 368 |
| | 28,534 |
| Derivative assets | 109,746 | | | 11,342 | |
| Receivable for securities sold | 13,435 |
| | — |
| |
| Principal receivable on investments | 3,359 |
| | 11,978 |
| |
| Accrued interest receivable | 19,267 |
| | 20,396 |
| Accrued interest receivable | 15,480 | | | 14,388 | |
| Other assets, net | 7,193 |
| | 6,814 |
| Other assets, net | 6,577 | | | 6,394 | |
| Total assets | $ | 3,143,278 |
| | $ | 3,397,731 |
| Total assets | $ | 2,901,108 | | | $ | 3,095,435 | |
| | | | | | | | |
| LIABILITIES AND SHAREHOLDERS’ EQUITY |
|
| | |
| LIABILITIES AND SHAREHOLDERS’ EQUITY | | |
| Liabilities: | |
| | |
| Liabilities: | | | |
| Repurchase agreements | $ | 2,519,230 |
| | $ | 2,898,952 |
| Repurchase agreements | $ | 2,032,089 | | | $ | 2,437,163 | |
| Payable for unsettled securities | 77,357 |
| | — |
| |
| Non-recourse collateralized financing | 5,706 |
| | 6,440 |
| |
| Payable for purchases pending settlement | | Payable for purchases pending settlement | 24,455 | | | 5 | |
| Derivative liabilities | 133 |
| | 6,922 |
| Derivative liabilities | 19,866 | | | 1,634 | |
| Cash collateral posted by counterparties | | Cash collateral posted by counterparties | 83,776 | | | 7,681 | |
| Accrued interest payable | 2,720 |
| | 3,156 |
| Accrued interest payable | 418 | | | 1,410 | |
| Accrued dividends payable | 11,620 |
| | 12,268 |
| Accrued dividends payable | 5,639 | | | 5,814 | |
| Other liabilities | 2,413 |
| | 2,809 |
| Other liabilities | 3,589 | | | 8,275 | |
| Total liabilities | 2,619,179 |
| | 2,930,547 |
| Total liabilities | 2,169,832 | | | 2,461,982 | |
| |
|
| | | |
| Shareholders’ equity: | |
| | |
| Shareholders’ equity: | | | |
| Preferred stock, par value $.01 per share; 50,000,000 shares authorized; 5,665,101 and 4,571,937 shares issued and outstanding, respectively ($141,628 and $114,298 aggregate liquidation preference, respectively) | $ | 135,828 |
| | $ | 110,005 |
| |
Common stock, par value $.01 per share, 200,000,000 shares authorized; 51,262,350 and 49,153,463 shares issued and outstanding, respectively | 513 |
| | 492 |
| |
| Preferred stock, par value $0.01 per share; 50,000,000 shares authorized; 4,460,000 and 7,248,330 shares issued and outstanding, respectively ($111,500 and $181,208 aggregate liquidation preference, respectively) | | Preferred stock, par value $0.01 per share; 50,000,000 shares authorized; 4,460,000 and 7,248,330 shares issued and outstanding, respectively ($111,500 and $181,208 aggregate liquidation preference, respectively) | $ | 107,843 | | | $ | 174,564 | |
Common stock, par value $0.01 per share, 90,000,000 shares authorized; 30,879,569 and 23,697,970 shares issued and outstanding, respectively | | Common stock, par value $0.01 per share, 90,000,000 shares authorized; 30,879,569 and 23,697,970 shares issued and outstanding, respectively | 309 | | | 237 | |
| Additional paid-in capital | 742,845 |
| | 727,369 |
| Additional paid-in capital | 997,326 | | | 869,495 | |
| Accumulated other comprehensive income (loss) | 5,886 |
| | (32,609 | ) | |
| Accumulated other comprehensive income | | Accumulated other comprehensive income | 15,105 | | | 80,261 | |
| Accumulated deficit | (360,973 | ) | | (338,073 | ) | Accumulated deficit | (389,307) | | | (491,104) | |
| Total shareholders' equity | 524,099 |
| | 467,184 |
| |
| Total shareholders’ equity | | Total shareholders’ equity | 731,276 | | | 633,453 | |
| Total liabilities and shareholders’ equity | $ | 3,143,278 |
| | $ | 3,397,731 |
| Total liabilities and shareholders’ equity | $ | 2,901,108 | | | $ | 3,095,435 | |
See notes to the unaudited consolidated financial statements.
DYNEX CAPITAL, INC.
CONSOLIDATED STATEMENTS OF COMPREHENSIVE INCOME (LOSS)
(UNAUDITED)(unaudited)
(amounts in thousands except per share data)
| | | | Three Months Ended | | Nine Months Ended | | Three Months Ended | |
| | September 30, | | September 30, | | March 31, | |
| | 2017 | | 2016 | | 2017 | | 2016 | | 2021 | | 2020 | |
| Interest income | $ | 23,103 |
| | $ | 21,135 |
| | $ | 70,378 |
| | 69,040 |
| Interest income | $ | 13,892 | | | $ | 39,822 | | |
| Interest expense | 9,889 |
| | 6,068 |
| | 26,122 |
| | 18,478 |
| Interest expense | (1,633) | | | (22,101) | | |
| Net interest income | 13,214 |
| | 15,067 |
| | 44,256 |
| | 50,562 |
| Net interest income | 12,259 | | | 17,721 | | |
| | | | | | | | | | |
| Gain on sale of investments, net | | Gain on sale of investments, net | 4,697 | | | 84,783 | | |
| Loss on investments, net | | Loss on investments, net | (980) | | | (372) | | |
| Gain (loss) on derivative instruments, net | 5,993 |
| | 2,409 |
| | (9,634 | ) | | (62,153 | ) | Gain (loss) on derivative instruments, net | 107,801 | | | (195,567) | | |
| Loss on sale of investments, net | (5,211 | ) | | — |
| | (10,628 | ) | | (4,238 | ) | |
| Fair value adjustments, net | 23 |
| | 34 |
| | 63 |
| | 86 |
| |
| Other (loss) income, net | (109 | ) | | 545 |
| | (150 | ) | | 898 |
| |
| Other operating expense, net | | Other operating expense, net | (380) | | | (423) | | |
| General and administrative expenses: | | | | |
|
| | | General and administrative expenses: | | |
| Compensation and benefits | (2,070 | ) | | (1,736 | ) | | (6,356 | ) | | (5,829 | ) | Compensation and benefits | (3,096) | | | (2,163) | | |
| Other general and administrative | (1,529 | ) | | (1,619 | ) | | (5,620 | ) | | (5,288 | ) | Other general and administrative | (2,372) | | | (2,458) | | |
| Net income (loss) | 10,311 |
| | 14,700 |
| | 11,931 |
| | (25,962 | ) | Net income (loss) | 117,929 | | | (98,479) | | |
| Preferred stock dividends | (2,808 | ) | | (2,294 | ) | | (7,885 | ) | | (6,882 | ) | Preferred stock dividends | (2,559) | | | (3,841) | | |
| Preferred stock redemption charge | | Preferred stock redemption charge | (2,987) | | | (3,914) | | |
| Net income (loss) to common shareholders | $ | 7,503 |
| | $ | 12,406 |
| | $ | 4,046 |
| | $ | (32,844 | ) | Net income (loss) to common shareholders | $ | 112,383 | | | $ | (106,234) | | |
| | | | | | | | | | | | | |
| Other comprehensive income: | | | | |
|
| | | Other comprehensive income: | | |
| Unrealized gain on available-for-sale investments, net | $ | 981 |
| | $ | 769 |
| | $ | 28,087 |
| | $ | 61,260 |
| |
| Reclassification adjustment for loss on sale of investments, net | 5,211 |
| | — |
| | 10,628 |
| | 4,238 |
| |
| Reclassification adjustment for de-designated cash flow hedges | (48 | ) | | (99 | ) | | (220 | ) | | (152 | ) | |
| Total other comprehensive income | 6,144 |
| | 670 |
| | 38,495 |
| | 65,346 |
| |
| Comprehensive income to common shareholders | $ | 13,647 |
| | $ | 13,076 |
| | $ | 42,541 |
| | $ | 32,502 |
| |
| Unrealized (loss) gain on available-for-sale investments, net | | Unrealized (loss) gain on available-for-sale investments, net | $ | (60,459) | | | $ | 157,755 | | |
| Reclassification adjustment for realized gain on sale of available-for-sale investments, net | | Reclassification adjustment for realized gain on sale of available-for-sale investments, net | (4,697) | | | (84,783) | | |
| Total other comprehensive (loss) income | | Total other comprehensive (loss) income | (65,156) | | | 72,972 | | |
| Comprehensive income (loss) to common shareholders | | Comprehensive income (loss) to common shareholders | $ | 47,227 | | | $ | (33,262) | | |
| | | | | | | | | | | | | |
| Net income (loss) per common share-basic and diluted | $ | 0.15 |
| | $ | 0.25 |
| | $ | 0.08 |
| | $ | (0.67 | ) | Net income (loss) per common share-basic and diluted | $ | 4.20 | | | $ | (4.63) | | |
| Weighted average common shares-basic and diluted | 49,832 |
| | 49,147 |
| | 49,411 |
| | 49,102 |
| Weighted average common shares-basic and diluted | 26,788,693 | | | 22,963,084 | | |
See notes to the unaudited consolidated financial statements.
DYNEX CAPITAL, INC.
CONSOLIDATED STATEMENTSTATEMENTS OF SHAREHOLDERS’ EQUITY
(UNAUDITED)(unaudited)
($ in thousands)
| | | | | | | | | | | | | | | | | | | | | | | | | | | | | | | | | | | | | | | | | |
| Preferred Stock | | Common Stock | | Additional
Paid-in
Capital | | AOCI | | Accumulated
Deficit | | Total Shareholders’ Equity |
| Shares | Amount | Shares | Amount |
Balance as of
December 31, 2019 | 6,788,330 | | $ | 162,807 | | | 22,945,993 | | $ | 229 | | | $ | 858,347 | | | $ | 173,806 | | | $ | (612,201) | | | $ | 582,988 | |
| Cumulative effect of adopting accounting standard ASU 2019-05 | — | | — | | | — | | — | | | — | | | — | | | (548) | | | (548) | |
| Adjusted Balance, January 1, 2020 | 6,788,330 | | 162,807 | | | 22,945,993 | | 229 | | | 858,347 | | | 173,806 | | | (612,749) | | | 582,440 | |
| Stock issuance | 4,460,000 | | 107,988 | | | — | | — | | | — | | | — | | | — | | | 107,988 | |
| Redemption of preferred stock | (4,000,000) | | (96,086) | | | — | | — | | | — | | | — | | | (3,914) | | | (100,000) | |
| Restricted stock granted, net of amortization | — | | — | | | 67,511 | | 1 | | | 306 | | | — | | | — | | | 307 | |
| Stock repurchase | — | | — | | | (18,782) | | 0 | | | (206) | | | — | | | — | | | (206) | |
| Adjustments for tax withholding on share-based compensation | — | | — | | | (12,744) | | 0 | | | (235) | | | — | | | — | | | (235) | |
| Stock issuance costs | — | | — | | | — | | — | | | (9) | | | — | | | — | | | (9) | |
| Net loss | — | | — | | | — | | — | | | — | | | — | | | (98,479) | | | (98,479) | |
| Dividends on preferred stock | — | | — | | | — | | — | | | — | | | — | | | (3,841) | | | (3,841) | |
| Dividends on common stock | — | | — | | | — | | — | | | — | | | — | | | (10,330) | | | (10,330) | |
| Other comprehensive income | — | | — | | | — | | — | | | — | | | 72,972 | | | — | | | 72,972 | |
| Balance as of March 31, 2020 | 7,248,330 | | $ | 174,709 | | | 22,981,978 | | $ | 230 | | | $ | 858,203 | | | $ | 246,778 | | | $ | (729,313) | | | $ | 550,607 | |
| | | | | | | | | | | | | |
| Preferred Stock | | Common Stock | | Additional
Paid-in
Capital | | AOCI | | Accumulated
Deficit | | Total Shareholders’ Equity |
| Shares | Amount | Shares | Amount |
Balance as of
December 31, 2020 | 7,248,330 | | $ | 174,564 | | | 23,697,970 | | $ | 237 | | | $ | 869,495 | | | $ | 80,261 | | | $ | (491,104) | | | $ | 633,453 | |
| Stock issuance | — | | — | | | 7,187,500 | | 72 | | | 128,078 | | | — | | | — | | | 128,150 | |
| Redemption of preferred stock | (2,788,330) | | (66,721) | | | — | | — | | | — | | | — | | | (2,987) | | | (69,708) | |
| Restricted stock granted, net of amortization | — | | — | | | 16,722 | | 0 | | | 451 | | | — | | | — | | | 451 | |
| Adjustments for tax withholding on share-based compensation | — | | — | | | (22,623) | | 0 | | | (428) | | | — | | | — | | | (428) | |
| Stock issuance costs | — | | — | | | — | | — | | | (270) | | | — | | | — | | | (270) | |
| Net income | — | | — | | | — | | — | | | — | | | — | | | 117,929 | | | 117,929 | |
|
| | | | | | | | | | | | | | | | | | | | | | | | | | | |
| | Preferred Stock | | Common Stock | | Additional Paid-in Capital | | Accumulated Other Comprehensive (Loss) Income | | Accumulated Deficit | | Total Shareholders' Equity |
| | Shares | Amount | Shares | Amount |
| Balance as of December 31, 2016 | 4,571,937 |
| $ | 110,005 |
| | 49,153,463 |
| $ | 492 |
| | $ | 727,369 |
| | $ | (32,609 | ) | | $ | (338,073 | ) | | $ | 467,184 |
|
| Stock issuance | 1,093,164 |
| 25,884 |
| | 2,048,288 |
| 21 |
| | 14,474 |
| | — |
| | — |
| | 40,379 |
|
| Restricted stock granted, net of amortization | — |
| — |
| | 138,166 |
| 1 |
| | 1,565 |
| | — |
| | — |
| | 1,566 |
|
| Adjustments for tax withholding on share-based compensation | — |
| — |
| | (77,567 | ) | (1 | ) | | (520 | ) | | — |
| | — |
| | (521 | ) |
| Stock issuance costs | — |
| (61 | ) | | — |
| — |
| | (43 | ) | | — |
| | — |
| | (104 | ) |
| Net income | — |
| — |
| | — |
| — |
| | — |
| | — |
| | 11,931 |
| | 11,931 |
|
| Dividends on preferred stock | — |
| — |
| | — |
| — |
| | — |
| | — |
| | (7,885 | ) | | (7,885 | ) |
| Dividends on common stock | — |
| — |
| | — |
| — |
| | — |
| | — |
| | (26,946 | ) | | (26,946 | ) |
| Other comprehensive income | — |
| — |
| | — |
| — |
| | — |
| | 38,495 |
| | — |
| | 38,495 |
|
| Balance as of September 30, 2017 | 5,665,101 |
| $ | 135,828 |
| | 51,262,350 |
| $ | 513 |
| | $ | 742,845 |
| | $ | 5,886 |
| | $ | (360,973 | ) | | $ | 524,099 |
|
| | | | | | | | | | | | | | | | | | | | | | | | | | | | | | | | | | | | | | | | | |
| Preferred Stock | | Common Stock | | Additional
Paid-in
Capital | | AOCI | | Accumulated
Deficit | | Total Shareholders’ Equity |
| Shares | Amount | Shares | Amount |
| Dividends on preferred stock | — | | — | | | — | | — | | | — | | | — | | | (2,559) | | | (2,559) | |
| Dividends on common stock | — | | — | | | — | | — | | | — | | | — | | | (10,586) | | | (10,586) | |
| Other comprehensive income | — | | — | | | — | | — | | | — | | | (65,156) | | | — | | | (65,156) | |
| Balance as of March 31, 2021 | 4,460,000 | | $ | 107,843 | | | 30,879,569 | | $ | 309 | | | $ | 997,326 | | | $ | 15,105 | | | $ | (389,307) | | | $ | 731,276 | |
See notes to the unaudited consolidated financial statements.
DYNEX CAPITAL, INC.
CONSOLIDATED STATEMENTS OF CASH FLOWS
(UNAUDITED)(unaudited)
| | | | Nine Months Ended | | Three Months Ended |
| | September 30, | | March 31, |
| | 2017 | | 2016 | | 2021 | | 2020 |
| Operating activities: | | | | Operating activities: | | | |
| Net income (loss) | $ | 11,931 |
| | $ | (25,962 | ) | Net income (loss) | $ | 117,929 | | | $ | (98,479) | |
| Adjustments to reconcile net income (loss) to cash provided by operating activities: | |
| | |
| Adjustments to reconcile net income (loss) to cash provided by operating activities: | | |
| Decrease in accrued interest receivable | 1,129 |
| | 3,263 |
| |
| (Decrease) increase in accrued interest payable | (436 | ) | | 420 |
| |
| Loss on derivative instruments, net | 9,634 |
| | 62,153 |
| |
| Loss on sale of investments, net | 10,628 |
| | 4,238 |
| |
| Fair value adjustments, net | (63 | ) | | (86 | ) | |
| (Gain) loss on derivative instruments, net | | (Gain) loss on derivative instruments, net | (107,801) | | | 195,567 | |
| Gain on sale of investments, net | | Gain on sale of investments, net | (4,697) | | | (84,783) | |
| Loss on investments, net | | Loss on investments, net | 980 | | | 372 | |
| Amortization of investment premiums, net | 122,621 |
| | 112,418 |
| Amortization of investment premiums, net | 30,161 | | | 33,118 | |
| Other amortization and depreciation, net | 983 |
| | 1,186 |
| Other amortization and depreciation, net | 599 | | | 499 | |
| Stock-based compensation expense | 1,567 |
| | 2,066 |
| Stock-based compensation expense | 452 | | | 307 | |
| Increase in other assets and liabilities, net | (1,905 | ) | | (2,060 | ) | |
| Net cash and cash equivalents provided by operating activities | 156,089 |
| | 157,636 |
| |
| (Increase) decrease in accrued interest receivable | | (Increase) decrease in accrued interest receivable | (1,092) | | | 3,105 | |
| Decrease in accrued interest payable | | Decrease in accrued interest payable | (992) | | | (5,979) | |
| Change in other assets and liabilities, net | | Change in other assets and liabilities, net | (5,350) | | | 254 | |
| Net cash provided by operating activities | | Net cash provided by operating activities | 30,189 | | | 43,981 | |
| Investing activities: | |
| | |
| Investing activities: | | | |
| Purchase of investments | (772,590 | ) | | (96,816 | ) | Purchase of investments | (68,543) | | | (155,594) | |
| Principal payments received on investments | 248,298 |
| | 337,719 |
| Principal payments received on investments | 118,022 | | | 140,032 | |
| Proceeds from sales of investments | 792,984 |
| | 94,033 |
| Proceeds from sales of investments | 220,194 | | | 487,464 | |
| Principal payments received on mortgage loans held for investment, net | 2,641 |
| | 3,709 |
| |
| Distributions received from limited partnership | — |
| | 10,835 |
| |
| Principal payments received on mortgage loans held for investment | | Principal payments received on mortgage loans held for investment | 488 | | | 615 | |
| Net receipts (payments) on derivatives, including terminations | 11,743 |
| | (24,483 | ) | Net receipts (payments) on derivatives, including terminations | 52,079 | | | (187,822) | |
| Other investing activities | (214 | ) | | (105 | ) | |
| Net cash and cash equivalents provided by investing activities | 282,862 |
| | 324,892 |
| |
| Increase in cash collateral posted by counterparties | | Increase in cash collateral posted by counterparties | 76,095 | | | 3,185 | |
| | Net cash provided by investing activities | | Net cash provided by investing activities | 398,335 | | | 287,880 | |
| Financing activities: | |
| | |
| Financing activities: | | | |
| Borrowings under repurchase agreements | 60,229,426 |
| | 19,293,243 |
| Borrowings under repurchase agreements | 4,494,067 | | | 16,555,552 | |
| Repayments of repurchase agreement borrowings and FHLB advances | (60,609,148 | ) | | (19,661,384 | ) | |
| Repayments of repurchase agreement borrowings | | Repayments of repurchase agreement borrowings | (4,899,141) | | | (16,899,794) | |
| Principal payments on non-recourse collateralized financing | (747 | ) | | (1,443 | ) | Principal payments on non-recourse collateralized financing | (118) | | | (569) | |
| Proceeds from issuance of preferred stock | 25,884 |
| | — |
| Proceeds from issuance of preferred stock | 0 | | | 107,988 | |
| Proceeds from issuance of common stock | 14,495 |
| | 102 |
| Proceeds from issuance of common stock | 128,150 | | | 0 | |
| Cash paid for redemption of preferred stock | | Cash paid for redemption of preferred stock | (69,708) | | | (100,000) | |
| Cash paid for stock issuance costs | (61 | ) | | — |
| Cash paid for stock issuance costs | (270) | | | 0 | |
| Cash paid for repurchases of common stock | — |
| | (310 | ) | |
| Cash paid for common stock repurchases | | Cash paid for common stock repurchases | 0 | | | (206) | |
| Payments related to tax withholding for stock-based compensation | (521 | ) | | (485 | ) | Payments related to tax withholding for stock-based compensation | (428) | | | (235) | |
| Dividends paid | (35,479 | ) | | (39,285 | ) | Dividends paid | (13,320) | | | (15,027) | |
| Net cash and cash equivalents used in financing activities | (376,151 | ) | | (409,562 | ) | |
| Net cash used in financing activities | | Net cash used in financing activities | (360,768) | | | (352,291) | |
| | | | | | | | |
| Net increase in cash, cash equivalents, and restricted cash | 62,800 |
| | 72,966 |
| |
| Cash, cash equivalents, and restricted cash at beginning of period | 98,889 |
| | 85,125 |
| |
| Cash, cash equivalents, and restricted cash at end of period | $ | 161,689 |
| | $ | 158,091 |
| |
| Net increase (decrease) in cash and cash posted to counterparties | | Net increase (decrease) in cash and cash posted to counterparties | 67,756 | | | (20,430) | |
| Cash and cash posted to counterparties at beginning of period | | Cash and cash posted to counterparties at beginning of period | 310,360 | | | 136,230 | |
| Cash and cash posted to counterparties at end of period | | Cash and cash posted to counterparties at end of period | $ | 378,116 | | | $ | 115,800 | |
| Supplemental Disclosure of Cash Activity: | |
| | |
| Supplemental Disclosure of Cash Activity: | | | |
| Cash paid for interest | $ | 26,766 |
| | $ | 18,185 |
| Cash paid for interest | $ | 2,619 | | | $ | 28,074 | |
See notes to the unaudited consolidated financial statements.
NOTES TO THE CONSOLIDATED FINANCIAL STATEMENTS
DYNEX CAPITAL, INC.
(amounts in thousands except share data)
NOTE 1 – ORGANIZATION AND SUMMARY OF SIGNIFICANT ACCOUNTING POLICIES
Organization
Dynex Capital, Inc., ("Company" (“Company”) was incorporated in the Commonwealth of Virginia on December 18, 1987 and commenced operations in February 1988. The Company is an internally managed mortgage real estate investment trust, or mortgage REIT, which primarily earns income from investing on a leveraged basis in debt securities, the majority of which are specified pools of Agency and non-Agency mortgage-backed securities (“MBS”) consisting of commercial MBS (“CMBS”), residential MBS (“RMBS”), commercial MBS (“CMBS”) and CMBS interest-only ("IO"(“IO”) securities thatand non-Agency MBS, which consist mainly of CMBS IO. Agency MBS have a guaranty of principal payment by a U.S. government-sponsored entity (“GSE”) such as Fannie Mae and Freddie Mac, which are in conservatorship and are currently supported by a senior preferred stock purchase agreement from the U.S. Treasury. Non-Agency MBS are issued or guaranteed by the U.S. Government or U.S. Government sponsored agencies ("Agency MBS")non-governmental enterprises and MBS issued by others ("non-Agency MBS"). Wedo not have a guaranty of principal payment. The Company also investinvests in other types of mortgage-related securities, such as to-be-announced securities (“TBA”) forward contracts for the purchaseTBAs” or sale of generic (also referred to as "non-specified"“TBA securities”) pools of Agency MBS..
Basis of Presentation
The accompanying unaudited consolidated financial statements of Dynex Capital, Inc.the Company and its subsidiaries (together, “Dynex” or, as appropriate, the “Company”) have been prepared in accordance with accounting principlesU.S. generally accepted in the United States of Americaaccounting principles (“GAAP”) for interim financial information and with the instructions to the Quarterly Report on Form 10-Q and Article 10, Rule 10-01 of Regulation S-X promulgated by the Securities and Exchange Commission (the “SEC”). Accordingly, they do not include all of the information and notes required by GAAP for complete financial statements. In the opinion of management, all significant adjustments, consisting of normal recurring accruals, considered necessary for a fair presentation of the consolidated financial statements have been included. Operating results for the three months ended September 30, 2017March 31, 2021 are not necessarily indicative of the results that may be expected for any other interim periods or for the entire year ending December 31, 2017.2021. The unaudited consolidated financial statements included herein should be read in conjunction with the audited financial statements and notes thereto included in the Company’s Annual Report on Form 10-K for the year ended December 31, 20162020 (the “2020 Form 10-K”) filed with the SEC.
Consolidation
The consolidated financial statements include the accounts of the Company and the accounts of its majority owned subsidiaries and variable interest entities ("VIE") for which it is the primary beneficiary. As a primary beneficiary, the Company has both the power to direct the activities that most significantly impact the economic performance of the VIE and a right to receive benefits or absorb losses of the entity that could be potentially significant to the VIE. The Company is required to reconsider its evaluation of whether to consolidate a VIE each reporting period, based upon changes in the facts and circumstances pertaining to the VIE. The Company consolidates certain trusts through which it has securitized mortgage loans as a result of not meeting the sale criteria under GAAP at the time the financial assets were transferred to the trust. All intercompany accounts and transactions have been eliminated in consolidation.
Use of Estimates
The preparation of financial statements in conformity with GAAP requires management to make estimates and assumptions that affect the reported amounts of assets and liabilities and the disclosure of contingent assets and liabilities at the date of the financial statements as well as the reported amounts of revenue and expenses during the reported period. Actual results could differ from those estimates. The most significant estimates used by management include, but are not limited to, amortization of premiums and discounts and fair value measurements of its investments, and other-than-temporary impairments.investments. These items are discussed further below within this note to the consolidated financial statements.
The Company believes the estimates and assumptions underlying the consolidated financial statements included herein are reasonable and supportable based on the information available as of March 31, 2021; however, the uncertainty over the impact that the COVID-19 pandemic may continue to have on the global economy and on the Company’s business makes any estimates and assumptions inherently less certain than they would be absent the current and potential impacts of COVID-19. The COVID-19 pandemic and resulting emergency measures have led (and may continue to lead) to significant disruptions in the global capital markets and supply chains as well as the economy of the U.S. and other countries impacted by COVID-19. In particular, as part of the Coronavirus Aid, Relief, and Economic Security (“CARES”) Act passed by the U.S. Congress, which includes assistance to homeowners and renters, both Fannie Mae and Freddie Mac have implemented mortgage forbearance policies that allow borrowers to delay their mortgage payments for up to 18 months and placed a moratorium on foreclosures on single-family homes until June 30, 2021. The impact of high levels of forbearance on the Company’s MBS could range from immaterial to significant depending upon not only actual losses incurred on underlying loans but also future public policy choices and actions by the GSEs, their regulator the Federal Housing Finance Agency (“FHFA”), the U.S. Federal Reserve (“Federal Reserve”), and federal and state governments. The nature and timing of any such future public policy choices and actions are unpredictable, including the potential impact on MBS prices and prepayment speeds. Though these supportive actions have helped cushion the economic damage from the disruption of the
NOTES TO THE CONSOLIDATED FINANCIAL STATEMENTS
DYNEX CAPITAL, INC.
(amounts in thousands except share data)
pandemic to date, the Company can give no assurance as to how, in the long term, these and other actions by the U.S. government and GSEs will affect the efficiency, liquidity and stability of the financial and mortgage markets.
Reclassifications
Certain items on the Company’s consolidated balance sheet as of December 31, 2020 have been reclassified to conform to the current period’s presentation. In the Company’s 2020 Form 10-K, restricted cash on the consolidated balance sheet as of December 31, 2020 consisted of the cash collateral posted by the Company to its counterparties to cover initial and variation margin related to its financing and derivative instruments, net of any cash collateral received by the Company from its counterparties. Restricted cash has been renamed “cash collateral posted to counterparties” within total assets, and cash collateral of $7,681 posted by counterparties as of December 31, 2020 has been reclassified to “cash collateral posted by counterparties” within total liabilities.
Consolidation and Variable Interest Entities
The consolidated financial statements include the accounts of the Company and the accounts of its majority owned subsidiaries and variable interest entities (“VIE”) for which it is the primary beneficiary. All intercompany accounts and transactions have been eliminated in consolidation.
The Company consolidates a VIE if the Company is determined to be the VIE’s primary beneficiary, which is defined as the party that has both: (i) the power to control the activities that most significantly impact the VIE’s financial performance and (ii) the right to receive benefits or absorb losses that could potentially be significant to the VIE. The Company reconsiders its evaluation of whether to consolidate a VIE on an ongoing basis, based on changes in the facts and circumstances pertaining to the VIE. Though the Company invests in Agency and non-Agency MBS which are generally considered to be interests in VIEs, the Company does not consolidate these entities because it does not meet the criteria to be deemed a primary beneficiary.
The Company consolidates a securitization trust, which has residential mortgage loans included in “mortgage loans held for investment” on its consolidated balance sheet, of which a portion is pledged as collateral for one remaining non-recourse collateralized bond classified within “other liabilities” on its consolidated balance sheet. The Company owns the subordinate class in the trust and has been deemed the primary beneficiary.
Income Taxes
The Company has elected to be taxed as a real estate investment trust ("REIT"(“REIT”) under the Internal Revenue Code of 1986 and the corresponding provisions of state law. To qualify as a REIT, the Company must meet certain tests including investing in primarily real estate-related assets and the required distribution of at least 90% of its annual REIT taxable income to stockholdersshareholders after consideration of its net operating loss ("NOL"(“NOL”) carryforward and not including taxable income retained in its taxable subsidiaries. As a REIT, the Company generally will not be subject to federal income tax on the amount of its income or capital gains that is distributed as dividends to shareholders.
The Company assesses its tax positions for all open tax years and determines whether the Company has any material unrecognized liabilities in accordance with Accounting Standards Codification ("ASC") Topic 740. The Companyand records these liabilities, if any, to the extent they are deemed more likely than not to have been incurred.
Net Income (Loss) Per Common Share
The Company calculates basic net income (loss) per common share by dividing net income (loss) to common shareholders for the period by weighted-average shares of common stock outstanding for that period. The Company did not have any potentially dilutive securities outstanding during the three or nine months ended September 30, 2017March 31, 2021 or September 30, 2016.March 31, 2020.
The Company currently has unvested service-based restricted stock issued and outstanding. Holders of unvested shares of the Company's issued and outstanding restricted common stock are eligible to receive non-forfeitable dividends. As such, these unvested shares of restricted stock are considered participating securities as per ASC Topic 260-10 and therefore are included in the computation of basic net income (loss) per common share using
NOTES TO THE CONSOLIDATED FINANCIAL STATEMENTS
DYNEX CAPITAL, INC.
(amounts in thousands except share data)
the two-class method. Upon vesting, restrictions on transfer expire on each share of restricted stock, and each such share of restricted stock represents one unrestricted share of common stock.
Because the Company's 8.50%Company’s 6.900% Series AC Fixed-to-Floating Rate Cumulative Redeemable Preferred Stock (the “Series AC Preferred Stock”) and 7.625% Series B Cumulative Redeemable Preferred Stock (the “Series B Preferred Stock”) areis redeemable at the Company'sCompany’s option for cash only and may convertconvertible into shares of common stock only upon a change of control of the Company (and subject to other circumstances) as described in Article IIIC of the Company’s Articles of Amendment to the Restated Articles of Incorporation (the “Restated Articles of Incorporation, as amended”), the effect of those shares and their related dividends iswere excluded from the calculation of diluted net income (loss) per common share.share for the periods presented.
Cash
Cash includes unrestricted demand deposits at highly rated financial institutions. The Company’s cash balances fluctuate throughout the year and Cash Equivalentsmay exceed Federal Deposit Insurance Company insured limits from time to time. Although the Company bears risk to amounts in excess of those insured by the FDIC, it does not anticipate any losses as a result due to the financial position and creditworthiness of the depository institutions in which those deposits are held.
Cash and cash equivalents include cash on hand and highly liquid investments with original maturities of three months or less.Collateral Posted To/By Counterparties
Restricted Cash
Restricted cash consists of cash the Company has pledged collateral posted to/by counterparties represents amounts pledged/received to cover initial and variation margin with itsrelated to the Company’s financing and derivative counterparties.instruments.
The Company early adopted Accounting Standards Update ("ASU") No. 2016-18, Statement of Cash Flows (Topic 230) - Restricted Cash, which requires amounts generally described as restricted cash or restricted cash equivalents to be included with cash and cash equivalents when reconciling the beginning of period and end of period total amounts shown on the statement of cash flows. Because this ASU is to be applied retrospectively to each period presented, "net cash and cash equivalents used in financing activities" on the Company's consolidated statement of cash flows for the nine months ended September 30, 2016 now omits "increase in restricted cash" previously reported in the Quarterly Report on Form 10-Q for that period, and that increase is now included within "net increase in cash, cash equivalents, and restricted cash" for that period in order to conform to the current period's presentation.
The following table provides a reconciliation of cash and cash equivalents, and restricted cashposted to counterparties reported on the Company's consolidated balance sheet as of September 30, 2017the period indicated that sum to the total of the same such amounts shown on the Company'sCompany’s consolidated statement of cash flows for the ninethree months ended September 30, 2017:March 31, 2021:
| | | | | | | |
| March 31, 2021 | | |
| Cash | $ | 328,936 | | | |
| Cash collateral posted to counterparties | 49,180 | | | |
| Total cash and cash posted to counterparties shown on consolidated statement of cash flows | $ | 378,116 | | | |
|
| | | | |
| | | September 30, 2017 |
| Cash and cash equivalents | | $ | 117,702 |
|
| Restricted cash | | 43,987 |
|
| Total cash, cash equivalents, and restricted cash shown on consolidated statement of cash flows | | $ | 161,689 |
|
Mortgage-Backed Securities
The Company's investments in Agency and non-Agency RMBS, CMBS, and CMBS IO securities are designated as available-for-sale ("AFS") andCompany’s MBS are recorded at fair value on the Company'sCompany’s consolidated balance sheet. ChangesMBS purchased prior to January 1, 2021 are designated as available for sale (“AFS”) with changes in unrealized gain (loss) on the Company's MBS arefair value reported in other comprehensive income ("OCI"(“OCI”) as an unrealized gain (loss) until itthe investment is sold matures, or is determined to be other than temporarily impaired. Although the Company generally intends to hold its AFS securities until maturity, it may sell any of these securities as part of the overall management of its business.matures. Upon the sale of an AFS security, any unrealized gain or loss is reclassified out of accumulated other comprehensive income ("AOCI"(“AOCI”) into net income as a realized "gain“gain (loss) on sale of investments, net"net” using the specific identification method.
The Company’s MBS pledged as collateral against repurchase agreements and derivative instruments are included in MBS on Effective January 1, 2021, the consolidated balance sheets withCompany elected the fair value option for all MBS purchased on or after that date with changes in fair value reported in net income as “gain (loss) on investments, net”. Management is electing the fair value option so that GAAP net income will reflect the changes in fair value for its future purchases of MBS in a manner consistent with the presentation and timing of the MBS pledgedchanges in fair value of its derivative instruments. Electing the fair value option is increasing as collateral disclosed parenthetically.an industry trend for mortgage REITs who have not elected cash flow hedge accounting. “Gain (loss) on investments, net”, which was titled “fair value adjustments, net” in prior reporting periods, also includes changes in fair value for mortgage loans held for investment for which the Company elected the fair value option effective January 1, 2020.
Interest Income, Premium Amortization, and Discount Accretion.Interest income on MBS is accrued based on the outstanding principal balance (or notional balance in the case of interest-only, or "IO",“IO” securities) and their contractual terms. Premiums andor discounts onassociated with the Company'spurchase of Agency MBS as well as any non-Agency MBS rated 'AA' and higher at the time of purchase are amortized or accreted into interest income over the expectedprojected life of such securities using the effective yield method, and adjustments to premium amortization and discount accretion are made for actual cash payments. The Company may also adjust premium amortization and discount accretion for changes in projected future cash payments. The Company'sCompany’s projections of future cash payments are based on input and analysis received from external sources and internal models and include assumptions about the amount and timing of loan prepayment rates, fluctuations in interest rates, credit losses, and other factors. On at least a
NOTES TO THE CONSOLIDATED FINANCIAL STATEMENTS
DYNEX CAPITAL, INC.
(amounts in thousands except share data)
quarterly basis, the Company reviews and makes any necessary adjustments to its cash flow projections and updates the yield recognized on these assets.
The Company does not estimate future prepayments on its fixed-rate Agency RMBS.
The Company holds certaincurrently hold any non-Agency MBS that hadwere purchased at a discount with credit ratings of less than 'AA' at the time of purchase‘AA’ or were not rated by any of the nationally recognized credit rating agencies. A portionagencies at the time of these non-Agency MBS were purchased at discounts to their par value, which management does not believe to be substantial. The discount is accreted into income over the security's expected life based on management's estimate of the security's projected cash flows. Future changes in the timing of projected cash flows or differences arising between projected cash flows and actual cash flows received may result in a prospective change in the effective yield on those securities.purchase.
Determination of MBS Fair Value.The Company estimates the fair value of the majority of its MBS based upon prices obtained from third-party pricing services and broker quotes. The remainder of the Company'sCompany’s MBS are valued by discounting the estimated future cash flows derived from cash flow models that utilize information such as the security'ssecurity’s coupon rate, estimated prepayment speeds, expected weighted average life, collateral composition, estimated future interest rates, expected losses, and credit enhancements as well as certain other relevant information. ReferPlease refer to Note 5 for further discussion of MBS fair value measurements.
Other-than-Temporary Impairment. AnAllowance for Credit Losses.On at least a quarterly basis, the Company evaluates any MBS is considered impaired when itsdesignated as AFS with a fair value is less than its amortized cost. The Company evaluates all of its impaired MBScost for other-than-temporary impairments ("OTTI") on at least a quarterly basis. An impairment is considered other-than-temporary if: (1) the Company intends to sell the MBS; (2) it is more likely than not that the Company will be required to sell the MBS before its fair value recovers; or (3) the Company does not expect to recover the full amortized cost basis of the MBS.credit losses. If either of the first two conditions is met, the entire amount of the impairment is recognized in earnings. If the impairment is solely due to the inability to fully recover the amortized cost basis, the security is further analyzed to quantify any credit loss, which is the difference between the present value of cash flows expected to be collected on the MBS andis less than its amortized cost. Thecost, the difference is recorded as an allowance for credit loss if any, is thenthrough net income up to and not exceeding the amount that the amortized cost exceeds current fair value. Subsequent changes in credit loss estimates are recognized in earnings whilein the balanceperiod in which they occur. Because the majority of impairmentthe Company’s investments are higher credit quality and most are guaranteed by a GSE, the Company is not likely to have an allowance for credit losses related to other factors is recognized in other comprehensive income.its MBS recorded on its consolidated balance sheet.
Following the recognition of an OTTI through earnings, a new cost basis is established for the security. Any subsequent recoveries in fair value may be accreted back into the amortized cost basis of the MBS on a prospective basis through interest income. Please see Note 2 for additional information related to the Company's evaluation for OTTI.
Repurchase Agreements
The Company'sCompany’s repurchase agreements, which are used to finance its purchases of MBS, are accounted for as secured borrowings under which the Company pledges its securities as collateral to secure a loan, which is equal in value to a specified percentage of the estimated fair value of the pledged collateral. The Company retains beneficial ownership of the pledged collateral.collateral, which is disclosed parenthetically on the Company’s consolidated balance sheets. At the maturity of a repurchase agreement, the Company is required to repay the loan and concurrently receives back its pledged collateral from the lender or, with the consent of the lender, the Company may renew the agreement at the then prevailing financing rate. A repurchase agreement lender may require the Company to pledge additional collateral in the event of a decline in the fair value of the collateral pledged. Repurchase agreement financing is recourse to the Company and the assets pledged. Most of the Company’s repurchase agreements are based on the September 1996 version of the Bond Market Association Master Repurchase Agreement, which generally provides that the lender, as buyer, is responsible for obtaining collateral valuations from a generally recognized source agreed to by both the Company and the lender, or, in an instance when such source is not available, the value determination is made by the lender.
Derivative Instruments
The Company'sAs of March 31, 2021, the Company’s derivative instruments include U.S. Treasury futures, options on U.S. Treasury futures, options on interest rate swaps (“swaptions”) and TBA securities, which are forward contracts for the purchase or sale of generic Agency RMBS commonly referred to as "TBA securities" or "TBA contracts".on a non-specified pool basis. Derivative instruments are accounted forreported at thetheir fair value of their unit of account. Derivative instrumentson the Company’s consolidated balance sheet as derivative assets if in a gain position are reportedor as derivative assets and derivative instrumentsliabilities if in a loss position, are reported as derivative liabilities onat the Company's consolidated balance sheet.end of the period reported. All periodic interest benefits/costs and changes in fair value of derivative instruments, including gains and losses realized upon termination, maturity, or settlement are recorded in "gain“gain (loss) on derivative instruments, net"net” on the Company'sCompany’s consolidated statement of comprehensive income.income (loss). Cash receipts and payments related to derivative instruments are classified in the investing activities section of ourthe consolidated statements of cash flows in accordance with the underlying nature or purpose of the derivative transactions.
Our interest rate swap agreementsThe Company currently has short positions in U.S. Treasury futures contracts, which are privately negotiated invalued based on exchange pricing with daily margin settlements. The Company realizes gains or losses on these contracts upon expiration at an amount equal to the over-the-counter ("OTC") market and the majority of these agreements are centrally cleared through the Chicago Mercantile Exchange ("CME") with the rest being subject to bilateral agreementsdifference between the Company and the swap counterparty. The Company's CME cleared swaps require that the Company post initial margin as determined by the CME, and in addition, variation margin is exchanged, typically in cash, for changes in thecurrent fair value of the CME cleared swaps. Beginning in January 2017, as a resultunderlying asset and the contractual price of a change in the CME's rulebook,futures contract. Daily margin exchanges for the exchange of variation margin for CME cleared swaps is legallyCompany’s U.S. Treasury futures are not considered to be thelegal settlement of the derivative itself as opposed to a pledge of collateral. Accordingly, beginninginstrument.
NOTES TO THE CONSOLIDATED FINANCIAL STATEMENTS
DYNEX CAPITAL, INC.
(amounts in 2017,thousands except share data)
The Company’s options on U.S. Treasury futures provide the Company accountsthe right, but not an obligation, to buy U.S. Treasury futures at a predetermined notional amount and stated term in the future. Options on U.S. Treasury futures are valued based on exchange pricing without daily exchanges of margin amounts. The Company records the premium paid for the daily exchange of variation margin associated with its CME cleared interest rate swapsoption contract as a direct increase or decrease to the carrying value of the related derivative asset or liability. The carrying value of CME cleared interest rate swaps on the Company'sits consolidated balance sheets issheet and adjusts the unsettledbalance for changes in fair value through “gain (loss) on derivative instruments” until the option is exercised or the contract expires. The Company may also purchase swaptions and defer the premium payment until the effective date. The premium payable and underlying swaption are accounted for as a single unit of those instruments.account.
A TBA security is a forward contract (“TBA contract”) for the purchase (“long position”) or sale (“short position”) of a genericnon-specified Agency MBS at a predetermined price with certain principal and interest terms and certain types of collateral, but the particular Agency securities to be delivered are not identified until shortly before the TBA settlement date. The Company executes TBA dollar roll transactions which effectively delay the settlement of a forward purchase of a TBA Agency RMBS by entering into an offsettingaccounts for long and short position (referred to as a "pair off"), net settling the paired-off positions in cash, and simultaneously entering a similar TBA contract for a later settlement date. TBA securities purchased for a forward settlement month are generally priced at a discount relative to TBA securities sold for settlement in the current month. This discount, often referred to as “drop income” is the economic equivalent of net interest income on the underlying Agency securities over the roll period (interest income less implied financing cost).
The Company accounts for TBA securitiesTBAs as derivative instruments because the Company cannot assert that it is probable at inception and throughout the term of an individual TBA contracttransaction that its settlement will result in physical delivery of the underlying Agency RMBS or that the individual TBA contracttransaction will not settle in the shortest time period possible.
Please refer to Note 4 for additional information regarding the Company'sCompany’s derivative instruments as well as Note 5 for information on how the fair value of these instruments areis calculated.
Share-Based Compensation
Pursuant to the Company’s 20092020 Stock and Incentive Plan (the “2020 Plan”), the Company may grant share-based compensation to eligible employees, non-employee directors or consultants or advisersadvisors to the Company, including restricted stock awards, stock options, stock appreciation rights, dividend equivalent rights, performance shares,performance-based and service-based restricted stock units. The Company'sunits, and performance cash awards. Currently, the Company has shares of restricted stock currently issued and outstanding under this plan may be settled only in shares of its common stock, and thereforewhich are treated as equity awards withand recorded at their fair value which is measured atusing the grantclosing stock price on the date and recognized asof the grant. The compensation cost is recognized over the requisite servicevesting period with a corresponding credit to shareholders' equity.shareholders’ equity using the straight-line method. The requisite service period is the period during which an employee is required to provide service in exchangeCompany does not estimate forfeiture rates, but adjusts for an award, which is equivalent to the vesting period specifiedactual forfeitures in the terms of the time-based restricted stock award. None of the Company's restricted stock awards have performance based conditions.periods in which they occur. The Company does not currently have any share-based compensation issued or outstanding other than restricted stock issued to its employees, officers, and directors.
Contingencies
In the normal course of business, there may be various lawsuits, claims, and other contingencies pending against the Company. On a quarterly basis, the Company evaluates whether to establish provisions for estimated losses from those matters. The Company recognizes a liability for a contingent loss when: (a) the underlying causal event has occurred prior to the balance sheet date; (b) it is probable that a loss has been incurred; and (c) there is a reasonable basis for estimating that loss. A liability is not recognized for a contingent loss when it is only possible or remotely possible that a loss has been incurred, however, possible contingent losses shall be disclosed. If the contingent loss (or an additional loss in excess of any accrual) is at least a reasonable possibility and material, then the Company discloses a reasonable estimate of the possible loss or range of loss, if such reasonable estimate can be made. If the Company cannot make a reasonable estimate of the possible material loss, or range of loss, then that fact is disclosed.
RecentAs previously disclosed in the 2020 Form 10-K, the receiver (the “Receiver”) for one of the plaintiffs awarded damages in a judgment (the "DCI Judgment") against Dynex Commercial, Inc. ("DCI"), a subsidiary of a former affiliate of the Company, filed a separate claim in May 2018 against the Company seeking payment of the damages awarded in connection with the DCI Judgment, alleging that the Company breached a litigation cost sharing agreement, as amended (the "Agreement"), that was initially entered into by the Company and DCI in December 2000. On November 21, 2019, the U.S. District Court, Northern District of Texas ("Northern District Court") granted in part and denied in part summary judgment on the Receiver’s claim and the Company’s claim for offset and recoupment. The Northern District Court found that the Company breached the Agreement and therefore must pay damages to the Receiver. The Northern District Court simultaneously granted the Company’s motion for summary judgment finding that DCI also breached the Agreement and that the Company can recover amounts due to it from DCI under the Agreement. The Receiver subsequently filed a claim for damages with the Northern District Court of approximately $12,600, while the Company filed claims for damages ranging
NOTES TO THE CONSOLIDATED FINANCIAL STATEMENTS
DYNEX CAPITAL, INC.
(amounts in thousands except share data)
from $13,300 to $30,600, including interest. The Receiver filed objections (the "Objections") with the Northern District Court to, among other things, the Company recovering amounts incurred prior to entry into the Agreement and amounts incurred under the Agreement after January 31, 2006, including interest, which is the date that DCI’s corporate existence ceased under Virginia law. The Company has disputed the Receiver’s Objections, arguing, among other things, that the Receiver's Objections are not supportable under Virginia law and has further refined its damages claim to range from $15,961 based on simple interest to $22,752 based on a combination of simple and compound interest, which the Company believes is supportable under Virginia law. There have been no material developments in this matter during the three months ended March 31, 2021. After consultation with litigation counsel, the Company believes, based upon information currently available and its evaluation of Virginia law, that the likelihood of loss is not probable, and given the range of potential claims for damages by the Company to offset the Receiver's claims, the amount of possible loss cannot be reasonably estimated, and therefore, no contingent liability has been recorded.
Recently Issued Accounting Pronouncements
The Company evaluates Accounting Standards Updates (“ASU”) issued by the Financial Accounting Standards Board ("FASB"(“FASB”) on at least a quarterly basis to evaluate applicability and significance of any impact on its financial condition and results of operations. There were no accounting pronouncements issued ASU No. 2017-08, Receivables-Nonrefundable Fees and Other Costs, which shortensduring the amortization period for certain callable debt securities held at a premium, requiring the premium to be amortized to the earliest call date. The amendments in this ASUthree months ended March 31, 2021 that are effective for fiscal years, and interim periods within those fiscal years, beginning after December 15, 2018 and early adoption is permitted. The amendments in this Update should be applied using the modified-retrospective transition approach and will require disclosures for the change in accounting principle. The Company does not expect this ASUexpected to have a material impact on the Company's consolidatedCompany’s financial statements.condition or results of operations.
FASB issued ASU No. 2017-12, Derivatives and Hedging (Topic 815): Targeted Improvements to Accounting for Hedging Activities, which contains significant amendments to hedge accounting with the main objective of better aligning an entity’s risk management activities and financial reporting for hedging relationships through changes to both the designation and measurement guidance for qualifying hedging relationships and the presentation of hedge results. To meet that objective, the amendments expand and refine hedge accounting for both non-financial and financial risk components and align the recognition and presentation of the effects of the hedging instrument and the hedged item in the financial statements. This ASU also includes certain targeted improvements to ease the application of current guidance related to the assessment of hedge effectiveness as well as changes to current disclosure requirements. The amendments in this ASU are effective for public business entities for fiscal years beginning after December 15, 2018, and interim periods within those fiscal years, and early adoption is permitted. All transition requirements and elections will be applied to hedging relationships existing on the date of adoption. The effect of adoption will be reflected as of the beginning of the fiscal year of adoption, and the amended presentation and disclosure guidance is required only prospectively. The Company does not currently apply hedge accounting, but is evaluating the impact this ASU would have on its consolidated financial statements if the Company elects to adopt hedge accounting in the future.
NOTE 2 – MORTGAGE-BACKED SECURITIES
The majority of the Company's MBS are pledged as collateral for the Company's secured borrowings. The following tables present the Company’s MBS by investment type as of the dates indicated:
| | | | | | | | | | | | | | | | | | | | | | | | | | | | | |
| March 31, 2021 |
| Agency RMBS | | Agency CMBS | | CMBS IO (1) | | Non-Agency Other | | Total |
| MBS designated as AFS: | | | | | | | | | |
| Par value | $ | 1,651,864 | | | $ | 234,091 | | | $ | 0 | | | $ | 1,354 | | | $ | 1,887,309 | |
| Unamortized premium (discount) | 55,118 | | | 2,975 | | | 352,655 | | | (370) | | | 410,378 | |
| Amortized cost | 1,706,982 | | | 237,066 | | | 352,655 | | | 984 | | | 2,297,687 | |
| Gross unrealized gain | 13,646 | | | 12,551 | | | 14,200 | | | 202 | | | 40,599 | |
| Gross unrealized loss | (24,473) | | | 0 | | | (979) | | | (43) | | | (25,495) | |
| Fair value | 1,696,155 | | | 249,617 | | | 365,876 | | | 1,143 | | | 2,312,791 | |
| | | | | | | | | |
| MBS measured at fair value through net income: | | | | | | | | |
| Par value | $ | 67,692 | | | $ | — | | | $ | — | | | $ | — | | | $ | 67,692 | |
| Unamortized premium (discount) | 850 | | | — | | | — | | | — | | | 850 | |
| Amortized cost | 68,542 | | | — | | | — | | | — | | | 68,542 | |
| Gross unrealized gain | 0 | | | — | | | — | | | — | | | 0 | |
| Gross unrealized loss | (960) | | | — | | | — | | | — | | | (960) | |
| Fair value | 67,582 | | | — | | | — | | | — | | | 67,582 | |
| | | | | | | | | |
| Total as of March 31, 2021 | $ | 1,763,737 | | | $ | 249,617 | | | $ | 365,876 | | | $ | 1,143 | | | $ | 2,380,373 | |
(1) The notional balance for Agency CMBS IO and non-Agency CMBS IO was $11,097,619 and $9,209,025 respectively, as of March 31, 2021.
NOTES TO THE CONSOLIDATED FINANCIAL STATEMENTS
DYNEX CAPITAL, INC.
(amounts in thousands except share data)
|
| | | | | | | | | | | | | | | | | | | | | | | | | | |
| | September 30, 2017 |
| | Par | | Net Premium (Discount) | | Amortized Cost | | Gross Unrealized Gain | | Gross Unrealized Loss | | Fair Value | | WAC (1) |
| CMBS: | | | | | | | | | | | | | |
| Agency | $ | 1,302,237 |
| | $ | 12,688 |
| | 1,314,925 |
| | $ | 6,187 |
| | $ | (13,623 | ) | | 1,307,489 |
| | 2.99 | % |
| Non-Agency | 40,780 |
| | (4,452 | ) | | 36,328 |
| | 2,877 |
| | — |
| | 39,205 |
| | 5.48 | % |
| | 1,343,017 |
| | 8,236 |
| | 1,351,253 |
| | 9,064 |
| | (13,623 | ) | | 1,346,694 |
| | |
CMBS IO (2): | | | | | | | | | | | | | |
| Agency | — |
| | 394,380 |
| | 394,380 |
| | 7,592 |
| | (164 | ) | | 401,808 |
| | 0.63 | % |
| Non-Agency | — |
| | 322,735 |
| | 322,735 |
| | 6,254 |
| | (330 | ) | | 328,659 |
| | 0.61 | % |
| | — |
| | 717,115 |
| | 717,115 |
| | 13,846 |
| | (494 | ) | | 730,467 |
| | |
| RMBS: | | | | | | | | | | | | | |
| Agency fixed-rate | 522,099 |
| | 19,163 |
| | 541,262 |
| | — |
| | (1,903 | ) | | 539,359 |
| | 3.52 | % |
| Agency adjustable-rate | 294,254 |
| | 11,011 |
| | 305,265 |
| | 1,263 |
| | (2,746 | ) | | 303,782 |
| | 3.05 | % |
| Non-Agency | 1,113 |
| | — |
| | 1,113 |
| | 49 |
| | (20 | ) | | 1,142 |
| | 6.75 | % |
| | 817,466 |
| | 30,174 |
| | 847,640 |
| | 1,312 |
| | (4,669 | ) | | 844,283 |
| | |
| | | | | | | | | | | | | |
|
|
| Total AFS securities: | $ | 2,160,483 |
| | $ | 755,525 |
| | $ | 2,916,008 |
| | $ | 24,222 |
| | $ | (18,786 | ) | | $ | 2,921,444 |
| | |
| |
(1) | The weighted average coupon ("WAC") is the gross interest rate of the security weighted by the outstanding principal balance (or by notional balance in the case of an IO security). |
| |
(2) | The notional balance for Agency CMBS IO and non-Agency CMBS IO was $14,253,392 and $11,061,377, respectively, as of September 30, 2017. |
| | | | | | | | | | | | | | | | | | | | | | | | | | | | | |
| December 31, 2020 |
| Agency RMBS | | Agency CMBS | | CMBS IO (1) | | Non-Agency Other | | Total |
| MBS designated as AFS: | | | | | | | | | |
| Par value | $ | 1,839,046 | | | $ | 235,801 | | | $ | 0 | | | $ | 1,499 | | | $ | 2,076,346 | |
| Unamortized premium (discount) | 57,997 | | | 3,152 | | | 378,940 | | | (440) | | | 439,649 | |
| Amortized cost | 1,897,043 | | | 238,953 | | | 378,940 | | | 1,059 | | | 2,515,995 | |
| Gross unrealized gain | 49,348 | | | 19,597 | | | 12,081 | | | 267 | | | 81,293 | |
| Gross unrealized loss | 0 | | | 0 | | | (982) | | | (51) | | | (1,033) | |
| Fair value | 1,946,391 | | | 258,550 | | | 390,039 | | | 1,275 | | | 2,596,255 | |
| | | | | | | | | |
| MBS measured at fair value through net income: | | | | | | | | |
| Par value | $ | — | | | $ | — | | | $ | — | | | $ | — | | | $ | — | |
| Unamortized premium (discount) | — | | | — | | | — | | | — | | | — | |
| Amortized cost | — | | | — | | | — | | | — | | | — | |
| Gross unrealized gain | — | | | — | | | — | | | — | | | — | |
| Gross unrealized loss | — | | | — | | | — | | | — | | | — | |
| Fair value | — | | | — | | | — | | | — | | | — | |
| | | | | | | | | |
| Total as of December 31, 2020 | $ | 1,946,391 | | | $ | 258,550 | | | $ | 390,039 | | | $ | 1,275 | | | $ | 2,596,255 | |
|
| | | | | | | | | | | | | | | | | | | | | | | | | | |
| | December 31, 2016 |
| | Par | | Net Premium (Discount) | | Amortized Cost | | Gross Unrealized Gain | | Gross Unrealized Loss | | Fair Value | | WAC (1) |
| CMBS: | | | | | | | | | | | | | |
| Agency | $ | 1,152,586 |
| | $ | 13,868 |
| | $ | 1,166,454 |
| | $ | 6,209 |
| | $ | (28,108 | ) | | $ | 1,144,555 |
| | 3.12 | % |
| Non-Agency | 79,467 |
| | (6,718 | ) | | 72,749 |
| | 5,467 |
| | — |
| | 78,216 |
| | 4.72 | % |
| | 1,232,053 |
| | 7,150 |
| | 1,239,203 |
| | 11,676 |
| | (28,108 | ) | | 1,222,771 |
| | |
CMBS IO (2): | | | | | | | | | | | | | |
| Agency | — |
| | 411,737 |
| | 411,737 |
| | 3,523 |
| | (3,362 | ) | | 411,898 |
| | 0.67 | % |
| Non-Agency | — |
| | 346,155 |
| | 346,155 |
| | 1,548 |
| | (5,055 | ) | | 342,648 |
| | 0.61 | % |
| | — |
| | 757,892 |
| | 757,892 |
| | 5,071 |
| | (8,417 | ) | | 754,546 |
| | |
| RMBS: | | | | | | | | | | | | | |
| Agency adjustable-rate | $ | 1,157,258 |
| | $ | 57,066 |
| | $ | 1,214,324 |
| | $ | 2,832 |
| | $ | (15,951 | ) | | $ | 1,201,205 |
| | 3.05 | % |
| Non-Agency | 33,572 |
| | (24 | ) | | 33,548 |
| | 64 |
| | (50 | ) | | 33,562 |
| | 3.58 | % |
| | 1,190,830 |
| | 57,042 |
| | 1,247,872 |
| | 2,896 |
| | (16,001 | ) | | 1,234,767 |
| | |
|
|
| | | |
|
| |
|
| | | |
|
| | |
| Total AFS securities: | $ | 2,422,883 |
| | $ | 822,084 |
| | $ | 3,244,967 |
| | $ | 19,643 |
| | $ | (52,526 | ) | | $ | 3,212,084 |
| |
|
|
| |
(1) | The WAC is the gross interest rate of the pool of mortgages underlying the security weighted by the outstanding principal balance (or by notional balance in the case of an IO security). |
| |
(2) | The notional balance for the Agency CMBS IO and non-Agency CMBS IO was $13,106,912 and $10,884,964, respectively, as of December 31, 2016. |
The majority of the Company’s MBS are pledged as collateral for the Company’s repurchase agreements which are disclosed in Note 3. Actual maturities of MBS are affected by the contractual lives of the underlying mortgage collateral, periodic payments of principal, prepayments of principal, and the payment priority structure of the security; therefore, actual maturities are generally shorter than the securities' stated contractual maturities.
The following table presents information regarding the sales included in "loss"gain on sale of investments, net" on the Company'sCompany’s consolidated statements of comprehensive income (loss) for the periods indicated:
| | | | | | | | | | | | | | | | | | | | | | | |
| Three Months Ended |
| March 31, |
| 2021 | | 2020 |
| Proceeds Received | | Realized Gain | | Proceeds Received | | Realized Gain |
| Agency RMBS-designated as AFS | $ | 74,829 | | | $ | 4,697 | | | $ | 1,817,350 | | | $ | 64,094 | |
| Agency CMBS-designated as AFS | 0 | | | 0 | | | 173,684 | | | 20,689 | |
| $ | 74,829 | | | $ | 4,697 | | | $ | 1,991,034 | | | $ | 84,783 | |
|
| | | | | | | | | | | | | | | |
| | Three Months Ended |
| | September 30, |
| | 2017 | | 2016 |
| | Proceeds Received | | Realized Gain (Loss) | | Proceeds Received | | Realized Gain (Loss) |
| Agency RMBS | $ | 393,502 |
| | $ | (5,160 | ) | | $ | — |
| | $ | — |
|
| Agency CMBS | 13,433 |
| | (51 | ) | | — |
| | — |
|
| | $ | 406,935 |
| | $ | (5,211 | ) | | $ | — |
| | $ | — |
|
| | | | | | | | |
| | Nine Months Ended |
| | September 30, |
| | 2017 | | 2016 |
| | Proceeds Received | | Realized Gain (Loss) | | Proceeds Received | | Realized Gain (Loss) |
| Agency RMBS | $ | 716,560 |
| | $ | (12,392 | ) | | $ | 54,178 |
| | $ | (3,010 | ) |
| Agency CMBS | 206,993 |
| | 523 |
| | — |
| | — |
|
| Non-Agency CMBS | 35,705 |
| | 1,199 |
| | 33,640 |
| | (1,228 | ) |
| Non-Agency RMBS | 16,407 |
| | 42 |
| | — |
| | — |
|
| | $ | 975,665 |
| | $ | (10,628 | ) | | $ | 87,818 |
| | $ | (4,238 | ) |
The following table presents certain information for those MBSthe AFS securities in an unrealized loss position as of the dates indicated:
NOTES TO THE CONSOLIDATED FINANCIAL STATEMENTS
DYNEX CAPITAL, INC.
(amounts in thousands except share data)
| | | | September 30, 2017 | | December 31, 2016 | | March 31, 2021 | | December 31, 2020 |
| | Fair Value | | Gross Unrealized Losses | | # of Securities | | Fair Value | | Gross Unrealized Losses | | # of Securities | | Fair Value | | Gross Unrealized Losses | | # of Securities | | Fair Value | | Gross Unrealized Losses | | # of Securities |
| Continuous unrealized loss position for less than 12 months: | | | | | | | | | Continuous unrealized loss position for less than 12 months: | | | | | | | | | | | |
| Agency MBS | $ | 1,377,438 |
| | $ | (13,201 | ) | | 76 | | $ | 1,738,094 |
| | $ | (38,469 | ) | | 133 | Agency MBS | $ | 1,446,354 | | | $ | (25,019) | | | 32 | | $ | 19,266 | | | $ | (399) | | | 19 |
| Non-Agency MBS | 38,979 |
| | (151 | ) | | 6 | | 205,484 |
| | (2,773 | ) | | 48 | Non-Agency MBS | 5,221 | | | (111) | | | 5 | | 33,417 | | | (408) | | | 23 |
| | | | | | | | | | |
| Continuous unrealized loss position for 12 months or longer: | | | | | | | | | Continuous unrealized loss position for 12 months or longer: | |
| Agency MBS | $ | 206,045 |
| | $ | (5,236 | ) | | 17 | | $ | 427,405 |
| | $ | (8,952 | ) | | 72 | Agency MBS | $ | 846 | | | $ | (224) | | | 5 | | $ | 749 | | | $ | (133) | | | 2 |
| Non-Agency MBS | 15,749 |
| | (199 | ) | | 11 | | 81,660 |
| | (2,332 | ) | | 26 | Non-Agency MBS | 5,029 | | | (140) | | | 8 | | 2,156 | | | (93) | | | 5 |
BecauseThe unrealized losses on the Company’s MBS were the result of declines in market prices and were not credit related; therefore the Company’s allowance for credit losses on its MBS designated as AFS was $0 as of March 31, 2021. The principal related to Agency MBS is guaranteed by the government-sponsored entitiesGSEs Fannie Mae and Freddie Mac which have the implicit guarantee of the U.S. government, the Company does not consider any of the unrealized
losses on its Agency MBS to be credit related.Mac. Although the unrealized losses are not credit related, the Company assesses its ability and intent to hold any Agency MBS with an unrealized loss until the recovery in its value in accordance with GAAP. This assessment is based on the amount of the unrealized loss and significance of the related investment as well as the Company’s leverage and liquidity position. Based on this analysis,In addition, for its non-Agency MBS, the Company has determined that the unrealized losses on its Agency MBS as of September 30, 2017 and December 31, 2016 were temporary.
The Company reviews any non-Agency MBS in an unrealized loss position to evaluate whether any decline in fair value represents an OTTI. The evaluation includes a review of the credit ratings, of the non-Agency MBS, the credit characteristics of the mortgage loans collateralizing these securities, and the estimated future cash flows including projected collateral losses. The Company performed this evaluation for its non-Agency MBS in an unrealized loss position and has determined that there have not been any adverse changes in the timing or amount of estimated future cash flows that necessitate a recognition of OTTI amounts as of September 30, 2017 or December 31, 2016.
NOTE 3 – REPURCHASE AGREEMENTS
The Company’s repurchase agreements outstanding as of September 30, 2017March 31, 2021 and December 31, 20162020 are summarized in the following tables:
| | | | | | | | | | | | | | | | | | | | | | | | | | | | | | | | | | | | | | |
| | | March 31, 2021 | | December 31, 2020 |
| Collateral Type | | Balance | | Weighted
Average Rate | | Fair Value of
Collateral Pledged | | Balance | | Weighted
Average Rate | | Fair Value of
Collateral Pledged |
| Agency RMBS | | $ | 1,499,034 | | | 0.16 | % | | $ | 1,568,623 | | | $ | 1,874,176 | | | 0.23 | % | | $ | 1,973,608 | |
| Agency CMBS | | 234,228 | | | 0.16 | % | | 246,936 | | | 237,649 | | | 0.23 | % | | 255,741 | |
| Agency CMBS IO | | 191,882 | | | 0.78 | % | | 228,854 | | | 209,393 | | | 0.90 | % | | 243,042 | |
| Non-Agency CMBS IO | | 106,945 | | | 1.01 | % | | 128,920 | | | 115,945 | | | 1.28 | % | | 136,684 | |
| Total repurchase agreements | | $ | 2,032,089 | | | 0.26 | % | | $ | 2,173,333 | | | $ | 2,437,163 | | | 0.34 | % | | $ | 2,609,075 | |
|
| | | | | | | | | | | | | | | | | | | | | | |
| | | September 30, 2017 | | December 31, 2016 |
| Collateral Type | | Balance | | Weighted Average Rate | | Fair Value of Collateral Pledged | | Balance | | Weighted Average Rate | | Fair Value of Collateral Pledged |
| Agency CMBS | | $ | 1,188,230 |
| | 1.31 | % | | $ | 1,250,575 |
| | $ | 1,005,726 |
| | 0.82 | % | | $ | 1,095,002 |
|
| Non-Agency CMBS | | 15,625 |
| | 2.14 | % | | 18,365 |
| | 66,881 |
| | 1.63 | % | | 77,840 |
|
| Agency CMBS IO | | 336,187 |
| | 2.06 | % | | 389,637 |
| | 346,892 |
| | 1.57 | % | | 407,481 |
|
| Non-Agency CMBS IO | | 279,981 |
| | 2.15 | % | | 327,976 |
| | 291,199 |
| | 1.67 | % | | 341,139 |
|
| Agency RMBS | | 695,841 |
| | 1.31 | % | | 727,727 |
| | 1,157,302 |
| | 0.82 | % | | 1,191,147 |
|
| Non-Agency RMBS | | — |
| | — | % | | — |
| | 26,149 |
| | 1.98 | % | | 31,952 |
|
| Securitization financing bond | | 3,366 |
| | 2.58 | % | | 3,723 |
| | 4,803 |
| | 2.00 | % | | 5,278 |
|
| Total repurchase agreements | | $ | 2,519,230 |
| | 1.51 | % | | $ | 2,718,003 |
| | $ | 2,898,952 |
| | 1.03 | % | | $ | 3,149,839 |
|
The amounts for fair value of collateral pledged in the table above as of December 31, 2020 include securities with an amortized cost of $141,215 which were sold but not settled as of that date, and for which the proceeds of $150,432 are recorded within “receivable for sales pending settlement” on the consolidated balance sheet. These securities collateralized $140,612 of the Company’s repurchase agreement borrowings outstanding as of December 31, 2020. The Company also had $24,455 and $5 payable to counterparties as of March 31, 2021 and December 31, 2020, respectively, for purchases pending settlement as of those respective dates. The Company had repurchase agreement borrowings outstanding with 20 different counterparties as of March 31, 2021, and its equity at risk did not exceed 5% with any counterparty as of that date.
The following table provides information on the remaining term to maturity and original term to maturity for the Company'sCompany’s repurchase agreements as of the periodsdates indicated:
NOTES TO THE CONSOLIDATED FINANCIAL STATEMENTS
DYNEX CAPITAL, INC.
(amounts in thousands except share data)
| | | | | September 30, 2017 | | December 31, 2016 | | March 31, 2021 | | December 31, 2020 |
| Remaining Term to Maturity | | Balance | | WAVG Original Term to Maturity | | Balance | | WAVG Original Term to Maturity | Remaining Term to Maturity | | Balance | | Weighted
Average Rate | | WAVG Original Term to Maturity | | Balance | | Weighted
Average Rate | | WAVG Original Term to Maturity |
| Less than 30 days | | $ | 1,725,518 |
| | 36 |
| | $ | 2,480,213 |
| | 58 |
| Less than 30 days | | $ | 1,119,808 | | | 0.27 | % | | 24 | | | $ | 1,416,608 | | | 0.37 | % | | 53 | |
| 30 to 90 days | | 793,712 |
| | 89 |
| | 418,739 |
| | 87 |
| 30 to 90 days | | 753,223 | | | 0.28 | % | | 42 | | | 845,394 | | | 0.31 | % | | 35 | |
| 91 to 180 days | | 91 to 180 days | | 159,058 | | | 0.17 | % | | 14 | | | 175,161 | | | 0.22 | % | | 13 | |
| Total | | $ | 2,519,230 |
| | 53 |
| | $ | 2,898,952 |
| | 63 |
| Total | | $ | 2,032,089 | | | 0.26 | % | | 30 | | | $ | 2,437,163 | | | 0.34 | % | | 44 | |
The following table lists the counterparties with whom the Company had over 10% of its shareholders' equity at risk (defined as the excess of collateral pledged over the borrowings outstanding):
|
| | | | | | | | | | | |
| | | September 30, 2017 |
| Counterparty Name | | Balance | | Weighted Average Rate | | Equity at Risk |
| Wells Fargo Bank, N. A. and affiliates | | $ | 349,965 |
| | 2.10 | % | | $ | 57,992 |
|
Of the amount outstandinghas one committed repurchase facility with Wells Fargo Bank, N.A. and affiliates, $343,780 is under a committed repurchase facility whichthat has an aggregate maximum borrowing capacity of $400,000 and is scheduled to mature on May 12, 2019, subject to early termination provisions contained in the master repurchase agreement. The facility is collateralized primarily by CMBS IO, and its$250,000, of which it had $114,251 outstanding at a weighted average borrowing rate of 0.97% as of September 30, 2017 was 2.10%.
As of September 30, 2017,March 31, 2021. The maturity date for the facility is June 11, 2021. The Company is expecting to renew the facility as it has in prior periods and with similar terms. The remaining repurchase facilities available to the Company had repurchase agreement amounts outstandingare uncommitted with 18no guarantee of its 34 available repurchase agreement counterparties. renewal or terms of renewal.
The Company'sCompany’s counterparties, as set forth in the master repurchase agreement with the counterparty, require the Company to comply with various customary operating and financial covenants, including, but not limited to, minimum net worth and earnings, maximum declines in net worth in a given period, and maximum leverage requirements as well as maintaining the Company'sCompany’s REIT status. In addition, some of the agreements contain cross default features, whereby default under an agreement with one lender simultaneously causes default under agreements with other lenders. To the extent that the Company fails to comply with the covenants contained in these financing agreements or is otherwise found to be in default under the terms of such agreements, the counterparty has the right to accelerate amounts due under the master repurchase agreement. The Company believes it was in full compliance with all covenants in master repurchase agreements under which there were amounts outstanding as of September 30, 2017.March 31, 2021.
The Company's repurchase agreements are subject to underlying agreements with master netting or similar arrangements, which provide for the right of offset in the event of default or in the event of bankruptcy of either party to the transactions. The Company reports its repurchase agreements to these arrangements on a gross basis. The following tables present information regarding the Company's repurchase agreements as if the Company had presented them on a net basis as of September 30, 2017March 31, 2021 and December 31, 2016:2020:
| | | | | | | | | | | | | | | | | | | | | | | | | | | | | | | | | | | |
| Gross Amount of Recognized Liabilities | | Gross Amount Offset in the Balance Sheet | | Net Amount of Liabilities Presented in the Balance Sheet | | Gross Amount Not Offset in the Balance Sheet (1) | | Net Amount |
| Financial Instruments Posted as Collateral | | Cash Posted as Collateral |
| March 31, 2021 | | | | | | | | | | | |
| Repurchase agreements | $ | 2,032,089 | | | $ | 0 | | | $ | 2,032,089 | | | $ | (2,032,089) | | | $ | 0 | | | $ | 0 | |
| | | | | | | | | | | |
| December 31, 2020 | | | | | | | | | | | |
| Repurchase agreements | $ | 2,437,163 | | | $ | 0 | | | $ | 2,437,163 | | | $ | (2,437,163) | | | $ | 0 | | | $ | 0 | |
|
| | | | | | | | | | | | | | | | | | | | | | | |
| | Gross Amount of Recognized Liabilities | | Gross Amount Offset in the Balance Sheet | | Net Amount of Liabilities Presented in the Balance Sheet | | Gross Amount Not Offset in the Balance Sheet (1) | | Net Amount |
| Financial Instruments Posted as Collateral | | Cash Posted as Collateral |
| September 30, 2017 | | | | | | | | | | | |
| Repurchase agreements | $ | 2,519,230 |
| | $ | — |
| | $ | 2,519,230 |
| | $ | (2,519,230 | ) | | $ | — |
| | $ | — |
|
| | | | | | | | | | | | |
| December 31, 2016: | | | | | | | | | | | |
| Repurchase agreements | $ | 2,898,952 |
| | $ | — |
| | $ | 2,898,952 |
| | $ | (2,898,952 | ) | | $ | — |
| | $ | — |
|
| |
(1) | Amounts disclosed for collateral received by or posted to the same counterparty include cash and the fair value of MBS up to and not exceeding the net amount of the asset or liability presented in the balance sheet. The fair value of the actual(1) Amounts disclosed for collateral received by or posted to the same counterparty include cash and the fair value of MBS up to and not exceeding the net amount of the repurchase agreement liability presented in the balance sheet. The fair value of the total collateral received by or posted to the same counterparty may exceed the amounts presented. |
Please see Note 4for information related to the Company'sCompany’s derivatives, which are also subject to underlying agreements with master netting or similar arrangements.
NOTES TO THE CONSOLIDATED FINANCIAL STATEMENTS
DYNEX CAPITAL, INC.
(amounts in thousands except share data)
NOTE 4 – DERIVATIVES
Types and Uses of Derivatives Instruments
Interest Rate Derivatives. The Company's derivative instruments includeCompany is currently using short positions in U.S. Treasury futures, put options on U.S. Treasury futures, and interest rate swaps and TBA securities. The Company utilizes interest rate swaps to economically hedge a portion of its exposure to interest rate risk in orderswaptions to mitigate declines in book value resulting from fluctuations in the fair valueimpact of the Company's assets from changing interest rates and to protect some portion of the Company's earnings from rising interest rates. on its book value.
TBA Transactions. The Company investspurchases TBA securities as a means of investing in non-specified fixed-rate Agency RMBS and may also periodically sell TBA securities as a means of economically hedging its book value exposure to Agency RMBS. The Company holds long and short positions in TBA securities forby executing a series of transactions, commonly referred to as “dollar roll” transactions, which effectively delay the settlement of a forward purchase or sale(or sale) of a non-specified Agency RMBS onby entering into an offsetting TBA position, net settling the paired-off positions in cash, and simultaneously entering into an identical TBA long (or short) position with a non-specified pool basis.later settlement date. TBA securities purchased (or sold) for a forward settlement date are forward contracts which are accounted for as derivative instruments; however, management viewsgenerally priced at a discount relative to TBA securities settling in the current month. This discount, often referred to as “drop income” represents the economic equivalent of investingnet interest income (interest income less implied financing cost) on the underlying Agency security from trade date to settlement date. The Company accounts for all TBAs (whether net long or net short positions, or collectively “TBA dollar roll positions”) as derivative instruments because it cannot assert that it is probable at inception and throughout the term of an individual TBA transaction that its settlement will result in and financing genericphysical delivery of the underlying Agency fixed-rate RMBS, throughor that the repurchase agreement markets. Please refer to Note 1individual TBA transaction will not settle in the shortest period possible.
Gain (Loss) on Derivative Instruments, Net
The table below provides detail of the Company’s “gain (loss) on derivative instruments, net” by type of derivative for information related to the Company's accounting policy for its derivative instruments.periods indicated:
| | | | | | | | | | | | | | |
| | Three Months Ended |
| | March 31, |
| Type of Derivative Instrument | | 2021 | | 2020 |
| Interest rate swaps | | $ | 0 | | | $ | (182,181) | |
| Interest rate swaptions | | 57,763 | | | (573) | |
| U.S. Treasury futures | | 95,647 | | | (8,447) | |
| Options on U.S. Treasury futures | | 12,617 | | | (10,727) | |
| TBA securities - long positions | | (58,226) | | | 18,432 | |
| TBA securities - short positions | | 0 | | | (12,071) | |
| Gain (loss) on derivative instruments, net | | $ | 107,801 | | | $ | (195,567) | |
The table below summarizes information about the faircarrying value by type of derivative instrument on the Company'sCompany’s consolidated balance sheets as of the dates indicated:
NOTES TO THE CONSOLIDATED FINANCIAL STATEMENTS
DYNEX CAPITAL, INC.
(amounts in thousands except share data)
|
| | | | | | | | | | |
| | | | | September 30, 2017 | | December 31, 2016 |
| Type of Derivative Instruments | | Balance Sheet Location | | Fair Value | | Fair Value (1) |
| Interest rate swaps | | Derivative assets | | $ | 368 |
| | $ | 28,534 |
|
| TBA securities | | Derivative assets | | — |
| | — |
|
| | | | | $ | 368 |
| | $ | 28,534 |
|
| | | | | | | |
| Interest rate swaps | | Derivative liabilities | | $ | — |
| | $ | (6,922 | ) |
| TBA securities | | Derivative liabilities | | (133 | ) | | — |
|
| | | | | $ | (133 | ) | | $ | (6,922 | ) |
| | | | | | | | | | | | | | | | | | | | | | | | | | |
| Type of Derivative Instrument | | Balance Sheet Location | | Purpose | | March 31, 2021 | | December 31, 2020 |
| U.S. Treasury futures | | Derivative assets | | Economic hedging | | $ | 72,723 | | | $ | — | |
| Options on U.S. Treasury futures | | Derivative assets | | Economic hedging | | 9,180 | | | 1,094 | |
| Interest rate swaptions | | Derivative assets | | Economic hedging | | 27,843 | | | 1,360 | |
| TBA securities | | Derivative assets | | Investing | | — | | | 8,888 | |
| Total derivatives assets | | | | | | $ | 109,746 | | | $ | 11,342 | |
| | | | | | | | |
| Interest rate swaptions | | Derivative liabilities | | Economic hedging | | $ | — | | | $ | (107) | |
| U.S. Treasury futures | | Derivative liabilities | | Economic hedging | | 0 | | | (1,527) | |
| TBA securities | | Derivative liabilities | | Investing | | (19,866) | | | — | |
| Total derivatives liabilities | | | | | | $ | (19,866) | | | $ | (1,634) | |
| |
(1) | Refer to Note 1 regarding information on a change in the CME rulebook. Amounts reported on the consolidated balance sheet as of September 30, 2017 for its interest rate swaps reflect the netting of the derivative asset or liability with the related collateral received or posted, respectively. The net amounts comparable to September 30, 2017 for the derivative asset and derivative liabilities as of December 31, 2016 were $104 and $(576), respectively. |
The following tables present information abouttable provides details on the Company'sCompany’s interest rate swapsswaptions held as of the dates indicated:
| | | | | | | | | | | | | | | | | | | | | | | | | | | | | | | | |
| | Option | | Underlying Payer Swap |
| Average Months to Expiration | | Cost | | Fair Value | | Notional Amount | | Average Fixed Pay Rate | | Average Term in Years |
| As of March 31, 2021: | | | | | | | | | | |
| 6 months or less | | $ | 2,963 | | | $ | 14,208 | | | $ | 250,000 | | | 1.12% | | 10 |
| 6-9 months | | 3,725 | | | 13,635 | | | 250,000 | | | 1.19% | | 10 |
| | $ | 6,688 | | | $ | 27,843 | | | $ | 500,000 | | | 1.16% | | |
| As of December 31, 2020: | | | | | | | | | | |
| 6 months or less | | $ | 6,312 | | | $ | 1,161 | | | $ | 750,000 | | | 1.02% | | 10 |
| 6-9 months | | 6,688 | | | 92 | | | 500,000 | | | 1.16% | | 10 |
| | $ | 13,000 | | | $ | 1,253 | | | $ | 1,250,000 | | | 1.07% | | |
|
| | | | | | | | | | | | | |
| | | September 30, 2017 |
| | | | | Weighted-Average: | | |
| Years to Maturity: | | Net Notional Amount (1) | | Pay Rate (2) | | Life Remaining (in Years) | | Fair Value |
< 3 years | | $ | 3,110,000 |
| | 1.39 | % | | 0.9 | | $ | 368 |
|
>3 and < 6 years | | 1,160,000 |
| | 1.66 | % | | 4.2 | | — |
|
>6 and < 10 years | | 1,175,000 |
| | 2.45 | % | | 8.1 | | — |
|
| Total | | $ | 5,445,000 |
| | 1.68 | % | | 3.2 | | $ | 368 |
|
| | | | | | | | | |
| | | December 31, 2016 |
| | | | | Weighted-Average: | | |
| Years to Maturity: | | Net Notional Amount (1) | | Pay Rate (2) | | Life Remaining (in Years) | | Fair Value |
< 3 years | | $ | 595,000 |
| | 0.73 | % | | 2.3 | | $ | 4,348 |
|
>3 and < 6 years | | 1,185,000 |
| | 1.47 | % | | 4.3 | | 8,631 |
|
>6 and < 10 years | | 1,250,000 |
| | 2.42 | % | | 8.9 | | 8,633 |
|
| Total | | $ | 3,030,000 |
| | 1.58 | % | | 5.3 | | $ | 21,612 |
|
| |
(1) | The net notional amounts included in the tables above represent pay-fixed interest rate swaps, net of receive-fixed interest rate swaps and include $2,425,000 and $2,725,000 of pay-fixed forward starting interest rate swaps as of September 30, 2017 and December 31, 2016, respectively. |
(2) Excluding forward starting pay-fixed interest rate swaps,The following table provides details on the weighted average pay rate was 1.34%Company’s U.S. Treasury futures and 0.73%options on U.S. Treasury futures held as of September 30, 2017 and December 31, 2016, respectively.the dates indicated:
| | | | | | | | | | | | | | | | | | | | | | | | | | | | | | | | | | | |
| March 31, 2021 | | December 31, 2020: |
| Notional Amount Long (Short) | | Fair Value | | Average Term to Expiration | | Notional Amount Long (Short) | | Fair Value | | Average Term to Expiration |
| Options on U.S. Treasury futures | $ | 250,000 | | | $ | 9,180 | | | 2 months | | $ | 500,000 | | | $ | 1,094 | | | 1 month |
| U.S. Treasury futures | (2,980,000) | | | 72,723 | | | 3 months | | (825,000) | | | (1,527) | | | 2 months |
The following table summarizes information about the Company's long positions in TBA securities as of September 30, 2017:the dates indicated:
| | | | | | | | | | | | | | | | | | |
| | March 31, 2021 | | December 31, 2020 |
| | | | | | | | |
Implied market value (1) | | $ | 2,825,937 | | | | | $ | 1,572,949 | | | |
Implied cost basis (2) | | 2,845,803 | | | | | 1,564,061 | | | |
Net carrying value (3) | | $ | (19,866) | | | | | $ | 8,888 | | | |
(1) Implied market value represents the estimated fair value of the underlying Agency MBS as of the date indicated.
(2) Implied cost basis represents the forward price to be paid for the underlying Agency MBS as of the date indicated.
NOTES TO THE CONSOLIDATED FINANCIAL STATEMENTS
DYNEX CAPITAL, INC.
(amounts in thousands except share data)
|
| | | | | | | | | | | | | | | | |
| | | September 30, 2017 |
| | | Notional Amount (1) | | Cost Basis (2) | | Market Value (3) | | Net Carrying Value (4) |
| 30-year 4.0% TBA securities | | $ | 650,000 |
| | $ | 683,813 |
| | $ | 683,680 |
| | $ | (133 | ) |
| |
(1) | Notional amount represents the par value (or principal balance) of the underlying Agency MBS. |
| |
(2) | Cost basis represents the forward price to be paid for the underlying Agency MBS as if settled. |
| |
(3) | Market value is the current fair value of the TBA contract and represents the estimated fair value of the underlying Agency security as of the end of the period. |
| |
(4) | Net carrying value represents the difference between the market value and the cost basis of the TBA contract as of the end of the period and is included on the consolidated balance sheets within "derivative assets (liabilities)". |
Volume of Activity
The tables below summarize changes in ourthe Company’s derivative instruments for the periods indicated:three months ended March 31, 2021:
| | | | | | | | | | | | | | | | | | | | | | | | | | |
| Type of Derivative Instrument | | Beginning
Notional Amount-Long (Short) | | Additions | | Settlements,
Terminations,
or Pair-Offs | | Ending
Notional Amount-Long (Short) |
| Interest rate swaptions | | 1,250,000 | | | 0 | | | (750,000) | | | 500,000 | |
| U.S. Treasury futures | | (825,000) | | | (4,010,000) | | | 1,855,000 | | | (2,980,000) | |
| Options on U.S. Treasury futures | | 500,000 | | | 1,500,000 | | | (1,750,000) | | | 250,000 | |
| TBA securities | | 1,515,000 | | | 8,065,000 | | | (6,780,000) | | | 2,800,000 | |
|
| | | | | | | | | | | | | | | | |
| Type of Derivative Instrument | | Notional Amount as of December 31, 2016 | | Additions | | Settlements, Terminations, or Pair-Offs | | Notional Amount as of September 30, 2017 |
| Receive-fixed interest rate swaps | | $ | 425,000 |
| | $ | — |
| | $ | (325,000 | ) | | $ | 100,000 |
|
| Pay-fixed interest rate swaps | | 3,455,000 |
| | 3,010,000 |
| | (920,000 | ) | | 5,545,000 |
|
| TBA securities | | — |
| | 3,814,000 |
| | (3,164,000 | ) | | 650,000 |
|
Offsetting
The table below provides detail of the Company's "gain (loss) on derivative instruments, net" by type of derivative for the periods indicated:
|
| | | | | | | | | | | | | | | | |
| | | Three Months Ended | | Nine Months Ended |
| | | September 30, | | September 30, |
| Type of Derivative Instrument | | 2017 | | 2016 | | 2017 | | 2016 |
| Receive-fixed interest rate swaps | | $ | (99 | ) | | $ | (2,976 | ) | | $ | 746 |
| | $ | 11,301 |
|
| Pay-fixed interest rate swaps | | (611 | ) | | 2,555 |
| | (18,799 | ) | | (59,912 | ) |
| TBA securities | | 6,703 |
| | — |
| | 8,419 |
| | — |
|
| Eurodollar futures | | — |
| | 2,830 |
| | — |
| | (13,542 | ) |
| Gain (loss) on derivative instruments, net | | $ | 5,993 |
| | $ | 2,409 |
| | $ | (9,634 | ) | | $ | (62,153 | ) |
There is a net unrealized gain of $450 remaining in AOCI on the Company's consolidated balance sheet as of September 30, 2017 which represents the activity related to interest rate swap agreements while they were previously designated as cash flow hedges, and this amount will be recognized in the Company's net income as an adjustment to "interest expense" over the remaining contractual life of the agreements. The Company estimates a credit of $210 will be reclassified to net income as a reduction of "interest expense" within the next 12 months.
A portion of the Company's interest rate swaps were entered into under bilateral agreements which contain cross-default provisions with other agreements between the parties. In addition, these bilateral agreements contain financial and operational covenants similar to those contained in our repurchase agreements as described in Note 3. The Company was in compliance with all covenants with respect to bilateral agreements under which interest rate swaps were entered into as of September 30, 2017.
The Company's derivatives are subject to underlying agreements with master netting or similar arrangements, which provide for the right of offset in the event of default or in the event of bankruptcy of either party to the transactions. The Company reports its derivative assets and liabilities subject to these arrangements on a gross basis. Please see Note 3 for information related to the Company’s repurchase agreements, which are also subject to underlying agreements with master netting or similar arrangements. The following tables present information regarding those derivative assets and liabilities subject to such arrangements as if the Company had presented them on a net basis as of September 30, 2017March 31, 2021 and December 31, 2016:2020:
| | | | | | | | | | | | | | | | | | | | | | | | | | | | | | | | | | | |
| Offsetting of Assets |
| Gross Amount of Recognized Assets | | Gross Amount Offset in the Balance Sheet | | Net Amount of Assets Presented in the Balance Sheet | | Gross Amount Not Offset in the Balance Sheet (1) | | Net Amount |
| Financial Instruments Received as Collateral | | Cash Received as Collateral |
| March 31, 2021 | | | | | | | | | | | |
| U.S. Treasury futures | $ | 72,723 | | | $ | 0 | | | $ | 72,723 | | | $ | 0 | | | $ | (26,430) | | | $ | 46,293 | |
| Options on U.S. Treasury futures | 9,180 | | | 0 | | | 9,180 | | | 0 | | | 0 | | | 9,180 | |
| Interest rate swaptions | 27,843 | | | 0 | | | 27,843 | | | 0 | | | (27,843) | | | 0 | |
| Derivative assets | $ | 109,746 | | | $ | 0 | | | $ | 109,746 | | | $ | 0 | | | $ | (54,273) | | | $ | 55,473 | |
| December 31, 2020 | | | | | | | | | | | |
| Interest rate swaptions | $ | 1,360 | | | $ | 0 | | | $ | 1,360 | | | $ | (107) | | | $ | 0 | | | $ | 1,253 | |
| Options on U.S. Treasury futures | 1,094 | | | 0 | | | 1,094 | | | 0 | | | 0 | | | 1,094 | |
| TBA securities | 8,888 | | | 0 | | | 8,888 | | | 0 | | | (7,681) | | | 1,207 | |
| Derivative assets | $ | 11,342 | | | $ | 0 | | | $ | 11,342 | | | $ | (107) | | | $ | (7,681) | | | $ | 3,554 | |
NOTES TO THE CONSOLIDATED FINANCIAL STATEMENTS
DYNEX CAPITAL, INC.
(amounts in thousands except share data)
|
| | | | | | | | | | | | | | | | | | | | | | | |
| | Offsetting of Assets |
| | Gross Amount of Recognized Assets | | Gross Amount Offset in the Balance Sheet | | Net Amount of Assets Presented in the Balance Sheet | | Gross Amount Not Offset in the Balance Sheet (1) | | Net Amount |
| Financial Instruments Received as Collateral | | Cash Received as Collateral |
| September 30, 2017 | | | | | | | | | | | |
| Interest rate swaps | $ | 368 |
| | $ | — |
| | $ | 368 |
| | $ | — |
| | $ | — |
| | $ | 368 |
|
| TBA securities | — |
| | — |
| | — |
| | — |
| | — |
| | — |
|
| Derivative assets | $ | 368 |
| | $ | — |
| | $ | 368 |
| | $ | — |
| | $ | — |
| | $ | 368 |
|
| December 31, 2016: | | | | | | | | | | | |
| Interest rate swaps | $ | 28,534 |
| | $ | — |
| | $ | 28,534 |
| | $ | (6,449 | ) | | $ | (22,085 | ) | | $ | — |
|
| TBA securities | — |
| | — |
| | — |
| | — |
| | — |
| | — |
|
| Derivative assets | $ | 28,534 |
| | $ | — |
| | $ | 28,534 |
| | $ | (6,449 | ) | | $ | (22,085 | ) | | $ | — |
|
| | | | | | | | | | | | | | | | | | | | | | | | | | | | | | | | | | | |
| Offsetting of Liabilities |
| Gross Amount of Recognized Liabilities | | Gross Amount Offset in the Balance Sheet | | Net Amount of Liabilities Presented in the Balance Sheet | | Gross Amount Not Offset in the Balance Sheet (1) | | Net Amount |
| Financial Instruments Posted as Collateral | | Cash Posted as Collateral |
| March 31, 2021 | | | | | | | | | | | |
| TBA securities | $ | (19,866) | | | 0 | | | $ | (19,866) | | | $ | 0 | | | $ | 19,866 | | | $ | 0 | |
| Derivative liabilities | $ | (19,866) | | | $ | 0 | | | $ | (19,866) | | | $ | 0 | | | $ | 19,866 | | | $ | 0 | |
| | | | | | | | | | | |
| December 31, 2020 | | | | | | | | | | | |
| U.S. Treasury futures-short positions | $ | (1,527) | | | 0 | | | $ | (1,527) | | | $ | 0 | | | $ | 1,527 | | | $ | 0 | |
| Interest rate swaptions | (107) | | | 0 | | | (107) | | | 107 | | | 0 | | | 0 | |
| Derivative liabilities | $ | (1,634) | | | $ | 0 | | | $ | (1,634) | | | $ | 107 | | | $ | 1,527 | | | $ | 0 | |
|
| | | | | | | | | | | | | | | | | | | | | | | |
| | Offsetting of Liabilities |
| | Gross Amount of Recognized Liabilities | | Gross Amount Offset in the Balance Sheet | | Net Amount of Liabilities Presented in the Balance Sheet | | Gross Amount Not Offset in the Balance Sheet (1) | | Net Amount |
| Financial Instruments Posted as Collateral | | Cash Posted as Collateral |
| September 30, 2017 | | | | | | | | | | | |
| Interest rate swaps | $ | — |
| | $ | — |
| | $ | — |
| | $ | — |
| | $ | — |
| | $ | — |
|
| TBA securities | 133 |
| | — |
| | 133 |
| | — |
| | (63 | ) | | 70 |
|
| Derivative liabilities | $ | 133 |
| | $ | — |
| | $ | 133 |
| | $ | — |
| | $ | (63 | ) | | $ | 70 |
|
| | | | | | | | | | | | |
| December 31, 2016: | | | | | | | | | | | |
| Interest rate swaps | $ | 6,922 |
| | $ | — |
| | $ | 6,922 |
| | $ | (6,913 | ) | | $ | — |
| | $ | 9 |
|
| TBA securities | — |
| | — |
| | — |
| | — |
| | — |
| | — |
|
| Derivative liabilities | $ | 6,922 |
| | $ | — |
| | $ | 6,922 |
| | $ | (6,913 | ) | | $ | — |
| | $ | 9 |
|
| |
(1) | (1) Amounts disclosed for collateral received by or posted to the same counterparty include cash and the fair value of MBS up to and not exceeding the net amount of the asset or liability presented in the balance sheet. The fair value of the actual collateral received by or posted to the same counterparty may exceed the amounts presented. |
Please see Note 3 for information related to the Company'ssame counterparty include cash and the fair value of MBS up to and not exceeding the net amount of the derivative asset or liability presented in the balance sheet. The fair value of the total collateral received by or posted to the same counterparty may exceed the amounts presented. Please refer to the consolidated balance sheets for the total fair value of financial instruments pledged as collateral for derivatives and repurchase agreements, which are also subject to underlying agreements with master nettingis shown parenthetically, and the total cash pledged or similar arrangements.received as collateral which is disclosed in “cash collateral posted to/by counterparties.”
NOTE 5 – FAIR VALUE OF FINANCIAL INSTRUMENTS
ASC Topic 820 defines fairFair value is defined as the price that would be received to sell an asset or paid to transfer a liability in an orderly transaction between market participants at the measurement date. ASC Topic 820 clarifies that fairFair value should beis based on the assumptions market participants would use when pricing an asset or liability and also requires an entity to considerconsiders all aspects of nonperformance risk, including the entity'sentity’s own credit standing, when measuring fair value of a liability. ASC Topic 820 established a valuation hierarchy of three levels as follows:
•Level 1 – Inputs are unadjusted, quoted prices in active markets for identical assets or liabilities as of the measurement date.
•Level 2 – Inputs include quoted prices in active markets for similar assets or liabilities; quoted prices in inactive markets for identical or similar assets or liabilities; or inputs either directly observable or indirectly observable through correlation with market data at the measurement date and for the duration of the instrument’s anticipated life.
•Level 3 – Unobservable inputs are supported by little or no market activity. The unobservable inputs represent management’s best estimate of how market participants would price the asset or liability at the measurement date. Consideration is given to the risk inherent in the valuation technique and the risk inherent in the inputs to the model.
The Company reviews the classification of its financial instruments within the fair value hierarchy on a quarterly basis, and management may conclude that its financial instruments should be reclassified to a different level in the future if a change in type of inputs occurs.
The following table presents the fair value of the Company’s financial instruments segregated by the hierarchy level of the fair value estimate that are measured at fair value on a recurring basisthe Company’s consolidated balance sheet by their valuation hierarchy levels as of the dates indicated:
NOTES TO THE CONSOLIDATED FINANCIAL STATEMENTS
DYNEX CAPITAL, INC.
(amounts in thousands except share data)
|
| | | | | | | | | | | | | | | |
| | September 30, 2017 |
| | Fair Value | | Level 1 - Unadjusted Quoted Prices in Active Markets | | Level 2 - Observable Inputs | | Level 3 - Unobservable Inputs |
| Assets: | | | | | | | |
| Mortgage-backed securities | $ | 2,921,444 |
| | $ | — |
| | $ | 2,913,877 |
| | $ | 7,567 |
|
| Interest rate swaps | 368 |
| | — |
| | 368 |
| | — |
|
| Total assets carried at fair value | $ | 2,921,812 |
| | $ | — |
| | $ | 2,914,245 |
| | $ | 7,567 |
|
| Liabilities: | |
| | |
| | |
| | |
|
| TBA securities | 133 |
| | — |
| | 133 |
| | — |
|
| Total liabilities carried at fair value | $ | 133 |
| | $ | — |
| | $ | 133 |
| | $ | — |
|
| | | | | | | | |
| | December 31, 2016 |
| | Fair Value | | Level 1 - Unadjusted Quoted Prices in Active Markets | | Level 2 - Observable Inputs | | Level 3 - Unobservable Inputs |
| Assets: | | | | | | | |
| Mortgage-backed securities | $ | 3,212,084 |
| | $ | — |
| | $ | 3,201,157 |
| | $ | 10,927 |
|
| Interest rate swaps | 28,534 |
| | — |
| | 28,534 |
| | — |
|
| Total assets carried at fair value | $ | 3,240,618 |
| | $ | — |
| | $ | 3,229,691 |
| | $ | 10,927 |
|
| Liabilities: | | | | | | | |
| Interest rate swaps | $ | 6,922 |
| | $ | — |
| | $ | 6,922 |
| | $ | — |
|
| Total liabilities carried at fair value | $ | 6,922 |
| | $ | — |
|
| $ | 6,922 |
| | $ | — |
|
| | | | | | | | | | | | | | | | | | | | | | | | | | | | | | | | | | | | | | | | | | | | | | | |
| March 31, 2021 | | December 31, 2020 |
| | Fair Value | | Level 1 | | Level 2 | | Level 3 | | Fair Value | | Level 1 | | Level 2 | | Level 3 |
| Assets carried at fair value: | | | | | | | | | | | | | | | |
| MBS | $ | 2,380,373 | | | $ | 0 | | | $ | 2,379,230 | | | $ | 1,143 | | | $ | 2,596,255 | | | $ | 0 | | | $ | 2,594,980 | | | $ | 1,275 | |
| Mortgage loans held for investment | 5,749 | | | 0 | | | 0 | | | 5,749 | | | 6,264 | | | 0 | | | 0 | | | 6,264 | |
| Derivative assets: | | | | | | | | | | | | | | | |
| U.S. Treasury futures | $ | 72,723 | | 72,723 | | | 0 | | | 0 | | | — | | | — | | | — | | | — | |
| Options on U.S. Treasury futures | 9,180 | | | 9,180 | | | 0 | | | 0 | | | 1,094 | | | 1,094 | | | 0 | | | 0 | |
| Interest rate swaptions | 27,843 | | | 0 | | | 27,843 | | | 0 | | | 1,360 | | | 0 | | | 1,360 | | | 0 | |
| TBA securities-long positions | — | | | — | | | — | | | — | | | 8,888 | | | 0 | | | 8,888 | | | 0 | |
| Total assets carried at fair value | $ | 2,495,868 | | | $ | 81,903 | | | $ | 2,407,073 | | | $ | 6,892 | | | $ | 2,613,861 | | | $ | 1,094 | | | $ | 2,605,228 | | | $ | 7,539 | |
| | | | | | | | | | | | | | | |
| Liabilities carried at fair value: | | | | | | | | | | | | | | | |
| U.S. Treasury futures | $ | — | | | $ | — | | | $ | — | | | $ | — | | | $ | 1,527 | | | $ | 1,527 | | | $ | 0 | | | $ | 0 | |
| Interest rate swaptions | — | | | — | | | — | | | — | | | 107 | | | 0 | | | 107 | | | 0 | |
| TBA securities-long positions | 19,866 | | | 0 | | | 19,866 | | | 0 | | | — | | | — | | | — | | | — | |
| Total liabilities carried at fair value | $ | 19,866 | | | $ | 0 | | | $ | 19,866 | | | $ | 0 | | | $ | 1,634 | | | $ | 1,527 | | | $ | 107 | | | $ | 0 | |
The fair value measurements for a majority of the Company's MBS are considered Level 2. These Level 2 securitieswhen there are substantially similar to securities that either are actively tradedtrading or havefor which there has been recently tradedrecent trading activity in their respective markets. The Company determines the fair value of its Level 2 securitiesmarkets and are based on prices received from the Company's primary pricing service as well as other pricing services and brokers. The Company evaluates the third party prices it receives to assess their reasonableness. Although the Company does not adjust third party prices, they may be excludedquotes from use in the determination of a security's fair value if they are significantly different from other observable market data.brokers. In valuing a security, the primary pricing service uses either a market approach, which uses observable prices and other relevant information that is generated by
market transactions of identical or similar securities, or an income approach, which uses valuation techniques to convert future amounts to a single, discounted present value amount. The Company also reviews the prices it receives from its pricing sources as well as the assumptions and inputs utilized in the valuation techniques ofby its primary pricing service.sources for reasonableness. Examples of these observable inputs and assumptions include market interest rates, credit spreads, and projected prepayment speeds, among other things.
The fair value of interest rate swaps are measured using the income approach with the primary input being the forward interest rate swap curve, which is considered an observable input, and thus their fair values are considered Level 2 measurements as of September 30, 2017 and December 31, 2016. The fair value of TBA securities are estimated using methods similar those used to fair value the Company's Level 2 MBS.
The Company owns certainother non-Agency MBS forand mortgage loans that are considered Level 3 assets because there has been no recent trading activity of similar instruments upon which there are not sufficiently recent trades of substantially similar securities, and their fair value measurements are thus considered Level 3.can be measured. The Company determines the fair value of itsfor these Level 3 securitiesassets is measured by discounting the estimated future cash flows derived from cash flow models using significant inputs which are determined by the Company when market observable inputs are not available. Information utilized in those pricing models include the security’s credit rating, coupon rate, estimated prepayment speeds, expected weighted average life, collateral composition, estimated future interest rates, expected credit losses, and credit enhancement as well as certain other relevant information. The Company used a constant prepayment rate assumption of 10%, default rate of 2%, loss severity of 20%, and a discount rate of 7.0% in measuring the fair value of its Level 3 assets as of March 31, 2021. Significant changes in any of these inputs in isolation may result in a significantly different fair value measurement. Level 3 assets are generally most sensitive to the default rate and severity assumptions.
NOTES TO THE CONSOLIDATED FINANCIAL STATEMENTS
DYNEX CAPITAL, INC.
(amounts in thousands except share data)
The activity of the instruments measured at fair value on a recurring basis usingCompany’s Level 3 inputsassets during the three months ended March 31, 2021 is presented in the following tabletable:
| | | | | | | | | | | |
| Three Months Ended |
| March 31, 2021 |
| Other Non-Agency MBS | | Mortgage Loans |
| Balance as of beginning of period | $ | 1,275 | | | $ | 6,264 | |
Change in fair value (1) | (57) | | | (22) | |
| Principal payments | (145) | | | (488) | |
| Accretion (amortization) | 70 | | | (5) | |
| Balance as of end of period | $ | 1,143 | | | $ | 5,749 | |
(1) Change in fair value for mortgage loans is recorded as unrealized gain (loss) in “gain (loss) on investments, net” in net income and change in fair value for other non-Agency MBS is recorded as unrealized gain (loss) in “other comprehensive income”.
U.S. Treasury futures and options on U.S. Treasury futures are valued based on closing exchange prices on these contracts and are classified accordingly as Level 1 measurements. The fair value of interest rate swaptions is based on the period indicated:
|
| | | | | | | | | | | |
| | Level 3 Fair Value |
| | Non-Agency CMBS | | Non-Agency RMBS | | Total |
| Balance as of December 31, 2016 | $ | 9,669 |
| | $ | 1,258 |
| | $ | 10,927 |
|
Unrealized loss included in OCI (1) | (1,422 | ) | | 16 |
| | (1,406 | ) |
| Principal payments | (3,896 | ) | | (133 | ) | | (4,029 | ) |
| Accretion | 2,075 |
| | — |
| | 2,075 |
|
| Balance as of September 30, 2017 | $ | 6,426 |
| | $ | 1,141 |
| | $ | 7,567 |
|
| |
(1) | Amount included in "unrealized gain on available-for-sale investments, net" on consolidated statements of comprehensive income (loss). |
The following table presents a summaryfair value of the carryingunderlying interest rate swap and time remaining until its expiration and is carried on the balance sheet net of any deferred premium to be paid upon expiration. The fair value andof TBA securities is estimated using methods similar those used to fair values ofvalue the Company’s financial instruments as of the dates indicated:Level 2 MBS.
|
| | | | | | | | | | | | | | | |
| | September 30, 2017 | | December 31, 2016 |
| | Carrying Value | | Fair Value | | Carrying Value | | Fair Value |
| Assets: | | | | | | | |
| Mortgage-backed securities | $ | 2,921,444 |
| | $ | 2,921,444 |
| | $ | 3,212,084 |
| | $ | 3,212,084 |
|
Mortgage loans held for investment, net (1) | 16,523 |
| | 13,674 |
| | 19,036 |
| | 15,971 |
|
| Derivative assets | 368 |
| | 368 |
| | 28,534 |
| | 28,534 |
|
| Liabilities: | |
| | |
| | |
| | |
|
Repurchase agreements (2) | $ | 2,519,230 |
| | $ | 2,519,230 |
| | $ | 2,898,952 |
| | $ | 2,898,952 |
|
Non-recourse collateralized financing (1) | 5,706 |
| | 5,722 |
| | 6,440 |
| | 6,357 |
|
| Derivative liabilities | 133 |
| | 133 |
| | 6,922 |
| | 6,922 |
|
| |
(1) | The Company determines the fair value of its mortgage loans held for investment, net and its non-recourse collateralized financing using internally developed cash flow models with inputs similar to those used to estimate the fair value of the Company's Level 3 non-Agency MBS. |
| |
(2) | The carrying value of repurchase agreements generally approximates fair value due to their short term maturities. |
NOTE 6 – SHAREHOLDERS'SHAREHOLDERS’ EQUITY AND SHARE-BASED COMPENSATION
Preferred Stock
Stock. The Company's articles of incorporation authorize the issuance of up to 50,000,000 shares of preferred stock, par value $0.01 per share, of which the Company'sshare. The Company’s Board of Directors has designated 8,000,0006,600,000 shares for issuance as Series C Preferred Stock, of which the Company has 4,460,000 of such shares outstanding as of March 31, 2021. During the first quarter of 2021, the Company redeemed the remaining 2,788,330 outstanding shares of 8.50% Series A Preferred Stock and 7,000,000 shares ofits 7.625% Series B Cumulative Redeemable Preferred Stock (the Series A Preferred Stockat an aggregate redemption price of approximately $25.15 per share, which included accumulated and the Series B Preferred Stock collectively, the "Preferred Stock"). The Company had 2,300,000 shares of its Series A Preferred Stock and 3,365,101 shares of its Series B Preferred Stock issued and outstandingunpaid dividends declared as of September 30, 2017 comparedthe redemption date February 15, 2021. The excess of the $25.00 liquidation price per share over the carrying value of the preferred stock redeemed resulted in a charge of $(2,987) to 2,300,000 shares ofnet income to common shareholders for the three months ended March 31, 2021.
The Series A Preferred Stock and 2,271,937 shares of Series B Preferred Stock as of December 31, 2016.
TheC Preferred Stock has no stated maturity, is not subject to any sinking fund or mandatory redemption, and will remain outstanding indefinitely unless redeemed or otherwise repurchased or converted into common stock pursuant to the terms of the Series C Preferred Stock. The Company's Series A Preferred Stock may be redeemed in whole, or in part, at any time and from time to time at the Company's option at a cash redemption price of $25.00 per share plus any accumulated and unpaid dividends. Except under certain limited circumstances described in Article IIIC of the Company’s Restated Articles of Incorporation, as amended, the Company may not redeem the Series BC Preferred Stock prior to April 30, 2018.15, 2025. On or after April 30, 2018,that date, the Company's Series BC Preferred Stock may be redeemed in whole, or in part, at any time and from time to time at the Company's option at a cash redemption price of $25.00 per share plus any accumulated and unpaid dividends. Because the Series C Preferred Stock is redeemable only at the option of the issuer, it is classified as equity on the Company'sCompany’s consolidated balance sheet.
The Series AC Preferred Stockstock pays a cumulative cash dividend equivalent to 8.50%6.900% of the $25.00 liquidation preference per share each year until April 15, 2025 upon which date and thereafter, the Series B Preferred Stock pays aCompany will pay cumulative cash dividend equivalent to 7.625%dividends at a percentage of the $25.00 liquidation preferencevalue per share each year.equal to an annual floating rate of three-month LIBOR plus a spread of 5.461%. The Company paid its regular quarterly dividends on itsdividend of $0.43125 per share of Series C Preferred Stock for the third quarter on October 16, 2017April 15, 2021 to shareholders of record as of OctoberApril 1, 2017.2021.
Common Stock
Stock. The Company declared a third quarterfollowing table summarizes information regarding monthly dividend declarations on the Company’s common stock dividend of $0.18 perduring the three months ended March 31, 2021:
NOTES TO THE CONSOLIDATED FINANCIAL STATEMENTS
DYNEX CAPITAL, INC.
(amounts in thousands except share that was paid on October 31, 2017 to shareholders of record as of October 3, 2017.data)
2009 | | | | | | | | | | | | | | | | | | | | |
| | Three Months Ended |
| | March 31, 2021 |
| Declaration Date | | Amount Declared | | Record Date | | Payment Date |
| January 13, 2021 | | $ | 0.13 | | | January 25, 2021 | | February 1, 2021 |
| February 11, 2021 | | 0.13 | | | February 22, 2021 | | March 1, 2021 |
| March 11, 2021 | | 0.13 | | | March 22, 2021 | | April 1, 2021 |
Stock and Incentive Plan. Of the 2,500,000 shares of common stock authorized for issuance under its 2009Plans. The Company’s 2020 Stock and Incentive Plan reserves for issuance up to 2,300,000 common shares for eligible employees, non-employee directors, consultants, and advisors to the Company had 785,962 available for issuance asto be granted in the form of September 30, 2017.stock options, restricted stock, restricted stock units, stock appreciation rights, performance units, and performance cash awards. Awards previously granted under the 2018 Plan or any other prior equity plan will remain outstanding and valid in accordance with their terms, but no new awards will be granted under the 2018 Plan or any other prior equity plan. Total stock-based compensation expense recognized by the Company for the three and nine months ended September 30, 2017March 31, 2021 was $388 and $1,567, respectively,$452 compared to $623 and $2,066$307 for the three and nine months ended September 30, 2016, respectively.
March 31, 2020. The following table presents a rollforward of the restricted stock activity for the periods indicated:
| | | | | | | | | | | | | | | | | | | | | | | |
| Three Months Ended |
| | March 31, 2021 | | March 31, 2020 |
| Shares | | Weighted Average Grant Date Fair Value Per Share | | Shares | | Weighted Average Grant Date Fair Value Per Share |
| Restricted stock outstanding as of beginning of period | 281,761 | | | $ | 14.74 | | | 119,213 | | | $ | 18.56 | |
| Granted | 16,722 | | | 19.03 | | | 67,511 | | | 17.10 | |
| Vested | (59,024) | | | 18.02 | | | (48,569) | | | 19.02 | |
| Restricted stock outstanding as of end of period | 239,459 | | | $ | 14.23 | | | 138,155 | | | $ | 17.69 | |
|
| | | | | | | | | | | | | |
| | Three Months Ended |
| | September 30, |
| | 2017 | | 2016 |
| | Shares | | Weighted Average Grant Date Fair Value Per Share | | Shares | | Weighted Average Grant Date Fair Value Per Share |
| Restricted stock outstanding as of beginning of period | 353,103 |
| | $ | 7.01 |
| | 561,089 |
| | $ | 7.54 |
|
| Restricted stock granted | — |
| | — |
| | — |
| | — |
|
| Restricted stock vested | — |
| | — |
| | — |
| | — |
|
| Restricted stock outstanding as of end of period | 353,103 |
| | $ | 7.01 |
| | 561,089 |
| | $ | 7.54 |
|
| | | | | | | | |
| | Nine Months Ended |
| | September 30, |
| | 2017 | | 2016 |
| | Shares | | Weighted Average Grant Date Fair Value Per Share | | Shares | | Weighted Average Grant Date Fair Value Per Share |
| Restricted stock outstanding as of beginning of period | 553,396 |
| | $ | 7.55 |
| | 696,597 |
| | $ | 8.54 |
|
| Restricted stock granted | 138,166 |
| | 6.76 |
| | 214,878 |
| | 6.28 |
|
| Restricted stock vested | (338,459 | ) | | 7.80 |
| | (350,386 | ) | | 8.76 |
|
| Restricted stock outstanding as of end of period | 353,103 |
| | $ | 7.01 |
| | 561,089 |
| | $ | 7.54 |
|
As of September 30, 2017,March 31, 2021, the grant date fair value of the Company’s remaining nonvested restricted stock is $1,505$2,626 which will be amortized into compensation expense over a weighted average period of 1.52.1 years.
NOTE 7 – SUBSEQUENT EVENTS
Management has evaluated events and circumstances occurring as of and through the date this Quarterly Report on Form 10-Q was filed with the SEC and made available to the public and has determined that there have been no significant events or circumstances that qualify as a "recognized" subsequent event as defined by ASC Topic 855.
Management has determined that the following significant event, which occurred subsequent to September 30, 2017 and before the date this Quarterly Report on Form 10-Q was filed with the SEC and made available to the public, qualifies as a "nonrecognized" subsequent event as defined by ASC Topic 855:
The Company has received $14,078 in net proceeds from at-the-market issuances of 1,956,936 shares of its common stock since September 30, 2017 and $2,169 in net proceeds from at-the-market issuance of 89,313 shares of Series B Preferred Stock.
| |
ITEM 2. | MANAGEMENT'S DISCUSSION AND ANALYSIS OF FINANCIAL CONDITION AND RESULTS OF OPERATIONS |
ITEM 2. MANAGEMENT’S DISCUSSION AND ANALYSIS OF FINANCIAL CONDITION AND RESULTS OF OPERATIONS
The following discussion should be read in conjunction with our unaudited consolidated financial statements and the accompanying notes included in Part 1,I, Item 1. “Financial Statements” in this Quarterly Report on Form 10-Q and our audited consolidated financial statements and the accompanying notes included in Part II, Item 8 in our Annual Report on2020 Form 10-K for the year ended December 31, 2016.10-K. References herein to “Dynex,” the “Company,” “we,” “us,” and “our” include Dynex Capital, Inc. and its consolidated subsidiaries, unless the context otherwise requires. In addition to current and historical information, the following discussion and analysis contains forward-looking statements within the meaning of the Private Securities Litigation Reform Act of 1995. These statements relate to our future business, financial condition or results of operations. For a description of certain factors that may have a significant impact on our future business, financial condition or results of operations, see “Forward-Looking Statements” at the end of this discussion and analysis.
For more information about our business including our operating policies, investment philosophy and strategy, financing and hedging strategies, and other important information, please refer to Part I, Item 1 of our Annual Report on2020 Form 10-K for the year ended December 31, 2016.10-K.
EXECUTIVE OVERVIEW
Company Overview
We areDynex Capital, Inc. is an internally managed mortgage real estate investment trust, or mortgage REIT, which primarily invests in residential and commercial mortgage-backed securities (“MBS”) on a leveraged basis. Our common stock is traded on the New York Stock Exchange ("NYSE")We finance our investments principally with borrowings under the symbol "DX".repurchase agreements. Our objective is to provide attractive risk-adjusted returns to our shareholders over the long term that are reflective of a leveraged, high quality fixed income portfolio with a focus on capital preservation. We seek to provide returns to our shareholders primarily through the payment of regular quarterly dividends and also potentially through capital appreciation.
We also have two series of preferred stock outstanding, our 8.50% Series A Cumulative Redeemable Preferred Stock (the "Series A Preferred Stock") which is traded on the NYSE under the symbol "DXPRA", and our 7.625% Series B Cumulative Redeemable Preferred Stock (the "Series B Preferred Stock") which is traded on the NYSE under the symbol "DXPRB".
We invest in Agency and non-Agency mortgage-backed securities (“MBS”) consisting of residential MBS (“RMBS”), commercial MBS (“CMBS”) and CMBS interest-only ("IO") securities. Agency MBS have a guaranty of principal payment by an agency of the U.S. government or a U.S. government-sponsored entity ("GSE") such as Fannie Mae and Freddie Mac. Non-Agency MBS have no such guaranty of payment. Our investments in non-Agency MBS are generally higher quality senior or mezzanine classes (typically rated 'A' or better by one or more of the nationally recognized statistical rating organizations) because they are typically more liquid (i.e., they are more easily converted into cash either through sales or pledges as collateral for repurchase agreement borrowings) and have less exposure to credit losses than lower-rated non-Agency MBS.
We invest and manage our capital pursuant to Operating Policies approved by our Board of Directors. We use leverage to enhance the returns on our invested capital by pledging our investments as collateral for borrowings such as repurchase agreements as discussed further below. We also use derivative instruments to attempt to mitigate our exposure to adverse changes in interest rates as discussed further below.
RMBS. Our Agency RMBS investments include MBS collateralized by fixed-rate mortgage loans as well as adjustable-rate mortgage loans ("ARMs"), which have interest rates that generally adjust at least annually to an increment over a specified interest rate index. Agency ARMs also include hybrid adjustable-rate mortgage loans ("hybrid ARMs"), which are loans that have a fixed rate of interest for a specified period (typically three to ten years) and then adjust their interest rate at least annually to an increment over a specified interest rate index. Substantially allappreciation of our ARMs reset based on the one-year LIBOR index. We sold the majority of our non-Agency RMBS during the second quarter of 2017 because these investments were within a year of their maturity. We are not currently re-investing capital into non-Agency RMBS due to the lack of available securities of this type with attractive risk-adjusted returns.
In the second quarter of 2017, we began entering into forward contracts for the purchase of TBA securities as a means of investing in and financing non-specified fixed-rate Agency RMBS. A TBA security is a forward contract for the purchase or sale of a fixed-rate Agency MBS at a predetermined price with certain principal and interest terms and certain types of collateral, but the particular Agency securities to be delivered are not identified until shortly before the TBA settlement date. The financing for TBA securities is implied through our use of TBA dollar roll transactions whereby we enter into an offsetting short position, net settle the paired-off positions in cash, and simultaneously enter into a similar TBA contract for a later settlement date. TBA securities purchased for a forward settlement month are generally priced at a discount relative to TBA securities sold for settlement in the current month. This discount, often referred to as “drop income,” is the economic equivalent of net interest income on the underlying Agency securities over the roll period (interest income less implied financing cost). We account for TBA securities as derivative instruments because we cannot assert that it is probable at inception and throughout the term of an individual TBA contract that its settlement will result in physical delivery of the underlying Agency RMBS, or the individual TBA contract will not settle in the shortest time period possible.
CMBS. The majority of our CMBS investments are fixed-rate Agency-issued securities backed by multifamily housing loans. The remainder of our CMBS portfolio contains both Agency and non-Agency issued securities backed by other commercial real estate property types such as office building, retail, hospitality, and health care. Loans underlying CMBS generally are geographically diverse, are fixed-rate, mature in eight to eighteen years and have amortization terms of up to 30 years. Typically these loans have some form of prepayment protection provisions (such as prepayment lock-out) or prepayment compensation provisions (such as yield maintenance or prepayment penalty). Yield maintenance and prepayment penalty requirements are intended to create an economic disincentive for the loans to prepay.
CMBS IO. CMBS IO are interest-only securities issued as part of a CMBS securitization and represent the right to receive a portion of the monthly interest payments (but not principal cash flows) on the unpaid principal balance of the underlying pool of commercial mortgage loans. We invest in both Agency-issued and non-Agency issued CMBS IO. The loans collateralizing CMBS IO pools are very similar in composition to the pools of loans that generally collateralize CMBS as discussed above. Since CMBS IO securities have no principal associated with them, the interest payments received are based on the unpaid principal balance of the underlying pool of mortgage loans, which is often referred to as the notional amount. Most loans in these securities have some form of prepayment protection from early repayment including absolute loan prepayment lock-outs, loan prepayment penalties, or yield maintenance requirements similar to CMBS described above. There are no prepayment protections, however, if the loan defaults and is partially or wholly repaid earlier as a result of loss mitigation actions taken by the underlying loan servicer, and therefore yields on CMBS IO investments are dependent upon the underlying loan performance. Because Agency-issued MBS generally contain higher credit quality loans, Agency CMBS IO are expected to have a lower risk of default than non-Agency CMBS IO. Our CMBS IO investments are investment grade-rated with the majority rated 'AAA' by at least one of the nationally recognized statistical rating organizations.
Financing. We finance our investments primarily through the use of uncommitted repurchase agreements which are provided principally by major financial institutions and broker-dealers. We pledge our MBS as collateral to secure the amounts borrowed from our counterparties. These repurchase agreements generally have original terms to maturity of overnight to six months, though in some instances we may enter into longer-dated maturities depending on market conditions. We pay interest on our repurchase agreement borrowings at a rate usually based on a spread to LIBOR and fixed for the term of the borrowing. Borrowings under these repurchase agreements are renewable at the discretion of our lenders and do not contain guaranteed roll-over terms. One of our repurchase agreement lenders provides a committed repurchase agreement financing facility to us with an aggregate borrowing capacity of $400.0 million that expires in May 2019.
TBA dollar roll transactions require us to post initial margin (though typically the amount is less than the initial margin amount for repurchase agreements) and variation margin for fluctuations in fair value of the TBA securities. These dollar roll transactions have an implied financing rate which changes with market conditions, expected prepayment speeds, and the underlying demand for Agency RMBS in a given delivery period.
Hedging. We currently use interest rate swaps to hedge our exposure to changes in interest rates. Such exposure results from our ownership of hybrid and fixed-rate investments that are financed with repurchase agreements which have significantly shorter maturities than the weighted average life of these investments. Changes in interest rates can impact the market value of our investments and our net interest income, thereby ultimately impacting book value per common share. We frequently adjust
our hedging portfolio based on our expectation of future interest rates, including the absolute level of rates and the slope of the yield curve versus market expectations.
Factors that Affect Our Results of Operations and Financial Condition
Our financial performance is driven principally by the performance of our investment portfolio and related financing and hedging activity. Management focuses on net interest income, net income, comprehensive income, book value per common share, and core net operating income to common shareholders (a non-GAAP measure) as measurements of our financial performance. Our financial performance may be impacted by multiple factors, including but not limited to, macroeconomic conditions, geopolitical conditions, central bank and government policy, the absolute level of interest rates and the relative slope of interest rate curves, changes in market expectations of future interest rates, actual and estimated future prepayment rates on our investments, competition for investments, economic conditions and their impact on the credit performance of our investments, and market required yields as reflected by market spreads. All of these factors are influenced by market forces beyond our control and may be exacerbated during periods of market volatility.
Our performance may also be impacted by other factors such as the availability and cost of financing and the state of the overall credit markets. Reductions in or limitations of financing for our investments could force us to sell assets, potentially at losses particularly if there is a period of stress in the funding markets as was experienced by the industry during the 2008 financial crisis. Other factors that could also impact our business include changes in regulatory requirements, including requirements to qualify for registration under the 1940 Act and REIT requirements.
We believe that regulatory impacts on financial institutions, many of which are our trading and financing counterparties, continue to pose a threat to the overall liquidity in the capital markets. Restrictions on market-making activities of large U.S. financial institutions could result in reduced liquidity in times of market stress. The Federal Reserve has begun curtailing its reinvestment of principal payments received on its Agency RMBS and U.S. Treasury portfolios, which could result in volatile asset prices. Other foreign central bank asset purchases have also favorably impacted asset prices in the U.S., including securities in which we invest. Finally, the market liquidity of our investments and the financing markets could be negatively impacted if the Federal Reserve's Federal Open Market Committee (or "FOMC") suddenly changes market expectations of the target Federal Funds Rate or takes other actions which have the effect of tightening monetary policy.
To complement the performance of our investment portfolio, we regularly review our existing operations to determine whether our investment strategy or business model should change, including through a change in our investment portfolio, our targeted investments, and our risk position. We may also consider reallocating our capital resources to other assets or portfolios that better align with our long-term strategy, expanding our capital base, or merger, acquisition, or divestiture opportunities. We analyze and evaluate potential business opportunities that we identify or are presented to us that might be a strategic fit for our investment strategy or asset allocation or otherwise maximize value for our shareholders. Pursuing such an opportunity or transaction could require us to issue additional equity or debt securities.
For further discussion of the risks inherent in our business model, please see "Liquidity and Capital Resources" within this Item 2 and in Part I, Item 3 of this Quarterly Report on Form 10-Q as well as in Item 1A, "Risk Factors" of Part I of our Annual Report on Form 10-K for the year ended December 31, 2016.
Market Conditions and Recent Activity
Market volatility remained largely subduedEconomic activity continued to recover in the first quarter of 2021 and market conditions materially improved relative to recent quarters. Interest rates and credit markets responded to the improving economic outlook with the 10-year U.S. Treasury rate increasing 82 basis points and spreads on MBS tightening as indicated in the table below. Equity markets also continued their strong performance as evidenced by the S&P 500 Index increasing 6.2% during the thirdfirst quarter of 20172021. As discussed further below, the Company had anticipated and aspositioned its hedging portfolio for strengthening economic activity and a result credit spreads modestly tightened or held steady across most asset classes. Assteepening yield curve, which more than offset the impact of September 30, 2017, market credit spreads in general and in sectors in which we invest were at or near their tightest levels in the last year. Credit spreads for fixed-rate Agency RMBS have lagged other sectors which we believe reflects market concerns over the announced balance sheet reduction by the Federal Reserve and in our view continues to make these securities the most attractive risk-adjusted return in the market. We also believe that the macroeconomican increasing interest rate environment continues to be supportive for RMBS and CMBS. In particular, two major central banks (the Bank of Japan and the European Central Bank) continue to inject liquidity through large scale asset purchases supporting valuations across sectors.
Interest rates were largely unchangedon MBS prices during the quarter but traded in a fairly wide range generally in responsequarter.
| | | | | | | | | | | | | | | | | | | | | | | | | | |
| Investment Type: | | Change in Spreads | | As of
March 31, 2021 | | As of
December 31, 2020 | | | | | | |
Agency RMBS: (1) | | | | | | | | | | | | |
| 2.0% coupon | | (19) | | | (20) | | | (1) | | | | | | | |
| 2.5% coupon | | (14) | | | (16) | | | (2) | | | | | | | |
| 3.0% coupon | | (34) | | | 2 | | | 36 | | | | | | | |
| 3.5% coupon | | (20) | | | 8 | | | 28 | | | | | | | |
| 4.0% coupon | | (40) | | | 11 | | | 51 | | | | | | | |
Agency DUS (Agency CMBS) (2) | | (14) | | | 22 | | | 36 | | | | | | | |
Freddie K AAA IO (Agency CMBS IO) (2) | | (45) | | | 95 | | | 140 | | | | | | | |
AAA CMBS IO (Non-Agency CMBS IO) (2) | | (35) | | | 130 | | | 165 | | | | | | | |
(1) Option adjusted spreads are based on Company estimates using third-party models and market data.
(2) Data represents the spread to shifting economic data. As expected by the markets, the FOMC increased the target Federal Funds Rate by 0.25% in June 2017swap rate on newly issued securities and has now increased the target Federal Funds Rate a full 1.00% to a current targeted range of 1.00% - 1.25% since December 2015. is sourced from JP Morgan.
The chartcharts below showsshow the highest and lowest U.S. Treasury and swap rates during the three months ended September 30, 2017March 31, 2021 as well as the rates as of September 30, 2017March 31, 2021 and June 30, 2017December 31, 2020:
First Quarter 2021 Performance
Our results for the indicated U.S. Treasury securities:
The interest rate swap curve was slightly higher duringfirst quarter of 2021 were driven by the quarteroverall positioning of our assets and volatility was reasonably muted. The chart below shows the highest and lowest swap rates during the three months ended September 30, 2017 as well as the swap rates as of September 30, 2017 and June 30, 2017:
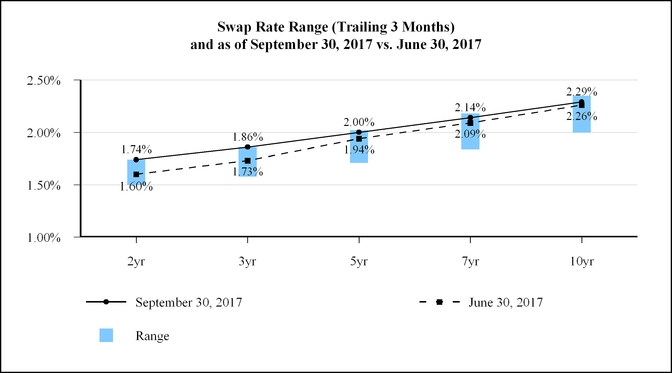
In general, global fundamentals have improved; however, we continue to view the economic environment as fragile for a number of reasons, including high levels of global debt, the uncertain geopolitical environment, and the uncertain regulatory environment, including potential shifts in Federal Reserve policy that could result from leadership changes at the Federal Reserve. We believe these conditions can create an environment of intermittent volatility, and there is potential for a rapid reversal in current monetary policy in the U.S. Given this backdrop, we will continue to invest in high credit quality and highly liquid assetsour hedging for the near term. We also are mindfulpotential performance of potential developments that could impactthose assets, given our view. In particular, changes in inflation or in the expectation of future inflation or performance could cause a sharp increase in volatility and changes in monetary policy.
Highlights of the Third Quarter of 2017
During the third quarter of 2017, we continued to sell lower yielding hybrid ARMs and reallocate capital into 30-year fixed-rate Agency RMBS through the purchase of specified pools and TBA securities. Given the challenging risk environment that currently exists globally, we are focusing on fixed-rate Agency RMBS because their higher liquidity gives us the ability to readjust our risk position more rapidly than other asset classes. Management believes that risk-adjusted returns on fixed-rate Agency RMBS are more favorable than other asset classes, particularly if credit spreads widen in the future. Furthermore, prepayments on fixed-rate Agency RMBS are more predictable than adjustable-rate Agency RMBS, which currently have higher risk of prepayment in the flatsteepening yield curve environment.
curve. Comprehensive income to common shareholders of $0.27$47.2 million, or $1.76 per common share, for the third quarter of 2017 was primarily comprised of net income to common shareholders of $0.15 per common sharerealized and other comprehensive income ("OCI") of $0.12 per common share,unrealized gains from our hedging instruments, which protected the Company's book value. The steepening yield curve resulted primarily from the favorable impact of credit spread tightening onin a decline in the fair value of the majority of MBS as mentioned previously. Inour investment portfolio, but this decline was partially buffered by spread tightening, particularly in the secondlower coupon assets in which we are predominantly invested. We used proceeds from our two capital raises during the first quarter comprehensive income to common shareholders was $0.05purchase investments and adjust our hedge position, which together contributed approximately $0.51 of the increase in book value per common share consisting of net loss to common shareholders of ($0.20) per common share and other comprehensive income ("OCI") of $0.25 per common share. during the first quarter.
Net interest income for the thirdfirst quarter of 20172021 declined approximately 18%$2.2 million compared to the secondprior quarter due to a smaller average balance of 2017lower yielding assets while adjusted net interest income, a non-GAAP measure, was relatively unchanged
from the prior quarter as a result of increasing short-term interest rates, a modest decline in average interest earning assets, and a decrease in prepayment penalty compensationdrop income from CMBS. TheTBA dollar roll positions increased by $2.1 million, mostly offsetting the decline in net interest income was more than offsetincome. We increased our investment activity in TBA securities by gains
on derivative instruments (both TBAs and interest rate swaps) which increased from losses on derivative instruments incurredapproximately 50% during the secondfirst quarter of 2017.2021 as implied funding costs remained lower for TBA dollar roll transactions versus repurchase agreement financing typically used for specified pools. The increase in our leverage including TBA long positions to 6.9 time shareholders’ equity as of March 31, 2021 compared to 6.3 times shareholders’ equity as of December 31, 2020 was primarily due to our increased investment in TBAs during the first quarter.
Core net operating income to common shareholders, (aa non-GAAP measure) was $0.19measure, increased for the first quarter of 2021 by $1.9 million to $12.4 million, or $0.46 per common share, forcompared to the thirdprior quarter of 2017, the same as the second quarter. Drop income from TBA dollar roll transactionsdue to lower general and administrative expenses and lower net periodic interest costs from interest rate swaps offset higher borrowing costs and lower prepayment penalty compensation. Please see "Non-GAAP Financial Measures" at the end of this "Executive Overview" for additional important information about non-GAAP measures.
Book value per common share increased $0.08 to $7.46 as of September 30, 2017 from June 30, 2017 primarily because our investments outperformed our hedgespreferred stock dividends as a result of tightening credit spreads. Economic return on book value was 3.5% for the third quarterredemption of 2017 and 11.4% for the first nine monthsremaining shares of 2017. Economic return on book value is calculated by dividing (i) the sum of dividends declaredour 7.625% Series B Preferred Stock. On a per common share basis, the impact of the $1.9 million increase in core net operating income to common shareholders was mostly offset by an increase in weighted average common shares as a result of the two capital raises during the first quarter.
Current Outlook
We believe market conditions and the outlook for the Company continue to remain favorable. Second quarter projections of U.S. Gross Domestic Product are optimistic, but interest rates remain range-bound and off their recent highs. Borrowing rates remain very low with short-term interest rates near 0%, and market volatility remains somewhat muted given the historic monetary stimulus measures of the Federal Reserve. The Federal Reserve has also indicated that policy will be based on actual outcomes and not projections, which is consistent with their process historically. We believe this could potentially introduce more volatility as market participants adjust to the new policy-making regime. As we have continually noted, markets are more vulnerable to exogenous shocks and the risk for policy mistakes remains high.
For the next few quarters, we believe rates will remain relatively range-bound while longer-term we believe interest rates will likely face pressure from the increased supply of U.S. Treasuries as well as possible increases in real and expected inflation. The Federal Reserve has indicated that the Federal Funds target rate will remain near zero until at least 2023, which means our financing costs should remain at current low levels until then. An environment where borrowing costs are anchored and the yield curve is reasonably steep with rates range-bound supports our ability to generate solid total economic returns to our shareholders. While there are risks that the 10-year Treasury rate moves outside the range we currently expect or there is a sudden change in book value per common share by (ii) beginning book value per common share.Federal Reserve policy, we believe the probability of either occurring in the near-term is relatively low.
Management Outlook
The environmentWe have planned for other potential scenarios that may unfold, including the risk of an exogenous event, which we believe remains conducive to generating net interest income from high quality investments due to low realized volatilityhigh. As a result, we are maintaining a lower leveraged capital structure, a highly liquid position, and a benign outlook for central bank withdrawal of stimulus. We believe that fixed-rateare investing in Agency MBS where the Federal Reserve is providing material support. Also, though we do not expect dollar roll specialness to continue at the same level as what we experienced in the latter half of 2020, we do expect our second quarter results to offer the most attractive relative return currently and will be the predominant marginal use ofbenefit from our capitalcontinued investment in TBA securities. Our target for the foreseeable future. We expect to maintain leverage including TBA securities at cost as if settled at levels modestly higher than where they were atremains between 6-9 times shareholders’ equity, and we will actively increase or decrease leverage based on the endrisk environment and the expected rate of the third quarter of 2017, but we remain concerned about sudden spikes in market volatility and may quickly reduce leverage should conditions warrant. Global central bank policies are the dominating factors for interest rates and credit spreads, and global central banks are seeking to minimize market volatility to encourage recovery in global economic growth. Should market volatility increase, our book value is likely to decline, but we would view this volatility as a potential investment opportunity given our views of expected central bank behavior. Our expectation is that our net interest spread should remain relatively flat for the fourth quarter of 2017, and that performance beyond the fourth quarter of 2017 will be highly dependentreturn on Federal Reserve monetary policy and our hedging strategy.
available assets. Longer term, we maintain our belief that the demographics behind the housing sector continue to believe that the outlook forsupport our business model is very positive. Demographic trendsinvestment thesis of investing in the U.S. are driving a significant increase in household formation, creating more demand in multifamily and single-family housing. As government participation in thehigh quality, highly liquid U.S.-based housing market shrinks, there will be an increased need for private capital and expertise in the housing finance system. Global demographic aging trends are driving demand for assets, that generate income. Fundamentally, this supports the assets in which we invest and also could be a source of capital for us to potentially grow our portfolio. We also intend to capitalize on opportunities for investing capital as government and regulatory policies shift while realizing that such shifts may occur over a period of several years. We will also continue seeking ways to diversify funding sources if the regulatory environment becomes more favorable, and we will also actively managemaintain our hedge instruments to attempt to mitigatefocus on capital preservation while generating returns over the impact on our costs of funds if the Federal Funds rate continues to increase.long term.
Non-GAAP Financial Measures
In addition to the Company's operating results presented in accordance with GAAP, the information presented within Item 2, "Management's Discussion and Analysis of Financial Condition and Results of Operations" of this Quarterly Report on Form 10-Q contains the following non-GAAP financial measures: core net operating income to common shareholders (including per common share), adjusted interest expense, adjusted net interest income and the related metrics adjusted cost of funds andmetric adjusted net interest spread. Management views core net operating income to common shareholders as an estimate of the net interest earnings and drop income from our investments after operating expenses and preferred stock dividends. In addition to the reconciliation set forth below, which derives core net operating income to common shareholders from GAAP net income to common shareholders as the nearest GAAP equivalent measure, core net operating income to common shareholders can also be determined by adjusting net interest income to include interest rate swap periodic interest costs, drop income on TBA securities, general and administrative expenses (GAAP), and preferred dividends. Management includes drop income in core net operating income to common shareholders and in adjusted net interest income because TBA securities are viewed by management as economically equivalent to holding and financing Agency RMBS using short-term repurchase agreements. Management also includes periodic interest costs from its interest rate swaps, which are included in "gain (loss) on derivative instruments" on the
Company's consolidated statements of comprehensive income, in adjusted net interest expense and in adjusted net interest income because interest rate swaps are used by the Company to economically hedge the Company's borrowing costs from repurchase agreements, and including periodic interest costs from interest rate swaps is a helpful indicator of the Company’s total cost of financing in addition to GAAP interest expense. Because these measures are used in the Company's internal analysis of financial and operating performance, management believes that they provide greater transparency to our investors of management's view of our economic performance. Management also believes the presentation of these measures, when analyzed in conjunction with the Company's GAAP operating results, allows investors to more effectively evaluate and compare the performance of the Company to that of its peers. Because these
peers, although the Company's presentation of its non-GAAP financial measures include or exclude, as applicable, certain items usedmay not be comparable to compute GAAPother similarly-titled measures of other companies. Reconciliations of core net operating income to common shareholders GAAPand adjusted net interest income orto the related GAAP financial measures are provided below and within “Results of Operations”.
Management views core net operating income to common shareholders as an estimate of the Company’s financial performance based on the effective yield of its investments, net of financing costs and other normal recurring operating income/expense, net. In addition to the non-GAAP reconciliation set forth below, which derives core net operating income to common shareholders from GAAP comprehensive income (loss) to common shareholders, core net operating income to common shareholders can also be determined by adjusting net interest income to include interest rate swap periodic interest benefit/cost, drop income on TBA securities, general and administrative expenses, and preferred dividends. Drop income generated by TBA dollar roll positions, which is included in "gain (loss) on derivatives instruments, net" on the Company's consolidated statements of comprehensive income, is included in core net operating income and in adjusted net interest income because management views drop income as the economic equivalent of net interest income (interest income less implied financing cost) on the underlying Agency security from trade date to settlement date. Management also includes interest rate swap periodic interest benefit/cost, which is also included in "gain (loss) on derivatives instruments, net", in adjusted net interest income because interest rate swaps are used by the Company to economically hedge the impact of changing interest rates on its borrowing costs from repurchase agreements, and therefore represent a cost of financing in addition to GAAP interest expense,expense. However, these non-GAAP financialmeasures do not provide a full perspective on our results of operations, and therefore, their usefulness is limited. For example, these non-GAAP measures do not include the changes in fair value of investments or changes in fair value of and costs of terminating derivative instruments used by management to economically hedge the impact of changing interest rates on the fair value of the Company’s portfolio and book value per common share. As a result, these non-GAAP measures should be considered as a supplement to, and not as a substitute for, the Company's GAAP results as reported on its consolidated statements of comprehensive income. In addition, because not all companies use identical calculations,
| | | | | | | | | | | | | | |
| | Three Months Ended |
| Reconciliations of GAAP to Non-GAAP Financial Measures: | | March 31, 2021 | | December 31, 2020 |
| ($ in thousands except per share data) | | |
| Comprehensive income to common shareholders | | $ | 47,227 | | | $ | 28,725 | |
| Less: | | | | |
| Change in fair value of available for sale investments | | 60,459 | | | (888) | |
| Loss on investments, net | | 980 | | | 134 | |
Change in fair value of derivative instruments, net (1) | | (99,233) | | | (17,428) | |
| Preferred stock redemption charge | | 2,987 | | | — | |
| Core net operating income to common shareholders | | $ | 12,420 | | | $ | 10,543 | |
| Average common shares outstanding | | 26,788,693 | | | 23,261,542 | |
| Comprehensive income per common share | | $ | 1.76 | | | $ | 1.23 | |
| Core net operating income per common share | | $ | 0.46 | | | $ | 0.45 | |
| | | | |
| GAAP net interest income | | $ | 12,259 | | | $ | 14,416 | |
TBA drop income (2) | | 8,568 | | | 6,445 | |
| Net periodic interest cost of interest rate swaps | | — | | | (7) | |
| Adjusted net interest income | | $ | 20,827 | | | $ | 20,854 | |
| Other operating expense, net | | (380) | | | (205) | |
| General and administrative expenses | | (5,468) | | | (6,853) | |
| Preferred stock dividends | | (2,559) | | | (3,253) | |
| Core net operating income to common shareholders | | $ | 12,420 | | | $ | 10,543 | |
(1) Amount includes unrealized gains and losses from changes in fair value of derivatives and realized gains and losses on terminated derivatives and excludes net periodic interest benefit/cost incurred on effective interest rate swaps outstanding during the Company's presentationperiod and TBA drop income.
(2) TBA drop income is calculated by multiplying the notional amount of non-GAAP financial measures may not be comparable to other similarly-titled measuresthe TBA dollar roll positions by the difference in price between two TBA securities with the same terms but different settlement dates. The impact of other companies.
Schedules reconciling adjusted interest expense andTBA drop income on adjusted net interest income to their related GAAP financial measures are provided within "Resultsspread includes the implied average funding cost of Operations". The following table presents a reconciliation of our GAAP net income (loss) to common shareholders to our core net operating income to common shareholders forTBA dollar roll transactions during the periods presented:indicated.
|
| | | | | | | |
| | Three Months Ended |
| ($ in thousands, except per share amounts) | September 30, 2017 | | June 30, 2017 |
| GAAP net income (loss) to common shareholders | $ | 7,503 |
| | $ | (10,073 | ) |
| Less: | | | |
Accretion of de-designated cash flow hedges (1) | (48 | ) | | (73 | ) |
Change in fair value of derivative instruments, net (2) | (3,222 | ) | | 15,801 |
|
| Loss on sale of investments, net | 5,211 |
| | 3,709 |
|
| Fair value adjustments, net | (23 | ) | | (30 | ) |
| Core net operating income to common shareholders | $ | 9,421 |
| | $ | 9,334 |
|
| |
| |
|
| Weighted average common shares outstanding | 49,832 |
| | 49,218 |
|
| Core net operating income per common share | $ | 0.19 |
| | $ | 0.19 |
|
| |
(1) | Included in GAAP interest expense and relates to the accretion of the balance remaining in accumulated other comprehensive income as a result of our discontinuation of cash flow hedge accounting effective June 30, 2013. |
| |
(2) | Amount represents net realized and unrealized gains and losses on derivatives and excludes net periodic interest costs related to these instruments. |
CRITICAL ACCOUNTING POLICIES
The discussion and analysis of our financial condition and results of operations are based in large part upon our consolidated financial statements, which have been prepared in accordance with GAAP. The preparation of our consolidated financial statements requires management to make estimates, judgments and assumptions that affect the reported amounts of assets, liabilities, revenues and expenses and disclosure of contingent assets and liabilities. We base these estimates and judgments on historical experience and assumptions believed to be reasonable under current facts and circumstances. Actual results, however, may differ from the estimated amounts we have recorded.
Critical accounting policies are defined as those that require management's most difficult, subjective or complex judgments, and which may result in materially different results under different assumptions and conditions. Our accounting policies that require the most significant management estimates, judgments, or assumptions, or that management believes includes the most significant uncertainties, and are considered most critical to our results of operations or financial position relate to fair value measurements, amortization of investment premiums, and other-than-temporary impairments. Our critical accounting policies are discussed in Part II, Item 7, “Management’s Discussion and Analysis of Financial Condition and Results of
Operations” of our Annual Report on Form 10-K for the year ended December 31, 2016 under “Critical Accounting Policies”. There have been no significant changes in our critical accounting policies during the three months ended September 30, 2017.
FINANCIAL CONDITION
Throughout the nine months ended September 30, 2017, we have been deploying available capital into specified and generic fixed-rate Agency RMBS and Agency CMBS. These assets generally have longer durations and higher yields than other assets of similar credit quality which management believes offer better risk-adjusted returns in the current environment. In addition, prepayments on fixed-rate Agency RMBS are more predictable than adjustable-rate Agency RMBS, which currently have a higher risk of prepayment in the flat yield curve environment. Investment Portfolio
The following charts showchart compares the composition of our investmentMBS portfolio including TBA securities as of September 30, 2017 compared to Decemberthe dates indicated:
(1) Includes TBA positions at their implied market value as if settled of $2.8 billion and $1.6 billion, respectively. TBA securities are recorded within “derivative assets (liabilities)” on our consolidated balance sheet at their net carrying value, which represents the difference between the implied market value and the implied cost basis of the TBA security as of the date indicated..
RMBS.As of March 31, 2016:
| |
(1) | Includes TBA securities, which are accounted for as "derivative assets (liabilities)" on our consolidated balance sheet, at their if-settled cost basis as of the end of the period. |
The following table details2021, the activity related to our MBS portfolio during the nine months ended September 30, 2017:
|
| | | | | | | | | | | | | | | | | | | | | | | |
| | Agency CMBS | | Agency RMBS | | CMBS IO (2) | | Non-Agency Other (3) | | Total |
| ($ in thousands) | | 30-Year Fixed (1) | | Adjustable-Rate | | | |
| Balance as of December 31, 2016 | $ | 1,144,555 |
| | $ | — |
| | $ | 1,201,205 |
| | $ | 754,546 |
| | $ | 111,778 |
| | $ | 3,212,084 |
|
| Purchases | 234,094 |
| | 544,050 |
| | — |
| | 71,803 |
| | — |
| | 849,947 |
|
| Principal payments | (45,217 | ) | | (1,549 | ) | | (172,650 | ) | | — |
| | (20,263 | ) | | (239,679 | ) |
| Sales | (37,215 | ) | | (1,111 | ) | | (727,841 | ) | | — |
| | (50,871 | ) | | (817,038 | ) |
| (Amortization) accretion | (3,587 | ) | | (128 | ) | | (8,568 | ) | | (112,580 | ) | | 2,279 |
| | (122,584 | ) |
| Change in fair value | 14,859 |
| | (1,903 | ) | | 11,636 |
| | 16,698 |
| | (2,576 | ) | | 38,714 |
|
| Balance as of September 30, 2017 | $ | 1,307,489 |
| | $ | 539,359 |
| | $ | 303,782 |
| | $ | 730,467 |
| | $ | 40,347 |
| | $ | 2,921,444 |
|
| |
(1) | Does not include TBA securities accounted for as "derivative assets (liabilities)" on our consolidated balance sheet. |
| |
(2) | Includes Agency and non-Agency issued securities. |
| |
(3) | Includes non-Agency CMBS and RMBS. |
We sold over 50%majority of our investments in
adjustable-rateRMBS were Agency-issued pass-through securities collateralized primarily by pools of fixed-rate single-family mortgage loans. Monthly payments of principal and interest made by the individual borrowers on the mortgage loans underlying the pools are "passed through" to the security holders, after deducting GSE or U.S. Government agency guarantee and servicer fees. Mortgage pass-through certificates generally distribute cash flows from the underlying collateral on a pro-rata basis among the security holders. Security holders also receive guarantor advances of principal and interest for delinquent loans in the mortgage pools. In addition to specified pools of Agency RMBS,
since December 31, 2016 as we
expectare also currently investing in TBA securities. Please refer to Notes 1 and 4 of the Notes to the Consolidated Financial Statements for a description of these assets to underperform other asset classestransactions and information regarding their accounting treatment.As noted in the current flat yield curve environment. Duringtable below, as of March 31, 2021, we are invested in lower coupon securities to mitigate the same period, werisk of loss of premiums due to early prepayment. Our lower coupon investments also sold the majority of our non-Agency RMBS because these investments were generally within a year of their expected maturity. We also sold approximately half of our non-Agency CMBS investments because their risk-adjusted returns werehave lower premiums relative to other assets.
higher coupon assets which further protects our earnings when prepayments occur. Our investment in TBA securities has increased relative to prior periods as implied financing rates for dollar roll transactions have been lower than the financing rates for repurchase agreement borrowings we typically use to finance specified pools. Because TBA securities have higher relative liquidity, these transactions allow more flexibility should we decide or find it necessary to reduce leverage.
The following table provides a summary of the amortized cost and fair value oftables compare our investment portfoliofixed-rate Agency RMBS investments including TBA dollar roll positions as of the periodsdates indicated:
|
| | | | | | | | | | | | | | | | |
| | | September 30, 2017 | | December 31, 2016 |
| | | Amortized Cost | | Fair Value | | Amortized Cost | | Fair Value |
| RMBS: | | | |
| | | | |
| Agency RMBS, 30 year fixed-rate | | $ | 541,262 |
| | $ | 539,359 |
| | $ | — |
| | $ | — |
|
TBA securities, 30 year fixed-rate (1) | | 683,813 |
| | 683,680 |
| | — |
| | — |
|
| Agency RMBS - adjustable rate | | 305,265 |
| | 303,782 |
| | 1,214,324 |
| | 1,201,205 |
|
| Non-Agency RMBS | | 1,113 |
| | 1,142 |
| | 33,548 |
| | 33,562 |
|
| | | 1,531,453 |
| | 1,527,963 |
| | 1,247,872 |
| | 1,234,767 |
|
| CMBS and CMBS IO: | | | | | | | | |
| Fixed-rate Agency CMBS | | $ | 1,314,925 |
| | $ | 1,307,489 |
| | $ | 1,166,454 |
| | $ | 1,144,555 |
|
| Non-Agency CMBS | | 36,328 |
| | 39,205 |
| | 72,749 |
| | 78,216 |
|
| Agency CMBS IO | | 394,380 |
| | 401,808 |
| | 411,737 |
| | 411,898 |
|
| Non-Agency CMBS IO | | 322,735 |
| | 328,659 |
| | 346,155 |
| | 342,648 |
|
| | | 2,068,368 |
| | 2,077,161 |
| | 1,997,095 |
| | 1,977,317 |
|
| | | | | | | | | |
| Total MBS portfolio including TBA securities | | $ | 3,599,821 |
| | $ | 3,605,124 |
| | $ | 3,244,967 |
| | $ | 3,212,084 |
|
| |
(1) | TBA securities are accounted for as "derivative assets (liabilities)" on our consolidated balance sheet at their net carrying value which represents the difference between the market value and the cost basis of the TBA contract as of the end of the period. |
| | | | | | | | | | | | | | | | | | | | | | | | | | | | | | | | | | | | | | |
| | March 31, 2021 |
| | Par/Notional-Long (Short) | | Amortized Cost/ Implied Cost Basis (1)(3) | | Fair Value (2)(3) | | Weighted Average |
| Coupon | | | | | Loan Age (in months)(4) | | 3 Month CPR (4)(5) | | Estimated Duration (6) |
| 30-year fixed-rate: | | ($ in thousands) | | | | | | |
| 2.0% | | $ | 664,474 | | | $ | 679,538 | | | $ | 664,294 | | | 10 | | 11.0 | % | | 7.71 |
| 2.5% | | 810,213 | | | 843,779 | | | 833,590 | | | 13 | | 17.8 | % | | 6.33 |
| 4.0% | | 244,868 | | | 252,207 | | | 265,852 | | | 36 | | 39.9 | % | | 3.22 |
| TBA 2.0% | | 1,035,000 | | | 1,040,214 | | | 1,028,661 | | | n/a | | n/a | | 8.10 |
| TBA 2.5% | | 890,000 | | | 910,249 | | | 908,739 | | | n/a | | n/a | | 6.34 |
| 15-year fixed-rate: | | | | | | | | | | | | |
| TBA 1.5% | | 375,000 | | | 375,911 | | | 375,850 | | | n/a | | n/a | | 5.36 |
| TBA 2.0% | | 500,000 | | | 519,430 | | | 512,687 | | | n/a | | n/a | | 4.65 |
| Total | | $ | 4,519,555 | | | $ | 4,621,328 | | | $ | 4,589,673 | | | 15 | | 18.6 | % | | 6.48 | |
CMBS
| | | | | | | | | | | | | | | | | | | | | | | | | | | | | | | | | | | | | | |
| | December 31, 2020 |
| | Par/Notional-Long (Short) | | Amortized Cost/ Implied Cost Basis (1)(3) | | Fair Value (2)(3) | | Weighted Average |
| Coupon | | | | | Loan Age (in months)(4) | | 3 Month CPR (4)(5) | | Estimated Duration (6) |
| 30-year fixed-rate: | | ($ in thousands) | | | | | | |
| TBA 2.0% | | $ | 765,000 | | | $ | 789,945 | | | $ | 792,957 | | | n/a | | n/a | | 4.89 |
| 2.0% | | 620,238 | | | 635,096 | | | 646,744 | | | 8 | | 7.7 | % | | 5.31 |
| 2.5% | | 938,334 | | | 973,116 | | | 995,889 | | | 10 | | 13.5 | % | | 3.53 |
| 4.0% | | 280,474 | | | 288,831 | | | 303,758 | | | 33 | | 46.8 | % | | 2.48 |
| 15-year fixed-rate: | | | | | | | | | | | | |
| TBA 1.5% | | 250,000 | | | 255,068 | | | 257,305 | | | n/a | | n/a | | 4.73 |
| TBA 2.0% | | 500,000 | | | 519,047 | | | 522,687 | | | n/a | | n/a | | 3.09 |
| Total | | $ | 3,354,046 | | | $ | 3,461,103 | | | $ | 3,519,340 | | | 13 | | 17.1 | % | | 4.10 | |
Because Agency CMBS are guaranteed by(1) Implied cost basis of TBAs represents the GSEs with respectforward price to return of principal, our credit exposure is limited to any unamortized premium remaining on those securities. Non-Agency CMBS are not guaranteed and therefore our entire investment is exposed to credit losses frombe paid for the underlying loans collateralizingAgency MBS.
(2) Fair value of TBAs is the CMBS. The following table presentsimplied market value of the parunderlying Agency security as of the end of the period.
(3) TBAs are included on the consolidated balance sheet within “derivative assets/liabilities” at their net carrying value amortizedwhich is the difference between their implied market value and implied cost basis. Please refer to Note 4 of the Notes to the Consolidated Financial Statements for additional information. (4) TBAs are excluded from this calculation as they do not have a defined weighted-average loan balance or age until mortgages have been assigned to the pool.
(5) Constant prepayment rate (“CPR”) represents the 3-month CPR of Agency RMBS held as of date indicated. Securities with no prepayment history are excluded from this calculation.
(6) Duration measures the sensitivity of a security's price to the change in interest rates and weighted average months to estimated maturityrepresents the percent change in price of a security for a 100-basis point increase in interest rates. We calculate duration using third-party financial models and empirical data. Different models and methodologies can produce different estimates of duration for the same securities.
CMBS. Substantially all of our CMBS investments as of March 31, 2021 were fixed-rate Agency-issued securities backed by multifamily housing loans. The loans underlying CMBS are generally fixed-rate with scheduled principal payments generally assuming a 30-year amortization period, but typically requiring balloon payments on average approximately 10 years from origination. These loans typically have some form of prepayment protection provisions (such as prepayment lock-out) or prepayment compensation provisions (such as yield maintenance or prepayment penalty), which provide us compensation if underlying loans prepay prior to us earning our expected return on our investment. Yield
maintenance and prepayment penalty requirements are intended to create an economic disincentive for the dates indicatedloans to prepay, which we believe makes the fair value of CMBS less costly to hedge relative to RMBS.
The following table presents information about our CMBS investments by year of origination:origination as of the dates indicated:
| | | | | | | | | | | | | | | | | | | | | | | | | | | | | | | | | | | | | | | | | | | | | | | |
| March 31, 2021 | | December 31, 2020 |
| ($ in thousands) | Par Value | | Amortized Cost | | Months to Estimated Maturity (1) | | WAC (2) | | Par Value | | Amortized Cost | | Months to Estimated Maturity (1) | | WAC (2) |
| Year of Origination: | | | | | | | | | | | | | | | |
| Prior to 2009 | $ | 8,924 | | | $ | 8,790 | | | 25 | | 5.13 | % | | $ | 9,132 | | | $ | 8,964 | | | 36 | | 5.69 | % |
| 2009 to 2012 | 11,352 | | | 11,968 | | | 44 | | 5.56 | % | | 11,424 | | | 12,085 | | | 65 | | 5.56 | % |
| 2013 to 2014 | 9,811 | | | 9,968 | | | 42 | | 3.29 | % | | 9,865 | | | 10,033 | | | 44 | | 3.61 | % |
| 2015 | 154,333 | | | 155,646 | | | 67 | | 2.85 | % | | 155,760 | | | 157,137 | | | 69 | | 2.85 | % |
| 2017 | 30,882 | | | 31,254 | | | 89 | | 3.18 | % | | 30,907 | | | 31,294 | | | 91 | | 3.18 | % |
| 2019 | 19,702 | | | 19,982 | | | 149 | | 3.12 | % | | 19,702 | | | 19,988 | | | 151 | | 3.12 | % |
| $ | 235,004 | | | $ | 237,608 | | | 73 | | 3.15 | % | | $ | 236,790 | | | $ | 239,501 | | | 77 | | 3.19 | % |
|
| | | | | | | | | | | | | | | | | | | | |
| | September 30, 2017 | | December 31, 2016 |
| ($ in thousands) | Par Value | | Amortized Cost | | Months to Estimated Maturity (1) | | Par Value | | Amortized Cost | | Months to Estimated Maturity (1) |
| Year of Origination: | | | | | | | | | | | |
| 2008 and prior | $ | 41,058 |
| | $ | 37,869 |
| | 38 | | $ | 57,771 |
| | $ | 53,161 |
| | 34 |
| 2009 to 2012 | 135,326 |
| | 138,475 |
| | 26 | | 193,061 |
| | 198,916 |
| | 33 |
| 2013 to 2014 | 20,324 |
| | 20,701 |
| | 85 | | 42,760 |
| | 43,176 |
| | 95 |
| 2015 | 661,113 |
| | 664,321 |
| | 102 | | 683,680 |
| | 687,214 |
| | 111 |
| 2016 | 254,375 |
| | 256,161 |
| | 113 | | 254,781 |
| | 256,736 |
| | 122 |
| 2017 | 230,821 |
| | 233,728 |
| | 119 | | — |
| | — |
| | — |
|
| | $ | 1,343,017 |
| | $ | 1,351,255 |
| | 97 | | $ | 1,232,053 |
| | $ | 1,239,203 |
| | 97 |
| |
(1) | (1) Months to estimated maturity is an average weighted by the amortized cost of the investment. |
(2) The weighted average coupon (“WAC”) is the gross interest rate of the security weighted by the outstanding principal balance.
As
CMBS IO. CMBS IO are interest-only securities issued as part of September 30, 2017,a CMBS securitization and represent the right to receive a portion of the monthly interest payments (but not principal cash flows) on the unpaid principal balance of the underlying pool of commercial mortgage loans. We invest in both Agency-issued and non-Agency issued CMBS IO. The loans collateralizing Agency-issued CMBS IO pools are similar in composition to the pools of loans that collateralize CMBS as discussed above. Non-Agency issued CMBS IO are backed by loans secured by a number of different property types including office buildings, hospitality, and retail, among others. Since CMBS IO securities have no principal associated with them, the interest payments received are based on the unpaid principal balance of the underlying pool of mortgage loans, which is often referred to as the notional amount. Yields on CMBS IO securities are dependent upon the performance of the underlying loans. Similar to CMBS described above, the Company receives prepayment compensation as most loans in these securities have some form of prepayment protection from early repayment; however, there are no prepayment protections if the loan defaults and is partially or wholly repaid earlier because of loss mitigation actions taken by the underlying loan servicer. Because Agency CMBS IO generally contain higher credit quality loans, they have a lower risk of default than non-Agency CMBS IO. The majority of our CMBS IO investments are investment grade-rated with the majority rated ‘AAA’ by at least one of the collateral underlyingnationally recognized statistical rating organizations.
The following table presents our non-Agency CMBS is comprisedIO investments by year of multifamily properties. The portion of our non-Agency CMBS collateralized with single-family rental properties were sold during the second quarter of 2017. The collateral underlying our non-Agency CMBS investments is geographically dispersed in order to mitigate exposure to any particular regionorigination as of the country. dates indicated:
| | | | | | | | | | | | | | | | | | | | | | | | | | | | | | | | | | | |
| March 31, 2021 |
| Agency | | Non-Agency |
| ($ in thousands) | Amortized Cost | | Fair Value | | Remaining WAL (1) | | Amortized Cost | | Fair Value | | Remaining WAL (1) |
| Year of Origination: | | | | | | | | | | | |
| 2010-2012 | $ | 9,043 | | | $ | 8,959 | | | 6 | | | $ | 2,287 | | | $ | 2,250 | | | 6 | |
| 2013 | 19,187 | | | 20,947 | | | 10 | | | 9,541 | | | 9,668 | | | 12 | |
| 2014 | 22,558 | | | 23,344 | | | 19 | | | 46,583 | | | 47,836 | | | 17 | |
| 2015 | 29,555 | | | 30,972 | | | 23 | | | 49,821 | | | 51,594 | | | 24 | |
| 2016 | 21,865 | | | 22,908 | | | 28 | | | 15,899 | | | 16,251 | | | 16 | |
| 2017 | 25,543 | | | 26,818 | | | 39 | | | 7,370 | | | 7,583 | | | 32 | |
| 2018 | 3,715 | | | 3,953 | | | 59 | | | — | | | — | | | — | |
| 2019 | 86,572 | | | 89,661 | | | 57 | | | — | | | — | | | — | |
| 2020 | 3,116 | | | 3,132 | | | 50 | | | — | | | — | | | — | |
| $ | 221,154 | | | $ | 230,694 | | | 37 | | | $ | 131,501 | | | $ | 135,182 | | | 21 | |
| | | | | | | | | | | | | | | | | | | | | | | | | | | | | | | | | | | |
| December 31, 2020 |
| Agency | | Non-Agency |
| ($ in thousands) | Amortized Cost | | Fair Value | | Remaining WAL (1) | | Amortized Cost | | Fair Value | | Remaining WAL (1) |
| Year of Origination: | | | | | | | | | | | |
| 2010-2012 | $ | 12,037 | | | $ | 11,932 | | | 9 | | | $ | 3,237 | | | $ | 3,263 | | | 8 | |
| 2013 | 22,367 | | | 24,165 | | | 13 | | | 10,875 | | | 10,912 | | | 15 | |
| 2014 | 24,841 | | | 25,749 | | | 22 | | | 50,777 | | | 51,175 | | | 20 | |
| 2015 | 31,875 | | | 33,404 | | | 26 | | | 53,176 | | | 54,020 | | | 27 | |
| 2016 | 23,072 | | | 24,203 | | | 31 | | | 16,705 | | | 16,906 | | | 16 | |
| 2017 | 26,493 | | | 27,952 | | | 42 | | | 7,733 | | | 7,808 | | | 34 | |
| 2018 | 3,792 | | | 3,983 | | | 62 | | | — | | | — | | | — | |
| 2019 | 88,757 | | | 91,303 | | | 60 | | | — | | | — | | | — | |
| 2020 | 3,203 | | | 3,264 | | | 53 | | | — | | | — | | | — | |
| $ | 236,437 | | | $ | 245,955 | | | 39 | | | $ | 142,503 | | | $ | 144,084 | | | 24 | |
(1) Remaining weighted average life (“WAL”) represents an estimate of the number of months of contractual cash flows remaining for the investments by year of origination.
The U.S. state with the largest percentage of collateral underlyingweighted average interest coupon rate for our non-Agency CMBS IO was Maryland at 23%0.55% as of September 30, 2017March 31, 2021 and Texas at 16.0%0.56% as of December 31, 2016.
CMBS IO
Income earned from2020. Effective yields on CMBS IO is based on interest payments received onsecurities are dependent upon the performance of the underlying commercial mortgage loan pools.loans. Our return on these investments may be negatively impacted by any changeif the loans default, resulting in scheduled cash flows such as modificationsforeclosures, or liquidations of the mortgage loans or involuntary prepayments including defaults, foreclosures, and liquidations on orloan collateral. Non-Agency-issued securities are generally expected to have a higher risk of the underlying mortgage loans prior to its contractual maturity date. In order to manage our exposure to credit performance, we generally investdefault than Agency CMBS IO. We are mostly invested in senior tranches of these securities and where we have evaluated the credit profile of the underlying loan pool and can monitor credit performance. In addition,performance in order to address changes in market fundamentals and the compositionmitigate our exposure to losses. The majority of mortgage loans collateralizing an investment, we consider the year of origination of the loans underlying CMBS IO in our selection of investments. The following table presents ournon-Agency CMBS IO investments as of September 30, 2017are investment grade-rated with the majority rated ‘AAA’ by year of origination:
|
| | | | | | | | | | | | | | | | | | | | | |
| | September 30, 2017 | | December 31, 2016 |
| ($ in thousands) | Amortized Cost | | Fair Value | | Remaining WAL (1) | | Amortized Cost | | Fair Value | | Remaining WAL (1) |
| Year of Origination: | | | | | | | | | | | |
| 2010 | $ | 7,157 |
| | $ | 7,364 |
| | 15 |
| | $ | 9,456 |
| | $ | 9,858 |
| | 19 |
|
| 2011 | 27,848 |
| | 29,353 |
| | 20 |
| | 35,130 |
| | 36,897 |
| | 23 |
|
| 2012 | 77,728 |
| | 79,667 |
| | 23 |
| | 102,378 |
| | 103,675 |
| | 27 |
|
| 2013 | 109,705 |
| | 111,451 |
| | 29 |
| | 128,891 |
| | 129,011 |
| | 33 |
|
| 2014 | 179,440 |
| | 182,447 |
| | 36 |
| | 201,802 |
| | 200,260 |
| | 39 |
|
| 2015 | 177,176 |
| | 180,448 |
| | 41 |
| | 198,016 |
| | 194,886 |
| | 45 |
|
| 2016 | 84,943 |
| | 86,048 |
| | 48 |
| | 82,219 |
| | 79,959 |
| | 87 |
|
| 2017 | 53,118 |
| | 53,689 |
| | 54 |
| | — |
| | — |
| | — |
|
| | $ | 717,115 |
| | $ | 730,467 |
| | 37 |
| | $ | 757,892 |
| | $ | 754,546 |
| | 42 |
|
(1) Remaining weighted average life ("WAL") represents an estimateat least one of the numbernationally recognized statistical rating organizations. All of monthsour non-Agency CMBS IO were originated prior to 2017, the majority of interest earnings remaining forwhich we believe have had underlying property value appreciation.
Since the investments by yeareconomic impacts of origination.
Approximately 67% of the collateralCOVID-19 began in 2020, servicers are reporting an increase in delinquencies on loans underlying our non-Agency CMBS IO is comprisedand have taken loss mitigation actions including loan forbearance or allowing the borrower to make loan payments using replacement reserve or similar property related funds. Most of retail, office, and multifamily properties as of September 30, 2017, and therethe increases in delinquencies thus far have been no material changes toin the retail and hotel sectors and have nominally impacted cash flows and yields on the securities. Considering the characteristics or distribution of collateral type underlying these securities since December 31, 2016. The collateral underlying our non-Agency CMBS IO investments is geographically dispersed in orderand the actions taken by servicers so far to mitigate exposure towork with borrowers through various relief measures, we have not seen evidence of and do not currently expect a material adverse effect on our future cash flows for non-Agency CMBS IO. However, the ultimate impact of COVID-19 on the global economy and on the loans underlying any particular region of our securities remains uncertain and cannot be predicted at this time.
The property type for the country. The U.S. state with the largest percentage of collateral underlyingloans securing our non-Agency CMBS IO, was California at 14%which has not changed materially since December 31, 2020, are shown in the table below as of September 30, 2017, unchanged comparedMarch 31, 2021:
| | | | | | | | | | | | | | |
| | March 31, 2021 |
| ($ in thousands) | | Fair Value | | Percentage of Portfolio |
| Property Type: | | | | |
| Retail | | $ | 37,567 | | | 27.8 | % |
| Office | | 29,280 | | | 21.7 | % |
| Multifamily | | 23,452 | | | 17.3 | % |
| Hotel | | 18,132 | | | 13.4 | % |
| Mixed use | | 9,117 | | | 6.7 | % |
Other (1) | | 17,634 | | | 13.1 | % |
| Total non-Agency CMBS IO | | $ | 135,182 | | | 100.0 | % |
(1) Other property types collateralizing non-Agency CMBS IO do not comprise more than 5% individually.
Repurchase Agreements
We use leverage to December 31, 2016.
RMBS
In addition to purchasing specified pools of fixed-rate Agency RMBS, we also utilize TBA contracts to purchase generic pools of fixed-rate Agency RMBS. Although these instruments are accountedenhance the returns on our invested capital by pledging our investments as collateral for as derivatives, management views TBA securities as the economic equivalent of investing in and financing generic fixed-rate Agency RMBSborrowings primarily through the use of uncommitted repurchase agreements with major financial institutions and broker-dealers. Repurchase agreements generally have original terms to maturity of overnight to six months, though in some instances we may enter into longer-dated maturities depending on market conditions. We pay interest on our repurchase agreement marketborrowings based on short-term rate indices that historically closely track LIBOR and therefore, evaluatesare fixed for the economics of these transactions in its assessmentterm of the performance of its Agency RMBS portfolio. The following table provides information on our Agency RMBS investments including TBA securities as of September 30, 2017:borrowing.
|
| | | | | | | | | | | | | | | | | | | | | | | | | |
| | | September 30, 2017 |
| | | | | | | | | Weighted Average Based on Par |
| Coupon | | Par | | Fair Value (1)(3) | | Amortized Cost/Cost Basis (2)(3) | | Loan Balance (4) | | Loan Age (in months) (4) | | 3 Month CPR (4)(5) | | Duration (6) |
| ($ in thousands) | | | | | | | | | | | | | | |
| 30-year fixed-rate: | | | | | | | | | | | | | | |
| 3.0% | | $ | 248,773 |
| | $ | 249,981 |
| | $ | 250,632 |
| | $ | 233,336 |
| | 10 |
| | 2.5 | % | | 6.34 |
|
| 4.0% | | 273,326 |
| | 289,378 |
| | 290,630 |
| | 240,621 |
| | 2 |
| | — | % | | 4.38 |
|
| TBA 4.0% | | 650,000 |
| | 683,680 |
| | 683,813 |
| | n/a | | n/a | | n/a | | 3.32 |
|
| Total 30-year fixed-rate | | $ | 1,172,099 |
| | $ | 1,223,039 |
| | $ | 1,225,075 |
| | $ | 237,150 |
| | 6 |
| | 1.2 | % | | 4.21 |
|
| | | | | | | | | | | | | | | |
| Adjustable-rate: | | | | | | | | | | | | | | |
3.1% (7) | | $ | 294,254 |
| | $ | 303,782 |
| | $ | 305,265 |
| | $ | 270,208 |
| | 72 |
| | 17.1 | % | | 2.21 |
|
| | | | | | | | | | | | | | | |
| Total Agency RMBS (including TBA securities) | | $ | 1,466,353 |
| | $ | 1,526,821 |
| | $ | 1,530,340 |
| | $ | 249,066 |
| | 30 |
| | 6.9 | % | | 3.81 |
|
| |
(1) | Fair value of TBA securities is the current market value of the TBA contract and represents the estimated fair value of the underlying Agency security as of the end of the period. |
| |
(2) | Cost basis of TBA securities represents the forward price to be paid for the underlying Agency MBS as if settled. |
| |
(3) | The net carrying value of TBA securities, which is the difference between the market value and the cost basis of the TBA securities, was $(0.1) million as of September 30, 2017 and is included on the consolidated balance sheet within "derivative liabilities". |
| |
(4) | TBAs are excluded from this calculation as they do not have a defined weighted-average loan balance or age until mortgages have been assigned to the pool. |
| |
(5) | Constant prepayment rate ("CPR") represents the 3-month CPR of Agency RMBS held as of date indicated. Securities with no prepayment history are excluded from this calculation. |
| |
(6) | Duration is used to measure the market price volatility as interest rates change using dollar value of one basis point ("DV01") methodology. |
| |
(7) | Coupon of adjustable-rate Agency RMBS represents the weighted average coupon based on amortized cost. |
We did not have any investments in specified or non-specified pools of fixed-rate Agency RMBS as of December 31, 2016.
As mentioned previously, we have been reallocating capital away from adjustable-rate RMBS given the likelihood these investments will underperform in the current flat yield curve environment. We have been allowing and will continuePlease refer to allow this portion of our portfolio to liquidate either on its own through payoffs or by selling when attractive bids are available. The following table provides information on our adjustable-rate RMBS by months to interest rate reset asNote 3 of the dates indicated:Notes to the Consolidated Financial Statements contained within this Quarterly Report on Form 10-Q as well as “Results of Operations” and “Liquidity and Capital Resources” contained within this Item 2 for additional information relating to our repurchase agreement borrowings. |
| | | | | | | | | | | | | | | | | | | | | | | |
| | September 30, 2017 | | December 31, 2016 |
| ($ in thousands) | Par Value | | Amortized Cost | | Fair Value | | Par Value | | Amortized Cost | | Fair Value |
| Adjustable-rate Agency RMBS by MTR: | | | | | | | | | | | |
| 0-12 MTR | $ | 47,126 |
| | $ | 48,440 |
| | $ | 49,580 |
| | $ | 335,476 |
| | $ | 355,069 |
| | $ | 353,887 |
|
| 13-36 MTR | 2,875 |
| | 3,057 |
| | 3,030 |
| | 225,272 |
| | 237,642 |
| | 235,137 |
|
| 37-60 MTR | 157,359 |
| | 164,286 |
| | 162,810 |
| | 151,578 |
| | 160,948 |
| | 157,945 |
|
| Greater than 60 MTR | 86,894 |
| | 89,482 |
| | 88,362 |
| | 444,932 |
| | 460,665 |
| | 454,236 |
|
| Total adjustable-rate Agency RMBS | $ | 294,254 |
| | $ | 305,265 |
| | $ | 303,782 |
| | $ | 1,157,258 |
| | $ | 1,214,324 |
| | $ | 1,201,205 |
|
Derivative Assets and Liabilities
We use interest rate swapsderivative instruments to economically hedge our earningsexposure to adverse changes in interest rates resulting from our ownership of primarily fixed-rate investments financed with short-term repurchase agreements. Changes in interest rates can impact net interest income, the market value of our investments, and book value exposure to fluctuations in interest rates.per common share. We regularly monitor and frequently adjust our hedging portfolio in response to many factors including, but not limited to, changes in our investment portfolio shifts inas well as our expectation of future interest rates, including the absolute level of rates and the slope of the yield curve andversus market expectations. As of March 31, 2021, approximately 72% of our expectations with respect to the future path of interest ratesMBS portfolio including TBA securities were hedged using short positions in U.S. Treasury futures, put options on U.S. Treasury futures, and interest rate volatility.
We also utilize TBA contractsswaptions compared to approximately 62% as
a means of
investing in and financing fixed-rate Agency RMBS. These forward contracts are accounted for as derivative instruments because the Company cannot assert that it is probable at inception and throughout the term of an individual TBA contract that its settlement will result in physical delivery of the underlying Agency RMBS or the individual TBA contract will not settle in the shortest time period possible.December 31, 2020. Please refer to
"RMBS" aboveNote 4 of the Notes to the Consolidated Financial Statements for additional information about TBAs.
The following graphs present the effective notional balance outstanding and net weighted average pay-fixed rate fordetails on our interest rate swaps for the periods indicated:
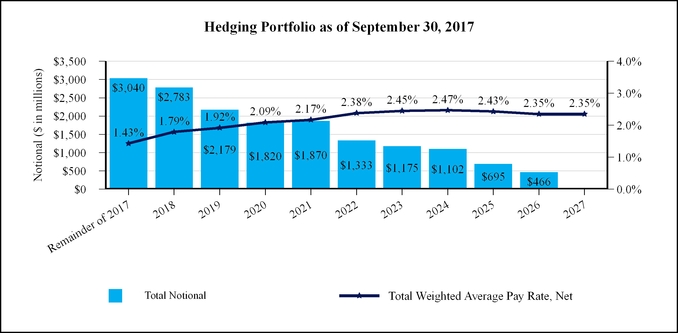

During the nine months ended September 30, 2017, we added interest rate swaps with a combined notional of $3.0 billion at a weighted average net pay-fixed rate of 1.80% and we terminated $1.1 billion in interest rate swaps with a weighted average net pay-fixed rate of 0.69%. Additionally, we had $0.2 million of interest rate swaps mature during the nine months ended September 30, 2017 with a weighted average net pay-fixed rate 0.92%. Our adjustments to the hedging portfolio were made in response to many market factors including, but not limited to, changes in our investment allocations, investing in TBA securities, shifts in the yield curve, and expectations with respect to the future path of interest rates and interest rate volatility, which is discussed further in "Quantitativederivative instruments as well as “Quantitative and Qualitative Disclosures about Market Risk"Risk” in Part I, Item 3 of this Quarterly Report on Form 10-Q.
The following table summarizes the activity related to our interest rate swaps during the nine months ended September 30, 2017:
|
| | | |
| | Nine Months Ended |
| ($ in thousands) | September 30, 2017 |
Balance as of December 31, 2016 (1) | $ | 21,612 |
|
| Net receipt on termination | (3,126 | ) |
| Periodic net cash payments | (3,364 | ) |
Settlement of variation margin (2) | 3,300 |
|
| Change in fair value | (14,955 | ) |
| Accrued interest payable | (3,099 | ) |
Balance as of September 30, 2017 (1) | $ | 368 |
|
| |
(1) | Represents the net amount recorded in "derivative assets (liabilities)" on the Company's consolidated balance sheets as of period indicated and excludes amounts related to TBA contracts which are also recorded in "derivative assets (liabilities)". |
| |
(2) | As of January 2017 margin requirements from fluctuations in fair value of the Company's cleared interest rate swaps are settled daily with the Chicago Mercantile Exchange ("CME"). |
Repurchase Agreements
The majority of our repurchase agreement borrowings are collateralized with Agency MBS which have historically had lower liquidity risk than non-Agency MBS. The following table presents the amount pledged and leverage against the fair value of our non-Agency MBS investments by credit rating as of September 30, 2017 and December 31, 2016:
|
| | | | | | | | | | | | | | | | | | | | | | | |
| | September 30, 2017 | | December 31, 2016 |
| ($ in thousands) | Fair Value | | Amount Pledged | | Related Borrowings | | Fair Value | | Amount Pledged | | Related Borrowings |
| Non-Agency CMBS: | | | | | | | | | | | |
| AAA | $ | — |
| | $ | — |
| | $ | — |
| | $ | 35,405 |
| | $ | 35,313 |
| | $ | 32,266 |
|
| AA | 14,013 |
| | — |
| | — |
| | 14,127 |
| | 14,105 |
| | 11,665 |
|
| A | 18,366 |
| | 18,365 |
| | 15,625 |
| | 18,614 |
| | 18,549 |
| | 15,831 |
|
| Below A/Not Rated | 6,826 |
| | — |
| | — |
| | 10,070 |
| | 9,873 |
| | 7,119 |
|
| | $ | 39,205 |
| | $ | 18,365 |
| | $ | 15,625 |
| | $ | 78,216 |
| | $ | 77,840 |
| | $ | 66,881 |
|
| | | | | | | | | | | | |
| Non-Agency CMBS IO: | | | | | | | | | | | |
| AAA | $ | 273,308 |
| | $ | 273,302 |
| | $ | 232,717 |
| | $ | 290,092 |
| | $ | 289,608 |
| | $ | 246,412 |
|
| AA | 44,474 |
| | 43,797 |
| | 37,694 |
| | 46,986 |
| | 45,995 |
| | 40,026 |
|
| A | 753 |
| | 753 |
| | 663 |
| | — |
| | — |
| | — |
|
| Below A/Not Rated | 10,124 |
| | 10,124 |
| | 8,907 |
| | 5,570 |
| | 5,536 |
| | 4,761 |
|
| | $ | 328,659 |
|
| $ | 327,976 |
| | $ | 279,981 |
| | $ | 342,648 |
| | $ | 341,139 |
| | $ | 291,199 |
|
| | | | | | | | | | | | |
| Non-Agency RMBS: | | | | | | | | | | | |
| Below A/Not Rated | $ | 1,142 |
| | $ | — |
| | $ | — |
| | $ | 33,562 |
| | $ | 31,952 |
| | $ | 26,149 |
|
| | $ | 1,142 |
| | $ | — |
| | $ | — |
| | $ | 33,562 |
| | $ | 31,952 |
| | $ | 26,149 |
|
Please refer to Note 3 of the Notes to the Unaudited Consolidated Financial Statements contained within this Quarterly Report on Form 10-Q as well as "Interest Expense and Cost of Funds" within "Results of Operations" and “Liquidity and Capital Resources” contained within this Item 2 for additional information relating to our borrowings.
Shareholder's Equity
Shareholder's equity increased approximately 12% during the first nine months of 2017 primarily due to an increase of $38.5 million in the fair value of MBS, which is recorded in accumulated other comprehensive income. The increase in the fair value of MBS since December 31, 2016 resulted primarily from credit spread tightening. The following table provides the accumulated unrealized holding gains (losses) by type of MBS and the remaining balance of de-designated cash flow hedges as of the periods indicated:
|
| | | | | | | |
| ($ in thousands) | September 30, 2017 | | December 31, 2016 |
| Agency CMBS | $ | (7,436 | ) | | $ | (22,295 | ) |
| Non-Agency CMBS | 2,877 |
| | 5,467 |
|
| Agency CMBS IO | 7,428 |
| | 161 |
|
| Non-Agency CMBS IO | 5,924 |
| | (3,507 | ) |
| Agency RMBS | (3,386 | ) | | (13,119 | ) |
| Non-Agency RMBS | 29 |
| | 14 |
|
| De-designated cash flow hedges | 450 |
| | 670 |
|
| Accumulated other comprehensive income (loss) | $ | 5,886 |
| | $ | (32,609 | ) |
During the nine months ended September 30, 2017, we issued 1,093,164 shares of Series B Preferred Stock under our preferred stock ATM program at a discount of approximately 5% to the liquidation value of $25.00 per share. Cash proceeds were $25.9 million, net of 2% broker commissions and other fees. On March 31, 2017, the Company entered into an amended and restated equity distribution agreement pursuant to which the Company may offer and sell up to 7,416,520 shares of common stock of the Company from time to time through its sales agent in at-the-market ("ATM") offerings. We issued 2,027,857 shares of common stock pursuant to this agreement during the nine months ended September 30, 2017 at a discount of approximately
5% to book value of $7.46 per common share at September 30, 2017. We are using the cash proceeds from these capital raises in combination with repurchase agreement borrowings to purchase additional interest earning assets for our investment portfolio.
RESULTS OF OPERATIONS
The discussionsdiscussion below provide information on items on our consolidated statements of comprehensive income. These discussions includeincludes both GAAP and non-GAAP financial measures whichthat management utilizes in its internal analysis of financial and operating performance. Please read the section "Non-GAAP“Non-GAAP Financial Measures" at the endMeasures” contained in “Executive Overview” of "Executive Overview" in Part 1, Item 2 of this Quarterly Report on Form 10-Q for additional important information about these measures.
The following table summarizes the results of operations for the periods indicated:
| | | | | | | | | | | | | | | | | |
| Three Months Ended |
| $s in thousands | March 31, 2021 | | December 31, 2020 | | March 31, 2020 |
| Net interest income | $ | 12,259 | | | $ | 14,416 | | | $ | 17,721 | |
| Gain on sale of investments, net | 4,697 | | | 9,356 | | | 84,783 | |
| Loss on investments, net | (980) | | | (134) | | | (372) | |
| Gain (loss) on derivative instruments, net | 107,801 | | | 23,866 | | | (195,567) | |
| General and administrative expenses | (5,468) | | | (6,853) | | | (4,621) | |
| Other operating expenses, net | (380) | | | (205) | | | (423) | |
| Preferred stock dividends | (2,559) | | | (3,253) | | | (3,841) | |
| Preferred stock redemption charges | (2,987) | | | — | | | (3,914) | |
| Net income (loss) to common shareholders | 112,383 | | | 37,193 | | | (106,234) | |
| Other comprehensive (loss) income | (65,156) | | | (8,468) | | | 72,972 | |
| Comprehensive income (loss) to common shareholders | $ | 47,227 | | | $ | 28,725 | | | $ | (33,262) | |
Net Interest Income and Effective Yields on MBSFor Three Months Ended March 31, 2021 Compared to the Three Months Ended December 31, 2020
Interest income includes gross interest earned from the coupon rate on the securities, premium amortization and discount accretion, and otherNet interest income resulting fromdecreased $2.2 million for the three months ended March 31, 2021 compared to the three months ended December 31, 2020 due to a smaller average balance of lower yielding investments. Net interest spread declined 7 basis points for the three months ended March 31, 2021 compared to the prior quarter, but exceeded management's expectation for the first quarter of 2021 as prepayment penalty income or otherspeeds were lower than anticipated and financing rates dropped 5 basis points versus the prior quarter.
The following table presents certain information about our interest-earning assets and interest-bearing liabilities and their performance for the periods indicated:
| | | | | | | | | | | | | | | | | | | | | | | | | | | | | | | | | | | |
| Three Months Ended |
| March 31, 2021 | | December 31, 2020 |
| ($ in thousands) | Interest Income/Expense | | Average Balance (1)(2) | | Effective Yield/ Cost of Funds (3)(4) | | Interest Income/Expense | | Average Balance (1)(2) | | Effective Yield/ Cost of Funds (3)(4) |
| Interest-earning assets: | | | | | | | | | | | |
| Agency RMBS | $ | 7,381 | | | $ | 1,821,920 | | | 1.62 | % | | $ | 9,812 | | | $ | 2,139,626 | | | 1.83 | % |
| Agency CMBS | 1,832 | | | 238,158 | | | 2.91 | % | | 1,973 | | | 255,327 | | | 2.90 | % |
CMBS IO (5) | 4,516 | | | 365,891 | | | 4.33 | % | | 4,746 | | | 391,004 | | | 4.27 | % |
| Non-Agency MBS and other investments | 163 | | | 7,304 | | | 7.15 | % | | 174 | | | 7,960 | | | 7.37 | % |
| Total: | $ | 13,892 | | | $ | 2,433,273 | | | 2.17 | % | | $ | 16,705 | | | $ | 2,793,917 | | | 2.29 | % |
| | | | | | | | | | | |
Interest-bearing liabilities: (6) | (1,633) | | | 2,158,121 | | | (0.30) | % | | (2,289) | | | 7,960 | | | (0.35) | % |
| Net interest income/net interest spread | $ | 12,259 | | | | | 1.87 | % | | $ | 14,416 | | | | | 1.94 | % |
(1) Average balance for assets is calculated as a simple average of the daily amortized cost and excludes unrealized gains and losses as well as securities pending settlement if applicable.
(2) Average balance for liabilities is calculated as a simple average of the daily borrowings outstanding during the period.
(3) Effective yield maintenance items on CMBS and CMBS IO securities. Effective yields areis calculated by dividing the sum of gross interest income and scheduled premium amortization/discount accretion (both of which are annualized for any reporting period less than 12 months) and prepayment compensation and premium amortization/discount accretion adjustments (collectively, "prepayment adjustments"), which are not annualized, by the average balance of investmentsasset type outstanding during the reporting period. The following table presents details on average balances,
(4) Cost of funds is calculated by dividing annualized interest income, and effective yields of MBS forexpense by the periods indicated:
|
| | | | | | | | | | | | | |
| | Three Months Ended |
| | September 30, |
| | 2017 | | 2016 |
| ($ in thousands) | Amount | | Yield | | Amount | | Yield |
| CMBS: | | | | | | | |
| Coupon and scheduled amortization | $ | 9,976 |
| | 2.90 | % | | $ | 7,903 |
| | 3.19 | % |
Prepayment adjustments (1) | 176 |
| | 0.01 | % | | (154 | ) | | (0.02 | )% |
| | $ | 10,152 |
| | 2.91 | % | | $ | 7,749 |
| | 3.17 | % |
Average balance (2) | $ | 1,352,681 |
| |
|
| | $ | 974,240 |
| |
|
|
| | | | | | | | |
| CMBS IO: |
|
| | | | | | |
| Coupon and scheduled amortization | $ | 6,841 |
| | 3.73 | % | | $ | 6,895 |
| | 3.81 | % |
Prepayment adjustments (1) | 1,209 |
| | 0.16 | % | | 546 |
| | 0.07 | % |
| | $ | 8,050 |
| | 3.89 | % | | $ | 7,441 |
| | 3.88 | % |
Average balance (2) | $ | 734,282 |
| | | | $ | 724,859 |
| | |
| | | | | | | | |
| RMBS: |
|
| | | | | | |
| Coupon and scheduled amortization | $ | 4,693 |
| | 2.19 | % | | $ | 6,689 |
| | 1.92 | % |
Prepayment adjustments (1) | (124 | ) | | (0.01 | )% | | (982 | ) | | (0.07 | )% |
| | $ | 4,569 |
| | 2.18 | % | | $ | 5,707 |
| | 1.85 | % |
Average balance (2) | $ | 856,705 |
| |
|
| | $ | 1,390,401 |
| | |
| |
|
| | | | | | |
| Total MBS interest income and effective yield: | $ | 22,771 |
| | 2.94 | % | | $ | 20,897 |
| | 2.75 | % |
| | | | | | | | |
Total average balance (2): | $ | 2,943,668 |
| | | | $ | 3,089,500 |
| | |
| | | | | | | | |
| | Nine Months Ended |
| | September 30, |
| | 2017 | | 2016 |
| | Amount | | Yield | | Amount | | Yield |
| CMBS: | | | | | | | |
| Coupon and scheduled amortization | $ | 28,991 |
| | 2.93 | % | | $ | 24,241 |
| | 3.23 | % |
Prepayment adjustments (1) | 2,255 |
| | 0.17 | % | | 1,016 |
| | 0.10 | % |
|
| | | | | | | | | | | | | |
| | $ | 31,246 |
| | 3.10 | % | | $ | 25,257 |
| | 3.33 | % |
Average balance (2) | $ | 1,308,811 |
| |
|
| | $ | 990,440 |
| | |
| |
|
| | | | | | |
| CMBS IO: |
|
| | | |
|
| | |
| Coupon and scheduled amortization | $ | 21,059 |
| | 3.75 | % | | $ | 21,279 |
| | 3.79 | % |
Prepayment adjustments (1) | 3,619 |
| | 0.48 | % | | 1,363 |
| | 0.18 | % |
| | $ | 24,678 |
| | 4.23 | % | | $ | 22,642 |
| | 3.97 | % |
Average balance (2) | $ | 749,343 |
| |
|
| | $ | 748,097 |
| | |
| | | | | | | | |
| RMBS: |
|
| | | |
|
| |
|
|
| Coupon and scheduled amortization | $ | 15,341 |
| | 2.02 | % | | $ | 21,525 |
| | 1.91 | % |
Prepayment adjustments (1) | (1,753 | ) | | (0.17 | )% | | (1,104 | ) | | (0.07 | )% |
| | $ | 13,588 |
| | 1.84 | % | | $ | 20,421 |
| | 1.84 | % |
Average balance (2) | $ | 1,014,283 |
| |
|
| | $ | 1,499,309 |
| | |
| |
|
| | | |
|
| | |
| Total MBS interest income and effective yield: | $ | 69,512 |
| | 2.96 | % | | $ | 68,320 |
| | 2.79 | % |
| | | | | | | | |
Total average balance (2): | $ | 3,072,437 |
| | | | $ | 3,237,846 |
| | |
| |
(1) | Prepayment adjustments represent effective interest amortization adjustments related to changes in actual and projected prepayment speeds for RMBS and prepayment compensation, net of amortization for CMBS and CMBS IO. |
| |
(2) | Average balances are calculated as a simple average of the daily amortized cost and exclude unrealized gains and losses as well as securities pending settlement if applicable. |
Interest income and effective yields on our total MBS portfolio for the three and nine months ended September 30, 2017 increased due to higher prepayment penalty income from CMBS and CMBS IO and lower premium amortization adjustments on RMBS compared to the three and nine months ended September 30, 2016. Interest income and effective yields on MBS also increased overall as a result of our shift in investment strategy to higher yielding fixed-rate securities over the past twelve months. The following tables present the estimated impact of changes in average balances, yields, and prepayment adjustments on interest income by type of MBS for the periods indicated:
|
| | | | | | | | | | | | | | | |
| | Three Months Ended |
| | September 30, 2017 vs. September 30, 2016 |
| | Increase (Decrease) in Interest Income | | Due to Change In |
| ($ in thousands) | | Average Balance | | Coupon and Scheduled Amortization | | Prepayment Adjustments (1) |
| CMBS | $ | 2,402 |
| | $ | 2,013 |
| | $ | 59 |
| | $ | 330 |
|
| CMBS IO | 609 |
| | 134 |
| | (188 | ) | | 663 |
|
| RMBS | (1,137 | ) | | (2,069 | ) | | 74 |
| | 858 |
|
| Total | $ | 1,874 |
| | $ | 78 |
| | $ | (55 | ) | | $ | 1,851 |
|
| | | | | | | | |
| | Nine Months Ended |
| | September 30, 2017 vs. September 30, 2016 |
| | Increase (Decrease) in Interest Income | | Due to Change In |
| ($ in thousands) | | Average Balance | | Coupon and Scheduled Amortization | | Prepayment Adjustments (1) |
| CMBS | $ | 5,989 |
| | $ | 4,800 |
| | $ | (50 | ) | | $ | 1,239 |
|
| CMBS IO | 2,036 |
| | 57 |
| | (277 | ) | | 2,256 |
|
| RMBS | (6,833 | ) | | (6,488 | ) | | 304 |
| | (649 | ) |
| Total | $ | 1,192 |
| | $ | (1,631 | ) | | $ | (23 | ) | | $ | 2,846 |
|
| |
(1) | Prepayment adjustments represent effective interest amortization adjustments related to changes in actual and projected prepayment speeds for RMBS and prepayment compensation, net of amortization for CMBS and CMBS IO. |
Interest income from CMBS increased for the three and nine months ended September 30, 2017 compared to the three and nine months ended September 30, 2016 due to a higher average balance and higher prepayment penalty income while the effective yield earned on our CMBS portfolio was lower for three and nine months ended September 30, 2017 due primarily to lower average coupons on our current CMBS portfolio versus the same periods in the prior year.
Interest income and effective yield for CMBS IO for the three and nine months ended September 30, 2017 increased compared to the three and nine months ended September 30, 2016 due to an increase in prepayment penalty income for the three and nine months ended September 30, 2017 versus the same periods in 2016.
Interest income declined on RMBS for the three and nine months ended September 30, 2017 primarily due to a decrease in the average balance of approximately (38)% and (32)% for the three and nine months ended September 30, 2017, respectively, compared to the same periods in 2016. The increase of 33 basis points in the effective yield on RMBS for the three months ended September 30, 2017 compared to the same period in 2016 is due to the addition of $544.1 million in specified pools of 30-year fixed-rate Agency RMBSborrowings outstanding during the third quarterperiod with an assumption of 2017. Because these fixed-rate securities are newer issues, they have higher coupons than the adjustable-rate RMBS we have sold since September 30, 2016. Premium amortization was lower for the three360 days in a year.
(5) Includes Agency and nine months ended September 30, 2017 as a resultnon-Agency issued securities.
(6) Interest-bearing liabilities consist primarily of the sales of adjustable-rate RMBS. The rate at which we amortize the premiums on adjustable-rate Agency RMBS is impacted by actual and forecasted prepayments, which is measured by the constant prepayment rate ("CPR"). The following graph shows our actual 3 month average CPRs for our adjustable-rate Agency RMBS for the periods indicated:repurchase agreement borrowings.
Premium amortization on our fixed-rate Agency RMBS is adjusted when actual prepayments are received. The CPR for our fixed-rate Agency RMBS was 1.3% for the third quarter of 2017. We do not forecast prepayments on our fixed-rate Agency RMBS.
Interest Expense and Cost of Funds
The following table summarizes the components of interest expense as well as average balances and cost of funds for the periods indicated:
|
| | | | | | | | | | | | | | | |
| | Three Months Ended | | Nine Months Ended |
| | September 30, | | September 30, |
| ($ in thousands) | 2017 | | 2016 | | 2017 | | 2016 |
| Interest expense on repurchase agreement borrowings | $ | 9,910 |
| | $ | 5,800 |
| | $ | 26,269 |
| | $ | 17,440 |
|
| Interest expense on FHLB advances | — |
| | 343 |
| | — |
| | 1,118 |
|
Accretion of de-designated cash flow hedges (1) | (48 | ) | | (99 | ) | | (220 | ) | | (152 | ) |
| Non-recourse collateralized financing | 27 |
| | 24 |
| | 73 |
| | 72 |
|
| Total interest expense | $ | 9,889 |
| | $ | 6,068 |
| | $ | 26,122 |
| | $ | 18,478 |
|
| |
|
| | | |
|
| | |
| Average balance of repurchase agreements | $ | 2,616,250 |
| | $ | 2,536,562 |
| | $ | 2,736,834 |
| | $ | 2,623,225 |
|
| Average balance of FHLB advances | — |
| | 263,000 |
| | — |
| | 308,022 |
|
| Average balance of non-recourse collateralized financing | 5,817 |
| | 7,386 |
| | 6,058 |
| | 7,892 |
|
| Average balance of borrowings | $ | 2,622,067 |
| | $ | 2,806,948 |
| | $ | 2,742,892 |
| | $ | 2,939,139 |
|
Cost of funds (2) | 1.48 | % | | 0.85 | % | | 1.26 | % | | 0.83 | % |
| |
(1) | Amount recorded in accordance with GAAP related to accretion of the balance remaining in accumulated other comprehensive income as a result of our discontinuation of cash flow hedge accounting effective June 30, 2013. |
| |
(2) | Cost of funds is calculated by dividing annualized interest expense by the total average balance of borrowings outstanding during the period. |
Rate/Volume Analysis.The following table presents the estimated impact on our net interest income due to changes in rate (effective yield/cost of the changefunds) and changes in average balancesvolume (average balance) of our interest-earning assets and borrowing rates of secured borrowings and other differences in interest expenseinterest-bearing liabilities for the comparative periods presented:indicated:
| | | | | | | | | | | | | | | | | | | | | | | |
| Three Months Ended |
| March 31, 2021 Compared to December 31, 2020 |
| Increase (Decrease) Due to Change In | | Total Change in Interest Income/Expense |
| ($ in thousands) | Rate | | Volume | | Prepayment Adjustments (1) | |
| Interest-earning assets: | | | | | | | |
| Agency RMBS | $ | (984) | | | $ | (1,447) | | | $ | — | | | $ | (2,431) | |
| Agency CMBS | — | | | (160) | | | 19 | | | (141) | |
CMBS IO (2) | 48 | | | (257) | | | (21) | | | (230) | |
| Non-Agency MBS and other investments | (5) | | | (3) | | | (3) | | | (11) | |
| Change in interest income | (941) | | | (1,867) | | | (5) | | | (2,813) | |
| Change in interest expense | (315) | | | (341) | | | — | | | (656) | |
| | | | | | | |
| Total net change in net interest income | $ | (626) | | | $ | (1,526) | | | $ | (5) | | | $ | (2,157) | |
(1) Prepayment adjustments represent effective interest amortization adjustments related to changes in actual prepayment speeds and prepayment compensation, net of amortization adjustments for CMBS and CMBS IO.
(2) Includes Agency and non-Agency issued securities.
|
| | | | | | | |
| ($ in thousands) | Three Months Ended September 30, 2017 vs. September 30, 2016 | | Nine Months Ended September 30, 2017 vs. September 30, 2016 |
| Change in borrowing rates on repurchase agreements and FHLB advances | $ | 4,169 |
| | $ | 8,927 |
|
| Change in average balance of repurchase agreements and FHLB advances | (402 | ) | | (1,216 | ) |
| Decrease (increase) in accretion of de-designated cash flow hedges | 51 |
| | (68 | ) |
| Decrease in non-recourse collateralized financing and other interest expense | 3 |
| | 1 |
|
| Total change in interest expense | $ | 3,821 |
| | $ | 7,644 |
|
Increases in interest expense for the three and nine months ended September 30, 2017 comparedAdjusted Net Interest Income.Please refer to the same periods in 2016 were due to higher borrowing rates on our repurchase agreements. Our borrowing rates are based primarily on one-month LIBOR which has increased approximately 70 basis points since September 30, 2016.
Adjusted Interest Expense
Because we use derivative instruments as economic hedges of our interest rate risk exposure, management considers net periodic interest costs from derivative instruments to be an additional cost of financing investments. As such, management uses the non-GAAP financial measure "adjusted interest expense" which includes the net periodic interest costs of our effective derivative instruments excluded from GAAP interest expense. Please read the section "Non-GAAP“Non-GAAP Financial Measures"Measures” at the end of "Executive Overview" in Part 1, Item 2the “Executive Overview” section of this Quarterly Report on Form 10-Q for additional information.information about this financial measure used by management to evaluate results of operations.
| | | | | | | | | | | | | | | | | | | | | | | |
| Three Months Ended |
| March 31, 2021 | | December 31, 2020 |
| ($ in thousands) | Amount | | Rate | | Amount | | Rate |
| Net interest income | $ | 12,259 | | | 1.87 | % | | $ | 14,416 | | | 1.94 | % |
Add: TBA drop income (1) (2) | 8,568 | | | — | % | | 6,445 | | | 0.04 | % |
Add: net periodic interest benefit (3) | — | | | — | % | | (7) | | | — | % |
| Adjusted net interest income | $ | 20,827 | | | 1.87 | % | | $ | 20,854 | | | 1.98 | % |
(1) TBA drop income is calculated by multiplying the notional amount of the TBA dollar roll positions by the difference in price between two TBA securities with the same terms but different settlement dates.
(2) The tableimpact of TBA drop income on adjusted net interest spread includes the implied average funding cost of TBA dollar roll transactions during the periods indicated.
(3) Amount represents net periodic interest cost/benefit of effective interest rate swaps outstanding during the period and excludes realized and unrealized gains and losses from changes in fair value of derivatives.
Adjusted net interest income was flat for the three months ended March 31, 2021 compared to the three months ended December 31, 2020 because the increase in our investment in TBA securities generated an additional $2.1 million in drop income which mostly offset the decline in net interest income of $2.2 million. The financing cost imputed in TBA dollar roll transactions continues to be lower than the average repurchase agreement financing rate, which is commonly referred to in the industry as TBA dollar rolls “trading special” or “dollar roll specialness”. Dollar roll specialness happens primarily as a result of supply/demand imbalances or volatility in market prepayment expectations, and in management’s view, the pace of bank and Federal Reserve purchases is currently resulting in an implied financing costs dropping below presents the reconciliation of GAAP interest expense0%. The implied financing rate for our TBA long positions was (0.20)% compared to our repurchase agreement financing cost for specified pools of Agency RMBS of 0.19% for the three months ended March 31, 2021. TBA drop income did not impact adjusted net interest expensespread for the first quarter of 2021 because the implied net interest spread on TBA dollar roll transactions was similar to the net interest spread on our MBS.
Net Interest Income For Three Months Ended March 31, 2021 Compared to the Three Months Ended March 31, 2020
Net interest income declined by $(5.5) million for the three months ended March 31, 2021 compared to the three months ended March 31, 2020 because we held a smaller average balance of lower yielding investments during the first quarter of 2021. The following table presents information about our interest-earning assets and interest-bearing liabilities and their performance for the periods indicated:
|
| | | | | | | | | | | | | | | |
| | Three Months Ended | | Nine Months Ended |
| | September 30, | | September 30, |
| ($ in thousands) | 2017 | | 2016 | | 2017 | | 2016 |
| Interest expense | $ | 9,889 |
| | $ | 6,068 |
| | $ | 26,122 |
| | $ | 18,478 |
|
Add: net periodic interest costs of derivative instruments (1) | 1,131 |
| | 155 |
| | 3,099 |
| | 2,321 |
|
Less: de-designated hedge accretion (2) | 48 |
| | 99 |
| | 220 |
| | 152 |
|
| Adjusted interest expense | $ | 11,068 |
| | $ | 6,322 |
| | $ | 29,441 |
| | $ | 20,951 |
|
| | | | | | | | | | | | | | | | | | | | | | | | | | | | | | | | | | | |
| Three Months Ended |
| March 31, |
| 2021 | | 2020 |
| ($ in thousands) | Interest Income/Expense | | Average Balance (1)(2) | | Effective Yield/ Cost of Funds (3)(4) | | Interest Income/Expense | | Average Balance (1)(2) | | Effective Yield/ Cost of Funds (3)(4) |
| Interest-earning assets: | | | | | | | | | | | |
| Agency RMBS | $ | 7,381 | | | $ | 1,821,920 | | | 1.62 | % | | $ | 19,289 | | | $ | 2,514,228 | | | 3.07 | % |
| Agency CMBS | 1,832 | | | 238,158 | | | 2.91 | % | | 15,222 | | | 1,899,226 | | | 3.16 | % |
CMBS IO (5) | 4,516 | | | 365,891 | | | 4.33 | % | | 4,655 | | | 475,404 | | | 3.73 | % |
| Non-Agency MBS and other investments | 163 | | | 7,304 | | | 7.15 | % | | 656 | | | 10,274 | | | 7.55 | % |
| Total: | $ | 13,892 | | | $ | 2,433,273 | | | 2.17 | % | | $ | 39,822 | | | $ | 4,899,132 | | | 3.18 | % |
| | | | | | | | | | | |
| Interest-bearing liabilities: | (1,633) | | | 2,158,121 | | | (0.30) | % | | (22,101) | | | 4,703,511 | | | (1.86) | % |
| Net interest income/net interest spread | $ | 12,259 | | | | | 1.87 | % | | $ | 17,721 | | | | | 1.32 | % |
(1) Average balance for assets is calculated as a simple average of the daily amortized cost and excludes unrealized gains and losses as well as securities pending settlement if applicable.
| |
1) | Amounts represent net periodic interest costs on effective interest rate swaps(2) Average balance for liabilities is calculated as a simple average of the daily borrowings outstanding during the period and exclude termination costs and changes in fair value. |
| |
(2) | Amount recorded as a portion of "interest expense" in accordance with GAAP related to accretion of the balance remaining in accumulated other comprehensive income as a result of our discontinuation of cash flow hedge accounting effective June 30, 2013. |
Of the $1.1 million and $3.1 million in net periodic interest costs incurred during the threeperiod.
(3) Effective yield is calculated by dividing the sum of gross interest income and nine months ended September 30, 2017, respectively, $0.8 millionscheduled premium amortization/discount accretion (both of which are annualized for any reporting period less than 12 months) and $1.3 million, respectively, relates toprepayment compensation and premium amortization/discount accretion adjustments (collectively, "prepayment adjustments"), which are not annualized, by the average balance of asset type outstanding during the reporting period.
(4) Cost of funds is calculated by dividing annualized interest rate swaps we added to our hedging portfolioexpense by the total average balance of borrowings outstanding during the period with an assumption of 360 days in order to mitigatea year.
(5) Includes Agency and non-Agency issued securities.
(6) Interest-bearing liabilities consist primarily of repurchase agreement borrowings.
Rate/Volume Analysis. The following table presents the potentialestimated impact of changing interest rates on our TBA securities.
Net Interest Income and Net Interest Spread
The tables below present net interest income due to changes in rate (effective yield/cost of funds) and net interest spread forchanges in volume (average balance) of our interest-earning assets and interest-bearing liabilities for the periods indicated:.
| | | | | | | | | | | | | | | | | | | | | | | |
| Three Months Ended |
| March 31, 2021 Compared to March 31, 2020 |
| Increase (Decrease) Due to Change In | | Total Change in Interest Income/Expense |
| Rate | | Volume | | Prepayment Adjustments (1) | |
| Interest-earning assets: | | | | | | | |
| Agency RMBS | $ | (6,603) | | | $ | (5,305) | | | $ | — | | | $ | (11,908) | |
| Agency CMBS | (177) | | | (13,265) | | | 52 | | | (13,390) | |
CMBS IO (2) | 418 | | | (999) | | | 442 | | | (139) | |
| Non-Agency MBS and other investments | (447) | | | (30) | | | (16) | | | (493) | |
| Change in interest income | $ | (6,809) | | | $ | (19,599) | | | $ | 478 | | | $ | (25,930) | |
| Change in interest expense | (8,400) | | | (12,068) | | | — | | | (20,468) | |
| | | | | | | |
| Total net change in net interest income | $ | 1,591 | | | $ | (7,531) | | | $ | 478 | | | $ | (5,462) | |
(1) Prepayment adjustments represent effective interest amortization adjustments related to changes in actual prepayment speeds and prepayment compensation, net of amortization adjustments for CMBS and CMBS IO.
|
| | | | | | | | | | | | | |
| | Three Months Ended |
| | September 30, |
| | 2017 | | 2016 |
| ($ in thousands) | Amount | | Yield | | Amount | | Yield |
| Interest income | $ | 23,103 |
| | 2.95 | % | | $ | 21,135 |
| | 2.75 | % |
| Interest expense | 9,889 |
| | 1.48 | % | | 6,068 |
| | 0.85 | % |
| Net interest income/spread | 13,214 |
| | 1.47 | % | | 15,067 |
| | 1.90 | % |
| | | | | | | | |
Average interest earning assets (1) | $ | 2,960,595 |
| | | | $ | 3,110,884 |
| | |
Average balance of borrowings (2) | $ | 2,622,067 |
| | | | $ | 2,806,948 |
| | |
| | | | | | | | |
| | Nine Months Ended |
| | September 30, |
| | 2017 | | 2016 |
| ($ in thousands) | Amount | | Yield | | Amount | | Yield |
| Interest income | $ | 70,378 |
| | 2.97 | % | | $ | 69,040 |
| | 2.80 | % |
| Interest expense | 26,122 |
| | 1.26 | % | | 18,478 |
| | 0.83 | % |
| Net interest income/spread | $ | 44,256 |
| | 1.71 | % | | $ | 50,562 |
| | 1.97 | % |
| | | | | | | | |
Average interest earning assets (1) | $ | 3,090,313 |
| | | | $ | 3,260,510 |
| | |
Average balance of borrowings (2) | $ | 2,742,892 |
| | | | $ | 2,939,139 |
| | |
| |
(1) | Average balances are calculated as a simple average of the daily amortized cost and exclude unrealized gains and losses as well as securities pending settlement if applicable. |
| |
(2) | Average balances are calculated as a simple average of the daily borrowings outstanding for both repurchase agreement and non-recourse collateralized financing. |
(2) Includes Agency and non-Agency issued securities.
Adjusted Net interest income and net interest spread declined due to higher borrowing costs during the three and nine months ended September 30, 2017 compared to the respective periods in 2016. Higher borrowings costs were partially mitigated by an increase in interest income for the three and nine months ended September 30, 2017 compared to the respective periods in 2016, which resulted from replacing lower yielding adjustable-rate RMBS with higher yielding fixed-rate MBS during the past twelve months. Interest Income.Please refer to "Interest Income and Effective Yields" and "Interest Expense and Cost“Non-GAAP Financial Measures” at the end of Funds"the “Executive Overview” section of this Quarterly Report on Form 10-Q for additional information.information about this financial measure used by management to evaluate results of operations.
| | | | | | | | | | | | | | | | | | | | | | | |
| Three Months Ended |
| March 31, |
| 2021 | | 2020 |
| ($ in thousands) | Amount | | Rate | | Amount | | Rate |
| Net interest income | $ | 12,259 | | | 1.87 | % | | $ | 17,721 | | | 1.32 | % |
Add: TBA drop income (1) (2) | 8,568 | | | — | % | | 739 | | | (0.03) | % |
Add: net periodic interest benefit (3) | — | | | — | % | | 2,064 | | | 0.18 | % |
| Adjusted net interest income | $ | 20,827 | | | 1.87 | % | | $ | 20,524 | | | 1.47 | % |
Adjusted Net Interest Income
Drop income from(1) TBA securities and net periodic interest costs from interest rate swaps effective during the period are included in "gain (loss) on derivatives instruments, net" on the Company's consolidated statements of comprehensive income. Dropdrop income is calculated by multiplying the notional amount of the TBA dollar roll positions by the difference in price between the near settlingtwo TBA contract and the price forsecurities with the same contract with a laterterms but different settlement date. Management believesdates.
(2) The impact of TBA drop income on adjusted net interest spread includes the implied average funding cost of TBA dollar roll transactions during the periods indicated.
(3) Amount represents net periodic interest cost/benefit of effective interest rate swaps outstanding during the economic equivalentperiod and excludes realized and unrealized gains and losses from changes in fair value of derivatives.
Adjusted net interest income (interestincreased $0.3 million for the three months ended March 31, 2021 compared to the three months ended March 31, 2020 because our increased investment in TBA securities at lower implied funding costs relative to the three months ended March 31, 2020 resulted in an increase in TBA drop income less implied financing cost) onof $7.8 million. This increase in TBA drop income offset the underlying Agency security from trade date to settlement date. Management also viewsdecline of $(5.5) million in net interest income and $(2.1) million in net periodic interest costsbenefit from interest rate swaps. As discussed previously, we have increased our investment in TBA securities relative to prior periods due to dollar roll specialness and also given the current market environment, TBA securities allow us more flexibility should we decide or find it necessary to reduce leverage. The decline in net periodic interest benefit from interest rate swaps used to hedge interest rate risk as an additional cost ofis because we are not currently using repurchase agreements
to finance its investments. As such, management includes drop income from TBA securities and net periodic interest costs from interest rate swaps to hedge our interest rate risk.
Changes in a non-GAAP financial measure "adjusted net interest income". The following table reconciles adjusted net interest income to GAAP net interest income for the periods indicated:
|
| | | | | | | | | | | | | | | |
| | Three Months Ended | | Nine Months Ended |
| | September 30, | | September 30, |
| ($ in thousands) | 2017 | | 2016 | | 2017 | | 2016 |
| Net interest income | $ | 13,214 |
| | $ | 15,067 |
| | $ | 44,256 |
| | $ | 50,562 |
|
| Add: drop income | 3,902 |
| | — |
| | 5,253 |
| | — |
|
Add: net periodic interest costs (1) | (1,131 | ) | | (155 | ) | | (3,099 | ) | | (2,321 | ) |
Less: de-designated hedge accretion (2) | (48 | ) | | (99 | ) | | (220 | ) | | (152 | ) |
| Adjusted net interest income | $ | 15,937 |
| | $ | 14,813 |
| | $ | 46,190 |
| | $ | 48,089 |
|
| |
(1) | Amounts represent net periodic interest costs on effective interest rate swaps outstanding during the period and exclude termination costs and changes in fair value. |
| |
(2) | Amount recorded in accordance with GAAP related to accretion of the balance remaining in accumulated other comprehensive income as a result of our discontinuation of cash flow hedge accounting effective June 30, 2013. |
Loss on Derivative Instruments, Net
The following table provides information on the componentsFair Value of our "loss on derivative instruments, net" for the periods indicated:
|
| | | | | | | | | | | | | | | | | | | | | | | | |
| | | Three Months Ended |
| | | September 30, |
| ($ in thousands) | | 2017 | | 2016 |
| Type of Derivative Instrument | | Net Periodic Interest Costs | | Change in Fair Value (1)(2) | | Total | | Net Periodic Interest Costs | | Change in Fair Value (1) | | Total |
| Interest rate swaps | | $ | (1,131 | ) | | $ | 421 |
| | $ | (710 | ) | | $ | (155 | ) | | $ | (266 | ) | | $ | (421 | ) |
| TBA securities | | — |
| | 6,703 |
| | 6,703 |
| | — |
| | — |
| | — |
|
| Eurodollar futures | | — |
| | — |
| | — |
| | — |
| | 2,830 |
| | 2,830 |
|
| Loss on derivative instruments, net | | $ | (1,131 | ) | | $ | 7,124 |
| | $ | 5,993 |
| | $ | (155 | ) | | $ | 2,564 |
| | $ | 2,409 |
|
| | | | | | | | | | | | | |
| | | Nine Months Ended |
| | | September 30, |
| | | 2017 | | 2016 |
| Type of Derivative Instrument | | Net Periodic Interest Costs | | Change in Fair Value (1)(2) | | Total | | Net Periodic Interest Costs | | Change in Fair Value (1) | | Total |
| Interest rate swaps | | $ | (3,099 | ) | | $ | (14,954 | ) | | $ | (18,053 | ) | | $ | (2,321 | ) | | $ | (46,290 | ) | | $ | (48,611 | ) |
| TBA securities | | — |
| | 8,419 |
| | 8,419 |
| | — |
| | — |
| | — |
|
| Eurodollar futures | | — |
| | — |
| | — |
| | — |
| | (13,542 | ) | | (13,542 | ) |
| Loss on derivative instruments, net | | $ | (3,099 | ) | | $ | (6,535 | ) | | $ | (9,634 | ) | | $ | (2,321 | ) | | $ | (59,832 | ) | | $ | (62,153 | ) |
| |
(1) | Changes in fair value for interest rate swaps and Eurodollar futures include unrealized gains (losses) from current and forward starting derivative instruments and realized gains (losses) from terminated derivative instruments. |
| |
(2) | Change in fair value for TBA securities includes unrealized gains (losses) from open TBA contracts and realized gains (losses) on terminated positions. |
Investments
Changes in the fair value of our investments result in realized and unrealized gains and losses. The fair value of our investments are impacted by a number of number of factors including, among others, market volatility, changes in credit spreads, spot and forward interest rate swapsrates, actual and Eurodollar futuresanticipated prepayments, and supply/demand dynamics which are in turn impacted by, among other things, interest rates, capital flows, economic conditions, and government policies and actions, such as purchases and sales by the Federal Reserve Bank of New York.
Unrealized Gains (Losses). Changes in the fair value of our MBS designated as AFS are reported in other comprehensive income (“OCI”) as an unrealized gain or loss until the security is sold or matures. Effective January 1, 2021, we elected the fair value option for MBS purchased on or after that date with changes in fair value reported in net income as an unrealized gain or loss until the security is sold or matures. The following table provides details on the unrealized gains or
losses on our investments recorded within “other comprehensive (loss) income” and “loss on investments, net” for the periods indicated:
| | | | | | | | | | | | | | | | | |
| Three Months Ended |
| ($ in thousands) | March 31, 2021 | | December 31, 2020 | | March 31, 2020 |
| Agency RMBS purchased after December 31, 2020 | $ | (960) | | | $ | — | | | $ | — | |
| Mortgage loans held for investment | (35) | | | (118) | | | (370) | |
| Other | 15 | | | (16) | | | (2) | |
| Loss on investments, net | (980) | | | (134) | | | (372) | |
| | | | | |
| Agency RMBS | (60,175) | | | (7,579) | | | (24,613) | |
| Agency CMBS | (7,046) | | | (3,900) | | | 112,785 | |
| CMBS IO | 2,121 | | | 3,081 | | | (15,083) | |
| Non-Agency other | (56) | | | (70) | | | (117) | |
| Other comprehensive (loss) income | (65,156) | | | (8,468) | | | 72,972 | |
| | | | | |
| Total unrealized (losses) gains | $ | (66,136) | | | $ | (8,602) | | | $ | 72,600 | |
Realized Gains (Losses).Sales of our investments happen in the ordinary course of business as we manage our risk, capital and liquidity profiles, and as we reallocate capital to various investments. Upon the sale of an AFS security, any unrealized gain or loss is reclassified out of AOCI into net income as a realized gain or loss within “gain (loss) on sale of investments, net.” Upon the sale of a security for which we have elected the fair value option, any unrealized gain or loss recorded in “loss on investments, net” is reversed and the realized gain or loss is recorded within “gain (loss) on sale of investments, net”. The following table provides information related to our realized gains (losses) on sales of AFS investments for the periods indicated:
| | | | | | | | | | | | | | | | | | | | | | | | | | | | | | | | | | | |
| Three Months Ended |
| |
| March 31, 2021 | | December 31, 2020 | | March 31, 2020 |
| ($ in thousands) | Amortized
cost sold | | Realized
Gain | | Amortized
cost sold | | Realized
Gain | | Amortized
cost sold | | Realized
Gain |
| Agency RMBS | $ | 70,132 | | | $ | 4,697 | | | $ | 200,212 | | | $ | 6,865 | | | $ | 1,753,256 | | | $ | 64,094 | |
| Agency CMBS | — | | | — | | | 29,684 | | | 2,491 | | | 152,995 | | | 20,689 | |
| $ | 70,132 | | | $ | 4,697 | | | $ | 229,896 | | | $ | 9,356 | | | $ | 1,906,251 | | | $ | 84,783 | |
Our sales of AFS investments during the three months ended March 31, 2020 were significantly higher compared to the three months ended March 31, 2021 and the three months ended December 31, 2020. When interest rates rallied early to mid-March of 2020 as the markets initially responded to the COVID-19 pandemic, we chose to realize gains on our Agency RMBS as asset prices began to fall and we chose to de-lever our balance sheet.
Gain (Loss) on Derivative Instruments, Net
Changes in the fair value of derivative instruments and net periodic interest benefits/costs are impacted by changing market interest rates and adjustments that we may make to our hedging positions in any given period. In addition, because we continually monitor our hedge positioning and make changes based on our investment portfolio and related financings, management's view of the future path of interest rates, and where
we believe hedges will be most effective in relation to our capital allocation and interest rate risk, gains and losses on derivative instruments will also fluctuate based on the notional amount, maturity, and interest rate of the derivative instruments held during the period. Because of the changes made to our hedgingderivatives portfolio from one reporting period to the next, results of any given reporting period are generally not comparable to results of another.
The following table provides information on our financial instruments accounted for as derivative instruments for the periods indicated:
During | | | | | | | | | | | | | | | | | | | | | |
| Three Months Ended | | |
| ($ in thousands) | March 31, 2021 | | December 31, 2020 | | March 31, 2020 | | | | |
| Interest rate swaps: | | | | | | | | | |
| Net periodic interest benefit | $ | — | | | $ | (7) | | | $ | 2,064 | | | | | |
| Change in fair value | — | | | 7 | | | (184,245) | | | | | |
| Total loss on interest rate swaps, net | — | | | — | | | (182,181) | | | | | |
| Change in fair value of other derivatives used as hedges: | | | | | | | | | |
| Interest rate swaptions | 57,763 | | | 842 | | | (573) | | | | | |
| Options on U.S. Treasury futures | 12,617 | | | (2,371) | | | (10,727) | | | | | |
| U.S. Treasury futures | 95,647 | | | 10,094 | | | (8,447) | | | | | |
| Total gain (loss) on derivatives used as hedges of interest rate risk | 166,027 | | | 8,565 | | | (201,928) | | | | | |
| | | | | | | | | |
| TBA dollar roll positions: | | | | | | | | | |
Change in fair value (1) | (66,794) | | | 8,856 | | | 5,622 | | | | | |
TBA drop income (2) | 8,568 | | | 6,445 | | | 739 | | | | | |
| Total TBA dollar roll (loss) gain, net | (58,226) | | | 15,301 | | | 6,361 | | | | | |
| | | | | | | | | |
| Total gain (loss) on derivative instruments, net | $ | 107,801 | | | $ | 23,866 | | | $ | (195,567) | | | | | |
(1) Changes in fair value for TBA dollar roll positions include unrealized gains (losses) from open TBA contracts and realized gains (losses) on paired off or terminated positions.
(2) TBA drop income represents a portion of the three months ended September 30, 2017,change in fair value and is calculated by multiplying the notional amount of the net TBA dollar roll positions by the difference in price between two TBA securities with the same terms but different settlement dates.
Changes in fair value of our interest rate swaps increased $0.4 millionderivative instruments consist of unrealized gains (losses) on instruments held as a result of higher swap rates (as shown in the Swap Rate Range graph under “Market Conditions and Recent Activity” within "Executive Overview"). Because we are "short" interest rate swaps (i.e., we pay a fixed rate of interest and receive a floating rate of interest based primarily on 3 month LIBOR), increases in swap rates result in increases in the fair value of the interest rate swaps. During the quarter, we also terminated interest rate swaps on which we paid net proceeds of $0.7 million.
For the nine months ended September 30. 2017, the fair value of interest rate swaps declined $15.0 million also as a result of lower swap rates during that period, specifically on the long end of the swap curve. Declines in fair value forperiod and realized gains (losses) from instruments terminated or paired off during the nine months ended September 30, 2016 were largely unfavorable as compared to the same periods in 2017 as a result of a larger declines in rates along the entire swap curve as well as changes in the composition of the hedging portfolio.
Net periodic interest costs for the three and nine months ended September 30, 2017 were higher than the same periods in 2016 due to a larger average notional balance of effective interest rate swaps outstanding at higher weighted-average pay-fixed rates as shown in theperiod. The following table provides information regarding realized gains (losses) on derivative instruments for the periods indicated:
| | | | | | | | | | | | | | | | | |
| Three Months Ended |
| ($ in thousands) | March 31, 2021 | | December 31, 2020 | | March 31, 2020 |
| Interest rate swaps | $ | — | | | $ | — | | | $ | (183,773) | |
| Interest rate swaptions | 31,173 | | | — | | | (1,934) | |
| U.S. Treasury futures | 21,397 | | | 6,457 | | | (10) | |
| Options on U.S. Treasury futures | 1,872 | | | (4,652) | | | (2,422) | |
| TBA long positions | (29,471) | | | 9,882 | | | 19,266 | |
| TBA short positions | — | | | — | | | (7,843) | |
| Total realized gains (losses) on derivatives | $ | 24,971 | | | $ | 11,687 | | | $ | (176,716) | |
|
| | | | | | | | | | | | | | | |
| | Three Months Ended | | Nine Months Ended |
| | September 30, | | September 30, |
| ($ in thousands) | 2017 | | 2016 | | 2017 | | 2016 |
| Average notional balance | $ | 2,668,478 |
| | $ | 305,000 |
| | $ | 2,011,355 |
| | $ | 549,617 |
|
| Weighted average net pay-fixed rate | 1.37 | % | | 0.64 | % | | 1.30 | % | | 1.06 | % |
As mentioned previously, we execute TBA dollar roll transactions which effectively delay the settlement of a forward purchase of an Agency RMBS by entering into an offsetting short position (referred to as a "pair off"), net settling the paired-off positions in cash, and simultaneously entering a similar TBA contract for a later settlement date. TBA securities purchased for a forward settlement month are generally priced at a discount relative to TBA securities sold for settlement in the current month. This discount, often referred to as “drop income” is the economic equivalent of net interest income on the underlying Agency securities over the roll period (interest income less implied financing cost). The average if-settled cost basis of the TBA securities, which represents the basis on which we earned drop income during the three and nine months ended September 30, 2017, and the related drop income are presented in the following table:
|
| | | | | | | | | | | | | | | | |
| | | Three Months Ended | | Nine Months Ended |
| | | September 30, 2017 | | September 30, 2017 |
| ($ in thousands) | | Average Cost Basis | | Drop Income (1) | | Average Cost Basis | | Drop Income (1) |
| TBA securities: | | | | | | | | |
| 3.0% 30-year | | $ | 119,528 |
| | $ | 563 |
| | $ | 69,539 |
| | $ | 960 |
|
| 4.0% 30-year | | 677,956 |
| | 3,339 |
| | 287,298 |
| | 4,293 |
|
| Total TBA securities | | $ | 797,484 |
| | $ | 3,902 |
| | $ | 356,837 |
| | $ | 5,253 |
|
| |
(1) | Drop income is recognized in "gain (loss) on derivatives, net" on our consolidated statements of comprehensive income. |
Loss on Sale of Investments, Net
Sales of our investments occur in the ordinary course of business as we manage our risk, capital and liquidity profiles, and as we reallocate capital to various investments. As mentioned previously, we have been reallocating our capital from adjustable-rate Agency RMBS to generic and specified pools of fixed-rate Agency RMBS, which we believe to be more liquid and less vulnerable to loss in book value from credit spread widening versus other investments in the current macroeconomic environment. The following tables provide information related to our loss on sale of investments, net for the periods indicated:
|
| | | | | | | | | | | | | | | |
| | Three Months Ended |
| | September 30, |
| | 2017 | | 2016 |
| ($ in thousands) | Amortized cost basis sold | | Gain (loss) on sale of investments, net | | Amortized cost basis sold | | Gain (loss) on sale of investments, net |
| Agency RMBS | $ | 398,662 |
| | $ | (5,160 | ) | | $ | — |
| | $ | — |
|
| Agency CMBS | 13,484 |
| | (51 | ) | | — |
| | — |
|
| | $ | 412,146 |
| | $ | (5,211 | ) | | $ | — |
| | $ | — |
|
| | | | | | | | |
| | Nine Months Ended |
| | September 30, |
| | 2017 | | 2016 |
| ($ in thousands) | Amortized cost basis sold | | Gain (loss) on sale of investments, net | | Amortized cost basis sold | | Gain (loss) on sale of investments, net |
| Agency RMBS | $ | 728,952 |
| | $ | (12,392 | ) | | $ | 57,188 |
| | $ | (3,010 | ) |
| Agency CMBS | 206,470 |
| | 523 |
| | — |
| | — |
|
| Non-Agency CMBS | 34,506 |
| | 1,199 |
| | 34,868 |
| | (1,228 | ) |
| Non-Agency RMBS | 16,365 |
| | 42 |
| | — |
| | — |
|
| | $ | 986,293 |
| | $ | (10,628 | ) | | $ | 92,056 |
| | $ | (4,238 | ) |
General and Administrative Expenses
CompensationGeneral and benefits expense was $0.3administrative expenses decreased $(1.4) million and $0.5 million higher for the three and nine months ended September 30, 2017March 31, 2021 compared to the same periods in 2016three months ended December 31, 2020 due primarily due to the timingabsence of the year-end bonus expense accrual andadjustment that impacted the related payments. Other generalfourth quarter of 2020. General and administrative expenses were $0.5increased $0.8 million higher for the ninethree months ended September 30, 2017March 31, 2021 compared to the same period in 2016three months ended March 31, 2020 due primarily to higher legal expenses related to a lawsuit filed in 2017 which is discussed in more detail in Item 1 of Part II of this Quarterly Report on Form 10-Q.
Other Comprehensive Income
The following table provides detail on the changes in fair value by type of MBS which are recorded as unrealized gains (losses) in other comprehensive income on our consolidated statements of operationsbonus accruals for the periods indicated:first quarter of 2021 compared to the first quarter of 2020.
|
| | | | | | | | | | | | | | | |
| | Three Months Ended | | Nine Months Ended |
| | September 30, | | September 30, |
| ($ in thousands) | 2017 | | 2016 | | 2017 | | 2016 |
| Agency CMBS | $ | 2,334 |
| | $ | (1,226 | ) | | $ | 14,859 |
| | $ | 40,093 |
|
| Non-Agency CMBS | (403 | ) | | (377 | ) | | (2,591 | ) | | 2,036 |
|
| Agency CMBS IO | 1,032 |
| | 1,616 |
| | 7,268 |
| | 4,187 |
|
| Non-Agency CMBS IO | 1,101 |
| | 2,131 |
| | 9,431 |
| | 5,832 |
|
| Agency RMBS | 2,120 |
| | (1,765 | ) | | 9,734 |
| | 12,548 |
|
| Non-Agency RMBS | 8 |
| | 390 |
| | 14 |
| | 802 |
|
| Unrealized gain on available-for-sale investments | $ | 6,192 |
| | $ | 769 |
| | $ | 38,715 |
| | $ | 65,498 |
|
Credit spreads tightened during the three months ended September 30, 2017 and September 30, 2016 which increased the fair value of MBS in our portfolio during those periods and more than offset the impact of slightly higher interest rates during those same periods. The increase in fair value of MBS of $38.7 million during the nine months ended September 30, 2017 was primarily due to credit spread tightening during the period. The increase in fair value of MBS of $65.5 million during the nine
months ended September 30, 2016 was primarily due to declining interest rates during the period, which favorably impacted the longer duration investments such as Agency CMBS.
LIQUIDITY AND CAPITAL RESOURCES
Our primary sources of liquidity include borrowings under repurchase arrangements and monthly principal and interest payments we receive on our investments. Additional sources may also include proceeds from the sale of investments, equity offerings, and payments received from counterparties from interest rate swap agreements.for derivative instruments. We use our liquidity to purchase investments and to pay our operating expenses and dividends on our common and preferred stock. We also use our liquidity to post initialmeet margin and variation margin onrequirements for our repurchase agreements and derivative transactions, including TBA contracts, when required under the terms of the related agreements. We may also periodically use liquidity to repurchase shares of ourthe Company’s stock.
Our liquid assets fluctuateliquidity fluctuates based on our investment activities, our financing and capital raising activities, and changes in the fair value of our MBSinvestments and derivative instruments. We seek to maintain sufficient liquidity to support our operations and to meet our anticipated liquidity demands, including potential margin calls from lenders (as discussed further below). We measure, manage, and forecast our liquidity on a daily basis. Our availablemost liquid assets include unrestricted cash and cash equivalents unencumbered Agency MBS, and certain unencumbered non-Agency MBS that can be pledged as collateral for margin calls or converted reasonably quickly into cash. As of September 30, 2017, our available liquid assets were $239.2 million, which consisted of unrestricted cash and cash equivalents of $117.7 millionand unencumbered Agency MBS of $121.5 million, compared to $138.1RMBS, CMBS, and CMBS IO which were $528.6 million as of March 31, 2021 compared to $415.3 million as of December 31, 2016. Unencumbered Agency MBS excludes purchases and sales of MBS pending settlement. The increase in available liquid assets since December 31, 2016 is primarily due to our shift in investment mix.
2020.
We perform sensitivity analysis onanalyze our liquidity under various scenarios based on changes in the fair value of our investments and derivative instruments due to market factors such as changes in the absolute level of interest rates and the shape of the yield curve, credit spreads, lender haircuts, and prepayment speeds as well as changes in the fair value of our derivative instruments due to changes in interest rates.speeds. In performing this analysisthese analyses, we will also consider the current state of the fixed income markets and the repurchase agreement markets in order to determine if market forces such as supply-demand imbalances or structural changes to these markets could change the liquidity of MBS or the availability of financing. The objective of our analysisanalyses is to assess the adequacy of our liquidity to withstand potential adverse events.events, such as the current COVID-19 pandemic. We may change our leverage targets based on market conditions and our perceptions of the liquidity of our investments.
We closely monitor our debt-to-invested Our leverage, which we calculate using total liabilities plus the cost basis of TBA long positions, was 6.9x shareholders’ equity ratio (which isas of March 31, 2021 compared to 6.3x as of December 31, 2020. The increase in leverage resulted from an 82% increase in the ratio of debt financing to invested equity for any investment) as partcost basis of our liquidity management processinvestment in TBA securities as wellof March 31, 2021 compared to December 31, 2020. This increase was partially offset by a 15% increase in our equity, which increased primarily as our overall enterprise level debt-to-equity ratio.a result of the two capital raises during the first quarter of 2021. We also monitor the ratio of our available liquidity to outstanding repurchase agreement borrowings, which fluctuates due to changes in the fair value of collateral we have pledged to our lenders. On an enterprise level basis, our current operating policies limit our total liabilities-to-shareholders' equity to 8 times our shareholders' equity. Includinginclude our TBA position at cost (if settled), which was $683.8 million as of September 30, 2017, ourlong positions in evaluating the Company’s leverage was 6.3 times shareholders' equity. The financing for TBA securities is implied through our use of TBA dollar roll transactions whereby we enter into an offsetting TBA contract and net settle the paired off position in cash. Itbecause it is possible under certain market conditions that it may be uneconomical for us to roll oura TBA contractslong position into future months, which may result in us having to take physical delivery of the underlying securities. Because under those circumstances we would havesecurities and use cash or other financing sources to fund our total purchase commitmentcommitment. Management expects leverage to increase modestly over the next 6 months given current expectations of market conditions. In general, our leverage will increase if we are able to purchase investments with cash or other financing sources, which may impact our liquidity position, management includes our TBA position at cost (if settled) in evaluating the Company's leverage.higher expected returns than currently exist today.
The following table presents information regarding the balances of our repurchase agreement borrowings and our net TBA position for the periods indicated:
|
| | | | | | | | | | | | | | | | | | | |
| | Repurchase Agreements | | Net TBA Position (1) |
| ($ in thousands) | Balance Outstanding As of Quarter End | | Average Balance Outstanding For the Quarter Ended | | Maximum Balance Outstanding During the Quarter Ended | | Balance Outstanding As of Quarter End | | Average Balance Outstanding For the Quarter Ended |
| September 30, 2017 | $ | 2,519,230 |
| | $ | 2,616,250 |
| | $ | 2,801,418 |
| | $ | 683,813 |
| | $ | 745,270 |
|
| June 30, 2017 | 2,540,759 |
| | 2,753,019 |
| | 2,826,005 |
| | 416,312 |
| | 305,720 |
|
| March 31, 2017 | 2,825,945 |
| | 2,843,733 |
| | 2,913,617 |
| | — |
| | — |
|
| December 31, 2016 | 2,898,952 |
| | 2,768,769 |
| | 2,938,745 |
| | — |
| | — |
|
| September 30, 2016 | 2,478,278 |
| | 2,536,562 |
| | 2,599,491 |
| | — |
| | — |
|
| |
(1) | Balance outstanding as of quarter end and average balance outstanding for the quarter ended for net TBA position are reported at cost (as if settled). |
Repurchase Agreements
Our repurchase agreement borrowings are generallyprincipally uncommitted with terms renewable at the discretion of our lenders without guaranteed roll-over terms. Given theand have short-term and uncommitted nature of most of our repurchase agreement financing,maturities. As such, we attempt to maintain unused capacity under our existing repurchase agreement credit lines with multiple counterparties, which helps protect us in the event of a counterparty's failure to renew existing repurchase agreements eitheragreements. As part of our continuous evaluation of counterparty risk, we maintain our highest counterparty exposures with favorable termsbroker dealer subsidiaries of regulated financial institutions or at all. Asprimary dealers whom we believe are better capitalized and more durable counterparties.
The following table presents information regarding the balances of September 30, 2017, we hadour repurchase agreement borrowings outstanding with 18 of our 34 available repurchase agreement counterparties at a weighted average borrowing rate of 1.51% compared to 1.03% as of December 31, 2016. Our repurchase agreement borrowings generally carry a rate of interest based on a spread to an index such as LIBOR.and for the periods indicated:
| | | | | | | | | | | | | | | | | |
| Repurchase Agreements |
| ($ in thousands) | Balance Outstanding As of
Quarter End | | Average Balance Outstanding For the Quarter Ended | | Maximum Balance Outstanding During the Quarter Ended |
| March 31, 2021 | $ | 2,032,089 | | | $ | 2,158,121 | | | $ | 2,437,163 | |
| December 31, 2020 | 2,437,163 | | | 2,500,639 | | | 2,594,683 | |
| September 30, 2020 | 2,594,683 | | | 2,984,946 | | | 3,314,991 | |
| June 30, 2020 | 3,314,991 | | | 2,580,296 | | | 4,408,106 | |
| March 31, 2020 | 4,408,106 | | | 4,701,010 | | | 4,917,731 | |
| December 31, 2019 | 4,752,348 | | | 4,806,826 | | | 4,891,341 | |
For our repurchase agreement borrowings, we are required to post and maintain margin to the lender (i.e., collateral in excess of the repurchase agreement financing) in order to support the amount of the financing. This excess collateral is often referred to as a "haircut" (and which we also refer“haircut” and is intended to as equity at risk). Asprovide the collateral pledged is generally MBS, thelender some protection against fluctuations in fair value of the collateral can fluctuate with changes inand/or the failure by us to repay the borrowing at maturity. Lenders have the right to change haircut requirements at maturity of the repurchase agreement (if the term is renewed) and may change their haircuts based on market conditions.conditions and the perceived riskiness of the collateral pledged. If the fair value of the collateral falls below the haircut required by the lender, the lender has the right to demand additional margin, or collateral, to increase the haircut back to the initial amount. These demands are typically referred to as "margin calls".“margin calls”, and if we fail to meet any margin call, our lenders have the right to terminate the repurchase agreement and sell any collateral pledged. Declines in the fair value of investments occur for any number of reasons including but not limited to changes in interest rates, changes in ratings on an investment, changes in actual or perceived liquidity of the investment, or changes in overall market risk perceptions. Additionally, values in Agency RMBS will also decline from the payment delay feature of those securities. Agency RMBS have a payment delay feature whereby Fannie Mae and Freddie Mac announce principal payments on Agency RMBS but do not remit theMBS in advance of their actual remittance of principal payments, and interest for 20 days in the case of Fannie Mae and 40 days in the case of Freddie Mac. Because these securities are financed with repurchase agreements, the repurchase agreement lenderlenders generally makes amake margin callcalls for an amount equal to the product of their advance rate on the repurchase agreement and the announced principal payments on the Agency RMBS. This causesA margin call made by a temporary use oflender reduces our liquidity to meet the margin call until we receive the principal payments from Fannie Mae and interest 20 to 40 days later.
Freddie Mac. The weighted average haircut for our borrowings collateralized with Agency RMBS, Agency CMBS, and CMBS IO was 4.8%, 4.8%, and 15.6%, respectively, as of March 31, 2021, unchanged from those as of December 31, 2020.
The following table presents the weighted average minimum haircut contractually required by our counterparties for MBS pledged as collateral forwe post in excess of our repurchase agreement borrowingsborrowing with any counterparty is also typically referred to by us as of“equity at risk”, which represents the dates indicated:
|
| | | | | | | | | | | | | | |
| | September 30, 2017 | | June 30, 2017 | | March 31, 2017 | | December 31, 2016 | | September 30, 2016 |
| Agency CMBS and RMBS | 5.0 | % | | 5.0 | % | | 5.0 | % | | 5.0 | % | | 5.1 | % |
| Non-Agency CMBS and RMBS | 15.0 | % | | 18.0 | % | | 15.8 | % | | 16.3 | % | | 17.0 | % |
| CMBS IO | 15.0 | % | | 15.0 | % | | 15.3 | % | | 15.4 | % | | 15.4 | % |
potential loss to the Company if the counterparty is unable or unwilling to return collateral securing the repurchase agreement borrowing at its maturity. The counterparties with whom we have the greatest amounts of equity at risk may vary significantly during any given period due to the short-term and generally uncommitted nature of the repurchase agreement borrowings. Equity at risk is defined as the amount pledged as collateral to the counterparty in excessAs of the borrowed amount outstanding. This equity at risk represents the potential loss toMarch 31, 2021, the Company if the counterparty is unable or unwilling to return collateral securing the repurchase agreement borrowing at its maturity. The following tables present the counterparties with whom we had greater than 5% of our equity at risk as of September 30, 2017 and December 31, 2016:
|
| | | | | | | |
| | September 30, 2017 |
| ($ in thousands) | Amount Outstanding | | Equity at Risk |
| Well Fargo Bank, N.A. and affiliates | $ | 349,965 |
| | $ | 57,992 |
|
| JP Morgan Securities, LLC | 270,883 |
| | 30,803 |
|
| | $ | 620,848 |
| | $ | 88,795 |
|
|
| | | | | | | |
| | December 31, 2016 |
| ($ in thousands) | Amount Outstanding | | Equity at Risk |
| Well Fargo Bank, N.A. and affiliates | $ | 342,160 |
| | $ | 62,041 |
|
| South Street Financial Corporation | 597,394 |
| | 38,770 |
|
| JP Morgan Securities, LLC | 212,921 |
| | 35,658 |
|
| | $ | 1,152,475 |
| | $ | 136,469 |
|
The following table discloses our repurchase agreement amounts outstanding with 20 of its 37 available repurchase agreement counterparties and the valuedid not have more than 5% of theequity at risk with any counterparty or group of related collateral pledged by geographic region of our counterparties as of September 30, 2017counterparties.
We have various financial and December 31, 2016:
|
| | | | | | | | | | | | | | | |
| | September 30, 2017 | | December 31, 2016 |
| ($ in thousands) | Amount Outstanding | | Market Value of Collateral Pledged | | Amount Outstanding | | Market Value of Collateral Pledged |
| North America | $ | 1,685,493 |
|
| $ | 1,840,749 |
| | $ | 2,105,337 |
| | $ | 2,309,391 |
|
| Asia | 521,832 |
|
| 548,717 |
| | 421,991 |
| | 443,098 |
|
| Europe | 311,905 |
|
| 328,537 |
| | 371,624 |
| | 397,351 |
|
| | $ | 2,519,230 |
| | $ | 2,718,003 |
| | $ | 2,898,952 |
| | $ | 3,149,840 |
|
Certainoperating covenants in certain of our repurchase agreement counterparties require us to comply with various operating and financial covenants. The financial covenants includeagreements including, among other things, requirements that we maintain minimum shareholders' equity (usually a set minimum, or a percentage of the highest amount of shareholders' equity since the date of the agreement), limits on maximum decline in shareholders' equity (expressed as a percentage decline in any given period), and limits on maximum leverage (as a multiple of shareholders' equity). Operating requirements include, among other things,, and requirements to maintain our status as a REIT and to maintain our listing on the NYSE. Violations of one or more of these covenants could result in the lender declaring an event of default which would result in the termination of the repurchase agreement and immediate acceleration of amounts due thereunder. In addition, some of the agreements contain cross default features, whereby default with one lender simultaneously causes default under agreements with other lenders. Violations could also restrict us from paying dividends or engaging in other transactions that are necessary for us to maintain our REIT status.
We monitor and evaluate on an ongoing basis the impact these customary financial covenants may have on our operating and financing flexibility. Currently, we do not believe we are subject to any covenants that materially restrict our financing flexibility. We were in full compliance with our debt covenants as of March 31, 2021, and we are not aware of any circumstances which could potentially result in our non-compliance in the foreseeable future.
Derivative Instruments
OurWe use certain types of financial instruments that are accounted for as derivative instruments, including interest rate swaps, futures, options, and long and short positions in TBA securities. Certain of these derivative instruments may require us to post initial margin at inception and daily variation margin based on subsequent changes in thetheir fair value of the derivatives.value. The collateral posted as margin by us is typically in the form of cash or Agency MBS. Counterparties may have to post variation margin to us. Generally, as interest rates decline, due to market changes, we will be required to post collateral with counterparties on our pay-fixed derivative instruments and receive collateral from our counterparties on our receive-fixed derivative instruments,interest rate derivatives and vice versa as interest rates increase. As of September 30, 2017,March 31, 2021, we had received cash collateral of $44.0$83.8 million posted as initial marginfrom our counterparties under these agreements.
As of September 30, 2017, approximately $160 million of the Company's interest rate swaps were entered into under bilateral agreements which contain cross-default provisions with other agreements between the parties. In addition, these bilateral agreements contain financial and operational covenants similar to those contained in our repurchase agreements, as described above. Currently, we do not believe we are subject to any covenants that materially restrict our hedging flexibility.
Our TBA contracts are subject to master securities forward transaction agreements published by the Securities Industry and Financial Markets Association as well as supplemental terms and conditions with each counterparty. Under the terms of these agreements, we may be required to pledge collateral to, or have the right to receive collateral from, our counterpartycounterparties when initiated or in the event the fair value of our TBA contracts declines and such counterparty demandsdeclines. As of March 31, 2021, we had cash of $49.2 million posted as collateral through a margin call.under these agreements. Declines in the fair value of TBA contracts are generally related to such factors as rising interest rates, increases in expected prepayment speeds, or widening spreads. Our TBA contracts generally provide that valuations for our TBA contracts and any pledged collateral are to be obtained from a generally recognized source agreed to by both parties. However, in certain circumstances, our counterparties have the sole discretion to determine the value of the TBA contract and any pledged collateral. In such instances, our counterparties are required to act in
good faith in making determinations of value. In the event of a margin call, we must generally provide additional collateral on the same business day.
Dividends
As a REIT, we are required to distribute to our shareholders amounts equal to at least 90% of our REIT taxable income for each taxable year after consideration of our tax NOL carryforwards.certain deductions. We generally fund our dividend distributions through our cash flows from operations. If we make dividend distributions in excess of our operating cash flows during the period, whether for purposes of meeting our REIT distribution requirements or other strategic reasons, those distributions are generally funded either through our existing cash balances or through the return of principal from our investments (either through repayment or sale).
We have a net operating tax loss ("NOL") carryforward that we could usePlease refer to offset our REIT taxable income distribution requirement. This NOL carryforward had an estimated balance of approximately $89.8 million"Federal Income Tax Considerations" within Part I, Item 1, "Business" as of September 30, 2017. We also have deferred tax hedge losses on terminated derivative instruments, which will be recognized over the original periods being hedged by those terminated derivatives. These losses have already been recognized in our GAAP earnings but will reduce taxable income over the next ten yearswell as noted in the following table:
|
| | | |
| ($ in thousands) | Tax Hedge Loss Deduction |
| 2017 | $ | 21,542 |
|
| 2018 | 21,175 |
|
| 2019 | 16,937 |
|
| 2020 - 2026 | 12,383 |
|
| | $ | 72,037 |
|
If any of the deferred tax hedge losses for the years noted in the table above result in dividend distributions to our shareholders in excess of REIT taxable income, the excess dividends distributed will be considered a return of capital to the shareholder. As of September 30, 2017, we estimated that approximately 75%Part I, Item 1A, “Risk Factors” of our common stock2020 Form 10-K for additional important information regarding dividends declared during the nine months ended September 30, 2017 will represent a return of capital to shareholders and not a distribution of REITon our taxable income, principally as a result of the amount of the tax hedge loss deduction.income.
Contractual Obligations and Other Matters
The following table summarizes ourAs of March 31, 2021, we do not have any material contractual obligations by payment due date as of September 30, 2017:
|
| | | | | | | | | | | | | | | | | | | | |
| ($ in thousands) | | Payments due by period |
| Contractual Obligations: | | Total | | < 1 year | | 1-3 years | | 3-5 years | | > 5 years |
Repurchase agreements (1) | | $ | 2,557,279 |
| | $ | 2,557,279 |
| | $ | — |
| | $ | — |
| | $ | — |
|
Non-recourse collateralized financing (2) | | 5,786 |
| | 1,669 |
| | 2,199 |
| | 1,207 |
| | 711 |
|
| Operating lease obligations | | 544 |
| | 214 |
| | 330 |
| | — |
| | — |
|
| Total | | $ | 2,563,609 |
| | $ | 2,559,162 |
| | $ | 2,529 |
| | $ | 1,207 |
| | $ | 711 |
|
(1) Includes estimated interest payments calculated using interest rates in effect as of September 30, 2017.
(2) Amounts shown are for principal only and exclude interest obligations as thoseother than the short-term repurchase agreement amounts are not significant. Non-recourse collateralized financing represents securitization financing that is payable solely from loans and securities pledged as collateral. Payments due by period were estimated based on the principal repayments forecasted for the underlying loans and securities, substantially all of which is used to repay the associated financing outstanding.
Other Matters
As of September 30, 2017,discussed above, nor do we do not believe that any off-balance sheet arrangements exist that are reasonably likely to have a material effect on our current or future financial condition, results of operations, or liquidity other than as discussed above. In addition, we do not have any material commitments for capital expenditures and have not obtained any commitments for funds to fulfill any capital obligations.
RECENT ACCOUNTING PRONOUNCEMENTS
There were no accounting pronouncements issued during the three months ended March 31, 2021 that are expected to have a material impact on the Company’s financial condition or results of operations. Please refer to Note 1 to of the Notes to the Unaudited Consolidated Financial Statements contained inwithin Part I, Item 1 of this Quarterly Report on Form 10-Q for information regarding recently issuedadditional information.
CRITICAL ACCOUNTING ESTIMATES
The discussion and analysis of our financial condition and results of operations are based in large part upon our consolidated financial statements, which have been prepared in accordance with GAAP. The preparation of our consolidated financial statements requires management to make estimates, judgments and assumptions that affect the reported amounts of
assets, liabilities, revenues and expenses and disclosure of contingent assets and liabilities. We base these estimates and judgments on historical experience and assumptions believed to be reasonable under current facts and circumstances. Actual results, however, may differ from the estimated amounts we have recorded.
Critical accounting pronouncements.estimates are defined as those that require management's most difficult, subjective or complex judgments, and which may result in materially different results under different assumptions and conditions. Our critical accounting estimates are discussed in Part II, Item 7, “Management’s Discussion and Analysis of Financial Condition and Results of Operations” of our 2020 Form 10-K under “Critical Accounting Estimates.” There have been no significant changes in our critical accounting estimates during the three months ended March 31, 2021.
FORWARD-LOOKING STATEMENTS
Certain written statements in this Quarterly Report on Form 10-Q that are not historical facts constitute “forward-looking statements” within the meaning of Section 27A of the Securities Act of 1933, Actas amended, and Section 21E of the Securities Exchange Act.Act of 1934, as amended (the “Exchange Act”). Statements in this report addressing expectations, assumptions, beliefs, projections, future plans and strategies, future events, developments that we expect or anticipate will occur in the future, and future operating results, capital management, and dividend policy are forward-looking statements. Forward-looking statements are based upon management’s beliefs, assumptions, and expectations as of the date of this report regarding future events and operating performance, taking into account all information currently available to us, and are applicable only as of the date of this report. Forward-looking statements generally can be identified by use of words such as “believe”, “expect”, “anticipate”, “estimate”, “plan”, “may”, “will”, “intend”, “should”, “could” or similar expressions. We caution readers not to place undue reliance on our forward-looking statements, which are not historical facts and may be based on projections, assumptions, expectations, and anticipated events that do not materialize. Except as required by law, we are not obligated to, and do not intend to, update or revise any forward-looking statement whether as a result of new information, future events, or otherwise.
Forward-looking statements in this Quarterly Report on Form 10-Q may include, but are not limited to:to statements about:
•Our business and investment strategy including our ability to generate acceptable risk-adjusted returns and our target investment allocations;allocations, and our views on the future performance of MBS and other investments;
•Our views on the macroeconomic environment, monetary and fiscal policy, and conditions in the investment, credit, and derivatives markets;
•Our views on the effect of actual or proposed actions of the U.S. Federal Reserve, and the FOMCFederal Reserve’s Federal Open Market Committee (the “FOMC”), the FHFA, or other central banks with respect to monetary policy (including the targeted Federal Funds Rate), and the potential impact of these actions on interest rates, inflation or unemployment;
•The effect of regulatory initiatives of the Federal Reserve (including the FOMC), other financial regulators, and other financial regulators;central banks;
•Our financing strategy including our target leverage ratios, our use of TBA dollar roll transactions, and anticipated trends in financing costs including TBA dollar roll transaction costs, and our hedging strategy including changes to the derivative instruments to which we are a party, and changes to government regulation of hedging instruments and our use of these instruments;
•Our investment portfolio composition and target investments;
•Our investment portfolio performance, including the fair value, yields, and forecasted prepayment speeds of our investments;
•The impact of COVID-19 on the economy, as well as certain actions taken by federal, state and local governments in response to the pandemic, on delinquencies in loans underlying our investments;
•Our liquidity and ability to access financing, and the anticipated availability and cost of financing;
•Our capital stock repurchase activity andincluding the impact of stock issuances and repurchases;
•The amount, timing, and funding of future dividends;
•Our use of and restrictions on using our tax NOL carryforward;
•The status of pending litigation;
•The competitive environment in the future, including competition for investments and the availability of financing;
•Estimates of future interest expenses, including related to the Company'sCompany’s repurchase agreements and derivative instruments;
•The status and effect of legislative reforms and regulatory rule-making or review processes, and the status of reform efforts and other business developments in the repurchase agreement financing market;
•Market, industry and economic trends, and how these trends and related economic data may impact the behavior of market participants and financial regulators;
•The financial position and credit worthiness of the depository institutions in which the Company’s cash deposits are held;
•The impact of applicable tax and accounting requirements on the Company;
•Our future compliance with covenants in our master repurchase agreements and debt covenants in our debt agreements;
•Market interest rates and market spreads.spreads; and
•Possible future effects of the COVID-19 pandemic.
Forward-looking statements are inherently subject to risks, uncertainties and other factors that could cause our actual results to differ materially from historical results or from any results expressed or implied by such forward-looking statements. Not all of these risks and other factors are known to us. New risks and uncertainties arise over time, and it is not possible to predict those events or how they may affect us. The projections, assumptions, expectations or beliefs upon which the forward-looking statements are based can also change as a result of these risks or other factors. If such a risk or other factor materializes in future periods, our business, financial condition, liquidity and results of operations may vary materially from those expressed or implied in our forward-looking statements.
While it is not possible to identify all factors, some of the factors that may cause actual results to differ from historical results or from any results expressed or implied by forward-looking statements, or that may cause our projections, assumptions, expectations or beliefs to change, some of those factors include the following:
•the risks and uncertainties referenced in this Quarterly Report on Form 10-Q, particularlyespecially those set forth under and incorporated by reference into Part II, Item 1A, “Risk Factors”;, and in particular, adverse effects of the ongoing COVID-19 pandemic and any governmental or societal responses thereto, including the efficacy, distribution, and adoption rates of vaccines for COVID-19 and variants thereof;
•our ability to find suitable reinvestment opportunities;
•changes in domestic economic conditions;
•changes in interest rates and interest rate spreads, including the repricing of interest-earning assets and interest-bearing liabilities;
•our investment portfolio performance particularly as it relates to cash flow, prepayment rates and credit performance;
•the impact on markets and asset prices from changes in the Federal Reserve's balance sheet normalization process throughReserve’s policies regarding the reduction in its holdingspurchases of Agency RMBS, Agency CMBS, and U.S. TreasuriesTreasuries;
•actual or anticipated changes in Federal Reserve monetary policy;policy or the monetary policy of other central banks;
•adverse reactions in U.S. financial markets related to actions of foreign central banks or the economic performance of foreign economies including in particular China, Japan, the European Union, and the United Kingdom;
•uncertainty concerning the long-term fiscal health and stability of the United States;
•the cost and availability of financing, including the future availability of financing due to changes to regulation of, and capital requirements imposed upon, financial institutions;
•the cost and availability of new equity capital;
•changes in our use of leverage;
•changes to our investment strategy, operating policies, dividend policy or asset allocations;
•the quality of performance of third-party servicer providers of our loans and loans underlying our securities;
•the level of defaults by borrowers on loans we have securitized;
•changes in our industry;
•increased competition;
•changes in government regulations affecting our business;
•changes or volatility in the repurchase agreement financing markets and other credit markets;
•changes to the market for interest rate swaps and other derivative instruments, including changes to margin requirements on derivative instruments;
•uncertainty regarding continued government support of the U.SU.S. financial system and U.S. housing and real estate markets;markets, or to reform the U.S. housing finance system including the resolution of the conservatorship of Fannie Mae and Freddie Mac;
•the composition of the Board of Governors of the Federal Reserve System;
ownership shifts under Section 382 that further limit the use of our tax NOL carryforward;•systems failures or cybersecurity incidents; and
•exposure to current and future claims and litigation.
ITEM 3. QUANTITATIVE AND QUALITATIVE DISCLOSURES ABOUT MARKET RISK
Market risk is the exposure to losses resulting from changes in market factors. Our business strategy exposes us to a variety of market risks, including interest rate, spread, prepayment, reinvestment, credit, liquidity, and liquidityreinvestment risks. These risks can and do cause fluctuations in our liquidity, comprehensive income and book value as discussed below.
Interest Rate Risk
Investing in interest-rate sensitive investments such as MBS and TBA securities subjects us to interest rate risk. Interest rate risk results from investing in securities that have a fixed coupon or when the coupon may not immediately adjust for changes in interest rates. Interest rate risk also results from the mismatch between the duration of our assets versus the duration of our liabilities and hedges. With respect to MBS, mismatch in duration is usually the result of interest-rate reset or maturity dates and differing cash flow profiles of our assets versus our liabilities. Borrowing costs on our liabilities are generally based on prevailing short-term market rates and reset more frequently than interest rates on our assets. Changes in interest rates and changes in the forward curve also impact the market value of our investment portfolio and our derivative instruments (including TBA securities and interest rate swaps).
The measures of an instrument's price sensitivity to interest rate fluctuations are its duration and convexity. Duration measures the percentage change in projected market value of our investments and derivative instruments given a change in interest rates. The duration of our RMBS and TBA securities tend to increase when interest rates rise and decrease when interest rates fall, which is commonly referred to as negative convexity. This occurs because prepayments of the mortgage loans underlying the RMBS tend to decline when interest rates rise (which extends the life of the security) and increase when interest rates fall (which shortens the life of the security). The fair value of TBA securities react similarly to RMBS to changes in interest rates as they are based on an underlying generic pool of fixed-rate RMBS securities. CMBS and CMBS IO, however, generally have little convexity because the mortgage loans underlying the securities contain some form of prepayment protection provision (such as prepayment lock-outs) or prepayment compensation provisions (such as yield maintenance or prepayment penalties) which create an economic disincentive for the loans to prepay.
We attempt to manage our exposure to changes in interest rates that results from the duration mismatch between our assets and liabilities by entering into interest rate swaps to hedge this risk. We manage interest rate risk within tolerances set by our Board of Directors. Our portfolio duration changes based on the composition of our investment portfolio and our hedge positions as well as market factors. We calculate our portfolio duration based on model projected cash flows, and such calculated duration can be an imprecise measure of actual interest rate risk. In the case of Agency RMBS and TBA securities, the primary input to the calculated duration is the anticipated prepayment speed of the underlying mortgage loans, which is sensitive to future interest rates and borrowers' behavior. Estimates of prepayment speeds can vary significantly by investor for the same security and therefore estimates of security and portfolio duration can vary significantly.
During a period of rising interest rates (particularly short term rates in a flattening yield curve environment), our borrowing costs will increase faster than our asset yields, negatively impacting our net interest income. The amount of the impact will depend on the composition of our portfolio, our hedging strategy, the effectiveness of our hedging instruments as well as the magnitude and the duration of the increase in interest rates. In addition,
We attempt to manage our adjustable-rate Agency RMBS reset based on one-year LIBOR and have limits or caps on the initial, aggregate, or periodic amount that an interest rate may reset while our liabilities do not have interest rate reset caps. As of September 30, 2017, we had a positive net duration gap in our investment portfolio, which means our liabilities mature or reset sooner than our investments, and we had not fully hedged this difference. Therefore, increasesexposure to changes in interest rates particularly rapid increases, will negativelyby entering into interest rate hedging instruments to mitigate the impact of changing interest rates on the market value of our investments, thereby reducing our book value.assets. In additionprior periods, we have also used interest rate hedges to mitigate the information set forth in the tables below, see "Spread Risk" below for further discussionimpact of the risks to the market value of our investments. For further discussion of the reset features of our hybrid ARMs, please refer to "Financial Condition-RMBS" within Part I, Item 2 of this Quarterly Report on Form 10-Q.
The table below shows the projected sensitivity of our netchanging interest income and net periodic interest costsrates on our interest expense from repurchase agreements used to finance our investments. Given current FOMC monetary policy, management anticipates funding costs to remain low and stable in the near-term, and as such, we are not currently hedging our repurchase agreement financing costs.
We manage interest rate swaps;risk within tolerances set by our Board of Directors. Our hedging techniques are highly complex and are partly based on assumed levels of prepayments of our assets. If prepayments are slower or faster than assumed, the projected sensitivity of the market valuematurity of our investments will also differ from our expectations, which could reduce the effectiveness of our hedging strategies and derivative instruments (including TBA securities);may cause losses on such transactions and adversely affect our cash flow. Estimates of prepayment speeds can vary significantly by investor for the percentage change in shareholders' equity as they existed assame security, and therefore estimates of the periods indicated based on an instantaneous parallel shift in market interest rates as set forth in the table below. In light of the low interest rate environment at September 30, 2017, the only declining rate scenario that we present is a downward shift of 50 basis points.
security and portfolio duration can vary significantly.
Changes in types of our investments, the returns earned on these investments, future interest rates, credit spreads, the shape of the yield curve, the availability of financing, and/or the mix of our investments and financings including derivative instruments may cause actual results to differ significantly from the modeled results.results shown in the tables below. There can be no assurance that assumed events used forto model the modelresults shown below will occur, or that other events will not occur, that will affect the outcomes; therefore, the modeled results shown in the tables below and all related disclosures constitute forward-looking statements.
The table below shows the projected sensitivity of our net interest income as of the dates indicated assuming an instantaneous parallel shift in interest rates and no changes in the composition of our investment portfolio:
| | | | | | | | | | | | | | | | | | | | | | | |
| Projected Change in Net Interest Income Due To |
| Decrease in Interest Rates of | | Increase in Interest Rates of |
| 50 Basis Points | | 25 Basis Points | | 25 Basis Points | | 50 Basis Points |
| March 31, 2021 | (1) | | 2.7 | % | | (7.2) | % | | (15.0) | % |
| December 31, 2020 | (1) | | 0.4 | % | | (5.9) | % | | (12.9) | % |
(1) Because the Company does not assume financing rates will be less than 0%, a parallel downward shift in interest rates of 50 basis points is not presented.
|
| | | | | | | | | | | | |
| | | September 30, 2017 | | December 31, 2016 |
| | | Percentage Change in | | Percentage Change in |
| Parallel Shift in Interest Rates | | Market Value of Investments (1) | | Shareholders' Equity | | Net Interest Income and Net Periodic Interest Costs (2) | | Market Value of Investments (1) | | Shareholders' Equity | | Net Interest Income and Net Periodic Interest Costs (2) |
| +100 | | (1.3)% | | (9.1)% |
| 10.3% | | (0.6)% | | (4.4)% | | (42.4)% |
| +50 | | (0.5)% | | (3.7)% | | 5.6% | | (0.3)% | | (1.9)% | | (20.7)% |
| -50 | | 0.3% | | 2.1% | | (7.2)% | | 0.2% | | 1.2% | | 18.7% |
| |
(1) | Includes changes in market value of our investments and derivative instruments, including TBA securities, but excludes changes in market value of our financings because they are not carried at fair value on our balance sheet. The projections for market value do not assume any change in credit spreads. |
| |
(2) | Includes changes in net interest income as well as net periodic interest costs on our interest rate swaps recorded in "gain (loss) on derivatives instruments, net". |
The projected impactsensitivity to changes in interest rates on our net interest related earningsincome shown in an increasingthe table above as of March 31, 2021 has increased slightly compared to December 31, 2020 because the higher interest rate environment changed from arates as of March 31, 2021 resulted in the projected declineprepayment speed for our Agency RMBS not slowing as much as it did as of December 31, 20162020, which decreased the benefit of lower amortization expense compared to aDecember 31, 2020.
The table below shows the projected increasesensitivity of the market value of our financial instruments and the percentage change in shareholders’ equity assuming an instantaneous parallel shift in market interest rates as of September 30, 2017the dates indicated:
| | | | | | | | | | | | | | | | | | | | | | | | | | | | | | | | | | | | | | | | | | | | | | | | | | |
| | March 31, 2021 |
| | Decrease in Interest Rates of | | Increase in Interest Rates of |
| | 100 Basis Points | | 50 Basis Points | | 50 Basis Points | | 100 Basis Points |
Type of Instrument (1) | | % of Market Value | | % of Common Equity | | % of Market Value | | % of Common Equity | | % of Market Value | | % of Common Equity | | % of Market Value | | % of Common Equity |
| RMBS | | 3.1 | % | | 12.3 | % | | 1.9 | % | | 7.8 | % | | (2.4) | % | | (9.7) | % | | (5.0) | % | | (20.1) | % |
| CMBS | | 0.5 | % | | 2.0 | % | | 0.3 | % | | 1.0 | % | | (0.3) | % | | (1.0) | % | | (0.5) | % | | (2.0) | % |
| CMBS IO | | 0.2 | % | | 1.0 | % | | 0.2 | % | | 0.6 | % | | (0.2) | % | | (0.7) | % | | (0.3) | % | | (1.4) | % |
| TBAs | | 5.1 | % | | 20.4 | % | | 3.2 | % | | 12.9 | % | | (4.0) | % | | (15.8) | % | | (8.1) | % | | (32.5) | % |
| Interest rate hedges | | (11.3) | % | | (45.3) | % | | (5.9) | % | | (23.7) | % | | 6.0 | % | | 23.8 | % | | 11.7 | % | | 46.9 | % |
| Total | | (2.4) | % | | (9.6) | % | | (0.3) | % | | (1.4) | % | | (0.9) | % | | (3.4) | % | | (2.2) | % | | (9.1) | % |
| | | | | | | | | | | | | | | | |
| | December 31, 2020 |
| | Decrease in Interest Rates by | | Increase in Interest Rates by |
| | 100 Basis Points | | 50 Basis Points | | 50 Basis Points | | 100 Basis Points |
Type of Instrument (1) | | % of Market Value | | % of Common Equity | | % of Market Value | | % of Common Equity | | % of Market Value | | % of Common Equity | | % of Market Value | | % of Common Equity |
| RMBS | | 1.1 | % | | 6.5 | % | | 0.9 | % | | 5.5 | % | | (1.7) | % | | (10.1) | % | | (3.9) | % | | (22.5) | % |
| CMBS | | 0.3 | % | | 1.9 | % | | 0.2 | % | | 1.4 | % | | (0.3) | % | | (1.5) | % | | (0.5) | % | | (3.0) | % |
| CMBS IO | | 0.2 | % | | 0.9 | % | | 0.1 | % | | 0.8 | % | | (0.2) | % | | (1.1) | % | | (0.4) | % | | (2.1) | % |
| TBAs | | 0.9 | % | | 5.2 | % | | 0.8 | % | | 4.6 | % | | (1.5) | % | | (8.9) | % | | (3.4) | % | | (19.6) | % |
| Interest rate hedges | | (3.4) | % | | (19.6) | % | | (1.9) | % | | (11.0) | % | | 3.4 | % | | 19.9 | % | | 7.5 | % | | 43.4 | % |
| Total | | (0.9) | % | | (5.1) | % | | 0.1 | % | | 1.3 | % | | (0.3) | % | | (1.7) | % | | (0.7) | % | | (3.8) | % |
(1)Changes in market value of our financings are excluded because they are not carried at fair value on our balance sheet. The projections for market value do not assume any change in credit spreads.
The projected sensitivity to changes in interest rates on the market value of our portfolio shown in the table above as of March 31, 2021 has increased compared to December 31, 2020 because we made adjustmentsreduced the notional balance of our options on U.S. Treasury futures which we used to our hedging portfoliohedge for the increase in interest rates we were anticipating during the nine months ended September 30, 2017. When the yield curve flattened during the secondfirst quarter of 2017, we entered into approximately $1.0 billion of2021. We believe interest rate swapsrates in order to "lock-in" our financing costs over the near term will be more range-bound, therefore we reduced the notional amount of our options on U.S. Treasury futures to $250.0 million and increased our short position in an attemptU.S. Treasury futures to avoid potential volatility in our net interest earnings. We also entered into additional interest rate swaps to hedge the interest rate risk related to our TBA securities we began investing in during the second quarter of 2017.$3.0 billion.
Management also considers changes in the shape of the interest rate curves in assessing and managing portfolio interest rate risk. Often interest rates do not move in a parallel fashion from quarter to quarter.quarter (as can be seen by the graphs for U.S, Treasury and swap rates in Item 2. “Executive Overview”). The table below shows the percentage change in projected market value of our investment portfolio net of derivativefinancial instruments for instantaneous changes in the shape of the U.S. Treasury ("UST"(“UST”) curve (with similar changes to the interest rate swap curves) as of the periodsdates indicated:
|
| | | | | | | | | | |
| | | September 30, 2017 | | December 31, 2016 |
| Basis Point Change in | | Percentage Change in |
| 2-year UST | | 10-year UST | | Market Value of Investments (1) | | Shareholders' Equity | | Market Value of Investments (1) | | Shareholders' Equity |
| +25 | | +50 | | (0.5)% | | (3.6)% | | 0.1% | | 0.5% |
| +25 | | +0 | | (0.1)% | | (0.6)% | | (0.4)% | | (2.5)% |
| +50 | | +25 | | (0.3)% | | (2.3)% | | (0.5)% | | (3.2)% |
| +50 | | +100 | | (1.2)% | | (8.1)% | | 0.1% | | 0.4% |
| -10 | | -50 | | (0.2)% | | 1.5% | | (0.3)% | | (2.3)% |
| |
(1) | Includes changes in market value of our investments and derivative instruments, including TBA securities, but excludes changes in market value of our financings because they are not carried at fair value on our balance sheet. The projections for market value do not assume any change in credit spreads. |
| | | | | | | | | | | | | | | | | | | | | | | | | | | | | | | | |
| | March 31, 2021 | | December 31, 2020 |
| Basis Point Change in | | Percentage Change in | | Percentage Change in |
| 2-year UST | | 10-year UST | | Market Value of Investments (1) | | Common
Equity | | Market Value of Investments (1) | | Common
Equity |
| +25 | | +50 | | (1.0) | % | | (4.0) | % | | (0.1) | % | | (0.4) | % |
| +50 | | +25 | | (0.3) | % | | (1.1) | % | | (0.5) | % | | (2.7) | % |
| +50 | | +100 | | (2.6) | % | | (10.3) | % | | (0.2) | % | | (1.2) | % |
| 0 | | -25 | | 0.3 | % | | 1.1 | % | | 0.1 | % | | 0.8 | % |
| -10 | | -50 | | 0.2 | % | | 0.8 | % | | 0.3 | % | | 1.9 | % |
| -25 | | -75 | | (0.4) | % | | (1.7) | % | | 0.2 | % | | 1.1 | % |
(1)Includes changes in market value of our investments and derivative instruments, including TBA securities, but excludes changes in market value of our financings which are not carried at fair value on our balance sheet due to their short-term maturities. The projections for market value do not assume any change in credit spreads.
Spread Risk
Spread risk is the risk of loss from an increase in the market spread between the yield on an investment versus its benchmark index. Changes in market spreads represent the market's valuation of the perceived riskiness of an asset relative to risk-free rates, and widening spreads reduce the market value of our investments as market participants require additional yield to hold riskier assets. Market spreads could change based on macroeconomic or systemic factors as well as the factors specific to a particular security such as prepayment performance or credit performance. Other factors that could impact credit spreads include technical issues such as supply and demand for a particular type of security or FOMC monetary policy. Likewise, most of our investments are fixed-rate or reset in rate over a period of time, and as interest rates rise, we would expect the market value of these investments to decrease.
We do not hedge spread risk given the complexity of hedging credit spreads and in our opinion, the lack of liquid instruments available to use as hedges.
Fluctuations in spreads typically vary based on the type of investment. Sensitivity to changes in market spreads is derived from models that are dependent on various assumptions, and actual changes in market value in response to changes in market spreads could differ materially from the projected sensitivity if actual conditions differ from these assumptions.
The Company's exposure to changes to market spreads did not materially shift as of March 31, 2021 versus December 31, 2020. The table below is an estimateshows the projected sensitivity of the percentage change in projected market value of our investments (including TBA securities) given the indicated change in market spreads as of the periodsdates indicated:
| | | | | | | | | | | | | | | | | | | | | | | | | | |
| | March 31, 2021 | | December 31, 2020 |
| | Percentage Change in | | Percentage Change in |
| Basis Point Change in Market Spreads | | Market Value of Investments (1) | | Common
Equity | | Market Value of Investments (1) | | Common
Equity |
+20/+50 (2) | | (2.6) | % | | (10.5) | % | | (1.6) | % | | (9.5) | % |
| +10 | | (1.3) | % | | (5.0) | % | | (0.8) | % | | (4.4) | % |
| -10 | | 1.3 | % | | 5.0 | % | | 0.8 | % | | 4.4 | % |
-20/-50 (2) | | 2.6 | % | | 10.5 | % | | 1.6 | % | | 9.5 | % |
(1) Includes changes in market value of our MBS investments, including TBA securities.
(2) Assumes a 20-basis point shift in Agency and non-Agency RMBS and CMBS and a 50-basis point shift in Agency
and non-Agency CMBS IO.
|
| | | | |
| Basis Point Change in Market Spreads | | Percentage Change in Projected Market Value of Investments |
| | | September 30, 2017 | | December 31, 2016 |
| +50 | | (2.6)% | | (2.2)% |
| +25 | | (1.3)% | | (1.1)% |
| -25 | | 1.3% | | 1.1% |
| -50 | | 2.6% | | 2.3% |
Prepayment and Reinvestment Risk
Prepayment risk is the risk of an early, unscheduled return of principal on an investment. We are subject to prepayment risk from premiums paid on investments, which are amortized as a reduction in interest income using the effective yield method under GAAP. Our comprehensive income and book value per common share may also be negatively impacted by prepayments if the fair value of the investment materially exceeds the par balance of the underlying security. Principal prepayments on our investments are influenced by changes in market interest rates and a variety of economic, geographic, government policy and other factors beyond our control.
control, including GSE policy with respect to loan forbearance and delinquent loan buy-outs. The recently enacted FHFA Adverse Market Refinance Fee, which raises mortgage rates by 0.125% for all but the highest quality borrowers, is another example of government policy which we believe may reduce prepayments.
Loans underlying our CMBS and CMBS IO securities typically have some form of prepayment protection provisions (such as prepayment lock-outs) or prepayment compensation provisions (such as yield maintenance or prepayment penalties). Yield maintenance and prepayment penalty requirements are intended to create an economic disincentive for the loans to prepay; however, the amount of the prepayment penalty required to be paid may decline over time, and as loans age, interest rates decline, or market values of collateral supporting the loans increase, prepayment penalties may lessen as an economic disincentive to the borrower. Generally, our experience has been that prepayment lock-out and yield maintenance provisions result in stable prepayment performance from period to period. There are no prepayment protections, however, if the loan defaults and is partially or wholly repaid earlier as a result of loss mitigation actions taken by the underlying loan servicer. Historically, we have experienced low default rates on loans underlying CMBS and CMBS IO.
Because CMBS IO consist of rights to interest on the underlying commercial mortgage loan pools and do not have rights to principal payments on the underlying loans, prepayment risk on these securities would beis particularly acute without these prepayment protection provisions. There are no prepayment protections if the loan defaults and is partially or wholly repaid earlier as a result of loss mitigation actions taken by the underlying loan servicer. Loans in non-Agency CMBS IO prepayment protectionsecurities which are collateralized by income producing properties such as retail shopping centers, hotels, multifamily apartments and compensation provisions vary by issueroffice buildings are at a higher risk of default as a result of the security (i.e. Freddie Mac, Fannie Mae, Ginnie Mae, or non-Agency). The majorityeconomic impact of our Agencythe COVID-19 pandemic. Over the last several years, we have not experienced material defaults on CMBS IO are issued by Freddie Macloans in our portfolio; however, the ultimate impact on the economy and these securities generally have initial prepayment lock-outs followed by a defeasance period whichcommercial real estate performance and market values from the COVID-19 pandemic, and correspondingly loan defaults, is currently unknown. Please refer to Item 2, “Financial Condition-CMBS IO” for additional information on average extends to within six monthsthe composition of the stated maturities of the underlying loans. Non-AgencyCompany’s investment in CMBS IO generally have prepayment protection in the form of prepayment lock-outs and defeasance provisions. The following table details the fair value of our CMBS IO portfolio by issuer as of the end of the periods indicated:
|
| | | | | | | |
| ($ in thousands) | September 30, 2017 | | December 31, 2016 |
| Fannie Mae | $ | 11,200 |
| | $ | 18,957 |
|
| Freddie Mac | 390,608 |
| | 392,941 |
|
| Non-Agency CMBS IO | 328,659 |
| | 342,648 |
|
| | $ | 730,467 |
| | $ | 754,546 |
|
Prepayments on the loans underlying our RMBS generally accelerate in a declining interest rate environment, as the loans age, and, with respect to ARMS, as the loans near their respective interest rate reset dates, particularly the initial reset date, or if expectations are that interest rates will rise in the future. Our prepayment models anticipate an acceleration of prepayments in these events. To the extent the actual prepayments exceed our modeled prepayments, or, with respect to adjustable-rate RMBS, if we change our future prepayment expectations, we will record adjustments to our premium amortization which may negatively impact our net interest income. In addition, changes in market expectations of prepayments could impact the fair value of our RMBS.
As an indication of our prepayment risk on our RMBS portfolio, the following table summarizes information for our Agency RMBS portfolio regarding the net premium and weighted average coupon by months to reset ("MTR") or until maturity in the case of fixed-rate securities as of the end of the past four quarters: |
| | | | | | | | | | | | | | | | | | | | | | | |
| | September 30, 2017 | | June 30, 2017 | | March 31, 2017 | | December 31, 2016 |
| ($ in thousands) | Net Premium | | WAC | | Net Premium | | WAC | | Net Premium | | WAC | | Net Premium | | WAC |
| 0-12 MTR | $ | 1,313 |
| | 3.44% | | $ | 7,637 |
| | 3.36% | | $ | 17,671 |
| | 3.24% | | $ | 19,593 |
| | 3.17% |
| 13-36 MTR | 182 |
| | 4.52% | | 3,278 |
| | 3.14% | | 7,307 |
| | 3.07% | | 12,369 |
| | 3.18% |
| 37-60 MTR | 6,928 |
| | 3.16% | | 11,074 |
| | 3.07% | | 11,651 |
| | 3.38% | | 10,441 |
| | 3.51% |
| > 60 MTR | 2,588 |
| | 2.58% | | 7,085 |
| | 2.57% | | 11,744 |
| | 2.68% | | 14,663 |
| | 2.73% |
| 30-year fixed-rate | 19,163 |
| | 3.52% | | — |
| | —% | | — |
| | —% | | — |
| | —% |
| Total | $ | 30,174 |
| | 3.35% | | $ | 29,074 |
| | 2.98% | | $ | 48,373 |
| | 3.04% | | $ | 57,066 |
| | 3.05% |
| Par balance | $ | 816,353 |
| | | | $ | 715,015 |
| | | | $ | 1,033,735 |
| | | | $ | 1,157,258 |
| | |
| Premium, net as a % of par value | 3.7 | % | | | | 4.1 | % | | | | 4.7 | % | | | | 4.9 | % | | |
IO.
We seek to manage our prepayment risk on our MBS by diversifying our investments, seeking investments which we believe will have superior prepayment performance, and investing in securities which have some sort of prepayment prohibition or yield maintenance (as is the case with CMBS and CMBS IO). With respect to RMBS, when we investhave invested substantially in RMBS atlower coupon securities with approximately 83% of our capital in securities with a premium to the security's par value, wecoupon of 2.5% or lower as of March 31, 2021. We also tend to favor securities in which we believe the underlying borrowers have some disincentive to refinance as a result of the size of each loan'sloan’s principal balance, credit characteristics of the borrower, or geographic location of the property, among other factors.
We are also subject to reinvestment risk as a result of the prepayment, repayment and salesfactors, which we estimate represents approximately 90% of our investments. In order to maintain ourAgency RMBS investment portfolio size and our earnings, we need to reinvest capital received from these events into new interest-earning assets or TBA securities. If we are unable to find suitable reinvestment opportunities or if yields on assets in which we reinvest are lower than yields on existing assets, our results and cash flows could be negatively impacted. In addition, based on market conditions, our leverage, and our liquidity profile, we may decide to not reinvest the cash flows we receive from our investment portfolio even when attractive reinvestment opportunities are available, or we may decide to reinvest in assets with lower yield but greater liquidity. If we retain rather than reinvest capital or if we invest it in lower yielding assets for liquidity reasons, the sizeas of our investment portfolio and the amount of income generated by our investment portfolio will likely decline.
March 31, 2021.
Credit Risk
Credit risk is the risk that we will not receive all contractual amounts due on investments that we own due to default by the borrower or due to a deficiency in proceeds from the liquidation of the collateral securing the obligation. Credit losses on loans could result in lower or negative yields on our investments.
Agency RMBS and Agency CMBS have credit risk to the extent that Fannie Mae or Freddie Mac fails to remit payments on the MBS for which they have issued a guaranty of payment. Given the improved financial performance and conservatorship of these entities and the continued support of the U.S. government, we believe this risk is low. Since
Agency and non-Agency CMBS IO represent the right to excess interest and not principal on the underlying loans, theseloans. These securities are exposed to the loss of investment basis in the event a loan collateralizing the security liquidates without paying yield maintenance or prepayment penalty, whichpenalty. This will typically occursoccur when an involuntarily liquidatingthe underlying loan repays all or a portionis in default and proceeds from the disposition of its related principal balance.
Wethe loan collateral are exposedinsufficient to pay the prepayment consideration. To mitigate credit risk on our non-Agency securities and we attempt to mitigate our credit risk through asset selection and by purchasing higher quality non-Agency MBS. Our non-Agency MBS are typically investment grade rated securities which we believe will have strong credit performance. We do not currently seek to purchase heavily discounted, credit sensitive MBS. The majority of our non-Agency securities are CMBS and CMBS IO and the return we earn on these securities is dependent on the credit performance of the underlying commercial loans. In particular, since investmentsinvesting in CMBS IO, pay interest fromwe invest in primarily AAA-rated securities in senior tranches, which means we receive the underlying commercial mortgage loan pools, returns generallyhighest payment priority and are more negatively impacted by liquidations of loansthe last to absorb losses in the underlying loan pool. Please refer to "Financial Condition-Repurchase Agreements" within Item 2event of this Quarterly Report on Form 10-Q for information regarding the credit ratings on our non-Agency MBS.a shortfall in cash flows.
Liquidity Risk
We have liquidity risk principally from the use of recourse repurchase agreements to finance our ownership of securities. In general, our repurchase agreements provide a source of uncommitted short-term financing for longer-term assets, thereby creating a mismatch between the maturities of the asset and the associated financing. Our repurchase agreements are renewable at the discretion of our lenders and do not contain guaranteed roll-over terms. If we fail to repay the lender at maturity, the lender has the right to immediately sell the collateral and pursue us for any shortfall if the sales proceeds are inadequate to cover the repurchase agreement financing. In addition, declines in the
market value of our investments pledged as collateral for repurchase agreement borrowings may result in counterparties initiating margin calls for additional collateral .
collateral.
Our use of TBA dollar roll transactionslong positions as a means of investing in and financing Agency RMBS also exposes us to liquidity risk in the event that we are unable to roll or terminate our TBA dollar roll transactionscontracts prior to their settlement date. If we are unable to roll or terminate our TBA dollar roll transactions,long positions, we could be required to take physical delivery of the underlying securities and settle our obligations for cash, which could negatively impact our liquidity position or force us to sell assets under adverse conditions if financing is not available to us on acceptable terms.
For further information, including how we attempt to mitigate liquidity risk and monitor our liquidity position and in particular, during the current economic crisis, please refer to “Liquidity and Capital Resources” in Part I, Item 2 of this Quarterly Report on Form 10-Q.
Reinvestment Risk
We are subject to reinvestment risk as a result of the prepayment, repayment and sales of our investments. In order to maintain our investment portfolio size and our earnings, we need to reinvest capital received from these events into new interest-earning assets or TBA securities. Market yields on new investments are substantially lower than the investments we sold in March. As such, we expect new assets that we add at lower yields than the investments sold will lower our interest income in the near future. In addition, based on market conditions, our leverage, and our liquidity profile, we may decide to not reinvest the cash flows we receive from our investment portfolio even when attractive reinvestment opportunities are available, or we may decide to reinvest in assets with lower yield but greater liquidity. If we retain capital or pay dividends to return capital to shareholders rather than reinvest capital, or if we invest capital in lower yielding assets for liquidity reasons, the size of our investment portfolio and the amount of income generated by our investment portfolio will likely decline.
| |
ITEM 4. | CONTROLS AND PROCEDURES |
ITEM 4. CONTROLS AND PROCEDURES
Disclosure controlsControls and procedures.
Procedures
Our management evaluated, with the participation of our Principal Executive Officerprincipal executive officer and Principal Financial Officer,principal financial officer, the effectiveness of our disclosure controls and procedures, as defined in Exchange Act Rule 13a-15(e), as of the end of the period covered by this report. Based on that evaluation, our Principal Executive Officerprincipal executive officer and Principal Financial Officerprincipal financial officer concluded that our disclosure controls and procedures were effective as of September 30, 2017March 31, 2021 to ensure that information required to be disclosed in the reports that we file or submit under the Exchange Act is recorded, processed, summarized and reported, within the time periods specified in the SEC’s rules and forms, and that such information is accumulated and communicated to our management, including our Principal Executive Officerprincipal executive officer and Principal Financial Officer,principal financial officer, as appropriate, to allow timely decisions regarding required disclosure.
Changes in internal controlInternal Control over financial reporting.Financial Reporting
Our management is also responsible for establishing and maintaining adequate internal control over financial reporting as defined in Exchange Act Rule 13a-15(f). There were no changes in our internal control over financial reporting during the three months ended September 30, 2017March 31, 2021 that materially affected, or are reasonably likely to materially affect, our internal control over financial reporting.
| |
PART II. | OTHER INFORMATION |
PART II. OTHER INFORMATION
From timeITEM 1. LEGAL PROCEEDINGS
With respect to time,the claim of $11.3 million against the Company and its subsidiaries are parties to various legal proceedings. As of September 30, 2017, neitherdiscussed in the Company’s 2020 Form 10-K (the "Receiver Litigation”) which alleges that the Company nor any of its subsidiariesbreached a litigation cost sharing agreement, there were a party to any material legal proceedings.
There have been no material changesdevelopments during the three months ended September 30, 2017 with respect toMarch 31, 2021.
The Company records a contingent liability when, in the garnishment action related to DCI Commercial, Inc. (“DCI”), a former affiliateopinion of management, the likelihood of loss is probable and the amount of the loss can be reasonably estimated. After consultation with litigation counsel, the Company believes, based upon information currently available and formerly known as Dynex Commercial, Inc., discussedits evaluation of applicable state law that the likelihood of loss in connection with the Receiver Litigation is not probable, and given the range of potential claims for damages by the Company to offset the Receiver's claims, the amount of possible loss in the Receiver Litigation cannot be reasonably estimated and, therefore, no contingent liability has been recorded for either matter.
The Company believes that the Receiver Litigation will be resolved without a material adverse effect on the Company’s Annual Report on Form 10-K for the year ended December 31, 2016, or the suit againstconsolidated financial statements as a whole. The outcome, however, of any legal proceeding, including this matter, cannot be predicted with certainty. As such, no assurances can be given that the Company and DCI, as co-defendants, discussedwill be successful in its defense of this action on the merits or otherwise. If the Company is not successful in its defense efforts, the resolution of this matter could have a material adverse effect on the Company’s Quarterly Report on Form 10-Q for the quarter ended June 30, 2017. consolidated financial statements in a future reporting period.
Other than as previously disclosed in the Company's periodic reports,described above, to the Company’s knowledge, there are no pending or threatened legal proceedings, the resolution of which, in management’s opinion, individually or in the aggregate, wouldcould have a material adverse effect on the Company’s results of operations or financial condition.
ITEM 1A. RISK FACTORS
There have been no material changes from the risk factors discussed in Part I, Item 1A, “Risk Factors” of our 2020 Form 10-K. Risks and uncertainties identified in our forward-looking statements contained in this Quarterly Report on Form 10-Q together with those previously disclosed in the Annual Report on2020 Form 10-K for the year ended December 31, 2016 or those that are presently unforeseen could result in significant adverse effects on our financial condition, results of operations and cash flows. See “Forward-Looking Statements” contained in Part I, Item 2, “Management’s Discussion and Analysis of Financial Condition and Results of Operations” withinin this Quarterly Report on Form 10-Q as well as Part I, Item 1A, “Risk Factors” in our Annual Report on2020 Form 10-K for the year ended December 31, 2016, and Part II, Item 1A, "Risk Factors" in our Quarterly Reports on Form 10-Q for the quarters ended March 31, 2017 and June 30, 2017.10-K.
ITEM 2. UNREGISTERED SALES OF EQUITY SECURITIES AND USE OF PROCEEDS
Issuer Purchases of Equity Securities
The Company has been authorized by itsCompany’s Board of Directors tohas authorized the repurchase of up to $40 million of itsthe Company’s outstanding shares of common stock and up to $40 million of the Company’s Series C Preferred Stock through DecemberMarch 31, 2018.2022. Subject to applicable securities laws and the terms of the Series AC Preferred Stock, designation and the Series B Preferred Stock designation, both of which areis contained in our Articles of Incorporation, future repurchases of common stock will be made at times and in amounts as the Company deems appropriate, provided that the repurchase price per share is less than the Company's estimate of the current net book value of a share of common stock. Repurchases may be suspended or discontinued at any time. DuringThe following table summarizes repurchases of our common stock that occurred during the three months ended September 30, 2017March 31, 2021:
| | | | | | | | | | | | | | | | | | | | | | | |
| Issuer Purchases of Equity Securities |
| Total Number of Shares | | Average Price Paid per Share | | Total Number of Shares Purchased as Part of Publicly Announced Plans or Programs | | Maximum Number (or Approximate Dollar Value) of Shares that May Yet Be Purchased Under the Plans or Programs |
| | | | | | | ($ in thousands) |
| January 1 - 31, 2021 | — | | | $ | — | | | — | | | $ | 39,834 | |
February 1 - 28, 2021 (1) | 5,999 | | | — | | | — | | | 39,834 | |
March 1 - 31, 2021 (1) | 16,624 | | | — | | | — | | | 39,834 | |
| 22,623 | | | $ | — | | | — | | | |
(1) These shares were withheld from certain employees to satisfy tax withholding obligations arising upon the Company didvesting of restricted shares. Accordingly, these shares are not included in the calculation of approximate dollar value of shares that may yet be purchased under the $40 million repurchase any sharesplan authorized by the Company's Board of common stock under this repurchase authorization.Directors.
ITEM 3. DEFAULTS UPON SENIOR SECURITIES
None.
ITEM 4. MINE SAFETY DISCLOSURES
None.
ITEM 5. OTHER INFORMATION
None.
ITEM 6. EXHIBITS
|
| | | | |
| Exhibit No. | Description |
| 3.1 | |
3.23.1.1 | |
| 3.1.2 | |
| 3.2 | |
10.23.44.1 | |
| 4.3 | |
| 10.42 | |
10.3410.43 | |
12.131.1 | |
31.1 |
|
| 31.2 |
|
| 32.1 |
|
| 101 | The following materials from Dynex Capital, Inc.'s Quarterly Report on Form 10-Q for the three months ended September 30, 2017,March 31, 2021, formatted in XBRL (ExtensibleiXBRL (Inline Extensible Business Reporting Language), filed herewith: (i) Consolidated Balance Sheets, (unaudited), (ii) Consolidated Statements of Comprehensive Income (unaudited)(Loss), (iii) Consolidated StatementStatements of Shareholders'Shareholders’ Equity, (unaudited), (iv) Consolidated Statements of Cash Flows, (unaudited), and (v) Notes to the Unaudited Consolidated Financial Statements. |
| 104 | The cover page from Dynex Capital, Inc.'s Quarterly Report on Form 10-Q for the three months ended March 31, 2021, formatted in iXBRL (Inline Extensible Business Reporting Language) (included with Exhibit 101). |
SIGNATURES
Pursuant to the requirements of Section 13 or 15(d) of the Securities Exchange Act of 1934, the registrant has duly caused this report to be signed on its behalf by the undersigned, thereunto duly authorized.
| | | | | | | | | | | |
| | |
| | DYNEX CAPITAL, INC. |
| | | |
| Date: | May 3, 2021 | |
Date: | November 3, 2017 | /s/ Byron L. Boston |
| | | Byron L. Boston |
| | | Chief Executive Officer, President, |
| | Co-Chief Investment Officer, and Director |
| | | and Director |
| | | (Principal Executive Officer) |
| | | |
| Date: | NovemberMay 3, 20172021 | | /s/ Stephen J. Benedetti |
| | | Stephen J. Benedetti |
| | | Executive Vice President, Chief Financial Officer and Chief Operating Officer |
| | | (Principal Financial Officer) |
| | | |