Delaware (State or other jurisdiction of incorporation or organization) | 52-1568099 (I.R.S. Employer Identification No.) | |
388 Greenwich Street, New York, NY (Address of principal executive offices) | 10013 (Zip code) | |
(212) 559-1000 (Registrant's telephone number, including area code) | ||
Large accelerated filer x | Accelerated filer o | Non-accelerated filer o (Do not check if a smaller reporting company) | Smaller reporting company o Emerging growth company o | |||
| OVERVIEW | |
MANAGEMENT'S DISCUSSION AND ANALYSIS OF FINANCIAL CONDITION AND RESULTS OF OPERATIONS | |
| Executive Summary | |
| Summary of Selected Financial Data | |
SEGMENT AND BUSINESS—INCOME (LOSS) AND REVENUES | |
| SEGMENT BALANCE SHEET | |
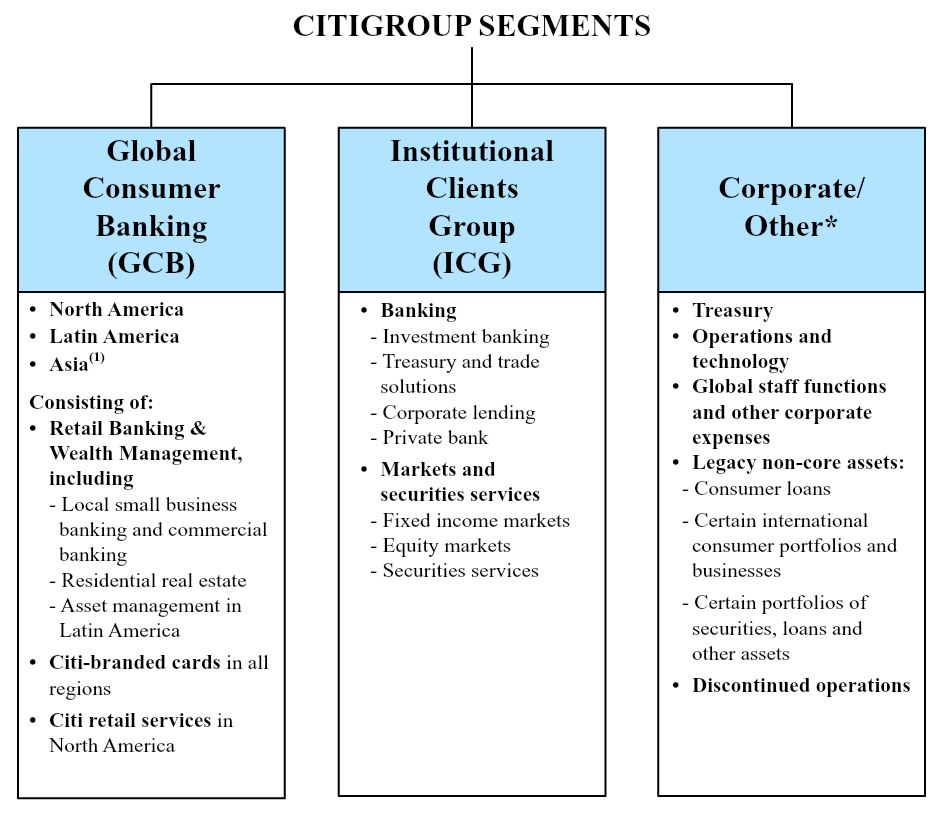
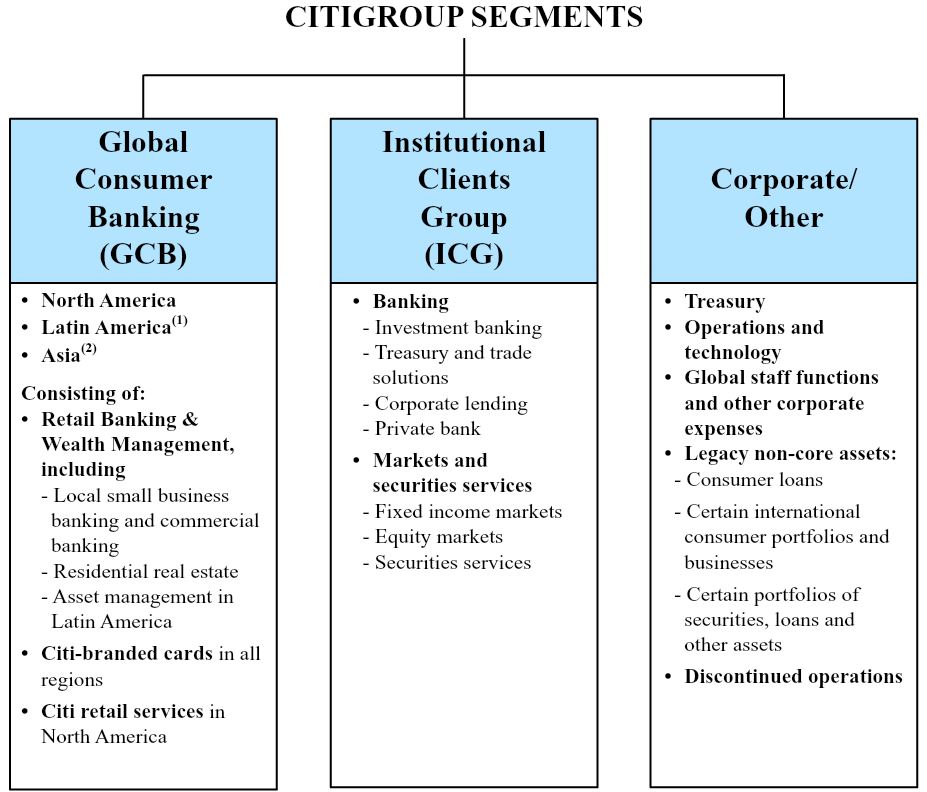
| Global Consumer Banking (GCB) | |
| North America GCB | |
| Latin America GCB | |
| Asia GCB | |
| Institutional Clients Group | |
| Corporate/Other | |
OFF-BALANCE SHEET ARRANGEMENTS | |
| CAPITAL RESOURCES | |
MANAGING GLOBAL RISK TABLE OF CONTENTS | |
| MANAGING GLOBAL RISK | |
| INCOME TAXES | |
FUTURE APPLICATION OF ACCOUNTING STANDARDS | |
DISCLOSURE CONTROLS AND PROCEDURES | |
DISCLOSURE PURSUANT TO SECTION 219 OF THE IRAN THREAT REDUCTION AND SYRIA HUMAN RIGHTS ACT | |
| FORWARD-LOOKING STATEMENTS | |
FINANCIAL STATEMENTS AND NOTES TABLE OF CONTENTS | |
| CONSOLIDATED FINANCIAL STATEMENTS | |
NOTES TO CONSOLIDATED FINANCIAL STATEMENTS (UNAUDITED) | |
UNREGISTERED SALES OF EQUITY SECURITIES, PURCHASES OF EQUITY SECURITIES AND DIVIDENDS | |
| (1) | Latin America GCB consists of Citi’s consumer banking businessin Mexico. |
| (2) | Asia GCB includes the results of operations of GCB activities in certain EMEA countries for all periods presented. |
North |
| First Quarter | First Quarter | |||||||||||||||
| In millions of dollars, except per-share amounts and ratios | 2017 | 2016 | % Change | 2018 | 2017 | % Change | ||||||||||
| Net interest revenue | $ | 10,857 | $ | 11,227 | (3 | )% | $ | 11,172 | $ | 10,955 | 2 | % | ||||
| Non-interest revenue | 7,263 | 6,328 | 15 | 7,700 | 7,411 | 4 | ||||||||||
| Revenues, net of interest expense | $ | 18,120 | $ | 17,555 | 3 | % | $ | 18,872 | $ | 18,366 | 3 | % | ||||
| Operating expenses | 10,477 | 10,523 | — | 10,925 | 10,723 | 2 | ||||||||||
| Provisions for credit losses and for benefits and claims | 1,662 | 2,045 | (19 | ) | 1,857 | 1,662 | 12 | |||||||||
| Income from continuing operations before income taxes | $ | 5,981 | $ | 4,987 | 20 | % | $ | 6,090 | $ | 5,981 | 2 | % | ||||
| Income taxes | 1,863 | 1,479 | 26 | 1,441 | 1,863 | (23 | ) | |||||||||
| Income from continuing operations | $ | 4,118 | $ | 3,508 | 17 | % | $ | 4,649 | $ | 4,118 | 13 | % | ||||
Income (loss) from discontinued operations, net of taxes | (18 | ) | (2 | ) | NM | (7 | ) | (18 | ) | 61 | ||||||
Net income before attribution of noncontrolling interests | $ | 4,100 | $ | 3,506 | 17 | % | $ | 4,642 | $ | 4,100 | 13 | % | ||||
| Net income attributable to noncontrolling interests | 10 | 5 | 100 | 22 | 10 | NM | ||||||||||
| Citigroup’s net income | $ | 4,090 | $ | 3,501 | 17 | % | $ | 4,620 | $ | 4,090 | 13 | % | ||||
| Less: | ||||||||||||||||
| Preferred dividends—Basic | $ | 301 | $ | 210 | 43 | % | $ | 272 | $ | 301 | (10 | )% | ||||
| Dividends and undistributed earnings allocated to employee restricted and deferred shares that contain nonforfeitable rights to dividends, applicable to basic EPS | 55 | 40 | 38 | 51 | 55 | (7 | ) | |||||||||
Income allocated to unrestricted common shareholders for basic and diluted EPS | $ | 3,734 | $ | 3,251 | 15 | % | $ | 4,297 | $ | 3,734 | 15 | % | ||||
| Earnings per share | ||||||||||||||||
| Basic | ||||||||||||||||
| Income from continuing operations | $ | 1.36 | $ | 1.11 | 23 | 1.68 | 1.36 | 24 | ||||||||
| Net income | 1.35 | 1.10 | 23 | 1.68 | 1.35 | 24 | ||||||||||
| Diluted | ||||||||||||||||
| Income from continuing operations | $ | 1.36 | $ | 1.11 | 23 | % | $ | 1.68 | $ | 1.36 | 24 | % | ||||
| Net income | 1.35 | 1.10 | 23 | 1.68 | 1.35 | 24 | ||||||||||
| Dividends declared per common share | 0.16 | 0.05 | NM | 0.32 | 0.16 | 100 | ||||||||||
| Citigroup Inc. and Consolidated Subsidiaries | Citigroup Inc. and Consolidated Subsidiaries | Citigroup Inc. and Consolidated Subsidiaries | ||||||||||||||
| First Quarter | First Quarter | |||||||||||||||
In millions of dollars, except per-share amounts, ratios and direct staff | 2017 | 2016 | % Change | 2018 | 2017 | % Change | ||||||||||
| At March 31: | ||||||||||||||||
| Total assets | $ | 1,821,635 | $ | 1,800,967 | 1 | % | $ | 1,922,104 | $ | 1,821,479 | 6 | % | ||||
| Total deposits | 949,990 | 934,591 | 2 | 1,001,219 | 949,990 | 5 | ||||||||||
| Long-term debt | 208,530 | 207,835 | — | 237,938 | 208,530 | 14 | ||||||||||
| Citigroup common stockholders’ equity | 208,879 | 209,769 | — | 182,759 | 208,723 | (12 | ) | |||||||||
| Total Citigroup stockholders’ equity | 228,132 | 227,522 | — | 201,915 | 227,976 | (11 | ) | |||||||||
Direct staff (in thousands) | 215 | 225 | (4 | ) | 209 | 215 | (3 | ) | ||||||||
| Performance metrics | ||||||||||||||||
| Return on average assets | 0.91 | % | 0.79 | % | 0.98 | % | 0.91 | % | ||||||||
Return on average common stockholders’ equity | 7.4 | 6.4 | 9.7 | 7.4 | ||||||||||||
Return on average total stockholders’ equity | 7.3 | 6.3 | 9.3 | 7.3 | ||||||||||||
| Efficiency ratio (Total operating expenses/Total revenues) | 58 | 60 | ||||||||||||||
| Efficiency ratio (total operating expenses/total revenues) | 58 | 58 | ||||||||||||||
| Basel III ratios—full implementation | ||||||||||||||||
Common Equity Tier 1 Capital | 12.83 | % | 12.34 | % | 12.05 | % | 12.81 | % | ||||||||
Tier 1 Capital | 14.49 | 13.81 | 13.67 | 14.48 | ||||||||||||
Total Capital | 16.54 | 15.71 | 16.01 | 16.52 | ||||||||||||
Supplementary Leverage ratio | 7.28 | 7.44 | 6.71 | 7.27 | ||||||||||||
| Citigroup common stockholders’ equity to assets | 11.47 | % | 11.65 | % | 9.51 | % | 11.46 | % | ||||||||
| Total Citigroup stockholders’ equity to assets | 12.52 | 12.63 | 10.50 | 12.52 | ||||||||||||
Dividend payout ratio | 11.9 | 4.5 | 19.0 | 11.9 | ||||||||||||
Total payout ratio(6) | 59 | % | 44 | % | ||||||||||||
Total payout ratio(7) | 71 | 59 | ||||||||||||||
| Book value per common share | $ | 75.86 | $ | 71.47 | 6 | % | $ | 71.67 | $ | 75.81 | (5 | )% | ||||
Tangible book value (TBV) per share | $ | 65.94 | $ | 62.58 | 5 | % | 61.02 | 65.88 | (7 | ) | ||||||
| Ratio of earnings to fixed charges and preferred stock dividends | 2.51x | 2.54x | 2.10x | 2.51x | ||||||||||||
| (1) | The first quarter of 2018 reflects the impact of Tax Reform. For additional information on Tax Reform, including the impact on Citi’s fourth quarter and full-year 2017 results, see Citi’s 2017 Annual Report on Form 10-K. |
| (2) | See Note 2 to the Consolidated Financial Statements for additional information on Citi’s discontinued operations. |
| The return on average common stockholders’ equity is calculated using net income less preferred stock dividends divided by average common stockholders’ equity. The return on average total Citigroup stockholders’ equity is calculated using net income divided by average Citigroup stockholders’ equity. |
| Citi’s |
| (5) | Citi’s risk-based capital and leverage ratios as of March 31, 2017 are non-GAAP financial measures, which reflect full implementation of regulatory capital adjustments and deductions prior to the effective date of January 1, 2018. |
| (6) | Dividends declared per common share as a percentage of net income per diluted share. |
| Total common dividends declared plus common stock repurchases as a percentage of net income available to common shareholders. See “Consolidated Statement of Changes in Stockholders’ |
| For information on TBV, see “Capital Resources—Tangible Common Equity, Book Value Per Share, Tangible Book Value Per Share and Returns on Equity” below. |
| First Quarter | First Quarter | |||||||||||||||
| In millions of dollars | 2017 | 2016 | % Change | 2018 | 2017 | % Change | ||||||||||
| Income from continuing operations | ||||||||||||||||
| Global Consumer Banking | ||||||||||||||||
| North America | $ | 627 | $ | 833 | (25 | )% | $ | 838 | $ | 614 | 36 | % | ||||
| Latin America | 130 | 146 | (11 | ) | 183 | 135 | 36 | |||||||||
Asia(1) | 246 | 215 | 14 | 373 | 249 | 50 | ||||||||||
| Total | $ | 1,003 | $ | 1,194 | (16 | )% | $ | 1,394 | $ | 998 | 40 | % | ||||
| Institutional Clients Group | ||||||||||||||||
| North America | $ | 1,100 | $ | 546 | NM | $ | 857 | $ | 1,077 | (20 | )% | |||||
| EMEA | 855 | 374 | NM | 1,113 | 862 | 29 | ||||||||||
| Latin America | 475 | 330 | 44 | 491 | 482 | 2 | ||||||||||
| Asia | 581 | 619 | (6 | ) | 868 | 590 | 47 | |||||||||
| Total | $ | 3,011 | $ | 1,869 | 61 | % | $ | 3,329 | $ | 3,011 | 11 | % | ||||
| Corporate/Other | 104 | 445 | (77 | )% | (74 | ) | 109 | NM | ||||||||
| Income from continuing operations | $ | 4,118 | $ | 3,508 | 17 | % | $ | 4,649 | $ | 4,118 | 13 | % | ||||
| Discontinued operations | $ | (18 | ) | $ | (2 | ) | NM | $ | (7 | ) | $ | (18 | ) | 61 | % | |
| Net income attributable to noncontrolling interests | 10 | 5 | 100 | % | 22 | 10 | NM | |||||||||
| Citigroup’s net income | $ | 4,090 | $ | 3,501 | 17 | % | $ | 4,620 | $ | 4,090 | 13 | % | ||||
| (1) | Asia GCB includes the results of operations of GCB activities in certain EMEA countries for all periods presented. |
| First Quarter | First Quarter | |||||||||||||||
| In millions of dollars | 2017 | 2016 | % Change | 2018 | 2017 | % Change | ||||||||||
| Global Consumer Banking | ||||||||||||||||
| North America | $ | 4,944 | $ | 4,830 | 2 | % | $ | 5,157 | $ | 4,945 | 4 | % | ||||
| Latin America | 1,151 | 1,229 | (6 | ) | 1,347 | 1,167 | 15 | |||||||||
Asia(1) | 1,722 | 1,655 | 4 | 1,929 | 1,734 | 11 | ||||||||||
| Total | $ | 7,817 | $ | 7,714 | 1 | % | $ | 8,433 | $ | 7,846 | 7 | % | ||||
| Institutional Clients Group | ||||||||||||||||
| North America | $ | 3,455 | $ | 2,980 | 16 | % | $ | 3,265 | $ | 3,522 | (7 | )% | ||||
| EMEA | 2,807 | 2,167 | 30 | 3,167 | 2,854 | 11 | ||||||||||
| Latin America | 1,127 | 962 | 17 | 1,210 | 1,169 | 4 | ||||||||||
| Asia | 1,737 | 1,786 | (3 | ) | 2,206 | 1,774 | 24 | |||||||||
| Total | $ | 9,126 | $ | 7,895 | 16 | % | $ | 9,848 | $ | 9,319 | 6 | % | ||||
| Corporate/Other | 1,177 | 1,946 | (40 | ) | 591 | 1,201 | (51 | ) | ||||||||
| Total Citigroup Net Revenues | $ | 18,120 | $ | 17,555 | 3 | % | ||||||||||
| Total Citigroup net revenues | $ | 18,872 | $ | 18,366 | 3 | % | ||||||||||
| (1) | Asia GCB includes the results of operations of GCB activities in certain EMEA countries for all periods presented. |
| In millions of dollars | Global Consumer Banking | Institutional Clients Group | Corporate/Other and consolidating eliminations(2) | Citigroup Parent company- issued long-term debt and stockholders’ equity(3) | Total Citigroup consolidated | Global Consumer Banking | Institutional Clients Group | Corporate/Other and consolidating eliminations(2) | Citigroup parent company- issued long-term debt and stockholders’ equity(3) | Total Citigroup consolidated | ||||||||||||||||||||
| Assets | ||||||||||||||||||||||||||||||
| Cash and deposits with banks | $ | 9,371 | $ | 64,322 | $ | 106,352 | $ | — | $ | 180,045 | $ | 7,493 | $ | 65,194 | $ | 130,017 | $ | — | $ | 202,704 | ||||||||||
| Federal funds sold and securities borrowed or purchased under agreements to resell | 302 | 242,241 | 386 | — | 242,929 | 291 | 257,288 | 308 | — | 257,887 | ||||||||||||||||||||
| Trading account assets | 6,512 | 235,799 | 2,592 | — | 244,903 | 662 | 260,226 | 7,920 | — | 268,808 | ||||||||||||||||||||
| Investments | 11,172 | 112,252 | 222,409 | — | 345,833 | 1,475 | 111,464 | 239,032 | — | 351,971 | ||||||||||||||||||||
| Loans, net of unearned income and | ||||||||||||||||||||||||||||||
| allowance for loan losses | 282,901 | 305,404 | 28,260 | — | 616,565 | |||||||||||||||||||||||||
Loans, net of unearned income and allowance for loan losses | 294,808 | 345,478 | 20,298 | — | 660,584 | |||||||||||||||||||||||||
| Other assets | 38,422 | 94,798 | 58,140 | — | 191,360 | 37,341 | 107,949 | 34,860 | — | 180,150 | ||||||||||||||||||||
Liquidity assets(4) | 63,128 | 259,291 | (322,419 | ) | — | — | ||||||||||||||||||||||||
Net inter-segment liquid assets(4) | 80,816 | 259,120 | (339,936 | ) | — | — | ||||||||||||||||||||||||
| Total assets | $ | 411,808 | $ | 1,314,107 | $ | 95,720 | $ | — | $ | 1,821,635 | $ | 422,886 | $ | 1,406,719 | $ | 92,499 | $ | — | $ | 1,922,104 | ||||||||||
| Liabilities and equity | ||||||||||||||||||||||||||||||
| Total deposits | $ | 311,383 | $ | 619,513 | $ | 19,094 | $ | — | $ | 949,990 | $ | 314,355 | $ | 665,987 | $ | 20,877 | $ | — | $ | 1,001,219 | ||||||||||
| Federal funds purchased and securities loaned or sold under agreements to repurchase | 3,597 | 144,624 | 9 | — | 148,230 | 4,359 | 167,391 | 9 | — | 171,759 | ||||||||||||||||||||
| Trading account liabilities | 24 | 143,464 | 582 | — | 144,070 | 142 | 143,018 | 801 | — | 143,961 | ||||||||||||||||||||
| Short-term borrowings | 578 | 19,299 | 6,250 | — | 26,127 | 588 | 20,256 | 15,250 | — | 36,094 | ||||||||||||||||||||
Long-term debt(3) | 1,225 | 32,739 | 32,940 | 141,626 | 208,530 | 1,977 | 36,913 | 45,974 | 153,074 | 237,938 | ||||||||||||||||||||
| Other liabilities | 17,811 | 77,000 | 20,724 | — | 115,535 | 18,379 | 95,702 | 14,186 | — | 128,267 | ||||||||||||||||||||
Net inter-segment funding (lending)(3) | 77,190 | 277,468 | 15,100 | (369,758 | ) | — | 83,086 | 277,452 | (5,549 | ) | (354,989 | ) | — | |||||||||||||||||
| Total liabilities | $ | 411,808 | $ | 1,314,107 | $ | 94,699 | $ | (228,132 | ) | $ | 1,592,482 | $ | 422,886 | $ | 1,406,719 | $ | 91,548 | $ | (201,915 | ) | $ | 1,719,238 | ||||||||
Total equity(5) | — | — | 1,021 | 228,132 | 229,153 | |||||||||||||||||||||||||
Total stockholders’ equity(5) | — | — | 951 | 201,915 | 202,866 | |||||||||||||||||||||||||
| Total liabilities and equity | $ | 411,808 | $ | 1,314,107 | $ | 95,720 | $ | — | $ | 1,821,635 | $ | 422,886 | $ | 1,406,719 | $ | 92,499 | $ | — | $ | 1,922,104 | ||||||||||
| (1) | The supplemental information presented in the table above reflects Citigroup’s consolidated GAAP balance sheet by reporting segment as of March 31, |
| (2) | Consolidating eliminations for total Citigroup and Citigroup parent company assets and liabilities are recorded within Corporate/Other. |
| (3) | The total stockholders’ equity and the majority of long-term debt of Citigroup reside in the Citigroup parent company Consolidated Balance Sheet. Citigroup allocates stockholders’ equity and long-term debt to its businesses through inter-segment allocations as shown above. |
| (4) | Represents the attribution of Citigroup’s |
| (5) | Corporate/ |
| First Quarter | First Quarter | |||||||||||||||
| In millions of dollars except as otherwise noted | 2017 | 2016 | % Change | 2018 | 2017 | % Change | ||||||||||
| Net interest revenue | $ | 6,522 | $ | 6,352 | 3 | % | $ | 6,980 | $ | 6,579 | 6 | % | ||||
| Non-interest revenue | 1,295 | 1,362 | (5 | ) | 1,453 | 1,267 | 15 | |||||||||
| Total revenues, net of interest expense | $ | 7,817 | $ | 7,714 | 1 | % | $ | 8,433 | $ | 7,846 | 7 | % | ||||
| Total operating expenses | $ | 4,415 | $ | 4,401 | — | % | $ | 4,681 | $ | 4,451 | 5 | % | ||||
| Net credit losses | $ | 1,603 | $ | 1,371 | 17 | % | $ | 1,736 | $ | 1,603 | 8 | % | ||||
| Credit reserve build (release) | 177 | 85 | NM | 144 | 177 | (19 | ) | |||||||||
| Provision (release) for unfunded lending commitments | 6 | 1 | NM | (1 | ) | 6 | NM | |||||||||
| Provision for benefits and claims | 29 | 28 | 4 | 26 | 29 | (10 | ) | |||||||||
| Provisions for credit losses and for benefits and claims | $ | 1,815 | $ | 1,485 | 22 | % | ||||||||||
| Provisions for credit losses and for benefits and claims (LLR & PBC) | $ | 1,905 | $ | 1,815 | 5 | % | ||||||||||
| Income from continuing operations before taxes | $ | 1,587 | $ | 1,828 | (13 | )% | $ | 1,847 | $ | 1,580 | 17 | % | ||||
| Income taxes | 584 | 634 | (8 | ) | 453 | 582 | (22 | ) | ||||||||
| Income from continuing operations | $ | 1,003 | $ | 1,194 | (16 | )% | $ | 1,394 | $ | 998 | 40 | % | ||||
| Noncontrolling interests | 1 | 2 | (50 | ) | 2 | 1 | 100 | |||||||||
| Net income | $ | 1,002 | $ | 1,192 | (16 | )% | $ | 1,392 | $ | 997 | 40 | % | ||||
Balance Sheet data (in billions of dollars) | ||||||||||||||||
| Total EOP assets | $ | 412 | $ | 384 | 7 | % | $ | 423 | $ | 411 | 3 | % | ||||
| Average assets | $ | 411 | $ | 377 | 9 | 423 | 410 | 3 | ||||||||
| Return on average assets | 0.99 | % | 1.27 | % | 1.33 | % | 0.99 | % | ||||||||
| Efficiency ratio | 56 | % | 57 | % | 56 | 57 | ||||||||||
| Average deposits | $ | 304 | $ | 294 | 3 | $ | 309 | $ | 303 | 2 | ||||||
| Net credit losses as a percentage of average loans | 2.24 | % | 2.04 | % | 2.30 | % | 2.24 | % | ||||||||
| Revenue by business | ||||||||||||||||
| Retail banking | $ | 3,155 | $ | 3,187 | (1 | )% | $ | 3,471 | $ | 3,175 | 9 | % | ||||
Cards(1) | 4,662 | 4,527 | 3 | 4,962 | 4,671 | 6 | ||||||||||
| Total | $ | 7,817 | $ | 7,714 | 1 | % | $ | 8,433 | $ | 7,846 | 7 | % | ||||
| Income from continuing operations by business | ||||||||||||||||
| Retail banking | $ | 339 | $ | 298 | 14 | % | $ | 524 | $ | 333 | 57 | % | ||||
Cards(1) | 664 | 896 | (26 | ) | 870 | 665 | 31 | |||||||||
| Total | $ | 1,003 | $ | 1,194 | (16 | )% | $ | 1,394 | $ | 998 | 40 | % | ||||
| Foreign currency (FX) translation impact | ||||||||||||||||
| Total revenue—as reported | $ | 7,817 | $ | 7,714 | 1 | % | $ | 8,433 | $ | 7,846 | 7 | % | ||||
Impact of FX translation(2) | — | (103 | ) | — | 139 | |||||||||||
Total revenues—ex-FX(3) | $ | 7,817 | $ | 7,611 | 3 | % | $ | 8,433 | $ | 7,985 | 6 | % | ||||
| Total operating expenses—as reported | $ | 4,415 | $ | 4,401 | — | % | $ | 4,681 | $ | 4,451 | 5 | % | ||||
Impact of FX translation(2) | — | (42 | ) | — | 87 | |||||||||||
Total operating expenses—ex-FX(3) | $ | 4,415 | $ | 4,359 | 1 | % | $ | 4,681 | $ | 4,538 | 3 | % | ||||
| Total provisions for LLR & PBC—as reported | $ | 1,815 | $ | 1,485 | 22 | % | $ | 1,905 | $ | 1,815 | 5 | % | ||||
Impact of FX translation(2) | — | (30 | ) | — | 27 | |||||||||||
Total provisions for LLR & PBC—ex-FX(3) | $ | 1,815 | $ | 1,455 | 25 | % | $ | 1,905 | $ | 1,842 | 3 | % | ||||
| Net income—as reported | $ | 1,002 | $ | 1,192 | (16 | )% | $ | 1,392 | $ | 997 | 40 | % | ||||
Impact of FX translation(2) | — | (25 | ) | — | 18 | |||||||||||
Net income—ex-FX(3) | $ | 1,002 | $ | 1,167 | (14 | )% | $ | 1,392 | $ | 1,015 | 37 | % | ||||
| (1) | Includes both Citi-branded cards and Citi retail services. |
| (2) | Reflects the impact of FX translation into U.S. dollars at the first quarter of |
| (3) | Presentation of this metric excluding FX translation is a non-GAAP financial measure. |
| First Quarter | % Change | First Quarter | ||||||||||||||
| In millions of dollars, except as otherwise noted | 2017 | 2016 | 2018 | 2017 | % Change | |||||||||||
| Net interest revenue | $ | 4,617 | $ | 4,398 | 5 | % | $ | 4,750 | $ | 4,617 | 3 | % | ||||
| Non-interest revenue | 327 | 432 | (24 | ) | 407 | 328 | 24 | |||||||||
| Total revenues, net of interest expense | $ | 4,944 | $ | 4,830 | 2 | % | $ | 5,157 | $ | 4,945 | 4 | % | ||||
| Total operating expenses | $ | 2,576 | $ | 2,500 | 3 | % | $ | 2,645 | $ | 2,597 | 2 | % | ||||
| Net credit losses | $ | 1,190 | $ | 933 | 28 | % | $ | 1,296 | $ | 1,190 | 9 | % | ||||
| Credit reserve build (release) | 152 | 79 | 92 | 123 | 152 | (19 | ) | |||||||||
| Provision for unfunded lending commitments | 7 | — | NM | (4 | ) | 7 | NM | |||||||||
| Provisions for benefits and claims | 6 | 9 | (33 | ) | ||||||||||||
| Provision for benefits and claims | 6 | 6 | — | |||||||||||||
| Provisions for credit losses and for benefits and claims | $ | 1,355 | $ | 1,021 | 33 | % | $ | 1,421 | $ | 1,355 | 5 | % | ||||
| Income from continuing operations before taxes | $ | 1,013 | $ | 1,309 | (23 | )% | $ | 1,091 | $ | 993 | 10 | % | ||||
| Income taxes | 386 | 476 | (19 | ) | 253 | 379 | (33 | ) | ||||||||
| Income from continuing operations | $ | 627 | $ | 833 | (25 | )% | $ | 838 | $ | 614 | 36 | % | ||||
| Noncontrolling interests | — | — | — | — | — | NM | ||||||||||
| Net income | $ | 627 | $ | 833 | (25 | )% | $ | 838 | $ | 614 | 36 | % | ||||
Balance Sheet data (in billions of dollars) | ||||||||||||||||
| Average assets | $ | 245 | $ | 211 | 16 | % | $ | 248 | $ | 245 | 1 | % | ||||
| Return on average assets | 1.04 | % | 1.59 | % | 1.37 | % | 1.02 | % | ||||||||
| Efficiency ratio | 52 | % | 52 | % | 51 | 53 | ||||||||||
| Average deposits | $ | 185.5 | $ | 180.6 | 3 | $ | 180.9 | $ | 184.6 | (2 | ) | |||||
| Net credit losses as a percentage of average loans | 2.63 | % | 2.32 | % | 2.77 | % | 2.63 | % | ||||||||
| Revenue by business | ||||||||||||||||
| Retail banking | $ | 1,256 | $ | 1,290 | (3 | )% | $ | 1,307 | $ | 1,257 | 4 | % | ||||
| Citi-branded cards | 2,096 | 1,860 | 13 | 2,232 | 2,096 | 6 | ||||||||||
| Citi retail services | 1,592 | 1,680 | (5 | ) | 1,618 | 1,592 | 2 | |||||||||
| Total | $ | 4,944 | $ | 4,830 | 2 | % | $ | 5,157 | $ | 4,945 | 4 | % | ||||
| Income from continuing operations by business | ||||||||||||||||
| Retail banking | $ | 83 | $ | 89 | (7 | )% | $ | 140 | $ | 72 | 94 | % | ||||
| Citi-branded cards | 248 | 353 | (30 | ) | 425 | 246 | 73 | |||||||||
| Citi retail services | 296 | 391 | (24 | ) | 273 | 296 | (8 | ) | ||||||||
| Total | $ | 627 | $ | 833 | (25 | )% | $ | 838 | $ | 614 | 36 | % | ||||
| First Quarter | % Change | First Quarter | ||||||||||||||
| In millions of dollars, except as otherwise noted | 2017 | 2016 | 2018 | 2017 | % Change | |||||||||||
| Net interest revenue | $ | 800 | $ | 853 | (6 | )% | $ | 997 | $ | 848 | 18 | % | ||||
| Non-interest revenue | 351 | 376 | (7 | ) | 350 | 319 | 10 | |||||||||
| Total revenues, net of interest expense | $ | 1,151 | $ | 1,229 | (6 | )% | $ | 1,347 | $ | 1,167 | 15 | % | ||||
| Total operating expenses | $ | 659 | $ | 718 | (8 | )% | $ | 759 | $ | 667 | 14 | % | ||||
| Net credit losses | $ | 253 | $ | 278 | (9 | )% | $ | 278 | $ | 253 | 10 | % | ||||
| Credit reserve build (release) | 12 | 17 | (29 | ) | 42 | 12 | NM | |||||||||
| Provision (release) for unfunded lending commitments | — | 1 | (100 | ) | 1 | — | NM | |||||||||
| Provision for benefits and claims | 23 | 19 | 21 | 20 | 23 | (13 | ) | |||||||||
| Provisions for credit losses and for benefits and claims (LLR & PBC) | $ | 288 | $ | 315 | (9 | )% | $ | 341 | $ | 288 | 18 | % | ||||
| Income from continuing operations before taxes | $ | 204 | $ | 196 | 4 | % | $ | 247 | $ | 212 | 17 | % | ||||
| Income taxes | 74 | 50 | 48 | 64 | 77 | (17 | ) | |||||||||
| Income from continuing operations | $ | 130 | $ | 146 | (11 | )% | $ | 183 | $ | 135 | 36 | % | ||||
| Noncontrolling interests | 1 | 1 | — | — | 1 | (100 | ) | |||||||||
| Net income | $ | 129 | $ | 145 | (11 | )% | $ | 183 | $ | 134 | 37 | % | ||||
Balance Sheet data (in billions of dollars) | ||||||||||||||||
| Average assets | $ | 43 | $ | 50 | (14 | )% | $ | 44 | $ | 42 | 5 | % | ||||
| Return on average assets | 1.22 | % | 1.17 | % | 1.69 | 1.29 | ||||||||||
| Efficiency ratio | 57 | % | 58 | % | 56 | % | 57 | % | ||||||||
| Average deposits | $ | 25.3 | $ | 26.1 | (3 | ) | $ | 28.9 | $ | 25.3 | 14 | |||||
| Net credit losses as a percentage of average loans | 4.44 | % | 4.58 | % | 4.29 | % | 4.44 | % | ||||||||
| Revenue by business | ||||||||||||||||
| Retail banking | $ | 836 | $ | 856 | (2 | )% | $ | 966 | $ | 850 | 14 | % | ||||
| Citi-branded cards | 315 | 373 | (16 | ) | 381 | 317 | 20 | |||||||||
| Total | $ | 1,151 | $ | 1,229 | (6 | )% | $ | 1,347 | $ | 1,167 | 15 | % | ||||
| Income from continuing operations by business | ||||||||||||||||
| Retail banking | $ | 86 | $ | 90 | (4 | )% | $ | 138 | $ | 90 | 53 | % | ||||
| Citi-branded cards | 44 | 56 | (21 | ) | 45 | 45 | — | |||||||||
| Total | $ | 130 | $ | 146 | (11 | )% | $ | 183 | $ | 135 | 36 | % | ||||
| FX translation impact | ||||||||||||||||
| Total revenues—as reported | $ | 1,151 | $ | 1,229 | (6 | )% | $ | 1,347 | $ | 1,167 | 15 | % | ||||
Impact of FX translation(1) | — | (122 | ) | — | 75 | |||||||||||
Total revenues—ex-FX(2) | $ | 1,151 | $ | 1,107 | 4 | % | $ | 1,347 | $ | 1,242 | 8 | % | ||||
| Total operating expenses—as reported | $ | 659 | $ | 718 | (8 | )% | $ | 759 | $ | 667 | 14 | % | ||||
Impact of FX translation(1) | — | (57 | ) | — | 37 | |||||||||||
Total operating expenses—ex-FX(2) | $ | 659 | $ | 661 | — | % | $ | 759 | $ | 704 | 8 | % | ||||
| Provisions for LLR & PBC—as reported | $ | 288 | $ | 315 | (9 | )% | $ | 341 | $ | 288 | 18 | % | ||||
Impact of FX translation(1) | — | (31 | ) | — | 20 | |||||||||||
Provisions for LLR & PBC—ex-FX(2) | $ | 288 | $ | 284 | 1 | % | $ | 341 | $ | 308 | 11 | % | ||||
| Net income—as reported | $ | 129 | $ | 145 | (11 | )% | $ | 183 | $ | 134 | 37 | % | ||||
Impact of FX translation(1) | — | (27 | ) | — | 13 | |||||||||||
Net income—ex-FX(2) | $ | 129 | $ | 118 | 9 | % | $ | 183 | $ | 147 | 24 | % | ||||
| (1) | Reflects the impact of FX translation into U.S. dollars at the first quarter of |
| (2) | Presentation of this metric excluding FX translation is a non-GAAP financial measure. |
| First Quarter | % Change | First Quarter | ||||||||||||||
In millions of dollars, except as otherwise noted (1) | 2017 | 2016 | 2018 | 2017 | % Change | |||||||||||
| Net interest revenue | $ | 1,105 | $ | 1,101 | — | % | $ | 1,233 | $ | 1,114 | 11 | % | ||||
| Non-interest revenue | 617 | 554 | 11 | 696 | 620 | 12 | ||||||||||
| Total revenues, net of interest expense | $ | 1,722 | $ | 1,655 | 4 | % | $ | 1,929 | $ | 1,734 | 11 | % | ||||
| Total operating expenses | $ | 1,180 | $ | 1,183 | — | % | $ | 1,277 | $ | 1,187 | 8 | % | ||||
| Net credit losses | $ | 160 | $ | 160 | — | % | $ | 162 | $ | 160 | 1 | % | ||||
| Credit reserve build (release) | 13 | (11 | ) | NM | (21 | ) | 13 | NM | ||||||||
| Provision (release) for unfunded lending commitments | (1 | ) | — | (100 | ) | 2 | (1 | ) | NM | |||||||
| Provisions for credit losses | $ | 172 | $ | 149 | 15 | % | $ | 143 | $ | 172 | (17 | )% | ||||
| Income from continuing operations before taxes | $ | 370 | $ | 323 | 15 | % | $ | 509 | $ | 375 | 36 | % | ||||
| Income taxes | 124 | 108 | 15 | 136 | 126 | 8 | ||||||||||
| Income from continuing operations | $ | 246 | $ | 215 | 14 | % | $ | 373 | $ | 249 | 50 | % | ||||
| Noncontrolling interests | — | 1 | (100 | ) | 2 | — | NM | |||||||||
| Net income | $ | 246 | $ | 214 | 15 | % | $ | 371 | $ | 249 | 49 | % | ||||
Balance Sheet data (in billions of dollars) | ||||||||||||||||
| Average assets | $ | 123 | $ | 116 | 6 | % | $ | 131 | $ | 123 | 7 | % | ||||
| Return on average assets | 0.81 | % | 0.74 | % | 1.15 | % | 0.82 | % | ||||||||
| Efficiency ratio | 69 | % | 71 | % | 66 | 68 | ||||||||||
| Average deposits | $ | 92.7 | $ | 87.2 | 6 | $ | 99.1 | $ | 92.7 | 7 | ||||||
| Net credit losses as a percentage of average loans | 0.78 | % | 0.76 | % | 0.73 | % | 0.78 | % | ||||||||
| Revenue by business | ||||||||||||||||
| Retail banking | $ | 1,063 | $ | 1,041 | 2 | % | $ | 1,198 | $ | 1,068 | 12 | % | ||||
| Citi-branded cards | 659 | 614 | 7 | 731 | 666 | 10 | ||||||||||
| Total | $ | 1,722 | $ | 1,655 | 4 | % | $ | 1,929 | $ | 1,734 | 11 | % | ||||
| Income from continuing operations by business | ||||||||||||||||
| Retail banking | $ | 170 | $ | 119 | 43 | % | $ | 246 | $ | 171 | 44 | % | ||||
| Citi-branded cards | 76 | 96 | (21 | ) | 127 | 78 | 63 | |||||||||
| Total | $ | 246 | $ | 215 | 14 | % | $ | 373 | $ | 249 | 50 | % | ||||
| FX translation impact | ||||||||||||||||
| Total revenues—as reported | $ | 1,722 | $ | 1,655 | 4 | % | $ | 1,929 | $ | 1,734 | 11 | % | ||||
Impact of FX translation(2) | — | 19 | — | 64 | ||||||||||||
Total revenues—ex-FX(3) | $ | 1,722 | $ | 1,674 | 3 | % | $ | 1,929 | $ | 1,798 | 7 | % | ||||
| Total operating expenses—as reported | $ | 1,180 | $ | 1,183 | — | % | $ | 1,277 | $ | 1,187 | 8 | % | ||||
Impact of FX translation(2) | — | 15 | — | 50 | ||||||||||||
Total operating expenses—ex-FX(3) | $ | 1,180 | $ | 1,198 | (2 | )% | $ | 1,277 | $ | 1,237 | 3 | % | ||||
| Provisions for loan losses—as reported | $ | 172 | $ | 149 | 15 | % | $ | 143 | $ | 172 | (17 | )% | ||||
Impact of FX translation(2) | — | 1 | — | 7 | ||||||||||||
Provisions for loan losses—ex-FX(3) | $ | 172 | $ | 150 | 15 | % | $ | 143 | $ | 179 | (20 | )% | ||||
| Net income—as reported | $ | 246 | $ | 214 | 15 | % | $ | 371 | $ | 249 | 49 | % | ||||
Impact of FX translation(2) | — | 2 | — | 5 | ||||||||||||
Net income—ex-FX(3) | $ | 246 | $ | 216 | 14 | % | $ | 371 | $ | 254 | 46 | % | ||||
| (1) | Asia GCB includes the results of operations of GCB activities in certain EMEA countries for all periods presented. |
| (2) | Reflects the impact of FX translation into U.S. dollars at the first quarter of |
| (3) | Presentation of this metric excluding FX translation is a non-GAAP financial measure. |
| First Quarter | % Change | First Quarter | ||||||||||||||
| In millions of dollars, except as otherwise noted | 2017 | 2016 | 2018 | 2017 | % Change | |||||||||||
| Commissions and fees | $ | 985 | $ | 1,004 | (2 | )% | $ | 1,213 | $ | 1,024 | 18 | % | ||||
| Administration and other fiduciary fees | 644 | 597 | 8 | 694 | 635 | 9 | ||||||||||
| Investment banking | 1,044 | 740 | 41 | 985 | 1,110 | (11 | ) | |||||||||
| Principal transactions | 2,668 | 1,576 | 69 | 2,884 | 2,731 | 6 | ||||||||||
Other | (5 | ) | (7 | ) | 29 | 418 | 1 | NM | ||||||||
| Total non-interest revenue | $ | 5,336 | $ | 3,910 | 36 | % | $ | 6,194 | $ | 5,501 | 13 | % | ||||
| Net interest revenue (including dividends) | 3,790 | 3,985 | (5 | ) | 3,654 | 3,818 | (4 | ) | ||||||||
| Total revenues, net of interest expense | $ | 9,126 | $ | 7,895 | 16 | % | $ | 9,848 | $ | 9,319 | 6 | % | ||||
| Total operating expenses | $ | 4,945 | $ | 4,872 | 1 | % | $ | 5,503 | $ | 5,138 | 7 | % | ||||
| Net credit losses | $ | 25 | $ | 211 | (88 | )% | $ | 105 | $ | 25 | NM | |||||
| Credit reserve build (release) | (176 | ) | 108 | NM | (175 | ) | (176 | ) | 1 | |||||||
| Provision (release) for unfunded lending commitments | (54 | ) | 71 | NM | 29 | (54 | ) | NM | ||||||||
| Provisions for credit losses | $ | (205 | ) | $ | 390 | NM | $ | (41 | ) | $ | (205 | ) | 80 | % | ||
| Income from continuing operations before taxes | $ | 4,386 | $ | 2,633 | 67 | % | $ | 4,386 | $ | 4,386 | — | % | ||||
| Income taxes | 1,375 | 764 | 80 | 1,057 | 1,375 | (23 | ) | |||||||||
| Income from continuing operations | $ | 3,011 | $ | 1,869 | 61 | % | $ | 3,329 | $ | 3,011 | 11 | % | ||||
| Noncontrolling interests | 15 | 10 | 50 | 15 | 15 | — | ||||||||||
| Net income | $ | 2,996 | $ | 1,859 | 61 | % | $ | 3,314 | $ | 2,996 | 11 | % | ||||
| EOP assets (in billions of dollars) | $ | 1,314 | $ | 1,293 | 2 | % | $ | 1,407 | $ | 1,314 | 7 | % | ||||
Average assets (in billions of dollars) | $ | 1,318 | $ | 1,272 | 4 | % | 1,388 | 1,318 | 5 | |||||||
| Return on average assets | 0.92 | % | 0.59 | % | 0.97 | % | 0.92 | % | ||||||||
| Efficiency ratio | 54 | % | 62 | % | 56 | 55 | ||||||||||
| Revenues by region | ||||||||||||||||
| North America | $ | 3,455 | $ | 2,980 | 16 | % | $ | 3,265 | $ | 3,522 | (7 | )% | ||||
| EMEA | 2,807 | 2,167 | 30 | 3,167 | 2,854 | 11 | ||||||||||
| Latin America | 1,127 | 962 | 17 | 1,210 | 1,169 | 4 | ||||||||||
| Asia | 1,737 | 1,786 | (3 | ) | 2,206 | 1,774 | 24 | |||||||||
| Total | $ | 9,126 | $ | 7,895 | 16 | % | $ | 9,848 | $ | 9,319 | 6 | % | ||||
| Income from continuing operations by region | ||||||||||||||||
| North America | $ | 1,100 | $ | 546 | NM | $ | 857 | $ | 1,077 | (20 | )% | |||||
| EMEA | 855 | 374 | NM | 1,113 | 862 | 29 | ||||||||||
| Latin America | 475 | 330 | 44 | 491 | 482 | 2 | ||||||||||
| Asia | 581 | 619 | (6 | ) | 868 | 590 | 47 | |||||||||
| Total | $ | 3,011 | $ | 1,869 | 61 | % | $ | 3,329 | $ | 3,011 | 11 | % | ||||
Average loans by region (in billions of dollars) | ||||||||||||||||
| North America | $ | 140 | $ | 133 | 5 | % | $ | 160 | $ | 146 | 10 | % | ||||
| EMEA | 65 | 63 | 3 | 78 | 65 | 20 | ||||||||||
| Latin America | 37 | 39 | (5 | ) | 34 | 34 | — | |||||||||
| Asia | 60 | 60 | — | 67 | 57 | 18 | ||||||||||
| Total | $ | 302 | $ | 295 | 2 | % | $ | 339 | $ | 302 | 12 | % | ||||
EOP deposits by business (in billions of dollars) | ||||||||||||||||
| Treasury and trade solutions | $ | 417 | $ | 417 | — | % | $ | 449 | $ | 417 | 8 | % | ||||
All other ICG businesses | 203 | 192 | 6 | 217 | 203 | 7 | ||||||||||
| Total | $ | 620 | $ | 609 | 2 | % | $ | 666 | $ | 620 | 8 | % | ||||
| First Quarter | ||||||||
| In millions of dollars | 2018 | 2017 | % Change | |||||
Investment banking revenue details | ||||||||
| Advisory | $ | 215 | $ | 249 | (14 | )% | ||
| Equity underwriting | 216 | 250 | (14 | ) | ||||
| Debt underwriting | 699 | 763 | (8 | ) | ||||
| Total investment banking | $ | 1,130 | $ | 1,262 | (10 | )% | ||
| Treasury and trade solutions | 2,268 | 2,108 | 8 | |||||
Corporate lending—excluding gains (losses) on loan hedges(1) | 521 | 438 | 19 | |||||
| Private bank | 904 | 749 | 21 | |||||
| Total banking revenues (ex-gains (losses) on loan hedges) | $ | 4,823 | $ | 4,557 | 6 | % | ||
Corporate lending—gains (losses) on loan hedges(1) | $ | 23 | $ | (115 | ) | NM | ||
| Total banking revenues (including gains (losses) on loan hedges) | $ | 4,846 | $ | 4,442 | 9 | % | ||
| Fixed income markets | $ | 3,418 | $ | 3,678 | (7 | )% | ||
| Equity markets | 1,103 | 802 | 38 | |||||
| Securities services | 641 | 552 | 16 | |||||
| Other | (160 | ) | (155 | ) | (3 | ) | ||
| Total markets and securities services revenues | $ | 5,002 | $ | 4,877 | 3 | % | ||
| Total revenues, net of interest expense | $ | 9,848 | $ | 9,319 | 6 | % | ||
| Commissions and fees | $ | 176 | $ | 142 | 24 | % | ||
Principal transactions(2) | 2,184 | 2,360 | (7 | ) | ||||
| Other | 276 | 151 | 83 | |||||
| Total non-interest revenue | $ | 2,636 | $ | 2,653 | (1 | )% | ||
| Net interest revenue | 782 | 1,025 | (24 | ) | ||||
| Total fixed income markets | $ | 3,418 | $ | 3,678 | (7 | )% | ||
| Rates and currencies | $ | 2,470 | $ | 2,530 | (2 | )% | ||
| Spread products/other fixed income | 948 | 1,148 | (17 | ) | ||||
| Total fixed income markets | $ | 3,418 | $ | 3,678 | (7 | )% | ||
| Commissions and fees | $ | 361 | $ | 326 | 11 | % | ||
Principal transactions(2) | 537 | 189 | NM | |||||
| Other | 80 | 9 | NM | |||||
| Total non-interest revenue | $ | 978 | $ | 524 | 87 | % | ||
| Net interest revenue | 125 | 278 | (55 | ) | ||||
| Total equity markets | $ | 1,103 | $ | 802 | 38 | % | ||
| (1) |
| First Quarter | % Change | |||||||
| In millions of dollars | 2017 | 2016 | ||||||
Investment banking revenue details | ||||||||
| Advisory | $ | 246 | $ | 227 | 8 | % | ||
| Equity underwriting | 235 | 118 | 99 | |||||
| Debt underwriting | 733 | 528 | 39 | |||||
| Total investment banking | $ | 1,214 | $ | 873 | 39 | % | ||
| Treasury and trade solutions | 2,075 | 1,903 | 9 | |||||
Corporate lending—excluding (loss) on loan hedges(1) | 434 | 448 | (3 | ) | ||||
| Private bank | 744 | 684 | 9 | |||||
| Total banking revenues (ex-(loss) on loan hedges) | $ | 4,467 | $ | 3,908 | 14 | % | ||
Corporate lending—(loss) on loan hedges(1) | $ | (115 | ) | $ | (66 | ) | (74 | )% |
| Total banking revenues (including (loss) on loan hedges) | $ | 4,352 | $ | 3,842 | 13 | % | ||
| Fixed income markets | $ | 3,622 | $ | 3,051 | 19 | % | ||
| Equity markets | 769 | 697 | 10 | |||||
| Securities services | 543 | 561 | (3 | ) | ||||
Other(2) | (160 | ) | (256 | ) | 38 | |||
| Total markets and securities services revenues | $ | 4,774 | $ | 4,053 | 18 | % | ||
| Total revenues, net of interest expense | $ | 9,126 | $ | 7,895 | 16 | % | ||
| Commissions and fees | $ | 140 | $ | 124 | 13 | % | ||
Principal transactions(3) | 2,318 | 1,344 | 72 | |||||
| Other | 149 | 216 | (31 | ) | ||||
| Total non-interest revenue | $ | 2,607 | $ | 1,684 | 55 | % | ||
| Net interest revenue | 1,015 | 1,367 | (26 | ) | ||||
| Total fixed income markets | $ | 3,622 | $ | 3,051 | 19 | % | ||
| Rates and currencies | $ | 2,503 | $ | 2,236 | 12 | % | ||
| Spread products / other fixed income | 1,119 | 815 | 37 | |||||
| Total fixed income markets | $ | 3,622 | $ | 3,051 | 19 | % | ||
| Commissions and fees | $ | 316 | $ | 357 | (11 | )% | ||
Principal transactions(3) | 166 | 51 | NM | |||||
| Other | 8 | 2 | NM | |||||
| Total non-interest revenue | $ | 490 | $ | 410 | 20 | % | ||
| Net interest revenue | 279 | 287 | (3 | ) | ||||
| Total equity markets | $ | 769 | $ | 697 | 10 | |||
| First Quarter | % Change | First Quarter | ||||||||||||||
| In millions of dollars | 2017 | 2016 | 2018 | 2017 | % Change | |||||||||||
| Net interest revenue | $ | 545 | $ | 890 | (39 | )% | $ | 538 | $ | 558 | (4 | )% | ||||
| Non-interest revenue | 632 | 1,056 | (40 | )% | 53 | 643 | (92 | ) | ||||||||
| Total revenues, net of interest expense | $ | 1,177 | $ | 1,946 | (40 | )% | $ | 591 | $ | 1,201 | (51 | )% | ||||
| Total operating expenses | $ | 1,117 | $ | 1,250 | (11 | )% | $ | 741 | $ | 1,134 | (35 | )% | ||||
| Net credit losses | $ | 81 | $ | 142 | (43 | )% | $ | 26 | $ | 81 | (68 | )% | ||||
| Credit reserve build (release) | (35 | ) | (31 | ) | (13 | ) | (33 | ) | (35 | ) | 6 | |||||
| Provision (release) for unfunded lending commitments | 5 | (1 | ) | NM | — | 1 | (100 | ) | ||||||||
| Provision for benefits and claims | 1 | 60 | (98 | ) | — | 5 | (100 | ) | ||||||||
| Provisions for loan losses and for benefits and claims | 52 | 170 | (69 | )% | ||||||||||||
| Income from continuing operations before taxes | $ | 8 | $ | 526 | (98 | )% | ||||||||||
| Provisions for credit losses and for benefits and claims | $ | (7 | ) | $ | 52 | NM | ||||||||||
| Income (loss) from continuing operations before taxes | $ | (143 | ) | $ | 15 | NM | ||||||||||
| Income taxes (benefits) | (96 | ) | 81 | NM | (69 | ) | (94 | ) | 27 | |||||||
| Income from continuing operations | $ | 104 | $ | 445 | (77 | )% | ||||||||||
| Income (loss) from continuing operations | $ | (74 | ) | $ | 109 | NM | ||||||||||
| Income (loss) from discontinued operations, net of taxes | (18 | ) | (2 | ) | NM | (7 | ) | (18 | ) | 61 | ||||||
| Net income before attribution of noncontrolling interests | $ | 86 | $ | 443 | (81 | )% | ||||||||||
| Net income (loss) before attribution of noncontrolling interests | $ | (81 | ) | $ | 91 | NM | ||||||||||
| Noncontrolling interests | (6 | ) | (7 | ) | 14 | % | 5 | (6 | ) | NM | ||||||
| Net income | $ | 92 | $ | 450 | (80 | )% | ||||||||||
| Net income (loss) | $ | (86 | ) | $ | 97 | NM | ||||||||||
| Variable interests and other obligations, including contingent obligations, arising from variable interests in nonconsolidated VIEs | See Note 18 to the Consolidated Financial Statements. |
| Letters of credit, and lending and other commitments | See Note 22 to the Consolidated Financial Statements. |
| Guarantees | See Note 22 to the Consolidated Financial Statements. |
| March 31, 2017 | December 31, 2016 | March 31, 2018 | December 31, 2017 | ||||||||||||||||||||||
| In millions of dollars, except ratios | Advanced Approaches | Standardized Approach | Advanced Approaches | Standardized Approach | Advanced Approaches | Standardized Approach | Advanced Approaches | Standardized Approach | |||||||||||||||||
| Common Equity Tier 1 Capital | $ | 161,665 | $ | 161,665 | $ | 167,378 | $ | 167,378 | $ | 144,128 | $ | 144,128 | $ | 142,822 | $ | 142,822 | |||||||||
| Tier 1 Capital | 177,104 | 177,104 | 178,387 | 178,387 | 163,490 | 163,490 | 162,377 | 162,377 | |||||||||||||||||
Total Capital (Tier 1 Capital + Tier 2 Capital) | 201,500 | 214,080 | 202,146 | 214,938 | 188,668 | 200,892 | 187,877 | 199,989 | |||||||||||||||||
| Total Risk-Weighted Assets | 1,166,202 | 1,142,579 | 1,166,764 | 1,126,314 | 1,178,127 | 1,195,981 | 1,152,644 | 1,155,099 | |||||||||||||||||
Common Equity Tier 1 Capital ratio(2) | 13.86 | % | 14.15 | % | 14.35 | % | 14.86 | % | |||||||||||||||||
Tier 1 Capital ratio(2) | 15.19 | 15.50 | 15.29 | 15.84 | |||||||||||||||||||||
Total Capital ratio(2) | 17.28 | 18.74 | 17.33 | 19.08 | |||||||||||||||||||||
| Credit Risk | $ | 790,466 | $ | 1,125,602 | $ | 767,102 | $ | 1,089,372 | |||||||||||||||||
| Market Risk | 69,577 | 70,379 | 65,003 | 65,727 | |||||||||||||||||||||
| Operational Risk | 318,084 | — | 320,539 | — | |||||||||||||||||||||
Common Equity Tier 1 Capital ratio(1)(2) | 12.23 | % | 12.05 | % | 12.39 | % | 12.36 | % | |||||||||||||||||
Tier 1 Capital ratio(1)(2) | 13.88 | 13.67 | 14.09 | 14.06 | |||||||||||||||||||||
Total Capital ratio(1)(2) | 16.01 | 16.80 | 16.30 | 17.31 | |||||||||||||||||||||
| In millions of dollars, except ratios | March 31, 2017 | December 31, 2016 | March 31, 2018 | December 31, 2017 | |||||||||||||
Quarterly Adjusted Average Total Assets(3) | $ | 1,776,048 | $ | 1,768,415 | $ | 1,862,802 | $ | 1,868,326 | |||||||||
Total Leverage Exposure(4) | 2,375,616 | 2,351,883 | 2,436,817 | 2,432,491 | |||||||||||||
| Tier 1 Leverage ratio | 9.97 | % | 10.09 | % | 8.78 | % | 8.69 | % | |||||||||
| Supplementary Leverage ratio | 7.46 | 7.58 | 6.71 | 6.68 | |||||||||||||
| (1) |
| As of March 31, |
| (2) | Citi’s risk-based capital and leverage ratios and related components as of December 31, 2017 are non-GAAP financial measures, which reflect full implementation of regulatory capital adjustments and deductions prior to the effective date of January 1, 2018. |
| (3) | Tier 1 Leverage ratio denominator. |
| (4) | Supplementary Leverage ratio denominator. |
| In millions of dollars | March 31, 2017 | December 31, 2016 | ||||
| Common Equity Tier 1 Capital | ||||||
Citigroup common stockholders’ equity(1) | $ | 209,063 | $ | 206,051 | ||
| Add: Qualifying noncontrolling interests | 197 | 259 | ||||
| Regulatory Capital Adjustments and Deductions: | ||||||
Less: Net unrealized losses on securities available-for-sale (AFS), net of tax(2)(3) | (116 | ) | (320 | ) | ||
Less: Defined benefit plans liability adjustment, net of tax(3) | (1,035 | ) | (2,066 | ) | ||
Less: Accumulated net unrealized losses on cash flow hedges, net of tax(4) | (562 | ) | (560 | ) | ||
Less: Cumulative unrealized net loss related to changes in fair value of financial liabilities attributable to own creditworthiness, net of tax(3)(5) | (138 | ) | (37 | ) | ||
| Less: Intangible assets: | ||||||
Goodwill, net of related deferred tax liabilities (DTLs)(6) | 21,448 | 20,858 | ||||
Identifiable intangible assets other than mortgage servicing rights (MSRs), net of related DTLs(3) | 3,790 | 2,926 | ||||
Less: Defined benefit pension plan net assets(3) | 669 | 514 | ||||
Less: Deferred tax assets (DTAs) arising from net operating loss, foreign tax credit and general business credit carry-forwards(3)(7) | 16,862 | 12,802 | ||||
Less: Excess over 10%/15% limitations for other DTAs, certain common stock investments, and MSRs(3)(7)(8) | 6,677 | 4,815 | ||||
| Total Common Equity Tier 1 Capital | $ | 161,665 | $ | 167,378 | ||
| Additional Tier 1 Capital | ||||||
Qualifying perpetual preferred stock(1) | $ | 19,069 | $ | 19,069 | ||
Qualifying trust preferred securities(9) | 1,372 | 1,371 | ||||
| Qualifying noncontrolling interests | 23 | 17 | ||||
| Regulatory Capital Adjustment and Deductions: | ||||||
Less: Cumulative unrealized net loss related to changes in fair value of financial liabilities attributable to own creditworthiness, net of tax(3)(5) | (35 | ) | (24 | ) | ||
Less: Defined benefit pension plan net assets(3) | 167 | 343 | ||||
Less: DTAs arising from net operating loss, foreign tax credit and general business credit carry-forwards(3)(7) | 4,215 | 8,535 | ||||
Less: Permitted ownership interests in covered funds(10) | 618 | 533 | ||||
Less: Minimum regulatory capital requirements of insurance underwriting subsidiaries(11) | 60 | 61 | ||||
| Total Additional Tier 1 Capital | $ | 15,439 | $ | 11,009 | ||
| Total Tier 1 Capital (Common Equity Tier 1 Capital + Additional Tier 1 Capital) | $ | 177,104 | $ | 178,387 | ||
| Tier 2 Capital | ||||||
| Qualifying subordinated debt | $ | 23,278 | $ | 22,818 | ||
Qualifying trust preferred securities(12) | 319 | 317 | ||||
| Qualifying noncontrolling interests | 30 | 22 | ||||
Excess of eligible credit reserves over expected credit losses(13) | 827 | 660 | ||||
| Regulatory Capital Adjustment and Deduction: | ||||||
| Add: Unrealized gains on AFS equity exposures includable in Tier 2 Capital | 2 | 3 | ||||
Less: Minimum regulatory capital requirements of insurance underwriting subsidiaries(11) | 60 | 61 | ||||
| Total Tier 2 Capital | $ | 24,396 | $ | 23,759 | ||
| Total Capital (Tier 1 Capital + Tier 2 Capital) | $ | 201,500 | $ | 202,146 | ||
| March 31, 2017 | December 31, 2016 | ||||||||||||
| In millions of dollars | Advanced Approaches | Standardized Approach | Advanced Approaches | Standardized Approach | |||||||||
Credit Risk(14) | $ | 766,382 | $ | 1,070,053 | $ | 773,483 | $ | 1,061,786 | |||||
| Market Risk | 72,247 | 72,526 | 64,006 | 64,528 | |||||||||
| Operational Risk | 327,573 | — | 329,275 | — | |||||||||
| Total Risk-Weighted Assets | $ | 1,166,202 | $ | 1,142,579 | $ | 1,166,764 | $ | 1,126,314 | |||||
| In millions of dollars | March 31, 2018 | December 31, 2017 | ||||
| Common Equity Tier 1 Capital | ||||||
Citigroup common stockholders’ equity(1) | $ | 182,943 | $ | 181,671 | ||
| Add: Qualifying noncontrolling interests | 140 | 153 | ||||
| Regulatory Capital Adjustments and Deductions: | ||||||
Less: Accumulated net unrealized losses on cash flow hedges, net of tax(2) | (920 | ) | (698 | ) | ||
Less: Cumulative unrealized net loss related to changes in fair value of financial liabilities attributable to own creditworthiness, net of tax(3) | (498 | ) | (721 | ) | ||
| Less: Intangible assets: | ||||||
Goodwill, net of related DTLs(4) | 22,482 | 22,052 | ||||
Identifiable intangible assets other than MSRs, net of related DTLs | 4,209 | 4,401 | ||||
| Less: Defined benefit pension plan net assets | 871 | 896 | ||||
Less: DTAs arising from net operating loss, foreign tax credit and general business credit carry-forwards(5) | 12,811 | 13,072 | ||||
| Total Common Equity Tier 1 Capital (Standardized Approach and Advanced Approaches) | $ | 144,128 | $ | 142,822 | ||
| Additional Tier 1 Capital | ||||||
Qualifying noncumulative perpetual preferred stock(1) | $ | 18,972 | $ | 19,069 | ||
Qualifying trust preferred securities(6) | 1,379 | 1,377 | ||||
| Qualifying noncontrolling interests | 59 | 61 | ||||
| Regulatory Capital Deductions: | ||||||
Less: Permitted ownership interests in covered funds(7) | 997 | 900 | ||||
Less: Minimum regulatory capital requirements of insurance underwriting subsidiaries(8) | 51 | 52 | ||||
| Total Additional Tier 1 Capital (Standardized Approach and Advanced Approaches) | $ | 19,362 | $ | 19,555 | ||
Total Tier 1 Capital (Common Equity Tier 1 Capital + Additional Tier 1 Capital) (Standardized Approach and Advanced Approaches) | $ | 163,490 | $ | 162,377 | ||
| Tier 2 Capital | ||||||
| Qualifying subordinated debt | $ | 23,430 | $ | 23,673 | ||
Qualifying trust preferred securities(9) | 334 | 329 | ||||
| Qualifying noncontrolling interests | 51 | 50 | ||||
Eligible allowance for credit losses(10) | 13,638 | 13,612 | ||||
| Regulatory Capital Deduction: | ||||||
Less: Minimum regulatory capital requirements of insurance underwriting subsidiaries(8) | 51 | 52 | ||||
| Total Tier 2 Capital (Standardized Approach) | $ | 37,402 | $ | 37,612 | ||
| Total Capital (Tier 1 Capital + Tier 2 Capital) (Standardized Approach) | $ | 200,892 | $ | 199,989 | ||
Adjustment for excess of eligible credit reserves over expected credit losses(10) | $ | (12,224 | ) | $ | (12,112 | ) |
Total Tier 2 Capital (Advanced Approaches) | $ | 25,178 | $ | 25,500 | ||
| Total Capital (Tier 1 Capital + Tier 2 Capital) (Advanced Approaches) | $ | 188,668 | $ | 187,877 | ||
| (1) | Issuance costs of $184 million related to noncumulative perpetual preferred stock outstanding at March 31, |
| In millions of dollars | Three months ended March 31, 2017 | ||
| Common Equity Tier 1 Capital | |||
| Balance, beginning of period | $ | 167,376 | |
| Net income | 4,090 | ||
| Common and preferred stock dividends declared | (746 | ) | |
| Net increase in treasury stock | (1,277 | ) | |
| Net decrease in common stock and additional paid-in capital | (429 | ) | |
| Net decrease in foreign currency translation adjustment net of hedges, net of tax | 1,318 | ||
| Net decrease in unrealized losses on securities AFS, net of tax | 16 | ||
| Net increase in defined benefit plans liability adjustment, net of tax | (1,043 | ) | |
Net change in adjustment related to changes in fair value of financial liabilities attributable to own creditworthiness, net of tax | 41 | ||
| Net increase in goodwill, net of related DTLs | (590 | ) | |
| Net increase in identifiable intangible assets other than MSRs, net of related DTLs | (864 | ) | |
| Net increase in defined benefit pension plan net assets | (155 | ) | |
Net increase in DTAs arising from net operating loss, foreign tax credit and general business credit carry-forwards | (4,034 | ) | |
Net increase in excess over 10%/15% limitations for other DTAs, certain common stock investments and MSRs | (1,886 | ) | |
| Other | (152 | ) | |
| Net decrease in Common Equity Tier 1 Capital | $ | (5,711 | ) |
| Common Equity Tier 1 Capital Balance, end of period | $ | 161,665 | |
| Additional Tier 1 Capital | |||
| Balance, beginning of period | $ | 10,992 | |
| Net increase in qualifying trust preferred securities | 1 | ||
Net change in adjustment related to changes in fair value of financial liabilities attributable to own creditworthiness, net of tax | 11 | ||
| Net decrease in defined benefit pension plan net assets | 176 | ||
Net decrease in DTAs arising from net operating loss, foreign tax credit and general business credit carry-forwards | 4,337 | ||
| Net increase in permitted ownership interests in covered funds | (85 | ) | |
| Other | 7 | ||
| Net increase in Additional Tier 1 Capital | $ | 4,447 | |
| Tier 1 Capital Balance, end of period | $ | 177,104 | |
| Tier 2 Capital | |||
| Balance, beginning of period | $ | 23,759 | |
| Net increase in qualifying subordinated debt | 460 | ||
| Net increase in qualifying trust preferred securities | 2 | ||
| Net increase in excess of eligible credit reserves over expected credit losses | 167 | ||
| Other | 8 | ||
| Net increase in Tier 2 Capital | $ | 637 | |
| Tier 2 Capital Balance, end of period | $ | 24,396 | |
| Total Capital (Tier 1 Capital + Tier 2 Capital) | $ | 201,500 | |
| In millions of dollars | Three months ended March 31, 2017 | ||
| Total Risk-Weighted Assets, beginning of period | $ | 1,166,764 | |
| Changes in Credit Risk-Weighted Assets | |||
Net decrease in retail exposures(1) | (4,312 | ) | |
Net increase in wholesale exposures(2) | 4,445 | ||
| Net decrease in repo-style transactions | (197 | ) | |
| Net decrease in securitization exposures | (235 | ) | |
| Net increase in equity exposures | 465 | ||
Net decrease in over-the-counter (OTC) derivatives(3) | (4,199 | ) | |
Net decrease in derivatives CVA(4) | (1,061 | ) | |
Net decrease in other exposures(5) | (1,665 | ) | |
Net decrease in supervisory 6% multiplier(6) | (342 | ) | |
| Net decrease in Credit Risk-Weighted Assets | $ | (7,101 | ) |
| Changes in Market Risk-Weighted Assets | |||
Net increase in risk levels(7) | $ | 10,995 | |
Net decrease due to model and methodology updates(8) | (2,754 | ) | |
| Net increase in Market Risk-Weighted Assets | $ | 8,241 | |
Net decrease in Operational Risk-Weighted Assets(9) | $ | (1,702 | ) |
| Total Risk-Weighted Assets, end of period | $ | 1,166,202 | |
| March 31, 2017 | December 31, 2016 | ||||||||||||
| In millions of dollars, except ratios | Advanced Approaches | Standardized Approach | Advanced Approaches | Standardized Approach | |||||||||
| Common Equity Tier 1 Capital | $ | 126,543 | $ | 126,543 | $ | 126,220 | $ | 126,220 | |||||
| Tier 1 Capital | 127,859 | 127,859 | 126,465 | 126,465 | |||||||||
Total Capital (Tier 1 Capital + Tier 2 Capital)(1) | 140,431 | 151,628 | 138,821 | 150,291 | |||||||||
| Total Risk-Weighted Assets | 984,660 | 1,016,037 | 973,933 | 1,001,016 | |||||||||
Common Equity Tier 1 Capital ratio(2)(3) | 12.85 | % | 12.45 | % | 12.96 | % | 12.61 | % | |||||
Tier 1 Capital ratio(2)(3) | 12.99 | 12.58 | 12.99 | 12.63 | |||||||||
Total Capital ratio(2)(3) | 14.26 | 14.92 | 14.25 | 15.01 | |||||||||
| In millions of dollars, except ratios | March 31, 2017 | December 31, 2016 | |||||||
Quarterly Adjusted Average Total Assets(4) | $ | 1,350,921 | $ | 1,333,161 | |||||
Total Leverage Exposure(5) | 1,885,462 | 1,859,394 | |||||||
Tier 1 Leverage ratio(3) | 9.46 | % | 9.49 | % | |||||
| Supplementary Leverage ratio | 6.78 | 6.80 | |||||||
Common Equity Tier 1 Capital ratio | Tier 1 Capital ratio | Total Capital ratio | ||||
| In basis points | Impact of $100 million change in Common Equity Tier 1 Capital | Impact of $1 billion change in risk- weighted assets | Impact of $100 million change in Tier 1 Capital | Impact of $1 billion change in risk- weighted assets | Impact of $100 million change in Total Capital | Impact of $1 billion change in risk- weighted assets |
| Citigroup | ||||||
| Advanced Approaches | 0.9 | 1.2 | 0.9 | 1.3 | 0.9 | 1.5 |
| Standardized Approach | 0.9 | 1.2 | 0.9 | 1.4 | 0.9 | 1.6 |
| Citibank | ||||||
| Advanced Approaches | 1.0 | 1.3 | 1.0 | 1.3 | 1.0 | 1.4 |
| Standardized Approach | 1.0 | 1.2 | 1.0 | 1.2 | 1.0 | 1.5 |
| Tier 1 Leverage ratio | Supplementary Leverage ratio | |||
| In basis points | Impact of $100 million change in Tier 1 Capital | Impact of $1 billion change in quarterly adjusted average total assets | Impact of $100 million change in Tier 1 Capital | Impact of $1 billion change in Total Leverage Exposure |
| Citigroup | 0.6 | 0.6 | 0.4 | 0.3 |
| Citibank | 0.7 | 0.7 | 0.5 | 0.4 |
| March 31, 2017 | December 31, 2016 | ||||||||||||
| In millions of dollars, except ratios | Advanced Approaches | Standardized Approach | Advanced Approaches | Standardized Approach | |||||||||
| Common Equity Tier 1 Capital | $ | 152,835 | $ | 152,835 | $ | 149,516 | $ | 149,516 | |||||
| Tier 1 Capital | 172,626 | 172,626 | 169,390 | 169,390 | |||||||||
Total Capital (Tier 1 Capital + Tier 2 Capital)(1) | 197,027 | 209,607 | 193,160 | 205,975 | |||||||||
| Total Risk-Weighted Assets | 1,191,503 | 1,166,447 | 1,189,680 | 1,147,956 | |||||||||
Common Equity Tier 1 Capital ratio(2)(3) | 12.83 | % | 13.10 | % | 12.57 | % | 13.02 | % | |||||
Tier 1 Capital ratio(2)(3) | 14.49 | 14.80 | 14.24 | 14.76 | |||||||||
Total Capital ratio(2)(3) | 16.54 | 17.97 | 16.24 | 17.94 | |||||||||
| In millions of dollars, except ratios | March 31, 2017 | December 31, 2016 | |||||||
Quarterly Adjusted Average Total Assets(4) | $ | 1,772,780 | $ | 1,761,923 | |||||
Total Leverage Exposure(5) | 2,372,348 | 2,345,391 | |||||||
Tier 1 Leverage ratio(3) | 9.74 | % | 9.61 | % | |||||
Supplementary Leverage ratio(3) | 7.28 | 7.22 | |||||||
| In millions of dollars | March 31, 2017 | December 31, 2016 | ||||
| Common Equity Tier 1 Capital | ||||||
Citigroup common stockholders’ equity(1) | $ | 209,063 | $ | 206,051 | ||
| Add: Qualifying noncontrolling interests | 133 | 129 | ||||
| Regulatory Capital Adjustments and Deductions: | ||||||
Less: Accumulated net unrealized losses on cash flow hedges, net of tax(2) | (562 | ) | (560 | ) | ||
Less: Cumulative unrealized net loss related to changes in fair value of financial liabilities attributable to own creditworthiness, net of tax(3) | (173 | ) | (61 | ) | ||
| Less: Intangible assets: | ||||||
Goodwill, net of related DTLs(4) | 21,448 | 20,858 | ||||
Identifiable intangible assets other than MSRs, net of related DTLs | 4,738 | 4,876 | ||||
| Less: Defined benefit pension plan net assets | 836 | 857 | ||||
Less: DTAs arising from net operating loss, foreign tax credit and general business credit carry-forwards(5) | 21,077 | 21,337 | ||||
Less: Excess over 10%/15% limitations for other DTAs, certain common stock investments, and MSRs(5)(6) | 8,997 | 9,357 | ||||
| Total Common Equity Tier 1 Capital | $ | 152,835 | $ | 149,516 | ||
| Additional Tier 1 Capital | ||||||
Qualifying perpetual preferred stock(1) | $ | 19,069 | $ | 19,069 | ||
Qualifying trust preferred securities(7) | 1,372 | 1,371 | ||||
| Qualifying noncontrolling interests | 28 | 28 | ||||
| Regulatory Capital Deductions: | ||||||
Less: Permitted ownership interests in covered funds(8) | 618 | 533 | ||||
Less: Minimum regulatory capital requirements of insurance underwriting subsidiaries(9) | 60 | 61 | ||||
| Total Additional Tier 1 Capital | $ | 19,791 | $ | 19,874 | ||
| Total Tier 1 Capital (Common Equity Tier 1 Capital + Additional Tier 1 Capital) | $ | 172,626 | $ | 169,390 | ||
| Tier 2 Capital | ||||||
| Qualifying subordinated debt | $ | 23,278 | $ | 22,818 | ||
Qualifying trust preferred securities(10) | 319 | 317 | ||||
| Qualifying noncontrolling interests | 37 | 36 | ||||
Excess of eligible credit reserves over expected credit losses(11) | 827 | 660 | ||||
| Regulatory Capital Deduction: | ||||||
Less: Minimum regulatory capital requirements of insurance underwriting subsidiaries(9) | 60 | 61 | ||||
| Total Tier 2 Capital | $ | 24,401 | $ | 23,770 | ||
Total Capital (Tier 1 Capital + Tier 2 Capital)(12) | $ | 197,027 | $ | 193,160 | ||
| (2) | Common Equity Tier 1 Capital is adjusted for accumulated net unrealized gains (losses) on cash flow hedges included in AOCI that relate to the hedging of items not recognized at fair value on the balance sheet. |
| (3) | The cumulative impact of changes in Citigroup’s own creditworthiness in valuing liabilities for which the fair value option has been elected, and own-credit valuation adjustments on derivatives, are excluded from Common Equity Tier 1 Capital, in accordance with the U.S. Basel III rules. |
| (4) | Includes goodwill “embedded” in the valuation of significant common stock investments in unconsolidated financial institutions. |
| (5) | Of Citi’s |
| (6) |
| Represents Citigroup Capital XIII trust preferred securities, which are permanently grandfathered as Tier 1 Capital under the U.S. Basel III rules. |
| Banking entities are required to be in compliance with the Volcker Rule of the Dodd-Frank Act, |
| 50% of the minimum regulatory capital requirements of insurance underwriting subsidiaries must be deducted from each of Tier 1 Capital and Tier 2 Capital. |
| Represents the amount of non-grandfathered trust preferred securities eligible for inclusion in Tier 2 Capital under the U.S. Basel III rules, which will be fully phased-out of Tier 2 Capital by January 1, 2022. |
| In millions of dollars | Three months ended March 31, 2017 | Three Months Ended March 31, 2018 | ||||
| Common Equity Tier 1 Capital | ||||||
| Balance, beginning of period | $ | 149,512 | ||||
| Common Equity Tier 1 Capital, beginning of period | $ | 142,822 | ||||
| Net income | 4,090 | 4,620 | ||||
| Common and preferred stock dividends declared | (746 | ) | (1,098 | ) | ||
| Net increase in treasury stock | (1,277 | ) | (1,806 | ) | ||
| Net decrease in common stock and additional paid-in capital | (429 | ) | (409 | ) | ||
| Net decrease in foreign currency translation adjustment net of hedges, net of tax | 1,318 | 1,120 | ||||
| Net decrease in unrealized losses on securities AFS, net of tax | 220 | |||||
| Net increase in defined benefit plans liability adjustment, net of tax | (12 | ) | ||||
| Net increase in unrealized losses on debt securities AFS, net of tax | (1,061 | ) | ||||
| Net decrease in defined benefit plans liability adjustment, net of tax | 88 | |||||
Net change in adjustment related to changes in fair value of financial liabilities attributable to own creditworthiness, net of tax | 52 | (95 | ) | |||
| Net increase in ASC 815—excluded Component of Fair Value Hedges | (4 | ) | ||||
| Net increase in goodwill, net of related DTLs | (590 | ) | (430 | ) | ||
| Net decrease in identifiable intangible assets other than MSRs, net of related DTLs | 138 | 192 | ||||
| Net decrease in defined benefit pension plan net assets | 21 | 25 | ||||
Net decrease in DTAs arising from net operating loss, foreign tax credit and general business credit carry-forwards | 303 | 261 | ||||
Net decrease in excess over 10%/15% limitations for other DTAs, certain common stock investments and MSRs | 321 | |||||
| Other | (86 | ) | (97 | ) | ||
| Net increase in Common Equity Tier 1 Capital | $ | 3,323 | $ | 1,306 | ||
| Common Equity Tier 1 Capital Balance, end of period | $ | 152,835 | ||||
| Additional Tier 1 Capital | ||||||
| Balance, beginning of period | $ | 19,874 | ||||
Common Equity Tier 1 Capital, end of period (Standardized Approach and Advanced Approaches) | $ | 144,128 | ||||
| Additional Tier 1 Capital, beginning of period | $ | 19,555 | ||||
| Net decrease in qualifying perpetual preferred stock | (97 | ) | ||||
| Net increase in qualifying trust preferred securities | 1 | 2 | ||||
| Net increase in permitted ownership interests in covered funds | (85 | ) | (97 | ) | ||
| Other | 1 | (1 | ) | |||
| Net decrease in Additional Tier 1 Capital | $ | (83 | ) | $ | (193 | ) |
| Tier 1 Capital Balance, end of period | $ | 172,626 | ||||
| Tier 2 Capital | ||||||
| Balance, beginning of period | $ | 23,770 | ||||
| Net increase in qualifying subordinated debt | 460 | |||||
| Net increase in excess of eligible credit reserves over expected credit losses | 167 | |||||
Tier 1 Capital, end of period (Standardized Approach and Advanced Approaches) | $ | 163,490 | ||||
| Tier 2 Capital, beginning of period (Standardized Approach) | $ | 37,612 | ||||
| Net decrease in qualifying subordinated debt | (243 | ) | ||||
| Net increase in eligible allowance for credit losses | 26 | |||||
| Other | 4 | 7 | ||||
| Net increase in Tier 2 Capital | $ | 631 | ||||
| Tier 2 Capital Balance, end of period | $ | 24,401 | ||||
| Total Capital (Tier 1 Capital + Tier 2 Capital) | $ | 197,027 | ||||
| Net decrease in Tier 2 Capital (Standardized Approach) | $ | (210 | ) | |||
| Tier 2 Capital, end of period (Standardized Approach) | $ | 37,402 | ||||
| Total Capital, end of period (Standardized Approach) | $ | 200,892 | ||||
| Tier 2 Capital, beginning of period (Advanced Approaches) | $ | 25,500 | ||||
| Net decrease in qualifying subordinated debt | (243 | ) | ||||
| Net decrease in excess of eligible credit reserves over expected credit losses | (86 | ) | ||||
| Other | 7 | |||||
| Net decrease in Tier 2 Capital (Advanced Approaches) | $ | (322 | ) | |||
| Tier 2 Capital, end of period (Advanced Approaches) | $ | 25,178 | ||||
| Total Capital, end of period (Advanced Approaches) | $ | 188,668 | ||||
| March 31, 2017 | December 31, 2016 | ||||||||||||
| In millions of dollars | Advanced Approaches | Standardized Approach | Advanced Approaches | Standardized Approach | |||||||||
| Credit Risk | $ | 791,683 | $ | 1,093,921 | $ | 796,399 | $ | 1,083,428 | |||||
| Market Risk | 72,247 | 72,526 | 64,006 | 64,528 | |||||||||
| Operational Risk | 327,573 | — | 329,275 | — | |||||||||
| Total Risk-Weighted Assets | $ | 1,191,503 | $ | 1,166,447 | $ | 1,189,680 | $ | 1,147,956 | |||||
| In millions of dollars | Three Months Ended March 31, 2018 | ||
| Total Risk-Weighted Assets, beginning of period | $ | 1,155,099 | |
| Changes in Credit Risk-Weighted Assets | |||
Net decrease in general credit risk exposures(1) | (1,252 | ) | |
Net increase in repo-style transactions(2) | 8,253 | ||
| Net increase in securitization exposures | 1,827 | ||
| Net increase in equity exposures | 878 | ||
Net increase in over-the-counter (OTC) derivatives(3) | 10,433 | ||
Net increase in other exposures(4) | 7,952 | ||
Net increase in off-balance sheet exposures(5) | 8,139 | ||
| Net increase in Credit Risk-Weighted Assets | $ | 36,230 | |
| Changes in Market Risk-Weighted Assets | |||
Net increase in risk levels(6) | $ | 7,232 | |
Net decrease due to model and methodology updates(7) | (2,580 | ) | |
| Net increase in Market Risk-Weighted Assets | $ | 4,652 | |
| Total Risk-Weighted Assets, end of period | $ | 1,195,981 | |
| (1) | General credit risk exposures include cash and balances due from depository institutions, securities, and loans and leases. General credit risk exposures increased during the three months ended March 31, 2018 primarily due to corporate loan growth. |
| (2) | Repo-style transactions include repurchase or reverse repurchase transactions and securities borrowing or securities lending transactions. |
| (3) | OTC derivatives increased during the three months ended March 31, 2018 primarily due to increased notional amounts for bilateral trades resulting from increased seasonal business activity. |
| (4) | Other exposures include cleared transactions, unsettled transactions, and other assets. Other exposures increased during the three months ended March 31, 2018 primarily due to additional DTAs arising from temporary differences, which are subject to risk-weighting at 250%. |
| (5) | Off-balance sheet exposures increased during the three months ended March 31, 2018 primarily due to an increase in commitments to extend credit that will drive future corporate loan growth. |
| (6) | Risk levels increased during the three months ended March 31, 2018 primarily due to increases in exposure levels subject to Stressed Value at Risk and Value at Risk. |
| (7) | Risk-weighted assets declined during the three months ended March 31, 2018 primarily due to methodology changes for standard specific risk charges. |
| In millions of dollars | Three months ended March 31, 2017 | Three Months Ended March 31, 2018 | ||||
| Total Risk-Weighted Assets, beginning of period | $ | 1,189,680 | $ | 1,152,644 | ||
| Changes in Credit Risk-Weighted Assets | ||||||
Net decrease in retail exposures(1) | (4,312 | ) | (9,405 | ) | ||
Net increase in wholesale exposures(2) | 4,445 | 9,288 | ||||
| Net decrease in repo-style transactions | (197 | ) | ||||
| Net decrease in securitization exposures | (235 | ) | ||||
Net increase in repo-style transactions(3) | 4,189 | |||||
| Net increase in securitization exposures | 1,980 | |||||
| Net increase in equity exposures | 542 | 1,029 | ||||
Net decrease in over-the-counter (OTC) derivatives(3) | (4,199 | ) | ||||
Net decrease in derivatives CVA(4) | (1,061 | ) | ||||
Net increase in over-the-counter (OTC) derivatives(4) | 3,047 | |||||
Net increase in derivatives CVA(5) | 7,120 | |||||
Net increase in other exposures | 508 | 5,196 | ||||
Net decrease in supervisory 6% multiplier(6) | (207 | ) | ||||
| Net decrease in Credit Risk-Weighted Assets | $ | (4,716 | ) | |||
Net increase in supervisory 6% multiplier(7) | 920 | |||||
| Net increase in Credit Risk-Weighted Assets | $ | 23,364 | ||||
| Changes in Market Risk-Weighted Assets | ||||||
Net increase in risk levels | $ | 10,995 | $ | 7,154 | ||
Net decrease due to model and methodology updates | (2,754 | ) | (2,580 | ) | ||
| Net increase in Market Risk-Weighted Assets | $ | 8,241 | $ | 4,574 | ||
Net decrease in Operational Risk-Weighted Assets(9) | $ | (1,702 | ) | |||
Net decrease in Operational Risk-Weighted Assets(10) | $ | (2,455 | ) | |||
| Total Risk-Weighted Assets, end of period | $ | 1,191,503 | $ | 1,178,127 | ||
| (1) | Retail exposures decreased during the three months ended March 31, |
| (2) | Wholesale exposures increased during the three months ended March 31, |
| (3) | Repo-style transactions include repurchase or reverse repurchase transactions and securities borrowing or securities lending transactions. |
| (4) | OTC derivatives |
| Derivatives CVA |
| Other exposures include cleared transactions, unsettled transactions, assets other than those reportable in specific exposure categories and non-material portfolios. Other exposures increased during the three months ended March 31, 2018 primarily due to additional temporary difference deferred tax assets subject to risk weighting. |
| Supervisory 6% multiplier does not apply to derivatives CVA. |
| Risk levels increased during the three months ended March 31, |
| Risk-weighted assets declined during the three months ended March 31, |
| In millions of dollars, except ratios | March 31, 2017 | December 31, 2016 | March 31, 2018 | December 31, 2017 | ||||||||
| Tier 1 Capital | $ | 172,626 | $ | 169,390 | $ | 163,490 | $ | 162,377 | ||||
| Total Leverage Exposure (TLE) | ||||||||||||
On-balance sheet assets(1) | $ | 1,830,554 | $ | 1,819,802 | $ | 1,904,223 | $ | 1,909,699 | ||||
Certain off-balance sheet exposures:(2) | ||||||||||||
| Potential future exposure on derivative contracts | 220,573 | 211,009 | 190,824 | 191,555 | ||||||||
Effective notional of sold credit derivatives, net(3) | 65,584 | 64,366 | 51,006 | 59,207 | ||||||||
Counterparty credit risk for repo-style transactions(4) | 25,205 | 22,002 | 26,673 | 27,005 | ||||||||
| Unconditionally cancellable commitments | 67,101 | 66,663 | 68,240 | 67,644 | ||||||||
| Other off-balance sheet exposures | 221,105 | 219,428 | 237,272 | 218,754 | ||||||||
| Total of certain off-balance sheet exposures | $ | 599,568 | $ | 583,468 | $ | 574,015 | $ | 564,165 | ||||
| Less: Tier 1 Capital deductions | 57,774 | 57,879 | 41,421 | 41,373 | ||||||||
| Total Leverage Exposure | $ | 2,372,348 | $ | 2,345,391 | $ | 2,436,817 | $ | 2,432,491 | ||||
| Supplementary Leverage ratio | 7.28 | % | 7.22 | % | 6.71 | % | 6.68 | % | ||||
| (1) | Represents the daily average of on-balance sheet assets for the quarter. |
| (2) | Represents the average of certain off-balance sheet exposures calculated as of the last day of each month in the quarter. |
| (3) | Under the U.S. Basel III rules, banking organizations are required to include in TLE the effective notional amount of sold credit derivatives, with netting of exposures permitted if certain conditions are met. |
| (4) | Repo-style transactions include repurchase or reverse repurchase transactions and securities borrowing or securities lending transactions. |
| March 31, 2018 | December 31, 2017 | |||||||||||
| In millions of dollars, except ratios | Advanced Approaches | Standardized Approach | Advanced Approaches | Standardized Approach | ||||||||
| Common Equity Tier 1 Capital | $ | 126,413 | $ | 126,413 | $ | 122,848 | $ | 122,848 | ||||
| Tier 1 Capital | 128,546 | 128,546 | 124,952 | 124,952 | ||||||||
Total Capital (Tier 1 Capital + Tier 2 Capital)(1) | 141,702 | 152,431 | 138,008 | 148,946 | ||||||||
| Total Risk-Weighted Assets | 962,395 | 1,039,774 | 965,435 | 1,024,502 | ||||||||
| Credit Risk | $ | 677,461 | $ | 999,860 | $ | 674,659 | $ | 980,324 | ||||
| Market Risk | 39,328 | 39,914 | 43,300 | 44,178 | ||||||||
| Operational Risk | 245,606 | — | 247,476 | — | ||||||||
Common Equity Tier 1 Capital ratio(2)(3)(4) | 13.14 | % | 12.16 | % | 12.72 | % | 11.99 | % | ||||
Tier 1 Capital ratio(2)(3)(4) | 13.36 | 12.36 | 12.94 | 12.20 | ||||||||
Total Capital ratio(2)(3)(4) | 14.72 | 14.66 | 14.29 | 14.54 | ||||||||
| In millions of dollars, except ratios | March 31, 2018 | December 31, 2017 | ||||||
Quarterly Adjusted Average Total Assets(5) | $ | 1,386,249 | $ | 1,401,187 | ||||
Total Leverage Exposure(6) | 1,897,742 | 1,900,641 | ||||||
Tier 1 Leverage ratio(2)(4) | 9.27 | % | 8.92 | % | ||||
Supplementary Leverage ratio(2)(4) | 6.77 | 6.57 | ||||||
| (1) | Under the Advanced Approaches framework, eligible credit reserves that exceed expected credit losses are eligible for inclusion in Tier 2 Capital to the extent the excess reserves do not exceed 0.6% of credit risk-weighted assets, which differs from the Standardized Approach in which the allowance for credit losses is eligible for inclusion in Tier 2 Capital up to 1.25% of credit risk-weighted assets, with any excess allowance for credit losses being deducted in arriving at credit risk-weighted assets. |
| (2) | Citibank’s risk-based capital and leverage ratios and related components as of December 31, 2017 are non-GAAP financial measures, which reflect full implementation of regulatory capital adjustments and deductions prior to the effective date of January 1, 2018. |
| (3) | As of March 31, 2018, Citibank’s reportable Common Equity Tier 1 Capital, Tier 1 Capital and Total Capital ratios were the lower derived under the Basel III Standardized Approach. As of December 31, 2017, Citibank’s reportable Common Equity Tier 1 Capital and Tier 1 Capital ratios were the lower derived under the Basel III Standardized Approach, whereas the reportable Total Capital ratio was the lower derived under the Basel III Advanced Approaches framework. |
| (4) | Citibank must maintain minimum Common Equity Tier 1 Capital, Tier 1 Capital, Total Capital and Tier 1 Leverage ratios of 6.5%, 8.0%, 10.0% and 5.0%, respectively, to be considered “well capitalized” under the revised Prompt Corrective Action (PCA) regulations applicable to insured depository institutions as established by the U.S. Basel III rules. Effective January 1, 2018, Citibank must also maintain a minimum Supplementary Leverage ratio of 6.0% to be considered “well capitalized.” For additional information, see “Capital Resources—Current Regulatory Capital Standards—Prompt Corrective Action Framework” in Citigroup’s 2017 Annual Report on Form 10-K. |
| (5) | Tier 1 Leverage ratio denominator. |
| (6) | Supplementary Leverage ratio denominator. |
Common Equity Tier 1 Capital ratio | Tier 1 Capital ratio | Total Capital ratio | ||||
| In basis points | Impact of $100 million change in Common Equity Tier 1 Capital | Impact of $1 billion change in risk- weighted assets | Impact of $100 million change in Tier 1 Capital | Impact of $1 billion change in risk- weighted assets | Impact of $100 million change in Total Capital | Impact of $1 billion change in risk- weighted assets |
| Citigroup | ||||||
| Advanced Approaches | 0.8 | 1.0 | 0.8 | 1.2 | 0.8 | 1.4 |
| Standardized Approach | 0.8 | 1.0 | 0.8 | 1.1 | 0.8 | 1.4 |
| Citibank | ||||||
| Advanced Approaches | 1.0 | 1.4 | 1.0 | 1.4 | 1.0 | 1.5 |
| Standardized Approach | 1.0 | 1.2 | 1.0 | 1.2 | 1.0 | 1.4 |
| Tier 1 Leverage ratio | Supplementary Leverage ratio | |||
| In basis points | Impact of $100 million change in Tier 1 Capital | Impact of $1 billion change in quarterly adjusted average total assets | Impact of $100 million change in Tier 1 Capital | Impact of $1 billion change in Total Leverage Exposure |
| Citigroup | 0.5 | 0.5 | 0.4 | 0.3 |
| Citibank | 0.7 | 0.7 | 0.5 | 0.4 |
| In millions of dollars or shares, except per share amounts | March 31, 2017 | December 31, 2016 | March 31, 2018 | December 31, 2017 | ||||||||
| Total Citigroup stockholders’ equity | $ | 228,132 | $ | 225,120 | $ | 201,915 | $ | 200,740 | ||||
| Less: Preferred stock | 19,253 | 19,253 | 19,156 | 19,253 | ||||||||
| Common stockholders’ equity | $ | 208,879 | $ | 205,867 | $ | 182,759 | $ | 181,487 | ||||
| Less: | ||||||||||||
| Goodwill | 22,265 | 21,659 | 22,659 | 22,256 | ||||||||
| Identifiable intangible assets (other than MSRs) | 5,013 | 5,114 | 4,450 | 4,588 | ||||||||
| Goodwill and identifiable intangible assets (other than MSRs) related to assets held-for-sale | 48 | 72 | ||||||||||
Goodwill and identifiable intangible assets (other than MSRs) related to assets held-for-sale (HFS) | 48 | 32 | ||||||||||
| Tangible common equity (TCE) | $ | 181,553 | $ | 179,022 | $ | 155,602 | $ | 154,611 | ||||
| Common shares outstanding (CSO) | 2,753.3 | 2,772.4 | 2,549.9 | 2,569.9 | ||||||||
| Book value per share (common equity/CSO) | $ | 75.86 | $ | 74.26 | $ | 71.67 | $ | 70.62 | ||||
| Tangible book value per share (TCE/CSO) | 65.94 | 64.57 | 61.02 | 60.16 | ||||||||
| In millions of dollars | Three months ended March 31, 2017 | Three months ended March 31, 2016 | ||||||||||
| Net income available to common shareholders | $ | 3,789 | $ | 3,291 | ||||||||
| Average common stockholders’ equity | $ | 207,040 | $ | 207,084 | ||||||||
| Average TCE | $ | 180,288 | $ | 181,336 | ||||||||
Less: Average net DTAs excluded from Common Equity Tier 1 Capital(1) | 28,951 | 29,988 | ||||||||||
| Average TCE, excluding average net DTAs excluded from Common Equity Tier 1 Capital | $ | 151,337 | $ | 151,348 | ||||||||
| Return on average common stockholders’ equity | 7.4 | % | 6.4 | % | ||||||||
Return on average TCE (ROTCE)(2) | 8.5 | 7.3 | ||||||||||
| Return on average TCE, excluding average net DTAs excluded from Common Equity Tier 1 Capital | 10.2 | 8.7 | ||||||||||
| In millions of dollars | Three Months Ended March 31, 2018 | Three Months Ended March 31, 2017 | ||||
| Net income available to common shareholders | $ | 4,348 | $ | 3,789 | ||
Average common stockholders’ equity(1) | $ | 181,628 | $ | 206,903 | ||
| Average TCE | $ | 155,107 | $ | 180,210 | ||
| Return on average common stockholders’ equity | 9.7 | % | 7.4 | % | ||
Return on average TCE (ROTCE)(2) | 11.4 | 8.5 | ||||
| (1) |
| (2) | ROTCE represents annualized net income available to common shareholders as a percentage of average TCE. |
| MANAGING GLOBAL RISK | |||
CREDIT RISK(1) | |||
| Consumer Credit | |||
| Corporate Credit | |||
| Additional Consumer and Corporate Credit Details | |||
| Loans Outstanding | |||
| Details of Credit Loss Experience | |||
| Allowance for Loan Losses | |||
| Non-Accrual Loans and Assets and Renegotiated Loans | |||
| LIQUIDITY RISK | |||
| High-Quality Liquid Assets (HQLA) | |||
| Loans | |||
| Deposits | |||
| Long-Term Debt | |||
| Secured Funding Transactions and Short-Term Borrowings | |||
| Liquidity Coverage Ratio (LCR) | |||
| Credit Ratings | |||
MARKET RISK(1) | |||
| Market Risk of Non-Trading Portfolios | |||
| Market Risk of Trading Portfolios | |||
| COUNTRY RISK | |||
| (1) | For additional information regarding certain credit risk, market risk and other quantitative and qualitative information, refer to Citi’s Pillar 3 Basel III Advanced Approaches Disclosures, as required by the rules of the Federal Reserve Board, on Citi’s Investor Relations website. |
| In billions of dollars | 1Q’16 | 2Q’16 | 3Q’16 | 4Q’16 | 1Q’17 | 1Q’17 | 2Q’17 | 3Q’17 | 4Q’17 | 1Q’18 | ||||||||||||||||||||
| Retail banking: | ||||||||||||||||||||||||||||||
| Mortgages | $ | 82.2 | $ | 81.6 | $ | 81.4 | $ | 79.4 | $ | 81.2 | $ | 81.2 | $ | 81.4 | $ | 81.4 | $ | 81.7 | $ | 82.1 | ||||||||||
| Commercial banking | 32.2 | 32.6 | 33.2 | 32.0 | 33.9 | 33.9 | 34.8 | 35.5 | 36.3 | 36.8 | ||||||||||||||||||||
| Personal and other | 27.6 | 27.2 | 27.0 | 24.9 | 26.3 | 26.3 | 27.2 | 27.3 | 27.9 | 28.5 | ||||||||||||||||||||
| Total retail banking | $ | 142.0 | $ | 141.4 | $ | 141.6 | $ | 136.3 | $ | 141.4 | $ | 141.4 | $ | 143.4 | $ | 144.2 | $ | 145.9 | $ | 147.4 | ||||||||||
| Cards: | ||||||||||||||||||||||||||||||
Citi-branded cards | $ | 87.8 | $ | 100.1 | $ | 103.9 | $ | 108.3 | $ | 105.7 | $ | 105.7 | $ | 109.9 | $ | 110.7 | $ | 115.7 | $ | 110.6 | ||||||||||
| Citi retail services | 42.5 | 43.3 | 43.9 | 47.3 | 44.2 | 44.2 | 45.2 | 45.9 | 49.2 | 46.0 | ||||||||||||||||||||
| Total cards | $ | 130.3 | $ | 143.4 | $ | 147.8 | $ | 155.6 | $ | 149.9 | $ | 149.9 | $ | 155.1 | $ | 156.6 | $ | 164.9 | $ | 156.6 | ||||||||||
Total GCB | $ | 272.3 | $ | 284.8 | $ | 289.4 | $ | 291.9 | $ | 291.3 | $ | 291.3 | $ | 298.5 | $ | 300.8 | $ | 310.8 | $ | 304.0 | ||||||||||
GCB regional distribution: | ||||||||||||||||||||||||||||||
| North America | 59 | % | 62 | % | 62 | % | 64 | % | 62 | % | 62 | % | 62 | % | 62 | % | 63 | % | 61 | % | ||||||||||
| Latin America | 9 | 8 | 8 | 8 | 9 | 9 | 9 | 9 | 8 | 9 | ||||||||||||||||||||
Asia | 32 | 30 | 30 | 28 | 29 | 29 | 29 | 29 | 29 | 30 | ||||||||||||||||||||
Total GCB | 100 | % | 100 | % | 100 | % | 100 | % | 100 | % | 100 | % | 100 | % | 100 | % | 100 | % | 100 | % | ||||||||||
| Corporate / Other | $ | 45.3 | $ | 41.3 | $ | 39.0 | $ | 33.2 | $ | 29.3 | ||||||||||||||||||||
Corporate/Other(3) | $ | 29.3 | $ | 26.8 | $ | 24.8 | $ | 22.9 | $ | 21.1 | ||||||||||||||||||||
| Total consumer loans | $ | 317.6 | $ | 326.1 | $ | 328.4 | $ | 325.1 | $ | 320.6 | $ | 320.6 | $ | 325.3 | $ | 325.6 | $ | 333.7 | $ | 325.1 | ||||||||||
| (1) | End-of-period loans include interest and fees on credit cards. |
| (2) |
Asia includes loans and leases in certain EMEA countries for all periods presented. |
| (3) | Primarily consists of legacy assets, principally North America consumer mortgages. |
| Global Consumer Banking |

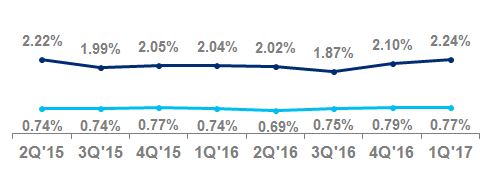
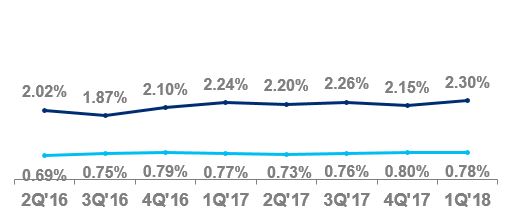
| North America GCB |
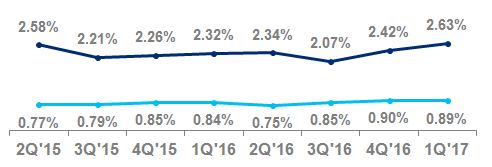
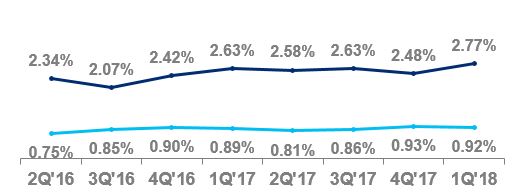

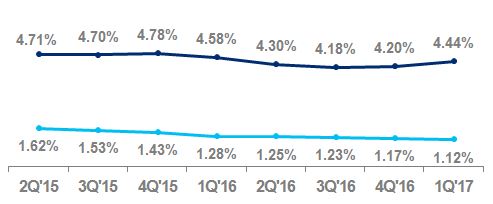

| Latin America GCB |
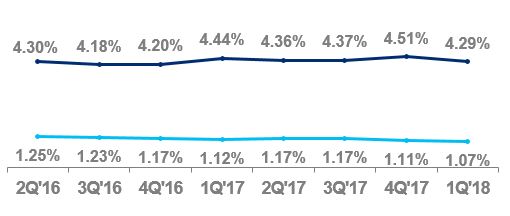
Asia(1) GCB |
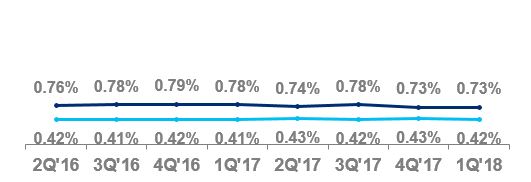
| (1) | Asia includes GCB activities in certain EMEA countries for all periods presented. |
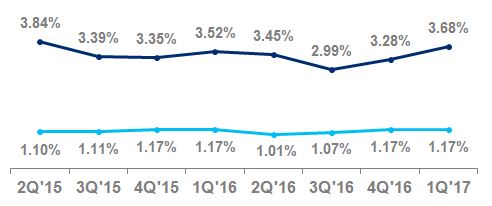

| North America Citi-Branded Cards |

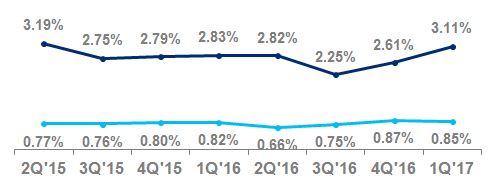
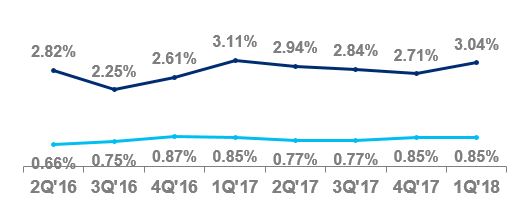
| North America Citi Retail Services |

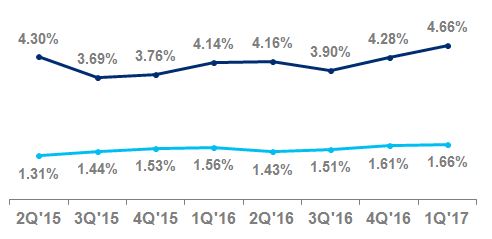
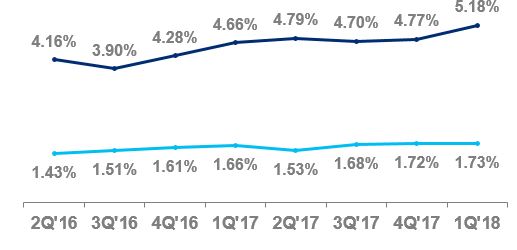

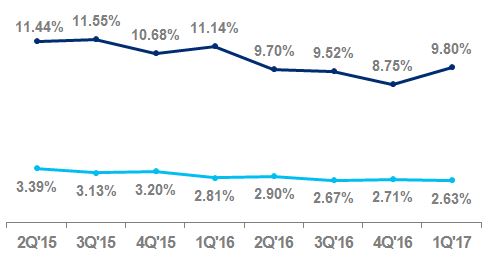

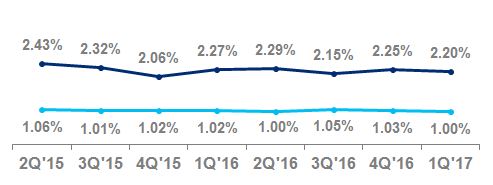
| Latin America Citi-Branded Cards |

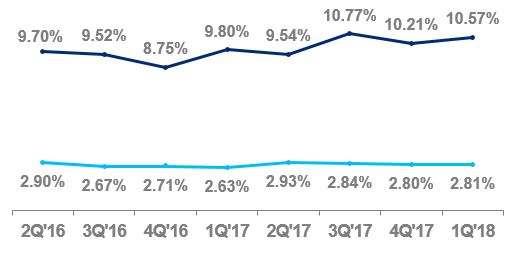
Asia Citi-Branded Cards(1) |

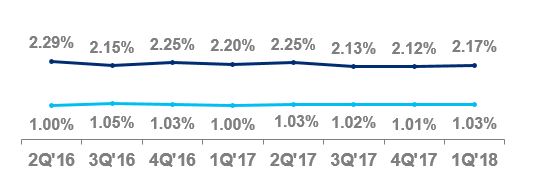
| (1) | Asia includes loans and leases in certain EMEA countries for all periods presented. |
| FICO distribution | March 31, 2017 | December 31, 2016 | ||
| > 720 | 61 | % | 64 | % |
| 660 - 720 | 27 | 26 | ||
| 620 - 660 | 7 | 6 | ||
| < 620 | 5 | 4 | ||
| Total | 100 | % | 100 | % |
| FICO distribution | March 31, 2018 | December 31, 2017 | March 31, 2017 | |||
| > 760 | 41 | % | 42 | % | 40 | % |
| 680 - 760 | 42 | 41 | 44 | |||
| < 680 | 17 | 17 | 16 | |||
| Total | 100 | % | 100 | % | 100 | % |
| FICO distribution | March 31, 2017 | December 31, 2016 | ||
| > 720 | 40 | % | 42 | % |
| 660 - 720 | 35 | 35 | ||
| 620 - 660 | 14 | 13 | ||
| < 620 | 11 | 10 | ||
| Total | 100 | % | 100 | % |
| FICO distribution | March 31, 2018 | December 31, 2017 | March 31, 2017 | |||
| > 760 | 22 | % | 24 | % | 22 | % |
| 680 - 760 | 43 | 43 | 43 | |||
| < 680 | 35 | 33 | 35 | |||
| Total | 100 | % | 100 | % | 100 | % |
| In billions of dollars | 1Q’16 | 2Q’16 | 3Q’16 | 4Q’16 | 1Q’17 | 1Q’17 | 2Q’17 | 3Q’17 | 4Q’17 | 1Q’18 | ||||||||||||||||||||
GCB: | ||||||||||||||||||||||||||||||
| Residential firsts | $ | 39.2 | $ | 40.1 | $ | 40.1 | $ | 40.2 | $ | 40.3 | $ | 40.3 | $ | 40.2 | $ | 40.1 | $ | 40.1 | $ | 40.1 | ||||||||||
| Home equity | 3.7 | 3.8 | 3.9 | 4.0 | 4.0 | 4.0 | 4.1 | 4.1 | 4.2 | 4.1 | ||||||||||||||||||||
Total GCB | $ | 42.9 | $ | 43.9 | $ | 44.0 | $ | 44.2 | $ | 44.3 | $ | 44.3 | $ | 44.3 | $ | 44.2 | $ | 44.3 | $ | 44.2 | ||||||||||
Corporate/Other: | ||||||||||||||||||||||||||||||
| Residential firsts | $ | 17.6 | $ | 15.8 | $ | 14.8 | $ | 13.4 | $ | 12.3 | $ | 12.3 | $ | 11.0 | $ | 10.1 | $ | 9.3 | $ | 8.1 | ||||||||||
| Home equity | 18.3 | 17.3 | 16.1 | 15.0 | 13.4 | 13.4 | 12.4 | 11.5 | 10.6 | 9.9 | ||||||||||||||||||||
Total Corporate/Other | $ | 35.9 | $ | 33.1 | $ | 30.9 | $ | 28.4 | $ | 25.7 | ||||||||||||||||||||
Total Corporate/ Other | $ | 25.7 | $ | 23.4 | $ | 21.6 | $ | 19.9 | $ | 18.0 | ||||||||||||||||||||
Total Citigroup— North America | $ | 78.8 | $ | 77.0 | $ | 74.9 | $ | 72.6 | $ | 70.0 | $ | 70.0 | $ | 67.7 | $ | 65.8 | $ | 64.2 | $ | 62.2 | ||||||||||
North America Home Equity Lines of Credit Amortization – Citigroup Total ENR by Reset Year In billions of dollars as of March 31, |
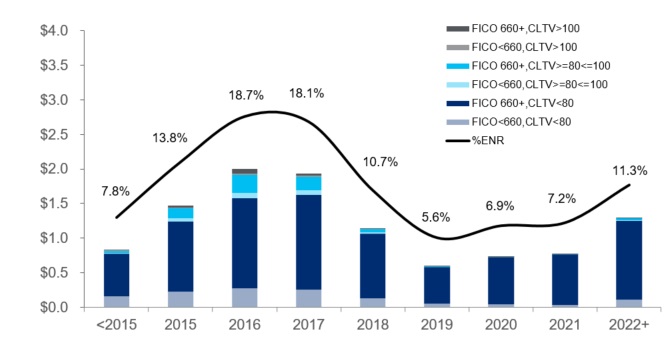
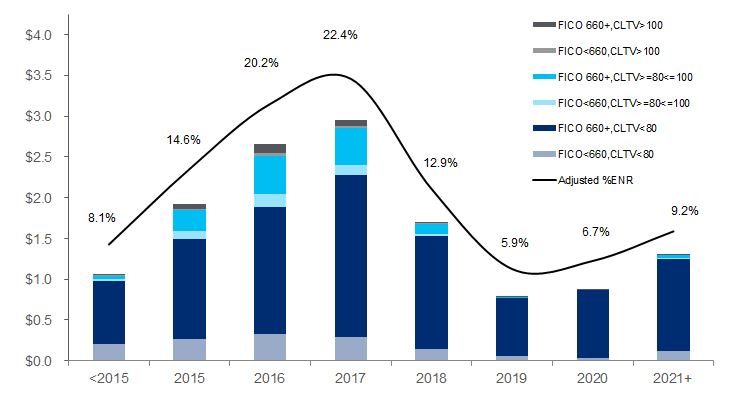
EOP loans(1) | 90+ days past due(2) | 30–89 days past due(2) | EOP loans(1) | 90+ days past due(2) | 30–89 days past due(2) | |||||||||||||||||||||||||||||||||||||
| In millions of dollars, except EOP loan amounts in billions | March 31, 2017 | March 31, 2017 | December 31, 2016 | March 31, 2016 | March 31, 2017 | December 31, 2016 | March 31, 2016 | March 31, 2018 | March 31, 2018 | December 31, 2017 | March 31, 2017 | March 31, 2018 | December 31, 2017 | March 31, 2017 | ||||||||||||||||||||||||||||
Global Consumer Banking(3)(4) | ||||||||||||||||||||||||||||||||||||||||||
| Total | $ | 291.3 | $ | 2,241 | $ | 2,293 | $ | 2,022 | $ | 2,516 | $ | 2,540 | $ | 2,360 | $ | 304.0 | $ | 2,379 | $ | 2,478 | $ | 2,241 | $ | 2,710 | $ | 2,762 | $ | 2,516 | ||||||||||||||
| Ratio | 0.77 | % | 0.79 | % | 0.75 | % | 0.87 | % | 0.87 | % | 0.87 | % | 0.78 | % | 0.80 | % | 0.77 | % | 0.89 | % | 0.89 | % | 0.87 | % | ||||||||||||||||||
| Retail banking | ||||||||||||||||||||||||||||||||||||||||||
| Total | $ | 141.4 | $ | 488 | $ | 474 | $ | 498 | $ | 777 | $ | 726 | $ | 793 | $ | 147.4 | $ | 493 | $ | 515 | $ | 488 | $ | 830 | $ | 822 | $ | 777 | ||||||||||||||
| Ratio | 0.35 | % | 0.35 | % | 0.35 | % | 0.55 | % | 0.54 | % | 0.56 | % | 0.34 | % | 0.35 | % | 0.35 | % | 0.57 | % | 0.57 | % | 0.55 | % | ||||||||||||||||||
| North America | 55.5 | 182 | 181 | 152 | 189 | 214 | 198 | 55.4 | 184 | 199 | 182 | 227 | 306 | 189 | ||||||||||||||||||||||||||||
| Ratio | 0.33 | % | 0.33 | % | 0.29 | % | 0.35 | % | 0.39 | % | 0.38 | % | 0.34 | % | 0.36 | % | 0.33 | % | 0.41 | % | 0.55 | % | 0.35 | % | ||||||||||||||||||
| Latin America | 19.7 | 141 | 136 | 172 | 246 | 185 | 256 | 21.2 | 128 | 130 | 141 | 248 | 195 | 246 | ||||||||||||||||||||||||||||
| Ratio | 0.72 | % | 0.76 | % | 0.87 | % | 1.25 | % | 1.03 | % | 1.29 | % | 0.60 | % | 0.65 | % | 0.72 | % | 1.17 | % | 0.98 | % | 1.25 | % | ||||||||||||||||||
Asia(5) | 66.2 | 165 | 157 | 174 | 342 | 327 | 339 | 70.8 | 181 | 186 | 165 | 355 | 321 | 342 | ||||||||||||||||||||||||||||
| Ratio | 0.25 | % | 0.25 | % | 0.25 | % | 0.52 | % | 0.52 | % | 0.49 | % | 0.26 | % | 0.27 | % | 0.25 | % | 0.50 | % | 0.46 | % | 0.52 | % | ||||||||||||||||||
| Cards | ||||||||||||||||||||||||||||||||||||||||||
| Total | $ | 149.9 | $ | 1,753 | $ | 1,819 | $ | 1,524 | $ | 1,739 | $ | 1,814 | $ | 1,567 | $ | 156.6 | $ | 1,886 | $ | 1,963 | $ | 1,753 | $ | 1,880 | $ | 1,940 | $ | 1,739 | ||||||||||||||
| Ratio | 1.17 | % | 1.17 | % | 1.17 | % | 1.16 | % | 1.17 | % | 1.20 | % | 1.20 | % | 1.19 | % | 1.17 | % | 1.20 | % | 1.18 | % | 1.16 | % | ||||||||||||||||||
| North America—Citi-branded | 82.2 | 698 | 748 | 530 | 632 | 688 | 492 | |||||||||||||||||||||||||||||||||||
North America—Citi-branded | 85.7 | 731 | 768 | 698 | 669 | 698 | 632 | |||||||||||||||||||||||||||||||||||
| Ratio | 0.85 | % | 0.87 | % | 0.82 | % | 0.77 | % | 0.80 | % | 0.76 | % | 0.85 | % | 0.85 | % | 0.85 | % | 0.78 | % | 0.77 | % | 0.77 | % | ||||||||||||||||||
| North America—Citi retail services | 44.2 | 735 | 761 | 665 | 730 | 777 | 688 | |||||||||||||||||||||||||||||||||||
North America—Citi retail services | 46.0 | 797 | 845 | 735 | 791 | 830 | 730 | |||||||||||||||||||||||||||||||||||
| Ratio | 1.66 | % | 1.61 | % | 1.56 | % | 1.65 | % | 1.64 | % | 1.62 | % | 1.73 | % | 1.72 | % | 1.66 | % | 1.72 | % | 1.69 | % | 1.65 | % | ||||||||||||||||||
| Latin America | 5.2 | 137 | 130 | 149 | 145 | 125 | 152 | 5.7 | 160 | 151 | 137 | 160 | 153 | 145 | ||||||||||||||||||||||||||||
| Ratio | 2.63 | % | 2.71 | % | 2.81 | % | 2.79 | % | 2.60 | % | 2.87 | % | 2.81 | % | 2.80 | % | 2.63 | % | 2.81 | % | 2.83 | % | 2.79 | % | ||||||||||||||||||
Asia(5) | 18.3 | 183 | 180 | 180 | 232 | 224 | 235 | 19.2 | 198 | 199 | 183 | 260 | 259 | 232 | ||||||||||||||||||||||||||||
| Ratio | 1.00 | % | 1.03 | % | 1.02 | % | 1.27 | % | 1.28 | % | 1.34 | % | 1.03 | % | 1.01 | % | 1.00 | % | 1.35 | % | 1.31 | % | 1.27 | % | ||||||||||||||||||
Corporate/Other—Consumer(6)(7) | ||||||||||||||||||||||||||||||||||||||||||
| Total | $ | 29.3 | $ | 684 | $ | 834 | $ | 896 | $ | 615 | $ | 735 | $ | 929 | $ | 21.1 | $ | 478 | $ | 557 | $ | 684 | $ | 393 | $ | 542 | $ | 615 | ||||||||||||||
| Ratio | 2.45 | % | 2.62 | % | 2.08 | % | 2.20 | % | 2.31 | % | 2.16 | % | 2.38 | % | 2.57 | % | 2.45 | % | 1.96 | % | 2.50 | % | 2.20 | % | ||||||||||||||||||
| International | 2.1 | 77 | 94 | 145 | 60 | 49 | 161 | 1.7 | 32 | 43 | 77 | 44 | 40 | 60 | ||||||||||||||||||||||||||||
| Ratio | 3.67 | % | 3.92 | % | 2.27 | % | 2.86 | % | 2.04 | % | 2.52 | % | 1.88 | % | 2.69 | % | 3.67 | % | 2.59 | % | 2.50 | % | 2.86 | % | ||||||||||||||||||
| North America | 27.2 | 607 | 740 | 751 | 555 | 686 | 768 | 19.4 | 446 | 514 | 607 | 349 | 502 | 555 | ||||||||||||||||||||||||||||
| Ratio | 2.35 | % | 2.52 | % | 2.05 | % | 2.15 | % | 2.33 | % | 2.09 | % | 2.42 | % | 2.56 | % | 2.35 | % | 1.90 | % | 2.50 | % | 2.15 | % | ||||||||||||||||||
| Total Citigroup | 320.6 | $ | 2,925 | $ | 3,127 | $ | 2,918 | $ | 3,131 | $ | 3,275 | $ | 3,289 | $ | 325.1 | $ | 2,857 | $ | 3,035 | $ | 2,925 | $ | 3,103 | $ | 3,304 | $ | 3,131 | |||||||||||||||
| Ratio | 0.92 | % | 0.97 | % | 0.93 | % | 0.98 | % | 1.01 | % | 1.05 | % | 0.88 | % | 0.91 | % | 0.92 | % | 0.96 | % | 1.00 | % | 0.98 | % | ||||||||||||||||||
| (1) | End-of-period (EOP) loans include interest and fees on credit cards. |
| (2) | The ratios of 90+ days past due and 30–89 days past due are calculated based on EOP loans, net of unearned income. |
| (3) | The 90+ days past due balances for North |
| (4) | The 90+ days past due and 30–89 days past due and related ratios for GCB North America exclude U.S. mortgage loans that are guaranteed by U.S. government-sponsored entities since the potential loss predominantly resides within the U.S. government-sponsored entities. The amounts excluded for loans 90+ days past due and (EOP loans) were |
| (5) | Asia includes delinquencies and loans in certain EMEA countries for all periods presented. |
| (6) | The 90+ days past due and 30–89 days past due and related ratios for Corporate/Other—North America consumer exclude U.S. mortgage loans that are guaranteed by U.S. government-sponsored entities since the potential loss predominantly resides within the U.S. government-sponsored entities. The amounts excluded for loans 90+ days past due (and EOP loans) were $0.5 billion ($0.9 billion), $0.6 billion ($1.1 billion) and $0.8 billion ($1.4 billion) |
| (7) | The March 31, |
Average loans(1) | Net credit losses(2)(3) | Average loans(1) | Net credit losses(2)(3) | |||||||||||||||||||||
| In millions of dollars, except average loan amounts in billions | 1Q17 | 4Q16 | 1Q16 | 1Q18 | 4Q17 | 1Q17 | ||||||||||||||||||
| Global Consumer Banking | ||||||||||||||||||||||||
| Total | $ | 289.6 | $ | 1,603 | $ | 1,516 | $ | 1,371 | $ | 306.3 | $ | 1,736 | $ | 1,640 | $ | 1,603 | ||||||||
| Ratio | 2.24 | % | 2.10 | % | 2.04 | % | 2.30 | % | 2.15 | % | 2.24 | % | ||||||||||||
| Retail banking | ||||||||||||||||||||||||
| Total | $ | 138.8 | $ | 236 | $ | 286 | $ | 221 | $ | 147.1 | $ | 232 | $ | 243 | $ | 236 | ||||||||
| Ratio | 0.69 | % | 0.82 | % | 0.64 | % | 0.64 | % | 0.66 | % | 0.69 | % | ||||||||||||
| North America | 55.4 | 37 | 83 | 25 | 55.7 | 43 | 30 | 37 | ||||||||||||||||
| Ratio | 0.27 | % | 0.60 | % | 0.19 | % | 0.31 | % | 0.21 | % | 0.27 | % | ||||||||||||
| Latin America | 18.3 | 137 | 138 | 134 | 20.7 | 132 | 153 | 137 | ||||||||||||||||
| Ratio | 3.04 | % | 2.97 | % | 2.81 | % | 2.59 | % | 2.99 | % | 3.04 | % | ||||||||||||
Asia(4) | 65.1 | 62 | 65 | 62 | 70.7 | 57 | 60 | 62 | ||||||||||||||||
| Ratio | 0.39 | % | 0.40 | % | 0.37 | % | 0.33 | % | 0.35 | % | 0.39 | % | ||||||||||||
| Cards | ||||||||||||||||||||||||
| Total | $ | 150.8 | $ | 1,367 | $ | 1,230 | $ | 1,150 | $ | 159.2 | $ | 1,504 | $ | 1,397 | $ | 1,367 | ||||||||
| Ratio | 3.68 | % | 3.28 | % | 3.52 | % | 3.83 | % | 3.50 | % | 3.68 | % | ||||||||||||
| North America—Citi-branded | 82.6 | 633 | 539 | 455 | ||||||||||||||||||||
North America—Citi-branded | 86.9 | 651 | 592 | 633 | ||||||||||||||||||||
| Ratio | 3.11 | % | 2.61 | % | 2.83 | % | 3.04 | % | 2.71 | % | 3.11 | % | ||||||||||||
| North America—Retail services | 45.3 | 520 | 483 | 453 | ||||||||||||||||||||
North America—Citi retail services | 47.1 | 602 | 564 | 520 | ||||||||||||||||||||
| Ratio | 4.66 | % | 4.28 | % | 4.14 | % | 5.18 | % | 4.77 | % | 4.66 | % | ||||||||||||
| Latin America | 4.8 | 116 | 110 | 144 | 5.6 | 146 | 139 | 116 | ||||||||||||||||
| Ratio | 9.80 | % | 8.75 | % | 11.14 | % | 10.57 | % | 10.21 | % | 9.80 | % | ||||||||||||
Asia(4) | 18.1 | 98 | 98 | 98 | 19.6 | 105 | 102 | 98 | ||||||||||||||||
| Ratio | 2.20 | % | 2.25 | % | 2.27 | % | 2.17 | % | 2.12 | % | 2.20 | % | ||||||||||||
Corporate/Other—Consumer(3) | ||||||||||||||||||||||||
| Total | $ | 31.7 | $ | 69 | $ | 60 | $ | 143 | $ | 21.0 | $ | 35 | $ | 17 | $ | 69 | ||||||||
| Ratio | 0.88 | % | 0.69 | % | 1.25 | % | 0.64 | % | 0.29 | % | 0.88 | % | ||||||||||||
| International | 2.1 | 26 | 32 | 78 | 1.7 | 23 | 7 | 26 | ||||||||||||||||
| Ratio | 5.02 | % | 5.30 | % | 4.68 | % | 5.49 | % | 1.63 | % | 5.02 | % | ||||||||||||
| North America | 29.6 | 43 | 28 | 65 | 19.3 | 12 | 10 | 43 | ||||||||||||||||
| Ratio | 0.59 | % | 0.35 | % | 0.66 | % | 0.24 | % | 0.18 | % | 0.59 | % | ||||||||||||
| Other | — | 1 | — | |||||||||||||||||||||
| Total Citigroup | $ | 321.3 | $ | 1,672 | $ | 1,576 | $ | 1,514 | $ | 327.3 | $ | 1,771 | $ | 1,658 | $ | 1,672 | ||||||||
| Ratio | 2.11 | % | 1.95 | % | 1.92 | % | 2.19 | % | 2.01 | % | 2.11 | % | ||||||||||||
| (1) | Average loans include interest and fees on credit cards. |
| (2) | The ratios of net credit losses are calculated based on average loans, net of unearned income. |
| (3) |
| (4) | Asia includes NCLs and average loans in certain EMEA countries for all periods presented. |
| At March 31, 2017 | At December 31, 2016 | At March 31, 2018 | At December 31, 2017 | |||||||||||||||||||||||||||||||||||||||||||||
| In billions of dollars | Due within 1 year | Greater than 1 year but within 5 years | Greater than 5 years | Total exposure | Due within 1 year | Greater than 1 year but within 5 years | Greater than 5 years | Total exposure | Due within 1 year | Greater than 1 year but within 5 years | Greater than 5 years | Total exposure | Due within 1 year | Greater than 1 year but within 5 years | Greater than 5 years | Total exposure | ||||||||||||||||||||||||||||||||
Direct outstandings (on-balance sheet)(1) | $ | 129 | $ | 82 | $ | 20 | $ | 231 | $ | 109 | $ | 94 | $ | 22 | $ | 225 | $ | 135 | $ | 101 | $ | 21 | $ | 257 | $ | 127 | $ | 96 | $ | 22 | $ | 245 | ||||||||||||||||
Unfunded lending commitments (off-balance sheet)(2) | 113 | 221 | 23 | 357 | 103 | 218 | 23 | 344 | 121 | 238 | 23 | 382 | 111 | 222 | 20 | 353 | ||||||||||||||||||||||||||||||||
| Total exposure | $ | 242 | $ | 303 | $ | 43 | $ | 588 | $ | 212 | $ | 312 | $ | 45 | $ | 569 | $ | 256 | $ | 339 | $ | 44 | $ | 639 | $ | 238 | $ | 318 | $ | 42 | $ | 598 | ||||||||||||||||
| (1) | Includes drawn loans, overdrafts, bankers’ acceptances and leases. |
| (2) | Includes unused commitments to lend, letters of credit and financial guarantees. |
| March 31, 2017 | December 31, 2016 | March 31, 2018 | December 31, 2017 | |||||
| North America | 53 | % | 55 | % | 53 | % | 54 | % |
| EMEA | 26 | 26 | 28 | 27 | ||||
| Asia | 13 | 12 | 12 | 12 | ||||
| Latin America | 8 | 7 | 7 | 7 | ||||
| Total | 100 | % | 100 | % | 100 | % | 100 | % |
| Total exposure | Total exposure | |||||||
| March 31, 2017 | December 31, 2016 | March 31, 2018 | December 31, 2017 | |||||
| AAA/AA/A | 48 | % | 48 | % | 48 | % | 49 | % |
| BBB | 34 | 34 | 34 | 34 | ||||
| BB/B | 16 | 16 | 17 | 16 | ||||
| CCC or below | 2 | 2 | 1 | 1 | ||||
| Total | 100 | % | 100 | % | 100 | % | 100 | % |
| Total exposure | ||||
| March 31, 2017 | December 31, 2016 | |||
| Transportation and industrial | 21 | % | 22 | % |
| Consumer retail and health | 16 | 16 | ||
| Technology, media and telecom | 12 | 12 | ||
| Power, chemicals, metals and mining | 11 | 11 | ||
Energy and commodities(1) | 8 | 9 | ||
| Real estate | 7 | 7 | ||
| Banks/broker-dealers/finance companies | 6 | 6 | ||
| Hedge funds | 5 | 5 | ||
| Insurance and special purpose entities | 5 | 5 | ||
| Public sector | 5 | 5 | ||
| Other industries | 4 | 2 | ||
| Total | 100 | % | 100 | % |
| Total exposure | ||||
| March 31, 2018 | December 31, 2017 | |||
| Transportation and industrial | 22 | % | 22 | % |
| Consumer retail and health | 17 | 16 | ||
| Technology, media and telecom | 13 | 12 | ||
| Power, chemicals, metals and mining | 10 | 10 | ||
| Energy and commodities | 8 | 8 | ||
| Banks/broker-dealers/finance companies | 8 | 8 | ||
| Real estate | 7 | 8 | ||
| Insurance and special purpose entities | 5 | 5 | ||
| Public sector | 5 | 5 | ||
| Hedge funds | 4 | 4 | ||
| Other industries | 1 | 2 | ||
| Total | 100 | % | 100 | % |
| March 31, 2017 | December 31, 2016 | March 31, 2018 | December 31, 2017 | |||||
| AAA/AA/A | 16 | % | 16 | % | 26 | % | 23 | % |
| BBB | 49 | 49 | 43 | 43 | ||||
| BB/B | 31 | 31 | 28 | 31 | ||||
| CCC or below | 4 | 4 | 3 | 3 | ||||
| Total | 100 | % | 100 | % | 100 | % | 100 | % |
| March 31, 2017 | December 31, 2016 | March 31, 2018 | December 31, 2017 | |||||
| Transportation and industrial | 28 | % | 29 | % | 28 | % | 27 | % |
| Energy and commodities | 19 | 20 | 12 | 15 | ||||
| Consumer retail and health | 13 | 10 | 9 | 10 | ||||
| Technology, media and telecom | 13 | 13 | 14 | 12 | ||||
Power, chemicals, metals and mining | 12 | 12 | 13 | 14 | ||||
| Public sector | 6 | 5 | 11 | 12 | ||||
| Banks/broker-dealers | 4 | 4 | 6 | 6 | ||||
| Insurance and special purpose entities | 3 | 3 | 4 | 2 | ||||
| Other industries | 2 | 4 | 3 | 2 | ||||
| Total | 100 | % | 100 | % | 100 | % | 100 | % |
| 1st Qtr. | 4th Qtr. | 3rd Qtr. | 2nd Qtr. | 1st Qtr. | 1st Qtr. | 4th Qtr. | 3rd Qtr. | 2nd Qtr. | 1st Qtr. | |||||||||||||||||||||
| In millions of dollars | 2017 | 2016 | 2018 | 2017 | ||||||||||||||||||||||||||
| Consumer loans | ||||||||||||||||||||||||||||||
| In U.S. offices | ||||||||||||||||||||||||||||||
Mortgage and real estate(1) | $ | 71,170 | $ | 72,957 | $ | 75,057 | $ | 77,242 | $ | 79,128 | $ | 63,412 | $ | 65,467 | $ | 67,131 | $ | 69,022 | $ | 71,170 | ||||||||||
| Installment, revolving credit, and other | 3,252 | 3,395 | 3,465 | 3,486 | 3,504 | |||||||||||||||||||||||||
| Installment, revolving credit and other | 3,306 | 3,398 | 3,191 | 3,190 | 3,252 | |||||||||||||||||||||||||
| Cards | 125,799 | 132,654 | 124,637 | 120,113 | 106,892 | 131,081 | 139,006 | 131,476 | 130,181 | 125,799 | ||||||||||||||||||||
| Commercial and industrial | 7,434 | 7,159 | 6,989 | 7,041 | 6,793 | 7,493 | 7,840 | 7,619 | 7,404 | 7,434 | ||||||||||||||||||||
| Total | $ | 207,655 | $ | 216,165 | $ | 210,148 | $ | 207,882 | $ | 196,317 | $ | 205,292 | $ | 215,711 | $ | 209,417 | $ | 209,797 | $ | 207,655 | ||||||||||
| In offices outside the U.S. | ||||||||||||||||||||||||||||||
Mortgage and real estate(1) | $ | 43,822 | $ | 42,803 | $ | 45,751 | $ | 46,049 | $ | 47,831 | $ | 44,833 | $ | 44,081 | $ | 43,723 | $ | 43,821 | $ | 43,822 | ||||||||||
| Installment, revolving credit, and other | 26,014 | 24,887 | 28,217 | 27,830 | 28,778 | |||||||||||||||||||||||||
| Installment, revolving credit and other | 27,651 | 26,556 | 26,153 | 26,480 | 26,014 | |||||||||||||||||||||||||
| Cards | 24,497 | 23,783 | 25,833 | 25,844 | 26,312 | 25,993 | 26,257 | 25,443 | 25,376 | 24,497 | ||||||||||||||||||||
| Commercial and industrial | 17,728 | 16,568 | 17,498 | 17,520 | 17,352 | 20,526 | 20,238 | 20,015 | 18,956 | 17,728 | ||||||||||||||||||||
| Lease financing | 83 | 81 | 113 | 140 | 139 | 62 | 76 | 77 | 81 | 83 | ||||||||||||||||||||
| Total | $ | 112,144 | $ | 108,122 | $ | 117,412 | $ | 117,383 | $ | 120,412 | $ | 119,065 | $ | 117,208 | $ | 115,411 | $ | 114,714 | $ | 112,144 | ||||||||||
| Total consumer loans | $ | 319,799 | $ | 324,287 | $ | 327,560 | $ | 325,265 | $ | 316,729 | $ | 324,357 | $ | 332,919 | $ | 324,828 | $ | 324,511 | $ | 319,799 | ||||||||||
Unearned income(2) | 757 | 776 | 812 | 817 | 826 | 727 | 737 | 748 | 750 | 757 | ||||||||||||||||||||
| Consumer loans, net of unearned income | $ | 320,556 | $ | 325,063 | $ | 328,372 | $ | 326,082 | $ | 317,555 | $ | 325,084 | $ | 333,656 | $ | 325,576 | $ | 325,261 | $ | 320,556 | ||||||||||
| Corporate loans | ||||||||||||||||||||||||||||||
| In U.S. offices | ||||||||||||||||||||||||||||||
| Commercial and industrial | $ | 49,845 | $ | 49,586 | $ | 50,156 | $ | 50,286 | $ | 44,104 | $ | 54,005 | $ | 51,319 | $ | 51,679 | $ | 50,341 | $ | 49,845 | ||||||||||
| Loans to financial institutions | 35,734 | 35,517 | 35,801 | 32,001 | 36,865 | 40,472 | 39,128 | 37,203 | 36,953 | 35,734 | ||||||||||||||||||||
Mortgage and real estate(1) | 40,052 | 38,691 | 41,078 | 40,175 | 38,697 | 45,581 | 44,683 | 43,274 | 42,041 | 40,052 | ||||||||||||||||||||
| Installment, revolving credit, and other | 32,212 | 34,501 | 32,571 | 32,491 | 33,273 | |||||||||||||||||||||||||
| Installment, revolving credit and other | 32,866 | 33,181 | 32,464 | 31,611 | 32,212 | |||||||||||||||||||||||||
| Lease financing | 1,511 | 1,518 | 1,532 | 1,546 | 1,597 | 1,463 | 1,470 | 1,493 | 1,467 | 1,511 | ||||||||||||||||||||
| Total | $ | 159,354 | $ | 159,813 | $ | 161,138 | $ | 156,499 | $ | 154,536 | $ | 174,387 | $ | 169,781 | $ | 166,113 | $ | 162,413 | $ | 159,354 | ||||||||||
| In offices outside the U.S. | ||||||||||||||||||||||||||||||
| Commercial and industrial | $ | 87,258 | $ | 81,882 | $ | 84,492 | $ | 87,432 | $ | 85,836 | $ | 101,368 | $ | 93,750 | $ | 93,107 | $ | 91,131 | $ | 87,258 | ||||||||||
| Loans to financial institutions | 33,763 | 26,886 | 27,305 | 27,856 | 28,652 | 35,659 | 35,273 | 33,050 | 34,844 | 33,763 | ||||||||||||||||||||
Mortgage and real estate(1) | 5,527 | 5,363 | 5,595 | 5,455 | 5,769 | 7,543 | 7,309 | 6,383 | 6,783 | 5,527 | ||||||||||||||||||||
| Installment, revolving credit, and other | 16,576 | 19,965 | 25,462 | 24,855 | 21,583 | |||||||||||||||||||||||||
| Installment, revolving credit and other | 23,338 | 22,638 | 23,830 | 19,200 | 16,576 | |||||||||||||||||||||||||
| Lease financing | 253 | 251 | 243 | 255 | 280 | 167 | 190 | 216 | 234 | 253 | ||||||||||||||||||||
| Governments and official institutions | 5,970 | 5,850 | 6,506 | 5,757 | 5,303 | 6,170 | 5,200 | 5,628 | 5,518 | 5,970 | ||||||||||||||||||||
| Total | $ | 149,347 | $ | 140,197 | $ | 149,603 | $ | 151,610 | $ | 147,423 | $ | 174,245 | $ | 164,360 | $ | 162,214 | $ | 157,710 | $ | 149,347 | ||||||||||
| Total corporate loans | $ | 308,701 | $ | 300,010 | $ | 310,741 | $ | 308,109 | $ | 301,959 | $ | 348,632 | $ | 334,141 | $ | 328,327 | $ | 320,123 | $ | 308,701 | ||||||||||
Unearned income(3) | (662 | ) | (704 | ) | (678 | ) | (676 | ) | (690 | ) | (778 | ) | (763 | ) | (720 | ) | (689 | ) | (662 | ) | ||||||||||
| Corporate loans, net of unearned income | $ | 308,039 | $ | 299,306 | $ | 310,063 | $ | 307,433 | $ | 301,269 | $ | 347,854 | $ | 333,378 | $ | 327,607 | $ | 319,434 | $ | 308,039 | ||||||||||
| Total loans—net of unearned income | $ | 628,595 | $ | 624,369 | $ | 638,435 | $ | 633,515 | $ | 618,824 | $ | 672,938 | $ | 667,034 | $ | 653,183 | $ | 644,695 | $ | 628,595 | ||||||||||
| Allowance for loan losses—on drawn exposures | (12,030 | ) | (12,060 | ) | (12,439 | ) | (12,304 | ) | (12,712 | ) | (12,354 | ) | (12,355 | ) | (12,366 | ) | (12,025 | ) | (12,030 | ) | ||||||||||
| Total loans—net of unearned income and allowance for credit losses | $ | 616,565 | $ | 612,309 | $ | 625,996 | $ | 621,211 | $ | 606,112 | $ | 660,584 | $ | 654,679 | $ | 640,817 | $ | 632,670 | $ | 616,565 | ||||||||||
Allowance for loan losses as a percentage of total loans— net of unearned income(4) | 1.93 | % | 1.94 | % | 1.97 | % | 1.96 | % | 2.07 | % | 1.85 | % | 1.87 | % | 1.91 | % | 1.88 | % | 1.93 | % | ||||||||||
Allowance for consumer loan losses as a percentage of total consumer loans—net of unearned income(4) | 2.96 | % | 2.88 | % | 2.95 | % | 2.89 | % | 3.09 | % | 3.09 | % | 2.96 | % | 3.04 | % | 2.93 | % | 2.96 | % | ||||||||||
Allowance for corporate loan losses as a percentage of total corporate loans—net of unearned income(4) | 0.83 | % | 0.91 | % | 0.90 | % | 0.95 | % | 0.98 | % | 0.67 | % | 0.76 | % | 0.77 | % | 0.80 | % | 0.83 | % | ||||||||||
| (1) | Loans secured primarily by real estate. |
| (2) | Unearned income on consumer loans primarily represents unamortized origination fees and costs, premiums and discounts. |
| (3) | Unearned income on corporate loans primarily represents interest received in advance, but not yet earned, on loans originated on a |
| (4) | All periods exclude loans that are carried at fair value. |
| 1st Qtr. | 4th Qtr. | 3rd Qtr. | 2nd Qtr. | 1st Qtr. | 1st Qtr. | 4th Qtr. | 3rd Qtr. | 2nd Qtr. | 1st Qtr. | |||||||||||||||||||||
| In millions of dollars | 2017 | 2016 | 2018 | 2017 | ||||||||||||||||||||||||||
| Allowance for loan losses at beginning of period | $ | 12,060 | $ | 12,439 | $ | 12,304 | $ | 12,712 | $ | 12,626 | $ | 12,355 | $ | 12,366 | $ | 12,025 | $ | 12,030 | $ | 12,060 | ||||||||||
| Provision for loan losses | ||||||||||||||||||||||||||||||
| Consumer | $ | 1,816 | $ | 1,659 | $ | 1,815 | $ | 1,276 | $ | 1,571 | $ | 1,881 | $ | 1,785 | $ | 2,142 | $ | 1,620 | $ | 1,816 | ||||||||||
| Corporate | (141 | ) | 68 | (69 | ) | 114 | 315 | (78 | ) | 231 | 4 | 46 | (141 | ) | ||||||||||||||||
| Total | $ | 1,675 | $ | 1,727 | $ | 1,746 | $ | 1,390 | $ | 1,886 | $ | 1,803 | $ | 2,016 | $ | 2,146 | $ | 1,666 | $ | 1,675 | ||||||||||
| Gross credit losses | ||||||||||||||||||||||||||||||
| Consumer | ||||||||||||||||||||||||||||||
| In U.S. offices | $ | 1,444 | $ | 1,343 | $ | 1,181 | $ | 1,213 | $ | 1,231 | $ | 1,542 | $ | 1,426 | $ | 1,429 | $ | 1,437 | $ | 1,444 | ||||||||||
| In offices outside the U.S. | 597 | 605 | 702 | 678 | 689 | 615 | 611 | 642 | 597 | 597 | ||||||||||||||||||||
| Corporate | ||||||||||||||||||||||||||||||
| In U.S. offices | 48 | 32 | 29 | 62 | 189 | 65 | 21 | 15 | 72 | 48 | ||||||||||||||||||||
| In offices outside the U.S. | 55 | 103 | 36 | 95 | 34 | 74 | 221 | 34 | 24 | 55 | ||||||||||||||||||||
| Total | $ | 2,144 | $ | 2,083 | $ | 1,948 | $ | 2,048 | $ | 2,143 | $ | 2,296 | $ | 2,279 | $ | 2,120 | $ | 2,130 | $ | 2,144 | ||||||||||
Credit recoveries(1) | ||||||||||||||||||||||||||||||
| Consumer | ||||||||||||||||||||||||||||||
| In U.S. offices | $ | 242 | $ | 235 | $ | 227 | $ | 262 | $ | 256 | $ | 238 | $ | 228 | $ | 167 | $ | 266 | $ | 242 | ||||||||||
| In offices outside the U.S. | 127 | 137 | 173 | 154 | 150 | 148 | 151 | 170 | 135 | 127 | ||||||||||||||||||||
| Corporate | ||||||||||||||||||||||||||||||
| In U.S. offices | 2 | 2 | 16 | 3 | 4 | 13 | 4 | 2 | 15 | 2 | ||||||||||||||||||||
| In offices outside the U.S. | 64 | 13 | 7 | 13 | 9 | 30 | 16 | 4 | 4 | 64 | ||||||||||||||||||||
| Total | $ | 435 | $ | 387 | $ | 423 | $ | 432 | $ | 419 | $ | 429 | $ | 399 | $ | 343 | $ | 420 | $ | 435 | ||||||||||
| Net credit losses | ||||||||||||||||||||||||||||||
| In U.S. offices | $ | 1,248 | $ | 1,138 | $ | 967 | $ | 1,010 | $ | 1,160 | $ | 1,356 | $ | 1,215 | $ | 1,275 | $ | 1,228 | $ | 1,248 | ||||||||||
| In offices outside the U.S. | 461 | 558 | 558 | 606 | 564 | 511 | 665 | 502 | 482 | 461 | ||||||||||||||||||||
| Total | $ | 1,709 | $ | 1,696 | $ | 1,525 | $ | 1,616 | $ | 1,724 | $ | 1,867 | $ | 1,880 | $ | 1,777 | $ | 1,710 | $ | 1,709 | ||||||||||
Other—net(2)(3)(4)(5)(6)(7) | $ | 4 | $ | (410 | ) | $ | (86 | ) | $ | (182 | ) | $ | (76 | ) | $ | 63 | $ | (147 | ) | $ | (28 | ) | $ | 39 | $ | 4 | ||||
| Allowance for loan losses at end of period | $ | 12,030 | $ | 12,060 | $ | 12,439 | $ | 12,304 | $ | 12,712 | $ | 12,354 | $ | 12,355 | $ | 12,366 | $ | 12,025 | $ | 12,030 | ||||||||||
Allowance for loan losses as a percentage of total loans(8) | 1.93 | % | 1.94 | % | 1.97 | % | 1.96 | % | 2.07 | % | 1.85 | % | 1.87 | % | 1.91 | % | 1.88 | % | 1.93 | % | ||||||||||
Allowance for unfunded lending commitments(9) | $ | 1,377 | $ | 1,418 | $ | 1,388 | $ | 1,432 | $ | 1,473 | $ | 1,290 | $ | 1,258 | $ | 1,232 | $ | 1,406 | $ | 1,377 | ||||||||||
| Total allowance for loan losses and unfunded lending commitments | $ | 13,407 | $ | 13,478 | $ | 13,827 | $ | 13,736 | $ | 14,185 | $ | 13,644 | $ | 13,613 | $ | 13,598 | $ | 13,431 | $ | 13,407 | ||||||||||
| Net consumer credit losses | $ | 1,672 | $ | 1,576 | $ | 1,483 | $ | 1,475 | $ | 1,514 | $ | 1,771 | $ | 1,658 | $ | 1,734 | $ | 1,633 | $ | 1,672 | ||||||||||
| As a percentage of average consumer loans | 2.11 | % | 1.95 | % | 1.80 | % | 1.87 | % | 1.90 | % | 2.19 | % | 2.02 | % | 2.11 | % | 2.04 | % | 2.11 | % | ||||||||||
| Net corporate credit losses | $ | 37 | $ | 120 | $ | 42 | $ | 141 | $ | 210 | $ | 96 | $ | 222 | $ | 43 | $ | 77 | $ | 37 | ||||||||||
| As a percentage of average corporate loans | 0.05 | % | 0.16 | % | 0.05 | % | 0.19 | % | 0.29 | % | 0.11 | % | 0.27 | % | 0.05 | % | 0.10 | % | 0.05 | % | ||||||||||
Allowance by type at end of period(10) | ||||||||||||||||||||||||||||||
| Consumer | $ | 9,495 | $ | 9,358 | $ | 9,673 | $ | 9,432 | $ | 9,807 | $ | 10,039 | $ | 9,869 | $ | 9,892 | $ | 9,515 | $ | 9,495 | ||||||||||
| Corporate | 2,535 | 2,702 | 2,766 | 2,872 | 2,905 | 2,315 | 2,486 | 2,474 | 2,510 | 2,535 | ||||||||||||||||||||
| Total | $ | 12,030 | $ | 12,060 | $ | 12,439 | $ | 12,304 | $ | 12,712 | $ | 12,354 | $ | 12,355 | $ | 12,366 | $ | 12,025 | $ | 12,030 | ||||||||||
| (1) | Recoveries have been reduced by certain collection costs that are incurred only if collection efforts are successful. |
| (2) | Includes all adjustments to the allowance for credit losses, such as changes in the allowance from acquisitions, dispositions, securitizations, FX translation, purchase accounting adjustments, etc. |
| (3) | The first quarter of 2018 includes a reduction of approximately $55 million related to the sale or transfer to held-for-sale (HFS) of various loan portfolios, including a reduction of $53 million related to the transfer of a real estate loan portfolio to HFS. Additionally, the first quarter includes an increase of approximately $118 million related to FX translation. |
| (4) | The fourth quarter of 2017 includes a reduction of approximately $47 million related to the sale or transfer to HFS of various loan portfolios, including a reduction of $22 million related to the transfer of a real estate loan portfolio to HFS. Additionally, the fourth quarter includes a decrease of approximately $106 million related to FX translation. |
| (5) | The third quarter of 2017 includes a reduction of approximately $34 million related to the sale or transfer to HFS of various loan portfolios, including a reduction of $28 million related to the transfer of a real estate loan portfolio to HFS. Additionally, the third quarter includes an increase of approximately $7 million related to FX translation. |
| (6) | The second quarter of 2017 includes a reduction of approximately $19 million related to the sale or transfer to HFS of various loan portfolios, including a reduction of $19 million related to the transfer of a real estate loan portfolio to HFS. Additionally, the second quarter includes an increase of approximately $50 million related to FX translation. |
| (7) | The first quarter of 2017 includes a reduction of approximately $161 million related to the sale or transfer to |
| (8) | March 31, |
| (9) | Represents additional credit reserves recorded as Other liabilities on the Consolidated Balance Sheet. |
| (10) | Allowance for loan losses represents management’s best estimate of probable losses inherent in the portfolio, as well as probable losses related to large individually evaluated impaired loans and troubled debt restructurings. See “Significant Accounting Policies and Significant Estimates” and Note 1 to the Consolidated Financial Statements in Citi’s |
| March 31, 2017 | March 31, 2018 | |||||||||||||||
| In billions of dollars | Allowance for loan losses | Loans, net of unearned income | Allowance as a percentage of loans(1) | Allowance for loan losses | Loans, net of unearned income | Allowance as a percentage of loans(1) | ||||||||||
North America cards(2) | $ | 5.3 | $ | 126.4 | 4.2 | % | $ | 6.2 | $ | 131.8 | 4.7 | % | ||||
North America mortgages(3) | 1.0 | 69.9 | 1.4 | 0.7 | 62.2 | 1.1 | ||||||||||
North America other | 0.4 | 12.8 | 3.1 | 0.3 | 12.4 | 2.4 | ||||||||||
| International cards | 1.3 | 24.0 | 5.4 | 1.4 | 25.5 | 5.5 | ||||||||||
International other(4) | 1.5 | 87.5 | 1.7 | 1.5 | 93.2 | 1.6 | ||||||||||
| Total consumer | $ | 9.5 | $ | 320.6 | 3.0 | % | $ | 10.1 | $ | 325.1 | 3.1 | % | ||||
| Total corporate | 2.5 | 308.0 | 0.8 | 2.3 | 347.8 | 0.7 | ||||||||||
| Total Citigroup | $ | 12.0 | $ | 628.6 | 1.9 | % | $ | 12.4 | $ | 672.9 | 1.8 | % | ||||
| (1) | Allowance as a percentage of loans excludes loans that are carried at fair value. |
| (2) | Includes both Citi-branded cards and Citi retail services. The |
| (3) | Of the |
| (4) | Includes mortgages and other retail loans. |
| December 31, 2016 | December 31, 2017 | |||||||||||||||
| In billions of dollars | Allowance for loan losses | Loans, net of unearned income | Allowance as a percentage of loans(1) | Allowance for loan losses | Loans, net of unearned income | Allowance as a percentage of loans(1) | ||||||||||
North America cards(2) | $ | 5.2 | $ | 133.3 | 3.9 | % | $ | 6.1 | $ | 139.7 | 4.4 | % | ||||
North America mortgages(3) | 1.1 | 72.6 | 1.5 | 0.7 | 64.2 | 1.1 | ||||||||||
North America other | 0.5 | 13.6 | 3.7 | 0.3 | 13.0 | 2.3 | ||||||||||
| International cards | 1.2 | 23.1 | 5.2 | 1.3 | 25.7 | 5.1 | ||||||||||
International other(4) | 1.4 | 82.8 | 1.7 | 1.5 | 91.1 | 1.6 | ||||||||||
| Total consumer | $ | 9.4 | $ | 325.4 | 2.9 | % | $ | 9.9 | $ | 333.7 | 3.0 | % | ||||
| Total corporate | 2.7 | 299.0 | 0.9 | 2.5 | 333.3 | 0.8 | ||||||||||
| Total Citigroup | $ | 12.1 | $ | 624.4 | 1.9 | % | $ | 12.4 | $ | 667.0 | 1.9 | % | ||||
| (1) | Allowance as a percentage of loans excludes loans that are carried at fair value. |
| (2) | Includes both Citi-branded cards and Citi retail services. The |
| (3) | Of the |
| (4) | Includes mortgages and other retail loans. |
| Mar. 31, | Dec. 31, | Sept. 30, | Jun. 30, | Mar. 31, | Mar. 31, | Dec. 31, | Sept. 30, | Jun. 30, | Mar. 31, | |||||||||||||||||||||
| In millions of dollars | 2017 | 2016 | 2018 | 2017 | ||||||||||||||||||||||||||
Corporate non-accrual loans(1) | ||||||||||||||||||||||||||||||
| North America | $ | 993 | $ | 984 | $ | 1,057 | $ | 1,280 | $ | 1,331 | $ | 817 | $ | 784 | $ | 915 | $ | 944 | $ | 993 | ||||||||||
| EMEA | 828 | 904 | 857 | 762 | 469 | 561 | 849 | 681 | 727 | 828 | ||||||||||||||||||||
| Latin America | 342 | 379 | 380 | 267 | 410 | 263 | 280 | 312 | 281 | 342 | ||||||||||||||||||||
| Asia | 176 | 154 | 121 | 151 | 117 | 27 | 29 | 146 | 146 | 176 | ||||||||||||||||||||
| Total corporate non-accrual loans | $ | 2,339 | $ | 2,421 | $ | 2,415 | $ | 2,460 | $ | 2,327 | $ | 1,668 | $ | 1,942 | $ | 2,054 | $ | 2,098 | $ | 2,339 | ||||||||||
Consumer non-accrual loans(1) | ||||||||||||||||||||||||||||||
| North America | $ | 1,926 | $ | 2,160 | $ | 2,429 | $ | 2,520 | $ | 2,519 | $ | 1,500 | $ | 1,650 | $ | 1,721 | $ | 1,754 | $ | 1,926 | ||||||||||
| Latin America | 737 | 711 | 841 | 884 | 817 | 791 | 756 | 791 | 793 | 737 | ||||||||||||||||||||
Asia(2) | 292 | 287 | 282 | 301 | 265 | 284 | 284 | 271 | 301 | 292 | ||||||||||||||||||||
| Total consumer non-accrual loans | $ | 2,955 | $ | 3,158 | $ | 3,552 | $ | 3,705 | $ | 3,601 | $ | 2,575 | $ | 2,690 | $ | 2,783 | $ | 2,848 | $ | 2,955 | ||||||||||
| Total non-accrual loans | $ | 5,294 | $ | 5,579 | $ | 5,967 | $ | 6,165 | $ | 5,928 | $ | 4,243 | $ | 4,632 | $ | 4,837 | $ | 4,946 | $ | 5,294 | ||||||||||
| (1) | Excludes purchased distressed loans, as they are generally accreting interest. The carrying value of these loans was $126 million at March 31, 2018, $167 million at December 31, 2017, $177 million at September 30, 2017, $183 million at June 30, 2017 and $194 million at March 31, |
| Three months ended | Three months ended | Three Months Ended | Three Months Ended | |||||||||||||||||||||||||||||||||
| March 31, 2017 | March 31, 2016 | March 31, 2018 | March 31, 2017 | |||||||||||||||||||||||||||||||||
| In millions of dollars | Corporate | Consumer | Total | Corporate | Consumer | Total | Corporate | Consumer | Total | Corporate | Consumer | Total | ||||||||||||||||||||||||
| Non-accrual loans at beginning of period | $ | 2,421 | $ | 3,158 | $ | 5,579 | $ | 1,596 | $ | 3,658 | $ | 5,254 | $ | 1,942 | $ | 2,690 | $ | 4,632 | $ | 2,421 | $ | 3,158 | $ | 5,579 | ||||||||||||
Additions | 253 | 824 | 1,077 | 1,047 | 914 | 1,961 | 825 | 861 | 1,686 | 253 | 824 | 1,077 | ||||||||||||||||||||||||
| Sales and transfers to held-for-sale | (36 | ) | (135 | ) | (171 | ) | (8 | ) | (162 | ) | (170 | ) | ||||||||||||||||||||||||
| Sales and transfers to HFS | (20 | ) | (85 | ) | (105 | ) | (36 | ) | (135 | ) | (171 | ) | ||||||||||||||||||||||||
| Returned to performing | (37 | ) | (164 | ) | (201 | ) | (15 | ) | (141 | ) | (156 | ) | (68 | ) | (208 | ) | (276 | ) | (37 | ) | (164 | ) | (201 | ) | ||||||||||||
| Paydowns/settlements | (183 | ) | (280 | ) | (463 | ) | (98 | ) | (245 | ) | (343 | ) | (884 | ) | (270 | ) | (1,154 | ) | (183 | ) | (280 | ) | (463 | ) | ||||||||||||
| Charge-offs | (54 | ) | (524 | ) | (578 | ) | (140 | ) | (439 | ) | (579 | ) | (106 | ) | (454 | ) | (560 | ) | (54 | ) | (524 | ) | (578 | ) | ||||||||||||
| Other | (25 | ) | 76 | 51 | (55 | ) | 16 | (39 | ) | (21 | ) | 41 | 20 | (25 | ) | 76 | 51 | |||||||||||||||||||
| Ending balance | $ | 2,339 | $ | 2,955 | $ | 5,294 | $ | 2,327 | $ | 3,601 | $ | 5,928 | $ | 1,668 | $ | 2,575 | $ | 4,243 | $ | 2,339 | $ | 2,955 | $ | 5,294 | ||||||||||||
| Mar. 31, | Dec. 31, | Sept. 30, | Jun. 30, | Mar. 31, | Mar. 31, | Dec. 31, | Sept. 30, | Jun. 30, | Mar. 31, | |||||||||||||||||||||
| In millions of dollars | 2017 | 2016 | 2018 | 2017 | ||||||||||||||||||||||||||
| OREO | ||||||||||||||||||||||||||||||
| North America | $ | 136 | $ | 161 | $ | 132 | $ | 151 | $ | 159 | $ | 70 | $ | 89 | $ | 97 | $ | 128 | $ | 136 | ||||||||||
| EMEA | 1 | — | 1 | — | 1 | — | 2 | 1 | 1 | 1 | ||||||||||||||||||||
| Latin America | 31 | 18 | 18 | 19 | 35 | 29 | 35 | 30 | 31 | 31 | ||||||||||||||||||||
| Asia | 5 | 7 | 10 | 5 | 10 | 15 | 18 | 15 | 8 | 5 | ||||||||||||||||||||
| Total OREO | $ | 173 | $ | 186 | $ | 161 | $ | 175 | $ | 205 | $ | 114 | $ | 144 | $ | 143 | $ | 168 | $ | 173 | ||||||||||
| Non-accrual assets | ||||||||||||||||||||||||||||||
| Corporate non-accrual loans | $ | 2,339 | $ | 2,421 | $ | 2,415 | $ | 2,460 | $ | 2,327 | $ | 1,668 | $ | 1,942 | $ | 2,054 | $ | 2,098 | $ | 2,339 | ||||||||||
| Consumer non-accrual loans | 2,955 | 3,158 | 3,552 | 3,705 | 3,601 | 2,575 | 2,690 | 2,783 | 2,848 | 2,955 | ||||||||||||||||||||
| Non-accrual loans (NAL) | $ | 5,294 | $ | 5,579 | $ | 5,967 | $ | 6,165 | $ | 5,928 | $ | 4,243 | $ | 4,632 | $ | 4,837 | $ | 4,946 | $ | 5,294 | ||||||||||
| OREO | $ | 173 | $ | 186 | $ | 161 | $ | 175 | $ | 205 | $ | 114 | $ | 144 | $ | 143 | $ | 168 | $ | 173 | ||||||||||
| Non-accrual assets (NAA) | $ | 5,467 | $ | 5,765 | $ | 6,128 | $ | 6,340 | $ | 6,133 | $ | 4,357 | $ | 4,776 | $ | 4,980 | $ | 5,114 | $ | 5,467 | ||||||||||
| NAL as a percentage of total loans | 0.84 | % | 0.89 | % | 0.93 | % | 0.97 | % | 0.96 | % | 0.63 | % | 0.69 | % | 0.74 | % | 0.77 | % | 0.84 | % | ||||||||||
| NAA as a percentage of total assets | 0.30 | 0.32 | 0.34 | 0.35 | 0.34 | 0.23 | 0.26 | 0.26 | 0.27 | 0.30 | ||||||||||||||||||||
Allowance for loan losses as a percentage of NAL(1) | 227 | 216 | 208 | 200 | 214 | 291 | 267 | 256 | 243 | 227 | ||||||||||||||||||||
| (1) | The allowance for loan losses includes the allowance for Citi’s credit card portfolios and purchased distressed loans, while the non-accrual loans exclude credit card balances (with the exception of certain international portfolios) and purchased distressed loans as these continue to accrue interest until charge-off. |
| In millions of dollars | Mar. 31, 2017 | Dec. 31, 2016 | Mar. 31, 2018 | Dec. 31, 2017 | ||||||||
Corporate renegotiated loans(1) | ||||||||||||
| In U.S. offices | ||||||||||||
Commercial and industrial(2) | $ | 136 | $ | 89 | $ | 202 | $ | 225 | ||||
| Mortgage and real estate | 80 | 84 | 89 | 90 | ||||||||
| Loans to financial institutions | 9 | 9 | 25 | 33 | ||||||||
| Other | 177 | 228 | 41 | 45 | ||||||||
| $ | 402 | $ | 410 | |||||||||
| Total | $ | 357 | $ | 393 | ||||||||
| In offices outside the U.S. | ||||||||||||
Commercial and industrial(2) | $ | 254 | $ | 319 | $ | 305 | $ | 392 | ||||
| Mortgage and real estate | 4 | 3 | 9 | 11 | ||||||||
| Loans to financial institutions | 15 | — | 15 | 15 | ||||||||
| $ | 273 | $ | 322 | |||||||||
| Other | — | 7 | ||||||||||
| Total | $ | 329 | $ | 425 | ||||||||
| Total corporate renegotiated loans | $ | 675 | $ | 732 | $ | 686 | $ | 818 | ||||
Consumer renegotiated loans(3)(4)(5) | ||||||||||||
| In U.S. offices | ||||||||||||
Mortgage and real estate(6) | $ | 4,541 | $ | 4,695 | $ | 3,380 | $ | 3,709 | ||||
| Cards | 1,327 | 1,313 | 1,291 | 1,246 | ||||||||
| Installment and other | 138 | 117 | 152 | 169 | ||||||||
| $ | 6,006 | $ | 6,125 | |||||||||
| Total | $ | 4,823 | $ | 5,124 | ||||||||
| In offices outside the U.S. | ||||||||||||
| Mortgage and real estate | $ | 357 | $ | 447 | $ | 342 | $ | 345 | ||||
| Cards | 496 | 435 | 555 | 541 | ||||||||
| Installment and other | 379 | 443 | 447 | 427 | ||||||||
| $ | 1,232 | $ | 1,325 | |||||||||
| Total | $ | 1,344 | $ | 1,313 | ||||||||
| Total consumer renegotiated loans | $ | 7,238 | $ | 7,450 | $ | 6,167 | $ | 6,437 | ||||
| (1) | Includes |
| (2) | In addition to modifications reflected as TDRs at March 31, |
| (3) | Includes |
| (4) | Includes |
| (5) | Includes |
| (6) | Reduction in the three months ended March 31, 2018 compared with December 31, 2017 includes |
| Citibank | Non-Bank and Other(1) | Total | Citibank | Non-Bank and Other | Total | |||||||||||||||||||||||||||||||||||||||||||||||||
| In billions of dollars | Mar. 31, 2017 | Dec. 31, 2016 | Mar. 31, 2016 | Mar. 31, 2017 | Dec. 31, 2016 | Mar. 31, 2016 | Mar. 31, 2017 | Dec. 31, 2016 | Mar. 31, 2016 | Mar. 31, 2018 | Dec. 31, 2017 | Mar. 31, 2017 | Mar. 31, 2018 | Dec. 31, 2017 | Mar. 31, 2017 | Mar. 31, 2018 | Dec. 31, 2017 | Mar. 31, 2017 | ||||||||||||||||||||||||||||||||||||
| Available cash | $ | 83.8 | $ | 68.3 | $ | 74.2 | $ | 24.5 | $ | 19.8 | $ | 24.5 | $ | 108.3 | $ | 88.1 | $ | 98.7 | $ | 94.9 | $ | 94.3 | $ | 87.9 | $ | 24.9 | $ | 30.9 | $ | 20.9 | $ | 119.9 | $ | 125.2 | $ | 108.8 | ||||||||||||||||||
| U.S. sovereign | 113.8 | 123.0 | 117.7 | 22.7 | 22.5 | 22.6 | 136.5 | 145.5 | 140.3 | 114.6 | 113.2 | 117.1 | 28.9 | 27.9 | 22.4 | 143.4 | 141.1 | 139.5 | ||||||||||||||||||||||||||||||||||||
| U.S. agency/agency MBS | 59.2 | 61.7 | 68.9 | 0.8 | 0.6 | 0.5 | 60.0 | 62.3 | 69.4 | 74.3 | 80.8 | 60.7 | 5.6 | 0.5 | 0.2 | 79.9 | 81.3 | 60.8 | ||||||||||||||||||||||||||||||||||||
Foreign government debt | 84.5 | 87.9 | 86.8 | 17.2 | 15.6 | 19.6 | 101.7 | 103.5 | 106.4 | 69.2 | 80.5 | 87.5 | 12.9 | 16.4 | 14.7 | 82.1 | 96.9 | 102.2 | ||||||||||||||||||||||||||||||||||||
| Other investment grade | 0.3 | 0.3 | 1.1 | 1.5 | 1.2 | 1.6 | 1.8 | 1.5 | 2.7 | 0.3 | 0.7 | 0.3 | 1.3 | 1.2 | 1.2 | 1.6 | 1.9 | 1.5 | ||||||||||||||||||||||||||||||||||||
| Total HQLA (EOP) | $ | 341.6 | $ | 341.2 | $ | 348.7 | $ | 66.7 | $ | 59.7 | $ | 68.8 | $ | 408.3 | $ | 400.9 | $ | 417.5 | ||||||||||||||||||||||||||||||||||||
| Total HQLA (AVG) | $ | 353.5 | $ | 345.7 | $ | 335.1 | $ | 59.3 | $ | 58.0 | $ | 65.0 | $ | 412.8 | $ | 403.7 | $ | 400.1 | $ | 353.3 | $ | 369.5 | $ | 353.5 | $ | 73.6 | $ | 76.9 | $ | 59.3 | $ | 426.9 | $ | 446.4 | $ | 412.8 | ||||||||||||||||||
| (1) |
| Foreign government debt includes securities issued or guaranteed by foreign sovereigns, agencies and multilateral development banks. Foreign government debt securities are held largely to support local liquidity requirements and Citi’s local franchises and principally include government bonds from Hong Kong, |
| In billions of dollars | Mar. 31, 2017 | Dec. 31, 2016 | Mar. 31, 2016 | Mar. 31, 2018 | Dec. 31, 2017 | Mar. 31, 2017 | ||||||||||||
| Global Consumer Banking | ||||||||||||||||||
| North America | $ | 183.3 | $ | 182.0 | $ | 161.6 | $ | 189.7 | $ | 189.7 | $ | 183.3 | ||||||
| Latin America | 23.1 | 23.5 | 24.4 | 26.3 | 25.7 | 23.1 | ||||||||||||
Asia(1) | 83.2 | 81.9 | 84.9 | 90.3 | 87.9 | 83.2 | ||||||||||||
| Total | $ | 289.6 | $ | 287.4 | $ | 270.9 | $ | 306.3 | $ | 303.3 | $ | 289.6 | ||||||
| Institutional Clients Group | ||||||||||||||||||
| Corporate lending | 118.1 | 118.9 | 121.6 | $ | 131.6 | $ | 124.8 | $ | 118.1 | |||||||||
| Treasury and trade solutions (TTS) | 70.5 | 71.5 | 70.4 | 78.2 | 77.0 | 71.4 | ||||||||||||
| Private bank, markets and securities services and other | 113.2 | 113.9 | 103.0 | |||||||||||||||
| Private Bank | 88.9 | 85.9 | 76.7 | |||||||||||||||
Markets and securities services and other | 40.7 | 40.4 | 35.5 | |||||||||||||||
| Total | $ | 301.8 | $ | 304.3 | $ | 295.0 | $ | 339.4 | $ | 328.2 | $ | 301.8 | ||||||
Total Corporate/Other | 31.8 | 34.6 | 46.3 | $ | 22.2 | $ | 22.5 | $ | 31.9 | |||||||||
| Total Citigroup loans (AVG) | $ | 623.2 | $ | 626.3 | $ | 612.2 | $ | 667.9 | $ | 654.0 | $ | 623.3 | ||||||
| Total Citigroup loans (EOP) | $ | 628.6 | $ | 624.4 | $ | 618.8 | $ | 672.9 | $ | 667.0 | $ | 628.6 | ||||||
| (1) | Includes loans in certain EMEA countries for all periods presented. |
| In billions of dollars | Mar. 31, 2017 | Dec. 31, 2016 | Mar. 31, 2016 | Mar. 31, 2018 | Dec. 31, 2017 | Mar. 31, 2017 | ||||||||||||
| Global Consumer Banking | ||||||||||||||||||
| North America | $ | 185.5 | $ | 186.0 | $ | 180.6 | $ | 180.9 | $ | 182.7 | $ | 184.6 | ||||||
| Latin America | 25.3 | 25.2 | 26.1 | 28.9 | 27.8 | 25.3 | ||||||||||||
Asia(1) | 92.7 | 89.9 | 87.2 | 99.1 | 96.0 | 92.7 | ||||||||||||
| Total | $ | 303.5 | $ | 301.1 | $ | 293.9 | $ | 308.9 | $ | 306.5 | $ | 302.6 | ||||||
| Institutional Clients Group | ||||||||||||||||||
| Treasury and trade solutions (TTS) | 416.2 | 415.4 | 402.1 | $ | 440.3 | $ | 444.5 | $ | 416.2 | |||||||||
| Banking ex-TTS | 120.8 | 122.4 | 113.5 | 128.2 | 126.9 | 120.8 | ||||||||||||
| Markets and securities services | 80.1 | 81.7 | 77.4 | 84.1 | 82.9 | 80.1 | ||||||||||||
| Total | $ | 617.1 | $ | 619.5 | $ | 593.0 | $ | 652.6 | $ | 654.4 | $ | 617.1 | ||||||
| Corporate/Other | 20.3 | 14.5 | 24.8 | $ | 20.3 | $ | 12.4 | $ | 21.2 | |||||||||
| Total Citigroup deposits (AVG) | $ | 940.9 | $ | 935.1 | $ | 911.7 | $ | 981.9 | $ | 973.3 | $ | 940.9 | ||||||
| Total Citigroup deposits (EOP) | $ | 950.0 | $ | 929.4 | $ | 934.6 | $ | 1,001.2 | $ | 959.8 | $ | 950.0 | ||||||
| (1) | Includes deposits in certain EMEA countries for all periods presented. |
| In billions of dollars | Mar. 31, 2017 | Dec. 31, 2016 | Mar. 31, 2016 | Mar. 31, 2018 | Dec. 31, 2017 | Mar. 31, 2017 | ||||||||||||
Parent and other(1) | ||||||||||||||||||
| Benchmark debt: | ||||||||||||||||||
| Senior debt | $ | 100.2 | $ | 99.9 | $ | 94.0 | $ | 112.0 | $ | 109.8 | $ | 100.2 | ||||||
| Subordinated debt | 26.3 | 26.8 | 29.4 | 25.5 | 26.9 | 26.3 | ||||||||||||
| Trust preferred | 1.7 | 1.7 | 1.7 | 1.7 | 1.7 | 1.7 | ||||||||||||
| Customer-related debt: | 32.4 | 30.7 | 27.2 | |||||||||||||||
| Structured debt | 24.3 | 22.8 | 23.6 | |||||||||||||||
| Non-structured debt | 2.9 | 3.0 | 3.3 | |||||||||||||||
Local country and other(2) | 2.0 | 2.5 | 4.1 | 1.6 | 1.8 | 2.0 | ||||||||||||
| Total parent and other | $ | 157.4 | $ | 156.7 | $ | 156.1 | $ | 173.2 | $ | 170.9 | $ | 157.4 | ||||||
| Bank | ||||||||||||||||||
| FHLB borrowings | $ | 20.3 | $ | 21.6 | $ | 17.1 | $ | 15.7 | $ | 19.3 | $ | 20.3 | ||||||
Securitizations(3) | 24.0 | 23.5 | 28.7 | 30.2 | 30.3 | 24.0 | ||||||||||||
| CBNA Benchmark Debt | 2.5 | — | — | |||||||||||||||
| CBNA benchmark senior debt | 15.0 | 12.5 | 2.5 | |||||||||||||||
Local country and other(2) | 4.3 | 4.4 | 5.9 | 3.8 | 3.7 | 4.3 | ||||||||||||
| Total bank | $ | 51.1 | $ | 49.5 | $ | 51.7 | $ | 64.8 | $ | 65.8 | $ | 51.1 | ||||||
| Total long-term debt | $ | 208.5 | $ | 206.2 | $ | 207.8 | $ | 237.9 | $ | 236.7 | $ | 208.5 | ||||||
| (1) | “Parent and other” includes long-term debt issued to third parties by the parent holding company (Citigroup) and Citi’s non-bank subsidiaries (including broker-dealer subsidiaries) that are consolidated into Citigroup. As of March 31, |
| (2) | Local country debt includes debt issued by Citi’s affiliates in support of their local operations. |
| (3) | Predominantly credit card securitizations, primarily backed by Citi-branded credit card receivables. |
| 1Q17 | 4Q16 | 1Q16 | 1Q18 | 4Q17 | 1Q17 | |||||||||||||||||||||||||||||||
| In billions of dollars | Maturities | Issuances | Maturities | Issuances | Maturities | Issuances | Maturities | Issuances | Maturities | Issuances | Maturities | Issuances | ||||||||||||||||||||||||
| Parent and other | ||||||||||||||||||||||||||||||||||||
| Benchmark debt: | ||||||||||||||||||||||||||||||||||||
| Senior debt | $ | 5.3 | $ | 5.2 | $ | 2.2 | $ | 9.7 | $ | 4.3 | $ | 5.2 | $ | 3.5 | $ | 5.4 | $ | 4.3 | $ | 4.4 | $ | 5.3 | $ | 5.2 | ||||||||||||
| Subordinated debt | 1.2 | 0.7 | 0.2 | — | — | 1.5 | 1.6 | 0.2 | 0.4 | 0.4 | 1.2 | 0.7 | ||||||||||||||||||||||||
| Trust preferred | — | — | — | — | — | — | — | — | — | — | — | — | ||||||||||||||||||||||||
| Customer-related debt: | ||||||||||||||||||||||||||||||||||||
| Structured debt | 6.6 | 6.2 | 1.8 | 1.6 | 2.0 | 3.6 | ||||||||||||||||||||||||||||||
| Non-structured debt | 0.2 | — | 0.3 | — | 0.2 | — | ||||||||||||||||||||||||||||||
| Customer-related debt | 2.5 | 4.9 | 1.7 | 2.2 | 6.8 | 6.2 | ||||||||||||||||||||||||||||||
| Local country and other | 0.6 | 0.2 | 0.1 | — | 0.1 | 1.9 | 0.1 | 0.1 | 0.1 | — | 0.6 | 0.2 | ||||||||||||||||||||||||
| Total parent and other | $ | 13.9 | $ | 12.3 | $ | 4.6 | $ | 11.3 | $ | 6.6 | $ | 12.2 | $ | 7.7 | $ | 10.7 | $ | 6.5 | $ | 6.9 | $ | 13.9 | $ | 12.3 | ||||||||||||
| Bank | ||||||||||||||||||||||||||||||||||||
| FHLB borrowings | $ | 1.8 | $ | 0.5 | $ | 5.1 | $ | 5.1 | $ | 1.7 | $ | 1.0 | $ | 6.5 | $ | 3.9 | $ | 3.0 | $ | 2.5 | $ | 1.8 | $ | 0.5 | ||||||||||||
| Securitizations | 2.0 | 2.5 | 4.1 | 3.3 | 2.3 | — | 2.9 | 2.8 | 0.6 | 2.5 | 2.0 | 2.5 | ||||||||||||||||||||||||
| CBNA Benchmark Debt | — | 2.5 | — | — | — | — | ||||||||||||||||||||||||||||||
| CBNA benchmark senior debt | — | 2.5 | — | 3.1 | — | 2.5 | ||||||||||||||||||||||||||||||
| Local country and other | 1.2 | 0.8 | 1.2 | 0.6 | 0.7 | 0.7 | 0.8 | 0.8 | 1.1 | 0.7 | 1.2 | 0.8 | ||||||||||||||||||||||||
| Total bank | $ | 5.0 | $ | 6.3 | $ | 10.4 | $ | 9.0 | $ | 4.7 | $ | 1.7 | $ | 10.2 | $ | 10.1 | $ | 4.7 | $ | 8.8 | $ | 5.0 | $ | 6.3 | ||||||||||||
| Total | $ | 18.9 | $ | 18.6 | $ | 15.0 | $ | 20.3 | $ | 11.3 | $ | 13.9 | $ | 17.9 | $ | 20.8 | $ | 11.2 | $ | 15.7 | $ | 18.9 | $ | 18.6 | ||||||||||||
| Maturities | 1Q18 | Maturities | ||||||||||||||||||||||||||||||||||||||||||||||||||||
| In billions of dollars | 1Q17 | 2017 | 2018 | 2019 | 2020 | 2021 | 2022 | Thereafter | Total | 2018 | 2019 | 2020 | 2021 | 2022 | 2023 | Thereafter | Total | |||||||||||||||||||||||||||||||||||||
| Parent and other | ||||||||||||||||||||||||||||||||||||||||||||||||||||||
| Benchmark debt: | ||||||||||||||||||||||||||||||||||||||||||||||||||||||
| Senior debt | $ | 5.3 | $ | 8.8 | $ | 18.2 | $ | 14.1 | $ | 8.9 | $ | 14.0 | $ | 2.5 | $ | 33.7 | $ | 100.2 | $ | 3.5 | $ | 15.0 | $ | 16.4 | $ | 8.4 | $ | 14.5 | $ | 8.1 | $ | 11.2 | $ | 38.4 | $ | 112.0 | ||||||||||||||||||
| Subordinated debt | 1.2 | — | 0.9 | 1.3 | — | — | 1.1 | 22.9 | 26.3 | 1.6 | 1.0 | — | — | 0.1 | 0.8 | 1.2 | 22.5 | 25.5 | ||||||||||||||||||||||||||||||||||||
| Trust preferred | — | — | — | — | — | — | — | 1.7 | 1.7 | — | — | — | — | — | — | — | 1.7 | 1.7 | ||||||||||||||||||||||||||||||||||||
| Customer-related debt: | ||||||||||||||||||||||||||||||||||||||||||||||||||||||
| Structured debt | 6.6 | — | 4.6 | 2.7 | 2.0 | 2.3 | 1.2 | 11.4 | 24.3 | |||||||||||||||||||||||||||||||||||||||||||||
| Non-structured debt | 0.2 | 0.4 | 0.6 | 0.1 | 0.3 | 0.1 | — | 1.4 | 2.9 | |||||||||||||||||||||||||||||||||||||||||||||
| Customer-related debt | 2.5 | 2.1 | 3.1 | 5.0 | 2.6 | 2.3 | 1.5 | 15.8 | 32.4 | |||||||||||||||||||||||||||||||||||||||||||||
| Local country and other | 0.6 | — | 0.7 | 0.2 | 0.1 | 0.6 | 0.3 | 0.3 | 2.0 | 0.1 | — | 0.3 | 0.1 | 0.2 | — | — | 0.8 | 1.6 | ||||||||||||||||||||||||||||||||||||
| Total parent and other | $ | 13.9 | $ | 9.2 | $ | 25.0 | $ | 18.4 | $ | 11.3 | $ | 17.0 | $ | 5.1 | $ | 71.4 | $ | 157.4 | $ | 7.7 | $ | 18.2 | $ | 19.8 | $ | 13.5 | $ | 17.4 | $ | 11.2 | $ | 13.9 | $ | 79.2 | $ | 173.2 | ||||||||||||||||||
| Bank | ||||||||||||||||||||||||||||||||||||||||||||||||||||||
| FHLB borrowings | $ | 1.8 | $ | 6.0 | $ | 13.8 | $ | 0.6 | $ | — | $ | — | $ | — | $ | — | $ | 20.3 | $ | 6.5 | $ | 9.3 | $ | 4.1 | $ | 2.4 | $ | — | $ | — | $ | — | $ | — | $ | 15.7 | ||||||||||||||||||
| Securitizations | 2.0 | 3.3 | 9.4 | 6.5 | 0.1 | 3.8 | 0.1 | 0.9 | 24.0 | 2.9 | 5.9 | 8.0 | 5.6 | 5.7 | 1.3 | 1.3 | 2.5 | 30.2 | ||||||||||||||||||||||||||||||||||||
| CBNA Benchmark Debt | — | — | — | 2.5 | — | — | — | — | 2.5 | |||||||||||||||||||||||||||||||||||||||||||||
| CBNA benchmark debt | — | 2.2 | 4.7 | 5.2 | 2.5 | — | — | 0.3 | 15.0 | |||||||||||||||||||||||||||||||||||||||||||||
| Local country and other | 1.2 | 0.4 | 1.8 | 0.6 | 0.8 | 0.1 | 0.1 | 0.3 | 4.3 | 0.8 | 1.2 | 1.0 | 0.9 | 0.1 | 0.3 | 0.1 | 0.3 | 3.8 | ||||||||||||||||||||||||||||||||||||
| Total bank | $ | 5.0 | $ | 9.7 | $ | 25.0 | $ | 10.2 | $ | 0.9 | $ | 3.9 | $ | 0.2 | $ | 1.2 | $ | 51.1 | $ | 10.2 | $ | 18.6 | $ | 17.7 | $ | 14.0 | $ | 8.3 | $ | 1.5 | $ | 1.4 | $ | 3.1 | $ | 64.8 | ||||||||||||||||||
| Total long-term debt | $ | 18.9 | $ | 18.9 | $ | 50.0 | $ | 28.6 | $ | 12.2 | $ | 20.9 | $ | 5.3 | $ | 72.6 | $ | 208.5 | $ | 17.9 | $ | 36.8 | $ | 37.6 | $ | 27.5 | $ | 25.7 | $ | 12.7 | $ | 15.3 | $ | 82.4 | $ | 237.9 | ||||||||||||||||||
| In billions of dollars | Mar. 31, 2017 | Dec. 31, 2016 | Mar. 31, 2016 | Mar. 31, 2018 | Dec. 31, 2017 | Mar. 31, 2017 | ||||||||||||
| HQLA | $ | 412.8 | $ | 403.7 | $ | 400.1 | $ | 426.9 | $ | 446.4 | $ | 412.8 | ||||||
| Net outflows | 334.4 | 332.5 | 333.3 | 355.2 | 364.3 | 334.4 | ||||||||||||
| LCR | 123 | % | 121 | % | 120 | % | 120 | % | 123 | % | 123 | % | ||||||
| HQLA in excess of net outflows | $ | 78.4 | $ | 71.3 | $ | 66.8 | $ | 71.7 | $ | 82.1 | $ | 78.4 | ||||||
| Citigroup Inc. | Citibank, N.A. | |||||
Senior debt | Commercial paper | Outlook | Long- term | Short- term | Outlook | |
| Fitch Ratings (Fitch) | A | F1 | Stable | A+ | F1 | Stable |
| Moody’s Investors Service (Moody’s) | Baa1 | P-2 | A1 | P-1 | ||
| Standard & Poor’s (S&P) | BBB+ | A-2 | Stable | A+ | A-1 | Stable |
| In millions of dollars (unless otherwise noted) | Mar. 31, 2017 | Dec. 31, 2016 | Mar. 31, 2016 | Mar. 31, 2018 | Dec. 31, 2017 | Mar. 31, 2017 | ||||||||||||
| Estimated annualized impact to net interest revenue | ||||||||||||||||||
U.S. dollar(1) | $ | 1,644 | $ | 1,586 | $ | 1,362 | $ | 1,243 | $ | 1,471 | $ | 1,644 | ||||||
| All other currencies | 581 | 550 | 587 | 651 | 598 | 581 | ||||||||||||
| Total | $ | 2,225 | $ | 2,136 | $ | 1,949 | $ | 1,894 | $ | 2,069 | $ | 2,225 | ||||||
| As a percentage of average interest-earning assets | 0.14 | % | 0.13 | % | 0.13 | % | 0.11 | % | 0.12 | % | 0.14 | % | ||||||
Estimated initial impact to AOCI (after-tax)(2) | $ | (3,830 | ) | $ | (4,671 | ) | $ | (4,950 | ) | $ | (4,955 | ) | $ | (4,853 | ) | $ | (3,830 | ) |
Estimated initial impact on Common Equity Tier 1 Capital ratio (bps)(3) | (43 | ) | (53 | ) | (57 | ) | (33 | ) | (35 | ) | (43 | ) | ||||||
| (1) | Certain trading-oriented businesses within Citi have accrual-accounted positions that are excluded from the estimated impact to net interest revenue in the table, since these exposures are managed economically in combination with mark-to-market positions. The U.S. dollar interest rate exposure associated with these businesses was |
| (2) | Includes the effect of changes in interest rates on AOCI related to investment securities, cash flow hedges and pension liability adjustments. |
| (3) |
| In millions of dollars (unless otherwise noted) | Scenario 1 | Scenario 2 | Scenario 3 | Scenario 4 | Scenario 1 | Scenario 2 | Scenario 3 | Scenario 4 | ||||||||||||||||
| Overnight rate change (bps) | 100 | 100 | — | — | 100 | 100 | — | — | ||||||||||||||||
| 10-year rate change (bps) | 100 | — | 100 | (100 | ) | 100 | — | 100 | (100 | ) | ||||||||||||||
Estimated annualized impact to net interest revenue | ||||||||||||||||||||||||
| U.S. dollar | $ | 1,644 | $ | 1,533 | $ | 96 | $ | (114 | ) | $ | 1,243 | $ | 1,213 | $ | 69 | $ | (82 | ) | ||||||
| All other currencies | 581 | 536 | 33 | (33 | ) | 651 | 612 | 37 | (37 | ) | ||||||||||||||
| Total | $ | 2,225 | $ | 2,069 | $ | 129 | $ | (147 | ) | $ | 1,894 | $ | 1,825 | $ | 106 | $ | (119 | ) | ||||||
Estimated initial impact to AOCI (after-tax)(1) | $ | (3,830 | ) | $ | (2,430 | ) | $ | (1,550 | ) | $ | 1,261 | $ | (4,955 | ) | $ | (2,951 | ) | $ | (2,172 | ) | $ | 1,697 | ||
Estimated initial impact to Common Equity Tier 1 Capital ratio (bps) | (43 | ) | (27 | ) | (18 | ) | 14 | (33 | ) | (20 | ) | (15 | ) | 11 | ||||||||||
| (1) | Includes the effect of changes in interest rates on AOCI related to investment securities, cash flow hedges and pension liability adjustments. |
| For the quarter ended | For the quarter ended | |||||||||||||||||
| In millions of dollars (unless otherwise noted) | Mar. 31, 2017 | Dec. 31, 2016 | Mar. 31, 2016 | Mar. 31, 2018 | Dec. 31, 2017 | Mar. 31, 2017 | ||||||||||||
Change in FX spot rate(1) | 4.5 | % | (5.2 | )% | 2.1 | % | 2.5 | % | (1.2 | )% | 4.5 | % | ||||||
| Change in TCE due to FX translation, net of hedges | $ | 654 | $ | (1,668 | ) | $ | 396 | $ | 676 | $ | (498 | ) | $ | 654 | ||||
| As a percentage of TCE | 0.4 | % | (0.9 | )% | 0.2 | % | 0.4 | % | (0.3 | )% | 0.4 | % | ||||||
Estimated impact to Common Equity Tier 1 Capital ratio (on a fully implemented basis) due to changes in FX translation, net of hedges (bps) | (2 | ) | — | (1 | ) | (2 | ) | (5 | ) | (2 | ) | |||||||
| (1) | FX spot rate change is a weighted average based upon Citi’s quarterly average GAAP capital exposure to foreign countries. |
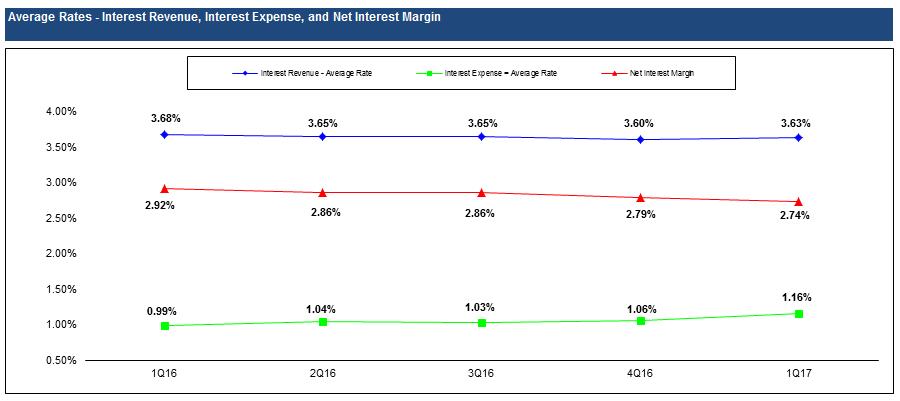
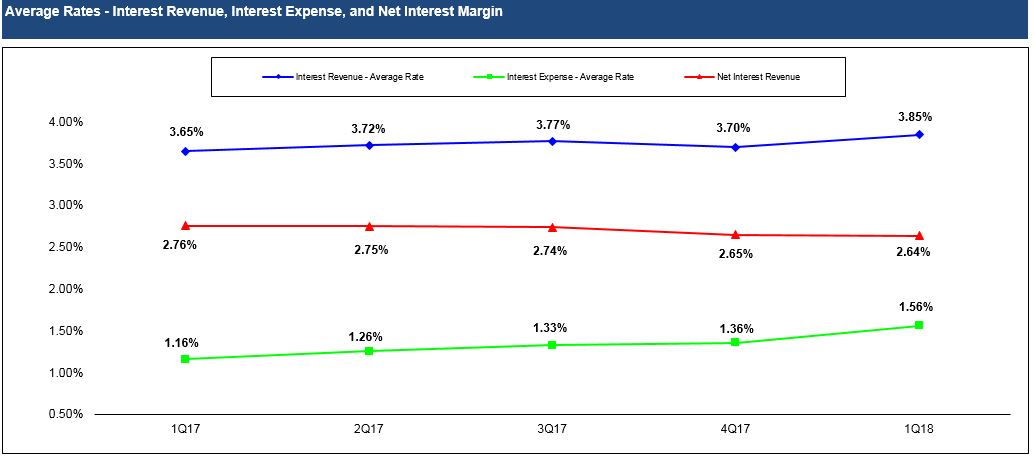
| 1st Qtr. | 4th Qtr. | 1st Qtr. | Change | 1st Qtr. | 4th Qtr. | 1st Qtr. | Change | |||||||||||||||||||||||
| In millions of dollars, except as otherwise noted | 2017 | 2016 | 2016 | 1Q17 vs. 1Q16 | 2018 | 2017 | 2017 | 1Q18 vs. 1Q17 | ||||||||||||||||||||||
Interest revenue(1) | $ | 14,546 | $ | 14,551 | $ | 14,286 | 2 | % | $ | 16,396 | $ | 15,978 | $ | 14,644 | 12 | % | ||||||||||||||
Interest expense(2) | 3,566 | 3,277 | 2,940 | 21 | 5,160 | 4,537 | 3,566 | 45 | ||||||||||||||||||||||
| Net interest revenue | $ | 10,980 | $ | 11,274 | $ | 11,346 | (3 | )% | $ | 11,236 | $ | 11,441 | $ | 11,078 | 1 | % | ||||||||||||||
| Interest revenue—average rate | 3.63 | % | 3.60 | % | 3.68 | % | (5 | ) | bps | 3.85 | % | 3.70 | % | 3.65 | % | 20 | bps | |||||||||||||
| Interest expense—average rate | 1.16 | 1.06 | 0.99 | 17 | bps | 1.56 | 1.36 | 1.16 | 40 | bps | ||||||||||||||||||||
| Net interest margin | 2.74 | 2.79 | 2.92 | (18 | ) | bps | ||||||||||||||||||||||||
Net interest margin(3) | 2.64 | 2.65 | 2.76 | (12 | ) | bps | ||||||||||||||||||||||||
| Interest-rate benchmarks | ||||||||||||||||||||||||||||||
| Two-year U.S. Treasury note—average rate | 1.24 | % | 1.01 | % | 0.84 | % | 40 | bps | 2.16 | % | 1.69 | % | 1.24 | % | 92 | bps | ||||||||||||||
| 10-year U.S. Treasury note—average rate | 2.45 | 2.14 | 1.91 | 54 | bps | 2.76 | 2.37 | 2.45 | 31 | bps | ||||||||||||||||||||
| 10-year vs. two-year spread | 121 | bps | 113 | bps | 107 | bps | 60 | bps | 68 | bps | 121 | bps | ||||||||||||||||||
| (1) | Net interest revenue includes the taxable equivalent adjustments related to the tax-exempt bond portfolio (based on the U.S. federal statutory tax |
| (2) | Interest expense associated with certain hybrid financial instruments, which are classified as Long-term debt and accounted for at fair value, is reported together with any changes in fair value as part of Principal |
| (3) | Citi’s net interest margin (NIM) is calculated by dividing gross interest revenue less gross interest expense by average interest-earning assets. |
| Average volume | Interest revenue | % Average rate | Average volume | Interest revenue | % Average rate | |||||||||||||||||||||||||||||||||||||||||||
| 1st Qtr. | 4th Qtr. | 1st Qtr. | 1st Qtr. | 4th Qtr. | 1st Qtr. | 1st Qtr. | 4th Qtr. | 1st Qtr. | 1st Qtr. | 4th Qtr. | 1st Qtr. | 1st Qtr. | 4th Qtr. | 1st Qtr. | 1st Qtr. | 4th Qtr. | 1st Qtr. | |||||||||||||||||||||||||||||||
| In millions of dollars, except rates | 2017 | 2016 | 2016 | 2017 | 2016 | 2016 | 2017 | 2016 | 2018 | 2017 | 2017 | 2018 | 2017 | 2017 | 2018 | 2017 | ||||||||||||||||||||||||||||||||
| Assets | ||||||||||||||||||||||||||||||||||||||||||||||||
Deposits with banks(4) | $ | 154,765 | $ | 143,119 | $ | 117,765 | $ | 295 | $ | 268 | $ | 219 | 0.77 | % | 0.74 | % | 0.75 | % | $ | 170,867 | $ | 179,810 | $ | 154,765 | $ | 432 | $ | 479 | $ | 295 | 1.03 | % | 1.06 | % | 0.77 | % | ||||||||||||
Federal funds sold and securities borrowed or purchased under agreements to resell(5) | ||||||||||||||||||||||||||||||||||||||||||||||||
| In U.S. offices | $ | 144,003 | $ | 145,799 | $ | 150,044 | $ | 368 | $ | 360 | $ | 374 | 1.04 | % | 0.98 | % | 1.00 | % | $ | 140,357 | $ | 140,062 | $ | 144,003 | $ | 713 | $ | 558 | $ | 368 | 2.06 | % | 1.58 | % | 1.04 | % | ||||||||||||
In offices outside the U.S.(4) | 103,032 | 89,565 | 78,571 | 293 | 236 | 273 | 1.15 | % | 1.05 | % | 1.40 | % | 113,920 | 109,842 | 103,032 | 326 | 343 | 293 | 1.16 | 1.24 | 1.15 | |||||||||||||||||||||||||||
| Total | $ | 247,035 | $ | 235,364 | $ | 228,615 | $ | 661 | $ | 596 | $ | 647 | 1.09 | % | 1.01 | % | 1.14 | % | $ | 254,277 | $ | 249,904 | $ | 247,035 | $ | 1,039 | $ | 901 | $ | 661 | 1.66 | % | 1.43 | % | 1.09 | % | ||||||||||||
Trading account assets(6)(7) | ||||||||||||||||||||||||||||||||||||||||||||||||
| In U.S. offices | $ | 101,836 | $ | 100,473 | $ | 104,982 | $ | 884 | $ | 956 | $ | 953 | 3.52 | % | 3.79 | % | 3.65 | % | $ | 97,558 | $ | 98,377 | $ | 101,836 | $ | 869 | $ | 852 | $ | 884 | 3.61 | % | 3.44 | % | 3.52 | % | ||||||||||||
In offices outside the U.S.(4) | 94,015 | 94,309 | 90,623 | 423 | 415 | 518 | 1.82 | % | 1.75 | % | 2.30 | % | 118,603 | 113,308 | 94,015 | 512 | 493 | 423 | 1.75 | 1.73 | 1.82 | |||||||||||||||||||||||||||
| Total | $ | 195,851 | $ | 194,782 | $ | 195,605 | $ | 1,307 | $ | 1,371 | $ | 1,471 | 2.71 | % | 2.80 | % | 3.02 | % | $ | 216,161 | $ | 211,685 | $ | 195,851 | $ | 1,381 | $ | 1,345 | $ | 1,307 | 2.59 | % | 2.52 | % | 2.71 | % | ||||||||||||
| Investments | ||||||||||||||||||||||||||||||||||||||||||||||||
| In U.S. offices | ||||||||||||||||||||||||||||||||||||||||||||||||
| Taxable | $ | 221,450 | $ | 220,461 | $ | 228,980 | $ | 1,034 | $ | 999 | $ | 1,000 | 1.89 | % | 1.80 | % | 1.76 | % | $ | 229,407 | $ | 231,758 | $ | 221,450 | $ | 1,224 | $ | 1,192 | $ | 1,034 | 2.16 | % | 2.04 | % | 1.89 | % | ||||||||||||
| Exempt from U.S. income tax | 18,680 | 18,802 | 19,400 | 196 | 192 | 169 | 4.26 | % | 4.06 | % | 3.50 | % | 17,531 | 17,573 | 18,680 | 170 | 201 | 196 | 3.93 | 4.54 | 4.26 | |||||||||||||||||||||||||||
In offices outside the U.S.(4) | 107,225 | 106,289 | 103,763 | 789 | 772 | 754 | 2.98 | % | 2.89 | % | 2.92 | % | 105,307 | 103,719 | 107,225 | 877 | 855 | 789 | 3.38 | 3.27 | 2.98 | |||||||||||||||||||||||||||
| Total | $ | 347,355 | $ | 345,552 | $ | 352,143 | $ | 2,019 | $ | 1,963 | $ | 1,923 | 2.36 | % | 2.26 | % | 2.20 | % | $ | 352,245 | $ | 353,050 | $ | 347,355 | $ | 2,271 | $ | 2,248 | $ | 2,019 | 2.61 | % | 2.53 | % | 2.36 | % | ||||||||||||
Loans (net of unearned income) | ||||||||||||||||||||||||||||||||||||||||||||||||
| In U.S. offices | $ | 367,397 | $ | 371,928 | $ | 350,107 | $ | 6,273 | $ | 6,302 | $ | 5,873 | 6.92 | % | 6.74 | % | 6.75 | % | $ | 380,357 | $ | 378,039 | $ | 367,397 | $ | 6,732 | $ | 6,628 | $ | 6,273 | 7.18 | % | 6.96 | % | 6.92 | % | ||||||||||||
In offices outside the U.S.(4) | 255,941 | 254,100 | 262,133 | 3,697 | 3,731 | 3,901 | 5.86 | % | 5.84 | % | 5.99 | % | 287,568 | 275,912 | 255,941 | 4,177 | 4,060 | 3,795 | 5.89 | 5.84 | 6.01 | |||||||||||||||||||||||||||
| Total | $ | 623,338 | $ | 626,028 | $ | 612,240 | $ | 9,970 | $ | 10,033 | $ | 9,774 | 6.49 | % | 6.38 | % | 6.42 | % | $ | 667,925 | $ | 653,951 | $ | 623,338 | $ | 10,909 | $ | 10,688 | $ | 10,068 | 6.62 | % | 6.48 | % | 6.55 | % | ||||||||||||
Other interest-earning assets(9) | $ | 56,733 | $ | 62,602 | $ | 56,260 | $ | 294 | $ | 320 | $ | 252 | 2.10 | % | 2.03 | % | 1.80 | % | $ | 66,761 | $ | 63,996 | $ | 56,733 | $ | 364 | $ | 317 | $ | 294 | 2.21 | % | 1.97 | % | 2.10 | % | ||||||||||||
| Total interest-earning assets | $ | 1,625,077 | $ | 1,607,447 | $ | 1,562,628 | $ | 14,546 | $ | 14,551 | $ | 14,286 | 3.63 | % | 3.60 | % | 3.68 | % | $ | 1,728,236 | $ | 1,712,396 | $ | 1,625,077 | $ | 16,396 | $ | 15,978 | $ | 14,644 | 3.85 | % | 3.70 | % | 3.65 | % | ||||||||||||
Non-interest-earning assets(6) | $ | 205,477 | $ | 212,355 | $ | 214,943 | $ | 175,987 | $ | 197,303 | $ | 205,477 | ||||||||||||||||||||||||||||||||||||
| Total assets | $ | 1,830,554 | $ | 1,819,802 | $ | 1,777,571 | $ | 1,904,223 | $ | 1,909,699 | $ | 1,830,554 | ||||||||||||||||||||||||||||||||||||
| (1) | Net interest revenue includes the taxable equivalent adjustments related to the tax-exempt bond portfolio (based on the U.S. federal statutory tax |
| (2) | Interest rates and amounts include the effects of risk management activities associated with the respective asset categories. |
| (3) | Monthly or quarterly averages have been used by certain subsidiaries where daily averages are unavailable. |
| (4) | Average rates reflect prevailing local interest rates, including inflationary effects and monetary corrections in certain countries. |
| (5) | Average volumes of securities borrowed or purchased under agreements to resell are reported net pursuant to ASC 210-20-45. However, Interest revenue excludes the impact of ASC 210-20-45. |
| (6) | The fair value carrying amounts of derivative contracts are reported net, pursuant to ASC 815-10-45, in Non-interest-earning assets and Other non-interest-bearing liabilities. |
| (7) | Interest expense on Trading account liabilities of ICG is reported as a reduction of Interest revenue. Interest revenue and Interest expense on cash collateral positions are reported in interest on Trading account assets and Trading account liabilities, respectively. |
| (8) | Includes cash-basis loans. |
| (9) | Includes brokerage receivables. |
| Average volume | Interest expense | % Average rate | Average volume | Interest expense | % Average rate | |||||||||||||||||||||||||||||||||||||||||||
| 1st Qtr. | 4th Qtr. | 1st Qtr. | 1st Qtr. | 4th Qtr. | 1st Qtr. | 1st Qtr. | 4th Qtr. | 1st Qtr. | 1st Qtr. | 4th Qtr. | 1st Qtr. | 1st Qtr. | 4th Qtr. | 1st Qtr. | 1st Qtr. | 4th Qtr. | 1st Qtr. | |||||||||||||||||||||||||||||||
| In millions of dollars, except rates | 2017 | 2016 | 2016 | 2017 | 2016 | 2016 | 2017 | 2016 | 2018 | 2017 | 2017 | 2018 | 2017 | 2017 | 2018 | 2017 | 2017 | |||||||||||||||||||||||||||||||
| Liabilities | ||||||||||||||||||||||||||||||||||||||||||||||||
| Deposits | ||||||||||||||||||||||||||||||||||||||||||||||||
In U.S. offices(4) | $ | 302,294 | $ | 293,969 | $ | 277,648 | $ | 507 | $ | 473 | $ | 316 | 0.68 | % | 0.64 | % | 0.46 | % | $ | 323,355 | $ | 319,448 | $ | 302,294 | $ | 897 | $ | 735 | $ | 507 | 1.13 | % | 0.91 | % | 0.68 | % | ||||||||||||
In offices outside the U.S.(5) | 428,743 | 424,902 | 424,055 | 908 | 874 | 888 | 0.86 | % | 0.82 | % | 0.84 | % | 446,416 | 440,686 | 428,743 | 1,100 | 1,059 | 908 | 1.00 | 0.95 | 0.86 | |||||||||||||||||||||||||||
| Total | $ | 731,037 | $ | 718,871 | $ | 701,703 | $ | 1,415 | $ | 1,347 | $ | 1,204 | 0.78 | % | 0.75 | % | 0.69 | % | $ | 769,771 | $ | 760,134 | $ | 731,037 | $ | 1,997 | $ | 1,794 | $ | 1,415 | 1.05 | % | 0.94 | % | 0.78 | % | ||||||||||||
Federal funds purchased and securities loaned or sold under agreements to repurchase(6) | ||||||||||||||||||||||||||||||||||||||||||||||||
| In U.S. offices | $ | 94,461 | $ | 94,922 | $ | 103,523 | $ | 282 | $ | 237 | $ | 260 | 1.21 | % | 0.99 | % | 1.01 | % | $ | 99,015 | $ | 95,780 | $ | 94,461 | $ | 604 | $ | 473 | $ | 282 | 2.47 | % | 1.96 | % | 1.21 | % | ||||||||||||
In offices outside the U.S.(5) | 54,425 | 55,215 | 59,392 | 211 | 187 | 242 | 1.57 | % | 1.35 | % | 1.64 | % | 65,450 | 67,058 | 54,425 | 345 | 307 | 211 | 2.14 | 1.82 | 1.57 | |||||||||||||||||||||||||||
| Total | $ | 148,886 | $ | 150,137 | $ | 162,915 | $ | 493 | $ | 424 | $ | 502 | 1.34 | % | 1.12 | % | 1.24 | % | $ | 164,465 | $ | 162,838 | $ | 148,886 | $ | 949 | $ | 780 | $ | 493 | 2.34 | % | 1.90 | % | 1.34 | |||||||||||||
Trading account liabilities(7)(8) | ||||||||||||||||||||||||||||||||||||||||||||||||
| In U.S. offices | $ | 32,215 | $ | 33,266 | $ | 23,636 | $ | 84 | $ | 61 | $ | 52 | 1.06 | % | 0.73 | % | 0.88 | % | $ | 33,996 | $ | 34,473 | $ | 32,215 | $ | 127 | $ | 111 | $ | 84 | 1.52 | % | 1.28 | % | 1.06 | % | ||||||||||||
In offices outside the U.S.(5) | 59,667 | 48,404 | 41,676 | 63 | 63 | 36 | 0.43 | % | 0.52 | % | 0.35 | % | 57,725 | 55,012 | 59,667 | 88 | 65 | 63 | 0.62 | 0.47 | 0.43 | |||||||||||||||||||||||||||
| Total | $ | 91,882 | $ | 81,670 | $ | 65,312 | $ | 147 | $ | 124 | $ | 88 | 0.65 | % | 0.60 | % | 0.54 | % | $ | 91,721 | $ | 89,485 | $ | 91,882 | $ | 215 | $ | 176 | $ | 147 | 0.95 | % | 0.78 | % | 0.65 | % | ||||||||||||
Short-term borrowings(9) | ||||||||||||||||||||||||||||||||||||||||||||||||
| In U.S. offices | $ | 71,607 | $ | 71,381 | $ | 56,834 | $ | 85 | $ | 79 | $ | 29 | 0.48 | % | 0.44 | % | 0.21 | % | $ | 89,202 | $ | 81,994 | $ | 71,607 | $ | 389 | $ | 262 | $ | 85 | 1.77 | % | 1.27 | % | 0.48 | % | ||||||||||||
In offices outside the U.S.(5) | 24,006 | 23,554 | 22,642 | 114 | 98 | 71 | 1.93 | % | 1.66 | % | 1.26 | % | 23,482 | 23,345 | 24,006 | 82 | 78 | 114 | 1.42 | 1.33 | 1.93 | |||||||||||||||||||||||||||
| Total | $ | 95,613 | $ | 94,935 | $ | 79,476 | $ | 199 | $ | 177 | $ | 100 | 0.84 | % | 0.74 | % | 0.51 | % | $ | 112,684 | $ | 105,339 | $ | 95,613 | $ | 471 | $ | 340 | $ | 199 | 1.70 | % | 1.28 | % | 0.84 | % | ||||||||||||
Long-term debt(10) | ||||||||||||||||||||||||||||||||||||||||||||||||
| In U.S. offices | $ | 178,656 | $ | 178,006 | $ | 172,429 | $ | 1,255 | $ | 1,148 | $ | 995 | 2.85 | % | 2.57 | % | 2.32 | % | $ | 199,924 | $ | 203,282 | $ | 178,656 | $ | 1,482 | $ | 1,389 | $ | 1,255 | 3.01 | % | 2.71 | % | 2.85 | % | ||||||||||||
In offices outside the U.S.(5) | 5,313 | 5,631 | 6,854 | 57 | 57 | 51 | 4.35 | % | 4.03 | % | 2.99 | % | 4,353 | 4,316 | 5,313 | 46 | 58 | 57 | 4.29 | % | 5.33 | 4.35 | ||||||||||||||||||||||||||
| Total | $ | 183,969 | $ | 183,637 | $ | 179,283 | $ | 1,312 | $ | 1,205 | $ | 1,046 | 2.89 | % | 2.61 | % | 2.35 | % | $ | 204,277 | $ | 207,598 | $ | 183,969 | $ | 1,528 | $ | 1,447 | $ | 1,312 | 3.03 | % | 2.77 | % | 2.89 | % | ||||||||||||
| Total interest-bearing liabilities | $ | 1,251,387 | $ | 1,229,250 | $ | 1,188,689 | $ | 3,566 | $ | 3,277 | $ | 2,940 | 1.16 | % | 1.06 | % | 0.99 | % | $ | 1,342,918 | $ | 1,325,394 | $ | 1,251,387 | $ | 5,160 | $ | 4,537 | $ | 3,566 | 1.56 | % | 1.36 | % | 1.16 | % | ||||||||||||
| Demand deposits in U.S. offices | $ | 37,748 | $ | 41,699 | $ | 31,336 | $ | 35,528 | $ | 37,102 | $ | 37,748 | ||||||||||||||||||||||||||||||||||||
Other non-interest-bearing liabilities(7) | 314,106 | 319,567 | 332,065 | 324,002 | 323,701 | 309,528 | ||||||||||||||||||||||||||||||||||||||||||
| Total liabilities | $ | 1,603,241 | $ | 1,590,516 | $ | 1,552,090 | $ | 1,702,448 | $ | 1,686,197 | $ | 1,598,663 | ||||||||||||||||||||||||||||||||||||
Citigroup stockholders’ equity(11) | $ | 226,312 | $ | 228,218 | $ | 224,320 | ||||||||||||||||||||||||||||||||||||||||||
| Citigroup stockholders’ equity | $ | 200,833 | $ | 222,544 | $ | 230,890 | ||||||||||||||||||||||||||||||||||||||||||
| Noncontrolling interest | 1,001 | 1,068 | 1,161 | 942 | 958 | 1,001 | ||||||||||||||||||||||||||||||||||||||||||
Total equity(11) | $ | 227,313 | $ | 229,286 | $ | 225,481 | ||||||||||||||||||||||||||||||||||||||||||
| Total equity | $ | 201,775 | $ | 223,502 | $ | 231,891 | ||||||||||||||||||||||||||||||||||||||||||
| Total liabilities and stockholders’ equity | $ | 1,830,554 | $ | 1,819,802 | $ | 1,777,571 | $ | 1,904,223 | $ | 1,909,699 | $ | 1,830,554 | ||||||||||||||||||||||||||||||||||||
Net interest revenue as a percentage of average interest-earning assets(12) | ||||||||||||||||||||||||||||||||||||||||||||||||
Net interest revenue as a percentage of average interest-earning assets(11) | ||||||||||||||||||||||||||||||||||||||||||||||||
| In U.S. offices | $ | 959,115 | $ | 960,324 | $ | 940,526 | $ | 6,837 | $ | 7,105 | $ | 6,953 | 2.89 | % | 2.94 | % | 2.97 | % | $ | 973,752 | $ | 990,391 | $ | 959,115 | $ | 6,717 | $ | 6,965 | $ | 6,763 | 2.80 | % | 2.79 | % | 2.86 | % | ||||||||||||
In offices outside the U.S.(6) | 665,962 | 647,123 | 622,102 | 4,143 | 4,169 | 4,393 | 2.52 | 2.56 | 2.84 | 754,484 | 722,005 | 665,962 | 4,519 | 4,476 | 4,315 | 2.43 | 2.46 | 2.63 | % | |||||||||||||||||||||||||||||
| Total | $ | 1,625,077 | $ | 1,607,447 | $ | 1,562,628 | $ | 10,980 | $ | 11,274 | $ | 11,346 | 2.74 | % | 2.79 | % | 2.92 | % | $ | 1,728,236 | $ | 1,712,396 | $ | 1,625,077 | $ | 11,236 | $ | 11,441 | $ | 11,078 | 2.64 | % | 2.65 | % | 2.76 | % | ||||||||||||
| (1) | Net interest revenue includes the taxable equivalent adjustments related to the tax-exempt bond portfolio (based on the U.S. federal statutory tax |
| (2) | Interest rates and amounts include the effects of risk management activities associated with the respective liability categories. |
| (3) | Monthly or quarterly averages have been used by certain subsidiaries where daily averages are unavailable. |
| (4) | Consists of other time deposits and savings deposits. Savings deposits are made up of insured money market accounts, NOW accounts and other savings deposits. The interest expense on savings deposits includes FDIC deposit insurance assessments. |
| (5) | Average rates reflect prevailing local interest rates, including inflationary effects and monetary corrections in certain countries. |
| (6) | Average volumes of securities sold under agreements to repurchase are reported net pursuant to ASC 210-20-45. However, Interest expense excludes the impact of ASC 210-20-45. |
| (7) | The fair value carrying amounts of derivative contracts are reported net, pursuant to ASC 815-10-45, in Non-interest-earning assets and Other non-interest-bearing liabilities. |
| (8) | Interest expense on Trading account liabilities of ICG is reported as a reduction of Interest revenue. Interest revenue and Interest expense on cash collateral positions are reported in interest on Trading account assets and Trading account liabilities, respectively. |
| (9) | Includes brokerage payables. |
| (10) | Excludes hybrid financial instruments and beneficial interests in consolidated VIEs that are classified as Long-term debt, as |
| (11) |
| Includes allocations for capital and funding costs based on the location of the asset. |
| 1st Qtr. 2017 vs. 4th Qtr. 2016 | 1st Qtr. 2017 vs. 1st Qtr. 2016 | 1st Qtr. 2018 vs. 4th Qtr. 2017 | 1st Qtr. 2018 vs. 1st Qtr. 2017 | |||||||||||||||||||||||||||||||||
Increase (decrease) due to change in: | Increase (decrease) due to change in: | Increase (decrease) due to change in: | Increase (decrease) due to change in: | |||||||||||||||||||||||||||||||||
| In millions of dollars | Average volume | Average rate | Net change | Average volume | Average rate | Net change | Average volume | Average rate | Net change | Average volume | Average rate | Net change | ||||||||||||||||||||||||
Deposits with banks(4) | $ | 22 | $ | 5 | $ | 27 | $ | 70 | $ | 6 | $ | 76 | $ | (23 | ) | $ | (24 | ) | $ | (47 | ) | $ | 33 | $ | 104 | $ | 137 | |||||||||
Federal funds sold and securities borrowed or purchased under agreements to resell | ||||||||||||||||||||||||||||||||||||
| In U.S. offices | $ | (4 | ) | $ | 12 | $ | 8 | $ | (15 | ) | $ | 9 | $ | (6 | ) | $ | 1 | $ | 154 | $ | 155 | $ | (10 | ) | $ | 355 | $ | 345 | ||||||||
In offices outside the U.S.(4) | 37 | 20 | 57 | 75 | (55 | ) | 20 | 12 | (29 | ) | (17 | ) | 31 | 2 | 33 | |||||||||||||||||||||
| Total | $ | 33 | $ | 32 | $ | 65 | $ | 60 | $ | (46 | ) | $ | 14 | $ | 13 | $ | 125 | $ | 138 | $ | 21 | $ | 357 | $ | 378 | |||||||||||
Trading account assets(5) | ||||||||||||||||||||||||||||||||||||
| In U.S. offices | $ | 13 | $ | (85 | ) | $ | (72 | ) | $ | (28 | ) | $ | (41 | ) | $ | (69 | ) | $ | (7 | ) | $ | 24 | $ | 17 | $ | (38 | ) | $ | 23 | $ | (15 | ) | ||||
In offices outside the U.S.(4) | (1 | ) | 9 | 8 | 19 | (114 | ) | (95 | ) | 23 | (4 | ) | 19 | 107 | (18 | ) | 89 | |||||||||||||||||||
| Total | $ | 12 | $ | (76 | ) | $ | (64 | ) | $ | (9 | ) | $ | (155 | ) | $ | (164 | ) | $ | 16 | $ | 20 | $ | 36 | $ | 69 | $ | 5 | $ | 74 | |||||||
Investments(1) | ||||||||||||||||||||||||||||||||||||
| In U.S. offices | $ | 4 | $ | 35 | $ | 39 | $ | (40 | ) | $ | 101 | $ | 61 | $ | (13 | ) | $ | 14 | $ | 1 | $ | 36 | $ | 128 | $ | 164 | ||||||||||
In offices outside the U.S.(4) | 7 | 10 | 17 | 25 | 10 | 35 | 13 | 9 | 22 | (14 | ) | 102 | 88 | |||||||||||||||||||||||
| Total | $ | 11 | $ | 45 | $ | 56 | $ | (15 | ) | $ | 111 | $ | 96 | $ | — | $ | 23 | $ | 23 | $ | 22 | $ | 230 | $ | 252 | |||||||||||
Loans (net of unearned income)(6) | ||||||||||||||||||||||||||||||||||||
| In U.S. offices | $ | (77 | ) | $ | 48 | $ | (29 | ) | $ | 294 | $ | 106 | $ | 400 | $ | 41 | $ | 63 | $ | 104 | $ | 225 | $ | 234 | $ | 459 | ||||||||||
In offices outside the U.S.(4) | 27 | (61 | ) | (34 | ) | (91 | ) | (113 | ) | (204 | ) | 170 | (53 | ) | 117 | 461 | (79 | ) | 382 | |||||||||||||||||
| Total | $ | (50 | ) | $ | (13 | ) | $ | (63 | ) | $ | 203 | $ | (7 | ) | $ | 196 | $ | 211 | $ | 10 | $ | 221 | $ | 686 | $ | 155 | $ | 841 | ||||||||
Other interest-earning assets(7) | $ | (30 | ) | $ | 4 | $ | (26 | ) | $ | 2 | $ | 40 | $ | 42 | $ | 14 | $ | 33 | $ | 47 | $ | 54 | $ | 16 | $ | 70 | ||||||||||
| Total interest revenue | $ | (2 | ) | $ | (3 | ) | $ | (5 | ) | $ | 311 | $ | (51 | ) | $ | 260 | $ | 231 | $ | 187 | $ | 418 | $ | 885 | $ | 867 | $ | 1,752 | ||||||||
| (1) | The taxable equivalent adjustment is related to the tax-exempt bond portfolio based on the U.S. federal statutory tax |
| (2) | Rate/volume variance is allocated based on the percentage relationship of changes in volume and changes in rate to the total net change. |
| (3) | Detailed average volume, Interest revenue and Interest expense exclude Discontinued operations. See Note 2 to the Consolidated Financial Statements. |
| (4) | Changes in average rates reflect changes in prevailing local interest rates, including inflationary effects and monetary corrections in certain countries. |
| (5) | Interest expense on Trading account liabilities of ICG is reported as a reduction of Interest revenue. Interest revenue and Interest expense on cash collateral positions are reported in interest on Trading account assets and Trading account liabilities, respectively. |
| (6) | Includes cash-basis loans. |
| (7) | Includes brokerage receivables. |
| 1st Qtr. 2017 vs. 4th Qtr. 2016 | 1st Qtr. 2017 vs. 1st Qtr. 2016 | 1st Qtr. 2018 vs. 4th Qtr. 2017 | 1st Qtr. 2018 vs. 1st Qtr. 2017 | |||||||||||||||||||||||||||||||||
Increase (decrease) due to change in: | Increase (decrease) due to change in: | Increase (decrease) due to change in: | Increase (decrease) due to change in: | |||||||||||||||||||||||||||||||||
| In millions of dollars | Average volume | Average rate | Net change | Average volume | Average rate | Net change | Average volume | Average rate | Net change | Average volume | Average rate | Net change | ||||||||||||||||||||||||
| Deposits | ||||||||||||||||||||||||||||||||||||
| In U.S. offices | $ | 14 | $ | 20 | $ | 34 | $ | 30 | $ | 161 | $ | 191 | $ | 9 | $ | 153 | $ | 162 | $ | 38 | $ | 352 | $ | 390 | ||||||||||||
In offices outside the U.S.(4) | 8 | 26 | 34 | 10 | 10 | 20 | 14 | 27 | 41 | 39 | 153 | 192 | ||||||||||||||||||||||||
| Total | $ | 22 | $ | 46 | $ | 68 | $ | 40 | $ | 171 | $ | 211 | $ | 23 | $ | 180 | $ | 203 | $ | 77 | $ | 505 | $ | 582 | ||||||||||||
| Federal funds purchased and securities loaned or sold under agreements to repurchase | ||||||||||||||||||||||||||||||||||||
| In U.S. offices | $ | (1 | ) | $ | 46 | $ | 45 | $ | (24 | ) | $ | 46 | $ | 22 | $ | 16 | $ | 115 | $ | 131 | $ | 14 | $ | 308 | $ | 322 | ||||||||||
In offices outside the U.S.(4) | (3 | ) | 27 | 24 | (20 | ) | (11 | ) | (31 | ) | (8 | ) | 46 | 38 | 48 | 86 | 134 | |||||||||||||||||||
| Total | $ | (4 | ) | $ | 73 | $ | 69 | $ | (44 | ) | $ | 35 | $ | (9 | ) | $ | 8 | $ | 161 | $ | 169 | $ | 62 | $ | 394 | $ | 456 | |||||||||
Trading account liabilities(5) | ||||||||||||||||||||||||||||||||||||
| In U.S. offices | $ | (2 | ) | $ | 25 | $ | 23 | $ | 21 | $ | 11 | $ | 32 | $ | (2 | ) | $ | 18 | $ | 16 | $ | 5 | $ | 38 | $ | 43 | ||||||||||
In offices outside the U.S.(4) | 13 | (13 | ) | — | 18 | 9 | 27 | 3 | 20 | 23 | (2 | ) | 27 | 25 | ||||||||||||||||||||||
| Total | $ | 11 | $ | 12 | $ | 23 | $ | 39 | $ | 20 | $ | 59 | $ | 1 | $ | 38 | $ | 39 | $ | 3 | $ | 65 | $ | 68 | ||||||||||||
Short-term borrowings(6) | ||||||||||||||||||||||||||||||||||||
| In U.S. offices | $ | — | $ | 6 | $ | 6 | $ | 9 | $ | 47 | $ | 56 | $ | 25 | $ | 102 | $ | 127 | $ | 26 | $ | 278 | $ | 304 | ||||||||||||
In offices outside the U.S.(4) | 2 | 14 | 16 | 5 | 38 | 43 | — | 4 | 4 | (2 | ) | (30 | ) | (32 | ) | |||||||||||||||||||||
| Total | $ | 2 | $ | 20 | $ | 22 | $ | 14 | $ | 85 | $ | 99 | $ | 25 | $ | 106 | $ | 131 | $ | 24 | $ | 248 | $ | 272 | ||||||||||||
| Long-term debt | ||||||||||||||||||||||||||||||||||||
| In U.S. offices | $ | 4 | $ | 103 | $ | 107 | $ | 37 | $ | 223 | $ | 260 | $ | (23 | ) | $ | 116 | $ | 93 | $ | 155 | $ | 72 | $ | 227 | |||||||||||
In offices outside the U.S.(4) | (3 | ) | 3 | — | (13 | ) | 19 | 6 | — | (12 | ) | (12 | ) | (10 | ) | (1 | ) | (11 | ) | |||||||||||||||||
| Total | $ | 1 | $ | 106 | $ | 107 | $ | 24 | $ | 242 | $ | 266 | $ | (23 | ) | $ | 104 | $ | 81 | $ | 145 | $ | 71 | $ | 216 | |||||||||||
| Total interest expense | $ | 32 | $ | 257 | $ | 289 | $ | 73 | $ | 553 | $ | 626 | $ | 34 | $ | 589 | $ | 623 | $ | 311 | $ | 1,283 | $ | 1,594 | ||||||||||||
| Net interest revenue | $ | (34 | ) | $ | (260 | ) | $ | (294 | ) | $ | 238 | $ | (604 | ) | $ | (366 | ) | $ | 197 | $ | (402 | ) | $ | (205 | ) | $ | 574 | $ | (416 | ) | $ | 158 | ||||
| (1) | The taxable equivalent adjustment is related to the tax-exempt bond portfolio based on the U.S. federal statutory tax |
| (2) | Rate/volume variance is allocated based on the percentage relationship of changes in volume and changes in rate to the total net change. |
| (3) | Detailed average volume, Interest revenue and Interest expense exclude Discontinued operations. See Note 2 to the Consolidated Financial Statements. |
| (4) | Changes in average rates reflect changes in prevailing local interest rates, including inflationary effects and monetary corrections in certain countries. |
| (5) | Interest expense on Trading account liabilities of ICG is reported as a reduction of Interest revenue. Interest revenue and Interest expense on cash collateral positions are reported in interest on Trading account assets and Trading account liabilities, respectively. |
| (6) | Includes brokerage payables. |
| First Quarter | Fourth Quarter | First Quarter | First Quarter | Fourth Quarter | First Quarter | |||||||||||||||||||||||||||||||
| In millions of dollars | March 31, 2017 | 2017 Average | Dec. 31, 2016 | 2016 Average | March 31, 2016 | 2016 Average | March 31, 2018 | 2018 Average | December 31, 2017 | 2017 Average | March 31, 2017 | 2017 Average | ||||||||||||||||||||||||
| Interest rate | $ | 52 | $ | 48 | $ | 37 | $ | 33 | $ | 37 | $ | 41 | $ | 84 | $ | 68 | $ | 69 | $ | 68 | $ | 52 | $ | 48 | ||||||||||||
| Credit spread | 54 | 56 | 63 | 64 | 62 | $ | 64 | 52 | 49 | 54 | 45 | 54 | $ | 56 | ||||||||||||||||||||||
Covariance adjustment(1) | (17 | ) | (17 | ) | (17 | ) | (28 | ) | (29 | ) | (27 | ) | (24 | ) | (25 | ) | (25 | ) | (27 | ) | (17 | ) | (17 | ) | ||||||||||||
| Fully diversified interest rate and credit spread | $ | 89 | $ | 87 | $ | 83 | $ | 69 | $ | 70 | $ | 78 | $ | 112 | $ | 92 | $ | 98 | $ | 86 | $ | 89 | $ | 87 | ||||||||||||
| Foreign exchange | 16 | 24 | 32 | 23 | 25 | 29 | 33 | 30 | 25 | 26 | 16 | 24 | ||||||||||||||||||||||||
| Equity | 17 | 15 | 13 | 14 | 9 | 15 | 20 | 22 | 17 | 18 | 17 | 15 | ||||||||||||||||||||||||
| Commodity | 23 | 23 | 27 | 27 | 17 | 14 | 19 | 20 | 17 | 19 | 23 | 23 | ||||||||||||||||||||||||
Covariance adjustment(1) | (53 | ) | (63 | ) | (70 | ) | (62 | ) | (62 | ) | (56 | ) | (73 | ) | (71 | ) | (63 | ) | (64 | ) | (53 | ) | (63 | ) | ||||||||||||
Total trading VAR—all market risk factors, including general and specific risk (excluding credit portfolios)(2) | $ | 92 | $ | 86 | $ | 85 | $ | 71 | $ | 59 | $ | 80 | $ | 111 | $ | 93 | $ | 94 | $ | 85 | $ | 92 | $ | 86 | ||||||||||||
Specific risk-only component(3) | $ | — | $ | 2 | $ | 3 | $ | 5 | $ | 7 | $ | 7 | $ | 3 | $ | 3 | $ | — | $ | 2 | $ | — | $ | 2 | ||||||||||||
Total trading VAR—general market risk factors only (excluding credit portfolios)(2) | $ | 92 | $ | 84 | $ | 82 | $ | 66 | $ | 52 | $ | 73 | ||||||||||||||||||||||||
Total trading VAR—general market risk factors only (excluding credit portfolios) | $ | 108 | $ | 90 | $ | 94 | $ | 83 | $ | 92 | $ | 84 | ||||||||||||||||||||||||
Incremental impact of the credit portfolio(4) | $ | 15 | $ | 14 | $ | 20 | $ | 18 | $ | 29 | $ | 28 | $ | 5 | $ | 9 | $ | 11 | $ | 8 | $ | 15 | $ | 14 | ||||||||||||
| Total trading and credit portfolio VAR | $ | 107 | $ | 100 | $ | 105 | $ | 89 | $ | 88 | $ | 108 | $ | 116 | $ | 102 | $ | 105 | $ | 93 | $ | 107 | $ | 100 | ||||||||||||
| (1) | Covariance adjustment (also known as diversification benefit) equals the difference between the total VAR and the sum of the VARs tied to each individual risk type. The benefit reflects the fact that the risks within each and across risk types are not perfectly correlated and, consequently, the total VAR on a given day will be lower than the sum of the VARs relating to each individual risk type. The determination of the primary drivers of changes to the covariance adjustment is made by an examination of the impact of both model parameter and position changes. |
| (2) | The total trading VAR includes mark-to-market and certain fair value option trading positions in |
| (3) | The specific risk-only component represents the level of equity and fixed income issuer-specific risk embedded in VAR. |
| (4) | The credit portfolio is composed of mark-to-market positions associated with non-trading business units including Citi Treasury, the CVA relating to derivative counterparties and all associated CVA hedges. FVA and DVA are not included. The credit portfolio also includes hedges to the loan portfolio, fair value option loans and hedges to the leveraged finance pipeline within capital markets origination in ICG. |
| First Quarter | Fourth Quarter | First Quarter | First Quarter | Fourth Quarter | First Quarter | |||||||||||||||||||||||||||||||
| 2017 | 2016 | 2018 | 2017 | |||||||||||||||||||||||||||||||||
| In millions of dollars | Low | High | Low | High | Low | High | Low | High | Low | High | Low | High | ||||||||||||||||||||||||
| Interest rate | $ | 29 | $ | 70 | $ | 25 | $ | 45 | $ | 29 | $ | 64 | $ | 50 | $ | 89 | $ | 46 | $ | 89 | $ | 29 | $ | 70 | ||||||||||||
| Credit spread | 51 | 63 | 57 | 72 | 56 | 69 | 45 | 53 | 40 | 54 | 51 | 63 | ||||||||||||||||||||||||
| Fully diversified interest rate and credit spread | $ | 59 | $ | 109 | $ | 61 | $ | 83 | $ | 66 | $ | 97 | $ | 78 | $ | 117 | $ | 75 | $ | 101 | $ | 59 | $ | 109 | ||||||||||||
| Foreign exchange | 16 | 35 | 15 | 32 | 24 | 40 | 24 | 44 | 20 | 49 | 16 | 35 | ||||||||||||||||||||||||
| Equity | 6 | 25 | 7 | 25 | 9 | 24 | 16 | 32 | 12 | 27 | 6 | 25 | ||||||||||||||||||||||||
| Commodity | 18 | 30 | 21 | 33 | 10 | 18 | 16 | 23 | 13 | 27 | 18 | 30 | ||||||||||||||||||||||||
| Total trading | $ | 61 | $ | 107 | $ | 58 | $ | 85 | $ | 59 | $ | 106 | $ | 79 | $ | 118 | $ | 68 | $ | 101 | $ | 61 | $ | 107 | ||||||||||||
| Total trading and credit portfolio | 75 | 123 | 78 | 105 | 85 | 131 | 88 | 124 | 76 | 107 | 75 | 123 | ||||||||||||||||||||||||
| In millions of dollars | Mar. 31, 2017 | Mar. 31, 2018 | ||||
| Total—all market risk factors, including general and specific risk | $ | 91 | ||||
| Average—during quarter | $ | 81 | $ | 92 | ||
| High—during quarter | 95 | 119 | ||||
| Low—during quarter | 64 | 78 | ||||
| In billions of dollars | ICG loans(1) | GCB loans(2) | Other funded(3) | Unfunded(4) | Net MTM on derivatives/repos(5) | Total hedges (on loans and CVA) | Investment securities(6) | Trading account assets(7) | Total as of 1Q17 | Total as of 4Q16 | Total as of 1Q16 | ICG loans(1) | GCB loans | Other funded(3) | Unfunded(4) | Net MTM on derivatives/repos(5) | Total hedges (on loans and CVA) | Investment securities(6) | Trading account assets(7) | Total as of 1Q18 | Total as of 4Q17 | Total as of 1Q17 | Total as a % of Citi as of 1Q18 | |||||||||||||||||||||||||||||||||||||||||||||
| United Kingdom | $ | 31.4 | $ | — | $ | 3.4 | $ | 56.3 | $ | 11.5 | $ | (2.1 | ) | $ | 8.4 | $ | (0.3 | ) | $ | 108.6 | $ | 107.5 | $ | 103.5 | $ | 37.1 | $ | — | $ | 4.7 | $ | 68.7 | $ | 9.8 | $ | (2.4 | ) | $ | 6.4 | $ | 1.4 | $ | 125.7 | $ | 113.2 | $ | 108.6 | 7.8 | % | |||||||||||||||||||
| Mexico | 8.8 | 24.9 | 0.4 | 6.0 | 1.8 | (0.8 | ) | 14.0 | 4.0 | 59.1 | 52.4 | 61.1 | 9.9 | 26.9 | 0.3 | 7.1 | 0.8 | (0.6 | ) | 15.1 | 4.4 | 63.9 | 58.4 | 59.1 | 4.0 | |||||||||||||||||||||||||||||||||||||||||||
| Hong Kong | 13.7 | 10.3 | 0.7 | 8.1 | 1.3 | (0.7 | ) | 5.8 | 1.1 | 40.3 | 35.9 | 34.5 | 18.2 | 11.5 | 0.9 | 6.0 | 0.6 | (0.2 | ) | 6.2 | 2.7 | 45.9 | 42.2 | 40.3 | 2.9 | |||||||||||||||||||||||||||||||||||||||||||
| Singapore | 12.2 | 12.0 | 0.1 | 5.6 | 1.1 | (0.3 | ) | 8.5 | 0.6 | 39.8 | 36.4 | 37.2 | 15.4 | 12.4 | 0.3 | 4.8 | 1.3 | (0.2 | ) | 8.5 | 0.5 | 43.0 | 41.4 | 39.8 | 2.7 | |||||||||||||||||||||||||||||||||||||||||||
| Korea | 2.4 | 20.0 | 0.2 | 3.1 | 1.3 | (1.1 | ) | 9.0 | 0.9 | 35.8 | 35.3 | 36.0 | 2.2 | |||||||||||||||||||||||||||||||||||||||||||||||||||||||
| Ireland | 12.7 | — | 1.1 | 16.7 | 1.4 | — | — | 0.7 | 32.6 | 31.9 | 25.3 | 2.0 | ||||||||||||||||||||||||||||||||||||||||||||||||||||||||
| India | 10.6 | 6.4 | 0.7 | 7.5 | 3.0 | (1.3 | ) | 7.9 | 1.4 | 36.2 | 30.9 | 32.8 | 4.5 | 6.9 | 0.7 | 5.3 | 3.4 | (0.7 | ) | 9.0 | 2.6 | 31.7 | 30.3 | 36.2 | 2.0 | |||||||||||||||||||||||||||||||||||||||||||
| Korea | 2.5 | 19.5 | 0.4 | 3.6 | 1.5 | (1.0 | ) | 7.6 | 1.9 | 36.0 | 34.0 | 38.5 | ||||||||||||||||||||||||||||||||||||||||||||||||||||||||
| Brazil | 13.7 | 0.2 | 0.2 | 3.4 | 4.5 | (2.8 | ) | 3.5 | 4.3 | 27.0 | 26.8 | 27.8 | 11.9 | — | 0.1 | 3.3 | 5.4 | (1.5 | ) | 3.7 | 4.0 | 26.9 | 24.7 | 28.9 | 1.7 | |||||||||||||||||||||||||||||||||||||||||||
| Ireland | 8.2 | — | 0.7 | 15.7 | 0.3 | — | — | 0.4 | 25.3 | 24.8 | 24.5 | |||||||||||||||||||||||||||||||||||||||||||||||||||||||||
| Australia | 3.9 | 10.8 | 0.1 | 6.0 | 1.0 | (1.0 | ) | 4.1 | (1.0 | ) | 23.9 | 22.4 | 25.9 | 4.5 | 10.7 | — | 5.7 | 0.6 | (0.5 | ) | 2.9 | 0.7 | 24.6 | 25.2 | 23.9 | 1.5 | ||||||||||||||||||||||||||||||||||||||||||
| Taiwan | 4.5 | 8.4 | 0.1 | 1.1 | 0.7 | (0.2 | ) | 1.8 | 2.1 | 18.5 | 16.6 | 15.5 | 5.3 | 9.2 | 0.1 | 2.5 | 0.9 | — | 1.2 | 1.1 | 20.3 | 17.3 | 18.5 | 1.3 | ||||||||||||||||||||||||||||||||||||||||||||
| China | 8.6 | 4.9 | 0.3 | 1.8 | 1.7 | (0.7 | ) | 3.1 | 0.1 | 19.8 | 19.4 | 17.4 | 1.2 | |||||||||||||||||||||||||||||||||||||||||||||||||||||||
| Japan | 2.6 | — | 0.2 | 9.4 | 2.8 | (1.7 | ) | 3.8 | 1.2 | 18.3 | 18.3 | 11.1 | 3.2 | 0.1 | 0.1 | 2.4 | 5.6 | (1.3 | ) | 5.1 | 3.2 | 18.4 | 17.7 | 18.3 | 1.1 | |||||||||||||||||||||||||||||||||||||||||||
| Canada | 1.8 | 0.6 | 0.4 | 6.9 | 1.9 | (0.4 | ) | 4.0 | 0.4 | 15.6 | 16.3 | 15.0 | 1.0 | |||||||||||||||||||||||||||||||||||||||||||||||||||||||
| Germany | 0.1 | — | — | 3.9 | 5.1 | (2.9 | ) | 9.4 | 2.4 | 18.0 | 16.0 | 21.9 | 0.8 | — | — | 3.1 | 3.9 | (2.0 | ) | 9.7 | (0.8 | ) | 14.7 | 19.1 | 18.0 | 0.9 | ||||||||||||||||||||||||||||||||||||||||||
| China | 5.8 | 4.3 | 0.2 | 1.6 | 1.3 | (1.1 | ) | 4.3 | 1.0 | 17.4 | 17.2 | 22.9 | ||||||||||||||||||||||||||||||||||||||||||||||||||||||||
| Canada | 1.8 | 0.6 | 0.5 | 6.1 | 2.0 | (0.7 | ) | 4.6 | 0.1 | 15.0 | 17.0 | 17.4 | ||||||||||||||||||||||||||||||||||||||||||||||||||||||||
| Poland | 3.1 | 1.6 | — | 3.1 | 0.5 | (0.3 | ) | 4.1 | 0.1 | 12.2 | 11.8 | 14.8 | 3.8 | 2.0 | 0.1 | 3.1 | 0.4 | (0.1 | ) | 4.6 | 0.8 | 14.7 | 14.0 | 12.2 | 0.9 | |||||||||||||||||||||||||||||||||||||||||||
| United Arab Emirates | 6.4 | 1.5 | 0.1 | 3.0 | 0.2 | (0.1 | ) | — | (0.1 | ) | 11.0 | 7.0 | 5.9 | 0.7 | ||||||||||||||||||||||||||||||||||||||||||||||||||||||
| Malaysia | 1.3 | 4.3 | 0.3 | 1.5 | 0.2 | (0.1 | ) | 0.8 | 0.8 | 9.1 | 9.3 | 10.8 | 1.7 | 5.0 | 0.3 | 1.6 | 0.1 | (0.1 | ) | 0.9 | 0.5 | 10.0 | 10.0 | 9.1 | 0.6 | |||||||||||||||||||||||||||||||||||||||||||
| Netherlands | — | — | — | — | 4.1 | (0.6 | ) | 4.1 | (0.8 | ) | 6.8 | 5.1 | 6.8 | |||||||||||||||||||||||||||||||||||||||||||||||||||||||
| Jersey | 6.3 | — | 0.4 | 2.3 | — | — | — | — | 9.0 | 4.8 | 3.8 | 0.6 | ||||||||||||||||||||||||||||||||||||||||||||||||||||||||
| Thailand | 0.8 | 2.0 | — | 1.3 | 0.1 | — | 1.7 | 0.3 | 6.2 | 5.8 | 6.2 | 1.0 | 2.3 | — | 1.6 | 0.2 | — | 1.3 | 1.0 | 7.4 | 7.4 | 6.2 | 0.5 | |||||||||||||||||||||||||||||||||||||||||||||
| Indonesia | 2.1 | 1.1 | — | 1.3 | 0.3 | (0.1 | ) | 1.5 | 0.3 | 6.5 | 6.3 | 5.5 | 0.4 | |||||||||||||||||||||||||||||||||||||||||||||||||||||||
| Luxembourg | 0.1 | — | 0.1 | — | 0.5 | (0.4 | ) | 5.0 | 0.4 | 5.7 | 5.4 | 5.7 | 0.4 | |||||||||||||||||||||||||||||||||||||||||||||||||||||||
| Russia | 2.3 | 1.0 | — | 1.2 | 0.5 | (0.2 | ) | 0.9 | 0.3 | 6.0 | 5.3 | 5.1 | 1.9 | 1.0 | — | 1.2 | 0.1 | (0.1 | ) | 1.1 | 0.3 | 5.5 | 6.6 | 6.0 | 0.3 | |||||||||||||||||||||||||||||||||||||||||||
| United Arab Emirates | 3.1 | 1.4 | 0.1 | 1.5 | 0.4 | (0.4 | ) | — | (0.2 | ) | 5.9 | 6.0 | 6.4 | |||||||||||||||||||||||||||||||||||||||||||||||||||||||
| Colombia | 2.6 | 1.7 | — | 1.1 | 0.1 | (0.1 | ) | 0.5 | (0.1 | ) | 5.8 | 5.6 | 5.9 | |||||||||||||||||||||||||||||||||||||||||||||||||||||||
| Luxembourg | — | — | — | — | 0.6 | (0.3 | ) | 5.2 | 0.2 | 5.7 | 5.4 | 6.2 | ||||||||||||||||||||||||||||||||||||||||||||||||||||||||
| Indonesia | 1.7 | 1.1 | 0.1 | 1.2 | 0.2 | (0.2 | ) | 1.2 | 0.2 | 5.5 | 5.2 | 5.2 | ||||||||||||||||||||||||||||||||||||||||||||||||||||||||
| Chile | 1.8 | — | 2.0 | 0.1 | 0.2 | — | — | — | 4.1 | 4.0 | 3.8 | |||||||||||||||||||||||||||||||||||||||||||||||||||||||||
| Turkey | 2.9 | — | 0.4 | 0.4 | 0.3 | (0.2 | ) | 0.3 | (0.1 | ) | 4.0 | 3.9 | 4.8 | |||||||||||||||||||||||||||||||||||||||||||||||||||||||
Colombia(2) | 1.9 | 1.6 | — | 1.0 | — | — | 0.5 | — | 5.0 | 5.1 | 5.8 | 0.3 | ||||||||||||||||||||||||||||||||||||||||||||||||||||||||
| South Africa | 1.9 | — | — | 1.2 | 0.2 | (0.1 | ) | 1.3 | 0.2 | 4.7 | 4.3 | 3.5 | 0.3 | |||||||||||||||||||||||||||||||||||||||||||||||||||||||
| Argentina | 2.0 | — | — | 0.1 | 1.3 | (0.4 | ) | 0.2 | 1.1 | 4.3 | 4.2 | 2.7 | 0.3 | |||||||||||||||||||||||||||||||||||||||||||||||||||||||
| Total | 37.4 | % | ||||||||||||||||||||||||||||||||||||||||||||||||||||||||||||||||||
| (1) | ICG loans reflect funded corporate loans and private bank loans, net of unearned income. As of March 31, |
| (2) | GCBloans include funded loans in |
| (3) | Other funded includes other direct exposure such as accounts receivable, loans |
| (4) | Unfunded exposure includes unfunded corporate lending commitments, letters of credit and other contingencies. |
| (5) | Net mark-to-market |
| (6) | Investment securities include securities available-for-sale, recorded at fair market value, and securities held-to-maturity, recorded at historical cost. |
| (7) | Trading account assets are shown on a net basis and include issuer risk on cash products and derivative exposure where the underlying reference |
| Jurisdiction/Component | DTAs balance | DTAs balance | ||||||||||
| In billions of dollars | Mar. 31, 2017 | December 31, 2016 | March 31, 2018 | December 31, 2017 | ||||||||
| Total U.S. | $ | 43.8 | $ | 44.6 | $ | 20.3 | $ | 19.9 | ||||
| Total foreign | 2.1 | 2.1 | 2.7 | 2.6 | ||||||||
| Total | $ | 45.9 | $ | 46.7 | $ | 23.0 | $ | 22.5 | ||||
| CONSOLIDATED FINANCIAL STATEMENTS | |
Consolidated Statement of Income (Unaudited)— For the Three Months Ended March 31, | |
| Consolidated Statement of Comprehensive | |
| Consolidated Balance Sheet—March 31, | |
| Consolidated Statement of Changes in Stockholders’ | |
Consolidated Statement of Cash Flows (Unaudited)— For the Three Months Ended March 31, | |
| NOTES TO CONSOLIDATED FINANCIAL STATEMENTS (UNAUDITED) | |
| Note 1—Basis of Presentation and Accounting Changes | |
| Note 2—Discontinued Operations and Significant Disposals | |
| Note 3—Business Segments | |
| Note 4—Interest Revenue and Expense | |
Note 5—Commissions and Fees; Administration and Other Fiduciary Fees | |
| Note 6—Principal Transactions | |
| Note 7—Incentive Plans | |
| Note 8—Retirement Benefits | |
| Note 9—Earnings per Share | |
| Note 10—Federal Funds, Securities Borrowed, Loaned and Subject to Repurchase Agreements | |
| Note 11—Brokerage Receivables and Brokerage Payables | |
| Note 12—Investments | |
| Note 13—Loans | |
| Note 14—Allowance for Credit Losses | |
| Note 15—Goodwill and Intangible Assets | |
| Note 16—Debt | |
| Note 17—Changes in Accumulated Other Comprehensive Income (Loss) (AOCI) | |
| Note 18—Securitizations and Variable Interest Entities | |
| Note 19—Derivatives Activities | |
| Note 20—Fair Value Measurement | |
| Note 21—Fair Value Elections | |
| Note 22—Guarantees and Commitments | |
| Note 23—Contingencies | |
| Note 24—Condensed Consolidating Financial Statements | |
| CONSOLIDATED STATEMENT OF INCOME (UNAUDITED) | Citigroup Inc. and Subsidiaries | |
| Three Months Ended March 31, | ||||||
| In millions of dollars, except per share amounts | 2018 | 2017 | ||||
| Revenues | ||||||
| Interest revenue | $ | 16,332 | $ | 14,521 | ||
| Interest expense | 5,160 | 3,566 | ||||
| Net interest revenue | $ | 11,172 | $ | 10,955 | ||
| Commissions and fees | $ | 3,030 | $ | 3,055 | ||
| Principal transactions | 3,289 | 3,094 | ||||
| Administration and other fiduciary fees | 905 | 834 | ||||
| Realized gains on sales of investments, net | 170 | 192 | ||||
| Impairment losses on investments | ||||||
| Gross impairment losses | (28 | ) | (12 | ) | ||
| Less: Impairments recognized in AOCI | — | — | ||||
| Net impairment losses recognized in earnings | $ | (28 | ) | $ | (12 | ) |
| Other revenue | $ | 334 | $ | 248 | ||
| Total non-interest revenues | $ | 7,700 | $ | 7,411 | ||
| Total revenues, net of interest expense | $ | 18,872 | $ | 18,366 | ||
| Provisions for credit losses and for benefits and claims | ||||||
| Provision for loan losses | $ | 1,803 | $ | 1,675 | ||
| Policyholder benefits and claims | 26 | 30 | ||||
| Release for unfunded lending commitments | 28 | (43 | ) | |||
| Total provisions for credit losses and for benefits and claims | $ | 1,857 | $ | 1,662 | ||
| Operating expenses | ||||||
| Compensation and benefits | $ | 5,807 | $ | 5,534 | ||
| Premises and equipment | 593 | 620 | ||||
| Technology/communication | 1,758 | 1,663 | ||||
| Advertising and marketing | 381 | 373 | ||||
| Other operating | 2,386 | 2,533 | ||||
| Total operating expenses | $ | 10,925 | $ | 10,723 | ||
| Income from continuing operations before income taxes | $ | 6,090 | $ | 5,981 | ||
| Provision for income taxes | 1,441 | 1,863 | ||||
| Income from continuing operations | $ | 4,649 | $ | 4,118 | ||
| Discontinued operations | ||||||
| Loss from discontinued operations | $ | (7 | ) | $ | (28 | ) |
| Benefit for income taxes | — | (10 | ) | |||
| Loss from discontinued operations, net of taxes | $ | (7 | ) | $ | (18 | ) |
| Net income before attribution of noncontrolling interests | $ | 4,642 | $ | 4,100 | ||
| Noncontrolling interests | 22 | 10 | ||||
| Citigroup’s net income | $ | 4,620 | $ | 4,090 | ||
Basic earnings per share(1) | ||||||
| Income from continuing operations | $ | 1.68 | $ | 1.36 | ||
| Income (loss) from discontinued operations, net of taxes | — | (0.01 | ) | |||
| Net income | $ | 1.68 | $ | 1.35 | ||
| Weighted average common shares outstanding | 2,561.6 | 2,765.3 | ||||
| Three months ended March 31, | ||||||
| In millions of dollars, except per share amounts | 2017 | 2016 | ||||
| Revenues | ||||||
| Interest revenue | $ | 14,423 | $ | 14,167 | ||
| Interest expense | 3,566 | 2,940 | ||||
| Net interest revenue | $ | 10,857 | $ | 11,227 | ||
| Commissions and fees | $ | 2,759 | $ | 2,463 | ||
| Principal transactions | 3,022 | 1,840 | ||||
| Administration and other fiduciary fees | 893 | 811 | ||||
| Realized gains on sales of investments, net | 192 | 186 | ||||
| Other-than-temporary impairment losses on investments | ||||||
| Gross impairment losses | (12 | ) | (465 | ) | ||
| Less: Impairments recognized in AOCI | — | — | ||||
| Net impairment losses recognized in earnings | $ | (12 | ) | $ | (465 | ) |
| Insurance premiums | $ | 169 | $ | 264 | ||
| Other revenue | 240 | 1,229 | ||||
| Total non-interest revenues | $ | 7,263 | $ | 6,328 | ||
| Total revenues, net of interest expense | $ | 18,120 | $ | 17,555 | ||
| Provisions for credit losses and for benefits and claims | ||||||
| Provision for loan losses | $ | 1,675 | $ | 1,886 | ||
| Policyholder benefits and claims | 30 | 88 | ||||
| Provision (release) for unfunded lending commitments | (43 | ) | 71 | |||
| Total provisions for credit losses and for benefits and claims | $ | 1,662 | $ | 2,045 | ||
| Operating expenses | ||||||
| Compensation and benefits | $ | 5,534 | $ | 5,556 | ||
| Premises and equipment | 620 | 651 | ||||
| Technology/communication | 1,659 | 1,649 | ||||
| Advertising and marketing | 373 | 390 | ||||
| Other operating | 2,291 | 2,277 | ||||
| Total operating expenses | $ | 10,477 | $ | 10,523 | ||
| Income from continuing operations before income taxes | $ | 5,981 | $ | 4,987 | ||
| Provision for income taxes | 1,863 | 1,479 | ||||
| Income from continuing operations | $ | 4,118 | $ | 3,508 | ||
| Discontinued operations | ||||||
| Loss from discontinued operations | $ | (28 | ) | $ | (3 | ) |
| Benefit for income taxes | (10 | ) | (1 | ) | ||
| Loss from discontinued operations, net of taxes | $ | (18 | ) | $ | (2 | ) |
| Net income before attribution of noncontrolling interests | $ | 4,100 | $ | 3,506 | ||
| Noncontrolling interests | 10 | 5 | ||||
| Citigroup’s net income | $ | 4,090 | $ | 3,501 | ||
Basic earnings per share(1) | ||||||
| Income from continuing operations | $ | 1.36 | $ | 1.11 | ||
| Loss from discontinued operations, net of taxes | (0.01 | ) | — | |||
| Net income | $ | 1.35 | $ | 1.10 | ||
| Weighted average common shares outstanding | 2,765.3 | 2,943.0 | ||||
Diluted earnings per share(1) | ||||||||||||
| Income from continuing operations | $ | 1.36 | $ | 1.11 | $ | 1.68 | $ | 1.36 | ||||
| Loss from discontinued operations, net of taxes | (0.01 | ) | — | |||||||||
| Income (loss) from discontinued operations, net of taxes | — | (0.01 | ) | |||||||||
| Net income | $ | 1.35 | $ | 1.10 | $ | 1.68 | $ | 1.35 | ||||
| Adjusted weighted average common shares outstanding | 2,765.5 | 2,943.1 | 2,563.0 | 2,765.5 | ||||||||
| (1) | Due to rounding, earnings per share on continuing operations and discontinued operations may not sum to earnings per share on net income. |
| CONSOLIDATED STATEMENT OF COMPREHENSIVE INCOME | Citigroup Inc. and Subsidiaries | |
| (UNAUDITED) | ||
| Three months ended March 31, | Three Months Ended March 31, | |||||||||||
| In millions of dollars | 2017 | 2016 | 2018 | 2017 | ||||||||
| Citigroup's net income | $ | 4,090 | $ | 3,501 | ||||||||
| Citigroup’s net income | $ | 4,620 | $ | 4,090 | ||||||||
| Add: Citigroup's other comprehensive income | ||||||||||||
| Net change in unrealized gains and losses on investment securities, net of taxes | $ | 220 | $ | 2,034 | ||||||||
Net change in unrealized gains and losses on investment securities, net of taxes(1)(2) | $ | (1,058 | ) | $ | 220 | |||||||
Net change in debt valuation adjustment (DVA), net of taxes (1) | (60 | ) | 193 | 128 | (60 | ) | ||||||
| Net change in cash flow hedges, net of taxes | (2 | ) | 317 | (222 | ) | (2 | ) | |||||
| Benefit plans liability adjustment, net of taxes | (12 | ) | (465 | ) | 88 | (12 | ) | |||||
| Net change in foreign currency translation adjustment, net of taxes and hedges | 1,318 | 654 | 1,120 | 1,318 | ||||||||
Net change in excluded component of fair value hedges, net of taxes | (4 | ) | — | |||||||||
| Citigroup’s total other comprehensive income | $ | 1,464 | $ | 2,733 | $ | 52 | $ | 1,464 | ||||
| Citigroup’s total comprehensive income | $ | 5,554 | $ | 6,234 | $ | 4,672 | $ | 5,554 | ||||
| Add: Other comprehensive income attributable to noncontrolling interests | $ | 31 | $ | 27 | $ | 14 | $ | 31 | ||||
| Add: Net income attributable to noncontrolling interests | 10 | 5 | 22 | 10 | ||||||||
| Total comprehensive income | $ | 5,595 | $ | 6,266 | $ | 4,708 | $ | 5,595 | ||||
| (1) | See Note 1 to the Consolidated Financial Statements. |
| (2) | For the three months ended March 31, 2018, amount represents the net change in unrealized gains and losses on available-for-sale (AFS) debt securities. Effective January 1, 2018, the AFS category is eliminated for equity securities under ASU 2016-01. |
| CONSOLIDATED BALANCE SHEET | Citigroup Inc. and Subsidiaries | |
| March 31, | March 31, | |||||||||||
| 2017 | December 31, | 2018 | December 31, | |||||||||
| In millions of dollars | (Unaudited) | 2016 | (Unaudited) | 2017 | ||||||||
| Assets | ||||||||||||
| Cash and due from banks (including segregated cash and other deposits) | $ | 22,272 | $ | 23,043 | $ | 21,850 | $ | 23,775 | ||||
| Deposits with banks | 157,773 | 137,451 | 180,854 | 156,741 | ||||||||
| Federal funds sold and securities borrowed or purchased under agreements to resell (including $137,360 and $133,204 as of March 31, 2017 and December 31, 2016, respectively, at fair value) | 242,929 | 236,813 | ||||||||||
| Federal funds sold and securities borrowed or purchased under agreements to resell (including $161,537 and $132,949 as of March 31, 2018 and December 31, 2017, respectively, at fair value) | 257,887 | 232,478 | ||||||||||
| Brokerage receivables | 36,888 | 28,887 | 46,572 | 38,384 | ||||||||
| Trading account assets (including $82,157 and $80,986 pledged to creditors at March 31, 2017 and December 31, 2016, respectively) | 244,903 | 243,925 | ||||||||||
| Trading account assets (including $107,399 and $99,460 pledged to creditors at March 31, 2018 and December 31, 2017, respectively) | 268,808 | 252,790 | ||||||||||
| Investments: | ||||||||||||
| Available for sale (including $8,115 and $8,239 pledged to creditors as of March 31, 2017 and December 31, 2016, respectively) | 290,282 | 299,424 | ||||||||||
| Held to maturity (including $898 and $843 pledged to creditors as of March 31, 2017 and December 31, 2016, respectively) | 47,942 | 45,667 | ||||||||||
| Non-marketable equity securities (including $1,529 and $1,774 at fair value as of March 31, 2017 and December 31, 2016, respectively) | 7,609 | 8,213 | ||||||||||
| Available-for-sale debt securities (including $14,312 and $9,493 pledged to creditors as of March 31, 2018 and December 31, 2017, respectively) | 291,523 | 290,725 | ||||||||||
| Held-to-maturity debt securities (including $1,063 and $435 pledged to creditors as of March 31, 2018 and December 31, 2017, respectively) | 52,492 | 53,320 | ||||||||||
| Equity securities (including $1,569 and $1,395 at fair value as of March 31, 2018 and December 31, 2017, respectively, of which $189 was available for sale as of December 31, 2017) | 7,956 | 8,245 | ||||||||||
| Total investments | $ | 345,833 | $ | 353,304 | $ | 351,971 | $ | 352,290 | ||||
| Loans: | ||||||||||||
| Consumer (including $28 and $29 as of March 31, 2017 and December 31, 2016, respectively, at fair value) | 320,556 | 325,063 | ||||||||||
| Corporate (including $4,007 and $3,457 as of March 31, 2017 and December 31, 2016, respectively, at fair value) | 308,039 | 299,306 | ||||||||||
| Consumer (including $23 and $25 as of March 31, 2018 and December 31, 2017, respectively, at fair value) | 325,084 | 333,656 | ||||||||||
| Corporate (including $4,513 and $4,349 as of March 31, 2018 and December 31, 2017, respectively, at fair value) | 347,854 | 333,378 | ||||||||||
| Loans, net of unearned income | $ | 628,595 | $ | 624,369 | $ | 672,938 | $ | 667,034 | ||||
| Allowance for loan losses | (12,030 | ) | (12,060 | ) | (12,354 | ) | (12,355 | ) | ||||
| Total loans, net | $ | 616,565 | $ | 612,309 | $ | 660,584 | $ | 654,679 | ||||
| Goodwill | 22,265 | 21,659 | 22,659 | 22,256 | ||||||||
| Intangible assets (other than MSRs) | 5,013 | 5,114 | 4,450 | 4,588 | ||||||||
| Mortgage servicing rights (MSRs) | 567 | 1,564 | 587 | 558 | ||||||||
| Other assets (including $17,281 and $15,729 as of March 31, 2017 and December 31, 2016, respectively, at fair value) | 126,627 | 128,008 | ||||||||||
| Other assets (including $20,443 and $18,559 as of March 31, 2018 and December 31, 2017, respectively, at fair value) | 105,882 | 103,926 | ||||||||||
| Total assets | $ | 1,821,635 | $ | 1,792,077 | $ | 1,922,104 | $ | 1,842,465 | ||||
| March 31, | March 31, | |||||||||||
| 2017 | December 31, | 2018 | December 31, | |||||||||
| In millions of dollars | (Unaudited) | 2016 | (Unaudited) | 2017 | ||||||||
| Assets of consolidated VIEs to be used to settle obligations of consolidated VIEs | ||||||||||||
| Cash and due from banks | $ | 65 | $ | 142 | $ | 34 | $ | 52 | ||||
| Trading account assets | 1,031 | 602 | 1,582 | 1,129 | ||||||||
| Investments | 3,397 | 3,636 | 2,492 | 2,498 | ||||||||
| Loans, net of unearned income | ||||||||||||
| Consumer | 49,815 | 53,401 | 50,256 | 54,656 | ||||||||
| Corporate | 19,556 | 20,121 | 19,516 | 19,835 | ||||||||
| Loans, net of unearned income | $ | 69,371 | $ | 73,522 | $ | 69,772 | $ | 74,491 | ||||
| Allowance for loan losses | (1,860 | ) | (1,769 | ) | (1,923 | ) | (1,930 | ) | ||||
| Total loans, net | $ | 67,511 | $ | 71,753 | $ | 67,849 | $ | 72,561 | ||||
| Other assets | 165 | 158 | 159 | 154 | ||||||||
| Total assets of consolidated VIEs to be used to settle obligations of consolidated VIEs | $ | 72,169 | $ | 76,291 | $ | 72,116 | $ | 76,394 | ||||
| March 31, | March 31, | |||||||||||
| 2017 | December 31, | 2018 | December 31, | |||||||||
| In millions of dollars, except shares and per share amounts | (Unaudited) | 2016 | (Unaudited) | 2017 | ||||||||
| Liabilities | ||||||||||||
| Non-interest-bearing deposits in U.S. offices | $ | 129,436 | $ | 136,698 | $ | 125,332 | $ | 126,880 | ||||
| Interest-bearing deposits in U.S. offices (including $351 and $434 as of March 31, 2017 and December 31, 2016, respectively, at fair value) | 310,572 | 300,972 | ||||||||||
| Interest-bearing deposits in U.S. offices (including $300 and $303 as of March 31, 2018 and December 31, 2017, respectively, at fair value) | 327,872 | 318,613 | ||||||||||
| Non-interest-bearing deposits in offices outside the U.S. | 79,063 | 77,616 | 90,477 | 87,440 | ||||||||
| Interest-bearing deposits in offices outside the U.S. (including $956 and $778 as of March 31, 2017 and December 31, 2016, respectively, at fair value) | 430,919 | 414,120 | ||||||||||
| Interest-bearing deposits in offices outside the U.S. (including $1,386 and $1,162 as of March 31, 2018 and December 31, 2017, respectively, at fair value) | 457,538 | 426,889 | ||||||||||
| Total deposits | $ | 949,990 | $ | 929,406 | $ | 1,001,219 | $ | 959,822 | ||||
| Federal funds purchased and securities loaned or sold under agreements to repurchase (including $40,939 and $33,663 as of March 31, 2017 and December 31, 2016, respectively, at fair value) | 148,230 | 141,821 | ||||||||||
| Federal funds purchased and securities loaned or sold under agreements to repurchase (including $45,840 and $40,638 as of March 31, 2018 and December 31, 2017, respectively, at fair value) | 171,759 | 156,277 | ||||||||||
| Brokerage payables | 59,655 | 57,152 | 69,685 | 61,342 | ||||||||
| Trading account liabilities | 144,070 | 139,045 | 143,961 | 125,170 | ||||||||
| Short-term borrowings (including $3,473 and $2,700 as of March 31, 2017 and December 31, 2016, respectively, at fair value) | 26,127 | 30,701 | ||||||||||
| Long-term debt (including $27,526 and $26,254 as of March 31, 2017 and December 31, 2016, respectively, at fair value) | 208,530 | 206,178 | ||||||||||
| Other liabilities (including $12,681 and $10,796 as of March 31, 2017 and December 31, 2016, respectively, at fair value) | 55,880 | 61,631 | ||||||||||
| Short-term borrowings (including $4,467 and $4,627 as of March 31, 2018 and December 31, 2017, respectively, at fair value) | 36,094 | 44,452 | ||||||||||
| Long-term debt (including $33,571 and $31,392 as of March 31, 2018 and December 31, 2017, respectively, at fair value) | 237,938 | 236,709 | ||||||||||
| Other liabilities (including $15,552 and $13,961 as of March 31, 2018 and December 31, 2017, respectively, at fair value) | 58,582 | 57,021 | ||||||||||
| Total liabilities | $ | 1,592,482 | $ | 1,565,934 | $ | 1,719,238 | $ | 1,640,793 | ||||
| Stockholders’ equity | ||||||||||||
Preferred stock ($1.00 par value; authorized shares: 30 million), issued shares: 770,120 as of March 31, 2017 and as of December 31, 2016, at aggregate liquidation value | $ | 19,253 | $ | 19,253 | ||||||||
Common stock ($0.01 par value; authorized shares: 6 billion), issued shares: 3,099,523,273 and 3,099,482,042 as of March 31, 2017 and December 31, 2016 | 31 | 31 | ||||||||||
Preferred stock ($1.00 par value; authorized shares: 30 million), issued shares: as of March 31, 2018—766,250 and as of December 31, 2017—770,120, at aggregate liquidation value | $ | 19,156 | $ | 19,253 | ||||||||
Common stock ($0.01 par value; authorized shares: 6 billion), issued shares: as of March 31, 2018—3,099,557,871 and as of December 31, 2017—3,099,523,273 | 31 | 31 | ||||||||||
| Additional paid-in capital | 107,613 | 108,042 | 107,599 | 108,008 | ||||||||
| Retained earnings | 149,731 | 146,477 | 141,863 | 138,425 | ||||||||
Treasury stock, at cost: March 31, 2017—346,265,476 shares and December 31, 2016—327,090,192 shares | (17,579 | ) | (16,302 | ) | ||||||||
| Accumulated other comprehensive income (loss) | (30,917 | ) | (32,381 | ) | ||||||||
Treasury stock, at cost: March 31, 2018—549,624,378 shares and December 31, 2017—529,614,728 shares | (32,115 | ) | (30,309 | ) | ||||||||
| Accumulated other comprehensive income (loss) (AOCI) | (34,619 | ) | (34,668 | ) | ||||||||
| Total Citigroup stockholders’ equity | $ | 228,132 | $ | 225,120 | $ | 201,915 | $ | 200,740 | ||||
| Noncontrolling interest | 1,021 | 1,023 | 951 | 932 | ||||||||
| Total equity | $ | 229,153 | $ | 226,143 | $ | 202,866 | $ | 201,672 | ||||
| Total liabilities and equity | $ | 1,821,635 | $ | 1,792,077 | $ | 1,922,104 | $ | 1,842,465 | ||||
| March 31, | March 31, | |||||||||||
| 2017 | December 31, | 2018 | December 31, | |||||||||
| In millions of dollars | (Unaudited) | 2016 | (Unaudited) | 2017 | ||||||||
Liabilities of consolidated VIEs for which creditors or beneficial interest holders do not have recourse to the general credit of Citigroup | ||||||||||||
| Short-term borrowings | $ | 10,636 | $ | 10,697 | $ | 10,242 | $ | 10,142 | ||||
| Long-term debt | 24,062 | 23,919 | 30,406 | 30,492 | ||||||||
| Other liabilities | 739 | 1,275 | 517 | 611 | ||||||||
Total liabilities of consolidated VIEs for which creditors or beneficial interest holders do not have recourse to the general credit of Citigroup | $ | 35,437 | $ | 35,891 | $ | 41,165 | $ | 41,245 | ||||
| CONSOLIDATED STATEMENT OF CHANGES IN STOCKHOLDERS’ EQUITY | Citigroup Inc. and Subsidiaries | |
| (UNAUDITED) | ||
| Three Months Ended March 31, | Three Months Ended March 31, | |||||||||||
| In millions of dollars, except shares in thousands | 2017 | 2016 | ||||||||||
| In millions of dollars | 2018 | 2017 | ||||||||||
| Preferred stock at aggregate liquidation value | ||||||||||||
| Balance, beginning of period | $ | 19,253 | $ | 16,718 | $ | 19,253 | $ | 19,253 | ||||
| Issuance of new preferred stock | — | 1,035 | ||||||||||
| Redemption of preferred stock | (97 | ) | — | |||||||||
| Balance, end of period | $ | 19,253 | $ | 17,753 | $ | 19,156 | $ | 19,253 | ||||
| Common stock and additional paid-in capital | ||||||||||||
| Balance, beginning of period | $ | 108,073 | $ | 108,319 | $ | 108,039 | $ | 108,073 | ||||
| Employee benefit plans | (426 | ) | (660 | ) | (405 | ) | (426 | ) | ||||
| Preferred stock issuance expense | — | (31 | ) | — | — | |||||||
| Other | (3 | ) | (7 | ) | (4 | ) | (3 | ) | ||||
| Balance, end of period | $ | 107,644 | $ | 107,621 | $ | 107,630 | $ | 107,644 | ||||
| Retained earnings | ||||||||||||
| Balance, beginning of period | $ | 146,477 | $ | 133,841 | $ | 138,425 | $ | 146,477 | ||||
Adjustment to opening balance, net of taxes(1) | — | 15 | (84 | ) | (660 | ) | ||||||
| Adjusted balance, beginning of period | $ | 146,477 | $ | 133,856 | $ | 138,341 | $ | 145,817 | ||||
| Citigroup’s net income | 4,090 | 3,501 | 4,620 | 4,090 | ||||||||
Common dividends(2) | (445 | ) | (149 | ) | (826 | ) | (445 | ) | ||||
| Preferred dividends | (301 | ) | (210 | ) | (272 | ) | (301 | ) | ||||
| Tax benefit | — | |||||||||||
Other(3) | (90 | ) | — | — | (90 | ) | ||||||
| Balance, end of period | $ | 149,731 | $ | 136,998 | $ | 141,863 | $ | 149,071 | ||||
| Treasury stock, at cost | ||||||||||||
| Balance, beginning of period | $ | (16,302 | ) | $ | (7,677 | ) | $ | (30,309 | ) | $ | (16,302 | ) |
Employee benefit plans(4) | 507 | 765 | 469 | 507 | ||||||||
Treasury stock acquired(5) | (1,784 | ) | (1,312 | ) | (2,275 | ) | (1,784 | ) | ||||
| Balance, end of period | $ | (17,579 | ) | $ | (8,224 | ) | $ | (32,115 | ) | $ | (17,579 | ) |
| Citigroup’s accumulated other comprehensive income (loss) | ||||||||||||
| Balance, beginning of period | $ | (32,381 | ) | $ | (29,344 | ) | $ | (34,668 | ) | $ | (32,381 | ) |
Adjustment to opening balance, net of taxes(1) | — | (15 | ) | (3 | ) | 504 | ||||||
| Adjusted balance, beginning of period | $ | (32,381 | ) | $ | (29,359 | ) | $ | (34,671 | ) | $ | (31,877 | ) |
| Citigroup’s total other comprehensive income (loss) | 1,464 | 2,733 | 52 | 1,464 | ||||||||
| Balance, end of period | $ | (30,917 | ) | $ | (26,626 | ) | $ | (34,619 | ) | $ | (30,413 | ) |
| Total Citigroup common stockholders’ equity | $ | 208,879 | $ | 209,769 | $ | 182,759 | $ | 208,723 | ||||
| Total Citigroup stockholders’ equity | $ | 228,132 | $ | 227,522 | $ | 201,915 | $ | 227,976 | ||||
| Noncontrolling interests | ||||||||||||
| Balance, beginning of period | $ | 1,023 | $ | 1,235 | $ | 932 | $ | 1,023 | ||||
| Transactions between Citigroup and the noncontrolling-interest shareholders | (1 | ) | (27 | ) | (15 | ) | (1 | ) | ||||
| Net income attributable to noncontrolling-interest shareholders | 10 | 5 | 22 | 10 | ||||||||
Other comprehensive income (loss) attributable to noncontrolling-interest shareholders | 31 | 27 | 14 | 31 | ||||||||
| Other | (42 | ) | (1 | ) | (2 | ) | (42 | ) | ||||
| Net change in noncontrolling interests | $ | (2 | ) | $ | 4 | $ | 19 | $ | (2 | ) | ||
| Balance, end of period | $ | 1,021 | $ | 1,239 | $ | 951 | $ | 1,021 | ||||
| Total equity | $ | 229,153 | $ | 228,761 | $ | 202,866 | $ | 228,997 | ||||
| (1) | See Note 1 to the Consolidated Financial Statements for additional details. |
| (2) | Common dividends declared were $0.32 per share in the first quarter of 2018 and $0.16 per share in the first quarter of |
| (3) | Includes the impact of ASU 2016-09, |
| (4) | Includes treasury stock related to (i) certain activity on employee stock option program exercises where the employee delivers existing shares to cover the option exercise, or (ii) under Citi’s employee restricted or deferred stock programs where shares are withheld to satisfy tax requirements. |
| CONSOLIDATED STATEMENT OF CASH FLOWS | Citigroup Inc. and Subsidiaries | |
| (UNAUDITED) | ||
| Three months ended March 31, | Three Months Ended March 31, | |||||||||||
| In millions of dollars | 2017 | 2016 | 2018 | 2017 | ||||||||
| Cash flows from operating activities of continuing operations | ||||||||||||
| Net income before attribution of noncontrolling interests | $ | 4,100 | $ | 3,506 | $ | 4,642 | $ | 4,100 | ||||
| Net income attributable to noncontrolling interests | 10 | 5 | 22 | 10 | ||||||||
| Citigroup’s net income | $ | 4,090 | $ | 3,501 | $ | 4,620 | $ | 4,090 | ||||
| Loss from discontinued operations, net of taxes | (18 | ) | (2 | ) | (7 | ) | (18 | ) | ||||
| Income from continuing operations—excluding noncontrolling interests | $ | 4,108 | $ | 3,503 | $ | 4,627 | $ | 4,108 | ||||
| Adjustments to reconcile net income to net cash provided by operating activities of continuing operations | ||||||||||||
Net gains on significant disposals(1) | (19 | ) | (422 | ) | — | (19 | ) | |||||
| Depreciation and amortization | 896 | 908 | 926 | 896 | ||||||||
| Provision for loan losses | 1,675 | 1,886 | 1,803 | 1,675 | ||||||||
| Realized gains from sales of investments | (192 | ) | (186 | ) | (170 | ) | (192 | ) | ||||
| Net impairment losses on investments, goodwill and intangible assets | 40 | 465 | 28 | 40 | ||||||||
| Change in trading account assets | (1,073 | ) | (23,791 | ) | (16,054 | ) | 30 | |||||
| Change in trading account liabilities | 5,025 | 18,634 | 18,791 | 4,457 | ||||||||
| Change in brokerage receivables net of brokerage payables | (5,498 | ) | (3,043 | ) | 155 | (5,498 | ) | |||||
| Change in loans held-for-sale (HFS) | 1,949 | 3,896 | ||||||||||
| Change in loans HFS | 1,627 | 1,949 | ||||||||||
| Change in other assets | (811 | ) | (3,327 | ) | (3,503 | ) | (1,926 | ) | ||||
| Change in other liabilities | (5,685 | ) | (179 | ) | 1,561 | (5,117 | ) | |||||
| Other, net | (3,421 | ) | 1,118 | (2,835 | ) | (3,455 | ) | |||||
| Total adjustments | $ | (7,114 | ) | $ | (4,041 | ) | $ | 2,329 | $ | (7,160 | ) | |
| Net cash provided by (used in) operating activities of continuing operations | $ | (3,006 | ) | $ | (538 | ) | $ | 6,956 | $ | (3,052 | ) | |
| Cash flows from investing activities of continuing operations | ||||||||||||
| Change in deposits with banks | $ | (20,322 | ) | $ | (23,852 | ) | ||||||
| Change in federal funds sold and securities borrowed or purchased under agreements to resell | (6,116 | ) | (5,418 | ) | $ | (25,409 | ) | $ | (6,116 | ) | ||
| Change in loans | (7,953 | ) | (5,057 | ) | (8,717 | ) | (7,953 | ) | ||||
| Proceeds from sales and securitizations of loans | 3,191 | 1,247 | 1,654 | 3,191 | ||||||||
| Purchases of investments | (41,584 | ) | (59,715 | ) | (41,030 | ) | (41,584 | ) | ||||
| Proceeds from sales of investments | 29,456 | 39,268 | 20,688 | 29,456 | ||||||||
| Proceeds from maturities of investments | 24,006 | 16,544 | 21,509 | 24,006 | ||||||||
Proceeds from significant disposals(1) | 2,732 | 265 | — | 2,732 | ||||||||
| Capital expenditures on premises and equipment and capitalized software | (786 | ) | (702 | ) | (969 | ) | (786 | ) | ||||
Proceeds from sales of premises and equipment, subsidiaries and affiliates, and repossessed assets | 133 | 230 | ||||||||||
| Net cash used in investing activities of continuing operations | $ | (17,243 | ) | $ | (37,190 | ) | ||||||
Proceeds from sales of premises and equipment, subsidiaries and affiliates and repossessed assets | 101 | 133 | ||||||||||
| Other, net | 49 | 46 | ||||||||||
| Net cash provided by (used in) investing activities of continuing operations | $ | (32,124 | ) | $ | 3,125 | |||||||
| Cash flows from financing activities of continuing operations | ||||||||||||
| Dividends paid | $ | (744 | ) | $ | (359 | ) | $ | (1,095 | ) | $ | (744 | ) |
| Issuance of preferred stock | — | 1,004 | ||||||||||
| Redemption of preferred stock | (97 | ) | — | |||||||||
| Treasury stock acquired | (1,858 | ) | (1,312 | ) | (2,378 | ) | (1,858 | ) | ||||
| Stock tendered for payment of withholding taxes | (397 | ) | (308 | ) | (475 | ) | (397 | ) | ||||
| Change in federal funds purchased and securities loaned or sold under agreements to repurchase | 6,409 | 10,712 | 15,482 | 6,409 | ||||||||
| Issuance of long-term debt | 18,603 | 13,904 | 20,769 | 18,603 | ||||||||
| Payments and redemptions of long-term debt | (18,885 | ) | (11,281 | ) | (17,882 | ) | (18,885 | ) | ||||
| Change in deposits | 20,584 | 26,704 | 41,397 | 20,584 | ||||||||
| Change in short-term borrowings | (4,574 | ) | (186 | ) | (8,358 | ) | (4,574 | ) | ||||
| CONSOLIDATED STATEMENT OF CASH FLOWS | Citigroup Inc. and Subsidiaries | |||||||||||
| (UNAUDITED) (CONTINUED) | Three months ended March 31, | |||||||||||
| (UNAUDITED) (Continued) | Three Months Ended March 31, | |||||||||||
| In millions of dollars | 2017 | 2016 | 2018 | 2017 | ||||||||
| Net cash provided by financing activities of continuing operations | $ | 19,138 | $ | 38,878 | $ | 47,363 | $ | 19,138 | ||||
| Effect of exchange rate changes on cash and cash equivalents | $ | 340 | $ | 190 | ||||||||
| Change in cash and due from banks | $ | (771 | ) | $ | 1,340 | |||||||
| Cash and due from banks at beginning of period | 23,043 | 20,900 | ||||||||||
| Cash and due from banks at end of period | $ | 22,272 | $ | 22,240 | ||||||||
| Effect of exchange rate changes on cash and due from banks | $ | (7 | ) | $ | 340 | |||||||
Change in cash and due from banks and deposits with banks(2) | $ | 22,188 | $ | 19,551 | ||||||||
Cash, due from banks and deposits with banks at beginning of period(2) | 180,516 | 160,494 | ||||||||||
Cash, due from banks and deposits with banks at end of period(2) | $ | 202,704 | $ | 180,045 | ||||||||
| Cash and due from banks | $ | 21,850 | $ | 22,272 | ||||||||
| Deposits with banks | 180,854 | 157,773 | ||||||||||
| Cash, due from banks and deposits with banks at end of period | $ | 202,704 | $ | 180,045 | ||||||||
| Supplemental disclosure of cash flow information for continuing operations | ||||||||||||
| Cash paid during the period for income taxes | $ | 913 | $ | 688 | $ | 738 | $ | 913 | ||||
| Cash paid during the period for interest | 3,250 | 2,694 | 4,586 | 3,250 | ||||||||
| Non-cash investing activities | ||||||||||||
| Decrease in goodwill associated with significant disposals reclassified to HFS | — | (30 | ) | |||||||||
| Transfers to loans HFS from loans | 2,800 | 3,200 | $ | 900 | $ | 2,800 | ||||||
| Transfers to OREO and other repossessed assets | 30 | 56 | 26 | 30 | ||||||||
| CONSOLIDATED FINANCIAL STATEMENTS | |
Consolidated Statement of Income (Unaudited)— For the Three Months Ended March 31, 2018 and 2017 | |
| Consolidated Statement of Comprehensive Income (Unaudited)—For the Three Months Ended March 31, 2018 and 2017 | |
| Consolidated Balance Sheet—March 31, 2018 (Unaudited) and December 31, 2017 | |
| Consolidated Statement of Changes in Stockholders’ Equity (Unaudited)—For the Three Months Ended March 31, 2018 and 2017 | |
Consolidated Statement of Cash Flows (Unaudited)— For the Three Months Ended March 31, 2018 and 2017 | |
| NOTES TO CONSOLIDATED FINANCIAL STATEMENTS (UNAUDITED) | |
| Note 1—Basis of Presentation and Accounting Changes | |
| Note 2—Discontinued Operations and Significant Disposals | |
| Note 3—Business Segments | |
| Note 4—Interest Revenue and Expense | |
Note 5—Commissions and Fees; Administration and Other Fiduciary Fees | |
| Note 6—Principal Transactions | |
| Note 7—Incentive Plans | |
| Note 8—Retirement Benefits | |
| Note 9—Earnings per Share | |
| Note 10—Federal Funds, Securities Borrowed, Loaned and Subject to Repurchase Agreements | |
| Note 11—Brokerage Receivables and Brokerage Payables | |
| Note 12—Investments | |
| Note 13—Loans | |
| Note 14—Allowance for Credit Losses | |
| Note 15—Goodwill and Intangible Assets | |
| Note 16—Debt | |
| Note 17—Changes in Accumulated Other Comprehensive Income (Loss) (AOCI) | |
| Note 18—Securitizations and Variable Interest Entities | |
| Note 19—Derivatives Activities | |
| Note 20—Fair Value Measurement | |
| Note 21—Fair Value Elections | |
| Note 22—Guarantees and Commitments | |
| Note 23—Contingencies | |
| Note 24—Condensed Consolidating Financial Statements | |
| CONSOLIDATED STATEMENT OF INCOME (UNAUDITED) | Citigroup Inc. and Subsidiaries | |
| Three Months Ended March 31, | ||||||
| In millions of dollars, except per share amounts | 2018 | 2017 | ||||
| Revenues | ||||||
| Interest revenue | $ | 16,332 | $ | 14,521 | ||
| Interest expense | 5,160 | 3,566 | ||||
| Net interest revenue | $ | 11,172 | $ | 10,955 | ||
| Commissions and fees | $ | 3,030 | $ | 3,055 | ||
| Principal transactions | 3,289 | 3,094 | ||||
| Administration and other fiduciary fees | 905 | 834 | ||||
| Realized gains on sales of investments, net | 170 | 192 | ||||
| Impairment losses on investments | ||||||
| Gross impairment losses | (28 | ) | (12 | ) | ||
| Less: Impairments recognized in AOCI | — | — | ||||
| Net impairment losses recognized in earnings | $ | (28 | ) | $ | (12 | ) |
| Other revenue | $ | 334 | $ | 248 | ||
| Total non-interest revenues | $ | 7,700 | $ | 7,411 | ||
| Total revenues, net of interest expense | $ | 18,872 | $ | 18,366 | ||
| Provisions for credit losses and for benefits and claims | ||||||
| Provision for loan losses | $ | 1,803 | $ | 1,675 | ||
| Policyholder benefits and claims | 26 | 30 | ||||
| Release for unfunded lending commitments | 28 | (43 | ) | |||
| Total provisions for credit losses and for benefits and claims | $ | 1,857 | $ | 1,662 | ||
| Operating expenses | ||||||
| Compensation and benefits | $ | 5,807 | $ | 5,534 | ||
| Premises and equipment | 593 | 620 | ||||
| Technology/communication | 1,758 | 1,663 | ||||
| Advertising and marketing | 381 | 373 | ||||
| Other operating | 2,386 | 2,533 | ||||
| Total operating expenses | $ | 10,925 | $ | 10,723 | ||
| Income from continuing operations before income taxes | $ | 6,090 | $ | 5,981 | ||
| Provision for income taxes | 1,441 | 1,863 | ||||
| Income from continuing operations | $ | 4,649 | $ | 4,118 | ||
| Discontinued operations | ||||||
| Loss from discontinued operations | $ | (7 | ) | $ | (28 | ) |
| Benefit for income taxes | — | (10 | ) | |||
| Loss from discontinued operations, net of taxes | $ | (7 | ) | $ | (18 | ) |
| Net income before attribution of noncontrolling interests | $ | 4,642 | $ | 4,100 | ||
| Noncontrolling interests | 22 | 10 | ||||
| Citigroup’s net income | $ | 4,620 | $ | 4,090 | ||
Basic earnings per share(1) | ||||||
| Income from continuing operations | $ | 1.68 | $ | 1.36 | ||
| Income (loss) from discontinued operations, net of taxes | — | (0.01 | ) | |||
| Net income | $ | 1.68 | $ | 1.35 | ||
| Weighted average common shares outstanding | 2,561.6 | 2,765.3 | ||||
Diluted earnings per share(1) | ||||||
| Income from continuing operations | $ | 1.68 | $ | 1.36 | ||
| Income (loss) from discontinued operations, net of taxes | — | (0.01 | ) | |||
| Net income | $ | 1.68 | $ | 1.35 | ||
| Adjusted weighted average common shares outstanding | 2,563.0 | 2,765.5 | ||||
| (1) | Due to rounding, earnings per share on continuing operations and discontinued operations may not sum to earnings per share on net income. |
| CONSOLIDATED STATEMENT OF COMPREHENSIVE INCOME | Citigroup Inc. and Subsidiaries | |
| (UNAUDITED) | ||
| Three Months Ended March 31, | ||||||
| In millions of dollars | 2018 | 2017 | ||||
| Citigroup’s net income | $ | 4,620 | $ | 4,090 | ||
| Add: Citigroup's other comprehensive income | ||||||
Net change in unrealized gains and losses on investment securities, net of taxes(1)(2) | $ | (1,058 | ) | $ | 220 | |
Net change in debt valuation adjustment (DVA), net of taxes(1) | 128 | (60 | ) | |||
| Net change in cash flow hedges, net of taxes | (222 | ) | (2 | ) | ||
| Benefit plans liability adjustment, net of taxes | 88 | (12 | ) | |||
| Net change in foreign currency translation adjustment, net of taxes and hedges | 1,120 | 1,318 | ||||
Net change in excluded component of fair value hedges, net of taxes | (4 | ) | — | |||
| Citigroup’s total other comprehensive income | $ | 52 | $ | 1,464 | ||
| Citigroup’s total comprehensive income | $ | 4,672 | $ | 5,554 | ||
| Add: Other comprehensive income attributable to noncontrolling interests | $ | 14 | $ | 31 | ||
| Add: Net income attributable to noncontrolling interests | 22 | 10 | ||||
| Total comprehensive income | $ | 4,708 | $ | 5,595 | ||
| (1) | See Note 1 to the Consolidated Financial Statements. |
| (2) | For the three months ended March 31, 2018, amount represents the net change in unrealized gains and losses on available-for-sale (AFS) debt securities. Effective January 1, 2018, the AFS category is eliminated for equity securities under ASU 2016-01. |
| CONSOLIDATED BALANCE SHEET | Citigroup Inc. and Subsidiaries | |
| March 31, | ||||||
| 2018 | December 31, | |||||
| In millions of dollars | (Unaudited) | 2017 | ||||
| Assets | ||||||
| Cash and due from banks (including segregated cash and other deposits) | $ | 21,850 | $ | 23,775 | ||
| Deposits with banks | 180,854 | 156,741 | ||||
| Federal funds sold and securities borrowed or purchased under agreements to resell (including $161,537 and $132,949 as of March 31, 2018 and December 31, 2017, respectively, at fair value) | 257,887 | 232,478 | ||||
| Brokerage receivables | 46,572 | 38,384 | ||||
| Trading account assets (including $107,399 and $99,460 pledged to creditors at March 31, 2018 and December 31, 2017, respectively) | 268,808 | 252,790 | ||||
| Investments: | ||||||
| Available-for-sale debt securities (including $14,312 and $9,493 pledged to creditors as of March 31, 2018 and December 31, 2017, respectively) | 291,523 | 290,725 | ||||
| Held-to-maturity debt securities (including $1,063 and $435 pledged to creditors as of March 31, 2018 and December 31, 2017, respectively) | 52,492 | 53,320 | ||||
| Equity securities (including $1,569 and $1,395 at fair value as of March 31, 2018 and December 31, 2017, respectively, of which $189 was available for sale as of December 31, 2017) | 7,956 | 8,245 | ||||
| Total investments | $ | 351,971 | $ | 352,290 | ||
| Loans: | ||||||
| Consumer (including $23 and $25 as of March 31, 2018 and December 31, 2017, respectively, at fair value) | 325,084 | 333,656 | ||||
| Corporate (including $4,513 and $4,349 as of March 31, 2018 and December 31, 2017, respectively, at fair value) | 347,854 | 333,378 | ||||
| Loans, net of unearned income | $ | 672,938 | $ | 667,034 | ||
| Allowance for loan losses | (12,354 | ) | (12,355 | ) | ||
| Total loans, net | $ | 660,584 | $ | 654,679 | ||
| Goodwill | 22,659 | 22,256 | ||||
| Intangible assets (other than MSRs) | 4,450 | 4,588 | ||||
| Mortgage servicing rights (MSRs) | 587 | 558 | ||||
| Other assets (including $20,443 and $18,559 as of March 31, 2018 and December 31, 2017, respectively, at fair value) | 105,882 | 103,926 | ||||
| Total assets | $ | 1,922,104 | $ | 1,842,465 | ||
| March 31, | ||||||
| 2018 | December 31, | |||||
| In millions of dollars | (Unaudited) | 2017 | ||||
| Assets of consolidated VIEs to be used to settle obligations of consolidated VIEs | ||||||
| Cash and due from banks | $ | 34 | $ | 52 | ||
| Trading account assets | 1,582 | 1,129 | ||||
| Investments | 2,492 | 2,498 | ||||
| Loans, net of unearned income | ||||||
| Consumer | 50,256 | 54,656 | ||||
| Corporate | 19,516 | 19,835 | ||||
| Loans, net of unearned income | $ | 69,772 | $ | 74,491 | ||
| Allowance for loan losses | (1,923 | ) | (1,930 | ) | ||
| Total loans, net | $ | 67,849 | $ | 72,561 | ||
| Other assets | 159 | 154 | ||||
| Total assets of consolidated VIEs to be used to settle obligations of consolidated VIEs | $ | 72,116 | $ | 76,394 | ||
| March 31, | ||||||
| 2018 | December 31, | |||||
| In millions of dollars, except shares and per share amounts | (Unaudited) | 2017 | ||||
| Liabilities | ||||||
| Non-interest-bearing deposits in U.S. offices | $ | 125,332 | $ | 126,880 | ||
| Interest-bearing deposits in U.S. offices (including $300 and $303 as of March 31, 2018 and December 31, 2017, respectively, at fair value) | 327,872 | 318,613 | ||||
| Non-interest-bearing deposits in offices outside the U.S. | 90,477 | 87,440 | ||||
| Interest-bearing deposits in offices outside the U.S. (including $1,386 and $1,162 as of March 31, 2018 and December 31, 2017, respectively, at fair value) | 457,538 | 426,889 | ||||
| Total deposits | $ | 1,001,219 | $ | 959,822 | ||
| Federal funds purchased and securities loaned or sold under agreements to repurchase (including $45,840 and $40,638 as of March 31, 2018 and December 31, 2017, respectively, at fair value) | 171,759 | 156,277 | ||||
| Brokerage payables | 69,685 | 61,342 | ||||
| Trading account liabilities | 143,961 | 125,170 | ||||
| Short-term borrowings (including $4,467 and $4,627 as of March 31, 2018 and December 31, 2017, respectively, at fair value) | 36,094 | 44,452 | ||||
| Long-term debt (including $33,571 and $31,392 as of March 31, 2018 and December 31, 2017, respectively, at fair value) | 237,938 | 236,709 | ||||
| Other liabilities (including $15,552 and $13,961 as of March 31, 2018 and December 31, 2017, respectively, at fair value) | 58,582 | 57,021 | ||||
| Total liabilities | $ | 1,719,238 | $ | 1,640,793 | ||
| Stockholders’ equity | ||||||
Preferred stock ($1.00 par value; authorized shares: 30 million), issued shares: as of March 31, 2018—766,250 and as of December 31, 2017—770,120, at aggregate liquidation value | $ | 19,156 | $ | 19,253 | ||
Common stock ($0.01 par value; authorized shares: 6 billion), issued shares: as of March 31, 2018—3,099,557,871 and as of December 31, 2017—3,099,523,273 | 31 | 31 | ||||
| Additional paid-in capital | 107,599 | 108,008 | ||||
| Retained earnings | 141,863 | 138,425 | ||||
Treasury stock, at cost: March 31, 2018—549,624,378 shares and December 31, 2017—529,614,728 shares | (32,115 | ) | (30,309 | ) | ||
| Accumulated other comprehensive income (loss) (AOCI) | (34,619 | ) | (34,668 | ) | ||
| Total Citigroup stockholders’ equity | $ | 201,915 | $ | 200,740 | ||
| Noncontrolling interest | 951 | 932 | ||||
| Total equity | $ | 202,866 | $ | 201,672 | ||
| Total liabilities and equity | $ | 1,922,104 | $ | 1,842,465 | ||
| March 31, | ||||||
| 2018 | December 31, | |||||
| In millions of dollars | (Unaudited) | 2017 | ||||
Liabilities of consolidated VIEs for which creditors or beneficial interest holders do not have recourse to the general credit of Citigroup | ||||||
| Short-term borrowings | $ | 10,242 | $ | 10,142 | ||
| Long-term debt | 30,406 | 30,492 | ||||
| Other liabilities | 517 | 611 | ||||
Total liabilities of consolidated VIEs for which creditors or beneficial interest holders do not have recourse to the general credit of Citigroup | $ | 41,165 | $ | 41,245 | ||
| CONSOLIDATED STATEMENT OF CHANGES IN STOCKHOLDERS’ EQUITY | Citigroup Inc. and Subsidiaries | |
| (UNAUDITED) | ||
| Three Months Ended March 31, | ||||||
| In millions of dollars | 2018 | 2017 | ||||
| Preferred stock at aggregate liquidation value | ||||||
| Balance, beginning of period | $ | 19,253 | $ | 19,253 | ||
| Redemption of preferred stock | (97 | ) | — | |||
| Balance, end of period | $ | 19,156 | $ | 19,253 | ||
| Common stock and additional paid-in capital | ||||||
| Balance, beginning of period | $ | 108,039 | $ | 108,073 | ||
| Employee benefit plans | (405 | ) | (426 | ) | ||
| Preferred stock issuance expense | — | — | ||||
| Other | (4 | ) | (3 | ) | ||
| Balance, end of period | $ | 107,630 | $ | 107,644 | ||
| Retained earnings | ||||||
| Balance, beginning of period | $ | 138,425 | $ | 146,477 | ||
Adjustment to opening balance, net of taxes(1) | (84 | ) | (660 | ) | ||
| Adjusted balance, beginning of period | $ | 138,341 | $ | 145,817 | ||
| Citigroup’s net income | 4,620 | 4,090 | ||||
Common dividends(2) | (826 | ) | (445 | ) | ||
| Preferred dividends | (272 | ) | (301 | ) | ||
Other(3) | — | (90 | ) | |||
| Balance, end of period | $ | 141,863 | $ | 149,071 | ||
| Treasury stock, at cost | ||||||
| Balance, beginning of period | $ | (30,309 | ) | $ | (16,302 | ) |
Employee benefit plans(4) | 469 | 507 | ||||
Treasury stock acquired(5) | (2,275 | ) | (1,784 | ) | ||
| Balance, end of period | $ | (32,115 | ) | $ | (17,579 | ) |
| Citigroup’s accumulated other comprehensive income (loss) | ||||||
| Balance, beginning of period | $ | (34,668 | ) | $ | (32,381 | ) |
Adjustment to opening balance, net of taxes(1) | (3 | ) | 504 | |||
| Adjusted balance, beginning of period | $ | (34,671 | ) | $ | (31,877 | ) |
| Citigroup’s total other comprehensive income (loss) | 52 | 1,464 | ||||
| Balance, end of period | $ | (34,619 | ) | $ | (30,413 | ) |
| Total Citigroup common stockholders’ equity | $ | 182,759 | $ | 208,723 | ||
| Total Citigroup stockholders’ equity | $ | 201,915 | $ | 227,976 | ||
| Noncontrolling interests | ||||||
| Balance, beginning of period | $ | 932 | $ | 1,023 | ||
| Transactions between Citigroup and the noncontrolling-interest shareholders | (15 | ) | (1 | ) | ||
| Net income attributable to noncontrolling-interest shareholders | 22 | 10 | ||||
Other comprehensive income (loss) attributable to noncontrolling-interest shareholders | 14 | 31 | ||||
| Other | (2 | ) | (42 | ) | ||
| Net change in noncontrolling interests | $ | 19 | $ | (2 | ) | |
| Balance, end of period | $ | 951 | $ | 1,021 | ||
| Total equity | $ | 202,866 | $ | 228,997 | ||
| (1) | See Note 1 to the Consolidated Financial Statements for additional details. |
| (2) | Common dividends declared were $0.32 per share in the first quarter of 2018 and $0.16 per share in the first quarter of 2017. |
| (3) | Includes the impact of ASU 2016-09, Compensation—Stock Compensation (Topic 718): Improvements to Employee Share-Based Payment Accounting. See Note 1 to the Consolidated Financial Statements. |
| (4) | Includes treasury stock related to (i) certain activity on employee stock option program exercises where the employee delivers existing shares to cover the option exercise, or (ii) under Citi’s employee restricted or deferred stock programs where shares are withheld to satisfy tax requirements. |
| CONSOLIDATED STATEMENT OF CASH FLOWS | Citigroup Inc. and Subsidiaries | |
| (UNAUDITED) | ||
| Three Months Ended March 31, | ||||||
| In millions of dollars | 2018 | 2017 | ||||
| Cash flows from operating activities of continuing operations | ||||||
| Net income before attribution of noncontrolling interests | $ | 4,642 | $ | 4,100 | ||
| Net income attributable to noncontrolling interests | 22 | 10 | ||||
| Citigroup’s net income | $ | 4,620 | $ | 4,090 | ||
| Loss from discontinued operations, net of taxes | (7 | ) | (18 | ) | ||
| Income from continuing operations—excluding noncontrolling interests | $ | 4,627 | $ | 4,108 | ||
| Adjustments to reconcile net income to net cash provided by operating activities of continuing operations | ||||||
Net gains on significant disposals(1) | — | (19 | ) | |||
| Depreciation and amortization | 926 | 896 | ||||
| Provision for loan losses | 1,803 | 1,675 | ||||
| Realized gains from sales of investments | (170 | ) | (192 | ) | ||
| Net impairment losses on investments, goodwill and intangible assets | 28 | 40 | ||||
| Change in trading account assets | (16,054 | ) | 30 | |||
| Change in trading account liabilities | 18,791 | 4,457 | ||||
| Change in brokerage receivables net of brokerage payables | 155 | (5,498 | ) | |||
| Change in loans HFS | 1,627 | 1,949 | ||||
| Change in other assets | (3,503 | ) | (1,926 | ) | ||
| Change in other liabilities | 1,561 | (5,117 | ) | |||
| Other, net | (2,835 | ) | (3,455 | ) | ||
| Total adjustments | $ | 2,329 | $ | (7,160 | ) | |
| Net cash provided by (used in) operating activities of continuing operations | $ | 6,956 | $ | (3,052 | ) | |
| Cash flows from investing activities of continuing operations | ||||||
| Change in federal funds sold and securities borrowed or purchased under agreements to resell | $ | (25,409 | ) | $ | (6,116 | ) |
| Change in loans | (8,717 | ) | (7,953 | ) | ||
| Proceeds from sales and securitizations of loans | 1,654 | 3,191 | ||||
| Purchases of investments | (41,030 | ) | (41,584 | ) | ||
| Proceeds from sales of investments | 20,688 | 29,456 | ||||
| Proceeds from maturities of investments | 21,509 | 24,006 | ||||
Proceeds from significant disposals(1) | — | 2,732 | ||||
| Capital expenditures on premises and equipment and capitalized software | (969 | ) | (786 | ) | ||
Proceeds from sales of premises and equipment, subsidiaries and affiliates and repossessed assets | 101 | 133 | ||||
| Other, net | 49 | 46 | ||||
| Net cash provided by (used in) investing activities of continuing operations | $ | (32,124 | ) | $ | 3,125 | |
| Cash flows from financing activities of continuing operations | ||||||
| Dividends paid | $ | (1,095 | ) | $ | (744 | ) |
| Redemption of preferred stock | (97 | ) | — | |||
| Treasury stock acquired | (2,378 | ) | (1,858 | ) | ||
| Stock tendered for payment of withholding taxes | (475 | ) | (397 | ) | ||
| Change in federal funds purchased and securities loaned or sold under agreements to repurchase | 15,482 | 6,409 | ||||
| Issuance of long-term debt | 20,769 | 18,603 | ||||
| Payments and redemptions of long-term debt | (17,882 | ) | (18,885 | ) | ||
| Change in deposits | 41,397 | 20,584 | ||||
| Change in short-term borrowings | (8,358 | ) | (4,574 | ) | ||
| CONSOLIDATED STATEMENT OF CASH FLOWS | ||||||
| (UNAUDITED) (Continued) | Three Months Ended March 31, | |||||
| In millions of dollars | 2018 | 2017 | ||||
| Net cash provided by financing activities of continuing operations | $ | 47,363 | $ | 19,138 | ||
| Effect of exchange rate changes on cash and due from banks | $ | (7 | ) | $ | 340 | |
Change in cash and due from banks and deposits with banks(2) | $ | 22,188 | $ | 19,551 | ||
Cash, due from banks and deposits with banks at beginning of period(2) | 180,516 | 160,494 | ||||
Cash, due from banks and deposits with banks at end of period(2) | $ | 202,704 | $ | 180,045 | ||
| Cash and due from banks | $ | 21,850 | $ | 22,272 | ||
| Deposits with banks | 180,854 | 157,773 | ||||
| Cash, due from banks and deposits with banks at end of period | $ | 202,704 | $ | 180,045 | ||
| Supplemental disclosure of cash flow information for continuing operations | ||||||
| Cash paid during the period for income taxes | $ | 738 | $ | 913 | ||
| Cash paid during the period for interest | 4,586 | 3,250 | ||||
| Non-cash investing activities | ||||||
| Transfers to loans HFS from loans | $ | 900 | $ | 2,800 | ||
| Transfers to OREO and other repossessed assets | 26 | 30 | ||||
| Three months ended March 31, | ||||||
| In millions of dollars | 2017 | 2016 | ||||
| Total revenues, net of interest expense | $ | — | $ | — | ||
| Income (loss) from discontinued operations | $ | (28 | ) | $ | (3 | ) |
| Provision (benefit) for income taxes | (10 | ) | (1 | ) | ||
| Income (loss) from discontinued operations, net of taxes | $ | (18 | ) | $ | (2 | ) |
Three Months Ended March 31, | ||||||
| In millions of dollars | 2018 | 2017 | ||||
| Total revenues, net of interest expense | $ | — | $ | — | ||
| Loss from discontinued operations | $ | (7 | ) | $ | (28 | ) |
| Benefit for income taxes | — | (10 | ) | |||
| Loss from discontinued operations, net of taxes | $ | (7 | ) | $ | (18 | ) |
| Three months ended March 31, | ||||||
| In millions of dollars | 2017 | 2016 | ||||
| Income before taxes | $ | 30 | $ | 21 | ||
| Three months ended March 31, | Three Months Ended March 31, | |||||||||||||||||||||||||||||||||||||||||||||||
Revenues, net of interest expense(1) | Provision (benefits) for income taxes | Income (loss) from continuing operations(2) | Identifiable assets | Revenues, net of interest expense(1) | Provision (benefits) for income taxes | Income (loss) from continuing operations(2) | Identifiable assets | |||||||||||||||||||||||||||||||||||||||||
| In millions of dollars, except identifiable assets in billions | 2017 | 2016 | 2017 | 2016 | 2017 | 2016 | March 31, 2017 | December 31, 2016 | 2018 | 2017 | 2018 | 2017 | 2018 | 2017 | March 31, 2018 | December 31, 2017 | ||||||||||||||||||||||||||||||||
| Global Consumer Banking | $ | 7,817 | $ | 7,714 | $ | 584 | $ | 634 | $ | 1,003 | $ | 1,194 | $ | 412 | $ | 412 | $ | 8,433 | $ | 7,846 | $ | 453 | $ | 582 | $ | 1,394 | $ | 998 | $ | 423 | $ | 428 | ||||||||||||||||
| Institutional Clients Group | 9,126 | 7,895 | 1,375 | 764 | 3,011 | 1,869 | 1,314 | 1,277 | 9,848 | 9,319 | 1,057 | 1,375 | 3,329 | 3,011 | 1,407 | 1,336 | ||||||||||||||||||||||||||||||||
| Corporate/Other | 1,177 | 1,946 | (96 | ) | 81 | 104 | 445 | 96 | 103 | 591 | 1,201 | (69 | ) | (94 | ) | (74 | ) | 109 | 92 | 78 | ||||||||||||||||||||||||||||
| Total | $ | 18,120 | $ | 17,555 | $ | 1,863 | $ | 1,479 | $ | 4,118 | $ | 3,508 | $ | 1,822 | $ | 1,792 | $ | 18,872 | $ | 18,366 | $ | 1,441 | $ | 1,863 | $ | 4,649 | $ | 4,118 | $ | 1,922 | $ | 1,842 | ||||||||||||||||
| (1) | Includes total revenues, net of interest expense (excluding Corporate/Other), in North America of |
| (2) | Includes pretax provisions for credit losses and for benefits and claims in the GCB results of |
| Three months ended March 31, | Three Months Ended March 31, | |||||||||||
| In millions of dollars | 2017 | 2016 | 2018 | 2017 | ||||||||
| Interest revenue | ||||||||||||
| Loan interest, including fees | $ | 9,947 | $ | 9,760 | $ | 10,892 | $ | 10,045 | ||||
| Deposits with banks | 295 | 219 | 432 | 295 | ||||||||
| Federal funds sold and securities borrowed or purchased under agreements to resell | 661 | 647 | 1,039 | 661 | ||||||||
| Investments, including dividends | 1,960 | 1,855 | 2,234 | 1,960 | ||||||||
Trading account assets(1) | 1,266 | 1,434 | 1,371 | 1,266 | ||||||||
| Other interest | 294 | 252 | 364 | 294 | ||||||||
| Total interest revenue | $ | 14,423 | $ | 14,167 | $ | 16,332 | $ | 14,521 | ||||
| Interest expense | ||||||||||||
Deposits(2) | $ | 1,415 | $ | 1,204 | $ | 1,997 | $ | 1,415 | ||||
| Federal funds purchased and securities loaned or sold under agreements to repurchase | 493 | 502 | 949 | 493 | ||||||||
Trading account liabilities(1) | 147 | 88 | 215 | 147 | ||||||||
| Short-term borrowings | 199 | 100 | 471 | 199 | ||||||||
| Long-term debt | 1,312 | 1,046 | 1,528 | 1,312 | ||||||||
| Total interest expense | $ | 3,566 | $ | 2,940 | $ | 5,160 | $ | 3,566 | ||||
| Net interest revenue | $ | 10,857 | $ | 11,227 | $ | 11,172 | $ | 10,955 | ||||
| Provision for loan losses | 1,675 | 1,886 | 1,803 | 1,675 | ||||||||
| Net interest revenue after provision for loan losses | $ | 9,182 | $ | 9,341 | $ | 9,369 | $ | 9,280 | ||||
| (1) | Interest expense on Trading account liabilities |
| (2) | Includes deposit insurance fees and charges of |
| Three Months Ended March 31, | ||||||||||||
| 2018 | ||||||||||||
| In millions of dollars | ICG | GCB | Corporate/Other | Total | ||||||||
| Investment banking | $ | 822 | $ | — | $ | — | $ | 822 | ||||
| Brokerage commissions | 566 | 248 | — | 814 | ||||||||
| Credit- and bank-card income | ||||||||||||
| Interchange fees | 260 | 1,875 | 5 | 2,140 | ||||||||
| Card-related loan fees | 14 | 155 | 6 | 175 | ||||||||
| Card rewards and partner payments | (124 | ) | (1,874 | ) | (5 | ) | (2,003 | ) | ||||
Deposit-related fees(1) | 236 | 183 | 1 | 420 | ||||||||
| Transactional service fees | 190 | 21 | 2 | 213 | ||||||||
Corporate finance(2) | 142 | 1 | — | 143 | ||||||||
Insurance distribution revenue(3) | 5 | 143 | 5 | 153 | ||||||||
Insurance premiums(3) | — | 33 | (1 | ) | 32 | |||||||
| Loan servicing | 38 | 22 | 12 | 72 | ||||||||
| Other | 15 | 32 | 2 | 49 | ||||||||
Total commissions and fees(4) | $ | 2,164 | $ | 839 | $ | 27 | $ | 3,030 | ||||
| Three months ended March 31, | ||||||
| In millions of dollars | 2017 | 2016 | ||||
| Investment banking | $ | 862 | $ | 574 | ||
| Trading-related | 572 | 601 | ||||
| Trade and securities services | 390 | 406 | ||||
| Credit cards and bank cards | 311 | 271 | ||||
Corporate finance(1) | 169 | 123 | ||||
Other consumer(2) | 164 | 158 | ||||
| Checking-related | 120 | 116 | ||||
| Loan servicing | 86 | 96 | ||||
| Other | 85 | 118 | ||||
| Total commissions and fees | $ | 2,759 | $ | 2,463 | ||
| Three Months Ended March 31, | ||||||||||||
| 2017 | ||||||||||||
| In millions of dollars | ICG | GCB | Corporate/Other | Total | ||||||||
| Investment banking | $ | 904 | $ | — | $ | — | $ | 904 | ||||
| Brokerage commissions | 482 | 193 | 1 | 676 | ||||||||
| Credit- and bank-card income | ||||||||||||
| Interchange fees | 222 | 1,703 | 40 | 1,965 | ||||||||
| Card-related loan fees | 12 | 167 | 16 | 195 | ||||||||
| Card rewards and partner payments | (103 | ) | (1,685 | ) | (27 | ) | (1,815 | ) | ||||
Deposit-related fees(1) | 208 | 185 | 4 | 397 | ||||||||
| Transactional service fees | 174 | 27 | 24 | 225 | ||||||||
Corporate finance(2) | 184 | 1 | — | 185 | ||||||||
Insurance distribution revenue(3) | 2 | 144 | 25 | 171 | ||||||||
Insurance premiums(3) | — | 33 | (1 | ) | 32 | |||||||
| Loan servicing | 35 | 26 | 31 | 92 | ||||||||
| Other | (20 | ) | 25 | 23 | 28 | |||||||
Total commissions and fees(4) | $ | 2,100 | $ | 819 | $ | 136 | $ | 3,055 | ||||
| (1) | Includes $32 million and $33 million of overdraft fees in the first quarter of 2018 and the first quarter of 2017, respectively. Overdraft fees are accounted for under ASC 310. |
| (2) | Consists primarily of fees earned from structuring and underwriting loan |
| (4) | Commissions and fees includes $(1,545) million and $(1,278) million not accounted for under ASC 606, Revenue from Contracts with Customers, for the first quarters of 2018 and 2017, respectively. Amounts reported in Commissions and fees accounted for under other guidance primarily include card-related loan fees, |
| Three Months Ended March 31, | ||||||||||||
| 2018 | ||||||||||||
| In millions of dollars | ICG | GCB | Corp/Other | Total | ||||||||
| Custody fees | $ | 368 | $ | 47 | $ | 16 | $ | 431 | ||||
| Fiduciary fees | 167 | 147 | 7 | 321 | ||||||||
| Guarantee fees | 137 | 14 | 2 | 153 | ||||||||
Total administration and other fiduciary fees(1) | $ | 672 | $ | 208 | $ | 25 | $ | 905 | ||||
| Three Months Ended March 31, | ||||||||||||
| 2017 | ||||||||||||
| In millions of dollars | ICG | GCB | Corp/Other | Total | ||||||||
| Custody fees | $ | 355 | $ | 38 | $ | 13 | $ | 406 | ||||
| Fiduciary fees | 141 | 133 | 11 | 285 | ||||||||
| Guarantee fees | 128 | 13 | 2 | 143 | ||||||||
Total administration and other fiduciary fees(1) | $ | 624 | $ | 184 | $ | 26 | $ | 834 | ||||
| (1) | Administration and other fiduciary fees includes $153 million and $143 million for the first quarters of 2018 and 2017, respectively, that are not accounted for under ASC 606, Revenue from Contracts with Customers. These amounts include guarantee fees. |
| Three Months Ended March 31, | ||||||
| In millions of dollars | 2018 | 2017 | ||||
Global Consumer Banking(1) | $ | 150 | $ | 155 | ||
| Institutional Clients Group | 2,884 | 2,731 | ||||
Corporate/Other(1) | 255 | 208 | ||||
| Total Citigroup | $ | 3,289 | $ | 3,094 | ||
Interest rate risks(2) | $ | 1,622 | $ | 1,746 | ||
Foreign exchange risks(3) | 745 | 579 | ||||
Equity risks(4) | 566 | 212 | ||||
Commodity and other risks(5) | 92 | 153 | ||||
Credit products and risks(6) | 264 | 404 | ||||
| Total | $ | 3,289 | $ | 3,094 | ||
| Three months ended March 31, | ||||||
| In millions of dollars | 2017 | 2016 | ||||
Global Consumer Banking(1) | $ | 149 | $ | 143 | ||
| Institutional Clients Group | 2,668 | 1,576 | ||||
Corporate/Other (1) | 205 | 121 | ||||
| Total Citigroup | $ | 3,022 | $ | 1,840 | ||
Interest rate risks(2) | $ | 1,766 | $ | 807 | ||
Foreign exchange risks(3) | 588 | 613 | ||||
Equity risks(4) | 188 | 50 | ||||
Commodity and other risks(5) | 90 | 144 | ||||
Credit products and risks(6) | 390 | 226 | ||||
| Total | $ | 3,022 | $ | 1,840 | ||
| (1) | Primarily relates to foreign exchange risks. |
| (2) | Includes revenues from government securities and corporate debt, municipal securities, mortgage securities and other debt instruments. Also includes spot and forward trading of currencies and exchange-traded and over-the-counter (OTC) currency options, options on fixed income securities, interest rate swaps, currency swaps, swap options, caps and floors, financial futures, OTC options and forward contracts on fixed income securities. |
| (3) | Includes revenues from foreign exchange spot, forward, option and swap contracts, as well as foreign currency translation (FX translation) gains and losses. |
| (4) | Includes revenues from common, preferred and convertible preferred stock, convertible corporate debt, equity-linked notes and exchange-traded and OTC equity options and warrants. |
| (5) | Primarily includes revenues from crude oil, refined oil products, natural gas and other commodities trades. |
| (6) | Includes revenues from structured credit products. |
| Three months ended March 31, | Three Months Ended March 31, | ||||||||||||||||||||||||||||||||||||||||||||||||||
| Pension plans | Postretirement benefit plans | Pension plans | Postretirement benefit plans | ||||||||||||||||||||||||||||||||||||||||||||||||
| U.S. plans | Non-U.S. plans | U.S. plans | Non-U.S. plans | U.S. plans | Non-U.S. plans | U.S. plans | Non-U.S. plans | ||||||||||||||||||||||||||||||||||||||||||||
| In millions of dollars | 2017 | 2016 | 2017 | 2016 | 2017 | 2016 | 2017 | 2016 | 2018 | 2017 | 2018 | 2017 | 2018 | 2017 | 2018 | 2017 | |||||||||||||||||||||||||||||||||||
| Qualified plans | |||||||||||||||||||||||||||||||||||||||||||||||||||
| Benefits earned during the period | $ | 1 | $ | 1 | $ | 36 | $ | 38 | $ | — | $ | — | $ | 2 | $ | 3 | $ | 1 | $ | 1 | $ | 38 | $ | 36 | $ | — | $ | — | $ | 2 | $ | 2 | |||||||||||||||||||
| Interest cost on benefit obligation | 132 | 141 | 71 | 73 | 6 | 8 | 24 | 24 | 123 | 139 | 75 | 71 | 6 | 6 | 26 | 24 | |||||||||||||||||||||||||||||||||||
| Expected return on plan assets | (216 | ) | (218 | ) | (70 | ) | (72 | ) | (1 | ) | (2 | ) | (21 | ) | (21 | ) | (213 | ) | (216 | ) | (78 | ) | (70 | ) | (3 | ) | (1 | ) | (23 | ) | (21 | ) | |||||||||||||||||||
| Amortization of unrecognized | |||||||||||||||||||||||||||||||||||||||||||||||||||
| Prior service benefit | — | — | (1 | ) | — | — | — | (2 | ) | (3 | ) | — | — | (1 | ) | (1 | ) | — | — | (2 | ) | (2 | ) | ||||||||||||||||||||||||||||
| Net actuarial loss (gain) | 41 | 36 | 16 | 19 | (1 | ) | — | 8 | 8 | 47 | 44 | 13 | 16 | — | (1 | ) | 7 | 8 | |||||||||||||||||||||||||||||||||
Curtailment gains(1) | — | — | — | (3 | ) | — | — | — | — | ||||||||||||||||||||||||||||||||||||||||||
Settlement loss(1) | — | — | — | 1 | — | — | — | — | — | — | 4 | — | — | — | — | — | |||||||||||||||||||||||||||||||||||
| Net qualified plans (benefit) expense | $ | (42 | ) | $ | (40 | ) | $ | 52 | $ | 56 | $ | 4 | $ | 6 | $ | 11 | $ | 11 | |||||||||||||||||||||||||||||||||
| Nonqualified plans expense | 10 | 10 | — | — | — | — | — | — | |||||||||||||||||||||||||||||||||||||||||||
| Total net (benefit) expense | $ | (32 | ) | $ | (30 | ) | $ | 52 | $ | 56 | $ | 4 | $ | 6 | $ | 11 | $ | 11 | $ | (42 | ) | $ | (32 | ) | $ | 51 | $ | 52 | $ | 3 | $ | 4 | $ | 10 | $ | 11 | |||||||||||||||
| (1) | Losses due to settlement relate to repositioning and divestiture activities. |
| Three months ended March 31, 2017 | Three Months Ended March 31, 2018 | ||||||||||||||||||||||||||
| Pension plans | Postretirement benefit plans | Pension plans | Postretirement benefit plans | ||||||||||||||||||||||||
| In millions of dollars | U.S. plans | Non-U.S. plans | U.S. plans | Non-U.S. plans | U.S. plans | Non-U.S. plans | U.S. plans | Non-U.S. plans | |||||||||||||||||||
| Change in projected benefit obligation | |||||||||||||||||||||||||||
| Projected benefit obligation at beginning of year | $ | 14,000 | $ | 6,522 | $ | 686 | $ | 1,141 | $ | 14,040 | $ | 7,433 | $ | 699 | $ | 1,261 | |||||||||||
| Plans measured annually | (28 | ) | (1,784 | ) | — | (303 | ) | (28 | ) | (1,987 | ) | — | (334 | ) | |||||||||||||
| Projected benefit obligation at beginning of year—Significant Plans | $ | 13,972 | $ | 4,738 | $ | 686 | $ | 838 | $ | 14,012 | $ | 5,446 | $ | 699 | $ | 927 | |||||||||||
| Benefits earned during the period | 1 | 21 | — | 2 | 1 | 22 | — | 2 | |||||||||||||||||||
| Interest cost on benefit obligation | 139 | 60 | 6 | 20 | 123 | 63 | 6 | 23 | |||||||||||||||||||
| Plan amendments | — | 5 | — | — | |||||||||||||||||||||||
| Actuarial loss | 72 | 134 | 3 | 39 | |||||||||||||||||||||||
| Benefits paid, net of participants’ contributions | (187 | ) | (75 | ) | (16 | ) | (11 | ) | |||||||||||||||||||
| Actuarial (gain) loss | (495 | ) | (6 | ) | (21 | ) | 5 | ||||||||||||||||||||
| Benefits paid, net of participants’ contributions and government subsidy | (205 | ) | (68 | ) | (17 | ) | (12 | ) | |||||||||||||||||||
| Foreign exchange impact and other | — | 657 | — | 84 | — | 140 | — | 71 | |||||||||||||||||||
| Projected benefit obligation at period end—Significant Plans | $ | 13,997 | $ | 5,540 | $ | 679 | $ | 972 | $ | 13,436 | $ | 5,597 | $ | 667 | $ | 1,016 | |||||||||||
| Three months ended March 31, 2017 | Three Months Ended March 31, 2018 | ||||||||||||||||||||||||||
| Pension plans | Postretirement benefit plans | Pension plans | Postretirement benefit plans | ||||||||||||||||||||||||
| In millions of dollars | U.S. plans | Non-U.S. plans | U.S. plans | Non-U.S. plans | U.S. plans | Non-U.S. plans | U.S. plans | Non-U.S. plans | |||||||||||||||||||
| Change in plan assets | |||||||||||||||||||||||||||
| Plan assets at fair value at beginning of year | $ | 12,363 | $ | 6,149 | $ | 129 | $ | 1,015 | $ | 12,725 | $ | 7,128 | $ | 262 | $ | 1,119 | |||||||||||
| Plans measured annually | — | (1,167 | ) | — | (11 | ) | — | (1,305 | ) | — | (10 | ) | |||||||||||||||
| Plan assets at fair value at beginning of year—Significant Plans | $ | 12,363 | $ | 4,982 | $ | 129 | $ | 1,004 | $ | 12,725 | $ | 5,823 | $ | 262 | $ | 1,109 | |||||||||||
| Actual return on plan assets | 333 | 179 | 4 | 36 | (157 | ) | 26 | — | (14 | ) | |||||||||||||||||
| Company contributions, net of reimbursements | 13 | 13 | 12 | — | 13 | 11 | (4 | ) | — | ||||||||||||||||||
| Plan participants’ contributions | — | 1 | — | — | |||||||||||||||||||||||
| Benefits paid, net of government subsidy | (187 | ) | (76 | ) | (16 | ) | (11 | ) | |||||||||||||||||||
Benefits paid, net of participants’ contributions and government subsidy | (205 | ) | (68 | ) | (17 | ) | (12 | ) | |||||||||||||||||||
| Foreign exchange impact and other | — | 786 | — | 99 | — | 146 | — | 84 | |||||||||||||||||||
| Plan assets at fair value at period end—Significant Plans | $ | 12,522 | $ | 5,885 | $ | 129 | $ | 1,128 | $ | 12,376 | $ | 5,938 | $ | 241 | $ | 1,167 | |||||||||||
| Funded status of the Significant Plans | |||||||||||||||||||||||||||
Qualified plans(1) | $ | (778 | ) | $ | 345 | $ | (550 | ) | $ | 156 | $ | (365 | ) | $ | 341 | $ | (426 | ) | $ | 151 | |||||||
| Nonqualified plans | (697 | ) | — | — | — | (695 | ) | — | — | — | |||||||||||||||||
| Funded status of the plans at period end—Significant Plans | $ | (1,475 | ) | $ | 345 | $ | (550 | ) | $ | 156 | $ | (1,060 | ) | $ | 341 | $ | (426 | ) | $ | 151 | |||||||
| Net amount recognized | |||||||||||||||||||||||||||
| Net amount recognized at period end | |||||||||||||||||||||||||||
| Benefit asset | $ | — | $ | 801 | $ | — | $ | 156 | $ | — | $ | 829 | $ | — | $ | 151 | |||||||||||
| Benefit liability | (1,475 | ) | (456 | ) | (550 | ) | — | (1,060 | ) | (488 | ) | (426 | ) | — | |||||||||||||
| Net amount recognized on the balance sheet—Significant Plans | $ | (1,475 | ) | $ | 345 | $ | (550 | ) | $ | 156 | $ | (1,060 | ) | $ | 341 | $ | (426 | ) | $ | 151 | |||||||
Amounts recognized in AOCI | |||||||||||||||||||||||||||
| Amounts recognized in AOCI at period end | Amounts recognized in AOCI at period end | ||||||||||||||||||||||||||
| Prior service benefit | $ | — | $ | 32 | $ | — | $ | 92 | $ | — | $ | 27 | $ | — | $ | 86 | |||||||||||
| Net actuarial gain (loss) | (6,795 | ) | (921 | ) | 104 | (372 | ) | ||||||||||||||||||||
| Net actuarial (loss) gain | (6,644 | ) | (882 | ) | 89 | (364 | ) | ||||||||||||||||||||
| Net amount recognized in equity (pretax)—Significant Plans | $ | (6,795 | ) | $ | (889 | ) | $ | 104 | $ | (280 | ) | $ | (6,644 | ) | $ | (855 | ) | $ | 89 | $ | (278 | ) | |||||
| Accumulated benefit obligation at period end—Significant Plans | $ | 13,991 | $ | 5,272 | $ | 679 | $ | 972 | $ | 13,430 | $ | 5,329 | $ | 667 | $ | 1,016 | |||||||||||
| (1) | The U.S. qualified pension plan is fully funded |
| In millions of dollars | Three months ended March 31, 2017 | Year ended December 31, 2016 | Three Months Ended March 31, 2018 | For Year Ended December 31, 2017 | |||||||||
Beginning of period balance, net of tax(1)(2) | $ | (5,164 | ) | $ | (5,116 | ) | $ | (6,183 | ) | $ | (5,164 | ) | |
| Actuarial assumptions changes and plan experience | (248 | ) | (854 | ) | 516 | (760 | ) | ||||||
| Net asset gain due to difference between actual and expected returns | 253 | 400 | |||||||||||
| Net asset (loss) gain due to difference between actual and expected returns | (451 | ) | 625 | ||||||||||
| Net amortization | 56 | 232 | 58 | 229 | |||||||||
| Prior service (cost) credit | (5 | ) | 28 | ||||||||||
| Prior service cost | — | (4 | ) | ||||||||||
Curtailment/settlement gain(3) | — | 17 | 4 | 17 | |||||||||
| Foreign exchange impact and other | (58 | ) | 99 | (36 | ) | (93 | ) | ||||||
Impact of Tax Reform(4) | — | (1,020 | ) | ||||||||||
| Change in deferred taxes, net | (10 | ) | 30 | (3 | ) | (13 | ) | ||||||
| Change, net of tax | $ | (12 | ) | $ | (48 | ) | $ | 88 | $ | (1,019 | ) | ||
End of period balance, net of tax(1)(2) | $ | (5,176 | ) | $ | (5,164 | ) | $ | (6,095 | ) | $ | (6,183 | ) | |
| (1) | See Note 17 to the Consolidated Financial Statements for further discussion of net AOCI balance. |
| (2) | Includes net-of-tax amounts for certain profit sharing plans outside the U.S. |
| (3) | Gains due to curtailment and settlement relate to repositioning and divestiture activities. |
| (4) | In the fourth quarter of 2017, the Company adopted ASU 2018-02, which transferred these amounts from AOCI to Retained earnings. See Note 1 to the 2017 Consolidated Financial Statements. |
| Net benefit (expense) assumed discount rates during the period | Three months ended | |||||
| Mar. 31, 2017 | Dec. 31, 2016 | Mar. 31, 2016 | ||||
| Net (benefit) expense assumed discount rates during the period | Three Months Ended | |||||
| Mar. 31, 2018 | Dec. 31, 2017 | Mar. 31, 2017 | ||||
| U.S. plans | ||||||
| Qualified pension | 4.10% | 3.55% | 4.40% | 3.60% | 3.75% | 4.10% |
| Nonqualified pension | 4.00 | 3.45 | 4.35 | 3.60 | 3.65 | 4.00 |
| Postretirement | 3.90 | 3.30 | 4.20 | 3.50 | 3.55 | 3.90 |
| Non-U.S. plans | ||||||
| Pension | 0.60-11.00 | 0.20-11.55 | 0.75-13.20 | 0.6-10.20 | 0.65-10.35 | 0.60-11.00 |
| Weighted average | 5.08 | 4.42 | 5.37 | 4.75 | 4.86 | 5.08 |
| Postretirement | 9.65 | 8.25 | 8.60 | 9.55 | 8.95 | 9.65 |
| Plan obligations assumed discount rates at period ended | Mar. 31, 2018 | Dec. 31, 2017 |
| U.S. plans | ||
| Qualified pension | 3.95% | 3.60% |
| Nonqualified pension | 3.95 | 3.60 |
| Postretirement | 3.90 | 3.50 |
| Non-U.S. plans | ||
| Pension | 0.75 -9.90 | 0.6-10.20 |
| Weighted average | 4.88 | 4.75 |
| Postretirement | 9.50 | 9.55 |
| Plan obligations assumed discount rates at period ended | Mar. 31, 2017 | Dec. 31, 2016 |
| U.S. plans | ||
| Qualified pension | 4.05% | 4.10% |
| Nonqualified pension | 3.95 | 4.00 |
| Postretirement | 3.85 | 3.90 |
| Non-U.S. plans | ||
| Pension | 0.55-10.45 | 0.60-11.00 |
| Weighted average | 4.83 | 5.08 |
| Postretirement | 9.25 | 9.65 |
| Three months ended March 31, 2017 | Three Months Ended March 31, 2018 | |||||||||||
| In millions of dollars | One-percentage-point increase | One-percentage-point decrease | One-percentage-point increase | One-percentage-point decrease | ||||||||
| Pension | ||||||||||||
| U.S. plans | $ | 7 | $ | (11 | ) | $ | 8 | $ | (12 | ) | ||
| Non-U.S. plans | (5 | ) | 7 | (3 | ) | 6 | ||||||
| Postretirement | ||||||||||||
| U.S. plans | $ | — | $ | — | — | (1 | ) | |||||
| Non-U.S. plans | (2 | ) | 2 | (2 | ) | 3 | ||||||
| Pension plans | Postretirement plans | Pension plans | Postretirement plans | ||||||||||||||||||||||||||||||||||||||||||||||||
U.S. plans (1) | Non-U.S. plans | U.S. plans | Non-U.S. plans | U.S. plans(1) | Non-U.S. plans | U.S. plans | Non-U.S. plans | ||||||||||||||||||||||||||||||||||||||||||||
| In millions of dollars | 2017 | 2016 | 2017 | 2016 | 2017 | 2016 | 2017 | 2016 | 2018 | 2017 | 2018 | 2017 | 2018 | 2017 | 2018 | 2017 | |||||||||||||||||||||||||||||||||||
Company contributions(2) for the three months ended March 31 | $ | 13 | $ | 15 | $ | 34 | $ | 32 | $ | 12 | $ | 6 | $ | 2 | $ | 2 | $ | 14 | $ | 13 | $ | 29 | $ | 34 | $ | — | $ | 12 | $ | 3 | $ | 2 | |||||||||||||||||||
| Company contributions made or expected to be made during the remainder of the year | 43 | 541 | 105 | 94 | — | — | 6 | 7 | 45 | 92 | 99 | 101 | — | 164 | 8 | 7 | |||||||||||||||||||||||||||||||||||
| (1) | The U.S. pension plans include benefits paid directly by the Company for the nonqualified pension plans. |
| (2) | Company contributions are composed of cash contributions made to the plans and benefits paid directly by the Company. |
| Three months ended March 31, | Three Months Ended March 31, | |||||||||||
| In millions of dollars | 2017 | 2016 | 2018 | 2017 | ||||||||
| U.S. plans | $ | 98 | $ | 96 | $ | 104 | $ | 98 | ||||
| Non-U.S. plans | 69 | 68 | 76 | 69 | ||||||||
| Three months ended March 31, | ||||||
| In millions of dollars | 2017 | 2016 | ||||
Service-related expense | ||||||
Interest cost on benefit obligation | $ | — | $ | 1 | ||
| Amortization of unrecognized | ||||||
| Prior service benefit | (8 | ) | (8 | ) | ||
| Net actuarial loss | 1 | 1 | ||||
| Total service-related benefit | $ | (7 | ) | $ | (6 | ) |
| Non-service-related expense | $ | 8 | $ | 8 | ||
| Total net benefit expense | $ | 1 | $ | 2 | ||
| Three Months Ended March 31, | ||||||
| In millions of dollars | 2018 | 2017 | ||||
Service-related expense | $ | — | $ | — | ||
| Interest cost on benefit obligation | — | — | ||||
| Amortization of unrecognized | ||||||
| Prior service benefit | (8 | ) | (8 | ) | ||
| Net actuarial loss | 1 | 1 | ||||
| Total service-related benefit | $ | (7 | ) | $ | (7 | ) |
| Non-service-related expense | $ | 6 | $ | 8 | ||
Total net (benefit) expense | $ | (1 | ) | $ | 1 | |
| Three months ended March 31, | Three Months Ended March 31, | |||||||||||
| In millions, except per-share amounts | 2017 | 2016 | 2018 | 2017 | ||||||||
| Income from continuing operations before attribution of noncontrolling interests | $ | 4,118 | $ | 3,508 | $ | 4,649 | $ | 4,118 | ||||
| Less: Noncontrolling interests from continuing operations | 10 | 5 | 22 | 10 | ||||||||
| Net income from continuing operations (for EPS purposes) | $ | 4,108 | $ | 3,503 | $ | 4,627 | $ | 4,108 | ||||
| Income (loss) from discontinued operations, net of taxes | (18 | ) | (2 | ) | (7 | ) | (18 | ) | ||||
| Citigroup's net income | $ | 4,090 | $ | 3,501 | $ | 4,620 | $ | 4,090 | ||||
Less: Preferred dividends(1) | 301 | 210 | 272 | 301 | ||||||||
| Net income available to common shareholders | $ | 3,789 | $ | 3,291 | $ | 4,348 | $ | 3,789 | ||||
| Less: Dividends and undistributed earnings allocated to employee restricted and deferred shares with nonforfeitable rights to dividends, applicable to basic EPS | 55 | 40 | 51 | 55 | ||||||||
| Net income allocated to common shareholders for basic EPS | $ | 3,734 | $ | 3,251 | $ | 4,297 | $ | 3,734 | ||||
| Net income allocated to common shareholders for diluted EPS | 3,734 | 3,251 | 4,297 | 3,734 | ||||||||
| Weighted-average common shares outstanding applicable to basic EPS | 2,765.3 | 2,943.0 | 2,561.6 | 2,765.3 | ||||||||
Effect of dilutive securities(2) | ||||||||||||
Options(3) | 0.2 | 0.1 | 0.1 | 0.2 | ||||||||
| Other employee plans | 1.3 | — | ||||||||||
Adjusted weighted-average common shares outstanding applicable to diluted EPS(4) | 2,765.5 | 2,943.1 | 2,563.0 | 2,765.5 | ||||||||
Basic earnings per share(5) | ||||||||||||
| Income from continuing operations | $ | 1.36 | $ | 1.11 | $ | 1.68 | $ | 1.36 | ||||
| Discontinued operations | (0.01 | ) | — | — | (0.01 | ) | ||||||
| Net income | $ | 1.35 | $ | 1.10 | $ | 1.68 | $ | 1.35 | ||||
Diluted earnings per share(5) | ||||||||||||
| Income from continuing operations | $ | 1.36 | $ | 1.11 | $ | 1.68 | $ | 1.36 | ||||
| Discontinued operations | (0.01 | ) | — | — | (0.01 | ) | ||||||
| Net income | $ | 1.35 | $ | 1.10 | $ | 1.68 | $ | 1.35 | ||||
| (1) |
| (2) | Warrants issued to the U.S. Treasury as part of the Troubled Asset Relief Program (TARP) and the loss-sharing agreement (all of which were subsequently sold to the public in January 2011), with exercise prices of $178.50 and |
| (3) | During the first quarters of |
| (4) | Due to rounding, common shares outstanding applicable to basic EPS and the effect of dilutive securities may not sum to common shares outstanding applicable to diluted EPS. |
| (5) | Due to rounding, earnings per share on continuing operations and discontinued operations may not sum to earnings per share on net income. |
| In millions of dollars | March 31, 2017 | December 31, 2016 | March 31, 2018 | December 31, 2017 | ||||||||
| Federal funds sold | $ | — | $ | — | $ | — | $ | — | ||||
| Securities purchased under agreements to resell | 134,924 | 131,473 | 133,616 | 130,984 | ||||||||
| Deposits paid for securities borrowed | 108,005 | 105,340 | 124,271 | 101,494 | ||||||||
Total(1) | $ | 242,929 | $ | 236,813 | $ | 257,887 | $ | 232,478 | ||||
| In millions of dollars | March 31, 2017 | December 31, 2016 | March 31, 2018 | December 31, 2017 | ||||||||
| Federal funds purchased | $ | 133 | $ | 178 | $ | 325 | $ | 326 | ||||
| Securities sold under agreements to repurchase | 133,129 | 125,685 | 157,550 | 142,646 | ||||||||
| Deposits received for securities loaned | 14,968 | 15,958 | 13,884 | 13,305 | ||||||||
Total(1) | $ | 148,230 | $ | 141,821 | $ | 171,759 | $ | 156,277 | ||||
| (1) | The above tables do not include securities-for-securities lending transactions of |
| As of March 31, 2017 | As of March 31, 2018 | |||||||||||||||||||||||||||||
| In millions of dollars | Gross amounts of recognized assets | Gross amounts offset on the Consolidated Balance Sheet(1) | Net amounts of assets included on the Consolidated Balance Sheet(2) | Amounts not offset on the Consolidated Balance Sheet but eligible for offsetting upon counterparty default(3) | Net amounts(4) | Gross amounts of recognized assets | Gross amounts offset on the Consolidated Balance Sheet(1) | Net amounts of assets included on the Consolidated Balance Sheet(2) | Amounts not offset on the Consolidated Balance Sheet but eligible for offsetting upon counterparty default(3) | Net amounts(4) | ||||||||||||||||||||
| Securities purchased under agreements to resell | $ | 185,844 | $ | 50,920 | $ | 134,924 | $ | 102,227 | $ | 32,697 | $ | 220,159 | $ | 86,543 | $ | 133,616 | $ | 101,046 | $ | 32,570 | ||||||||||
| Deposits paid for securities borrowed | 108,005 | — | 108,005 | 20,622 | 87,383 | 124,271 | — | 124,271 | 24,560 | 99,711 | ||||||||||||||||||||
| Total | $ | 293,849 | $ | 50,920 | $ | 242,929 | $ | 122,849 | $ | 120,080 | $ | 344,430 | $ | 86,543 | $ | 257,887 | $ | 125,606 | $ | 132,281 | ||||||||||
| In millions of dollars | Gross amounts of recognized liabilities | Gross amounts offset on the Consolidated Balance Sheet(1) | Net amounts of liabilities included on the Consolidated Balance Sheet(2) | Amounts not offset on the Consolidated Balance Sheet but eligible for offsetting upon counterparty default(3) | Net amounts(4) | Gross amounts of recognized liabilities | Gross amounts offset on the Consolidated Balance Sheet(1) | Net amounts of liabilities included on the Consolidated Balance Sheet(2) | Amounts not offset on the Consolidated Balance Sheet but eligible for offsetting upon counterparty default(3) | Net amounts(4) | ||||||||||||||||||||
| Securities sold under agreements to repurchase | $ | 184,049 | $ | 50,920 | $ | 133,129 | $ | 66,956 | $ | 66,173 | $ | 244,093 | $ | 86,543 | $ | 157,550 | $ | 79,626 | $ | 77,924 | ||||||||||
| Deposits received for securities loaned | 14,968 | — | 14,968 | 3,447 | 11,521 | 13,884 | — | 13,884 | 4,528 | 9,356 | ||||||||||||||||||||
| Total | $ | 199,017 | $ | 50,920 | $ | 148,097 | $ | 70,403 | $ | 77,694 | $ | 257,977 | $ | 86,543 | $ | 171,434 | $ | 84,154 | $ | 87,280 | ||||||||||
| As of December 31, 2016 | As of December 31, 2017 | |||||||||||||||||||||||||||||
| In millions of dollars | Gross amounts of recognized assets | Gross amounts offset on the Consolidated Balance Sheet(1) | Net amounts of assets included on the Consolidated Balance Sheet(2) | Amounts not offset on the Consolidated Balance Sheet but eligible for offsetting upon counterparty default(3) | Net amounts(4) | Gross amounts of recognized assets | Gross amounts offset on the Consolidated Balance Sheet(1) | Net amounts of assets included on the Consolidated Balance Sheet(2) | Amounts not offset on the Consolidated Balance Sheet but eligible for offsetting upon counterparty default(3) | Net amounts(4) | ||||||||||||||||||||
| Securities purchased under agreements to resell | $ | 176,284 | $ | 44,811 | $ | 131,473 | $ | 102,874 | $ | 28,599 | $ | 204,460 | $ | 73,476 | $ | 130,984 | $ | 103,022 | $ | 27,962 | ||||||||||
| Deposits paid for securities borrowed | 105,340 | — | 105,340 | 16,200 | 89,140 | 101,494 | — | 101,494 | 22,271 | 79,223 | ||||||||||||||||||||
| Total | $ | 281,624 | $ | 44,811 | $ | 236,813 | $ | 119,074 | $ | 117,739 | $ | 305,954 | $ | 73,476 | $ | 232,478 | $ | 125,293 | $ | 107,185 | ||||||||||
| In millions of dollars | Gross amounts of recognized liabilities | Gross amounts offset on the Consolidated Balance Sheet(1) | Net amounts of liabilities included on the Consolidated Balance Sheet(2) | Amounts not offset on the Consolidated Balance Sheet but eligible for offsetting upon counterparty default(3) | Net amounts(4) | Gross amounts of recognized liabilities | Gross amounts offset on the Consolidated Balance Sheet(1) | Net amounts of liabilities included on the Consolidated Balance Sheet(2) | Amounts not offset on the Consolidated Balance Sheet but eligible for offsetting upon counterparty default(3) | Net amounts(4) | ||||||||||||||||||||
| Securities sold under agreements to repurchase | $ | 170,496 | $ | 44,811 | $ | 125,685 | $ | 63,517 | $ | 62,168 | $ | 216,122 | $ | 73,476 | $ | 142,646 | $ | 73,716 | $ | 68,930 | ||||||||||
| Deposits received for securities loaned | 15,958 | — | 15,958 | 3,529 | 12,429 | 13,305 | — | 13,305 | 4,079 | 9,226 | ||||||||||||||||||||
| Total | $ | 186,454 | $ | 44,811 | $ | 141,643 | $ | 67,046 | $ | 74,597 | $ | 229,427 | $ | 73,476 | $ | 155,951 | $ | 77,795 | $ | 78,156 | ||||||||||
| (1) | Includes financial instruments subject to enforceable master netting agreements that are permitted to be offset under ASC 210-20-45. |
| (2) | The total of this column for each period excludes |
| (3) | Includes financial instruments subject to enforceable master netting agreements that are not permitted to be offset under ASC 210-20-45, but would be eligible for offsetting to the extent that an event of default has occurred and a legal opinion supporting enforceability of the offsetting right has been obtained. |
| (4) | Remaining exposures continue to be secured by financial collateral, but the Company may not have sought or been able to obtain a legal opinion evidencing enforceability of the offsetting right. |
| As of March 31, 2017 | As of March 31, 2018 | |||||||||||||||||||||||||||||
| In millions of dollars | Open and overnight | Up to 30 days | 31–90 days | Greater than 90 days | Total | Open and overnight | Up to 30 days | 31–90 days | Greater than 90 days | Total | ||||||||||||||||||||
| Securities sold under agreements to repurchase | $ | 82,260 | $ | 55,581 | $ | 20,438 | $ | 25,770 | $ | 184,049 | $ | 96,155 | $ | 77,118 | $ | 26,587 | $ | 44,233 | $ | 244,093 | ||||||||||
| Deposits received for securities loaned | 9,997 | 1,274 | 2,062 | 1,635 | 14,968 | 9,369 | 397 | 2,197 | 1,921 | 13,884 | ||||||||||||||||||||
| Total | $ | 92,257 | $ | 56,855 | $ | 22,500 | $ | 27,405 | $ | 199,017 | $ | 105,524 | $ | 77,515 | $ | 28,784 | $ | 46,154 | $ | 257,977 | ||||||||||
| As of December 31, 2016 | As of December 31, 2017 | |||||||||||||||||||||||||||||
| In millions of dollars | Open and overnight | Up to 30 days | 31–90 days | Greater than 90 days | Total | Open and overnight | Up to 30 days | 31–90 days | Greater than 90 days | Total | ||||||||||||||||||||
| Securities sold under agreements to repurchase | $ | 79,740 | $ | 50,399 | $ | 19,396 | $ | 20,961 | $ | 170,496 | $ | 82,073 | $ | 68,372 | $ | 33,846 | $ | 31,831 | $ | 216,122 | ||||||||||
| Deposits received for securities loaned | 10,813 | 2,169 | 2,044 | 932 | 15,958 | 9,946 | 266 | 1,912 | 1,181 | 13,305 | ||||||||||||||||||||
| Total | $ | 90,553 | $ | 52,568 | $ | 21,440 | $ | 21,893 | $ | 186,454 | $ | 92,019 | $ | 68,638 | $ | 35,758 | $ | 33,012 | $ | 229,427 | ||||||||||
| As of March 31, 2017 | As of March 31, 2018 | |||||||||||||||||
| In millions of dollars | Repurchase agreements | Securities lending agreements | Total | Repurchase agreements | Securities lending agreements | Total | ||||||||||||
| U.S. Treasury and federal agency securities | $ | 67,821 | $ | 78 | $ | 67,899 | $ | 72,336 | $ | — | $ | 72,336 | ||||||
| State and municipal securities | 794 | — | 794 | 1,794 | — | 1,794 | ||||||||||||
| Foreign government securities | 65,167 | 1,145 | 66,312 | 99,870 | 226 | 100,096 | ||||||||||||
| Corporate bonds | 19,098 | 698 | 19,796 | 23,168 | 691 | 23,859 | ||||||||||||
| Equity securities | 10,756 | 12,593 | 23,349 | 21,659 | 12,310 | 33,969 | ||||||||||||
| Mortgage-backed securities | 10,428 | — | 10,428 | 15,930 | — | 15,930 | ||||||||||||
| Asset-backed securities | 6,016 | — | 6,016 | 6,593 | — | 6,593 | ||||||||||||
| Other | 3,969 | 454 | 4,423 | 2,743 | 657 | 3,400 | ||||||||||||
| Total | $ | 184,049 | $ | 14,968 | $ | 199,017 | $ | 244,093 | $ | 13,884 | $ | 257,977 | ||||||
| As of December 31, 2016 | As of December 31, 2017 | |||||||||||||||||
| In millions of dollars | Repurchase agreements | Securities lending agreements | Total | Repurchase agreements | Securities lending agreements | Total | ||||||||||||
| U.S. Treasury and federal agency securities | $ | 66,263 | $ | — | $ | 66,263 | $ | 58,774 | $ | — | $ | 58,774 | ||||||
| State and municipal securities | 334 | — | 334 | 1,605 | — | 1,605 | ||||||||||||
| Foreign government securities | 52,988 | 1,390 | 54,378 | 89,576 | 105 | 89,681 | ||||||||||||
| Corporate bonds | 17,164 | 630 | 17,794 | 20,194 | 657 | 20,851 | ||||||||||||
| Equity securities | 12,206 | 13,913 | 26,119 | 20,724 | 11,907 | 32,631 | ||||||||||||
| Mortgage-backed securities | 11,421 | — | 11,421 | 17,791 | — | 17,791 | ||||||||||||
| Asset-backed securities | 5,428 | — | 5,428 | 5,479 | — | 5,479 | ||||||||||||
| Other | 4,692 | 25 | 4,717 | 1,979 | 636 | 2,615 | ||||||||||||
| Total | $ | 170,496 | $ | 15,958 | $ | 186,454 | $ | 216,122 | $ | 13,305 | $ | 229,427 | ||||||
| In millions of dollars | March 31, 2017 | December 31, 2016 | March 31, 2018 | December 31, 2017 | ||||||||
| Receivables from customers | $ | 12,452 | $ | 10,374 | $ | 19,186 | $ | 19,215 | ||||
| Receivables from brokers, dealers, and clearing organizations | 24,436 | 18,513 | ||||||||||
| Receivables from brokers, dealers and clearing organizations | 27,386 | 19,169 | ||||||||||
Total brokerage receivables(1) | $ | 36,888 | $ | 28,887 | $ | 46,572 | $ | 38,384 | ||||
| Payables to customers | $ | 37,769 | $ | 37,237 | $ | 43,122 | $ | 38,741 | ||||
| Payables to brokers, dealers, and clearing organizations | 21,886 | 19,915 | ||||||||||
| Payables to brokers, dealers and clearing organizations | 26,563 | 22,601 | ||||||||||
Total brokerage payables(1) | $ | 59,655 | $ | 57,152 | $ | 69,685 | $ | 61,342 | ||||
| (1) | Includes brokerage receivables and payables recorded by Citi broker-dealer entities that are accounted for in accordance with the AICPA Accounting Guide for Brokers and Dealers in Securities as codified in ASC 940-320. |
| In millions of dollars | March 31, 2017 | December 31, 2016 | |||||
| Securities available-for-sale (AFS) | $ | 290,282 | $ | 299,424 | |||
Debt securities held-to-maturity (HTM)(1) | 47,942 | 45,667 | |||||
Non-marketable equity securities carried at fair value(2) | 1,529 | 1,774 | |||||
Non-marketable equity securities carried at cost(3) | 6,080 | 6,439 | |||||
| Total investments | $ | 345,833 | $ | 353,304 | |||
| In millions of dollars | March 31, 2018 | |||
| Debt securities available-for-sale (AFS) | $ | 291,523 | ||
Debt securities held-to-maturity (HTM)(1) | 52,492 | |||
Marketable equity securities carried at fair value(2) | 277 | |||
Non-marketable equity securities carried at fair value(2) | 1,292 | |||
Non-marketable equity securities measured using the measurement alternative(3) | 401 | |||
Non-marketable equity securities carried at cost(4) | 5,986 | |||
| Total investments | $ | 351,971 | ||
| In millions of dollars | December 31, 2017 | |||
| Securities available-for-sale (AFS) | $ | 290,914 | ||
Debt securities held-to-maturity (HTM)(1) | 53,320 | |||
Non-marketable equity securities carried at fair value(2) | 1,206 | |||
Non-marketable equity securities carried at cost(4) | 6,850 | |||
| Total investments | $ | 352,290 | ||
| (1) | Carried at adjusted amortized cost basis, net of any credit-related impairment. |
| (2) | Unrealized gains and losses |
| (3) |
| Three months ended March 31, | Three Months Ended March 31, | |||||||||||
| In millions of dollars | 2017 | 2016 | 2018 | 2017 | ||||||||
| Taxable interest | $ | 1,760 | $ | 1,677 | $ | 2,042 | $ | 1,764 | ||||
| Interest exempt from U.S. federal income tax | 146 | 143 | 130 | 142 | ||||||||
| Dividend income | 54 | 35 | 62 | 54 | ||||||||
| Total interest and dividend income | $ | 1,960 | $ | 1,855 | $ | 2,234 | $ | 1,960 | ||||
| Three months ended March 31, | Three Months Ended March 31, | |||||||||||
| In millions of dollars | 2017 | 2016 | 2018 | 2017 | ||||||||
| Gross realized investment gains | $ | 288 | $ | 379 | $ | 345 | $ | 288 | ||||
| Gross realized investment losses | (96 | ) | (193 | ) | (175 | ) | (96 | ) | ||||
| Net realized gains on sale of investments | $ | 192 | $ | 186 | $ | 170 | $ | 192 | ||||
| March 31, 2017 | December 31, 2016 | March 31, 2018 | December 31, 2017 | |||||||||||||||||||||||||||||||||||||||||||||
| In millions of dollars | Amortized cost | Gross unrealized gains | Gross unrealized losses | Fair value | Amortized cost | Gross unrealized gains | Gross unrealized losses | Fair value | Amortized cost | Gross unrealized gains | Gross unrealized losses | Fair value | Amortized cost | Gross unrealized gains | Gross unrealized losses | Fair value | ||||||||||||||||||||||||||||||||
| Securities AFS | ||||||||||||||||||||||||||||||||||||||||||||||||
Mortgage-backed securities(1) | ||||||||||||||||||||||||||||||||||||||||||||||||
| U.S. government-sponsored agency guaranteed | $ | 35,951 | $ | 241 | $ | 489 | $ | 35,703 | $ | 38,663 | $ | 248 | $ | 506 | $ | 38,405 | $ | 42,147 | $ | 134 | $ | 993 | $ | 41,288 | $ | 42,116 | $ | 125 | $ | 500 | $ | 41,741 | ||||||||||||||||
| Prime | 2 | — | — | 2 | 2 | — | — | 2 | 6 | 3 | — | 9 | 11 | 6 | — | 17 | ||||||||||||||||||||||||||||||||
| Alt-A | 38 | 9 | — | 47 | 43 | 7 | — | 50 | 9 | 88 | — | 97 | 26 | 90 | — | 116 | ||||||||||||||||||||||||||||||||
| Non-U.S. residential | 3,416 | 31 | 22 | 3,425 | 3,852 | 13 | 7 | 3,858 | 2,645 | 10 | 2 | 2,653 | 2,744 | 13 | 6 | 2,751 | ||||||||||||||||||||||||||||||||
| Commercial | 360 | 1 | 1 | 360 | 357 | 2 | 1 | 358 | 310 | 1 | 3 | 308 | 334 | — | 2 | 332 | ||||||||||||||||||||||||||||||||
| Total mortgage-backed securities | $ | 39,767 | $ | 282 | $ | 512 | $ | 39,537 | $ | 42,917 | $ | 270 | $ | 514 | $ | 42,673 | $ | 45,117 | $ | 236 | $ | 998 | $ | 44,355 | $ | 45,231 | $ | 234 | $ | 508 | $ | 44,957 | ||||||||||||||||
| U.S. Treasury and federal agency securities | ||||||||||||||||||||||||||||||||||||||||||||||||
| U.S. Treasury | $ | 107,543 | $ | 637 | $ | 396 | $ | 107,784 | $ | 113,606 | $ | 629 | $ | 452 | $ | 113,783 | $ | 108,335 | $ | 74 | $ | 1,611 | $ | 106,798 | $ | 108,344 | $ | 77 | $ | 971 | $ | 107,450 | ||||||||||||||||
| Agency obligations | 9,910 | 23 | 70 | 9,863 | 9,952 | 21 | 85 | 9,888 | 10,689 | 5 | 178 | 10,516 | 10,813 | 7 | 124 | 10,696 | ||||||||||||||||||||||||||||||||
| Total U.S. Treasury and federal agency securities | $ | 117,453 | $ | 660 | $ | 466 | $ | 117,647 | $ | 123,558 | $ | 650 | $ | 537 | $ | 123,671 | $ | 119,024 | $ | 79 | $ | 1,789 | $ | 117,314 | $ | 119,157 | $ | 84 | $ | 1,095 | $ | 118,146 | ||||||||||||||||
| State and municipal | $ | 10,228 | $ | 81 | $ | 684 | $ | 9,625 | $ | 10,797 | $ | 80 | $ | 757 | $ | 10,120 | $ | 9,980 | $ | 126 | $ | 269 | $ | 9,837 | $ | 8,870 | $ | 140 | $ | 245 | $ | 8,765 | ||||||||||||||||
| Foreign government | 99,974 | 623 | 467 | 100,130 | 98,112 | 590 | 554 | 98,148 | 103,833 | 540 | 598 | 103,775 | 100,615 | 508 | 590 | 100,533 | ||||||||||||||||||||||||||||||||
| Corporate | 15,897 | 91 | 109 | 15,879 | 17,195 | 105 | 176 | 17,124 | 13,068 | 43 | 115 | 12,996 | 14,144 | 51 | 86 | 14,109 | ||||||||||||||||||||||||||||||||
Asset-backed securities(1) | 6,522 | 9 | 8 | 6,523 | 6,810 | 6 | 22 | 6,794 | 3,075 | 53 | 47 | 3,081 | 3,906 | 14 | 2 | 3,918 | ||||||||||||||||||||||||||||||||
| Other debt securities | 550 | — | — | 550 | 503 | — | — | 503 | 165 | — | — | 165 | 297 | — | — | 297 | ||||||||||||||||||||||||||||||||
| Total debt securities AFS | $ | 290,391 | $ | 1,746 | $ | 2,246 | $ | 289,891 | $ | 299,892 | $ | 1,701 | $ | 2,560 | $ | 299,033 | $ | 294,262 | $ | 1,077 | $ | 3,816 | $ | 291,523 | $ | 292,220 | $ | 1,031 | $ | 2,526 | $ | 290,725 | ||||||||||||||||
| Marketable equity securities AFS | $ | 368 | $ | 28 | $ | 5 | $ | 391 | $ | 377 | $ | 20 | $ | 6 | $ | 391 | $ | — | $ | — | $ | — | $ | — | $ | 186 | $ | 4 | $ | 1 | $ | 189 | ||||||||||||||||
| Total securities AFS | $ | 290,759 | $ | 1,774 | $ | 2,251 | $ | 290,282 | $ | 300,269 | $ | 1,721 | $ | 2,566 | $ | 299,424 | $ | 294,262 | $ | 1,077 | $ | 3,816 | $ | 291,523 | $ | 292,406 | $ | 1,035 | $ | 2,527 | $ | 290,914 | ||||||||||||||||
| (1) | The Company invests in mortgage-backed and asset-backed securities. These securitizations are generally considered VIEs. The Company’s maximum exposure to loss from these VIEs is equal to the carrying amount of the securities, which is reflected in the table above. For mortgage-backed and asset-backed securitizations in which the Company has other involvement, see Note 18 to the Consolidated Financial Statements. |
| (2) | In the second quarter of 2017, Citi early adopted ASU 2017-08, Receivables-Nonrefundable Fees and Other Costs (Subtopic 310-20): Premium Amortization on Purchased Callable Debt Securities. Upon adoption, a cumulative effect adjustment was recorded to reduce retained earnings, effective January 1, 2017, for the incremental amortization of purchase premiums and cumulative fair value hedge adjustments on callable state and municipal debt securities. For additional information, see Note 1 to the Consolidated Financial Statements. |
| (3) | Citi adopted ASU 2016-01 and ASU 2018-03 as of January 1, 2018, resulting in a cumulative effect adjustment from AOCI to retained earnings for net unrealized gains on marketable equity securities AFS. The available for sale category is eliminated for equity securities effective January 1, 2018. See Note 1 to the Consolidated Financial Statements for additional details. |
| Less than 12 months | 12 months or longer | Total | Less than 12 months | 12 months or longer | Total | |||||||||||||||||||||||||||||||
| In millions of dollars | Fair value | Gross unrealized losses | Fair value | Gross unrealized losses | Fair value | Gross unrealized losses | Fair value | Gross unrealized losses | Fair value | Gross unrealized losses | Fair value | Gross unrealized losses | ||||||||||||||||||||||||
| March 31, 2017 | ||||||||||||||||||||||||||||||||||||
| March 31, 2018 | ||||||||||||||||||||||||||||||||||||
Debt Securities AFS(1) | ||||||||||||||||||||||||||||||||||||
| Mortgage-backed securities | ||||||||||||||||||||||||||||||||||||
| U.S. government-sponsored agency guaranteed | $ | 32,313 | $ | 900 | $ | 1,873 | $ | 93 | $ | 34,186 | $ | 993 | ||||||||||||||||||||||||
| Non-U.S. residential | 891 | 2 | — | — | 891 | 2 | ||||||||||||||||||||||||||||||
| Commercial | 241 | 2 | 41 | 1 | 282 | 3 | ||||||||||||||||||||||||||||||
| Total mortgage-backed securities | $ | 33,445 | $ | 904 | $ | 1,914 | $ | 94 | $ | 35,359 | $ | 998 | ||||||||||||||||||||||||
| U.S. Treasury and federal agency securities | ||||||||||||||||||||||||||||||||||||
| U.S. Treasury | $ | 81,738 | $ | 1,417 | $ | 7,526 | $ | 194 | $ | 89,264 | $ | 1,611 | ||||||||||||||||||||||||
| Agency obligations | 7,964 | 144 | 1,567 | 34 | 9,531 | 178 | ||||||||||||||||||||||||||||||
| Total U.S. Treasury and federal agency securities | $ | 89,702 | $ | 1,561 | $ | 9,093 | $ | 228 | $ | 98,795 | $ | 1,789 | ||||||||||||||||||||||||
| State and municipal | $ | 2,250 | $ | 35 | $ | 1,116 | $ | 234 | $ | 3,366 | $ | 269 | ||||||||||||||||||||||||
| Foreign government | 46,459 | 371 | 9,972 | 227 | 56,431 | 598 | ||||||||||||||||||||||||||||||
| Corporate | 5,831 | 101 | 890 | 14 | 6,721 | 115 | ||||||||||||||||||||||||||||||
| Asset-backed securities | 699 | 47 | 20 | — | 719 | 47 | ||||||||||||||||||||||||||||||
| Other debt securities | 22 | — | — | — | 22 | — | ||||||||||||||||||||||||||||||
| Total debt securities AFS | $ | 178,408 | $ | 3,019 | $ | 23,005 | $ | 797 | $ | 201,413 | $ | 3,816 | ||||||||||||||||||||||||
| December 31, 2017 | ||||||||||||||||||||||||||||||||||||
| Securities AFS | ||||||||||||||||||||||||||||||||||||
| Mortgage-backed securities | ||||||||||||||||||||||||||||||||||||
| U.S. government-sponsored agency guaranteed | $ | 21,496 | $ | 423 | $ | 2,043 | $ | 66 | $ | 23,539 | $ | 489 | $ | 30,994 | $ | 438 | $ | 2,206 | $ | 62 | $ | 33,200 | $ | 500 | ||||||||||||
| Non-U.S. residential | 423 | 1 | 803 | 21 | 1,226 | 22 | 753 | 6 | — | — | 753 | 6 | ||||||||||||||||||||||||
| Commercial | 91 | 1 | 49 | — | 140 | 1 | 150 | 1 | 57 | 1 | 207 | 2 | ||||||||||||||||||||||||
| Total mortgage-backed securities | $ | 22,010 | $ | 425 | $ | 2,895 | $ | 87 | $ | 24,905 | $ | 512 | $ | 31,897 | $ | 445 | $ | 2,263 | $ | 63 | $ | 34,160 | $ | 508 | ||||||||||||
| U.S. Treasury and federal agency securities | ||||||||||||||||||||||||||||||||||||
| U.S. Treasury | $ | 38,221 | $ | 393 | $ | 955 | $ | 3 | $ | 39,176 | $ | 396 | $ | 79,050 | $ | 856 | $ | 7,404 | $ | 115 | $ | 86,454 | $ | 971 | ||||||||||||
| Agency obligations | 6,099 | 70 | 145 | — | 6,244 | 70 | 8,857 | 110 | 1,163 | 14 | 10,020 | 124 | ||||||||||||||||||||||||
| Total U.S. Treasury and federal agency securities | $ | 44,320 | $ | 463 | $ | 1,100 | $ | 3 | $ | 45,420 | $ | 466 | $ | 87,907 | $ | 966 | $ | 8,567 | $ | 129 | $ | 96,474 | $ | 1,095 | ||||||||||||
| State and municipal | $ | 1,039 | $ | 47 | $ | 2,883 | $ | 637 | $ | 3,922 | $ | 684 | $ | 1,009 | $ | 11 | $ | 1,155 | $ | 234 | $ | 2,164 | $ | 245 | ||||||||||||
| Foreign government | 33,770 | 173 | 11,624 | 294 | 45,394 | 467 | 53,206 | 356 | 9,051 | 234 | 62,257 | 590 | ||||||||||||||||||||||||
| Corporate | 6,278 | 93 | 881 | 16 | 7,159 | 109 | 6,737 | 74 | 859 | 12 | 7,596 | 86 | ||||||||||||||||||||||||
| Asset-backed securities | 221 | — | 1,369 | 8 | 1,590 | 8 | 449 | 1 | 25 | 1 | 474 | 2 | ||||||||||||||||||||||||
| Other debt securities | 70 | — | — | — | 70 | — | — | — | — | — | — | — | ||||||||||||||||||||||||
| Marketable equity securities AFS | 13 | 1 | 66 | 4 | 79 | 5 | ||||||||||||||||||||||||||||||
Marketable equity securities AFS(1) | 11 | 1 | — | — | 11 | 1 | ||||||||||||||||||||||||||||||
| Total securities AFS | $ | 107,721 | $ | 1,202 | $ | 20,818 | $ | 1,049 | $ | 128,539 | $ | 2,251 | $ | 181,216 | $ | 1,854 | $ | 21,920 | $ | 673 | $ | 203,136 | $ | 2,527 | ||||||||||||
| December 31, 2016 | ||||||||||||||||||||||||||||||||||||
| Securities AFS | ||||||||||||||||||||||||||||||||||||
| Mortgage-backed securities | ||||||||||||||||||||||||||||||||||||
| U.S. government-sponsored agency guaranteed | $ | 23,534 | $ | 436 | $ | 2,236 | $ | 70 | $ | 25,770 | $ | 506 | ||||||||||||||||||||||||
| Prime | 1 | — | — | — | 1 | — | ||||||||||||||||||||||||||||||
| Non-U.S. residential | 486 | — | 1,276 | 7 | 1,762 | 7 | ||||||||||||||||||||||||||||||
| Commercial | 75 | 1 | 58 | — | 133 | 1 | ||||||||||||||||||||||||||||||
| Total mortgage-backed securities | $ | 24,096 | $ | 437 | $ | 3,570 | $ | 77 | $ | 27,666 | $ | 514 | ||||||||||||||||||||||||
| U.S. Treasury and federal agency securities | ||||||||||||||||||||||||||||||||||||
| U.S. Treasury | $ | 44,342 | $ | 445 | $ | 1,335 | $ | 7 | $ | 45,677 | $ | 452 | ||||||||||||||||||||||||
| Agency obligations | 6,552 | 83 | 250 | 2 | 6,802 | 85 | ||||||||||||||||||||||||||||||
| Total U.S. Treasury and federal agency securities | $ | 50,894 | $ | 528 | $ | 1,585 | $ | 9 | $ | 52,479 | $ | 537 | ||||||||||||||||||||||||
| State and municipal | $ | 1,616 | $ | 55 | $ | 3,116 | $ | 702 | $ | 4,732 | $ | 757 | ||||||||||||||||||||||||
| Foreign government | 38,226 | 243 | 8,973 | 311 | 47,199 | 554 | ||||||||||||||||||||||||||||||
| Corporate | 7,011 | 129 | 1,877 | 47 | 8,888 | 176 | ||||||||||||||||||||||||||||||
| Asset-backed securities | 411 | — | 3,213 | 22 | 3,624 | 22 | ||||||||||||||||||||||||||||||
| Other debt securities | 5 | — | — | — | 5 | — | ||||||||||||||||||||||||||||||
| Marketable equity securities AFS | 19 | 2 | 24 | 4 | 43 | 6 | ||||||||||||||||||||||||||||||
| Total securities AFS | $ | 122,278 | $ | 1,394 | $ | 22,358 | $ | 1,172 | $ | 144,636 | $ | 2,566 | ||||||||||||||||||||||||
| (1) | Citi adopted ASU 2016-01 and ASU 2018-03 as of January 1, 2018, resulting in a cumulative effect adjustment from AOCI to retained earnings for net unrealized gains on marketable equity securities AFS. The available for sale category is eliminated for equity securities effective January 1, 2018. See Note 1 to the Consolidated Financial Statements for additional details. |
| March 31, 2017 | December 31, 2016 | March 31, 2018 | December 31, 2017 | |||||||||||||||||||||
| In millions of dollars | Amortized cost | Fair value | Amortized cost | Fair value | Amortized cost | Fair value | Amortized cost | Fair value | ||||||||||||||||
Mortgage-backed securities(1) | ||||||||||||||||||||||||
| Due within 1 year | $ | 127 | $ | 127 | $ | 132 | $ | 132 | $ | 92 | $ | 91 | $ | 45 | $ | 45 | ||||||||
| After 1 but within 5 years | 633 | 635 | 736 | 738 | 1,331 | 1,327 | 1,306 | 1,304 | ||||||||||||||||
| After 5 but within 10 years | 1,888 | 1,877 | 2,279 | 2,265 | 1,320 | 1,298 | 1,376 | 1,369 | ||||||||||||||||
After 10 years(2) | 37,119 | 36,898 | 39,770 | 39,538 | 42,374 | 41,639 | 42,504 | 42,239 | ||||||||||||||||
| Total | $ | 39,767 | $ | 39,537 | $ | 42,917 | $ | 42,673 | $ | 45,117 | $ | 44,355 | $ | 45,231 | $ | 44,957 | ||||||||
| U.S. Treasury and federal agency securities | ||||||||||||||||||||||||
| Due within 1 year | $ | 4,182 | $ | 4,161 | $ | 4,945 | $ | 4,945 | $ | 12,897 | $ | 12,906 | $ | 4,913 | $ | 4,907 | ||||||||
| After 1 but within 5 years | 101,314 | 101,367 | 101,369 | 101,323 | 104,061 | 102,375 | 111,236 | 110,238 | ||||||||||||||||
| After 5 but within 10 years | 11,920 | 12,082 | 17,153 | 17,314 | 2,066 | 2,033 | 3,008 | 3,001 | ||||||||||||||||
After 10 years(2) | 37 | 37 | 91 | 89 | — | — | — | — | ||||||||||||||||
| Total | $ | 117,453 | $ | 117,647 | $ | 123,558 | $ | 123,671 | $ | 119,024 | $ | 117,314 | $ | 119,157 | $ | 118,146 | ||||||||
| State and municipal | ||||||||||||||||||||||||
| Due within 1 year | $ | 2,057 | $ | 2,057 | $ | 2,093 | $ | 2,092 | $ | 1,874 | $ | 1,873 | $ | 1,792 | $ | 1,792 | ||||||||
| After 1 but within 5 years | 2,675 | 2,674 | 2,668 | 2,662 | 2,496 | 2,494 | 2,579 | 2,576 | ||||||||||||||||
| After 5 but within 10 years | 319 | 316 | 335 | 334 | 591 | 607 | 514 | 528 | ||||||||||||||||
After 10 years(2) | 5,177 | 4,578 | 5,701 | 5,032 | 5,019 | 4,863 | 3,985 | 3,869 | ||||||||||||||||
| Total | $ | 10,228 | $ | 9,625 | $ | 10,797 | $ | 10,120 | $ | 9,980 | $ | 9,837 | $ | 8,870 | $ | 8,765 | ||||||||
| Foreign government | ||||||||||||||||||||||||
| Due within 1 year | $ | 31,111 | $ | 31,140 | $ | 32,540 | $ | 32,547 | $ | 32,899 | $ | 32,909 | $ | 32,130 | $ | 32,100 | ||||||||
| After 1 but within 5 years | 53,827 | 53,747 | 51,008 | 50,881 | 55,910 | 55,571 | 53,034 | 53,165 | ||||||||||||||||
| After 5 but within 10 years | 12,402 | 12,478 | 12,388 | 12,440 | 12,454 | 12,639 | 12,949 | 12,680 | ||||||||||||||||
After 10 years(2) | 2,634 | 2,765 | 2,176 | 2,280 | 2,570 | 2,656 | 2,502 | 2,588 | ||||||||||||||||
| Total | $ | 99,974 | $ | 100,130 | $ | 98,112 | $ | 98,148 | $ | 103,833 | $ | 103,775 | $ | 100,615 | $ | 100,533 | ||||||||
All other(3) | ||||||||||||||||||||||||
| Due within 1 year | $ | 3,443 | $ | 3,243 | $ | 2,629 | $ | 2,628 | $ | 2,821 | $ | 2,818 | $ | 3,998 | $ | 3,991 | ||||||||
| After 1 but within 5 years | 10,306 | 10,526 | 12,339 | 12,334 | 9,147 | 9,092 | 9,047 | 9,027 | ||||||||||||||||
| After 5 but within 10 years | 6,250 | 6,242 | 6,566 | 6,528 | 2,905 | 2,907 | 3,415 | 3,431 | ||||||||||||||||
After 10 years(2) | 2,970 | 2,941 | 2,974 | 2,931 | 1,435 | 1,425 | 1,887 | 1,875 | ||||||||||||||||
| Total | $ | 22,969 | $ | 22,952 | $ | 24,508 | $ | 24,421 | $ | 16,308 | $ | 16,242 | $ | 18,347 | $ | 18,324 | ||||||||
| Total debt securities AFS | $ | 290,391 | $ | 289,891 | $ | 299,892 | $ | 299,033 | $ | 294,262 | $ | 291,523 | $ | 292,220 | $ | 290,725 | ||||||||
| (1) | Includes mortgage-backed securities of U.S. government-sponsored agencies. |
| (2) | Investments with no stated maturities are included as contractual maturities of greater than 10 years. Actual maturities may differ due to call or prepayment rights. |
| (3) | Includes corporate, asset-backed and other debt securities. |
| In millions of dollars | Amortized cost basis(1) | Net unrealized gains (losses) recognized in AOCI | Carrying value(2) | Gross unrealized gains | Gross unrealized (losses) | Fair value | Amortized cost basis(1) | Net unrealized gains (losses) recognized in AOCI | Carrying value(2) | Gross unrealized gains | Gross unrealized (losses) | Fair value | ||||||||||||||||||||||||
| March 31, 2017 | ||||||||||||||||||||||||||||||||||||
| March 31, 2018 | March 31, 2018 | |||||||||||||||||||||||||||||||||||
| Debt securities held-to-maturity | ||||||||||||||||||||||||||||||||||||
Mortgage-backed securities(3) | ||||||||||||||||||||||||||||||||||||
| U.S. government agency guaranteed | $ | 23,998 | $ | 27 | $ | 24,025 | $ | 46 | $ | (204 | ) | $ | 23,867 | $ | 23,968 | $ | (38 | ) | $ | 23,930 | $ | 8 | $ | (553 | ) | $ | 23,385 | |||||||||
| Prime | 7 | — | 7 | 10 | — | 17 | ||||||||||||||||||||||||||||||
| Alt-A | 303 | (25 | ) | 278 | 78 | — | 356 | — | — | — | — | — | — | |||||||||||||||||||||||
| Non-U.S. residential | 1,828 | (46 | ) | 1,782 | 60 | — | 1,842 | 1,492 | — | 1,492 | 25 | — | 1,517 | |||||||||||||||||||||||
| Commercial | 26 | — | 26 | — | — | 26 | 260 | — | 260 | — | — | 260 | ||||||||||||||||||||||||
| Total mortgage-backed securities | $ | 26,162 | $ | (44 | ) | $ | 26,118 | $ | 194 | $ | (204 | ) | $ | 26,108 | $ | 25,720 | $ | (38 | ) | $ | 25,682 | $ | 33 | $ | (553 | ) | $ | 25,162 | ||||||||
| State and municipal | $ | 9,530 | $ | (468 | ) | $ | 9,062 | $ | 163 | $ | (224 | ) | $ | 9,001 | $ | 7,686 | $ | (33 | ) | $ | 7,653 | $ | 185 | $ | (132 | ) | 7,706 | |||||||||
| Foreign government | 1,202 | — | 1,202 | — | (21 | ) | 1,181 | 1,354 | — | 1,354 | 3 | (12 | ) | 1,345 | ||||||||||||||||||||||
Asset-backed securities(3) | 11,565 | (5 | ) | 11,560 | 63 | (6 | ) | 11,617 | 17,803 | — | 17,803 | 87 | (3 | ) | 17,887 | |||||||||||||||||||||
| Total debt securities held-to-maturity | $ | 48,459 | $ | (517 | ) | $ | 47,942 | $ | 420 | $ | (455 | ) | $ | 47,907 | $ | 52,563 | $ | (71 | ) | $ | 52,492 | $ | 308 | $ | (700 | ) | $ | 52,100 | ||||||||
| December 31, 2016 | ||||||||||||||||||||||||||||||||||||
| December 31, 2017 | ||||||||||||||||||||||||||||||||||||
| Debt securities held-to-maturity | ||||||||||||||||||||||||||||||||||||
Mortgage-backed securities(3) | ||||||||||||||||||||||||||||||||||||
| U.S. government agency guaranteed | $ | 22,462 | $ | 33 | $ | 22,495 | $ | 47 | $ | (186 | ) | $ | 22,356 | $ | 23,854 | $ | 26 | $ | 23,880 | $ | 40 | $ | (157 | ) | $ | 23,763 | ||||||||||
| Prime | 31 | (7 | ) | 24 | 10 | (1 | ) | 33 | ||||||||||||||||||||||||||||
| Alt-A | 314 | (27 | ) | 287 | 69 | (1 | ) | 355 | 206 | (65 | ) | 141 | 57 | — | 198 | |||||||||||||||||||||
| Non-U.S. residential | 1,871 | (47 | ) | 1,824 | 49 | — | 1,873 | 1,887 | (46 | ) | 1,841 | 65 | — | 1,906 | ||||||||||||||||||||||
| Commercial | 14 | — | 14 | — | — | 14 | 237 | — | 237 | — | — | 237 | ||||||||||||||||||||||||
| Total mortgage-backed securities | $ | 24,692 | $ | (48 | ) | $ | 24,644 | $ | 175 | $ | (188 | ) | $ | 24,631 | $ | 26,184 | $ | (85 | ) | $ | 26,099 | $ | 162 | $ | (157 | ) | $ | 26,104 | ||||||||
| State and municipal | $ | 9,025 | $ | (442 | ) | $ | 8,583 | $ | 129 | $ | (238 | ) | $ | 8,474 | ||||||||||||||||||||||
State and municipal (4) | $ | 8,925 | $ | (28 | ) | $ | 8,897 | $ | 378 | $ | (73 | ) | $ | 9,202 | ||||||||||||||||||||||
| Foreign government | 1,339 | — | 1,339 | — | (26 | ) | 1,313 | 740 | — | 740 | — | (18 | ) | 722 | ||||||||||||||||||||||
Asset-backed securities(3) | 11,107 | (6 | ) | 11,101 | 41 | (5 | ) | 11,137 | 17,588 | (4 | ) | 17,584 | 162 | (22 | ) | 17,724 | ||||||||||||||||||||
Total debt securities held-to-maturity(4) | $ | 46,163 | $ | (496 | ) | $ | 45,667 | $ | 345 | $ | (457 | ) | $ | 45,555 | ||||||||||||||||||||||
| Total debt securities held-to-maturity | $ | 53,437 | $ | (117 | ) | $ | 53,320 | $ | 702 | $ | (270 | ) | $ | 53,752 | ||||||||||||||||||||||
| (1) | For debt securities transferred to HTM from Trading account assets, amortized cost basis is defined as the fair value of the securities at the date of transfer plus any accretion income and less any impairments recognized in earnings subsequent to transfer. For debt securities transferred to HTM from AFS, amortized cost is defined as the original purchase cost, adjusted for the cumulative accretion or amortization of any purchase discount or premium, plus or minus any cumulative fair value hedge adjustments, net of accretion or amortization, and less any other-than-temporary impairment recognized in earnings. |
| (2) | HTM debt securities are carried on the Consolidated Balance Sheet at amortized cost basis, plus or minus any unamortized unrealized gains and losses and fair value hedge adjustments recognized in AOCI prior to reclassifying the debt securities from AFS to HTM. Changes in the values of these securities are not reported in the financial statements, except for the amortization of any difference between the carrying value at the transfer date and par value of the securities, and the recognition of any non-credit fair value adjustments in AOCI in connection with the recognition of any credit impairment in earnings related to securities the Company continues to intend to hold until maturity. |
| (3) | The Company invests in mortgage-backed and asset-backed securities. These securitizations are generally considered VIEs. The Company’s maximum exposure to loss from these VIEs is equal to the carrying amount of the securities, which is reflected in the table above. For mortgage-backed and asset-backed securitizations in which the Company has other involvement, see Note 18 to the Consolidated Financial Statements. |
| (4) | In the |
| Less than 12 months | 12 months or longer | Total | Less than 12 months | 12 months or longer | Total | |||||||||||||||||||||||||||||||
| In millions of dollars | Fair value | Gross unrecognized losses | Fair value | Gross unrecognized losses | Fair value | Gross unrecognized losses | Fair value | Gross unrecognized losses | Fair value | Gross unrecognized losses | Fair value | Gross unrecognized losses | ||||||||||||||||||||||||
| March 31, 2017 | ||||||||||||||||||||||||||||||||||||
| March 31, 2018 | ||||||||||||||||||||||||||||||||||||
| Debt securities held-to-maturity | ||||||||||||||||||||||||||||||||||||
| Mortgage-backed securities | $ | 3 | $ | — | $ | 18,784 | $ | 204 | $ | 18,787 | $ | 204 | $ | 6,889 | $ | 98 | $ | 15,108 | $ | 455 | $ | 21,997 | $ | 553 | ||||||||||||
| State and municipal | 2,005 | 52 | 1,199 | 172 | 3,204 | 224 | 1,528 | 21 | 758 | 111 | 2,286 | 132 | ||||||||||||||||||||||||
| Foreign government | 1,181 | 21 | — | — | 1,181 | 21 | 1,344 | 12 | — | — | 1,344 | 12 | ||||||||||||||||||||||||
| Asset-backed securities | — | — | 1,348 | 6 | 1,348 | 6 | 36 | 3 | — | — | 36 | 3 | ||||||||||||||||||||||||
| Total debt securities held-to-maturity | $ | 3,189 | $ | 73 | $ | 21,331 | $ | 382 | $ | 24,520 | $ | 455 | $ | 9,797 | $ | 134 | $ | 15,866 | $ | 566 | $ | 25,663 | $ | 700 | ||||||||||||
| December 31, 2016 | ||||||||||||||||||||||||||||||||||||
| December 31, 2017 | ||||||||||||||||||||||||||||||||||||
| Debt securities held-to-maturity | ||||||||||||||||||||||||||||||||||||
| Mortgage-backed securities | $ | 17 | $ | — | $ | 17,176 | $ | 188 | $ | 17,193 | $ | 188 | $ | 6,244 | $ | 50 | $ | 8,678 | $ | 107 | $ | 14,922 | $ | 157 | ||||||||||||
| State and municipal | 2,200 | 58 | 1,210 | 180 | 3,410 | 238 | 353 | 5 | 835 | 68 | 1,188 | 73 | ||||||||||||||||||||||||
| Foreign government | 1,313 | 26 | — | — | 1,313 | 26 | 723 | 18 | — | — | 723 | 18 | ||||||||||||||||||||||||
| Asset-backed securities | 2 | — | 2,503 | 5 | 2,505 | 5 | 71 | 3 | 134 | 19 | 205 | 22 | ||||||||||||||||||||||||
| Total debt securities held-to-maturity | $ | 3,532 | $ | 84 | $ | 20,889 | $ | 373 | $ | 24,421 | $ | 457 | $ | 7,391 | $ | 76 | $ | 9,647 | $ | 194 | $ | 17,038 | $ | 270 | ||||||||||||
| March 31, 2017 | December 31, 2016 | March 31, 2018 | December 31, 2017 | |||||||||||||||||||||
| In millions of dollars | Carrying value | Fair value | Carrying value | Fair value | Carrying value | Fair value | Carrying value | Fair value | ||||||||||||||||
| Mortgage-backed securities | ||||||||||||||||||||||||
| Due within 1 year | $ | — | $ | — | $ | — | $ | — | $ | — | $ | — | $ | — | $ | — | ||||||||
| After 1 but within 5 years | 755 | 758 | 760 | 766 | 131 | 130 | 720 | 720 | ||||||||||||||||
| After 5 but within 10 years | 53 | 54 | 54 | 55 | 166 | 165 | 148 | 149 | ||||||||||||||||
After 10 years(1) | 25,310 | 25,296 | 23,830 | 23,810 | 25,385 | 24,867 | 25,231 | 25,235 | ||||||||||||||||
| Total | $ | 26,118 | $ | 26,108 | $ | 24,644 | $ | 24,631 | $ | 25,682 | $ | 25,162 | $ | 26,099 | $ | 26,104 | ||||||||
| State and municipal | ||||||||||||||||||||||||
| Due within 1 year | $ | 358 | $ | 358 | $ | 406 | $ | 406 | $ | 234 | $ | 234 | $ | 407 | $ | 425 | ||||||||
| After 1 but within 5 years | 147 | 148 | 112 | 110 | 380 | 398 | 259 | 270 | ||||||||||||||||
| After 5 but within 10 years | 344 | 349 | 363 | 367 | 438 | 442 | 512 | 524 | ||||||||||||||||
After 10 years(1) | 8,213 | 8,146 | 7,702 | 7,591 | 6,601 | 6,632 | 7,719 | 7,983 | ||||||||||||||||
| Total | $ | 9,062 | $ | 9,001 | $ | 8,583 | $ | 8,474 | $ | 7,653 | $ | 7,706 | $ | 8,897 | $ | 9,202 | ||||||||
| Foreign government | ||||||||||||||||||||||||
| Due within 1 year | $ | 637 | $ | 637 | $ | 824 | $ | 818 | $ | 486 | $ | 486 | $ | 381 | $ | 381 | ||||||||
| After 1 but within 5 years | 565 | 544 | 515 | 495 | 868 | 859 | 359 | 341 | ||||||||||||||||
| After 5 but within 10 years | — | — | — | — | — | — | — | — | ||||||||||||||||
After 10 years(1) | — | — | — | — | — | — | — | — | ||||||||||||||||
| Total | $ | 1,202 | $ | 1,181 | $ | 1,339 | $ | 1,313 | $ | 1,354 | $ | 1,345 | $ | 740 | $ | 722 | ||||||||
All other(2) | ||||||||||||||||||||||||
| Due within 1 year | $ | — | $ | — | $ | — | $ | — | $ | — | $ | — | $ | — | $ | — | ||||||||
| After 1 but within 5 years | — | — | — | — | — | — | — | — | ||||||||||||||||
| After 5 but within 10 years | 500 | 501 | 513 | 514 | 1,989 | 1,994 | 1,669 | 1,680 | ||||||||||||||||
After 10 years(1) | 11,060 | 11,116 | 10,588 | 10,623 | 15,814 | 15,893 | 15,915 | 16,044 | ||||||||||||||||
| Total | $ | 11,560 | $ | 11,617 | $ | 11,101 | $ | 11,137 | $ | 17,803 | $ | 17,887 | $ | 17,584 | $ | 17,724 | ||||||||
| Total debt securities held-to-maturity | $ | 47,942 | $ | 47,907 | $ | 45,667 | $ | 45,555 | $ | 52,492 | $ | 52,100 | $ | 53,320 | $ | 53,752 | ||||||||
| (1) | Investments with no stated maturities are included as contractual maturities of greater than 10 years. Actual maturities may differ due to call or prepayment rights. |
| (2) | Includes corporate and asset-backed securities. |
| OTTI on Investments and Other assets | Three months ended March 31, 2017 | |||||||||||
| In millions of dollars | AFS(1) | HTM | Other assets | Total | ||||||||
| Impairment losses related to securities that the Company does not intend to sell nor will likely be required to sell: | ||||||||||||
| Total OTTI losses recognized during the period | $ | — | $ | — | $ | — | $ | — | ||||
| Less: portion of impairment loss recognized in AOCI (before taxes) | — | — | — | — | ||||||||
| Net impairment losses recognized in earnings for securities that the Company does not intend to sell nor will likely be required to sell | $ | — | $ | — | $ | — | $ | — | ||||
| Impairment losses recognized in earnings for securities that the Company intends to sell, would be more likely than not required to sell or will be subject to an issuer call deemed probable of exercise | 11 | 1 | — | 12 | ||||||||
| Total impairment losses recognized in earnings | $ | 11 | $ | 1 | $ | — | $ | 12 | ||||
| OTTI on Investments | Three Months Ended March 31, 2018 | ||||||||
| In millions of dollars | AFS(1) | HTM | Total | ||||||
| Impairment losses related to debt securities that the Company does not intend to sell nor will likely be required to sell: | |||||||||
| Total OTTI losses recognized during the period | $ | — | $ | — | $ | — | |||
| Less: portion of impairment loss recognized in AOCI (before taxes) | — | — | — | ||||||
| Net impairment losses recognized in earnings for debt securities that the Company does not intend to sell nor will likely be required to sell | $ | — | $ | — | $ | — | |||
| Impairment losses recognized in earnings for debt securities that the Company intends to sell, would be more-likely-than-not required to sell or will be subject to an issuer call deemed probable of exercise | 27 | — | 27 | ||||||
| Total OTTI losses recognized in earnings | $ | 27 | $ | — | $ | 27 | |||
| (1) |
| OTTI on Investments and Other assets | Three months ended March 31, 2016 | ||||||||||||||||||||
| OTTI on Investments | Three months ended March 31, 2017 | ||||||||||||||||||||
| In millions of dollars | AFS(1)(2) | HTM | Other assets(3) | Total | AFS (1) | HTM | Total | ||||||||||||||
| Impairment losses related to securities that the Company does not intend to sell nor will likely be required to sell: | |||||||||||||||||||||
| Total OTTI losses recognized during the period | $ | 1 | $ | — | $ | — | $ | 1 | $ | — | $ | — | $ | — | |||||||
| Less: portion of impairment loss recognized in AOCI (before taxes) | — | — | — | — | — | — | — | ||||||||||||||
| Net impairment losses recognized in earnings for securities that the Company does not intend to sell nor will likely be required to sell | $ | 1 | $ | — | $ | — | $ | 1 | $ | — | $ | — | $ | — | |||||||
| Impairment losses recognized in earnings for securities that the Company intends to sell, would be more likely than not required to sell or will be subject to an issuer call deemed probable of exercise and FX losses | 195 | 7 | 262 | 464 | |||||||||||||||||
| Impairment losses recognized in earnings for securities that the Company intends to sell, would be more-likely-than-not required to sell or will be subject to an issuer call deemed probable of exercise and FX losses | 11 | 1 | 12 | ||||||||||||||||||
| Total impairment losses recognized in earnings | $ | 196 | $ | 7 | $ | 262 | $ | 465 | $ | 11 | $ | 1 | $ | 12 | |||||||
| (1) | Includes OTTI on non-marketable equity securities. |
| Cumulative OTTI credit losses recognized in earnings on securities still held | Cumulative OTTI credit losses recognized in earnings on debt securities still held | |||||||||||||||||||||||||||||
| In millions of dollars | Dec. 31, 2016 balance | Credit impairments recognized in earnings on securities not previously impaired | Credit impairments recognized in earnings on securities that have been previously impaired | Reductions due to credit-impaired securities sold, transferred or matured | March 31, 2017 balance | December 31, 2017 balance | Credit impairments recognized in earnings on securities not previously impaired | Credit impairments recognized in earnings on securities that have been previously impaired | Changes due to credit-impaired securities sold, transferred or matured(1) | March 31, 2018 balance | ||||||||||||||||||||
| AFS debt securities | ||||||||||||||||||||||||||||||
| Mortgage-backed securities | $ | — | $ | — | $ | — | $ | — | $ | — | $ | 38 | $ | — | $ | — | $ | (13 | ) | $ | 25 | |||||||||
| State and municipal | 4 | — | — | — | 4 | 4 | — | — | (4 | ) | — | |||||||||||||||||||
| Foreign government securities | — | — | — | — | — | — | — | — | — | — | ||||||||||||||||||||
| Corporate | 5 | — | — | (1 | ) | 4 | 4 | — | — | — | 4 | |||||||||||||||||||
| All other debt securities | 22 | — | — | — | 22 | 2 | — | — | — | 2 | ||||||||||||||||||||
| Total OTTI credit losses recognized for AFS debt securities | $ | 31 | $ | — | $ | — | $ | (1 | ) | $ | 30 | $ | 48 | $ | — | $ | — | $ | (17 | ) | $ | 31 | ||||||||
| HTM debt securities | ||||||||||||||||||||||||||||||
Mortgage-backed securities | $ | 101 | $ | — | $ | — | $ | (4 | ) | $ | 97 | $ | 54 | $ | — | $ | — | $ | (54 | ) | $ | — | ||||||||
| State and municipal | 3 | — | — | — | 3 | 3 | — | — | (3 | ) | — | |||||||||||||||||||
| Total OTTI credit losses recognized for HTM debt securities | $ | 104 | $ | — | $ | — | $ | (4 | ) | $ | 100 | $ | 57 | $ | — | $ | — | $ | (57 | ) | $ | — | ||||||||
| (1) | Includes $18 million in cumulative OTTI reclassified from HTM to AFS due to the transfer of the related debt securities from HTM to AFS. Citi adopted ASU 2017-12, Targeted Improvements to Accounting for Hedge Activities, on January 1, 2018 and transferred approximately $4 billion of HTM debt securities into AFS classification as permitted as a one-time transfer under the standard. |
| (2) | Primarily consists of Prime securities. |
| (3) | Primarily consists of Alt-A securities. |
| Cumulative OTTI credit losses recognized in earnings on securities still held | Cumulative OTTI credit losses recognized in earnings on debt securities still held | |||||||||||||||||||||||||||||
| In millions of dollars | Dec. 31, 2015 balance | Credit impairments recognized in earnings on securities not previously impaired | Credit impairments recognized in earnings on securities that have been previously impaired | Reductions due to credit-impaired securities sold, transferred or matured | Mar. 31, 2016 balance | December 31, 2016 balance | Credit impairments recognized in earnings on securities not previously impaired | Credit impairments recognized in earnings on securities that have been previously impaired | Reductions due to credit-impaired securities sold, transferred or matured | March 31, 2017 balance | ||||||||||||||||||||
| AFS debt securities | ||||||||||||||||||||||||||||||
| Mortgage-backed securities | $ | — | $ | — | $ | — | $ | — | $ | — | $ | — | $ | — | $ | — | $ | — | $ | — | ||||||||||
| State and municipal | 12 | — | — | (8 | ) | 4 | 4 | — | — | — | 4 | |||||||||||||||||||
| Foreign government securities | 5 | — | — | — | 5 | — | — | — | — | — | ||||||||||||||||||||
| Corporate | 9 | 1 | — | (3 | ) | 7 | 5 | — | — | (1 | ) | 4 | ||||||||||||||||||
| All other debt securities | 47 | — | — | (4 | ) | 43 | 22 | — | — | — | 22 | |||||||||||||||||||
| Total OTTI credit losses recognized for AFS debt securities | $ | 73 | $ | 1 | $ | — | $ | (15 | ) | $ | 59 | $ | 31 | $ | — | $ | — | $ | (1 | ) | $ | 30 | ||||||||
| HTM debt securities | ||||||||||||||||||||||||||||||
Mortgage-backed securities(1) | $ | 132 | $ | — | $ | — | $ | — | $ | 132 | $ | 101 | $ | — | $ | — | $ | (4 | ) | $ | 97 | |||||||||
| State and municipal | 4 | — | — | — | 4 | 3 | — | — | — | 3 | ||||||||||||||||||||
| Total OTTI credit losses recognized for HTM debt securities | $ | 136 | $ | — | $ | — | $ | — | $ | 136 | $ | 104 | $ | — | $ | — | $ | (4 | ) | $ | 100 | |||||||||
| (1) | Primarily consists of Alt-A securities. |
| In millions of dollars | Three Months Ended March 31, 2018 | ||
Measurement alternative, balance at March 31, 2018 | $ | 401 | |
Measurement alternative—impairment losses(1) | 1 | ||
Measurement alternative—downward changes for observable prices(1) | 2 | ||
Measurement alternative—upward changes for observable prices(1) | 123 | ||
| (1) | See Note 20 to the Consolidated Financial Statements for additional information on these nonrecurring fair value measurements. |
| Fair value | Unfunded commitments | Redemption frequency (if currently eligible) monthly, quarterly, annually | Redemption notice period | Fair value | Unfunded commitments | Redemption frequency (if currently eligible) monthly, quarterly, annually | Redemption notice period | |||||||||||||||||||||
| In millions of dollars | March 31, 2017 | December 31, 2016 | March 31, 2017 | December 31, 2016 | March 31, 2018 | December 31, 2017 | March 31, 2018 | December 31, 2017 | ||||||||||||||||||||
| Hedge funds | $ | 3 | $ | 4 | $ | — | $ | — | Generally quarterly | 10–95 days | $ | — | $ | 1 | $ | — | $ | — | Generally quarterly | 10–95 days | ||||||||
Private equity funds(1)(2) | 359 | 348 | 82 | 82 | — | 413 | 372 | 62 | 62 | — | ||||||||||||||||||
Real estate funds (2)(3) | 54 | 56 | 21 | 20 | — | 20 | 31 | 19 | 20 | — | ||||||||||||||||||
| Total | $ | 416 | $ | 408 | $ | 103 | $ | 102 | — | $ | 433 | $ | 404 | $ | 81 | $ | 82 | — | ||||||||||
| (1) | Private equity funds include funds that invest in infrastructure, emerging markets and venture capital. |
| (2) | With respect to the Company’s investments in private equity funds and real estate funds, distributions from each fund will be received as the underlying assets held by these funds are liquidated. It is estimated that the underlying assets of these funds will be liquidated over a period of several years as market conditions allow. Private equity and real estate funds do not allow redemption of investments by their investors. Investors are permitted to sell or transfer their investments, subject to the approval of the general partner or investment manager of these funds, which generally may not be unreasonably withheld. |
| (3) | Includes several real estate funds that invest primarily in commercial real estate in the U.S., Europe and Asia. |
| In millions of dollars | March 31, 2017 | December 31, 2016 | March 31, 2018 | December 31, 2017 | ||||||||
| In U.S. offices | ||||||||||||
Mortgage and real estate(1) | $ | 71,170 | $ | 72,957 | $ | 63,412 | $ | 65,467 | ||||
| Installment, revolving credit, and other | 3,252 | 3,395 | ||||||||||
| Installment, revolving credit and other | 3,306 | 3,398 | ||||||||||
| Cards | 125,799 | 132,654 | 131,081 | 139,006 | ||||||||
| Commercial and industrial | 7,434 | 7,159 | 7,493 | 7,840 | ||||||||
| $ | 207,655 | $ | 216,165 | $ | 205,292 | $ | 215,711 | |||||
| In offices outside the U.S. | ||||||||||||
Mortgage and real estate(1) | $ | 43,822 | $ | 42,803 | $ | 44,833 | $ | 44,081 | ||||
| Installment, revolving credit, and other | 26,014 | 24,887 | ||||||||||
| Installment, revolving credit and other | 27,651 | 26,556 | ||||||||||
| Cards | 24,497 | 23,783 | 25,993 | 26,257 | ||||||||
| Commercial and industrial | 17,728 | 16,568 | 20,526 | 20,238 | ||||||||
| Lease financing | 83 | 81 | 62 | 76 | ||||||||
| $ | 112,144 | $ | 108,122 | $ | 119,065 | $ | 117,208 | |||||
| Total consumer loans | $ | 319,799 | $ | 324,287 | $ | 324,357 | $ | 332,919 | ||||
| Net unearned income | $ | 757 | $ | 776 | $ | 727 | $ | 737 | ||||
| Consumer loans, net of unearned income | $ | 320,556 | $ | 325,063 | $ | 325,084 | $ | 333,656 | ||||
| (1) | Loans secured primarily by real estate. |
| In millions of dollars | Total current(1)(2) | 30–89 days past due(3) | ≥ 90 days past due(3) | Past due government guaranteed(4) | Total loans(2) | Total non-accrual | 90 days past due and accruing | Total current(1)(2) | 30–89 days past due(3) | ≥ 90 days past due(3) | Past due government guaranteed(4) | Total loans(2) | Total non-accrual | 90 days past due and accruing | ||||||||||||||||||||||||||||
| In North America offices | ||||||||||||||||||||||||||||||||||||||||||
Residential first mortgages(5) | $ | 50,423 | $ | 447 | $ | 299 | $ | 1,368 | $ | 52,537 | $ | 763 | $ | 1,117 | $ | 46,607 | $ | 364 | $ | 257 | $ | 1,010 | $ | 48,238 | $ | 636 | $ | 750 | ||||||||||||||
Home equity loans(6)(7) | 16,694 | 233 | 404 | — | 17,331 | 848 | — | 13,476 | 160 | 315 | — | 13,951 | 691 | — | ||||||||||||||||||||||||||||
| Credit cards | 123,638 | 1,362 | 1,433 | — | 126,433 | — | 1,433 | 128,790 | 1,460 | 1,528 | — | 131,778 | — | 1,528 | ||||||||||||||||||||||||||||
| Installment and other | 3,537 | 46 | 18 | — | 3,601 | 24 | 1 | 3,333 | 38 | 14 | — | 3,385 | 21 | |||||||||||||||||||||||||||||
| Commercial banking loans | 9,128 | 18 | 68 | — | 9,214 | 291 | 12 | 9,011 | 14 | 44 | — | 9,069 | 152 | 13 | ||||||||||||||||||||||||||||
| Total | $ | 203,420 | $ | 2,106 | $ | 2,222 | $ | 1,368 | $ | 209,116 | $ | 1,926 | $ | 2,563 | $ | 201,217 | $ | 2,036 | $ | 2,158 | $ | 1,010 | $ | 206,421 | $ | 1,500 | $ | 2,291 | ||||||||||||||
| In offices outside North America | ||||||||||||||||||||||||||||||||||||||||||
Residential first mortgages(5) | $ | 36,624 | $ | 245 | $ | 156 | $ | — | $ | 37,025 | $ | 400 | $ | — | $ | 37,447 | $ | 250 | $ | 147 | $ | — | $ | 37,844 | $ | 412 | $ | — | ||||||||||||||
| Credit cards | 23,272 | 394 | 331 | — | 23,997 | 272 | 242 | 24,702 | 437 | 373 | — | 25,512 | 323 | 256 | ||||||||||||||||||||||||||||
| Installment and other | 24,088 | 295 | 123 | — | 24,506 | 149 | — | 26,243 | 311 | 116 | — | 26,670 | 161 | — | ||||||||||||||||||||||||||||
| Commercial banking loans | 25,726 | 91 | 93 | — | 25,910 | 208 | — | 28,504 | 69 | 63 | — | 28,636 | 179 | — | ||||||||||||||||||||||||||||
| Total | $ | 109,710 | $ | 1,025 | $ | 703 | $ | — | $ | 111,438 | $ | 1,029 | $ | 242 | $ | 116,896 | $ | 1,067 | $ | 699 | $ | — | $ | 118,662 | $ | 1,075 | $ | 256 | ||||||||||||||
Total GCB and Corporate/Other consumer | $ | 313,130 | $ | 3,131 | $ | 2,925 | $ | 1,368 | $ | 320,554 | $ | 2,955 | $ | 2,805 | ||||||||||||||||||||||||||||
Total GCB and Corporate/Other— Consumer | $ | 318,113 | $ | 3,103 | $ | 2,857 | $ | 1,010 | $ | 325,083 | $ | 2,575 | $ | 2,547 | ||||||||||||||||||||||||||||
Other(8) | 2 | — | — | — | 2 | — | — | 1 | — | — | — | 1 | — | — | ||||||||||||||||||||||||||||
| Total Citigroup | $ | 313,132 | $ | 3,131 | $ | 2,925 | $ | 1,368 | $ | 320,556 | $ | 2,955 | $ | 2,805 | $ | 318,114 | $ | 3,103 | $ | 2,857 | $ | 1,010 | $ | 325,084 | $ | 2,575 | $ | 2,547 | ||||||||||||||
| (1) | Loans less than 30 days past due are presented as current. |
| (2) | Includes |
| (3) | Excludes loans guaranteed by U.S. government-sponsored entities. |
| (4) | Consists of residential first mortgages that are guaranteed by U.S. government-sponsored entities that are 30–89 days past due of $0.2 billion and 90 days or more past due of |
| (5) | Includes approximately $0.1 billion of residential first mortgage loans in process of foreclosure. |
| (6) | Includes approximately $0.1 billion of home equity loans in process of foreclosure. |
| (7) | Fixed-rate home equity loans and loans extended under home equity lines of credit, which are typically in junior lien positions. |
| (8) | Represents loans classified as consumer loans on the Consolidated Balance Sheet that are not included in |
| In millions of dollars | Total current(1)(2) | 30–89 days past due(3) | ≥ 90 days past due(3) | Past due government guaranteed(4) | Total loans(2) | Total non-accrual | 90 days past due and accruing | Total current(1)(2) | 30–89 days past due(3) | ≥ 90 days past due(3) | Past due government guaranteed(4) | Total loans(2) | Total non-accrual | 90 days past due and accruing | ||||||||||||||||||||||||||||
| In North America offices | ||||||||||||||||||||||||||||||||||||||||||
Residential first mortgages(5) | $ | 50,766 | $ | 522 | $ | 371 | $ | 1,474 | $ | 53,133 | $ | 848 | $ | 1,227 | $ | 47,366 | $ | 505 | $ | 280 | $ | 1,225 | $ | 49,376 | $ | 665 | $ | 941 | ||||||||||||||
Home equity loans(6)(7) | 18,767 | 249 | 438 | — | 19,454 | 914 | — | 14,268 | 207 | 352 | — | 14,827 | 750 | — | ||||||||||||||||||||||||||||
| Credit cards | 130,327 | 1,465 | 1,509 | — | 133,301 | — | 1,509 | 136,588 | 1,528 | 1,613 | — | 139,729 | — | 1,596 | ||||||||||||||||||||||||||||
| Installment and other | 4,486 | 106 | 38 | — | 4,630 | 70 | 2 | 3,395 | 45 | 16 | — | 3,456 | 22 | 1 | ||||||||||||||||||||||||||||
| Commercial banking loans | 8,876 | 23 | 74 | — | 8,973 | 328 | 14 | 9,395 | 51 | 65 | — | 9,511 | 213 | 15 | ||||||||||||||||||||||||||||
| Total | $ | 213,222 | $ | 2,365 | $ | 2,430 | $ | 1,474 | $ | 219,491 | $ | 2,160 | $ | 2,752 | $ | 211,012 | $ | 2,336 | $ | 2,326 | $ | 1,225 | $ | 216,899 | $ | 1,650 | $ | 2,553 | ||||||||||||||
| In offices outside North America | ||||||||||||||||||||||||||||||||||||||||||
Residential first mortgages(5) | $ | 35,862 | $ | 206 | $ | 135 | $ | — | $ | 36,203 | $ | 360 | $ | — | $ | 37,062 | $ | 209 | $ | 148 | $ | — | $ | 37,419 | $ | 400 | $ | — | ||||||||||||||
| Credit cards | 22,363 | 368 | 324 | — | 23,055 | 258 | 239 | 24,934 | 427 | 366 | — | 25,727 | 323 | 259 | ||||||||||||||||||||||||||||
| Installment and other | 22,683 | 264 | 126 | — | 23,073 | 163 | — | 25,634 | 275 | 123 | — | 26,032 | 157 | — | ||||||||||||||||||||||||||||
| Commercial banking loans | 23,054 | 72 | 112 | — | 23,238 | 217 | — | 27,449 | 57 | 72 | — | 27,578 | 160 | — | ||||||||||||||||||||||||||||
| Total | $ | 103,962 | $ | 910 | $ | 697 | $ | — | $ | 105,569 | $ | 998 | $ | 239 | $ | 115,079 | $ | 968 | $ | 709 | $ | — | $ | 116,756 | $ | 1,040 | $ | 259 | ||||||||||||||
Total GCB and Corporate/Other consumer | $ | 317,184 | $ | 3,275 | $ | 3,127 | $ | 1,474 | $ | 325,060 | $ | 3,158 | $ | 2,991 | ||||||||||||||||||||||||||||
Total GCB and Corporate/Other— Consumer | $ | 326,091 | $ | 3,304 | $ | 3,035 | $ | 1,225 | $ | 333,655 | $ | 2,690 | $ | 2,812 | ||||||||||||||||||||||||||||
Other(8) | 3 | — | — | — | 3 | — | — | 1 | — | — | — | 1 | — | — | ||||||||||||||||||||||||||||
| Total Citigroup | $ | 317,187 | $ | 3,275 | $ | 3,127 | $ | 1,474 | $ | 325,063 | $ | 3,158 | $ | 2,991 | $ | 326,092 | $ | 3,304 | $ | 3,035 | $ | 1,225 | $ | 333,656 | $ | 2,690 | $ | 2,812 | ||||||||||||||
| (1) | Loans less than 30 days past due are presented as current. |
| (2) | Includes |
| (3) | Excludes loans guaranteed by U.S. government-sponsored entities. |
| (4) | Consists of residential first mortgages that are guaranteed by U.S. government-sponsored entities that are 30–89 days past due of $0.2 billion and 90 days or more past due of |
| (5) | Includes approximately $0.1 billion of residential first mortgage loans in process of foreclosure. |
| (6) | Includes approximately $0.1 billion of home equity loans in process of foreclosure. |
| (7) | Fixed-rate home equity loans and loans extended under home equity lines of credit, which are typically in junior lien positions. |
| (8) | Represents loans classified as consumer loans on the Consolidated Balance Sheet that are not included in |
FICO score distribution in U.S. portfolio(1)(2) | March 31, 2017 | March 31, 2018 | |||||||||||||||||||
| In millions of dollars | Less than 620 | ≥ 620 but less than 660 | Equal to or greater than 660 | Less than 620 | ≥ 620 but less than 660 | ≥ 660 but less than 720 | Equal to or greater than 720 | ||||||||||||||
| Residential first mortgages | $ | 2,643 | $ | 2,323 | $ | 43,848 | $ | 1,750 | $ | 1,746 | $ | 6,655 | $ | 35,253 | |||||||
| Home equity loans | 1,650 | 1,330 | 13,935 | 1,075 | 937 | 3,138 | 8,409 | ||||||||||||||
| Credit cards | 8,631 | 11,270 | 103,156 | 9,169 | 11,285 | 37,275 | 70,598 | ||||||||||||||
| Installment and other | 281 | 274 | 2,479 | 146 | 229 | 681 | 1,710 | ||||||||||||||
| Total | $ | 13,205 | $ | 15,197 | $ | 163,418 | $ | 12,140 | $ | 14,197 | $ | 47,749 | $ | 115,970 | |||||||
FICO score distribution in U.S. portfolio(1)(2) | December 31, 2016 | December 31, 2017 | |||||||||||||||||||
In millions of dollars | Less than 620 | ≥ 620 but less than 660 | Equal to or greater than 660 | Less than 620 | ≥ 620 but less than 660 | ≥ 660 but less than 720 | Equal to or greater than 720 | ||||||||||||||
| Residential first mortgages | $ | 2,744 | $ | 2,422 | $ | 44,279 | $ | 2,100 | $ | 1,932 | $ | 6,931 | $ | 35,334 | |||||||
| Home equity loans | 1,750 | 1,418 | 14,743 | 1,379 | 1,081 | 3,446 | 8,530 | ||||||||||||||
| Credit cards | 8,310 | 11,320 | 110,522 | 9,079 | 11,651 | 37,916 | 77,661 | ||||||||||||||
| Installment and other | 284 | 271 | 2,601 | 276 | 250 | 667 | 1,818 | ||||||||||||||
| Total | $ | 13,088 | $ | 15,431 | $ | 172,145 | $ | 12,834 | $ | 14,914 | $ | 48,960 | $ | 123,343 | |||||||
| (1) | Excludes loans guaranteed by U.S. government entities, loans subject to long-term standby commitments (LTSC) with U.S. government-sponsored entities and loans recorded at fair value. |
| (2) | Excludes balances where FICO was not available. Such amounts are not material. |
LTV distribution in U.S. portfolio(1)(2) | March 31, 2017 | March 31, 2018 | ||||||||||||||||
| In millions of dollars | Less than or equal to 80% | > 80% but less than or equal to 100% | Greater than 100% | Less than or equal to 80% | > 80% but less than or equal to 100% | Greater than 100% | ||||||||||||
| Residential first mortgages | $ | 45,335 | $ | 3,358 | $ | 312 | $ | 42,790 | $ | 2,536 | $ | 214 | ||||||
| Home equity loans | 12,344 | 3,305 | 1,183 | 10,788 | 1,954 | 737 | ||||||||||||
| Total | $ | 57,679 | $ | 6,663 | $ | 1,495 | $ | 53,578 | $ | 4,490 | $ | 951 | ||||||
LTV distribution in U.S. portfolio(1)(2) | December 31, 2016 | December 31, 2017 | ||||||||||||||||
| In millions of dollars | Less than or equal to 80% | > 80% but less than or equal to 100% | Greater than 100% | Less than or equal to 80% | > 80% but less than or equal to 100% | Greater than 100% | ||||||||||||
| Residential first mortgages | $ | 45,849 | $ | 3,467 | $ | 324 | $ | 43,626 | $ | 2,578 | $ | 247 | ||||||
| Home equity loans | 12,869 | 3,653 | 1,305 | 11,403 | 2,147 | 800 | ||||||||||||
| Total | $ | 58,718 | $ | 7,120 | $ | 1,629 | $ | 55,029 | $ | 4,725 | $ | 1,047 | ||||||
| (1) | Excludes loans guaranteed by U.S. government entities, loans subject to LTSCs with U.S. government-sponsored entities and loans recorded at fair value. |
| (2) | Excludes balances where LTV was not available. Such amounts are not material. |
| Three months ended March 31, | Three Months Ended March 31, | |||||||||||||||||||||||||||||||||||
| Balance at March 31, 2017 | 2017 | 2016 | Balance at March 31, 2018 | 2018 | 2017 | |||||||||||||||||||||||||||||||
| In millions of dollars | Recorded investment(1)(2) | Unpaid principal balance | Related specific allowance(3) | Average carrying value (4) | Interest income recognized(5) | Interest income recognized(5) | Recorded investment(1)(2) | Unpaid principal balance | Related specific allowance(3) | Average carrying value (4) | Interest income recognized(5) | Interest income recognized(5) | ||||||||||||||||||||||||
| Mortgage and real estate | ||||||||||||||||||||||||||||||||||||
| Residential first mortgages | $ | 3,632 | $ | 3,995 | $ | 402 | $ | 4,116 | $ | 36 | $ | 61 | $ | 3,020 | $ | 3,123 | $ | 250 | $ | 3,002 | $ | 21 | $ | 36 | ||||||||||||
| Home equity loans | 1,219 | 1,720 | 281 | 1,289 | 8 | 9 | 673 | 893 | 211 | 1,044 | 7 | 8 | ||||||||||||||||||||||||
| Credit cards | 1,824 | 1,858 | 588 | 1,813 | 38 | 41 | 1,846 | 1,879 | 626 | 1,809 | 30 | 38 | ||||||||||||||||||||||||
| Installment and other | ||||||||||||||||||||||||||||||||||||
| Individual installment and other | 391 | 411 | 176 | 449 | 8 | 7 | 443 | 473 | 182 | 428 | 6 | 8 | ||||||||||||||||||||||||
| Commercial banking loans | 507 | 710 | 122 | 549 | 6 | 2 | ||||||||||||||||||||||||||||||
| Commercial banking | 287 | 500 | 26 | 374 | 3 | 6 | ||||||||||||||||||||||||||||||
| Total | $ | 7,573 | $ | 8,694 | $ | 1,569 | $ | 8,216 | $ | 96 | $ | 120 | $ | 6,269 | $ | 6,868 | $ | 1,295 | $ | 6,657 | $ | 67 | $ | 96 | ||||||||||||
| (1) | Recorded investment in a loan includes net deferred loan fees and costs, unamortized premium or discount and direct write-downs and includes accrued interest only on credit card loans. |
| (2) | $ |
| Balance, December 31, 2016 | Balance, December 31, 2017 | |||||||||||||||||||||||
| In millions of dollars | Recorded investment(1)(2) | Unpaid principal balance | Related specific allowance(3) | Average carrying value(4) | Recorded investment(1)(2) | Unpaid principal balance | Related specific allowance(3) | Average carrying value(4) | ||||||||||||||||
| Mortgage and real estate | ||||||||||||||||||||||||
| Residential first mortgages | $ | 3,786 | $ | 4,157 | $ | 540 | $ | 4,632 | $ | 2,877 | $ | 3,121 | $ | 278 | $ | 3,155 | ||||||||
| Home equity loans | 1,298 | 1,824 | 189 | 1,326 | 1,151 | 1,590 | 216 | 1,181 | ||||||||||||||||
| Credit cards | 1,747 | 1,781 | 566 | 1,831 | 1,787 | 1,819 | 614 | 1,803 | ||||||||||||||||
| Installment and other | ||||||||||||||||||||||||
| Individual installment and other | 455 | 481 | 215 | 475 | 431 | 460 | 175 | 415 | ||||||||||||||||
| Commercial banking loans | 513 | 744 | 98 | 538 | ||||||||||||||||||||
| Commercial banking | 334 | 541 | 51 | 429 | ||||||||||||||||||||
| Total | $ | 7,799 | $ | 8,987 | $ | 1,608 | $ | 8,802 | $ | 6,580 | $ | 7,531 | $ | 1,334 | $ | 6,983 | ||||||||
| (1) | Recorded investment in a loan includes net deferred loan fees and costs, unamortized premium or discount and direct write-downs and includes accrued interest only on credit card loans. |
| (2) | $ |
| (3) | Included in the Allowance for loan losses. |
| (4) | Average carrying value represents the average recorded investment ending balance for the last four quarters and does not include the related specific allowance. |
| At and for the three months ended March 31, 2017 | At and for the three months ended March 31, 2018 | |||||||||||||||||||||||||||||||
| In millions of dollars except number of loans modified | Number of loans modified | Post- modification recorded investment(1)(2) | Deferred principal(3) | Contingent principal forgiveness(4) | Principal forgiveness(5) | Average interest rate reduction | Number of loans modified | Post- modification recorded investment(1)(2) | Deferred principal(3) | Contingent principal forgiveness(4) | Principal forgiveness(5) | Average interest rate reduction | ||||||||||||||||||||
| North America | ||||||||||||||||||||||||||||||||
| Residential first mortgages | 966 | $ | 130 | $ | 3 | $ | — | $ | 1 | 1 | % | 588 | $ | 89 | $ | 1 | $ | — | $ | — | — | % | ||||||||||
| Home equity loans | 679 | 56 | 3 | — | — | 1 | 456 | 41 | 2 | — | — | 1 | ||||||||||||||||||||
| Credit cards | 59,337 | 231 | — | — | — | 17 | 63,203 | 244 | — | — | — | 18 | ||||||||||||||||||||
| Installment and other revolving | 221 | 2 | — | — | — | 5 | 342 | 3 | — | — | — | 5 | ||||||||||||||||||||
Commercial markets(6) | 26 | 5 | — | — | — | — | ||||||||||||||||||||||||||
Commercial banking(6) | 9 | 1 | — | — | — | — | ||||||||||||||||||||||||||
Total(8) | 61,229 | $ | 424 | $ | 6 | $ | — | $ | 1 | 64,598 | $ | 378 | $ | 3 | $ | — | $ | — | ||||||||||||||
| International | ||||||||||||||||||||||||||||||||
| Residential first mortgages | 613 | 27 | — | — | — | — | % | 549 | $ | 18 | $ | — | $ | — | $ | — | — | % | ||||||||||||||
| Credit cards | 25,237 | 85 | — | — | 2 | 14 | 23,394 | 94 | — | — | 2 | 15 | ||||||||||||||||||||
| Installment and other revolving | 11,307 | 60 | — | — | 4 | 7 | 9,325 | 59 | — | — | 2 | 10 | ||||||||||||||||||||
Commercial markets(6) | 32 | 13 | — | — | — | 2 | ||||||||||||||||||||||||||
Commercial banking(6) | 145 | 28 | — | — | — | 2 | ||||||||||||||||||||||||||
Total(8) | 37,189 | $ | 185 | $ | — | $ | — | $ | 6 | 33,413 | $ | 199 | $ | — | $ | — | $ | 4 | ||||||||||||||
| At and for the three months ended March 31, 2016 | At and for the three months ended March 31, 2017 | |||||||||||||||||||||||||||||||
| In millions of dollars except number of loans modified | Number of loans modified | Post- modification recorded investment(1)(7) | Deferred principal(3) | Contingent principal forgiveness(4) | Principal forgiveness(5) | Average interest rate reduction | Number of loans modified | Post- modification recorded investment(1)(7) | Deferred principal(3) | Contingent principal forgiveness(4) | Principal forgiveness(5) | Average interest rate reduction | ||||||||||||||||||||
| North America | ||||||||||||||||||||||||||||||||
| Residential first mortgages | 1,468 | $ | 212 | $ | 2 | $ | — | $ | 1 | 1 | % | 966 | $ | 130 | $ | 3 | $ | — | $ | 1 | 1 | % | ||||||||||
| Home equity loans | 858 | 30 | — | — | — | 3 | 679 | 56 | 3 | — | — | 1 | ||||||||||||||||||||
| Credit cards | 49,109 | 188 | — | — | — | 17 | 59,337 | 231 | — | — | — | 17 | ||||||||||||||||||||
| Installment and other revolving | 1,385 | 12 | — | — | — | 14 | 221 | 2 | — | — | — | 5 | ||||||||||||||||||||
Commercial markets(6) | 23 | 5 | — | — | — | — | ||||||||||||||||||||||||||
Commercial banking(6) | 26 | 5 | — | — | — | — | ||||||||||||||||||||||||||
Total(8) | 52,843 | $ | 447 | $ | 2 | $ | — | $ | 1 | 61,229 | $ | 424 | $ | 6 | $ | — | $ | 1 | ||||||||||||||
| International | ||||||||||||||||||||||||||||||||
| Residential first mortgages | 419 | 15 | — | — | — | — | % | 613 | $ | 27 | $ | — | $ | — | $ | — | — | % | ||||||||||||||
| Credit cards | 52,207 | 123 | — | — | 2 | 13 | 25,237 | 85 | — | — | 2 | 14 | ||||||||||||||||||||
| Installment and other revolving | 21,644 | 82 | — | — | 2 | 7 | 11,307 | 60 | — | — | 4 | 7 | ||||||||||||||||||||
Commercial markets(6) | 28 | 20 | — | — | — | — | ||||||||||||||||||||||||||
Commercial banking(6) | 32 | 13 | — | — | — | 2 | ||||||||||||||||||||||||||
Total(8) | 74,298 | $ | 240 | $ | — | $ | — | $ | 4 | 37,189 | $ | 185 | $ | — | $ | — | $ | 6 | ||||||||||||||
| (1) | Post-modification balances include past due amounts that are capitalized at the modification date. |
| (2) | Post-modification balances in North America include |
| (3) | Represents portion of contractual loan principal that is non-interest bearing, but still due from the borrower. Such deferred principal is charged off at the time of permanent modification to the extent that the related loan balance exceeds the underlying collateral value. |
| (4) | Represents portion of contractual loan principal that is non-interest bearing and, depending upon borrower performance, eligible for forgiveness. |
| (5) | Represents portion of contractual loan principal that was forgiven at the time of permanent modification. |
| Three months ended March 31, | Three Months Ended March 31, | |||||||||||
| In millions of dollars | 2017 | 2016 | 2018 | 2017 | ||||||||
| North America | ||||||||||||
| Residential first mortgages | $ | 51 | $ | 87 | $ | 44 | $ | 51 | ||||
| Home equity loans | 9 | 9 | 10 | 9 | ||||||||
| Credit cards | 52 | 49 | 59 | 52 | ||||||||
| Installment and other revolving | — | 2 | 1 | — | ||||||||
| Commercial banking | 2 | 1 | 8 | 2 | ||||||||
| Total | $ | 114 | $ | 148 | $ | 122 | $ | 114 | ||||
| International | ||||||||||||
| Residential first mortgages | $ | 2 | $ | 3 | $ | 2 | $ | 2 | ||||
| Credit cards | 42 | 37 | 53 | 42 | ||||||||
| Installment and other revolving | 23 | 22 | 24 | 23 | ||||||||
| Commercial banking | — | 3 | — | — | ||||||||
| Total | $ | 67 | $ | 65 | $ | 79 | $ | 67 | ||||
| In millions of dollars | March 31, 2017 | December 31, 2016 | March 31, 2018 | December 31, 2017 | ||||||||
| In U.S. offices | ||||||||||||
| Commercial and industrial | $ | 49,845 | $ | 49,586 | $ | 54,005 | $ | 51,319 | ||||
| Financial institutions | 35,734 | 35,517 | 40,472 | 39,128 | ||||||||
Mortgage and real estate(1) | 40,052 | 38,691 | 45,581 | 44,683 | ||||||||
| Installment, revolving credit and other | 32,212 | 34,501 | 32,866 | 33,181 | ||||||||
| Lease financing | 1,511 | 1,518 | 1,463 | 1,470 | ||||||||
| $ | 159,354 | $ | 159,813 | $ | 174,387 | $ | 169,781 | |||||
| In offices outside the U.S. | ||||||||||||
| Commercial and industrial | $ | 87,258 | $ | 81,882 | $ | 101,368 | $ | 93,750 | ||||
| Financial institutions | 33,763 | 26,886 | 35,659 | 35,273 | ||||||||
Mortgage and real estate(1) | 5,527 | 5,363 | 7,543 | 7,309 | ||||||||
| Installment, revolving credit and other | 16,576 | 19,965 | 23,338 | 22,638 | ||||||||
| Lease financing | 253 | 251 | 167 | 190 | ||||||||
| Governments and official institutions | 5,970 | 5,850 | 6,170 | 5,200 | ||||||||
| $ | 149,347 | $ | 140,197 | $ | 174,245 | $ | 164,360 | |||||
| Total corporate loans | $ | 308,701 | $ | 300,010 | $ | 348,632 | $ | 334,141 | ||||
| Net unearned income | (662 | ) | (704 | ) | $ | (778 | ) | $ | (763 | ) | ||
| Corporate loans, net of unearned income | $ | 308,039 | $ | 299,306 | $ | 347,854 | $ | 333,378 | ||||
| (1) | Loans secured primarily by real estate. |
| In millions of dollars | 30–89 days past due and accruing(1) | ≥ 90 days past due and accruing(1) | Total past due and accruing | Total non-accrual(2) | Total current(3) | Total loans (4) | 30–89 days past due and accruing(1) | ≥ 90 days past due and accruing(1) | Total past due and accruing | Total non-accrual(2) | Total current(3) | Total loans (4) | ||||||||||||||||||||||||
| Commercial and industrial | $ | 170 | $ | — | $ | 170 | $ | 1,692 | $ | 132,583 | $ | 134,445 | $ | 478 | $ | 77 | $ | 555 | $ | 1,260 | $ | 149,912 | $ | 151,727 | ||||||||||||
| Financial institutions | 215 | 18 | 233 | 301 | 67,478 | 68,012 | 63 | 22 | 85 | 87 | 74,840 | 75,012 | ||||||||||||||||||||||||
| Mortgage and real estate | 211 | — | 211 | 181 | 45,172 | 45,564 | 131 | 14 | 145 | 192 | 52,772 | 53,109 | ||||||||||||||||||||||||
| Leases | 98 | 8 | 106 | 67 | 1,591 | 1,764 | 22 | — | 22 | 43 | 1,564 | 1,629 | ||||||||||||||||||||||||
| Other | 427 | 3 | 430 | 98 | 53,719 | 54,247 | 188 | 7 | 195 | 86 | 61,583 | 61,864 | ||||||||||||||||||||||||
| Loans at fair value | 4,007 | 4,513 | ||||||||||||||||||||||||||||||||||
| Purchased distressed loans | — | — | ||||||||||||||||||||||||||||||||||
| Total | $ | 1,121 | $ | 29 | $ | 1,150 | $ | 2,339 | $ | 300,543 | $ | 308,039 | $ | 882 | $ | 120 | $ | 1,002 | $ | 1,668 | $ | 340,671 | $ | 347,854 | ||||||||||||
| In millions of dollars | 30–89 days past due and accruing(1) | ≥ 90 days past due and accruing(1) | Total past due and accruing | Total non-accrual(2) | Total current(3) | Total loans (4) | 30–89 days past due and accruing(1) | ≥ 90 days past due and accruing(1) | Total past due and accruing | Total non-accrual(2) | Total current(3) | Total loans (4) | ||||||||||||||||||||||||
| Commercial and industrial | $ | 143 | $ | 52 | $ | 195 | $ | 1,909 | $ | 127,012 | $ | 129,116 | $ | 249 | $ | 13 | $ | 262 | $ | 1,506 | $ | 139,554 | $ | 141,322 | ||||||||||||
| Financial institutions | 119 | 2 | 121 | 185 | 61,254 | 61,560 | 93 | 15 | 108 | 92 | 73,557 | 73,757 | ||||||||||||||||||||||||
| Mortgage and real estate | 148 | 137 | 285 | 139 | 43,607 | 44,031 | 147 | 59 | 206 | 195 | 51,563 | 51,964 | ||||||||||||||||||||||||
| Leases | 27 | 8 | 35 | 56 | 1,678 | 1,769 | 68 | 8 | 76 | 46 | 1,533 | 1,655 | ||||||||||||||||||||||||
| Other | 349 | 12 | 361 | 132 | 58,880 | 59,373 | 70 | 13 | 83 | 103 | 60,145 | 60,331 | ||||||||||||||||||||||||
| Loans at fair value | 3,457 | 4,349 | ||||||||||||||||||||||||||||||||||
| Purchased distressed loans | — | — | ||||||||||||||||||||||||||||||||||
| Total | $ | 786 | $ | 211 | $ | 997 | $ | 2,421 | $ | 292,431 | $ | 299,306 | $ | 627 | $ | 108 | $ | 735 | $ | 1,942 | $ | 326,352 | $ | 333,378 | ||||||||||||
| (1) | Corporate loans that are 90 days past due are generally classified as non-accrual. Corporate loans are considered past due when principal or interest is contractually due but unpaid. |
| (2) | Non-accrual loans generally include those loans that are ≥ 90 days past due or those loans for which Citi believes, based on actual experience and a forward-looking assessment of the collectability of the loan in full, that the payment of interest or principal is doubtful. |
| (3) |
| (4) | Total loans include loans at fair value, which are not included in the various delinquency columns. |
Recorded investment in loans(1) | Recorded investment in loans(1) | |||||||||||
| In millions of dollars | March 31, 2017 | December 31, 2016 | March 31, 2018 | December 31, 2017 | ||||||||
Investment grade(2) | ||||||||||||
| Commercial and industrial | $ | 90,753 | $ | 85,369 | $ | 108,881 | $ | 101,313 | ||||
| Financial institutions | 55,422 | 49,915 | 62,082 | 60,404 | ||||||||
| Mortgage and real estate | 19,901 | 18,718 | 23,831 | 23,213 | ||||||||
| Leases | 1,169 | 1,303 | 1,063 | 1,090 | ||||||||
| Other | 47,307 | 51,930 | 57,863 | 56,306 | ||||||||
| Total investment grade | $ | 214,552 | $ | 207,235 | $ | 253,720 | $ | 242,326 | ||||
Non-investment grade(2) | ||||||||||||
| Accrual | ||||||||||||
| Commercial and industrial | $ | 41,999 | $ | 41,838 | $ | 41,586 | $ | 38,503 | ||||
| Financial institutions | 12,288 | 11,459 | 12,843 | 13,261 | ||||||||
| Mortgage and real estate | 1,865 | 1,821 | 3,226 | 2,881 | ||||||||
| Leases | 528 | 410 | 523 | 518 | ||||||||
| Other | 6,843 | 7,312 | 3,915 | 3,924 | ||||||||
| Non-accrual | ||||||||||||
| Commercial and industrial | 1,692 | 1,909 | 1,260 | 1,506 | ||||||||
| Financial institutions | 301 | 185 | 87 | 92 | ||||||||
| Mortgage and real estate | 181 | 139 | 192 | 195 | ||||||||
| Leases | 67 | 56 | 43 | 46 | ||||||||
| Other | 98 | 132 | 86 | 103 | ||||||||
| Total non-investment grade | $ | 65,862 | $ | 65,261 | $ | 63,761 | $ | 61,029 | ||||
Private bank loans managed on a delinquency basis(2) | $ | 23,618 | $ | 23,353 | ||||||||
Non-rated private bank loans managed on a delinquency basis(2) | $ | 25,860 | $ | 25,674 | ||||||||
| Loans at fair value | 4,007 | 3,457 | 4,513 | 4,349 | ||||||||
| Corporate loans, net of unearned income | $ | 308,039 | $ | 299,306 | $ | 347,854 | $ | 333,378 | ||||
| (1) | Recorded investment in a loan includes net deferred loan fees and costs, unamortized premium or discount, less any direct write-downs. |
| (2) | Held-for-investment loans are accounted for on an amortized cost basis. |
| March 31, 2017 | March 31, 2018 | Three Months Ended March 31, 2018 | ||||||||||||||||||||||||||||
| In millions of dollars | Recorded investment(1) | Unpaid principal balance | Related specific allowance | Average carrying value(2) | Interest income recognized(3) | Recorded investment(1) | Unpaid principal balance | Related specific allowance | Average carrying value(2) | Interest income recognized(3) | ||||||||||||||||||||
| Non-accrual corporate loans | ||||||||||||||||||||||||||||||
| Commercial and industrial | $ | 1,692 | $ | 2,040 | $ | 332 | $ | 1,876 | $ | 2 | $ | 1,260 | $ | 1,501 | $ | 227 | $ | 1,439 | $ | 3 | ||||||||||
| Financial institutions | 301 | 324 | 37 | 217 | — | 87 | 102 | 25 | 159 | — | ||||||||||||||||||||
| Mortgage and real estate | 181 | 309 | 9 | 168 | — | 192 | 349 | 10 | 186 | 1 | ||||||||||||||||||||
| Lease financing | 67 | 67 | 4 | 60 | — | 43 | 43 | 4 | 53 | — | ||||||||||||||||||||
| Other | 98 | 205 | — | 88 | — | 86 | 195 | 5 | 105 | — | ||||||||||||||||||||
| Total non-accrual corporate loans | $ | 2,339 | $ | 2,945 | $ | 382 | $ | 2,409 | $ | 2 | $ | 1,668 | $ | 2,190 | $ | 271 | $ | 1,942 | $ | 4 | ||||||||||
| December 31, 2016 | December 31, 2017 | |||||||||||||||||||||||
| In millions of dollars | Recorded investment(1) | Unpaid principal balance | Related specific allowance | Average carrying value(2) | Recorded investment(1) | Unpaid principal balance | Related specific allowance | Average carrying value(2) | ||||||||||||||||
| Non-accrual corporate loans | ||||||||||||||||||||||||
| Commercial and industrial | $ | 1,909 | $ | 2,259 | $ | 362 | $ | 1,919 | $ | 1,506 | $ | 1,775 | $ | 368 | $ | 1,547 | ||||||||
| Financial institutions | 185 | 192 | 16 | 183 | 92 | 102 | 41 | 212 | ||||||||||||||||
| Mortgage and real estate | 139 | 250 | 10 | 174 | 195 | 324 | 11 | 183 | ||||||||||||||||
| Lease financing | 56 | 56 | 4 | 44 | 46 | 46 | 4 | 59 | ||||||||||||||||
| Other | 132 | 197 | — | 87 | 103 | 212 | 2 | 108 | ||||||||||||||||
| Total non-accrual corporate loans | $ | 2,421 | $ | 2,954 | $ | 392 | $ | 2,407 | $ | 1,942 | $ | 2,459 | $ | 426 | $ | 2,109 | ||||||||
| March 31, 2017 | December 31, 2016 | March 31, 2018 | December 31, 2017 | |||||||||||||||||||||
| In millions of dollars | Recorded investment(1) | Related specific allowance | Recorded investment(1) | Related specific allowance | Recorded investment(1) | Related specific allowance | Recorded investment(1) | Related specific allowance | ||||||||||||||||
| Non-accrual corporate loans with valuation allowances | ||||||||||||||||||||||||
| Commercial and industrial | $ | 1,103 | $ | 332 | $ | 1,343 | $ | 362 | $ | 574 | $ | 227 | $ | 1,017 | $ | 368 | ||||||||
| Financial institutions | 87 | 37 | 45 | 16 | 87 | 25 | 88 | 41 | ||||||||||||||||
| Mortgage and real estate | 35 | 9 | 41 | 10 | 54 | 10 | 51 | 11 | ||||||||||||||||
| Lease financing | 53 | 4 | 55 | 4 | 43 | 4 | 46 | 4 | ||||||||||||||||
| Other | 1 | — | 1 | — | 16 | 5 | 13 | 2 | ||||||||||||||||
| Total non-accrual corporate loans with specific allowance | $ | 1,279 | $ | 382 | $ | 1,485 | $ | 392 | $ | 774 | $ | 271 | $ | 1,215 | $ | 426 | ||||||||
| Non-accrual corporate loans without specific allowance | ||||||||||||||||||||||||
| Commercial and industrial | $ | 589 | $ | 566 | $ | 686 | $ | 489 | ||||||||||||||||
| Financial institutions | 214 | 140 | — | 4 | ||||||||||||||||||||
| Mortgage and real estate | 146 | 98 | 138 | 144 | ||||||||||||||||||||
| Lease financing | 14 | 1 | — | — | ||||||||||||||||||||
| Other | 97 | 131 | 70 | 90 | ||||||||||||||||||||
| Total non-accrual corporate loans without specific allowance | $ | 1,060 | N/A | $ | 936 | N/A | $ | 894 | N/A | $ | 727 | N/A | ||||||||||||
| (1) | Recorded investment in a loan includes net deferred loan fees and costs, unamortized premium or discount, less any direct write-downs. |
| (2) | Average carrying value represents the average recorded investment balance and does not include related specific allowance. |
| (3) | Interest income recognized for the three months ended March 31, |
| In millions of dollars | Carrying Value | TDRs involving changes in the amount and/or timing of principal payments(1) | TDRs involving changes in the amount and/or timing of interest payments(2) | TDRs involving changes in the amount and/or timing of both principal and interest payments | Carrying Value | TDRs involving changes in the amount and/or timing of principal payments(1) | TDRs involving changes in the amount and/or timing of interest payments(2) | TDRs involving changes in the amount and/or timing of both principal and interest payments | ||||||||||||||||
| Commercial and industrial | $ | 55 | $ | — | $ | — | $ | 55 | $ | 2 | $ | — | $ | — | $ | 2 | ||||||||
| Financial institutions | 15 | — | — | 15 | ||||||||||||||||||||
| Mortgage and real estate | 1 | — | — | 1 | 1 | — | — | 1 | ||||||||||||||||
| Total | $ | 71 | $ | — | $ | — | $ | 71 | $ | 3 | $ | — | $ | — | $ | 3 | ||||||||
| In millions of dollars | Carrying Value | TDRs involving changes in the amount and/or timing of principal payments(1) | TDRs involving changes in the amount and/or timing of interest payments(2) | TDRs involving changes in the amount and/or timing of both principal and interest payments | ||||||||
| Commercial and industrial | $ | 98 | $ | — | $ | — | $ | 98 | ||||
| Mortgage and real estate | 4 | — | — | 4 | ||||||||
| Total | $ | 102 | $ | — | $ | — | $ | 102 | ||||
| In millions of dollars | Carrying Value | TDRs involving changes in the amount and/or timing of principal payments(1) | TDRs involving changes in the amount and/or timing of interest payments(2) | TDRs involving changes in the amount and/or timing of both principal and interest payments | ||||||||
| Commercial and industrial | $ | 55 | $ | — | $ | — | $ | 55 | ||||
| Financial institutions | 15 | — | — | 15 | ||||||||
| Mortgage and real estate | 1 | — | — | 1 | ||||||||
| Total | $ | 71 | $ | — | $ | — | $ | 71 | ||||
| In millions of dollars | TDR balances at March 31, 2017 | TDR loans in payment default during the three months ended March 31, 2017 | TDR balances at March 31, 2016 | TDR loans in payment default during the three months ended March 31, 2016 | TDR balances at March 31, 2018 | TDR loans in payment default during the three months ended March 31, 2018 | TDR balances at March 31, 2017 | TDR loans in payment default during the three months ended March 31, 2017 | ||||||||||||||||
| Commercial and industrial | $ | 390 | $ | 9 | $ | 219 | $ | — | $ | 507 | $ | 59 | $ | 390 | $ | 9 | ||||||||
| Loans to financial institutions | 24 | 3 | 2 | — | 40 | — | 24 | 3 | ||||||||||||||||
| Mortgage and real estate | 84 | — | 139 | — | 98 | — | 84 | — | ||||||||||||||||
| Other | 177 | — | 303 | — | 41 | — | 177 | — | ||||||||||||||||
Total(1) | $ | 675 | $ | 12 | $ | 663 | $ | — | $ | 686 | $ | 59 | $ | 675 | $ | 12 | ||||||||
| (1) | The above tables reflect activity for loans outstanding as of the end of the reporting period that were considered TDRs. |
| Three months ended March 31, | Three Months Ended March 31, | |||||||||||
| In millions of dollars | 2017 | 2016 | 2018 | 2017 | ||||||||
| Allowance for loan losses at beginning of period | $ | 12,060 | $ | 12,626 | $ | 12,355 | $ | 12,060 | ||||
| Gross credit losses | (2,144 | ) | (2,143 | ) | (2,296 | ) | (2,144 | ) | ||||
Gross recoveries(1) | 435 | 419 | 429 | 435 | ||||||||
| Net credit losses (NCLs) | $ | (1,709 | ) | $ | (1,724 | ) | $ | (1,867 | ) | $ | (1,709 | ) |
| NCLs | $ | 1,709 | $ | 1,724 | $ | 1,867 | $ | 1,709 | ||||
| Net reserve builds (releases) | (20 | ) | 42 | 102 | (20 | ) | ||||||
| Net specific reserve builds (releases) | (14 | ) | 120 | |||||||||
| Net specific reserve releases | (166 | ) | (14 | ) | ||||||||
| Total provision for loan losses | $ | 1,675 | $ | 1,886 | $ | 1,803 | $ | 1,675 | ||||
| Other, net (see table below) | 4 | (76 | ) | 63 | 4 | |||||||
| Allowance for loan losses at end of period | $ | 12,030 | $ | 12,712 | $ | 12,354 | $ | 12,030 | ||||
| Allowance for credit losses on unfunded lending commitments at beginning of period | $ | 1,418 | $ | 1,402 | $ | 1,258 | $ | 1,418 | ||||
| Provision (release) for unfunded lending commitments | (43 | ) | 71 | 28 | (43 | ) | ||||||
| Other, net | 2 | — | 4 | 2 | ||||||||
Allowance for credit losses on unfunded lending commitments at end of period(2) | $ | 1,377 | $ | 1,473 | $ | 1,290 | $ | 1,377 | ||||
| Total allowance for loans, leases, and unfunded lending commitments | $ | 13,407 | $ | 14,185 | ||||||||
| Total allowance for loans, leases and unfunded lending commitments | $ | 13,644 | $ | 13,407 | ||||||||
| (1) | Recoveries have been reduced by certain collection costs that are incurred only if collection efforts are successful. |
| (2) | Represents additional credit loss reserves for unfunded lending commitments and letters of credit recorded in Other liabilities on the Consolidated Balance Sheet. |
| Other, net details | Three months ended March 31, | Three Months Ended March 31, | ||||||||||
| In millions of dollars | 2017 | 2016 | 2018 | 2017 | ||||||||
| Sales or transfers of various consumer loan portfolios to held-for-sale | ||||||||||||
| Sales or transfers of various consumer loan portfolios to HFS | ||||||||||||
| Transfer of real estate loan portfolios | $ | (37 | ) | $ | (29 | ) | $ | (53 | ) | $ | (37 | ) |
| Transfer of other loan portfolios | (124 | ) | (119 | ) | (2 | ) | (124 | ) | ||||
| Sales or transfers of various consumer loan portfolios to held-for-sale | $ | (161 | ) | $ | (148 | ) | ||||||
| Sales or transfers of various consumer loan portfolios to HFS | $ | (55 | ) | $ | (161 | ) | ||||||
| FX translation, consumer | 164 | 63 | 118 | 164 | ||||||||
| Other | 1 | 9 | — | 1 | ||||||||
| Other, net | $ | 4 | $ | (76 | ) | $ | 63 | $ | 4 | |||
| Three Months Ended | Three Months Ended | |||||||||||||||||||||||||||||||||||
| March 31, 2017 | March 31, 2016 | March 31, 2018 | March 31, 2017 | |||||||||||||||||||||||||||||||||
| In millions of dollars | Corporate | Consumer | Total | Corporate | Consumer | Total | Corporate | Consumer | Total | Corporate | Consumer | Total | ||||||||||||||||||||||||
| Allowance for loan losses at beginning of period | $ | 2,702 | $ | 9,358 | $ | 12,060 | $ | 2,791 | $ | 9,835 | $ | 12,626 | $ | 2,486 | $ | 9,869 | $ | 12,355 | $ | 2,702 | $ | 9,358 | $ | 12,060 | ||||||||||||
| Charge-offs | (103 | ) | (2,041 | ) | (2,144 | ) | (223 | ) | (1,920 | ) | (2,143 | ) | (139 | ) | (2,157 | ) | (2,296 | ) | (103 | ) | (2,041 | ) | (2,144 | ) | ||||||||||||
| Recoveries | 66 | 369 | 435 | 13 | 406 | 419 | 43 | 386 | 429 | 66 | 369 | 435 | ||||||||||||||||||||||||
| Replenishment of net charge-offs | 37 | 1,672 | 1,709 | 210 | 1,514 | 1,724 | 96 | 1,771 | 1,867 | 37 | 1,672 | 1,709 | ||||||||||||||||||||||||
| Net reserve builds (releases) | (166 | ) | 146 | (20 | ) | 4 | 38 | 42 | (19 | ) | 121 | 102 | (166 | ) | 146 | (20 | ) | |||||||||||||||||||
| Net specific reserve builds (releases) | (12 | ) | (2 | ) | (14 | ) | 101 | 19 | 120 | (155 | ) | (11 | ) | (166 | ) | (12 | ) | (2 | ) | (14 | ) | |||||||||||||||
| Other | 11 | (7 | ) | 4 | 9 | (85 | ) | (76 | ) | 3 | 60 | 63 | 11 | (7 | ) | 4 | ||||||||||||||||||||
| Ending balance | $ | 2,535 | $ | 9,495 | $ | 12,030 | $ | 2,905 | $ | 9,807 | $ | 12,712 | $ | 2,315 | $ | 10,039 | $ | 12,354 | $ | 2,535 | $ | 9,495 | $ | 12,030 | ||||||||||||
| Three Months Ended | ||||||||||||||||||
| March 31, 2017 | December 31, 2016 | |||||||||||||||||
| In millions of dollars | Corporate | Consumer | Total | Corporate | Consumer | Total | ||||||||||||
| Allowance for loan losses | ||||||||||||||||||
| Determined in accordance with ASC 450 | $ | 2,153 | $ | 7,921 | $ | 10,074 | $ | 2,310 | $ | 7,744 | $ | 10,054 | ||||||
| Determined in accordance with ASC 310-10-35 | 382 | 1,569 | 1,951 | 392 | 1,608 | 2,000 | ||||||||||||
| Determined in accordance with ASC 310-30 | — | 5 | 5 | — | 6 | 6 | ||||||||||||
| Total allowance for loan losses | $ | 2,535 | $ | 9,495 | $ | 12,030 | $ | 2,702 | $ | 9,358 | $ | 12,060 | ||||||
| Loans, net of unearned income | ||||||||||||||||||
| Loans collectively evaluated for impairment in accordance with ASC 450 | $ | 301,561 | $ | 312,761 | $ | 614,322 | $ | 293,218 | $ | 317,048 | $ | 610,266 | ||||||
| Loans individually evaluated for impairment in accordance with ASC 310-10-35 | 2,471 | 7,573 | 10,044 | 2,631 | 7,799 | 10,430 | ||||||||||||
| Loans acquired with deteriorated credit quality in accordance with ASC 310-30 | — | 194 | 194 | — | 187 | 187 | ||||||||||||
| Loans held at fair value | 4,007 | 28 | 4,035 | 3,457 | 29 | 3,486 | ||||||||||||
| Total loans, net of unearned income | $ | 308,039 | $ | 320,556 | $ | 628,595 | $ | 299,306 | $ | 325,063 | $ | 624,369 | ||||||
| March 31, 2018 | December 31, 2017 | |||||||||||||||||
| In millions of dollars | Corporate | Consumer | Total | Corporate | Consumer | Total | ||||||||||||
| Allowance for loan losses | ||||||||||||||||||
| Collectively evaluated in accordance with ASC 450 | $ | 2,045 | $ | 8,740 | $ | 10,785 | $ | 2,060 | $ | 8,531 | $ | 10,591 | ||||||
| Individually evaluated in accordance with ASC 310-10-35 | 270 | 1,295 | 1,565 | 426 | 1,334 | 1,760 | ||||||||||||
| Purchased credit-impaired in accordance with ASC 310-30 | — | 4 | 4 | — | 4 | 4 | ||||||||||||
| Total allowance for loan losses | $ | 2,315 | $ | 10,039 | $ | 12,354 | $ | 2,486 | $ | 9,869 | $ | 12,355 | ||||||
| Loans, net of unearned income | ||||||||||||||||||
| Collectively evaluated in accordance with ASC 450 | $ | 341,676 | $ | 318,666 | $ | 660,342 | $ | 327,142 | $ | 326,884 | $ | 654,026 | ||||||
| Individually evaluated in accordance with ASC 310-10-35 | 1,665 | 6,269 | 7,934 | 1,887 | 6,580 | 8,467 | ||||||||||||
| Purchased credit-impaired in accordance with ASC 310-30 | — | 126 | 126 | — | 167 | 167 | ||||||||||||
| Held at fair value | 4,513 | 23 | 4,536 | 4,349 | 25 | 4,374 | ||||||||||||
| Total loans, net of unearned income | $ | 347,854 | $ | 325,084 | $ | 672,938 | $ | 333,378 | $ | 333,656 | $ | 667,034 | ||||||
| In millions of dollars | |||
| Balance, December 31, 2016 | $ | 21,659 | |
| Foreign exchange translation and other | 634 | ||
| Impairment of goodwill | (28 | ) | |
| Balance at March 31, 2017 | $ | 22,265 | |
| In millions of dollars | |||||
Reporting unit(1) | Goodwill | Fair value as a % of allocated book value | |||
| North America Global Consumer Banking | $ | 6,732 | 148 | % | |
Asia Global Consumer Banking | 4,910 | 157 | |||
| Latin America Global Consumer Banking | 1,151 | 180 | |||
ICG—Banking | 2,902 | 194 | |||
ICG—Markets and Securities Services | 6,554 | 115 | |||
Citi Holdings—Consumer Latin America(2) | 16 | 103 | |||
| Total as of March 31, 2017 | $ | 22,265 | |||
| In millions of dollars | Global Consumer Banking | Institutional Clients Group | Corporate/Other | Total | ||||||||
| Balance, December 31, 2017 | $ | 12,784 | $ | 9,456 | $ | 16 | $ | 22,256 | ||||
| Foreign exchange translation and other | $ | 184 | $ | 235 | $ | — | $ | 419 | ||||
Divestiture (1) | — | — | (16 | ) | (16 | ) | ||||||
| Balance at March 31, 2018 | $ | 12,968 | $ | 9,691 | $ | — | $ | 22,659 | ||||
| (1) | Goodwill allocated to |
| March 31, 2017 | December 31, 2016 | March 31, 2018 | December 31, 2017 | |||||||||||||||||||||||||||||||||
| In millions of dollars | Gross carrying amount | Accumulated amortization | Net carrying amount | Gross carrying amount | Accumulated amortization | Net carrying amount | Gross carrying amount | Accumulated amortization | Net carrying amount | Gross carrying amount | Accumulated amortization | Net carrying amount | ||||||||||||||||||||||||
| Purchased credit card relationships | $ | 5,703 | $ | 4,049 | $ | 1,654 | $ | 8,215 | $ | 6,549 | $ | 1,666 | $ | 5,308 | $ | 3,805 | $ | 1,503 | $ | 5,375 | $ | 3,836 | $ | 1,539 | ||||||||||||
Credit card contract related intangibles(1) | 5,044 | 2,159 | 2,885 | 5,149 | 2,177 | 2,972 | 5,044 | 2,542 | $ | 2,502 | 5,045 | 2,456 | 2,589 | |||||||||||||||||||||||
| Core deposit intangibles | 776 | 750 | 26 | 801 | 771 | 30 | 449 | 439 | $ | 10 | 639 | 628 | 11 | |||||||||||||||||||||||
| Other customer relationships | 480 | 275 | 205 | 474 | 272 | 202 | 486 | 294 | $ | 192 | 459 | 272 | 187 | |||||||||||||||||||||||
| Present value of future profits | 34 | 29 | 5 | 31 | 27 | 4 | 35 | 31 | $ | 4 | 32 | 28 | 4 | |||||||||||||||||||||||
| Indefinite-lived intangible assets | 227 | — | 227 | 210 | — | 210 | 231 | — | $ | 231 | 244 | — | 244 | |||||||||||||||||||||||
| Other | 170 | 159 | 11 | 504 | 474 | 30 | 100 | 92 | $ | 8 | 100 | 86 | 14 | |||||||||||||||||||||||
| Intangible assets (excluding MSRs) | $ | 12,434 | $ | 7,421 | $ | 5,013 | $ | 15,384 | $ | 10,270 | $ | 5,114 | $ | 11,653 | $ | 7,203 | $ | 4,450 | $ | 11,894 | $ | 7,306 | $ | 4,588 | ||||||||||||
Mortgage servicing rights (MSRs)(2) | 567 | — | 567 | 1,564 | — | 1,564 | 587 | — | 587 | 558 | — | 558 | ||||||||||||||||||||||||
| Total intangible assets | $ | 13,001 | $ | 7,421 | $ | 5,580 | $ | 16,948 | $ | 10,270 | $ | 6,678 | $ | 12,240 | $ | 7,203 | $ | 5,037 | $ | 12,452 | $ | 7,306 | $ | 5,146 | ||||||||||||
| Net carrying amount at | Net carrying amount at | Net carrying amount at | Net carrying amount at | |||||||||||||||||||||||||||
| In millions of dollars | December 31, 2016 | Acquisitions/ divestitures | Amortization | FX translation and other | March 31, 2017 | December 31, 2017 | Acquisitions/ divestitures | Amortization | FX translation and other | March 31, 2018 | ||||||||||||||||||||
| Purchased credit card relationships | $ | 1,666 | $ | 20 | $ | (33 | ) | $ | 1 | $ | 1,654 | $ | 1,539 | $ | — | $ | (35 | ) | $ | (1 | ) | $ | 1,503 | |||||||
Credit card contract related intangibles(1) | 2,972 | 9 | (98 | ) | 2 | 2,885 | 2,589 | — | (86 | ) | (1 | ) | 2,502 | |||||||||||||||||
| Core deposit intangibles | 30 | — | (6 | ) | 2 | 26 | 11 | — | (2 | ) | 1 | 10 | ||||||||||||||||||
| Other customer relationships | 202 | — | (6 | ) | 9 | 205 | 187 | — | (6 | ) | 11 | 192 | ||||||||||||||||||
| Present value of future profits | 4 | — | — | 1 | 5 | 4 | — | — | — | 4 | ||||||||||||||||||||
| Indefinite-lived intangible assets | 210 | — | — | 17 | 227 | 244 | — | — | (13 | ) | 231 | |||||||||||||||||||
| Other | 30 | (14 | ) | (4 | ) | (1 | ) | 11 | 14 | — | (6 | ) | — | 8 | ||||||||||||||||
| Intangible assets (excluding MSRs) | $ | 5,114 | $ | 15 | $ | (147 | ) | $ | 31 | $ | 5,013 | $ | 4,588 | $ | — | $ | (135 | ) | $ | (3 | ) | $ | 4,450 | |||||||
Mortgage servicing rights (MSRs)(2) | 1,564 | 567 | 558 | 587 | ||||||||||||||||||||||||||
| Total intangible assets | $ | 6,678 | $ | 5,580 | $ | 5,146 | $ | 5,037 | ||||||||||||||||||||||
| (1) | Primarily reflects contract-related intangibles associated with the American Airlines, |
| (2) | For additional information on Citi’s MSRs, including the rollforward for the three months ended March 31, |
| In millions of dollars | March 31, 2017 | December 31, 2016 | March 31, 2018 | December 31, 2017 | ||||||||
| Balance | Balance | |||||||||||
| Commercial paper | $ | 10,088 | $ | 9,989 | $ | 10,022 | $ | 9,940 | ||||
Other borrowings(1) | 16,039 | 20,712 | 26,072 | 34,512 | ||||||||
| Total | $ | 26,127 | $ | 30,701 | $ | 36,094 | $ | 44,452 | ||||
| (1) | Includes borrowings from Federal Home Loan Banks and other market participants. At March 31, |
| In millions of dollars | March 31, 2017 | December 31, 2016 | March 31, 2018 | December 31, 2017 | ||||||||
Citigroup Inc.(1) | $ | 141,626 | $ | 147,333 | $ | 153,074 | $ | 152,163 | ||||
Bank(2) | 51,085 | 49,454 | 64,757 | 65,856 | ||||||||
Broker-dealer(3) | 15,819 | 9,391 | ||||||||||
Broker-dealer and other(3) | 20,107 | 18,690 | ||||||||||
| Total | $ | 208,530 | $ | 206,178 | $ | 237,938 | $ | 236,709 | ||||
| (1) | Represents the parent holding company. |
| (2) | Represents Citibank entities as well as other bank entities. At March 31, |
| (3) | Represents broker-dealer and other non-bank subsidiaries that are consolidated into Citigroup Inc., the parent holding company. |
| Junior subordinated debentures owned by trust | Junior subordinated debentures owned by trust | |||||||||||||||||||||||||||||
| Trust | Issuance date | Securities issued | Liquidation value(1) | Coupon rate(2) | Common shares issued to parent | Amount | Maturity | Redeemable by issuer beginning | Issuance date | Securities issued | Liquidation value(1) | Coupon rate(2) | Common shares issued to parent | Amount | Maturity | Redeemable by issuer beginning | ||||||||||||||
In millions of dollars, except share amounts | In millions of dollars, except share amounts | In millions of dollars, except share amounts | ||||||||||||||||||||||||||||
| Citigroup Capital III | Dec. 1996 | 194,053 | $ | 194 | 7.625 | % | 6,003 | $ | 200 | Dec. 1, 2036 | Not redeemable | Dec. 1996 | 194,053 | $ | 194 | 7.625 | % | 6,003 | $ | 200 | Dec. 1, 2036 | Not redeemable | ||||||||
| Citigroup Capital XIII | Sept. 2010 | 89,840,000 | 2,246 | 3 mo LIBOR + 637 bps | 1,000 | 2,246 | Oct. 30, 2040 | Oct. 30, 2015 | Sept. 2010 | 89,840,000 | 2,246 | 3 mo LIBOR + 637 bps | 1,000 | 2,246 | Oct. 30, 2040 | Oct. 30, 2015 | ||||||||||||||
| Citigroup Capital XVIII | June 2007 | 99,901 | 125 | 6.829 | 50 | 125 | June 28, 2067 | June 28, 2017 | June 2007 | 99,901 | 140 | 3 mo LIBOR + 88.75 bps | 50 | 140 | June 28, 2067 | June 28, 2017 | ||||||||||||||
| Total obligated | $ | 2,565 | $ | 2,571 | $ | 2,580 | $ | 2,586 | ||||||||||||||||||||||
| (1) | Represents the notional value received by investors from the trusts at the time of issuance. |
| (2) | In each case, the coupon rate on the subordinated debentures is the same as that on the trust preferred securities. |
| In millions of dollars | Net unrealized gains (losses) on investment securities | Debt valuation adjustment (DVA)(1) | Cash flow hedges(2) | Benefit plans(3) | Foreign currency translation adjustment (CTA), net of hedges(4) | Accumulated other comprehensive income (loss) | ||||||||||||
| Balance, December 31, 2016 | $ | (799 | ) | $ | (352 | ) | $ | (560 | ) | $ | (5,164 | ) | $ | (25,506 | ) | $ | (32,381 | ) |
| Other comprehensive income before reclassifications | 334 | (55 | ) | 24 | (49 | ) | 1,465 | 1,719 | ||||||||||
| Increase (decrease) due to amounts reclassified from AOCI | (114 | ) | (5 | ) | (26 | ) | 37 | (147 | ) | (255 | ) | |||||||
Change, net of taxes | $ | 220 | $ | (60 | ) | $ | (2 | ) | $ | (12 | ) | $ | 1,318 | $ | 1,464 | |||
| Balance at March 31, 2017 | $ | (579 | ) | $ | (412 | ) | $ | (562 | ) | $ | (5,176 | ) | $ | (24,188 | ) | $ | (30,917 | ) |
| In millions of dollars | Net unrealized gains (losses) on investment securities | Debt valuation adjustment (DVA)(1) | Cash flow hedges(2) | Benefit plans(3) | Foreign currency translation adjustment (CTA), net of hedges(4) | Accumulated other comprehensive income (loss) | Net unrealized gains (losses) on investment securities | Debt valuation adjustment (DVA) | Cash flow hedges(1) | Benefit plans(2) | Foreign currency translation adjustment (CTA), net of hedges(3) | Excluded Component of fair value hedges (4) | Accumulated other comprehensive income (loss) | ||||||||||||||||||||||||||
| Balance, December 31, 2015 | $ | (907 | ) | $ | — | $ | (617 | ) | $ | (5,116 | ) | $ | (22,704 | ) | $ | (29,344 | ) | ||||||||||||||||||||||
| Balance, December 31, 2017 | $ | (1,158 | ) | $ | (921 | ) | $ | (698 | ) | $ | (6,183 | ) | $ | (25,708 | ) | $ | — | $ | (34,668 | ) | |||||||||||||||||||
Adjustment to opening balance, net of taxes | — | (15 | ) | — | — | — | (15 | ) | (3 | ) | — | — | — | — | — | (3 | ) | ||||||||||||||||||||||
| Adjusted balance, beginning of period | (907 | ) | (15 | ) | (617 | ) | (5,116 | ) | (22,704 | ) | (29,359 | ) | $ | (1,161 | ) | $ | (921 | ) | $ | (698 | ) | $ | (6,183 | ) | $ | (25,708 | ) | $ | — | $ | (34,671 | ) | |||||||
| Other comprehensive income before reclassifications | 2,026 | 192 | 291 | (500 | ) | 654 | 2,663 | (949 | ) | 101 | (243 | ) | 41 | 1,120 | (4 | ) | 70 | ||||||||||||||||||||||
| Increase (decrease) due to amounts reclassified from AOCI | 8 | 1 | 26 | 35 | — | 70 | (109 | ) | 27 | 21 | 47 | — | — | (14 | ) | ||||||||||||||||||||||||
| Change, net of taxes | $ | 2,034 | $ | 193 | $ | 317 | $ | (465 | ) | $ | 654 | $ | 2,733 | $ | (1,058 | ) | $ | 128 | $ | (222 | ) | $ | 88 | $ | 1,120 | $ | (4 | ) | $ | 52 | |||||||||
| Balance, March 31, 2016 | $ | 1,127 | $ | 178 | $ | (300 | ) | $ | (5,581 | ) | $ | (22,050 | ) | $ | (26,626 | ) | |||||||||||||||||||||||
| Balance at March 31, 2018 | $ | (2,219 | ) | $ | (793 | ) | $ | (920 | ) | $ | (6,095 | ) | $ | (24,588 | ) | $ | (4 | ) | $ | (34,619 | ) | ||||||||||||||||||
| In millions of dollars | Net unrealized gains (losses) on investment securities | Debt valuation adjustment (DVA) | Cash flow hedges(1) | Benefit plans(2) | Foreign currency translation adjustment (CTA), net of hedges(3) | Excluded Component of fair value hedges (4) | Accumulated other comprehensive income (loss) | ||||||||||||||
| Balance, December 31, 2016 | $ | (799 | ) | $ | (352 | ) | $ | (560 | ) | $ | (5,164 | ) | $ | (25,506 | ) | $ | — | $ | (32,381 | ) | |
Adjustment to opening balance, net of taxes (6) | 504 | — | — | — | — | — | 504 | ||||||||||||||
| Adjusted balance, beginning of period | $ | (295 | ) | $ | (352 | ) | $ | (560 | ) | $ | (5,164 | ) | $ | (25,506 | ) | $ | — | $ | (31,877 | ) | |
| Other comprehensive income before reclassifications | 334 | (55 | ) | 24 | (49 | ) | 1,465 | — | 1,719 | ||||||||||||
| Increase (decrease) due to amounts reclassified from AOCI | (114 | ) | (5 | ) | (26 | ) | 37 | (147 | ) | — | (255 | ) | |||||||||
| Change, net of taxes | $ | 220 | $ | (60 | ) | $ | (2 | ) | $ | (12 | ) | $ | 1,318 | $ | — | $ | 1,464 | ||||
| Balance, March 31, 2017 | $ | (75 | ) | $ | (412 | ) | $ | (562 | ) | $ | (5,176 | ) | $ | (24,188 | ) | $ | — | $ | (30,413 | ) | |
| (1) |
| Primarily driven by Citigroup’s pay fixed/receive floating interest rate swap programs that hedge the floating rates on liabilities. |
| Primarily reflects adjustments based on the quarterly actuarial valuations of the Company’s Significant pension and postretirement plans, annual actuarial valuations of all other plans and amortization of amounts previously recognized in other comprehensive income. |
| Primarily reflects the movements in (by order of impact) the Mexican |
| (4) | Beginning in the first quarter of 2018, changes in the excluded component of fair value hedges are reflected as a component of AOCI, pursuant to the early adoption of ASU No. 2017-12, Targeted Improvements to Accounting for Hedging Activities. See Note 1 to the Consolidated Financial Statements for further information regarding this change. |
| (5) | Citi adopted ASU 2016-01 and ASU 2018-03 on January 1, 2018. Upon adoption, a cumulative effect adjustment was recorded from AOCI to retained earnings for net unrealized gains on former AFS equity securities. For additional information, see Note 1 to the Consolidated Financial Statements. |
| (6) | In the second quarter of 2017, Citi early adopted ASU 2017-08, Receivables—Nonrefundable Fees and Other Costs (Subtopic 310-20): Premium Amortization on Purchased Callable Debt Securities. Upon adoption, a cumulative effect adjustment was recorded to reduce retained earnings, effective January 1, 2017, for the incremental amortization of cumulative fair value hedge adjustments on callable state and municipal debt securities. For additional information, see Note 1 to the Consolidated Financial Statements. |
| In millions of dollars | Pretax | Tax effect | After-tax | Pretax | Tax effect(1) | After-tax | ||||||||||||
| Balance, December 31, 2016 | $ | (42,035 | ) | $ | 9,654 | $ | (32,381 | ) | ||||||||||
| Change in net unrealized gains (losses) on investment securities | 346 | (126 | ) | 220 | ||||||||||||||
Balance, December 31, 2017(1) | $ | (41,228 | ) | $ | 6,560 | $ | (34,668 | ) | ||||||||||
Adjustment to opening balance (2) | (4 | ) | 1 | (3 | ) | |||||||||||||
| Adjusted balance, beginning of period | $ | (41,232 | ) | $ | 6,561 | $ | (34,671 | ) | ||||||||||
| Change in net unrealized gains (losses) on AFS debt securities | (1,380 | ) | 322 | (1,058 | ) | |||||||||||||
| Debt valuation adjustment (DVA) | (95 | ) | 35 | (60 | ) | 167 | (39 | ) | 128 | |||||||||
| Cash flow hedges | 1 | (3 | ) | (2 | ) | (290 | ) | 68 | (222 | ) | ||||||||
| Benefit plans | (2 | ) | (10 | ) | (12 | ) | 91 | (3 | ) | 88 | ||||||||
| Foreign currency translation adjustment | 1,468 | (150 | ) | 1,318 | 1,130 | (10 | ) | 1,120 | ||||||||||
| Excluded component of fair value hedges | (5 | ) | 1 | (4 | ) | |||||||||||||
| Change | $ | 1,718 | $ | (254 | ) | $ | 1,464 | $ | (287 | ) | $ | 339 | $ | 52 | ||||
| Balance, March 31, 2017 | $ | (40,317 | ) | $ | 9,400 | $ | (30,917 | ) | ||||||||||
| Balance, March 31, 2018 | $ | (41,519 | ) | $ | 6,900 | $ | (34,619 | ) | ||||||||||
| In millions of dollars | Pretax | Tax effect | After-tax | Pretax | Tax effect | After-tax | ||||||||||||
| Balance, December 31, 2015 | $ | (38,440 | ) | $ | 9,096 | $ | (29,344 | ) | ||||||||||
| Balance, December 31, 2016 | $ | (42,035 | ) | $ | 9,654 | $ | (32,381 | ) | ||||||||||
Adjustment to opening balance | (26 | ) | 11 | (15 | ) | 803 | (299 | ) | 504 | |||||||||
| Adjusted balance, beginning of period | (38,466 | ) | 9,107 | (29,359 | ) | $ | (41,232 | ) | $ | 9,355 | $ | (31,877 | ) | |||||
| Change in net unrealized gains (losses) on investment securities | 3,224 | (1,190 | ) | 2,034 | 346 | (126 | ) | 220 | ||||||||||
| Debt valuation adjustment (DVA) | 307 | (114 | ) | 193 | (95 | ) | 35 | (60 | ) | |||||||||
| Cash flow hedges | 481 | (164 | ) | 317 | 1 | (3 | ) | (2 | ) | |||||||||
| Benefit plans | (727 | ) | 262 | (465 | ) | (2 | ) | (10 | ) | (12 | ) | |||||||
| Foreign currency translation adjustment | 513 | 141 | 654 | 1,468 | (150 | ) | 1,318 | |||||||||||
| Excluded component of fair value hedges | — | — | — | |||||||||||||||
| Change | $ | 3,798 | $ | (1,065 | ) | $ | 2,733 | $ | 1,718 | $ | (254 | ) | $ | 1,464 | ||||
| Balance, March 31, 2016 | $ | (34,668 | ) | $ | 8,042 | $ | (26,626 | ) | ||||||||||
| Balance, March 31, 2017 | $ | (39,514 | ) | $ | 9,101 | $ | (30,413 | ) | ||||||||||
| (1) | Includes the |
| (2) | Citi adopted ASU 2016-01 and ASU 2018-03 on January 1, 2018. Upon adoption, a cumulative effect adjustment was recorded from AOCI to retained earnings for net unrealized gains on former AFS equity securities. For additional information, see Note 1 to the Consolidated Financial Statements. |
| (3) | In the second quarter of |
| Increase (decrease) in AOCI due to amounts reclassified to Consolidated Statement of Income | Increase (decrease) in AOCI due to amounts reclassified to Consolidated Statement of Income | |||||||||||
| Three months ended March 31, | Three Months Ended March 31, | |||||||||||
| In millions of dollars | 2017 | 2016 | 2018 | 2017 | ||||||||
| Realized (gains) losses on sales of investments | $ | (192 | ) | $ | (186 | ) | $ | (170 | ) | $ | (192 | ) |
| OTTI gross impairment losses | 12 | 203 | ||||||||||
| Gross impairment losses | 27 | 12 | ||||||||||
| Subtotal, pretax | $ | (180 | ) | $ | 17 | $ | (143 | ) | $ | (180 | ) | |
| Tax effect | 66 | (9 | ) | 34 | 66 | |||||||
Net realized (gains) losses on investment securities, after-tax(1) | $ | (114 | ) | $ | 8 | |||||||
Net realized (gains) losses on investments after-tax(1) | $ | (109 | ) | $ | (114 | ) | ||||||
| Realized DVA (gains) losses on fair value option liabilities | $ | (8 | ) | $ | 1 | $ | 35 | $ | (8 | ) | ||
| Subtotal, pretax | $ | (8 | ) | $ | 1 | $ | 35 | $ | (8 | ) | ||
| Tax effect | 3 | — | (8 | ) | 3 | |||||||
| Net realized debt valuation adjustment, after-tax | $ | (5 | ) | $ | 1 | $ | 27 | $ | (5 | ) | ||
| Interest rate contracts | $ | (44 | ) | $ | 16 | $ | 31 | $ | (44 | ) | ||
| Foreign exchange contracts | 3 | 26 | (2 | ) | 3 | |||||||
| Subtotal, pretax | $ | (41 | ) | $ | 42 | $ | 29 | $ | (41 | ) | ||
| Tax effect | 15 | (16 | ) | (8 | ) | 15 | ||||||
Amortization of cash flow hedges, after-tax(2) | $ | (26 | ) | $ | 26 | $ | 21 | $ | (26 | ) | ||
| Amortization of unrecognized | ||||||||||||
| Prior service cost (benefit) | $ | (10 | ) | $ | (10 | ) | $ | (11 | ) | $ | (10 | ) |
| Net actuarial loss | 67 | 66 | 69 | 67 | ||||||||
Curtailment/settlement impact(3) | — | (2 | ) | 4 | — | |||||||
| Subtotal, pretax | $ | 57 | $ | 54 | $ | 62 | $ | 57 | ||||
| Tax effect | (20 | ) | (19 | ) | (15 | ) | (20 | ) | ||||
Amortization of benefit plans, after-tax(3) | $ | 37 | $ | 35 | $ | 47 | $ | 37 | ||||
| Foreign currency translation adjustment | $ | (232 | ) | $ | — | $ | — | $ | (232 | ) | ||
| Tax effect | 85 | — | — | 85 | ||||||||
| Foreign currency translation adjustment | $ | (147 | ) | $ | — | $ | — | $ | (147 | ) | ||
| Total amounts reclassified out of AOCI, pretax | $ | (404 | ) | $ | 114 | $ | (17 | ) | $ | (404 | ) | |
| Total tax effect | 149 | (44 | ) | 3 | 149 | |||||||
| Total amounts reclassified out of AOCI, after-tax | $ | (255 | ) | $ | 70 | $ | (14 | ) | $ | (255 | ) | |
| (1) | The pretax amount is reclassified to Realized gains (losses) on sales of investments, net and Gross impairment losses |
| (2) | See Note 19 to the Consolidated Financial Statements for additional details. |
| (3) | See Note 8 to the Consolidated Financial Statements for additional details. |
| As of March 31, 2017 | As of March 31, 2018 | |||||||||||||||||||||||||||||||||||||||||||||||
Maximum exposure to loss in significant unconsolidated VIEs(1) | Maximum exposure to loss in significant unconsolidated VIEs(1) | |||||||||||||||||||||||||||||||||||||||||||||||
Funded exposures(2) | Unfunded exposures | Funded exposures(2) | Unfunded exposures | |||||||||||||||||||||||||||||||||||||||||||||
| In millions of dollars | Total involvement with SPE assets | Consolidated VIE / SPE assets | Significant unconsolidated VIE assets(3) | Debt investments | Equity investments | Funding commitments | Guarantees and derivatives | Total | Total involvement with SPE assets | Consolidated VIE/SPE assets | Significant unconsolidated VIE assets(3) | Debt investments | Equity investments | Funding commitments | Guarantees and derivatives | Total | ||||||||||||||||||||||||||||||||
| Credit card securitizations | $ | 46,993 | $ | 46,993 | $ | — | $ | — | $ | — | $ | — | $ | — | $ | — | $ | 46,540 | $ | 46,540 | $ | — | $ | — | $ | — | $ | — | $ | — | $ | — | ||||||||||||||||
Mortgage securitizations(4) | ||||||||||||||||||||||||||||||||||||||||||||||||
U.S. agency-sponsored | 117,210 | — | 117,210 | 2,766 | — | — | 74 | 2,840 | 111,980 | — | 111,980 | 2,690 | — | — | 87 | 2,777 | ||||||||||||||||||||||||||||||||
| Non-agency-sponsored | 20,164 | 1,037 | 19,127 | 284 | 35 | — | 1 | 320 | 20,660 | 1,891 | 18,769 | 335 | — | — | 1 | 336 | ||||||||||||||||||||||||||||||||
| Citi-administered asset-backed commercial paper conduits (ABCP) | 19,120 | 19,120 | — | — | — | — | — | — | 18,962 | 18,962 | — | — | — | — | — | — | ||||||||||||||||||||||||||||||||
| Collateralized loan obligations (CLOs) | 18,246 | — | 18,246 | 5,071 | — | — | 64 | 5,135 | 16,491 | — | 16,491 | 5,362 | — | — | 9 | 5,371 | ||||||||||||||||||||||||||||||||
| Asset-based financing | 50,939 | 742 | 50,197 | 15,707 | 583 | 4,923 | — | 21,213 | 63,019 | 637 | 62,382 | 19,190 | 571 | 6,904 | — | 26,665 | ||||||||||||||||||||||||||||||||
| Municipal securities tender option bond trusts (TOBs) | 6,927 | 2,659 | 4,268 | 8 | — | 2,914 | — | 2,922 | 7,105 | 2,165 | 4,940 | 18 | — | 3,344 | — | 3,362 | ||||||||||||||||||||||||||||||||
| Municipal investments | 18,463 | 15 | 18,448 | 2,507 | 3,639 | 2,561 | — | 8,707 | 19,265 | 5 | 19,260 | 2,769 | 3,632 | 2,129 | — | 8,530 | ||||||||||||||||||||||||||||||||
| Client intermediation | 1,504 | 800 | 704 | 462 | — | 208 | — | 670 | 1,414 | 1,279 | 135 | 37 | — | — | 7 | 44 | ||||||||||||||||||||||||||||||||
| Investment funds | 2,177 | 767 | 1,410 | 32 | 34 | 15 | 1 | 82 | 1,874 | 603 | 1,271 | 10 | 7 | 13 | — | 30 | ||||||||||||||||||||||||||||||||
| Other | 767 | 36 | 731 | 115 | 11 | 66 | 44 | 236 | 693 | 34 | 659 | 28 | 8 | 33 | 49 | 118 | ||||||||||||||||||||||||||||||||
| Total | $ | 302,510 | $ | 72,169 | $ | 230,341 | $ | 26,952 | $ | 4,302 | $ | 10,687 | $ | 184 | $ | 42,125 | $ | 308,003 | $ | 72,116 | $ | 235,887 | $ | 30,439 | $ | 4,218 | $ | 12,423 | $ | 153 | $ | 47,233 | ||||||||||||||||
| As of December 31, 2016 | As of December 31, 2017 | |||||||||||||||||||||||||||||||||||||||||||||||
Maximum exposure to loss in significant unconsolidated VIEs(1) | Maximum exposure to loss in significant unconsolidated VIEs(1) | |||||||||||||||||||||||||||||||||||||||||||||||
Funded exposures(2) | Unfunded exposures | Funded exposures(2) | Unfunded exposures | |||||||||||||||||||||||||||||||||||||||||||||
| In millions of dollars | Total involvement with SPE assets | Consolidated VIE / SPE assets | Significant unconsolidated VIE assets(3) | Debt investments | Equity investments | Funding commitments | Guarantees and derivatives | Total | Total involvement with SPE assets | Consolidated VIE/SPE assets | Significant unconsolidated VIE assets(3) | Debt investments | Equity investments | Funding commitments | Guarantees and derivatives | Total | ||||||||||||||||||||||||||||||||
| Credit card securitizations | $ | 50,171 | $ | 50,171 | $ | — | $ | — | $ | — | $ | — | $ | — | $ | — | $ | 50,795 | $ | 50,795 | $ | — | $ | — | $ | — | $ | — | $ | — | $ | — | ||||||||||||||||
Mortgage securitizations(4) | ||||||||||||||||||||||||||||||||||||||||||||||||
| U.S. agency-sponsored | 214,458 | — | 214,458 | 3,852 | — | — | 78 | 3,930 | 116,610 | — | 116,610 | 2,647 | — | — | 74 | 2,721 | ||||||||||||||||||||||||||||||||
| Non-agency-sponsored | 15,965 | 1,092 | 14,873 | 312 | 35 | — | 1 | 348 | 22,251 | 2,035 | 20,216 | 330 | — | — | 1 | 331 | ||||||||||||||||||||||||||||||||
| Citi-administered asset-backed commercial paper conduits (ABCP) | 19,693 | 19,693 | — | — | — | — | — | — | 19,282 | 19,282 | — | — | — | — | — | — | ||||||||||||||||||||||||||||||||
| Collateralized loan obligations (CLOs) | 18,886 | — | 18,886 | 5,128 | — | — | 62 | 5,190 | 20,588 | — | 20,588 | 5,956 | — | — | 9 | 5,965 | ||||||||||||||||||||||||||||||||
| Asset-based financing | 53,168 | 733 | 52,435 | 16,553 | 475 | 4,915 | — | 21,943 | 60,472 | 633 | 59,839 | 19,478 | 583 | 5,878 | — | 25,939 | ||||||||||||||||||||||||||||||||
| Municipal securities tender option bond trusts (TOBs) | 7,070 | 2,843 | 4,227 | 40 | — | 2,842 | — | 2,882 | 6,925 | 2,166 | 4,759 | 138 | — | 3,035 | — | 3,173 | ||||||||||||||||||||||||||||||||
| Municipal investments | 17,679 | 14 | 17,665 | 2,441 | 3,578 | 2,580 | — | 8,599 | 19,119 | 7 | 19,112 | 2,709 | 3,640 | 2,344 | — | 8,693 | ||||||||||||||||||||||||||||||||
| Client intermediation | 515 | 371 | 144 | 49 | — | — | 3 | 52 | 958 | 824 | 134 | 32 | — | — | 9 | 41 | ||||||||||||||||||||||||||||||||
| Investment funds | 2,788 | 767 | 2,021 | 32 | 120 | 27 | 3 | 182 | 1,892 | 616 | 1,276 | 14 | 7 | 13 | — | 34 | ||||||||||||||||||||||||||||||||
| Other | 1,429 | 607 | 822 | 116 | 11 | 58 | 43 | 228 | 677 | 36 | 641 | 27 | 9 | 34 | 47 | 117 | ||||||||||||||||||||||||||||||||
| Total | $ | 401,822 | $ | 76,291 | $ | 325,531 | $ | 28,523 | $ | 4,219 | $ | 10,422 | $ | 190 | $ | 43,354 | $ | 319,569 | $ | 76,394 | $ | 243,175 | $ | 31,331 | $ | 4,239 | $ | 11,304 | $ | 140 | $ | 47,014 | ||||||||||||||||
| (2) | Included on Citigroup’s March 31, |
| (3) | A significant unconsolidated VIE is an entity |
| (4) | Citigroup mortgage securitizations also include agency and non-agency (private-label) re-securitization activities. These SPEs are not consolidated. See “Re-securitizations” below for further discussion. |
| March 31, 2017 | December 31, 2016 | March 31, 2018 | December 31, 2017 | |||||||||||||||||||||
| In millions of dollars | Liquidity facilities | Loan/equity commitments | Liquidity facilities | Loan/equity commitments | Liquidity facilities | Loan/equity commitments | Liquidity facilities | Loan/equity commitments | ||||||||||||||||
| Asset-based financing | $ | — | $ | 4,923 | $ | 5 | $ | 4,910 | $ | — | $ | 6,904 | $ | — | $ | 5,878 | ||||||||
| Municipal securities tender option bond trusts (TOBs) | 2,914 | — | 2,842 | — | 3,344 | — | 3,035 | — | ||||||||||||||||
| Municipal investments | — | 2,561 | — | 2,580 | — | 2,129 | — | 2,344 | ||||||||||||||||
| Client Intermediation | — | 208 | — | — | ||||||||||||||||||||
| Investment funds | — | 15 | — | 27 | — | 13 | — | 13 | ||||||||||||||||
| Other | — | 66 | — | 58 | — | 33 | — | 34 | ||||||||||||||||
| Total funding commitments | $ | 2,914 | $ | 7,773 | $ | 2,847 | $ | 7,575 | $ | 3,344 | $ | 9,079 | $ | 3,035 | $ | 8,269 | ||||||||
| In billions of dollars | March 31, 2017 | December 31, 2016 | March 31, 2018 | December 31, 2017 | ||||||||
| Cash | $ | 0.1 | $ | 0.1 | $ | — | $ | — | ||||
| Trading account assets | 8.1 | 8.0 | 7.7 | 8.5 | ||||||||
| Investments | 4.4 | 4.4 | 4.4 | 4.4 | ||||||||
| Total loans, net of allowance | 18.3 | 18.8 | 21.9 | 22.2 | ||||||||
| Other | 0.5 | 1.5 | 0.5 | 0.5 | ||||||||
| Total assets | $ | 31.4 | $ | 32.8 | $ | 34.5 | $ | 35.6 | ||||
| In billions of dollars | March 31, 2017 | December 31, 2016 | March 31, 2018 | December 31, 2017 | Ownership interests in principal amount of trust credit card receivables | |||||||
| Sold to investors via trust-issued securities | $ | 23.2 | $ | 22.7 | $ | 28.8 | $ | 28.8 | ||||
| Retained by Citigroup as trust-issued securities | 7.5 | 7.4 | 7.7 | 7.6 | ||||||||
| Retained by Citigroup via non-certificated interests | 16.2 | 20.6 | 10.1 | 14.4 | ||||||||
| Total | $ | 46.9 | $ | 50.7 | $ | 46.6 | $ | 50.8 | ||||
| Three months ended March 31, | Three Months Ended March 31, | |||||||||||
| In billions of dollars | 2017 | 2016 | 2018 | 2017 | ||||||||
| Proceeds from new securitizations | $ | 2.5 | $ | — | $ | 2.8 | $ | 2.5 | ||||
| Pay down of maturing notes | (2.0 | ) | (2.2 | ) | (2.8 | ) | (2.0 | ) | ||||
| In billions of dollars | Mar. 31, 2018 | Dec. 31, 2017 | ||||
| Term notes issued to third parties | $ | 27.8 | $ | 27.8 | ||
| Term notes retained by Citigroup affiliates | 5.8 | 5.7 | ||||
| Total Master Trust liabilities | $ | 33.6 | $ | 33.5 | ||
| In billions of dollars | March 31, 2017 | Dec. 31, 2016 | ||||
| Term notes issued to third parties | $ | 22.2 | $ | 21.7 | ||
| Term notes retained by Citigroup affiliates | 5.6 | 5.5 | ||||
| Total Master Trust liabilities | $ | 27.8 | $ | 27.2 | ||
| In billions of dollars | March 31, 2017 | Dec. 31, 2016 | Mar. 31, 2018 | Dec. 31, 2017 | ||||||||
| Term notes issued to third parties | $ | 1.0 | $ | 1.0 | $ | 1.0 | $ | 1.0 | ||||
| Term notes retained by Citigroup affiliates | 1.9 | 1.9 | 1.9 | 1.9 | ||||||||
| Total Omni Trust liabilities | $ | 2.9 | $ | 2.9 | $ | 2.9 | $ | 2.9 | ||||
| 2017 | 2016 | |||||||||||
| In billions of dollars | U.S. agency- sponsored mortgages | Non-agency- sponsored mortgages | U.S. agency- sponsored mortgages | Non-agency- sponsored mortgages(1) | ||||||||
| Proceeds from new securitizations | $ | 7.2 | $ | 1.4 | $ | 10.6 | $ | 4.2 | ||||
| Contractual servicing fees received | 0.1 | — | 0.1 | — | ||||||||
| 2018 | 2017 | |||||||||||
| In billions of dollars | U.S. agency- sponsored mortgages | Non-agency- sponsored mortgages | U.S. agency- sponsored mortgages | Non-agency- sponsored mortgages | ||||||||
| Proceeds from new securitizations | $ | 8.0 | $ | 3.4 | $ | 7.2 | $ | 1.4 | ||||
| Contractual servicing fees received | — | — | 0.1 | — | ||||||||
| March 31, | ||||||
Non-agency-sponsored mortgages(1) | ||||||
U.S. agency- sponsored mortgages | Senior interests | Subordinated interests | ||||
| Discount rate | — | — | ||||
| Weighted average discount rate | % | — | — | |||
| Constant prepayment rate | — | — | ||||
| Weighted average constant prepayment rate | % | — | — | |||
Anticipated net credit losses(2) | NM | — | — | |||
| Weighted average anticipated net credit losses | NM | — | — | |||
| Weighted average life | — | — | ||||
| March 31, | |||||
Non-agency-sponsored mortgages(1) | |||||
| U.S. agency- sponsored mortgages | Senior interests | Subordinated interests | |||
| Discount rate | — | — | |||
| Weighted average discount rate | % | — | — | ||
| Constant prepayment rate | — | — | |||
| Weighted average constant prepayment rate | % | — | — | ||
Anticipated net credit losses(2) | NM | — | — | ||
| Weighted average anticipated net credit losses | NM | — | — | ||
| Weighted average life | — | — | |||
| (1) | Disclosure of non-agency-sponsored mortgages as senior and subordinated interests is indicative of the interests’ position in the capital structure of the securitization. |
| (2) | Anticipated net credit losses represent estimated loss severity associated with defaulted mortgage loans underlying the mortgage securitizations disclosed above. Anticipated net credit losses, in this instance, do not represent total credit losses incurred to date, nor do they represent credit losses expected on retained interests in mortgage securitizations. |
| NM | Anticipated net credit losses are not meaningful due to U.S. agency guarantees. |
| March 31, 2017 | March 31, 2018 | |||||||||||
Non-agency-sponsored mortgages(1) | Non-agency-sponsored mortgages(1) | |||||||||||
| U.S. agency- sponsored mortgages | Senior interests | Subordinated interests | U.S. agency- sponsored mortgages | Senior interests | Subordinated interests | |||||||
| Discount rate | 0.7% to 41.8% | 0.0% to 4.4% | 6.2% to 23.8% | 0.8% to 41.3% | 6.5 | % | 4.0% to 11.2% | |||||
| Weighted average discount rate | 9.5 | % | 0.5 | % | 11.8 | % | 6.2 | % | 6.5 | % | 7.3 | % |
| Constant prepayment rate | 6.2% to 20.7% | 8.0% to 13.1% | 0.5% to 23.6% | 4.3% to 18.4% | 8.9 | % | 9.1% to 13.1% | |||||
| Weighted average constant prepayment rate | 9.8 | % | 12.3 | % | 9.0 | % | 10.3 | % | 8.9 | % | 10.7 | % |
Anticipated net credit losses(2) | NM | 0.5% to 53.0% | 29.7% to 62.7% | NM | 46.9 | % | 35.1% to 52.1% | |||||
| Weighted average anticipated net credit losses | NM | 8.7 | % | 49.0 | % | NM | 46.9 | % | 44.5 | % | ||
| Weighted average life | 0.0 to 28.6 years | 5.3 to 8.6 years | 0.9 to 11.9 years | 0.1 to 27.5 years | 5.4 years | 2.1 to 18.3 years | ||||||
| December 31, 2016 | December 31, 2017 | |||||||||||
Non-agency-sponsored mortgages(1) | Non-agency-sponsored mortgages(1) | |||||||||||
| U.S. agency- sponsored mortgages | Senior interests | Subordinated interests | U.S. agency- sponsored mortgages | Senior interests | Subordinated interests | |||||||
| Discount rate | 0.7% to 28.2% | 0.0% to 8.1% | 5.1% to 26.4% | 1.8% to 84.2% | 5.8% to 100.0% | 2.8% to 35.1% | ||||||
| Weighted average discount rate | 9.0 | % | 2.1 | % | 13.1 | % | 7.1 | % | 5.8 | % | 9.0 | % |
| Constant prepayment rate | 6.8% to 22.8% | 4.2% to 14.7% | 0.5% to 37.5% | 6.9% to 27.8% | 8.9% to 15.5% | 8.6% to 13.1% | ||||||
| Weighted average constant prepayment rate | 10.2 | % | 11.0 | % | 10.8 | % | 11.6 | % | 8.9 | % | 10.6 | % |
Anticipated net credit losses(2) | NM | 0.5% to 85.6% | 8.0% to 63.7% | NM | 0.4% to 46.9% | 35.1% to 52.1% | ||||||
| Weighted average anticipated net credit losses | NM | 31.4 | % | 48.3 | % | NM | 46.9 | % | 44.9 | % | ||
| Weighted average life | 0.2 to 28.8 years | 5.0 to 8.5 years | 1.2 to 12.1 years | 0.1 to 27.8 years | 4.8 to 5.3 years | 0.2 to 18.6 years | ||||||
| (1) | Disclosure of non-agency-sponsored mortgages as senior and subordinated interests is indicative of the interests’ position in the capital structure of the securitization. |
| (2) | Anticipated net credit losses represent estimated loss severity associated with defaulted mortgage loans underlying the mortgage securitizations disclosed above. Anticipated net credit losses, in this instance, do not represent total credit losses incurred to date, nor do they represent credit losses expected on retained interests in mortgage securitizations. |
| NM | Anticipated net credit losses are not meaningful due to U.S. agency guarantees. |
| March 31, 2017 | March 31, 2018 | |||||||||||||||||
Non-agency-sponsored mortgages(1) | Non-agency-sponsored mortgages(1) | |||||||||||||||||
| In millions of dollars | U.S. agency- sponsored mortgages | Senior interests | Subordinated interests | U.S. agency- sponsored mortgages | Senior interests | Subordinated interests | ||||||||||||
| Carrying value of retained interests | $ | 1,211 | $ | 30 | $ | 168 | $ | 1,767 | $ | 245 | $ | 138 | ||||||
| Discount rates | ||||||||||||||||||
| Adverse change of 10% | $ | (42 | ) | $ | (8 | ) | $ | (8 | ) | $ | (47 | ) | $ | — | $ | (2 | ) | |
| Adverse change of 20% | (80 | ) | (16 | ) | (15 | ) | (91 | ) | — | (4 | ) | |||||||
| Constant prepayment rate | ||||||||||||||||||
| Adverse change of 10% | (33 | ) | (2 | ) | (3 | ) | (37 | ) | — | (1 | ) | |||||||
| Adverse change of 20% | (69 | ) | (3 | ) | (7 | ) | (75 | ) | — | (2 | ) | |||||||
| Anticipated net credit losses | ||||||||||||||||||
| Adverse change of 10% | NM | (7 | ) | (1 | ) | NM | — | — | ||||||||||
| Adverse change of 20% | NM | (14 | ) | (2 | ) | NM | — | (1 | ) | |||||||||
| December 31, 2016 | December 31, 2017 | |||||||||||||||||
Non-agency-sponsored mortgages(1) | Non-agency-sponsored mortgages(1) | |||||||||||||||||
| In millions of dollars | U.S. agency- sponsored mortgages | Senior interests | Subordinated interests | U.S. agency- sponsored mortgages | Senior interests | Subordinated interests | ||||||||||||
| Carrying value of retained interests | $ | 2,258 | $ | 26 | $ | 161 | $ | 1,634 | $ | 214 | $ | 139 | ||||||
| Discount rates | ||||||||||||||||||
| Adverse change of 10% | $ | (71 | ) | $ | (7 | ) | $ | (8 | ) | $ | (44 | ) | $ | (2 | ) | $ | (3 | ) |
| Adverse change of 20% | (138 | ) | (14 | ) | (16 | ) | (85 | ) | (4 | ) | (5 | ) | ||||||
| Constant prepayment rate | ||||||||||||||||||
| Adverse change of 10% | (80 | ) | (2 | ) | (4 | ) | (41 | ) | (1 | ) | (1 | ) | ||||||
| Adverse change of 20% | (160 | ) | (3 | ) | (8 | ) | (84 | ) | (1 | ) | (2 | ) | ||||||
| Anticipated net credit losses | ||||||||||||||||||
| Adverse change of 10% | NM | (7 | ) | (1 | ) | NM | (3 | ) | — | |||||||||
| Adverse change of 20% | NM | (14 | ) | (2 | ) | NM | (7 | ) | — | |||||||||
| (1) | Disclosure of non-agency-sponsored mortgages as senior and subordinated interests is indicative of the interests’ position in the capital structure of the securitization. |
| NM | Anticipated net credit losses are not meaningful due to U.S. agency guarantees. |
| In millions of dollars | 2017 | 2016 | 2018 | 2017 | ||||||||
| Balance, beginning of year | $ | 1,564 | $ | 1,781 | $ | 558 | $ | 1,564 | ||||
| Originations | 35 | 33 | 17 | 35 | ||||||||
| Changes in fair value of MSRs due to changes in inputs and assumptions | 67 | (225 | ) | 46 | 67 | |||||||
Other changes(1) | (53 | ) | (79 | ) | (17 | ) | (53 | ) | ||||
Sale of MSRs(2) | (1,046 | ) | 14 | (17 | ) | (1,046 | ) | |||||
| Balance, as of March 31 | $ | 567 | $ | 1,524 | $ | 587 | $ | 567 | ||||
| (1) | Represents changes due to customer payments and passage of time. |
| (2) | See Note 2 to the Consolidated Financial Statements in Citi’s 2017 Annual Report on Form 10-K for more information on the exit of the U.S. mortgage servicing operations and sale of |
| In millions of dollars | 2017 | 2016 | 2018 | 2017 | ||||||||
| Servicing fees | $ | 106 | $ | 128 | $ | 46 | $ | 106 | ||||
| Late fees | 3 | 4 | 1 | 3 | ||||||||
| Ancillary fees | 4 | 5 | 3 | 4 | ||||||||
| Total MSR fees | $ | 113 | $ | 137 | $ | 50 | $ | 113 | ||||
| Three Months Ended March 31, | ||||||||||||
| In billions of dollars | Mar. 31, 2017 | Mar. 31, 2016 | 2018 | 2017 | ||||||||
| Proceeds from new securitizations | $ | 0.3 | $ | — | $ | 1.4 | $ | 0.3 | ||||
| Mar. 31, | Dec. 31, | |
| Discount rate | 1.1% to | |
| In millions of dollars | Mar. 31, 2018 | Dec. 31, 2017 | ||||
| Carrying value of retained interests | $ | 3,713 | $ | 3,607 | ||
| Discount rates | ||||||
| Adverse change of 10% | $ | (25 | ) | $ | (24 | ) |
| Adverse change of 20% | (49 | ) | (47 | ) | ||
| In millions of dollars | Mar. 31, 2017 | Dec. 31, 2016 | ||||
| Carrying value of retained interests | $ | 4,259 | $ | 4,261 | ||
| Discount rates | ||||||
| Adverse change of 10% | $ | (28 | ) | $ | (30 | ) |
| Adverse change of 20% | (55 | ) | (62 | ) | ||
| March 31, 2017 | March 31, 2018 | |||||||||||
| In millions of dollars | Total unconsolidated VIE assets | Maximum exposure to unconsolidated VIEs | Total unconsolidated VIE assets | Maximum exposure to unconsolidated VIEs | ||||||||
| Type | ||||||||||||
| Commercial and other real estate | $ | 8,194 | $ | 2,164 | $ | 15,152 | $ | 4,815 | ||||
| Corporate loans | 3,376 | 2,183 | 6,862 | 5,731 | ||||||||
| Hedge funds and equities | 417 | 57 | 449 | 58 | ||||||||
| Airplanes, ships and other assets | 38,210 | 16,809 | 39,919 | 16,061 | ||||||||
| Total | $ | 50,197 | $ | 21,213 | $ | 62,382 | $ | 26,665 | ||||
| December 31, 2016 | December 31, 2017 | |||||||||||
| In millions of dollars | Total unconsolidated VIE assets | Maximum exposure to unconsolidated VIEs | Total unconsolidated VIE assets | Maximum exposure to unconsolidated VIEs | ||||||||
| Type | ||||||||||||
| Commercial and other real estate | $ | 8,784 | $ | 2,368 | $ | 15,370 | $ | 5,445 | ||||
| Corporate loans | 4,051 | 2,684 | 4,725 | 3,587 | ||||||||
| Hedge funds and equities | 370 | 54 | 542 | 58 | ||||||||
| Airplanes, ships and other assets | 39,230 | 16,837 | 39,202 | 16,849 | ||||||||
| Total | $ | 52,435 | $ | 21,943 | $ | 59,839 | $ | 25,939 | ||||
Hedging instruments under ASC 815(1)(2) | Other derivative instruments | Hedging instruments under ASC 815(1) | Other derivative instruments | |||||||||||||||||||||||||||
| Trading derivatives | Management hedges(3) | Trading derivatives | ||||||||||||||||||||||||||||
| In millions of dollars | March 31, 2017 | December 31, 2016 | March 31, 2017 | December 31, 2016 | March 31, 2017 | December 31, 2016 | March 31, 2018 | December 31, 2017 | March 31, 2018 | December 31, 2017 | ||||||||||||||||||||
| Interest rate contracts | ||||||||||||||||||||||||||||||
| Swaps | $ | 198,753 | $ | 151,331 | $ | 20,669,239 | $ | 19,145,250 | $ | 29,447 | $ | 47,324 | $ | 197,328 | $ | 189,779 | $ | 21,321,930 | $ | 18,754,219 | ||||||||||
| Futures and forwards | 97 | 97 | 8,341,434 | 6,864,276 | 10,143 | 30,834 | 500 | — | 8,245,034 | 6,460,539 | ||||||||||||||||||||
| Written options | — | — | 3,645,213 | 2,921,070 | 3,288 | 4,759 | — | — | 4,578,837 | 3,516,131 | ||||||||||||||||||||
| Purchased options | — | — | 3,501,503 | 2,768,528 | 3,900 | 7,320 | — | — | 3,710,550 | 3,234,025 | ||||||||||||||||||||
| Total interest rate contract notionals | $ | 198,850 | $ | 151,428 | $ | 36,157,389 | $ | 31,699,124 | $ | 46,778 | $ | 90,237 | $ | 197,828 | $ | 189,779 | $ | 37,856,351 | $ | 31,964,914 | ||||||||||
| Foreign exchange contracts | ||||||||||||||||||||||||||||||
| Swaps | $ | 36,928 | $ | 19,042 | $ | 6,548,915 | $ | 5,492,145 | $ | 21,420 | $ | 22,676 | $ | 40,063 | $ | 37,162 | $ | 6,940,579 | $ | 5,576,357 | ||||||||||
| Futures, forwards and spot | 38,220 | 56,964 | 4,175,350 | 3,251,132 | 2,333 | 3,419 | 39,102 | 33,103 | 4,465,416 | 3,097,700 | ||||||||||||||||||||
| Written options | 1,172 | — | 1,299,018 | 1,194,325 | — | — | 1,151 | 3,951 | 1,460,614 | 1,127,728 | ||||||||||||||||||||
| Purchased options | 2,596 | — | 1,308,291 | 1,215,961 | — | — | 1,405 | 6,427 | 1,450,534 | 1,148,686 | ||||||||||||||||||||
| Total foreign exchange contract notionals | $ | 78,916 | $ | 76,006 | $ | 13,331,574 | $ | 11,153,563 | $ | 23,753 | $ | 26,095 | $ | 81,721 | $ | 80,643 | $ | 14,317,143 | $ | 10,950,471 | ||||||||||
| Equity contracts | ||||||||||||||||||||||||||||||
| Swaps | $ | — | $ | — | $ | 204,137 | $ | 192,366 | $ | — | $ | — | $ | — | $ | — | $ | 243,567 | $ | 215,834 | ||||||||||
| Futures and forwards | — | — | 42,926 | 37,557 | — | — | — | — | 67,910 | 72,616 | ||||||||||||||||||||
| Written options | — | — | 372,759 | 304,579 | — | — | — | — | 427,798 | 389,961 | ||||||||||||||||||||
| Purchased options | — | — | 350,655 | 266,070 | — | — | — | — | 366,219 | 328,154 | ||||||||||||||||||||
| Total equity contract notionals | $ | — | $ | — | $ | 970,477 | $ | 800,572 | $ | — | $ | — | $ | — | $ | — | $ | 1,105,494 | $ | 1,006,565 | ||||||||||
| Commodity and other contracts | ||||||||||||||||||||||||||||||
| Swaps | $ | — | $ | — | $ | 67,942 | $ | 70,774 | $ | — | $ | — | $ | — | $ | — | $ | 92,552 | $ | 82,039 | ||||||||||
| Futures and forwards | 155 | 182 | 151,844 | 142,530 | — | — | 91 | 23 | 176,174 | 153,248 | ||||||||||||||||||||
| Written options | — | — | 74,668 | 74,627 | — | — | — | — | 71,136 | 62,045 | ||||||||||||||||||||
| Purchased options | — | — | 70,529 | 69,629 | — | — | — | — | 66,092 | 60,526 | ||||||||||||||||||||
| Total commodity and other contract notionals | $ | 155 | $ | 182 | $ | 364,983 | $ | 357,560 | $ | — | $ | — | $ | 91 | $ | 23 | $ | 405,954 | $ | 357,858 | ||||||||||
Credit derivatives | ||||||||||||||||||||||||||||||
| Protection sold | $ | — | $ | — | $ | 876,791 | $ | 859,420 | $ | — | $ | — | $ | — | $ | — | $ | 741,700 | $ | 735,142 | ||||||||||
| Protection purchased | — | — | 895,380 | 883,003 | 17,226 | 19,470 | — | — | 790,134 | 777,713 | ||||||||||||||||||||
| Total credit derivatives | $ | — | $ | — | $ | 1,772,171 | $ | 1,742,423 | $ | 17,226 | $ | 19,470 | $ | — | $ | — | $ | 1,531,834 | $ | 1,512,855 | ||||||||||
| Total derivative notionals | $ | 277,921 | $ | 227,616 | $ | 52,596,594 | $ | 45,753,242 | $ | 87,757 | $ | 135,802 | $ | 279,640 | $ | 270,445 | $ | 55,216,776 | $ | 45,792,663 | ||||||||||
| (1) | The notional amounts presented in this table do not include hedge accounting relationships under ASC 815 where Citigroup is hedging the foreign currency risk of a net investment in a foreign operation by issuing a foreign-currency-denominated debt instrument. The notional amount of such debt was |
| (2) |
| Credit derivatives are arrangements designed to allow one party (protection buyer) to transfer the credit risk of a “reference asset” to another party (protection seller). These arrangements allow a protection seller to assume the credit risk associated with the reference asset without directly purchasing that asset. The Company enters into credit derivative positions for purposes such as risk management, yield enhancement, reduction of credit concentrations and diversification of overall risk. |
| In millions of dollars at March 31, 2017 | Derivatives classified in Trading account assets / liabilities(1)(2)(3) | Derivatives classified in Other assets / liabilities(2)(3) | ||||||||||||||||
| In millions of dollars at March 31, 2018 | Derivatives classified in Trading account assets / liabilities(1)(2) | |||||||||||||||||
| Derivatives instruments designated as ASC 815 hedges | Assets | Liabilities | Assets | Liabilities | Assets | Liabilities | ||||||||||||
| Over-the-counter | $ | 645 | $ | 143 | $ | 1,308 | $ | 34 | $ | 1,896 | $ | 92 | ||||||
| Cleared | 3,925 | 2,175 | 53 | 62 | 62 | 125 | ||||||||||||
| Interest rate contracts | $ | 4,570 | $ | 2,318 | $ | 1,361 | $ | 96 | $ | 1,958 | $ | 217 | ||||||
| Over-the-counter | $ | 1,315 | $ | 923 | $ | 232 | $ | 236 | $ | 1,011 | $ | 1,199 | ||||||
| Foreign exchange contracts | $ | 1,315 | $ | 923 | $ | 232 | $ | 236 | $ | 1,011 | $ | 1,199 | ||||||
| Total derivatives instruments designated as ASC 815 hedges | $ | 5,885 | $ | 3,241 | $ | 1,593 | $ | 332 | $ | 2,969 | $ | 1,416 | ||||||
| Derivatives instruments not designated as ASC 815 hedges | ||||||||||||||||||
| Over-the-counter | $ | 222,212 | $ | 203,860 | $ | 64 | $ | — | $ | 184,682 | $ | 163,259 | ||||||
| Cleared | 86,795 | 94,086 | 119 | 164 | 8,972 | 11,926 | ||||||||||||
| Exchange traded | 150 | 85 | — | — | 217 | 184 | ||||||||||||
| Interest rate contracts | $ | 309,157 | $ | 298,031 | $ | 183 | $ | 164 | $ | 193,871 | $ | 175,369 | ||||||
| Over-the-counter | $ | 122,726 | $ | 126,685 | $ | — | $ | 59 | $ | 125,761 | $ | 119,004 | ||||||
| Cleared | 1,170 | 1,042 | — | — | 3,426 | 3,343 | ||||||||||||
| Exchange traded | 25 | 17 | — | — | 19 | 8 | ||||||||||||
| Foreign exchange contracts | $ | 123,921 | $ | 127,744 | $ | — | $ | 59 | $ | 129,206 | $ | 122,355 | ||||||
| Over-the-counter | $ | 16,494 | $ | 20,844 | $ | — | $ | — | $ | 18,737 | $ | 23,424 | ||||||
| Cleared | 19 | 27 | — | — | 12 | 17 | ||||||||||||
| Exchange traded | 8,123 | 7,819 | — | — | 10,686 | 10,674 | ||||||||||||
| Equity contracts | $ | 24,636 | $ | 28,690 | $ | — | $ | — | $ | 29,435 | $ | 34,115 | ||||||
| Over-the-counter | $ | 10,807 | $ | 12,647 | $ | — | $ | — | $ | 15,189 | $ | 18,134 | ||||||
| Exchange traded | 642 | 665 | — | — | 642 | 717 | ||||||||||||
| Commodity and other contracts | $ | 11,449 | $ | 13,312 | $ | — | $ | — | $ | 15,831 | $ | 18,851 | ||||||
| Over-the-counter | $ | 16,987 | $ | 17,770 | $ | 46 | $ | 87 | $ | 12,059 | $ | 11,633 | ||||||
| Cleared | 6,335 | 6,916 | 26 | 325 | 6,968 | 7,976 | ||||||||||||
Credit derivatives | $ | 23,322 | $ | 24,686 | $ | 72 | $ | 412 | $ | 19,027 | $ | 19,609 | ||||||
| Total derivatives instruments not designated as ASC 815 hedges | $ | 492,485 | $ | 492,463 | $ | 255 | $ | 635 | $ | 387,370 | $ | 370,299 | ||||||
| Total derivatives | $ | 498,370 | $ | 495,704 | $ | 1,848 | $ | 967 | $ | 390,339 | $ | 371,715 | ||||||
Cash collateral paid/received | $ | 10,436 | $ | 13,961 | $ | 5 | $ | 15 | $ | 8,676 | $ | 14,971 | ||||||
Less: Netting agreements | (416,229 | ) | (416,229 | ) | — | — | (303,169 | ) | (303,169 | ) | ||||||||
Less: Netting cash collateral received/paid | (36,198 | ) | (40,577 | ) | (940 | ) | (51 | ) | (40,951 | ) | (33,800 | ) | ||||||
Net receivables/payables included on the Consolidated Balance Sheet | $ | 56,379 | $ | 52,859 | $ | 913 | $ | 931 | $ | 54,895 | $ | 49,717 | ||||||
| Additional amounts subject to an enforceable master netting agreement, but not offset on the Consolidated Balance Sheet | ||||||||||||||||||
| Less: Cash collateral received/paid | $ | (653 | ) | $ | (13 | ) | $ | — | $ | — | $ | (924 | ) | $ | (113 | ) | ||
| Less: Non-cash collateral received/paid | (10,239 | ) | (8,635 | ) | (506 | ) | — | (13,525 | ) | (20,260 | ) | |||||||
Total net receivables/payables | $ | 45,487 | $ | 44,211 | $ | 407 | $ | 931 | $ | 40,446 | $ | 29,344 | ||||||
| (1) | The trading derivatives fair values are also presented in Note 20 to the Consolidated Financial Statements. |
| (2) |
| Over-the-counter (OTC) derivatives are derivatives executed and settled bilaterally with counterparties without the use of an organized exchange or central clearing house. Cleared derivatives include derivatives executed bilaterally with a counterparty in the OTC market, but then novated to a central clearing house, whereby the central clearing house becomes the counterparty to both of the original counterparties. Exchange traded derivatives include derivatives executed directly on an organized exchange that provides pre-trade price transparency. |
| Represents the netting of derivative receivable and payable balances with the same counterparty under enforceable netting agreements. Approximately |
| Represents the netting of cash collateral paid and received by counterparty under enforceable credit support agreements. Substantially all cash collateral received and paid is netted against OTC derivative assets and liabilities, respectively. |
| The net receivables/payables include approximately |
| In millions of dollars at December 31, 2016 | Derivatives classified in Trading account assets / liabilities(1)(2)(3) | Derivatives classified in Other assets / liabilities(2)(3) | ||||||||||||||||
| In millions of dollars at December 31, 2017 | Derivatives classified in Trading account assets / liabilities(1)(2) | |||||||||||||||||
| Derivatives instruments designated as ASC 815 hedges | Assets | Liabilities | Assets | Liabilities | Assets | Liabilities | ||||||||||||
| Over-the-counter | $ | 716 | $ | 171 | $ | 1,927 | $ | 22 | $ | 1,969 | $ | 134 | ||||||
| Cleared | 3,530 | 2,154 | 47 | 82 | 110 | 92 | ||||||||||||
| Interest rate contracts | $ | 4,246 | $ | 2,325 | $ | 1,974 | $ | 104 | $ | 2,079 | $ | 226 | ||||||
| Over-the-counter | $ | 2,494 | $ | 393 | $ | 747 | $ | 645 | $ | 1,143 | $ | 1,150 | ||||||
| Foreign exchange contracts | $ | 2,494 | $ | 393 | $ | 747 | $ | 645 | $ | 1,143 | $ | 1,150 | ||||||
| Total derivatives instruments designated as ASC 815 hedges | $ | 6,740 | $ | 2,718 | $ | 2,721 | $ | 749 | $ | 3,222 | $ | 1,376 | ||||||
| Derivatives instruments not designated as ASC 815 hedges | ||||||||||||||||||
| Over-the-counter | $ | 244,072 | $ | 221,534 | $ | 225 | $ | 5 | $ | 195,677 | $ | 173,937 | ||||||
| Cleared | 120,920 | 130,855 | 240 | 349 | 7,129 | 10,381 | ||||||||||||
| Exchange traded | 87 | 47 | — | — | 102 | 95 | ||||||||||||
| Interest rate contracts | $ | 365,079 | $ | 352,436 | $ | 465 | $ | 354 | $ | 202,908 | $ | 184,413 | ||||||
| Over-the-counter | $ | 182,659 | $ | 186,867 | $ | — | $ | 60 | $ | 119,092 | $ | 117,473 | ||||||
| Cleared | 482 | 470 | — | — | 1,690 | 2,028 | ||||||||||||
| Exchange traded | 27 | 31 | — | — | 34 | 121 | ||||||||||||
| Foreign exchange contracts | $ | 183,168 | $ | 187,368 | $ | — | $ | 60 | $ | 120,816 | $ | 119,622 | ||||||
| Over-the-counter | $ | 15,625 | $ | 19,119 | $ | — | $ | — | $ | 17,221 | $ | 21,201 | ||||||
| Cleared | 1 | 21 | — | — | 21 | 25 | ||||||||||||
| Exchange traded | 8,484 | 7,376 | — | — | 9,736 | 10,147 | ||||||||||||
| Equity contracts | $ | 24,110 | $ | 26,516 | $ | — | $ | — | $ | 26,978 | $ | 31,373 | ||||||
| Over-the-counter | $ | 13,046 | $ | 14,234 | $ | — | $ | — | $ | 13,499 | $ | 16,362 | ||||||
| Exchange traded | 719 | 798 | — | — | 604 | 665 | ||||||||||||
| Commodity and other contracts | $ | 13,765 | $ | 15,032 | $ | — | $ | — | $ | 14,103 | $ | 17,027 | ||||||
| Over-the-counter | $ | 19,033 | $ | 19,563 | $ | 159 | $ | 78 | $ | 12,972 | $ | 12,958 | ||||||
| Cleared | 5,582 | 5,874 | 47 | 310 | 7,562 | 8,575 | ||||||||||||
Credit derivatives | $ | 24,615 | $ | 25,437 | $ | 206 | $ | 388 | $ | 20,534 | $ | 21,533 | ||||||
| Total derivatives instruments not designated as ASC 815 hedges | $ | 610,737 | $ | 606,789 | $ | 671 | $ | 802 | $ | 385,339 | $ | 373,968 | ||||||
| Total derivatives | $ | 617,477 | $ | 609,507 | $ | 3,392 | $ | 1,551 | $ | 388,561 | $ | 375,344 | ||||||
Cash collateral paid/received | $ | 11,188 | $ | 15,731 | $ | 8 | $ | 1 | $ | 7,541 | $ | 14,308 | ||||||
Less: Netting agreements | (519,000 | ) | (519,000 | ) | — | — | (306,401 | ) | (306,401 | ) | ||||||||
Less: Netting cash collateral received/paid | (45,912 | ) | (49,811 | ) | (1,345 | ) | (53 | ) | (38,532 | ) | (35,666 | ) | ||||||
Net receivables/payables included on the Consolidated Balance Sheet | $ | 63,753 | $ | 56,427 | $ | 2,055 | $ | 1,499 | $ | 51,169 | $ | 47,585 | ||||||
| Additional amounts subject to an enforceable master netting agreement, but not offset on the Consolidated Balance Sheet | ||||||||||||||||||
| Less: Cash collateral received/paid | $ | (819 | ) | $ | (19 | ) | $ | — | $ | — | $ | (872 | ) | $ | (121 | ) | ||
| Less: Non-cash collateral received/paid | (11,767 | ) | (5,883 | ) | (530 | ) | — | (12,739 | ) | (6,929 | ) | |||||||
Total net receivables/payables | $ | 51,167 | $ | 50,525 | $ | 1,525 | $ | 1,499 | $ | 37,558 | $ | 40,535 | ||||||
| (1) | The trading derivatives fair values are presented in Note 20 to the Consolidated Financial Statements. |
Derivative mark-to-market receivables/payables |
| Over-the-counter (OTC) derivatives are derivatives executed and settled bilaterally with counterparties without the use of an organized exchange or central clearing house. Cleared derivatives include derivatives executed bilaterally with a counterparty in the OTC market, but then novated to a central clearing house, |
| Represents the netting of derivative receivable and payable balances with the same counterparty under enforceable netting agreements. Approximately |
| Represents the netting of cash collateral paid and received by counterparty under enforceable credit support agreements. Substantially all cash collateral received and paid is netted against OTC derivative assets and liabilities, respectively. |
| The net receivables/payables include approximately |
Gains (losses) included in Other revenue | ||||||
| Three months ended March 31, | ||||||
| In millions of dollars | 2017 | 2016 | ||||
| Interest rate contracts | $ | (45 | ) | $ | 15 | |
| Foreign exchange | 3 | 4 | ||||
| Credit derivatives | (263 | ) | (213 | ) | ||
| Total Citigroup | $ | (305 | ) | $ | (194 | ) |
Gains (losses) included in Other revenue | ||||||
| Three Months Ended March 31, | ||||||
| In millions of dollars | 2018 | 2017 | ||||
| Interest rate contracts | $ | (28 | ) | $ | (53 | ) |
| Foreign exchange | 527 | 225 | ||||
| Credit derivatives | (46 | ) | (279 | ) | ||
| Total Citigroup | $ | 453 | $ | (107 | ) | |
Gains (losses) on fair value hedges(1) | |||||||||||||||
Gains (losses) on fair value hedges(1) | Three Months Ended March 31, | ||||||||||||||
| Three months ended March 31, | 2018 | 2017(3) | |||||||||||||
| In millions of dollars | 2017 | 2016 | Other Revenue | Net interest revenue | Other Revenue | ||||||||||
| Gain (loss) on the derivatives in designated and qualifying fair value hedges | |||||||||||||||
| Interest rate contracts | $ | (305 | ) | $ | 2,115 | ||||||||||
| Foreign exchange contracts | (82 | ) | (1,361 | ) | |||||||||||
| Commodity contracts | 2 | 349 | |||||||||||||
| Interest rate hedges | $ | — | $ | 878 | $ | (305 | ) | ||||||||
| Foreign exchange hedges | 179 | — | (82 | ) | |||||||||||
| Commodity hedges | (2 | ) | — | 2 | |||||||||||
| Total gain (loss) on the derivatives in designated and qualifying fair value hedges | $ | (385 | ) | $ | 1,103 | $ | 177 | $ | 878 | $ | (385 | ) | |||
| Gain (loss) on the hedged item in designated and qualifying fair value hedges | |||||||||||||||
| Interest rate hedges | $ | 296 | $ | (2,090 | ) | $ | — | $ | (866 | ) | $ | 296 | |||
| Foreign exchange hedges | 196 | 1,307 | (249 | ) | — | 196 | |||||||||
| Commodity hedges | (1 | ) | (344 | ) | 1 | — | (1 | ) | |||||||
| Total gain (loss) on the hedged item in designated and qualifying fair value hedges | $ | 491 | $ | (1,127 | ) | $ | (248 | ) | $ | (866 | ) | $ | 491 | ||
| Hedge ineffectiveness recognized in earnings on designated and qualifying fair value hedges | |||||||||||||||
| Net gain (loss) excluded from assessment of the effectiveness of fair value hedges | |||||||||||||||
| Interest rate hedges | $ | (10 | ) | $ | 27 | $ | — | $ | — | $ | 1 | ||||
| Foreign exchange hedges | 62 | (75 | ) | ||||||||||||
| Total hedge ineffectiveness recognized in earnings on designated and qualifying fair value hedges | $ | 52 | $ | (48 | ) | ||||||||||
| Net gain (loss) excluded from assessment of the effectiveness of fair value hedges | |||||||||||||||
| Interest rate contracts | $ | 1 | $ | (2 | ) | ||||||||||
Foreign exchange contracts(2) | 52 | 21 | |||||||||||||
Commodity hedges(2) | 1 | 5 | |||||||||||||
Foreign exchange hedges(2) | 23 | — | 52 | ||||||||||||
| Commodity hedges | 1 | — | 1 | ||||||||||||
| Total net gain (loss) excluded from assessment of the effectiveness of fair value hedges | $ | 54 | $ | 24 | $ | 24 | $ | — | $ | 54 | |||||
| (1) |
| (2) | Amounts relate to the premium associated with forward contracts (differential between spot and contractual forward rates). These amounts are excluded from the assessment of hedge effectiveness and are reflected directly in earnings. After January 1, 2018, amounts include cross-currency basis which is recognized in accumulated other comprehensive income. The amount of cross currency basis that was included in accumulated other comprehensive income was $5 million, none of which was recognized in earnings. |
| (3) | Hedge ineffectiveness recognized in earnings on designated and qualifying fair value hedges for the three months ended March 31, 2017 was $(10) million for interest rate hedges and $62 million for foreign exchange hedges, for a total of $52 million. |
| In millions of dollars | |||||||||
| Balance sheet line item in which hedged item is recorded | Carrying amount of hedged asset/ liability | Cumulative fair value hedging adjustment included in the carrying amount | |||||||
| Active | De-Designated | ||||||||
| Long-term debt | $ | 139,786 | $ | (24 | ) | $ | 1,921 | ||
| Investments available for sale | 73,717 | 259 | 69 | ||||||
| Three months ended March 31, | ||||||
| In millions of dollars | 2017 | 2016 | ||||
| Effective portion of cash flow hedges included in AOCI | ||||||
| Interest rate contracts | $ | 41 | $ | 415 | ||
| Foreign exchange contracts | — | 24 | ||||
| Total effective portion of cash flow hedges included in AOCI | $ | 41 | $ | 439 | ||
| Effective portion of cash flow hedges reclassified from AOCI to earnings | ||||||
| Interest rate contracts | $ | 44 | $ | (16 | ) | |
| Foreign exchange contracts | (3 | ) | (26 | ) | ||
Total effective portion of cash flow hedges reclassified from AOCI to earnings(1) | $ | 41 | $ | (42 | ) | |
| Three Months Ended March 31, | |||||||||
| In millions of dollars | 2018 | 2017 | |||||||
| Amount of gain (loss) recognized in AOCI on derivative | |||||||||
Interest rate contracts(1) | $ | (322 | ) | $ | 41 | ||||
| Foreign exchange contracts | 6 | — | |||||||
| Total gain (loss) recognized in AOCI | $ | (316 | ) | $ | 41 | ||||
| Amount of gain (loss) reclassified from AOCI to earnings | Other revenue | Net interest revenue | |||||||
Interest rate contracts(1) | $ | — | $ | (31 | ) | $ | 44 | ||
| Foreign exchange contracts | 2 | — | (3 | ) | |||||
| Total gain (loss) reclassified from AOCI into earnings | $ | 2 | $ | (31 | ) | $ | 41 | ||
| (1) |
| Fair values | Notionals | Fair values | Notionals | |||||||||||||||||||||
| In millions of dollars at March 31, 2017 | Receivable(1) | Payable(2) | Protection purchased | Protection sold | ||||||||||||||||||||
| In millions of dollars at March 31, 2018 | Receivable(1) | Payable(2) | Protection purchased | Protection sold | ||||||||||||||||||||
| By industry/counterparty | ||||||||||||||||||||||||
| Banks | $ | 10,428 | $ | 9,483 | $ | 383,466 | $ | 393,864 | $ | 6,782 | $ | 6,120 | $ | 263,672 | $ | 272,815 | ||||||||
| Broker-dealers | 3,297 | 3,587 | 107,767 | 116,589 | 2,155 | 2,060 | 72,862 | 83,585 | ||||||||||||||||
| Non-financial | 80 | 187 | 3,164 | 1,430 | 75 | 75 | 1,240 | 2,313 | ||||||||||||||||
| Insurance and other financial institutions | 9,589 | 11,841 | 418,209 | 364,908 | 10,015 | 11,354 | 452,360 | 382,987 | ||||||||||||||||
| Total by industry/counterparty | $ | 23,394 | $ | 25,098 | $ | 912,606 | $ | 876,791 | $ | 19,027 | $ | 19,609 | $ | 790,134 | $ | 741,700 | ||||||||
| By instrument | ||||||||||||||||||||||||
| Credit default swaps and options | $ | 23,145 | $ | 23,096 | $ | 889,829 | $ | 868,748 | $ | 18,591 | $ | 18,787 | $ | 766,018 | $ | 729,303 | ||||||||
| Total return swaps and other | 249 | 2,002 | 22,777 | 8,043 | 436 | 822 | 24,116 | 12,397 | ||||||||||||||||
| Total by instrument | $ | 23,394 | $ | 25,098 | $ | 912,606 | $ | 876,791 | $ | 19,027 | $ | 19,609 | $ | 790,134 | $ | 741,700 | ||||||||
| By rating | ||||||||||||||||||||||||
| Investment grade | $ | 9,951 | $ | 10,142 | $ | 691,002 | $ | 669,241 | $ | 9,496 | $ | 9,594 | $ | 597,093 | $ | 559,526 | ||||||||
| Non-investment grade | 13,443 | 14,956 | 221,604 | 207,550 | 9,531 | 10,015 | 193,041 | 182,174 | ||||||||||||||||
| Total by rating | $ | 23,394 | $ | 25,098 | $ | 912,606 | $ | 876,791 | $ | 19,027 | $ | 19,609 | $ | 790,134 | $ | 741,700 | ||||||||
| By maturity | ||||||||||||||||||||||||
| Within 1 year | $ | 3,008 | $ | 4,108 | $ | 304,227 | $ | 296,731 | $ | 2,337 | $ | 2,517 | $ | 228,396 | $ | 212,661 | ||||||||
| From 1 to 5 years | 16,894 | 17,187 | 532,809 | 511,054 | 14,152 | 14,223 | 477,627 | 454,001 | ||||||||||||||||
| After 5 years | 3,492 | 3,803 | 75,570 | 69,006 | 2,538 | 2,869 | 84,111 | 75,038 | ||||||||||||||||
| Total by maturity | $ | 23,394 | $ | 25,098 | $ | 912,606 | $ | 876,791 | $ | 19,027 | $ | 19,609 | $ | 790,134 | $ | 741,700 | ||||||||
| (1) | The fair value amount receivable is composed of |
| (2) | The fair value amount payable is composed of |
| Fair values | Notionals | |||||||||||
| In millions of dollars at December 31, 2016 | Receivable(1) | Payable(2) | Protection purchased | Protection sold | ||||||||
| By industry/counterparty | ||||||||||||
| Banks | $ | 11,895 | $ | 10,930 | $ | 407,992 | $ | 414,720 | ||||
| Broker-dealers | 3,536 | 3,952 | 115,013 | 119,810 | ||||||||
| Non-financial | 82 | 99 | 4,014 | 2,061 | ||||||||
| Insurance and other financial institutions | 9,308 | 10,844 | 375,454 | 322,829 | ||||||||
| Total by industry/counterparty | $ | 24,821 | $ | 25,825 | $ | 902,473 | $ | 859,420 | ||||
| By instrument | ||||||||||||
| Credit default swaps and options | $ | 24,502 | $ | 24,631 | $ | 883,719 | $ | 852,900 | ||||
| Total return swaps and other | 319 | 1,194 | 18,754 | 6,520 | ||||||||
| Total by instrument | $ | 24,821 | $ | 25,825 | $ | 902,473 | $ | 859,420 | ||||
| By rating | ||||||||||||
| Investment grade | $ | 9,605 | $ | 9,995 | $ | 675,138 | $ | 648,247 | ||||
| Non-investment grade | 15,216 | 15,830 | 227,335 | 211,173 | ||||||||
| Total by rating | $ | 24,821 | $ | 25,825 | $ | 902,473 | $ | 859,420 | ||||
| By maturity | ||||||||||||
| Within 1 year | $ | 4,113 | $ | 4,841 | $ | 293,059 | $ | 287,262 | ||||
| From 1 to 5 years | 17,735 | 17,986 | 551,155 | 523,371 | ||||||||
| After 5 years | 2,973 | 2,998 | 58,259 | 48,787 | ||||||||
| Total by maturity | $ | 24,821 | $ | 25,825 | $ | 902,473 | $ | 859,420 | ||||
| Fair values | Notionals | |||||||||||
| In millions of dollars at December 31, 2017 | Receivable(1) | Payable(2) | Protection purchased | Protection sold | ||||||||
| By industry/counterparty | ||||||||||||
| Banks | $ | 7,471 | $ | 6,669 | $ | 264,414 | $ | 273,711 | ||||
| Broker-dealers | 2,325 | 2,285 | 73,273 | 83,229 | ||||||||
| Non-financial | 70 | 91 | 1,288 | 1,140 | ||||||||
Insurance and other financial institutions | 10,668 | 12,488 | 438,738 | 377,062 | ||||||||
| Total by industry/counterparty | $ | 20,534 | $ | 21,533 | $ | 777,713 | $ | 735,142 | ||||
| By instrument | ||||||||||||
| Credit default swaps and options | $ | 20,251 | $ | 20,554 | $ | 754,114 | $ | 724,228 | ||||
| Total return swaps and other | 283 | 979 | 23,599 | 10,914 | ||||||||
| Total by instrument | $ | 20,534 | $ | 21,533 | $ | 777,713 | $ | 735,142 | ||||
| By rating | ||||||||||||
| Investment grade | $ | 10,473 | $ | 10,616 | $ | 588,324 | $ | 557,987 | ||||
| Non-investment grade | 10,061 | 10,917 | 189,389 | 177,155 | ||||||||
| Total by rating | $ | 20,534 | $ | 21,533 | $ | 777,713 | $ | 735,142 | ||||
| By maturity | ||||||||||||
| Within 1 year | $ | 2,477 | $ | 2,914 | $ | 231,878 | $ | 218,097 | ||||
| From 1 to 5 years | 16,098 | 16,435 | 498,606 | 476,345 | ||||||||
| After 5 years | 1,959 | 2,184 | 47,229 | 40,700 | ||||||||
| Total by maturity | $ | 20,534 | $ | 21,533 | $ | 777,713 | $ | 735,142 | ||||
| (1) | The fair value amount receivable is composed of |
| (2) | The fair value amount payable is composed of |
Credit and funding valuation adjustments contra-liability (contra-asset) | Credit and funding valuation adjustments contra-liability (contra-asset) | |||||||||||
| In millions of dollars | March 31, 2017 | December 31, 2016 | March 31, 2018 | December 31, 2017 | ||||||||
| Counterparty CVA | $ | (1,316 | ) | $ | (1,488 | ) | $ | (841 | ) | $ | (970 | ) |
| Asset FVA | (444 | ) | (536 | ) | (438 | ) | (447 | ) | ||||
| Citigroup (own-credit) CVA | 377 | 459 | 364 | 287 | ||||||||
| Liability FVA | 52 | 62 | 40 | 47 | ||||||||
Total CVA—derivative instruments(1) | $ | (1,331 | ) | $ | (1,503 | ) | $ | (875 | ) | $ | (1,083 | ) |
| (1) | FVA is included with CVA for presentation purposes. |
Credit/funding/debt valuation adjustments gain (loss) | Credit/funding/debt valuation adjustments gain (loss) | |||||||||||
| Three months ended March 31, | Three Months Ended March 31, | |||||||||||
| In millions of dollars | 2017 | 2016 | 2018 | 2017 | ||||||||
| Counterparty CVA | $ | 90 | $ | (108 | ) | $ | 23 | $ | 90 | |||
| Asset FVA | 92 | (80 | ) | 9 | 92 | |||||||
| Own-credit CVA | (72 | ) | 135 | 75 | (72 | ) | ||||||
| Liability FVA | (10 | ) | 29 | (7 | ) | (10 | ) | |||||
| Total CVA—derivative instruments | $ | 100 | $ | (24 | ) | $ | 100 | $ | 100 | |||
DVA related to own FVO liabilities (1) | $ | (95 | ) | $ | 307 | $ | 167 | $ | (95 | ) | ||
Total CVA and DVA(2) | $ | 5 | $ | 283 | $ | 267 | $ | 5 | ||||
| (1) | See Note 1 and Note 17 to the Consolidated Financial Statements. |
| (2) | FVA is included with CVA for presentation purposes. |
| In millions of dollars at March 31, 2017 | Level 1(1) | Level 2(1) | Level 3 | Gross inventory | Netting(2) | Net balance | ||||||||||||||||||||||||||||||
| In millions of dollars at March 31, 2018 | Level 1(1) | Level 2(1) | Level 3 | Gross inventory | Netting(2) | Net balance | ||||||||||||||||||||||||||||||
| Assets | ||||||||||||||||||||||||||||||||||||
| Federal funds sold and securities borrowed or purchased under agreements to resell | $ | — | $ | 174,962 | $ | 1,187 | $ | 176,149 | $ | (38,789 | ) | $ | 137,360 | $ | — | $ | 222,936 | $ | 16 | $ | 222,952 | $ | (61,415 | ) | $ | 161,537 | ||||||||||
| Trading non-derivative assets | ||||||||||||||||||||||||||||||||||||
| Trading mortgage-backed securities | ||||||||||||||||||||||||||||||||||||
| U.S. government-sponsored agency guaranteed | — | 21,410 | 271 | 21,681 | — | 21,681 | — | 22,317 | 206 | 22,523 | — | 22,523 | ||||||||||||||||||||||||
| Residential | — | 289 | 368 | 657 | — | 657 | — | 1,084 | 143 | 1,227 | — | 1,227 | ||||||||||||||||||||||||
| Commercial | — | 1,052 | 266 | 1,318 | — | 1,318 | — | 1,440 | 35 | 1,475 | — | 1,475 | ||||||||||||||||||||||||
| Total trading mortgage-backed securities | $ | — | $ | 22,751 | $ | 905 | $ | 23,656 | $ | — | $ | 23,656 | $ | — | $ | 24,841 | $ | 384 | $ | 25,225 | $ | — | $ | 25,225 | ||||||||||||
| U.S. Treasury and federal agency securities | $ | 18,757 | $ | 3,511 | $ | 1 | $ | 22,269 | $ | — | $ | 22,269 | $ | 20,812 | $ | 3,898 | $ | — | $ | 24,710 | $ | — | $ | 24,710 | ||||||||||||
| State and municipal | — | 3,086 | 270 | 3,356 | — | 3,356 | — | 3,671 | 211 | 3,882 | — | 3,882 | ||||||||||||||||||||||||
| Foreign government | 37,588 | 21,152 | 126 | 58,866 | — | 58,866 | 46,617 | 24,918 | 21 | 71,556 | — | 71,556 | ||||||||||||||||||||||||
| Corporate | 240 | 16,011 | 296 | 16,547 | — | 16,547 | 274 | 18,826 | 252 | 19,352 | — | 19,352 | ||||||||||||||||||||||||
| Equity securities | 43,108 | 5,468 | 110 | 48,686 | — | 48,686 | 47,797 | 6,253 | 237 | 54,287 | — | 54,287 | ||||||||||||||||||||||||
| Asset-backed securities | — | 1,536 | 1,941 | 3,477 | — | 3,477 | — | 1,586 | 1,597 | 3,183 | — | 3,183 | ||||||||||||||||||||||||
Other trading assets(3) | 8 | 9,771 | 1,888 | 11,667 | — | 11,667 | 2 | 11,000 | 716 | 11,718 | — | 11,718 | ||||||||||||||||||||||||
| Total trading non-derivative assets | $ | 99,701 | $ | 83,286 | $ | 5,537 | $ | 188,524 | $ | — | $ | 188,524 | $ | 115,502 | $ | 94,993 | $ | 3,418 | $ | 213,913 | $ | — | $ | 213,913 | ||||||||||||
| Trading derivatives | ||||||||||||||||||||||||||||||||||||
| Interest rate contracts | $ | 17 | $ | 311,584 | $ | 2,126 | $ | 313,727 | $ | 276 | $ | 193,319 | $ | 2,234 | $ | 195,829 | ||||||||||||||||||||
| Foreign exchange contracts | 18 | 124,740 | 478 | 125,236 | 5 | 129,691 | 521 | 130,217 | ||||||||||||||||||||||||||||
| Equity contracts | 1,815 | 22,196 | 625 | 24,636 | 2,212 | 26,664 | 559 | 29,435 | ||||||||||||||||||||||||||||
| Commodity contracts | 250 | 10,647 | 552 | 11,449 | 169 | 15,100 | 562 | 15,831 | ||||||||||||||||||||||||||||
| Credit derivatives | — | 21,751 | 1,571 | 23,322 | — | 18,153 | 874 | 19,027 | ||||||||||||||||||||||||||||
| Total trading derivatives | $ | 2,100 | $ | 490,918 | $ | 5,352 | $ | 498,370 | $ | 2,662 | $ | 382,927 | $ | 4,750 | $ | 390,339 | ||||||||||||||||||||
Cash collateral paid(4) | $ | 10,436 | $ | 8,676 | ||||||||||||||||||||||||||||||||
| Netting agreements | $ | (416,229 | ) | $ | (303,169 | ) | ||||||||||||||||||||||||||||||
| Netting of cash collateral received | (36,198 | ) | (40,951 | ) | ||||||||||||||||||||||||||||||||
| Total trading derivatives | $ | 2,100 | $ | 490,918 | $ | 5,352 | $ | 508,806 | $ | (452,427 | ) | $ | 56,379 | $ | 2,662 | $ | 382,927 | $ | 4,750 | $ | 399,015 | $ | (344,120 | ) | $ | 54,895 | ||||||||||
| Investments | ||||||||||||||||||||||||||||||||||||
| Mortgage-backed securities | ||||||||||||||||||||||||||||||||||||
| U.S. government-sponsored agency guaranteed | $ | — | $ | 35,648 | $ | 55 | $ | 35,703 | $ | — | $ | 35,703 | $ | — | $ | 41,265 | $ | 23 | $ | 41,288 | $ | — | $ | 41,288 | ||||||||||||
| Residential | — | 3,474 | — | 3,474 | — | 3,474 | — | 2,759 | — | 2,759 | — | 2,759 | ||||||||||||||||||||||||
| Commercial | — | 360 | — | 360 | — | 360 | — | 303 | 5 | 308 | — | 308 | ||||||||||||||||||||||||
| Total investment mortgage-backed securities | $ | — | $ | 39,482 | $ | 55 | $ | 39,537 | $ | — | $ | 39,537 | $ | — | $ | 44,327 | $ | 28 | $ | 44,355 | $ | — | $ | 44,355 | ||||||||||||
| U.S. Treasury and federal agency securities | $ | 106,915 | $ | 10,731 | $ | 1 | $ | 117,647 | $ | — | $ | 117,647 | $ | 106,239 | $ | 11,075 | $ | — | $ | 117,314 | $ | — | $ | 117,314 | ||||||||||||
| State and municipal | — | 8,392 | 1,233 | 9,625 | — | 9,625 | — | 9,155 | 682 | 9,837 | — | 9,837 | ||||||||||||||||||||||||
| Foreign government | 56,398 | 43,497 | 235 | 100,130 | — | 100,130 | 61,312 | 42,393 | 70 | 103,775 | — | 103,775 | ||||||||||||||||||||||||
| Corporate | 1,807 | 13,733 | 339 | 15,879 | — | 15,879 | 3,756 | 9,164 | 76 | 12,996 | — | 12,996 | ||||||||||||||||||||||||
| Equity securities | 317 | 65 | 9 | 391 | — | 391 | 233 | 43 | 1 | 277 | — | 277 | ||||||||||||||||||||||||
| Asset-backed securities | — | 5,811 | 712 | 6,523 | — | 6,523 | — | 2,584 | 497 | 3,081 | — | 3,081 | ||||||||||||||||||||||||
| Other debt securities | — | 550 | — | 550 | — | 550 | — | 165 | — | 165 | — | 165 | ||||||||||||||||||||||||
Non-marketable equity securities(5) | — | 31 | 1,082 | 1,113 | — | 1,113 | — | 125 | 734 | 859 | — | 859 | ||||||||||||||||||||||||
| Total investments | $ | 165,437 | $ | 122,292 | $ | 3,666 | $ | 291,395 | $ | — | $ | 291,395 | $ | 171,540 | $ | 119,031 | $ | 2,088 | $ | 292,659 | $ | — | $ | 292,659 | ||||||||||||
| In millions of dollars at March 31, 2017 | Level 1(1) | Level 2(1) | Level 3 | Gross inventory | Netting(2) | Net balance | ||||||||||||||||||||||||||||||
| In millions of dollars at March 31, 2018 | Level 1(1) | Level 2(1) | Level 3 | Gross inventory | Netting(2) | Net balance | ||||||||||||||||||||||||||||||
| Loans | $ | — | $ | 3,455 | $ | 580 | $ | 4,035 | $ | — | $ | 4,035 | $ | — | $ | 3,982 | $ | 554 | $ | 4,536 | $ | — | $ | 4,536 | ||||||||||||
| Mortgage servicing rights | — | — | 567 | 567 | — | 567 | — | — | 587 | 587 | — | 587 | ||||||||||||||||||||||||
| Non-trading derivatives and other financial assets measured on a recurring basis, gross | $ | 11,750 | $ | 6,439 | $ | 27 | $ | 18,216 | ||||||||||||||||||||||||||||
Cash collateral paid(6) | 5 | |||||||||||||||||||||||||||||||||||
| Netting of cash collateral received | $ | (940 | ) | |||||||||||||||||||||||||||||||||
| Non-trading derivatives and other financial assets measured on a recurring basis | $ | 11,750 | $ | 6,439 | $ | 27 | $ | 18,221 | $ | (940 | ) | $ | 17,281 | $ | 15,549 | $ | 4,881 | $ | 13 | $ | 20,443 | $ | — | $ | 20,443 | |||||||||||
| Total assets | $ | 278,988 | $ | 881,352 | $ | 16,916 | $ | 1,187,697 | $ | (492,156 | ) | $ | 695,541 | $ | 305,253 | $ | 828,750 | $ | 11,426 | $ | 1,154,105 | $ | (405,535 | ) | $ | 748,570 | ||||||||||
Total as a percentage of gross assets(7) | 23.7 | % | 74.9 | % | 1.4 | % | ||||||||||||||||||||||||||||||
Total as a percentage of gross assets(6) | 26.6 | % | 72.4 | % | 1.0 | % | ||||||||||||||||||||||||||||||
| Liabilities | ||||||||||||||||||||||||||||||||||||
| Interest-bearing deposits | $ | — | $ | 1,005 | $ | 302 | $ | 1,307 | $ | — | $ | 1,307 | $ | — | $ | 1,394 | $ | 292 | $ | 1,686 | $ | — | $ | 1,686 | ||||||||||||
| Federal funds purchased and securities loaned or sold under agreements to repurchase | — | 78,919 | 809 | 79,728 | (38,789 | ) | 40,939 | — | 106,398 | 857 | 107,255 | (61,415 | ) | 45,840 | ||||||||||||||||||||||
| Trading account liabilities | ||||||||||||||||||||||||||||||||||||
| Securities sold, not yet purchased | 80,154 | 7,302 | 1,151 | 88,607 | — | 88,607 | 80,995 | 10,911 | 48 | 91,954 | — | 91,954 | ||||||||||||||||||||||||
| Other trading liabilities | — | 2,605 | — | 2,605 | — | 2,605 | — | 2,290 | — | 2,290 | — | 2,290 | ||||||||||||||||||||||||
| Total trading liabilities | $ | 80,154 | $ | 9,907 | $ | 1,151 | $ | 91,212 | $ | — | $ | 91,212 | $ | 80,995 | $ | 13,201 | $ | 48 | $ | 94,244 | $ | — | $ | 94,244 | ||||||||||||
| Trading derivatives | ||||||||||||||||||||||||||||||||||||
| Interest rate contracts | $ | 5 | $ | 297,445 | $ | 2,899 | $ | 300,349 | $ | 218 | $ | 173,128 | $ | 2,240 | $ | 175,586 | ||||||||||||||||||||
| Foreign exchange contracts | 8 | 128,229 | 430 | 128,667 | 4 | 123,117 | 433 | 123,554 | ||||||||||||||||||||||||||||
| Equity contracts | 1,675 | 24,866 | 2,149 | 28,690 | 2,126 | 29,689 | 2,300 | 34,115 | ||||||||||||||||||||||||||||
| Commodity contracts | 155 | 10,531 | 2,626 | 13,312 | 138 | 16,242 | 2,471 | 18,851 | ||||||||||||||||||||||||||||
| Credit derivatives | — | 21,992 | 2,694 | 24,686 | 2 | 17,874 | 1,733 | 19,609 | ||||||||||||||||||||||||||||
| Total trading derivatives | $ | 1,843 | $ | 483,063 | $ | 10,798 | $ | 495,704 | $ | 2,488 | $ | 360,050 | $ | 9,177 | $ | 371,715 | ||||||||||||||||||||
Cash collateral received(8) | $ | 13,961 | ||||||||||||||||||||||||||||||||||
Cash collateral received(7) | $ | 14,971 | ||||||||||||||||||||||||||||||||||
| Netting agreements | $ | (416,229 | ) | $ | (303,169 | ) | ||||||||||||||||||||||||||||||
| Netting of cash collateral paid | (40,577 | ) | (33,800 | ) | ||||||||||||||||||||||||||||||||
| Total trading derivatives | $ | 1,843 | $ | 483,063 | $ | 10,798 | $ | 509,665 | $ | (456,806 | ) | $ | 52,859 | $ | 2,488 | $ | 360,050 | $ | 9,177 | $ | 386,686 | $ | (336,969 | ) | $ | 49,717 | ||||||||||
| Short-term borrowings | $ | — | $ | 3,413 | $ | 60 | $ | 3,473 | $ | — | $ | 3,473 | $ | — | $ | 4,386 | $ | 81 | $ | 4,467 | $ | — | $ | 4,467 | ||||||||||||
| Long-term debt | — | 17,350 | 10,176 | 27,526 | — | 27,526 | — | 20,087 | 13,484 | 33,571 | — | 33,571 | ||||||||||||||||||||||||
| Non-trading derivatives and other financial liabilities measured on a recurring basis, gross | $ | 11,750 | $ | 963 | $ | 4 | $ | 12,717 | ||||||||||||||||||||||||||||
Cash collateral received(9) | 15 | |||||||||||||||||||||||||||||||||||
| Netting of cash collateral paid | $ | (51 | ) | |||||||||||||||||||||||||||||||||
| Total non-trading derivatives and other financial liabilities measured on a recurring basis | $ | 11,750 | $ | 963 | $ | 4 | $ | 12,732 | $ | (51 | ) | $ | 12,681 | $ | 15,549 | $ | — | $ | 3 | $ | 15,552 | $ | — | $ | 15,552 | |||||||||||
| Total liabilities | $ | 93,747 | $ | 594,620 | $ | 23,300 | $ | 725,643 | $ | (495,646 | ) | $ | 229,997 | $ | 99,032 | $ | 505,516 | $ | 23,942 | $ | 643,461 | $ | (398,384 | ) | $ | 245,077 | ||||||||||
Total as a percentage of gross liabilities(7) | 13.2 | % | 83.6 | % | 3.3 | % | ||||||||||||||||||||||||||||||
Total as a percentage of gross liabilities(6) | 15.8 | % | 80.4 | % | 3.8 | % | ||||||||||||||||||||||||||||||
| (1) | For the three months ended March 31, |
| (2) | Represents netting |
| (3) | Includes positions related to investments in unallocated precious metals, as discussed in Note 21 to the Consolidated Financial Statements. Also includes physical commodities accounted for at the lower of cost or fair value and unfunded credit products. |
| (4) | Reflects the net amount of |
| (5) | Amounts exclude $0.4 billion of investments measured at Net Asset Value (NAV) in accordance with ASU |
| (6) |
| Because the amount of the cash collateral paid/received has not been allocated to the Level 1, 2 and 3 subtotals, these percentages are calculated based on total assets and liabilities measured at fair value on a recurring basis, excluding the cash collateral paid/received on derivatives. |
| Reflects the net amount |
| In millions of dollars at December 31, 2016 | Level 1(1) | Level 2(1) | Level 3 | Gross inventory | Netting(2) | Net balance | ||||||||||||||||||||||||||||||
| In millions of dollars at December 31, 2017 | Level 1(1) | Level 2(1) | Level 3 | Gross inventory | Netting(2) | Net balance | ||||||||||||||||||||||||||||||
| Assets | ||||||||||||||||||||||||||||||||||||
| Federal funds sold and securities borrowed or purchased under agreements to resell | $ | — | $ | 172,394 | $ | 1,496 | $ | 173,890 | $ | (40,686 | ) | $ | 133,204 | $ | — | $ | 188,571 | $ | 16 | $ | 188,587 | $ | (55,638 | ) | $ | 132,949 | ||||||||||
| Trading non-derivative assets | ||||||||||||||||||||||||||||||||||||
| Trading mortgage-backed securities | ||||||||||||||||||||||||||||||||||||
| U.S. government-sponsored agency guaranteed | — | 22,718 | 176 | 22,894 | — | 22,894 | — | 22,801 | 163 | 22,964 | — | 22,964 | ||||||||||||||||||||||||
| Residential | — | 291 | 399 | 690 | — | 690 | — | 649 | 164 | 813 | — | 813 | ||||||||||||||||||||||||
| Commercial | — | 1,000 | 206 | 1,206 | — | 1,206 | — | 1,309 | 57 | 1,366 | — | 1,366 | ||||||||||||||||||||||||
| Total trading mortgage-backed securities | $ | — | $ | 24,009 | $ | 781 | $ | 24,790 | $ | — | $ | 24,790 | $ | — | $ | 24,759 | $ | 384 | $ | 25,143 | $ | — | $ | 25,143 | ||||||||||||
| U.S. Treasury and federal agency securities | $ | 17,756 | $ | 3,423 | $ | 1 | $ | 21,180 | $ | — | $ | 21,180 | $ | 17,524 | $ | 3,613 | $ | — | $ | 21,137 | $ | — | $ | 21,137 | ||||||||||||
| State and municipal | — | 3,780 | 296 | 4,076 | — | 4,076 | — | 4,426 | 274 | 4,700 | — | 4,700 | ||||||||||||||||||||||||
| Foreign government | 36,852 | 12,804 | 40 | 49,696 | — | 49,696 | 39,347 | 20,843 | 16 | 60,206 | — | 60,206 | ||||||||||||||||||||||||
| Corporate | 424 | 14,199 | 324 | 14,947 | — | 14,947 | 301 | 15,129 | 275 | 15,705 | — | 15,705 | ||||||||||||||||||||||||
| Equity securities | 45,331 | 4,985 | 127 | 50,443 | — | 50,443 | 53,305 | 6,794 | 120 | 60,219 | — | 60,219 | ||||||||||||||||||||||||
| Asset-backed securities | — | 892 | 1,868 | 2,760 | — | 2,760 | — | 1,198 | 1,590 | 2,788 | — | 2,788 | ||||||||||||||||||||||||
Other trading assets(3) | 2 | 9,464 | 2,814 | 12,280 | — | 12,280 | 3 | 11,105 | 615 | 11,723 | — | 11,723 | ||||||||||||||||||||||||
| Total trading non-derivative assets | $ | 100,365 | $ | 73,556 | $ | 6,251 | $ | 180,172 | $ | — | $ | 180,172 | $ | 110,480 | $ | 87,867 | $ | 3,274 | $ | 201,621 | $ | — | $ | 201,621 | ||||||||||||
| Trading derivatives | ||||||||||||||||||||||||||||||||||||
| Interest rate contracts | $ | 105 | $ | 366,995 | $ | 2,225 | $ | 369,325 | $ | 145 | $ | 203,134 | $ | 1,708 | $ | 204,987 | ||||||||||||||||||||
| Foreign exchange contracts | 53 | 184,776 | 833 | 185,662 | 19 | 121,363 | 577 | 121,959 | ||||||||||||||||||||||||||||
| Equity contracts | 2,306 | 21,209 | 595 | 24,110 | 2,364 | 24,170 | 444 | 26,978 | ||||||||||||||||||||||||||||
| Commodity contracts | 261 | 12,999 | 505 | 13,765 | 282 | 13,252 | 569 | 14,103 | ||||||||||||||||||||||||||||
| Credit derivatives | — | 23,021 | 1,594 | 24,615 | — | 19,624 | 910 | 20,534 | ||||||||||||||||||||||||||||
| Total trading derivatives | $ | 2,725 | $ | 609,000 | $ | 5,752 | $ | 617,477 | $ | 2,810 | $ | 381,543 | $ | 4,208 | $ | 388,561 | ||||||||||||||||||||
Cash collateral paid(4) | $ | 11,188 | $ | 7,541 | ||||||||||||||||||||||||||||||||
| Netting agreements | $ | (519,000 | ) | $ | (306,401 | ) | ||||||||||||||||||||||||||||||
| Netting of cash collateral received | (45,912 | ) | (38,532 | ) | ||||||||||||||||||||||||||||||||
| Total trading derivatives | $ | 2,725 | $ | 609,000 | $ | 5,752 | $ | 628,665 | $ | (564,912 | ) | $ | 63,753 | $ | 2,810 | $ | 381,543 | $ | 4,208 | $ | 396,102 | $ | (344,933 | ) | $ | 51,169 | ||||||||||
| Investments | ||||||||||||||||||||||||||||||||||||
| Mortgage-backed securities | ||||||||||||||||||||||||||||||||||||
| U.S. government-sponsored agency guaranteed | $ | — | $ | 38,304 | $ | 101 | $ | 38,405 | $ | — | $ | 38,405 | $ | — | $ | 41,717 | $ | 24 | $ | 41,741 | $ | — | $ | 41,741 | ||||||||||||
| Residential | — | 3,860 | 50 | 3,910 | — | 3,910 | — | 2,884 | — | 2,884 | — | 2,884 | ||||||||||||||||||||||||
| Commercial | — | 358 | — | 358 | — | 358 | — | 329 | 3 | 332 | — | 332 | ||||||||||||||||||||||||
| Total investment mortgage-backed securities | $ | — | $ | 42,522 | $ | 151 | $ | 42,673 | $ | — | $ | 42,673 | $ | — | $ | 44,930 | $ | 27 | $ | 44,957 | $ | — | $ | 44,957 | ||||||||||||
| U.S. Treasury and federal agency securities | $ | 112,916 | $ | 10,753 | $ | 2 | $ | 123,671 | $ | — | $ | 123,671 | $ | 106,964 | $ | 11,182 | $ | — | $ | 118,146 | $ | — | $ | 118,146 | ||||||||||||
| State and municipal | — | 8,909 | 1,211 | 10,120 | — | 10,120 | — | 8,028 | 737 | 8,765 | — | 8,765 | ||||||||||||||||||||||||
| Foreign government | 54,028 | 43,934 | 186 | 98,148 | — | 98,148 | 56,456 | 43,985 | 92 | 100,533 | — | 100,533 | ||||||||||||||||||||||||
| Corporate | 3,215 | 13,598 | 311 | 17,124 | — | 17,124 | 1,911 | 12,127 | 71 | 14,109 | — | 14,109 | ||||||||||||||||||||||||
| Equity securities | 336 | 46 | 9 | 391 | — | 391 | 176 | 11 | 2 | 189 | — | 189 | ||||||||||||||||||||||||
| Asset-backed securities | — | 6,134 | 660 | 6,794 | — | 6,794 | — | 3,091 | 827 | 3,918 | — | 3,918 | ||||||||||||||||||||||||
| Other debt securities | — | 503 | — | 503 | — | 503 | — | 297 | — | 297 | — | 297 | ||||||||||||||||||||||||
Non-marketable equity securities(5) | — | 35 | 1,331 | 1,366 | — | 1,366 | — | 121 | 681 | 802 | — | 802 | ||||||||||||||||||||||||
| Total investments | $ | 170,495 | $ | 126,434 | $ | 3,861 | $ | 300,790 | $ | — | $ | 300,790 | $ | 165,507 | $ | 123,772 | $ | 2,437 | $ | 291,716 | $ | — | $ | 291,716 | ||||||||||||
| In millions of dollars at December 31, 2016 | Level 1(1) | Level 2(1) | Level 3 | Gross inventory | Netting(2) | Net balance | ||||||||||||||||||||||||||||||
| In millions of dollars at December 31, 2017 | Level 1(1) | Level 2(1) | Level 3 | Gross inventory | Netting(2) | Net balance | ||||||||||||||||||||||||||||||
| Loans | $ | — | $ | 2,918 | $ | 568 | $ | 3,486 | $ | — | $ | 3,486 | $ | — | $ | 3,824 | $ | 550 | $ | 4,374 | $ | — | $ | 4,374 | ||||||||||||
| Mortgage servicing rights | — | — | 1,564 | 1,564 | — | 1,564 | — | — | 558 | 558 | — | 558 | ||||||||||||||||||||||||
| Non-trading derivatives and other financial assets measured on a recurring basis, gross | $ | 9,300 | $ | 7,732 | $ | 34 | $ | 17,066 | ||||||||||||||||||||||||||||
Cash collateral paid(6) | 8 | |||||||||||||||||||||||||||||||||||
| Netting of cash collateral received | $ | (1,345 | ) | |||||||||||||||||||||||||||||||||
| Non-trading derivatives and other financial assets measured on a recurring basis | $ | 9,300 | $ | 7,732 | $ | 34 | $ | 17,074 | $ | (1,345 | ) | $ | 15,729 | $ | 13,903 | $ | 4,640 | $ | 16 | $ | 18,559 | $ | — | $ | 18,559 | |||||||||||
| Total assets | $ | 282,885 | $ | 992,034 | $ | 19,526 | $ | 1,305,641 | $ | (606,943 | ) | $ | 698,698 | $ | 292,700 | $ | 790,217 | $ | 11,059 | $ | 1,101,517 | $ | (400,571 | ) | $ | 700,946 | ||||||||||
Total as a percentage of gross assets(7) | 21.9 | % | 76.6 | % | 1.5 | % | ||||||||||||||||||||||||||||||
Total as a percentage of gross assets(6) | 26.8 | % | 72.2 | % | 1.0 | % | ||||||||||||||||||||||||||||||
| Liabilities | ||||||||||||||||||||||||||||||||||||
| Interest-bearing deposits | $ | — | $ | 919 | $ | 293 | $ | 1,212 | $ | — | $ | 1,212 | $ | — | $ | 1,179 | $ | 286 | $ | 1,465 | $ | — | $ | 1,465 | ||||||||||||
| Federal funds purchased and securities loaned or sold under agreements to repurchase | — | 73,500 | 849 | 74,349 | (40,686 | ) | 33,663 | — | 95,550 | 726 | 96,276 | (55,638 | ) | 40,638 | ||||||||||||||||||||||
| Trading account liabilities | ||||||||||||||||||||||||||||||||||||
| Securities sold, not yet purchased | 73,782 | 5,831 | 1,177 | 80,790 | — | 80,790 | 65,843 | 10,306 | 22 | 76,171 | — | 76,171 | ||||||||||||||||||||||||
| Other trading liabilities | — | 1,827 | 1 | 1,828 | — | 1,828 | — | 1,409 | 5 | 1,414 | — | 1,414 | ||||||||||||||||||||||||
| Total trading liabilities | $ | 73,782 | $ | 7,658 | $ | 1,178 | $ | 82,618 | $ | — | $ | 82,618 | $ | 65,843 | $ | 11,715 | $ | 27 | $ | 77,585 | $ | — | $ | 77,585 | ||||||||||||
| Trading account derivatives | ||||||||||||||||||||||||||||||||||||
| Interest rate contracts | $ | 107 | $ | 351,766 | $ | 2,888 | $ | 354,761 | $ | 137 | $ | 182,372 | $ | 2,130 | $ | 184,639 | ||||||||||||||||||||
| Foreign exchange contracts | 13 | 187,328 | 420 | 187,761 | 9 | 120,316 | 447 | 120,772 | ||||||||||||||||||||||||||||
| Equity contracts | 2,245 | 22,119 | 2,152 | 26,516 | 2,430 | 26,472 | 2,471 | 31,373 | ||||||||||||||||||||||||||||
| Commodity contracts | 196 | 12,386 | 2,450 | 15,032 | 115 | 14,482 | 2,430 | 17,027 | ||||||||||||||||||||||||||||
| Credit derivatives | — | 22,842 | 2,595 | 25,437 | — | 19,824 | 1,709 | 21,533 | ||||||||||||||||||||||||||||
| Total trading derivatives | $ | 2,561 | $ | 596,441 | $ | 10,505 | $ | 609,507 | $ | 2,691 | $ | 363,466 | $ | 9,187 | $ | 375,344 | ||||||||||||||||||||
Cash collateral received(8) | $ | 15,731 | ||||||||||||||||||||||||||||||||||
Cash collateral received(7) | $ | 14,308 | ||||||||||||||||||||||||||||||||||
| Netting agreements | $ | (519,000 | ) | $ | (306,401 | ) | ||||||||||||||||||||||||||||||
| Netting of cash collateral paid | (49,811 | ) | (35,666 | ) | ||||||||||||||||||||||||||||||||
| Total trading derivatives | $ | 2,561 | $ | 596,441 | $ | 10,505 | $ | 625,238 | $ | (568,811 | ) | $ | 56,427 | $ | 2,691 | $ | 363,466 | $ | 9,187 | $ | 389,652 | $ | (342,067 | ) | $ | 47,585 | ||||||||||
| Short-term borrowings | $ | — | $ | 2,658 | $ | 42 | $ | 2,700 | $ | — | $ | 2,700 | $ | — | $ | 4,609 | $ | 18 | $ | 4,627 | $ | — | $ | 4,627 | ||||||||||||
| Long-term debt | — | 16,510 | 9,744 | 26,254 | — | 26,254 | — | 18,310 | 13,082 | 31,392 | — | 31,392 | ||||||||||||||||||||||||
| Non-trading derivatives and other financial liabilities measured on a recurring basis, gross | $ | 9,300 | $ | 1,540 | $ | 8 | $ | 10,848 | ||||||||||||||||||||||||||||
Cash collateral received(9) | 1 | |||||||||||||||||||||||||||||||||||
| Netting of cash collateral paid | $ | (53 | ) | |||||||||||||||||||||||||||||||||
| Non-trading derivatives and other financial liabilities measured on a recurring basis | $ | 9,300 | $ | 1,540 | $ | 8 | $ | 10,849 | $ | (53 | ) | $ | 10,796 | $ | 13,903 | $ | 50 | $ | 8 | $ | 13,961 | $ | — | $ | 13,961 | |||||||||||
| Total liabilities | $ | 85,643 | $ | 699,226 | $ | 22,619 | $ | 823,220 | $ | (609,550 | ) | $ | 213,670 | $ | 82,437 | $ | 494,879 | $ | 23,334 | $ | 614,958 | $ | (397,705 | ) | $ | 217,253 | ||||||||||
Total as a percentage of gross liabilities(7) | 10.6 | % | 86.6 | % | 2.8 | % | ||||||||||||||||||||||||||||||
Total as a percentage of gross liabilities(6) | 13.7 | % | 82.4 | % | 3.9 | % | ||||||||||||||||||||||||||||||
| (1) | In |
| (2) | Represents netting |
| (3) | Includes positions related to investments in unallocated precious metals, as discussed in Note 21 to the Consolidated Financial Statements. Also includes physical commodities accounted for at the lower of cost or fair value and unfunded credit products. |
| (4) | Reflects the net amount of |
| (5) | Amounts exclude |
| (6) |
| Because the amount of the cash collateral paid/received has not been allocated to the Level 1, 2 and 3 subtotals, these percentages are calculated based on total assets and liabilities measured at fair value on a recurring basis, excluding the cash collateral paid/received on derivatives. |
| Reflects the net amount of |
| Net realized/unrealized gains (losses) incl. in | Transfers | Unrealized gains (losses) still held(3) | Net realized/unrealized gains (losses) incl. in | Transfers | Unrealized gains (losses) still held(3) | |||||||||||||||||||||||||||||||||||||||||||||||||||||||||||||
| In millions of dollars | Dec. 31, 2016 | Principal transactions | Other(1)(2) | into Level 3 | out of Level 3 | Purchases | Issuances | Sales | Settlements | Mar. 31, 2017 | Dec. 31, 2017 | Principal transactions | Other(1)(2) | into Level 3 | out of Level 3 | Purchases | Issuances | Sales | Settlements | Mar. 31, 2018 | ||||||||||||||||||||||||||||||||||||||||||||||
| Assets | ||||||||||||||||||||||||||||||||||||||||||||||||||||||||||||||||||
Federal funds sold and securities borrowed or purchased under agreements to resell | $ | 1,496 | $ | (56 | ) | $ | — | $ | — | $ | (252 | ) | $ | — | $ | — | $ | — | $ | (1 | ) | $ | 1,187 | $ | 4 | $ | 16 | $ | 18 | $ | — | $ | — | $ | — | $ | — | $ | — | $ | — | $ | (18 | ) | $ | 16 | $ | 3 | ||||||||||||||||||
| Trading non-derivative assets | ||||||||||||||||||||||||||||||||||||||||||||||||||||||||||||||||||
Trading mortgage- backed securities | ||||||||||||||||||||||||||||||||||||||||||||||||||||||||||||||||||
| U.S. government-sponsored agency guaranteed | 176 | 5 | — | 50 | (17 | ) | 161 | — | (104 | ) | — | 271 | — | 163 | 1 | — | 86 | (49 | ) | 116 | — | (111 | ) | — | 206 | — | ||||||||||||||||||||||||||||||||||||||||
| Residential | 399 | 15 | — | 17 | (29 | ) | 50 | — | (84 | ) | — | 368 | 10 | 164 | 22 | — | 35 | (77 | ) | 46 | — | (47 | ) | — | 143 | 3 | ||||||||||||||||||||||||||||||||||||||||
| Commercial | 206 | (8 | ) | — | 17 | (13 | ) | 190 | — | (126 | ) | — | 266 | (4 | ) | 57 | 1 | — | 4 | (35 | ) | 15 | — | (7 | ) | — | 35 | 3 | ||||||||||||||||||||||||||||||||||||||
Total trading mortgage- backed securities | $ | 781 | $ | 12 | $ | — | $ | 84 | $ | (59 | ) | $ | 401 | $ | — | $ | (314 | ) | $ | — | $ | 905 | $ | 6 | $ | 384 | $ | 24 | $ | — | $ | 125 | $ | (161 | ) | $ | 177 | $ | — | $ | (165 | ) | $ | — | $ | 384 | $ | 6 | ||||||||||||||||||
| U.S. Treasury and federal agency securities | $ | 1 | $ | — | $ | — | $ | — | $ | — | $ | — | $ | — | $ | — | $ | — | $ | 1 | $ | — | $ | — | $ | — | $ | — | $ | — | $ | — | $ | — | $ | — | $ | — | $ | — | $ | — | $ | — | ||||||||||||||||||||||
| State and municipal | 296 | 2 | — | 2 | (47 | ) | 81 | — | (64 | ) | — | 270 | 2 | 274 | 6 | — | — | (44 | ) | — | — | (25 | ) | — | 211 | (1 | ) | |||||||||||||||||||||||||||||||||||||||
| Foreign government | 40 | 4 | — | 78 | (13 | ) | 44 | — | (27 | ) | — | 126 | 6 | 16 | — | — | 2 | — | 14 | — | (11 | ) | — | 21 | — | |||||||||||||||||||||||||||||||||||||||||
| Corporate | 324 | 91 | — | 27 | (52 | ) | 118 | — | (197 | ) | (15 | ) | 296 | 12 | 275 | 43 | — | 49 | (72 | ) | 34 | — | (77 | ) | — | 252 | 84 | |||||||||||||||||||||||||||||||||||||||
| Equity securities | 127 | 15 | — | 2 | (12 | ) | 7 | — | (29 | ) | — | 110 | 2 | 120 | 75 | — | 1 | (15 | ) | 168 | — | (112 | ) | — | 237 | (3 | ) | |||||||||||||||||||||||||||||||||||||||
| Asset-backed securities | 1,868 | 160 | — | 20 | (16 | ) | 391 | — | (482 | ) | — | 1,941 | 81 | 1,590 | 58 | — | 18 | (15 | ) | 316 | — | (370 | ) | — | 1,597 | 73 | ||||||||||||||||||||||||||||||||||||||||
| Other trading assets | 2,814 | (7 | ) | — | 210 | (531 | ) | 287 | 1 | (875 | ) | (11 | ) | 1,888 | (55 | ) | 615 | 135 | — | 58 | (10 | ) | 112 | 5 | (194 | ) | (5 | ) | 716 | 6 | ||||||||||||||||||||||||||||||||||||
Total trading non- derivative assets | $ | 6,251 | $ | 277 | $ | — | $ | 423 | $ | (730 | ) | $ | 1,329 | $ | 1 | $ | (1,988 | ) | $ | (26 | ) | $ | 5,537 | $ | 54 | $ | 3,274 | $ | 341 | $ | — | $ | 253 | $ | (317 | ) | $ | 821 | $ | 5 | $ | (954 | ) | $ | (5 | ) | $ | 3,418 | $ | 165 | ||||||||||||||||
Trading derivatives, net(4) | ||||||||||||||||||||||||||||||||||||||||||||||||||||||||||||||||||
| Interest rate contracts | $ | (663 | ) | $ | (37 | ) | $ | — | $ | (38 | ) | $ | 19 | $ | 6 | $ | — | $ | (113 | ) | $ | 53 | $ | (773 | ) | $ | (23 | ) | $ | (422 | ) | $ | 381 | $ | — | $ | 5 | $ | 37 | $ | 7 | $ | — | $ | (16 | ) | $ | 2 | $ | (6 | ) | $ | (94 | ) | ||||||||||||
| Foreign exchange contracts | 413 | (390 | ) | — | 55 | (20 | ) | 34 | — | (32 | ) | (12 | ) | 48 | (341 | ) | 130 | (62 | ) | — | (1 | ) | 8 | 1 | — | — | 12 | 88 | (155 | ) | ||||||||||||||||||||||||||||||||||||
| Equity contracts | (1,557 | ) | (2 | ) | — | — | (16 | ) | 85 | — | (24 | ) | (10 | ) | (1,524 | ) | 202 | (2,027 | ) | (136 | ) | — | (57 | ) | 472 | 13 | — | (7 | ) | 1 | (1,741 | ) | 156 | |||||||||||||||||||||||||||||||||
| Commodity contracts | (1,945 | ) | (175 | ) | — | 46 | (2 | ) | — | — | — | 2 | (2,074 | ) | (170 | ) | (1,861 | ) | (33 | ) | — | (47 | ) | 8 | 20 | — | — | 4 | (1,909 | ) | (42 | ) | ||||||||||||||||||||||||||||||||||
| Credit derivatives | (1,001 | ) | (92 | ) | — | (24 | ) | (8 | ) | — | — | — | 2 | (1,123 | ) | (108 | ) | (799 | ) | (62 | ) | — | 1 | (2 | ) | 2 | — | 1 | — | (859 | ) | (203 | ) | |||||||||||||||||||||||||||||||||
Total trading derivatives, net(4) | $ | (4,753 | ) | $ | (696 | ) | $ | — | $ | 39 | $ | (27 | ) | $ | 125 | $ | — | $ | (169 | ) | $ | 35 | $ | (5,446 | ) | $ | (440 | ) | $ | (4,979 | ) | $ | 88 | $ | — | $ | (99 | ) | $ | 523 | $ | 43 | $ | — | $ | (22 | ) | $ | 19 | $ | (4,427 | ) | $ | (338 | ) | |||||||||||
| Net realized/unrealized gains (losses) incl. in | Transfers | Unrealized gains (losses) still held(3) | Net realized/unrealized gains (losses) incl. in | Transfers | Unrealized gains (losses) still held(3) | |||||||||||||||||||||||||||||||||||||||||||||||||||||||||||||
| In millions of dollars | Dec. 31, 2016 | Principal transactions | Other(1)(2) | into Level 3 | out of Level 3 | Purchases | Issuances | Sales | Settlements | Mar. 31, 2017 | Dec. 31 2017 | Principal transactions | Other(1)(2) | into Level 3 | out of Level 3 | Purchases | Issuances | Sales | Settlements | Mar. 31, 2018 | ||||||||||||||||||||||||||||||||||||||||||||||
| Investments | ||||||||||||||||||||||||||||||||||||||||||||||||||||||||||||||||||
| Mortgage-backed securities | ||||||||||||||||||||||||||||||||||||||||||||||||||||||||||||||||||
| U.S. government-sponsored agency guaranteed | $ | 101 | $ | — | $ | 2 | $ | 1 | $ | (49 | ) | $ | — | $ | — | $ | — | $ | — | $ | 55 | $ | 2 | $ | 24 | $ | — | $ | (1 | ) | $ | — | $ | — | $ | — | $ | — | $ | — | $ | — | $ | 23 | $ | 2 | ||||||||||||||||||||
| Residential | 50 | — | 2 | — | (47 | ) | — | — | (5 | ) | — | — | — | — | — | — | — | — | — | — | — | — | — | — | ||||||||||||||||||||||||||||||||||||||||||
| Commercial | — | — | — | — | — | 8 | — | (8 | ) | — | — | — | 3 | — | 2 | — | — | — | — | — | — | 5 | — | |||||||||||||||||||||||||||||||||||||||||||
| Total investment mortgage-backed securities | $ | 151 | $ | — | $ | 4 | $ | 1 | $ | (96 | ) | $ | 8 | $ | — | $ | (13 | ) | $ | — | $ | 55 | $ | 2 | $ | 27 | $ | — | $ | 1 | $ | — | $ | — | $ | — | $ | — | $ | — | $ | — | $ | 28 | $ | 2 | ||||||||||||||||||||
| U.S. Treasury and federal agency securities | $ | 2 | $ | — | $ | — | $ | — | $ | — | $ | — | $ | — | $ | (1 | ) | $ | — | $ | 1 | $ | — | $ | — | $ | — | $ | — | $ | — | $ | — | $ | — | $ | — | $ | — | $ | — | $ | — | $ | — | |||||||||||||||||||||
| State and municipal | 1,211 | — | 12 | 37 | (30 | ) | 54 | — | (51 | ) | — | 1,233 | 6 | 737 | — | (16 | ) | — | (9 | ) | 29 | — | (59 | ) | — | 682 | (33 | ) | ||||||||||||||||||||||||||||||||||||||
| Foreign government | 186 | — | 1 | 2 | (18 | ) | 142 | — | (78 | ) | — | 235 | 1 | 92 | — | (1 | ) | — | (2 | ) | 57 | — | (76 | ) | — | 70 | — | |||||||||||||||||||||||||||||||||||||||
| Corporate | 311 | — | 2 | 59 | (4 | ) | 91 | — | (120 | ) | — | 339 | 2 | 71 | — | (1 | ) | 3 | — | 3 | — | — | — | 76 | — | |||||||||||||||||||||||||||||||||||||||||
| Equity securities | 9 | — | — | — | — | — | — | — | — | 9 | — | 2 | — | — | — | — | — | — | (1 | ) | — | 1 | — | |||||||||||||||||||||||||||||||||||||||||||
| Asset-backed securities | 660 | — | 9 | 17 | — | 26 | — | — | — | 712 | 3 | 827 | — | 10 | 2 | (342 | ) | — | — | — | — | 497 | 7 | |||||||||||||||||||||||||||||||||||||||||||
| Other debt securities | — | — | — | — | — | 11 | — | (11 | ) | — | — | — | — | — | — | — | — | — | — | — | — | — | — | |||||||||||||||||||||||||||||||||||||||||||
| Non-marketable equity securities | 1,331 | — | (94 | ) | — | — | 8 | — | (73 | ) | (90 | ) | 1,082 | (2 | ) | 681 | — | 24 | 30 | — | 15 | — | — | (16 | ) | 734 | 22 | |||||||||||||||||||||||||||||||||||||||
| Total investments | $ | 3,861 | $ | — | $ | (66 | ) | $ | 116 | $ | (148 | ) | $ | 340 | $ | — | $ | (347 | ) | $ | (90 | ) | $ | 3,666 | $ | 12 | $ | 2,437 | $ | — | $ | 17 | $ | 35 | $ | (353 | ) | $ | 104 | $ | — | $ | (136 | ) | $ | (16 | ) | $ | 2,088 | $ | (2 | ) | ||||||||||||||
| Loans | $ | 568 | $ | — | $ | (4 | ) | $ | 65 | $ | (16 | ) | $ | 12 | $ | — | $ | (43 | ) | $ | (2 | ) | $ | 580 | $ | 74 | $ | 550 | $ | — | $ | 19 | $ | — | $ | (1 | ) | $ | 4 | $ | — | $ | (16 | ) | $ | (2 | ) | $ | 554 | $ | 26 | |||||||||||||||
| Mortgage servicing rights | $ | 1,564 | $ | — | $ | 67 | $ | — | $ | — | $ | — | $ | 35 | $ | (1,046 | ) | $ | (53 | ) | $ | 567 | $ | 83 | 558 | — | 46 | — | — | — | 17 | (17 | ) | (17 | ) | 587 | 46 | |||||||||||||||||||||||||||||
| Other financial assets measured on a recurring basis | $ | 34 | $ | — | $ | (189 | ) | $ | 3 | $ | (1 | ) | $ | — | $ | 29 | $ | 204 | $ | (53 | ) | $ | 27 | $ | (191 | ) | 16 | — | 8 | — | — | 4 | 12 | — | (27 | ) | 13 | 18 | ||||||||||||||||||||||||||||
| Liabilities | ||||||||||||||||||||||||||||||||||||||||||||||||||||||||||||||||||
| Interest-bearing deposits | $ | 293 | $ | — | $ | 11 | $ | 20 | $ | — | $ | — | $ | — | $ | — | $ | — | $ | 302 | $ | 25 | $ | 286 | $ | — | $ | 26 | $ | 12 | $ | — | $ | — | $ | 20 | $ | — | $ | — | $ | 292 | $ | 29 | ||||||||||||||||||||||
| Federal funds purchased and securities loaned or sold under agreements to repurchase | 849 | 6 | — | — | — | — | — | — | (34 | ) | 809 | 6 | 726 | 14 | — | — | — | — | 147 | — | (2 | ) | 857 | 14 | ||||||||||||||||||||||||||||||||||||||||||
| Trading account liabilities | ||||||||||||||||||||||||||||||||||||||||||||||||||||||||||||||||||
| Securities sold, not yet purchased | 1,177 | 54 | — | 11 | (14 | ) | — | — | 101 | (70 | ) | 1,151 | 2 | 22 | (105 | ) | — | 3 | (19 | ) | — | — | 3 | (66 | ) | 48 | (7 | ) | ||||||||||||||||||||||||||||||||||||||
| Other trading liabilities | 1 | — | — | — | — | — | — | — | (1 | ) | — | — | 5 | 5 | — | — | — | — | — | — | — | — | (5 | ) | ||||||||||||||||||||||||||||||||||||||||||
| Short-term borrowings | 42 | (9 | ) | — | — | — | — | 11 | — | (2 | ) | 60 | 22 | 18 | 7 | — | 45 | — | — | 25 | — | — | 81 | (2 | ) | |||||||||||||||||||||||||||||||||||||||||
| Long-term debt | 9,744 | 17 | — | 200 | (409 | ) | — | 929 | — | (271 | ) | 10,176 | 116 | 13,082 | (236 | ) | — | 940 | (764 | ) | 36 | 3 | (44 | ) | (5 | ) | 13,484 | 254 | ||||||||||||||||||||||||||||||||||||||
| Other financial liabilities measured on a recurring basis | 8 | — | (2 | ) | — | — | (1 | ) | 1 | — | (6 | ) | 4 | (2 | ) | 8 | — | — | — | (5 | ) | — | 2 | — | (2 | ) | 3 | (1 | ) | |||||||||||||||||||||||||||||||||||||
| (1) | Changes in fair value for available-for-sale |
| (2) | Unrealized gains (losses) on MSRs are recorded in Other revenue on the Consolidated Statement of Income. |
| (3) | Represents the amount of total gains or losses for the period, included in earnings (and AOCI for changes in fair value of available-for-sale |
| (4) | Total Level 3 trading derivative assets and liabilities have been netted in these tables for presentation purposes only. |
| Net realized/unrealized gains (losses) incl. in | Transfers | Unrealized gains (losses) still held(3) | |||||||||||||||||||||||||||||||
| In millions of dollars | Dec. 31, 2015 | Principal transactions | Other(1)(2) | into Level 3 | out of Level 3 | Purchases | Issuances | Sales | Settlements | Mar. 31, 2016 | |||||||||||||||||||||||
| Assets | |||||||||||||||||||||||||||||||||
| Federal funds sold and securities borrowed or purchased under agreements to resell | $ | 1,337 | $ | 70 | $ | — | $ | — | $ | — | $ | 503 | $ | — | $ | — | $ | (1 | ) | $ | 1,909 | $ | — | ||||||||||
| Trading non-derivative assets | |||||||||||||||||||||||||||||||||
| Trading mortgage-backed securities | |||||||||||||||||||||||||||||||||
| U.S. government-sponsored agency guaranteed | 744 | 12 | — | 335 | (220 | ) | 356 | — | (191 | ) | 3 | 1,039 | 1 | ||||||||||||||||||||
| Residential | 1,326 | 49 | — | 104 | (43 | ) | 211 | — | (455 | ) | — | 1,192 | — | ||||||||||||||||||||
| Commercial | 517 | 9 | — | 56 | (27 | ) | 245 | — | (219 | ) | — | 581 | — | ||||||||||||||||||||
| Total trading mortgage-backed securities | $ | 2,587 | $ | 70 | $ | — | $ | 495 | $ | (290 | ) | $ | 812 | $ | — | $ | (865 | ) | $ | 3 | $ | 2,812 | $ | 1 | |||||||||
| U.S. Treasury and federal agency securities | $ | 1 | $ | — | $ | — | $ | 2 | $ | — | $ | — | $ | — | $ | — | $ | — | $ | 3 | $ | — | |||||||||||
| State and municipal | 351 | 7 | — | 13 | (159 | ) | 103 | — | (106 | ) | — | 209 | — | ||||||||||||||||||||
| Foreign government | 197 | (1 | ) | — | 2 | (4 | ) | 41 | — | (16 | ) | — | 219 | — | |||||||||||||||||||
| Corporate | 376 | 12 | — | 45 | (16 | ) | 169 | — | (109 | ) | — | 477 | 2 | ||||||||||||||||||||
| Equity securities | 3,684 | (44 | ) | — | 93 | (34 | ) | 79 | — | (23 | ) | — | 3,755 | — | |||||||||||||||||||
| Asset-backed securities | 2,739 | 128 | — | 117 | (14 | ) | 492 | — | (648 | ) | — | 2,814 | — | ||||||||||||||||||||
| Other trading assets | 2,483 | (27 | ) | — | 778 | (613 | ) | 283 | 11 | (331 | ) | (10 | ) | 2,574 | (5 | ) | |||||||||||||||||
| Total trading non-derivative assets | $ | 12,418 | $ | 145 | $ | — | $ | 1,545 | $ | (1,130 | ) | $ | 1,979 | $ | 11 | $ | (2,098 | ) | $ | (7 | ) | $ | 12,863 | $ | (2 | ) | |||||||
Trading derivatives, net(4) | |||||||||||||||||||||||||||||||||
| Interest rate contracts | $ | (495 | ) | $ | (508 | ) | $ | — | $ | 165 | $ | 90 | $ | 5 | $ | — | $ | (3 | ) | $ | (9 | ) | $ | (755 | ) | $ | (9 | ) | |||||
| Foreign exchange contracts | 620 | (353 | ) | — | 3 | 30 | 17 | — | (39 | ) | 17 | 295 | 2 | ||||||||||||||||||||
| Equity contracts | (800 | ) | 32 | — | 75 | (144 | ) | 24 | — | (59 | ) | (4 | ) | (876 | ) | — | |||||||||||||||||
| Commodity contracts | (1,861 | ) | (142 | ) | — | (52 | ) | 10 | — | — | — | 96 | (1,949 | ) | (1 | ) | |||||||||||||||||
| Credit derivatives | 307 | (515 | ) | — | (81 | ) | 29 | 1 | — | — | (62 | ) | (321 | ) | (1 | ) | |||||||||||||||||
Total trading derivatives, net(4) | $ | (2,229 | ) | $ | (1,486 | ) | $ | — | $ | 110 | $ | 15 | $ | 47 | $ | — | $ | (101 | ) | $ | 38 | $ | (3,606 | ) | $ | (9 | ) | ||||||
| Investments | |||||||||||||||||||||||||||||||||
| Mortgage-backed securities | |||||||||||||||||||||||||||||||||
| U.S. government-sponsored agency guaranteed | $ | 139 | $ | — | $ | (31 | ) | $ | 7 | $ | (39 | ) | $ | 39 | $ | — | $ | (3 | ) | $ | (1 | ) | $ | 111 | $ | — | |||||||
| Residential | 4 | — | 1 | — | — | — | — | (5 | ) | — | — | — | |||||||||||||||||||||
| Commercial | 2 | — | — | 3 | (2 | ) | — | — | — | — | 3 | — | |||||||||||||||||||||
| Total investment mortgage-backed securities | $ | 145 | $ | — | $ | (30 | ) | $ | 10 | $ | (41 | ) | $ | 39 | $ | — | $ | (8 | ) | $ | (1 | ) | $ | 114 | $ | — | |||||||
| U.S. Treasury and federal agency securities | $ | 4 | $ | — | $ | — | $ | — | $ | — | $ | — | $ | — | $ | (1 | ) | $ | — | $ | 3 | $ | — | ||||||||||
| State and municipal | 2,192 | — | 35 | 261 | (409 | ) | 151 | — | (132 | ) | — | 2,098 | — | ||||||||||||||||||||
| Foreign government | 260 | — | 2 | 33 | — | 62 | — | (182 | ) | — | 175 | — | |||||||||||||||||||||
| Corporate | 603 | — | 14 | 5 | (37 | ) | 1 | — | (88 | ) | — | 498 | — | ||||||||||||||||||||
| Equity securities | 124 | — | — | 2 | — | — | — | — | — | 126 | — | ||||||||||||||||||||||
| Asset-backed securities | 596 | — | (26 | ) | — | (1 | ) | 132 | — | — | — | 701 | — | ||||||||||||||||||||
| Other debt securities | — | — | — | — | — | — | — | — | — | — | — | ||||||||||||||||||||||
| Non-marketable equity securities | 1,135 | — | (2 | ) | 38 | — | 12 | — | — | (18 | ) | 1,165 | — | ||||||||||||||||||||
| Total investments | $ | 5,059 | $ | — | $ | (7 | ) | $ | 349 | $ | (488 | ) | $ | 397 | $ | — | $ | (411 | ) | $ | (19 | ) | $ | 4,880 | $ | — | |||||||
| Net realized/unrealized gains (losses) incl. in | Transfers | Unrealized gains (losses) still held(3) | |||||||||||||||||||||||||||||||
| In millions of dollars | Dec. 31, 2016 | Principal transactions | Other(1)(2) | into Level 3 | out of Level 3 | Purchases | Issuances | Sales | Settlements | Mar. 31, 2017 | |||||||||||||||||||||||
| Assets | |||||||||||||||||||||||||||||||||
| Federal funds sold and securities borrowed or purchased under agreements to resell | $ | 1,496 | $ | (56 | ) | $ | — | $ | — | $ | (252 | ) | $ | — | $ | — | $ | — | $ | (1 | ) | $ | 1,187 | $ | 4 | ||||||||
| Trading non-derivative assets | |||||||||||||||||||||||||||||||||
| Trading mortgage-backed securities | |||||||||||||||||||||||||||||||||
| U.S. government-sponsored agency guaranteed | 176 | 5 | — | 50 | (17 | ) | 161 | — | (104 | ) | — | 271 | — | ||||||||||||||||||||
| Residential | 399 | 15 | — | 17 | (29 | ) | 50 | — | (84 | ) | — | 368 | 10 | ||||||||||||||||||||
| Commercial | 206 | (8 | ) | — | 17 | (13 | ) | 190 | — | (126 | ) | — | 266 | (4 | ) | ||||||||||||||||||
| Total trading mortgage-backed securities | $ | 781 | $ | 12 | $ | — | $ | 84 | $ | (59 | ) | $ | 401 | $ | — | $ | (314 | ) | $ | — | $ | 905 | $ | 6 | |||||||||
| U.S. Treasury and federal agency securities | $ | 1 | $ | — | $ | — | $ | — | $ | — | $ | — | $ | — | $ | — | $ | — | $ | 1 | $ | — | |||||||||||
| State and municipal | 296 | 2 | — | 2 | (47 | ) | 81 | — | (64 | ) | — | 270 | 2 | ||||||||||||||||||||
| Foreign government | 40 | 4 | — | 78 | (13 | ) | 44 | — | (27 | ) | — | 126 | 6 | ||||||||||||||||||||
| Corporate | 324 | 91 | — | 27 | (52 | ) | 118 | — | (197 | ) | (15 | ) | 296 | 12 | |||||||||||||||||||
| Equity securities | 127 | 15 | — | 2 | (12 | ) | 7 | — | (29 | ) | — | 110 | 2 | ||||||||||||||||||||
| Asset-backed securities | 1,868 | 160 | — | 20 | (16 | ) | 391 | — | (482 | ) | — | 1,941 | 81 | ||||||||||||||||||||
| Other trading assets | 2,814 | (7 | ) | — | 210 | (531 | ) | 287 | 1 | (875 | ) | (11 | ) | 1,888 | (55 | ) | |||||||||||||||||
| Total trading non-derivative assets | $ | 6,251 | $ | 277 | $ | — | $ | 423 | $ | (730 | ) | $ | 1,329 | $ | 1 | $ | (1,988 | ) | $ | (26 | ) | $ | 5,537 | $ | 54 | ||||||||
Trading derivatives, net(4) | |||||||||||||||||||||||||||||||||
| Interest rate contracts | $ | (663 | ) | $ | (37 | ) | $ | — | $ | (38 | ) | $ | 19 | $ | 6 | $ | — | $ | (113 | ) | $ | 53 | $ | (773 | ) | $ | (23 | ) | |||||
| Foreign exchange contracts | 413 | (390 | ) | — | 55 | (20 | ) | 34 | — | (32 | ) | (12 | ) | 48 | (341 | ) | |||||||||||||||||
| Equity contracts | (1,557 | ) | (2 | ) | — | — | (16 | ) | 85 | — | (24 | ) | (10 | ) | (1,524 | ) | 202 | ||||||||||||||||
| Commodity contracts | (1,945 | ) | (175 | ) | — | 46 | (2 | ) | — | — | — | 2 | (2,074 | ) | (170 | ) | |||||||||||||||||
| Credit derivatives | (1,001 | ) | (92 | ) | — | (24 | ) | (8 | ) | — | — | — | 2 | (1,123 | ) | (108 | ) | ||||||||||||||||
Total trading derivatives, net(4) | $ | (4,753 | ) | $ | (696 | ) | $ | — | $ | 39 | $ | (27 | ) | $ | 125 | $ | — | $ | (169 | ) | $ | 35 | $ | (5,446 | ) | $ | (440 | ) | |||||
| Investments | |||||||||||||||||||||||||||||||||
| Mortgage-backed securities | |||||||||||||||||||||||||||||||||
| U.S. government-sponsored agency guaranteed | $ | 101 | $ | — | $ | 2 | $ | 1 | $ | (49 | ) | $ | — | $ | — | $ | — | $ | — | $ | 55 | $ | 2 | ||||||||||
| Residential | 50 | — | 2 | — | (47 | ) | — | — | (5 | ) | — | — | — | ||||||||||||||||||||
| Commercial | — | — | — | — | — | 8 | — | (8 | ) | — | — | — | |||||||||||||||||||||
| Total investment mortgage-backed securities | $ | 151 | $ | — | $ | 4 | $ | 1 | $ | (96 | ) | $ | 8 | $ | — | $ | (13 | ) | $ | — | $ | 55 | $ | 2 | |||||||||
| U.S. Treasury and federal agency securities | $ | 2 | $ | — | $ | — | $ | — | $ | — | $ | — | $ | — | $ | (1 | ) | $ | — | $ | 1 | $ | — | ||||||||||
| State and municipal | 1,211 | — | 12 | 37 | (30 | ) | 54 | — | (51 | ) | — | 1,233 | 6 | ||||||||||||||||||||
| Foreign government | 186 | — | 1 | 2 | (18 | ) | 142 | — | (78 | ) | — | 235 | 1 | ||||||||||||||||||||
| Corporate | 311 | — | 2 | 59 | (4 | ) | 91 | — | (120 | ) | — | 339 | 2 | ||||||||||||||||||||
| Equity securities | 9 | — | — | — | — | — | — | — | — | 9 | — | ||||||||||||||||||||||
| Asset-backed securities | 660 | — | 9 | 17 | — | 26 | — | — | — | 712 | 3 | ||||||||||||||||||||||
| Other debt securities | — | — | — | — | — | 11 | — | (11 | ) | — | — | — | |||||||||||||||||||||
| Non-marketable equity securities | 1,331 | — | (94 | ) | — | — | 8 | — | (73 | ) | (90 | ) | 1,082 | (2 | ) | ||||||||||||||||||
| Total investments | $ | 3,861 | $ | — | $ | (66 | ) | $ | 116 | $ | (148 | ) | $ | 340 | $ | — | $ | (347 | ) | $ | (90 | ) | $ | 3,666 | $ | 12 | |||||||
| Net realized/unrealized gains (losses) incl. in | Transfers | Unrealized gains (losses) still held(3) | Net realized/unrealized gains (losses) incl. in | Transfers | Unrealized gains (losses) still held(3) | |||||||||||||||||||||||||||||||||||||||||||||||||||||||||||||
| In millions of dollars | Dec. 31, 2015 | Principal transactions | Other(1)(2) | into Level 3 | out of Level 3 | Purchases | Issuances | Sales | Settlements | Mar. 31, 2016 | Dec. 31, 2016 | Principal transactions | Other(1)(2) | into Level 3 | out of Level 3 | Purchases | Issuances | Sales | Settlements | Mar. 31, 2017 | ||||||||||||||||||||||||||||||||||||||||||||||
| Loans | $ | 2,166 | $ | — | $ | (77 | ) | $ | 89 | $ | (538 | ) | $ | 359 | $ | 161 | $ | (378 | ) | $ | (59 | ) | $ | 1,723 | $ | 7 | $ | 568 | $ | — | $ | (4 | ) | $ | 65 | $ | (16 | ) | $ | 12 | $ | — | $ | (43 | ) | $ | (2 | ) | $ | 580 | $ | 74 | ||||||||||||||
| Mortgage servicing rights | 1,781 | — | (225 | ) | — | — | — | 33 | 14 | (79 | ) | 1,524 | 57 | 1,564 | — | 67 | — | — | — | 35 | (1,046 | ) | (53 | ) | 567 | 83 | ||||||||||||||||||||||||||||||||||||||||
| Other financial assets measured on a recurring basis | 180 | — | 17 | 3 | (3 | ) | — | 63 | (120 | ) | (83 | ) | 57 | (317 | ) | 34 | — | (189 | ) | 3 | (1 | ) | — | 29 | 204 | (53 | ) | 27 | (191 | ) | ||||||||||||||||||||||||||||||||||||
| Liabilities | ||||||||||||||||||||||||||||||||||||||||||||||||||||||||||||||||||
| Interest-bearing deposits | $ | 434 | $ | — | $ | (4 | ) | $ | 4 | $ | (209 | ) | $ | — | $ | 4 | $ | — | $ | (46 | ) | $ | 191 | $ | — | $ | 293 | $ | — | $ | 11 | $ | 20 | $ | — | $ | — | $ | — | $ | — | $ | — | $ | 302 | $ | 25 | |||||||||||||||||||
| Federal funds purchased and securities loaned or sold under agreements to repurchase | 1,247 | (25 | ) | — | — | — | — | — | 16 | (50 | ) | 1,238 | — | 849 | 6 | — | — | — | — | — | — | (34 | ) | 809 | 6 | |||||||||||||||||||||||||||||||||||||||||
| Trading account liabilities | ||||||||||||||||||||||||||||||||||||||||||||||||||||||||||||||||||
| Securities sold, not yet purchased | 199 | 25 | — | 59 | (25 | ) | — | — | 36 | (126 | ) | 118 | (2 | ) | 1,177 | 54 | — | 11 | (14 | ) | — | — | 101 | (70 | ) | 1,151 | 2 | |||||||||||||||||||||||||||||||||||||||
| Other trading liabilities | — | — | — | — | — | — | — | — | — | — | — | 1 | — | — | — | — | — | — | — | (1 | ) | — | — | |||||||||||||||||||||||||||||||||||||||||||
| Short-term borrowings | 9 | (3 | ) | — | 5 | (4 | ) | — | 34 | — | (1 | ) | 46 | (4 | ) | 42 | (9 | ) | — | — | — | — | 11 | — | (2 | ) | 60 | 22 | ||||||||||||||||||||||||||||||||||||||
| Long-term debt | 6,951 | 46 | — | 509 | (1,087 | ) | — | 1,440 | — | (89 | ) | 7,678 | — | 9,744 | 17 | — | 200 | (409 | ) | — | 929 | — | (271 | ) | 10,176 | 116 | ||||||||||||||||||||||||||||||||||||||||
| Other financial liabilities measured on a recurring basis | 14 | — | (8 | ) | — | (4 | ) | (4 | ) | 1 | — | (1 | ) | 14 | (5 | ) | 8 | — | (2 | ) | — | — | (1 | ) | 1 | — | (6 | ) | 4 | (2 | ) | |||||||||||||||||||||||||||||||||||
(1) | Changes in fair value |
| (2) | Unrealized gains (losses) on MSRs are recorded in Other revenue on the Consolidated Statement of Income. |
| (3) | Represents the amount of total gains or losses for the period, included in earnings (and AOCI for changes in fair value of available-for-sale |
| (4) | Total Level 3 trading derivative assets and liabilities have been netted in these tables for presentation purposes only. |
| As of March 31, 2017 | Fair value(1) (in millions) | Methodology | Input | Low(2)(3) | High(2)(3) | Weighted average(4) | ||||||||||||||||||||||
| As of March 31, 2018 | Fair value(1) (in millions) | Methodology | Input | Low(2)(3) | High(2)(3) | Weighted average(4) | ||||||||||||||||||||||
| Assets | ||||||||||||||||||||||||||||
| Federal funds sold and securities borrowed or purchased under agreements to resell | $ | 1,187 | Model-based | IR normal volatility | 13.87 | % | 71.61 | % | 57.55 | % | $ | 16 | Model-based | Interest rate | 1.74 | % | 2.41 | % | 2.40 | % | ||||||||
| Mortgage-backed securities | $ | 220 | Yield analysis | Yield | 2.18 | % | 8.14 | % | 3.89 | % | ||||||||||||||||||
| Interest rate | (0.56 | )% | 2.25 | % | (0.39 | )% | 147 | Price-based | Price | $ | 6.00 | $ | 102.26 | $ | 74.57 | |||||||||||||
| Mortgage-backed securities | $ | 890 | Price-based | Price | $ | 5.78 | $ | 113.12 | $ | 70.94 | ||||||||||||||||||
| State and municipal, foreign government, corporate and other debt securities | $ | 3,136 | Price-based | Price | $ | 15.00 | $ | 108.88 | $ | 92.19 | $ | 943 | Model-based | Price | $ | 3.47 | $ | 110.39 | $ | 88.85 | ||||||||
| 883 | Price-based | Credit spread | 35bps | 500bps | 252bps | |||||||||||||||||||||||
| 655 | Cash flow | Credit spread | 35 bps | 600 bps | 236 bps | Yield | 2.00 | % | 14.88 | % | 6.54 | % | ||||||||||||||||
Equity securities(5) | $ | 73 | Model-based | Price | $ | — | $ | 158.24 | $ | 7.28 | $ | 206 | Price-based | Price | $ | 0.01 | $ | 18,320.07 | $ | 654.81 | ||||||||
| 30 | Price-based | WAL | 2.50 years | 2.50 years | 2.50 years | 30 | Model-based | |||||||||||||||||||||
| Asset-backed securities | $ | 2,617 | Price-based | Price | $ | 3.35 | $ | 101.38 | $ | 72.53 | $ | 1,983 | Price-based | Price | $ | 2.33 | $ | 100.76 | $ | 69.28 | ||||||||
| Non-marketable equity | $ | 527 | Price-based | Discount to price | — | % | 100.00 | % | 12.77 | % | ||||||||||||||||||
| Non-marketable equities | $ | 431 | Comparables analysis | EBITDA multiples | 7.00 | x | 10.90 | x | 8.56 | x | ||||||||||||||||||
| 513 | Comparables analysis | EBITDA multiples | 6.50 | x | 10.60 | x | 8.60 | x | 265 | Price-based | Discount to price | — | % | 100.00 | % | 13.24 | % | |||||||||||
| Price-to-book ratio | 0.70 | % | 1.03 | % | 0.92 | % | Price to book ratio | 5.00 | x | 100.00 | x | 68.86 | x | |||||||||||||||
Derivatives—gross(6) | ||||||||||||||||||||||||||||
| Interest rate contracts (gross) | $ | 4,917 | Model-based | IR normal volatility | 13.87 | % | 86.04 | % | 53.37 | % | $ | 4,440 | Model-based | Mean reversion | 1.00 | % | 20.00 | % | 10.50 | % | ||||||||
| Inflation volatility | 0.25 | % | 2.70 | % | 0.82 | % | ||||||||||||||||||||||
| Mean reversion | 1.00 | % | 20.00 | % | 10.50 | % | IR Normal Volatility | 0.12 | % | 78.91 | % | 50.71 | % | |||||||||||||||
| Foreign exchange contracts (gross) | $ | 761 | Model-based | Foreign exchange (FX) volatility | 3.04 | % | 22.77 | % | 10.03 | % | $ | 877 | Model-based | FX volatility | 6.41 | % | 20.25 | % | 12.75 | % | ||||||||
| 149 | Cash flow | Yield | 5.62 | % | 14.50 | % | 8.49 | % | IR basis | (0.74 | )% | 2.01 | % | (0.01 | )% | |||||||||||||
| IR-FX correlation | (27.35 | )% | 60.00 | % | 47.42 | % | Credit spread | 23bps | 7,823bps | 166bps | ||||||||||||||||||
| IR-IR correlation | 40.00 | % | 47.54 | % | 40.22 | % | IR-IR correlation | 40.00 | % | 40.00 | % | 40.00 | % | |||||||||||||||
| Credit spread | 22 bps | 523 bps | 217 bps | IR-FX correlation | 40.00 | % | 60.00 | % | 50.00 | % | ||||||||||||||||||
Equity contracts (gross)(7) | $ | 2,700 | Model-based | Equity volatility | 3.00 | % | 55.49 | % | 24.77 | % | ||||||||||||||||||
| Equity contracts (gross) | $ | 2,835 | Model-based | Equity volatility | 1.16 | % | 70.22 | % | 25.72 | % | ||||||||||||||||||
| Forward price | 43.06 | % | 144.61 | % | 93.92 | % | Forward price | 63.73 | % | 153.71 | % | 101.21 | % | |||||||||||||||
| Equity-Equity correlation | (89.91 | )% | 97.69 | % | 14.44 | % | ||||||||||||||||||||||
| Equity-FX correlation | (70.20 | )% | 29.90 | % | (24.88 | )% | ||||||||||||||||||||||
| Commodity contracts (gross) | $ | 3,170 | Model-based | Forward price | 38.85 | % | 299.37 | % | 102.39 | % | ||||||||||||||||||
| Commodity and other contracts (gross) | $ | 2,940 | Model-based | Forward price | 35.75 | % | 478.26 | % | 114.73 | % | ||||||||||||||||||
| Commodity volatility | 10.45 | % | 45.13 | % | 26.24 | % | Commodity volatility | 9.14 | % | 41.03 | % | 22.87 | % | |||||||||||||||
| Commodity correlation | (44.00 | )% | 91.00 | % | 56.00 | % | Commodity correlation | (51.36 | )% | 91.85 | % | 19.83 | % | |||||||||||||||
| Credit derivatives (gross) | $ | 2,976 | Model-based | Recovery rate | 6.50 | % | 65.00 | % | 35.21 | % | $ | 1,833 | Model-based | Credit correlation | 25.00 | % | 85.00 | % | 43.30 | % | ||||||||
| 1,287 | Price-based | Credit correlation | 5.00 | % | 95.00 | % | 32.70 | % | 774 | Price-based | Upfront points | 3.84 | % | 97.33 | % | 59.81 | % | |||||||||||
| Upfront points | 10.20 | % | 99.00 | % | 54.28 | % | Credit spread | 6bps | 1,200bps | 115bps | ||||||||||||||||||
| Price | $ | — | $ | 123.67 | $ | 75.18 | Price | $ | 7.54 | $ | 100.00 | $ | 64.58 | |||||||||||||||
| Credit spread | 4 bps | 2,109 bps | 210 bps | |||||||||||||||||||||||||
| As of March 31, 2017 | Fair value(1) (in millions) | Methodology | Input | Low(2)(3) | High(2)(3) | Weighted average(4) | ||||||||||||||||||||||
Nontrading derivatives and other financial assets and liabilities measured on a recurring basis (gross)(6) | $ | 30 | Model-based | Redemption rate | 12.52 | % | 99.50 | % | 72.08 | % | ||||||||||||||||||
| As of March 31, 2018 | Fair value(1) (in millions) | Methodology | Input | Low(2)(3) | High(2)(3) | Weighted average(4) | ||||||||||||||||||||||
Nontrading derivatives and other financial assets and liabilities measured on a recurring basis (Gross) | $ | 19 | Model-based | Recovery rate | 25.00 | % | 46.00 | % | 38.21 | % | ||||||||||||||||||
| Recovery rate | 40.00 | % | 40.00 | % | 40.00 | % | Credit spread | 21bps | 129bps | 77bps | ||||||||||||||||||
| Credit spread | 33 bps | 659 bps | 202 bps | Redemption rate | 5.14 | % | 99.50 | % | 72.69 | % | ||||||||||||||||||
| Loans | $ | 235 | Model-based | Credit spread | 45 bps | 500 bps | 76 bps | |||||||||||||||||||||
| 214 | Yield Analysis | Yield | 2.90 | % | 20.00 | % | 11.98 | % | Upfront points | 54.00 | % | 54.00 | % | 54.00 | % | |||||||||||||
| Loans and leases | $ | 520 | Model-based | Credit spread | 17bps | 500bps | 92bps | |||||||||||||||||||||
| 120 | Price-based | Yield | 2.70 | % | 4.06 | % | 3.71 | % | ||||||||||||||||||||
| Mortgage servicing rights | $ | 475 | Cash flow | Yield | 4.20 | % | 21.22 | % | 12.38 | % | $ | 500 | Cash flow | Yield | 4.26 | % | 12.60 | % | 8.36 | % | ||||||||
| 92 | Model-based | WAL | 3.53 years | 7.72 years | 6.23 years | 87 | Model-based | WAL | 4.08 years | 7.63 years | 6.53 years | |||||||||||||||||
| Liabilities | ||||||||||||||||||||||||||||
| Interest-bearing deposits | $ | 282 | Model-based | Mean reversion | 1.00 | % | 20.00 | % | 10.50 | % | $ | 292 | Model-based | Mean reversion | — | % | 20.00 | % | 7.85 | % | ||||||||
| Forward price | 99.50 | % | 99.95 | % | 99.62 | % | ||||||||||||||||||||||
| Federal funds purchased and securities loaned or sold under agreements to repurchase | $ | 809 | Model-based | Interest rate | 0.73 | % | 2.25 | % | 2.07 | % | ||||||||||||||||||
| Federal funds purchased and securities loaned or sold under agreement to repurchase | $ | 857 | Model-based | Interest rate | 1.74 | % | 2.41 | % | 2.40 | % | ||||||||||||||||||
| Trading account liabilities | ||||||||||||||||||||||||||||
| Securities sold, not yet purchased | $ | 1,013 | Model-based | IR normal volatility | 13.87 | % | 71.61 | % | 57.55 | % | $ | 31 | Model-based | Equity volatility | 3.00 | % | 70.22 | % | 31.84 | % | ||||||||
| $ | 138 | Price-based | Price | $ | 1.29 | $ | 121.00 | $ | 98.22 | 18 | Price-based | Equity-equity correlation | (99.00 | )% | 100.00 | % | 59.65 | % | ||||||||||
| Short-term borrowings and long-term debt | $ | 10,303 | Model-based | Mean Reversion | 1.00 | % | 20.00 | % | 10.50 | % | ||||||||||||||||||
| Forward price | 68.46 | % | 235.35 | % | 100.73 | % | Equity-FX correlation | (80.37 | )% | 56.00 | % | (29.86 | )% | |||||||||||||||
| Equity volatility | 3.00 | % | 50.00 | % | 20.71 | % | Forward Price | 63.73 | % | 153.71 | % | 100.14 | % | |||||||||||||||
| IR normal volatility | 0.16 | % | 86.04 | % | 57.73 | % | Price | $ | — | $ | 100.00 | $ | 24.84 | |||||||||||||||
| Short-term borrowings and long-term debt | $ | 13,559 | Model-based | Equity volatility | 3.00 | % | 70.22 | % | 18.48 | % | ||||||||||||||||||
| Forward price | 63.73 | % | 167.94 | % | 103.12 | % | ||||||||||||||||||||||
| As of December 31, 2016 | Fair value(1) (in millions) | Methodology | Input | Low(2)(3) | High(2)(3) | Weighted average(4) | ||||||||||||||||||||||
| As of December 31, 2017 | Fair value(1) (in millions) | Methodology | Input | Low(2)(3) | High(2)(3) | Weighted average(4) | ||||||||||||||||||||||
| Assets | ||||||||||||||||||||||||||||
| Federal funds sold and securities borrowed or purchased under agreements to resell | $ | 1,496 | Model-based | IR log-normal volatility | 12.86 | % | 75.50 | % | 61.73 | % | $ | 16 | Model-based | Interest rate | 1.43 | % | 2.16 | % | 2.09 | % | ||||||||
| Interest rate | (0.51 | )% | 5.76 | % | 2.80 | % | ||||||||||||||||||||||
| Mortgage-backed securities | $ | 509 | Price-based | Price | $ | 5.50 | $ | 113.48 | $ | 61.74 | $ | 214 | Price-based | Price | $ | 2.96 | $ | 101.00 | $ | 56.52 | ||||||||
| 368 | Yield analysis | Yield | 1.90 | % | 14.54 | % | 4.34 | % | 184 | Yield analysis | Yield | 2.52 | % | 14.06 | % | 5.97 | % | |||||||||||
| State and municipal, foreign government, corporate and other debt securities | $ | 3,308 | Price-based | Price | $ | 15.00 | $ | 103.60 | $ | 89.93 | $ | 949 | Model-based | Price | $ | — | $ | 184.04 | $ | 91.74 | ||||||||
| 914 | Price-based | Credit spread | 35bps | 500bps | 249bps | |||||||||||||||||||||||
| 1,513 | Cash flow | Credit spread | 35 bps | 600 bps | 230 bps | Yield | 2.36 | % | 14.25 | % | 6.03 | % | ||||||||||||||||
Equity securities(5) | $ | 69 | Model-based | Price | $ | 0.48 | $ | 104.00 | $ | 22.19 | $ | 65 | Price-based | Price | $ | — | $ | 25,450.00 | $ | 2,526.62 | ||||||||
| 58 | Price-based | 55 | Model-based | WAL | 2.50 years | 2.50 years | 2.50 years | |||||||||||||||||||||
| Asset-backed securities | $ | 2,454 | Price-based | Price | $ | 4.00 | $ | 100.00 | $ | 71.51 | $ | 2,287 | Price-based | Price | $ | 4.25 | $ | 100.60 | $ | 74.57 | ||||||||
| Non-marketable equity | $ | 726 | Price-based | Discount to price | — | % | 90.00 | % | 13.36 | % | $ | 423 | Comparables analysis | EBITDA multiples | 6.90 | x | 12.80 | x | 8.66 | x | ||||||||
| 565 | Comparables analysis | EBITDA multiples | 6.80 | x | 10.10 | x | 8.62 | x | 223 | Price-based | Discount to price | — | % | 100.00 | % | 11.83 | % | |||||||||||
| Price-to-book ratio | 0.32 | % | 1.03 | % | 0.87 | % | Price-to-book ratio | 0.05 | x | 1.00 | x | 0.32 | x | |||||||||||||||
| Price | $ | — | $ | 113.23 | $ | 54.40 | ||||||||||||||||||||||
Derivatives—gross(6) | ||||||||||||||||||||||||||||
| Interest rate contracts (gross) | $ | 4,897 | Model-based | IR log-normal volatility | 1.00 | % | 93.97 | % | 62.72 | % | ||||||||||||||||||
| Mean reversion | 1.00 | % | 20.00 | % | 10.50 | % | ||||||||||||||||||||||
| Foreign exchange contracts (gross) | $ | 1,110 | Model-based | Foreign exchange (FX) volatility | 1.39 | % | 26.85 | % | 15.18 | % | ||||||||||||||||||
| 134 | Cash flow | Interest rate | (0.85 | )% | (0.49 | )% | (0.84 | )% | ||||||||||||||||||||
| Credit spread | 4 bps | 657 bps | 266 bps | |||||||||||||||||||||||||
| As of December 31, 2016 | Fair value(1) (in millions) | Methodology | Input | Low(2)(3) | High(2)(3) | Weighted average(4) | ||||||||||||||||||||||
| As of December 31, 2017 | Fair value(1) (in millions) | Methodology | Input | Low(2)(3) | High(2)(3) | Weighted average(4) | ||||||||||||||||||||||
| Interest rate contracts (gross) | $ | 3,818 | Model-based | IR normal volatility | 9.40 | % | 77.40 | % | 58.86 | % | ||||||||||||||||||
| IR-IR correlation | 40.00 | % | 50.00 | % | 41.27 | % | Mean reversion | 1.00 | % | 20.00 | % | 10.50 | % | |||||||||||||||
| IR-FX correlation | 16.41 | % | 60.00 | % | 49.52 | % | ||||||||||||||||||||||
Equity contracts (gross)(7) | $ | 2,701 | Model-based | Equity volatility | 3.00 | % | 97.78 | % | 29.52 | % | ||||||||||||||||||
| Foreign exchange contracts (gross) | $ | 940 | Model-based | Foreign exchange (FX) volatility | 4.58 | % | 15.02 | % | 8.16 | % | ||||||||||||||||||
| Forward price | 69.05 | % | 144.61 | % | 94.28 | % | Interest rate | (0.55 | )% | 0.28 | % | 0.04 | % | |||||||||||||||
| Equity-FX correlation | (60.70 | )% | 28.20 | % | (26.28 | )% | IR-IR correlation | (51.00 | )% | 40.00 | % | 36.56 | % | |||||||||||||||
| Equity-IR correlation | (35.00 | )% | 41.00 | % | (15.65 | )% | IR-FX correlation | (7.34 | )% | 60.00 | % | 49.04 | % | |||||||||||||||
| Yield volatility | 3.55 | % | 14.77 | % | 9.29 | % | Credit spread | 11bps | 717bps | 173bps | ||||||||||||||||||
Equity contracts (gross)(7) | $ | 2,897 | Model-based | Equity volatility | 3.00 | % | 68.93 | % | 24.66 | % | ||||||||||||||||||
| Equity-equity correlation | (87.70 | )% | 96.50 | % | 67.45 | % | Forward price | 69.74 | % | 154.19 | % | 92.80 | % | |||||||||||||||
| Commodity contracts (gross) | $ | 2,955 | Model-based | Forward price | 35.74 | % | 235.35 | % | 119.99 | % | $ | 2,937 | Model-based | Forward price | 3.66 | % | 290.59 | % | 114.16 | % | ||||||||
| Commodity volatility | 2.00 | % | 32.19 | % | 17.07 | % | Commodity volatility | 8.60 | % | 66.73 | % | 25.04 | % | |||||||||||||||
| Commodity correlation | (41.61 | )% | 90.42 | % | 52.85 | % | Commodity correlation | (37.64 | )% | 91.71 | % | 15.21 | % | |||||||||||||||
| Credit derivatives (gross) | $ | 2,786 | Model-based | Recovery rate | 20.00 | % | 75.00 | % | 39.75 | % | $ | 1,797 | Model-based | Credit correlation | 25.00 | % | 90.00 | % | 44.64 | % | ||||||||
| 1,403 | Price-based | Credit correlation | 5.00 | % | 90.00 | % | 34.27 | % | 823 | Price-based | Upfront points | 6.03 | % | 97.26 | % | 62.88 | % | |||||||||||
| Upfront points | 6.00 | % | 99.90 | % | 72.89 | % | Credit spread | 3 bps | 1,636bps | 173bps | ||||||||||||||||||
| Price | $ | 1.00 | $ | 167.00 | $ | 77.35 | Price | $ | 1.00 | $ | 100.24 | $ | 57.63 | |||||||||||||||
Nontrading derivatives and other financial assets and liabilities measured on a recurring basis (gross)(6) | $ | 24 | Model-based | Recovery rate | 25.00 | % | 40.00 | % | 31.56 | % | ||||||||||||||||||
| Credit spread | 3 bps | 1,515 bps | 256 bps | Redemption rate | 10.72 | % | 99.50 | % | 74.24 | % | ||||||||||||||||||
Nontrading derivatives and other financial assets and liabilities measured on a recurring basis (gross)(6) | $ | 42 | Model-based | Recovery rate | 40.00 | % | 40.00 | % | 40.00 | % | ||||||||||||||||||
| Redemption rate | 3.92 | % | 99.58 | % | 74.69 | % | Credit spread | 38bps | 275bps | 127bps | ||||||||||||||||||
| Upfront points | 16.00 | % | 20.50 | % | 18.78 | % | Upfront points | 61.00 | % | 61.00 | % | 61.00 | % | |||||||||||||||
| Loans | $ | 258 | Price-based | Price | $ | 31.55 | $ | 105.74 | $ | 56.46 | $ | 391 | Model-based | Equity Volatility | 3.00 | % | 68.93 | % | 22.52 | % | ||||||||
| 221 | Yield analysis | Yield | 2.75 | % | 20.00 | % | 11.09 | % | 148 | Price-based | Credit spread | 134bps | 500bps | 173bps | ||||||||||||||
| 79 | Model-based | Yield | 3.09 | % | 4.40 | % | 3.13 | % | ||||||||||||||||||||
| Mortgage servicing rights | $ | 1,473 | Cash flow | Yield | 4.20 | % | 20.56 | % | 9.32 | % | $ | 471 | Cash flow | Yield | 8.00 | % | 16.38 | % | 11.47 | % | ||||||||
| WAL | 3.53 years | 7.24 years | 5.83 years | 87 | Model-based | WAL | 3.83 years | 6.89 years | 5.93 years | |||||||||||||||||||
| Liabilities | ||||||||||||||||||||||||||||
| Interest-bearing deposits | $ | 293 | Model-based | Mean reversion | 1.00 | % | 20.00 | % | 10.50 | % | $ | 286 | Model-based | Mean reversion | 1.00 | % | 20.00 | % | 10.50 | % | ||||||||
| Forward price | 98.79 | % | 104.07 | % | 100.19 | % | Forward price | 99.56 | % | 99.95 | % | 99.72 | % | |||||||||||||||
| Federal funds purchased and securities loaned or sold under agreements to repurchase | $ | 849 | Model-based | Interest rate | 0.62 | % | 2.19 | % | 1.99 | % | $ | 726 | Model-based | Interest rate | 1.43 | % | 2.16 | % | 2.09 | % | ||||||||
| Trading account liabilities | ||||||||||||||||||||||||||||
| Securities sold, not yet purchased | $ | 1,056 | Model-based | IR normal volatility | 12.86 | % | 75.50 | % | 61.73 | % | $ | 21 | Price-based | Price | $ | 1.00 | $ | 287.64 | $ | 88.19 | ||||||||
| Short-term borrowings and long-term debt | $ | 9,774 | Model-based | Mean reversion | 1.00 | % | 20.00 | % | 10.50 | % | ||||||||||||||||||
| Commodity correlation | (41.61 | )% | 90.42 | % | 52.85 | % | ||||||||||||||||||||||
| Commodity volatility | 2.00 | % | 32.19 | % | 17.07 | % | ||||||||||||||||||||||
| Forward price | 69.05 | % | 235.35 | % | 103.28 | % | ||||||||||||||||||||||
Short-term borrowings and long- term debt | $ | 13,100 | Model-based | Forward price | 69.74 | % | 161.11 | % | 100.70 | % | ||||||||||||||||||
| (1) | The fair value amounts presented in these tables represent the primary valuation technique or techniques for each class of assets or liabilities. |
| (2) | Some inputs are shown as zero due to rounding. |
| (3) | When the low and high inputs are the same, there is either a constant input applied to all positions, or the methodology involving the input applies to only one large position. |
| (4) | Weighted averages are calculated based on the fair values of the instruments. |
| (5) | For equity securities, the price |
| (6) | Both trading and nontrading account derivatives—assets and liabilities—are presented on a gross absolute value basis. |
| (7) | Includes hybrid products. |
| In millions of dollars | Fair value | Level 2 | Level 3 | Fair value | Level 2 | Level 3 | ||||||||||||
| March 31, 2017 | ||||||||||||||||||
| Loans held-for-sale | $ | 3,790 | $ | 2,002 | $ | 1,788 | ||||||||||||
| March 31, 2018 | ||||||||||||||||||
Loans HFS(1) | $ | 3,481 | $ | 1,430 | $ | 2,051 | ||||||||||||
| Other real estate owned | 70 | 13 | 57 | 70 | 41 | 29 | ||||||||||||
Loans | 1,195 | 630 | 565 | 545 | 179 | 366 | ||||||||||||
| Non-marketable equity investments measured using the measurement alternative | $ | 188 | $ | 133 | $ | 55 | ||||||||||||
| Total assets at fair value on a nonrecurring basis | $ | 5,055 | $ | 2,645 | $ | 2,410 | $ | 4,284 | $ | 1,783 | $ | 2,501 | ||||||
| In millions of dollars | Fair value | Level 2 | Level 3 | Fair value | Level 2 | Level 3 | ||||||||||||
| December 31, 2016 | ||||||||||||||||||
| Loans held-for-sale | $ | 5,802 | $ | 3,389 | $ | 2,413 | ||||||||||||
| December 31, 2017 | ||||||||||||||||||
Loans HFS(1) | $ | 5,675 | $ | 2,066 | $ | 3,609 | ||||||||||||
| Other real estate owned | 75 | 15 | 60 | 54 | 10 | 44 | ||||||||||||
Loans | 1,376 | 586 | 790 | 630 | 216 | 414 | ||||||||||||
| Total assets at fair value on a nonrecurring basis | $ | 7,253 | $ | 3,990 | $ | 3,263 | $ | 6,359 | $ | 2,292 | $ | 4,067 | ||||||
| (1) |
| (2) | Represents impaired loans held for investment whose carrying amount is based on the fair value of the underlying collateral less costs to sell, primarily real estate. |
| As of March 31, 2017 | Fair value(1) (in millions) | Methodology | Input | Low(2) | High | Weighted average(3) | ||||||||
| Loans held-for-sale | $ | 1,788 | Price-based | Price | $ | 77.93 | $ | 100.00 | $ | 98.03 | ||||
| Other real estate owned | $ | 57 | Price-based | Discount to price(4) | 0.34 | % | 0.34 | % | 0.34 | % | ||||
| Appraised value | $ | 27,054.05 | $ | 4,514,806.00 | $ | 2,032,098.00 | ||||||||
| Price | $ | 62.43 | $ | 85.81 | $ | 65.53 | ||||||||
Loans(5) | $ | 345 | Price-based | Price | $ | 3.20 | $ | 100.00 | $ | 23.67 | ||||
| 128 | Recovery analysis | Discount to price(4) | 18.67 | % | 28.39 | % | 23.57 | % | ||||||
| Recovery rate | 92.68 | % | 92.68 | % | 92.68 | % | ||||||||
| As of December 31, 2016 | Fair value(1) (in millions) | Methodology | Input | Low(2) | High | Weighted average(3) | ||||||||||||||||||||||
| As of March 31, 2018 | Fair value(1) (in millions) | Methodology | Input | Low(2) | High | Weighted average(3) | ||||||||||||||||||||||
| Loans held-for-sale | $ | 2,413 | Price-based | Price | $ | — | $ | 100.00 | $ | 93.08 | $ | 2,015 | Price-based | Price | $ | 0.88 | $ | 100.00 | $ | 95.86 | ||||||||
| Other real estate owned | $ | 59 | Price-based | Discount to price(4) | 0.34 | % | 13.00 | % | 3.10 | % | $ | 26 | Price-based | Appraised value(4) | $ | 20,290 | $ | 8,423,945 | $ | 4,273,507 | ||||||||
| Price | $ | 64.65 | $ | 74.39 | $ | 66.21 | Price | $ | — | $ | 53.47 | $ | 50.08 | |||||||||||||||
Loans(5) | $ | 431 | Cash flow | Price | $ | 3.25 | $ | 105.00 | $ | 59.61 | $ | 125 | Recovery analysis | Recovery rate | 9.00 | % | 91.53 | % | 31.51 | % | ||||||||
| 197 | Recovery analysis | Forward price | $ | 2.90 | $ | 210.00 | $ | 156.78 | 106 | Cash flow | Price | $ | 2.80 | $ | 100.00 | $ | 81.82 | |||||||||||
| 135 | Price-based | Discount to price(4) | 0.25 | % | 13.00 | % | 8.34 | % | 102 | Price-based | Appraised value | $ | 35,490,000 | $ | 465,594,643 | $ | 74,229,249 | |||||||||||
| Appraised value | $ | 25.80 | $ | 26,400,000 | $ | 6,462,735 | ||||||||||||||||||||||
Non-marketable equity investments measured using the measurement alternative | $ | 55 | Price-based | Discount to price | 25 | % | 25 | % | 25 | % | ||||||||||||||||||
| As of December 31, 2017 | Fair value(1) (in millions) | Methodology | Input | Low(2) | High | Weighted average(3) | ||||||||
| Loans held-for-sale | $ | 3,186 | Price-based | Price | $ | 77.93 | $ | 100.00 | $ | 99.26 | ||||
| Other real estate owned | $ | 42 | Price-based | Appraised Value(4) | $ | 20,278 | $ | 8,091,760 | $ | 4,016,665 | ||||
Discount to price(6) | 34.00 | % | 34.00 | % | 34.00 | % | ||||||||
| Price | $ | 30.00 | $ | 50.36 | $ | 49.09 | ||||||||
Loans(5) | $ | 133 | Price-based | Price | $ | 2.80 | $ | 100.00 | $ | 62.46 | ||||
| 129 | Cash flow | Recovery rate | 50.00 | % | 100.00 | % | 63.59 | % | ||||||
| 127 | Recovery analysis | Appraised value | $ | — | $ | 45,500,000 | $ | 38,785,667 | ||||||
| (1) | The fair value amounts presented in this table represent the primary valuation technique or techniques for each class of assets or liabilities. |
| (2) | Some inputs are shown as zero due to rounding. |
| (3) | Weighted averages are calculated based on the fair values of the instruments. |
| (4) |
| (5) | Represents impaired loans held for investment whose carrying amounts are based on the fair value of the underlying |
| (6) | Includes estimated costs to sell. |
| Three months ended March 31, | Three Months Ended March 31, | |||||
| In millions of dollars | 2017 | 2018 | ||||
| Loans held-for-sale | $ | (22 | ) | |||
| Loans HFS | $ | (35 | ) | |||
| Other real estate owned | (2 | ) | (3 | ) | ||
Loans(1) | (28 | ) | (32 | ) | ||
Other Assets(2) | $ | — | ||||
Non-marketable equity investments measured using the measurement alternative | 120 | |||||
| Total nonrecurring fair value gains (losses) | $ | (52 | ) | $ | 50 | |
| (1) | Represents loans held for investment whose carrying amount is based on the fair value of the underlying collateral, primarily real estate. |
| Three months ended March 31, | Three Months Ended March 31, | |||||
| In millions of dollars | 2016 | 2017 | ||||
| Loans held-for-sale | $ | 3 | ||||
| Loans HFS | $ | (22 | ) | |||
| Other real estate owned | (2 | ) | (2 | ) | ||
Loans(1) | (63 | ) | (28 | ) | ||
Other Assets (2) | $ | (262 | ) | |||
| Total nonrecurring fair value gains (losses) | $ | (324 | ) | $ | (52 | ) |
| (1) | Represents loans held for investment whose carrying amount is based on the fair value of the underlying collateral, primarily real estate. |
| March 31, 2017 | Estimated fair value | March 31, 2018 | Estimated fair value | |||||||||||||||||||||||||||
Carrying value | Estimated fair value | Carrying value | Estimated fair value | |||||||||||||||||||||||||||
| In billions of dollars | Level 1 | Level 2 | Level 3 | Level 1 | Level 2 | Level 3 | ||||||||||||||||||||||||
| Assets | ||||||||||||||||||||||||||||||
| Investments | $ | 54.0 | $ | 53.9 | $ | 0.9 | $ | 50.5 | $ | 2.5 | $ | 58.5 | $ | 58.1 | $ | 1.1 | $ | 54.8 | $ | 2.2 | ||||||||||
| Federal funds sold and securities borrowed or purchased under agreements to resell | 105.6 | 105.6 | — | 100.6 | 5.0 | 96.4 | 96.4 | — | 91.4 | 5.0 | ||||||||||||||||||||
Loans(1)(2) | 610.7 | 604.0 | — | 7.3 | 596.7 | 654.4 | 653.4 | — | 4.3 | 649.1 | ||||||||||||||||||||
Other financial assets(2)(3) | 242.3 | 242.8 | 7.0 | 173.2 | 62.6 | 274.2 | 274.6 | 188.3 | 14.4 | 71.9 | ||||||||||||||||||||
| Liabilities | ||||||||||||||||||||||||||||||
| Deposits | $ | 948.7 | $ | 947.1 | $ | — | $ | 800.5 | $ | 146.6 | $ | 999.5 | $ | 997.7 | $ | — | $ | 850.2 | $ | 147.5 | ||||||||||
| Federal funds purchased and securities loaned or sold under agreements to repurchase | 107.3 | 107.3 | — | 107.2 | 0.1 | 125.9 | 125.9 | — | 125.8 | 0.1 | ||||||||||||||||||||
Long-term debt(4) | 181.0 | 187.5 | — | 158.7 | 28.8 | 204.4 | 209.7 | — | 189.5 | 20.2 | ||||||||||||||||||||
Other financial liabilities(5) | 110.2 | 110.2 | — | 14.9 | 95.3 | 116.5 | 116.5 | — | 15.3 | 101.2 | ||||||||||||||||||||
| December 31, 2016 | Estimated fair value | December 31, 2017 | Estimated fair value | |||||||||||||||||||||||||||
Carrying value | Estimated fair value | Carrying value | Estimated fair value | |||||||||||||||||||||||||||
| In billions of dollars | Level 1 | Level 2 | Level 3 | Level 1 | Level 2 | Level 3 | ||||||||||||||||||||||||
| Assets | ||||||||||||||||||||||||||||||
| Investments | $ | 52.1 | $ | 52.0 | $ | 0.8 | $ | 48.6 | $ | 2.6 | $ | 60.2 | $ | 60.6 | $ | 0.5 | $ | 57.5 | $ | 2.6 | ||||||||||
| Federal funds sold and securities borrowed or purchased under agreements to resell | 103.6 | 103.6 | — | 98.5 | 5.1 | 99.5 | 99.5 | — | 94.4 | 5.1 | ||||||||||||||||||||
Loans(1)(2) | 607.0 | 604.5 | — | 7.0 | 597.5 | 648.6 | 644.9 | — | 6.0 | 638.9 | ||||||||||||||||||||
Other financial assets(2)(3) | 215.2 | 215.9 | 8.2 | 153.6 | 54.1 | 242.6 | 243.0 | 166.4 | 14.1 | 62.5 | ||||||||||||||||||||
| Liabilities | ||||||||||||||||||||||||||||||
| Deposits | $ | 928.2 | $ | 927.6 | $ | — | $ | 789.7 | $ | 137.9 | $ | 958.4 | $ | 955.6 | $ | — | $ | 816.1 | $ | 139.5 | ||||||||||
| Federal funds purchased and securities loaned or sold under agreements to repurchase | 108.2 | 108.2 | — | 107.8 | 0.4 | 115.6 | 115.6 | — | 115.6 | — | ||||||||||||||||||||
Long-term debt(4) | 179.9 | 185.5 | — | 156.5 | 29.0 | 205.3 | 214.0 | — | 187.2 | 26.8 | ||||||||||||||||||||
Other financial liabilities(5) | 115.3 | 115.3 | — | 16.2 | 99.1 | 115.9 | 115.9 | — | 15.5 | 100.4 | ||||||||||||||||||||
(1) | The carrying value of loans is net of the Allowance for loan losses of |
| (2) | Includes items measured at fair value on a nonrecurring basis. |
| (3) | Includes cash and due from banks, deposits with banks, brokerage receivables, reinsurance |
| (4) | The carrying value includes long-term debt balances under qualifying fair value hedges. |
| (5) | Includes brokerage payables, separate and variable accounts, short-term borrowings (carried at cost) and other financial instruments included in Other liabilities on the Consolidated Balance Sheet, for all of which the carrying value is a reasonable estimate of fair value. |
| Changes in fair value gains (losses) for the | Changes in fair value—gains (losses) | |||||||||||
| three months ended March 31, | Three Months Ended March 31, | |||||||||||
| In millions of dollars | 2017 | 2016 | 2018 | 2017 | ||||||||
| Assets | ||||||||||||
Federal funds sold and securities borrowed or purchased under agreements to resell - selected portfolios | $ | (33 | ) | $ | 28 | |||||||
| Federal funds sold and securities borrowed or purchased under agreements to resell | $ | (16 | ) | $ | (33 | ) | ||||||
| Trading account assets | 430 | 258 | (16 | ) | 430 | |||||||
| Investments | — | 1 | — | — | ||||||||
| Loans | ||||||||||||
Certain corporate loans | 24 | 24 | (123 | ) | 24 | |||||||
Certain consumer loans | — | (1 | ) | — | — | |||||||
| Total loans | $ | 24 | $ | 23 | $ | (123 | ) | $ | 24 | |||
| Other assets | ||||||||||||
| MSRs | $ | 67 | $ | (225 | ) | $ | 46 | $ | 67 | |||
Certain mortgage loans held for sale(2) | 37 | 80 | ||||||||||
| Other assets | — | 370 | ||||||||||
Certain mortgage loans held-for-sale(1) | 2 | 37 | ||||||||||
| Total other assets | $ | 104 | $ | 225 | $ | 48 | $ | 104 | ||||
| Total assets | $ | 525 | $ | 535 | $ | (107 | ) | $ | 525 | |||
| Liabilities | ||||||||||||
| Interest-bearing deposits | $ | (14 | ) | $ | (50 | ) | $ | 28 | $ | (14 | ) | |
Federal funds purchased and securities loaned or sold under agreements to repurchase - selected portfolios | 613 | (6 | ) | |||||||||
| Federal funds purchased and securities loaned or sold under agreements to repurchase | (111 | ) | 613 | |||||||||
| Trading account liabilities | 26 | 94 | (6 | ) | 26 | |||||||
| Short-term borrowings | 19 | 80 | 177 | 19 | ||||||||
| Long-term debt | (332 | ) | (423 | ) | 618 | (332 | ) | |||||
| Total liabilities | $ | 312 | $ | (305 | ) | $ | 706 | $ | 312 | |||
| (1) |
| Includes gains (losses) associated with interest rate |
| March 31, 2017 | December 31, 2016 | March 31, 2018 | December 31, 2017 | |||||||||||||||||||||
| In millions of dollars | Trading assets | Loans | Trading assets | Loans | Trading assets | Loans | Trading assets | Loans | ||||||||||||||||
| Carrying amount reported on the Consolidated Balance Sheet | $ | 9,126 | $ | 4,035 | $ | 9,824 | $ | 3,486 | $ | 9,194 | $ | 4,536 | $ | 8,851 | $ | 4,374 | ||||||||
| Aggregate unpaid principal balance in excess of fair value | 532 | — | 758 | 18 | ||||||||||||||||||||
| Aggregate unpaid principal balance in excess of (less than) fair value | 475 | 870 | 623 | 682 | ||||||||||||||||||||
| Balance of non-accrual loans or loans more than 90 days past due | — | 2 | — | 1 | — | 1 | — | 1 | ||||||||||||||||
| Aggregate unpaid principal balance in excess of fair value for non-accrual loans or loans more than 90 days past due | — | 1 | — | 1 | — | — | — | 1 | ||||||||||||||||
| In millions of dollars | March 31, 2017 | December 31, 2016 | March 31, 2018 | December 31, 2017 | ||||||||
| Carrying amount reported on the Consolidated Balance Sheet | $ | 683 | $ | 915 | $ | 333 | $ | 426 | ||||
| Aggregate fair value in excess of unpaid principal balance | 21 | 8 | ||||||||||
| Aggregate fair value in excess of (less than) unpaid principal balance | 7 | 14 | ||||||||||
| Balance of non-accrual loans or loans more than 90 days past due | — | — | — | — | ||||||||
| Aggregate unpaid principal balance in excess of fair value for non-accrual loans or loans more than 90 days past due | — | — | — | — | ||||||||
| In billions of dollars | March 31, 2017 | December 31, 2016 | March 31, 2018 | December 31, 2017 | ||||||||
| Interest rate linked | $ | 11.3 | $ | 10.6 | $ | 15.9 | $ | 13.9 | ||||
| Foreign exchange linked | 0.2 | 0.2 | 0.3 | 0.3 | ||||||||
| Equity linked | 12.0 | 12.3 | 12.8 | 13.0 | ||||||||
| Commodity linked | 0.8 | 0.3 | 0.4 | 0.2 | ||||||||
| Credit linked | 1.6 | 0.9 | 1.9 | 1.9 | ||||||||
| Total | $ | 25.9 | $ | 24.3 | $ | 31.3 | $ | 29.3 | ||||
| In millions of dollars | March 31, 2017 | December 31, 2016 | March 31, 2018 | December 31, 2017 | ||||||||
| Carrying amount reported on the Consolidated Balance Sheet | $ | 27,526 | $ | 26,254 | $ | 33,571 | $ | 31,392 | ||||
| Aggregate unpaid principal balance in excess of (less than) fair value | (55 | ) | (128 | ) | (93 | ) | (579 | ) | ||||
| In millions of dollars | March 31, 2017 | December 31, 2016 | March 31, 2018 | December 31, 2017 | ||||||||
| Carrying amount reported on the Consolidated Balance Sheet | $ | 3,473 | $ | 2,700 | $ | 4,467 | $ | 4,627 | ||||
| Aggregate unpaid principal balance in excess of (less than) fair value | (9 | ) | (61 | ) | ||||||||
| Aggregate unpaid principal balance in excess of fair value | 463 | 74 | ||||||||||
| Maximum potential amount of future payments | Maximum potential amount of future payments | |||||||||||||||||||||||
| In billions of dollars at March 31, 2017 except carrying value in millions | Expire within 1 year | Expire after 1 year | Total amount outstanding | Carrying value (in millions of dollars) | ||||||||||||||||||||
| In billions of dollars at March 31, 2018 except carrying value in millions | Expire within 1 year | Expire after 1 year | Total amount outstanding | Carrying value (in millions of dollars) | ||||||||||||||||||||
| Financial standby letters of credit | $ | 28.1 | $ | 66.0 | $ | 94.1 | $ | 205 | $ | 30.4 | $ | 63.0 | $ | 93.4 | $ | 131 | ||||||||
| Performance guarantees | 7.6 | 3.7 | 11.3 | 20 | 7.5 | 4.1 | 11.6 | 31 | ||||||||||||||||
| Derivative instruments considered to be guarantees | 10.7 | 78.1 | 88.8 | 690 | 17.0 | 85.6 | 102.6 | 432 | ||||||||||||||||
| Loans sold with recourse | — | 0.2 | 0.2 | 11 | — | 0.2 | 0.2 | 8 | ||||||||||||||||
Securities lending indemnifications(1) | 97.1 | — | 97.1 | — | 126.9 | — | 126.9 | — | ||||||||||||||||
Credit card merchant processing(1)(2) | 77.6 | — | 77.6 | — | 82.5 | — | 82.5 | — | ||||||||||||||||
| Credit card arrangements with partners | 0.2 | 1.3 | 1.5 | 206 | 0.2 | 1.1 | 1.3 | 162 | ||||||||||||||||
| Custody indemnifications and other | 1.5 | 47.5 | 49.0 | 58 | — | 38.5 | 38.5 | 82 | ||||||||||||||||
| Total | $ | 222.8 | $ | 196.8 | $ | 419.6 | $ | 1,190 | $ | 264.5 | $ | 192.5 | $ | 457.0 | $ | 846 | ||||||||
| Maximum potential amount of future payments | Maximum potential amount of future payments | |||||||||||||||||||||||
| In billions of dollars at December 31, 2016 except carrying value in millions | Expire within 1 year | Expire after 1 year | Total amount outstanding | Carrying value (in millions of dollars) | ||||||||||||||||||||
| In billions of dollars at December 31, 2017 except carrying value in millions | Expire within 1 year | Expire after 1 year | Total amount outstanding | Carrying value (in millions of dollars) | ||||||||||||||||||||
| Financial standby letters of credit | $ | 26.0 | $ | 67.1 | $ | 93.1 | $ | 141 | $ | 27.9 | $ | 65.9 | $ | 93.8 | $ | 93 | ||||||||
| Performance guarantees | 7.5 | 3.6 | 11.1 | 19 | 7.2 | 4.1 | 11.3 | 20 | ||||||||||||||||
| Derivative instruments considered to be guarantees | 7.2 | 80.0 | 87.2 | 747 | 11.0 | 84.9 | 95.9 | 423 | ||||||||||||||||
| Loans sold with recourse | — | 0.2 | 0.2 | 12 | — | 0.2 | 0.2 | 9 | ||||||||||||||||
Securities lending indemnifications(1) | 80.3 | — | 80.3 | — | 103.7 | — | 103.7 | — | ||||||||||||||||
Credit card merchant processing(1)(2) | 86.4 | — | 86.4 | — | 85.5 | — | 85.5 | — | ||||||||||||||||
| Credit card arrangements with partners | — | 1.5 | 1.5 | 206 | 0.3 | 1.1 | 1.4 | 205 | ||||||||||||||||
| Custody indemnifications and other | — | 45.4 | 45.4 | 58 | — | 36.0 | 36.0 | 59 | ||||||||||||||||
| Total | $ | 207.4 | $ | 197.8 | $ | 405.2 | $ | 1,183 | $ | 235.6 | $ | 192.2 | $ | 427.8 | $ | 809 | ||||||||
| (1) | The carrying values of securities lending indemnifications and credit card merchant processing were not material for either period presented, as the probability of potential liabilities arising from these guarantees is minimal. |
| (2) | At March 31, |
| Maximum potential amount of future payments | Maximum potential amount of future payments | |||||||||||||||||||||||
| In billions of dollars at March 31, 2017 | Investment grade | Non-investment grade | Not rated | Total | ||||||||||||||||||||
| In billions of dollars at March 31, 2018 | Investment grade | Non-investment grade | Not rated | Total | ||||||||||||||||||||
| Financial standby letters of credit | $ | 65.9 | $ | 14.8 | $ | 13.4 | $ | 94.1 | $ | 68.1 | $ | 10.3 | $ | 15.0 | $ | 93.4 | ||||||||
| Performance guarantees | 7.2 | 2.6 | 1.5 | 11.3 | 8.2 | 2.3 | 1.1 | 11.6 | ||||||||||||||||
| Derivative instruments deemed to be guarantees | — | — | 88.8 | 88.8 | — | — | 102.6 | 102.6 | ||||||||||||||||
| Loans sold with recourse | — | — | 0.2 | 0.2 | — | — | 0.2 | 0.2 | ||||||||||||||||
| Securities lending indemnifications | — | — | 97.1 | 97.1 | — | — | 126.9 | 126.9 | ||||||||||||||||
| Credit card merchant processing | — | — | 77.6 | 77.6 | — | — | 82.5 | 82.5 | ||||||||||||||||
| Credit card arrangements with partners | — | — | 1.5 | 1.5 | — | — | 1.3 | 1.3 | ||||||||||||||||
| Custody indemnifications and other | 47.3 | 0.1 | 1.6 | 49.0 | 25.8 | 12.7 | — | 38.5 | ||||||||||||||||
| Total | $ | 120.4 | $ | 17.5 | $ | 281.7 | $ | 419.6 | $ | 102.1 | $ | 25.3 | $ | 329.6 | $ | 457.0 | ||||||||
| Maximum potential amount of future payments | Maximum potential amount of future payments | |||||||||||||||||||||||
| In billions of dollars at December 31, 2016 | Investment grade | Non-investment grade | Not rated | Total | ||||||||||||||||||||
| In billions of dollars at December 31, 2017 | Investment grade | Non-investment grade | Not rated | Total | ||||||||||||||||||||
| Financial standby letters of credit | $ | 66.8 | $ | 13.4 | $ | 12.9 | $ | 93.1 | $ | 68.1 | $ | 10.9 | $ | 14.8 | $ | 93.8 | ||||||||
| Performance guarantees | 6.3 | 4.0 | 0.8 | 11.1 | 7.9 | 2.4 | 1.0 | 11.3 | ||||||||||||||||
| Derivative instruments deemed to be guarantees | — | — | 87.2 | 87.2 | — | — | 95.9 | 95.9 | ||||||||||||||||
| Loans sold with recourse | — | — | 0.2 | 0.2 | — | — | 0.2 | 0.2 | ||||||||||||||||
| Securities lending indemnifications | — | — | 80.3 | 80.3 | — | — | 103.7 | 103.7 | ||||||||||||||||
| Credit card merchant processing | — | — | 86.4 | 86.4 | — | — | 85.5 | 85.5 | ||||||||||||||||
| Credit card arrangements with partners | — | — | 1.5 | 1.5 | — | — | 1.4 | 1.4 | ||||||||||||||||
| Custody indemnifications and other | 45.3 | 0.1 | — | 45.4 | 23.7 | 12.3 | — | 36.0 | ||||||||||||||||
| Total | $ | 118.4 | $ | 17.5 | $ | 269.3 | $ | 405.2 | $ | 99.7 | $ | 25.6 | $ | 302.5 | $ | 427.8 | ||||||||
| In millions of dollars | U.S. | Outside of U.S. | March 31, 2017 | December 31, 2016 | U.S. | Outside of U.S. | March 31, 2018 | December 31, 2017 | ||||||||||||||||
| Commercial and similar letters of credit | $ | 795 | $ | 4,790 | $ | 5,585 | $ | 5,736 | $ | 821 | $ | 4,675 | $ | 5,496 | $ | 5,000 | ||||||||
| One- to four-family residential mortgages | 1,283 | 1,698 | 2,981 | 2,838 | 1,385 | 1,610 | 2,995 | 2,674 | ||||||||||||||||
| Revolving open-end loans secured by one- to four-family residential properties | 11,900 | 1,542 | 13,442 | 13,405 | 10,703 | 1,510 | 12,213 | 12,323 | ||||||||||||||||
| Commercial real estate, construction and land development | 9,562 | 1,318 | 10,880 | 10,781 | 8,955 | 2,146 | 11,101 | 11,151 | ||||||||||||||||
| Credit card lines | 576,402 | 97,286 | 673,688 | 664,335 | 583,477 | 102,158 | 685,635 | 678,300 | ||||||||||||||||
| Commercial and other consumer loan commitments | 174,429 | 96,164 | 270,593 | 259,934 | 188,945 | 111,770 | 300,715 | 272,655 | ||||||||||||||||
| Other commitments and contingencies | 3,723 | 9,290 | 13,013 | 11,267 | 2,145 | 716 | 2,861 | 3,071 | ||||||||||||||||
| Total | $ | 778,094 | $ | 212,088 | $ | 990,182 | $ | 968,296 | $ | 796,431 | $ | 224,585 | $ | 1,021,016 | $ | 985,174 | ||||||||
| Three months ended March 31, 2017 | Three Months Ended March 31, 2018 | |||||||||||||||||||||||||||||||||||||||
| In millions of dollars | Citigroup parent company | CGMHI | Other Citigroup subsidiaries and eliminations | Consolidating adjustments | Citigroup consolidated | Citigroup parent company | CGMHI | Other Citigroup subsidiaries and eliminations | Consolidating adjustments | Citigroup consolidated | ||||||||||||||||||||||||||||||
| Revenues | ||||||||||||||||||||||||||||||||||||||||
| Dividends from subsidiaries | $ | 3,750 | $ | — | $ | — | $ | (3,750 | ) | $ | — | $ | 5,585 | $ | — | $ | — | $ | (5,585 | ) | $ | — | ||||||||||||||||||
| Interest revenue | 1 | 1,027 | 13,395 | — | 14,423 | 52 | 1,655 | 14,625 | — | 16,332 | ||||||||||||||||||||||||||||||
| Interest revenue—intercompany | 793 | 157 | (950 | ) | — | — | 1,130 | 383 | (1,513 | ) | — | — | ||||||||||||||||||||||||||||
| Interest expense | 1,218 | 396 | 1,952 | — | 3,566 | 910 | 1,013 | 3,237 | — | 5,160 | ||||||||||||||||||||||||||||||
| Interest expense—intercompany | 90 | 426 | (516 | ) | — | — | 587 | 772 | (1,359 | ) | — | — | ||||||||||||||||||||||||||||
| Net interest revenue | $ | (514 | ) | $ | 362 | $ | 11,009 | $ | — | $ | 10,857 | $ | (315 | ) | $ | 253 | $ | 11,234 | $ | — | $ | 11,172 | ||||||||||||||||||
| Commissions and fees | $ | — | $ | 1,255 | $ | 1,504 | $ | — | $ | 2,759 | $ | — | $ | 1,252 | $ | 1,778 | $ | — | $ | 3,030 | ||||||||||||||||||||
| Commissions and fees—intercompany | — | 2 | (2 | ) | — | — | — | — | — | — | — | |||||||||||||||||||||||||||||
| Principal transactions | (163 | ) | 1,606 | 1,579 | — | 3,022 | 1,031 | 921 | 1,337 | — | 3,289 | |||||||||||||||||||||||||||||
| Principal transactions—intercompany | 204 | (682 | ) | 478 | — | — | (386 | ) | 192 | 194 | — | — | ||||||||||||||||||||||||||||
| Other income | (39 | ) | 74 | 1,447 | — | 1,482 | (928 | ) | 153 | 2,156 | — | 1,381 | ||||||||||||||||||||||||||||
| Other income—intercompany | (123 | ) | 34 | 89 | — | — | 55 | 50 | (105 | ) | — | — | ||||||||||||||||||||||||||||
| Total non-interest revenues | $ | (121 | ) | $ | 2,289 | $ | 5,095 | $ | — | $ | 7,263 | $ | (228 | ) | $ | 2,568 | $ | 5,360 | $ | — | $ | 7,700 | ||||||||||||||||||
| Total revenues, net of interest expense | $ | 3,115 | $ | 2,651 | $ | 16,104 | $ | (3,750 | ) | $ | 18,120 | $ | 5,042 | $ | 2,821 | $ | 16,594 | $ | (5,585 | ) | $ | 18,872 | ||||||||||||||||||
| Provisions for credit losses and for benefits and claims | $ | — | $ | — | $ | 1,662 | $ | — | $ | 1,662 | $ | — | $ | — | $ | 1,857 | $ | — | $ | 1,857 | ||||||||||||||||||||
| Operating expenses | ||||||||||||||||||||||||||||||||||||||||
| Compensation and benefits | $ | (14 | ) | $ | 1,262 | $ | 4,286 | $ | — | $ | 5,534 | $ | 134 | $ | 1,265 | $ | 4,408 | $ | — | $ | 5,807 | |||||||||||||||||||
| Compensation and benefits—intercompany | 31 | — | (31 | ) | — | — | 34 | — | (34 | ) | — | — | ||||||||||||||||||||||||||||
| Other operating | 28 | 406 | 4,509 | — | 4,943 | 44 | 548 | 4,526 | — | 5,118 | ||||||||||||||||||||||||||||||
| Other operating—intercompany | (59 | ) | 468 | (409 | ) | — | — | 12 | 578 | (590 | ) | — | — | |||||||||||||||||||||||||||
| Total operating expenses | $ | (14 | ) | $ | 2,136 | $ | 8,355 | $ | — | $ | 10,477 | $ | 224 | $ | 2,391 | $ | 8,310 | $ | — | $ | 10,925 | |||||||||||||||||||
| Equity in undistributed income of subsidiaries | 587 | — | — | (587 | ) | — | $ | (445 | ) | $ | — | $ | — | $ | 445 | $ | — | |||||||||||||||||||||||
| Income (loss) from continuing operations before income taxes | $ | 3,716 | $ | 515 | $ | 6,087 | $ | (4,337 | ) | $ | 5,981 | $ | 4,373 | $ | 430 | $ | 6,427 | $ | (5,140 | ) | $ | 6,090 | ||||||||||||||||||
| Provision (benefit) for income taxes | (374 | ) | 215 | 2,022 | — | 1,863 | (247 | ) | 65 | 1,623 | — | 1,441 | ||||||||||||||||||||||||||||
| Income (loss) from continuing operations | $ | 4,090 | $ | 300 | $ | 4,065 | $ | (4,337 | ) | $ | 4,118 | $ | 4,620 | $ | 365 | $ | 4,804 | $ | (5,140 | ) | $ | 4,649 | ||||||||||||||||||
| Loss from discontinued operations, net of taxes | — | — | (18 | ) | — | (18 | ) | — | — | (7 | ) | — | (7 | ) | ||||||||||||||||||||||||||
| Net income (loss) before attribution of noncontrolling interests | $ | 4,090 | $ | 300 | $ | 4,047 | $ | (4,337 | ) | $ | 4,100 | |||||||||||||||||||||||||||||
| Net income before attribution of noncontrolling interests | $ | 4,620 | $ | 365 | $ | 4,797 | $ | (5,140 | ) | $ | 4,642 | |||||||||||||||||||||||||||||
| Noncontrolling interests | — | — | 10 | — | 10 | — | — | 22 | — | 22 | ||||||||||||||||||||||||||||||
| Net income (loss) | $ | 4,090 | $ | 300 | $ | 4,037 | $ | (4,337 | ) | $ | 4,090 | $ | 4,620 | $ | 365 | $ | 4,775 | $ | (5,140 | ) | $ | 4,620 | ||||||||||||||||||
| Comprehensive income | ||||||||||||||||||||||||||||||||||||||||
| Add: Other comprehensive income (loss) | 1,464 | (20 | ) | (3,721 | ) | 3,741 | 1,464 | $ | 52 | $ | 82 | $ | (3,156 | ) | $ | 3,074 | $ | 52 | ||||||||||||||||||||||
| Total Citigroup comprehensive income (loss) | $ | 5,554 | $ | 280 | $ | 316 | $ | (596 | ) | $ | 5,554 | $ | 4,672 | $ | 447 | $ | 1,619 | $ | (2,066 | ) | $ | 4,672 | ||||||||||||||||||
| Add: Other comprehensive income attributable to noncontrolling interests | — | — | — | — | 31 | — | 31 | $ | — | $ | — | $ | 14 | $ | — | $ | 14 | |||||||||||||||||||||||
| Add: Net income attributable to noncontrolling interests | — | — | — | — | 10 | — | 10 | — | — | 22 | — | 22 | ||||||||||||||||||||||||||||
| Total comprehensive income (loss) | $ | 5,554 | $ | 280 | $ | 357 | $ | (596 | ) | $ | 5,595 | $ | 4,672 | $ | 447 | $ | 1,655 | $ | (2,066 | ) | $ | 4,708 | ||||||||||||||||||
| Three months ended March 31, 2016 | Three Months Ended March 31, 2017 | ||||||||||||||||||||||||||||||||||||||||
| In millions of dollars | Citigroup parent company | CGMHI | Other Citigroup subsidiaries and eliminations | Consolidating adjustments | Citigroup consolidated | Citigroup parent company | CGMHI | Other Citigroup subsidiaries and eliminations | Consolidating adjustments | Citigroup consolidated | |||||||||||||||||||||||||||||||
| Revenues | |||||||||||||||||||||||||||||||||||||||||
| Dividends from subsidiaries | $ | 2,800 | $ | — | $ | — | $ | (2,800 | ) | $ | — | $ | 3,750 | $ | — | $ | — | $ | (3,750 | ) | $ | — | |||||||||||||||||||
| Interest revenue | 2 | 1,146 | 13,019 | — | 14,167 | 1 | 1,027 | 13,493 | — | 14,521 | |||||||||||||||||||||||||||||||
| Interest revenue—intercompany | 872 | 136 | (1,008 | ) | — | — | 793 | 157 | (950 | ) | — | — | |||||||||||||||||||||||||||||
| Interest expense | 1,070 | 364 | 1,506 | — | 2,940 | 1,218 | 393 | 1,955 | — | 3,566 | |||||||||||||||||||||||||||||||
| Interest expense—intercompany | 41 | 429 | (470 | ) | — | — | 90 | 428 | (518 | ) | — | — | |||||||||||||||||||||||||||||
| Net interest revenue | $ | (237 | ) | $ | 489 | $ | 10,975 | $ | — | $ | 11,227 | $ | (514 | ) | $ | 363 | $ | 11,106 | $ | — | $ | 10,955 | |||||||||||||||||||
| Commissions and fees | $ | — | $ | 960 | $ | 1,503 | $ | — | $ | 2,463 | $ | — | $ | 1,323 | $ | 1,732 | $ | — | $ | 3,055 | |||||||||||||||||||||
| Commissions and fees—intercompany | (2 | ) | (6 | ) | 8 | — | — | — | 2 | (2 | ) | — | — | ||||||||||||||||||||||||||||
| Principal transactions | (209 | ) | (137 | ) | 2,186 | — | 1,840 | (163 | ) | 1,658 | 1,599 | — | 3,094 | ||||||||||||||||||||||||||||
| Principal transactions—intercompany | 258 | 748 | (1,006 | ) | — | — | 204 | (695 | ) | 491 | — | — | |||||||||||||||||||||||||||||
| Other income | (3,094 | ) | 76 | 5,043 | — | 2,025 | (39 | ) | 65 | 1,236 | — | 1,262 | |||||||||||||||||||||||||||||
| Other income—intercompany | 3,260 | (140 | ) | (3,120 | ) | — | — | (123 | ) | 110 | 13 | — | — | ||||||||||||||||||||||||||||
| Total non-interest revenues | $ | 213 | $ | 1,501 | $ | 4,614 | $ | — | $ | 6,328 | $ | (121 | ) | $ | 2,463 | $ | 5,069 | $ | — | $ | — | $ | 7,411 | ||||||||||||||||||
| Total revenues, net of interest expense | $ | 2,776 | $ | 1,990 | $ | 15,589 | $ | (2,800 | ) | $ | 17,555 | $ | 3,115 | $ | 2,826 | $ | 16,175 | $ | (3,750 | ) | $ | 18,366 | |||||||||||||||||||
| Provisions for credit losses and for benefits and claims | $ | — | $ | — | $ | 2,045 | $ | — | $ | 2,045 | $ | — | $ | — | $ | 1,662 | $ | — | $ | 1,662 | |||||||||||||||||||||
| Operating expenses | |||||||||||||||||||||||||||||||||||||||||
| Compensation and benefits | $ | 8 | $ | 1,289 | $ | 4,259 | $ | — | $ | 5,556 | $ | (14 | ) | $ | 1,262 | $ | 4,286 | $ | — | $ | 5,534 | ||||||||||||||||||||
| Compensation and benefits—intercompany | 3 | — | (3 | ) | — | — | 31 | — | (31 | ) | — | — | |||||||||||||||||||||||||||||
| Other operating | 267 | 386 | 4,314 | — | 4,967 | 28 | 509 | 4,652 | — | 5,189 | |||||||||||||||||||||||||||||||
| Other operating—intercompany | 1 | 307 | (308 | ) | — | — | (59 | ) | 540 | (481 | ) | — | — | ||||||||||||||||||||||||||||
| Total operating expenses | $ | 279 | $ | 1,982 | $ | 8,262 | $ | — | $ | 10,523 | $ | (14 | ) | $ | 2,311 | $ | 8,426 | $ | — | $ | 10,723 | ||||||||||||||||||||
| Equity in undistributed income of subsidiaries | 944 | — | — | (944 | ) | — | $ | 587 | $ | — | $ | — | $ | (587 | ) | $ | — | ||||||||||||||||||||||||
| Income (loss) from continuing operations before income taxes | $ | 3,441 | $ | 8 | $ | 5,282 | $ | (3,744 | ) | $ | 4,987 | $ | 3,716 | $ | 515 | $ | 6,087 | $ | (4,337 | ) | $ | 5,981 | |||||||||||||||||||
| Provision (benefit) for income taxes | (60 | ) | 37 | 1,502 | — | 1,479 | (374 | ) | 215 | 2,022 | — | 1,863 | |||||||||||||||||||||||||||||
| Income (loss) from continuing operations | $ | 3,501 | $ | (29 | ) | $ | 3,780 | $ | (3,744 | ) | $ | 3,508 | $ | 4,090 | $ | 300 | $ | 4,065 | $ | (4,337 | ) | $ | 4,118 | ||||||||||||||||||
| Income from discontinued operations, net of taxes | — | — | (2 | ) | — | (2 | ) | ||||||||||||||||||||||||||||||||||
| Loss from discontinued operations, net of taxes | — | — | (18 | ) | — | (18 | ) | ||||||||||||||||||||||||||||||||||
| Net income (loss) before attribution of noncontrolling interests | $ | 3,501 | $ | (29 | ) | $ | 3,778 | $ | (3,744 | ) | $ | 3,506 | $ | 4,090 | $ | 300 | $ | 4,047 | $ | (4,337 | ) | $ | 4,100 | ||||||||||||||||||
| Noncontrolling interests | — | 2 | 3 | — | 5 | — | — | 10 | — | 10 | |||||||||||||||||||||||||||||||
| Net income (loss) | $ | 3,501 | $ | (31 | ) | $ | 3,775 | $ | (3,744 | ) | $ | 3,501 | $ | 4,090 | $ | 300 | $ | 4,037 | $ | (4,337 | ) | $ | 4,090 | ||||||||||||||||||
| Comprehensive income | |||||||||||||||||||||||||||||||||||||||||
| Add: Other comprehensive income (loss) | $ | 2,733 | $ | 47 | $ | (534 | ) | $ | 487 | $ | 2,733 | $ | 1,464 | $ | (20 | ) | $ | (3,721 | ) | $ | 3,741 | $ | 1,464 | ||||||||||||||||||
| Total Citigroup comprehensive income (loss) | $ | 6,234 | $ | 16 | $ | 3,241 | $ | (3,257 | ) | $ | 6,234 | $ | 5,554 | $ | 280 | $ | 316 | $ | (596 | ) | $ | 5,554 | |||||||||||||||||||
| Add: Other comprehensive income attributable to noncontrolling interests | — | — | 27 | — | 27 | $ | — | $ | — | — | $ | 31 | $ | — | $ | 31 | |||||||||||||||||||||||||
| Add: Net income attributable to noncontrolling interests | — | 2 | 3 | — | 5 | — | — | — | 10 | — | 10 | ||||||||||||||||||||||||||||||
| Total comprehensive income (loss) | $ | 6,234 | $ | 18 | $ | 3,271 | $ | (3,257 | ) | $ | 6,266 | $ | 5,554 | $ | 280 | $ | 357 | $ | (596 | ) | $ | 5,595 | |||||||||||||||||||
| March 31, 2017 | March 31, 2018 | |||||||||||||||||||||||||||||||||||||
| In millions of dollars | Citigroup parent company | CGMHI | Other Citigroup subsidiaries and eliminations | Consolidating adjustments | Citigroup consolidated | Citigroup parent company | CGMHI | Other Citigroup subsidiaries and eliminations | Consolidating adjustments | Citigroup consolidated | ||||||||||||||||||||||||||||
| Assets | ||||||||||||||||||||||||||||||||||||||
| Cash and due from banks | $ | — | $ | 480 | $ | 21,792 | $ | — | $ | 22,272 | $ | 2 | $ | 423 | $ | 21,425 | $ | — | $ | 21,850 | ||||||||||||||||||
| Cash and due from banks—intercompany | 352 | 3,167 | (3,519 | ) | — | — | 14 | 5,225 | (5,239 | ) | — | — | ||||||||||||||||||||||||||
| Deposits with banks | — | 3,005 | 177,849 | — | 180,854 | |||||||||||||||||||||||||||||||||
| Deposits with banks - intercompany | 3,000 | 5,492 | (8,492 | ) | — | — | ||||||||||||||||||||||||||||||||
| Federal funds sold and resale agreements | — | 196,387 | 46,542 | — | 242,929 | — | 206,659 | 51,228 | — | 257,887 | ||||||||||||||||||||||||||||
| Federal funds sold and resale agreements—intercompany | — | 14,742 | (14,742 | ) | — | — | — | 14,284 | (14,284 | ) | — | — | ||||||||||||||||||||||||||
| Trading account assets | 1 | 128,414 | 116,488 | — | 244,903 | 298 | 150,249 | 118,261 | — | 268,808 | ||||||||||||||||||||||||||||
| Trading account assets—intercompany | 991 | 3,173 | (4,164 | ) | — | — | 483 | 2,079 | (2,562 | ) | — | — | ||||||||||||||||||||||||||
| Investments | 43 | 217 | 345,573 | — | 345,833 | 7,755 | 249 | 343,967 | — | 351,971 | ||||||||||||||||||||||||||||
| Loans, net of unearned income | — | 1,269 | 627,326 | — | 628,595 | — | 875 | 672,063 | — | 672,938 | ||||||||||||||||||||||||||||
| Loans, net of unearned income—intercompany | — | — | — | — | — | — | — | — | — | — | ||||||||||||||||||||||||||||
| Allowance for loan losses | — | — | (12,030 | ) | — | (12,030 | ) | — | — | (12,354 | ) | — | (12,354 | ) | ||||||||||||||||||||||||
| Total loans, net | $ | — | $ | 1,269 | $ | 615,296 | $ | — | $ | 616,565 | $ | — | $ | 875 | $ | 659,709 | $ | — | $ | 660,584 | ||||||||||||||||||
| Advances to subsidiaries | $ | 143,808 | $ | — | $ | (143,808 | ) | $ | — | $ | — | $ | 141,977 | $ | — | $ | (141,977 | ) | $ | — | $ | — | ||||||||||||||||
| Investments in subsidiaries | 228,432 | — | — | (228,432 | ) | — | 209,808 | — | — | (209,808 | ) | — | ||||||||||||||||||||||||||
Other assets (1) | 23,924 | 51,968 | 273,241 | — | 349,133 | 10,784 | 66,723 | 102,643 | — | 180,150 | ||||||||||||||||||||||||||||
| Other assets—intercompany | 8,229 | 58,770 | (66,999 | ) | — | — | 3,667 | 47,051 | (50,718 | ) | — | — | ||||||||||||||||||||||||||
| Total assets | $ | 405,780 | $ | 458,587 | $ | 1,185,700 | $ | (228,432 | ) | $ | 1,821,635 | $ | 377,788 | $ | 502,314 | $ | 1,251,810 | $ | (209,808 | ) | $ | 1,922,104 | ||||||||||||||||
| Liabilities and equity | ||||||||||||||||||||||||||||||||||||||
| Deposits | $ | — | $ | — | $ | 949,990 | $ | — | $ | 949,990 | $ | — | $ | — | $ | 1,001,219 | $ | — | $ | 1,001,219 | ||||||||||||||||||
| Deposits—intercompany | — | — | — | — | — | — | — | — | — | — | ||||||||||||||||||||||||||||
| Federal funds purchased and securities loaned or sold | — | 128,196 | 20,034 | — | 148,230 | — | 144,400 | 27,359 | — | 171,759 | ||||||||||||||||||||||||||||
| Federal funds purchased and securities loaned or sold—intercompany | — | 20,807 | (20,807 | ) | — | — | — | 20,444 | (20,444 | ) | — | — | ||||||||||||||||||||||||||
| Trading account liabilities | 7 | 94,791 | 49,272 | — | 144,070 | 2 | 98,287 | 45,672 | — | 143,961 | ||||||||||||||||||||||||||||
| Trading account liabilities—intercompany | 819 | 2,834 | (3,653 | ) | — | — | 241 | 1,904 | (2,145 | ) | — | — | ||||||||||||||||||||||||||
| Short-term borrowings | — | 1,961 | 24,166 | — | 26,127 | 235 | 3,159 | 32,700 | — | 36,094 | ||||||||||||||||||||||||||||
| Short-term borrowings—intercompany | — | 65,562 | (65,562 | ) | — | — | — | 41,097 | (41,097 | ) | — | — | ||||||||||||||||||||||||||
| Long-term debt | 141,626 | 15,017 | 51,887 | — | 208,530 | 153,074 | 19,907 | 64,957 | — | 237,938 | ||||||||||||||||||||||||||||
| Long-term debt—intercompany | — | 28,781 | (28,781 | ) | — | — | — | 60,351 | (60,351 | ) | — | — | ||||||||||||||||||||||||||
| Advances from subsidiaries | 26,357 | — | (26,357 | ) | — | — | 19,151 | — | (19,151 | ) | — | — | ||||||||||||||||||||||||||
| Other liabilities | 3,346 | 66,324 | 45,865 | — | 115,535 | 2,832 | 69,516 | 55,919 | — | 128,267 | ||||||||||||||||||||||||||||
| Other liabilities—intercompany | 5,493 | 1,263 | (6,756 | ) | — | — | 338 | 10,336 | (10,674 | ) | — | — | ||||||||||||||||||||||||||
| Stockholders’ equity | 228,132 | 33,051 | 196,402 | (228,432 | ) | 229,153 | 201,915 | 32,913 | 177,846 | (209,808 | ) | 202,866 | ||||||||||||||||||||||||||
| Total liabilities and equity | $ | 405,780 | $ | 458,587 | $ | 1,185,700 | $ | (228,432 | ) | $ | 1,821,635 | $ | 377,788 | $ | 502,314 | $ | 1,251,810 | $ | (209,808 | ) | $ | 1,922,104 | ||||||||||||||||
| (1) | Other assets for Citigroup parent company at March 31, |
| December 31, 2016 | December 31, 2017 | |||||||||||||||||||||||||||||||||||||
| In millions of dollars | Citigroup parent company | CGMHI | Other Citigroup subsidiaries and eliminations | Consolidating adjustments | Citigroup consolidated | Citigroup parent company | CGMHI | Other Citigroup subsidiaries and eliminations | Consolidating adjustments | Citigroup consolidated | ||||||||||||||||||||||||||||
| Assets | ||||||||||||||||||||||||||||||||||||||
| Cash and due from banks | $ | — | $ | 870 | $ | 22,173 | $ | — | $ | 23,043 | $ | — | $ | 378 | $ | 23,397 | $ | — | $ | 23,775 | ||||||||||||||||||
| Cash and due from banks—intercompany | 142 | 3,820 | (3,962 | ) | — | — | 13 | 3,750 | (3,763 | ) | — | — | ||||||||||||||||||||||||||
| Deposits with banks | — | 3,348 | 153,393 | — | 156,741 | |||||||||||||||||||||||||||||||||
| Deposits with banks - intercompany | 11,000 | 5,219 | (16,219 | ) | — | — | ||||||||||||||||||||||||||||||||
| Federal funds sold and resale agreements | — | 196,236 | 40,577 | — | 236,813 | — | 182,685 | 49,793 | — | 232,478 | ||||||||||||||||||||||||||||
| Federal funds sold and resale agreements—intercompany | — | 12,270 | (12,270 | ) | — | — | — | 16,091 | (16,091 | ) | — | — | ||||||||||||||||||||||||||
| Trading account assets | 6 | 121,484 | 122,435 | — | 243,925 | — | 139,462 | 113,328 | — | 252,790 | ||||||||||||||||||||||||||||
| Trading account assets—intercompany | 1,173 | 907 | (2,080 | ) | — | — | 38 | 2,711 | (2,749 | ) | — | — | ||||||||||||||||||||||||||
| Investments | 173 | 335 | 352,796 | — | 353,304 | 27 | 181 | 352,082 | — | 352,290 | ||||||||||||||||||||||||||||
| Loans, net of unearned income | — | 575 | 623,794 | — | 624,369 | — | 900 | 666,134 | — | 667,034 | ||||||||||||||||||||||||||||
| Loans, net of unearned income—intercompany | — | — | — | — | — | — | — | — | — | — | ||||||||||||||||||||||||||||
| Allowance for loan losses | — | — | (12,060 | ) | — | (12,060 | ) | — | — | (12,355 | ) | — | (12,355 | ) | ||||||||||||||||||||||||
| Total loans, net | $ | — | $ | 575 | $ | 611,734 | $ | — | $ | 612,309 | $ | — | $ | 900 | $ | 653,779 | $ | — | $ | 654,679 | ||||||||||||||||||
| Advances to subsidiaries | $ | 143,154 | $ | — | $ | (143,154 | ) | $ | — | $ | — | $ | 139,722 | $ | — | $ | (139,722 | ) | $ | — | $ | — | ||||||||||||||||
| Investments in subsidiaries | 226,279 | — | — | (226,279 | ) | — | 210,537 | — | — | (210,537 | ) | — | ||||||||||||||||||||||||||
Other assets(1) | 23,734 | 46,095 | 252,854 | — | 322,683 | 10,844 | 58,299 | 100,569 | — | 169,712 | ||||||||||||||||||||||||||||
| Other assets—intercompany | 27,845 | 38,207 | (66,052 | ) | — | — | 3,428 | 43,613 | (47,041 | ) | — | — | ||||||||||||||||||||||||||
| Total assets | $ | 422,506 | $ | 420,799 | $ | 1,175,051 | $ | (226,279 | ) | $ | 1,792,077 | $ | 375,609 | $ | 456,637 | $ | 1,220,756 | $ | (210,537 | ) | $ | 1,842,465 | ||||||||||||||||
| Liabilities and equity | ||||||||||||||||||||||||||||||||||||||
| Deposits | $ | — | $ | — | $ | 929,406 | $ | — | $ | 929,406 | $ | — | $ | — | $ | 959,822 | $ | — | $ | 959,822 | ||||||||||||||||||
| Deposits—intercompany | — | — | — | — | — | — | — | — | — | — | ||||||||||||||||||||||||||||
| Federal funds purchased and securities loaned or sold | — | 122,320 | 19,501 | — | 141,821 | — | 134,888 | 21,389 | — | 156,277 | ||||||||||||||||||||||||||||
| Federal funds purchased and securities loaned or sold—intercompany | — | 25,417 | (25,417 | ) | — | — | — | 18,597 | (18,597 | ) | — | — | ||||||||||||||||||||||||||
| Trading account liabilities | — | 87,714 | 51,331 | — | 139,045 | — | 80,801 | 44,369 | — | 125,170 | ||||||||||||||||||||||||||||
| Trading account liabilities—intercompany | 1,006 | 868 | (1,874 | ) | — | — | 15 | 2,182 | (2,197 | ) | — | — | ||||||||||||||||||||||||||
| Short-term borrowings | — | 1,356 | 29,345 | — | 30,701 | 251 | 3,568 | 40,633 | — | 44,452 | ||||||||||||||||||||||||||||
| Short-term borrowings—intercompany | — | 35,596 | (35,596 | ) | — | — | — | 32,871 | (32,871 | ) | — | — | ||||||||||||||||||||||||||
| Long-term debt | 147,333 | 8,128 | 50,717 | — | 206,178 | 152,163 | 18,048 | 66,498 | — | 236,709 | ||||||||||||||||||||||||||||
| Long-term debt—intercompany | — | 41,287 | (41,287 | ) | — | — | — | 60,765 | (60,765 | ) | — | — | ||||||||||||||||||||||||||
| Advances from subsidiaries | 41,258 | — | (41,258 | ) | — | — | 19,136 | — | (19,136 | ) | — | — | ||||||||||||||||||||||||||
| Other liabilities | 3,466 | 57,430 | 57,887 | — | 118,783 | 2,673 | 62,113 | 53,577 | — | 118,363 | ||||||||||||||||||||||||||||
| Other liabilities—intercompany | 4,323 | 7,894 | (12,217 | ) | — | — | 631 | 9,753 | (10,384 | ) | — | — | ||||||||||||||||||||||||||
| Stockholders’ equity | 225,120 | 32,789 | 194,513 | (226,279 | ) | 226,143 | 200,740 | 33,051 | 178,418 | (210,537 | ) | 201,672 | ||||||||||||||||||||||||||
| Total liabilities and equity | $ | 422,506 | $ | 420,799 | $ | 1,175,051 | $ | (226,279 | ) | $ | 1,792,077 | $ | 375,609 | $ | 456,637 | $ | 1,220,756 | $ | (210,537 | ) | $ | 1,842,465 | ||||||||||||||||
| (1) | Other assets for Citigroup parent company at December 31, |
| Three months ended March 31, 2017 | Three Months Ended March 31, 2018 | |||||||||||||||||||||||||||||||||||||
| In millions of dollars | Citigroup parent company | CGMHI | Other Citigroup subsidiaries and eliminations | Consolidating adjustments | Citigroup consolidated | Citigroup parent company | CGMHI | Other Citigroup subsidiaries and eliminations | Consolidating adjustments | Citigroup consolidated | ||||||||||||||||||||||||||||
| Net cash provided by (used in) operating activities of continuing operations | $ | 24,958 | $ | (3,405 | ) | $ | (24,559 | ) | $ | — | $ | (3,006 | ) | $ | 5,268 | $ | 7,046 | $ | (5,358 | ) | $ | — | $ | 6,956 | ||||||||||||||
| Cash flows from investing activities of continuing operations | ||||||||||||||||||||||||||||||||||||||
| Purchases of investments | $ | — | $ | — | $ | (41,584 | ) | $ | — | $ | (41,584 | ) | $ | (7,955 | ) | $ | — | $ | (33,075 | ) | $ | — | $ | (41,030 | ) | |||||||||||||
| Proceeds from sales of investments | 116 | — | 29,340 | — | 29,456 | — | — | 20,688 | — | 20,688 | ||||||||||||||||||||||||||||
| Proceeds from maturities of investments | — | — | 24,006 | — | 24,006 | — | — | 21,509 | — | 21,509 | ||||||||||||||||||||||||||||
| Change in deposits with banks | — | 6,514 | (26,836 | ) | — | (20,322 | ) | |||||||||||||||||||||||||||||||
| Change in loans | — | — | (7,953 | ) | — | (7,953 | ) | — | — | (8,717 | ) | — | (8,717 | ) | ||||||||||||||||||||||||
| Proceeds from sales and securitizations of loans | — | — | 3,191 | — | 3,191 | — | — | 1,654 | — | 1,654 | ||||||||||||||||||||||||||||
| Proceeds from significant disposals | — | — | 2,732 | — | 2,732 | |||||||||||||||||||||||||||||||||
| Change in federal funds sold and resales | — | (2,623 | ) | (3,493 | ) | — | (6,116 | ) | — | (22,167 | ) | (3,242 | ) | — | (25,409 | ) | ||||||||||||||||||||||
| Changes in investments and advances—intercompany | (569 | ) | (5,007 | ) | 5,576 | — | — | (1,463 | ) | (3,603 | ) | 5,066 | — | — | ||||||||||||||||||||||||
| Other investing activities | — | — | (653 | ) | — | (653 | ) | (729 | ) | (9 | ) | (81 | ) | — | (819 | ) | ||||||||||||||||||||||
| Net cash used in investing activities of continuing operations | $ | (453 | ) | $ | (1,116 | ) | $ | (15,674 | ) | $ | — | $ | (17,243 | ) | ||||||||||||||||||||||||
| Net cash provided by (used in) investing activities of continuing operations | $ | (10,147 | ) | $ | (25,779 | ) | $ | 3,802 | $ | — | $ | (32,124 | ) | |||||||||||||||||||||||||
| Cash flows from financing activities of continuing operations | ||||||||||||||||||||||||||||||||||||||
| Dividends paid | $ | (744 | ) | $ | — | $ | — | $ | — | $ | (744 | ) | $ | (1,095 | ) | $ | — | $ | — | $ | — | $ | (1,095 | ) | ||||||||||||||
| Redemption of preferred stock | (97 | ) | — | — | — | (97 | ) | |||||||||||||||||||||||||||||||
| Treasury stock acquired | (1,858 | ) | — | — | — | (1,858 | ) | (2,378 | ) | — | — | — | (2,378 | ) | ||||||||||||||||||||||||
| Proceeds (repayments) from issuance of long-term debt, net | (6,395 | ) | 5,175 | 938 | — | (282 | ) | |||||||||||||||||||||||||||||||
| Proceeds from issuance of long-term debt, net | 699 | 2,004 | 184 | — | 2,887 | |||||||||||||||||||||||||||||||||
| Proceeds (repayments) from issuance of long-term debt—intercompany, net | — | (12,506 | ) | 12,506 | — | — | — | (412 | ) | 412 | — | — | ||||||||||||||||||||||||||
| Change in deposits | — | — | 20,584 | — | 20,584 | — | — | 41,397 | — | 41,397 | ||||||||||||||||||||||||||||
| Change in federal funds purchased and repos | — | 1,266 | 5,143 | — | 6,409 | — | 11,359 | 4,123 | — | 15,482 | ||||||||||||||||||||||||||||
| Change in short-term borrowings | — | 605 | (5,179 | ) | — | (4,574 | ) | — | (409 | ) | (7,949 | ) | — | (8,358 | ) | |||||||||||||||||||||||
| Net change in short-term borrowings and other advances—intercompany | (14,901 | ) | 8,938 | 5,963 | — | — | 14 | 8,226 | (8,240 | ) | — | — | ||||||||||||||||||||||||||
| Capital contributions from (to) parent | — | (585 | ) | 585 | — | — | ||||||||||||||||||||||||||||||||
| Other financing activities | (397 | ) | — | — | — | (397 | ) | (261 | ) | — | (214 | ) | — | (475 | ) | |||||||||||||||||||||||
| Net cash provided by (used in) financing activities of continuing operations | $ | (24,295 | ) | $ | 3,478 | $ | 39,955 | $ | — | $ | 19,138 | $ | (3,118 | ) | $ | 20,183 | $ | 30,298 | $ | — | $ | 47,363 | ||||||||||||||||
| Effect of exchange rate changes on cash and due from banks | $ | — | $ | — | $ | 340 | $ | — | $ | 340 | $ | — | $ | — | $ | (7 | ) | $ | — | $ | (7 | ) | ||||||||||||||||
| Change in cash and due from banks | $ | 210 | $ | (1,043 | ) | $ | 62 | $ | — | $ | (771 | ) | ||||||||||||||||||||||||||
| Cash and due from banks at beginning of period | 142 | 4,690 | 18,211 | — | 23,043 | |||||||||||||||||||||||||||||||||
| Cash and due from banks at end of period | $ | 352 | $ | 3,647 | $ | 18,273 | $ | — | $ | 22,272 | ||||||||||||||||||||||||||||
Change in cash, due from banks and deposits with banks | $ | (7,997 | ) | $ | 1,450 | $ | 28,735 | $ | — | $ | 22,188 | |||||||||||||||||||||||||||
| Cash, due from banks and deposits with banks at beginning of period | 11,013 | 12,695 | 156,808 | — | 180,516 | |||||||||||||||||||||||||||||||||
| Cash, due from banks and deposits with banks at end of period | $ | 3,016 | $ | 14,145 | $ | 185,543 | $ | — | $ | 202,704 | ||||||||||||||||||||||||||||
| Cash and due from banks | $ | 16 | $ | 5,648 | $ | 16,186 | $ | — | $ | 21,850 | ||||||||||||||||||||||||||||
| Deposits with banks | 3,000 | 8,497 | 169,357 | — | 180,854 | |||||||||||||||||||||||||||||||||
| Cash, due from banks and deposits with banks at end of period | $ | 3,016 | $ | 14,145 | $ | 185,543 | $ | — | $ | 202,704 | ||||||||||||||||||||||||||||
| Supplemental disclosure of cash flow information for continuing operations | ||||||||||||||||||||||||||||||||||||||
| Cash paid (refund) during the year for income taxes | $ | (139 | ) | $ | 64 | $ | 988 | $ | — | $ | 913 | |||||||||||||||||||||||||||
| Cash paid (received) during the year for income taxes | $ | (266 | ) | $ | 29 | $ | 975 | $ | — | $ | 738 | |||||||||||||||||||||||||||
| Cash paid during the year for interest | 1,153 | 822 | 1,275 | — | 3,250 | 883 | 1,627 | 2,076 | — | 4,586 | ||||||||||||||||||||||||||||
| Non-cash investing activities | ||||||||||||||||||||||||||||||||||||||
| Transfers to loans HFS from loans | — | — | 2,800 | — | 2,800 | $ | — | $ | — | $ | 900 | $ | — | $ | 900 | |||||||||||||||||||||||
| Transfers to OREO and other repossessed assets | — | — | 30 | — | 30 | — | — | 26 | — | 26 | ||||||||||||||||||||||||||||
| Three months ended March 31, 2016 | Three Months Ended March 31, 2017 | |||||||||||||||||||||||||||||||||||||
| In millions of dollars | Citigroup parent company | CGMHI | Other Citigroup subsidiaries and eliminations | Consolidating adjustments | Citigroup consolidated | Citigroup parent company | CGMHI | Other Citigroup subsidiaries and eliminations | Consolidating adjustments | Citigroup consolidated | ||||||||||||||||||||||||||||
| Net cash provided by (used in) operating activities of continuing operations | $ | 5,194 | $ | (2,833 | ) | $ | (2,899 | ) | $ | — | $ | (538 | ) | $ | (652 | ) | $ | (3,404 | ) | $ | 1,004 | $ | — | $ | (3,052 | ) | ||||||||||||
| Cash flows from investing activities of continuing operations | ||||||||||||||||||||||||||||||||||||||
| Purchases of investments | $ | — | $ | — | $ | (59,715 | ) | $ | — | $ | (59,715 | ) | $ | — | $ | — | $ | (41,584 | ) | $ | — | $ | (41,584 | ) | ||||||||||||||
| Proceeds from sales of investments | — | — | 39,268 | — | 39,268 | 116 | — | 29,340 | — | 29,456 | ||||||||||||||||||||||||||||
| Proceeds from maturities of investments | 26 | — | 16,518 | — | 16,544 | — | — | 24,006 | — | 24,006 | ||||||||||||||||||||||||||||
| Change in deposits with banks | — | (7,380 | ) | (16,472 | ) | — | (23,852 | ) | ||||||||||||||||||||||||||||||
| Change in loans | — | — | (5,057 | ) | — | (5,057 | ) | — | — | (7,953 | ) | — | (7,953 | ) | ||||||||||||||||||||||||
| Proceeds from sales and securitizations of loans | — | — | 1,247 | — | 1,247 | — | — | 3,191 | — | 3,191 | ||||||||||||||||||||||||||||
| Proceeds from significant disposals | — | — | 265 | — | 265 | — | — | 2,732 | — | 2,732 | ||||||||||||||||||||||||||||
| Change in federal funds sold and resales | — | (1,127 | ) | (4,291 | ) | — | (5,418 | ) | — | (2,623 | ) | (3,493 | ) | — | (6,116 | ) | ||||||||||||||||||||||
| Changes in investments and advances—intercompany | (12,271 | ) | (6,052 | ) | 18,323 | — | — | (569 | ) | (5,007 | ) | 5,576 | — | — | ||||||||||||||||||||||||
| Other investing activities | — | — | (472 | ) | — | (472 | ) | — | — | (607 | ) | — | (607 | ) | ||||||||||||||||||||||||
| Net cash used in investing activities of continuing operations | $ | (12,245 | ) | $ | (14,559 | ) | $ | (10,386 | ) | $ | — | $ | (37,190 | ) | ||||||||||||||||||||||||
| Net cash provided by (used in) investing activities of continuing operations | $ | (453 | ) | $ | (7,630 | ) | $ | 11,208 | $ | — | $ | 3,125 | ||||||||||||||||||||||||||
| Cash flows from financing activities of continuing operations | ||||||||||||||||||||||||||||||||||||||
| Dividends paid | $ | (359 | ) | $ | — | $ | — | $ | — | $ | (359 | ) | $ | (744 | ) | $ | — | $ | — | $ | — | $ | (744 | ) | ||||||||||||||
| Issuance of preferred stock | 1,004 | — | — | — | 1,004 | |||||||||||||||||||||||||||||||||
| Treasury stock acquired | (1,312 | ) | — | — | — | (1,312 | ) | (1,858 | ) | — | — | — | (1,858 | ) | ||||||||||||||||||||||||
| Proceeds (repayments) from issuance of long-term debt, net | 2,448 | 1,527 | (1,352 | ) | — | 2,623 | (1,454 | ) | 5,175 | (4,003 | ) | — | (282 | ) | ||||||||||||||||||||||||
| Proceeds (repayments) from issuance of long-term debt—intercompany, net | — | (2,692 | ) | 2,692 | — | — | — | (12,506 | ) | 12,506 | — | — | ||||||||||||||||||||||||||
| Change in deposits | — | — | 26,704 | — | 26,704 | — | — | 20,584 | — | 20,584 | ||||||||||||||||||||||||||||
| Change in federal funds purchased and repos | — | 12,077 | (1,365 | ) | — | 10,712 | — | 1,266 | 5,143 | — | 6,409 | |||||||||||||||||||||||||||
| Change in short-term borrowings | (109 | ) | 342 | (419 | ) | — | (186 | ) | — | 605 | (5,179 | ) | — | (4,574 | ) | |||||||||||||||||||||||
| Net change in short-term borrowings and other advances—intercompany | 5,926 | 3,711 | (9,637 | ) | — | — | (14,901 | ) | 8,938 | 5,963 | — | — | ||||||||||||||||||||||||||
| Capital contributions from parent | — | 2,500 | (2,500 | ) | — | — | ||||||||||||||||||||||||||||||||
| Other financing activities | (308 | ) | — | — | — | (308 | ) | (397 | ) | — | — | — | (397 | ) | ||||||||||||||||||||||||
| Net cash provided by financing activities of continuing operations | $ | 7,290 | $ | 17,465 | $ | 14,123 | $ | — | $ | 38,878 | ||||||||||||||||||||||||||||
| Net cash provided by (used in) financing activities of continuing operations | $ | (19,354 | ) | $ | 3,478 | $ | 35,014 | $ | — | $ | 19,138 | |||||||||||||||||||||||||||
| Effect of exchange rate changes on cash and due from banks | $ | — | $ | — | $ | 190 | $ | — | $ | 190 | $ | — | $ | — | $ | 340 | $ | — | $ | 340 | ||||||||||||||||||
| Change in cash and due from banks | $ | 239 | $ | 73 | $ | 1,028 | $ | — | $ | 1,340 | $ | (20,459 | ) | $ | (7,556 | ) | $ | 47,566 | $ | — | $ | 19,551 | ||||||||||||||||
| Cash and due from banks at beginning of period | 124 | 1,995 | 18,781 | — | 20,900 | 20,811 | 25,118 | 114,565 | — | 160,494 | ||||||||||||||||||||||||||||
| Cash and due from banks at end of period | $ | 363 | $ | 2,068 | $ | 19,809 | $ | — | $ | 22,240 | $ | 352 | $ | 17,562 | $ | 162,131 | $ | — | $ | 180,045 | ||||||||||||||||||
| Cash and due from banks | $ | 352 | $ | 3,647 | $ | 18,273 | $ | — | $ | 22,272 | ||||||||||||||||||||||||||||
| Deposits with banks | — | 13,915 | 143,858 | — | 157,773 | |||||||||||||||||||||||||||||||||
| Cash, due from banks and deposits with banks at end of period | $ | 352 | $ | 17,562 | $ | 162,131 | $ | — | $ | 180,045 | ||||||||||||||||||||||||||||
| Supplemental disclosure of cash flow information for continuing operations | ||||||||||||||||||||||||||||||||||||||
| Cash paid (refund) during the year for income taxes | $ | (231 | ) | $ | 20 | $ | 899 | $ | — | $ | 688 | $ | (139 | ) | $ | 64 | $ | 988 | $ | — | $ | 913 | ||||||||||||||||
| Cash paid during the year for interest | 1,036 | 637 | 1,021 | — | 2,694 | 1,153 | 822 | 1,275 | — | 3,250 | ||||||||||||||||||||||||||||
| Non-cash investing activities | ||||||||||||||||||||||||||||||||||||||
| Decrease in goodwill associated with significant disposals reclassified to HFS | — | — | (30 | ) | — | (30 | ) | |||||||||||||||||||||||||||||||
| Transfers to loans HFS from loans | — | — | 3,200 | — | 3,200 | $ | — | $ | — | $ | 2,800 | $ | — | $ | 2,800 | |||||||||||||||||||||||
| Transfers to OREO and other repossessed assets | — | — | 56 | — | 56 | — | — | 30 | — | 30 | ||||||||||||||||||||||||||||
| In millions, except per share amounts | Total shares purchased | Average price paid per share | Approximate dollar value of shares that may yet be purchased under the plan or programs | Total shares purchased | Average price paid per share | Approximate dollar value of shares that may yet be purchased under the plan or programs | ||||||||||
| January 2017 | ||||||||||||||||
| January 2018 | ||||||||||||||||
Open market repurchases(1) | 10.4 | $ | 57.68 | $ | 2,969 | 7.9 | $ | 76.87 | $ | 4,018 | ||||||
Employee transactions(2) | — | — | N/A | — | — | N/A | ||||||||||
| February 2017 | ||||||||||||||||
| February 2018 | ||||||||||||||||
Open market repurchases(1) | 9.2 | 58.54 | 2,431 | 13.2 | 75.63 | 3,022 | ||||||||||
Employee transactions(2) | — | — | N/A | 0.4 | 76.71 | N/A | ||||||||||
| March 2017 | ||||||||||||||||
| March 2018 | ||||||||||||||||
Open market repurchases(1) | 10.7 | 60.15 | 1,785 | 9.2 | 72.72 | 2,350 | ||||||||||
Employee transactions(2) | — | — | N/A | — | — | N/A | ||||||||||
| Total for 1Q17 and remaining program balance as of March 31, 2017 | 30.3 | $ | 58.82 | $ | 1,785 | |||||||||||
| Total for 1Q18 and remaining program balance as of March 31, 2018 | 30.7 | $ | 75.09 | $ | 2,350 | |||||||||||
| (1) | Represents repurchases under the |
| (2) | Consisted of shares added to treasury stock related to (i) certain activity on employee stock option program exercises where the employee delivers existing shares to cover the option exercise, or (ii) under Citi’s employee restricted |
| Exhibit | ||
| Number | Description of Exhibit | |
3.01+ | ||