0000831001 us-gaap:NonUsMember us-gaap:ConsumerPortfolioSegmentMember us-gaap:CreditCardReceivablesMember 2019-01-01 2019-03-31 0000831001 us-gaap:NotDesignatedAsHedgingInstrumentTradingMember 2019-03-31 0000831001 srt:WeightedAverageMember us-gaap:FairValueInputsLevel3Member c:MeasurementInputEquityEquityCorrelationMember us-gaap:MarketApproachValuationTechniqueMember 2018-12-31
UNITED STATES
SECURITIES AND EXCHANGE COMMISSION
WASHINGTON, D.C. 20549
FORM 10-Q
QUARTERLY REPORT PURSUANT TO SECTION 13 OR 15(d) OF
THE SECURITIES EXCHANGE ACT OF 1934
For the quarterly period ended September 30, 2018March 31, 2019
Commission file number 1-9924
Citigroup Inc.
(Exact name of registrant as specified in its charter)
|
| | |
Delaware (State or other jurisdiction of incorporation or organization) | | 52-1568099 (I.R.S. Employer Identification No.) |
388 Greenwich Street, New York, NY (Address of principal executive offices) | | 10013 (Zip code) |
(212) 559-1000 (Registrant's telephone number, including area code) |
Indicate by check mark whether the registrant (1) has filed all reports required to be filed by Section 13 or 15(d) of the Securities Exchange Act of 1934 during the preceding 12 months (or for such shorter period that the registrant was required to file such reports), and (2) has been subject to such filing requirements for the past 90 days. Yes x No o
Indicate by check mark whether the registrant has submitted electronically every Interactive Data File required to be submitted pursuant to Rule 405 of Regulation S-T (§232.405 of this chapter) during the preceding 12 months (or for such shorter period that the registrant was required to submit such files). Yes x No o
Indicate by check mark whether the registrant is a large accelerated filer, an accelerated filer, a non-accelerated filer, smaller reporting, or an emerging growth company. See the definitions of "large accelerated filer," "accelerated filer," "smaller reporting company" and “emerging growth company” in Rule 12b-2 of the Exchange Act. |
| | | | | | |
Large accelerated filer x | | Accelerated filer o | | Non-accelerated filer o
| | Smaller reporting company o Emerging growth company o |
If an emerging growth company, indicate by check mark if the registrant has elected not to use the extended transition period for complying with any new or revised financial accounting standards provided pursuant to Section 13(a) of the Exchange Act. Yes o
Indicate by check mark whether the registrant is a shell company (as defined in Rule 12b-2 of the Exchange Act). Yes o No x
Number of shares of Citigroup Inc. common stock outstanding on September 30, 2018: 2,442,136,813March 31, 2019: 2,312,467,721
Available on the web at www.citigroup.com
CITIGROUP’S THIRDFIRST QUARTER 2018—2019—FORM 10-Q
|
| |
| OVERVIEW | |
MANAGEMENT'S DISCUSSION AND ANALYSIS OF FINANCIAL CONDITION AND RESULTS OF OPERATIONS | |
| Executive Summary | |
| Summary of Selected Financial Data | |
SEGMENT AND BUSINESS—INCOME (LOSS) AND REVENUES | |
| SEGMENT BALANCE SHEET | |
| Global Consumer Banking (GCB) | |
| North America GCB | |
| Latin America GCB | |
| Asia GCB | |
| Institutional Clients Group | |
| Corporate/Other | |
OFF-BALANCE SHEET ARRANGEMENTS | |
| CAPITAL RESOURCES | |
MANAGING GLOBAL RISK TABLE OF CONTENTS | |
| MANAGING GLOBAL RISK | |
| INCOME TAXES | |
FUTURE APPLICATION OF ACCOUNTING STANDARDS | |
DISCLOSURE CONTROLS AND PROCEDURES | |
DISCLOSURE PURSUANT TO SECTION 219 OF THE IRAN THREAT REDUCTION AND SYRIA HUMAN RIGHTS ACT | |
| FORWARD-LOOKING STATEMENTS | |
FINANCIAL STATEMENTS AND NOTES TABLE OF CONTENTS | |
| CONSOLIDATED FINANCIAL STATEMENTS | |
NOTES TO CONSOLIDATED FINANCIAL STATEMENTS (UNAUDITED) | |
UNREGISTERED SALES OF EQUITY SECURITIES, PURCHASES OF EQUITY SECURITIES AND DIVIDENDS | |
OVERVIEW
This Quarterly Report on Form 10-Q should be read in conjunction with Citigroup’s Annual Report on Form 10-K for the year ended December 31, 2017 (20172018 (2018 Annual Report on Form 10-K) and Citigroup’s Quarterly Reports on Form 10-Q for the quarters ended March 31, 2018 (First Quarter of 2018 Form 10-Q) and June 30, 2018 (Second Quarter of 2018 Form 10-Q).
Additional information about Citigroup is available on Citi’s website at www.citigroup.com. Citigroup’s annual reports on Form 10-K, quarterly reports on Form 10-Q and proxy statements, as well as other filings with the U.S. Securities and Exchange Commission (SEC), are available free of charge through Citi’s website by clicking on the “Investors” page and selecting “All SEC Filings.” The SEC’s website also contains current reports on Form 8-K, and other information regarding Citi at www.sec.gov.
Certain reclassifications, including a realignment of certain businesses, have been made to the prior periods’ financial statements and disclosures to conform to the current period’s presentation. For additional information on certain recent reclassifications, see Notes 1 and 3 to the Consolidated Financial Statements below and Notes 1 and 3 to the Consolidated Financial Statements in Citi’s 20172018 Annual Report on Form 10-K.
Throughout this report, “Citigroup,” “Citi” and “the Company” refer to Citigroup Inc. and its consolidated subsidiaries.
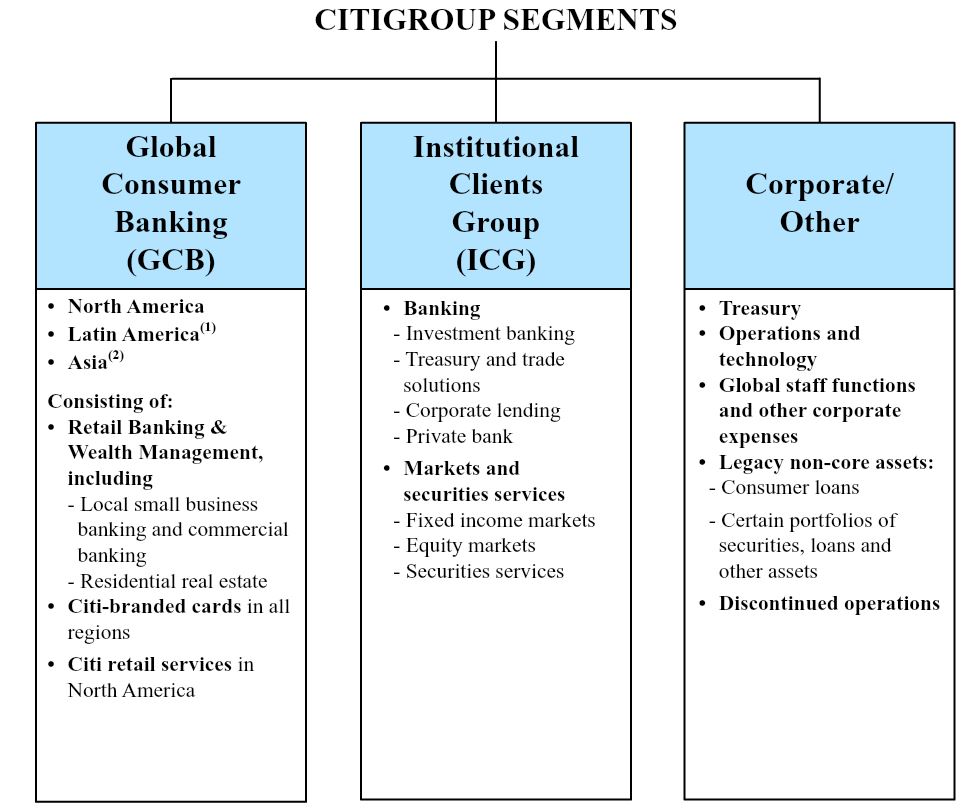
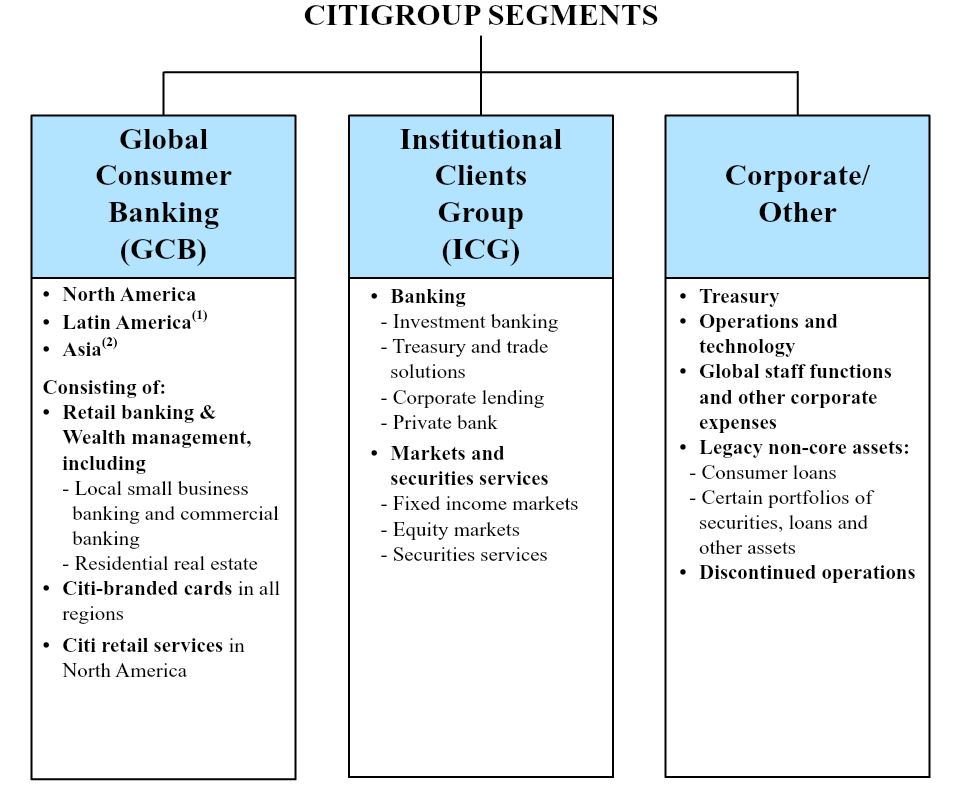
Citigroup is managed pursuant to two business segments: Global Consumer Banking and Institutional Clients Group, with the remaining operations in Corporate/Other.
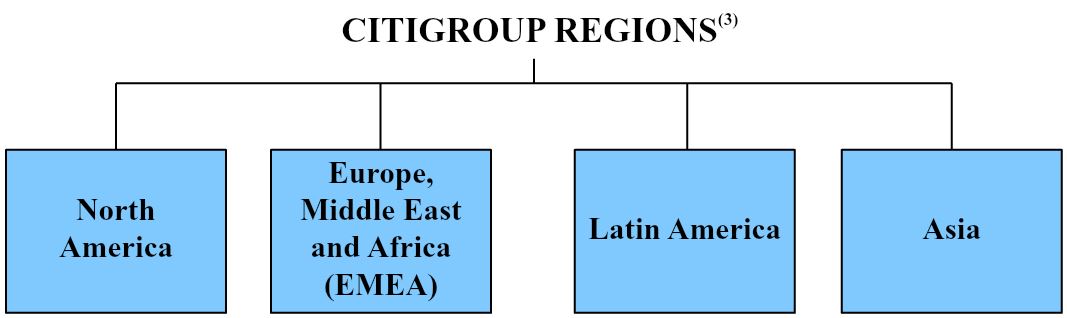
The following are the four regions in which Citigroup operates. The regional results are fully reflected in the segment results above.
| |
| (1) | Latin America GCB consists of Citi’s consumer banking businessin Mexico. |
| |
| (2) | Asia GCB includes the results of operations of GCB activities in certain EMEA countries for all periods presented. |
| |
| (3) | North America includes the U.S., Canada and Puerto Rico, Latin America includes Mexico and Asia includes Japan. |
MANAGEMENT’S DISCUSSION AND ANALYSIS OF FINANCIAL CONDITION
AND RESULTS OF OPERATIONS
EXECUTIVE SUMMARY
ThirdFirst Quarter of 2018—Solid Operating 2019—Results andDemonstrated Continued MomentumProgress
As described further throughout this Executive Summary, Citi reported solid operating resultsmade steady progress in the thirdfirst quarter of 2018, reflecting2019 toward improving its profitability and returns. During the quarter, Citi had revenue growth and positive operating leverage in every region in Global Consumer Banking (GCB), excluding the impact of foreign currency translation into U.S. dollars for reporting purposes (FX translation) as well as the gain on sale of the Hilton portfolio in the prior-year period in North America GCB. (Citi’s results of operations excluding the gain on sale as well as the impact of FX translation are non-GAAP financial measures.) Citi also showed continued momentum across businesses and geographies, including in many of the areas where Citi has been making ongoing investments.
During the third quarter of 2018, Citi had solid revenue growth across treasury and trade solutions, fixed income markets, securities services, investment banking and the private bankcorporate lending in the Institutional Clients Group (ICG)and in international Global Consumer Banking (GCB), with particular strength in Latin America GCB. Results in the current quarter and prior-year period also reflected the impact of gains on sale of businesses in ICG and Latin America GCB (see “Citigroup” below)while equity markets revenues were impacted by a weaker market environment. During the quarter,
Citi continued to demonstrate strong expense and credit discipline, resulting in the tenth consecutive quarter of positive operating leverage and an improvement in pretax earnings.leverage. Citi also had broad-basedgrowth in deposits and overall loan growth in GCB and ICG, as well as deposit growth.while credit quality remained broadly stable.
In addition, Citi continued to return capital to its shareholders. In the quarter, Citi returned $6.4$5.1 billion in the form of common stock repurchases and dividends. Citi repurchased approximately 7566 million common shares, during the quarter and over 200 million over the last 12 months, resultingcontributing to a 9% reduction in an 8% reduction inaverage outstanding common shares from the prior-year period. Despite the continued progress in returning capital to shareholders during the quarter, each of Citi’s key regulatory capital metrics remained strong (see “Capital” below).
While global economic growth has continued and the macroeconomic environment remains largely positive, global economic growth forecasts for 2019 have been lowered and there continue to be various economic, political and other risks and uncertainties that could create a more volatile operating environment and impact Citi’s businesses and future results. For a discussion of the risks and uncertainties that could impact Citi’s businesses, results of operations and financial condition during the remainder of 2018,2019, see each respective business’s results of operations and “Forward-Looking Statements” below, as well as each respective business’s results of operations and the “Managing Global Risk” and “Risk Factors” sections in Citi’s 20172018 Annual Report on Form 10-K.
ThirdFirst Quarter of 20182019 Results Summary Results
Citigroup
Citigroup reported net income of $4.6$4.7 billion, or $1.73$1.87 per share, compared to net income of $4.1$4.6 billion, or $1.42$1.68 per share, in the prior-year period. The 12% increase in netNet income wasincreased 2% from the prior-year period, primarily driven by lower expenses and a lower effective tax rate, due to the impact of the Tax Cutspartially offset by lower revenues and Jobs Act (Tax Reform), and also reflected lower expenses and lowerhigher cost of credit. Earnings per share increased 22% due to11%,
primarily reflecting the growth in net income and the 8%9% reduction in average shares outstanding driven by the common stock repurchases.
repurchases, as well as growth in net income.Citigroup revenues of $18.4$18.6 billion in the thirdfirst quarter of 2018 were largely unchanged2019 decreased 2% from the prior-year period, primarily reflectingincluding the net impact of athe $150 million gain on the sale of the Hilton portfolio in the prior-year period. Excluding the gain on sale, (approximately $580 million) of a fixed income analytics business in ICG in the prior-year period and a gain on sale (approximately $250 million) of an asset management business in Latin America GCB in the current quarterrevenues decreased 1%, primarily reflecting lower equity markets revenues as well as mark-to-market losses on loan hedges, both in ICG, and the impactcontinued wind-down of foreign currency translation (which increased reported revenueslegacy assets in the prior-year period by $335 million)Corporate/Other. Excluding the gains on sale as well as the impact of foreign currency translation in U.S. dollars for reporting purposes (FX translation), revenues increased 4%, driven by growth in ICG (Citi’s results of operations excluding the gains on sale as well as the impact of FX translation are non-GAAP financial measures).
Citigroup’s end-of-period loans increased 3%1% to $675$682 billion versus the prior-year period. Excluding the impact of FX translation, Citigroup’s end-of-period loans grew 4%3%, as 6%5% aggregate growth in GCB and ICG was partially offset by the continued wind-down of legacy assets in Corporate/Other. Citigroup’s end-of-period deposits increased 4%3% to $1.0 trillion versus the prior-year period. Excluding the impact of FX translation, Citigroup’s deposits increased 5%, primarily driven by 8% growth in ICG deposits. deposits as well as 2% growth in GCB.
Expenses
Citigroup operating expenses of $10.3$10.6 billion decreased 1%3% versus the prior-year period, as the impact of higher volume-related expenses and ongoing investments was more than offset by efficiency savings and the wind-down of legacy assets.assets were partially offset by continued investments. Year-over-year, GCBand ICG operating expenses were up 5%both down 1% and ICG Corporate/Other operating expenses increased 1%, while Corporate/Other operating expenses declined 44%, all versus the prior-year period.decreased 26%.
Cost of Credit
Citi’s total provisions for credit losses and for benefits and claims of $2.0 billion decreased 1%increased 7% from the prior-year period. The decreaseincrease was primarily driven by higher net credit losses in both Citi-branded cards and Citi retail services in North America GCB as well as a lower net loan loss reserve buildsrelease in both Citi retail services and Citi-branded cards in North America GCB, partially offset by a net loan loss reserve build in ICG,driven by volume growth.
Net credit losses of $1.8$1.9 billion declined 1%increased 4% versus the prior-year period. Consumer net credit losses of $1.7$1.9 billion were largely unchangedincreased 7% from the prior-year period.period, primarily reflecting volume growth and seasoning in the North America cards portfolios. Corporate net credit losses decreased from $43$96 million in the prior-year period to $30$56 million.
For additional information on Citi’s consumer and corporate credit costs and allowance for loan losses, see each respective business’s results of operations and “Credit Risk” below.
Capital
Citigroup’s Common Equity Tier 1 (CET1) Capital and Tier 1 Capital ratios on a fully implemented basis, were 11.7%11.9% and 13.4%13.5% as of September 30, 2018,March 31, 2019, respectively, compared to
13.0% 12.1% and 14.6%13.7% as of September 30, 2017,March 31, 2018, both based on the Basel III Standardized Approach for determining risk-weighted assets. The decline in regulatory capital ratios primarily reflected the return of capital to common shareholders, the previously disclosed approximate $6 billion reduction in CET1 Capital in the fourth quarter of 2017 due to the impact of Tax Reform as well as an increase in risk-weighted assets, partially offset by net income.
Citigroup’s Supplementary Leverage ratio as of September 30, 2018, on a fully implemented basis,March 31, 2019 was 6.5%6.4%, compared to 7.1%6.7% as of September 30, 2017.March 31, 2018. For additional information on Citi’s capital ratios and related components, including the impact of Tax Reform on its capital ratios, see “Capital Resources” below.
Global Consumer Banking
GCB net income of $1.6$1.4 billion increased 34%, driven primarily by lower cost of credit and a lower effective tax rate, as well as the gain on sale in Latin America GCB, partially offset by higher expenses. Operating expenses were $4.7 billion, up 5%, or 6% excluding4%. Excluding the impact of FX translation driven byand the timinggain on the sale of investment spending versus the prior-year period.
GCB revenues of $8.7 billion increased 2% versusHilton portfolio in the prior-year period and 3% excluding(approximately $115 million after-tax), net income increased 14%, driven primarily by higher revenues, partially offset by higher cost of credit. GCB operating expenses of $4.6 billion decreased 1%. Excluding the impact of FX translation, driven primarilyexpenses were largely unchanged, as investments and volume-driven expenses were offset by strength in Latin America efficiency savings.
GCB as well asrevenues of $8.5 billion were largely unchanged versus the prior-year period. Excluding the impact of FX translation and the gain on sale. the sale of the Hilton portfolio in the prior-year period, revenues increased 4%, driven by growth in all three regions. North America GCB revenues decreasedof $5.2 billion increased 1% to $5.1 billion, as higher revenues, or 4% excluding the gain on the sale of the Hilton portfolio, with growth in Citi retail services were more than offset by lower revenues in Citi-branded cards and retail banking.all three businesses. In North America GCB, Citi-branded cards revenues of $2.1$2.2 billion were down 3% versusincreased 5%, excluding the prior-year period, asgain on the sale of the Hilton portfolio, primarily driven by growth in interest-earning balances was more than offset by the impact of the previously disclosed Hilton portfolio sale as well as previously disclosed partnership terms.balances. Citi retail servicesrevenues of $1.7 billion increased 2%3% versus the prior-year period, primarily reflecting organic loan growth and the benefit of the L.L.Bean portfolio acquisition, partially offset by higher partner payments.acquisition. Retail banking revenues decreased 3%increased 1% from the prior-year period to $1.3 billion. Excluding mortgage revenues, retail banking revenues of $1.2 billion were up 1%2% from the prior-year period, driven by continued growth in deposit margins and investments, largely offset by lower episodic transaction activityspreads as well as modest growth in commercial banking.deposit volumes.
North America GCB average deposits of $180$182 billion decreased 2%increased 1% year-over-year, primarily driven by a reduction in money market balances, as clients transferred money to investments. North America GCB average retail loans of $56$57 billion grew 1%increased 3% year-over-year and assets under management of $64$66 billion grew 9%. Average Citi-branded card loans of $88 billion increased 3%,1% compared to the first quarter of 2018, which represented the peak level of promotional balances in 2018, as Citi has now optimized its mix of interest-earning to non-interest earning balances, while Citi-branded card purchase sales of $87$84 billion increased 9%6% versus the prior-year period. Average Citi retail services loans of $49$50 billion increased 7% versus the prior-year period, while Citi retail services purchase sales of $22$19 billion were up 11%also increased 7%. For additional information on the results of operations of North America GCB for the thirdfirst quarter of 2018,2019, see “Global Consumer Banking—North America GCB” below.
International GCB revenues (consisting of Latin America GCB and Asia GCB (which includes the results of operations in certain EMEA countries)) increased 8%,of $3.3 billion were largely unchanged versus the prior-year period to $3.5 billion.period. Excluding the impact of FX translation, international GCB revenues increased 11%3% versus the prior-year period. On this basis, Latin America GCB revenues increased 26%6% versus the prior-year period, including the impact of the sale of an asset management business in Mexico in 2018. The impact was a net benefit in the current quarter, as Citi recorded a small residual gain on sale. the sale, partially offset by the absence of related revenues.
Excluding the gain on sale, this impact, Latin America GCB revenues increased 8%5%,primarily driven by continued volumedeposit growth across commercial, mortgage and card loans as well as deposits. improved deposit spreads. Asia GCB revenues increased 1%, as continued growth in deposit, cardslending and insurance revenues was largely offset by lower investment revenues due to weaker market sentiment. For additional information on the results of operations of Latin America GCB and Asia GCB for the thirdfirst quarter of 2018,2019, including the impact of FX translation,see “Global Consumer Banking—Latin America GCB” and “Global Consumer Banking—Asia GCB” below.
Year-over-year, international GCB average deposits of $127$128 billion increased 5%3%, average retail loans of $90$89 billion increased 4%2%, assets under management of $105$106 billion increased 8%7%, average card loans of $24$25 billion increased 2%3% and card purchase sales of $26 billion increased 7%6%, all excluding the impact of FX translation.
Institutional Clients Group
ICG net income of $3.1$3.3 billionincreased 2%, driven primarily by thewas largely unchanged, as a decrease in expenses and a lower effective tax rate whichwere offset by lower revenues and higher cost of credit. ICG operating expenses decreased 1% to $5.4 billion, as efficiency savings more than offset the lower revenues as well as the higher cost of creditinvestments and operatingvolume-related expenses.ICG operating expenses increased 1% to $5.2 billion, driven by an increase in compensation costs, volume-related expenses and investments, partially offset by efficiency savings.
ICG revenues were $9.2$9.7 billion in the thirdfirst quarter of 2018,2019, down 2% from the prior-year period, as a 1%2% increase in Banking revenues was more than offset by a 5%6% decrease in Markets and securities services,reflecting the impact of the gain on sale in the prior-year period. Excluding the gain on sale in the prior-year period, revenues increased 4%, driven by growth in both Markets and securities services (up 8%) and Banking (up 1%).revenue. The increase in Banking revenues included the impact of $106$231 million of losses on loan hedges within corporate lending, compared to lossesgains of $48$23 million in the prior-year period.
Banking revenues of $4.9$5.2 billion (excluding the impact of lossesgains (losses) on loan hedges within corporate lending) increased 2%8%, driven by solid growth in treasury and trade solutions, private bankinvestment banking and corporate lending, partially offset by lower revenues in investment banking.private bank. Investment banking revenues of $1.2$1.4 billion decreased 8%increased 20% versus the prior-year period, as growth in advisory wasand investment-grade debt underwriting more than offset by a decline in both debt and equity underwriting, largely reflecting a lower market activity.wallet. Advisory revenues increased 9%76% to $262$378 million, equity underwriting revenues decreased 17%20% to $259$172 million and debt underwriting revenues decreased 9%increased 15% to $660$804 million, all versus the prior-year period.
Treasury and trade solutions revenues of $2.3$2.4 billion increased 4%6% versus the prior-year period, and 8%10% excluding the impact of FX translation, reflecting continued growth in
transaction volumes, loans and deposits. Private bank revenues increased 7% to $849 million versus the prior-year period, driven by growth in loans and investments, deposits as well as improved deposit spreads. Private bank revenues decreased 3% to $880 million compared to a strong prior-year period, reflecting lower managed investment revenues and higher funding costs. Corporate lending revenues were largely unchanged at $457decreased 38% to $338 million. Excluding the impact of lossesgains (losses) on loan hedges, corporate lending revenues increased 11%9% versus the prior-year period, primarily driven by loan growth and lower hedging costs.spread expansion.
Markets and securities services revenues of $4.5$4.7 billion decreased 5%6% from the prior-year period. Excluding the gain on sale, Markets and securities services increased 8%, driven byperiod, as lower equity markets revenues more than offset modest revenue growth in both fixed income and equity marketsas well as securities services.income.Fixed income markets revenues of $3.2$3.5 billion increased 9% from the prior-year period, with contributions from both rates and currencies as well as spread products. Equity markets revenues of $792 million increased 1% from the prior-year period, as strength in prime finance rates
and derivativesspread products was largely offset by weakness in FX, as a result of low currency volatility in the current quarter, while corporate client activity remained stable. Equity markets revenues of $842 million decreased 24%, compared to a strong prior-year period, reflecting lower revenues in cash equities, reflecting a more challenging trading environmentmarket volumes and lower commissions.client financing balances. Securities services revenues of $672$638 million were largely unchanged, and increased 11%, and 15%5% excluding the impact of FX translation, driven by continued growth in client volumes and higher net interest revenue. For additional information on the results of operations of ICG for the thirdfirst quarter of 2018,2019, see “Institutional Clients Group” below.
Corporate/Other
Corporate/Other net loss was $67$38 million in the thirdfirst quarter of 2018,2019, compared to a net loss of $83$87 million in the prior-year period. Operating expenses of $459$549 million declined 44%26% from the prior-year period, largely reflecting the wind-down of legacy assets as well as lower infrastructure costs.
assets. Corporate/Other revenues were $494$431 million, down 5%27% from the prior-year period, primarily reflecting the continued wind-down of legacy assets.
For additional information on the results of operations of Corporate/Other for the thirdfirst quarter of 2018,2019, see “Corporate/Other” below.
RESULTS OF OPERATIONS
SUMMARY OF SELECTED FINANCIAL DATA—PAGE 1
Citigroup Inc. and Consolidated Subsidiaries
| | | | Third Quarter | | Nine Months | | First Quarter | |
| In millions of dollars, except per-share amounts and ratios | 2018 | 2017 | % Change | 2018 | 2017 | % Change | 2019 | 2018 | % Change |
| Net interest revenue | $ | 11,802 |
| $ | 11,535 |
| 2 | % | $ | 34,639 |
| $ | 33,748 |
| 3 | % | $ | 11,759 |
| $ | 11,172 |
| 5 | % |
| Non-interest revenue | 6,587 |
| 6,884 |
| (4 | ) | 21,091 |
| 21,192 |
| — |
| 6,817 |
| 7,700 |
| (11 | ) |
| Revenues, net of interest expense | $ | 18,389 |
| $ | 18,419 |
| — | % | $ | 55,730 |
| $ | 54,940 |
| 1 | % | $ | 18,576 |
| $ | 18,872 |
| (2 | )% |
| Operating expenses | 10,311 |
| 10,417 |
| (1 | ) | 31,948 |
| 31,900 |
| — |
| 10,584 |
| 10,925 |
| (3 | ) |
| Provisions for credit losses and for benefits and claims | 1,974 |
| 1,999 |
| (1 | ) | 5,643 |
| 5,378 |
| 5 |
| 1,980 |
| 1,857 |
| 7 |
|
| Income from continuing operations before income taxes | $ | 6,104 |
| $ | 6,003 |
| 2 | % | $ | 18,139 |
| $ | 17,662 |
| 3 | % | $ | 6,012 |
| $ | 6,090 |
| (1 | )% |
Income taxes(1) | 1,471 |
| 1,866 |
| (21 | ) | 4,356 |
| 5,524 |
| (21 | ) | 1,275 |
| 1,441 |
| (12 | ) |
| Income from continuing operations | $ | 4,633 |
| $ | 4,137 |
| 12 | % | $ | 13,783 |
| $ | 12,138 |
| 14 | % | $ | 4,737 |
| $ | 4,649 |
| 2 | % |
Income (loss) from discontinued operations, net of taxes(2)(1) | (8 | ) | (5 | ) | (60 | ) | — |
| (2 | ) | 100 |
| (2 | ) | (7 | ) | 71 |
|
Net income before attribution of noncontrolling interests | $ | 4,625 |
| $ | 4,132 |
| 12 | % | $ | 13,783 |
| $ | 12,136 |
| 14 | % | $ | 4,735 |
| $ | 4,642 |
| 2 | % |
| Net income attributable to noncontrolling interests | 3 |
| (1 | ) | NM |
| 51 |
| 41 |
| 24 |
| 25 |
| 22 |
| 14 |
|
| Citigroup’s net income | $ | 4,622 |
| $ | 4,133 |
| 12 | % | $ | 13,732 |
| $ | 12,095 |
| 14 | % | $ | 4,710 |
| $ | 4,620 |
| 2 | % |
| Less: | |
|
| | | | |
|
|
| Preferred dividends—Basic | $ | 270 |
| $ | 272 |
| (1 | )% | $ | 860 |
| $ | 893 |
| (4 | )% | $ | 262 |
| $ | 272 |
| (4 | )% |
| Dividends and undistributed earnings allocated to employee restricted and deferred shares that contain nonforfeitable rights to dividends, applicable to basic EPS | 51 |
| 53 |
| (4 | ) | 151 |
| 156 |
| (3 | ) | 59 |
| 51 |
| 16 |
|
Income allocated to unrestricted common shareholders for basic and diluted EPS | $ | 4,301 |
| $ | 3,808 |
| 13 | % | $ | 12,721 |
| $ | 11,046 |
| 15 | % | $ | 4,389 |
| $ | 4,297 |
| 2 | % |
| Earnings per share | |
|
| | |
| | |
|
|
| Basic | |
|
| | |
| | |
|
|
| Income from continuing operations | $ | 1.74 |
| $ | 1.42 |
| 23 | % | $ | 5.04 |
| $ | 4.05 |
| 24 | % | $ | 1.88 |
| $ | 1.68 |
| 12 | % |
| Net income | 1.73 |
| 1.42 |
| 22 |
| 5.04 |
| 4.05 |
| 24 |
| 1.88 |
| 1.68 |
| 12 |
|
| Diluted | |
|
| | | | |
|
|
| Income from continuing operations | $ | 1.74 |
| $ | 1.42 |
| 23 | % | $ | 5.04 |
| $ | 4.05 |
| 24 | % | $ | 1.87 |
| $ | 1.68 |
| 11 | % |
| Net income | 1.73 |
| 1.42 |
| 22 |
| 5.04 |
| 4.05 |
| 24 |
| 1.87 |
| 1.68 |
| 11 |
|
| Dividends declared per common share | 0.45 |
| 0.32 |
| 41 |
| 1.09 |
| 0.64 |
| 70 |
| 0.45 |
| 0.32 |
| 41 |
|
Table continues on the next page, including footnotes.
SUMMARY OF SELECTED FINANCIAL DATA—PAGE 2
Citigroup Inc. and Consolidated Subsidiaries
| | | | Third Quarter | | Nine Months | | First Quarter | |
| In millions of dollars, except per-share amounts, ratios and direct staff | 2018 | 2017 | % Change | 2018 | 2017 | % Change | 2019 | 2018 | % Change |
| At September 30: | | | | | | |
| At March 31: | | | |
| Total assets | $ | 1,925,165 |
| $ | 1,889,133 |
| 2 | % | | | | $ | 1,958,413 |
| $ | 1,922,104 |
| 2 | % |
| Total deposits | 1,005,176 |
| 964,038 |
| 4 |
| | | | 1,030,355 |
| 1,001,219 |
| 3 |
|
| Long-term debt | 235,270 |
| 232,673 |
| 1 |
| | | | 243,566 |
| 237,938 |
| 2 |
|
Citigroup common stockholders’ equity(1) | 177,969 |
| 208,381 |
| (15 | ) | | | | 178,272 |
| 182,759 |
| (2 | ) |
Total Citigroup stockholders’ equity(1) | 197,004 |
| 227,634 |
| (13 | ) | | | | 196,252 |
| 201,915 |
| (3 | ) |
Direct staff (in thousands) | 206 |
| 213 |
| (3 | ) | | | | 203 |
| 209 |
| (3 | ) |
| Performance metrics | |
|
| | | | |
|
|
| Return on average assets | 0.95 | % | 0.87 | % |
|
| 0.96 | % | 0.87 | % | | 0.98 | % | 0.98 | % |
|
|
Return on average common stockholders’ equity(3)(2) | 9.6 |
| 7.3 |
|
|
| 9.5 |
| 7.2 |
| | 10.2 |
| 9.7 |
|
|
|
Return on average total stockholders’ equity(3)(2) | 9.2 |
| 7.2 |
|
|
| 9.2 |
| 7.1 |
| | 9.8 |
| 9.3 |
|
|
|
| Efficiency ratio (total operating expenses/total revenues) | 56.1 |
| 56.6 |
|
|
| 57.3 |
| 58.1 |
| | 57.0 |
| 57.9 |
|
|
|
Basel III ratios—full implementation(1)(4) | | | | | | |
| Basel III ratios | | | |
Common Equity Tier 1 Capital(5)(3) | 11.73 | % | 12.98 | % | | | | | 11.91 | % | 12.05 | % | |
Tier 1 Capital(5)(3) | 13.36 |
| 14.61 |
| | | | | 13.47 |
| 13.67 |
| |
Total Capital(5)(3) | 15.98 |
| 16.95 |
| | | | | 16.44 |
| 16.01 |
| |
| Supplementary Leverage ratio | 6.50 |
| 7.11 |
| | | | | 6.44 |
| 6.71 |
| |
Citigroup common stockholders’ equity to assets(1) | 9.24 | % | 11.03 | % | |
|
| | | 9.10 | % | 9.51 | % | |
Total Citigroup stockholders’ equity to assets(1) | 10.23 |
| 12.05 |
| |
|
| | | 10.02 |
| 10.50 |
| |
Dividend payout ratio(6)(4) | 26.0 |
| 22.5 |
| | 21.6 | % | 15.8 | % | | 24 |
| 19 |
| |
Total payout ratio(7)(5) | 147.0 |
| 164.6 |
| | 98.1 |
| 96.5 |
| | 115 |
| 71 |
| |
Book value per common share(1) | $ | 72.88 |
| $ | 78.81 |
| (8 | )% |
|
| | | $ | 77.09 |
| $ | 71.67 |
| 8 | % |
Tangible book value (TBV) per share(8)(6) | 61.91 |
| 68.55 |
| (10 | ) | | | | 65.55 |
| 61.02 |
| 7 |
|
| |
| (1) | The third quarter and nine months of 2018 reflect the impact of Tax Reform. For additional information on Tax Reform, including the impact on Citi’s fourth quarter and full-year 2017 results, see Citi’s 2017 Annual Report on Form 10-K. |
| |
(2) | See Note 2 to the Consolidated Financial Statements in Citi’s 2018 Annual Report on Form 10-K for additional information on Citi’s discontinued operations. |
| |
(3)(2) | The return on average common stockholders’ equity is calculated using net income less preferred stock dividends divided by average common stockholders’ equity. The return on average total Citigroup stockholders’ equity is calculated using net income divided by average Citigroup stockholders’ equity. |
| |
(4) | Citi’s risk-based capital and leverage ratios as of September 30, 2017 are non-GAAP financial measures, which reflect full implementation of regulatory capital adjustments and deductions prior to the effective date of January 1, 2018. |
| |
(5)(3) | Citi’s reportable Common Equity Tier 1 (CET1) Capital and Tier 1 Capital ratios were the lower derived under the U.S. Basel III Standardized Approach, and Citi’swhereas the reportable Total Capital ratios wereratio was the lower derived under the U.S. Basel III Advanced Approaches for both periods presented.framework. This reflects the U.S. Basel III requirement to report the lower of risk-based capital ratios under both the Standardized Approach and Advanced Approaches in accordance with the Collins Amendment of the Dodd-Frank Act. |
| |
(6)(4) | Dividends declared per common share as a percentage of net income per diluted share. |
| |
(7)(5) | Total common dividends declared plus common stock repurchases as a percentage of net income available to common shareholders. See “Consolidated Statement of Changes in Stockholders’ Equity,” Note 9 to the Consolidated Financial Statements and “Equity Security Repurchases” below for the component details. |
| |
(8)(6) | For information on TBV, see “Capital Resources—Tangible Common Equity, Book Value Per Share, Tangible Book Value Per Share and Returns on Equity” below. |
NM Not meaningful
SEGMENT AND BUSINESS—INCOME (LOSS) AND REVENUES
CITIGROUP INCOME
| | | | Third Quarter | | Nine Months | | First Quarter | |
| In millions of dollars | 2018 | 2017 | % Change | 2018 | 2017 | % Change | 2019 | 2018 | % Change |
| Income from continuing operations | | | | | | | |
| Global Consumer Banking | | | | | | | |
| North America | $ | 850 |
| $ | 642 |
| 32 | % | $ | 2,407 |
| $ | 1,913 |
| 26 | % | $ | 769 |
| $ | 838 |
| (8 | )% |
| Latin America | 334 |
| 169 |
| 98 |
| 717 |
| 445 |
| 61 |
| 252 |
| 179 |
| 41 |
|
Asia(1) | 383 |
| 359 |
| 7 |
| 1,116 |
| 938 |
| 19 |
| 416 |
| 373 |
| 12 |
|
| Total | $ | 1,567 |
| $ | 1,170 |
| 34 | % | $ | 4,240 |
| $ | 3,296 |
| 29 | % | $ | 1,437 |
| $ | 1,390 |
| 3 | % |
| Institutional Clients Group |
|
| |
|
|
|
| |
|
|
|
| |
|
|
| North America | $ | 870 |
| $ | 1,298 |
| (33 | )% | $ | 2,755 |
| $ | 3,463 |
| (20 | )% | $ | 714 |
| $ | 858 |
| (17 | )% |
| EMEA | 972 |
| 753 |
| 29 |
| 3,072 |
| 2,401 |
| 28 |
| 1,125 |
| 1,113 |
| 1 |
|
| Latin America | 541 |
| 388 |
| 39 |
| 1,546 |
| 1,211 |
| 28 |
| 503 |
| 494 |
| 2 |
|
| Asia | 734 |
| 623 |
| 18 |
| 2,310 |
| 1,778 |
| 30 |
| 980 |
| 869 |
| 13 |
|
| Total | $ | 3,117 |
| $ | 3,062 |
| 2 | % | $ | 9,683 |
| $ | 8,853 |
| 9 | % | $ | 3,322 |
| $ | 3,334 |
| — | % |
| Corporate/Other | (51 | ) | (95 | ) | 46 |
| (140 | ) | (11 | ) | NM |
| (22 | ) | (75 | ) | 71 |
|
| Income from continuing operations | $ | 4,633 |
| $ | 4,137 |
| 12 | % | $ | 13,783 |
| $ | 12,138 |
| 14 | % | $ | 4,737 |
| $ | 4,649 |
| 2 | % |
| Discontinued operations | $ | (8 | ) | $ | (5 | ) | (60 | )% | $ | — |
| $ | (2 | ) | 100 | % | $ | (2 | ) | $ | (7 | ) | 71 | % |
| Net income attributable to noncontrolling interests | 3 |
| (1 | ) | NM |
| 51 |
| 41 |
| 24 |
| |
| Less: Net income attributable to noncontrolling interests | | 25 |
| 22 |
| 14 |
|
| Citigroup’s net income | $ | 4,622 |
| $ | 4,133 |
| 12 | % | $ | 13,732 |
| $ | 12,095 |
| 14 | % | $ | 4,710 |
| $ | 4,620 |
| 2 | % |
| |
| (1) | Asia GCB includes the results of operations of GCB activities in certain EMEA countries for all periods presented. |
NM Not meaningful
| | | | Third Quarter | | Nine Months | | First Quarter | |
| In millions of dollars | 2018 | 2017 | % Change | 2018 | 2017 | % Change | 2019 | 2018 | % Change |
| Global Consumer Banking | | | | | | | |
| North America | $ | 5,129 |
| $ | 5,197 |
| (1 | )% | $ | 15,290 |
| $ | 15,088 |
| 1 | % | $ | 5,185 |
| $ | 5,157 |
| 1 | % |
| Latin America | 1,670 |
| 1,388 |
| 20 |
| 4,398 |
| 3,863 |
| 14 |
| 1,381 |
| 1,340 |
| 3 |
|
Asia(1) | 1,855 |
| 1,885 |
| (2 | ) | 5,649 |
| 5,438 |
| 4 |
| 1,885 |
| 1,929 |
| (2 | ) |
| Total | $ | 8,654 |
| $ | 8,470 |
| 2 | % | $ | 25,337 |
| $ | 24,389 |
| 4 | % | $ | 8,451 |
| $ | 8,426 |
| — | % |
| Institutional Clients Group |
|
| |
|
| | |
|
|
|
| |
|
|
| North America | $ | 3,329 |
| $ | 3,709 |
| (10 | )% | $ | 10,105 |
| $ | 10,877 |
| (7 | )% | $ | 3,119 |
| $ | 3,266 |
| (5 | )% |
| EMEA | 2,927 |
| 2,703 |
| 8 |
| 9,137 |
| 8,438 |
| 8 |
| 3,170 |
| 3,167 |
| — |
|
| Latin America | 1,055 |
| 1,099 |
| (4 | ) | 3,427 |
| 3,354 |
| 2 |
| 1,160 |
| 1,216 |
| (5 | ) |
| Asia | 1,930 |
| 1,919 |
| 1 |
| 6,111 |
| 5,501 |
| 11 |
| 2,245 |
| 2,206 |
| 2 |
|
| Total | $ | 9,241 |
| $ | 9,430 |
| (2 | )% | $ | 28,780 |
| $ | 28,170 |
| 2 | % | $ | 9,694 |
| $ | 9,855 |
| (2 | )% |
| Corporate/Other | 494 |
| 519 |
| (5 | ) | 1,613 |
| 2,381 |
| (32 | ) | 431 |
| 591 |
| (27 | ) |
| Total Citigroup net revenues | $ | 18,389 |
| $ | 18,419 |
| — | % | $ | 55,730 |
| $ | 54,940 |
| 1 | % | $ | 18,576 |
| $ | 18,872 |
| (2 | )% |
| |
| (1) | Asia GCB includes the results of operations of GCB activities in certain EMEA countries for all periods presented. |
SEGMENT BALANCE SHEET(1)
| | | In millions of dollars | Global Consumer Banking | Institutional Clients Group | Corporate/Other and consolidating eliminations(2) | Citigroup parent company- issued long-term debt and stockholders’ equity(3) | Total Citigroup consolidated | Global Consumer Banking | Institutional Clients Group | Corporate/Other and consolidating eliminations(2) | Citigroup parent company- issued long-term debt and stockholders’ equity(3) | Total Citigroup consolidated |
| Assets | | | | | | | | |
| Cash and deposits with banks | $ | 10,034 |
| $ | 66,084 |
| $ | 123,168 |
| $ | — |
| $ | 199,286 |
| $ | 8,747 |
| 64,506 |
| $ | 132,640 |
| $ | — |
| $ | 205,893 |
|
Federal funds sold and securities borrowed and purchased under agreements to resell | 157 |
| 280,556 |
| 228 |
| — |
| 280,941 |
| — |
| 264,264 |
| 231 |
| — |
| 264,495 |
|
| Trading account assets | 754 |
| 249,904 |
| 6,844 |
| — |
| 257,502 |
| 843 |
| 275,309 |
| 10,359 |
| — |
| 286,511 |
|
| Investments | 1,271 |
| 108,942 |
| 235,300 |
| — |
| 345,513 |
| 1,173 |
| 117,776 |
| 230,332 |
| — |
| 349,281 |
|
Loans, net of unearned income and allowance for loan losses
| 299,493 |
| 347,050 |
| 16,030 |
| — |
| 662,573 |
| 297,630 |
| 360,156 |
| 12,231 |
| — |
| 670,017 |
|
| Other assets | 37,605 |
| 105,200 |
| 36,545 |
| — |
| 179,350 |
| 37,544 |
| 103,212 |
| 41,460 |
| — |
| 182,216 |
|
Net inter-segment liquid assets(4) | 77,370 |
| 246,754 |
| (324,124 | ) | — |
| — |
| 79,746 |
| 240,275 |
| (320,021 | ) | — |
| — |
|
| Total assets | $ | 426,684 |
| $ | 1,404,490 |
| $ | 93,991 |
| $ | — |
| $ | 1,925,165 |
| $ | 425,683 |
| $ | 1,425,498 |
| $ | 107,232 |
| $ | — |
| $ | 1,958,413 |
|
| Liabilities and equity | | | | | | |
| Total deposits | $ | 310,689 |
| $ | 684,623 |
| $ | 9,864 |
| $ | — |
| $ | 1,005,176 |
| $ | 315,547 |
| $ | 701,544 |
| $ | 13,264 |
| $ | — |
| $ | 1,030,355 |
|
Federal funds purchased and securities loaned and sold under agreements to repurchase | 3,054 |
| 172,851 |
| 10 |
| — |
| 175,915 |
| 3,967 |
| 186,335 |
| 70 |
| — |
| 190,372 |
|
| Trading account liabilities | 141 |
| 147,115 |
| 396 |
| — |
| 147,652 |
| 195 |
| 135,864 |
| 333 |
| — |
| 136,392 |
|
| Short-term borrowings | 473 |
| 22,798 |
| 10,499 |
| — |
| 33,770 |
| 485 |
| 25,490 |
| 13,347 |
| — |
| 39,322 |
|
Long-term debt(3) | 1,831 |
| 41,351 |
| 43,905 |
| 148,183 |
| 235,270 |
| 1,817 |
| 48,509 |
| 43,410 |
| 149,830 |
| 243,566 |
|
| Other liabilities | 19,613 |
| 94,913 |
| 14,993 |
| — |
| 129,519 |
| 19,386 |
| 83,420 |
| 18,585 |
| — |
| 121,391 |
|
Net inter-segment funding (lending)(3) | 90,883 |
| 240,839 |
| 13,465 |
| (345,187 | ) | — |
| 84,286 |
| 244,336 |
| 17,460 |
| (346,082 | ) | — |
|
| Total liabilities | $ | 426,684 |
| $ | 1,404,490 |
| $ | 93,132 |
| $ | (197,004 | ) | $ | 1,727,302 |
| $ | 425,683 |
| $ | 1,425,498 |
| $ | 106,469 |
| $ | (196,252 | ) | $ | 1,761,398 |
|
Total stockholders’ equity(5) | — |
| — |
| 859 |
| 197,004 |
| 197,863 |
| — |
| — |
| 763 |
| 196,252 |
| 197,015 |
|
| Total liabilities and equity | $ | 426,684 |
| $ | 1,404,490 |
| $ | 93,991 |
| $ | — |
| $ | 1,925,165 |
| $ | 425,683 |
| $ | 1,425,498 |
| $ | 107,232 |
| $ | — |
| $ | 1,958,413 |
|
| |
| (1) | The supplemental information presented in the table above reflects Citigroup’s consolidated GAAP balance sheet by reporting segment as of September 30, 2018.March 31, 2019. The respective segment information depicts the assets and liabilities managed by each segment as of such date. |
| |
| (2) | Consolidating eliminations for total Citigroup and Citigroup parent company assets and liabilities are recorded within Corporate/Other. |
| |
| (3) | The total stockholders’ equity and the majority of long-term debt of Citigroup reside in the Citigroup parent company Consolidated Balance Sheet. Citigroup allocates stockholders’ equity and long-term debt to its businesses through inter-segment allocations as shown above. |
| |
| (4) | Represents the attribution of Citigroup’s liquid assets (primarily consisting of cash, marketable equity securities, and available-for-sale debt securities) to the various businesses based on Liquidity Coverage Ratio (LCR) assumptions. |
| |
| (5) | Corporate/Other equity represents noncontrolling interests. |
GLOBAL CONSUMER BANKING
Global Consumer Banking (GCB) consists of consumer banking businesses in North America, Latin America (consisting of Citi’s consumer banking business in Mexico) and Asia. GCB provides traditional banking services to retail customers through retail banking, including commercial banking, and Citi-branded cards and Citi retail services (for additional information on these businesses, see “Citigroup Segments” above and “Managing Global Risk—Consumer Credit” below)above). GCB is focused on its priority markets in the U.S., Mexico and Asia with 2,4172,404 branches in 19 countries and jurisdictions as of September 30, 2018.March 31, 2019. At September 30, 2018, March 31, 2019, GCB had approximately $427$426 billion in assets and $311$316 billion in deposits.
GCB’s overall strategy is to leverage Citi’s global footprint and be the pre-eminent bank for the emerging affluent and emerging affluent consumers in large urban centers. In credit cards and in certain retail markets (including commercial banking), Citi serves customers in a somewhat broader set of segments and geographies.
| | | | Third Quarter | | Nine Months | | First Quarter | |
| In millions of dollars except as otherwise noted | 2018 | 2017 | % Change | 2018 | 2017 | % Change | |
| In millions of dollars, except as otherwise noted | | 2019 | 2018 | % Change |
| Net interest revenue | $ | 7,236 |
| $ | 7,071 |
| 2 | % | $ | 21,235 |
| $ | 20,410 |
| 4 | % | $ | 7,253 |
| $ | 6,980 |
| 4 | % |
| Non-interest revenue | 1,418 |
| 1,399 |
| 1 |
| 4,102 |
| 3,979 |
| 3 |
| 1,198 |
| 1,446 |
| (17 | ) |
| Total revenues, net of interest expense | $ | 8,654 |
| $ | 8,470 |
| 2 | % | $ | 25,337 |
| $ | 24,389 |
| 4 | % | $ | 8,451 |
| $ | 8,426 |
| — | % |
| Total operating expenses | $ | 4,661 |
| $ | 4,452 |
| 5 | % | $ | 13,997 |
| $ | 13,440 |
| 4 | % | $ | 4,608 |
| $ | 4,677 |
| (1 | )% |
| Net credit losses | $ | 1,714 |
| $ | 1,704 |
| 1 | % | $ | 5,176 |
| $ | 4,922 |
| 5 | % | $ | 1,891 |
| $ | 1,736 |
| 9 | % |
| Credit reserve build (release) | 186 |
| 486 |
| (62 | ) | 484 |
| 788 |
| (39 | ) | 76 |
| 144 |
| (47 | ) |
| Provision (release) for unfunded lending commitments | 6 |
| (5 | ) | NM |
| 8 |
| — |
| NM |
| 5 |
| (1 | ) | NM |
|
| Provision for benefits and claims | 27 |
| 28 |
| (4 | ) | 75 |
| 80 |
| (6 | ) | 12 |
| 26 |
| (54 | ) |
| Provisions for credit losses and for benefits and claims (LLR & PBC) | $ | 1,933 |
| $ | 2,213 |
| (13 | )% | $ | 5,743 |
| $ | 5,790 |
| (1 | )% | $ | 1,984 |
| $ | 1,905 |
| 4 | % |
| Income from continuing operations before taxes | $ | 2,060 |
| $ | 1,805 |
| 14 | % | $ | 5,597 |
| $ | 5,159 |
| 8 | % | $ | 1,859 |
| $ | 1,844 |
| 1 | % |
| Income taxes | 493 |
| 635 |
| (22 | ) | 1,357 |
| 1,863 |
| (27 | ) | 422 |
| 454 |
| (7 | ) |
| Income from continuing operations | $ | 1,567 |
| $ | 1,170 |
| 34 | % | $ | 4,240 |
| $ | 3,296 |
| 29 | % | $ | 1,437 |
| $ | 1,390 |
| 3 | % |
| Noncontrolling interests | 1 |
| 2 |
| (50 | ) | 4 |
| 7 |
| (43 | ) | — |
| 2 |
| (100 | ) |
| Net income | $ | 1,566 |
| $ | 1,168 |
| 34 | % | $ | 4,236 |
| $ | 3,289 |
| 29 | % | $ | 1,437 |
| $ | 1,388 |
| 4 | % |
Balance Sheet data (in billions of dollars) |
|
| |
|
| | |
|
| |
Balance Sheet data and ratios (in billions of dollars) | |
|
| |
|
|
| Total EOP assets | $ | 427 |
| $ | 419 |
| 2 | % | | |
|
| $ | 426 |
| $ | 423 |
| 1 | % |
| Average assets | 424 |
| 421 |
| 1 |
| $ | 421 |
| $ | 415 |
| 1 | % | 426 |
| 423 |
| 1 |
|
| Return on average assets | 1.47 | % | 1.10 | % |
|
| 1.35 | % | 1.06 | % |
|
| 1.37 | % | 1.33 | % |
|
|
| Efficiency ratio | 54 |
| 53 |
|
|
| 55 |
| 55 |
|
|
| 55 |
| 56 |
|
|
|
| Average deposits | $ | 307 |
| $ | 308 |
| — |
| $ | 307 |
| $ | 306 |
| — |
| $ | 310 |
| $ | 309 |
| — |
|
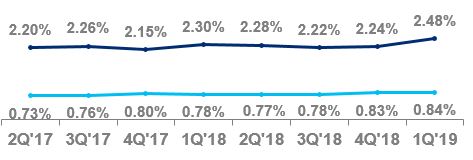
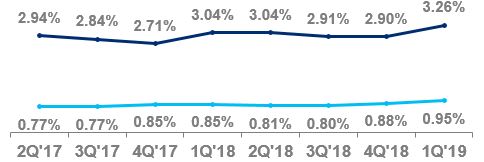
| Net credit losses as a percentage of average loans | 2.22 | % | 2.26 | % |
|
| 2.27 | % | 2.24 | % |
|
| 2.48 | % | 2.30 | % |
|
|
| Revenue by business |
|
| |
|
| | |
|
|
|
| |
|
|
| Retail banking | $ | 3,717 |
| $ | 3,521 |
| 6 | % | $ | 10,677 |
| $ | 10,024 |
| 7 | % | $ | 3,467 |
| $ | 3,464 |
| — | % |
Cards(1) | 4,937 |
| 4,949 |
| — |
| 14,660 |
| 14,365 |
| 2 |
| 4,984 |
| 4,962 |
| — |
|
| Total | $ | 8,654 |
| $ | 8,470 |
| 2 | % | $ | 25,337 |
| $ | 24,389 |
| 4 | % | $ | 8,451 |
| $ | 8,426 |
| — | % |
| Income from continuing operations by business |
|
| |
|
| | |
|
|
|
| |
|
|
| Retail banking | $ | 666 |
| $ | 546 |
| 22 | % | $ | 1,770 |
| $ | 1,298 |
| 36 | % | $ | 526 |
| $ | 520 |
| 1 | % |
Cards(1) | 901 |
| 624 |
| 44 |
| 2,470 |
| 1,998 |
| 24 |
| 911 |
| 870 |
| 5 |
|
| Total | $ | 1,567 |
| $ | 1,170 |
| 34 | % | $ | 4,240 |
| $ | 3,296 |
| 29 | % | $ | 1,437 |
| $ | 1,390 |
| 3 | % |
Table continues on the next page, including footnotes.
| | | Foreign currency (FX) translation impact | |
|
| | | | |
|
|
| Total revenue—as reported | $ | 8,654 |
| $ | 8,470 |
| 2 | % | $ | 25,337 |
| $ | 24,389 |
| 4 | % | $ | 8,451 |
| $ | 8,426 |
| — | % |
Impact of FX translation(2) | — |
| (106 | ) |
|
| — |
| (11 | ) |
|
| — |
| (113 | ) |
|
|
Total revenues—ex-FX(3) | $ | 8,654 |
| $ | 8,364 |
| 3 | % | $ | 25,337 |
| $ | 24,378 |
| 4 | % | $ | 8,451 |
| $ | 8,313 |
| 2 | % |
| Total operating expenses—as reported | $ | 4,661 |
| $ | 4,452 |
| 5 | % | $ | 13,997 |
| $ | 13,440 |
| 4 | % | $ | 4,608 |
| $ | 4,677 |
| (1 | )% |
Impact of FX translation(2) | — |
| (53 | ) |
|
| — |
| 15 |
|
|
| — |
| (70 | ) |
|
|
Total operating expenses—ex-FX(3) | $ | 4,661 |
| $ | 4,399 |
| 6 | % | $ | 13,997 |
| $ | 13,455 |
| 4 | % | $ | 4,608 |
| $ | 4,607 |
| — | % |
| Total provisions for LLR & PBC—as reported | $ | 1,933 |
| $ | 2,213 |
| (13 | )% | $ | 5,743 |
| $ | 5,790 |
| (1 | )% | $ | 1,984 |
| $ | 1,905 |
| 4 | % |
Impact of FX translation(2) | — |
| (23 | ) |
|
| — |
| (12 | ) |
|
| — |
| (19 | ) |
|
|
Total provisions for LLR & PBC—ex-FX(3) | $ | 1,933 |
| $ | 2,190 |
| (12 | )% | $ | 5,743 |
| $ | 5,778 |
| (1 | )% | $ | 1,984 |
| $ | 1,886 |
| 5 | % |
| Net income—as reported | $ | 1,566 |
| $ | 1,168 |
| 34 | % | $ | 4,236 |
| $ | 3,289 |
| 29 | % | $ | 1,437 |
| $ | 1,388 |
| 4 | % |
Impact of FX translation(2) | — |
| (18 | ) |
|
| — |
| (9 | ) |
|
| — |
| (13 | ) |
|
|
Net income—ex-FX(3) | $ | 1,566 |
| $ | 1,150 |
| 36 | % | $ | 4,236 |
| $ | 3,280 |
| 29 | % | $ | 1,437 |
| $ | 1,375 |
| 5 | % |
| |
| (1) | Includes both Citi-branded cards and Citi retail services. |
| |
| (2) | Reflects the impact of FX translation into U.S. dollars at the thirdfirst quarter of 2018 and year-to-date 20182019 average exchange rates for all periods presented. |
| |
| (3) | Presentation of this metric excluding FX translation is a non-GAAP financial measure. |
NM Not meaningful
NORTH AMERICA GCB
North America GCB provides traditional retail banking, including commercial banking, and its Citi-branded cards and Citi retail services card products to retail customers and small to mid-size businesses, as applicable, in the U.S. North America GCB’s U.S. cards product portfolio includes its proprietary portfolio (including the Citi Double Cash, Thank You and Value cards) and co-branded cards (including, among others, American Airlines and Costco) within Citi-branded cards as well as its co-brand and private label relationships (including, among others, Sears, The Home Depot, Best Buy and Macy’s) within Citi retail services.
As of September 30, 2018, March 31, 2019, North America GCB’s 692689 retail bank branches are concentrated in the six key metropolitan areas of New York, Chicago, Miami, Washington, D.C., Los Angeles and San Francisco. Also as of September 30, 2018, March 31, 2019, North America GCB had approximately 9.09.1 million retail banking customer accounts, $56.3$57.3 billion in retail banking loans and $181.9$185.4 billion in deposits. In addition, North America GCB had approximately 120.2119.4 million Citi-branded and Citi retail services credit card accounts with $137.8$135.9 billion in outstanding card loan balances, including the newly acquired $1.5 billion L.L.Bean portfolio.
balances.
| | | | Third Quarter | | Nine Months | | First Quarter | |
| In millions of dollars, except as otherwise noted | 2018 | 2017 | % Change | 2018 | 2017 | % Change | 2019 | 2018 | % Change |
| Net interest revenue | $ | 4,984 |
| $ | 4,825 |
| 3 | % | $ | 14,514 |
| $ | 14,074 |
| 3 | % | $ | 5,058 |
| $ | 4,750 |
| 6 | % |
| Non-interest revenue | 145 |
| 372 |
| (61 | ) | 776 |
| 1,014 |
| (23 | ) | 127 |
| 407 |
| (69 | ) |
| Total revenues, net of interest expense | $ | 5,129 |
| $ | 5,197 |
| (1 | )% | $ | 15,290 |
| $ | 15,088 |
| 1 | % | $ | 5,185 |
| $ | 5,157 |
| 1 | % |
| Total operating expenses | $ | 2,668 |
| $ | 2,482 |
| 7 | % | $ | 7,979 |
| $ | 7,677 |
| 4 | % | $ | 2,669 |
| $ | 2,645 |
| 1 | % |
| Net credit losses | $ | 1,242 |
| $ | 1,239 |
| — | % | $ | 3,816 |
| $ | 3,610 |
| 6 | % | $ | 1,429 |
| $ | 1,296 |
| 10 | % |
| Credit reserve build (release) | 116 |
| 463 |
| (75 | ) | 354 |
| 716 |
| (51 | ) | 98 |
| 123 |
| (20 | ) |
| Provision (release) for unfunded lending commitments | 5 |
| (3 | ) | NM |
| 3 |
| 6 |
| (50 | ) | 5 |
| (4 | ) | NM |
|
| Provision for benefits and claims | 5 |
| 9 |
| (44 | ) | 16 |
| 23 |
| (30 | ) | 6 |
| 6 |
| — |
|
| Provisions for credit losses and for benefits and claims | $ | 1,368 |
| $ | 1,708 |
| (20 | )% | $ | 4,189 |
| $ | 4,355 |
| (4 | )% | $ | 1,538 |
| $ | 1,421 |
| 8 | % |
| Income from continuing operations before taxes | $ | 1,093 |
| $ | 1,007 |
| 9 | % | $ | 3,122 |
| $ | 3,056 |
| 2 | % | $ | 978 |
| $ | 1,091 |
| (10 | )% |
| Income taxes | 243 |
| 365 |
| (33 | ) | 715 |
| 1,143 |
| (37 | ) | 209 |
| 253 |
| (17 | ) |
| Income from continuing operations | $ | 850 |
| $ | 642 |
| 32 | % | $ | 2,407 |
| $ | 1,913 |
| 26 | % | $ | 769 |
| $ | 838 |
| (8 | )% |
| Noncontrolling interests | — |
| — |
| — |
| — |
| — |
| — |
| — |
| — |
| — |
|
| Net income | $ | 850 |
| $ | 642 |
| 32 | % | $ | 2,407 |
| $ | 1,913 |
| 26 | % | $ | 769 |
| $ | 838 |
| (8 | )% |
Balance Sheet data (in billions of dollars) |
|
| |
|
| |
| |
|
|
| |
Balance Sheet data and ratios (in billions of dollars) | |
|
| |
|
|
| Average assets | $ | 249 |
| $ | 250 |
| — | % | $ | 247 |
| $ | 246 |
| — | % | $ | 250 |
| $ | 248 |
| 1 | % |
| Return on average assets | 1.35 | % | 1.02 | % |
|
| 1.30 | % | 1.04 | % |
|
| 1.25 | % | 1.37 | % |
|
|
| Efficiency ratio | 52 |
| 48 |
|
|
| 52 |
| 51 |
|
|
| 51 |
| 51 |
|
|
|
| Average deposits | $ | 180.2 |
| $ | 184.1 |
| (2 | ) | $ | 180.3 |
| $ | 184.6 |
| (2 | ) | $ | 182.3 |
| $ | 180.9 |
| 1 |
|
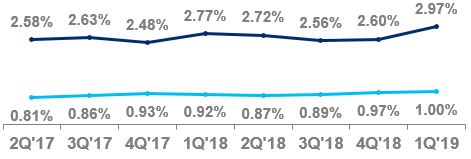
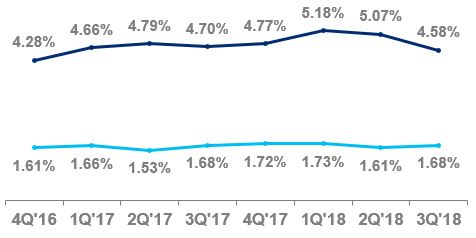
| Net credit losses as a percentage of average loans | 2.56 | % | 2.63 | % |
|
| 2.68 | % | 2.62 | % |
|
| 2.97 | % | 2.77 | % |
|
|
| Revenue by business |
|
| |
|
| |
| |
|
|
|
|
| |
|
|
| Retail banking | $ | 1,329 |
| $ | 1,366 |
| (3 | )% | $ | 3,984 |
| $ | 3,916 |
| 2 | % | $ | 1,316 |
| $ | 1,307 |
| 1 | % |
| Citi-branded cards | 2,108 |
| 2,178 |
| (3 | ) | 6,402 |
| 6,353 |
| 1 |
| 2,195 |
| 2,232 |
| (2 | ) |
| Citi retail services | 1,692 |
| 1,653 |
| 2 |
| 4,904 |
| 4,819 |
| 2 |
| 1,674 |
| 1,618 |
| 3 |
|
| Total | $ | 5,129 |
| $ | 5,197 |
| (1 | )% | $ | 15,290 |
| $ | 15,088 |
| 1 | % | $ | 5,185 |
| $ | 5,157 |
| 1 | % |
| Income from continuing operations by business |
|
| |
|
| |
| |
|
|
|
|
| |
|
|
| Retail banking | $ | 131 |
| $ | 169 |
| (22 | )% | $ | 432 |
| $ | 371 |
| 16 | % | $ | 83 |
| $ | 140 |
| (41 | )% |
| Citi-branded cards | 375 |
| 342 |
| 10 |
| 1,109 |
| 890 |
| 25 |
| 382 |
| 425 |
| (10 | ) |
| Citi retail services | 344 |
| 131 |
| NM |
| 866 |
| 652 |
| 33 |
| 304 |
| 273 |
| 11 |
|
| Total | $ | 850 |
| $ | 642 |
| 32 | % | $ | 2,407 |
| $ | 1,913 |
| 26 | % | $ | 769 |
| $ | 838 |
| (8 | )% |
NM Not meaningful
3Q181Q19 vs. 3Q171Q18
Net income increased 32% decreased 8%, due to lowerhigher cost of credit and higher expenses, partially offset by a lower effective tax rate due to the impact of Tax Reform, partially offset by lower revenues and higher expenses.revenues.
Revenues decreased increased 1%, as higher revenues in Citi retail services and retail banking were more thanlargely offset by lower revenues in Citi-branded cards, and retail banking.including the impact of the $150 million gain on the sale of the Hilton portfolio in the prior-year period. Excluding the gain on sale, revenues increased 4%, reflecting growth in all three businesses.
Retail banking revenues decreased 3%increased 1%. Excluding mortgage revenues (decline of 28%12%), retail banking revenues were up 1%2%, driven by continued growth in deposit margins and investments, largely offset by lower episodic transaction activity in commercial bankingspreads as well as increasing
rate sensitivity.modest deposit growth. Average deposits decreased 2% year-over-year, primarily driven by a reduction in money market balances, as clients transferred money to investments. Assetsincreased 1% and assets under management were upincreased 9%. The decline in mortgage revenues was driven by lower origination activity and higher cost of funds, reflecting the higher interest rate environment.
Cards revenues decreased 1%were largely unchanged. Excluding the gain on sale, revenues were up 5%. In Citi-branded cards, revenues decreased 3%2%, as growth in interest-earning balances was more than offset byincluding the impact of the Hilton portfoliogain on sale as well as previously disclosed partnership terms that went into effect earlier in 2018.the prior-year period. Excluding the gain on sale, Citi-branded cards revenues increased 5%, primarily driven by continued growth in interest-earning balances. Average loans increased 3% and purchase1%, compared to the first quarter of 2018, which represented the peak level of promotional balances in 2018, as Citi has now optimized its mix of interest-earning to non-interest earning balances. Purchase sales increased 9%.6%, or 7% excluding Hilton.
Citi retail services revenues increased 2%3%, primarily reflecting organic loan growth and the benefit of the L.L.Bean portfolio acquisition, partially offset by higher partner payments.acquisition. Average loans increased 7% and purchase sales both increased 11%7%.
Expenses increased 7%1%, driven byas volume growth and investments were largely offset by efficiency savings.
the timing of investment spending versus the prior-year period.
Provisions decreased 20% increased 8% from the prior-year period, primarily driven by higher net credit losses, partially offset by a lower net loan loss reserve build. Net credit losses increased 10%, primarily driven by higher net credit losses in Citi-branded cards (up 8% to $706 million) and Citi retail services (up 10% to $663 million). The increase in net credit losses primarily reflected volume growth and seasoning in both cards portfolios.
The net loan loss reserve build in the current quarter was $121$103 million primarily due to volume growth in both cards portfolios. This compares(compared to a build of $460$119 million in the prior-year period, which included $300 million related to an increase in net flow rates in the later delinquency buckets in Citi retail services and a slight increase in delinquencies for the Citi-branded cards portfolio.
Net credit losses were largely unchanged at $1.2 billion, driven by higher net credit losses in Citi-branded cards (up 5% to $644 million) and Citi retail services (up 5% to $566 million)period), offset by a $56 million decrease in retail banking, driven by episodic charge-offs in the commercial portfolio in the prior-year period. The increase in the cards net credit losses primarily reflectedreflecting volume growth and seasoning in both cards portfolios.
For additional information on North America GCB’s retail banking, including commercial banking, and its Citi-branded cards and Citi retail services portfolios, see “Credit Risk—Consumer Credit” below.
As part of itsFor additional information on Citi retail services business, Citi issuesservices’ co-brand and private label credit card products with Sears. As has been widely reported, on October 15, 2018, Sears, filed for Chapter 11 bankruptcy protection that includes, among other things, plans to close additional stores. The impact to Citi retail services, including on revenues due to reduced new
account acquisitions or lower purchase sales, will depend, among other things, on the magnitude and timing of the Sears store closures. Citi retail services could also incur additional costs related to customer communications, including to support spending activity on the predominantly general-purpose MasterCard portfolio. Citi does not currently expect the Chapter 11 filing to have an immediate or ongoing material impact on its consolidated results. For additional information, see “Forward-Looking Statements” below and “Risk-Factors—“North America GCB” and “Risk Factors—Strategic Risks” in Citi’s 20172018 Annual Report on Form 10-K.
2018 YTD vs. 2017 YTD
Net income increased 26%, driven by higher revenues, a lower effective tax rate due to the impact of Tax Reform and lower cost of credit, partially offset by higher expenses.
Revenues increased 1%, reflecting higher revenues across retail banking, Citi retail services and Citi-branded cards. Retail banking revenues increased 2%. Excluding mortgage revenues (decline of 24%), retail banking revenues increased 6%, driven by growth in deposit margins and investments. Cards revenues increased 1%. In Citi-branded cards, revenues increased 1% driven by the same factors described above, as well as the sale of the Hilton portfolio, which resulted in a gain of approximately $150 million in the first quarter of 2018. This gain was largely offset by the loss of operating revenues from the portfolio. Citi retail services revenues increased 2%, driven by the same factors described above.
Expenses increased 4%, driven by the same factors described above, partially offset by efficiency savings.
Provisions decreased 4%. Net credit losses increased 6%, driven by volume growth and seasoning in both cards portfolios. This increase was more than offset by a 51% decline in the net loan loss reserve build, driven by the same factors described above.
LATIN AMERICA GCB
Latin America GCB provides traditional retail banking, including commercial banking, and its Citi-branded card products to retail customers and small to mid-size businesses in Mexico through Citibanamex, one of Mexico’s largest banks.
At September 30, 2018, March 31, 2019, Latin America GCB had 1,4631,464 retail branches in Mexico, with approximately 29.130.0 million retail banking customer accounts, $21.0$19.7 billion in retail banking loans and $30.1$28.4 billion in deposits. In addition, the business had approximately 5.75.5 million Citi-branded card accounts with $5.8$5.6 billion in outstanding card loan balances.
| | | | Third Quarter | | Nine Months | % Change | First Quarter | |
| In millions of dollars, except as otherwise noted | 2018 | 2017 | % Change | 2018 | 2017 | 2019 | 2018 | % Change |
| Net interest revenue | $ | 1,042 |
| $ | 1,038 |
| — | % | $ | 3,052 |
| $ | 2,853 |
| 7 | % | $ | 975 |
| $ | 997 |
| (2 | )% |
Non-interest revenue(1) | 628 |
| 350 |
| 79 |
| 1,346 |
| 1,010 |
| 33 |
| 406 |
| 343 |
| 18 |
|
| Total revenues, net of interest expense | $ | 1,670 |
| $ | 1,388 |
| 20 | % | $ | 4,398 |
| $ | 3,863 |
| 14 | % | $ | 1,381 |
| $ | 1,340 |
| 3 | % |
| Total operating expenses | $ | 828 |
| $ | 779 |
| 6 | % | $ | 2,369 |
| $ | 2,191 |
| 8 | % | $ | 735 |
| $ | 755 |
| (3 | )% |
| Net credit losses | $ | 307 |
| $ | 295 |
| 4 | % | $ | 863 |
| $ | 825 |
| 5 | % | $ | 298 |
| $ | 278 |
| 7 | % |
| Credit reserve build | 31 |
| 44 |
| (30 | ) | 106 |
| 106 |
| — |
| (7 | ) | 42 |
| NM |
|
| Provision (release) for unfunded lending commitments | — |
| (1 | ) | 100 |
| 1 |
| (2 | ) | NM |
| — |
| 1 |
| (100 | ) |
| Provision for benefits and claims | 22 |
| 19 |
| 16 |
| 59 |
| 57 |
| 4 |
| 6 |
| 20 |
| (70 | ) |
| Provisions for credit losses and for benefits and claims (LLR & PBC) | $ | 360 |
| $ | 357 |
| 1 | % | $ | 1,029 |
| $ | 986 |
| 4 | % | $ | 297 |
| $ | 341 |
| (13 | )% |
| Income from continuing operations before taxes | $ | 482 |
| $ | 252 |
| 91 | % | $ | 1,000 |
| $ | 686 |
| 46 | % | $ | 349 |
| $ | 244 |
| 43 | % |
| Income taxes | 148 |
| 83 |
| 78 |
| 283 |
| 241 |
| 17 |
| 97 |
| 65 |
| 49 |
|
| Income from continuing operations | $ | 334 |
| $ | 169 |
| 98 | % | $ | 717 |
| $ | 445 |
| 61 | % | $ | 252 |
| $ | 179 |
| 41 | % |
| Noncontrolling interests | — |
| 1 |
| (100 | ) | — |
| 4 |
| (100 | ) | — |
| — |
| — |
|
| Net income | $ | 334 |
| $ | 168 |
| 99 | % | $ | 717 |
| $ | 441 |
| 63 | % | $ | 252 |
| $ | 179 |
| 41 | % |
Balance Sheet data (in billions of dollars) |
|
| |
|
| |
| |
|
|
| |
Balance Sheet data and ratios (in billions of dollars) | |
|
| |
|
|
| Average assets | $ | 45 |
| $ | 47 |
| (4 | )% | $ | 44 |
| $ | 45 |
| (2 | )% | $ | 44 |
| $ | 44 |
| — | % |
| Return on average assets | 2.94 | % | 1.42 | % |
|
| 2.18 | % | 1.31 | % |
|
| 2.32 | % | 1.65 | % |
|
|
| Efficiency ratio | 50 |
| 56 |
|
|
| 54 |
| 57 |
|
|
| 53 |
| 56 |
|
|
|
| Average deposits | $ | 29.4 |
| $ | 28.8 |
| 2 |
| $ | 28.9 |
| $ | 27.3 |
| 6 |
| $ | 28.6 |
| $ | 28.9 |
| (1 | ) |
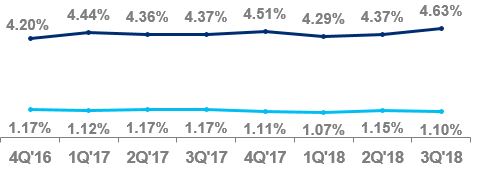
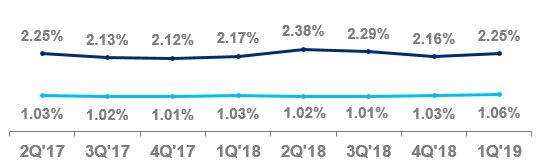
| Net credit losses as a percentage of average loans | 4.63 | % | 4.37 | % |
|
| 4.44 | % | 4.39 | % |
|
| 4.72 | % | 4.29 | % |
|
|
| Revenue by business |
|
| |
|
| | |
|
|
|
| |
|
|
| Retail banking | $ | 1,265 |
| $ | 992 |
| 28 | % | $ | 3,230 |
| $ | 2,781 |
| 16 | % | $ | 1,008 |
| $ | 959 |
| 5 | % |
| Citi-branded cards | 405 |
| 396 |
| 2 |
| 1,168 |
| 1,082 |
| 8 |
| 373 |
| 381 |
| (2 | ) |
| Total | $ | 1,670 |
| $ | 1,388 |
| 20 | % | $ | 4,398 |
| $ | 3,863 |
| 14 | % | $ | 1,381 |
| $ | 1,340 |
| 3 | % |
| Income from continuing operations by business |
|
| |
|
| |
| |
|
|
|
|
| |
|
|
| Retail banking | $ | 279 |
| $ | 129 |
| NM |
| $ | 572 |
| $ | 310 |
| 85 | % | $ | 197 |
| $ | 134 |
| 47 | % |
| Citi-branded cards | 55 |
| 40 |
| 38 | % | 145 |
| 135 |
| 7 |
| 55 |
| 45 |
| 22 | % |
| Total | $ | 334 |
| $ | 169 |
| 98 | % | $ | 717 |
| $ | 445 |
| 61 | % | $ | 252 |
| $ | 179 |
| 41 | % |
| | | FX translation impact |
|
| |
|
| | |
|
|
|
|
| |
|
|
| Total revenues—as reported | $ | 1,670 |
| $ | 1,388 |
| 20 | % | $ | 4,398 |
| $ | 3,863 |
| 14 | % | $ | 1,381 |
| $ | 1,340 |
| 3 | % |
Impact of FX translation(2) | — |
| (66 | ) |
|
| — |
| (45 | ) |
|
| |
Impact of FX translation(1) | | — |
| (43 | ) |
|
|
Total revenues—ex-FX(3)(2) | $ | 1,670 |
| $ | 1,322 |
| 26 | % | $ | 4,398 |
| $ | 3,818 |
| 15 | % | $ | 1,381 |
| $ | 1,297 |
| 6 | % |
| Total operating expenses—as reported | $ | 828 |
| $ | 779 |
| 6 | % | $ | 2,369 |
| $ | 2,191 |
| 8 | % | $ | 735 |
| $ | 755 |
| (3 | )% |
Impact of FX translation(2) | — |
| (31 | ) |
|
| — |
| (21 | ) |
|
| |
Impact of FX translation(1) | | — |
| (21 | ) |
|
|
Total operating expenses—ex-FX(3)(2) | $ | 828 |
| $ | 748 |
| 11 | % | $ | 2,369 |
| $ | 2,170 |
| 9 | % | $ | 735 |
| $ | 734 |
| — | % |
| Provisions for LLR & PBC—as reported | $ | 360 |
| $ | 357 |
| 1 | % | $ | 1,029 |
| $ | 986 |
| 4 | % | $ | 297 |
| $ | 341 |
| (13 | )% |
Impact of FX translation(2) | — |
| (17 | ) |
|
| — |
| (12 | ) |
|
| |
Impact of FX translation(1) | | — |
| (11 | ) |
|
|
Provisions for LLR & PBC—ex-FX(3)(2) | $ | 360 |
| $ | 340 |
| 6 | % | $ | 1,029 |
| $ | 974 |
| 6 | % | $ | 297 |
| $ | 330 |
| (10 | )% |
| Net income—as reported | $ | 334 |
| $ | 168 |
| 99 | % | $ | 717 |
| $ | 441 |
| 63 | % | $ | 252 |
| $ | 179 |
| 41 | % |
Impact of FX translation(2) | — |
| (11 | ) |
|
| — |
| (9 | ) |
|
| |
Impact of FX translation(1) | | — |
| (7 | ) |
|
|
Net income—ex-FX(3)(2) | $ | 334 |
| $ | 157 |
| NM |
| $ | 717 |
| $ | 432 |
| 66 | % | $ | 252 |
| $ | 172 |
| 47 | % |
| |
| (1) | Third quarter of 2018 includes an approximate $250 million gain on the sale of an asset management business. See Note 2 to the Consolidated Financial Statements. |
| |
(2) | Reflects the impact of FX translation into U.S. dollars at the thirdfirst quarter of 2018 and year-to-date 20182019 average exchange rates for all periods presented. |
| |
(3)(2) | Presentation of this metric excluding FX translation is a non-GAAP financial measure. |
NM Not meaningful
The discussion of the results of operations for Latin America GCB below excludes the impact of FX translation for all periods presented. Presentations of the results of operations, excluding the impact of FX translation, are non-GAAP financial measures. For a reconciliation of certain of these metrics to the reported results, see the table above.
3Q181Q19 vs. 3Q171Q18
Net income increased $177 million to $334 million,47%, reflecting higher revenues and lower cost of credit, partially offset by a lowerhigher effective tax rate, as a result of Tax Reform, partially offset by higherwhile expenses and cost of credit.were largely unchanged.
Revenues increased 26%6%, including the gain onimpact of the sale of an asset management business (approximately $250 million). For additional information, see Note 2 toin Mexico in 2018. The impact was a net benefit in the Consolidated Financial Statements. Excluding thecurrent quarter, as Citi recorded a small residual gain on the sale, partially offset by the absence of related revenues. Excluding this impact, Latin America GCBrevenueswere up 8% increased 5%, largely driven by increases in bothhigher retail banking and cards.revenues.
Retail banking revenues increased 34%. Excluding9% (7% excluding the gain on sale, retail banking revenues increased 8%impact), driven by continued deposit growth, across commercial and mortgage loans and deposits, as well as improved deposit spreads due to higher interest rates. Average loans grew 4%, average deposits grew 8% and assets under management both grew 5%1%. Average loans declined 2%, due in part to a slowdown in commercial banking activity where client sentiment has become more cautious. Cards revenues increased 7%1%, due to continued volume growth, reflecting higher purchase sales (up 14%8%) and full-rate revolving loans.loans, partially offset by lower fees revenue. Average cards loans grew 6%5%. Although consumer confidence remained strong in Mexico in the current quarter, Latin America GCB has begun to see a slowdown in overall economic growth and industry lending volumes in Mexico.
Expenses increased 11%, driven by volume growth, were largely unchanged, as ongoing investment spending and higher repositioning charges, partiallyvolume-driven growth were offset by efficiency savings.
Provisions increased 6% decreased 10%, as higher net credit losses were partiallymore than offset by a lowernet loan loss release compared to a net loan loss reserve build.build in the prior-year period. The increase in net credit loss increaselosses was primarily reflected an episodic commercial charge-off that was fully offsetdriven by a related loan loss reserve release.volume growth and seasoning in the cards portfolio.
For additional information on LatinAmerica GCB’s retail banking, including commercial banking, and its Citi-branded cards portfolios, see “Credit Risk—Consumer Credit” below.
2018 YTD vs. 2017 YTD
Year-to-date, Latin America GCB has experienced similar trends to those described above. Net income increased 66%, driven by the same factors described above.
Revenues increased 15%, including the gain on sale in the third quarter of 2018. Excluding the gain on sale, revenues increased 9%, reflecting higher revenues in both retail banking and cards. Retail banking revenues increased 8%, driven by the same factors described above. Cards revenues increased 9%, driven by the same factors described above.
Expenses increased 9%, driven by the same factors described above.
Provisions increased 6%, driven by higher net credit losses and a higher net loan loss reserve build, primarily due to volume growth and seasoning in cards. The increase in net credit losses also reflected the episodic commercial charge-off that was fully offset by a related loan loss reserve release.
ASIA GCB
Asia GCB provides traditional retail banking, including commercial banking, and its Citi-branded card products to retail customers and small to mid-size businesses, as applicable. During the thirdfirst quarter of 2018, 2019, Asia GCB’s most significant revenues in Asia were from Singapore, Hong Kong, Singapore, Korea, India, Australia, Taiwan, Thailand, Philippines, Indonesia and Malaysia. Included within Asia GCB, traditional retail banking and Citi-branded card products are also provided to retail customers in certain EMEA countries, primarily Poland, Russia and the United Arab Emirates.
At September 30, 2018,March 31, 2019, on a combined basis, the businesses had 262251 retail branches, approximately 15.9 million retail banking customer accounts, $69.5$70.0 billion in retail banking loans and $98.7$101.7 billion in deposits. In addition, the businesses had approximately 15.415.2 million Citi-branded card accounts with $18.6$18.8 billion in outstanding card loan balances.
| | | | Third Quarter | | Nine Months | % Change | First Quarter | |
In millions of dollars, except as otherwise noted (1) | 2018 | 2017 | % Change | 2018 | 2017 | 2019 | 2018 | % Change |
| Net interest revenue | $ | 1,210 |
| $ | 1,208 |
| — | % | $ | 3,669 |
| $ | 3,483 |
| 5 | % | $ | 1,220 |
| $ | 1,233 |
| (1 | )% |
| Non-interest revenue | 645 |
| 677 |
| (5 | ) | 1,980 |
| 1,955 |
| 1 |
| 665 |
| 696 |
| (4 | ) |
| Total revenues, net of interest expense | $ | 1,855 |
| $ | 1,885 |
| (2 | )% | $ | 5,649 |
| $ | 5,438 |
| 4 | % | $ | 1,885 |
| $ | 1,929 |
| (2 | )% |
| Total operating expenses | $ | 1,165 |
| $ | 1,191 |
| (2 | )% | $ | 3,649 |
| $ | 3,572 |
| 2 | % | $ | 1,204 |
| $ | 1,277 |
| (6 | )% |
| Net credit losses | $ | 165 |
| $ | 170 |
| (3 | )% | $ | 497 |
| $ | 487 |
| 2 | % | $ | 164 |
| $ | 162 |
| 1 | % |
| Credit reserve build (release) | 39 |
| (21 | ) | NM |
| 24 |
| (34 | ) | NM |
| (15 | ) | (21 | ) | 29 |
|
| Provision (release) for unfunded lending commitments | 1 |
| (1 | ) | NM |
| 4 |
| (4 | ) | NM |
| — |
| 2 |
| (100 | ) |
| Provisions for credit losses | $ | 205 |
| $ | 148 |
| 39 | % | $ | 525 |
| $ | 449 |
| 17 | % | $ | 149 |
| $ | 143 |
| 4 | % |
| Income from continuing operations before taxes | $ | 485 |
| $ | 546 |
| (11 | )% | $ | 1,475 |
| $ | 1,417 |
| 4 | % | $ | 532 |
| $ | 509 |
| 5 | % |
| Income taxes | 102 |
| 187 |
| (45 | ) | 359 |
| 479 |
| (25 | ) | 116 |
| 136 |
| (15 | ) |
| Income from continuing operations | $ | 383 |
| $ | 359 |
| 7 | % | $ | 1,116 |
| $ | 938 |
| 19 | % | $ | 416 |
| $ | 373 |
| 12 | % |
| Noncontrolling interests | 1 |
| 1 |
| — |
| 4 |
| 3 |
| 33 |
| — |
| 2 |
| (100 | ) |
| Net income | $ | 382 |
| $ | 358 |
| 7 | % | $ | 1,112 |
| $ | 935 |
| 19 | % | $ | 416 |
| $ | 371 |
| 12 | % |
Balance Sheet data (in billions of dollars) |
|
|
|
|
|
| |
| |
|
|
| |
Balance Sheet data and ratios (in billions of dollars) | |
|
|
|
|
|
|
| Average assets | $ | 130 |
| $ | 124 |
| 5 | % | $ | 130 |
| $ | 124 |
| 5 | % | $ | 132 |
| $ | 131 |
| 1 | % |
| Return on average assets | 1.17 | % | 1.15 | % |
|
| 1.14 | % | 1.01 | % |
|
| 1.28 | % | 1.15 | % |
|
|
| Efficiency ratio | 63 |
| 63 |
| | 65 |
| 66 |
|
|
| 64 |
| 66 |
| |
| Average deposits | $ | 97.6 |
| $ | 95.2 |
| 3 |
| $ | 98.1 |
| $ | 94.1 |
| 4 |
| $ | 99.3 |
| $ | 99.1 |
| — |
|
| Net credit losses as a percentage of average loans | 0.75 | % | 0.78 | % |
|
| 0.75 | % | 0.77 | % |
|
| 0.75 | % | 0.73 | % |
|
|
| Revenue by business | | | | |
|
| | |
| Retail banking | $ | 1,123 |
| $ | 1,163 |
| (3 | )% | $ | 3,463 |
| $ | 3,327 |
| 4 | % | $ | 1,143 |
| $ | 1,198 |
| (5 | )% |
| Citi-branded cards | 732 |
| 722 |
| 1 |
| 2,186 |
| 2,111 |
| 4 |
| 742 |
| 731 |
| 2 |
|
| Total | $ | 1,855 |
| $ | 1,885 |
| (2 | )% | $ | 5,649 |
| $ | 5,438 |
| 4 | % | $ | 1,885 |
| $ | 1,929 |
| (2 | )% |
| Income from continuing operations by business |
|
|
|
|
|
| | |
|
|
|
|
|
|
|
|
| Retail banking | $ | 256 |
| $ | 248 |
| 3 | % | $ | 766 |
| $ | 617 |
| 24 | % | $ | 246 |
| $ | 246 |
| — | % |
| Citi-branded cards | 127 |
| 111 |
| 14 |
| 350 |
| 321 |
| 9 |
| 170 |
| 127 |
| 34 |
|
| Total | $ | 383 |
| $ | 359 |
| 7 | % | $ | 1,116 |
| $ | 938 |
| 19 | % | $ | 416 |
| $ | 373 |
| 12 | % |
| | | FX translation impact |
|
| | |
|
|
|
|
| Total revenues—as reported | $ | 1,855 |
| $ | 1,885 |
| (2 | )% | $ | 5,649 |
| $ | 5,438 |
| 4 | % | $ | 1,885 |
| $ | 1,929 |
| (2 | )% |
Impact of FX translation(2) | — |
| (40 | ) |
|
| — |
| 34 |
|
|
| — |
| (70 | ) |
|
|
Total revenues—ex-FX(3) | $ | 1,855 |
| $ | 1,845 |
| 1 | % | $ | 5,649 |
| $ | 5,472 |
| 3 | % | $ | 1,885 |
| $ | 1,859 |
| 1 | % |
| Total operating expenses—as reported | $ | 1,165 |
| $ | 1,191 |
| (2 | )% | $ | 3,649 |
| $ | 3,572 |
| 2 | % | $ | 1,204 |
| $ | 1,277 |
| (6 | )% |
Impact of FX translation(2) | — |
| (22 | ) |
|
| — |
| 36 |
|
|
| — |
| (49 | ) |
|
|
Total operating expenses—ex-FX(3) | $ | 1,165 |
| $ | 1,169 |
| — | % | $ | 3,649 |
| $ | 3,608 |
| 1 | % | $ | 1,204 |
| $ | 1,228 |
| (2 | )% |
| Provisions for loan losses—as reported | $ | 205 |
| $ | 148 |
| 39 | % | $ | 525 |
| $ | 449 |
| 17 | % | $ | 149 |
| $ | 143 |
| 4 | % |
Impact of FX translation(2) | — |
| (6 | ) |
|
| — |
| — |
|
|
| — |
| (8 | ) |
|
|
Provisions for loan losses—ex-FX(3) | $ | 205 |
| $ | 142 |
| 44 | % | $ | 525 |
| $ | 449 |
| 17 | % | $ | 149 |
| $ | 135 |
| 10 | % |
| Net income—as reported | $ | 382 |
| $ | 358 |
| 7 | % | $ | 1,112 |
| $ | 935 |
| 19 | % | $ | 416 |
| $ | 371 |
| 12 | % |
Impact of FX translation(2) | — |
| (7 | ) |
|
| — |
| — |
|
|
| — |
| (6 | ) |
|
|
Net income—ex-FX(3) | $ | 382 |
| $ | 351 |
| 9 | % | $ | 1,112 |
| $ | 935 |
| 19 | % | $ | 416 |
| $ | 365 |
| 14 | % |
| |
| (1) | Asia GCB includes the results of operations of GCB activities in certain EMEA countries for all periods presented. |
| |
| (2) | Reflects the impact of FX translation into U.S. dollars at the thirdfirst quarter of 2018 and year-to-date 20182019 average exchange rates for all periods presented. |
| |
| (3) | Presentation of this metric excluding FX translation is a non-GAAP financial measure. |
NM Not meaningful
The discussion of the results of operations for Asia GCB below excludes the impact of FX translation for all periods presented. Presentations of the results of operations, excluding the impact of FX translation, are non-GAAP financial measures. For a reconciliation of certain of these metrics to the reported results, see the table above.
3Q181Q19 vs. 3Q171Q18
Net income increased 9%14%, reflecting higher revenues, lower expenses and a lower effective tax rate, as a result of Tax Reform, partially offset by higher cost of credit.
Revenues increased 1%, driven by higher cards revenues, partially offset by lower retail banking revenues.
Retail banking revenues decreased 2%1% compared to the prior-year period, which included a modest one-time gain. Excluding the gain, retail banking revenues increased 1%, as continued growth in deposit and insurance revenues was more than offset by lower investment revenues due to weaker market sentiment. Investment sales decreased 22%24%, while assets under management grew 9% and10%, average deposits increased 4% and average loans increased 3%. Retail lending revenues declined 1%, as volumecontinued growth in personal and commercial loans was more than offset by lower mortgage revenues due to spread compression. Average loans grew 4%.
Cards revenues increased 4%6%, driven by continued growth in average loans (up 2%3%) and purchase sales (up 6%5%), as well as a modest one-time gain. Excluding the gain, cards revenues grew 1%.
Expenses were largely unchanged, decreased 2%, as efficiency savings more than offset volume-driven growth and ongoing investment spending were offset by efficiency savings.spending.
Provisions increased 44%10%, primarily driven by ahigher net loan loss reserve build compared to a net loan loss reserve release in the prior-year period.credit losses. Net credit losses increased 7%, primarily reflecting volume growth and seasoning. Overall credit quality continued to remain stable in the region.
For additional information on AsiaGCB’s retail banking, including commercial banking, and its Citi-branded cards portfolios, see “Credit Risk—Consumer Credit” below.
2018 YTD vs. 2017 YTD
Year-to-date, Asia GCB has experienced similar trends to
those described above. Net income increased 19%, due to higher revenues and the lower effective tax rate, partially offset by higher expenses and a higher cost of credit.
Revenues increased 3%, driven by continued momentum in retail banking and cards. Retail banking revenues increased 3%, driven by growth in deposits, partially offset by lower investment and mortgage revenues. Cards revenues were up 3%, driven by the same factors described above.
Expenses increased 1%, as volume-driven growth and ongoing investment spending were partially offset by efficiency savings.
Provisions were up 17%, primarily driven by a net loan loss reserve build compared to a release in the prior-year period and modestly higher net credit losses related to volume growth and seasoning.
INSTITUTIONAL CLIENTS GROUP
Institutional Clients Group (ICG) includes Banking and Markets and securities services (for additional information on these businesses, see “Citigroup Segments” above). ICG provides corporate, institutional, public sector and high-net-worth clients around the world with a full range of wholesale banking products and services, including fixed income and equity sales and trading, foreign exchange, prime brokerage, derivative services, equity and fixed income research, corporate lending, investment banking and advisory services, private banking, cash management, trade finance and securities services. ICG transacts with clients in both cash instruments and derivatives, including fixed income, foreign currency, equity and commodity products.
ICG revenue is generated primarily from fees and spreads associated with these activities. ICG earns fee income for assisting clients with transactional services and clearing, providing brokerage and investment banking services and other such activities. Such fees are recognized at the point in time when Citigroup’s performance under the terms of a contractual arrangement is completed, which is typically at the trade/execution date or closing of a transaction. Revenue generated from these activities is recorded in Commissions and fees and Investment banking. Revenue is also generated from assets under custody and administration, which is recognized as/when the associated promised service is satisfied, which normally occurs at the point in time the service is requested by the customer and provided by Citi. Revenue generated from these activities is primarily recorded in Administration and other fiduciary fees. For additionalmore information on these various types of revenues,ICG’s business activities, see Note 5 to the Consolidated Financial Statements.“Institutional Clients Group” in Citi’s 2018 Annual Report on Form 10-K.
In addition, as a market maker, ICG facilitates transactions, including holding product inventory to meet client demand, and earns the differential between the price at which it buys and sells the products. These price differentials and the unrealized gains and losses on the inventory are recorded in Principal transactions(for additional information on Principal transactions revenue, see Note 6 to the Consolidated Financial Statements). Other primarily includes mark-to-market gains and losses on certain credit derivatives, gains and losses on available-for-sale (AFS) debt securities, gains and losses on equity securities not held in trading accounts, and other non-recurring gains and losses. Interest income earned on assets held, less interest paid to customers on deposits and long- and short-term debt, is recorded as Net interest revenue.
The amount and types of Markets revenues are impacted by a variety of interrelated factors, including market liquidity; changes in market variables such as interest rates, foreign exchange rates, equity prices, commodity prices and credit spreads, as well as their implied volatilities; investor confidence; and other macroeconomic conditions. Assuming all other market conditions do not change, increases in client activity levels or bid/offer spreads generally result in increases in revenues. However, changes in market conditions can significantly impact client activity levels, bid/offer spreads and the fair value of product inventory. For example, a decrease in market liquidity may increase bid/offer spreads, decrease client activity levels and widen credit spreads on product inventory positions.
ICG’s management of the Markets businesses involves daily monitoring and evaluating of the above factors at the trading desk as well as the country level. ICG does not separately track the impact on total Markets revenues of the volume of transactions, bid/offer spreads, fair value changes of product inventory positions and economic hedges because, as noted above, these components are interrelated and are not deemed useful or necessary individually to manage the Markets businesses at an aggregatelevel.
In the Markets businesses, client revenues are those revenues directly attributable to client transactions at the time of inception, including commissions, interest or fees earned. Client revenues do not include the results of client facilitation activities (for example, holding product inventory in anticipation of client demand) or the results of certain economic hedging activities.
ICG’s international presence is supported by trading floors in approximately 80 countries and a proprietary network in 98 countries and jurisdictions. At September 30, 2018, March 31, 2019, ICG had approximately $1.4 trillion of assets and $685$702 billion of deposits, while two of its businesses—securities services and issuer services—managed approximately $18.0$18.3 trillion of assets under custody compared to $17.1$17.7 trillion at the end of the prior-year period.
|
| | | | | | | | |
| | First Quarter | |
| In millions of dollars, except as otherwise noted | 2019 | 2018 | % Change |
| Commissions and fees | $ | 1,121 |
| $ | 1,213 |
| (8 | )% |
| Administration and other fiduciary fees | 670 |
| 694 |
| (3 | ) |
| Investment banking | 1,112 |
| 985 |
| 13 |
|
| Principal transactions | 2,631 |
| 2,844 |
| (7 | ) |
| Other | 285 |
| 465 |
| (39 | ) |
| Total non-interest revenue | $ | 5,819 |
| $ | 6,201 |
| (6 | )% |
| Net interest revenue (including dividends) | 3,875 |
| 3,654 |
| 6 |
|
| Total revenues, net of interest expense | $ | 9,694 |
| $ | 9,855 |
| (2 | )% |
| Total operating expenses | $ | 5,427 |
| $ | 5,506 |
| (1 | )% |
| Net credit losses | $ | 55 |
| $ | 105 |
| (48 | )% |
| Credit reserve build (release) | (54 | ) | (175 | ) | 69 |
|
| Provision (release) for unfunded lending commitments | 20 |
| 29 |
| (31 | ) |
| Provisions for credit losses | $ | 21 |
| $ | (41 | ) | NM |
|
| Income from continuing operations before taxes | $ | 4,246 |
| $ | 4,390 |
| (3 | )% |
| Income taxes | 924 |
| 1,056 |
| (13 | ) |
| Income from continuing operations | $ | 3,322 |
| $ | 3,334 |
| — | % |
| Noncontrolling interests | 11 |
| 15 |
| (27 | ) |
| Net income | $ | 3,311 |
| $ | 3,319 |
| — | % |
EOP assets (in billions of dollars) | $ | 1,425 |
| $ | 1,407 |
| 1 | % |
Average assets (in billions of dollars) | 1,414 |
| 1,388 |
| 2 |
|
| Return on average assets | 0.95 | % | 0.97 | % |
|
|
| Efficiency ratio | 56 |
| 56 |
|
|
|
| Revenues by region | | |
|
|
| North America | $ | 3,119 |
| $ | 3,266 |
| (5 | )% |
| EMEA | 3,170 |
| 3,167 |
| — |
|
| Latin America | 1,160 |
| 1,216 |
| (5 | ) |
| Asia | 2,245 |
| 2,206 |
| 2 |
|
| Total | $ | 9,694 |
| $ | 9,855 |
| (2 | )% |
| Income from continuing operations by region | | |
|
|
| North America | $ | 714 |
| $ | 858 |
| (17 | )% |
| EMEA | 1,125 |
| 1,113 |
| 1 |
|
| Latin America | 503 |
| 494 |
| 2 |
|
| Asia | 980 |
| 869 |
| 13 |
|
| Total | $ | 3,322 |
| $ | 3,334 |
| — | % |
|
| | | | | | | | | | | | | | | | |
| | Third Quarter | | Nine Months | % Change |
| In millions of dollars, except as otherwise noted | 2018 | 2017 | % Change | 2018 | 2017 |
| Commissions and fees | $ | 1,085 |
| $ | 1,100 |
| (1 | )% | $ | 3,425 |
| $ | 3,230 |
| 6 | % |
| Administration and other fiduciary fees | 686 |
| 688 |
| — |
| 2,093 |
| 1,997 |
| 5 |
|
| Investment banking | 1,029 |
| 1,163 |
| (12 | ) | 3,260 |
| 3,516 |
| (7 | ) |
| Principal transactions | 2,447 |
| 1,827 |
| 34 |
| 7,689 |
| 6,709 |
| 15 |
|
Other(1) | (18 | ) | 704 |
| NM |
| 554 |
| 951 |
| (42 | ) |
| Total non-interest revenue | $ | 5,229 |
| $ | 5,482 |
| (5 | )% | $ | 17,021 |
| $ | 16,403 |
| 4 | % |
| Net interest revenue (including dividends) | 4,012 |
| 3,948 |
| 2 |
| 11,759 |
| 11,767 |
| — |
|
| Total revenues, net of interest expense | $ | 9,241 |
| $ | 9,430 |
| (2 | )% | $ | 28,780 |
| $ | 28,170 |
| 2 | % |
| Total operating expenses | $ | 5,191 |
| $ | 5,138 |
| 1 | % | $ | 16,152 |
| $ | 15,503 |
| 4 | % |
| Net credit losses | $ | 23 |
| $ | 44 |
| (48 | )% | $ | 127 |
| $ | 140 |
| (9 | )% |
| Credit reserve build (release) | 7 |
| (38 | ) | NM |
| (136 | ) | (229 | ) | 41 |
|
| Provision (release) for unfunded lending commitments | 41 |
| (170 | ) | NM |
| 64 |
| (193 | ) | NM |
|
| Provisions for credit losses | $ | 71 |
| $ | (164 | ) | NM |
| $ | 55 |
| $ | (282 | ) | NM |
|
| Income from continuing operations before taxes | $ | 3,979 |
| $ | 4,456 |
| (11 | )% | $ | 12,573 |
| $ | 12,949 |
| (3 | )% |
| Income taxes | 862 |
| 1,394 |
| (38 | ) | 2,890 |
| 4,096 |
| (29 | ) |
| Income from continuing operations | $ | 3,117 |
| $ | 3,062 |
| 2 | % | $ | 9,683 |
| $ | 8,853 |
| 9 | % |
| Noncontrolling interests | (6 | ) | 14 |
| NM |
| 21 |
| 47 |
| (55 | ) |
| Net income | $ | 3,123 |
| $ | 3,048 |
| 2 | % | $ | 9,662 |
| $ | 8,806 |
| 10 | % |
EOP assets (in billions of dollars) | $ | 1,404 |
| $ | 1,370 |
| 2 | % | | | |
Average assets (in billions of dollars) | 1,402 |
| 1,369 |
| 2 |
| $ | 1,399 |
| $ | 1,349 |
| 4 | % |
| Return on average assets | 0.88 | % | 0.88 | % |
|
| 0.92 | % | 0.87 | % |
|
|
| Efficiency ratio | 56 |
| 54 |
|
|
| 56 |
| 55 |
|
|
|
| Revenues by region | | |
|
| | |
|
|
| North America | $ | 3,329 |
| $ | 3,709 |
| (10 | )% | $ | 10,105 |
| $ | 10,877 |
| (7 | )% |
| EMEA | 2,927 |
| 2,703 |
| 8 |
| 9,137 |
| 8,438 |
| 8 |
|
| Latin America | 1,055 |
| 1,099 |
| (4 | ) | 3,427 |
| 3,354 |
| 2 |
|
| Asia | 1,930 |
| 1,919 |
| 1 |
| 6,111 |
| 5,501 |
| 11 |
|
| Total | $ | 9,241 |
| $ | 9,430 |
| (2 | )% | $ | 28,780 |
| $ | 28,170 |
| 2 | % |
| Income from continuing operations by region | | |
|
| | |
|
|
|
| North America | $ | 870 |
| $ | 1,298 |
| (33 | )% | $ | 2,755 |
| $ | 3,463 |
| (20 | )% |
| EMEA | 972 |
| 753 |
| 29 |
| 3,072 |
| 2,401 |
| 28 |
|
| Latin America | 541 |
| 388 |
| 39 |
| 1,546 |
| 1,211 |
| 28 |
|
| Asia | 734 |
| 623 |
| 18 |
| 2,310 |
| 1,778 |
| 30 |
|
| Total | $ | 3,117 |
| $ | 3,062 |
| 2 | % | $ | 9,683 |
| $ | 8,853 |
| 9 | % |
Average loans by region (in billions of dollars) | | |
|
| | |
|
|
|
| North America | $ | 166 |
| $ | 152 |
| 9 | % | $ | 164 |
| $ | 149 |
| 10 | % |
| EMEA | 82 |
| 71 |
| 15 |
| 80 |
| 68 |
| 18 |
|
| Latin America | 33 |
| 34 |
| (3 | ) | 33 |
| 34 |
| (3 | ) |
| Asia | 65 |
| 64 |
| 2 |
| 67 |
| 61 |
| 10 |
|
| Total | $ | 346 |
| $ | 321 |
| 8 | % | $ | 344 |
| $ | 312 |
| 10 | % |
EOP deposits by business (in billions of dollars) | | | | | |
|
|
| Treasury and trade solutions | $ | 470 |
| $ | 428 |
| 10 | % | | |
|
|
All other ICG businesses | 215 |
| 212 |
| 1 |
|
|
|
|
|
|
|
| Total | $ | 685 |
| $ | 640 |
| 7 | % |
|
|
|
|
|
|
|
| | | | | | | | |
Average loans by region (in billions of dollars) | | |
|
|
| North America | $ | 176 |
| $ | 160 |
| 10 | % |
| EMEA | 84 |
| 78 |
| 8 |
|
| Latin America | 34 |
| 34 |
| — |
|
| Asia | 63 |
| 67 |
| (6 | ) |
| Total | $ | 357 |
| $ | 339 |
| 5 | % |
EOP deposits by business (in billions of dollars) | | | |
| Treasury and trade solutions | $ | 475 |
| $ | 449 |
| 6 | % |
All other ICG businesses | 227 |
| 217 |
| 5 |
|
| Total | $ | 702 |
| $ | 666 |
| 5 | % |
| |
(1) | Third quarter of 2017 includes an approximate $580 million gain on the sale of a fixed income analytics business. |
NM Not meaningful
ICG Revenue Details—Excluding Gains (Losses) on Loan HedgesDetails
| | | | Third Quarter | | Nine Months | % Change | First Quarter | |
| In millions of dollars | 2018 | 2017 | % Change | 2018 | 2017 | 2019 | 2018 | % Change |
Investment banking revenue details | | | | | | | |
| Advisory | $ | 262 |
| $ | 240 |
| 9 | % | $ | 838 |
| $ | 807 |
| 4 | % | $ | 378 |
| $ | 215 |
| 76 | % |
| Equity underwriting | 259 |
| 311 |
| (17 | ) | 810 |
| 870 |
| (7 | ) | 172 |
| 216 |
| (20 | ) |
| Debt underwriting | 660 |
| 729 |
| (9 | ) | 2,085 |
| 2,400 |
| (13 | ) | 804 |
| 699 |
| 15 |
|
| Total investment banking | $ | 1,181 |
| $ | 1,280 |
| (8 | )% | $ | 3,733 |
| $ | 4,077 |
| (8 | )% | $ | 1,354 |
| $ | 1,130 |
| 20 | % |
| Treasury and trade solutions | 2,283 |
| 2,185 |
| 4 |
| 6,887 |
| 6,399 |
| 8 |
| 2,395 |
| 2,268 |
| 6 |
|
Corporate lending—excluding gains (losses) on loan hedges(1) | 563 |
| 506 |
| 11 |
| 1,673 |
| 1,425 |
| 17 |
| 569 |
| 521 |
| 9 |
|
| Private bank | 849 |
| 790 |
| 7 |
| 2,601 |
| 2,332 |
| 12 |
| 880 |
| 904 |
| (3 | ) |
| Total banking revenues (ex-gains (losses) on loan hedges) | $ | 4,876 |
| $ | 4,761 |
| 2 | % | $ | 14,894 |
| $ | 14,233 |
| 5 | % | $ | 5,198 |
| $ | 4,823 |
| 8 | % |
Corporate lending—gains (losses) on loan hedges(1) | $ | (106 | ) | $ | (48 | ) | NM |
| $ | (60 | ) | $ | (154 | ) | 61 | % | $ | (231 | ) | $ | 23 |
| NM |
|
| Total banking revenues (including gains (losses) on loan hedges), net of interest expense | $ | 4,770 |
| $ | 4,713 |
| 1 | % | $ | 14,834 |
| $ | 14,079 |
| 5 | % | $ | 4,967 |
| $ | 4,846 |
| 2 | % |
| Fixed income markets | $ | 3,199 |
| $ | 2,936 |
| 9 | % | $ | 9,693 |
| $ | 9,888 |
| (2 | )% | $ | 3,452 |
| $ | 3,425 |
| 1 | % |
| Equity markets | 792 |
| 785 |
| 1 |
| 2,759 |
| 2,312 |
| 19 |
| 842 |
| 1,103 |
| (24 | ) |
| Securities services | 672 |
| 608 |
| 11 |
| 1,978 |
| 1,754 |
| 13 |
| 638 |
| 641 |
| — |
|
Other(2) | (192 | ) | 388 |
| NM |
| (484 | ) | 137 |
| NM |
| (205 | ) | (160 | ) | (28 | ) |
| Total markets and securities services revenues, net of interest expense | $ | 4,471 |
| $ | 4,717 |
| (5 | )% | $ | 13,946 |
| $ | 14,091 |
| (1 | )% | $ | 4,727 |
| $ | 5,009 |
| (6 | )% |
| Total revenues, net of interest expense | $ | 9,241 |
| $ | 9,430 |
| (2 | )% | $ | 28,780 |
| $ | 28,170 |
| 2 | % | $ | 9,694 |
| $ | 9,855 |
| (2 | )% |
| Commissions and fees | $ | 165 |
| $ | 171 |
| (4 | )% | $ | 523 |
| $ | 471 |
| 11 | % | $ | 174 |
| $ | 175 |
| (1 | )% |
Principal transactions(3)(2) | 2,020 |
| 1,592 |
| 27 |
| 6,312 |
| 5,887 |
| 7 |
| 2,377 |
| 2,192 |
| 8 |
|
| Other | 84 |
| 130 |
| (35 | ) | 388 |
| 464 |
| (16 | ) | 150 |
| 275 |
| (45 | ) |
| Total non-interest revenue | $ | 2,269 |
| $ | 1,893 |
| 20 | % | $ | 7,223 |
| $ | 6,822 |
| 6 | % | $ | 2,701 |
| $ | 2,642 |
| 2 | % |
| Net interest revenue | 930 |
| 1,043 |
| (11 | ) | 2,470 |
| 3,066 |
| (19 | ) | 751 |
| 783 |
| (4 | ) |
| Total fixed income markets | $ | 3,199 |
| $ | 2,936 |
| 9 | % | $ | 9,693 |
| $ | 9,888 |
| (2 | )% | $ | 3,452 |
| $ | 3,425 |
| 1 | % |
| Rates and currencies | $ | 2,347 |
| $ | 2,189 |
| 7 | % | $ | 7,052 |
| $ | 6,973 |
| 1 | % | $ | 2,402 |
| $ | 2,477 |
| (3 | )% |
| Spread products/other fixed income | 852 |
| 747 |
| 14 |
| 2,641 |
| 2,915 |
| (9 | ) | 1,050 |
| 948 |
| 11 |
|
| Total fixed income markets | $ | 3,199 |
| $ | 2,936 |
| 9 | % | $ | 9,693 |
| $ | 9,888 |
| (2 | )% | $ | 3,452 |
| $ | 3,425 |
| 1 | % |
| Commissions and fees | $ | 284 |
| $ | 309 |
| (8 | )% | $ | 953 |
| $ | 958 |
| (1 | )% | $ | 293 |
| $ | 361 |
| (19 | )% |
Principal transactions(3)(2) | 284 |
| 211 |
| 35 |
| 922 |
| 399 |
| NM |
| 396 |
| 537 |
| (26 | ) |
| Other | (3 | ) | (5 | ) | 40 |
| 97 |
| (2 | ) | NM |
| 7 |
| 80 |
| (91 | ) |
| Total non-interest revenue | $ | 565 |
| $ | 515 |
| 10 | % | $ | 1,972 |
| $ | 1,355 |
| 46 | % | $ | 696 |
| $ | 978 |
| (29 | )% |
| Net interest revenue | 227 |
| 270 |
| (16 | ) | 787 |
| 957 |
| (18 | ) | 146 |
| 125 |
| 17 |
|
| Total equity markets | $ | 792 |
| $ | 785 |
| 1 | % | $ | 2,759 |
| $ | 2,312 |
| 19 | % | $ | 842 |
| $ | 1,103 |
| (24 | )% |
| |
| (1) | Credit derivatives are used to economically hedge a portion of the corporate loan portfolio that includes both accrual loans and loans at fair value. Gains (losses) on loan hedges include the mark-to-market on the credit derivatives and the mark-to-market on the loans in the portfolio that are at fair value. The fixed premium costs of these hedges are netted against the corporate lending revenues to reflect the cost of credit protection. Citigroup’s results of operations excluding the impact of gains (losses) on loan hedges are non-GAAP financial measures. |
| |
| (2) | Third quarter of 2017 includes an approximate $580 million gain on the sale of a fixed income analytics business. |
| |
(3) | Excludes principal transactions revenues of ICG businesses other than Markets, primarily treasury and trade solutions and the private bank. |
NM Not meaningful
The discussion of the results of operations for ICG below excludes (where noted) the impact of gains (losses) on hedges of accrual loans, which are non-GAAP financial measures. For a reconciliation of these metrics to the reported results, see the table above.
1Q19 vs. 1Q18
3Q18 vs. 3Q17
Net income increased 2%, driven primarily was largely unchanged, as lower revenues and a higher cost of credit were offset by lower expenses and a lower effective tax rate due to Tax Reform, which more than offset lower revenues, higher cost of credit and expenses.rate.
| |
| • | Revenues decreased 2%, as a 2% increase in Banking (including gains (losses) on loan hedges) was more than offset by a 6% decrease in Markets and securities services, largely driven by lower revenues in equity markets. Excluding the impact of the gains (losses) on loan hedges, Banking revenues increased 8%, primarily driven by growth in investment banking, treasury and trade solutions and corporate lending, partially offset by a decline in private bank. |
Within Banking:
Revenues decreased 2%, as a 1% increase in Banking revenues was more than offset by a 5% decrease in
| |
| • | Investment banking revenues increased 20%, as strong growth in advisory and investment-grade debt underwriting more than offset a decline in equity underwriting. Advisory revenues increased 76%, reflecting gains in wallet share and strong performance in North America and EMEA. Debt underwriting revenues increased 15%, reflecting wallet share gains, with strength in North America. Equity underwriting revenues decreased 20%, driven by declines in both market wallet and wallet share. |
| |
| • | Treasury and trade solutions revenues increased 6%. Excluding the impact of FX translation, revenues increased 10%, reflecting strength in all regions. Revenue growth in the cash business was primarily driven by continued growth in deposit balances and improved deposit spreads. Trade revenue growth was driven primarily by improved loan spreads, partially offset by lower episodic fees. Average deposit balances increased 7% (10% excluding the impact of FX translation), with strong growth across regions. Average trade loans decreased 4% (a decrease of 1% excluding the impact of FX translation), as growth in EMEA and Latin America was more than offset by North America and Asia, as the businesses maintained strong origination volumes, while reducing lower spread assets and increasing asset sales to optimize returns. |
| |
| • | Corporate lending revenues decreased from $544 million to $338 million. Excluding the impact of gains (losses) on loan hedges, revenues increased 9%, driven by higher loan volumes and spread expansion. Average loans increased 1% (4% excluding the impact of FX translation). |
| |
| • | Private bank revenues decreased 3% from a strong prior-year period, primarily due to higher mortgage funding costs and lower managed investments revenue, partially offset by higher volumes. |
Within Markets and securities services, reflecting the impact of
:the approximate $580 million gain on sale of a fixed income analytics business in the prior-year period. Excluding the gain on sale in the prior-year period,
| |
| • | Fixed income markets revenues increased 1%, primarily due to higher revenues in EMEA and Asia. The increase in |
revenues were up 4%,was largely driven by higher revenues in both Banking and Markets and securities services. The increase in Banking revenues was driven by improved performance in treasury and trade solutions and the private bank, partially offset by a decline in investment banking. Excluding the gain on sale, Markets and securities services revenues increased 8%, driven by higher revenues in fixed income markets and securities services.
Within Banking:
Investment banking revenues declined 8%, driven by a drop in market wallet across all major products. Advisory revenues increased 9%, reflecting strong performance in North America. Equity underwriting revenues decreased 17%, driven by lower market wallet as well as a decline in market share. Debt underwriting revenues decreased 9%, due to the decline in market wallet despite gaining market share.
Treasury and trade solutions revenues increased 4%. Excluding the impact of FX translation, revenues increased 8%, reflecting strength in all regions. Revenue growth in the cash business was primarily driven by continued growth in deposit balances and improved deposit spreads, as well as higher transaction volumes from both new and existing clients. Trade revenues were largely unchanged, as loan growth was offset by the tightening of loan spreads and lower episodic fees. Average deposit balances increased 7% (8% excluding the impact of FX translation), with strong growth in deposits across all regions. Average loans increased 3% (4% excluding the impact of FX translation), driven by EMEA and Latin America.
Corporate lending revenues of $457 million were largely unchanged. Excluding the losses on loan hedges, revenues increased 11%, driven by lower hedging cost and higher loan volumes. Average loans increased 8% versus the prior-year period.
Private bank revenues increased 7%, driven by North America and EMEA, reflecting higher deposit spreads, an increase in loans and higher managed investments revenues due to strong client activity.
Within Markets and securities services:
Fixed income markets revenues increased 9%, driven by higher revenues in EMEA and North America. The increase in revenues was largely due to higher non-interest revenue, (an increase of 20%) in rates and
currencies as well as spread products and other fixed income, partially offset by lower net interest revenue mainly reflecting a change in the mix of trading positions in support of client activity as well asdue to higher funding costs, given the higher interest rate environment. The increase in non-interest revenues was primarily driven by higher principal transactiontransactions revenues, (increase of 27%), primarilyreflecting higher investor client activity in a more favorable market environment than the prior-year period, particularly in rates and currencies, reflecting higher client activity and facilitation gains.spread products.
Rates and currencies revenues increased 7%decreased 3%, as strength in G10 rates was more than offset by lower FX revenues, primarily in EMEA and Latin America. The lower FX revenues were driven by higher G10 rates and G10 FX revenues in all regions, reflecting strength indeclining currency volatility, while corporate client activity as well as benefiting from a continuation of volatility in the FX markets.
Spread products and other fixed income revenues increased 14%, primarily due to a comparison to a weak prior-year period, particularly in North America and EMEA.
Equity markets revenues increased 1%, as growth in equity derivatives and prime finance was partially offset by lower cash equities revenues. Equity derivatives and prime finance revenues increased in EMEA, North America and Asia, driven by higher investor client activity and higher client balances. Cash equities revenues decreased across regions, reflecting a more challenging trading environment and lower commissions, as well as comparison to a strong prior-year period. Principal transactions revenues increased 35%, partially offset by a decrease in net interest revenue, mainly reflecting a change in the mix of trading positions in support of client activity.
Securities services revenues increased 11%. Excluding the impact of FX translation, revenues increased 15%, reflecting growth in all regions.remained stable. The increase in revenuesrates was driven by higher fee revenues, reflecting growth in both client volumes and assets under custody, as well as higher net interest revenue driven by higher deposit volume and higher interest rates.
Expenses increased 1%, driven by an increase in compensation costs, volume-related expenses and investments, partially offset by efficiency savings and a benefit from FX translation.
Provisions increased $235 million to $71 million, driven by higher provisions for unfunded lending commitments (up $211 million) and a higher net loan loss reserve build (up $45 million), partially offset by lower net credit losses (down $21 million). The increase in provisions was largely driven by volume-related reserve builds and an absence of a large release in the prior-year period.
2018 YTD vs. 2017 YTD
Net income increased 10%, primarily driven by higher revenues and a lower effective tax rate due to the impact of Tax Reform, partially offset by higher expenses and higher credit costs.
Revenues increased 2%, driven by a 5% increase in Banking revenues, partially offset by a 1% decrease in Markets and securities services revenues. Excluding the gain on sale in the prior-year period, revenues increased 4%, reflecting higher revenues in both Banking (increase of 5%) and Markets and securities services (increase of 3%).
Within Banking:
Investment banking revenues declined 8%, due to a decline in market wallet across all major products as well as a particularly strong performance in the prior-year period. Advisory revenues increased 4%, reflecting gains in wallet share despite a decline in the overall market wallet. Equity underwriting revenues declined 7%, driven by the decline in market wallet. Debt underwriting revenues declined 13%, driven by the decline in market wallet as well as a decline in wallet share.
Treasury and trade solutions revenues increased 8%, reflecting growth across both net interest and fee income, driven by continued growth in deposit and loan volumes, improved deposit spreads and strong fee growth across most cash products.
Corporate lending revenues increased 27%. Excluding the impact of losses on loan hedges, revenues increased 17%, driven by the same factors described above. Average loans increased 10% versus the prior-year period.
Private bank revenues increased 12%, driven by strong client activity across all regions. The increase in revenues reflected higher deposit spreads, an increase in loans, higher managed investments revenues and increased capital markets activity.
Within Markets and securities services:
Fixed incomemarkets revenues decreased 2%, primarily due to lower revenues in North America,Asia and Latin America. Rates and currencies revenues increased 1%, driven by higher G10 FX revenues that benefited from the return of volatility in the FX markets, as well as strong corporate and investor client activity. This increase was partially offset by lower G10 rates revenues due to lower client activity as well as a comparison to a strongless favorable environment in the prior-year period, primarily in EMEA. period.
Spread products and other fixed income revenues decreased 9%increased 11%, primarily driven by higher revenues in flow trading, notably corporate bonds and agency mortgage-backed securities (MBS) in North America, largely and EMEA due to lowerincreased investor client activity,activity. This increase in revenues was partially offset by weakness in structured products in North America, reflecting thea more challenging market environment and a comparison to a strong prior-year period.environment.
| |
| • | Equity markets revenues decreased 24%, compared to a strong prior-year period that benefited from a more favorable market environment with higher volatility. Equity derivatives revenues declined, primarily in North America and Asia, reflecting the less favorable market environment. The decrease in equity markets revenues was also driven by lower market volumes globally, and lower client financing balances. Non-interest revenues decreased, primarily driven by lower principal transactions revenues, reflecting a less favorable market environment, as well as lower commissions and fees revenues. |
| |
| • | Securities services revenues were largely unchanged. Excluding the impact of FX translation, revenues increased 5%, driven by higher client volumes and an increase in interest revenues from higher interest rates. |
Equity markets revenues increased 19%, reflecting strength in Asia, North America and EMEA, due to
growth in equity derivatives and prime finance, driven by a more favorable operating environment with higher
market volatility and increased investor and corporate client activity, as well as higher client balances.
Securities services revenues increased 13%, driven by the same factors described above.
Expenses decreased 1%, as efficiency savings and a benefit from FX translation were partially offset by investments and higher volume-related expenses.
Provisions increased 4%, driven by the same factors described above.
Provisions increased $337 million to $55$62 million, primarily due to a smaller benefit from net loan loss reserve releases in the current quarter of $34 million, compared to a benefit of $146 million in the prior-year period, partially offset by lower net credit losses. Provisions of $21 million in the current quarter were driven by volume-related reserve builds, for both funded loans and unfunded lending commitments, and a lower loan losspartially offset by loan-specific reserve release as compared toreleases, including the prior-year period.paydown of certain non-accrual loans.
CORPORATE/OTHER
Corporate/Other includes certain unallocated costs of global staff functions (including finance, risk, human resources, legal and compliance), other corporate expenses and unallocated global operations and technology expenses and income taxes, as well as Corporate Treasury, certain North America legacy consumer loan portfolios, other legacy assets and discontinued operations (for additional information on Corporate/Other, see “Citigroup Segments” above). At September 30, 2018, March 31, 2019, Corporate/Other had $94$107 billion in assets, down $6up $15 billion year-over-year.
| | | | Third Quarter | | Nine Months | % Change | First Quarter | |
| In millions of dollars | 2018 | 2017 | % Change | 2018 | 2017 | 2019 | 2018 | % Change |
| Net interest revenue | $ | 554 |
| $ | 516 |
| 7 | % | $ | 1,645 |
| $ | 1,571 |
| 5 | % | $ | 631 |
| $ | 538 |
| 17 | % |
| Non-interest revenue | (60 | ) | 3 |
| NM |
| (32 | ) | 810 |
| NM |
| (200 | ) | 53 |
| NM |
|
| Total revenues, net of interest expense | $ | 494 |
| $ | 519 |
| (5 | )% | $ | 1,613 |
| $ | 2,381 |
| (32 | )% | $ | 431 |
| $ | 591 |
| (27 | )% |
| Total operating expenses | $ | 459 |
| $ | 827 |
| (44 | )% | $ | 1,799 |
| $ | 2,957 |
| (39 | )% | $ | 549 |
| $ | 742 |
| (26 | )% |
| Net credit losses | $ | 19 |
| $ | 29 |
| (34 | )% | $ | 24 |
| $ | 134 |
| (82 | )% | $ | 2 |
| $ | 26 |
| (92 | )% |
| Credit reserve build (release) | (43 | ) | (79 | ) | 46 |
| (171 | ) | (268 | ) | 36 |
| (26 | ) | (33 | ) | 21 |
|
| Provision (release) for unfunded lending commitments | (5 | ) | — |
| — |
| (6 | ) | 3 |
| NM |
| (1 | ) | — |
| — |
|
| Provision for benefits and claims | (1 | ) | — |
| NM |
| (2 | ) | 1 |
| NM |
| — |
| — |
| NM |
|
| Provisions for credit losses and for benefits and claims | $ | (30 | ) | $ | (50 | ) | 40 | % | $ | (155 | ) | $ | (130 | ) | (19 | )% | $ | (25 | ) | $ | (7 | ) | NM |
|
| Income (loss) from continuing operations before taxes | $ | 65 |
| $ | (258 | ) | NM |
| $ | (31 | ) | $ | (446 | ) | 93 | % | $ | (93 | ) | $ | (144 | ) | 35 | % |
| Income taxes (benefits) | 116 |
| (163 | ) | NM |
| 109 |
| (435 | ) | NM |
| (71 | ) | (69 | ) | (3 | ) |
| Income (loss) from continuing operations | $ | (51 | ) | $ | (95 | ) | 46 | % | $ | (140 | ) | $ | (11 | ) | NM |
| $ | (22 | ) | $ | (75 | ) | 71 | % |
| Income (loss) from discontinued operations, net of taxes | (8 | ) | (5 | ) | (60 | ) | — |
| (2 | ) | 100 | % | (2 | ) | (7 | ) | 71 |
|
| Net income (loss) before attribution of noncontrolling interests | $ | (59 | ) | $ | (100 | ) | 41 | % | $ | (140 | ) | $ | (13 | ) | NM |
| $ | (24 | ) | $ | (82 | ) | 71 | % |
| Noncontrolling interests | 8 |
| (17 | ) | NM |
| 26 |
| (13 | ) | NM |
| 14 |
| 5 |
| NM |
|
| Net income (loss) | $ | (67 | ) | $ | (83 | ) | 19 | % | $ | (166 | ) | $ | — |
| — | % | $ | (38 | ) | $ | (87 | ) | 56 | % |
NM Not meaningful
3Q181Q19 vs. 3Q171Q18
The net loss was $67$38 million, compared to a net loss of $83$87 million in the prior-year period. The lower net loss was largely driven by lower expenses and lower cost of credit, partially offset by higher taxes and a lower net loan loss reserve release.revenues.
Revenues decreased 5%27%, primarily driven by the continued wind-down of legacy assets.
Expenses decreased 44%26%, primarily driven by the wind-down of legacy assets as well as lower infrastructure costs.assets.
Provisions increased $20 decreased $18 million to a net benefit of $30$25 million, as lower net credit losses were more thanpartially offset by a lower net loan loss reserve release. The decline in net credit losses reflected the impact of ongoing divestiture activity,
including the impact of the continued wind-down in the legacy North America mortgage portfolio.
2018 YTD vs. 2017 YTD
The net loss was $166 million, compared to $0 net income in the prior-year period, reflecting lower revenues and higher taxes, partially offset by lower expenses and a higher net benefit from credit.
Revenues decreased 32%, primarily driven by the same factors described above.
Expenses decreased 39%, driven by the same factors described above, as well as lower legal costs.
Provisions decreased $25 million to a net benefit of $155 million, driven by lower net credit losses, partially offset by a lower net loan loss reserve release. Net credit losses declined 82% to $24 million, driven by the same factors described above.
OFF-BALANCE SHEET ARRANGEMENTS
The table below shows where a discussion of Citi’s various off-balance sheet arrangements in this Form 10-Q may be found. For additional information, see “Off-Balance Sheet Arrangements” and Notes 1, 21 and 26 to the Consolidated Financial Statements in Citigroup’s 20172018 Annual Report on Form 10-K.
Types of Off-Balance Sheet Arrangements Disclosures in this Form 10-Q
|
| |
| Variable interests and other obligations, including contingent obligations, arising from variable interests in nonconsolidated VIEs | See Note 18 to the Consolidated Financial Statements. |
| Letters of credit, and lending and other commitments | See Note 22 to the Consolidated Financial Statements. |
| Guarantees | See Note 22 to the Consolidated Financial Statements. |
CAPITAL RESOURCES
Overview
Capital is used principally to support assetsFor additional information about capital resources, including Citi’s capital management, the stress testing component of capital planning, current regulatory capital standards, and regulatory capital standards developments, see “Capital Resources” and “Risk Factors” in Citi’s businesses and to absorb credit, market and operational losses. Citi primarily generates capital through earnings from its operating businesses. Citi may augment its capital through issuances of common stock, noncumulative perpetual preferred stock and equity issued through awards under employee benefit plans, among other issuances.
Further, Citi’s capital levels may also be affected by changes in accounting and regulatory standards, as well as U.S. corporate tax laws and the impact of future events2018 Annual Report on Citi’s business results, such as changes in interest and foreign exchange rates, as well as business and asset dispositions.Form 10-K.
During the thirdfirst quarter of 2018,2019, Citi returned a total of $6.4$5.1 billion of capital to common shareholders in the form of share repurchases (approximately 7566 million common shares) and dividends.
Capital Management
Citi’s capital management framework is designed to ensure that Citigroup and its principal subsidiaries maintain sufficient capital consistent with each entity’s respective risk profile, management targets and all applicable regulatory standards and guidelines. Based on Citigroup’s current regulatory capital requirements, as well as consideration of potential future changes to the U.S. Basel III rules, management currently believes that a targeted Common Equity Tier 1 Capital ratio of approximately 11.5% represents the amount necessary to prudently operate and invest in Citi’s franchise, including when considering future growth plans, capital return projections and other factors that may impact Citi’s businesses. However, management may revise Citigroup’s targeted Common Equity Tier 1 Capital ratio in response to changing regulatory capital requirements as well as other relevant factors. For additional information regarding Citi’s capital management, see “Capital Resources—Capital Management” in Citigroup’s 2017 Annual Report on Form 10-K.
Stress Testing Component of Capital Planning
Citi is subject to an annual assessment by the Federal Reserve Board as to whether Citigroup has effective capital planning processes as well as sufficient regulatory capital to absorb losses during stressful economic and financial conditions, while also meeting obligations to creditors and counterparties and continuing to serve as a credit intermediary. This annual assessment includes two related programs: the Comprehensive Capital Analysis and Review (CCAR) and Dodd-Frank Act Stress Testing (DFAST). For additional information regarding the stress testing component of capital planning, see “Forward-Looking Statements” below and “Capital Resources—Current Regulatory Capital Standards—Stress Testing Component of Capital Planning” and “Risk Factors—Strategic Risks”
in Citigroup’s 2017 Annual Report on Form 10-K. For additional information regarding a recent proposed rulemaking and other potential changes in Citi’s regulatory capital requirements and future CCAR processes, see “Regulatory Capital Standards Developments” in the First Quarter of 2018 Form 10-Q.
Current Regulatory Capital Standards
Citi is subject to regulatory capital standards issued by the Federal Reserve Board, which constitute the U.S. Basel III rules. These rules establish an integrated capital adequacy framework, encompassing both risk-based capital ratios and leverage ratios. For additional information regarding the risk-based capital ratios, Tier 1 Leverage ratio and Supplementary Leverage ratio, see “Capital Resources—Current Regulatory Capital Standards” in Citigroup’s 2017 Annual Report on Form 10-K.
GSIB Surcharge
The Federal Reserve Board also adopted a rule that imposes a risk-based capital surcharge upon U.S. GSIBs, including Citi. Citi’s GSIB surcharge effective for 2018 remains unchanged from 2017 at 3.0%. For additional information regarding the identification of a GSIB and the methodology for annually determining the GSIB surcharge, see “Capital Resources—Current Regulatory Capital Standards—GSIB Surcharge” in Citigroup’s 2017 Annual Report on Form 10-K.
Transition Provisions
The U.S. Basel III rules contain several differing, largely multi-year transition provisions (i.e., “phase-ins” and “phase-outs”). Moreover, the GSIB surcharge, Capital Conservation Buffer, and any Countercyclical Capital Buffer (currently 0%), commenced phase-in on January 1, 2016, becoming fully effective on January 1, 2019. With the exception of the non-grandfathered trust preferred securities, which do not fully phase-out until January 1, 2022, and the capital buffers and GSIB surcharge, which do not fully phase-in until January 1, 2019, all other transition provisions are entirely reflected in Citi’s regulatory capital ratios beginning January 1, 2018. Accordingly, commencing with the first quarter of 2018, Citi is presenting a single set of regulatory capital components and ratios, reflecting current regulatory capital standards in effect throughout 2018. Citi previously disclosed its Basel III risk-based capital and leverage ratios and related components reflecting Basel III Transition Arrangements with respect to regulatory capital adjustments and deductions, as well as Full Implementation, in Citi’s 2017 Annual Report on Form 10-K and Quarterly Reports on Form 10-Q; however, beginning January 1, 2018, that distinction is no longer relevant.
For additional information regarding the transition provisions under the U.S. Basel III rules, including with respect to the GSIB surcharge, see “Capital Resources—
Current Regulatory Capital Standards—Transition Provisions” in Citigroup’s 2017 Annual Report on Form 10-K. For information regarding Citigroup’s capital resources reflecting Basel III Transition Arrangements as of December 31, 2017, see “Capital Resources—Current Regulatory Capital Standards—Citigroup’s Capital Resources Under Current Regulatory Standards” in Citigroup’s 2017 Annual Report on Form 10-K.
Citigroup’s Capital Resources
Citi is required to maintain stated minimum Common Equity Tier 1 Capital, Tier 1 Capital and Total Capital ratios of 4.5%, 6.0% and 8.0%, respectively.
Citi’s effective minimum Common Equity Tier 1 Capital, Tier 1 Capital and Total Capital ratios during 2018, inclusive of the 75% phase-in of both the 2.5% Capital Conservation Buffer and the 3.0% GSIB surcharge (all of which is to be composed of Common Equity Tier 1 Capital), are 8.625%, 10.125% and 12.125%, respectively. Citi’s effective minimum Common Equity Tier 1 Capital, Tier 1 Capital and Total Capital ratios during 2017, inclusive of the 50% phase-in of both the 2.5% Capital Conservation Buffer and the 3.0% GSIB surcharge (all of which is to be composed of Common Equity Tier 1 Capital), were 7.25%, 8.75% and 10.75%, respectively.
Citi currently estimates that its effective minimum Common Equity Tier 1 Capital, Tier 1 Capital and Total Capital ratio requirements during 2019, inclusive of the 2.5% Capital Conservation Buffer and the Countercyclical Capital Buffer at its current level of 0%, as well as a 3.0% GSIB surcharge, may be 10.0%, 11.5% and 13.5%, respectively.
Furthermore, to be “well capitalized” under current federal bank regulatory agency definitions, a bank holding
company must have a Tier 1 Capital ratio of at least 6.0%, a Total Capital ratio of at least 10.0%, and not be subject to a Federal Reserve Board directive to maintain higher capital levels.
Under the U.S. Basel III rules, Citi must comply with a 4.0% minimum Tier 1 Leverage ratio requirement. Effective January 1, 2018, Citi must also comply with an effective 5.0% minimum Supplementary Leverage ratio requirement.
The following tables set forth theCiti’s capital tiers, total risk-weighted assetscomponents and underlying risk components, risk-based capital ratios, quarterly adjusted average total assets, Total Leverage Exposure and leverage ratios for Citi as of September 30, 2018 and December 31, 2017.ratios:
Citigroup Capital Components and Ratios
| | | | September 30, 2018 | December 31, 2017 | March 31, 2019 | December 31, 2018 |
| In millions of dollars, except ratios | Advanced Approaches | Standardized Approach | Advanced Approaches | Standardized Approach | Effective Minimum Requirement(1) | Advanced Approaches | Standardized Approach | Effective Minimum Requirement(1) | Advanced Approaches | Standardized Approach |
| Common Equity Tier 1 Capital | $ | 140,428 |
| $ | 140,428 |
| $ | 142,822 |
| $ | 142,822 |
| | $ | 140,355 |
| $ | 140,355 |
| | $ | 139,252 |
| $ | 139,252 |
|
| Tier 1 Capital | 159,877 |
| 159,877 |
| 162,377 |
| 162,377 |
| | 158,712 |
| 158,712 |
| | 158,122 |
| 158,122 |
|
| Total Capital (Tier 1 Capital + Tier 2 Capital) | 184,623 |
| 196,808 |
| 187,877 |
| 199,989 |
| | 184,418 |
| 196,452 |
| | 183,144 |
| 195,440 |
|
| Total Risk-Weighted Assets | 1,155,188 |
| 1,196,923 |
| 1,152,644 |
| 1,155,099 |
| | 1,121,645 |
| 1,178,628 |
| | 1,131,933 |
| 1,174,448 |
|
| Credit Risk | $ | 769,942 |
| $ | 1,126,869 |
| $ | 767,102 |
| $ | 1,089,372 |
| | $ | 752,804 |
| $ | 1,118,057 |
| | $ | 758,887 |
| $ | 1,109,007 |
|
| Market Risk | 68,647 |
| 70,054 |
| 65,003 |
| 65,727 |
| | 59,200 |
| 60,571 |
| | 63,987 |
| 65,441 |
|
| Operational Risk | 316,599 |
| — |
| 320,539 |
| — |
| | 309,641 |
| — |
| | 309,059 |
| — |
|
Common Equity Tier 1 Capital ratio(1)(2) | 12.16 | % | 11.73 | % | 12.39 | % | 12.36 | % | |
Tier 1 Capital ratio(1)(2) | 13.84 |
| 13.36 |
| 14.09 |
| 14.06 |
| |
Total Capital ratio(1)(2) | 15.98 |
| 16.44 |
| 16.30 |
| 17.31 |
| |
Common Equity Tier 1 Capital ratio(2) | | 10.0 | % | 12.51 | % | 11.91 | % | 8.625 | % | 12.30 | % | 11.86 | % |
Tier 1 Capital ratio(2) | | 11.5 |
| 14.15 |
| 13.47 |
| 10.125 |
| 13.97 |
| 13.46 |
|
Total Capital ratio(2) | | 13.5 |
| 16.44 |
| 16.67 |
| 12.125 |
| 16.18 |
| 16.64 |
|
| | | In millions of dollars, except ratios | September 30, 2018 | December 31, 2017 | Effective Minimum Requirement | March 31, 2019 | December 31, 2018 |
Quarterly Adjusted Average Total Assets(3) | | $ | 1,882,493 |
| | $ | 1,868,326 |
| | | $ | 1,899,790 |
| | $ | 1,896,959 |
|
Total Leverage Exposure(4) | | 2,459,993 |
| | 2,432,491 |
| | | 2,463,958 |
| | 2,465,641 |
|
Tier 1 Leverage ratio(2) | | 8.49 | % | | 8.69 | % | 4.0 | % | | 8.35 | % | | 8.34 | % |
Supplementary Leverage ratio(2) | | 6.50 |
| | 6.68 |
| 5.0 |
| | 6.44 |
| | 6.41 |
|
| |
| (1) | Citi’s effective minimum risk-based capital requirements during 2019 and 2018 are inclusive of the 100% and 75% phase-in, respectively, of both the 2.5% Capital Conservation Buffer and the 3.0% GSIB surcharge (all of which must be composed of Common Equity Tier 1 Capital). |
| |
| (2) | As of September 30, 2018March 31, 2019 and December 31, 2017,2018, Citi’s reportable Common Equity Tier 1 Capital and Tier 1 Capital ratios were the lower derived under the Basel III Standardized Approach, whereas the reportable Total Capital ratio was the lower derived under the Basel III Advanced Approaches framework. |
| |
(2) | Citi’s risk-based capital and leverage ratios and related components as of December 31, 2017 are non-GAAP financial measures, which reflect full implementation of regulatory capital adjustments and deductions prior to the effective date of January 1, 2018. |
| |
| (3) | Tier 1 Leverage ratio denominator. |
| |
| (4) | Supplementary Leverage ratio denominator. |
As indicated in the table above, Citigroup’s risk-based capital ratios at September 30, 2018March 31, 2019 were in excess of the stated and effective minimum requirements under the U.S. Basel III rules. In addition, Citi was also “well capitalized” under current federal bank regulatory agency definitions as of September 30, 2018.March 31, 2019.
Common Equity Tier 1 Capital Ratio
Citi’s Common Equity Tier 1 Capital ratio was 11.7%11.9% at September 30, 2018, compared to 12.1% at June 30, 2018March 31, 2019, unchanged quarter-over-quarter, as net income of $4.7 billion and 12.4% at December 31, 2017. The ratio decreased from the second quarter of 2018 primarily due tobeneficial net movements in Accumulated other comprehensive income (AOCI) were offset by the return of $6.4$5.1 billion of capital to common shareholders, increases in credit and market risk-weighted assets, and adverse net movements in Accumulated other comprehensive income (AOCI), partially offset by quarterly net income of $4.6 billion. Citi’s Common Equity Tier 1 Capital ratio declined from year-end 2017 primarily due to the return of $12.6 billion of capital to common shareholders, increases in credit and market risk-weighted assets, and adverse net movements in AOCI, partially offset by year-to-date net income of $13.7 billion.shareholders.
Components of Citigroup Capital
| | | In millions of dollars | September 30,
2018 | December 31, 2017 | March 31,
2019 | December 31, 2018 |
| Common Equity Tier 1 Capital | | |
Citigroup common stockholders’ equity(1) | $ | 178,153 |
| $ | 181,671 |
| $ | 178,427 |
| $ | 177,928 |
|
| Add: Qualifying noncontrolling interests | 148 |
| 153 |
| 144 |
| 147 |
|
| Regulatory Capital Adjustments and Deductions: | | |
Less: Accumulated net unrealized losses on cash flow hedges, net of tax(2) | (1,095 | ) | (698 | ) | (442 | ) | (728 | ) |
Less: Cumulative unrealized net loss related to changes in fair value of financial liabilities attributable to own creditworthiness, net of tax(3) | (503 | ) | (721 | ) | |
Less: Cumulative unrealized net gain (loss) related to changes in fair value of financial liabilities attributable to own creditworthiness, net of tax | | (67 | ) | 580 |
|
| Less: Intangible assets: | | |
Goodwill, net of related DTLs(4)(2) | 21,891 |
| 22,052 |
| 21,768 |
| 21,778 |
|
Identifiable intangible assets other than MSRs, net of related DTLs | 4,304 |
| 4,401 |
| 4,390 |
| 4,402 |
|
| Less: Defined benefit pension plan net assets | 931 |
| 896 |
| 811 |
| 806 |
|
Less: DTAs arising from net operating loss, foreign tax credit and general business credit carry-forwards(5)(3) | 12,345 |
| 13,072 |
| 11,756 |
| 11,985 |
|
| Total Common Equity Tier 1 Capital (Standardized Approach and Advanced Approaches) | $ | 140,428 |
| $ | 142,822 |
| $ | 140,355 |
| $ | 139,252 |
|
| Additional Tier 1 Capital | | |
Qualifying noncumulative perpetual preferred stock(1) | $ | 18,851 |
| $ | 19,069 |
| $ | 17,825 |
| $ | 18,292 |
|
Qualifying trust preferred securities(6)(4) | 1,382 |
| 1,377 |
| 1,386 |
| 1,384 |
|
| Qualifying noncontrolling interests | 56 |
| 61 |
| 45 |
| 55 |
|
| Regulatory Capital Deductions: | | |
Less: Permitted ownership interests in covered funds(7)(5) | 795 |
| 900 |
| 848 |
| 806 |
|
Less: Minimum regulatory capital requirements of insurance underwriting subsidiaries(8)(6) | 45 |
| 52 |
| 51 |
| 55 |
|
| Total Additional Tier 1 Capital (Standardized Approach and Advanced Approaches) | $ | 19,449 |
| $ | 19,555 |
| $ | 18,357 |
| $ | 18,870 |
|
Total Tier 1 Capital (Common Equity Tier 1 Capital + Additional Tier 1 Capital) (Standardized Approach and Advanced Approaches) | $ | 159,877 |
| $ | 162,377 |
| $ | 158,712 |
| $ | 158,122 |
|
| Tier 2 Capital | | |
| Qualifying subordinated debt | $ | 22,948 |
| $ | 23,673 |
| $ | 23,704 |
| $ | 23,324 |
|
Qualifying trust preferred securities(9)(7) | 324 |
| 329 |
| 324 |
| 321 |
|
| Qualifying noncontrolling interests | 48 |
| 50 |
| 44 |
| 47 |
|
Eligible allowance for credit losses(10) | 13,656 |
| 13,612 |
| |
Eligible allowance for credit losses(8) | | 13,719 |
| 13,681 |
|
| Regulatory Capital Deduction: | | |
Less: Minimum regulatory capital requirements of insurance underwriting subsidiaries(8)(6) | 45 |
| 52 |
| 51 |
| 55 |
|
| Total Tier 2 Capital (Standardized Approach) | $ | 36,931 |
| $ | 37,612 |
| $ | 37,740 |
| $ | 37,318 |
|
| Total Capital (Tier 1 Capital + Tier 2 Capital) (Standardized Approach) | $ | 196,808 |
| $ | 199,989 |
| $ | 196,452 |
| $ | 195,440 |
|
Adjustment for excess of eligible credit reserves over expected credit losses(10) | $ | (12,185 | ) | $ | (12,112 | ) | |
Adjustment for excess of eligible credit reserves over expected credit losses(8) | | $ | (12,034 | ) | $ | (12,296 | ) |
Total Tier 2 Capital (Advanced Approaches)
| $ | 24,746 |
| $ | 25,500 |
| $ | 25,706 |
| $ | 25,022 |
|
| Total Capital (Tier 1 Capital + Tier 2 Capital) (Advanced Approaches) | $ | 184,623 |
| $ | 187,877 |
| $ | 184,418 |
| $ | 183,144 |
|
| |
| (1) | Issuance costs of $184$155 million as of March 31, 2019 and $168 million as of December 31, 2018 are related to outstanding noncumulative perpetual preferred stock, outstanding at September 30, 2018 and December 31, 2017which are excluded from common stockholders’ equity and netted against such preferred stock in accordance with Federal Reserve Board regulatory reporting requirements, which differ from those under U.S. GAAP. |
| |
| (2) | Common Equity Tier 1 Capital is adjusted for accumulated net unrealized gains (losses) on cash flow hedges included in AOCI that relate to the hedging of items not recognized at fair value on the balance sheet. |
| |
(3) | The cumulative impact of changes in Citigroup’s own creditworthiness in valuing liabilities for which the fair value option has been elected, and own-credit valuation adjustments on derivatives, are excluded from Common Equity Tier 1 Capital, in accordance with the U.S. Basel III rules. |
| |
(4) | Includes goodwill “embedded” in the valuation of significant common stock investments in unconsolidated financial institutions. |
Footnotes continue on the following page.
| |
(5)(3) | Of Citi’s $23.0$22.8 billion of net DTAs at September 30, 2018, $11.4March 31, 2019, $12.0 billion werewas includable in Common Equity Tier 1 Capital pursuant to the U.S. Basel III rules, while $11.6$10.8 billion werewas excluded. Excluded from Citi’s Common Equity Tier 1 Capital as of September 30, 2018March 31, 2019 was $12.3$11.8 billion of net DTAs arising from net operating loss, foreign tax credit and general business credit carry-forwards, which was reduced by $0.7$1.0 billion of net DTLs primarily associated with goodwill and certain other intangible assets. Separately, under the U.S. Basel III rules, goodwill and these other intangible assets are deducted net of associated DTLs in arriving at Common Equity Tier 1 Capital. DTAs arising from net operating loss, foreign tax credit and general business credit carry-forwards are required to be entirely deducted from Common Equity Tier 1 Capital under the U.S. Basel III rules. Commencing on December 31, 2017, Citi’s DTAs arising from temporary differences wereare less than the 10% limitation under the U.S. Basel III rules and therefore not subject to deduction from Common Equity Tier 1 Capital, but are subject to risk-weighting at 250%. |
| |
(6)(4) | Represents Citigroup Capital XIII trust preferred securities, which are permanently grandfathered as Tier 1 Capital under the U.S. Basel III rules. |
Footnotes continue on the following page.
| |
(7)(5) | Banking entities are required to be in compliance with the Volcker Rule of the Dodd-Frank Act, which prohibits conducting certain proprietary investment activities and limits their ownership of, and relationships with, covered funds. Accordingly, Citi is required by the Volcker Rule to deduct from Tier 1 Capital all permitted ownership interests in covered funds that were acquired after December 31, 2013.funds. |
| |
(8)(6) | 50% of the minimum regulatory capital requirements of insurance underwriting subsidiaries must be deducted from each of Tier 1 Capital and Tier 2 Capital. |
| |
(9)(7) | Represents the amount of non-grandfathered trust preferred securities eligible for inclusion in Tier 2 Capital under the U.S. Basel III rules, which will be fully phased-out of Tier 2 Capital by January 1, 2022. |
| |
(10)(8) | Under the Standardized Approach, the allowance for credit losses is eligible for inclusion in Tier 2 Capital up to 1.25% of credit risk-weighted assets, with any excess allowance for credit losses being deducted in arriving at credit risk-weighted assets, which differs from the Advanced Approaches framework, in which eligible credit reserves that exceed expected credit losses are eligible for inclusion in Tier 2 Capital to the extent that the excess reserves do not exceed 0.6% of credit risk-weighted assets. The total amount of eligible credit reserves in excess of expected credit losses that were eligible for inclusion in Tier 2 Capital, subject to limitation, under the Advanced Approaches framework was $1.5$1.7 billion and $1.4 billion at both September 30, 2018March 31, 2019 and December 31, 2017.2018, respectively. |
Citigroup Capital Rollforward | | | In millions of dollars | Three Months Ended
September 30, 2018 | Nine Months Ended
September 30, 2018 | Three Months Ended
March 31, 2019 |
| Common Equity Tier 1 Capital, beginning of period | $ | 142,868 |
| $ | 142,822 |
| $ | 139,252 |
|
| Net income | 4,622 |
| 13,732 |
| 4,710 |
|
| Common and preferred stock dividends declared | (1,397 | ) | (3,637 | ) | |
| Common and preferred dividends declared | | (1,337 | ) |
| Net increase in treasury stock | (5,265 | ) | (9,369 | ) | (3,491 | ) |
| Net change in common stock and additional paid-in capital | 98 |
| (184 | ) | |
| Net increase in foreign currency translation losses net of hedges, net of tax | (221 | ) | (1,968 | ) | |
| Net increase in unrealized losses on debt securities AFS, net of tax | (605 | ) | (2,164 | ) | |
| Net decrease in defined benefit plans liability adjustment, net of tax | 26 |
| 415 |
| |
Net change in adjustment related to changes in fair value of financial liabilities attributable to own creditworthiness, net of tax | 54 |
| (59 | ) | |
| Net change in ASC 815—excluded component of fair value hedges | 10 |
| (22 | ) | |
| Net change in goodwill, net of related DTLs | (82 | ) | 161 |
| |
| Net decrease in common stock and additional paid-in capital | | (384 | ) |
| Net increase in foreign currency translation gains net of hedges, net of tax | | 58 |
|
| Net decrease in unrealized losses on debt securities AFS, net of tax | | 1,135 |
|
| Net increase in defined benefit plans liability adjustment, net of tax | | (64 | ) |
| Net change in adjustment related to change in fair value of financial liabilities attributable to own creditworthiness, net of tax | | 76 |
|
| Net increase in ASC 815—excluded component of fair value hedges | | 18 |
|
| Net decrease in goodwill, net of related DTLs | | 10 |
|
| Net decrease in identifiable intangible assets other than MSRs, net of related DTLs | 157 |
| 97 |
| 12 |
|
| Net increase in defined benefit pension plan net assets | (49 | ) | (35 | ) | (5 | ) |
Net decrease in DTAs arising from net operating loss, foreign tax credit and general business credit carry-forwards | 206 |
| 727 |
| 229 |
|
| Other | 6 |
| (88 | ) | 136 |
|
| Net decrease in Common Equity Tier 1 Capital | $ | (2,440 | ) | $ | (2,394 | ) | |
| Net increase in Common Equity Tier 1 Capital | | $ | 1,103 |
|
Common Equity Tier 1 Capital, end of period (Standardized Approach and Advanced Approaches) | $ | 140,428 |
| $ | 140,428 |
| $ | 140,355 |
|
| Additional Tier 1 Capital, beginning of period | $ | 19,134 |
| $ | 19,555 |
| $ | 18,870 |
|
| Net decrease in qualifying perpetual preferred stock | — |
| (218 | ) | (467 | ) |
| Net increase in qualifying trust preferred securities | 2 |
| 5 |
| 2 |
|
| Net decrease in permitted ownership interests in covered funds | 314 |
| 105 |
| |
| Net increase in permitted ownership interest in covered funds | | (42 | ) |
| Other | (1 | ) | 2 |
| (6 | ) |
| Net change in Additional Tier 1 Capital | $ | 315 |
| $ | (106 | ) | |
| Net decrease in Additional Tier 1 Capital | | $ | (513 | ) |
Tier 1 Capital, end of period (Standardized Approach and Advanced Approaches) | $ | 159,877 |
| $ | 159,877 |
| $ | 158,712 |
|
| Tier 2 Capital, beginning of period (Standardized Approach) | $ | 36,962 |
| $ | 37,612 |
| $ | 37,318 |
|
| Net decrease in qualifying subordinated debt | (286 | ) | (725 | ) | |
| Net increase in qualifying subordinated debt | | 380 |
|
| Net increase in eligible allowance for credit losses | 253 |
| 44 |
| 38 |
|
| Other | 2 |
| — |
| 4 |
|
| Net decrease in Tier 2 Capital (Standardized Approach) | $ | (31 | ) | $ | (681 | ) | |
| Net increase in Tier 2 Capital (Standardized Approach) | | $ | 422 |
|
| Tier 2 Capital, end of period (Standardized Approach) | $ | 36,931 |
| $ | 36,931 |
| $ | 37,740 |
|
| Total Capital, end of period (Standardized Approach) | $ | 196,808 |
| $ | 196,808 |
| $ | 196,452 |
|
| Tier 2 Capital, beginning of period (Advanced Approaches) | $ | 25,238 |
| $ | 25,500 |
| $ | 25,022 |
|
| Net decrease in qualifying subordinated debt | (286 | ) | (725 | ) | |
| Net decrease in excess of eligible credit reserves over expected credit losses | (208 | ) | (29 | ) | |
| Net increase in qualifying subordinated debt | | 380 |
|
| Net increase in excess of eligible credit reserves over expected credit losses | | 300 |
|
| Other | 2 |
| — |
| 4 |
|
| Net decrease in Tier 2 Capital (Advanced Approaches) | $ | (492 | ) | $ | (754 | ) | |
| Net increase in Tier 2 Capital (Advanced Approaches) | | $ | 684 |
|
| Tier 2 Capital, end of period (Advanced Approaches) | $ | 24,746 |
| $ | 24,746 |
| $ | 25,706 |
|
| Total Capital, end of period (Advanced Approaches) | $ | 184,623 |
| $ | 184,623 |
| $ | 184,418 |
|
Citigroup Risk-Weighted Assets Rollforward (Basel III Standardized Approach)
|
| | | | | | |
| In millions of dollars | Three Months Ended
September 30, 2018 | Nine Months Ended
September 30, 2018 |
| Total Risk-Weighted Assets, beginning of period | $ | 1,176,863 |
| $ | 1,155,099 |
|
| Changes in Credit Risk-Weighted Assets | | |
Net increase in general credit risk exposures(1) | 2,730 |
| 2,715 |
|
Net increase in repo-style transactions(2) | 3,761 |
| 5,621 |
|
| Net decrease in securitization exposures | (1,078 | ) | (232 | ) |
| Net increase in equity exposures | 1,139 |
| 2,679 |
|
Net increase in over-the-counter (OTC) derivatives(3) | 7,489 |
| 18,213 |
|
Net change in other exposures(4) | (321 | ) | 1,999 |
|
Net increase in off-balance sheet exposures(5) | 266 |
| 6,502 |
|
| Net increase in Credit Risk-Weighted Assets | $ | 13,986 |
| $ | 37,497 |
|
| Changes in Market Risk-Weighted Assets | | |
Net increase in risk levels(6) | $ | 5,673 |
| $ | 11,603 |
|
Net change due to model and methodology updates(7) | 401 |
| (7,276 | ) |
| Net increase in Market Risk-Weighted Assets | $ | 6,074 |
| $ | 4,327 |
|
| Total Risk-Weighted Assets, end of period | $ | 1,196,923 |
| $ | 1,196,923 |
|
|
| | | |
| In millions of dollars | Three Months Ended
March 31, 2019 |
| Total Risk-Weighted Assets, beginning of period | $ | 1,174,448 |
|
| Changes in Credit Risk-Weighted Assets | |
General credit risk exposures(1) | (7,072 | ) |
Repo-style transactions(2) | 7,730 |
|
Securitization exposures(3) | 7,331 |
|
| Equity exposures | 1,839 |
|
| Over-the-counter (OTC) derivatives | 66 |
|
Other exposures(4) | 5,909 |
|
Off-balance sheet exposures(5) | (6,753 | ) |
| Net increase in Credit Risk-Weighted Assets | $ | 9,050 |
|
| Changes in Market Risk-Weighted Assets | |
Risk levels(6) | $ | (4,513 | ) |
| Model and methodology updates | (357 | ) |
| Net decrease in Market Risk-Weighted Assets | $ | (4,870 | ) |
| Total Risk-Weighted Assets, end of period | $ | 1,178,628 |
|
| |
| (1) | General credit risk exposures include cash and balances due from depository institutions, securities, and loans and leases. General credit risk exposures increaseddecreased during the three and nine months ended September 30, 2018, driven by growth in corporate loans.March 31, 2019 primarily due to seasonal holiday spending repayments. |
| |
| (2) | Repo-style transactions include repurchase and reverse repurchase transactions as well as securities borrowing and securities lending transactions. |
| |
| (3) | OTC derivativesSecuritization exposures increased during the three and nine months ended September 30, 2018,March 31, 2019 primarily due to increased notional amounts for bilateral trades.exposures from new deals. |
| |
| (4) | Other exposures include cleared transactions, unsettled transactions and other assets. Other exposures increased during the ninethree months ended September 30, 2018,March 31, 2019 primarily due to additional DTAs arising from temporary differences, which are subject to risk-weighting at 250%.the recognition of right-of-use (ROU) assets in accordance with the adoption of ASU No. 2016-02, Leases (Topic 842), effective January 1, 2019. |
| |
| (5) | Off-balance sheet exposures increaseddecreased during the ninethree months ended September 30, 2018,March 31, 2019 primarily due to an increasea decrease in commitments to extend credit that will drive future corporate loan growth.commitments. |
| |
| (6) | Risk levels increaseddecreased during the three months ended September 30, 2018March 31, 2019 primarily due to an increase in positions subject to specific risk charges, partially offset by decreases in exposure levels subject to Stressed Value at Risk. Risk levels increased during the nine months ended September 30, 2018 primarily due to an increase in positions subject to specific risk charges. |
| |
(7) | Risk-weighted assets decreased during the nine months ended September 30, 2018 due to changes in model inputs regarding volatility and the correlation between market risk factors, as well as methodology changes for standard specific risk charges.Value at Risk. |
Citigroup Risk-Weighted Assets Rollforward (Basel III Advanced Approaches)
|
| | | | | | |
| In millions of dollars | Three Months Ended
September 30, 2018 | Nine Months Ended
September 30, 2018 |
| Total Risk-Weighted Assets, beginning of period | $ | 1,147,865 |
| $ | 1,152,644 |
|
| Changes in Credit Risk-Weighted Assets | | |
Net change in retail exposures(1) | 2,293 |
| (14,218 | ) |
Net change in wholesale exposures(2) | (2,519 | ) | 5,756 |
|
Net increase in repo-style transactions(3) | 98 |
| 1,394 |
|
| Net change in securitization exposures | (637 | ) | 387 |
|
| Net increase in equity exposures | 1,320 |
| 2,878 |
|
Net change in over-the-counter (OTC) derivatives(4) | (189 | ) | 1,754 |
|
Net change in derivatives CVA(5) | (1,415 | ) | 1,783 |
|
Net increase in other exposures(6) | 1,594 |
| 3,046 |
|
Net increase in supervisory 6% multiplier(7) | 118 |
| 60 |
|
| Net increase in Credit Risk-Weighted Assets | $ | 663 |
| $ | 2,840 |
|
| Changes in Market Risk-Weighted Assets | | |
Net increase in risk levels(8) | $ | 5,159 |
| $ | 10,920 |
|
Net change due to model and methodology updates(9) | 401 |
| (7,276 | ) |
| Net increase in Market Risk-Weighted Assets | $ | 5,560 |
| $ | 3,644 |
|
Net change in Operational Risk-Weighted Assets(10) | $ | 1,100 |
| $ | (3,940 | ) |
| Total Risk-Weighted Assets, end of period | $ | 1,155,188 |
| $ | 1,155,188 |
|
|
| | | |
| In millions of dollars | Three Months Ended
March 31, 2019 |
| Total Risk-Weighted Assets, beginning of period | $ | 1,131,933 |
|
| Changes in Credit Risk-Weighted Assets | |
| Retail exposures | (1,512 | ) |
Wholesale exposures(1) | (12,307 | ) |
| Repo-style transactions | (970 | ) |
Securitization exposures(2) | 3,861 |
|
| Equity exposures | 1,694 |
|
| Over-the-counter (OTC) derivatives | 908 |
|
| Derivatives CVA | (14 | ) |
Other exposures(3) | 2,601 |
|
| Supervisory 6% multiplier | (344 | ) |
| Net decrease in Credit Risk-Weighted Assets | $ | (6,083 | ) |
| Changes in Market Risk-Weighted Assets | |
Risk levels(4) | $ | (4,430 | ) |
| Model and methodology updates | (357 | ) |
| Net decrease in Market Risk-Weighted Assets | $ | (4,787 | ) |
| Net increase in Operational Risk-Weighted Assets | $ | 582 |
|
| Total Risk-Weighted Assets, end of period | $ | 1,121,645 |
|
| |
| (1) | Retail exposures increased during the three months ended September 30, 2018, primarily due to new accounts and spending for qualifying revolving (cards) exposures. Retail exposures decreased during the nine months ended September 30, 2018, primarily due to net reductions in qualifying revolving (cards) exposures attributable to seasonal holiday spending repayments, as well as residential mortgage loan sales and repayments. |
| |
(2) | Wholesale exposures decreased during the three months ended September 30, 2018March 31, 2019 primarily due to decreases in commercial loans. Wholesaleannual model parameter updates reflecting Citi’s loss experience. |
| |
| (2) | Securitization exposures increased during the ninethree months ended September 30, 2018, primarilyMarch 31, 2019 mainly due to increases in commercial loans and loan commitments.increased exposures from new deals. |
| |
| (3) | Repo-style transactions include repurchase and reverse repurchase transactions as well as securities borrowing and securities lending transactions. |
| |
(4) | OTC derivatives increased during the nine months ended September 30, 2018, primarily due to increases in potential future exposure and fair value. |
| |
(5) | Derivatives CVA decreased during the three months ended September 30, 2018, primarily due to decreases in exposures. Derivatives CVA increased during the nine months ended September 30, 2018, primarily due to increased exposures and changes in credit spreads. |
| |
(6) | Other exposures include cleared transactions, unsettled transactions, assets other than those reportable in specific exposure categories and non-material portfolios. Other exposures increased during the three months ended September 30, 2018,March 31, 2019 primarily due to an increasethe recognition of right-of-use (ROU) assets in other assets. Other exposures increased duringaccordance with the nine months ended September 30, 2018, primarily due to an increase in other assets and additional DTAs arising from temporary differences, which are subject to risk-weighting at 250%.adoption of ASU No. 2016-02, Leases (Topic 842), effective January 1, 2019. |
| |
(7) | Supervisory 6% multiplier does not apply to derivatives CVA. |
| |
(8)(4) | Risk levels increaseddecreased during the three months ended September 30, 2018March 31, 2019 primarily due to an increase in positions subject to specific risk charges, partially offset by decreases in exposure levels subject to Stressed Value at Risk. Risk levels increased during the nine months ended September 30, 2018 primarily due to an increase in positions subject to specific risk charges. |
| |
(9) | Risk-weighted assets decreased during the nine months ended September 30, 2018 due to changes in model inputs regarding volatility and the correlation between market risk factors, as well as methodology changes for standard specific risk charges. |
| |
(10) | Operational risk-weighted assets increased during the three months ended September 30, 2018, and decreased during the nine months ended September 30, 2018, primarily due to changes in operational loss severity and frequency.Value at Risk. |
As set forth in the table above, total risk-weighted assets under the Basel III Standardized Approach increased from year-end 20172018 primarily due to higher credit and market risk-weighted assets. The increase in credit risk-weighted assets, was primarily due to increased OTC derivatives, corporate loan commitments and an increase in repo-style transactions.
Total risk-weighted assets under the Basel III Advanced Approaches increased from year-end 2017, as higher credit and market risk-weighted assets were partially offset by a decrease in operationalmarket risk-weighted assets. The increase in credit risk-weighted assets was primarily due to increases in commercial loans and loan commitments, increases in equitysecuritization exposures and repo-style transactions, as well as the recognition of right-of-use (ROU) assets in accordance with the adoption of ASU No. 2016-02, Leases (Topic 842), effective January 1, 2019. At adoption, Citi recognized an ROU asset of approximately $4.4 billion on the Consolidated Balance Sheet related to its future lease commitments as lessee under operating leases. For additional temporary difference DTAs subjectinformation, see Note 1 to risk weighting,the Consolidated Financial Statements. The increase in credit risk-weighted assets was partially offset
by a decline in retail exposures due to reductions in qualifying revolving (cards) exposures attributable to seasonal holiday spending repayments as well as residential mortgagea decrease in loan salescommitments.
As set forth in the table above, total risk-weighted assets under the Basel III Advanced Approaches decreased from year-end 2018, driven by lower credit and repayments.market risk-weighted assets, slightly offset by an increase in operational risk-weighted assets. The declinedecrease in operationalcredit risk-weighted assets was primarily due to changesannual wholesale parameter updates, partially offset by the recognition of ROU assets in operational loss severity and frequency.accordance with the adoption of ASU 2016-02.
Market risk-weighted assets increaseddecreased under both the Basel III Standardized Approach and Basel III Advanced Approaches primarily due to increasesdecreases in positionsexposure levels subject to specific risk charges, partially offset by changes in model inputs regarding volatilityStressed Value at Risk and the correlation between market risk factors, as well as methodology changes for standard specific risk charges.Value at Risk.
Supplementary Leverage Ratio
As set forth in the table below, Citigroup’s Supplementary Leverage ratio was 6.5%6.4% for the thirdfirst quarter of 2018, compared to 6.6% for the second quarter of 2018 and 6.7% for2019, unchanged from the fourth quarter of 2017. The decline2018, as net income of $4.7 billion, beneficial net movements in the ratio quarter-over-quarter was principally drivenAOCI and a slight decrease in Total Leverage Exposure were offset by the return of $6.4$5.1 billion of capital to common shareholders as well as adverse net movements in AOCI, partially offset by quarterly net income of $4.6 billion. The ratio decreased from the fourth quarter of 2017, principally driven by the return of capital to common shareholders, adverse net
movements in AOCI and an increase in Total Leverage Exposure (TLE) primarily due to growth in average on-balance sheet assets and off-balance sheet commitments, partially offset by year-to-date net income.shareholders.
The following table sets forth Citi’s Supplementary Leverage ratio and related components for the three months ended September 30, 2018 and December 31, 2017.components:
Citigroup Basel III Supplementary Leverage Ratio and Related Components
| | | In millions of dollars, except ratios | September 30, 2018 | December 31, 2017 | March 31, 2019 | December 31, 2018 |
| Tier 1 Capital | $ | 159,877 |
| $ | 162,377 |
| $ | 158,712 |
| $ | 158,122 |
|
| Total Leverage Exposure (TLE) | | |
| Total Leverage Exposure | | |
On-balance sheet assets(1) | $ | 1,922,804 |
| $ | 1,909,699 |
| $ | 1,939,414 |
| $ | 1,936,791 |
|
Certain off-balance sheet exposures:(2) | | |
| Potential future exposure on derivative contracts | 191,557 |
| 191,555 |
| 184,115 |
| 187,130 |
|
Effective notional of sold credit derivatives, net(3) | 48,047 |
| 59,207 |
| 44,506 |
| 49,402 |
|
Counterparty credit risk for repo-style transactions(4) | 22,732 |
| 27,005 |
| 20,696 |
| 23,715 |
|
| Unconditionally cancellable commitments | 69,794 |
| 67,644 |
| 70,252 |
| 69,630 |
|
| Other off-balance sheet exposures | 245,370 |
| 218,754 |
| 244,599 |
| 238,805 |
|
| Total of certain off-balance sheet exposures | $ | 577,500 |
| $ | 564,165 |
| $ | 564,168 |
| $ | 568,682 |
|
| Less: Tier 1 Capital deductions | 40,311 |
| 41,373 |
| (39,624 | ) | (39,832 | ) |
| Total Leverage Exposure | $ | 2,459,993 |
| $ | 2,432,491 |
| $ | 2,463,958 |
| $ | 2,465,641 |
|
| Supplementary Leverage ratio | 6.50 | % | 6.68 | % | 6.44 | % | 6.41 | % |
| |
| (1) | Represents the daily average of on-balance sheet assets for the quarter. |
| |
| (2) | Represents the average of certain off-balance sheet exposures calculated as of the last day of each month in the quarter. |
| |
| (3) | Under the U.S. Basel III rules, banking organizations are required to include in TLETotal Leverage Exposure the effective notional amount of sold credit derivatives, with netting of exposures permitted if certain conditions are met. |
| |
| (4) | Repo-style transactions include repurchase and reverse repurchase transactions as well as securities borrowing and securities lending transactions. |
Capital Resources of Citigroup’s Subsidiary U.S. Depository Institutions
Citigroup’s subsidiary U.S. depository institutions, including Citibank, are also subject to regulatory capital standards issued by their respective primary federal bank regulatory agencies, which are similar to the standards of the Federal Reserve Board.
During 2018, Citi’s primary subsidiary U.S. depository institution, Citibank, N.A. (Citibank), is subject to effective minimum Common Equity Tier 1 Capital, Tier 1 Capital and Total Capital ratios, inclusive of the 75% phase-in of the 2.5% Capital Conservation Buffer, of 6.375%, 7.875% and 9.875%, respectively. Citibank’s effective minimum Common Equity Tier 1 Capital, Tier 1 Capital and Total Capital ratios during 2017, inclusive of the 50% phase-in of
the 2.5% Capital Conservation Buffer, were 5.75%, 7.25% and 9.25%, respectively. Citibank is required to maintain stated minimum Common Equity Tier 1 Capital, Tier 1 Capital and Total Capital ratios of 4.5%, 6.0% and 8.0%, respectively.
The following tables set forth theCitibank’s capital tiers, total risk-weighted assetscomponents and underlying risk components, risk-based capital ratios, quarterly adjusted average total assets, Total Leverage Exposure and leverage ratios for Citibank, Citi’s primary subsidiary U.S. depository institution, as of September 30, 2018 and December 31, 2017.ratios:
Citibank Capital Components and Ratios
| | | | September 30, 2018 | December 31, 2017 | March 31, 2019 | December 31, 2018 |
| In millions of dollars, except ratios | Advanced Approaches | Standardized Approach | Advanced Approaches | Standardized Approach | Effective Minimum Requirement(1) | Advanced Approaches | Standardized Approach | Effective Minimum Requirement(1) | Advanced Approaches | Standardized Approach |
| Common Equity Tier 1 Capital | $ | 128,097 |
| $ | 128,097 |
| $ | 122,848 |
| $ | 122,848 |
| | $ | 130,051 |
| $ | 130,051 |
| | $ | 129,091 |
| $ | 129,091 |
|
| Tier 1 Capital | 130,222 |
| 130,222 |
| 124,952 |
| 124,952 |
| | 132,169 |
| 132,169 |
| | 131,215 |
| 131,215 |
|
Total Capital (Tier 1 Capital + Tier 2 Capital)(1) | 143,471 |
| 154,081 |
| 138,008 |
| 148,946 |
| |
Total Capital (Tier 1 Capital + Tier 2 Capital)(2) | | | 145,516 |
| 156,132 |
| | 144,358 |
| 155,154 |
|
| Total Risk-Weighted Assets | 946,235 |
| 1,043,721 |
| 965,435 |
| 1,024,502 |
| | 926,758 |
| 1,041,251 |
| | 926,229 |
| 1,032,809 |
|
| Credit Risk | $ | 667,549 |
| $ | 1,007,205 |
| $ | 674,659 |
| $ | 980,324 |
| | $ | 651,979 |
| $ | 1,001,334 |
| | $ | 654,962 |
| $ | 994,294 |
|
| Market Risk | 36,141 |
| 36,516 |
| 43,300 |
| 44,178 |
| | 39,463 |
| 39,917 |
| | 38,144 |
| 38,515 |
|
| Operational Risk | 242,545 |
| — |
| 247,476 |
| — |
| | 235,316 |
| — |
| | 233,123 |
| — |
|
Common Equity Tier 1 Capital ratio(2)(3)(4) | 13.54 | % | 12.27 | % | 12.72 | % | 11.99 | % | |
Tier 1 Capital ratio(2)(3)(4) | 13.76 |
| 12.48 |
| 12.94 |
| 12.20 |
| |
Total Capital ratio(2)(3)(4) | 15.16 |
| 14.76 |
| 14.29 |
| 14.54 |
| |
Common Equity Tier 1 Capital ratio(3)(4) | | 7.0 | % | 14.03 | % | 12.49 | % | 6.375 | % | 13.94 | % | 12.50 | % |
Tier 1 Capital ratio(3)(4) | | 8.5 |
| 14.26 |
| 12.69 |
| 7.875 |
| 14.17 |
| 12.70 |
|
Total Capital ratio(3)(4) | | 10.5 |
| 15.70 |
| 14.99 |
| 9.875 |
| 15.59 |
| 15.02 |
|
| | | In millions of dollars, except ratios | September 30, 2018 | December 31, 2017 | Effective Minimum Requirement | March 31, 2019 | December 31, 2018 |
Quarterly Adjusted Average Total Assets(5) | | $ | 1,396,471 |
| | $ | 1,401,187 |
| | | $ | 1,397,703 |
| | $ | 1,398,875 |
|
Total Leverage Exposure(6) | | 1,920,675 |
| | 1,900,641 |
| | | 1,909,587 |
| | 1,914,663 |
|
Tier 1 Leverage ratio(2)(4) | | 9.33 | % | | 8.92 | % | |
Supplementary Leverage ratio(2)(4) | | 6.78 |
| | 6.57 |
| |
Tier 1 Leverage ratio(4) | | 4.0 | % | | 9.46 | % | | 9.38 | % |
Supplementary Leverage ratio(4) | | 6.0 |
| | 6.92 |
| | 6.85 |
|
| |
| (1) | Citibank’s effective minimum risk-based capital requirements during 2019 and 2018 are inclusive of the 100% and 75% phase-in, respectively, of the 2.5% Capital Conservation Buffer (all of which must be composed of Common Equity Tier 1 Capital). |
| |
| (2) | Under the Advanced Approaches framework, eligible credit reserves that exceed expected credit losses are eligible for inclusion in Tier 2 Capital to the extent that the excess reserves do not exceed 0.6% of credit risk-weighted assets, which differs from the Standardized Approach in which the allowance for credit losses is eligible for inclusion in Tier 2 Capital up to 1.25% of credit risk-weighted assets, with any excess allowance for credit losses being deducted in arriving at credit risk-weighted assets. |
| |
(2) | Citibank’s risk-based capital and leverage ratios and related components as of December 31, 2017 are non-GAAP financial measures, which reflect full implementation of regulatory capital adjustments and deductions prior to the effective date of January 1, 2018. |
| |
| (3) | As of September 30,March 31, 2019 and December 31, 2018, Citibank’s reportable Common Equity Tier 1 Capital, Tier 1 Capital and Total Capital ratios were the lower derived under the Basel III Standardized Approach. As of December 31, 2017, Citibank’s reportable Common Equity Tier 1 Capital and Tier 1 Capital ratios were the lower derived under the Basel III Standardized Approach, whereas the reportable Total Capital ratio was the lower derived under the Basel III Advanced Approaches framework. |
| |
| (4) | Citibank must maintain minimum Common Equity Tier 1 Capital, Tier 1 Capital, Total Capital and Tier 1 Leverage ratios of 6.5%, 8.0%, 10.0% and 5.0%, respectively, to be considered “well capitalized” under the revised Prompt Corrective Action (PCA) regulations applicable to insured depository institutions as established by the U.S. Basel III rules. Effective January 1, 2018, Citibank must also maintain a minimum Supplementary Leverage ratio of 6.0% to be considered “well capitalized.” For additional information, see “Capital Resources—Current Regulatory Capital Standards—Prompt Corrective Action Framework” in Citigroup’s 20172018 Annual Report on Form 10-K. |
| |
| (5) | Tier 1 Leverage ratio denominator. |
| |
| (6) | Supplementary Leverage ratio denominator. |
As indicated in the table above, Citibank’s capital ratios at September 30, 2018March 31, 2019 were in excess of the stated and effective minimum requirements under the U.S.
Basel III rules. In addition, Citibank was also “well capitalized” as of September 30, 2018March 31, 2019 under the revised PCA regulations.
Impact of Changes on Citigroup and Citibank Capital Ratios
The following tables present the estimated sensitivity of Citigroup’s and Citibank’s capital ratios to changes of $100 million in Common Equity Tier 1 Capital, Tier 1 Capital and Total Capital (numerator), and changes of $1 billion in
Advanced Approaches and Standardized Approach risk-weighted assets and quarterly adjusted average total assets, as well as Total Leverage Exposure (denominator), as of September 30, 2018.March 31, 2019. This information is provided for the
purpose of analyzing the impact that a change in Citigroup’s or Citibank’s financial position or results of operations could have on these ratios. These sensitivities only consider a single change to either a component of capital, risk-weighted assets, quarterly adjusted average total assets or Total Leverage Exposure. Accordingly, an event that affects more than one factor may have a larger basis point impact than is reflected in these tables.
Impact of Changes on Citigroup and Citibank Risk-Based Capital Ratios
| | | | Common Equity Tier 1 Capital ratio | Tier 1 Capital ratio | Total Capital ratio | Common Equity Tier 1 Capital ratio | Tier 1 Capital ratio | Total Capital ratio |
| In basis points | Impact of $100 million change in Common Equity Tier 1 Capital | Impact of $1 billion change in risk- weighted assets | Impact of $100 million change in Tier 1 Capital | Impact of $1 billion change in risk- weighted assets | Impact of $100 million change in Total Capital | Impact of $1 billion change in risk- weighted assets | Impact of $100 million change in Common Equity Tier 1 Capital | Impact of $1 billion change in risk- weighted assets | Impact of $100 million change in Tier 1 Capital | Impact of $1 billion change in risk- weighted assets | Impact of $100 million change in Total Capital | Impact of $1 billion change in risk- weighted assets |
| Citigroup | | | | | | | | | | | | |
| Advanced Approaches | 0.9 | 1.1 | 0.9 | 1.2 | 0.9 | 1.4 | 0.9 | 1.1 | 0.9 | 1.3 | 0.9 | 1.5 |
| Standardized Approach | 0.8 | 1.0 | 0.8 | 1.1 | 0.8 | 1.4 | 0.8 | 1.0 | 0.8 | 1.1 | 0.8 | 1.4 |
| Citibank | | | | | | | | | | | | |
| Advanced Approaches | 1.1 | 1.4 | 1.1 | 1.5 | 1.1 | 1.6 | 1.1 | 1.5 | 1.1 | 1.5 | 1.1 | 1.7 |
| Standardized Approach | 1.0 | 1.2 | 1.0 | 1.2 | 1.0 | 1.4 | 1.0 | 1.2 | 1.0 | 1.2 | 1.0 | 1.4 |
Impact of Changes on Citigroup and Citibank Leverage Ratios
| | | | Tier 1 Leverage ratio | Supplementary Leverage ratio | Tier 1 Leverage ratio | Supplementary Leverage ratio |
| In basis points | Impact of $100 million change in Tier 1 Capital | Impact of $1 billion change in quarterly adjusted average total assets | Impact of $100 million change in Tier 1 Capital | Impact of $1 billion change in Total Leverage Exposure | Impact of $100 million change in Tier 1 Capital | Impact of $1 billion change in quarterly adjusted average total assets | Impact of $100 million change in Tier 1 Capital | Impact of $1 billion change in Total Leverage Exposure |
| Citigroup | 0.5 | 0.5 | 0.4 | 0.3 | 0.5 | 0.4 | 0.4 | 0.3 |
| Citibank | 0.7 | 0.7 | 0.5 | 0.4 | 0.7 | 0.7 | 0.5 | 0.4 |
Citigroup Broker-Dealer Subsidiaries
At September 30, 2018,March 31, 2019, Citigroup Global Markets Inc., a U.S. broker-dealer registered with the SEC that is an indirect wholly owned subsidiary of Citigroup, had net capital, computed in accordance with the SEC’s net capital rule, of $10.5$9.6 billion, which exceeded the minimum requirement by $8.1$6.9 billion.
Moreover, Citigroup Global Markets Limited, a broker-dealer registered with the United Kingdom’s Prudential Regulation Authority (PRA) that is also an indirect wholly owned subsidiary of Citigroup, had total capital of $20.9 billion at September 30, 2018,March 31, 2019, which exceeded the PRA's minimum regulatory capital requirements.
In addition, certain of Citi’s other broker-dealer subsidiaries are subject to regulation in the countries in which they do business, including requirements to maintain specified levels of net capital or its equivalent. Citigroup’s other principal broker-dealer subsidiaries were in compliance with their regulatory capital requirements at September 30, 2018.
Regulatory Capital Standards Developments
Leverage Ratio Treatment of Client Cleared DerivativesCountercyclical Capital Buffer
In October 2018,March 2019, the Federal Reserve Board voted to affirm the Countercyclical Capital Buffer at the current level of 0%.
Total Loss-Absorbing Capacity (TLAC) Holdings
In April 2019, the U.S. banking agencies released a proposal that would create a new regulatory capital deduction applicable to Advanced Approaches banking organizations for certain investments in covered debt instruments issued by GSIBs. The proposed rule is intended to reduce systemic risk by creating an incentive for Advanced Approaches banking organizations to limit their exposure to GSIBs.
Under the U.S. Basel Committee on Banking Supervision (Basel Committee) issuedIII rules, investments in the capital of unconsolidated financial institutions are subject to deduction to the extent that they exceed certain thresholds. Under the proposed rule, an investment in a consultative document seeking views“covered debt instrument” would be treated as an investment in a Tier 2 capital instrument and, therefore, would be subject to whether a targeted and limited revisiondeduction from the Advanced Approaches banking organization’s own Tier 2 Capital in accordance with the existing rules for investments in unconsolidated financial institutions. Covered debt instruments would include unsecured debt instruments that are “eligible debt securities” for purposes of the leverage ratio exposure measure is warranted with regardTLAC rule, or that are pari passu or subordinated to such securities, in addition to certain unsecured debt instruments issued by foreign GSIBs.
To support a deep and liquid market for covered debt instruments, the treatmentproposed rule provides an exception from the approach described above for covered debt instruments held for 30 days or less for market-making purposes, if the aggregate amount of client cleared derivatives. Insuch debt instruments does not exceed 5% of the U.S.,banking organization’s Common Equity Tier 1 Capital.
The proposed rule does not specify a proposed effective date for the Basel Committee’s leverage ratio framework and leverage ratio exposure measure are most closely aligned withnew regulatory capital deduction. If adopted as proposed, Citi does not expect the proposed rule to have a material impact on its regulatory capital.
Revisions to the Supplementary Leverage Ratio for Custody Banks
In April 2019, the U.S. banking agencies released a proposal to implement certain provisions of the Economic Growth, Regulatory Relief, and Total Leverage Exposure, respectively. Under the Basel Committee’s leverage ratio framework,Consumer Protection Act, which was last updatedsigned into law in December 2017, the leverage ratio exposure measure is generally2018. The proposal would apply to “custodial banking organizations,” which does not adjusted for physical or financial collateral, guarantees or other credit risk mitigation techniques. However, the Basel Committee consultative document proposes two alternative treatments for client cleared derivatives that would reduce the leverage ratio exposure measure, to varying degrees, in recognition of the beneficial effects of margin requirements and overcollateralization, as applicable.
One of the options under consideration would allow amounts of cash and non-cash initial margin that are received from the client to offset the potential future exposure of derivatives centrally cleared on the client’s behalf. Another option would amend the currently specified treatment of client cleared derivatives to align it with the measurement as determined per the Basel Committee’s standardized approach for measuring counterparty credit risk exposures, as used for risk-based capital requirements. This option would permit both cash and non-cash forms of initial margin and variation margin received from the client to offset replacement cost and potential future exposure for client cleared derivatives only.
include Citi. The U.S. banking agencies may revisepreviously issued a proposal in April 2018 that would have modified the treatment of client cleared derivatives under theenhanced Supplementary Leverage Ratio inratio standards applicable to all U.S. GSIBs and their Federal Reserve Board or OCC-regulated insured depository institution subsidiaries. It is currently unclear how this latest proposal may impact or interact with the future, based upon any revisions adopted by the Basel Committee.proposed rulemaking from April 2018.
Tangible Common Equity, Book Value Per Share, Tangible Book Value Per Share and Returns on Equity
Tangible common equity (TCE), as defined by Citi, represents common stockholders’ equity less goodwill and identifiable intangible assets (other than MSRs). Other companies may calculate TCE in a different manner. TCE, tangible book value (TBV) per share and returns on average TCE are non-GAAP financial measures.
| | | In millions of dollars or shares, except per share amounts | September 30,
2018 | December 31,
2017 | March 31,
2019 | December 31,
2018 |
| Total Citigroup stockholders’ equity | $ | 197,004 |
| $ | 200,740 |
| $ | 196,252 |
| $ | 196,220 |
|
| Less: Preferred stock | 19,035 |
| 19,253 |
| 17,980 |
| 18,460 |
|
| Common stockholders’ equity | $ | 177,969 |
| $ | 181,487 |
| $ | 178,272 |
| $ | 177,760 |
|
| Less: | | |
| Goodwill | 22,187 |
| 22,256 |
| 22,037 |
| 22,046 |
|
| Identifiable intangible assets (other than MSRs) | 4,598 |
| 4,588 |
| 4,645 |
| 4,636 |
|
Goodwill and identifiable intangible assets (other than MSRs) related to assets held-for-sale (HFS) | — |
| 32 |
| |
| Tangible common equity (TCE) | $ | 151,184 |
| $ | 154,611 |
| $ | 151,590 |
| $ | 151,078 |
|
| Common shares outstanding (CSO) | 2,442.1 |
| 2,569.9 |
| 2,312.5 |
| 2,368.5 |
|
| Book value per share (common equity/CSO) | $ | 72.88 |
| $ | 70.62 |
| $ | 77.09 |
| $ | 75.05 |
|
| Tangible book value per share (TCE/CSO) | 61.91 |
| 60.16 |
| 65.55 |
| 63.79 |
|
| | | In millions of dollars | Three Months Ended September 30, 2018 | Three Months Ended September 30, 2017 | Nine Months Ended September 30, 2018 | Nine Months Ended September 30, 2017 | Three Months Ended March 31, 2019 | Three Months Ended March 31, 2018 |
| Net income available to common shareholders | $ | 4,352 |
| $ | 3,861 |
| $ | 12,872 |
| $ | 11,202 |
| $ | 4,448 |
| $ | 4,348 |
|
Average common stockholders’ equity(1) | $ | 179,459 |
| $ | 209,764 |
| $ | 180,772 |
| $ | 208,787 |
| $ | 177,485 |
| $ | 181,628 |
|
| Average TCE | $ | 152,712 |
| $ | 182,333 |
| $ | 153,909 |
| $ | 181,271 |
| $ | 151,334 |
| $ | 155,107 |
|
| Return on average common stockholders’ equity | 9.6 | % | 7.3 | % | 9.5 | % | 7.2 | % | 10.2 | % | 9.7 | % |
Return on average TCE (ROTCE)(2)(1) | 11.3 |
| 8.4 |
| 11.2 |
| 8.3 |
| 11.9 |
| 11.4 |
|
| |
| (1) | Average common stockholders’ equity for the 2018 periods includes the $22.6 billion impact from Tax Reform recorded at the end of the fourth quarter of 2017. |
| |
(2) | ROTCE represents annualized net income available to common shareholders as a percentage of average TCE. |
Managing Global Risk Table of Contents
|
| | | |
| MANAGING GLOBAL RISK | | |
|
CREDIT RISK(1) | | |
|
| Consumer Credit | | |
|
| Corporate Credit | | |
|
| Additional Consumer and Corporate Credit Details | | |
|
| Loans Outstanding | | |
|
| Details of Credit Loss Experience | | |
|
| Allowance for Loan Losses | | 5045 |
|
| Non-Accrual Loans and Assets and Renegotiated Loans | | |
|
| LIQUIDITY RISK | | |
|
| High-Quality Liquid Assets (HQLA) | | |
|
| Liquidity Coverage Ratio (LCR) | | |
|
| Loans | | 5650 |
|
| Deposits | | 5650 |
|
| Long-Term Debt | | 5751 |
|
| Secured Funding Transactions and Short-Term Borrowings | | 5953 |
|
Liquidity Coverage Ratio (LCR) | | 59 |
|
| Credit Ratings | | 6054 |
|
MARKET RISK(1) | | |
|
| Market Risk of Non-Trading Portfolios | | |
|
| Market Risk of Trading Portfolios | | |
|
COUNTRYSTRATEGIC RISK | | |
|
| Country Risk | | |
|
| Potential Exit of U.K. from EU | | |
|
| |
| (1) | For additional information regarding certain credit risk, market risk and other quantitative and qualitative information, refer to Citi’s Pillar 3 Basel III Advanced Approaches Disclosures, as required by the rules of the Federal Reserve Board, on Citi’s Investor Relations website. |
MANAGING GLOBAL RISK
For Citi, effective risk management is of primary importance to its overall operations. Accordingly, Citi’s risk management process has been designed to identify, monitor, evaluate and manage the principal risks it assumes in conducting its activities. Specifically, the activities that Citi engages in, and the risks those activities generate, must be consistent with Citi’s mission and value proposition, the key principles that guide it and Citi's risk appetite.
For more information on Citi’s management of global risk, including its three lines of defense, see “Managing Global Risk” in Citi’s 20172018 Annual Report on Form 10-K.
CREDIT RISK
For additional information on credit risk, including Citi’s credit risk management, measurement and stress testing, and Citi’s consumer and corporate credit portfolios, see “Credit Risk” and “Risk Factors” in Citi’s 20172018 Annual Report on Form 10-K.
CONSUMER CREDIT
Citi provides traditional retail banking, including commercial banking, and credit card products in 19 countries and jurisdictions through North America GCB, Latin America GCB and Asia GCB. The retail banking products include consumer mortgages, home equity, personal and commercial loans and lines of credit and similar related products with a focus on lending to prime customers. Citi uses its risk appetite framework to define its lending parameters. In addition, Citi uses proprietary scoring models for new customer approvals.
As stated in “Global Consumer Banking” above, GCB’s overall strategy is to leverage Citi’s global footprint and be the pre-eminent bank for the affluent and emerging affluent consumers in large urban centers. In credit cards and in certain retail markets (including commercial banking), Citi serves customers in a somewhat broader set of segments and geographies. GCB’s commercial banking business primarily focuses on small to mid-size businesses and also serves larger middle market companies in certain regions.
Consumer Credit Portfolio
The following table shows Citi’s quarterly end-of-period consumer loans:(1)
| | | In billions of dollars | 3Q’17 | 4Q’17 | 1Q’18 | 2Q’18 | 3Q’18 | 1Q’18 | 2Q’18 | 3Q’18 | 4Q’18 | 1Q’19 |
| Retail banking: | | | | | | |
| Mortgages | $ | 81.4 |
| $ | 81.7 |
| $ | 82.1 |
| $ | 80.5 |
| $ | 80.9 |
| $ | 82.1 |
| $ | 80.5 |
| $ | 80.9 |
| $ | 80.6 |
| $ | 80.8 |
|
| Commercial banking | 35.5 |
| 36.3 |
| 36.8 |
| 36.5 |
| 37.2 |
| 36.8 |
| 36.5 |
| 37.2 |
| 36.3 |
| 37.1 |
|
| Personal and other | 27.3 |
| 27.9 |
| 28.5 |
| 28.1 |
| 28.7 |
| 28.5 |
| 28.1 |
| 28.7 |
| 28.8 |
| 29.1 |
|
| Total retail banking | $ | 144.2 |
| $ | 145.9 |
| $ | 147.4 |
| $ | 145.1 |
| $ | 146.8 |
| $ | 147.4 |
| $ | 145.1 |
| $ | 146.8 |
| $ | 145.7 |
| $ | 147.0 |
|
| Cards: | | |
| Citi-branded cards | $ | 110.7 |
| $ | 115.7 |
| $ | 110.6 |
| $ | 112.3 |
| $ | 112.8 |
| $ | 110.6 |
| $ | 112.3 |
| $ | 112.8 |
| $ | 116.8 |
| $ | 111.4 |
|
| Citi retail services | 45.9 |
| 49.2 |
| 46.0 |
| 48.6 |
| 49.4 |
| 46.0 |
| 48.6 |
| 49.4 |
| 52.7 |
| 48.9 |
|
| Total cards | $ | 156.6 |
| $ | 164.9 |
| $ | 156.6 |
| $ | 160.9 |
| $ | 162.2 |
| $ | 156.6 |
| $ | 160.9 |
| $ | 162.2 |
| $ | 169.5 |
| $ | 160.3 |
|
Total GCB | $ | 300.8 |
| $ | 310.8 |
| $ | 304.0 |
| $ | 306.0 |
| $ | 309.0 |
| $ | 304.0 |
| $ | 306.0 |
| $ | 309.0 |
| $ | 315.2 |
| $ | 307.3 |
|
GCB regional distribution: | | |
| North America | 62 | % | 63 | % | 61 | % | 63 | % | 62 | % | 61 | % | 63 | % | 62 | % | 64 | % | 63 | % |
| Latin America | 9 |
| 8 |
| 9 |
| 8 |
| 9 |
| 9 |
| 8 |
| 9 |
| 8 |
| 8 |
|
Asia(2) | 29 |
| 29 |
| 30 |
| 29 |
| 29 |
| 30 |
| 29 |
| 29 |
| 28 |
| 29 |
|
Total GCB | 100 | % | 100 | % | 100 | % | 100 | % | 100 | % | 100 | % | 100 | % | 100 | % | 100 | % | 100 | % |
Corporate/Other(3) | $ | 24.8 |
| $ | 22.9 |
| $ | 21.1 |
| $ | 17.6 |
| $ | 16.5 |
| $ | 21.1 |
| $ | 17.6 |
| $ | 16.5 |
| $ | 15.3 |
| $ | 12.6 |
|
| Total consumer loans | $ | 325.6 |
| $ | 333.7 |
| $ | 325.1 |
| $ | 323.6 |
| $ | 325.5 |
| $ | 325.1 |
| $ | 323.6 |
| $ | 325.5 |
| $ | 330.5 |
| $ | 319.9 |
|
| |
| (1) | End-of-period loans include interest and fees on credit cards. |
| |
| (2) | Asia includes loans and leases in certain EMEA countries for all periods presented. |
| |
| (3) | Primarily consists of legacy assets, principally North America consumer mortgages. |
For information on changes to Citi’s end-of-period consumer loans, see “Liquidity Risk—Loans” below.
Overall Consumer Credit Trends
The following charts show the quarterly trends in delinquencies and net credit losses across both retail banking, including commercial banking, and cards for total GCB and by region.
As of March 31, 2019, approximately 70% of North America GCBprovides mortgages, home equity loans, personal loans and commercial banking products through Citi’s retail banking network and card products through Citi-branded cards and Citi retail services businesses. The retail bank is concentrated in six major metropolitan cities in the United States (for additional information on the U.S. retail bank, see “North America GCB” above).
As of September 30, 2018, approximately 71% of North America GCB consumer loans consisted of Citi-branded and Citi retail services cards, which generally drives the overall credit performance of North America GCB (for additional information on North America GCB’s cards portfolios, including delinquency and net credit loss rates, see “Credit Card Trends” below).
As shown in the chart above, the quarter-over-quarter net credit loss rate decreased while the 90+ days past due delinquency rate slightlywas broadly stable quarter-over-quarter in North America GCB. The net credit loss rate increased quarter-over-quarter, primarily driven bydue to seasonality in both cards portfolios. The year-over-year net credit loss rate decreased due toportfolios as well as an episodic charge-off in the commercial portfolioportfolio.
The delinquency rate increased year-over-year, primarily due to seasoning in North America cards and higher net flow rates in the prior-year period, whilelater delinquency buckets in Citi retail services. The net credit loss rate increased year-over-year due to seasoning in North America cards, an increase in net flow rates in later delinquency buckets in Citi retail services and the delinquency rate was broadly stable.previously referenced episodic charge-off in the commercial portfolio.
Latin America GCB operates in Mexico through Citibanamex, one of Mexico’s largest banks, and provides credit cards, consumer mortgages, personal loans and commercial banking products. Latin America GCB serves a more mass market segment in Mexico and focuses on developing multi-product relationships with customers.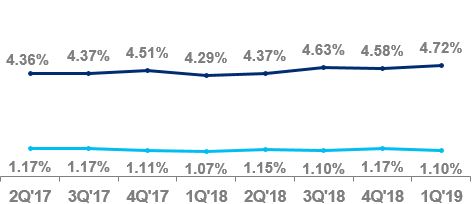
As set forthshown in the chart above, the 90+ days past due delinquency rate decreased quarter-over-quarter and year-over-year, primarilyin Latin America GCB due to improvements in mortgages and the commercial portfolio.seasonality. The quarter-over-quarter and year-over year net credit loss rate increased quarter-over-quarter also due to seasonality as well as the impact of lower overall volume growth. The delinquency rate was broadly stable year-over-year, while the net credit loss rate increased year-over-year, primarily driven by an episodic charge-offseasoning in the commercialcards portfolio which was offset by a related loan loss reserve release.as well as the impact of the lower overall volume growth.
| |
| (1) | Asia includes GCB activities in certain EMEA countries for all periods presented. |
Asia GCB operates in 17 countries in Asia and EMEA and provides credit cards, consumer mortgages, personal loans and commercial banking products.
As shown in the chart above, the 90+ days past due delinquency and net credit loss rates were broadly stable in Asia GCB quarter-over-quarter and year-over-year as of the third quarter of 2018.year-over-year. This stability reflects the strong credit profiles in Asia GCB’s target customer segments. In addition, regulatory changes in many markets in Asia over the past few years have resulted in stable portfolio credit quality.
For additional information on cost of credit, loan delinquency and other information for Citi’s consumer loan portfolios, see each respective business’s results of operations above and Note 13 to the Consolidated Financial Statements.
Credit Card Trends
The following charts show the quarterly trends in delinquencies and net credit losses for total GCB cards, North America Citi-branded cards and Citi retail services portfolios as well as for Latin America and Asia Citi-branded cards portfolios.
|
|
| North America Citi-Branded Cards |

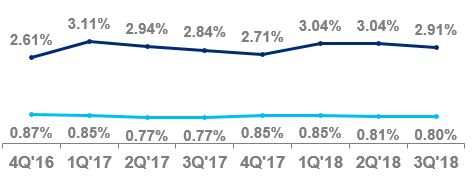
North America GCB’s Citi-branded cards portfolio issues proprietary and co-branded cards.
As shown in the chart above, quarter-over-quarter the 90+ days past due delinquency rate was stable while the net credit loss rate decreased primarily due to seasonality. The year-over-year increases in both the delinquency and net credit loss rates increased quarter-over-quarter, primarily due to seasonality, while the increases year-over-year were driven primarily by portfolio seasoning.due to seasoning of the portfolio.
|
|
| North America Citi Retail Services |
Citi retail services partners directly with more than 20 retailers and dealers to offer private-label and co-branded consumer and commercial cards. Citi retail services’ target market is focused on select industry segments such as home improvement, specialty retail, consumer electronics and fuel. Citi retail services continually evaluates opportunities to add partners within target industries that have strong loyalty, lending or payment programs and growth potential.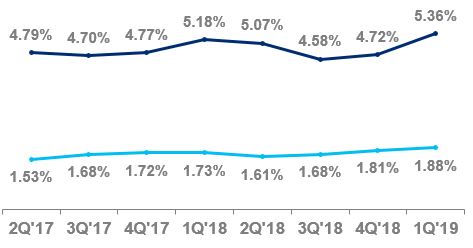
As shown in the chart above, Citi retail services’ 90+ days past due delinquency rate increased quarter-over-quarter, mainly due to seasonality, while theand net credit loss rate decreased,rates increased quarter-over-quarter, primarily due to seasonality and the impact of recently acquired portfolios.as well as an increase in net flow rates in later delinquency buckets. The year-over-yeardelinquency and net credit loss rate decrease wasrates increased year-over-year, primarily driven by the impact of recently acquired portfolios.due to seasoning and an increase in net flow rates in later delinquency buckets.
|
|
| Latin America Citi-Branded Cards |

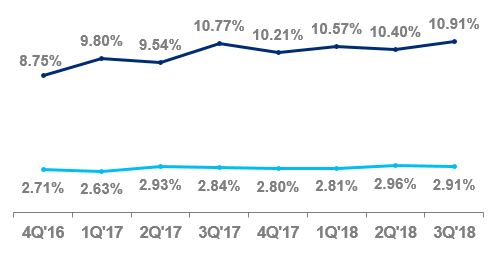
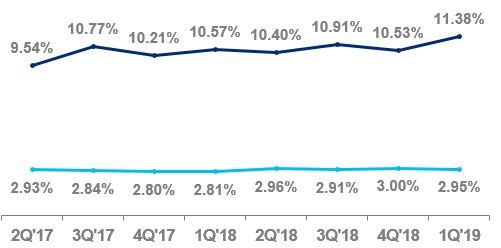
Latin America GCB issues proprietary and co-branded cards. As set forthshown in the chart above, the quarter-over-quarter net credit loss rate increased while the 90+ days past due delinquency rate decreased, both primarily driven by seasonality. The year-over-yearwhile the net credit loss and delinquency ratesrate increased quarter-over-quarter, both primarily due to portfolioseasonality. The delinquency and net credit loss rates both increased year-over-year, primarily due to seasoning.
|
|
Asia Citi-Branded Cards(1) |
| |
| (1) | Asia includes loans and leases in certain EMEA countries for all periods presented. |
Asia GCB issues proprietary and co-branded cards. As set forth in the chart above, the 90+ days past due delinquency rate has remained broadly stable quarter-over-quarter and year-over-year, driven by the mature and well-diversified cards portfolios. The increase in the year-over-year net credit loss rate wasincreased quarter-over-quarter, primarily driven bydue to seasonality, while the conversionrate increased year-over-year, reflecting the normalization of an acquired portfolio in Australia. The quarter-over-quarter decrease inoverall credit across the net credit loss rate was primarily related to improvements in this portfolio.region.
For additional information on cost of credit, delinquency and other information for Citi’s cards portfolios, see each respective business’s results of operations above and Note 13 to the Consolidated Financial Statements.
North America Cards FICO Distribution
The following tables show the current FICO score distributions for Citi’s North America Citi-branded cards and Citi retail services portfolios based on end-of-period receivables. FICO scores are updated monthly for substantially all of the portfolio and on a quarterly basis for the remaining portfolio.
| | | | | | | |
| FICO distribution | September 30, 2018 | June 30, 2018 | September 30, 2017 | March 31, 2019 | December 31, 2018 | March 31, 2018 |
| > 760 | 42 | % | 43 | % | 40 | % | 41 | % | 43 | % | 41 | % |
| 680 - 760 | 41 |
| 40 |
| 41 |
| |
| 680–760 | | 41 |
| 40 |
| 42 |
|
| < 680 | 17 |
| 17 |
| 19 |
| 18 |
| 17 |
| 17 |
|
| Total | 100 | % | 100 | % | 100 | % | 100 | % | 100 | % | 100 | % |
| | | | | | | |
| FICO distribution | September 30, 2018 | June 30, 2018 | September 30, 2017 | March 31, 2019 | December 31, 2018 | March 31, 2018 |
| > 760 | 24 | % | 24 | % | 23 | % | 23 | % | 25 | % | 22 | % |
| 680 - 760 | 43 |
| 43 |
| 43 |
| |
| 680–760 | | 43 |
| 42 |
| 43 |
|
| < 680 | 33 |
| 33 |
| 34 |
| 34 |
| 33 |
| 35 |
|
| Total | 100 | % | 100 | % | 100 | % | 100 | % | 100 | % | 100 | % |
The FICO distribution of both cards portfolios wasremained broadly stable, compared to the previousprior year and prior quarter, and previous year. The portfolios continued to demonstratedemonstrating strong underlying credit quality. For additional information on FICO scores, see Note 13 to the Consolidated Financial Statements.
North America Consumer Mortgage Lending
Citi’s NorthAmerica consumer mortgage portfolio consists of both residential first mortgages and home equity loans. The following table shows the outstanding quarterly end-of-period loans for Citi’s North America residential first mortgage and home equity loan portfolios:
|
| | | | | | | | | | | | | | | |
| In billions of dollars | 3Q’17 | 4Q’17 | 1Q’18 | 2Q’18 | 3Q’18 |
GCB: | | | | | |
| Residential firsts | $ | 40.1 |
| $ | 40.1 |
| $ | 40.1 |
| $ | 40.3 |
| $ | 40.7 |
|
| Home equity | 4.1 |
| 4.2 |
| 4.1 |
| 4.1 |
| 3.9 |
|
Total GCB | $ | 44.2 |
| $ | 44.3 |
| $ | 44.2 |
| $ | 44.4 |
| $ | 44.6 |
|
Corporate/Other: | | | | | |
| Residential firsts | $ | 10.1 |
| $ | 9.3 |
| $ | 8.1 |
| $ | 7.6 |
| $ | 7.0 |
|
| Home equity | 11.5 |
| 10.6 |
| 9.9 |
| 8.8 |
| 8.2 |
|
Total Corporate/ Other | $ | 21.6 |
| $ | 19.9 |
| $ | 18.0 |
| $ | 16.4 |
| $ | 15.2 |
|
Total Citigroup— North America | $ | 65.8 |
| $ | 64.2 |
| $ | 62.2 |
| $ | 60.8 |
| $ | 59.8 |
|
For additional information on delinquency and net credit loss trends in Citi’s consumer mortgage portfolio, see “Additional Consumer Credit Details” below.
Home Equity Loans—Revolving HELOCs
As set forth in the table above, Citi had $12.1 billion of home equity loans as of September 30, 2018, of which $2.5 billion were fixed-rate home equity loans and $9.6 billion were extended under home equity lines of credit (Revolving HELOCs). Fixed-rate home equity loans are fully amortizing. Revolving HELOCs allow for amounts to be drawn for a period of time with the payment of interest only until the end of the draw period, when the outstanding amount is converted to an amortizing loan, or “reset” (the interest-only payment feature during the revolving period is standard for this product across the industry). Upon reset, these borrowers will be required to pay both interest, usually at a variable rate, and principal that amortizes typically over 20 years, rather than the standard 30-year amortization.
Of the Revolving HELOCs at September 30, 2018, $6.2 billion had reset (compared to $6.4 billion at June 30, 2018) and $3.4 billion were still within their revolving period and had not reset (compared to $3.7 billion at June 30, 2018). The following chart indicates the FICO and combined loan-to-value (CLTV) characteristics of Citi’s Revolving HELOCs portfolio and the year in which they reset:
|
|
North America Home Equity Lines of Credit Amortization – Citigroup
Total ENR by Reset Year
In billions of dollars as of September 30, 2018
|
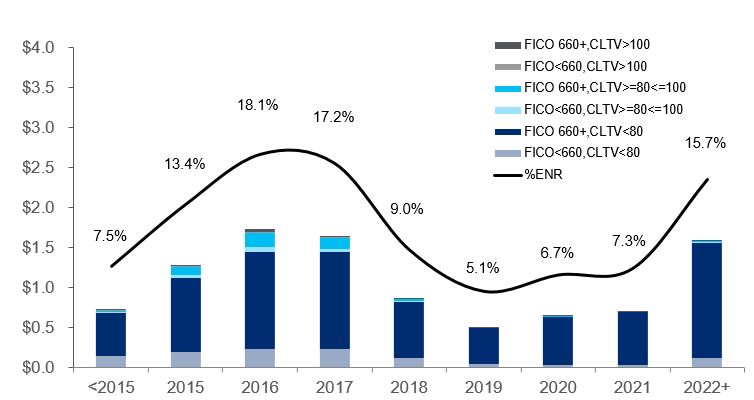
Note: Totals may not sum due to rounding.
Approximately 64% of Citi’s total Revolving HELOCs portfolio had reset as of September 30, 2018 (compared to 63% as of June 30, 2018). Of the remaining Revolving HELOCs portfolio, approximately 2% will commence amortization during the remainder of 2018. Citi’s customers with Revolving HELOCs that reset could experience “payment shock” due to the higher required payments on the loans. Citi currently estimates that the monthly loan payment for its Revolving HELOCs that reset during the remainder of 2018 could increase on average by approximately $270, or 98%. Increases in interest rates could further increase these payments given the variable nature of the interest rates on these loans post-reset. Borrowers’ high loan-to-value positions, as well as the cost and availability of refinancing options, could limit borrowers’ ability to refinance their Revolving HELOCs as these loans continue to reset.
Approximately 5.5% of the Revolving HELOCs that have reset as of September 30, 2018 were 30+ days past due, compared to 3.7% of the total outstanding home equity loan portfolio (amortizing and non-amortizing). This compared to 5.3% and 3.6%, respectively, as of June 30, 2018. As newly amortizing loans continue to season, the delinquency rate of Citi’s total home equity loan portfolio could increase. Although interest rates have steadily increased over the past 12 months, resets to date have generally occurred during a period of historically low interest rates, which Citi believes has likely reduced the overall “payment shock” to the borrower.
Citi monitors this reset risk closely and will continue to consider any potential impact in determining its allowance for loan loss reserves. In addition, management continues to review and take additional actions to offset potential reset risk, such as establishing a borrower outreach program to provide reset risk education and proactively working with high-risk borrowers through a specialized single point of contact unit.
Additional Consumer Credit Details
Consumer Loan Delinquency Amounts and Ratios
| | | | EOP loans(1) | 90+ days past due(2) | 30–89 days past due(2) | EOP loans(1) | 90+ days past due(2) | 30–89 days past due(2) |
In millions of dollars,
except EOP loan amounts in billions | September 30,
2018 | September 30,
2018 | June 30,
2018 | September 30,
2017 | September 30,
2018 | June 30,
2018 | September 30,
2017 | March 31,
2019 | March 31,
2019 | December 31,
2018 | March 31,
2018 | March 31,
2019 | December 31,
2018 | March 31,
2018 |
Global Consumer Banking(3)(4) | | | | | | | | |
| Total | $ | 309.0 |
| $ | 2,404 |
| $ | 2,345 |
| $ | 2,279 |
| $ | 2,890 |
| $ | 2,558 |
| $ | 2,763 |
| $ | 307.3 |
| $ | 2,585 |
| $ | 2,619 |
| $ | 2,379 |
| $ | 2,776 |
| $ | 2,902 |
| $ | 2,710 |
|
| Ratio | | 0.78 | % | 0.77 | % | 0.76 | % | 0.94 | % | 0.84 | % | 0.92 | % | | 0.84 | % | 0.83 | % | 0.78 | % | 0.91 | % | 0.92 | % | 0.89 | % |
| Retail banking | | | | | | | | | | |
| Total | $ | 146.8 |
| $ | 508 |
| $ | 500 |
| $ | 489 |
| $ | 857 |
| $ | 754 |
| $ | 805 |
| $ | 147.0 |
| $ | 474 |
| $ | 485 |
| $ | 493 |
| $ | 769 |
| $ | 790 |
| $ | 830 |
|
| Ratio | | 0.35 | % | 0.35 | % | 0.34 | % | 0.59 | % | 0.52 | % | 0.56 | % | | 0.32 | % | 0.33 | % | 0.34 | % | 0.53 | % | 0.54 | % | 0.57 | % |
| North America | 56.3 |
| 188 |
| 179 |
| 167 |
| 320 |
| 252 |
| 270 |
| 57.3 |
| 179 |
| 180 |
| 184 |
| 269 |
| 282 |
| 227 |
|
| Ratio | | 0.34 | % | 0.33 | % | 0.30 | % | 0.58 | % | 0.46 | % | 0.49 | % | | 0.32 | % | 0.32 | % | 0.34 | % | 0.47 | % | 0.50 | % | 0.41 | % |
| Latin America | 21.0 |
| 126 |
| 132 |
| 151 |
| 235 |
| 183 |
| 244 |
| 19.7 |
| 114 |
| 127 |
| 128 |
| 201 |
| 201 |
| 248 |
|
| Ratio | | 0.60 | % | 0.66 | % | 0.72 | % | 1.12 | % | 0.91 | % | 1.16 | % | | 0.58 | % | 0.64 | % | 0.60 | % | 1.02 | % | 1.02 | % | 1.17 | % |
Asia(5) | 69.5 |
| 194 |
| 189 |
| 171 |
| 302 |
| 319 |
| 291 |
| 70.0 |
| 181 |
| 178 |
| 181 |
| 299 |
| 307 |
| 355 |
|
| Ratio | | 0.28 | % | 0.27 | % | 0.25 | % | 0.43 | % | 0.46 | % | 0.43 | % | | 0.26 | % | 0.26 | % | 0.26 | % | 0.43 | % | 0.44 | % | 0.50 | % |
| Cards | | | | | | | | | | |
| Total | $ | 162.2 |
| $ | 1,896 |
| $ | 1,845 |
| $ | 1,790 |
| $ | 2,033 |
| $ | 1,804 |
| $ | 1,958 |
| $ | 160.3 |
| $ | 2,111 |
| $ | 2,134 |
| $ | 1,886 |
| $ | 2,007 |
| $ | 2,112 |
| $ | 1,880 |
|
| Ratio | | 1.17 | % | 1.15 | % | 1.14 | % | 1.25 | % | 1.12 | % | 1.25 | % | | 1.32 | % | 1.26 | % | 1.20 | % | 1.25 | % | 1.25 | % | 1.20 | % |
North America—Citi-branded | 88.4 |
| 707 |
| 712 |
| 668 |
| 722 |
| 627 |
| 705 |
| 87.0 |
| 828 |
| 812 |
| 731 |
| 731 |
| 755 |
| 669 |
|
| Ratio | | 0.80 | % | 0.81 | % | 0.77 | % | 0.82 | % | 0.71 | % | 0.82 | % | | 0.95 | % | 0.88 | % | 0.85 | % | 0.84 | % | 0.82 | % | 0.78 | % |
North America—Citi retail services | 49.4 |
| 832 |
| 781 |
| 772 |
| 890 |
| 761 |
| 836 |
| 48.9 |
| 918 |
| 952 |
| 797 |
| 859 |
| 932 |
| 791 |
|
| Ratio | | 1.68 | % | 1.61 | % | 1.68 | % | 1.80 | % | 1.57 | % | 1.82 | % | | 1.88 | % | 1.81 | % | 1.73 | % | 1.76 | % | 1.77 | % | 1.72 | % |
| Latin America | 5.8 |
| 169 |
| 160 |
| 159 |
| 170 |
| 156 |
| 163 |
| 5.6 |
| 165 |
| 171 |
| 160 |
| 161 |
| 170 |
| 160 |
|
| Ratio | | 2.91 | % | 2.96 | % | 2.84 | % | 2.93 | % | 2.89 | % | 2.91 | % | | 2.95 | % | 3.00 | % | 2.81 | % | 2.88 | % | 2.98 | % | 2.81 | % |
Asia(5) | 18.6 |
| 188 |
| 192 |
| 191 |
| 251 |
| 260 |
| 254 |
| 18.8 |
| 200 |
| 199 |
| 198 |
| 256 |
| 255 |
| 260 |
|
| Ratio | | 1.01 | % | 1.02 | % | 1.02 | % | 1.35 | % | 1.38 | % | 1.35 | % | | 1.06 | % | 1.03 | % | 1.03 | % | 1.36 | % | 1.32 | % | 1.35 | % |
Corporate/Other—Consumer(6) | | | | | | | | | | |
| Total | $ | 16.5 |
| $ | 401 |
| $ | 415 |
| $ | 605 |
| $ | 422 |
| $ | 355 |
| $ | 643 |
| $ | 12.6 |
| $ | 354 |
| $ | 382 |
| $ | 478 |
| $ | 348 |
| $ | 362 |
| $ | 393 |
|
| Ratio | | 2.57 | % | 2.49 | % | 2.57 | % | 2.71 | % | 2.13 | % | 2.74 | % | | 2.97 | % | 2.62 | % | 2.38 | % | 2.92 | % | 2.48 | % | 1.96 | % |
| International | — |
| — |
| — |
| 57 |
| — |
| — |
| 47 |
| — |
| — |
| — |
| 32 |
| — |
| — |
| 44 |
|
| Ratio | | — | % | — | % | 3.35 | % | — | % | — | % | 2.76 | % | | — | % | — | % | 1.88 | % | — | % | — | % | 2.59 | % |
| North America | 16.5 |
| 401 |
| 415 |
| 548 |
| 422 |
| 355 |
| 596 |
| 12.6 |
| 354 |
| 382 |
| 446 |
| 348 |
| 362 |
| 349 |
|
| Ratio | | 2.57 | % | 2.49 | % | 2.51 | % | 2.71 | % | 2.13 | % | 2.73 | % | | 2.97 | % | 2.62 | % | 2.42 | % | 2.92 | % | 2.48 | % | 1.90 | % |
| Total Citigroup | $ | 325.5 |
| $ | 2,805 |
| $ | 2,760 |
| $ | 2,884 |
| $ | 3,312 |
| $ | 2,913 |
| $ | 3,406 |
| $ | 319.9 |
| $ | 2,939 |
| $ | 3,001 |
| $ | 2,857 |
| $ | 3,124 |
| $ | 3,264 |
| $ | 3,103 |
|
| Ratio | | 0.87 | % | 0.86 | % | 0.89 | % | 1.02 | % | 0.90 | % | 1.05 | % | | 0.92 | % | 0.91 | % | 0.88 | % | 0.98 | % | 0.99 | % | 0.96 | % |
| |
| (1) | End-of-period (EOP) loans include interest and fees on credit cards. |
| |
| (2) | The ratios of 90+ days past due and 30–89 days past due are calculated based on EOP loans, net of unearned income. |
| |
| (3) | The 90+ days past due balances for North America—Citi-brandedand North America—Citi retail services are generally still accruing interest. Citigroup’s policy is generally to accrue interest on credit card loans until 180 days past due, unless notification of bankruptcy filing has been received earlier. |
| |
| (4) | The 90+ days past due and 30–89 days past due and related ratios for North America GCB exclude U.S. mortgage loans that are guaranteed by U.S. government-sponsored entities since the potential loss predominantly resides within the U.S. government-sponsored entities. The amounts excluded for loans 90+ days past due and (EOP loans) were $235$163 million ($0.70.6 billion), $244$201 million ($0.70.6 billion) and $289$272 million ($0.7 billion) as of September 30, 2018, June 30,March 31, 2019, December 31, 2018 and September 30, 2017,March 31, 2018, respectively. The amounts excluded for loans 30–89 days past due and (EOP loans) were $82$71 million ($0.70.6 billion), $87$78 million ($0.70.6 billion), and $79$92 million ($0.7 billion) as of September 30, 2018, June 30,March 31, 2019, December 31, 2018 and September 30, 2017,March 31, 2018, respectively. |
| |
| (5) | Asia includes delinquencies and loans in certain EMEA countries for all periods presented. |
| |
| (6) | The loans 90+ days past due and related ratios exclude U.S. mortgage loans that are guaranteed by U.S. government-sponsored agencies since the potential loss predominantly resides with the U.S. agencies. The amounts excluded for 90+ days past due and (EOP loans) for each period were $0.4$0.3 billion ($0.80.7 billion), $0.4$0.3 billion ($0.7 billion) and $0.5 billion ($0.9 billion) and $0.7 billion ($1.2 billion) as of September 30, 2018, June 30,March 31, 2019, December 31, 2018 and September 30, 2017,March 31, 2018, respectively. The amounts excluded for loans 30–89 days past due and (EOP loans) for each period were $0.1 billion ($0.80.7 billion), $0.1 billion ($0.90.7 billion), and $0.1 billion ($1.20.9 billion) as of September 30, 2018, June 30,March 31, 2019, December 31, 2018 and September 30, 2017,March 31, 2018, respectively. |
Consumer Loan Net Credit Losses and Ratios
| | | | Average loans(1) | Net credit losses(2)(3) | Average loans(1) | Net credit losses(2) |
| In millions of dollars, except average loan amounts in billions | 3Q18 | 2Q18 | 3Q17 | 1Q19 | 4Q18 | 1Q18 |
| Global Consumer Banking | | | | | | |
| Total | $ | 306.8 |
| $ | 1,714 |
| $ | 1,726 |
| $ | 1,704 |
| $ | 309.2 |
| $ | 1,891 |
| $ | 1,744 |
| $ | 1,736 |
|
| Ratio | | 2.22 | % | 2.28 | % | 2.26 | % | | 2.48 | % | 2.24 | % | 2.30 | % |
| Retail banking | | | | |
| Total | $ | 145.9 |
| $ | 243 |
| $ | 228 |
| $ | 300 |
| $ | 146.5 |
| $ | 256 |
| $ | 246 |
| $ | 232 |
|
| Ratio | | 0.66 | % | 0.63 | % | 0.82 | % | | 0.71 | % | 0.67 | % | 0.64 | % |
| North America | 56.0 |
| 32 |
| 32 |
| 88 |
| 57.1 |
| 60 |
| 31 |
| 43 |
|
| Ratio | | 0.23 | % | 0.23 | % | 0.63 | % | | 0.43 | % | 0.22 | % | 0.31 | % |
| Latin America | 20.7 |
| 153 |
| 138 |
| 143 |
| 19.9 |
| 138 |
| 144 |
| 132 |
|
| Ratio | | 2.93 | % | 2.75 | % | 2.68 | % | | 2.81 | % | 2.91 | % | 2.59 | % |
Asia(4)(3) | 69.2 |
| 58 |
| 58 |
| 69 |
| 69.5 |
| 58 |
| 71 |
| 57 |
|
| Ratio | | 0.33 | % | 0.33 | % | 0.41 | % | | 0.34 | % | 0.41 | % | 0.33 | % |
| Cards | | | | |
| Total | $ | 160.9 |
| $ | 1,471 |
| $ | 1,498 |
| $ | 1,404 |
| $ | 162.7 |
| $ | 1,635 |
| $ | 1,498 |
| $ | 1,504 |
|
| Ratio | | 3.63 | % | 3.81 | % | 3.58 | % | | 4.08 | % | 3.64 | % | 3.83 | % |
North America—Citi-branded | 87.8 |
| 644 |
| 657 |
| 611 |
| 87.7 |
| 706 |
| 650 |
| 651 |
|
| Ratio | | 2.91 | % | 3.04 | % | 2.84 | % | | 3.26 | % | 2.90 | % | 3.04 | % |
North America—Citi retail services | 49.0 |
| 566 |
| 589 |
| 540 |
| 50.2 |
| 663 |
| 600 |
| 602 |
|
| Ratio | | 4.58 | % | 5.07 | % | 4.70 | % | | 5.36 | % | 4.72 | % | 5.18 | % |
| Latin America | 5.6 |
| 154 |
| 140 |
| 152 |
| 5.7 |
| 160 |
| 146 |
| 146 |
|
| Ratio | | 10.91 | % | 10.40 | % | 10.77 | % | | 11.38 | % | 10.53 | % | 10.57 | % |
Asia(4)(3) | 18.5 |
| 107 |
| 112 |
| 101 |
| 19.1 |
| 106 |
| 102 |
| 105 |
|
| Ratio | | 2.29 | % | 2.38 | % | 2.13 | % | | 2.25 | % | 2.16 | % | 2.17 | % |
Corporate/Other—Consumer(3) | | | | |
| Total | $ | 17.0 |
| $ | 12 |
| $ | (20 | ) | $ | 52 |
| $ | 13.6 |
| $ | 1 |
| $ | — |
| $ | 35 |
|
| Ratio | | 0.28 | % | (0.41 | )% | 0.80 | % | | 0.03 | % | — | % | 0.64 | % |
| International | — |
| — |
| 19 |
| 25 |
| — |
| — |
| — |
| 23 |
|
| Ratio | | — | % | 6.93 | % | 5.22 | % | | — | % | — | % | 5.49 | % |
| North America | 17.0 |
| 12 |
| (39 | ) | 27 |
| 13.6 |
| 1 |
| — |
| 12 |
|
| Ratio | | 0.28 | % | (0.85 | )% | 0.45 | % | | 0.03 | % | — | % | 0.24 | % |
Other(5) | — |
| — |
| — |
| (22 | ) | — |
| — |
| (3 | ) | — |
|
| Total Citigroup | $ | 323.8 |
| $ | 1,726 |
| $ | 1,706 |
| $ | 1,734 |
| $ | 322.8 |
| $ | 1,892 |
| $ | 1,741 |
| $ | 1,771 |
|
| Ratio | | 2.11 | % | 2.12 | % | 2.11 | % | | 2.38 | % | 2.12 | % | 2.19 | % |
| |
| (1) | Average loans include interest and fees on credit cards. |
| |
| (2) | The ratios of net credit losses are calculated based on average loans, net of unearned income. |
| |
| (3) | In October 2016, Citi entered into an agreement to sell Citi’s Brazil consumer banking business. The sale was completed at the end of the fourth quarter of 2017. As a result of HFS accounting treatment, approximately $37 million of net credit losses (NCLs) was recorded as a reduction in revenue (Other revenue) during the third quarter of 2017. Accordingly, these NCLs are not included in this table. Loans classified as HFS are excluded from this table as they are recorded in Other assets.
|
| |
(4) | Asia includes NCLs and average loans in certain EMEA countries for all periods presented. |
| |
(5) | The third quarter of 2017 NCLs reflected a recovery related to legacy assets. |
CORPORATE CREDIT
Consistent with its overall strategy, Citi’s corporate clients are typically large, multinational corporations that value the depth and breadth of Citi’s global network. Citi aims to establish relationships with these clients that encompass multiple products, consistent with client needs, including cash management and trade services, foreign exchange, lending, capital markets and M&A advisory.
Corporate Credit Portfolio
The following table sets forth Citi’s corporate credit portfolio within ICG (excluding private bank), before consideration of collateral or hedges, by remaining tenor for the periods indicated:
| | | | At September 30, 2018 | June 30, 2018 | December 31, 2017 | At March 31, 2019 | December 31, 2018 |
| In billions of dollars | Due within 1 year | Greater than 1 year but within 5 years | Greater than 5 years | Total exposure | Due within 1 year | Greater than 1 year but within 5 years | Greater than 5 years | Total exposure | Due within 1 year | Greater than 1 year but within 5 years | Greater than 5 years | Total exposure | Due within 1 year | Greater than 1 year but within 5 years | Greater than 5 years | Total exposure | Due within 1 year | Greater than 1 year but within 5 years | Greater than 5 years | Total exposure |
Direct outstandings (on-balance sheet)(1) | $ | 131 |
| $ | 103 |
| $ | 20 |
| $ | 254 |
| $ | 133 |
| $ | 103 |
| $ | 19 |
| $ | 255 |
| $ | 127 |
| $ | 96 |
| $ | 22 |
| $ | 245 |
| $ | 135 |
| $ | 109 |
| $ | 20 |
| $ | 264 |
| $ | 128 |
| $ | 110 |
| $ | 20 |
| $ | 258 |
|
Unfunded lending commitments (off-balance sheet)(2) | 115 |
| 253 |
| 25 |
| 393 |
| 127 |
| 235 |
| 20 |
| 382 |
| 111 |
| 222 |
| 20 |
| 353 |
| 121 |
| 240 |
| 23 |
| 384 |
| 106 |
| 246 |
| 19 |
| 370 |
|
| Total exposure | $ | 246 |
| $ | 356 |
| $ | 45 |
| $ | 647 |
| $ | 260 |
| $ | 338 |
| $ | 39 |
| $ | 637 |
| $ | 238 |
| $ | 318 |
| $ | 42 |
| $ | 598 |
| $ | 256 |
| $ | 349 |
| $ | 43 |
| $ | 648 |
| $ | 234 |
| $ | 356 |
| $ | 39 |
| $ | 628 |
|
| |
| (1) | Includes drawn loans, overdrafts, bankers’ acceptances and leases. |
| |
| (2) | Includes unused commitments to lend, letters of credit and financial guarantees. |
Portfolio Mix—Geography, Counterparty and Industry
Citi’s corporate credit portfolio is diverse across geography and counterparty. The following table shows the percentage of this portfolio by region based on Citi’s internal management geography:
| | | | September 30,
2018 | June 30,
2018 | December 31,
2017 | March 31,
2019 | December 31,
2018 |
| North America | 55 | % | 54 | % | 54 | % | 54 | % | 55 | % |
| EMEA | 27 |
| 27 |
| 27 |
| 28 |
| 27 |
|
| Asia | 11 |
| 12 |
| 12 |
| 11 |
| 11 |
|
| Latin America | 7 |
| 7 |
| 7 |
| 7 |
| 7 |
|
| Total | 100 | % | 100 | % | 100 | % | 100 | % | 100 | % |
The maintenance of accurate and consistent risk ratings across the corporate credit portfolio facilitates the comparison of credit exposure across all lines of business, geographic regions and products. Counterparty risk ratings reflect an estimated probability of default for a counterparty and are derived primarily through the use of validated statistical models, scorecard models and external agency ratings (under defined circumstances), in combination with consideration of factors specific to the obligor or market, such as management experience, competitive position,
regulatory environment and commodity prices. Facility risk ratings are assigned that reflect the probability of default of
the obligor and factors that affect the loss-given-default of the facility, such as support or collateral. Internal obligor ratings that generally correspond to BBB and above are
considered investment grade, while those below are considered non-investment grade.
Citigroup also has incorporated environmental factors like climate risk assessment and reporting criteria for certain obligors, as necessary. Factors evaluated include consideration of climate risk to an obligor’s business and physical assets and, when relevant, consideration of cost-effective options to reduce greenhouse gas emissions.
The following table presents the corporate credit portfolio by facility risk rating as a percentage of the total corporate credit portfolio:
| | | | Total exposure | Total exposure |
| | September 30,
2018 | June 30,
2018 | December 31,
2017 | March 31,
2019 | December 31,
2018 |
| AAA/AA/A | 48 | % | 49 | % | 49 | % | 49 | % | 49 | % |
| BBB | 34 |
| 34 |
| 34 |
| 35 |
| 34 |
|
| BB/B | 17 |
| 16 |
| 16 |
| 15 |
| 16 |
|
| CCC or below | 1 |
| 1 |
| 1 |
| 1 |
| 1 |
|
| Total | 100 | % | 100 | % | 100 | % | 100 | % | 100 | % |
Note: Total exposure includes direct outstandings and unfunded lending commitments.
Citi’s corporate credit portfolio is also diversified by industry. The following table shows the allocation of Citi’s total corporate credit portfolio by industry:
| | | | Total exposure | Total exposure |
| | September 30,
2018 | June 30,
2018 | December 31,
2017 | March 31,
2019 | December 31,
2018 |
| Transportation and industrial | 21 | % | 22 | % | 22 | % | 21 | % | 21 | % |
| Consumer retail and health | 16 |
| 16 |
| 16 |
| 15 |
| 15 |
|
| Technology, media and telecom | 14 |
| 13 |
| 12 |
| 11 |
| 13 |
|
| Power, chemicals, metals and mining | 11 |
| 10 |
| 10 |
| 11 |
| 10 |
|
| Energy and commodities | 8 |
| 8 |
| 8 |
| 8 |
| 8 |
|
| Banks/broker-dealers/finance companies | 8 |
| 8 |
| 8 |
| 8 |
| 8 |
|
| Real estate | 8 |
| 7 |
| 8 |
| 9 |
| 8 |
|
| Public sector | 5 |
| 5 |
| 5 |
| 4 |
| 5 |
|
| Insurance and special purpose entities | 4 |
| 4 |
| 5 |
| 4 |
| 4 |
|
| Hedge funds | 4 |
| 4 |
| 4 |
| 4 |
| 4 |
|
| Other industries | 1 |
| 3 |
| 2 |
| 5 |
| 4 |
|
| Total | 100 | % | 100 | % | 100 | % | 100 | % | 100 | % |
For additional information on Citi’s corporate credit portfolio, see Note 12 to the Consolidated Financial Statements.
Credit Risk Mitigation
As part of its overall risk management activities, Citigroup uses credit derivatives and other risk mitigants to hedge portions of the credit risk in its corporate credit portfolio, in addition to outright asset sales. The results of the mark-to-market and any realized gains or losses on credit derivatives are reflected primarily in Other revenue in the Consolidated Statement of Income.
At September 30, 2018, June 30, 2018March 31, 2019 and December 31, 2017, $26.9 billion, $27.42018, $30.4 billion, and $16.3$30.8 billion, respectively, of the corporate credit portfolio was economically hedged. Citigroup’s expected loss model used in the calculation of its loan loss reserve does not include the favorable impact of credit derivatives and other mitigants that are marked to market. In addition, the reported amounts of direct outstandings and unfunded lending commitments in the tables above do not reflect the impact of these hedging transactions. The credit protection was economically hedging underlying corporate credit portfolio exposures with the following risk rating distribution:
Rating of Hedged Exposure
| | | | September 30,
2018 | June 30,
2018 | December 31,
2017 | March 31,
2019 | December 31,
2018 |
| AAA/AA/A | 34 | % | 34 | % | 23 | % | 36 | % | 35 | % |
| BBB | 47 |
| 46 |
| 43 |
| 48 |
| 50 |
|
| BB/B | 17 |
| 18 |
| 31 |
| 15 |
| 14 |
|
| CCC or below | 2 |
| 2 |
| 3 |
| 1 |
| 1 |
|
| Total | 100 | % | 100 | % | 100 | % | 100 | % | 100 | % |
The credit protection was economically hedging underlying corporate credit portfolio exposures with the following industry distribution:
Industry of Hedged Exposure
|
| | | | |
| | March 31,
2019 | December 31,
2018 |
| Transportation and industrial | 22 | % | 23 | % |
| Technology, media and telecom | 18 |
| 17 |
|
| Consumer retail and health | 16 |
| 16 |
|
| Power, chemicals, metals and mining | 15 |
| 15 |
|
| Energy and commodities | 10 |
| 11 |
|
| Insurance and special purpose entities | 6 |
| 6 |
|
| Banks/broker-dealers/finance companies | 4 |
| 4 |
|
| Public Sector | 4 |
| 3 |
|
| Real Estate | 4 |
| 4 |
|
| Other industries | 1 |
| 1 |
|
| Total | 100 | % | 100 | % |
|
| | | | | | |
| | September 30,
2018 | June 30,
2018 | December 31,
2017 |
| Transportation and industrial | 25 | % | 25 | % | 27 | % |
| Technology, media and telecom | 15 |
| 15 |
| 12 |
|
| Consumer retail and health | 14 |
| 15 |
| 10 |
|
| Power, chemicals, metals and mining | 14 |
| 14 |
| 14 |
|
| Energy and commodities | 11 |
| 11 |
| 15 |
|
| Public sector | 7 |
| 7 |
| 12 |
|
Banks/broker-dealers/finance companies
| 5 |
| 4 |
| 6 |
|
| Insurance and special purpose entities | 4 |
| 5 |
| 2 |
|
| Other industries | 5 |
| 4 |
| 2 |
|
| Total | 100 | % | 100 | % | 100 | % |
ADDITIONAL CONSUMER AND CORPORATE CREDIT DETAILS
Loans Outstanding
| | | | 3rd Qtr. | 2nd Qtr. | 1st Qtr. | 4th Qtr. | 3rd Qtr. | 1st Qtr. | 4th Qtr. | 3rd Qtr. | 2nd Qtr. | 1st Qtr. |
| In millions of dollars | 2018 | 2018 | 2017 | 2019 | 2018 |
| Consumer loans |
|
|
|
|
| In U.S. offices |
|
|
Mortgage and real estate(1) | $ | 61,048 |
| $ | 61,692 |
| $ | 63,412 |
| $ | 65,467 |
| $ | 67,131 |
| $ | 57,461 |
| $ | 60,127 |
| $ | 61,048 |
| $ | 61,692 |
| $ | 63,412 |
|
| Installment, revolving credit and other | 3,515 |
| 3,759 |
| 3,306 |
| 3,398 |
| 3,191 |
| 3,257 |
| 3,398 |
| 3,515 |
| 3,759 |
| 3,306 |
|
| Cards | 137,051 |
| 135,968 |
| 131,081 |
| 139,006 |
| 131,476 |
| 135,206 |
| 143,788 |
| 137,051 |
| 135,968 |
| 131,081 |
|
| Commercial and industrial | 7,686 |
| 7,459 |
| 7,493 |
| 7,840 |
| 7,619 |
| 8,859 |
| 8,256 |
| 7,686 |
| 7,459 |
| 7,493 |
|
| Total | $ | 209,300 |
| $ | 208,878 |
| $ | 205,292 |
| $ | 215,711 |
| $ | 209,417 |
| $ | 204,783 |
| $ | 215,569 |
| $ | 209,300 |
| $ | 208,878 |
| $ | 205,292 |
|
| In offices outside the U.S. | | |
Mortgage and real estate(1) | $ | 43,714 |
| $ | 43,056 |
| $ | 44,833 |
| $ | 44,081 |
| $ | 43,723 |
| $ | 43,184 |
| $ | 43,379 |
| $ | 43,714 |
| $ | 43,056 |
| $ | 44,833 |
|
| Installment, revolving credit and other | 27,899 |
| 27,254 |
| 27,651 |
| 26,556 |
| 26,153 |
| 27,525 |
| 27,609 |
| 27,899 |
| 27,254 |
| 27,651 |
|
| Cards | 24,971 |
| 24,712 |
| 25,993 |
| 26,257 |
| 25,443 |
| 24,763 |
| 25,400 |
| 24,971 |
| 24,712 |
| 25,993 |
|
| Commercial and industrial | 18,821 |
| 18,966 |
| 20,526 |
| 20,238 |
| 20,015 |
| 18,884 |
| 17,773 |
| 18,821 |
| 18,966 |
| 20,526 |
|
| Lease financing | 52 |
| 55 |
| 62 |
| 76 |
| 77 |
| 47 |
| 49 |
| 52 |
| 55 |
| 62 |
|
| Total | $ | 115,457 |
| $ | 114,043 |
| $ | 119,065 |
| $ | 117,208 |
| $ | 115,411 |
| $ | 114,403 |
| $ | 114,210 |
| $ | 115,457 |
| $ | 114,043 |
| $ | 119,065 |
|
| Total consumer loans | $ | 324,757 |
| $ | 322,921 |
| $ | 324,357 |
| $ | 332,919 |
| $ | 324,828 |
| $ | 319,186 |
| $ | 329,779 |
| $ | 324,757 |
| $ | 322,921 |
| $ | 324,357 |
|
Unearned income(2) | 712 |
| 711 |
| 727 |
| 737 |
| 748 |
| 701 |
| 708 |
| 712 |
| 711 |
| 727 |
|
| Consumer loans, net of unearned income | $ | 325,469 |
| $ | 323,632 |
| $ | 325,084 |
| $ | 333,656 |
| $ | 325,576 |
| $ | 319,887 |
| $ | 330,487 |
| $ | 325,469 |
| $ | 323,632 |
| $ | 325,084 |
|
| Corporate loans |
|
|
| In U.S. offices |
|
|
| Commercial and industrial | $ | 51,365 |
| $ | 53,260 |
| $ | 54,005 |
| $ | 51,319 |
| $ | 51,679 |
| $ | 56,698 |
| $ | 52,063 |
| $ | 51,365 |
| $ | 53,260 |
| $ | 54,005 |
|
| Financial institutions | 46,255 |
| 42,867 |
| 40,472 |
| 39,128 |
| 37,203 |
| 49,985 |
| 48,447 |
| 46,255 |
| 42,867 |
| 40,472 |
|
Mortgage and real estate(1) | 47,629 |
| 46,310 |
| 45,581 |
| 44,683 |
| 43,274 |
| 49,746 |
| 50,124 |
| 47,629 |
| 46,310 |
| 45,581 |
|
| Installment, revolving credit and other | 32,201 |
| 32,663 |
| 32,866 |
| 33,181 |
| 32,464 |
| 32,768 |
| 33,247 |
| 32,201 |
| 32,663 |
| 32,866 |
|
| Lease financing | 1,445 |
| 1,445 |
| 1,463 |
| 1,470 |
| 1,493 |
| 1,405 |
| 1,429 |
| 1,445 |
| 1,445 |
| 1,463 |
|
| Total | $ | 178,895 |
| $ | 176,545 |
| $ | 174,387 |
| $ | 169,781 |
| $ | 166,113 |
| $ | 190,602 |
| $ | 185,310 |
| $ | 178,895 |
| $ | 176,545 |
| $ | 174,387 |
|
| In offices outside the U.S. |
|
|
| Commercial and industrial | $ | 98,281 |
| $ | 98,068 |
| $ | 101,368 |
| $ | 93,750 |
| $ | 93,107 |
| $ | 97,844 |
| $ | 94,701 |
| $ | 98,281 |
| $ | 98,068 |
| $ | 101,368 |
|
| Financial institutions | 37,851 |
| 38,312 |
| 35,659 |
| 35,273 |
| 33,050 |
| 39,155 |
| 36,837 |
| 37,851 |
| 38,312 |
| 35,659 |
|
Mortgage and real estate(1) | 7,344 |
| 7,261 |
| 7,543 |
| 7,309 |
| 6,383 |
| 7,005 |
| 7,376 |
| 7,344 |
| 7,261 |
| 7,543 |
|
| Installment, revolving credit and other | 22,827 |
| 22,755 |
| 23,338 |
| 22,638 |
| 23,830 |
| 24,868 |
| 25,684 |
| 22,827 |
| 22,755 |
| 23,338 |
|
| Lease financing | 131 |
| 139 |
| 167 |
| 190 |
| 216 |
| 95 |
| 103 |
| 131 |
| 139 |
| 167 |
|
| Governments and official institutions | 4,898 |
| 5,270 |
| 6,170 |
| 5,200 |
| 5,628 |
| 3,698 |
| 4,520 |
| 4,898 |
| 5,270 |
| 6,170 |
|
| Total | $ | 171,332 |
| $ | 171,805 |
| $ | 174,245 |
| $ | 164,360 |
| $ | 162,214 |
| $ | 172,665 |
| $ | 169,221 |
| $ | 171,332 |
| $ | 171,805 |
| $ | 174,245 |
|
| Total corporate loans | $ | 350,227 |
| $ | 348,350 |
| $ | 348,632 |
| $ | 334,141 |
| $ | 328,327 |
| $ | 363,267 |
| $ | 354,531 |
| $ | 350,227 |
| $ | 348,350 |
| $ | 348,632 |
|
Unearned income(3) | (787 | ) | (802 | ) | (778 | ) | (763 | ) | (720 | ) | (808 | ) | (822 | ) | (787 | ) | (802 | ) | (778 | ) |
| Corporate loans, net of unearned income | $ | 349,440 |
| $ | 347,548 |
| $ | 347,854 |
| $ | 333,378 |
| $ | 327,607 |
| $ | 362,459 |
| $ | 353,709 |
| $ | 349,440 |
| $ | 347,548 |
| $ | 347,854 |
|
| Total loans—net of unearned income | $ | 674,909 |
| $ | 671,180 |
| $ | 672,938 |
| $ | 667,034 |
| $ | 653,183 |
| $ | 682,346 |
| $ | 684,196 |
| $ | 674,909 |
| $ | 671,180 |
| $ | 672,938 |
|
| Allowance for loan losses—on drawn exposures | (12,336 | ) | (12,126 | ) | (12,354 | ) | (12,355 | ) | (12,366 | ) | (12,329 | ) | (12,315 | ) | (12,336 | ) | (12,126 | ) | (12,354 | ) |
Total loans—net of unearned income
and allowance for credit losses | $ | 662,573 |
| $ | 659,054 |
| $ | 660,584 |
| $ | 654,679 |
| $ | 640,817 |
| $ | 670,017 |
| $ | 671,881 |
| $ | 662,573 |
| $ | 659,054 |
| $ | 660,584 |
|
Allowance for loan losses as a percentage of total loans—
net of unearned income(4) | 1.84 | % | 1.81 | % | 1.85 | % | 1.87 | % | 1.91 | % | 1.82 | % | 1.81 | % | 1.84 | % | 1.81 | % | 1.85 | % |
Allowance for consumer loan losses as a percentage of
total consumer loans—net of unearned income(4) | 3.07 | % | 3.03 | % | 3.09 | % | 2.96 | % | 3.04 | % | 3.13 | % | 3.01 | % | 3.07 | % | 3.03 | % | 3.09 | % |
Allowance for corporate loan losses as a percentage of
total corporate loans—net of unearned income(4) | 0.68 | % | 0.68 | % | 0.67 | % | 0.76 | % | 0.77 | % | 0.64 | % | 0.67 | % | 0.68 | % | 0.68 | % | 0.67 | % |
| |
| (1) | Loans secured primarily by real estate. |
| |
| (2) | Unearned income on consumer loans primarily represents unamortized origination fees and costs, premiums and discounts. |
| |
| (3) | Unearned income on corporate loans primarily represents interest received in advance, but not yet earned, on loans originated on a discounted basis. |
| |
| (4) | All periods exclude loans that are carried at fair value. |
Details of Credit Loss Experience
| | | | 3rd Qtr. | 2nd Qtr. | 1st Qtr. | 4th Qtr. | 3rd Qtr. | 1st Qtr. | 4th Qtr. | 3rd Qtr. | 2nd Qtr. | 1st Qtr. |
| In millions of dollars | 2018 | 2018 | 2017 | 2019 | 2018 |
| Allowance for loan losses at beginning of period | $ | 12,126 |
| $ | 12,354 |
| $ | 12,355 |
| $ | 12,366 |
| $ | 12,025 |
| $ | 12,315 |
| $ | 12,336 |
| $ | 12,126 |
| $ | 12,354 |
| $ | 12,355 |
|
| Provision for loan losses | | |
| Consumer | $ | 1,869 |
| $ | 1,764 |
| $ | 1,881 |
| $ | 1,785 |
| $ | 2,142 |
| $ | 1,942 |
| $ | 1,774 |
| $ | 1,869 |
| $ | 1,764 |
| $ | 1,881 |
|
| Corporate | 37 |
| 31 |
| (78 | ) | 231 |
| 4 |
| 2 |
| 76 |
| 37 |
| 31 |
| (78 | ) |
| Total | $ | 1,906 |
| $ | 1,795 |
| $ | 1,803 |
| $ | 2,016 |
| $ | 2,146 |
| $ | 1,944 |
| $ | 1,850 |
| $ | 1,906 |
| $ | 1,795 |
| $ | 1,803 |
|
| Gross credit losses | | |
| Consumer | | |
| In U.S. offices | $ | 1,462 |
| $ | 1,490 |
| $ | 1,542 |
| $ | 1,426 |
| $ | 1,429 |
| $ | 1,670 |
| $ | 1,495 |
| $ | 1,462 |
| $ | 1,490 |
| $ | 1,542 |
|
| In offices outside the U.S. | 596 |
| 599 |
| 615 |
| 611 |
| 642 |
| 602 |
| 595 |
| 596 |
| 599 |
| 615 |
|
| Corporate | | |
| In U.S. offices | 15 |
| 5 |
| 65 |
| 21 |
| 15 |
| 33 |
| 23 |
| 15 |
| 5 |
| 65 |
|
| In offices outside the U.S. | 21 |
| 15 |
| 74 |
| 221 |
| 34 |
| 40 |
| 53 |
| 21 |
| 15 |
| 74 |
|
| Total | $ | 2,094 |
| $ | 2,109 |
| $ | 2,296 |
| $ | 2,279 |
| $ | 2,120 |
| $ | 2,345 |
| $ | 2,166 |
| $ | 2,094 |
| $ | 2,109 |
| $ | 2,296 |
|
Credit recoveries(1) | | |
| Consumer | | |
| In U.S. offices | $ | 212 |
| $ | 255 |
| $ | 238 |
| $ | 228 |
| $ | 167 |
| $ | 246 |
| $ | 217 |
| $ | 212 |
| $ | 255 |
| $ | 238 |
|
| In offices outside the U.S. | 120 |
| 128 |
| 148 |
| 151 |
| 170 |
| 134 |
| 132 |
| 120 |
| 128 |
| 148 |
|
| Corporate | | |
| In U.S. offices | 1 |
| 5 |
| 13 |
| 4 |
| 2 |
| 3 |
| 24 |
| 1 |
| 5 |
| 13 |
|
| In offices outside the U.S. | 5 |
| 17 |
| 30 |
| 16 |
| 4 |
| 14 |
| 7 |
| 5 |
| 17 |
| 30 |
|
| Total | $ | 338 |
| $ | 405 |
| $ | 429 |
| $ | 399 |
| $ | 343 |
| $ | 397 |
| $ | 380 |
| $ | 338 |
| $ | 405 |
| $ | 429 |
|
| Net credit losses | | |
| In U.S. offices | $ | 1,264 |
| $ | 1,235 |
| $ | 1,356 |
| $ | 1,215 |
| $ | 1,275 |
| $ | 1,454 |
| $ | 1,277 |
| $ | 1,264 |
| $ | 1,235 |
| $ | 1,356 |
|
| In offices outside the U.S. | 492 |
| 469 |
| 511 |
| 665 |
| 502 |
| 494 |
| 509 |
| 492 |
| 469 |
| 511 |
|
| Total | $ | 1,756 |
| $ | 1,704 |
| $ | 1,867 |
| $ | 1,880 |
| $ | 1,777 |
| $ | 1,948 |
| $ | 1,786 |
| $ | 1,756 |
| $ | 1,704 |
| $ | 1,867 |
|
Other—net(2)(3)(4)(5)(6)(7) | $ | 60 |
| $ | (319 | ) | $ | 63 |
| $ | (147 | ) | $ | (28 | ) | $ | 18 |
| $ | (85 | ) | $ | 60 |
| $ | (319 | ) | $ | 63 |
|
| Allowance for loan losses at end of period | $ | 12,336 |
| $ | 12,126 |
| $ | 12,354 |
| $ | 12,355 |
| $ | 12,366 |
| $ | 12,329 |
| $ | 12,315 |
| $ | 12,336 |
| $ | 12,126 |
| $ | 12,354 |
|
Allowance for loan losses as a percentage of total loans(8) | 1.84 | % | 1.81 | % | 1.85 | % | 1.87 | % | 1.91 | % | 1.82 | % | 1.81 | % | 1.84 | % | 1.81 | % | 1.85 | % |
Allowance for unfunded lending commitments(9) | $ | 1,321 |
| $ | 1,278 |
| $ | 1,290 |
| $ | 1,258 |
| $ | 1,232 |
| $ | 1,391 |
| $ | 1,367 |
| $ | 1,321 |
| $ | 1,278 |
| $ | 1,290 |
|
| Total allowance for loan losses and unfunded lending commitments | $ | 13,657 |
| $ | 13,404 |
| $ | 13,644 |
| $ | 13,613 |
| $ | 13,598 |
| $ | 13,720 |
| $ | 13,682 |
| $ | 13,657 |
| $ | 13,404 |
| $ | 13,644 |
|
| Net consumer credit losses | $ | 1,726 |
| $ | 1,706 |
| $ | 1,771 |
| $ | 1,658 |
| $ | 1,734 |
| $ | 1,892 |
| $ | 1,741 |
| $ | 1,726 |
| $ | 1,706 |
| $ | 1,771 |
|
| As a percentage of average consumer loans | 2.11 | % | 2.12 | % | 2.19 | % | 2.02 | % | 2.11 | % | 2.38 | % | 2.13 | % | 2.11 | % | 2.12 | % | 2.19 | % |
| Net corporate credit losses (recoveries) | $ | 30 |
| $ | (2 | ) | $ | 96 |
| $ | 222 |
| $ | 43 |
| $ | 56 |
| $ | 45 |
| $ | 30 |
| $ | (2 | ) | $ | 96 |
|
| As a percentage of average corporate loans | 0.03 | % | — | % | 0.11 | % | 0.27 | % | 0.05 | % | 0.07 | % | 0.06 | % | 0.03 | % | — | % | 0.11 | % |
Allowance by type at end of period(10) | | |
| Consumer | $ | 9,997 |
| $ | 9,796 |
| $ | 10,039 |
| $ | 9,869 |
| $ | 9,892 |
| $ | 10,026 |
| $ | 9,950 |
| $ | 9,997 |
| $ | 9,796 |
| $ | 10,039 |
|
| Corporate | 2,339 |
| 2,330 |
| 2,315 |
| 2,486 |
| 2,474 |
| 2,303 |
| 2,365 |
| 2,339 |
| 2,330 |
| 2,315 |
|
| Total | $ | 12,336 |
| $ | 12,126 |
| $ | 12,354 |
| $ | 12,355 |
| $ | 12,366 |
| $ | 12,329 |
| $ | 12,315 |
| $ | 12,336 |
| $ | 12,126 |
| $ | 12,354 |
|
| |
| (1) | Recoveries have been reduced by certain collection costs that are incurred only if collection efforts are successful. |
| |
| (2) | Includes all adjustments to the allowance for credit losses, such as changes in the allowance from acquisitions, dispositions, securitizations, FX translation, purchase accounting adjustments, etc. |
| |
| (3) | The first quarter of 2019 includes an increase of approximately $26 million related to FX translation. |
| |
| (4) | The fourth quarter of 2018 includes a reduction of approximately $4 million related to the sale or transfers to held-for-sale (HFS) of various loan portfolios, including a reduction of $3 million related to the transfers of a real estate loan portfolio to HFS. Additionally, the fourth quarter includes a decrease of approximately $76 million related to FX translation. |
| |
| (5) | The third quarter of 2018 includes a reduction of approximately $5 million related to the sale or transfers to held-for-sale (HFS)HFS of various loan portfolios, including a reduction of $2 million related to the transfers of a real estate loan portfolio to HFS. Additionally, the third quarter includes an increase of approximately $62 million related to FX translation. |
| |
(4)(6) | The second quarter of 2018 includes a reduction of approximately $137 million related to the sale or transfer to HFS of various loan portfolios, including a reduction of $33 million related to the transfer of a real estate loan portfolio to HFS. Additionally, the second quarter includes a decrease of approximately $164 million related to FX translation. |
| |
(5)(7) | The first quarter of 2018 includes a reduction of approximately $55 million related to the sale or transfer to HFS of various loan portfolios, including a reduction of $53 million related to the transfer of a real estate loan portfolio to HFS. Additionally, the first quarter includes an increase of approximately $118 million related to FX translation. |
| |
(6) | The fourth quarter of 2017 includes a reduction of approximately $47 million related to the sale or transfer to HFS of various loan portfolios, including a reduction of $22 million related to the transfer of a real estate loan portfolio to HFS. Additionally, the fourth quarter includes a decrease of approximately $106 million related to FX translation. |
| |
(7) | The third quarter of 2017 includes a reduction of approximately $34 million related to the sale or transfer to HFS of various loan portfolios, including a reduction of $28 million related to the transfer of a real estate loan portfolio to HFS. Additionally, the third quarter includes an increase of approximately $7 million related to FX translation. |
| |
| (8) | March 31, 2019, December 31, 2018, September 30, 2018, June 30, 2018 and March 31, 2018 December 31, 2017 and September 30, 2017 exclude $3.9 billion, $3.2 billion, $4.2 billion, $3.0 billion $4.5 billion, $4.9 billion and $4.3$4.5 billion, respectively, of loans which are carried at fair value. |
| |
| (9) | Represents additional credit reserves recorded as Other liabilities on the Consolidated Balance Sheet. |
| |
| (10) | Allowance for loan losses represents management’s best estimate of probable losses inherent in the portfolio, as well as probable losses related to large individually evaluated impaired loans and troubled debt restructurings. See “Significant Accounting Policies and Significant Estimates” and Note 1 to the Consolidated Financial Statements in Citi’s 20172018 Annual Report on Form 10-K. Attribution of the allowance is made for analytical purposes only and the entire allowance is available to absorb probable credit losses inherent in the overall portfolio. |
Allowance for Loan Losses
The following tables detail information on Citi’s allowance for loan losses, loans and coverage ratios:
| | | | September 30, 2018 | March 31, 2019 |
| In billions of dollars | Allowance for loan losses | Loans, net of unearned income | Allowance as a percentage of loans(1) | Allowance for loan losses | Loans, net of unearned income | Allowance as a percentage of loans(1) |
North America cards(2) | $ | 6.4 |
| $ | 137.9 |
| 4.6 | % | $ | 6.6 |
| $ | 135.9 |
| 4.9 | % |
North America mortgages(3) | 0.5 |
| 59.8 |
| 0.8 |
| 0.4 |
| 56.3 |
| 0.7 |
|
North America other | 0.3 |
| 12.8 |
| 2.3 |
| 0.3 |
| 13.7 |
| 2.2 |
|
| International cards | 1.4 |
| 24.4 |
| 5.7 |
| 0.6 |
| 24.3 |
| 2.5 |
|
International other(4) | 1.4 |
| 90.6 |
| 1.5 |
| 2.1 |
| 89.7 |
| 2.3 |
|
| Total consumer | $ | 10.0 |
| $ | 325.5 |
| 3.1 | % | $ | 10.0 |
| $ | 319.9 |
| 3.1 | % |
| Total corporate | 2.3 |
| 349.4 |
| 0.7 |
| 2.3 |
| 362.4 |
| 0.6 |
|
| Total Citigroup | $ | 12.3 |
| $ | 674.9 |
| 1.8 | % | $ | 12.3 |
| $ | 682.3 |
| 1.8 | % |
| |
| (1) | Allowance as a percentage of loans excludes loans that are carried at fair value. |
| |
| (2) | Includes both Citi-branded cards and Citi retail services. The $6.4$6.6 billion of loan loss reserves represented approximately 1614 months of coincident net credit loss coverage. |
| |
| (3) | Of the $0.5$0.4 billion, approximately $0.4$0.3 billion was allocated to North America mortgages in Corporate/Other. Of the $0.5 billion, approximately $0.2including $0.1 billion and $0.3 billion are determined in accordance with ASC 450-20 and ASC 310-10-35 (troubled debt restructurings), respectively. Of the $59.8$56.3 billion in loans, approximately $57.0$53.7 billion and $2.7$2.5 billion of the loans are evaluated in accordance with ASC 450-20 and ASC 310-10-35 (troubled debt restructurings), respectively. For additional information, see Note 14 to the Consolidated Financial Statements. |
| |
| (4) | Includes mortgages and other retail loans. |
| | | | December 31, 2017 | December 31, 2018 |
| In billions of dollars | Allowance for loan losses | Loans, net of unearned income | Allowance as a percentage of loans(1) | Allowance for loan losses | Loans, net of unearned income | Allowance as a percentage of loans(1) |
North America cards(2) | $ | 6.1 |
| $ | 139.7 |
| 4.4 | % | $ | 6.5 |
| $ | 144.6 |
| 4.5 | % |
North America mortgages(3) | 0.7 |
| 64.2 |
| 1.1 |
| 0.4 |
| 58.9 |
| 0.7 |
|
North America other | 0.3 |
| 13.0 |
| 2.3 |
| 0.3 |
| 13.2 |
| 2.3 |
|
| International cards | 1.3 |
| 25.7 |
| 5.1 |
| 0.7 |
| 24.9 |
| 2.8 |
|
International other(4) | 1.5 |
| 91.1 |
| 1.6 |
| 2.0 |
| 88.9 |
| 2.2 |
|
| Total consumer | $ | 9.9 |
| $ | 333.7 |
| 3.0 | % | $ | 9.9 |
| $ | 330.5 |
| 3.0 | % |
| Total corporate | 2.5 |
| 333.3 |
| 0.8 |
| 2.4 |
| 353.7 |
| 0.7 |
|
| Total Citigroup | $ | 12.4 |
| $ | 667.0 |
| 1.9 | % | $ | 12.3 |
| $ | 684.2 |
| 1.8 | % |
| |
| (1) | Allowance as a percentage of loans excludes loans that are carried at fair value. |
| |
| (2) | Includes both Citi-branded cards and Citi retail services. The $6.1$6.5 billion of loan loss reserves represented approximately 16 months of coincident net credit loss coverage. |
| |
| (3) | Of the $0.7$0.4 billion, approximately $0.6 billionnearly all of it was allocated to North America mortgages in Corporate/Other. Of the $0.7 billion, approximately $0.2, including $0.1 billion and $0.5$0.3 billion are determined in accordance with ASC 450-20 and ASC 310-10-35 (troubled debt restructurings), respectively. Of the $64.2$58.9 billion in loans, approximately $60.4$56.3 billion and $3.7$2.5 billion areof the loans were evaluated in accordance with ASC 450-20 and ASC 310-10-35 (troubled debt restructurings), respectively. For additional information, see Note 14 to the Consolidated Financial Statements. |
| |
| (4) | Includes mortgages and other retail loans. |
Non-Accrual Loans and Assets and Renegotiated Loans
There is a certain amount of overlap amongFor additional information on Citi’s non-accrual loans and assets and renegotiated loans. The following summary provides a general description of each category:
Non-Accrualloans, see “Non-Accrual Loans and Assets: and Renegotiated Loans” in Citi’s 2018 Annual Report on Form 10-K.
Corporate and consumer (including commercial banking) non-accrual status is based on the determination that payment of interest or principal is doubtful.
A corporate loan may be classified as non-accrual and still be performing under the terms of the loan structure. Payments received on corporate non-accrual loans are generally applied to loan principal and not reflected as interest income. Approximately 57%, 68% and 74% of Citi’s corporate non-accrual loans were performing at September 30, 2018, June 30, 2018 and December 31, 2017, respectively.
Consumer non-accrual status is generally based on aging, i.e., the borrower has fallen behind on payments.
Consumer mortgage loans, other than Federal Housing Administration (FHA) insured loans, are classified as non-accrual within 60 days of notification that the borrower has filed for bankruptcy. In addition, home equity loans are classified as non-accrual if the related residential first mortgage loan is 90 days or more past due.
North America Citi-branded cards and Citi retail services are not included because, under industry standards, credit card loans accrue interest until such loans are charged off, which typically occurs at 180 days of contractual delinquency.
Renegotiated Loans:
Includes both corporate and consumer loans whose terms have been modified in a troubled debt restructuring (TDR).
Includes both accrual and non-accrual TDRs.
Non-Accrual Loans
The table below summarizes Citigroup’s non-accrual loans as of the periods indicated. Non-accrual loans may still be current on interest payments. In situations where Citi reasonably expects that only a portion of the principal owed will ultimately be collected, all payments received are reflected as a reduction of principal and not as interest income. For all other non-accrual loans, cash interest receipts are generally recorded as revenue.
| | | | Sept. 30, | Jun. 30, | Mar. 31, | Dec. 31, | Sept. 30, | Mar. 31, | Dec. 31, | Sept. 30, | Jun. 30, | Mar. 31, |
| In millions of dollars | 2018 | 2018 | 2017 | 2019 | 2018 |
Corporate non-accrual loans(1)(2) | | |
| North America | $ | 679 |
| $ | 784 |
| $ | 817 |
| $ | 784 |
| $ | 915 |
| $ | 922 |
| $ | 483 |
| $ | 679 |
| $ | 784 |
| $ | 817 |
|
| EMEA | 362 |
| 391 |
| 561 |
| 849 |
| 681 |
| 317 |
| 375 |
| 362 |
| 391 |
| 561 |
|
| Latin America | 266 |
| 204 |
| 263 |
| 280 |
| 312 |
| 225 |
| 230 |
| 266 |
| 204 |
| 263 |
|
| Asia | 233 |
| 244 |
| 27 |
| 29 |
| 146 |
| 18 |
| 223 |
| 233 |
| 244 |
| 27 |
|
| Total corporate non-accrual loans | $ | 1,540 |
| $ | 1,623 |
| $ | 1,668 |
| $ | 1,942 |
| $ | 2,054 |
| $ | 1,482 |
| $ | 1,311 |
| $ | 1,540 |
| $ | 1,623 |
| $ | 1,668 |
|
Consumer non-accrual loans(1) | | |
| North America | $ | 1,323 |
| $ | 1,373 |
| $ | 1,500 |
| $ | 1,650 |
| $ | 1,721 |
| $ | 1,230 |
| $ | 1,241 |
| $ | 1,323 |
| $ | 1,373 |
| $ | 1,500 |
|
| Latin America | 764 |
| 726 |
| 791 |
| 756 |
| 791 |
| 694 |
| 715 |
| 764 |
| 726 |
| 791 |
|
Asia(2)(3) | 287 |
| 284 |
| 284 |
| 284 |
| 271 |
| 281 |
| 270 |
| 287 |
| 284 |
| 284 |
|
| Total consumer non-accrual loans | $ | 2,374 |
| $ | 2,383 |
| $ | 2,575 |
| $ | 2,690 |
| $ | 2,783 |
| $ | 2,205 |
| $ | 2,226 |
| $ | 2,374 |
| $ | 2,383 |
| $ | 2,575 |
|
| Total non-accrual loans | $ | 3,914 |
| $ | 4,006 |
| $ | 4,243 |
| $ | 4,632 |
| $ | 4,837 |
| $ | 3,687 |
| $ | 3,537 |
| $ | 3,914 |
| $ | 4,006 |
| $ | 4,243 |
|
| |
| (1) | Excludes purchased distressed loans, as they are generally accreting interest. The carrying value of these loans was $125 million at March 31, 2019, $128 million at December 31, 2018, $131 million at September 30, 2018, $149 million at June 30, 2018 and $126 million at March 31, 2018, $167 million at December 31, 2017 and $177 million at September 30, 2017.2018. |
| |
| (2) | Approximately 46%, 55% and 65% of Citi’s corporate non-accrual loans were performing at March 31, 2019, December 31, 2018 and March 31, 2018, respectively. |
| |
| (3) | Asia GCB includes balances in certain EMEA countries for all periods presented. |
The changes in Citigroup’s non-accrual loans were as follows:
| | | | Three Months Ended | Three Months Ended | Three Months Ended | Three Months Ended |
| | September 30, 2018 | September 30, 2017 | March 31, 2019 | March 31, 2018 |
| In millions of dollars | Corporate | Consumer | Total | Corporate | Consumer | Total | Corporate | Consumer | Total | Corporate | Consumer | Total |
| Non-accrual loans at beginning of period | $ | 1,623 |
| $ | 2,383 |
| $ | 4,006 |
| $ | 2,098 |
| $ | 2,848 |
| $ | 4,946 |
| $ | 1,311 |
| $ | 2,226 |
| $ | 3,537 |
| $ | 1,942 |
| $ | 2,690 |
| $ | 4,632 |
|
| Additions | 436 |
| 758 |
| 1,194 |
| 190 |
| 1,042 |
| 1,232 |
| 723 |
| 722 |
| 1,445 |
| 825 |
| 861 |
| 1,686 |
|
| Sales and transfers to HFS | (9 | ) | (44 | ) | (53 | ) | (1 | ) | (69 | ) | (70 | ) | (5 | ) | (34 | ) | (39 | ) | (20 | ) | (85 | ) | (105 | ) |
| Returned to performing | (14 | ) | (136 | ) | (150 | ) | (2 | ) | (133 | ) | (135 | ) | (28 | ) | (142 | ) | (170 | ) | (68 | ) | (208 | ) | (276 | ) |
| Paydowns/settlements | (479 | ) | (207 | ) | (686 | ) | (196 | ) | (291 | ) | (487 | ) | (485 | ) | (174 | ) | (659 | ) | (884 | ) | (270 | ) | (1,154 | ) |
| Charge-offs | (18 | ) | (417 | ) | (435 | ) | (33 | ) | (611 | ) | (644 | ) | (35 | ) | (402 | ) | (437 | ) | (106 | ) | (454 | ) | (560 | ) |
| Other | 1 |
| 37 |
| 38 |
| (2 | ) | (3 | ) | (5 | ) | 1 |
| 9 |
| 10 |
| (21 | ) | 41 |
| 20 |
|
| Ending balance | $ | 1,540 |
| $ | 2,374 |
| $ | 3,914 |
| $ | 2,054 |
| $ | 2,783 |
| $ | 4,837 |
| $ | 1,482 |
| $ | 2,205 |
| $ | 3,687 |
| $ | 1,668 |
| $ | 2,575 |
| $ | 4,243 |
|
|
| | | | | | | | | | | | | | | | | | |
| | Nine Months Ended | Nine Months Ended |
| | September 30, 2018 | September 30, 2017 |
| In millions of dollars | Corporate | Consumer | Total | Corporate | Consumer | Total |
| Non-accrual loans at beginning of period | $ | 1,942 |
| $ | 2,690 |
| $ | 4,632 |
| $ | 2,421 |
| $ | 3,158 |
| $ | 5,579 |
|
| Additions | 1,889 |
| 2,410 |
| 4,299 |
| 754 |
| 2,563 |
| 3,317 |
|
| Sales and transfers to held-for-sale | (37 | ) | (197 | ) | (234 | ) | (83 | ) | (286 | ) | (369 | ) |
| Returned to performing | (118 | ) | (490 | ) | (608 | ) | (42 | ) | (462 | ) | (504 | ) |
| Paydowns/settlements | (1,976 | ) | (804 | ) | (2,780 | ) | (843 | ) | (856 | ) | (1,699 | ) |
| Charge-offs | (138 | ) | (1,243 | ) | (1,381 | ) | (102 | ) | (1,452 | ) | (1,554 | ) |
| Other | (22 | ) | 8 |
| (14 | ) | (51 | ) | 118 |
| 67 |
|
| Ending balance | $ | 1,540 |
| $ | 2,374 |
| $ | 3,914 |
| $ | 2,054 |
| $ | 2,783 |
| $ | 4,837 |
|
The table below summarizes Citigroup’s other real estate owned (OREO) assets as of the periods indicated. This represents the carrying value of all real estate property acquired by foreclosure or other legal proceedings when Citi has taken possession of the collateral:
| | | | Sept. 30, | Jun. 30, | Mar. 31, | Dec. 31, | Sept. 30, | Mar. 31, | Dec. 31, | Sept. 30, | Jun. 30, | Mar. 31, |
| In millions of dollars | 2018 | 2018 | 2017 | 2019 | 2018 |
| OREO | | |
| North America | $ | 76 |
| $ | 66 |
| $ | 70 |
| $ | 89 |
| $ | 97 |
| $ | 63 |
| $ | 64 |
| $ | 76 |
| $ | 66 |
| $ | 70 |
|
| EMEA | 1 |
| 1 |
| — |
| 2 |
| 1 |
| 1 |
| 1 |
| 1 |
| 1 |
| — |
|
| Latin America | 25 |
| 24 |
| 29 |
| 35 |
| 30 |
| 13 |
| 12 |
| 25 |
| 24 |
| 29 |
|
| Asia | 7 |
| 10 |
| 15 |
| 18 |
| 15 |
| 21 |
| 22 |
| 7 |
| 10 |
| 15 |
|
| Total OREO | $ | 109 |
| $ | 101 |
| $ | 114 |
| $ | 144 |
| $ | 143 |
| $ | 98 |
| $ | 99 |
| $ | 109 |
| $ | 101 |
| $ | 114 |
|
| Non-accrual assets |
| |
| |
| Corporate non-accrual loans | $ | 1,540 |
| $ | 1,623 |
| $ | 1,668 |
| $ | 1,942 |
| $ | 2,054 |
| $ | 1,482 |
| $ | 1,311 |
| $ | 1,540 |
| $ | 1,623 |
| $ | 1,668 |
|
| Consumer non-accrual loans | 2,374 |
| 2,383 |
| 2,575 |
| 2,690 |
| 2,783 |
| 2,205 |
| 2,226 |
| 2,374 |
| 2,383 |
| 2,575 |
|
| Non-accrual loans (NAL) | $ | 3,914 |
| $ | 4,006 |
| $ | 4,243 |
| $ | 4,632 |
| $ | 4,837 |
| $ | 3,687 |
| $ | 3,537 |
| $ | 3,914 |
| $ | 4,006 |
| $ | 4,243 |
|
| OREO | $ | 109 |
| $ | 101 |
| $ | 114 |
| $ | 144 |
| $ | 143 |
| $ | 98 |
| $ | 99 |
| $ | 109 |
| $ | 101 |
| $ | 114 |
|
| Non-accrual assets (NAA) | $ | 4,023 |
| $ | 4,107 |
| $ | 4,357 |
| $ | 4,776 |
| $ | 4,980 |
| $ | 3,785 |
| $ | 3,636 |
| $ | 4,023 |
| $ | 4,107 |
| $ | 4,357 |
|
| NAL as a percentage of total loans | 0.58 | % | 0.60 | % | 0.63 | % | 0.69 | % | 0.74 | % | 0.54 | % | 0.52 | % | 0.58 | % | 0.60 | % | 0.63 | % |
| NAA as a percentage of total assets | 0.21 |
| 0.21 |
| 0.23 |
| 0.26 |
| 0.26 |
| 0.19 |
| 0.19 |
| 0.21 |
| 0.21 |
| 0.23 |
|
Allowance for loan losses as a percentage of NAL(1) | 315 |
| 303 |
| 291 |
| 267 |
| 256 |
| 334 |
| 348 |
| 315 |
| 303 |
| 291 |
|
| |
| (1) | The allowance for loan losses includes the allowance for Citi’s credit card portfolios and purchased distressed loans, while the non-accrual loans exclude credit card balances (with the exception of certain international portfolios) and purchased distressed loans as these continue to accrue interest until charge-off. |
Renegotiated Loans
The following table presents Citi’s loans modified in TDRs:
| | | In millions of dollars | Sept. 30, 2018 | Dec. 31, 2017 | Mar. 31, 2019 | Dec. 31, 2018 |
Corporate renegotiated loans(1) | | | | |
| In U.S. offices | | | |
Commercial and industrial(2) | $ | 226 |
| $ | 225 |
| $ | 190 |
| $ | 188 |
|
| Mortgage and real estate | 64 |
| 90 |
| 91 |
| 111 |
|
| Financial institutions | 21 |
| 33 |
| 4 |
| 16 |
|
| Other | 33 |
| 45 |
| 4 |
| 2 |
|
| Total | $ | 344 |
| $ | 393 |
| $ | 289 |
| $ | 317 |
|
| In offices outside the U.S. | | | |
Commercial and industrial(2) | $ | 254 |
| $ | 392 |
| $ | 220 |
| $ | 226 |
|
| Mortgage and real estate | 7 |
| 11 |
| 21 |
| 12 |
|
| Financial institutions | — |
| 15 |
| 9 |
| 9 |
|
| Other | 9 |
| 7 |
| — |
| — |
|
| Total | $ | 270 |
| $ | 425 |
| $ | 250 |
| $ | 247 |
|
| Total corporate renegotiated loans | $ | 614 |
| $ | 818 |
| $ | 539 |
| $ | 564 |
|
Consumer renegotiated loans(3)(4)(5) | | | |
| In U.S. offices | | | |
Mortgage and real estate(6) | $ | 2,698 |
| $ | 3,709 |
| $ | 2,452 |
| $ | 2,520 |
|
| Cards | 1,308 |
| 1,246 |
| 1,383 |
| 1,338 |
|
| Installment and other | 84 |
| 169 |
| 137 |
| 86 |
|
| Total | $ | 4,090 |
| $ | 5,124 |
| $ | 3,972 |
| $ | 3,944 |
|
| In offices outside the U.S. | | | |
| Mortgage and real estate | $ | 320 |
| $ | 345 |
| $ | 325 |
| $ | 311 |
|
| Cards | 493 |
| 541 |
| 477 |
| 480 |
|
| Installment and other | 415 |
| 427 |
| 415 |
| 415 |
|
| Total | $ | 1,228 |
| $ | 1,313 |
| $ | 1,217 |
| $ | 1,206 |
|
| Total consumer renegotiated loans | $ | 5,318 |
| $ | 6,437 |
| $ | 5,189 |
| $ | 5,150 |
|
| |
| (1) | Includes $504$444 million and $715$466 million of non-accrual loans included in the non-accrual loans table above at September 30, 2018March 31, 2019 and December 31, 2017,2018, respectively. The remaining loans are accruing interest. |
| |
| (2) | In addition to modifications reflected as TDRs at September 30, 2018,March 31, 2019, Citi also modified $6$32 million of commercial loans risk rated “Substandard Non-Performing” or worse (asset category defined by banking regulators) in offices outside the U.S. These modifications were not considered TDRs because the modifications did not involve a concession. |
| |
| (3) | Includes $1,113$1,039 million and $1,376$1,015 million of non-accrual loans included in the non-accrual loans table above at September 30, 2018March 31, 2019 and December 31, 2017,2018, respectively. The remaining loans are accruing interest. |
| |
| (4) | Includes $19$20 million and $26$17 million of commercial real estate loans at September 30, 2018March 31, 2019 and December 31, 2017,2018, respectively. |
| |
| (5) | Includes $94$155 million and $165$101 million of other commercial loans at September 30, 2018March 31, 2019 and December 31, 2017,2018, respectively. |
| |
(6) | Reduction in the nine months ended September 30, 2018 compared with December 31, 2017 includes $641 million related to TDRs sold or transferred to HFS. |
LIQUIDITY RISK
For additional information on funding and liquidity at Citigroup, including its objectives, management and measurement, see “Liquidity Risk” and “Risk Factors” in Citi’s 20172018 Annual Report on Form 10-K.
High-Quality Liquid Assets (HQLA)
| | | | Citibank | Non-Bank and Other | Total | Citibank | Non-Bank and Other | Total |
| In billions of dollars | Sept. 30, 2018 | Jun. 30, 2018 | Sept. 30, 2017 | Sept. 30, 2018 | Jun. 30, 2018 | Sept. 30, 2017 | Sept. 30, 2018 | Jun. 30, 2018 | Sept. 30, 2017 | Mar. 31, 2019 | Dec. 31, 2018 | Mar. 31, 2018 | Mar. 31, 2019 | Dec. 31, 2018 | Mar. 31, 2018 | Mar. 31, 2019 | Dec. 31, 2018 | Mar. 31, 2018 |
| Available cash | $ | 105.1 |
| $ | 97.3 |
| $ | 92.7 |
| $ | 35.1 |
| $ | 27.4 |
| $ | 32.9 |
| $ | 140.2 |
| $ | 124.7 |
| $ | 125.6 |
| $ | 94.7 |
| $ | 97.1 |
| $ | 94.9 |
| $ | 34.9 |
| $ | 27.6 |
| $ | 24.9 |
| $ | 129.6 |
| $ | 124.7 |
| $ | 119.9 |
|
| U.S. sovereign | 102.2 |
| 101.4 |
| 108.4 |
| 29.7 |
| 28.7 |
| 26.6 |
| 131.9 |
| 130.1 |
| 135.0 |
| 94.9 |
| 103.2 |
| 114.6 |
| 29.5 |
| 24.0 |
| 28.9 |
| 124.4 |
| 127.2 |
| 143.4 |
|
| U.S. agency/agency MBS | 56.4 |
| 59.5 |
| 68.1 |
| 6.5 |
| 6.7 |
| 0.6 |
| 62.9 |
| 66.2 |
| 68.7 |
| 59.3 |
| 60.0 |
| 74.3 |
| 5.3 |
| 5.8 |
| 5.6 |
| 64.6 |
| 65.8 |
| 79.9 |
|
Foreign government debt(1) | 74.9 |
| 73.5 |
| 101.3 |
| 9.6 |
| 10.9 |
| 16.3 |
| 84.5 |
| 84.4 |
| 117.6 |
| 67.7 |
| 76.8 |
| 69.2 |
| 3.5 |
| 6.3 |
| 12.9 |
| 71.2 |
| 83.2 |
| 82.1 |
|
| Other investment grade | 0.2 |
| 0.1 |
| 0.5 |
| 1.1 |
| 1.0 |
| 1.2 |
| 1.3 |
| 1.2 |
| 1.7 |
| 3.6 |
| 1.5 |
| 0.3 |
| 1.5 |
| 1.3 |
| 1.3 |
| 5.1 |
| 2.8 |
| 1.6 |
|
| Total HQLA (AVG) | $ | 338.8 |
| $ | 331.8 |
| $ | 371.0 |
| $ | 82.0 |
| $ | 74.8 |
| $ | 77.6 |
| $ | 420.8 |
| $ | 406.6 |
| $ | 448.6 |
| $ | 320.1 |
| $ | 338.6 |
| $ | 353.3 |
| $ | 74.8 |
| $ | 65.1 |
| $ | 73.6 |
| $ | 394.9 |
| $ | 403.7 |
| $ | 426.9 |
|
Note: The amounts set forth in the table above are presented on an average basis and reflect HQLA held at Citigroup’s operating entities, which are eligible for inclusion in Citigroup’s consolidated HQLA.basis. For securities, the amounts represent the liquidity value that potentially could be realized and, therefore, exclude any securities that are encumbered and incorporate any haircuts that would be required for securities financing transactions.
| |
| (1) | Foreign government debt includes securities issued or guaranteed by foreign sovereigns, agencies and multilateral development banks. Foreign government debt securities are held largely to support local liquidity requirements and Citi’s local franchises and principally include government bonds from Hong Kong, Singapore, Korea, Taiwan, India, Mexico and Brazil. |
The table above includes average amounts of HQLA held at Citigroup’s operating entities that are eligible for inclusion in the calculation of Citigroup’s consolidated LCR,Liquidity Coverage Ratio (LCR), pursuant to the U.S. LCR rules. These amounts include the HQLA needed to meet the minimum requirements at these entities and any amounts in excess of these minimums that are assumed to be transferable to Citigroup. While available liquidity resources at the operating entities generally increased,remained largely unchanged, the amount of HQLA included in the table above declined both year-over-year and sequentially, as less HQLA in the operating entities was eligible for inclusion in the consolidated metric. Sequentially, Citi’s total HQLA increased, primarily due to an increase in average cash driven by a reduction in illiquid assets and the timing of long-term debt issuance.
Citi’s HQLA as set forth above does not include Citi’s available borrowing capacity from the Federal Home Loan Banks (FHLBs) of which Citi is a member, which was approximately $25 billion as of March 31, 2019 (compared to $29 billion as of September 30,December 31, 2018 (compared to $21and $22 billion as of June 30, 2018 and $16 billion as of September 30, 2017)March 31, 2018) and maintained by eligible collateral pledged to such banks. The HQLA also does not include Citi’s borrowing capacity at the U.S. Federal Reserve Bank discount window or other central banks, which would be in addition to the resources noted above.
In general, Citi’s liquidity is fungible across legal entities within its bank group. Citi’s bank subsidiaries, including Citibank, can lend to the Citi parent and broker-dealer entities in accordance with Section 23A of the Federal Reserve Act. As of September 30, 2018,March 31, 2019, the capacity available for lending to these entities under Section 23A was approximately $16 billion, compared to $15 billion unchanged fromas of both June 30,December 31, 2018 and
September 30, 2017, March 31, 2018, subject to certain eligible non-cash collateral requirements.
Liquidity Coverage Ratio
In addition to internal 30-day liquidity stress testing performed for each of Citi’s major entities, operating subsidiaries and/or countries, Citi also monitors its liquidity by reference to the LCR, as calculated pursuant to the U.S. LCR rules. The table below details the components of Citi’s LCR calculation and HQLA in excess of net outflows for the periods indicated:
|
| | | | | | | | | |
| In billions of dollars | Mar. 31, 2019 | Dec. 31, 2018 | Mar. 31, 2018 |
| HQLA | $ | 394.9 |
| $ | 403.7 |
| $ | 426.9 |
|
| Net outflows | 331.6 | 334.8 |
| 355.2 |
|
| LCR | 119 | % | 121 | % | 120 | % |
| HQLA in excess of net outflows | $63.3 | $ | 68.9 |
| $ | 71.7 |
|
Note: The amounts are presented on an average basis.
Citi’s average LCR decreased both year-over-year and sequentially, as the decline in Citi’s HQLA was only partially offset by a decline in modeled net outflows.
Loans
The table below details the average loans, by business and/or segment, and the total end-of-period loans for each of the periods indicated:
| | | In billions of dollars | Sept. 30, 2018 | Jun. 30, 2018 | Sept. 30, 2017 | Mar. 31, 2019 | Dec. 31, 2018 | Mar. 31, 2018 |
| Global Consumer Banking | | |
| North America | $ | 192.8 |
| $ | 188.8 |
| $ | 186.7 |
| $ | 195.0 |
| $ | 195.7 |
| $ | 189.7 |
|
| Latin America | 26.3 |
| 25.5 |
| 26.8 |
| 25.6 |
| 25.1 |
| 26.3 |
|
Asia(1) | 87.7 |
| 88.8 |
| 86.2 |
| 88.6 |
| 87.6 |
| 90.3 |
|
| Total | $ | 306.8 |
| $ | 303.1 |
| $ | 299.7 |
| $ | 309.2 |
| $ | 308.4 |
| $ | 306.3 |
|
| Institutional Clients Group | | |
| Corporate lending | $ | 130.9 |
| $ | 135.5 |
| $ | 123.3 |
| $ | 133.1 |
| $ | 130.0 |
| $ | 131.6 |
|
| Treasury and trade solutions (TTS) | 76.9 |
| 77.7 |
| 74.9 |
| 75.1 |
| 77.0 |
| 78.2 |
|
| Private bank | 92.8 |
| 90.7 |
| 82.6 |
| 97.2 |
| 94.7 |
| 88.9 |
|
Markets and securities services and other | 45.6 |
| 43.0 |
| 40.1 |
| 51.1 |
| 49.3 |
| 40.7 |
|
| Total | $ | 346.2 |
| $ | 346.9 |
| $ | 320.9 |
| $ | 356.5 |
| $ | 351.0 |
| $ | 339.4 |
|
Total Corporate/Other | $ | 17.3 |
| $ | 19.7 |
| $ | 25.7 |
| $ | 13.5 |
| $ | 16.1 |
| $ | 22.2 |
|
| Total Citigroup loans (AVG) | $ | 670.3 |
| $ | 669.7 |
| $ | 646.3 |
| $ | 679.2 |
| $ | 675.5 |
| $ | 667.9 |
|
| Total Citigroup loans (EOP) | $ | 674.9 |
| $ | 671.2 |
| $ | 653.2 |
| $ | 682.3 |
| $ | 684.2 |
| $ | 672.9 |
|
| |
| (1) | Includes loans in certain EMEA countries for all periods presented. |
End-of-period loans increased 3%1% year-over-year and 1%remained largely unchanged sequentially. On an average basis, loans increased 4%2% year-over-year and were largely unchanged1% sequentially.
Excluding the impact of FX translation, average loans increased 5%4% year-over-year and 6%5% in aggregate across GCB and ICG. Average GCB loans grew 3% year-over-year, driven by continued growth across all regions.in North America GCB and Asia GCB. Average loans in Latin America GCB remained largely unchanged year-over-year, due in part to a slowdown in activity in Citi’s commercial banking business, reflecting more cautious client sentiment under the current presidential administration.
Average ICG loans increased 9%7% year-over-year, with continued momentum across businesses, includingas a modest decline in TTS loans was more than offset by continued growth in the privaterest of Citi’s franchise. TTS loans declined 1% year-over-year, despite strong growth in origination volumes, as Citi continued to utilize its distribution capabilities to optimize the balance sheet and drive returns. Corporate lending growth moderated to 4% year-over-year, reflecting the episodic nature of clients’ strategic financing needs, as well as an active quarter in debt capital markets origination. Private bank loans increased 10% driven by both new client onboarding, as well as the deepening of relationships with existing high net worth clients. Finally, continued strong year-over-year Markets and corporate lending.securities services loan growth was driven primarily by real-estate related warehouse lending activities.
Average Corporate/Other loans continued to decline (down 34%39%), driven by the wind-down of legacy assets.
Deposits
The table below details the average deposits, by business and/or segment, and the total end-of-period deposits for each of the periods indicated:
| | | In billions of dollars | Sept. 30, 2018 | Jun. 30, 2018 | Sept. 30, 2017 | Mar. 31, 2019 | Dec. 31, 2018
| Mar. 31, 2018
|
| Global Consumer Banking | | |
| North America | $ | 180.2 |
| $ | 179.9 |
| $ | 184.1 |
| $ | 182.3 |
| $ | 180.6 |
| $ | 180.9 |
|
| Latin America | 29.4 |
| 28.3 |
| 28.8 |
| 28.6 |
| 28.2 |
| 28.9 |
|
Asia(1) | 97.6 |
| 97.6 |
| 95.2 |
| 99.3 |
| 97.7 |
| 99.1 |
|
| Total | $ | 307.2 |
| $ | 305.8 |
| $ | 308.1 |
| $ | 310.2 |
| $ | 306.5 |
| $ | 308.9 |
|
| Institutional Clients Group | | |
| Treasury and trade solutions (TTS) | $ | 456.7 |
| $ | 448.7 |
| $ | 427.8 |
| $ | 472.4 |
| $ | 470.8 |
| $ | 440.3 |
|
| Banking ex-TTS | 124.6 |
| 125.5 |
| 122.4 |
| 130.2 |
| 128.4 |
| 128.2 |
|
| Markets and securities services | 86.7 |
| 88.2 |
| 84.7 |
| 90.0 |
| 86.7 |
| 84.1 |
|
| Total | $ | 668.0 |
| $ | 662.4 |
| $ | 634.9 |
| $ | 692.6 |
| $ | 685.9 |
| $ | 652.6 |
|
| Corporate/Other | $ | 10.6 |
| $ | 18.0 |
| $ | 22.9 |
| $ | 14.4 |
| $ | 13.3 |
| $ | 20.4 |
|
| Total Citigroup deposits (AVG) | $ | 985.7 |
| $ | 986.2 |
| $ | 965.9 |
| $ | 1,017.2 |
| $ | 1,005.7 |
| $ | 981.9 |
|
| Total Citigroup deposits (EOP) | $ | 1,005.2 |
| $ | 996.7 |
| $ | 964.0 |
| $ | 1,030.4 |
| $ | 1,013.2 |
| $ | 1,001.2 |
|
| |
| (1) | Includes deposits in certain EMEA countriesfor all periods presented. |
End-of-period deposits increased 3% year-over-year and 2% sequentially. On an average basis, deposits increased 4% year-over-year and 1% sequentially. On an average basis, deposits increased 2% year-over-year and were largely unchanged sequentially.
Excluding the impact of FX translation, average deposits grew 3%6% from the prior-year period. In GCB, deposits increased 2%, driven by growth across all regions. In North America GCB, deposits increased 1%, as strongreflecting growth in Asia GCB both branch-based deposits and Latin America GCB more than offset a 2% decline in North America GCB, primarily driven by a reduction in money market balances as clients transferred cash into investment accounts.digital channels.
Within ICG, average deposits grew 6%9% year-over-year, primarily driven by continued high-quality deposit growth in TTS.
Long-Term Debt
The weighted-average maturity of unsecured long-term debt issued by Citigroup and its affiliates (including Citibank) with a remaining life greater than one year was approximately 6.98.6 years as of September 30, 2018,March 31, 2019, an increase from both the prior-year period (6.8(8.5 years) and unchanged from the prior quarter (6.5 years).quarter. The weighted-average maturity is calculated based on the contractual maturity of each security, except for securities which are redeemable prior to maturity at the option of the holder and calculated based on the earliest date an option becomes exercisable.
Citi’s long-term debt outstanding at the Citigroup parent company includes senior and subordinated debt and what Citi refers to as customer-related debt, consisting of structured notes, such as equity- and credit-linked notes, as well as non-structured notes. Citi’s issuance of customer-related debt is generally driven by customer demand and supplementscomplements benchmark debt issuance as a source of funding for Citi’s non-bank entities. Citi’s long-term debt at the bank also includes benchmark senior debt, FHLB advances and securitizations.
Long-Term Debt Outstanding
The following table sets forth Citi’s end-of-period total long-term debt outstanding for each of the dates indicated:
| | | In billions of dollars | Sept. 30, 2018 | Jun. 30, 2018 | Sept. 30, 2017 | Mar. 31, 2019 | Dec. 31, 2018 | Mar. 31, 2018 |
Parent and other(1) |
|
|
|
|
|
|
|
|
|
|
|
|
| Benchmark debt: | | |
| Senior debt | $ | 107.2 |
| $ | 107.8 |
| $ | 109.8 |
| $ | 109.7 |
| $ | 104.6 |
| $ | 112.0 |
|
| Subordinated debt | 25.1 |
| 25.3 |
| 27.0 |
| 24.9 |
| 24.5 |
| 25.5 |
|
| Trust preferred | 1.7 |
| 1.7 |
| 1.7 |
| 1.7 |
| 1.7 |
| 1.7 |
|
| Customer-related debt | 35.4 |
| 34.3 |
| 30.3 |
| 42.4 |
| 37.1 |
| 32.4 |
|
Local country and other(2) | 3.8 |
| 3.8 |
| 1.8 |
| 3.3 |
| 2.9 |
| 1.6 |
|
| Total parent and other | $ | 173.2 |
| $ | 172.9 |
| $ | 170.6 |
| $ | 182.0 |
| $ | 170.8 |
| $ | 173.2 |
|
| Bank |
|
|
|
|
|
|
|
|
|
|
|
|
| FHLB borrowings | $ | 10.5 |
| $ | 13.7 |
| $ | 19.8 |
| $ | 10.5 |
| $ | 10.5 |
| $ | 15.7 |
|
Securitizations(3) | 27.4 |
| 28.5 |
| 28.6 |
| 25.9 |
| 28.4 |
| 30.2 |
|
| CBNA benchmark senior debt | 21.0 |
| 18.5 |
| 9.5 |
| |
| Citibank benchmark senior debt | | 21.4 |
| 18.8 |
| 15.0 |
|
Local country and other(2) | 3.2 |
| 3.2 |
| 4.2 |
| 3.8 |
| 3.5 |
| 3.8 |
|
| Total bank | $ | 62.1 |
| $ | 63.9 |
| $ | 62.1 |
| $ | 61.5 |
| $ | 61.2 |
| $ | 64.8 |
|
| Total long-term debt | $ | 235.3 |
| $ | 236.8 |
| $ | 232.7 |
| $ | 243.6 |
| $ | 232.0 |
| $ | 237.9 |
|
Note: Amounts represent the current value of long-term debt on Citi’s Consolidated Balance Sheet which, for certain debt instruments, includes consideration of fair value, hedging impacts and unamortized discounts and premiums.
| |
| (1) | “Parent and other” includes long-term debt issued to third parties by the parent holding company (Citigroup) and Citi’s non-bank subsidiaries (including broker-dealer subsidiaries) that are consolidated into Citigroup. As of September 30, 2018,March 31, 2019, “parent and other” included $25.0$32.2 billion of long-term debt issued by Citi’s broker-dealer subsidiaries. |
| |
| (2) | Local country debt includes debt issued by Citi’s affiliates in support of their local operations. |
| |
| (3) | Predominantly credit card securitizations, primarily backed by Citi-branded credit card receivables. |
Citi’s total long-term debt outstanding increased year-over-year, primarily driven by the issuance of customer-related debt at the Citigroup parent company and unsecured senior benchmark debt at the bank, partially offset by a decline in FHLB advances and securitizations. Sequentially, Citi’s total long-term debt outstanding increased, primarily driven by the issuance of unsecured senior benchmark debt and customer-related debt at the Citigroup parent company, partiallyas growth in unsecured senior benchmark debt at the bank was offset by declines in FHLB advances and senior unsecured benchmark debt at the parent company. Sequentially, Citi’s total long-term debt outstanding decreased modestly, primarily driven by a decline in FHLB advances, partially offset by the issuance of unsecured benchmark debt at the bank.securitizations.
As part of its liability management, Citi has considered, and may continue to consider, opportunities to repurchase its long-term debt pursuant to open market purchases, tender offers or other means. Such repurchases help reduce Citi’s overall funding costs and assist it in meeting regulatory changes and requirements.costs. During the thirdfirst quarter of 2018,2019, Citi repurchased and called an aggregate of approximately $1.2 $1.0billion of its outstanding long-term debt, including early redemptionexcluding the exercise of FHLB advances.call options on securities with a remaining life of three months or less.
Long-Term Debt Issuances and Maturities
The table below details Citi’s long-term debt issuances and maturities (including repurchases and redemptions) during the periods presented:
| | | | 3Q18 | 2Q18 | 3Q17 | 1Q19 | 4Q18 | 1Q18 |
| In billions of dollars | Maturities | Issuances | Maturities | Issuances | Maturities | Issuances | Maturities | Issuances | Maturities | Issuances | Maturities | Issuances |
| Parent and other |
|
|
|
|
|
|
|
|
|
|
|
|
|
|
|
|
|
|
|
|
|
|
|
|
| Benchmark debt: | | | | | | | | | | |
| Senior debt | $ | 4.2 |
| $ | 4.5 |
| $ | 7.2 |
| $ | 4.9 |
| $ | 2.5 |
| $ | 5.7 |
| $ | 0.2 |
| $ | 4.6 |
| $ | 3.5 |
| $ | — |
| $ | 3.5 |
| $ | 5.4 |
|
| Subordinated debt | — |
| — |
| 0.3 |
| 0.3 |
| — |
| — |
| — |
| — |
| 1.0 |
| — |
| 1.6 |
| 0.2 |
|
| Trust preferred | — |
| — |
| — |
| — |
| — |
| — |
| — |
| — |
| — |
| — |
| — |
| — |
|
| Customer-related debt | 1.2 |
| 2.9 |
| 1.5 |
| 4.7 |
| 1.8 |
| 3.0 |
| 1.0 |
| 5.2 |
| 1.5 |
| 4.4 |
| 2.5 |
| 4.9 |
|
| Local country and other | 0.3 |
| 0.1 |
| 0.2 |
| 2.1 |
| 0.4 |
| — |
| — |
| 0.3 |
| 0.7 |
| — |
| 0.1 |
| 0.1 |
|
| Total parent and other | $ | 5.7 |
| $ | 7.6 |
| $ | 9.1 |
| $ | 12.0 |
| $ | 4.7 |
| $ | 8.7 |
| $ | 1.2 |
| $ | 10.1 |
| $ | 6.7 |
| $ | 4.4 |
| $ | 7.7 |
| $ | 10.7 |
|
| Bank |
|
|
|
|
|
|
|
|
|
|
|
|
|
|
|
|
|
|
|
|
|
|
|
|
| FHLB borrowings | $ | 3.3 |
| $ | — |
| $ | 4.5 |
| $ | 2.5 |
| $ | 1.5 |
| $ | 1.0 |
| $ | — |
| $ | — |
| $ | 1.5 |
| $ | 1.5 |
| $ | 6.5 |
| $ | 3.9 |
|
| Securitizations | 2.9 |
| 1.9 |
| 2.7 |
| 1.1 |
| 1.8 |
| 2.2 |
| 2.6 |
| — |
| 0.1 |
| 1.0 |
| 2.9 |
| 2.8 |
|
| CBNA benchmark senior debt | — |
| 2.5 |
| — |
| 3.5 |
| — |
| 2.2 |
| |
| Citibank benchmark senior debt | | 2.5 |
| 5.0 |
| 2.3 |
| — |
| — |
| 2.5 |
|
| Local country and other | 0.2 |
| 0.3 |
| 0.9 |
| 0.9 |
| 0.5 |
| 0.5 |
| 0.3 |
| 0.5 |
| 0.4 |
| 0.7 |
| 0.8 |
| 0.8 |
|
| Total bank | $ | 6.4 |
| $ | 4.7 |
| $ | 8.1 |
| $ | 8.0 |
| $ | 3.8 |
| $ | 5.9 |
| $ | 5.4 |
| $ | 5.5 |
| $ | 4.2 |
| $ | 3.2 |
| $ | 10.2 |
| $ | 10.1 |
|
| Total | $ | 12.1 |
| $ | 12.3 |
| $ | 17.2 |
| $ | 20.0 |
| $ | 8.5 |
| $ | 14.6 |
| $ | 6.6 |
| $ | 15.6 |
| $ | 10.9 |
| $ | 7.6 |
| $ | 17.9 |
| $ | 20.8 |
|
The table below shows Citi’s aggregate long-term debt maturities (including repurchases and redemptions) year-to-date in 2018,during the first quarter of 2019, as well as its aggregate expected annual long-term debt maturities as of September 30, 2018:March 31, 2019:
| | | | Maturities 2018 YTD | Maturities | 1Q19 | Maturities |
| In billions of dollars | 2018 | 2019 | 2020 | 2021 | 2022 | 2023 | Thereafter | Total | 2019 | 2020 | 2021 | 2022 | 2023 | 2024 | Thereafter | Total |
| Parent and other |
|
|
|
|
|
|
|
|
|
|
|
|
|
|
|
|
|
|
|
|
|
|
|
|
|
|
|
|
|
|
|
|
|
|
|
|
| Benchmark debt: | | | |
| | | |
|
| Senior debt | $ | 14.9 |
| $ | 3.5 |
| $ | 14.3 |
| $ | 8.7 |
| $ | 14.2 |
| $ | 8.0 |
| $ | 12.4 |
| $ | 46.1 |
| $ | 107.2 |
| $ | 0.2 |
| $ | 13.9 |
| $ | 8.8 |
| $ | 14.2 |
| $ | 9.3 |
| $ | 12.5 |
| $ | 7.0 |
| $ | 44.0 |
| $ | 109.7 |
|
| Subordinated debt | 1.8 |
| 1.0 |
| — |
| — |
| — |
| 0.7 |
| 1.1 |
| 22.3 |
| $ | 25.1 |
| — |
| — |
| — |
| — |
| 0.7 |
| 1.1 |
| 0.8 |
| 22.2 |
| $ | 24.9 |
|
| Trust preferred | — |
| — |
| — |
| — |
| — |
| — |
| — |
| 1.7 |
| 1.7 |
| — |
| — |
| — |
| — |
| — |
| — |
| — |
| 1.7 |
| 1.7 |
|
| Customer-related debt | 5.2 |
| 0.9 |
| 3.7 |
| 5.7 |
| 3.2 |
| 2.6 |
| 2.5 |
| 16.8 |
| 35.4 |
| 1.0 |
| 0.6 |
| 5.1 |
| 6.2 |
| 3.9 |
| 3.5 |
| 3.1 |
| 20.1 |
| 42.4 |
|
| Local country and other | 0.5 |
| 2.2 |
| 0.4 |
| 0.1 |
| 0.4 |
| — |
| — |
| 0.7 |
| 3.8 |
| — |
| 1.4 |
| 0.5 |
| — |
| 0.1 |
| 0.1 |
| — |
| 1.2 |
| 3.3 |
|
| Total parent and other | $ | 22.4 |
| $ | 7.6 |
| $ | 18.4 |
| $ | 14.5 |
| $ | 17.8 |
| $ | 11.3 |
| $ | 16.0 |
| $ | 87.6 |
| $ | 173.2 |
| $ | 1.2 |
| $ | 15.9 |
| $ | 14.4 |
| $ | 20.4 |
| $ | 13.9 |
| $ | 17.2 |
| $ | 10.9 |
| $ | 89.3 |
| $ | 182.0 |
|
| Bank |
|
|
|
|
|
|
|
|
|
|
|
|
|
|
|
|
|
|
|
|
|
|
|
|
|
|
|
|
|
|
|
|
|
|
|
|
| FHLB borrowings | $ | 14.3 |
| $ | 1.5 |
| $ | 5.6 |
| $ | 3.4 |
| $ | — |
| $ | — |
| $ | — |
| $ | — |
| $ | 10.5 |
| $ | — |
| $ | 5.6 |
| $ | 4.9 |
| $ | — |
| $ | — |
| $ | — |
| $ | — |
| $ | — |
| $ | 10.5 |
|
| Securitizations | 8.5 |
| 0.1 |
| 7.9 |
| 6.1 |
| 5.7 |
| 2.2 |
| 2.5 |
| 2.9 |
| 27.4 |
| 2.6 |
| 5.3 |
| 4.5 |
| 7.2 |
| 2.2 |
| 2.5 |
| 1.2 |
| 2.9 |
| 25.9 |
|
| CBNA benchmark debt | — |
| 2.2 |
| 4.7 |
| 8.7 |
| 5.0 |
| — |
| — |
| 0.4 |
| 21.0 |
| |
| Citibank benchmark debt | | 2.5 |
| 2.2 |
| 8.7 |
| 6.1 |
| 1.8 |
| — |
| 2.6 |
| — |
| 21.4 |
|
| Local country and other | 2.0 |
| 0.1 |
| 0.5 |
| 1.7 |
| 0.1 |
| 0.3 |
| 0.2 |
| 0.3 |
| 3.2 |
| 0.3 |
| 0.3 |
| 0.8 |
| 1.7 |
| 0.3 |
| 0.3 |
| 0.1 |
| 0.4 |
| 3.8 |
|
| Total bank | $ | 24.8 |
| $ | 3.9 |
| $ | 18.7 |
| $ | 19.9 |
| $ | 10.8 |
| $ | 2.5 |
| $ | 2.7 |
| $ | 3.6 |
| $ | 62.1 |
| $ | 5.4 |
| $ | 13.4 |
| $ | 18.9 |
| $ | 14.9 |
| $ | 4.3 |
| $ | 2.7 |
| $ | 3.9 |
| $ | 3.3 |
| $ | 61.5 |
|
| Total long-term debt | $ | 47.2 |
| $ | 11.5 |
| $ | 37.1 |
| $ | 34.4 |
| $ | 28.6 |
| $ | 13.8 |
| $ | 18.7 |
| $ | 91.2 |
| $ | 235.3 |
| $ | 6.6 |
| $ | 29.3 |
| $ | 33.3 |
| $ | 35.3 |
| $ | 18.2 |
| $ | 19.9 |
| $ | 14.8 |
| $ | 92.6 |
| $ | 243.6 |
|
Secured Funding Transactions and Other Short-Term Borrowings
Citi supplements its primary sources of funding with short-term borrowings. Short-term borrowings generally include (i) secured funding transactions (securities loaned or sold under agreements to repurchase, or repos) and (ii) to a lesser extent, short-term borrowings consisting of commercial paper and borrowings from the FHLB and other market participantsparticipants.
Outside of secured funding transactions, Citi’s short-term borrowings of $39 billion increased 9% from $36 billion year-over-year and 22% from $32 billion sequentially. The increase year-over-year and sequential increases were driven by Citi’s commercial paper programs, including the introduction of a commercial paper program in Citi’s broker-dealer. Sequentially, the increase was also driven by FHLB advances (see Note 16 to the Consolidated Financial Statements for further information on Citigroup’s and its affiliates’ outstanding short-term borrowings).
Outside of secured funding transactions, Citi’s short-term borrowings decreased 11% year-over-year and 9% sequentially, driven primarily by Citi’s continued efforts to optimize its funding profile.
Secured Funding
Secured funding is primarily accessed through Citi’s broker-dealer subsidiaries to fund efficiently both secured lending activity and a portion of the securities inventory held in the context of market making and customer activities. Citi also executes a smaller portion of its secured funding transactions through its bank entities, which is typically collateralized by foreign government debt securities. Generally, daily changes in the level of Citi’s secured funding are primarily due to fluctuations in secured lending activity in the matched book (as described below) and securities inventory.
Secured funding of $176$190 billion as of September 30, 2018March 31, 2019 increased 9%11% from the prior-year period and declined 1%7% sequentially.Excluding the impact of FX translation, secured funding increased 11%16% from the prior-year period and declined 1%7% sequentially,both driven by normal business activity. Average balances for secured funding were also approximately $176$184 billion for the quarter ended September 30, 2018.March 31, 2019.
The portion of secured funding in the broker-dealer subsidiaries that funds secured lending is commonly referred to as “matched book” activity. The majority of this activity is secured by high-quality liquid securities such as U.S. Treasury securities, U.S. agency securities and foreign government debt securities. Other secured funding is secured by less-liquid securities, including equity securities, corporate bonds and asset-backed securities. The tenor of Citi’s matched book liabilities is generally equal to or longer than the tenor of the corresponding matched book assets.
The remainder of the secured funding activity in the broker-dealer subsidiaries serves to fund securities inventory held in the context of market making and customer activities. To maintain reliable funding under a wide range of market conditions, including under periods of stress, Citi manages these activities by taking into consideration the quality of the underlying collateral and stipulating financing tenor. The weighted average maturity of Citi’s secured funding of less-liquid securities inventory was greater than 110 days as of September 30, 2018.March 31, 2019.
Citi manages the risks in its secured funding by conducting daily stress tests to account for changes in capacity, tenors, haircut, collateral profile and client actions. Additionally, Citi maintains counterparty diversification by
establishing concentration triggers and assessing counterparty reliability and stability under stress. Citi generally sources secured funding from more than 150 counterparties.
Liquidity Coverage Ratio (LCR)
In addition to internal liquidity stress metrics that Citi has developed for a 30-day stress scenario, Citi also monitors its liquidity by reference to the LCR, as calculated pursuant to the U.S. LCR rules. The table below sets forth the components of Citi’s LCR calculation and HQLA in excess of net outflows for the periods indicated:
|
| | | | | | | | | |
| In billions of dollars | Sept. 30, 2018 | Jun. 30, 2018 | Sept. 30, 2017 |
| HQLA | $ | 420.8 |
| $ | 406.6 |
| $ | 448.6 |
|
| Net outflows | 350.8 | 341.5 |
| 365.1 |
|
| LCR | 120 | % | 119 | % | 123 | % |
| HQLA in excess of net outflows | $70.0 | $ | 65.1 |
| $ | 83.5 |
|
Note: The amounts are presented on an average basis.
Citi’s average LCR decreased year-over-year, driven by a decline in average HQLA, partially offset by a decline in modeled net outflows. Sequentially, Citi’s average LCR increased slightly, due to the increase in HQLA, as described above (see “High-Quality Liquid Assets” above), partially offset by an increase in modeled net outflows.
Credit Ratings
The table below sets forth the ratings for Citigroup and Citibank as of September 30, 2018. While not included in the table below, the long- and short-term ratings of Citigroup Global Markets Holdings Inc. (CGMHI) were BBB+/A-2 at Standard & Poor’s and A/F1 at Fitch as of September 30, 2018.March 31, 2019.
Ratings as of March 31, 2019
|
| | | | | | |
| | Citigroup Inc. | Citibank, N.A. |
| | Senior debt | Commercial paper | Outlook | Long- term | Short- term | Outlook |
| Fitch Ratings (Fitch) | A | F1 | Stable | A+ | F1 | Stable |
| Moody’s Investors Service (Moody’s) | Baa1A3 | P-2 | PositiveStable | A1Aa3 | P-1 | PositiveStable |
| Standard & Poor’s (S&P) | BBB+ | A-2 | Stable | A+ | A-1 | Stable |
Potential Impacts of Ratings Downgrades
Ratings downgrades by Moody’s, Fitch or S&P could negatively impact Citigroup’s and/or Citibank’s funding and liquidity due to reduced funding capacity, including derivative triggers, which could take the form of cash obligations and collateral requirements.
The following information is provided for the purpose of analyzing the potential funding and liquidity impact to Citigroup and Citibank of a hypothetical, simultaneous
ratings downgrade across all three major rating agencies. This analysis is subject to certain estimates, estimation methodologies, judgments and uncertainties. Uncertainties include potential ratings limitations that certain entities may have with respect to permissible counterparties, as well as general subjective counterparty behavior. For example, certain corporate customers and markets counterparties could re-evaluate their business relationships with Citi and limit transactions in certain contracts or market instruments with Citi. Changes in counterparty behavior could impact Citi’s funding and liquidity, as well as the results of operations of certain of its businesses. The actual impact to Citigroup or Citibank is unpredictable and may differ materially from the potential funding and liquidity impacts described below. For additional information on the impact of credit rating changes on Citi and its applicable subsidiaries, see “Risk Factors— Liquidity Risks” in Citi’s 20172018 Annual Report on Form 10-K.
Citigroup Inc. and Citibank—Potential Derivative Triggers
As of September 30, 2018,March 31, 2019, Citi estimates that a hypothetical one-notch downgrade of the senior debt/long-term rating of Citigroup Inc. across all three major rating agencies could impact Citigroup’s funding and liquidity due to derivative triggers by approximately $0.4$0.3 billion, unchanged from June 30,compared to $0.2 billion as of December 31, 2018. Other funding sources, such as secured financing transactions and other margin requirements, for which there are no explicit triggers, could also be adversely affected.
As of September 30, 2018,March 31, 2019, Citi estimates that a hypothetical one-notch downgrade of the senior debt/long-term rating of Citibank across all three major rating agencies could impact Citibank’s funding and liquidity by approximately $1.2$0.5 billion, compared to $0.9 billion as of June 30,unchanged from December 31, 2018.
In total, Citi estimates that a one-notch downgrade of Citigroup and Citibank, across all three major rating agencies, could result in increased aggregate cash obligations and collateral requirements of approximately $1.6$0.8 billion, compared to $1.2$0.7 billion as of June 30,December 31, 2018 (see also Note 19 to the Consolidated Financial Statements). As detailed under “High-Quality Liquid Assets” above, the liquidity resources that are eligible for inclusion in the calculation of Citi’s consolidated HQLA were approximately $339$320 billion for Citibank and $82approximately $75 billion for Citi’s non-bank and other entities, for a total of approximately $421$395 billion for the quarter ended September 30, 2018.March 31, 2019. These liquidity resources are available in part as a contingency for the potential events described above.
In addition, a broad range of mitigating actions are currently included in Citigroup’s and Citibank’s contingency funding plans. For Citigroup, these mitigating factors include, but are not limited to, accessing surplus funding capacity from existing clients, tailoring levels of secured lending and adjusting the size of select trading books and collateralized borrowings from certain Citibank subsidiaries. Mitigating actions available to Citibank include, but are not limited to, selling or financing highly liquid government securities, tailoring levels of secured lending, adjusting the size of select trading assets, reducing loan originations and renewals, raising additional deposits or borrowing from the FHLB or central banks. Citi believes these mitigating actions could
substantially reduce the funding and liquidity risk, if any, of the potential downgrades described above.
Citibank—Additional Potential Impacts
In addition to the above derivative triggers, Citi believes that a potential one-notch downgrade of Citibank’s senior debt/long-term rating by S&Pacross any of the three major rating agencies could also have an adverse impact on the commercial paper/short-term rating of Citibank. As of September 30, 2018,March 31, 2019, Citibank had liquidity commitments of approximately $12.1$13.1 billion to consolidated asset-backed commercial paper conduits, compared to $12.0$13.2 billion as of June 30,December 31, 2018 (as referenced in Note 18 to the Consolidated Financial Statements).
In addition to the above-referenced liquidity resources of certain Citibank entities, Citibank could reduce the funding and liquidity risk, if any, of the potential downgrades described above through mitigating actions, including repricing or reducing certain commitments to commercial paper conduits. In the event of the potential downgrades described above, Citi believes that certain corporate customers could re-evaluate their deposit relationships with Citibank. This re-evaluation could result in clients adjusting their discretionary deposit levels or changing their depository institution, which could potentially reduce certain deposit levels at Citibank. However, Citi could choose to adjust pricing, offer alternative deposit products to its existing customers or seek to attract deposits from new customers, in addition to the mitigating actions referenced above.
MARKET RISK
Market risk emanates from both Citi’s trading and non-trading portfolios. For additional information on market risk and market risk management at Citi, see “Market Risk” and “Risk���Risk Factors” in Citi’s 20172018 Annual Report on Form 10-K.
Market Risk of Non-Trading Portfolios
For additional information on Citi’s net interest revenue (for interest rate exposure purposes), interest rate risk and interest rate risk measurement, see “Market Risk of Non-Trading Portfolios” in Citi’s 2017 Annual Report on Form 10-K.
The following table sets forth the estimated impact to Citi’s net interest revenue, AOCI and the Common Equity Tier 1 Capital ratio (on a fully implemented basis), each assuming an unanticipated parallel instantaneous 100 basis point (bps) increase in interest rates: | | | In millions of dollars (unless otherwise noted) | Sept. 30, 2018 | Jun. 30, 2018 | Sept. 30, 2017 | |
| In millions of dollars, except as otherwise noted | | Mar. 31, 2019 | Dec. 31, 2018 | Mar. 31, 2018 |
| Estimated annualized impact to net interest revenue | | |
U.S. dollar(1) | $ | 879 |
| $ | 1,046 |
| $ | 1,449 |
| $ | 527 |
| $ | 758 |
| $ | 1,243 |
|
| All other currencies | 649 |
| 635 |
| 610 |
| 677 |
| 661 |
| 651 |
|
| Total | $ | 1,528 |
| $ | 1,681 |
| $ | 2,059 |
| $ | 1,204 |
| $ | 1,419 |
| $ | 1,894 |
|
| As a percentage of average interest-earning assets | 0.09 | % | 0.10 | % | 0.12 | % | 0.07 | % | 0.08 | % | 0.11 | % |
Estimated initial impact to AOCI (after-tax)(2) | $ | (4,597 | ) | $ | (4,713 | ) | $ | (4,206 | ) | $ | (3,828 | ) | $ | (3,920 | ) | $ | (4,955 | ) |
Estimated initial impact on Common Equity Tier 1 Capital ratio (bps)(3) | (31 | ) | (32 | ) | (48 | ) | (25 | ) | (28 | ) | (33 | ) |
| |
| (1) | Certain trading-oriented businesses within Citi have accrual-accounted positions that are excluded from the estimated impact to net interest revenue in the table, since these exposures are managed economically in combination with mark-to-market positions. The U.S. dollar interest rate exposure associated with these businesses was $(212)$(204) million for a 100 bps instantaneous increase in interest rates as of September 30, 2018.March 31, 2019. |
| |
| (2) | Includes the effect of changes in interest rates on AOCI related to investment securities, cash flow hedges and pension liability adjustments. |
| |
(3) | Results as of September 30, 2018 and June 30, 2018 reflect the impact of Tax Reform, including the lower expected effective tax rate and the impact to Citi’s DTA position. Results as of September 30, 2017 have not been restated. |
The estimated impact to net interest revenue decreased on a sequential basis, reflecting changes in balance sheet composition, including increased sensitivity in deposits combined with loan growth and other actions.Citi Treasury positioning. The decrease in the estimated impact to AOCI primarily reflected changes to the positioning of Citi Treasury’s investment securities and related interest rate derivatives portfolio.
In the event of an unanticipated parallel instantaneous 100 bps increase in interest rates, Citi expects that the negative impact to AOCI would be offset in stockholders’ equity through the combination of expected incremental net interest
revenue and the expected recovery of the impact on AOCI through accretion of Citi’s investment portfolio over a period of time. As of September 30, 2018,March 31, 2019, Citi expects that the negative $4.6$3.8 billion impact to AOCI in such a scenario could potentially be offset over approximately 1921 months.
The following table sets forth the estimated impact to Citi’s net interest revenue, AOCI and the Common Equity Tier 1 Capital ratio (on a fully implemented basis) under fourfive different changes in interest rate scenarios for the U.S. dollar and Citi’s other currencies. While Citi also monitors the impact of a parallel decrease in interest rates, a 100 bps decrease in short-term rates is not meaningful, as it would imply negative interest rates in many of Citi's markets.
|
| | | | | | | | | | | | |
| In millions of dollars (unless otherwise noted) | Scenario 1 | Scenario 2 | Scenario 3 | Scenario 4 |
| Overnight rate change (bps) | 100 |
| 100 |
| — |
| — |
|
| 10-year rate change (bps) | 100 |
| — |
| 100 |
| (100 | ) |
Estimated annualized impact to net interest revenue | | | | |
| U.S. dollar | $ | 879 |
| $ | 906 |
| $ | 47 |
| $ | (56 | ) |
| All other currencies | 649 |
| 617 |
| 37 |
| (37 | ) |
| Total | $ | 1,528 |
| $ | 1,523 |
| $ | 84 |
| $ | (93 | ) |
Estimated initial impact to AOCI (after-tax)(1) | $ | (4,597 | ) | $ | (2,547 | ) | $ | (2,279 | ) | $ | 1,772 |
|
| Estimated initial impact to Common Equity Tier 1 Capital ratio (bps) | (31 | ) | (17 | ) | (16 | ) | 12 |
|
|
| | | | | | | | | | | | | | | |
| In millions of dollars, except as otherwise noted | Scenario 1 | Scenario 2 | Scenario 3 | Scenario 4 | Scenario 5 |
| Overnight rate change (bps) | 100 |
| 100 |
| — |
| — |
| (100 | ) |
| 10-year rate change (bps) | 100 |
| — |
| 100 |
| (100 | ) | (100 | ) |
Estimated annualized impact to net interest revenue | | | | | |
| U.S. dollar | $ | 527 |
| $ | 481 |
| $ | 35 |
| $ | (52 | ) | $ | (810 | ) |
| All other currencies | 677 |
| 628 |
| 39 |
| (39 | ) | (532 | ) |
| Total | $ | 1,204 |
| $ | 1,109 |
| $ | 74 |
| $ | (91 | ) | $ | (1,342 | ) |
Estimated initial impact to AOCI (after-tax)(1) | $ | (3,828 | ) | $ | (2,312 | ) | $ | (1,620 | ) | $ | 1,116 |
| $ | 3,141 |
|
| Estimated initial impact to Common Equity Tier 1 Capital ratio (bps) | (25 | ) | (15 | ) | (11 | ) | 7 |
| 19 |
|
Note: Each scenario assumes that the rate change will occur instantaneously. Changes in interest rates for maturities between the overnight rate and the 10-year rate are interpolated.
| |
| (1) | Includes the effect of changes in interest rates on AOCI related to investment securities, cash flow hedges and pension liability adjustments. |
As shown in the table above, the magnitude of the impact to Citi’s net interest revenue and AOCI is greater under scenario 2 as compared to scenario 3. This is because the combination of changes to Citi’s investment portfolio, partially offset by changes related to Citi’s pension liabilities, results in a net position that is more sensitive to rates at shorter- and intermediate-term maturities.
In recent years, a number of central banks, including the European Central Bank, the Bank of Japan and the Swiss National Bank, have implemented negative interest rates, and additional governmental entities could do so in the future. While negative interest rates can adversely impact net interest revenue (as well as net interest margin), Citi has, to date, been able to partially offset the impact of negative rates in these jurisdictions through a combination of business and Citi Treasury interest rate risk mitigation activities, including applying negative rates to client accounts (for additional information on Citi Treasury’s ongoing interest rate mitigation activities, see “Market Risk—Market Risk of Non-Trading Portfolios” in Citi’s 2017 Annual Report on Form 10-K).
Changes in Foreign Exchange Rates—Impacts on AOCI and Capital
As of September 30, 2018,March 31, 2019, Citi estimates that an unanticipated parallel instantaneous 5% appreciation of the U.S. dollar against all of the other currencies in which Citi has invested capital could reduce Citi’s tangible common equity (TCE) by approximately $1.4$1.5 billion, or 0.9%1.0%, as a result of changes to Citi’s foreign currency translation adjustment in AOCI, net of hedges. This impact would be primarily due to changes in the value of the Mexican peso, the Euro and the Australian dollar.Indian rupee.
This impact is also before any mitigating actions Citi may take, including ongoing management of its foreign currency translation exposure. Specifically, as currency movements change the value of Citi’s net investments in foreign currency-denominated capital, these movements also change the value of Citi’s risk-weighted assets denominated in those currencies. This, coupled with Citi’s foreign currency hedging strategies, such as foreign currency borrowings, foreign currency forwards and other currency hedging instruments, lessens the impact of foreign currency movements on Citi’s Common Equity Tier 1 Capital ratio. Changes in these hedging strategies, as well as hedging costs, divestitures and tax impacts, can further affect the actual impact of changes in foreign exchange rates on Citi’s capital as compared to an unanticipated parallel shock, as described above.
The effect of Citi’s ongoing management strategies with respect to changes in foreign exchange rates and the impact of these changes on Citi’s TCE and Common Equity Tier 1 Capital ratio are shown in the table below. For additional information on the changes in AOCI, see Note 17 to the Consolidated Financial Statements.
| | | | For the quarter ended | For the quarter ended |
| In millions of dollars (unless otherwise noted) | Sept. 30, 2018 | Jun. 30, 2018 | Sept. 30, 2017 | |
| In millions of dollars, except as otherwise noted | | Mar. 31, 2019 | Dec. 31, 2018 | Mar. 31, 2018 |
Change in FX spot rate(1) | (0.2 | )% | (5.8 | )% | 1.1 | % | 0.4 | % | (1.6 | )% | 2.5 | % |
| Change in TCE due to FX translation, net of hedges | $ | (354 | ) | $ | (2,241 | ) | $ | 222 |
| $ | 65 |
| $ | (491 | ) | $ | 676 |
|
| As a percentage of TCE | (0.2 | )% | (1.5 | )% | 0.1 | % | — | % | (0.3 | )% | 0.4 | % |
Estimated impact to Common Equity Tier 1 Capital ratio (on a fully implemented basis) due to changes in FX translation, net of hedges (bps) | — |
| — |
| (3 | ) | — |
| (1 | ) | (2 | ) |
| |
| (1) | FX spot rate change is a weighted average based upon Citi’s quarterly average GAAP capital exposure to foreign countries. |
Interest Revenue/Expense and Net Interest Margin (NIM)
| | | | 3rd Qtr. | | 2nd Qtr. | | 3rd Qtr. | | Change | 1st Qtr. | | 4th Qtr. | | 1st Qtr. | | Change |
| In millions of dollars, except as otherwise noted | 2018 | | 2018 | | 2017 | | 3Q18 vs. 3Q17 | 2019 | | 2018 | | 2018 | | 1Q19 vs. 1Q18 |
Interest revenue(1) | $ | 18,228 |
| | $ | 17,613 |
| | $ | 16,037 |
| | 14 | % | | $ | 19,140 |
| | $ | 18,845 |
| | $ | 16,396 |
| | 17 | % | |
Interest expense(2) | 6,368 |
| | 5,885 |
| | 4,379 |
| | 45 |
| | 7,317 |
| | 6,853 |
| | 5,160 |
| | 42 |
| |
| Net interest revenue | $ | 11,860 |
| | $ | 11,728 |
| | $ | 11,658 |
| | 2 | % | | $ | 11,823 |
| | $ | 11,992 |
| | $ | 11,236 |
| | 5 | % | |
Interest revenue—average rate | 4.15 | % | | 4.05 | % | | 3.77 | % | | 38 |
| bps | 4.40 | % | | 4.26 | % | | 3.85 | % | | 55 |
| bps |
| Interest expense—average rate | 1.83 |
| | 1.73 |
| | 1.33 |
| | 50 |
| bps | 2.10 |
| | 1.95 |
| | 1.56 |
| | 54 |
| bps |
Net interest margin(3) | 2.70 |
| | 2.70 |
| | 2.74 |
| | (4 | ) | bps | |
Net interest margin(3)(4) | | 2.72 |
| | 2.71 |
| | 2.64 |
| | 8 |
| bps |
| Interest-rate benchmarks | | | | | | | | | | | | | | | | |
| Two-year U.S. Treasury note—average rate | 2.67 | % | | 2.48 | % | | 1.36 | % | | 131 |
| bps | 2.49 | % | | 2.80 | % | | 2.16 | % | | 33 |
| bps |
| 10-year U.S. Treasury note—average rate | 2.92 |
| | 2.92 |
| | 2.24 |
| | 68 |
| bps | 2.65 |
| | 3.04 |
| | 2.76 |
| | (11 | ) | bps |
| 10-year vs. two-year spread | 25 |
| bps | 44 |
| bps | 88 |
| bps | |
| | 16 |
| bps | 24 |
| bps | 60 |
| bps | |
| |
Note: All interest expense amounts include FDIC, as well as other similar deposit insurance assessments outside of the U.S. As of the fourth quarter of 2018, Citi’s FDIC surcharge was eliminated (approximately $130 million per quarter).
| |
| (1) | Net interest revenue includes the taxable equivalent adjustments related to the tax-exempt bond portfolio (based on the U.S. federal statutory tax rates of 21% in 20182019 and 35% in 2017)2018) of $58$64 million, $63$69 million and $123$64 million for the three months ended September 30, 2018, June 30,March 31, 2019, December 31, 2018 and September 30, 2017,March 31, 2018, respectively. |
| |
| (2) | Interest expense associated with certain hybrid financial instruments, which are classified as Long-term debt and accounted for at fair value, is reported together with any changes in fair value as part of Principal transactions in the Consolidated StatementsStatement of Income and is therefore not reflected in Interest expense in the table above. |
| |
| (3) | The average rate on interest revenue and net interest margin reflects the taxable equivalent gross-up adjustment. See footnote 1 on “Average Balances and Interest Rates—Assets” below. |
| |
| (4) | Citi’s net interest margin (NIM) is calculated by dividing grossnet interest revenue less gross interest expense by average interest-earning assets. |
Citi’s net interest revenue in the thirdfirst quarter of 20182019 increased 2%5% to $11.9$11.8 billion (as set forth in the table above, also up 2%5% on a taxable equivalent basis) versus the prior-year period. Excluding the impact of FX translation, net interest revenue increased 5%8%, or approximately $520$860 million. This increase was primarily due to higher net interest revenue ($11.3 billion, up approximately 9% or $1.0 billion) from Citi’s core accrual activities, which are mainly driven by its deposit and lending businesses. The increase in core accrual net interest revenue was partially offset by lower trading-related net interest revenue ($0.4 billion, down approximately 47% or $0.3 billion) and lower net interest revenue associated with the wind-down of legacy assets in Corporate/Other ($0.2
billion, down approximately 45% or $0.1 billion). The increase in the core accrual net interest revenue was driven mainly by higher interest rates, loan growth and an improveda favorable loan mix.mix as well as the impact of elimination of the FDIC surcharge. The increase was partially offset by a modest decrease from the lower trading-related net interest revenue and the continued wind-down of legacy assets.
As set forth above, Citi’s NIM was 2.70%2.72% on a taxable equivalent basis in the thirdfirst quarter of 2018, a decrease of 4 bps from the prior- year period, driven primarily by lower trading-related NIM. Citi’s core accrual NIM was 3.60%,2019, an increase of 12 bps versus1 basis point from the prior-year period, primarily driven byprior quarter. The increase reflected higher interest rates loan growth and an improved loan mix. (Citi’s core accrual net interest revenue and core accrual NIM are non-GAAP financial measures.)
Additional Interest Rate Details
Average Balances and Interest Rates—Assets(1)(2)(3)
| | | | Average volume | Interest revenue | % Average rate | Average volume | Interest revenue | % Average rate |
| | 3rd Qtr. | 2nd Qtr. | 3rd Qtr. | 3rd Qtr. | 2nd Qtr. | 3rd Qtr. | 3rd Qtr. | 2nd Qtr. | 3rd Qtr. | 1st Qtr. | 4th Qtr. | 1st Qtr. | 1st Qtr. | 4th Qtr. | 1st Qtr. | 1st Qtr. | 4th Qtr. | 1st Qtr. |
| In millions of dollars, except rates | 2018 | 2018 | 2017 | 2018 | 2018 | 2017 | 2018 | 2018 | 2017 | 2019 | 2018 | 2018 | 2019 | 2018 | 2018 | 2019 | 2018 |
| Assets | | | | | | | | | | | | | | | | |
Deposits with banks(4) | $ | 186,907 |
| $ | 176,151 |
| $ | 176,942 |
| $ | 629 |
| $ | 493 |
| $ | 486 |
| 1.34 | % | 1.12 | % | 1.09 | % | $ | 171,369 |
| $ | 175,251 |
| $ | 170,867 |
| $ | 607 |
| $ | 649 |
| $ | 432 |
| 1.44 | % | 1.47 | % | 1.03 | % |
Federal funds sold and securities borrowed or purchased under agreements to resell(5) | | | | | |
|
|
| | | | | |
|
|
|
| In U.S. offices | $ | 154,120 |
| $ | 153,273 |
| $ | 136,681 |
| $ | 1,065 |
| $ | 838 |
| $ | 524 |
| 2.74 | % | 2.19 | % | 1.52 | % | $ | 152,530 |
| $ | 151,760 |
| $ | 140,357 |
| $ | 1,262 |
| $ | 1,202 |
| $ | 713 |
| 3.36 | % | 3.14 | % | 2.06 | % |
In offices outside the U.S.(4) | 114,389 |
| 118,098 |
| 108,770 |
| 360 |
| 498 |
| 334 |
| 1.25 |
| 1.69 |
| 1.22 |
| 123,109 |
| 124,372 |
| 113,920 |
| 528 |
| 490 |
| 326 |
| 1.74 |
| 1.56 |
| 1.16 |
|
| Total | $ | 268,509 |
| $ | 271,371 |
| $ | 245,451 |
| $ | 1,425 |
| $ | 1,336 |
| $ | 858 |
| 2.11 | % | 1.97 | % | 1.39 | % | $ | 275,639 |
| $ | 276,132 |
| $ | 254,277 |
| $ | 1,790 |
| $ | 1,692 |
| $ | 1,039 |
| 2.63 | % | 2.43 | % | 1.66 | % |
Trading account assets(6)(7) | | | | |
|
|
| | | | |
|
|
|
| In U.S. offices | $ | 92,034 |
| $ | 92,791 |
| $ | 98,725 |
| $ | 1,048 |
| $ | 851 |
| $ | 918 |
| 4.52 | % | 3.68 | % | 3.69 | % | $ | 95,904 |
| $ | 93,877 |
| $ | 97,558 |
| $ | 940 |
| $ | 938 |
| $ | 869 |
| 3.98 | % | 3.96 | % | 3.61 | % |
In offices outside the U.S.(4) | 112,979 |
| 117,840 |
| 105,882 |
| 614 |
| 922 |
| 555 |
| 2.16 |
| 3.14 |
| 2.08 |
| 124,673 |
| 112,983 |
| 118,603 |
| 752 |
| 567 |
| 512 |
| 2.45 |
| 1.99 |
| 1.75 |
|
| Total | $ | 205,013 |
| $ | 210,631 |
| $ | 204,607 |
| $ | 1,662 |
| $ | 1,773 |
| $ | 1,473 |
| 3.22 | % | 3.38 | % | 2.86 | % | $ | 220,577 |
| $ | 206,860 |
| $ | 216,161 |
| $ | 1,692 |
| $ | 1,505 |
| $ | 1,381 |
| 3.11 | % | 2.89 | % | 2.59 | % |
| Investments | | | | |
|
|
| | | | |
|
|
|
| In U.S. offices | | | | |
|
|
| | | | |
|
|
|
| Taxable | $ | 227,282 |
| $ | 225,886 |
| $ | 227,680 |
| $ | 1,343 |
| $ | 1,315 |
| $ | 1,138 |
| 2.34 | % | 2.34 | % | 1.98 | % | $ | 225,733 |
| $ | 232,169 |
| $ | 229,407 |
| $ | 1,509 |
| $ | 1,449 |
| $ | 1,224 |
| 2.71 | % | 2.48 | % | 2.16 | % |
| Exempt from U.S. income tax | 17,088 |
| 17,339 |
| 17,890 |
| 175 |
| 180 |
| 181 |
| 4.06 |
| 4.16 |
| 4.01 |
| 16,287 |
| 16,838 |
| 17,531 |
| 129 |
| 181 |
| 170 |
| 3.21 |
| 4.26 |
| 3.93 |
|
In offices outside the U.S.(4) | 103,120 |
| 104,562 |
| 106,456 |
| 903 |
| 913 |
| 835 |
| 3.47 |
| 3.50 |
| 3.11 |
| 108,988 |
| 103,144 |
| 105,307 |
| 940 |
| 907 |
| 877 |
| 3.50 |
| 3.49 |
| 3.38 |
|
| Total | $ | 347,490 |
| $ | 347,787 |
| $ | 352,026 |
| $ | 2,421 |
| $ | 2,408 |
| $ | 2,154 |
| 2.76 | % | 2.78 | % | 2.43 | % | $ | 351,008 |
| $ | 352,151 |
| $ | 352,245 |
| $ | 2,578 |
| $ | 2,537 |
| $ | 2,271 |
| 2.98 | % | 2.86 | % | 2.61 | % |
Loans (net of unearned income)(8) | | | | | |
|
|
| | | | | |
|
|
|
| In U.S. offices | $ | 385,610 |
| $ | 382,972 |
| $ | 372,067 |
| $ | 7,331 |
| $ | 6,958 |
| $ | 6,650 |
| 7.54 | % | 7.29 | % | 7.09 | % | $ | 393,398 |
| $ | 392,460 |
| $ | 380,357 |
| $ | 7,649 |
| $ | 7,606 |
| $ | 6,732 |
| 7.89 | % | 7.69 | % | 7.18 | % |
In offices outside the U.S.(4) | 284,663 |
| 286,772 |
| 274,254 |
| 4,326 |
| 4,251 |
| 4,124 |
| 6.03 |
| 5.95 |
| 5.97 |
| 285,811 |
| 283,014 |
| 287,568 |
| 4,341 |
| 4,375 |
| 4,177 |
| 6.16 |
| 6.13 |
| 5.89 |
|
| Total | $ | 670,273 |
| $ | 669,744 |
| $ | 646,321 |
| $ | 11,657 |
| $ | 11,209 |
| $ | 10,774 |
| 6.90 | % | 6.71 | % | 6.61 | % | $ | 679,209 |
| $ | 675,474 |
| $ | 667,925 |
| $ | 11,990 |
| $ | 11,981 |
| $ | 10,909 |
| 7.16 | % | 7.04 | % | 6.62 | % |
Other interest-earning assets(9) | $ | 63,741 |
| $ | 69,341 |
| $ | 61,677 |
| $ | 434 |
| $ | 394 |
| $ | 292 |
| 2.70 | % | 2.28 | % | 1.88 | % | $ | 66,925 |
| $ | 69,243 |
| $ | 66,761 |
| $ | 483 |
| $ | 481 |
| $ | 364 |
| 2.93 | % | 2.76 | % | 2.21 | % |
| Total interest-earning assets | $ | 1,741,933 |
| $ | 1,745,025 |
| $ | 1,687,024 |
| $ | 18,228 |
| $ | 17,613 |
| $ | 16,037 |
| 4.15 | % | 4.05 | % | 3.77 | % | $ | 1,764,727 |
| $ | 1,755,111 |
| $ | 1,728,236 |
| $ | 19,140 |
| $ | 18,845 |
| $ | 16,396 |
| 4.40 | % | 4.26 | % | 3.85 | % |
Non-interest-earning assets(6) | $ | 180,871 |
| $ | 172,077 |
| $ | 205,268 |
| | | | | | | $ | 174,687 |
| $ | 181,680 |
| $ | 175,987 |
| | | | | | |
| Total assets | $ | 1,922,804 |
| $ | 1,917,102 |
| $ | 1,892,292 |
| | | | $ | 1,939,414 |
| $ | 1,936,791 |
| $ | 1,904,223 |
| | | |
| |
| (1) | Net interest revenue includes the taxable equivalent adjustments related to the tax-exempt bond portfolio (based on the U.S. federal statutory tax rates of 21% in 20182019 and 35% in 2017)2018) of $58$64 million, $63$69 million and $123$64 million for the three months ended September 30, 2018, June 30,March 31, 2019, December 31, 2018 and September 30, 2017,March 31, 2018, respectively. |
| |
| (2) | Interest rates and amounts include the effects of risk management activities associated with the respective asset categories. |
| |
| (3) | Monthly or quarterly averages have been used by certain subsidiaries where daily averages are unavailable. |
| |
| (4) | Average rates reflect prevailing local interest rates, including inflationary effects and monetary corrections in certain countries. |
| |
| (5) | Average volumes of securities borrowed or purchased under agreements to resell are reported net pursuant to ASC 210-20-45. However, Interest revenue excludes the impact of ASC 210-20-45. |
| |
| (6) | The fair value carrying amounts of derivative contracts are reported net, pursuant to ASC 815-10-45, in Non-interest-earning assets and Other non-interest-bearing liabilities. |
| |
| (7) | Interest expense on Trading account liabilities of ICG is reported as a reduction of Interest revenue. Interest revenue and Interest expense on cash collateral positions are reported in interest on Trading account assets and Trading account liabilities, respectively. |
| |
| (8) | Includes cash-basis loans. |
| |
| (9) | Includes brokerage receivables. |
Average Balances and Interest Rates—Liabilities and Equity, and Net Interest Revenue(1)(2)(3)
Taxable Equivalent Basis
| | | | Average volume | Interest expense | % Average rate | Average volume | Interest expense | % Average rate |
| | 3rd Qtr. | 2nd Qtr. | 3rd Qtr. | 3rd Qtr. | 2nd Qtr. | 3rd Qtr. | 3rd Qtr. | 2nd Qtr. | 3rd Qtr. | 1st Qtr. | 4th Qtr. | 1st Qtr. | 1st Qtr. | 4th Qtr. | 1st Qtr. | 1st Qtr. | 4th Qtr. | 1st Qtr. |
| In millions of dollars, except rates | 2018 | 2018 | 2017 | 2018 | 2018 | 2017 | 2018 | 2018 | 2017 | 2019 | 2018 | 2018 | 2019 | 2018 | 2018 | 2019 | 2018 |
| Liabilities | | | | | | | | | | | | | | | | |
| Deposits | | | | | | | | | | | | | | |
In U.S. offices(4) | $ | 341,679 |
| $ | 332,595 |
| $ | 318,881 |
| $ | 1,231 |
| $ | 1,041 |
| $ | 695 |
| 1.43 | % | 1.26 | % | 0.86 | % | $ | 366,247 |
| $ | 354,613 |
| $ | 323,355 |
| $ | 1,489 |
| $ | 1,331 |
| $ | 897 |
| 1.65 | % | 1.49 | % | 1.13 | % |
In offices outside the U.S.(5) | 452,197 |
| 453,025 |
| 438,561 |
| 1,349 |
| 1,203 |
| 1,080 |
| 1.18 |
| 1.07 |
| 0.98 |
| 473,142 |
| 463,533 |
| 446,416 |
| 1,538 |
| 1,464 |
| 1,100 |
| 1.32 |
| 1.25 |
| 1.00 |
|
| Total | $ | 793,876 |
| $ | 785,620 |
| $ | 757,442 |
| $ | 2,580 |
| $ | 2,244 |
| $ | 1,775 |
| 1.29 | % | 1.15 | % | 0.93 | % | $ | 839,389 |
| $ | 818,146 |
| $ | 769,771 |
| $ | 3,027 |
| $ | 2,795 |
| $ | 1,997 |
| 1.46 | % | 1.36 | % | 1.05 | % |
Federal funds purchased and securities loaned or sold under agreements to repurchase(6) | | | | | |
|
|
|
|
|
| | | | | |
|
|
|
|
|
|
| In U.S. offices | $ | 105,194 |
| $ | 102,517 |
| $ | 93,167 |
| $ | 872 |
| $ | 796 |
| $ | 423 |
| 3.29 | % | 3.11 | % | 1.80 | % | $ | 111,033 |
| $ | 104,647 |
| $ | 99,015 |
| $ | 1,107 |
| $ | 1,048 |
| $ | 604 |
| 4.04 | % | 3.97 | % | 2.47 | % |
In offices outside the U.S.(5) | 70,638 |
| 68,556 |
| 64,897 |
| 378 |
| 428 |
| 289 |
| 2.12 |
| 2.50 |
| 1.77 |
| 72,904 |
| 72,411 |
| 65,450 |
| 482 |
| 418 |
| 345 |
| 2.68 |
| 2.29 |
| 2.14 |
|
| Total | $ | 175,832 |
| $ | 171,073 |
| $ | 158,064 |
| $ | 1,250 |
| $ | 1,224 |
| $ | 712 |
| 2.82 | % | 2.87 | % | 1.79 | % | $ | 183,937 |
| $ | 177,058 |
| $ | 164,465 |
| $ | 1,589 |
| $ | 1,466 |
| $ | 949 |
| 3.50 | % | 3.28 | % | 2.34 | % |
Trading account liabilities(7)(8) | | | | | |
|
|
|
|
|
| | | | | |
|
|
|
|
|
|
| In U.S. offices | $ | 38,385 |
| $ | 36,103 |
| $ | 32,622 |
| $ | 167 |
| $ | 140 |
| $ | 104 |
| 1.73 | % | 1.56 | % | 1.26 | % | $ | 40,163 |
| $ | 40,735 |
| $ | 33,996 |
| $ | 196 |
| $ | 178 |
| $ | 127 |
| 1.98 | % | 1.73 | % | 1.52 | % |
In offices outside the U.S.(5) | 57,746 |
| 61,048 |
| 57,187 |
| 106 |
| 96 |
| 65 |
| 0.73 |
| 0.63 |
| 0.45 |
| 55,127 |
| 59,157 |
| 57,725 |
| 131 |
| 99 |
| 88 |
| 0.96 |
| 0.66 |
| 0.62 |
|
| Total | $ | 96,131 |
| $ | 97,151 |
| $ | 89,809 |
| $ | 273 |
| $ | 236 |
| $ | 169 |
| 1.13 | % | 0.97 | % | 0.75 | % | $ | 95,290 |
| $ | 99,892 |
| $ | 91,721 |
| $ | 327 |
| $ | 277 |
| $ | 215 |
| 1.39 | % | 1.10 | % | 0.95 | % |
Short-term borrowings(9) | | | | | |
|
|
|
|
|
| | | | | |
|
|
|
|
|
|
| In U.S. offices | $ | 85,592 |
| $ | 84,338 |
| $ | 77,211 |
| $ | 502 |
| $ | 439 |
| $ | 234 |
| 2.33 | % | 2.09 | % | 1.20 | % | $ | 75,440 |
| $ | 80,903 |
| $ | 89,202 |
| $ | 571 |
| $ | 555 |
| $ | 389 |
| 3.07 | % | 2.72 | % | 1.77 | % |
In offices outside the U.S.(5) | 22,579 |
| 23,854 |
| 20,928 |
| 76 |
| 84 |
| 84 |
| 1.34 |
| 1.41 |
| 1.59 |
| 23,740 |
| 23,693 |
| 23,482 |
| 81 |
| 82 |
| 82 |
| 1.38 |
| 1.37 |
| 1.42 |
|
| Total | $ | 108,171 |
| $ | 108,192 |
| $ | 98,139 |
| $ | 578 |
| $ | 523 |
| $ | 318 |
| 2.12 | % | 1.94 | % | 1.29 | % | $ | 99,180 |
| $ | 104,596 |
| $ | 112,684 |
| $ | 652 |
| $ | 637 |
| $ | 471 |
| 2.67 | % | 2.42 | % | 1.70 | % |
Long-term debt(10) | | | | |
|
|
|
|
|
| | | | |
|
|
|
|
|
|
| In U.S. offices | $ | 200,199 |
| $ | 198,291 |
| $ | 198,766 |
| $ | 1,647 |
| $ | 1,620 |
| $ | 1,377 |
| 3.26 | % | 3.28 | % | 2.75 | % | $ | 191,903 |
| $ | 193,317 |
| $ | 199,924 |
| $ | 1,685 |
| $ | 1,637 |
| $ | 1,482 |
| 3.56 | % | 3.36 | % | 3.01 | % |
In offices outside the U.S.(5) | 5,390 |
| 4,980 |
| 4,298 |
| 40 |
| 38 |
| 28 |
| 2.94 |
| 3.06 |
| 2.58 |
| 5,060 |
| 4,857 |
| 4,353 |
| 37 |
| 41 |
| 46 |
| 2.97 |
| 3.35 |
| 4.29 |
|
| Total | $ | 205,589 |
| $ | 203,271 |
| $ | 203,064 |
| $ | 1,687 |
| $ | 1,658 |
| $ | 1,405 |
| 3.26 | % | 3.27 | % | 2.75 | % | $ | 196,963 |
| $ | 198,174 |
| $ | 204,277 |
| $ | 1,722 |
| $ | 1,678 |
| $ | 1,528 |
| 3.55 | % | 3.36 | % | 3.03 | % |
| Total interest-bearing liabilities | $ | 1,379,599 |
| $ | 1,365,307 |
| $ | 1,306,518 |
| $ | 6,368 |
| $ | 5,885 |
| $ | 4,379 |
| 1.83 | % | 1.73 | % | 1.33 | % | $ | 1,414,759 |
| $ | 1,397,866 |
| $ | 1,342,918 |
| $ | 7,317 |
| $ | 6,853 |
| $ | 5,160 |
| 2.10 | % | 1.95 | % | 1.56 | % |
| Demand deposits in U.S. offices | $ | 31,697 |
| $ | 33,737 |
| $ | 37,673 |
| | | | | $ | 26,893 |
| $ | 32,629 |
| $ | 35,528 |
| | | | |
Other non-interest-bearing liabilities(7) | 312,174 |
| 316,907 |
| 318,060 |
| | | | 301,259 |
| 310,369 |
| 324,002 |
| | | |
| Total liabilities | $ | 1,723,470 |
| $ | 1,715,951 |
| $ | 1,662,251 |
| | | | $ | 1,742,911 |
| $ | 1,740,864 |
| $ | 1,702,448 |
| | | |
| Citigroup stockholders’ equity | $ | 198,494 |
| $ | 200,295 |
| $ | 229,017 |
| | | | $ | 195,705 |
| $ | 195,101 |
| $ | 200,833 |
| | | |
| Noncontrolling interest | 840 |
| 856 |
| 1,024 |
| | | | 798 |
| 827 |
| 942 |
| | | |
| Total equity | $ | 199,334 |
| $ | 201,151 |
| $ | 230,041 |
| | | | $ | 196,503 |
| $ | 195,928 |
| $ | 201,775 |
| | | |
| Total liabilities and stockholders’ equity | $ | 1,922,804 |
| $ | 1,917,102 |
| $ | 1,892,292 |
| | | | $ | 1,939,414 |
| $ | 1,936,792 |
| $ | 1,904,223 |
| | | |
Net interest revenue as a percentage of average interest-earning assets(11) | | | | | | | | | | | | |
| In U.S. offices | $ | 1,005,236 |
| $ | 983,786 |
| $ | 975,283 |
| $ | 7,307 |
| $ | 6,710 |
| $ | 7,046 |
| 2.88 | % | 2.74 | % | 2.87 | % | $ | 996,567 |
| $ | 1,007,400 |
| $ | 973,752 |
| $ | 7,232 |
| $ | 7,423 |
| $ | 6,717 |
| 2.94 | % | 2.92 | % | 2.80 | % |
In offices outside the U.S.(6) | 736,697 |
| 761,239 |
| 711,741 |
| 4,553 |
| 5,018 |
| 4,612 |
| 2.45 |
| 2.64 |
| 2.57 |
| 768,160 |
| 747,711 |
| 754,484 |
| 4,591 |
| 4,569 |
| 4,519 |
| 2.42 |
| 2.42 |
| 2.43 |
|
| Total | $ | 1,741,933 |
| $ | 1,745,025 |
| $ | 1,687,024 |
| $ | 11,860 |
| $ | 11,728 |
| $ | 11,658 |
| 2.70 | % | 2.70 | % | 2.74 | % | $ | 1,764,727 |
| $ | 1,755,111 |
| $ | 1,728,236 |
| $ | 11,823 |
| $ | 11,992 |
| $ | 11,236 |
| 2.72 | % | 2.71 | % | 2.64 | % |
| |
| (1) | Net interest revenue includes the taxable equivalent adjustments related to the tax-exempt bond portfolio (based on the U.S. federal statutory tax rates of 21% in 20182019 and 35% in 2017)2018) of $58$64 million, $63$69 million and $123$64 million for the three months ended September 30, 2018, June 30,March 31, 2019, December 31, 2018 and September 30, 2017,March 31, 2018, respectively. |
| |
| (2) | Interest rates and amounts include the effects of risk management activities associated with the respective liability categories. |
| |
| (3) | Monthly or quarterly averages have been used by certain subsidiaries where daily averages are unavailable. |
| |
| (4) | Consists of other time deposits and savings deposits. Savings deposits are made up of insured money market accounts, NOW accounts and other savings deposits. The interest expense on savings deposits includes FDIC deposit insurance assessments. |
| |
| (5) | Average rates reflect prevailing local interest rates, including inflationary effects and monetary corrections in certain countries. |
| |
| (6) | Average volumes of securities sold under agreements to repurchase are reported net pursuant to ASC 210-20-45. However, Interest expense excludes the impact of ASC 210-20-45. |
| |
| (7) | The fair value carrying amounts of derivative contracts are reported net, pursuant to ASC 815-10-45, in Non-interest-earning assets and Other non-interest-bearing liabilities. |
| |
| (8) | Interest expense on Trading account liabilities of ICG is reported as a reduction of Interest revenue. Interest revenue and Interest expense on cash collateral positions are reported in interest on Trading account assets and Trading account liabilities, respectively. |
| |
| (9) | Includes brokerage payables. |
| |
| (10) | Excludes hybrid financial instruments and beneficial interests in consolidated VIEs that are classified as Long-term debt, as the changes in fair value for these obligations are recorded in Principal transactions. |
| |
| (11) | Includes allocations for capital and funding costs based on the location of the asset. |
Average Balances and Interest Rates—Assets(1)(2)(3)(4)
|
| | | | | | | | | | | | | | | | |
| | Average volume | Interest revenue | % Average rate |
| | Nine Months | Nine Months | Nine Months | Nine Months | Nine Months | Nine Months |
| In millions of dollars, except rates | 2018 | 2017 | 2018 | 2017 | 2018 | 2017 |
| Assets | | | | | | |
Deposits with banks(5) | $ | 177,975 |
| $ | 165,910 |
| $ | 1,554 |
| $ | 1,156 |
| 1.17 | % | 0.93 | % |
Federal funds sold and securities borrowed or purchased under agreements to resell(6) | | | | | | |
| In U.S. offices | $ | 149,251 |
| $ | 141,723 |
| $ | 2,616 |
| $ | 1,364 |
| 2.34 | % | 1.29 | % |
In offices outside the U.S.(5) | 115,469 |
| 105,527 |
| 1,184 |
| 984 |
| 1.37 |
| 1.25 |
|
| Total | $ | 264,720 |
| $ | 247,250 |
| $ | 3,800 |
| $ | 2,348 |
| 1.92 | % | 1.27 | % |
Trading account assets(7)(8) | | | | | | |
| In U.S. offices | $ | 94,128 |
| $ | 100,214 |
| $ | 2,768 |
| $ | 2,679 |
| 3.93 | % | 3.57 | % |
In offices outside the U.S.(5) | 116,474 |
| 101,159 |
| 2,048 |
| 1,624 |
| 2.35 |
| 2.15 |
|
| Total | $ | 210,602 |
| $ | 201,373 |
| $ | 4,816 |
| $ | 4,303 |
| 3.06 | % | 2.86 | % |
| Investments | | | | | | |
| In U.S. offices | | | | | | |
| Taxable | $ | 227,525 |
| $ | 224,384 |
| $ | 3,882 |
| $ | 3,258 |
| 2.28 | % | 1.94 | % |
| Exempt from U.S. income tax | 17,319 |
| 18,345 |
| 525 |
| 574 |
| 4.05 |
| 4.18 |
|
In offices outside the U.S.(5) | 104,330 |
| 106,813 |
| 2,693 |
| 2,454 |
| 3.45 |
| 3.07 |
|
| Total | $ | 349,174 |
| $ | 349,542 |
| $ | 7,100 |
| $ | 6,286 |
| 2.72 | % | 2.40 | % |
Loans (net of unearned income)(9) | | | | | | |
| In U.S. offices | $ | 382,980 |
| $ | 369,602 |
| $ | 21,021 |
| $ | 19,316 |
| 7.34 | % | 6.99 | % |
In offices outside the U.S.(5) | 286,334 |
| 265,060 |
| 12,754 |
| 11,844 |
| 5.96 |
| 5.97 |
|
| Total | $ | 669,314 |
| $ | 634,662 |
| $ | 33,775 |
| $ | 31,160 |
| 6.75 | % | 6.56 | % |
Other interest-earning assets(10) | $ | 66,614 |
| $ | 59,506 |
| $ | 1,192 |
| $ | 846 |
| 2.39 | % | 1.90 | % |
| Total interest-earning assets | $ | 1,738,399 |
| $ | 1,658,243 |
| $ | 52,237 |
| $ | 46,099 |
| 4.02 | % | 3.72 | % |
Non-interest-earning assets(7) | $ | 176,312 |
| $ | 205,775 |
| | |
| | |
|
| Total assets | $ | 1,914,711 |
| $ | 1,864,018 |
| | |
| | |
|
| |
(1) | Net interestrevenue includes the taxable equivalent adjustments (based on the U.S. federal statutory tax rates of 21% in 2018 and 35% in 2017) of $185 million and $370 million for the nine months ended September 30, 2018 and 2017, respectively.
|
| |
(2) | Interest rates and amounts include the effects of risk management activities associated with the respective asset and liability categories. |
| |
(3) | Monthly or quarterly averages have been used by certain subsidiaries where daily averages are unavailable. |
| |
(4) | Detailed average volume, Interest revenue and Interest expense exclude Discontinued operations. See Note 2 to the Consolidated Financial Statements.
|
| |
(5) | Average rates reflect prevailing local interest rates, including inflationary effects and monetary corrections in certain countries. |
| |
(6) | Average volumes of securities borrowed or purchased under agreements to resell are reported net pursuant to FIN 41 (ASC 210-20-45). However, Interest revenue excludes the impact of FIN 41 (ASC 210-20-45).
|
| |
(7) | The fair value carrying amounts of derivative contracts are reported in Non-interest-earning assets and Other non-interest-bearing liabilities.
|
| |
(8) | Interest expense on Trading account liabilities of ICG is reported as a reduction of Interest revenue. Interest revenue and Interest expense on cash collateral positions are reported in interest on Trading account assets and Trading account liabilities, respectively.
|
| |
(9) | Includes cash-basis loans. |
| |
(10) | Includes brokerage receivables. |
Average Balances and Interest Rates—Liabilities and Equity, and Net Interest Revenue(1)(2)(3)(4)
Taxable Equivalent Basis
|
| | | | | | | | | | | | | | | | |
| | Average volume | Interest expense | % Average rate |
| | Nine Months | Nine Months | Nine Months | Nine Months | Nine Months | Nine Months |
| In millions of dollars, except rates | 2018 | 2017 | 2018 | 2017 | 2018 | 2017 |
| Liabilities | | | | | | |
| Deposits | | | | | | |
In U.S. offices(5) | $ | 332,542 |
| $ | 310,977 |
| $ | 3,169 |
| $ | 1,795 |
| 1.27 | % | 0.77 | % |
In offices outside the U.S.(6) | 450,546 |
| 435,704 |
| 3,652 |
| 2,998 |
| 1.08 |
| 0.92 |
|
| Total | $ | 783,088 |
| $ | 746,681 |
| $ | 6,821 |
| $ | 4,793 |
| 1.16 | % | 0.86 | % |
Federal funds purchased and securities loaned or sold under agreements to repurchase(7) | | | | | | |
| In U.S. offices | $ | 102,242 |
| $ | 96,417 |
| $ | 2,272 |
| $ | 1,101 |
| 2.97 | % | 1.53 | % |
In offices outside the U.S.(6) | 68,215 |
| 59,559 |
| 1,151 |
| 780 |
| 2.26 |
| 1.75 |
|
| Total | $ | 170,457 |
| $ | 155,976 |
| $ | 3,423 |
| $ | 1,881 |
| 2.68 | % | 1.61 | % |
Trading account liabilities(8)(9) | | | | | | |
| In U.S. offices | $ | 36,161 |
| $ | 33,041 |
| $ | 434 |
| $ | 269 |
| 1.60 | % | 1.09 | % |
In offices outside the U.S.(6) | 58,840 |
| 57,862 |
| 290 |
| 193 |
| 0.66 |
| 0.45 |
|
| Total | $ | 95,001 |
| $ | 90,903 |
| $ | 724 |
| $ | 462 |
| 1.02 | % | 0.68 | % |
Short-term borrowings(10) | | | | | | |
| In U.S. offices | $ | 86,377 |
| $ | 72,435 |
| $ | 1,330 |
| $ | 422 |
| 2.06 | % | 0.78 | % |
In offices outside the U.S.(6) | 23,305 |
| 22,668 |
| 242 |
| 297 |
| 1.39 |
| 1.75 |
|
| Total | $ | 109,682 |
| $ | 95,103 |
| $ | 1,572 |
| $ | 719 |
| 1.92 | % | 1.01 | % |
Long-term debt(11) | | | | | | |
| In U.S. offices | $ | 199,471 |
| $ | 188,344 |
| $ | 4,749 |
| $ | 3,993 |
| 3.18 | % | 2.83 | % |
In offices outside the U.S.(6) | 4,908 |
| 4,715 |
| 124 |
| 133 |
| 3.38 |
| 3.77 |
|
| Total | $ | 204,379 |
| $ | 193,059 |
| $ | 4,873 |
| $ | 4,126 |
| 3.19 | % | 2.86 | % |
| Total interest-bearing liabilities | $ | 1,362,607 |
| $ | 1,281,722 |
| $ | 17,413 |
| $ | 11,981 |
| 1.71 | % | 1.25 | % |
| Demand deposits in U.S. offices | $ | 33,654 |
| $ | 38,064 |
| | |
| | |
Other non-interest-bearing liabilities(8) | 317,697 |
| 313,605 |
| | |
| | |
| Total liabilities | $ | 1,713,958 |
| $ | 1,633,391 |
| | |
| | |
Citigroup stockholders’ equity(12) | $ | 199,874 |
| $ | 229,618 |
| | |
| | |
| Noncontrolling interest | 879 |
| 1,009 |
| | |
| | |
Total equity(12) | $ | 200,753 |
| $ | 230,627 |
| | |
| | |
| Total liabilities and stockholders’ equity | $ | 1,914,711 |
| $ | 1,864,018 |
| | |
| | |
| Net interest revenue as a percentage of average interest-earning assets | | | | | | |
| In U.S. offices | $ | 987,592 |
| $ | 963,789 |
| $ | 20,734 |
| $ | 20,588 |
| 2.81 | % | 2.86 | % |
In offices outside the U.S.(6) | 750,807 |
| 694,454 |
| 14,090 |
| 13,530 |
| 2.51 |
| 2.60 |
|
| Total | $ | 1,738,399 |
| $ | 1,658,243 |
| $ | 34,824 |
| $ | 34,118 |
| 2.68 | % | 2.75 | % |
| |
(1) | Net interestrevenue includes the taxable equivalent adjustments (based on the U.S. federal statutory tax rates of 21% in 2018 and 35% in 2017) of $185 million and $370 million for the nine months ended September 30, 2018 and 2017, respectively.
|
| |
(2) | Interest rates and amounts include the effects of risk management activities associated with the respective asset and liability categories. |
| |
(3) | Monthly or quarterly averages have been used by certain subsidiaries where daily averages are unavailable. |
| |
(4) | Detailed average volume, Interest revenue and Interest expense exclude Discontinued operations. See Note 2 to the Consolidated Financial Statements.
|
| |
(5) | Consists of other time deposits and savings deposits. Savings deposits are made up of insured money market accounts, NOW accounts and other savings deposits. The interest expense on savings deposits includes FDIC deposit insurance fees and charges. |
| |
(6) | Average rates reflect prevailing local interest rates, including inflationary effects and monetary corrections in certain countries. |
| |
(7) | Average volumes of securities loaned or sold under agreements to repurchase are reported net pursuant to FIN 41 (ASC 210-20-45). However, Interest expense excludes the impact of FIN 41 (ASC 210-20-45).
|
| |
(8) | The fair value carrying amounts of derivative contracts are reported in Non-interest-earning assets and Other non-interest-bearing liabilities.
|
| |
(9) | Interest expense on Trading account liabilities of ICG is reported as a reduction of Interest revenue. Interest revenue and Interest expense on cash collateral positions are reported in interest on Trading account assets and Trading account liabilities, respectively.
|
| |
(10) | Excludes hybrid financial instruments and beneficial interests in consolidated VIEs that are classified as Long-term debt, as these obligations are accounted for in changes in fair value recorded in Principal transactions.
|
| |
(11) | Includes stockholders' equity from discontinued operations. |
| |
(12) | Includes allocations for capital and funding costs based on the location of the asset. |
Analysis of Changes in Interest Revenue(1)(2)(3)
| | | | 3rd Qtr. 2018 vs. 2nd Qtr. 2018 | 3rd Qtr. 2018 vs. 3rd Qtr. 2017 | 1st Qtr. 2019 vs. 4th Qtr. 2018 | 1st Qtr. 2019 vs. 1st Qtr. 2018 |
| | Increase (decrease) due to change in: | Increase (decrease) due to change in: | Increase (decrease) due to change in: | Increase (decrease) due to change in: |
| In millions of dollars | Average volume | Average rate | Net change | Average volume | Average rate | Net change | Average volume | Average rate | Net change | Average volume | Average rate | Net change |
Deposits with banks(4) | $ | 32 |
| $ | 104 |
| $ | 136 |
| $ | 29 |
| $ | 114 |
| $ | 143 |
| $ | (14 | ) | $ | (28 | ) | $ | (42 | ) | $ | 1 |
| $ | 174 |
| $ | 175 |
|
Federal funds sold and securities borrowed or purchased under agreements to resell | | | | | | |
| In U.S. offices | $ | 5 |
| $ | 222 |
| $ | 227 |
| $ | 74 |
| $ | 467 |
| $ | 541 |
| $ | 6 |
| $ | 54 |
| $ | 60 |
| $ | 67 |
| $ | 482 |
| $ | 549 |
|
In offices outside the U.S.(4) | (15 | ) | (123 | ) | (138 | ) | 18 |
| 8 |
| 26 |
| (5 | ) | 43 |
| 38 |
| 28 |
| 174 |
| 202 |
|
| Total | $ | (10 | ) | $ | 99 |
| $ | 89 |
| $ | 92 |
| $ | 475 |
| $ | 567 |
| $ | 1 |
| $ | 97 |
| $ | 98 |
| $ | 95 |
| $ | 656 |
| $ | 751 |
|
Trading account assets(5) | | | | | | |
| In U.S. offices | $ | (7 | ) | $ | 204 |
| $ | 197 |
| $ | (65 | ) | $ | 195 |
| $ | 130 |
| $ | 20 |
| $ | (18 | ) | $ | 2 |
| $ | (15 | ) | $ | 86 |
| $ | 71 |
|
In offices outside the U.S.(4) | (37 | ) | (271 | ) | (308 | ) | 38 |
| 21 |
| 59 |
| 63 |
| 122 |
| 185 |
| 27 |
| 213 |
| 240 |
|
| Total | $ | (44 | ) | $ | (67 | ) | $ | (111 | ) | $ | (27 | ) | $ | 216 |
| $ | 189 |
| $ | 83 |
| $ | 104 |
| $ | 187 |
| $ | 12 |
| $ | 299 |
| $ | 311 |
|
Investments(1) | | | | | | |
| In U.S. offices | $ | 7 |
| $ | 16 |
| $ | 23 |
| $ | (6 | ) | $ | 205 |
| $ | 199 |
| $ | (46 | ) | $ | 54 |
| $ | 8 |
| $ | (28 | ) | $ | 272 |
| $ | 244 |
|
In offices outside the U.S.(4) | (13 | ) | 3 |
| (10 | ) | (27 | ) | 95 |
| 68 |
| 51 |
| (18 | ) | 33 |
| 31 |
| 32 |
| 63 |
|
| Total | $ | (6 | ) | $ | 19 |
| $ | 13 |
| $ | (33 | ) | $ | 300 |
| $ | 267 |
| $ | 5 |
| $ | 36 |
| $ | 41 |
| $ | 3 |
| $ | 304 |
| $ | 307 |
|
Loans (net of unearned income)(6) | | | | | | |
| In U.S. offices | $ | 48 |
| $ | 325 |
| $ | 373 |
| $ | 248 |
| $ | 433 |
| $ | 681 |
| $ | 18 |
| $ | 25 |
| $ | 43 |
| $ | 237 |
| $ | 680 |
| $ | 917 |
|
In offices outside the U.S.(4) | (31 | ) | 106 |
| 75 |
| 158 |
| 44 |
| 202 |
| 43 |
| (77 | ) | (34 | ) | (26 | ) | 190 |
| 164 |
|
| Total | $ | 17 |
| $ | 431 |
| $ | 448 |
| $ | 406 |
| $ | 477 |
| $ | 883 |
| $ | 61 |
| $ | (52 | ) | $ | 9 |
| $ | 211 |
| $ | 870 |
| $ | 1,081 |
|
Other interest-earning assets(7) | $ | (34 | ) | $ | 74 |
| $ | 40 |
| $ | 10 |
| $ | 132 |
| $ | 142 |
| $ | (16 | ) | $ | 18 |
| $ | 2 |
| $ | 1 |
| $ | 118 |
| $ | 119 |
|
| Total interest revenue | $ | (45 | ) | $ | 660 |
| $ | 615 |
| $ | 477 |
| $ | 1,714 |
| $ | 2,191 |
| $ | 120 |
| $ | 175 |
| $ | 295 |
| $ | 323 |
| $ | 2,421 |
| $ | 2,744 |
|
| |
| (1) | The taxable equivalent adjustment is related to the tax-exempt bond portfolio based on the U.S. federal statutory tax rates of 21% in 20182019 and 35% in 20172018 and is included in this presentation. |
| |
| (2) | Rate/volume variance is allocated based on the percentage relationship of changes in volume and changes in rate to the total net change. |
| |
| (3) | Detailed average volume, Interest revenue and Interest expense exclude Discontinued operations. See Note 2 to the Consolidated Financial Statements. |
| |
| (4) | Changes in average rates reflect changes in prevailing local interest rates, including inflationary effects and monetary corrections in certain countries. |
| |
| (5) | Interest expense on Trading account liabilities of ICG is reported as a reduction of Interest revenue. Interest revenue and Interest expense on cash collateral positions are reported in interest on Trading account assets and Trading account liabilities, respectively. |
| |
| (6) | Includes cash-basis loans. |
| |
| (7) | Includes brokerage receivables. |
Analysis of Changes in Interest Expense and Net Interest Revenue(1)(2)(3) | | | | 3rd Qtr. 2018 vs. 2nd Qtr. 2018 | 3rd Qtr. 2018 vs. 3rd Qtr. 2017 | 1st Qtr. 2019 vs. 4th Qtr. 2018 | 1st Qtr. 2019 vs. 1st Qtr. 2018 |
| | Increase (decrease) due to change in: | Increase (decrease) due to change in: | Increase (decrease) due to change in: | Increase (decrease) due to change in: |
| In millions of dollars | Average volume | Average rate | Net change | Average volume | Average rate | Net change | Average volume | Average rate | Net change | Average volume | Average rate | Net change |
| Deposits | | | | | | |
| In U.S. offices | $ | 29 |
| $ | 161 |
| $ | 190 |
| $ | 53 |
| $ | 483 |
| $ | 536 |
| $ | 45 |
| $ | 113 |
| $ | 158 |
| $ | 131 |
| $ | 461 |
| $ | 592 |
|
In offices outside the U.S.(4) | (2 | ) | 148 |
| 146 |
| 34 |
| 235 |
| 269 |
| 31 |
| 43 |
| 74 |
| 69 |
| 369 |
| 438 |
|
| Total | $ | 27 |
| $ | 309 |
| $ | 336 |
| $ | 87 |
| $ | 718 |
| $ | 805 |
| $ | 76 |
| $ | 156 |
| $ | 232 |
| $ | 200 |
| $ | 830 |
| $ | 1,030 |
|
Federal funds purchased and securities loaned
or sold under agreements to repurchase | | | | | | | | |
| In U.S. offices | $ | 21 |
| $ | 55 |
| $ | 76 |
| $ | 61 |
| $ | 388 |
| $ | 449 |
| $ | 64 |
| $ | (5 | ) | $ | 59 |
| $ | 81 |
| $ | 422 |
| $ | 503 |
|
In offices outside the U.S.(4) | 13 |
| (63 | ) | (50 | ) | 27 |
| 62 |
| 89 |
| 3 |
| 61 |
| 64 |
| 42 |
| 95 |
| 137 |
|
| Total | $ | 34 |
| $ | (8 | ) | $ | 26 |
| $ | 88 |
| $ | 450 |
| $ | 538 |
| $ | 67 |
| $ | 56 |
| $ | 123 |
| $ | 123 |
| $ | 517 |
| $ | 640 |
|
Trading account liabilities(5) | | | | | | |
| In U.S. offices | $ | 9 |
| $ | 18 |
| $ | 27 |
| $ | 21 |
| $ | 42 |
| $ | 63 |
| $ | (3 | ) | $ | 21 |
| $ | 18 |
| $ | 26 |
| $ | 43 |
| $ | 69 |
|
In offices outside the U.S.(4) | (5 | ) | 15 |
| 10 |
| 1 |
| 40 |
| 41 |
| (7 | ) | 39 |
| 32 |
| (4 | ) | 47 |
| 43 |
|
| Total | $ | 4 |
| $ | 33 |
| $ | 37 |
| $ | 22 |
| $ | 82 |
| $ | 104 |
| $ | (10 | ) | $ | 60 |
| $ | 50 |
| $ | 22 |
| $ | 90 |
| $ | 112 |
|
Short-term borrowings(6) | | | | | | |
| In U.S. offices | $ | 7 |
| $ | 56 |
| $ | 63 |
| $ | 28 |
| $ | 240 |
| $ | 268 |
| $ | (39 | ) | $ | 55 |
| $ | 16 |
| $ | (68 | ) | $ | 250 |
| $ | 182 |
|
In offices outside the U.S.(4) | (4 | ) | (4 | ) | (8 | ) | 6 |
| (14 | ) | (8 | ) | — |
| (1 | ) | (1 | ) | 1 |
| (2 | ) | (1 | ) |
| Total | $ | 3 |
| $ | 52 |
| $ | 55 |
| $ | 34 |
| $ | 226 |
| $ | 260 |
| $ | (39 | ) | $ | 54 |
| $ | 15 |
| $ | (67 | ) | $ | 248 |
| $ | 181 |
|
| Long-term debt | | | | | | |
| In U.S. offices | $ | 16 |
| $ | 11 |
| $ | 27 |
| $ | 10 |
| $ | 260 |
| $ | 270 |
| $ | (12 | ) | $ | 60 |
| $ | 48 |
| $ | (61 | ) | $ | 264 |
| $ | 203 |
|
In offices outside the U.S.(4) | 3 |
| (1 | ) | 2 |
| 8 |
| 4 |
| 12 |
| 2 |
| (6 | ) | (4 | ) | 7 |
| (16 | ) | (9 | ) |
| Total | $ | 19 |
| $ | 10 |
| $ | 29 |
| $ | 18 |
| $ | 264 |
| $ | 282 |
| $ | (10 | ) | $ | 54 |
| $ | 44 |
| $ | (54 | ) | $ | 248 |
| $ | 194 |
|
| Total interest expense | $ | 85 |
| $ | 396 |
| $ | 483 |
| $ | 249 |
| $ | 1,740 |
| $ | 1,989 |
| $ | 84 |
| $ | 380 |
| $ | 464 |
| $ | 224 |
| $ | 1,933 |
| $ | 2,157 |
|
| Net interest revenue | $ | (130 | ) | $ | 262 |
| $ | 132 |
| $ | 225 |
| $ | (23 | ) | $ | 202 |
| $ | 36 |
| $ | (205 | ) | $ | (169 | ) | $ | 100 |
| $ | 487 |
| $ | 587 |
|
| |
| (1) | The taxable equivalent adjustment is related to the tax-exempt bond portfolio based on the U.S. federal statutory tax rates of 21% in 20182019 and 35% in 20172018 and is included in this presentation. |
| |
| (2) | Rate/volume variance is allocated based on the percentage relationship of changes in volume and changes in rate to the total net change. |
| |
| (3) | Detailed average volume, Interest revenue and Interest expense exclude Discontinued operations. See Note 2 to the Consolidated Financial Statements. |
| |
| (4) | Changes in average rates reflect changes in prevailing local interest rates, including inflationary effects and monetary corrections in certain countries. |
| |
| (5) | Interest expense on Trading account liabilities of ICG is reported as a reduction of Interest revenue. Interest revenue and Interest expense on cash collateral positions are reported in interest on Trading account assets and Trading account liabilities, respectively. |
| |
| (6) | Includes brokerage payables. |
Analysis of Changes in Interest Revenue, Interest Expense and Net Interest Revenue(1)(2)(3)
|
| | | | | | | | | |
| | Nine Months 2018 vs. Nine Months 2017 |
| | Increase (decrease) due to change in: |
| In millions of dollars | Average volume | Average rate | Net change(2) |
Deposits with banks(4) | $ | 89 |
| $ | 309 |
| $ | 398 |
|
| Federal funds sold and securities borrowed or purchased under agreements to resell | | | |
| In U.S. offices | $ | 76 |
| $ | 1,176 |
| $ | 1,252 |
|
In offices outside the U.S.(4) | 97 |
| 103 |
| 200 |
|
| Total | $ | 173 |
| $ | 1,279 |
| $ | 1,452 |
|
Trading account assets(5) | | | |
| In U.S. offices | $ | (169 | ) | $ | 258 |
| $ | 89 |
|
In offices outside the U.S.(4) | 260 |
| 164 |
| 424 |
|
| Total | $ | 91 |
| $ | 422 |
| $ | 513 |
|
Investments(1) | | | |
| In U.S. offices | $ | 34 |
| $ | 541 |
| $ | 575 |
|
In offices outside the U.S.(4) | (58 | ) | 297 |
| 239 |
|
| Total | $ | (24 | ) | $ | 838 |
| $ | 814 |
|
Loans (net of unearned income)(6) | | | |
| In U.S. offices | $ | 714 |
| $ | 991 |
| $ | 1,705 |
|
In offices outside the U.S.(4) | 948 |
| (38 | ) | 910 |
|
| Total | $ | 1,662 |
| $ | 953 |
| $ | 2,615 |
|
| Other interest-earning assets | $ | 109 |
| $ | 237 |
| $ | 346 |
|
| Total interest revenue | $ | 2,100 |
| $ | 4,038 |
| $ | 6,138 |
|
Deposits(7) | | | |
| In U.S. offices | $ | 132 |
| $ | 1,242 |
| $ | 1,374 |
|
In offices outside the U.S.(4) | 105 |
| 549 |
| 654 |
|
| Total | $ | 237 |
| $ | 1,791 |
| $ | 2,028 |
|
| Federal funds purchased and securities loaned or sold under agreements to repurchase | | | |
| In U.S. offices | $ | 70 |
| $ | 1,101 |
| $ | 1,171 |
|
In offices outside the U.S.(4) | 124 |
| 247 |
| 371 |
|
| Total | $ | 194 |
| $ | 1,348 |
| $ | 1,542 |
|
Trading account liabilities(5) | | | |
| In U.S. offices | $ | 27 |
| $ | 138 |
| $ | 165 |
|
In offices outside the U.S.(4) | 3 |
| 94 |
| 97 |
|
| Total | $ | 30 |
| $ | 232 |
| $ | 262 |
|
| Short-term borrowings | | | |
| In U.S. offices | $ | 95 |
| $ | 813 |
| $ | 908 |
|
In offices outside the U.S.(4) | 8 |
| (63 | ) | (55 | ) |
| Total | $ | 103 |
| $ | 750 |
| $ | 853 |
|
| Long-term debt | | | |
| In U.S. offices | $ | 245 |
| $ | 511 |
| $ | 756 |
|
In offices outside the U.S.(4) | 5 |
| (14 | ) | (9 | ) |
| Total | $ | 250 |
| $ | 497 |
| $ | 747 |
|
| Total interest expense | $ | 814 |
| $ | 4,618 |
| $ | 5,432 |
|
| Net interest revenue | $ | 1,286 |
| $ | (580 | ) | $ | 706 |
|
| |
(1) | The taxable equivalent adjustment is related to the tax-exempt bond portfolio based on the U.S. federal statutory tax rates of 21% in 2018 and 35% in 2017 and is included in this presentation. |
| |
(2) | Rate/volume variance is allocated based on the percentage relationship of changes in volume and changes in rate to the total net change. |
| |
(3) | Detailed average volume, Interest revenue and Interest expense exclude Discontinued operations.
|
| |
(4) | Changes in average rates reflect changes in prevailing local interest rates, including inflationary effects and monetary corrections in certain countries. |
| |
(5) | Interest expense on Trading account liabilities of ICG is reported as a reduction of Interest revenue. Interest revenue and Interest expense on cash collateral positions are reported in Trading account assets and Trading account liabilities, respectively.
|
| |
(6) | Includes cash-basis loans. |
| |
(7) | The interest expense on deposits includes the FDIC assessment and deposit insurance fees and charges of $1,006 million and $935 million for the nine months ended September 30, 2018 and 2017, respectively. |
Market Risk of Trading Portfolios
For additional information on Citi’s market risk of trading portfolios, see “Market Risk—Market Risk of Trading Portfolios” in Citi’s 2017 Annual Report on Form 10-K.
Value at Risk
As of September 30, 2018,March 31, 2019, Citi estimates that the conservative features of its VAR calibration contributed an approximate 22%26% add-on to what would be a VAR estimated under the assumption of stable and perfectly normal distributed markets. As of June 30,December 31, 2018, the add-on was 25%20%.
As set forth in the table below, Citi's average trading VAR as of September 30, 2018March 31, 2019 decreased compared to June 30,December 31, 2018. The decrease was mainly due to lower foreign exchangeinterest rate risk in the Markets businesses within ICG. The decrease of average trading and credit portfolio VAR was in line with the decrease in average trading VAR.
Quarter-end and Average Trading VAR and Trading and Credit Portfolio VAR
| | | | | Third Quarter | | Second Quarter | | Third Quarter | | First Quarter | | Fourth Quarter | | First Quarter |
| In millions of dollars | September 30, 2018 | 2018 Average | June 30, 2018 | 2018 Average | September 30, 2017 | 2017 Average | March 31, 2019 | 2019 Average | December 31, 2018 | 2018 Average | March 31, 2018 | 2018 Average |
| Interest rate | $ | 33 |
| $ | 58 |
| $ | 60 |
| $ | 61 |
| $ | 63 |
| $ | 63 |
| $ | 32 |
| $ | 37 |
| $ | 48 |
| $ | 54 |
| $ | 84 |
| $ | 68 |
|
| Credit spread | 45 |
| 42 |
| 46 |
| 47 |
| 43 |
| 44 |
| 43 |
| 48 |
| 55 |
| 51 |
| 52 |
| 49 |
|
Covariance adjustment(1) | (17 | ) | (24 | ) | (25 | ) | (26 | ) | (28 | ) | (23 | ) | (21 | ) | (23 | ) | (23 | ) | (22 | ) | (24 | ) | (25 | ) |
Fully diversified interest rate and credit spread(2) | $ | 61 |
| $ | 76 |
| $ | 81 |
| $ | 82 |
| $ | 78 |
| $ | 84 |
| $ | 54 |
| $ | 62 |
| $ | 80 |
| $ | 83 |
| $ | 112 |
| $ | 92 |
|
| Foreign exchange | 18 |
| 21 |
| 29 |
| 30 |
| 26 |
| 26 |
| 15 |
| 26 |
| 18 |
| 21 |
| 33 |
| 30 |
|
| Equity | 23 |
| 21 |
| 23 |
| 20 |
| 15 |
| 13 |
| 20 |
| 17 |
| 25 |
| 23 |
| 20 |
| 22 |
|
| Commodity | 17 |
| 21 |
| 16 |
| 17 |
| 20 |
| 23 |
| 30 |
| 28 |
| 23 |
| 20 |
| 19 |
| 20 |
|
Covariance adjustment(1) | (58 | ) | (68 | ) | (74 | ) | (69 | ) | (64 | ) | (65 | ) | (66 | ) | (67 | ) | (66 | ) | (65 | ) | (73 | ) | (71 | ) |
Total trading VAR—all market risk factors, including general and specific risk (excluding credit portfolios)(2) | $ | 61 |
| $ | 71 |
| $ | 75 |
| $ | 80 |
| $ | 75 |
| $ | 81 |
| $ | 53 |
| $ | 66 |
| $ | 80 |
| $ | 82 |
| $ | 111 |
| $ | 93 |
|
Specific risk-only component(3) | $ | 7 |
| $ | 1 |
| $ | 2 |
| $ | 3 |
| $ | 3 |
| $ | 2 |
| $ | 2 |
| $ | 3 |
| $ | 4 |
| $ | 78 |
| $ | 3 |
| $ | 3 |
|
| Total trading VAR—general market risk factors only (excluding credit portfolios) | $ | 54 |
| $ | 70 |
| $ | 73 |
| $ | 77 |
| $ | 72 |
| $ | 79 |
| $ | 51 |
| $ | 63 |
| $ | 76 |
| $ | 4 |
| $ | 108 |
| $ | 90 |
|
Incremental impact of the credit portfolio(4) | $ | 11 |
| $ | 11 |
| $ | 16 |
| $ | 10 |
| $ | 8 |
| $ | 8 |
| $ | 14 |
| $ | 15 |
| $ | 18 |
| $ | 13 |
| $ | 5 |
| $ | 9 |
|
| Total trading and credit portfolio VAR | $ | 72 |
| $ | 82 |
| $ | 91 |
| $ | 90 |
| $ | 83 |
| $ | 89 |
| $ | 67 |
| $ | 81 |
| $ | 98 |
| $ | 95 |
| $ | 116 |
| $ | 102 |
|
| |
| (1) | Covariance adjustment (also known as diversification benefit) equals the difference between the total VAR and the sum of the VARs tied to each individual risk type. The benefit reflects the fact that the risks within each and across risk types are not perfectly correlated and, consequently, the total VAR on a given day will be lower than the sum of the VARs relating to each individual risk type. The determination of the primary drivers of changes to the covariance adjustment is made by an examination of the impact of both model parameter and position changes. |
| |
| (2) | The total trading VAR includes mark-to-market and certain fair value option trading positions in ICG,with the exception of hedges to the loan portfolio, fair value option loans and all CVA exposures. Available-for-sale and accrual exposures are not included. |
| |
| (3) | The specific risk-only component represents the level of equity and fixed income issuer-specific risk embedded in VAR. |
| |
| (4) | The credit portfolio is composed of mark-to-market positions associated with non-trading business units including Citi Treasury, the CVA relating to derivative counterparties and all associated CVA hedges. FVA and DVA are not included. The credit portfolio also includes hedges to the loan portfolio, fair value option loans and hedges to the leveraged finance pipeline within capital markets origination in ICG. |
The table below provides the range of market factor VARs associated with Citi’s total trading VAR, inclusive of specific risk:
| | | | Third Quarter | Second Quarter | Third Quarter | First Quarter | Fourth Quarter | First Quarter |
| | 2018 | 2018 | 2017 | 2019 | 2018 |
| In millions of dollars | Low | High | Low | High | Low | High | Low | High | Low | High | Low | High |
| Interest rate | $ | 33 |
| $ | 80 |
| $ | 38 |
| $ | 91 |
| $ | 33 |
| $ | 97 |
| $ | 30 |
| $ | 58 |
| $ | 34 |
| $ | 81 |
| $ | 50 |
| $ | 89 |
|
| Credit spread | 38 |
| 47 |
| 43 |
| 52 |
| 38 |
| 52 |
| 41 |
| 55 |
| 45 |
| 53 |
| 45 |
| 53 |
|
| Fully diversified interest rate and credit spread | $ | 61 |
| $ | 95 |
| $ | 59 |
| $ | 118 |
| $ | 59 |
| $ | 108 |
| $ | 51 |
| $ | 89 |
| $ | 61 |
| $ | 106 |
| $ | 78 |
| $ | 117 |
|
| Foreign exchange | 13 |
| 27 |
| 20 |
| 44 |
| 19 |
| 38 |
| 15 |
| 34 |
| 15 |
| 26 |
| 24 |
| 44 |
|
| Equity | 16 |
| 28 |
| 15 |
| 26 |
| 8 |
| 18 |
| 10 |
| 29 |
| 17 |
| 33 |
| 16 |
| 32 |
|
| Commodity | 16 |
| 27 |
| 13 |
| 22 |
| 14 |
| 31 |
| 19 |
| 43 |
| 17 |
| 23 |
| 16 |
| 23 |
|
| Total trading | $ | 56 |
| $ | 91 |
| $ | 57 |
| $ | 120 |
| $ | 58 |
| $ | 106 |
| $ | 53 |
| $ | 87 |
| $ | 62 |
| $ | 102 |
| $ | 79 |
| $ | 118 |
|
| Total trading and credit portfolio | 66 |
| 101 |
| 69 |
| 123 |
| 67 |
| 112 |
| 62 |
| 103 |
| 74 |
| 112 |
| 88 |
| 124 |
|
Note: No covariance adjustment can be inferred from the above table as the high and low for each market factor will be from different close-of-business dates.
The following table provides the VAR for ICG, excluding the CVA relating to derivative counterparties, hedges of CVA, fair value option loans and hedges to the loan portfolio:
| | | In millions of dollars | Sept. 30, 2018 | Mar. 31, 2019 |
Total—all market risk factors, including general and specific risk | | |
| Average—during quarter | $ | 71 |
| $ | 65 |
|
| High—during quarter | 91 |
| 86 |
|
| Low—during quarter | 56 |
| 53 |
|
Regulatory VAR Back-testing
In accordance with Basel III, Citi is required to perform back-testing to evaluate the effectiveness of its Regulatory VAR model. Regulatory VAR back-testing is the process in which the daily one-day VAR, at a 99% confidence interval, is compared to the buy-and-hold profit and loss (i.e., the profit and loss impact if the portfolio is held constant at the end of the day and re-priced the following day). Buy-and-hold profit and loss represents the daily mark-to-market profit and loss attributable to price movements in covered positions from the close of the previous business day. Buy-and-hold profit and loss excludes realized trading revenue, net interest, fees and commissions, intra-day trading profit and loss and changes in reserves.
Based on a 99% confidence level, Citi would expect two to three days in any one year where buy-and-hold losses exceeded the Regulatory VAR. Given the conservative calibration of Citi’s VAR model (as a result of taking the greater of short- and long-term volatilities and fat-tail scaling of volatilities), Citi would expect fewer exceptions under normal and stable market conditions. Periods of unstable market conditions could increase the number of back-testing exceptions.
As of September 30, 2018,March 31, 2019, there was one back-testing exception observed for Citi’s Regulatory VAR for the prior 12 months, due to market moves triggered by political events in Italy.
STRATEGIC RISK
For additional information on strategic risk at Citi, see “Strategic Risk” in Citi’s 2018 Annual Report on Form 10-K.
Country Risk
For additional information on country risk at Citi, see “Country Risk” in Citi’s 2017 Annual Report on Form 10-K.
Top 25 Country Exposures
The following table presents Citi’s top 25 exposures by
country (excluding the U.S.) as of September 30, 2018.March 31, 2019. The total exposure as of September 30, 2018March 31, 2019 to the top 25 countries disclosed below in combination with the U.S., would represent approximately 95%96% of Citi’s exposure to all countries. For purposes of the table, loan amounts are reflected in the country where the loan is booked, which is generally based on the domicile of the borrower. For example, a loan to a Chinese subsidiary of a Switzerland-based corporation will generally be categorized as a loan in China. In addition, Citi has
developed regional booking centers in certain countries, most significantly in the United Kingdom (U.K.) and Ireland,
in order to more efficiently serve its corporate customers. As an
example, with respect to the U.K., only 28%31% of corporate
loans presented in the table below are to U.K. domiciled
entities (29%(33% for unfunded commitments), with the balance of
the loans predominately to European domiciled counterparties.
Approximately 83%84% of the total U.K. funded loans and 91% of
the total U.K. unfunded commitments were investment grade
as of September 30, 2018.March 31, 2019. Trading account assets and investment securities are generally categorized based on the domicile of the issuer of the security of the underlying reference entity. For additional information on the assets included in the table, see the footnotes to the table below.
For a discussion of uncertainties arising as a result of the U.K.’s potential exit from the EU, see “Risk Factors—Strategic Risks” in Citigroup’s 2017 Annual Report on Form 10-K.
| | | In billions of dollars | ICG loans(1) | GCB loans | Other funded(2) | Unfunded(3) | Net MTM on derivatives/repos(4) | Total hedges (on loans and CVA) | Investment securities(5) | Trading account assets(6) | Total as of 3Q18 | Total as of 2Q18 | Total as of 3Q17 | Total as a % of Citi as of 3Q18 | ICG loans(1) | GCB loans | Other funded(2) | Unfunded(3) | Net MTM on derivatives/repos(4) | Total hedges (on loans and CVA) | Investment securities(5) | Trading account assets(6) | Total as of 1Q19 | Total as of 4Q18 | Total as of 1Q18 | Total as a % of Citi as of 1Q19 |
| United Kingdom | $ | 40.3 |
| $ | — |
| $ | 8.3 |
| $ | 62.1 |
| $ | 11.6 |
| $ | (3.4 | ) | $ | 5.6 |
| $ | (0.8 | ) | $ | 123.7 |
| $ | 125.8 |
| $ | 110.2 |
| 7.7 | % | $ | 41.1 |
| $ | — |
| $ | 4.9 |
| $ | 62.9 |
| $ | 16.5 |
| $ | (4.4 | ) | $ | 4.9 |
| $ | (3.6 | ) | $ | 122.3 |
| $ | 111.6 |
| $ | 125.7 |
| 7.5 | % |
| Mexico | 9.9 |
| 26.8 |
| 0.3 |
| 7.9 |
| 0.9 |
| (0.7 | ) | 12.4 |
| 4.4 |
| 61.9 |
| 60.2 |
| 62.8 |
| 3.9 |
| 10.0 |
| 25.2 |
| 0.3 |
| 8.1 |
| 0.5 |
| (0.7 | ) | 13.7 |
| 6.3 |
| 63.4 |
| 59.6 |
| 63.9 |
| 3.9 |
|
| Hong Kong | 16.8 |
| 12.3 |
| 0.8 |
| 6.9 |
| 1.6 |
| (0.2 | ) | 6.6 |
| 1.1 |
| 45.9 |
| 45.1 |
| 40.8 |
| 2.9 |
| 17.7 |
| 13.2 |
| 0.8 |
| 8.2 |
| 1.1 |
| (0.4 | ) | 7.1 |
| 2.6 |
| 50.3 |
| 48.1 |
| 45.9 |
| 3.1 |
|
| Singapore | 13.3 |
| 12.3 |
| 0.4 |
| 5.1 |
| 1.6 |
| (0.2 | ) | 7.9 |
| 0.6 |
| 41.0 |
| 41.2 |
| 43.8 |
| 2.6 |
| 12.2 |
| 12.7 |
| 0.2 |
| 4.7 |
| 1.1 |
| (0.2 | ) | 8.6 |
| 1.7 |
| 41.0 |
| 40.7 |
| 43.0 |
| 2.5 |
|
| Korea | 2.1 |
| 19.0 |
| 0.2 |
| 2.8 |
| 1.2 |
| (1.1 | ) | 8.8 |
| 0.7 |
| 33.7 |
| 35.0 |
| 34.2 |
| 2.1 |
| 1.9 |
| 18.1 |
| 0.2 |
| 2.4 |
| 1.5 |
| (0.4 | ) | 9.5 |
| 0.5 |
| 33.7 |
| 33.8 |
| 35.8 |
| 2.1 |
|
| Ireland | 12.2 |
| — |
| 0.8 |
| 16.7 |
| 0.5 |
| — |
| — |
| 0.9 |
| 31.1 |
| 31.3 |
| 28.8 |
| 1.9 |
| 13.3 |
| — |
| 0.8 |
| 18.2 |
| 0.4 |
| — |
| — |
| 0.8 |
| 33.5 |
| 33.7 |
| 32.6 |
| 2.1 |
|
| India | 4.1 |
| 6.7 |
| 0.8 |
| 5.1 |
| 2.6 |
| (0.8 | ) | 7.8 |
| 0.9 |
| 27.2 |
| 27.6 |
| 28.7 |
| 1.7 |
| 4.8 |
| 7.1 |
| 0.8 |
| 5.7 |
| 2.1 |
| (0.7 | ) | 9.5 |
| 2.7 |
| 32.0 |
| 30.2 |
| 31.7 |
| 2.0 |
|
| Brazil | 12.8 |
| — |
| — |
| 3.0 |
| 4.5 |
| (1.0 | ) | 3.2 |
| 3.4 |
| 25.9 |
| 24.4 |
| 28.0 |
| 1.6 |
| 12.7 |
| — |
| — |
| 2.9 |
| 5.3 |
| (0.9 | ) | 3.5 |
| 3.3 |
| 26.8 |
| 26.0 |
| 26.9 |
| 1.7 |
|
| Australia | 5.1 |
| 10.0 |
| — |
| 6.2 |
| 1.0 |
| (0.4 | ) | 1.8 |
| 0.4 |
| 24.1 |
| 23.2 |
| 27.0 |
| 1.5 |
| 5.6 |
| 9.9 |
| 0.2 |
| 6.8 |
| 1.2 |
| (0.4 | ) | 1.5 |
| (1.9 | ) | 22.9 |
| 23.5 |
| 24.6 |
| 1.4 |
|
| Germany | 0.1 |
| — |
| 0.1 |
| 4.1 |
| 3.7 |
| (3.4 | ) | 9.3 |
| 5.8 |
| 19.7 |
| 16.8 |
| 18.6 |
| 1.2 |
| 0.4 |
| — |
| 0.1 |
| 6.1 |
| 3.6 |
| (3.4 | ) | 9.1 |
| 6.3 |
| 22.2 |
| 17.4 |
| 14.7 |
| 1.4 |
|
| Taiwan | | 5.1 |
| 8.8 |
| 0.1 |
| 1.1 |
| 0.5 |
| (0.1 | ) | 1.2 |
| 0.9 |
| 17.6 |
| 17.4 |
| 20.3 |
| 1.1 |
|
| China | 7.4 |
| 4.7 |
| 0.4 |
| 1.9 |
| 1.5 |
| (0.5 | ) | 2.8 |
| 0.6 |
| 18.8 |
| 19.5 |
| 20.8 |
| 1.2 |
| 6.4 |
| 4.7 |
| 0.4 |
| 1.7 |
| 0.8 |
| (0.4 | ) | 4.4 |
| (0.6 | ) | 17.4 |
| 18.0 |
| 19.8 |
| 1.1 |
|
| Japan | 2.9 |
| 0.1 |
| 0.1 |
| 2.5 |
| 4.4 |
| (1.4 | ) | 4.7 |
| 5.1 |
| 18.4 |
| 15.9 |
| 18.8 |
| 1.1 |
| |
| Taiwan | 5.1 |
| 8.9 |
| 0.1 |
| 1.1 |
| 0.4 |
| — |
| 1.1 |
| 1.1 |
| 17.8 |
| 19.0 |
| 18.5 |
| 1.1 |
| |
| Canada | 2.3 |
| 0.7 |
| 0.5 |
| 7.4 |
| 2.3 |
| (0.3 | ) | 3.1 |
| 0.4 |
| 16.4 |
| 15.8 |
| 16.0 |
| 1.0 |
| 2.3 |
| 0.6 |
| 0.4 |
| 6.8 |
| 2.4 |
| (0.4 | ) | 2.7 |
| 0.5 |
| 15.3 |
| 16.0 |
| 15.6 |
| 0.9 |
|
| Poland | 3.7 |
| 2.0 |
| 0.1 |
| 3.8 |
| 0.1 |
| (0.1 | ) | 4.0 |
| 0.8 |
| 14.4 |
| 13.0 |
| 13.6 |
| 0.9 |
| 3.8 |
| 1.9 |
| 0.1 |
| 3.9 |
| 0.1 |
| (0.1 | ) | 4.3 |
| 1.3 |
| 15.3 |
| 13.2 |
| 14.7 |
| 0.9 |
|
| Jersey | 6.6 |
| — |
| 0.3 |
| 3.4 |
| — |
| — |
| — |
| — |
| 10.3 |
| 10.0 |
| 4.5 |
| 0.6 |
| |
| Japan | | 2.6 |
| — |
| 0.1 |
| 2.7 |
| 3.7 |
| (1.5 | ) | 6.2 |
| 0.6 |
| 14.4 |
| 17.6 |
| 18.4 |
| 0.9 |
|
| United Arab Emirates | 5.6 |
| 1.6 |
| 0.1 |
| 2.5 |
| 0.1 |
| (0.1 | ) | — |
| — |
| 9.8 |
| 10.2 |
| 6.7 |
| 0.6 |
| 7.1 |
| 1.5 |
| 0.1 |
| 3.5 |
| 0.2 |
| (0.1 | ) | — |
| 0.1 |
| 12.4 |
| 9.6 |
| 11.0 |
| 0.8 |
|
| Malaysia | 1.8 |
| 4.7 |
| 0.3 |
| 1.1 |
| 0.2 |
| (0.1 | ) | 1.3 |
| 0.3 |
| 9.6 |
| 9.7 |
| 9.1 |
| 0.6 |
| 1.8 |
| 4.6 |
| 0.3 |
| 1.2 |
| 0.1 |
| (0.1 | ) | 1.4 |
| 0.7 |
| 10.0 |
| 10.0 |
| 10.0 |
| 0.6 |
|
| Jersey | | 7.0 |
| — |
| 0.3 |
| 2.7 |
| 0.1 |
| (0.2 | ) | — |
| — |
| 9.9 |
| 10.4 |
| 9.0 |
| 0.6 |
|
| Thailand | 1.2 |
| 2.4 |
| — |
| 1.5 |
| — |
| — |
| 1.4 |
| 0.7 |
| 7.2 |
| 6.9 |
| 7.0 |
| 0.4 |
| 0.8 |
| 2.5 |
| 0.1 |
| 1.6 |
| — |
| — |
| 1.4 |
| 0.4 |
| 6.8 |
| 7.4 |
| 7.4 |
| 0.4 |
|
| Indonesia | 2.2 |
| 1.0 |
| 0.1 |
| 1.3 |
| 0.1 |
| (0.1 | ) | 1.1 |
| 0.1 |
| 5.8 |
| 6.2 |
| 6.2 |
| 0.4 |
| 2.3 |
| 1.0 |
| — |
| 1.5 |
| — |
| (0.1 | ) | 1.2 |
| 0.2 |
| 6.1 |
| 6.3 |
| 6.5 |
| 0.4 |
|
| Philippines | | 0.6 |
| 1.3 |
| 0.1 |
| 0.4 |
| 1.3 |
| — |
| 1.8 |
| 0.4 |
| 5.9 |
| 5.3 |
| 4.3 |
| 0.4 |
|
| Russia | | 2.1 |
| 0.9 |
| — |
| 0.8 |
| 0.4 |
| (0.1 | ) | 0.7 |
| (0.1 | ) | 4.7 |
| 4.6 |
| 5.5 |
| 0.3 |
|
| Luxembourg | — |
| — |
| — |
| — |
| 0.5 |
| (0.3 | ) | 4.1 |
| 0.8 |
| 5.1 |
| 4.9 |
| 6.1 |
| 0.3 |
| — |
| — |
| — |
| — |
| 0.8 |
| (0.3 | ) | 3.2 |
| 0.3 |
| 4.0 |
| 4.9 |
| 5.7 |
| 0.2 |
|
| South Africa | 1.8 |
| — |
| — |
| 1.4 |
| 0.5 |
| (0.1 | ) | 1.5 |
| (0.1 | ) | 5.0 |
| 5.3 |
| 4.3 |
| 0.3 |
| 1.2 |
| — |
| 0.1 |
| 0.9 |
| 0.2 |
| (0.1 | ) | 1.6 |
| — |
| 3.9 |
| 4.5 |
| 4.7 |
| 0.2 |
|
| Philippines | 0.8 |
| 1.2 |
| — |
| 0.4 |
| 1.1 |
| (0.1 | ) | 1.4 |
| 0.1 |
| 4.9 |
| 5.2 |
| 3.6 |
| 0.3 |
| |
| Russia | 1.8 |
| 0.9 |
| — |
| 0.8 |
| 0.1 |
| (0.1 | ) | 0.7 |
| (0.1 | ) | 4.1 |
| 4.6 |
| 5.0 |
| 0.3 |
| |
| Italy | 0.2 |
| — |
| — |
| 2.3 |
| 5.0 |
| (4.3 | ) | — |
| 0.5 |
| 3.7 |
| 3.2 |
| 3.1 |
| 0.2 |
| |
| Argentina | | 1.7 |
| — |
| — |
| 0.1 |
| 0.6 |
| — |
| — |
| 0.9 |
| 3.3 |
| 3.4 |
| 4.3 |
| 0.2 |
|
| Total | | | 36.4 | % | | | 36.7 | % |
| |
| (1) | ICG loans reflect funded corporate loans and private bank loans, net of unearned income. As of September 30, 2018,March 31, 2019, private bank loans in the table above totaled $24.5$26.5 billion, concentrated in Hong Kong ($7.08.2 billion), Singapore ($6.8 billion) and the U.K. ($6.16.4 billion). |
| |
| (2) | Other funded includes other direct exposure such as accounts receivable, loans HFS, other loans in Corporate/Other and investments accounted for under the equity method. |
| |
| (3) | Unfunded exposure includes unfunded corporate lending commitments, letters of credit and other contingencies. |
| |
| (4) | Net mark-to-market counterparty risk on OTC derivatives and securities lending/borrowing transactions (repos). Exposures are shown net of collateral and inclusive of CVA. Includes margin loans. |
| |
| (5) | Investment securities include securities available-for-sale, recorded at fair market value, and securities held-to-maturity, recorded at historical cost. |
| |
| (6) | Trading account assets are shown on a net basis and include issuer risk on cash products and derivative exposure where the underlying reference entity/issuer is located in that country. |
Venezuela
Citi continues to monitor the political and economic environment and uncertainties in Venezuela. As of December 31, 2018, Citi’s net investment in its on-shore Venezuelan operations was approximately $40 million. In addition, in early 2015, the Central Bank of Venezuela (BCV) sold gold held at the Bank of England to a Citi entity in the U.K., giving Citi ownership and full legal title to the gold for $1.6 billion. Simultaneously, the BCV entered into forward purchase agreements (collectively, the Agreements) with Citi, requiring the BCV to purchase the same quantity of gold from Citi on predetermined dates. The next and final such date will be in April 2020 at which time the BCV will be required to purchase the remaining amount of gold from Citi under the terms of the Agreements. Citi believes it is protected against market and credit risk related to the Agreements. The Agreements were accounted for as a financing on Citi’s books under ASC 470-40.
Potential Exit of U.K. from EU
As widely reported, the U.K. and EU agreed to extend the U.K.’s scheduled exit from the EU to October 31, 2019. For additional information regarding the U.K’s potential exit from the EU, see “Risk Factors—Strategic Risk” and “Strategic Risk—Potential Exit from U.K. from EU” in Citi’s 2018 Annual Report on Form 10-K.
INCOME TAXES
Deferred Tax Assets
For additional information on Citi’s deferred tax assets (DTAs), see “Risk Factors—Strategic Risks,” “Significant Accounting Policies and Significant Estimates—Income Taxes” and Notes 1 and 9 to the Consolidated Financial Statements in Citi’s 20172018 Annual Report on Form 10-K.
At September 30, 2018,March 31, 2019, Citigroup had recorded net DTAs of approximately $23.0$22.8 billion, an increasea decrease of $0.1 billion from June 30, 2018 and an increase of $0.5 billion from December 31, 2017.2018. The increasedecrease for the quarter was primarily driven by lossesgains in Other comprehensive income, partially offset by earnings. The increase for the nine months was primarily driven by losses in Other comprehensive income and adoption of ASU 2016-16 (see Note 1 to the Consolidated Financial Statements), partially offset by earnings..
The table below summarizes Citi’s net DTAs balance. balance:
|
| | | | | | |
| Jurisdiction/Component | DTAs balance |
| In billions of dollars | March 31,
2019 | December 31, 2018 |
| Total U.S. | $ | 20.6 |
| $ | 20.7 |
|
| Total foreign | 2.2 |
| 2.2 |
|
| Total | $ | 22.8 |
| $ | 22.9 |
|
Of Citi’s total net DTAs of $22.8 billion as of September 30, 2018, those arising fromMarch 31, 2019, $10.8 billion (primarily relating to net operating losses, foreign tax creditcredits and general business credit carry-forwards, are 100%which Citi reduced by $0.2 billion in the current quarter) was deducted in calculating Citi’s regulatory capital, whilecapital. Net DTAs arisingresulting from temporary differences are deducted from regulatory capital if in excess of the 10%/15% limitations.
Despite the $0.5 billion increase in net DTAs from December 31, 2017, Citi was able to reduce the amount of DTAs arising from net operating losses, foreign tax credits and general business credit carry-forwards by $0.7 billion, thereby reducing the amount of DTAs that was excluded from Common Equity Tier 1 Capital from $12.3 billion to $11.6 billion as of September 30, 2018. There were no DTAs in excess of the 10%/15% limitations as of September 30, 2018, (see “Capital Resources” above). Thus, approximately $11.4For the quarter ended March 31, 2019, Citi did not have any such DTAs. Accordingly, the remaining $12.0 billion of net DTAs as of March 31, 2019 was not deducted in calculating regulatory capital pursuant to Basel III standards, as of September 30, 2018, and was appropriately risk weighted as perunder those rules.
|
| | | | | | |
| Jurisdiction/Component | DTAs balance |
| In billions of dollars | September 30,
2018 | December 31, 2017 |
| Total U.S. | $ | 20.4 |
| $ | 19.9 |
|
| Total foreign | 2.6 |
| 2.6 |
|
| Total | $ | 23.0 |
| $ | 22.5 |
|
Effective Tax Rate
Citi’s effective tax rate for the thirdfirst quarter of 20182019 was 24.1%21.2%, as compared with 31.1%to 23.7% in the third quarter of 2017.prior-year period. The decrease in21.2% was lower than the roughly 23% expected effective tax rate was primarilyfor 2019 due to thecertain discrete items.The 23% expected 2019 rate is slightly lower U.S. federal statutory tax rate pursuantthan 2018 due to Tax Reform.changes in Citi’s earnings mix.
SEC Staff Accounting Bulletin 118
Citi’s third quarter of 2018 tax provision did not include any changes to Citi’s provisional income tax estimates recorded in the fourth quarter of 2017. The U.S. Treasury issued certain U.S. tax reform guidance through September 30, 2018 and it is anticipated that additional guidance will be issued by the end of 2018. Citi expects to complete its analysis within the one-year measurement period and record final adjustments to the provisional income tax estimates during the fourth quarter of 2018.
FUTURE APPLICATION OF ACCOUNTING STANDARDS
Accounting for Financial Instruments—Credit Losses
In June 2016, the Financial Accounting Standards Board (FASB) issued ASU No. 2016-13, Financial Instruments—Credit Losses(Topic 326). The ASU introduces a new credit loss methodology, the Current Expected Credit Losses (CECL) methodology, which requires earlier recognition of credit losses, while also providing additional transparency about credit risk.
The CECL methodology utilizes a lifetime “expected credit loss” measurement objective for the recognition of credit losses for loans, held-to-maturity debt securities and other receivables measured at amortized cost at the time the financial asset is originated or acquired. The expectedallowance for credit losses (ECL) areis adjusted each period for changes in expected lifetime credit losses. This methodology replaces the multiple existing impairment methods in current GAAP, which generally require that a loss be incurred before it is recognized. Within the life cycle of a loan or other financial asset, the ASU will generally result in the earlier recognition of the provision for credit losses and the related allowance for credit losses than current practice. For available-for-sale debt securities that Citi intends to hold and where fair value is less than cost, credit-related impairment, if any, will be recognized through an allowance for credit losses and adjusted each period for changes in credit risk.
The CECL methodology represents a significant change from existing GAAP and may result in material changes to the Company’s accounting for financial instruments. The Company is evaluating the effect that ASU 2016-13 will have on its Consolidated Financial Statements and related disclosures. The impact of the ASU will, among other things, depend upon the state of the economy, forecasted macroeconomic conditions and the nature of Citi’s portfolios at the date of adoption. Based on aan updated preliminary analysis performed in 2018the first quarter of 2019 and the environmentforecasts of macroeconomic conditions and portfoliosexposures at that time, the overall impact iswas estimated to be an approximate 10%20% to 20%30% increase in credit loss reserves. However, there are still some implementation questions to be resolved by the FASB that could affect the estimated impact, including (i) the amounts and types of recoveries that can be included in expected credit loss estimates and (ii) whether recovery inputs can be discounted under a non-discounted cash flow approach to estimating expected credit losses.
reserves. The ASU will be effective for Citi as of January 1, 2020. This increase would be reflected as a decrease to opening Retained earnings, net of income taxes, at January 1, 2020.
Implementation efforts are underway, including model development, fulfillment of additional data needs for new disclosures and reporting requirements, and drafting of accounting policies. Substantial progress has been made in model development. Model validations and user acceptance testing commenced in the first quarter of 2019, with parallel runs to begin in the third quarter of 2019. The Company intends to utilize a single macroeconomic scenario in estimating expected credit losses. Reasonable and supportable forecast periods and methods to revert to historical averages to arrive at lifetime expected credit losses vary by product.
For additional information on regulatory capital treatment, see “Capital Resources—Regulatory Capital Standards Developments-Regulatory Capital Treatment—Implementation and Transition of the Current Expected Credit
Losses (CECL) Methodology” in the First Quarter ofCiti’s 2018 Annual Report on Form 10-Q.10-K.
Lease Accounting
In February 2016, the FASB issued ASU No. 2016-02, Leases (Topic 842), which is intended to increase transparency and comparability of accounting for lease transactions. The ASU will require lessees to recognize leases on the balance sheet as lease assets and lease liabilities and will require both quantitative and qualitative disclosures regarding key information about leasing arrangements. Lessor accounting is largely unchanged. The guidance is effective beginning January 1, 2019 and will be adopted prospectively with a cumulative adjustment to Retained earnings. The Company estimates that upon adoption, its Consolidated Balance Sheet
will have an approximate $5 billion increase in assets and liabilities. Additionally, the Company estimates an approximate $140 million increase in retained earnings due to the cumulative effect of recognizing previously deferred gains on sale/leaseback transactions.
Subsequent Measurement of Goodwill
In January 2017, the FASB issued ASU No. 2017-04, Intangibles—Goodwill and Other (Topic 350): Simplifying the Test for Goodwill Impairment. The ASU simplifies the subsequent measurement of goodwill impairment by eliminating the requirement to calculate the implied fair value of goodwill (i.e., the current Step 2 of the goodwill impairment test) to measure a goodwill impairment charge. Under the ASU, the impairment test is the comparison of the fair value of a reporting unit with its carrying amount (the current Step 1), with the impairment charge being the deficit in fair value but not exceeding the total amount of goodwill allocated to that reporting unit. The simplified one-step impairment test applies to all reporting units (including those with zero or negative carrying amounts).
The ASU will be effective for Citi as of January 1, 2020. The impact of the ASU will depend upon the performance of Citi’s reporting units and the market conditions impacting the fair value of each reporting unit going forward.
Fair Value Measurement
In August 2018, the FASB issued ASU No. 2018-13, Fair Value Measurement (Topic 820): Disclosure Framework—Changes to the Disclosure Requirements for Fair Value Measurement. The amendments modify certain disclosure requirements for fair value measurements and are effective January 1, 2020, with early adoption permitted. Adoption of this standard is not expected to have a material impact on the Company.
See Note 1 to the Consolidated Financial Statements for a discussion of “Accounting Changes.”
DISCLOSURE CONTROLS AND PROCEDURES
Citi’s disclosure controls and procedures are designed to ensure that information required to be disclosed under the Securities Exchange Act of 1934, as amended, is recorded, processed, summarized and reported within the time periods specified in the SEC’s rules and forms, including without limitation that information required to be disclosed by Citi in its SEC filings is accumulated and communicated to management, including the Chief Executive Officer (CEO) and Chief Financial Officer (CFO), as appropriate, to allow for timely decisions regarding required disclosure.
Citi’s Disclosure Committee assists the CEO and CFO in their responsibilities to design, establish, maintain and evaluate the effectiveness of Citi’s disclosure controls and procedures. The Disclosure Committee is responsible for, among other things, the oversight, maintenance and implementation of the disclosure controls and procedures, subject to the supervision and oversight of the CEO and CFO.
Citi’s management, with the participation of its CEO and CFO, has evaluated the effectiveness of Citigroup’s disclosure controls and procedures (as defined in Rule 13a-15(e) under the Securities Exchange Act of 1934) as of September 30, 2018March 31, 2019 and, based on that evaluation, the CEO and CFO have concluded that at that date, Citigroup’s disclosure controls and procedures were effective.
DISCLOSURE PURSUANT TO SECTION 219 OF THE IRAN THREAT REDUCTION AND SYRIA HUMAN RIGHTS ACT
Pursuant to Section 219 of the Iran Threat Reduction and Syria Human Rights Act of 2012, which added Section 13(r) to the Securities Exchange Act of 1934, as amended, Citi is required to disclose in its annual or quarterly reports, as applicable, whether it or any of its affiliates knowingly engaged in certain activities, transactions or dealings relating to Iran or with individuals or entities that are subject to sanctions under U.S. law. Disclosure is generally required even where the activities, transactions or dealings were conducted in compliance with applicable law. Citi disclosed reportable activities pursuant to Section 219 in the second quarter of 2018 in the Second Quarter of 2018 Form 10-Q.
During the thirdfirst quarter of 2018, Bank Handlowy w Warszawie S.A.,2019, as a result of an operational error, the Hungarian branch of Citibank Europe plc, a subsidiary located in Poland,of Citibank, acting as the beneficiary bank, inadvertently processed a funds transfer involvingdomestic payment within Hungary for a fee related to the operating expenses of the Iranian Embassy in Poland.Budapest. The value of the funds transfer was EUR 100.00 (approximately USD 116.54). In addition, Citibank N.A., India Branch, processed a payment involving the Consulate General of Iran in India. Theaggregate value of the payment was INR 8,200.00HUF 135,636.00 (approximately USD 111.62)489.79). These payments wereThe transaction did not result in any revenue for visa- and passport-related fees respectively, which are permissible underCiti. The transaction was voluntarily self-disclosed to the travel exemption in the Iranian Transactions and Sanctions Regulations. Citibank realized nominal fees for the processingU.S. Office of these payments. Foreign Asset Control (OFAC).
FORWARD-LOOKING STATEMENTS
Certain statements in this Form 10-Q, including but not limited to statements included within the Management’s Discussion and Analysis of Financial Condition and Results of Operations, are “forward-looking statements” within the meaning of the rules and regulations of the SEC. In addition, Citigroup also may make forward-looking statements in its other documents filed or furnished with the SEC, and its management may make forward-looking statements orally to analysts, investors, representatives of the media and others.
Generally, forward-looking statements are not based on historical facts but instead represent Citigroup’s and its management’s beliefs regarding future events. Such statements may be identified by words such as believe, expect, anticipate, intend, estimate, may increase, may fluctuate, target, illustrative, and similar expressions or future or conditional verbs such as will, should, would and could.
Such statements are based on management’s current expectations and are subject to risks, uncertainties and changes in circumstances. Actual results and capital and other financial conditions may differ materially from those included in these statements due to a variety of factors, including without limitation (i) the precautionary statements included within each individual business’s discussion and analysis of its results of operations above and in Citi’s 20172018 Annual Report on Form 10-K, First Quarter of 2018 Form 10-Q and Second Quarter of 2018 Form 10-Q;10-K; (ii) the factors listed and described under “Risk Factors” in Citi’s 20172018 Annual Report on Form 10-K; and (iii) the risks and uncertainties summarized below:
the potential impact on Citi’s ability to return capital to common shareholders, consistent with its capital optimizationplanning efforts and targets, due to, among other things, regulatory approval, Citi’s results of operations, Citi’s ability to effectively managefinancial condition and effectiveness in managing its level of risk weightedrisk-weighted assets and GSIB surcharge, potential changes to the regulatory capital framework, the CCAR process and the results of regulatory stress tests, or any changes to the stress testing and CCAR requirements or process, such as the proposed integration of the annual stress testing requirements with ongoing regulatory capital requirements, including introduction of a firm-specific “stress capital buffer” (SCB), including as a result ofand any resulting year-to-year variability resulting fromin the SCB, and the impact on Citi’s estimated management buffer;buffer and the impact of incorporating CECL in future stress testing requirements;
the ongoing regulatory and other uncertainties and changes faced by financial institutions, including Citi, in the U.S. and globally, including, uncertaintiessuch as potential fiscal, monetary and regulatory changes from the U.S. Presidential administration and Congress, potential changes to various aspects of the regulatory capital framework and the terms of and other uncertainties resulting from the U.K.’s potential exit from the European Union, and the potential impact these uncertainties and changes could have on Citi’s businesses, results of operations, financial condition, strategy or organizational structure and compliance risks and costs;
Citi’s ability to utilize its remaining DTAs (including the foreign tax credit component of its DTAs) and thus reduce the
negative impact of the DTAs on Citi’s regulatory capital, including as a result of its ability to generate U.S. taxable income and by the provisions of and guidance issued in connection with Tax Reform;
the potential impact to Citi if its interpretation or application of the complex tax laws to which it is subject, such as withholding tax obligations and stamp and other transactional taxes, differs from those of the relevant governmental authorities;
Citi’s ability to achieve its expected results from ongoingits continued investments in its businesses and efficiency initiatives, includingsuch as revenue growth and expense savings, as part of Citi’s operational and financial objectives and targets, including as a result of factors that Citi cannot control;
the potential impact from declining sales and revenuesa deterioration in or other difficulties of any retailer or merchant with whom Citi has afailure to maintain Citi’s co-branding or private label credit card relationship, such asfor example Sears, including as a result of accelerated store closures, termination of a particular relationship,due to, among other things, external factors outside the control of either party to the relationship, such asincluding the general economic environment, declining sales and revenues or other operational difficulties of the retailer or merchant, termination of a particular relationship, or other factors, includingsuch as bankruptcies, liquidations, restructurings, consolidations andor other similar events, and the potential negative impact any such event could have on Citi retail services, including as a result of loss of revenues, higher cost of credit, impairment of purchased credit card relationships and contract-related intangibles or other losses;
the potential impact to Citi’s businesses, including funding costs, level and mix of deposits and other products and net interest revenues, from ongoing increases in interest rates;events;
the potential impact to Citi’s businesses, credit costs, revenues or other results of operations and financial condition as a result of macroeconomic and geopolitical challenges and uncertainties and volatility, including, among others, potential policy and/or regulatory changes arising from a new administrationweakening economic conditions in Mexico, the implementation of protectionist trade or other related policies by the U.S. and/or Citi’s other target markets, changes in U.S. trade policies and resulting retaliatory measures from other countries, geopolitical tensions and conflicts, changes in governmental fiscal and monetary actions, or expected actions, such as any balance sheet normalization program implemented byinterest rate and other policies, and the Federal Reserve Boardterms or other central banks, any agreement, or lack thereof, forconditions regarding the U.K. to withdraw’s potential withdrawal from the European Union, or geopolitical disputes;Union;
the various risks faced by Citi as a result of its presence in the emerging markets, including, among others, sovereign volatility, regulatory changes and political events, foreign exchange controls, limitations on foreign investment, sociopolitical instability (including from hyper-inflation)hyperinflation), fraud, nationalization or loss of licenses, business restrictions, sanctions or asset freezes, potential criminal charges, closure of branches or subsidiaries and confiscation of assets, as well as the resulting increased compliance, regulatory and legal risks and costs;
Citi’s ability in its resolution plan submissions to address any deficiencies identified or future guidance, including any final 2019 resolution plan guidance, provided by the Federal Reserve Board and FDIC;
the potential impact on Citi’s performance and the performance of its individual businesses, including its competitive position and ability to effectively manage its businesses and continue to execute its strategies, if Citi is
unable to hireattract, retain and retainmotivate highly qualified employees for any reason;employees;
Citi’s ability to effectively compete with U.S. and non-U.S. financial services companies and others;others, including as a result of emerging technologies;
the possible discontinuance of LIBOR or any other interest rate benchmark and the adverse consequences it could have for market participants, including Citi;
the potential impact of credit risk and concentrations of risk such as credit and market risk arising from the size and volume of Citi’s transactions with counterparties in the public sector, including the U.S. government and its agencies, or in the financial services industry, on Citi’s results of operations;operations, whether due to a default of or deterioration involving consumer, corporate or public sector counterparties in the U.S. or in various countries and jurisdictions globally;
the potential impacts on Citi’s liquidity and/or costs of funding as a result of external factors, including, among others, the competitive environment for U.S. retail deposits, market disruptions and governmental fiscal and monetary policies as well as regulatory changes or negative investor perceptions of Citi’s creditworthiness;
the impact of ratings downgrades of Citi or one or more of its more significant subsidiaries or issuing entities on Citi’s funding and liquidity as well as the results of operations of certain of its businesses;
the potential impact to Citi from a disruption of its operational systems, including as a result of, among other things, human error, fraud or malice, accidental technological failure, electrical or telecommunication outages or failure of computer servers, or other similar damage to Citi’s property or assets, or failures by third parties with whom Citi does business, as well as disruptions in the operations of Citi’s clients, customers or other third parties;
the increasing risk of continually evolving, sophisticated cybersecurity risksactivities faced by financial institutions and others, including Citi and third parties with whom it does business, and others (suchsuch as, theft of funds oramong other things, theft, loss, misuse or disclosure of confidential or proprietary client, customer corporate or networkcorporate information or assets and other attempts by unauthorized parties to disrupta disruption of computer andor network systems),systems, and the potential impact from such risks, including, among others, reputational damage, with clients, customers and others, lostregulatory penalties, loss of revenues, additional costs (including credit, remediation and other costs), regulatory penalties and inquiries, legal exposure to litigation and other financial losses;
the potential impact of incorrect assumptions or estimates in Citi’s financial statements or the impact of ongoing changes to financial accounting and reporting standards or interpretations, on how Citi records and reports its financial condition and results of operations;
the potential impact to Citi’s results of operations and/or regulatory capital and capital ratios if Citi’s risk management process,and mitigation processes, strategies or models, including those related to its ability to manage and aggregate data, are deficient or ineffective, require refinement, modification or enhancement or any related approval is withdrawn by Citi’s U.S. banking regulators;
the potential impact to Citi of ongoing implementation and interpretation of regulatory changes and requirements in the U.S. and globally, such asincluding on Citi’s compliance risks and costs, including reputational and legal risks as
well as the impact of any remediation and other financial costs, such as penalties and fines; and
the potential outcomes of the extensive legal and regulatory proceedings, as well as regulatory examinations, investigations and other inquiries, to which Citi is or may be subject at any given time, particularly given the increased focus on conduct risk and the severity of the remedies sought and potential collateral consequences to Citi arising from such outcomes.
Any forward-looking statements made by or on behalf of Citigroup speak only as to the date they are made, and Citi does not undertake to update forward-looking statements to reflect the impact of circumstances or events that arise after the date the forward-looking statements were made.
FINANCIAL STATEMENTS AND NOTES TABLE OF CONTENTS
|
| |
| CONSOLIDATED FINANCIAL STATEMENTS | |
Consolidated Statement of Income (Unaudited)— For the Three and Nine Months Ended September 30,March 31, 2019 and 2018 and 2017 | |
Consolidated Statement of Comprehensive Income (Unaudited)—For the Three and Nine Months Ended September 30,March 31, 2019 and 2018 and 2017 | |
Consolidated Balance Sheet—September 30, 2018March 31, 2019 (Unaudited) and December 31, 20172018 | |
Consolidated Statement of Changes in Stockholders’ Equity (Unaudited)—For the Three and Nine Months Ended September 30,March 31, 2019 and 2018 and 2017 | |
Consolidated Statement of Cash Flows (Unaudited)— For the NineThree Months Ended September 30,March 31, 2019 and 2018 and 2017 | |
|
| |
| NOTES TO CONSOLIDATED FINANCIAL STATEMENTS (UNAUDITED) | |
| Note 1—Basis of Presentation and Accounting Changes | |
| Note 2—Discontinued Operations and Significant Disposals | |
| Note 3—Business Segments | |
| Note 4—Interest Revenue and Expense | |
Note 5—Commissions and Fees; Administration and Other Fiduciary Fees | |
| Note 6—Principal Transactions | |
| Note 7—Incentive Plans | |
| Note 8—Retirement Benefits | |
| Note 9—Earnings per Share | |
Note 10—Federal Funds, Securities Borrowed, Loaned and
Subject to Repurchase Agreements | |
| Note 11—Brokerage Receivables and Brokerage Payables | |
| Note 12—Investments | |
|
| |
| | |
| Note 13—Loans | |
| Note 14—Allowance for Credit Losses | |
| Note 15—Goodwill and Intangible Assets | |
| Note 16—Debt | |
Note 17—Changes in Accumulated Other Comprehensive
Income (Loss) (AOCI) | |
| Note 18—Securitizations and Variable Interest Entities | |
| Note 19—Derivatives Activities | |
| Note 20—Fair Value Measurement | |
| Note 21—Fair Value Elections | |
| Note 22—Guarantees, Leases and Commitments | |
| Note 23—Contingencies | |
| Note 24—Condensed Consolidating Financial Statements | |
CONSOLIDATED FINANCIAL STATEMENTS
|
| | |
| CONSOLIDATED STATEMENT OF INCOME (UNAUDITED) | | Citigroup Inc. and Subsidiaries |
| | | | Three Months Ended September 30, | Nine Months Ended September 30, | Three Months Ended March 31, |
| In millions of dollars, except per share amounts | 2018 | 2017 | 2018 | 2017 | 2019 | 2018 |
| Revenues | | | |
| |
| |
| Interest revenue | $ | 18,170 |
| $ | 15,914 |
| $ | 52,052 |
| $ | 45,729 |
| $ | 19,076 |
| $ | 16,332 |
|
| Interest expense | 6,368 |
| 4,379 |
| 17,413 |
| 11,981 |
| 7,317 |
| 5,160 |
|
| Net interest revenue | $ | 11,802 |
| $ | 11,535 |
| $ | 34,639 |
| $ | 33,748 |
| $ | 11,759 |
| $ | 11,172 |
|
| Commissions and fees | $ | 2,803 |
| $ | 3,241 |
| $ | 8,944 |
| $ | 9,552 |
| $ | 2,926 |
| $ | 3,030 |
|
| Principal transactions | 2,566 |
| 2,248 |
| 8,006 |
| 7,985 |
| 2,804 |
| 3,242 |
|
| Administration and other fiduciary fees | 911 |
| 929 |
| 2,750 |
| 2,672 |
| 839 |
| 905 |
|
| Realized gains on sales of investments, net | 69 |
| 213 |
| 341 |
| 626 |
| 130 |
| 170 |
|
| Impairment losses on investments | | | |
| |
| |
| Gross impairment losses | (70 | ) | (15 | ) | (113 | ) | (47 | ) | (8 | ) | (28 | ) |
| Net impairment losses recognized in earnings | $ | (70 | ) | $ | (15 | ) | $ | (113 | ) | $ | (47 | ) | $ | (8 | ) | $ | (28 | ) |
| Other revenue | $ | 308 |
| $ | 268 |
| $ | 1,163 |
| $ | 404 |
| $ | 126 |
| $ | 381 |
|
| Total non-interest revenues | $ | 6,587 |
| $ | 6,884 |
| $ | 21,091 |
| $ | 21,192 |
| $ | 6,817 |
| $ | 7,700 |
|
| Total revenues, net of interest expense | $ | 18,389 |
| $ | 18,419 |
| $ | 55,730 |
| $ | 54,940 |
| $ | 18,576 |
| $ | 18,872 |
|
| Provisions for credit losses and for benefits and claims | | | |
| |
| |
| Provision for loan losses | $ | 1,906 |
| $ | 2,146 |
| $ | 5,504 |
| $ | 5,487 |
| $ | 1,944 |
| $ | 1,803 |
|
| Policyholder benefits and claims | 26 |
| 28 |
| 73 |
| 81 |
| 12 |
| 26 |
|
| Provision (release) for unfunded lending commitments | 42 |
| (175 | ) | 66 |
| (190 | ) | |
| Provision for unfunded lending commitments | | 24 |
| 28 |
|
| Total provisions for credit losses and for benefits and claims | $ | 1,974 |
| $ | 1,999 |
| $ | 5,643 |
| $ | 5,378 |
| $ | 1,980 |
| $ | 1,857 |
|
| Operating expenses | | | |
| |
| |
| Compensation and benefits | $ | 5,319 |
| $ | 5,304 |
| $ | 16,578 |
| $ | 16,301 |
| $ | 5,658 |
| $ | 5,807 |
|
| Premises and equipment | 565 |
| 608 |
| 1,728 |
| 1,832 |
| 564 |
| 593 |
|
| Technology/communication | 1,806 |
| 1,764 |
| 5,361 |
| 5,122 |
| 1,720 |
| 1,758 |
|
| Advertising and marketing | 378 |
| 417 |
| 1,170 |
| 1,222 |
| 359 |
| 381 |
|
| Other operating | 2,243 |
| 2,324 |
| 7,111 |
| 7,423 |
| 2,283 |
| 2,386 |
|
| Total operating expenses | $ | 10,311 |
| $ | 10,417 |
| $ | 31,948 |
| $ | 31,900 |
| $ | 10,584 |
| $ | 10,925 |
|
| Income from continuing operations before income taxes | $ | 6,104 |
| $ | 6,003 |
| $ | 18,139 |
| $ | 17,662 |
| $ | 6,012 |
| $ | 6,090 |
|
| Provision for income taxes | 1,471 |
| 1,866 |
| 4,356 |
| 5,524 |
| 1,275 |
| 1,441 |
|
| Income from continuing operations | $ | 4,633 |
| $ | 4,137 |
| $ | 13,783 |
| $ | 12,138 |
| $ | 4,737 |
| $ | 4,649 |
|
| Discontinued operations | | | |
| |
| |
| Loss from discontinued operations | $ | (8 | ) | $ | (9 | ) | $ | (17 | ) | $ | (4 | ) | $ | (2 | ) | $ | (7 | ) |
| Benefit for income taxes | — |
| (4 | ) | (17 | ) | (2 | ) | |
| Loss from discontinued operations, net of taxes | $ | (8 | ) | $ | (5 | ) | $ | — |
| $ | (2 | ) | $ | (2 | ) | $ | (7 | ) |
| Net income before attribution of noncontrolling interests | $ | 4,625 |
| $ | 4,132 |
| $ | 13,783 |
| $ | 12,136 |
| $ | 4,735 |
| $ | 4,642 |
|
| Noncontrolling interests | 3 |
| (1 | ) | 51 |
| 41 |
| 25 |
| 22 |
|
| Citigroup’s net income | $ | 4,622 |
| $ | 4,133 |
| $ | 13,732 |
| $ | 12,095 |
| $ | 4,710 |
| $ | 4,620 |
|
Basic earnings per share(1) | | | |
| |
| |
| Income from continuing operations | $ | 1.74 |
| $ | 1.42 |
| $ | 5.04 |
| $ | 4.05 |
| $ | 1.88 |
| $ | 1.68 |
|
| Income from discontinued operations, net of taxes | — |
| — |
| — |
| — |
| — |
| — |
|
| Net income | $ | 1.73 |
| $ | 1.42 |
| $ | 5.04 |
| $ | 4.05 |
| $ | 1.88 |
| $ | 1.68 |
|
Weighted average common shares outstanding (in millions) | 2,479.8 |
| 2,683.6 |
| 2,524.1 |
| 2,729.3 |
| 2,340.4 |
| 2,561.6 |
|
Diluted earnings per share(1) | | |
| |
| |
| Income from continuing operations | $ | 1.74 |
| $ | 1.42 |
| $ | 5.04 |
| $ | 4.05 |
| $ | 1.87 |
| $ | 1.68 |
|
| Income (loss) from discontinued operations, net of taxes | — |
| — |
| — |
| — |
| — |
| — |
|
| Net income | $ | 1.73 |
| $ | 1.42 |
| $ | 5.04 |
| $ | 4.05 |
| $ | 1.87 |
| $ | 1.68 |
|
Adjusted weighted average common shares outstanding (in millions) | 2,481.4 |
| 2,683.7 |
| 2,525.5 |
| 2,729.5 |
| 2,342.4 |
| 2,563.0 |
|
| |
| (1) | Due to rounding, earnings per share on continuing operations and discontinued operations may not sum to earnings per share on net income. |
The Notes to the Consolidated Financial Statements are an integral part of these Consolidated Financial Statements.
|
| | |
| CONSOLIDATED STATEMENT OF COMPREHENSIVE INCOME | | Citigroup Inc. and Subsidiaries |
| (UNAUDITED) | | |
|
| | | | | | |
| | Three Months Ended March 31, |
| In millions of dollars | 2019 | 2018 |
| Citigroup’s net income | $ | 4,710 |
| $ | 4,620 |
|
| Add: Citigroup's other comprehensive income | | |
|
Net change in unrealized gains and losses on debt securities, net of taxes(1) | $ | 1,135 |
| $ | (1,058 | ) |
Net change in debt valuation adjustment (DVA), net of taxes(1) | (571 | ) | 128 |
|
| Net change in cash flow hedges, net of taxes | 286 |
| (222 | ) |
| Benefit plans liability adjustment, net of taxes | (64 | ) | 88 |
|
| Net change in foreign currency translation adjustment, net of taxes and hedges | 58 |
| 1,120 |
|
Net change in excluded component of fair value hedges, net of taxes
| 18 |
| (4 | ) |
| Citigroup’s total other comprehensive income | $ | 862 |
| $ | 52 |
|
| Citigroup’s total comprehensive income | $ | 5,572 |
| $ | 4,672 |
|
Add: Other comprehensive income (loss) attributable to noncontrolling interests | $ | (13 | ) | $ | 14 |
|
| Add: Net income attributable to noncontrolling interests | 25 |
| 22 |
|
| Total comprehensive income | $ | 5,584 |
| $ | 4,708 |
|
|
| | | | | | | | | | | | |
| | Three Months Ended September 30, | Nine Months Ended September 30, |
| In millions of dollars | 2018 | 2017 | 2018 | 2017 |
| Citigroup’s net income | $ | 4,622 |
| $ | 4,133 |
| $ | 13,732 |
| $ | 12,095 |
|
| Add: Citigroup's other comprehensive income | | |
| | |
Net change in unrealized gains and losses on investment securities, net of taxes(1)(2) | $ | (605 | ) | $ | (66 | ) | $ | (2,161 | ) | $ | 127 |
|
Net change in debt valuation adjustment (DVA), net of taxes(1) | (287 | ) | (123 | ) | 159 |
| (267 | ) |
| Net change in cash flow hedges, net of taxes | (74 | ) | 8 |
| (397 | ) | 123 |
|
| Benefit plans liability adjustment, net of taxes | 26 |
| (29 | ) | 415 |
| (176 | ) |
Net change in foreign currency translation adjustment, net of taxes and hedges | (221 | ) | 218 |
| (1,968 | ) | 2,179 |
|
Net change in excluded component of fair value hedges, net of taxes
| 10 |
| — |
| (22 | ) | — |
|
| Citigroup’s total other comprehensive income (loss) | $ | (1,151 | ) | $ | 8 |
| $ | (3,974 | ) | $ | 1,986 |
|
| Citigroup’s total comprehensive income | $ | 3,471 |
| $ | 4,141 |
| $ | 9,758 |
| $ | 14,081 |
|
Add: Other comprehensive income attributable to noncontrolling interests | $ | 8 |
| $ | 12 |
| $ | (35 | ) | $ | 82 |
|
| Add: Net income attributable to noncontrolling interests | 3 |
| (1 | ) | 51 |
| 41 |
|
| Total comprehensive income | $ | 3,482 |
| $ | 4,152 |
| $ | 9,774 |
| $ | 14,204 |
|
| |
| (1) | See Note 1 to the Consolidated Financial Statements. |
| |
(2) | For the three and nine months ended September 30,Statements in Citi’s 2018 respectively, amount represents the net change in unrealized gains and lossesAnnual Report on available-for-sale (AFS) debt securities. Effective January 1, 2018, the AFS category is eliminated for equity securities under ASU 2016-01.Form 10-K. |
The Notes to the Consolidated Financial Statements are an integral part of these Consolidated Financial Statements.
|
| | |
| CONSOLIDATED BALANCE SHEET | | Citigroup Inc. and Subsidiaries |
| | | | September 30, | | March 31, | |
| | 2018 | December 31, | 2019 | December 31, |
| In millions of dollars | (Unaudited) | 2017 | (Unaudited) | 2018 |
| Assets | |
| |
| |
| |
|
| Cash and due from banks (including segregated cash and other deposits) | $ | 25,727 |
| $ | 23,775 |
| $ | 24,448 |
| $ | 23,645 |
|
| Deposits with banks | 173,559 |
| 156,741 |
| 181,445 |
| 164,460 |
|
| Federal funds sold and securities borrowed and purchased under agreements to resell (including $178,442 and $132,949 as of September 30, 2018 and December 31, 2017, respectively, at fair value) | 280,941 |
| 232,478 |
| |
| Federal funds sold and securities borrowed and purchased under agreements to resell (including $162,116 and $147,701 as of March 31, 2019 and December 31, 2018, respectively, at fair value) | | 264,495 |
| 270,684 |
|
| Brokerage receivables | 40,679 |
| 38,384 |
| 44,500 |
| 35,450 |
|
| Trading account assets (including $107,753 and $99,460 pledged to creditors at September 30, 2018 and December 31, 2017, respectively) | 257,502 |
| 252,790 |
| |
| Trading account assets (including $125,102 and $112,932 pledged to creditors at March 31, 2019 and December 31, 2018, respectively) | | 286,511 |
| 256,117 |
|
| Investments: | | |
| Available-for-sale debt securities (including $7,854 and $9,493 pledged to creditors as of September 30, 2018 and December 31, 2017, respectively) | 284,782 |
| 290,725 |
| |
| Held-to-maturity debt securities (including $1,073 and $435 pledged to creditors as of September 30, 2018 and December 31, 2017, respectively) | 53,249 |
| 53,320 |
| |
| Equity securities (including $1,388 and $1,395 at fair value as of September 30, 2018 and December 31, 2017, respectively, of which $189 was available for sale as of December 31, 2017) | 7,482 |
| 8,245 |
| |
| Available-for-sale debt securities (including $13,140 and $9,289 pledged to creditors as of March 31, 2019 and December 31, 2018, respectively) | | 275,132 |
| 288,038 |
|
| Held-to-maturity debt securities (including $986 and $971 pledged to creditors as of March 31, 2019 and December 31, 2018, respectively) | | 66,842 |
| 63,357 |
|
| Equity securities (including $1,012 and $1,109 at fair value as of March 31, 2019 and December 31, 2018, respectively) | | 7,307 |
| 7,212 |
|
| Total investments | $ | 345,513 |
| $ | 352,290 |
| $ | 349,281 |
| $ | 358,607 |
|
| Loans: | |
| |
| |
| |
|
| Consumer (including $21 and $25 as of September 30, 2018 and December 31, 2017, respectively, at fair value) | 325,469 |
| 333,656 |
| |
| Corporate (including $4,218 and $4,349 as of September 30, 2018 and December 31, 2017, respectively, at fair value) | 349,440 |
| 333,378 |
| |
| Consumer (including $20 and $20 as of March 31, 2019 and December 31, 2018, respectively, at fair value) | | 319,887 |
| 330,487 |
|
| Corporate (including $3,854 and $3,203 as of March 31, 2019 and December 31, 2018, respectively, at fair value) | | 362,459 |
| 353,709 |
|
| Loans, net of unearned income | $ | 674,909 |
| $ | 667,034 |
| $ | 682,346 |
| $ | 684,196 |
|
| Allowance for loan losses | (12,336 | ) | (12,355 | ) | (12,329 | ) | (12,315 | ) |
| Total loans, net | $ | 662,573 |
| $ | 654,679 |
| $ | 670,017 |
| $ | 671,881 |
|
| Goodwill | 22,187 |
| 22,256 |
| 22,037 |
| 22,046 |
|
| Intangible assets (other than MSRs) | 4,598 |
| 4,588 |
| |
| Mortgage servicing rights (MSRs) | 618 |
| 558 |
| |
| Other assets (including $25,151 and $18,559 as of September 30, 2018 and December 31, 2017, respectively, at fair value) | 111,268 |
| 103,926 |
| |
| Intangible assets (including MSRs of $551 and $584 as of March 31, 2019 and December 31, 2018, at fair value) | | 5,196 |
| 5,220 |
|
| Other assets (including $19,818 and $20,788 as of March 31, 2019 and December 31, 2018, respectively, at fair value) | | 110,483 |
| 109,273 |
|
| Total assets | $ | 1,925,165 |
| $ | 1,842,465 |
| $ | 1,958,413 |
| $ | 1,917,383 |
|
The following table presents certain assets of consolidated variable interest entities (VIEs), which are included in the Consolidated Balance Sheet above. The assets in the table below include those assets that can only be used to settle obligations of consolidated VIEs, presented on the following page, and are in excess of those obligations. Additionally, the assets in the table below include third-party assets of consolidated VIEs only and exclude intercompany balances that eliminate in consolidation. | | | | September 30, | | March 31, | |
| | 2018 | December 31, | 2019 | December 31, |
| In millions of dollars | (Unaudited) | 2017 | (Unaudited) | 2018 |
| Assets of consolidated VIEs to be used to settle obligations of consolidated VIEs | |
| |
| |
| |
|
| Cash and due from banks | $ | 40 |
| $ | 52 |
| $ | 105 |
| $ | 270 |
|
| Trading account assets | 722 |
| 1,129 |
| 1,706 |
| 917 |
|
| Investments | 2,276 |
| 2,498 |
| 1,805 |
| 1,796 |
|
| Loans, net of unearned income | |
| |
| | |
|
| Consumer | 48,678 |
| 54,656 |
| 45,885 |
| 49,403 |
|
| Corporate | 17,971 |
| 19,835 |
| 17,995 |
| 19,259 |
|
| Loans, net of unearned income | $ | 66,649 |
| $ | 74,491 |
| $ | 63,880 |
| $ | 68,662 |
|
| Allowance for loan losses | (1,876 | ) | (1,930 | ) | (1,858 | ) | (1,852 | ) |
| Total loans, net | $ | 64,773 |
| $ | 72,561 |
| $ | 62,022 |
| $ | 66,810 |
|
| Other assets | 167 |
| 154 |
| 140 |
| 151 |
|
| Total assets of consolidated VIEs to be used to settle obligations of consolidated VIEs | $ | 67,978 |
| $ | 76,394 |
| $ | 65,778 |
| $ | 69,944 |
|
Statement continues on the next page.
CONSOLIDATED BALANCE SHEETCitigroup Inc. and Subsidiaries
(Continued)
| | | | September 30, | | March 31, | |
| | 2018 | December 31, | 2019 | December 31, |
| In millions of dollars, except shares and per share amounts | (Unaudited) | 2017 | (Unaudited) | 2018 |
| Liabilities | |
| |
| |
| |
|
| Non-interest-bearing deposits in U.S. offices | $ | 111,446 |
| $ | 126,880 |
| $ | 101,354 |
| $ | 105,836 |
|
| Interest-bearing deposits in U.S. offices (including $354 and $303 as of September 30, 2018 and December 31, 2017, respectively, at fair value) | 351,291 |
| 318,613 |
| |
| Interest-bearing deposits in U.S. offices (including $1,408 and $717 as of March 31, 2019 and December 31, 2018, respectively, at fair value) | | 373,339 |
| 361,573 |
|
| Non-interest-bearing deposits in offices outside the U.S. | 83,200 |
| 87,440 |
| 80,594 |
| 80,648 |
|
| Interest-bearing deposits in offices outside the U.S. (including $1,086 and $1,162 as of September 30, 2018 and December 31, 2017, respectively, at fair value) | 459,239 |
| 426,889 |
| |
| Interest-bearing deposits in offices outside the U.S. (including $936 and $758 as of March 31, 2019 and December 31, 2018, respectively, at fair value) | | 475,068 |
| 465,113 |
|
| Total deposits | $ | 1,005,176 |
| $ | 959,822 |
| $ | 1,030,355 |
| $ | 1,013,170 |
|
| Federal funds purchased and securities loaned and sold under agreements to repurchase (including $48,148 and $40,638 as of September 30, 2018 and December 31, 2017, respectively, at fair value) | 175,915 |
| 156,277 |
| |
| Federal funds purchased and securities loaned and sold under agreements to repurchase (including $46,241 and $44,510 as of March 31, 2019 and December 31, 2018, respectively, at fair value) | | 190,372 |
| 177,768 |
|
| Brokerage payables | 73,346 |
| 61,342 |
| 62,656 |
| 64,571 |
|
| Trading account liabilities | 147,652 |
| 125,170 |
| 136,392 |
| 144,305 |
|
| Short-term borrowings (including $5,041 and $4,627 as of September 30, 2018 and December 31, 2017, respectively, at fair value) | 33,770 |
| 44,452 |
| |
| Long-term debt (including $36,771 and $31,392 as of September 30, 2018 and December 31, 2017, respectively, at fair value) | 235,270 |
| 236,709 |
| |
| Other liabilities (including $19,947 and $13,961 as of September 30, 2018 and December 31, 2017, respectively, at fair value) | 56,173 |
| 57,021 |
| |
| Short-term borrowings (including $5,172 and $4,483 as of March 31, 2019 and December 31, 2018, respectively, at fair value) | | 39,322 |
| 32,346 |
|
| Long-term debt (including $44,088 and $38,229 as of March 31, 2019 and December 31, 2018, respectively, at fair value) | | 243,566 |
| 231,999 |
|
| Other liabilities (including $14,577 and $15,906 as of March 31, 2019 and December 31, 2018, respectively, at fair value) | | 58,735 |
| 56,150 |
|
| Total liabilities | $ | 1,727,302 |
| $ | 1,640,793 |
| $ | 1,761,398 |
| $ | 1,720,309 |
|
| Stockholders’ equity | |
| |
| |
| |
|
Preferred stock ($1.00 par value; authorized shares: 30 million), issued shares: as of September 30, 2018—761,400 and as of December 31, 2017—770,120, at aggregate liquidation value | $ | 19,035 |
| $ | 19,253 |
| |
Common stock ($0.01 par value; authorized shares: 6 billion), issued shares: as of September 30, 2018—3,099,567,177 and as of December 31, 2017—3,099,523,273 | 31 |
| 31 |
| |
Preferred stock ($1.00 par value; authorized shares: 30 million), issued shares: as of March 31, 2019— 719,200 and as of December 31, 2018—738,400, at aggregate liquidation value | | $ | 17,980 |
| $ | 18,460 |
|
Common stock ($0.01 par value; authorized shares: 6 billion), issued shares: as of March 31, 2019—3,099,601,505 and as of December 31, 2018—3,099,567,177 | | 31 |
| 31 |
|
| Additional paid-in capital | 107,825 |
| 108,008 |
| 107,551 |
| 107,922 |
|
| Retained earnings | 148,436 |
| 138,425 |
| 154,859 |
| 151,347 |
|
Treasury stock, at cost: September 30, 2018—657,430,364 shares and December 31, 2017—529,614,728 shares | (39,678 | ) | (30,309 | ) | |
Treasury stock, at cost: March 31, 2019—787,133,784 shares and December 31, 2018—731,099,833 shares | | (47,861 | ) | (44,370 | ) |
| Accumulated other comprehensive income (loss) (AOCI) | (38,645 | ) | (34,668 | ) | (36,308 | ) | (37,170 | ) |
| Total Citigroup stockholders’ equity | $ | 197,004 |
| $ | 200,740 |
| $ | 196,252 |
| $ | 196,220 |
|
| Noncontrolling interest | 859 |
| 932 |
| 763 |
| 854 |
|
| Total equity | $ | 197,863 |
| $ | 201,672 |
| $ | 197,015 |
| $ | 197,074 |
|
| Total liabilities and equity | $ | 1,925,165 |
| $ | 1,842,465 |
| $ | 1,958,413 |
| $ | 1,917,383 |
|
The following table presents certain liabilities of consolidated VIEs, which are included in the Consolidated Balance Sheet above. The liabilities in the table below include third-party liabilities of consolidated VIEs only and exclude intercompany balances that eliminate in consolidation. The liabilities also exclude amounts where creditors or beneficial interest holders have recourse to the general credit of Citigroup.
| | | | September 30, | | March 31, | |
| | 2018 | December 31, | 2019 | December 31, |
| In millions of dollars | (Unaudited) | 2017 | (Unaudited) | 2018 |
Liabilities of consolidated VIEs for which creditors or beneficial interest holders do not have recourse to the general credit of Citigroup | |
| |
| |
| |
|
| Short-term borrowings | $ | 12,307 |
| $ | 10,142 |
| $ | 13,071 |
| $ | 13,134 |
|
| Long-term debt | 27,625 |
| 30,492 |
| 25,952 |
| 28,514 |
|
| Other liabilities | 748 |
| 611 |
| 940 |
| 697 |
|
Total liabilities of consolidated VIEs for which creditors or beneficial interest holders do not have recourse to the general credit of Citigroup | $ | 40,680 |
| $ | 41,245 |
| $ | 39,963 |
| $ | 42,345 |
|
The Notes to the Consolidated Financial Statements are an integral part of these Consolidated Financial Statements.
|
| | |
| CONSOLIDATED STATEMENT OF CHANGES IN STOCKHOLDERS’ EQUITY | | Citigroup Inc. and Subsidiaries |
| (UNAUDITED) | | |
| | | | Three Months Ended September 30, | Nine Months Ended September 30, | Three Months Ended March 31, |
| In millions of dollars | 2018 | 2017 | 2018 | 2017 | 2019 | 2018 |
| Preferred stock at aggregate liquidation value | | |
| |
| |
| |
|
| Balance, beginning of period | $ | 19,035 |
| $ | 19,253 |
| $ | 19,253 |
| $ | 19,253 |
| $ | 18,460 |
| $ | 19,253 |
|
| Redemption of preferred stock | — |
| — |
| (218 | ) | — |
| (480 | ) | (97 | ) |
| Balance, end of period | $ | 19,035 |
| $ | 19,253 |
| $ | 19,035 |
| $ | 19,253 |
| $ | 17,980 |
| $ | 19,156 |
|
| Common stock and additional paid-in capital | | |
| |
| |
| |
|
| Balance, beginning of period | $ | 107,755 |
| $ | 107,829 |
| $ | 108,039 |
| $ | 108,073 |
| $ | 107,953 |
| $ | 108,039 |
|
| Employee benefit plans | 98 |
| 102 |
| (187 | ) | (137 | ) | (382 | ) | (405 | ) |
| Other | 3 |
| (4 | ) | 4 |
| (9 | ) | 11 |
| (4 | ) |
| Balance, end of period | $ | 107,856 |
| $ | 107,927 |
| $ | 107,856 |
| $ | 107,927 |
| $ | 107,582 |
| $ | 107,630 |
|
| Retained earnings | | |
| |
| |
| |
|
| Balance, beginning of period | $ | 145,211 |
| $ | 152,178 |
| $ | 138,425 |
| $ | 146,477 |
| $ | 151,347 |
| $ | 138,425 |
|
Adjustment to opening balance, net of taxes(1) | — |
| — |
| (84 | ) | (660 | ) | 151 |
| (84 | ) |
| Adjusted balance, beginning of period | $ | 145,211 |
| $ | 152,178 |
| $ | 138,341 |
| $ | 145,817 |
| $ | 151,498 |
| $ | 138,341 |
|
| Citigroup’s net income | 4,622 |
| 4,133 |
| 13,732 |
| 12,095 |
| 4,710 |
| 4,620 |
|
Common dividends(2) | (1,127 | ) | (865 | ) | (2,777 | ) | (1,755 | ) | (1,075 | ) | (826 | ) |
| Preferred dividends | (270 | ) | (272 | ) | (860 | ) | (893 | ) | (262 | ) | (272 | ) |
Other(3) | — |
| — |
| — |
| (90 | ) | (12 | ) | — |
|
| Balance, end of period | $ | 148,436 |
| $ | 155,174 |
| $ | 148,436 |
| $ | 155,174 |
| $ | 154,859 |
| $ | 141,863 |
|
| Treasury stock, at cost | | |
| |
| |
| |
|
| Balance, beginning of period | $ | (34,413 | ) | $ | (19,342 | ) | $ | (30,309 | ) | $ | (16,302 | ) | $ | (44,370 | ) | $ | (30,309 | ) |
Employee benefit plans(4) | 6 |
| 3 |
| 477 |
| 526 |
| 564 |
| 469 |
|
Treasury stock acquired(5) | (5,271 | ) | (5,490 | ) | (9,846 | ) | (9,053 | ) | (4,055 | ) | (2,275 | ) |
| Balance, end of period | $ | (39,678 | ) | $ | (24,829 | ) | $ | (39,678 | ) | $ | (24,829 | ) | $ | (47,861 | ) | $ | (32,115 | ) |
| Citigroup’s accumulated other comprehensive income (loss) | | |
| |
| |
| |
|
| Balance, beginning of period | $ | (37,494 | ) | $ | (29,899 | ) | $ | (34,668 | ) | $ | (32,381 | ) | $ | (37,170 | ) | $ | (34,668 | ) |
Adjustment to opening balance, net of taxes(1) | — |
| — |
| (3 | ) | 504 |
| — |
| (3 | ) |
| Adjusted balance, beginning of period | $ | (37,494 | ) | $ | (29,899 | ) | $ | (34,671 | ) | $ | (31,877 | ) | $ | (37,170 | ) | $ | (34,671 | ) |
| Citigroup’s total other comprehensive income (loss) | (1,151 | ) | 8 |
| (3,974 | ) | 1,986 |
| |
| Citigroup’s total other comprehensive income | | 862 |
| 52 |
|
| Balance, end of period | $ | (38,645 | ) | $ | (29,891 | ) | $ | (38,645 | ) | $ | (29,891 | ) | $ | (36,308 | ) | $ | (34,619 | ) |
| Total Citigroup common stockholders’ equity | $ | 177,969 |
| $ | 208,381 |
| $ | 177,969 |
| $ | 208,381 |
| $ | 178,272 |
| $ | 182,759 |
|
| Total Citigroup stockholders’ equity | $ | 197,004 |
| $ | 227,634 |
| $ | 197,004 |
| $ | 227,634 |
| $ | 196,252 |
| $ | 201,915 |
|
| Noncontrolling interests | | |
| |
| |
| |
|
| Balance, beginning of period | $ | 874 |
| $ | 1,088 |
| $ | 932 |
| $ | 1,023 |
| $ | 854 |
| $ | 932 |
|
| Transactions between noncontrolling-interest shareholders and the related consolidated subsidiary | — |
| (3 | ) | — |
| (3 | ) | |
| Transactions between Citigroup and the noncontrolling-interest shareholders | (23 | ) | (56 | ) | (39 | ) | (50 | ) | (99 | ) | (15 | ) |
| Net income attributable to noncontrolling-interest shareholders | 3 |
| — |
| 51 |
| 41 |
| 25 |
| 22 |
|
| Distributions paid to noncontrolling-interest shareholders | (2 | ) | (44 | ) | (38 | ) | (44 | ) | (4 | ) | — |
|
Other comprehensive income (loss) attributable to noncontrolling-interest shareholders | 8 |
| 12 |
| (35 | ) | 82 |
| (13 | ) | 14 |
|
| Other | (1 | ) | (9 | ) | (12 | ) | (61 | ) | — |
| (2 | ) |
| Net change in noncontrolling interests | $ | (15 | ) | $ | (100 | ) | $ | (73 | ) | $ | (35 | ) | $ | (91 | ) | $ | 19 |
|
| Balance, end of period | $ | 859 |
| $ | 988 |
| $ | 859 |
| $ | 988 |
| $ | 763 |
| $ | 951 |
|
| Total equity | $ | 197,863 |
| $ | 228,622 |
| $ | 197,863 |
| $ | 228,622 |
| $ | 197,015 |
| $ | 202,866 |
|
| |
| (1) | See Note 1 to the Consolidated Financial Statements for additional details. |
| |
| (2) | Common dividends declared were $0.32$0.45 per share in the first and second quarters and $0.45 per share in the third quarter of 2018. Common dividends declared were $0.16 per share in the first and second quarters2019 and $0.32 for the thirdfirst quarter of 2017.2018. |
| |
| (3) | Includes the impact of ASU 2016-09, Compensation—Stock Compensation (Topic 718): Improvements to Employee Share-Based Payment Accounting. See Note 1 to the Consolidated Financial Statements. |
| |
| (4) | Includes treasury stock related to (i) certain activity on employee stock option program exercises where the employee delivers existing shares to cover the option exercise, or (ii) under Citi’s employee restricted or deferred stock programs where shares are withheld to satisfy tax requirements. |
| |
| (5) | For the three and nine months ended September 30, 2018 and 2017, primarilyPrimarily consists of open market purchases under Citi’s Board of Directors-approved common stock repurchase program. |
The Notes to the Consolidated Financial Statements are an integral part of these Consolidated Financial Statements.
|
| | |
| CONSOLIDATED STATEMENT OF CASH FLOWS | | Citigroup Inc. and Subsidiaries |
| (UNAUDITED) | | |
| | | | Nine Months Ended September 30, | Three Months Ended March 31, |
| In millions of dollars | 2018 | 2017 | 2019 | 2018 |
| Cash flows from operating activities of continuing operations | |
| |
| |
| |
|
| Net income before attribution of noncontrolling interests | $ | 13,783 |
| $ | 12,136 |
| $ | 4,735 |
| $ | 4,642 |
|
| Net income attributable to noncontrolling interests | 51 |
| 41 |
| 25 |
| 22 |
|
| Citigroup’s net income | $ | 13,732 |
| $ | 12,095 |
| $ | 4,710 |
| $ | 4,620 |
|
| Loss from discontinued operations, net of taxes | — |
| (2 | ) | (2 | ) | (7 | ) |
| Income from continuing operations—excluding noncontrolling interests | $ | 13,732 |
| $ | 12,097 |
| $ | 4,712 |
| $ | 4,627 |
|
| Adjustments to reconcile net income to net cash provided by operating activities of continuing operations | |
| |
| |
| |
|
Net gains on significant disposals(1) | (247 | ) | (602 | ) | |
| Depreciation and amortization | 2,800 |
| 2,717 |
| 931 |
| 926 |
|
| Provision for loan losses | 5,504 |
| 5,487 |
| 1,944 |
| 1,803 |
|
| Realized gains from sales of investments | (341 | ) | (626 | ) | (130 | ) | (170 | ) |
| Net impairment losses on investments, goodwill and intangible assets | 113 |
| 75 |
| 8 |
| 28 |
|
| Change in trading account assets | (4,831 | ) | (14,383 | ) | (30,427 | ) | (16,054 | ) |
| Change in trading account liabilities | 22,482 |
| (1,015 | ) | (7,913 | ) | 18,791 |
|
| Change in brokerage receivables net of brokerage payables | 9,709 |
| (3,136 | ) | (10,965 | ) | 155 |
|
| Change in loans HFS | 1,380 |
| 1,969 |
| 1,439 |
| 1,627 |
|
| Change in other assets | (8,696 | ) | (5,351 | ) | (2,961 | ) | (3,503 | ) |
| Change in other liabilities | (848 | ) | 1,569 |
| 2,585 |
| 1,561 |
|
| Other, net | (10,691 | ) | (2,262 | ) | 3,161 |
| (2,835 | ) |
| Total adjustments | $ | 16,334 |
| $ | (15,558 | ) | $ | (42,328 | ) | $ | 2,329 |
|
| Net cash provided by (used in) operating activities of continuing operations | $ | 30,066 |
| $ | (3,461 | ) | $ | (37,616 | ) | $ | 6,956 |
|
| Cash flows from investing activities of continuing operations | |
| |
| |
| |
|
| Change in federal funds sold and securities borrowed or purchased under agreements to resell | $ | (48,462 | ) | $ | (15,795 | ) | |
| Change in federal funds sold and securities borrowed and purchased under agreements to resell | | $ | 6,189 |
| $ | (25,409 | ) |
| Change in loans | (16,131 | ) | (41,569 | ) | (892 | ) | (8,717 | ) |
| Proceeds from sales and securitizations of loans | 4,021 |
| 7,019 |
| 2,062 |
| 1,654 |
|
| Purchases of investments | (129,054 | ) | (151,362 | ) | (69,673 | ) | (41,030 | ) |
| Proceeds from sales of investments | 52,170 |
| 89,724 |
| 31,436 |
| 20,688 |
|
| Proceeds from maturities of investments | 82,940 |
| 67,166 |
| 47,363 |
| 21,509 |
|
Proceeds from significant disposals(1) | 314 |
| 3,411 |
| |
| Capital expenditures on premises and equipment and capitalized software | (2,682 | ) | (2,502 | ) | (518 | ) | (969 | ) |
Proceeds from sales of premises and equipment, subsidiaries and affiliates and repossessed assets | 174 |
| 292 |
| 38 |
| 101 |
|
| Other, net | 147 |
| 156 |
| 38 |
| 49 |
|
| Net cash used in investing activities of continuing operations | $ | (56,563 | ) | $ | (43,460 | ) | |
| Net cash provided by (used in) investing activities of continuing operations | | $ | 16,043 |
| $ | (32,124 | ) |
| Cash flows from financing activities of continuing operations | |
| |
| |
| |
|
| Dividends paid | $ | (3,616 | ) | $ | (2,639 | ) | $ | (1,320 | ) | $ | (1,095 | ) |
| Redemption of preferred stock | (218 | ) | — |
| (480 | ) | (97 | ) |
| Treasury stock acquired | (9,848 | ) | (9,071 | ) | (4,055 | ) | (2,378 | ) |
| Stock tendered for payment of withholding taxes | (479 | ) | (402 | ) | (358 | ) | (475 | ) |
| Change in federal funds purchased and securities loaned or sold under agreements to repurchase | 19,638 |
| 19,461 |
| |
| Change in federal funds purchased and securities loaned and sold under agreements to repurchase | | 12,604 |
| 15,482 |
|
| Issuance of long-term debt | 53,027 |
| 52,293 |
| 15,552 |
| 20,769 |
|
| Payments and redemptions of long-term debt | (47,201 | ) | (29,785 | ) | (6,568 | ) | (17,882 | ) |
| Change in deposits | 45,354 |
| 34,632 |
| 17,186 |
| 41,397 |
|
| Change in short-term borrowings | (10,681 | ) | 7,448 |
| 6,976 |
| (8,358 | ) |
| | | CONSOLIDATED STATEMENT OF CASH FLOWS | | |
| (UNAUDITED) (Continued) | Nine Months Ended September 30, | Three Months Ended March 31, |
| In millions of dollars | 2018 | 2017 | 2019 | 2018 |
| Net cash provided by financing activities of continuing operations | $ | 45,976 |
| $ | 71,937 |
| $ | 39,537 |
| $ | 47,363 |
|
| Effect of exchange rate changes on cash and due from banks | $ | (709 | ) | $ | 599 |
| $ | (176 | ) | $ | (7 | ) |
Change in cash and due from banks and deposits with banks(2) | $ | 18,770 |
| $ | 25,615 |
| $ | 17,788 |
| $ | 22,188 |
|
Cash, due from banks and deposits with banks at beginning of period(2) | 180,516 |
| 160,494 |
| 188,105 |
| 180,516 |
|
Cash, due from banks and deposits with banks at end of period(2) | $ | 199,286 |
| $ | 186,109 |
| $ | 205,893 |
| $ | 202,704 |
|
| Cash and due from banks | $ | 25,727 |
| $ | 22,604 |
| $ | 24,448 |
| $ | 21,850 |
|
| Deposits with banks | 173,559 |
| 163,505 |
| 181,445 |
| 180,854 |
|
| Cash, due from banks and deposits with banks at end of period | $ | 199,286 |
| $ | 186,109 |
| $ | 205,893 |
| $ | 202,704 |
|
| Supplemental disclosure of cash flow information for continuing operations | |
| |
| |
| |
|
| Cash paid during the period for income taxes | $ | 3,261 |
| $ | 2,714 |
| $ | 1,325 |
| $ | 738 |
|
| Cash paid during the period for interest | 16,278 |
| 11,604 |
| 6,931 |
| 4,586 |
|
| Non-cash investing activities | |
| | |
| |
| Transfers to loans HFS from loans | $ | 3,300 |
| $ | 3,800 |
| $ | 2,000 |
| $ | 900 |
|
| Transfers to OREO and other repossessed assets | 94 |
| 85 |
| 36 |
| 26 |
|
(1) See Note 2 to the Consolidated Financial Statements for further information on significant disposals.
(2) Includes the impact of ASU 2016-18, Restricted Cash. See Notes 1 and 22 to the Consolidated Financial Statements.
The Notes to the Consolidated Financial Statements are an integral part of these Consolidated Financial Statements.
NOTES TO CONSOLIDATED FINANCIAL STATEMENTS (UNAUDITED)
1. BASIS OF PRESENTATION AND ACCOUNTING CHANGES
Basis of Presentation
The accompanying unaudited Consolidated Financial Statements as of September 30, 2018March 31, 2019 and for the three- and nine-monththree-month periods ended September 30,March 31, 2019 and 2018 and 2017 include the accounts of Citigroup Inc. and its consolidated subsidiaries.
In the opinion of management, all adjustments, consisting of normal recurring adjustments, necessary for a fair presentation have been reflected. The accompanying unaudited Consolidated Financial Statements should be read in conjunction with the Consolidated Financial Statements and related notes included in Citigroup’s Annual Report on Form 10-K for the fiscal year ended December 31, 2017 (20172018 (2018 Annual Report on Form 10-K) and Citigroup’s Quarterly Reports on Form 10-Q for the quarters ended June 30, 2018 (Second Quarter of 2018 Form 10-Q) and March 31, 2018 (First Quarter of 2018 Form 10-Q).
Certain financial information that is normally included in annual financial statements prepared in accordance with U.S. generally accepted accounting principles (GAAP), but is not required for interim reporting purposes, has been condensed or omitted.
Management must make estimates and assumptions that affect the Consolidated Financial Statements and the related footnote disclosures. While management uses its best judgment, actual results could differ from those estimates.
As noted above, the Notes to Consolidated Financial Statements are unaudited.
Throughout these Notes, “Citigroup,” “Citi” and the “Company” refer to Citigroup Inc. and its consolidated subsidiaries.
Certain reclassifications have been made to the prior periods’ financial statements and notes to conform to the current period’s presentation.
ACCOUNTING CHANGES
Revenue RecognitionLease Accounting
In May 2014, the Financial Accounting Standards Board (FASB) issued ASU 2014-09, Revenue from Contracts with Customers (Revenue Recognition), which outlines a single comprehensive model for entities to use in accounting for revenue arising from contracts with customers. The core principle of the revenue model is that an entity recognizes revenue to depict the transfer of promised goods or services to customers in an amount that reflects the consideration to which the entity expects to be entitled in exchange for those goods or services. The ASU defines the promised good or service as the performance obligation under the contract.
While the guidance replaces most existing revenue recognition guidance in GAAP, the ASU is not applicable to financial instruments and, therefore, does not impact a majority of the Company’s revenues, including net interest
income, loan fees, gains on sales and mark-to-market accounting.
In accordance with the new revenue recognition standard, Citi has identified the specific performance obligation (promised services) associated with the contract with the customer and has determined when that specific performance obligation has been satisfied, which may be at a point in time or over time depending on how the performance obligation is defined. The contracts with customers also contain the transaction price, which consists of fixed consideration and/or consideration that may vary (variable consideration), and is defined as the amount of consideration an entity expects to be entitled to when or as the performance obligation is satisfied, excluding amounts collected on behalf of third parties (including transaction taxes). The amounts recognized at the point in time the performance obligation is satisfied may differ from the ultimate transaction price associated with that performance obligation when a portion of it is based on variable consideration. For example, some consideration is based on the client’s month-end balance or market values which are unknown at the time the contract is executed. The remaining transaction price amount, if any, will be recognized as the variable consideration becomes determinable. In certain transactions, the performance obligation is considered satisfied at a point in time in the future. In this instance, Citi defers revenue on the balance sheet that will only be recognized upon completion of the performance obligation.
The new revenue recognition standard further clarified the guidance related to reporting revenue gross as principal versus net as an agent. In many cases, Citi outsources a component of its performance obligations to third parties. The Company has determined that it acts as principal in the majority of these transactions and therefore presents the amounts paid to these third parties gross within operating expenses.
The Company has retrospectively adopted this standard as of January 1, 2018 and as a result was required to report amounts paid to third parties where Citi is principal to the contract within Operating expenses. The adoption resulted in an increase in both revenue and expenses of approximately $250 million for the three-month period ended September 30, 2018 and approximately $750 million for the nine-month period ended September 30, 2018, respectively, while increasing approximately $1 billion for the year ended December 31, 2017 with similar amounts for prior periods. Prior to adoption, these expense amounts were reported as contra revenue primarily within Commissions and fees and Administration and other fiduciary fees revenue. Accordingly, prior periods have been reclassified to conform to the new presentation.
See Note 5 to the Consolidated Financial Statements for a description of the Company’s revenue recognition policies for Commissions and fees and Administration and other fiduciary fees.
Income Tax Impact of Intra-Entity Transfers of Assets
In OctoberFebruary 2016, the FASB issued ASU No. 2016-16, Income Taxes—Intra-Entity Transfers of Assets Other Than Inventory2016-02, Leases (Topic 842), which increases the transparency and comparability of accounting for lease transactions. The ASU requires an entitylessees to recognize liabilities for operating leases and offsetting right-of-use (ROU) assets on the income tax consequences of an intra-entity transfer of an asset other than inventory when the transfer occurs.balance sheet. The ASU was effectivealso requires quantitative and qualitative disclosures regarding key information about leasing arrangements. Lessee accounting for finance leases, as well as lessor accounting, are largely unchanged.
Effective January 1, 2018 and was2019, the Company prospectively adopted asthe provisions of that date. The impact of this standard was an increase of DTAs by approximately $300 million,the ASU. At adoption, Citi recognized a decrease of retained earnings by approximately $80 millionlease liability and a decreasecorresponding ROU asset of prepaid tax assets by approximately $380 million.
Clarifying$4.4 billion on the DefinitionConsolidated Balance Sheet related to its future lease payments as a lessee under operating leases. Additionally, the Company recorded a $151 million increase in Retained Earnings for the cumulative effect of a Business
In January 2017, the FASB issued ASU No. 2017-01, Business Combinations (Topic 805): Clarifying the Definition of a Business. The definition of a business directly and indirectly affects many areas of accounting (e.g., acquisitions, disposals, goodwill and consolidation). The ASU narrows the definition of a business by introducing a quantitative screen as the first step, such that if substantially all of the fair value of the gross assets acquired is concentrated in a single identifiable asset or a group of similar identifiable assets, then the set of transferred assets and activities is not a business. If the set is not scoped out from the quantitative screen, the entity then evaluates whether the set meets the requirement that a business include, at a minimum, an input and a substantive process that together significantly contribute to the ability to create outputs.
The ASU was effective for public entities, including Citi, as of January 1, 2018 with prospective application. The ongoing impactrecognizing previously deferred gains on sale/leaseback transactions. Adoption of the ASU will depend upon the acquisition and disposal activities of Citi. If fewer transactions qualify as a business, there could be less initial recognition of goodwill, but also less goodwill allocated to disposals.
Changes in Accounting for Pension and Postretirement (Benefit) Expense
In March 2017, the FASB issued ASU No. 2017-07, Compensation—Retirement Benefits (Topic 715): Improving the Presentation of Net Periodic Pension Cost and Net Periodic Postretirement Benefit Cost,which changes the income statement presentation of net benefit expense and requires restating the Company’s financial statements for each of the earlier periods presented in Citi’s annual and interim financial statements. The change in presentation was effective for annual and interim periods starting January 1, 2018. The ASU requires that only the service cost component of net benefit expense be included in Compensation and benefits on the income statement. The other components of net benefit expense are required to be presented outside of Compensation and benefits and are presented in Other operating expenses. Since both of these income statement line items are part of Operating expenses, total Operating expenses and Net income will not change. This change in presentation did not have a material effectimpact on Compensationthe Consolidated Income Statement. See Notes 13 and benefits and Other operating expenses and is applied prospectively. The components of22 for additional details.
the net benefit expense are currently disclosedThe Company has elected not to separate lease and non-lease components in Note 8its lease contracts and accounts for them as a single lease component. Citi has also elected not to record a ROU asset for short-term leases that have a term of 12 months or less and do not contain purchase options that Citi is reasonably certain to exercise. The cost of short-term leases is recognized in the Consolidated Financial Statements.Statement of Income on a straight-line basis over the lease term. Additionally, Citi applies the portfolio approach to account for certain equipment leases with nearly identical contractual terms.
The new standard also changes the components of net benefit expense that
Lessee accounting
Operating lease ROU assets and lease liabilities are eligible for capitalization when employee costs are capitalizedincluded in connection with various activities, such as internally developed software, construction-in-progressOther Assets and loan origination costs. Prospectively from January 1, 2018, only the service cost component of net benefit expense may be capitalized. Existing capitalized balances are not affected. This change in amounts eligible for capitalization does not have a material effectOther Liabilities, respectively, on the Company’s Consolidated Financial StatementsBalance Sheet. Finance lease assets and related disclosures.
Hedging
In August 2017,liabilities are included in Other Assets and Long-term Debt, respectively, on the FASB issued ASU No. 2017-12, Targeted Improvements to Accounting for Hedging Activities, which better aligns an entity’s risk management activities and financial reporting for hedging relationships through changes to the designation and measurement guidance for qualifying hedging relationships and the presentation of hedge results.Consolidated Balance Sheet. The ASU requires the changeCompany uses its incremental borrowing rate, factoring in the fairlease term, to determine the lease liability, which is measured at the present value of the hedging instrument to be presented in the same income statement line as the hedged item and also requires expanded disclosures. Citi adopted this standard on January 1, 2018 and transferred approximately $4 billion of pre-payable mortgage-backed securities and municipal bonds from held-to-maturity (HTM) into available-for-sale (AFS) securities classification as permitted as a one-time transfer uponfuture lease payments. The ROU asset, at adoption of the standard,ASU, is recorded at the amount of the lease liability plus any prepaid rent and initial direct costs, less any lease incentives and acrrued rent. The lease terms include periods covered by options to extend or terminate the lease depending on whether Citi is reasonably certain to exercise such options.
Lessor accounting
Lessor accounting is largely unchanged under the ASU. Citi acts as thesea lessor for power, railcar, shipping and aircraft assets, were deemedwhere the Company has executed operating, direct financing, and leveraged leasing arrangements. In a direct financing or a leveraged lease, Citi derecognizes the leased asset and records a lease financing receivable at lease commencement in Loans. Upon lease termination, Citi may obtain control of the asset, which is then recorded in Other assets on the consolidated balance sheet and any remaining receivable for the asset’s residual value is derecognized. Under the ASU, leveraged lease accounting is grandfathered and may continue to be eligible toapplied until the leveraged lease is terminated or modified. Upon modification, the lease must be hedged under the last of layer hedge strategy. The impact to opening retained earnings was immaterial. See Note 19 to the Consolidated Financial Statements for more information.
Recognition and Measurement of Financial Assets and Financial Liabilities
In January 2016, the FASB issued ASU No. 2016-01, Financial Instruments—Overall (Subtopic 825-10): Recognition and Measurement of Financial Assets and Financial Liabilities, which addresses certain aspects of recognition, measurement, presentation and disclosure of financial instruments. In February 2018, the FASB issued ASU No. 2018-03, Technical Corrections and Improvements to Financial Instruments—Overall (Subtopic 825-10), to clarify certain provisions in ASU 2016-01.
The ASUs require entities to present separately in AOCI the portion of the total change in the fair value of a liability resulting from a change in the instrument-specific credit risk when the entity has elected to measure the liability at fair valueclassified as an operating, direct finance, or sales-type lease in accordance with the fair value option for financial instruments. The ASUs also require equity investments (except those accounted for under the equity methodASU.
Separately, as part of accounting or those that result in consolidation of the investee) to be measured at fair value with changes in fair value recognized in net income, thus eliminating the AFS category for equity investments. However, Federal Reserve Bank and Federal Home Loan Bank stock,managing its real estate footprint, Citi subleases excess real estate space via operating lease arrangements, while retaining its obligation as well as certain exchange seats, will continue to be presented at cost. Thea lessee.
ASUs also provide an instrument-by-instrument election to measure non-marketable equity investments using a measurement alternative. Under the measurement alternative, the investment is carried at cost plus or minus changes resulting from observable prices in orderly transactions for the identical or a similar investment of the same issuer. Equity securities under the measurement alternative are also assessed for impairment. Finally, the ASUs require that fair value disclosures for financial instruments not measured at fair value on the balance sheet be presented at their exit prices (e.g., held-for-investment loans).
Citi early adopted the provisions of ASU 2016-01
related to presentation of the change in fair value of liabilities for which the fair value option was elected, related to changes in Citigroup’s own credit spreads in Accumulated other comprehensive income (loss) (AOCI) effective January 1, 2016. Accordingly, since the first quarter of 2016, these amounts have been reflected as a component of AOCI, whereas these amounts were previously recognized in Citigroup’s revenues and net income. The impact of adopting this amendment resulted in a cumulative catch-up reclassification from Retained earnings to AOCI of an accumulated after-tax loss of approximately $15 million at January 1, 2016. Financial statements for periods prior to 2016 were not subject to restatement under the provisions of this ASU. For additional information, see Notes 17, 20 and 21 to the Consolidated Financial Statements.
The other provisions of ASU 2016-01, as discussed above, were effective on January 1, 2018. Citi has adopted both ASU 2016-01 and ASU 2018-03 as of January 1, 2018. Accordingly, as of the first quarter of 2018, the changes to accounting for equity securities and fair value disclosures have been reflected in Citigroup’s financial statements. The impact of adopting the change to AFS equity securities resulted in a cumulative catch-up reclassification from AOCI to Retained earnings of an accumulated after-tax gain of approximately $3 million at January 1, 2018. Citi elected the measurement alternative for all non-marketable equity investments that no longer qualify for cost measurement under the ASUs. This provision in the ASUs was adopted prospectively. Financial statements for periods prior to 2018 were not subject to restatement under the provisions of the ASUs. For additional information, see Notes 12, 17 and 20to the Consolidated Financial Statements.
Statement of Cash Flows
In November 2016, the FASB issued ASU No. 2016-18, Restricted Cash,which requires that companies present cash, cash equivalents and amounts generally described as restricted cash or restricted cash equivalents (restricted cash) when reconciling beginning-of-period and end-of-period totals on the Statement of Cash Flows. In connection with the adoption of the ASU, Citigroup also changed its definition of cash and cash equivalents to include all of Cash and due from banks and predominately all of Deposits with banks. The Company has retrospectively adopted this ASU as of January 1, 2018 and as a result Net cash provided by investing activities of continuing operations on the
Statement of Cash Flows increased by $26.1 billion for the nine months ended September 30, 2017.
In August 2016, the FASB issued ASU No. 2016-15, Classification of Certain Cash Receipts and Cash Payments,which provides guidance on the classification and presentation of certain cash receipts and payments on the Statement of Cash Flows. The Company has retrospectively adopted this ASU as of January 1, 2018, which resulted in immaterial changes to Citi’s Consolidated Statement of Cash Flows.
Premium Amortization on Purchased Callable Debt Securities
In March 2017, the FASB issued Accounting Standards Update (ASU) No. 2017-08, Receivables—Nonrefundable Fees and Other Costs (Subtopic 310-20): Premium Amortization on Purchased Callable Debt Securities, which amends the amortization period for certain purchased callable debt securities held at a premium. The ASU requires entities to amortize premiums on debt securities by the first call date when the securities have fixed and determinable call dates and prices. The scope of the ASU includes all accounting premiums, such as purchase premiums and cumulative fair value hedge adjustments. The ASU does not change the accounting for discounts, which continue to be recognized over the contractual life of a security.
Citi early adopted the ASU in the second quarter of 2017, with an effective date of January 1, 2017. Adoption of the ASU is on a modified retrospective basis through a cumulative effect adjustment to Retained earnings as of the beginning of the year of adoption. Adoption of the ASU primarily affected Citi’s AFS and HTM portfolios of callable state and municipal debt securities. The ASU adoption resulted in a net reduction to total stockholders’ equity of $156 million (after-tax), effective as of January 1, 2017. This amount is composed of a reduction of approximately $660 million to Retained earnings for the incremental amortization of purchase premiums and cumulative hedge adjustments generated under fair value hedges of these callable debt securities, offset by an increase to AOCI of $504 million related to the cumulative fair value hedge adjustments reclassified to Retained earnings for AFS debt securities.
2. DISCONTINUED OPERATIONS AND SIGNIFICANT DISPOSALS
SummaryThe Company’s Discontinued operations consisted of Discontinued Operations
Citi sold its German retail banking operations andresidual activities related to the sale of the Egg Banking plc credit card businessCredit Card Business in 2008 and 2011, respectively. Residual items from these disposals are summarized below.2011. All Discontinued operations results are recorded within Corporate/Other.
The following summarizes financial information for all Discontinued operations:
|
| | | | | | |
| | Three Months Ended March 31, |
| In millions of dollars | 2019 | 2018 |
| Total revenues, net of interest expense | $ | — |
| $ | — |
|
| Loss from discontinued operations | $ | (2 | ) | $ | (7 | ) |
| Benefit for income taxes | — |
| — |
|
| Loss from discontinued operations, net of taxes | $ | (2 | ) | $ | (7 | ) |
|
| | | | | | | | | | | | |
| | Three Months Ended September 30, | Nine Months Ended September 30, |
| In millions of dollars | 2018 | 2017 | 2018 | 2017 |
| Total revenues, net of interest expense | $ | — |
| $ | — |
| $ | — |
| $ | — |
|
| Loss from discontinued operations | $ | (8 | ) | $ | (9 | ) | $ | (17 | ) | $ | (4 | ) |
| Benefit for income taxes | — |
| (4 | ) | (17 | ) | (2 | ) |
| Loss from discontinued operations, net of taxes | $ | (8 | ) | $ | (5 | ) | $ | — |
| $ | (2 | ) |
Cash flows for discontinuedfrom Discontinued operations were not material for the periods presented.
Significant Disposals
During the third quarter of 2018, one previously disclosed significant disposal transaction was completed as summarized below. There were no new significant disposal transactions during the three and nine months ended September 30, 2018. For a description of the Company’s significant disposal transactions and financial impact, see Note 2 to the Consolidated Financial Statements in Citi’s 20172018 Annual Report on Form 10-K.
Sale of Mexico Asset Management Business
On September 21, 2018, Citi completed the sale of its Mexico asset management business, which was part of Latin America Global Consumer Banking (GCB). As part of the sale, Citi derecognized net assets of $96 million, including goodwill of $32 million, already classified as held-for-sale beginning in the fourth quarter of 2017. The transaction resulted in a pretax gain on sale of approximately $250 million (approximately $150 million after-tax) recorded in Other revenue in the third quarter of 2018.
Income before taxes, excluding the pretax gain on sale, of the divested business was immaterial for the periods presented. Going forward, revenues in Latin America GCB will reflect the loss of ongoing operating revenues from the Mexico asset management business. However, this impact should be partially offset by lower operating expenses related to the asset management business, as well as expected growth in distribution revenues resulting from the transaction over time.
3. BUSINESS SEGMENTS
Citigroup’s activities are conducted through the following business segments: GCBGlobal Consumer Banking (GCB) and Institutional Clients Group (ICG). In addition, Corporate/Other includes activities not assigned to a specific business segment, as well as certain North America and international loan portfolios, discontinued operations and other legacy assets.
The prior-period balances reflect reclassifications to conform the presentation for all periods to the current period’s presentation. Effective January 1, 2018,2019, financial data was reclassified to reflect:
adoption of ASU No. 2014-09, Revenue Recognition, which occurred on January 1, 2018 on a retrospective basis. See “Accounting Changes” in Note 1 to the Consolidated Financial Statements;
the re-attribution of certain costs between Corporate/Other and GCB and ICG; and
| |
| • | the re-attribution of certain costs between Corporate/Other and GCB and ICG; and |
certain other immaterial reclassifications.
Citi’s consolidated results remain unchanged for all periods presented as a result of the changes and reclassifications discussed above.
For additional information regarding Citigroup’s business segments, see Note 3 to the Consolidated Financial Statements in Citi’s 20172018 Annual Report on Form 10-K.
The following table presents certain information regarding the Company’s continuing operations by segment:
| | | | Three Months Ended September 30, | | Three Months Ended March 31, | |
| | Revenues,
net of interest expense(1) | Provision (benefits)
for income taxes | Income (loss) from
continuing operations(2) | Identifiable assets | Revenues,
net of interest expense(1) | Provision (benefits)
for income taxes | Income (loss) from
continuing operations(2) | Identifiable assets |
| In millions of dollars, except identifiable assets in billions | 2018 | 2017 | 2018 | 2017 | 2018 | 2017 | September 30,
2018 | December 31, 2017 | 2019 | 2018 | 2019 | 2018 | 2019 | 2018 | March 31,
2019 | December 31, 2018 |
| Global Consumer Banking | $ | 8,654 |
| $ | 8,470 |
| $ | 493 |
| $ | 635 |
| $ | 1,567 |
| $ | 1,170 |
| $ | 427 |
| $ | 428 |
| $ | 8,451 |
| $ | 8,426 |
| $ | 422 |
| $ | 454 |
| $ | 1,437 |
| $ | 1,390 |
| $ | 426 |
| $ | 432 |
|
| Institutional Clients Group | 9,241 |
| 9,430 |
| 862 |
| 1,394 |
| 3,117 |
| 3,062 |
| 1,404 |
| 1,336 |
| 9,694 |
| 9,855 |
| 924 |
| 1,056 |
| 3,322 |
| 3,334 |
| 1,425 |
| 1,394 |
|
| Corporate/Other | 494 |
| 519 |
| 116 |
| (163 | ) | (51 | ) | (95 | ) | 94 |
| 78 |
| 431 |
| 591 |
| (71 | ) | (69 | ) | (22 | ) | (75 | ) | 107 |
| 91 |
|
| Total | $ | 18,389 |
| $ | 18,419 |
| $ | 1,471 |
| $ | 1,866 |
| $ | 4,633 |
| $ | 4,137 |
| $ | 1,925 |
| $ | 1,842 |
| $ | 18,576 |
| $ | 18,872 |
| $ | 1,275 |
| $ | 1,441 |
| $ | 4,737 |
| $ | 4,649 |
| $ | 1,958 |
| $ | 1,917 |
|
| |
| (1) | Includes total revenues, net of interest expense (excluding Corporate/Other), in North America of $8.5$8.3 billion and $8.9$8.2 billion; in EMEA of $2.9$3.2 billion and $2.7$3.2 billion; in Latin America of $2.7$2.5 billion and $2.5$2.6 billion; and in Asia of $3.8$4.1 billion and $3.8$4.1 billion for the three months ended September 30,March 31, 2019 and 2018, and 2017, respectively. These regional numbers exclude Corporate/Other, which largely operates within the U.S. |
| |
| (2) | Includes pretax provisions for credit losses and for benefits and claims in the GCB results of $1.9$2.0 billion and $2.2$1.9 billion; in the ICG results of $71$21 million and $(164)$(41) million; and in the Corporate/Other results of $(30)$(25) million and $(50)$(7) million for the three months ended September 30,March 31, 2019 and 2018, and 2017, respectively. |
|
| | | | | | | | | | | | | | | | | | |
| | Nine Months Ended September 30, |
| | Revenues,
net of interest expense(1) | Provision (benefits)
for income taxes | Income (loss) from
continuing operations(2) |
| In millions of dollars | 2018 | 2017 | 2018 | 2017 | 2018 | 2017 |
| Global Consumer Banking | $ | 25,337 |
| $ | 24,389 |
| $ | 1,357 |
| $ | 1,863 |
| $ | 4,240 |
| $ | 3,296 |
|
| Institutional Clients Group | 28,780 |
| 28,170 |
| 2,890 |
| 4,096 |
| 9,683 |
| 8,853 |
|
| Corporate/Other | 1,613 |
| 2,381 |
| 109 |
| (435 | ) | (140 | ) | (11 | ) |
| Total | $ | 55,730 |
| $ | 54,940 |
| $ | 4,356 |
| $ | 5,524 |
| $ | 13,783 |
| $ | 12,138 |
|
4. INTEREST REVENUE AND EXPENSE
Interest revenue and Interest expense consisted of the following:
|
| | | | | | |
| | Three Months Ended March 31, |
| In millions of dollars | 2019 | 2018 |
| Interest revenue | | |
| Loan interest, including fees | $ | 11,969 |
| $ | 10,892 |
|
| Deposits with banks | 607 |
| 432 |
|
| Federal funds sold and securities borrowed or purchased under agreements to resell | 1,783 |
| 1,039 |
|
| Investments, including dividends | 2,548 |
| 2,234 |
|
Trading account assets(1) | 1,686 |
| 1,371 |
|
| Other interest | 483 |
| 364 |
|
| Total interest revenue | $ | 19,076 |
| $ | 16,332 |
|
| Interest expense | | |
Deposits(2) | $ | 3,027 |
| $ | 1,997 |
|
| Federal funds purchased and securities loaned or sold under agreements to repurchase | 1,589 |
| 949 |
|
Trading account liabilities(1) | 327 |
| 215 |
|
| Short-term borrowings | 652 |
| 471 |
|
| Long-term debt | 1,722 |
| 1,528 |
|
| Total interest expense | $ | 7,317 |
| $ | 5,160 |
|
| Net interest revenue | $ | 11,759 |
| $ | 11,172 |
|
| Provision for loan losses | 1,944 |
| 1,803 |
|
| Net interest revenue after provision for loan losses | $ | 9,815 |
| $ | 9,369 |
|
| |
| (1) | Includes total revenues, net of interest expense, in North America of $25.4 billion and $26.0 billion; in EMEA of $9.1 billion and $8.4 billion; in Latin America of $7.8 billion and $7.2 billion; and in Asia of $11.8 billion and $10.9 billion for the nine months ended September 30, 2018 and 2017, respectively. Regional numbers exclude Corporate/Other, which largely operates within the U.S.
|
| |
(2) | Includes pretax provisions for credit losses and for benefits and claims in the GCB results of $5.7 billion and $5.8 billion; in the ICG results of $55 million and $(282) million; and in Corporate/Other results of $(155) million and $(130) million for the nine months ended September 30, 2018 and 2017, respectively.
|
4. INTEREST REVENUE AND EXPENSE
Interest revenue and Interest expense consisted of the following:
|
| | | | | | | | | | | | |
| | Three Months Ended September 30, | Nine Months Ended September 30, |
| In millions of dollars | 2018 | 2017 | 2018 | 2017 |
| Interest revenue | | | | |
| Loan interest, including fees | $ | 11,639 |
| $ | 10,745 |
| $ | 33,721 |
| $ | 31,082 |
|
| Deposits with banks | 629 |
| 486 |
| 1,554 |
| 1,156 |
|
| Federal funds sold and securities borrowed or purchased under agreements to resell | 1,425 |
| 858 |
| 3,800 |
| 2,348 |
|
| Investments, including dividends | 2,388 |
| 2,104 |
| 6,996 |
| 6,122 |
|
Trading account assets(1) | 1,655 |
| 1,429 |
| 4,789 |
| 4,175 |
|
| Other interest | 434 |
| 292 |
| 1,192 |
| 846 |
|
| Total interest revenue | $ | 18,170 |
| $ | 15,914 |
| $ | 52,052 |
| $ | 45,729 |
|
| Interest expense | | | | |
Deposits(2) | $ | 2,580 |
| $ | 1,775 |
| $ | 6,821 |
| $ | 4,793 |
|
| Federal funds purchased and securities loaned or sold under agreements to repurchase | 1,250 |
| 712 |
| 3,423 |
| 1,881 |
|
Trading account liabilities(1) | 273 |
| 169 |
| 724 |
| 462 |
|
| Short-term borrowings | 578 |
| 318 |
| 1,572 |
| 719 |
|
| Long-term debt | 1,687 |
| 1,405 |
| 4,873 |
| 4,126 |
|
| Total interest expense | $ | 6,368 |
| $ | 4,379 |
| $ | 17,413 |
| $ | 11,981 |
|
| Net interest revenue | $ | 11,802 |
| $ | 11,535 |
| $ | 34,639 |
| $ | 33,748 |
|
| Provision for loan losses | 1,906 |
| 2,146 |
| 5,504 |
| 5,487 |
|
| Net interest revenue after provision for loan losses | $ | 9,896 |
| $ | 9,389 |
| $ | 29,135 |
| $ | 28,261 |
|
| |
(1) | Interest expense on Trading account liabilities is reported as a reduction of interest revenue from Trading account assets. |
| |
| (2) | Includes deposit insurance fees and charges of $311$193 million and $301$376 million for the three months ended September 30,March 31, 2019 and 2018, and 2017, respectively, and $1,006 million and $935 million for the nine months ended September 30, 2018 and 2017, respectively. |
5. COMMISSIONS AND FEES; ADMINISTRATION
AND OTHER FIDUCIARY FEES
The primary components of For additional information on Citi’s Commissions and fees revenue are investment banking fees, brokerage commissions, credit-Fees; Administration and bank-card income and deposit-related fees.
Investment banking fees are substantially composed of underwriting and advisory revenues. Such fees are recognized at the point in time when Citigroup’s performance under the terms of a contractual arrangement is completed, which is typically at the closing of a transaction. Reimbursed expenses related to these transactions are recorded as revenue and are included within investment banking fees. In certain instances for advisory contracts, Citi will receive amounts in advance of the deal’s closing. In these instances, the amounts received will be recognized as a liability and not recognized in revenue until the transaction closes. The contract liability amount for the periods presented was negligible. Out-of-pocket expenses associated with underwriting activity are deferred and recognized at the time the related revenue is recognized, while out-of-pocket expenses associated with advisory arrangements are expensed as incurred. In general, expenses incurred related to investment banking transactions, whether consummated or not, are recorded in Other operating expenses. The Company has determined that it acts as principal in the majority of these transactions and therefore presents expenses gross within Other operating expenses.
Brokerage commissions primarily include commissions and fees from the following: executing transactions for clients on exchanges and over-the-counter markets; sales of mutual funds and other annuity products; and assisting clients in clearing transactions, providing brokerage services and other such activities. Brokerage commissions are recognized in Commissions and fees at the point in time the associated service is fulfilled, generally on trade-execution date. Gains or losses, if any, on these transactions are included in Principal transactions (seeFiduciary Fees, see Note 65 to the Consolidated Financial Statements). Sales of certain investment products include a portion of variable consideration associated with the underlying product. In these instances, a portion of the revenue associated with the sale of the product is not recognized until the variable consideration becomes fixed. The Company recognized $130 million and $107 million of revenue related to such variable consideration for the three months ended September 30,Statements in Citi’s 2018 and 2017, respectively, and $402 million and $302 million for the nine months ended September 30, 2018 and 2017, respectively. These amounts primarily relate to performance obligations satisfied in prior periods.
Annual Report on Form 10-K.
Credit- and bank-card income is primarily composed of interchange fees, which are earned by card issuers based on purchase sales, and certain card fees, including annual fees. Costs related to customer reward programs and certain payments to partners (primarily based on program sales, profitability and customer acquisitions) are recorded as a reduction of credit- and bank-card income. Interchange revenues are recognized as earned on a daily basis when Citi's performance obligation to transmit funds to the payment networks has been satisfied. Annual card fees, net of origination costs, are deferred and amortized on a straight-line basis over a 12-month period. Costs related to card reward programs are recognized when the rewards are earned by the cardholders. Payments to partners are recognized when incurred.
Deposit-related fees consist of service charges on deposit accounts and fees earned from performing cash management activities and other deposit account services. Such fees are recognized in the period in which the related service is provided.
Transactional service fees primarily consist of fees charged for processing services such as cash management, global payments, clearing, international funds transfer and other trade services. Such fees are recognized as/when the associated service is satisfied, which normally occurs at the point in time the service is requested by the customer and provided by Citi.
Insurance distribution revenue consists of commissions earned from third-party insurance companies for marketing and selling insurance policies on behalf of such entities. Such commissions are recognized in Commissions and fees at the point in time the associated service is fulfilled, generally when the insurance policy is sold to the policyholder. Sales of certain insurance products include a portion of variable consideration associated with the underlying product. In these instances, a portion of the revenue associated with the sale of the policy is not recognized until the variable consideration becomes determinable. The Company recognized $92 million and $115 million for the three months ended September 30, 2018 and 2017, respectively, and $296 million and $342 million for the nine months ended September 30, 2018 and 2017, respectively. These amounts primarily relate to performance obligations in prior periods.
Insurance premiums consist of premium income from insurance policies that Citi has underwritten and sold to policyholders.
The following tables present Commissions and fees revenue:
|
| | | | | | | | | | | | |
| | Three Months Ended March 31, |
| | 2019 |
| In millions of dollars | ICG | GCB | Corporate/Other | Total |
| Investment banking | $ | 910 |
| $ | 4 |
| $ | — |
| $ | 914 |
|
| Brokerage commissions | 471 |
| 186 |
| — |
| 657 |
|
| Credit- and bank-card income | | | |
|
|
| Interchange fees | 278 |
| 1,984 |
| — |
| 2,262 |
|
| Card-related loan fees | 13 |
| 160 |
| — |
| 173 |
|
| Card rewards and partner payments | (153 | ) | (2,061 | ) | — |
| (2,214 | ) |
Deposit-related fees(1) | 245 |
| 139 |
| — |
| 384 |
|
| Transactional service fees | 195 |
| 35 |
| — |
| 230 |
|
Corporate finance(2) | 178 |
| 1 |
| — |
| 179 |
|
Insurance distribution revenue(3) | 4 |
| 132 |
| — |
| 136 |
|
Insurance premiums(3) | — |
| 29 |
| (1 | ) | 28 |
|
| Loan servicing | 42 |
| 30 |
| 6 |
| 78 |
|
| Other | 17 |
| 81 |
| 1 |
| 99 |
|
Total commissions and fees(4) | $ | 2,200 |
| $ | 720 |
| $ | 6 |
| $ | 2,926 |
|
|
| | | | | | | | | | | | | | | | | | | | | | | | |
| | Three Months Ended September 30, | Nine Months Ended September 30, |
| | 2018 | 2018 |
| In millions of dollars | ICG | GCB | Corporate/Other | Total | ICG | GCB | Corporate/Other | Total |
| Investment banking | $ | 856 |
| $ | — |
| $ | — |
| $ | 856 |
| $ | 2,695 |
| $ | — |
| $ | — |
| $ | 2,695 |
|
| Brokerage commissions | 453 |
| 199 |
| — |
| 652 |
| 1,510 |
| 654 |
| — |
| 2,164 |
|
| Credit- and bank-card income | | | |
|
| | | | |
| Interchange fees | 268 |
| 2,063 |
| 1 |
| 2,332 |
| 804 |
| 5,963 |
| 11 |
| 6,778 |
|
| Card-related loan fees | 16 |
| 172 |
| — |
| 188 |
| 47 |
| 474 |
| 12 |
| 533 |
|
| Card rewards and partner payments | (125 | ) | (2,130 | ) | — |
| (2,255 | ) | (375 | ) | (6,070 | ) | (11 | ) | (6,456 | ) |
Deposit-related fees(1) | 239 |
| 160 |
| — |
| 399 |
| 711 |
| 503 |
| 1 |
| 1,215 |
|
| Transactional service fees | 171 |
| 22 |
| 1 |
| 194 |
| 543 |
| 64 |
| 4 |
| 611 |
|
Corporate finance(2) | 145 |
| 1 |
| — |
| 146 |
| 506 |
| 4 |
| — |
| 510 |
|
Insurance distribution revenue(3) | 3 |
| 144 |
| (4 | ) | 143 |
| 13 |
| 429 |
| 6 |
| 448 |
|
Insurance premiums(3) | — |
| 31 |
| (2 | ) | 29 |
| — |
| 96 |
| (4 | ) | 92 |
|
| Loan servicing | 42 |
| 27 |
| 8 |
| 77 |
| 118 |
| 89 |
| 31 |
| 238 |
|
| Other | 10 |
| 29 |
| 3 |
| 42 |
| 20 |
| 90 |
| 6 |
| 116 |
|
Total commissions and fees(4) | $ | 2,078 |
| $ | 718 |
| $ | 7 |
| $ | 2,803 |
| $ | 6,592 |
| $ | 2,296 |
| $ | 56 |
| $ | 8,944 |
|
| | | | Three Months Ended September 30, | Nine Months Ended September 30, | Three Months Ended March 31, |
| | 2017 | 2018 |
| In millions of dollars | ICG | GCB | Corporate/Other | Total | ICG | GCB | Corporate/Other | Total | ICG | GCB | Corporate/Other | Total |
| Investment banking | $ | 961 |
| $ | — |
| $ | — |
| $ | 961 |
| $ | 2,840 |
| $ | — |
| $ | — |
| $ | 2,840 |
| $ | 822 |
| $ | 5 |
| $ | — |
| $ | 827 |
|
| Brokerage commissions | 459 |
| 222 |
| 1 |
| 682 |
| 1,431 |
| 615 |
| 3 |
| 2,049 |
| 566 |
| 248 |
| — |
| 814 |
|
| Credit- and bank-card income | | | | | | | | | |
| Interchange fees | 242 |
| 1,912 |
| 24 |
| 2,178 |
| 705 |
| 5,507 |
| 87 |
| 6,299 |
| 260 |
| 1,874 |
| 5 |
| 2,139 |
|
| Card-related loan fees | 13 |
| 172 |
| 13 |
| 198 |
| 39 |
| 526 |
| 41 |
| 606 |
| 14 |
| 155 |
| 6 |
| 175 |
|
| Card rewards and partner payments | (105 | ) | (1,822 | ) | (8 | ) | (1,935 | ) | (316 | ) | (5,352 | ) | (49 | ) | (5,717 | ) | (124 | ) | (1,874 | ) | (5 | ) | (2,003 | ) |
Deposit-related fees(1) | 249 |
| 188 |
| 4 |
| 441 |
| 696 |
| 554 |
| 12 |
| 1,262 |
| 236 |
| 183 |
| 1 |
| 420 |
|
| Transactional service fees | 185 |
| 21 |
| 11 |
| 217 |
| 556 |
| 74 |
| 44 |
| 674 |
| 190 |
| 21 |
| 2 |
| 213 |
|
Corporate finance(2) | 183 |
| 2 |
| — |
| 185 |
| 616 |
| 4 |
| — |
| 620 |
| 142 |
| 1 |
| — |
| 143 |
|
Insurance distribution revenue(3) | 5 |
| 142 |
| 17 |
| 164 |
| 10 |
| 425 |
| 58 |
| 493 |
| 5 |
| 143 |
| 5 |
| 153 |
|
Insurance premiums(3) | — |
| 32 |
| (1 | ) | 31 |
| — |
| 97 |
| (4 | ) | 93 |
| — |
| 33 |
| (1 | ) | 32 |
|
| Loan servicing | 38 |
| 25 |
| 25 |
| 88 |
| 109 |
| 79 |
| 89 |
| 277 |
| 38 |
| 22 |
| 12 |
| 72 |
|
| Other | 2 |
| 25 |
| 4 |
| 31 |
| (36 | ) | 64 |
| 28 |
| 56 |
| 15 |
| 28 |
| 2 |
| 45 |
|
Total commissions and fees(4) | $ | 2,232 |
| $ | 919 |
| $ | 90 |
| $ | 3,241 |
| $ | 6,650 |
| $ | 2,593 |
| $ | 309 |
| $ | 9,552 |
| $ | 2,164 |
| $ | 839 |
| $ | 27 |
| $ | 3,030 |
|
| |
| (1) | Includes overdraft fees of $33$31 million and $35$32 million for the three months ended September 30,March 31, 2019 and 2018, and 2017, respectively, and $95 million and $101 million for the nine months ended September 30, 2018 and 2017, respectively. Overdraft fees are accounted for under ASC 310. |
| |
| (2) | Consists primarily of fees earned from structuring and underwriting loan syndications or related financing activity. This activity is accounted for under ASC 310. |
| |
| (3) | Previously reported as insurance premiums onin the Consolidated Statement of Income. |
| |
| (4) | Commissions and fees includes $(1,774)$(1,721) million and $(1,398)$(1,545) million not accounted for under ASC 606, Revenue from Contracts with Customers, for the three months ended September 30, 2018March 31, 2019 and 2017, respectively, and $(4,967) million and $(4,023) million for the nine months ended September 30, 2018 and 2017, respectively.2018. Amounts reported in Commissions and fees accounted for under other guidance primarily include card-related loan fees, card reward programs and certain partner payments, corporate finance fees, insurance premiums and loan servicing fees. |
Administration and Other Fiduciary Fees
The following table presents Administration and other fiduciary fees are primarily composed of custody fees and fiduciary fees.
The custody product is composed of numerous services related to the administration, safekeeping and reporting for both U.S. and non-U.S. denominated securities. The services offered to clients include trade settlement, safekeeping, income collection, corporate action notification, record-keeping and reporting, tax reporting and cash management. These services are provided for a wide range of securities, including but not limited to equities, municipal and corporate bonds, mortgage-backed and asset-backed securities, money market instruments, U.S. Treasuries and agencies, derivative instruments, mutual funds, alternative investments and precious metals. Custody fees are recognized as/when the associated promised service is satisfied, which normally occurs at the point in time the service is requested by the customer and provided by Citi.
Fiduciary fees consist of trust services and investment management services. As an escrow agent, Citi receives, safe-
keeps, services and manages clients’ escrowed assets such as cash, securities, property (including intellectual property), contracts or other collateral. Citi performs its escrow agent duties by safekeeping the funds during the specified time period agreed upon by all parties and therefore earns its revenue evenly during the contract duration.
Investment management services consist of managing assets on behalf of Citi’s retail and institutional clients. Revenue from these services primarily consists of asset-based fees for advisory accounts, which are based on the market value of the client’s assets and recognized monthly, when the market value is fixed. In some instances, the Company contracts with third-party advisors and with third-party custodians. The Company has determined that it acts as principal in the majority of these transactions and therefore presents the amounts paid to third parties gross within Other operating expenses.
The following table presents Administration and other fiduciary fees:
| | | | Three Months Ended September 30, | Nine Months Ended September 30, | Three Months Ended March 31, |
| | 2018 | 2019 |
| In millions of dollars | ICG | GCB | Corporate/Other | Total | ICG | GCB | Corporate/Other | Total | ICG | GCB | Corporate/Other | Total |
| Custody fees | $ | 371 |
| $ | 41 |
| $ | 18 |
| $ | 430 |
| $ | 1,138 |
| $ | 133 |
| $ | 50 |
| $ | 1,321 |
| $ | 364 |
| $ | 3 |
| $ | 16 |
| $ | 383 |
|
| Fiduciary fees | 160 |
| 158 |
| 12 |
| 330 |
| 492 |
| 455 |
| 31 |
| 978 |
| 152 |
| 146 |
| 12 |
| 310 |
|
| Guarantee fees | 136 |
| 14 |
| 1 |
| 151 |
| 403 |
| 43 |
| 5 |
| 451 |
| 130 |
| 14 |
| 2 |
| 146 |
|
Total administration and other fiduciary fees(1) | $ | 667 |
| $ | 213 |
| $ | 31 |
| $ | 911 |
| $ | 2,033 |
| $ | 631 |
| $ | 86 |
| $ | 2,750 |
| $ | 646 |
| $ | 163 |
| $ | 30 |
| $ | 839 |
|
|
| | | | | | | | | | | | |
| | Three Months Ended March 31, |
| | 2018 |
| In millions of dollars | ICG | GCB | Corporate/Other | Total |
| Custody fees | $ | 368 |
| $ | 47 |
| $ | 16 |
| $ | 431 |
|
| Fiduciary fees | 167 |
| 147 |
| 7 |
| 321 |
|
| Guarantee fees | 137 |
| 14 |
| 2 |
| 153 |
|
Total administration and other fiduciary fees(1) | $ | 672 |
| $ | 208 |
| $ | 25 |
| $ | 905 |
|
|
| | | | | | | | | | | | | | | | | | | | | | | | |
| | Three Months Ended September 30, | Nine Months Ended September 30, |
| | 2017 | 2017 |
| In millions of dollars | ICG | GCB | Corporate/Other | Total | ICG | GCB | Corporate/Other | Total |
| Custody fees | $ | 397 |
| $ | 44 |
| $ | 14 |
| $ | 455 |
| $ | 1,135 |
| $ | 123 |
| $ | 41 |
| $ | 1,299 |
|
| Fiduciary fees | 149 |
| 157 |
| 18 |
| 324 |
| 437 |
| 431 |
| 59 |
| 927 |
|
| Guarantee fees | 134 |
| 13 |
| 3 |
| 150 |
| 400 |
| 39 |
| 7 |
| 446 |
|
Total administration and other fiduciary fees(1) | $ | 680 |
| $ | 214 |
| $ | 35 |
| $ | 929 |
| $ | 1,972 |
| $ | 593 |
| $ | 107 |
| $ | 2,672 |
|
| |
| (1) | Administration and other fiduciary fees includes $151$146 million and $150$153 million for the three months ended September 30,March 31, 2019 and 2018, and 2017, respectively, and $451 million and $446 million for the nine months ended September 30, 2018 and 2017, respectively, that are not accounted for under ASC 606, Revenue from Contracts with Customers. These amounts include guarantee fees. |
6. PRINCIPAL TRANSACTIONS
Principal transactions revenue consists of realized and unrealized gains and losses from trading activities. Trading activities include revenues from fixed income, equities, credit and commodities products and foreign exchange transactions that are managed on a portfolio basis characterized by primary risk. Not included in the table below is the impact of net interest revenue related to trading activities, which is an
integral part of trading activities’ profitability. See Note 4 to the Consolidated Financial Statements for information about net interest revenue related to trading activities. Principal transactions include CVA (credit valuation adjustments on derivatives)adjustments) and FVA (funding valuation adjustments) on over-the-counter derivatives.derivatives, and gains (losses) on certain economic hedges on loans in ICG. These adjustments are discussed further in Note 20 to the Consolidated Financial Statements.
In certain transactions, Citi incurs fees and presents these fees paid to third parties in operating expenses.
The following table presents Principal transactions
revenue:
| | | | Three Months Ended September 30, | Nine Months Ended September 30, | Three Months Ended March 31, |
| In millions of dollars | 2018 | 2017 | 2018 | 2017 | 2019 | 2018 |
Interest rate risks(1) | $ | 1,403 |
| $ | 1,180 |
| $ | 4,576 |
| $ | 4,421 |
| $ | 1,718 |
| $ | 1,566 |
|
Foreign exchange risks(2) | 467 |
| 606 |
| 1,387 |
| 1,942 |
| 473 |
| 730 |
|
Equity risks(3) | 311 |
| 154 |
| 997 |
| 440 |
| 456 |
| 589 |
|
Commodity and other risks(4) | 244 |
| 112 |
| 544 |
| 434 |
| 119 |
| 101 |
|
Credit products and risks(5) | 141 |
| 196 |
| 502 |
| 748 |
| 38 |
| 256 |
|
| Total | $ | 2,566 |
| $ | 2,248 |
| $ | 8,006 |
| $ | 7,985 |
| $ | 2,804 |
| $ | 3,242 |
|
| |
| (1) | Includes revenues from government securities and corporate debt, municipal securities, mortgage securities and other debt instruments. Also includes spot and forward trading of currencies and exchange-traded and over-the-counter (OTC) currency options, options on fixed income securities, interest rate swaps, currency swaps, swap options, caps and floors, financial futures, OTC options and forward contracts on fixed income securities. |
| |
| (2) | Includes revenues from foreign exchange spot, forward, option and swap contracts, as well as foreign currency translation (FX translation) gains and losses. |
| |
| (3) | Includes revenues from common, preferred and convertible preferred stock, convertible corporate debt, equity-linked notes and exchange-traded and OTC equity options and warrants. |
| |
| (4) | Primarily includes revenues from crude oil, refined oil products, natural gas and other commodities trades. |
| |
| (5) | Includes revenues from structured credit products. |
7. INCENTIVE PLANS
For additional information on Citi’s incentive plans, see Note 7 to the Consolidated Financial Statements in Citi’s 20172018 Annual Report on Form 10-K.
8. RETIREMENT BENEFITS
For additional information on Citi’s retirement benefits, see Note 8 to the Consolidated Financial Statements in Citi’s 20172018 Annual Report on Form 10-K.
Net (Benefit) Expense
The following table summarizes the components of net (benefit) expense recognized in the Consolidated Statement of Income for the Company’s pension and postretirement plans for Significant Plans and All Other Plans:
| | | | Three Months Ended September 30, | Three Months Ended March 31, |
| | Pension plans | Postretirement benefit plans | Pension plans | Postretirement benefit plans |
| | U.S. plans | Non-U.S. plans | U.S. plans | Non-U.S. plans | U.S. plans | Non-U.S. plans | U.S. plans | Non-U.S. plans |
| In millions of dollars | 2018 | 2017 | 2018 | 2017 | 2018 | 2017 | 2018 | 2017 | 2019 | 2018 | 2019 | 2018 | 2019 | 2018 | 2019 | 2018 |
| Benefits earned during the period | $ | — |
| $ | 1 |
| $ | 35 |
| $ | 38 |
| $ | — |
| $ | — |
| $ | 2 |
| $ | 3 |
| $ | — |
| $ | 1 |
| $ | 36 |
| $ | 38 |
| $ | — |
| $ | — |
| $ | 2 |
| $ | 2 |
|
| Interest cost on benefit obligation | 132 |
| 131 |
| 73 |
| 76 |
| 6 |
| 9 |
| 26 |
| 27 |
| 130 |
| 123 |
| 75 |
| 75 |
| 7 |
| 6 |
| 26 |
| 26 |
|
| Expected return on plan assets | (210 | ) | (217 | ) | (71 | ) | (77 | ) | (4 | ) | (2 | ) | (22 | ) | (24 | ) | (203 | ) | (213 | ) | (68 | ) | (78 | ) | (5 | ) | (3 | ) | (21 | ) | (23 | ) |
| Amortization of unrecognized: | |
| | |
| |
| |
| |
| |
| |
| |
| | |
| |
| |
| |
| |
| |
|
| Prior service benefit | — |
| — |
| (1 | ) | (1 | ) | — |
| — |
| (2 | ) | (2 | ) | |
| Prior service cost (benefit) | | 1 |
| — |
| (1 | ) | (1 | ) | — |
| — |
| (2 | ) | (2 | ) |
| Net actuarial loss | 39 |
| 45 |
| 14 |
| 15 |
| — |
| — |
| 7 |
| 8 |
| 44 |
| 47 |
| 15 |
| 13 |
| — |
| — |
| 5 |
| 7 |
|
Curtailment loss(1) | — |
| 1 |
| — |
| — |
| — |
| — |
| — |
| — |
| |
Settlement loss(1) | — |
| — |
| — |
| 4 |
| — |
| — |
| — |
| — |
| — |
| — |
| — |
| 4 |
| — |
| — |
| — |
| — |
|
| Total net (benefit) expense | $ | (39 | ) | $ | (39 | ) | $ | 50 |
| $ | 55 |
| $ | 2 |
| $ | 7 |
| $ | 11 |
| $ | 12 |
| $ | (28 | ) | $ | (42 | ) | $ | 57 |
| $ | 51 |
| $ | 2 |
| $ | 3 |
| $ | 10 |
| $ | 10 |
|
| |
| (1) | Losses due to curtailment and settlement relate to repositioning and divestiture activities. |
|
| | | | | | | | | | | | | | | | | | | | | | | | |
| | Nine Months Ended September 30, |
| | Pension plans | Postretirement benefit plans |
| | U.S. plans | Non-U.S. plans | U.S. plans | Non-U.S. plans |
| In millions of dollars | 2018 | 2017 | 2018 | 2017 | 2018 | 2017 | 2018 | 2017 |
| Benefits earned during the period | $ | 1 |
| $ | 2 |
| $ | 111 |
| $ | 112 |
| $ | — |
| $ | — |
| $ | 7 |
| $ | 7 |
|
| Interest cost on benefit obligation | 381 |
| 406 |
| 220 |
| 221 |
| 19 |
| 20 |
| 77 |
| 76 |
|
| Expected return on plan assets | (634 | ) | (650 | ) | (221 | ) | (223 | ) | (10 | ) | (5 | ) | (67 | ) | (67 | ) |
| Amortization of unrecognized: | | | |
| |
| | |
| |
| |
|
| Prior service benefit | — |
| 1 |
| (3 | ) | (3 | ) | — |
| — |
| (7 | ) | (7 | ) |
| Net actuarial loss | 128 |
| 129 |
| 41 |
| 46 |
| — |
| — |
| 22 |
| 25 |
|
Curtailment loss(1) | 1 |
| 4 |
| — |
| — |
| — |
| — |
| — |
| — |
|
Settlement loss(1) | — |
| — |
| 5 |
| 8 |
| — |
| — |
| — |
| — |
|
| Total net (benefit) expense | $ | (123 | ) | $ | (108 | ) | $ | 153 |
| $ | 161 |
| $ | 9 |
| $ | 15 |
| $ | 32 |
| $ | 34 |
|
| |
(1) | Losses due to curtailment and settlement relate to repositioning and divestiture activities. |
Funded Status and Accumulated Other Comprehensive Income (AOCI)
The following tables summarizetable summarizes the funded status and amounts recognized inon the Consolidated Balance Sheet for the Company’s
| | | | Nine Months Ended September 30, 2018 | Three Months Ended March 31, 2019 |
| | Pension plans | Postretirement benefit plans | Pension plans | Postretirement benefit plans |
| In millions of dollars | U.S. plans | Non-U.S. plans | U.S. plans | Non-U.S. plans | U.S. plans | Non-U.S. plans | U.S. plans | Non-U.S. plans |
| Change in projected benefit obligation | |
| |
| |
| |
| |
| |
| |
| |
|
| Projected benefit obligation at beginning of year | $ | 14,040 |
| $ | 7,433 |
| $ | 699 |
| $ | 1,261 |
| $ | 12,655 |
| $ | 7,149 |
| $ | 662 |
| $ | 1,159 |
|
| Plans measured annually | (28 | ) | (1,987 | ) | — |
| (334 | ) | (25 | ) | (1,862 | ) | — |
| (307 | ) |
| Projected benefit obligation at beginning of year—Significant Plans | $ | 14,012 |
| $ | 5,446 |
| $ | 699 |
| $ | 927 |
| $ | 12,630 |
| $ | 5,287 |
| $ | 662 |
| $ | 852 |
|
| First quarter activity | (576 | ) | 151 |
| (32 | ) | 89 |
| |
| Second quarter activity | (595 | ) | (344 | ) | — |
| (65 | ) | |
| Projected benefit obligation at June 30, 2018—Significant Plans | $ | 12,841 |
| $ | 5,253 |
| $ | 667 |
| $ | 951 |
| |
| Benefits earned during the period | — |
| 20 |
| — |
| 2 |
| — |
| 20 |
| — |
| 1 |
|
| Interest cost on benefit obligation | 132 |
| 60 |
| 6 |
| 23 |
| 130 |
| 63 |
| 7 |
| 23 |
|
| Actuarial gain | (60 | ) | (59 | ) | — |
| (61 | ) | |
| Actuarial loss | | 493 |
| 252 |
| 13 |
| 38 |
|
| Benefits paid, net of participants’ contributions and government subsidy | (217 | ) | (68 | ) | (15 | ) | (14 | ) | (215 | ) | (55 | ) | (7 | ) | (11 | ) |
| Foreign exchange impact and other | — |
| 48 |
| — |
| 48 |
| — |
| 13 |
| — |
| 11 |
|
| Projected benefit obligation at period end—Significant Plans | $ | 12,696 |
| $ | 5,254 |
| $ | 658 |
| $ | 949 |
| $ | 13,038 |
| $ | 5,580 |
| $ | 675 |
| $ | 914 |
|
|
| | | | | | | | | | | | |
| | Three Months Ended March 31, 2019 |
| | Pension plans | Postretirement benefit plans |
| In millions of dollars | U.S. plans | Non-U.S. plans | U.S. plans | Non-U.S. plans |
| Change in plan assets | |
| |
| |
| |
|
| Plan assets at fair value at beginning of year | $ | 11,490 |
| $ | 6,699 |
| $ | 345 |
| $ | 1,036 |
|
| Plans measured annually | — |
| (1,248 | ) | — |
| (9 | ) |
Plan assets at fair value at beginning of year—Significant Plans | $ | 11,490 |
| $ | 5,451 |
| $ | 345 |
| $ | 1,027 |
|
| Actual return on plan assets | 688 |
| 273 |
| 15 |
| 29 |
|
| Company contributions, net of reimbursements | 14 |
| 14 |
| (6 | ) | — |
|
Benefits paid, net of participants’ contributions and government subsidy
| (215 | ) | (55 | ) | (7 | ) | (11 | ) |
| Foreign exchange impact and other | — |
| 25 |
| — |
| 14 |
|
| Plan assets at fair value at period end—Significant Plans | $ | 11,977 |
| $ | 5,708 |
| $ | 347 |
| $ | 1,059 |
|
| Funded status of the Significant Plans | | | | |
Qualified plans(1) | $ | (391 | ) | $ | 128 |
| $ | (328 | ) | $ | 145 |
|
| Nonqualified plans | (670 | ) | — |
| — |
| — |
|
| Funded status of the plans at period end—Significant Plans | $ | (1,061 | ) | $ | 128 |
| $ | (328 | ) | $ | 145 |
|
| Net amount recognized at period end | |
| |
| |
| |
|
| Benefit asset | $ | — |
| $ | 766 |
| $ | — |
| $ | 145 |
|
| Benefit liability | (1,061 | ) | (638 | ) | (328 | ) | — |
|
| Net amount recognized on the balance sheet—Significant Plans | $ | (1,061 | ) | $ | 128 |
| $ | (328 | ) | $ | 145 |
|
| Amounts recognized in AOCI at period end | |
| |
| |
|
| Prior service benefit | $ | — |
| $ | 15 |
| $ | — |
| $ | 73 |
|
| Net actuarial (loss) gain | (6,848 | ) | (978 | ) | 50 |
| (314 | ) |
| Net amount recognized in equity (pretax)—Significant Plans | $ | (6,848 | ) | $ | (963 | ) | $ | 50 |
| $ | (241 | ) |
| Accumulated benefit obligation at period end—Significant Plans | $ | 13,029 |
| $ | 5,302 |
| $ | 675 |
| $ | 914 |
|
|
| | | | | | | | | | | | |
| | Nine Months Ended September 30, 2018 |
| | Pension plans | Postretirement benefit plans |
| In millions of dollars | U.S. plans | Non-U.S. plans | U.S. plans | Non-U.S. plans |
| Change in plan assets | |
| |
| |
| |
|
| Plan assets at fair value at beginning of year | $ | 12,725 |
| $ | 7,128 |
| $ | 262 |
| $ | 1,119 |
|
| Plans measured annually | — |
| (1,305 | ) | — |
| (10 | ) |
| Plan assets at fair value at beginning of year—Significant Plans | $ | 12,725 |
| $ | 5,823 |
| $ | 262 |
| $ | 1,109 |
|
| First quarter activity | (349 | ) | 115 |
| (21 | ) | 58 |
|
| Second quarter activity | (220 | ) | (328 | ) | (4 | ) | (78 | ) |
Plan assets at fair value at June 30, 2018—Significant Plans | $ | 12,156 |
| $ | 5,610 |
| $ | 237 |
| $ | 1,089 |
|
| Actual return on plan assets | 123 |
| 7 |
| 1 |
| 23 |
|
| Company contributions, net of reimbursements | 13 |
| 15 |
| 153 |
| — |
|
Benefits paid, net of participants’ contributions and government subsidy
| (217 | ) | (68 | ) | (15 | ) | (14 | ) |
| Foreign exchange impact and other | — |
| 40 |
| — |
| 56 |
|
| Plan assets at fair value at period end—Significant Plans | $ | 12,075 |
| $ | 5,604 |
| $ | 376 |
| $ | 1,154 |
|
| Funded status of the Significant Plans | | | | |
Qualified plans(1) | $ | 36 |
| $ | 350 |
| $ | (282 | ) | $ | 205 |
|
| Nonqualified plans | (657 | ) | — |
| — |
| — |
|
| Funded status of the plans at period end—Significant Plans | $ | (621 | ) | $ | 350 |
| $ | (282 | ) | $ | 205 |
|
| Net amount recognized at period end | |
| |
| |
| |
|
| Benefit asset | $ | 36 |
| $ | 850 |
| $ | — |
| $ | 205 |
|
| Benefit liability | (657 | ) | (500 | ) | (282 | ) | — |
|
| Net amount recognized on the balance sheet—Significant Plans | $ | (621 | ) | $ | 350 |
| $ | (282 | ) | $ | 205 |
|
| Amounts recognized in AOCI at period end | |
| |
| |
|
| Prior service benefit | $ | — |
| $ | 25 |
| $ | — |
| $ | 80 |
|
| Net actuarial (loss) gain | (6,313 | ) | (807 | ) | 77 |
| (284 | ) |
| Net amount recognized in equity (pretax)—Significant Plans | $ | (6,313 | ) | $ | (782 | ) | $ | 77 |
| $ | (204 | ) |
| Accumulated benefit obligation at period end—Significant Plans | $ | 12,689 |
| $ | 4,980 |
| $ | 658 |
| $ | 949 |
|
| |
| (1) | The U.S. qualified pension plan is fully funded pursuant to the Employee Retirement Income Security Act of 1974, as amended (ERISA), funding rules as of January 1, 20182019 and no minimum required funding is expected for 2018.2019. |
The following table shows the change in AOCI related to the Company’s pension, postretirement and post employment plans: | | | In millions of dollars | Three Months Ended
September 30, 2018 | Nine Months Ended September 30, 2018 | Three Months Ended
March 31, 2019 | For Year Ended December 31, 2018 |
Beginning of period balance, net of tax(1)(2) | $ | (5,794 | ) | $ | (6,183 | ) | $ | (6,257 | ) | $ | (6,183 | ) |
| Actuarial assumptions changes and plan experience | 181 |
| 1,300 |
| (795 | ) | 1,288 |
|
| Net asset loss due to difference between actual and expected returns | (140 | ) | (919 | ) | |
| Net asset gain (loss) due to difference between actual and expected returns | | 690 |
| (1,732 | ) |
| Net amortization | 49 |
| 161 |
| 62 |
| 214 |
|
| Prior service cost | | — |
| (7 | ) |
Curtailment/settlement gain(3) | — |
| 6 |
| — |
| 7 |
|
| Foreign exchange impact and other | (35 | ) | 1 |
| (25 | ) | 136 |
|
| Change in deferred taxes, net | (29 | ) | (134 | ) | 4 |
| 20 |
|
| Change, net of tax | $ | 26 |
| $ | 415 |
| $ | (64 | ) | $ | (74 | ) |
End of period balance, net of tax(1)(2) | $ | (5,768 | ) | $ | (5,768 | ) | $ | (6,321 | ) | $ | (6,257 | ) |
| |
| (1) | See Note 17 to the Consolidated Financial Statements for further discussion of net AOCI balance. |
| |
| (2) | Includes net-of-tax amounts for certain profit sharing plans outside the U.S. |
| |
| (3) | Gains due to curtailmentCurtailment and settlement relate to repositioning and divestiture activities. |
Plan Assumptions
The discount rates utilized during the period in determining the pension and postretirement net (benefit) expense for the Significant Plans are as follows:
|
| | |
| Net (benefit) expense assumed discount rates during the period | Three Months Ended |
| Mar. 31, 2019 | Dec. 31, 2018 |
| U.S. plans | | |
| Qualified pension | 4.25% | 4.30% |
| Nonqualified pension | 4.25 | 4.30 |
| Postretirement | 4.20 | 4.20 |
| Non-U.S. plans | | |
| Pension | 0.75-10.75 | 0.95-10.75 |
| Weighted average | 5.09 | 5.08 |
| Postretirement | 10.75 | 10.10 |
|
| | |
| Net (benefit) expense assumed discount rates during the period | Three Months Ended |
| Sept. 30, 2018 | Jun. 30, 2018 |
| U.S. plans | | |
| Qualified pension | 4.25% | 3.95% |
| Nonqualified pension | 4.25 | 3.95 |
| Postretirement | 4.20 | 3.90 |
| Non-U.S. plans | | |
| Pension | 0.80-10.70 | 0.75-9.90 |
| Weighted average | 4.88 | 4.86 |
| Postretirement | 9.50 | 9.50 |
The discount rates utilized at period-end in determining the pension and postretirement benefit obligations for the Significant Plans are as follows:
|
| | | |
| Plan obligations assumed discount rates at period ended | Sept. 30, 2018 | Jun. 30, 2018 | Mar. 31, 2018 |
| U.S. plans | | | |
| Qualified pension | 4.30% | 4.25% | 3.95% |
| Nonqualified pension | 4.30 | 4.25 | 3.95 |
| Postretirement | 4.20 | 4.20 | 3.90 |
| Non-U.S. plans | | | |
| Pension | 0.95-10.75 | 0.80-10.70 | 0.75-9.90 |
| Weighted average | 5.08 | 4.88 | 4.86 |
| Postretirement | 10.10 | 9.50 | 9.50 |
|
| | | |
| Plan obligations assumed discount rates at period ended | Mar. 31, 2019 | Dec. 31, 2018 | Mar. 31, 2018 |
| U.S. plans | | | |
| Qualified pension | 3.85% | 4.25% | 3.95% |
| Nonqualified pension | 3.90 | 4.25 | 3.95 |
| Postretirement | 3.80 | 4.20 | 3.90 |
| Non-U.S. plans | | | |
| Pension | 0.45-10.30 | 0.75-10.75 | 0.75-9.90 |
| Weighted average | 4.74 | 5.09 | 4.88 |
| Postretirement | 10.30 | 10.75 | 9.50 |
Sensitivities of Certain Key Assumptions
The following table summarizes the estimated effect on the Company’s Significant Plans quarterly expense of a one-percentage-point change in the discount rate:
|
| | | | | | |
| | Three Months Ended March 31, 2019 |
| In millions of dollars | One-percentage-point increase | One-percentage-point decrease |
| Pension | | |
| U.S. plans | $ | 5 |
| $ | (8 | ) |
| Non-U.S. plans | (2 | ) | 6 |
|
| Postretirement | | |
| U.S. plans | — |
| (1 | ) |
| Non-U.S. plans | (2 | ) | 2 |
|
|
| | | | | | |
| | Three Months Ended September 30, 2018 |
| In millions of dollars | One-percentage-point increase | One-percentage-point decrease |
| Pension | | |
| U.S. plans | $ | 5 |
| $ | (8 | ) |
| Non-U.S. plans | (3 | ) | 5 |
|
| Postretirement | | |
| U.S. plans | — |
| (1 | ) |
| Non-U.S. plans | (2 | ) | 2 |
|
For the U.S. pension plans, there were no required minimum cash contributions during the first ninethree months of 2018.2019.
The following table summarizes the Company’s actual contributions for the ninethree months ended September 30,March 31, 2019 and 2018, and 2017, as well as estimated expected Company contributions for the remainder of 20182019 and the actual contributions made for the remainder of 2017:2018:
| | | | Pension plans | Postretirement plans | Pension plans | Postretirement plans |
| | U.S. plans(1) | Non-U.S. plans | U.S. plans | Non-U.S. plans | U.S. plans(1) | Non-U.S. plans | U.S. plans | Non-U.S. plans |
| In millions of dollars | 2018 | 2017 | 2018 | 2017 | 2018 | 2017 | 2018 | 2017 | 2019 | 2018 | 2019 | 2018 | 2019 | 2018 | 2019 | 2018 |
Company contributions(2) for the nine months ended September 30 | $ | 42 |
| $ | 90 |
| $ | 143 |
| $ | 109 |
| $ | 159 |
| $ | 30 |
| $ | 7 |
| $ | 7 |
| |
Company contributions(2) for the three months ended March 31 | | $ | 14 |
| $ | 14 |
| $ | 34 |
| $ | 29 |
| $ | — |
| $ | — |
| $ | 3 |
| $ | 3 |
|
Company contributions made during the remainder of the year
| — |
| 15 |
| — |
| 26 |
| — |
| 146 |
| — |
| 3 |
| — |
| 41 |
| — |
| 153 |
| — |
| 150 |
| — |
| 6 |
|
Company contributions expected to be made during the remainder of the year | 15 |
| — |
| 33 |
| — |
| 2 |
| — |
| 2 |
| — |
| 43 |
| — |
| 107 |
| — |
| — |
| — |
| 7 |
| — |
|
| |
| (1) | The U.S. pension plans include benefits paid directly by the Company for the nonqualified pension plans. |
| |
| (2) | Company contributions are composed of cash contributions made to the plans and benefits paid directly by the Company. |
Defined Contribution Plans
The following table summarizes the Company’s contributions
for the defined contribution plans: |
| | | | | | |
| | Three Months Ended March 31, |
| In millions of dollars | 2019 | 2018 |
| U.S. plans | $ | 99 |
| $ | 104 |
|
| Non-U.S. plans | 68 |
| 76 |
|
|
| | | | | | | | | | | | |
| | Three Months Ended September 30, | Nine Months Ended September 30, |
| In millions of dollars | 2018 | 2017 | 2018 | 2017 |
| U.S. plans | $ | 90 |
| $ | 95 |
| $ | 293 |
| $ | 293 |
|
| Non-U.S. plans | 68 |
| 68 |
| 216 |
| 203 |
|
Post Employment Plans
The following table summarizes the components of net expense recognized in the Consolidated Statement of Income for the Company’s U.S. post employment plans:
|
| | | | | | |
| | Three Months Ended March 31, |
| In millions of dollars | 2019 | 2018 |
| Service-related expense |
|
|
|
|
| Interest cost on benefit obligation | $ | — |
| $ | — |
|
| Expected return on plan assets | — |
| — |
|
| Amortization of unrecognized: |
|
|
|
|
| Prior service benefit | — |
| (8 | ) |
| Net actuarial loss | 1 |
| 1 |
|
| Total service-related benefit | $ | 1 |
| $ | (7 | ) |
| Non-service-related expense | $ | 4 |
| $ | 6 |
|
| Total net (benefit) expense | $ | 5 |
| $ | (1 | ) |
|
| | | | | | | | | | | | |
| | Three Months Ended September 30, | Nine Months Ended
September 30, |
| In millions of dollars | 2018 | 2017 | 2018 | 2017 |
| Interest cost on benefit obligation | $ | — |
| $ | — |
| $ | 1 |
| $ | 1 |
|
| Expected return on plan assets | — |
| — |
| (1 | ) | — |
|
| Amortization of unrecognized: |
|
|
|
|
|
|
|
|
Prior service benefit | (8 | ) | (8 | ) | (23 | ) | (23 | ) |
Net actuarial loss | 1 |
| 1 |
| 2 |
| 2 |
|
Total service- related benefit | $ | (7 | ) | $ | (7 | ) | $ | (21 | ) | $ | (20 | ) |
Non-service- related expense | $ | 4 |
| $ | 9 |
| $ | 7 |
| $ | 21 |
|
Total net (benefit) expense
| $ | (3 | ) | $ | 2 |
| $ | (14 | ) | $ | 1 |
|
9. EARNINGS PER SHARE
The following table reconciles the income and share data used in the basic and diluted earnings per share (EPS) computations:
| | | | Three Months Ended September 30, | Nine Months Ended September 30, | Three Months Ended March 31, |
| In millions of dollars, except per share amounts | 2018 | 2017 | 2018 | 2017 | 2019 | 2018 |
| Income from continuing operations before attribution of noncontrolling interests | $ | 4,633 |
| $ | 4,137 |
| $ | 13,783 |
| $ | 12,138 |
| $ | 4,737 |
| $ | 4,649 |
|
| Less: Noncontrolling interests from continuing operations | 3 |
| (1 | ) | 51 |
| 41 |
| 25 |
| 22 |
|
| Net income from continuing operations (for EPS purposes) | $ | 4,630 |
| $ | 4,138 |
| $ | 13,732 |
| $ | 12,097 |
| $ | 4,712 |
| $ | 4,627 |
|
| Loss from discontinued operations, net of taxes | (8 | ) | (5 | ) | — |
| (2 | ) | (2 | ) | (7 | ) |
| Citigroup's net income | $ | 4,622 |
| $ | 4,133 |
| $ | 13,732 |
| $ | 12,095 |
| $ | 4,710 |
| $ | 4,620 |
|
Less: Preferred dividends(1) | 270 |
| 272 |
| 860 |
| 893 |
| 262 |
| 272 |
|
| Net income available to common shareholders | $ | 4,352 |
| $ | 3,861 |
| $ | 12,872 |
| $ | 11,202 |
| $ | 4,448 |
| $ | 4,348 |
|
| Less: Dividends and undistributed earnings allocated to employee restricted and deferred shares with nonforfeitable rights to dividends, applicable to basic EPS | 51 |
| 53 |
| 151 |
| 156 |
| 59 |
| 51 |
|
| Net income allocated to common shareholders for basic EPS | $ | 4,301 |
| $ | 3,808 |
| $ | 12,721 |
| $ | 11,046 |
| |
| Net income allocated to common shareholders for diluted EPS | 4,301 |
| 3,808 |
| 12,721 |
| 11,046 |
| |
| Net income allocated to common shareholders for basic and diluted EPS | | 4,389 |
| 4,297 |
|
Weighted-average common shares outstanding applicable to basic EPS (in millions) | 2,479.8 |
| 2,683.6 |
| 2,524.1 |
| 2,729.3 |
| 2,340.4 |
| 2,561.6 |
|
Effect of dilutive securities(2) | | | |
| |
| |
Options(3) | 0.2 |
| 0.1 |
| 0.1 |
| 0.1 |
| |
| Effect of dilutive securities | | |
Options(2) | | 0.1 |
| 0.1 |
|
| Other employee plans | 1.4 |
| — |
| 1.3 |
| — |
| 1.9 |
| 1.3 |
|
Adjusted weighted-average common shares outstanding applicable to diluted EPS(4) | 2,481.4 |
| 2,683.7 |
| 2,525.5 |
| 2,729.5 |
| |
Basic earnings per share(5) | | | |
| |
| |
Adjusted weighted-average common shares outstanding applicable to diluted EPS(3) | | 2,342.4 |
| 2,563.0 |
|
Basic earnings per share(4) | | |
| Income from continuing operations | $ | 1.74 |
| $ | 1.42 |
| $ | 5.04 |
| $ | 4.05 |
| $ | 1.88 |
| $ | 1.68 |
|
| Discontinued operations | — |
| — |
| — |
| — |
| — |
| — |
|
| Net income | $ | 1.73 |
| $ | 1.42 |
| $ | 5.04 |
| $ | 4.05 |
| $ | 1.88 |
| $ | 1.68 |
|
Diluted earnings per share(5) | | | | | |
Diluted earnings per share(4) | | |
| Income from continuing operations | $ | 1.74 |
| $ | 1.42 |
| $ | 5.04 |
| $ | 4.05 |
| $ | 1.87 |
| $ | 1.68 |
|
| Discontinued operations | — |
| — |
| — |
| — |
| — |
| — |
|
| Net income | $ | 1.73 |
| $ | 1.42 |
| $ | 5.04 |
| $ | 4.05 |
| $ | 1.87 |
| $ | 1.68 |
|
| |
| (1) | As of September 30, 2018,March 31, 2019, Citi estimates it will distribute preferred dividends of approximately $313$846 million during the remainder of 2018,2019, assuming such dividends are declared by the Citi Board of Directors. During the first nine monthsquarter of 2018,2019, Citi redeemed all of its 3.819.2 million Series AAL preferred shares for $96.8 million and all of its 4.9 million Series E preferred shares for $121.3 million. All preferred shares were redeemed at par value. Citi redeemed all of its 23 million Series C preferred shares for $575$480 million in October 2018.February 2019. |
| |
| (2) | Warrants issuedDuring the first quarter of 2019, no significant options to the U.S. Treasury as part of the Troubled Asset Relief Program (TARP) and the loss-sharing agreement (all of which were subsequently sold to the public in January 2011), with exercise prices of $178.50 and $103.82 per share for approximately 21.0 million and 25.5 millionpurchase shares of Citigroup common stock respectively. Both warrants were not included in the computation of earnings per share in the three and nine months ended September 30, 2018 and 2017 because they were anti-dilutive. |
| |
(3) | outstanding. During the third quartersfirst quarter of 2018, and 2017, weighted-average options to purchase 0.5 million and 0.8 million shares of common stock respectively, were outstanding but not included in the computation of earnings per share because the weighted-average exercise pricesprice of $142.30 and $206.70$149.41 per share respectively, werewas anti-dilutive. |
| |
(4)(3) | Due to rounding, common shares outstanding applicable to basic EPS and the effect of dilutive securities may not sum to common shares outstanding applicable to diluted EPS. |
| |
(5)(4) | Due to rounding, earnings per share on continuing operations and discontinued operations may not sum to earnings per share on net income. |
10. FEDERAL FUNDS, SECURITIES BORROWED, LOANED AND SUBJECT TO REPURCHASE AGREEMENTS
For additional information on the Company’s resale and repurchase agreements and securities borrowing and lending agreements, see Note 11 to the Consolidated Financial Statements in Citi’s 20172018 Annual Report on Form 10-K.
Federal funds sold and securities borrowed and purchased under agreements to resell, at their respective carrying values, consisted of the following:
|
| | | | | | |
| In millions of dollars | March 31,
2019 | December 31, 2018 |
| Federal funds sold | $ | — |
| $ | — |
|
| Securities purchased under agreements to resell | 163,382 |
| 159,364 |
|
| Deposits paid for securities borrowed | 101,113 |
| 111,320 |
|
Total(1) | $ | 264,495 |
| $ | 270,684 |
|
|
| | | | | | |
| In millions of dollars | September 30,
2018 | December 31, 2017 |
| Federal funds sold | $ | 20 |
| $ | — |
|
| Securities purchased under agreements to resell | 152,889 |
| 130,984 |
|
| Deposits paid for securities borrowed | 128,032 |
| 101,494 |
|
Total(1) | $ | 280,941 |
| $ | 232,478 |
|
Federal funds purchased and securities loaned and sold under agreements to repurchase, at their respective carrying values, consisted of the following:
|
| | | | | | |
| In millions of dollars | March 31,
2019 | December 31, 2018 |
| Federal funds purchased | $ | — |
| $ | — |
|
| Securities sold under agreements to repurchase | 172,231 |
| 166,090 |
|
| Deposits received for securities loaned | 18,141 |
| 11,678 |
|
Total(1) | $ | 190,372 |
| $ | 177,768 |
|
|
| | | | | | |
| In millions of dollars | September 30,
2018 | December 31, 2017 |
| Federal funds purchased | $ | 117 |
| $ | 326 |
|
| Securities sold under agreements to repurchase | 161,987 |
| 142,646 |
|
| Deposits received for securities loaned | 13,811 |
| 13,305 |
|
Total(1) | $ | 175,915 |
| $ | 156,277 |
|
| |
| (1) | The above tables do not include securities-for-securities lending transactions of $19.9$14.6 billion and $14.0$15.9 billion at September 30, 2018March 31, 2019 and December 31, 2017,2018, respectively, where the Company acts as lender and receives securities that can be sold or pledged as collateral. In these transactions, the Company recognizes the securities received at fair value within Other assets and the obligation to return those securities as a liability within Brokerage payables. |
It is the Company’s policy to take possession of the underlying collateral, monitor its market value relative to the amounts due under the agreements and, when necessary, require prompt transfer of additional collateral in order to maintain contractual margin protection. For resale and repurchase agreements, when necessary, the Company posts additional collateral in order to maintain contractual margin protection.
A substantial portion of the resale and repurchase agreements is recorded at fair value, as described in Notes 20 and 21 to the Consolidated Financial Statements. The remaining portion is carried at the amount of cash initially advanced or received, plus accrued interest, as specified in the respective agreements.
A substantial portion of securities borrowing and lending agreements is recorded at the amount of cash advanced or received. The remaining portion is recorded at fair value as the Company elected the fair value option for certain securities borrowed and loaned portfolios, as described in Note 21 to the Consolidated Financial Statements. With respect to securities loaned, the Company receives cash collateral in an amount generally in excess of the market value of the securities loaned. The Company monitors the market value of securities borrowed and securities loaned on a daily basis and obtains or posts additional collateral in order to maintain contractual margin protection.
The following tables present the gross and net resale and repurchase agreements and securities borrowing and lending
agreements and the related offsetting amount permitted under ASC 210-20-45. The tables also include amounts related to financial instruments that are not permitted to be offset under ASC 210-20-45, but would be eligible for offsetting to the extent that an event of default occurred and a legal opinion supporting enforceability of the offsetting rights has been obtained. Remaining exposures continue to be secured by financial collateral, but the Company may not have sought or been able to obtain a legal opinion evidencing enforceability of the offsetting right.
| | | | As of September 30, 2018 | As of March 31, 2019 |
| In millions of dollars | Gross amounts
of recognized
assets | Gross amounts
offset on the
Consolidated
Balance Sheet(1) | Net amounts of
assets included on
the Consolidated
Balance Sheet(2) | Amounts
not offset on the
Consolidated Balance
Sheet but eligible for
offsetting upon
counterparty default(3) | Net
amounts(4) | Gross amounts
of recognized
assets | Gross amounts
offset on the
Consolidated
Balance Sheet(1) | Net amounts of
assets included on
the Consolidated
Balance Sheet(2) | Amounts
not offset on the
Consolidated Balance
Sheet but eligible for
offsetting upon
counterparty default(3) | Net
amounts(4) |
| Securities purchased under agreements to resell | $ | 248,802 |
| $ | 95,913 |
| $ | 152,889 |
| $ | 121,141 |
| $ | 31,748 |
| $ | 268,095 |
| $ | 104,713 |
| $ | 163,382 |
| $ | 129,911 |
| $ | 33,471 |
|
| Deposits paid for securities borrowed | 128,032 |
| — |
| 128,032 |
| 29,461 |
| 98,571 |
| 101,113 |
| — |
| 101,113 |
| 28,040 |
| 73,073 |
|
| Total | $ | 376,834 |
| $ | 95,913 |
| $ | 280,921 |
| $ | 150,602 |
| $ | 130,319 |
| $ | 369,208 |
| $ | 104,713 |
| $ | 264,495 |
| $ | 157,951 |
| $ | 106,544 |
|
|
| | | | | | | | | | | | | | | |
| In millions of dollars | Gross amounts
of recognized
liabilities | Gross amounts
offset on the
Consolidated
Balance Sheet(1) | Net amounts of
liabilities included on
the Consolidated
Balance Sheet(2) | Amounts
not offset on the
Consolidated Balance
Sheet but eligible for
offsetting upon
counterparty default(3) | Net
amounts(4) |
| Securities sold under agreements to repurchase | $ | 276,944 |
| $ | 104,713 |
| $ | 172,231 |
| $ | 91,923 |
| $ | 80,308 |
|
| Deposits received for securities loaned | 18,141 |
| — |
| 18,141 |
| 5,351 |
| 12,790 |
|
| Total | $ | 295,085 |
| $ | 104,713 |
| $ | 190,372 |
| $ | 97,274 |
| $ | 93,098 |
|
| | | | | | | | | | | | | As of December 31, 2018 |
| In millions of dollars | Gross amounts
of recognized
liabilities | Gross amounts
offset on the
Consolidated
Balance Sheet(1) | Net amounts of
liabilities included on
the Consolidated
Balance Sheet(2) | Amounts
not offset on the
Consolidated Balance
Sheet but eligible for
offsetting upon
counterparty default(3) | Net
amounts(4) | Gross amounts
of recognized
assets | Gross amounts
offset on the
Consolidated
Balance Sheet(1) | Net amounts of
assets included on
the Consolidated
Balance Sheet(2) | Amounts
not offset on the
Consolidated Balance
Sheet but eligible for
offsetting upon
counterparty default(3) | Net
amounts(4) |
| Securities sold under agreements to repurchase | $ | 257,900 |
| $ | 95,913 |
| $ | 161,987 |
| $ | 87,917 |
| $ | 74,070 |
| |
| Deposits received for securities loaned | 13,811 |
| — |
| 13,811 |
| 4,730 |
| 9,081 |
| |
| Securities purchased under agreements to resell | | $ | 246,788 |
| $ | 87,424 |
| $ | 159,364 |
| $ | 124,557 |
| $ | 34,807 |
|
| Deposits paid for securities borrowed | | 111,320 |
| — |
| 111,320 |
| 35,766 |
| 75,554 |
|
| Total | $ | 271,711 |
| $ | 95,913 |
| $ | 175,798 |
| $ | 92,647 |
| $ | 83,151 |
| $ | 358,108 |
| $ | 87,424 |
| $ | 270,684 |
| $ | 160,323 |
| $ | 110,361 |
|
|
| | | | | | | | | | | | | | | |
| | As of December 31, 2017 |
| In millions of dollars | Gross amounts
of recognized
assets | Gross amounts
offset on the
Consolidated
Balance Sheet(1) | Net amounts of
assets included on
the Consolidated
Balance Sheet(2) | Amounts
not offset on the
Consolidated Balance
Sheet but eligible for
offsetting upon
counterparty default(3) | Net
amounts(4) |
| Securities purchased under agreements to resell | $ | 204,460 |
| $ | 73,476 |
| $ | 130,984 |
| $ | 103,022 |
| $ | 27,962 |
|
| Deposits paid for securities borrowed | 101,494 |
| — |
| 101,494 |
| 22,271 |
| 79,223 |
|
| Total | $ | 305,954 |
| $ | 73,476 |
| $ | 232,478 |
| $ | 125,293 |
| $ | 107,185 |
|
| | | In millions of dollars | Gross amounts
of recognized
liabilities | Gross amounts
offset on the
Consolidated
Balance Sheet(1) | Net amounts of
liabilities included on
the Consolidated
Balance Sheet(2) | Amounts
not offset on the
Consolidated Balance
Sheet but eligible for
offsetting upon
counterparty default(3) | Net
amounts(4) | Gross amounts
of recognized
liabilities | Gross amounts
offset on the
Consolidated
Balance Sheet(1) | Net amounts of
liabilities included on
the Consolidated
Balance Sheet(2) | Amounts
not offset on the
Consolidated Balance
Sheet but eligible for
offsetting upon
counterparty default(3) | Net
amounts(4) |
| Securities sold under agreements to repurchase | $ | 216,122 |
| $ | 73,476 |
| $ | 142,646 |
| $ | 73,716 |
| $ | 68,930 |
| $ | 253,514 |
| $ | 87,424 |
| $ | 166,090 |
| $ | 82,823 |
| $ | 83,267 |
|
| Deposits received for securities loaned | 13,305 |
| — |
| 13,305 |
| 4,079 |
| 9,226 |
| 11,678 |
| — |
| 11,678 |
| 3,415 |
| 8,263 |
|
| Total | $ | 229,427 |
| $ | 73,476 |
| $ | 155,951 |
| $ | 77,795 |
| $ | 78,156 |
| $ | 265,192 |
| $ | 87,424 |
| $ | 177,768 |
| $ | 86,238 |
| $ | 91,530 |
|
| |
| (1) | Includes financial instruments subject to enforceable master netting agreements that are permitted to be offset under ASC 210-20-45. |
| |
| (2) | The total of this column for each period excludes federal funds sold/purchased. See tables above. |
| |
| (3) | Includes financial instruments subject to enforceable master netting agreements that are not permitted to be offset under ASC 210-20-45, but would be eligible for offsetting to the extent that an event of default has occurred and a legal opinion supporting enforceability of the offsetting right has been obtained. |
| |
| (4) | Remaining exposures continue to be secured by financial collateral, but the Company may not have sought or been able to obtain a legal opinion evidencing enforceability of the offsetting right. |
The following tables present the gross amount of liabilities associated with repurchase agreements and securities lending agreements, by remaining contractual maturity:
| | | | As of September 30, 2018 | As of March 31, 2019 |
| In millions of dollars | Open and overnight | Up to 30 days | 31–90 days | Greater than 90 days | Total | Open and overnight | Up to 30 days | 31–90 days | Greater than 90 days | Total |
| Securities sold under agreements to repurchase | $ | 121,109 |
| $ | 59,246 |
| $ | 30,558 |
| $ | 46,987 |
| $ | 257,900 |
| $ | 140,262 |
| $ | 60,664 |
| $ | 33,724 |
| $ | 42,294 |
| $ | 276,944 |
|
| Deposits received for securities loaned | 7,091 |
| 307 |
| 3,200 |
| 3,213 |
| 13,811 |
| 12,567 |
| 459 |
| 2,691 |
| 2,424 |
| 18,141 |
|
| Total | $ | 128,200 |
| $ | 59,553 |
| $ | 33,758 |
| $ | 50,200 |
| $ | 271,711 |
| $ | 152,829 |
| $ | 61,123 |
| $ | 36,415 |
| $ | 44,718 |
| $ | 295,085 |
|
| | | | As of December 31, 2017 | As of December 31, 2018 |
| In millions of dollars | Open and overnight | Up to 30 days | 31–90 days | Greater than 90 days | Total | Open and overnight | Up to 30 days | 31–90 days | Greater than 90 days | Total |
| Securities sold under agreements to repurchase | $ | 82,073 |
| $ | 68,372 |
| $ | 33,846 |
| $ | 31,831 |
| $ | 216,122 |
| $ | 108,405 |
| $ | 70,850 |
| $ | 29,898 |
| $ | 44,361 |
| $ | 253,514 |
|
| Deposits received for securities loaned | 9,946 |
| 266 |
| 1,912 |
| 1,181 |
| 13,305 |
| 6,296 |
| 774 |
| 2,626 |
| 1,982 |
| 11,678 |
|
| Total | $ | 92,019 |
| $ | 68,638 |
| $ | 35,758 |
| $ | 33,012 |
| $ | 229,427 |
| $ | 114,701 |
| $ | 71,624 |
| $ | 32,524 |
| $ | 46,343 |
| $ | 265,192 |
|
The following tables present the gross amount of liabilities associated with repurchase agreements and securities lending agreements, by class of underlying collateral:
| | | | As of September 30, 2018 | As of March 31, 2019 |
| In millions of dollars | Repurchase agreements | Securities lending agreements | Total | Repurchase agreements | Securities lending agreements | Total |
| U.S. Treasury and federal agency securities | $ | 95,116 |
| $ | 110 |
| $ | 95,226 |
| $ | 101,780 |
| $ | — |
| $ | 101,780 |
|
| State and municipal securities | 2,803 |
| — |
| 2,803 |
| 1,644 |
| — |
| 1,644 |
|
| Foreign government securities | 94,306 |
| 301 |
| 94,607 |
| 106,764 |
| 565 |
| 107,329 |
|
| Corporate bonds | 22,247 |
| 545 |
| 22,792 |
| 22,264 |
| 660 |
| 22,924 |
|
| Equity securities | 18,759 |
| 11,982 |
| 30,741 |
| 14,616 |
| 16,570 |
| 31,186 |
|
| Mortgage-backed securities | 15,088 |
| — |
| 15,088 |
| 20,112 |
| — |
| 20,112 |
|
| Asset-backed securities | 6,513 |
| — |
| 6,513 |
| 5,861 |
| — |
| 5,861 |
|
| Other | 3,068 |
| 873 |
| 3,941 |
| 3,903 |
| 346 |
| 4,249 |
|
| Total | $ | 257,900 |
| $ | 13,811 |
| $ | 271,711 |
| $ | 276,944 |
| $ | 18,141 |
| $ | 295,085 |
|
|
| | | | | | | | | |
| | As of December 31, 2018 |
| In millions of dollars | Repurchase agreements | Securities lending agreements | Total |
| U.S. Treasury and federal agency securities | $ | 86,785 |
| $ | 41 |
| $ | 86,826 |
|
| State and municipal securities | 2,605 |
| — |
| 2,605 |
|
| Foreign government securities | 99,131 |
| 179 |
| 99,310 |
|
| Corporate bonds | 21,719 |
| 749 |
| 22,468 |
|
| Equity securities | 12,920 |
| 10,664 |
| 23,584 |
|
| Mortgage-backed securities | 19,421 |
| — |
| 19,421 |
|
| Asset-backed securities | 6,207 |
| — |
| 6,207 |
|
| Other | 4,726 |
| 45 |
| 4,771 |
|
| Total | $ | 253,514 |
| $ | 11,678 |
| $ | 265,192 |
|
|
| | | | | | | | | |
| | As of December 31, 2017 |
| In millions of dollars | Repurchase agreements | Securities lending agreements | Total |
| U.S. Treasury and federal agency securities | $ | 58,774 |
| $ | — |
| $ | 58,774 |
|
| State and municipal securities | 1,605 |
| — |
| 1,605 |
|
| Foreign government securities | 89,576 |
| 105 |
| 89,681 |
|
| Corporate bonds | 20,194 |
| 657 |
| 20,851 |
|
| Equity securities | 20,724 |
| 11,907 |
| 32,631 |
|
| Mortgage-backed securities | 17,791 |
| — |
| 17,791 |
|
| Asset-backed securities | 5,479 |
| — |
| 5,479 |
|
| Other | 1,979 |
| 636 |
| 2,615 |
|
| Total | $ | 216,122 |
| $ | 13,305 |
| $ | 229,427 |
|
11. BROKERAGE RECEIVABLES AND BROKERAGE
PAYABLES
The Company has receivables and payables for financial instruments sold to and purchased from brokers, dealers and customers, which arise in the ordinary course of business.
For additional information on these receivables and payables, see Note 12 to the Consolidated Financial Statements in Citi’s 20172018 Annual Report on Form 10-K.
Brokerage receivables and Brokerage payables consisted of the following:
| | | In millions of dollars | September 30,
2018 | December 31, 2017 | March 31,
2019 | December 31, 2018 |
| Receivables from customers | $ | 15,195 |
| $ | 19,215 |
| $ | 14,945 |
| $ | 14,415 |
|
| Receivables from brokers, dealers and clearing organizations | 25,484 |
| 19,169 |
| 29,555 |
| 21,035 |
|
Total brokerage receivables(1) | $ | 40,679 |
| $ | 38,384 |
| $ | 44,500 |
| $ | 35,450 |
|
| Payables to customers | $ | 41,414 |
| $ | 38,741 |
| $ | 37,240 |
| $ | 40,273 |
|
| Payables to brokers, dealers and clearing organizations | 31,932 |
| 22,601 |
| 25,416 |
| 24,298 |
|
Total brokerage payables(1) | $ | 73,346 |
| $ | 61,342 |
| $ | 62,656 |
| $ | 64,571 |
|
| |
| (1) | Includes brokerage receivables and payables recorded by Citi broker-dealer entities that are accounted for in accordance with the AICPA Accounting Guide for Brokers and Dealers in Securities as codified in ASC 940-320. |
12. INVESTMENTS
For additional information regarding Citi’s investment portfolios, including evaluating investments for other-than-temporary impairment (OTTI), see Note 13 to the Consolidated Financial Statements in Citi’s 20172018 Annual Report on Form 10-K.
Overview
Citi adopted ASU 2016-01 and ASU 2018-03 as of January 1, 2018. The ASUs require fair value changes on marketable equity securities to be recognized in earnings. The available-for-sale category was eliminated for equity securities. Also, non-marketable equity securities are required to be measured at fair value with changes in fair value recognized in earnings unless (i) the measurement alternative is elected or (ii) the investment represents Federal Reserve Bank and Federal Home Loan Bank stock or certain exchange seats that continue to be carried at cost. See Note 1 to the Consolidated Financial Statements for additional details.
The following tables presenttable presents Citi’s investments by category:
|
| | | | |
| | In millions of dollars | September 30,
2018 |
| |
| | Debt securities available-for-sale (AFS) | $ | 284,782 |
|
| | Debt securities held-to-maturity (HTM)(1) | 53,249 |
|
| | Marketable equity securities carried at fair value(2) | 260 |
|
| | Non-marketable equity securities carried at fair value(2) | 1,128 |
|
| | Non-marketable equity securities measured using the measurement alternative(3)
| 452 |
|
| | Non-marketable equity securities carried at cost(4) | 5,642 |
|
| | Total investments | $ | 345,513 |
|
|
| | | | | | | |
| | In millions of dollars | March 31,
2019 | December 31,
2018 |
| |
| | Debt securities available-for-sale (AFS) | $ | 275,132 |
| $ | 288,038 |
|
| | Debt securities held-to-maturity (HTM)(1) | 66,842 |
| 63,357 |
|
| | Marketable equity securities carried at fair value(2) | 208 |
| 220 |
|
| | Non-marketable equity securities carried at fair value(2) | 804 |
| 889 |
|
| | Non-marketable equity securities measured using the measurement alternative(3)
| 630 |
| 538 |
|
| | Non-marketable equity securities carried at cost(4) | 5,665 |
| 5,565 |
|
| | Total investments | $ | 349,281 |
| $ | 358,607 |
|
|
| | | | |
| | In millions of dollars | December 31,
2017 |
| |
| | Securities available-for-sale (AFS) | $ | 290,914 |
|
| | Debt securities held-to-maturity (HTM)(1) | 53,320 |
|
| | Non-marketable equity securities carried at fair value(2) | 1,206 |
|
| | Non-marketable equity securities carried at cost(4) | 6,850 |
|
| | Total investments | $ | 352,290 |
|
| |
| (1) | Carried at adjusted amortized cost basis, net of any credit-related impairment. |
| |
| (2) | Unrealized gains and losses are recognized in earnings. |
| |
| (3) | Impairment losses and adjustments to the carrying value as a result of observable price changes are recognized in earnings. |
| |
| (4) | Represents shares issued by the Federal Reserve Bank, Federal Home Loan Banks and certain exchanges of which Citigroup is a member. |
The following table presents interest and dividend income on investments:
|
| | | | | | |
| | Three Months Ended March 31, |
| In millions of dollars | 2019 | 2018 |
| Taxable interest | $ | 2,372 |
| $ | 2,042 |
|
| Interest exempt from U.S. federal income tax | 127 |
| 130 |
|
| Dividend income | 49 |
| 62 |
|
| Total interest and dividend income | $ | 2,548 |
| $ | 2,234 |
|
|
| | | | | | | | | | | | |
| | Three Months Ended September 30, | Nine Months Ended September 30, |
| In millions of dollars | 2018 | 2017 | 2018 | 2017 |
| Taxable interest | $ | 2,195 |
| $ | 1,922 |
| $ | 6,395 |
| $ | 5,545 |
|
| Interest exempt from U.S. federal income tax | 130 |
| 129 |
| 392 |
| 412 |
|
| Dividend income | 63 |
| 53 |
| 209 |
| 165 |
|
| Total interest and dividend income | $ | 2,388 |
| $ | 2,104 |
| $ | 6,996 |
| $ | 6,122 |
|
The following table presents realized gains and losses on the sales of investments, which excludesexclude OTTI losses:
|
| | | | | | |
| | Three Months Ended March 31, |
| In millions of dollars | 2019 | 2018 |
| Gross realized investment gains | $ | 168 |
| $ | 345 |
|
| Gross realized investment losses | (38 | ) | (175 | ) |
| Net realized gains on sale of investments | $ | 130 |
| $ | 170 |
|
|
| | | | | | | | | | | | |
| | Three Months Ended September 30, | Nine Months Ended September 30, |
| In millions of dollars | 2018 | 2017 | 2018 | 2017 |
| Gross realized investment gains | $ | 153 |
| $ | 293 |
| $ | 550 |
| $ | 840 |
|
| Gross realized investment losses | (84 | ) | (80 | ) | (209 | ) | (214 | ) |
| Net realized gains on sale of investments | $ | 69 |
| $ | 213 |
| $ | 341 |
| $ | 626 |
|
Debt Securities Available-for-Sale
The amortized cost and fair value of AFS debt securities were as follows:
| | | | September 30, 2018 | December 31, 2017 | March 31, 2019 | December 31, 2018 |
| In millions of dollars | Amortized cost | Gross unrealized gains | Gross unrealized losses | Fair value | Amortized cost | Gross unrealized gains | Gross unrealized losses | Fair value | Amortized cost | Gross unrealized gains | Gross unrealized losses | Fair value | Amortized cost | Gross unrealized gains | Gross unrealized losses | Fair value |
| Securities AFS | | | | |
| Debt securities AFS | | | | |
Mortgage-backed securities(1) | | | | | | |
| U.S. government-sponsored agency guaranteed | $ | 46,675 |
| $ | 61 |
| $ | 1,575 |
| $ | 45,161 |
| $ | 42,116 |
| $ | 125 |
| $ | 500 |
| $ | 41,741 |
| $ | 39,228 |
| $ | 539 |
| $ | 434 |
| $ | 39,333 |
| $ | 43,504 |
| $ | 241 |
| $ | 725 |
| $ | 43,020 |
|
| Prime | — |
| — |
| — |
| — |
| 11 |
| 6 |
| — |
| 17 |
| |
| Alt-A | 1 |
| — |
| — |
| 1 |
| 26 |
| 90 |
| — |
| 116 |
| 1 |
| — |
| — |
| 1 |
| 1 |
| — |
| — |
| 1 |
|
| Non-U.S. residential | 1,620 |
| 7 |
| 1 |
| 1,626 |
| 2,744 |
| 13 |
| 6 |
| 2,751 |
| 1,117 |
| 4 |
| 1 |
| 1,120 |
| 1,310 |
| 4 |
| 2 |
| 1,312 |
|
| Commercial | 233 |
| 1 |
| 3 |
| 231 |
| 334 |
| — |
| 2 |
| 332 |
| 138 |
| 1 |
| 1 |
| 138 |
| 173 |
| 1 |
| 2 |
| 172 |
|
| Total mortgage-backed securities | $ | 48,529 |
| $ | 69 |
| $ | 1,579 |
| $ | 47,019 |
| $ | 45,231 |
| $ | 234 |
| $ | 508 |
| $ | 44,957 |
| $ | 40,484 |
| $ | 544 |
| $ | 436 |
| $ | 40,592 |
| $ | 44,988 |
| $ | 246 |
| $ | 729 |
| $ | 44,505 |
|
| U.S. Treasury and federal agency securities | | | | | | | | |
| U.S. Treasury | $ | 108,509 |
| $ | 28 |
| $ | 1,949 |
| $ | 106,588 |
| $ | 108,344 |
| $ | 77 |
| $ | 971 |
| $ | 107,450 |
| $ | 100,267 |
| $ | 25 |
| $ | 1,003 |
| $ | 99,289 |
| $ | 109,376 |
| $ | 33 |
| $ | 1,339 |
| $ | 108,070 |
|
| Agency obligations | 9,752 |
| — |
| 197 |
| 9,555 |
| 10,813 |
| 7 |
| 124 |
| 10,696 |
| 8,472 |
| 2 |
| 90 |
| 8,384 |
| 9,283 |
| 1 |
| 132 |
| 9,152 |
|
| Total U.S. Treasury and federal agency securities | $ | 118,261 |
| $ | 28 |
| $ | 2,146 |
| $ | 116,143 |
| $ | 119,157 |
| $ | 84 |
| $ | 1,095 |
| $ | 118,146 |
| $ | 108,739 |
| $ | 27 |
| $ | 1,093 |
| $ | 107,673 |
| $ | 118,659 |
| $ | 34 |
| $ | 1,471 |
| $ | 117,222 |
|
State and municipal(2) | $ | 9,662 |
| $ | 87 |
| $ | 269 |
| $ | 9,480 |
| $ | 8,870 |
| $ | 140 |
| $ | 245 |
| $ | 8,765 |
| |
| State and municipal | | $ | 8,012 |
| $ | 162 |
| $ | 65 |
| $ | 8,109 |
| $ | 9,372 |
| $ | 96 |
| $ | 262 |
| $ | 9,206 |
|
| Foreign government | 94,937 |
| 293 |
| 769 |
| 94,461 |
| 100,615 |
| 508 |
| 590 |
| 100,533 |
| 101,296 |
| 455 |
| 395 |
| 101,356 |
| 100,872 |
| 415 |
| 596 |
| 100,691 |
|
| Corporate | 12,498 |
| 21 |
| 139 |
| 12,380 |
| 14,144 |
| 51 |
| 86 |
| 14,109 |
| 12,366 |
| 59 |
| 115 |
| 12,310 |
| 11,714 |
| 42 |
| 157 |
| 11,599 |
|
Asset-backed securities(1) | 1,265 |
| 3 |
| 6 |
| 1,262 |
| 3,906 |
| 14 |
| 2 |
| 3,918 |
| 1,421 |
| 1 |
| 2 |
| 1,420 |
| 845 |
| 2 |
| 4 |
| 843 |
|
| Other debt securities | 4,036 |
| 1 |
| — |
| 4,037 |
| 297 |
| — |
| — |
| 297 |
| 3,671 |
| 1 |
| — |
| 3,672 |
| 3,973 |
| — |
| 1 |
| 3,972 |
|
| Total debt securities AFS | $ | 289,188 |
| $ | 502 |
| $ | 4,908 |
| $ | 284,782 |
| $ | 292,220 |
| $ | 1,031 |
| $ | 2,526 |
| $ | 290,725 |
| $ | 275,989 |
| $ | 1,249 |
| $ | 2,106 |
| $ | 275,132 |
| $ | 290,423 |
| $ | 835 |
| $ | 3,220 |
| $ | 288,038 |
|
Marketable equity securities AFS(3) | $ | — |
| $ | — |
| $ | — |
| $ | — |
| $ | 186 |
| $ | 4 |
| $ | 1 |
| $ | 189 |
| |
| Total securities AFS | $ | 289,188 |
| $ | 502 |
| $ | 4,908 |
| $ | 284,782 |
| $ | 292,406 |
| $ | 1,035 |
| $ | 2,527 |
| $ | 290,914 |
| |
| |
| (1) | The Company invests in mortgage-backedmortgage- and asset-backed securities. These securitizations are generally considered VIEs. The Company’s maximum exposure to loss from these VIEs is equal to the carrying amount of the securities, which is reflected in the table above. For mortgage-backedmortgage- and asset-backed securitizations in which the Company has other involvement, see Note 18 to the Consolidated Financial Statements. |
| |
(2) | In the second quarter of 2017, Citi early adopted ASU 2017-08, Receivables—Nonrefundable Fees and Other Costs (Subtopic 310-20): Premium Amortization on Purchased Callable Debt Securities. Upon adoption, a cumulative effect adjustment was recorded to reduce Retained earnings, effective January 1, 2017, for the incremental amortization of purchase premiums and cumulative fair value hedge adjustments on callable state and municipal debt securities. For additional information, see Note 1 to the Consolidated Financial Statements.
|
| |
(3) | Citi adopted ASU 2016-01 and ASU 2018-03 as of January 1, 2018, resulting in a cumulative effect adjustment from AOCI to Retained earnings for net unrealized gains on marketable equity securities AFS. The available-for-sale category was eliminated for equity securities effective January 1, 2018. See Note 1 to the Consolidated Financial Statements for additional details.
|
The following table shows the fair value of AFS debt securities that have been in an unrealized loss position:
| | | | Less than 12 months | 12 months or longer | Total | Less than 12 months | 12 months or longer | Total |
| In millions of dollars | Fair value | Gross unrealized losses | Fair value | Gross unrealized losses | Fair value | Gross unrealized losses | Fair value | Gross unrealized losses | Fair value | Gross unrealized losses | Fair value | Gross unrealized losses |
| September 30, 2018 | | | | |
Debt Securities AFS(1) | | | | |
| March 31, 2019 | | | | |
| Debt securities AFS | | | | |
| Mortgage-backed securities | | | | | | |
| U.S. government-sponsored agency guaranteed | $ | 21,723 |
| $ | 574 |
| $ | 18,828 |
| $ | 1,001 |
| $ | 40,551 |
| $ | 1,575 |
| |
| U.S. government agency guaranteed | | $ | 9,176 |
| $ | 268 |
| $ | 8,102 |
| $ | 166 |
| $ | 17,278 |
| $ | 434 |
|
| Non-U.S. residential | 256 |
| 1 |
| 1 |
| — |
| 257 |
| 1 |
| 387 |
| 1 |
| 1 |
| — |
| 388 |
| 1 |
|
| Commercial | 168 |
| 2 |
| 51 |
| 1 |
| 219 |
| 3 |
| 14 |
| — |
| 104 |
| 1 |
| 118 |
| 1 |
|
| Total mortgage-backed securities | $ | 22,147 |
| $ | 577 |
| $ | 18,880 |
| $ | 1,002 |
| $ | 41,027 |
| $ | 1,579 |
| $ | 9,577 |
| $ | 269 |
| $ | 8,207 |
| $ | 167 |
| $ | 17,784 |
| $ | 436 |
|
| U.S. Treasury and federal agency securities | | | | | | |
| U.S. Treasury | $ | 27,095 |
| $ | 279 |
| $ | 65,789 |
| $ | 1,670 |
| $ | 92,884 |
| $ | 1,949 |
| $ | 8,496 |
| $ | 48 |
| $ | 80,174 |
| $ | 955 |
| $ | 88,670 |
| $ | 1,003 |
|
| Agency obligations | 1,549 |
| 15 |
| 8,004 |
| 182 |
| 9,553 |
| 197 |
| 126 |
| 2 |
| 8,098 |
| 88 |
| 8,224 |
| 90 |
|
| Total U.S. Treasury and federal agency securities | $ | 28,644 |
| $ | 294 |
| $ | 73,793 |
| $ | 1,852 |
| $ | 102,437 |
| $ | 2,146 |
| $ | 8,622 |
| $ | 50 |
| $ | 88,272 |
| $ | 1,043 |
| $ | 96,894 |
| $ | 1,093 |
|
| State and municipal | $ | 1,811 |
| $ | 48 |
| $ | 1,260 |
| $ | 221 |
| $ | 3,071 |
| $ | 269 |
| $ | 928 |
| $ | 6 |
| $ | 968 |
| $ | 59 |
| $ | 1,896 |
| $ | 65 |
|
| Foreign government | 48,491 |
| 463 |
| 11,598 |
| 306 |
| 60,089 |
| 769 |
| 32,453 |
| 159 |
| 11,945 |
| 236 |
| 44,398 |
| 395 |
|
| Corporate | 6,556 |
| 114 |
| 798 |
| 25 |
| 7,354 |
| 139 |
| 3,252 |
| 96 |
| 2,127 |
| 19 |
| 5,379 |
| 115 |
|
| Asset-backed securities | 604 |
| 6 |
| 27 |
| — |
| 631 |
| 6 |
| 306 |
| 2 |
| 56 |
| — |
| 362 |
| 2 |
|
| Other debt securities | 1,313 |
| — |
| — |
| — |
| 1,313 |
| — |
| 816 |
| — |
| — |
| — |
| 816 |
| — |
|
| Total debt securities AFS | $ | 109,566 |
| $ | 1,502 |
| $ | 106,356 |
| $ | 3,406 |
| $ | 215,922 |
| $ | 4,908 |
| $ | 55,954 |
| $ | 582 |
| $ | 111,575 |
| $ | 1,524 |
| $ | 167,529 |
| $ | 2,106 |
|
| December 31, 2017 | |
| |
| |
| |
| |
| |
| |
| Securities AFS | |
| |
| |
| |
| |
| |
| |
| December 31, 2018 | | |
| |
| |
| |
| |
| |
|
| Debt securities AFS | | |
| |
| |
| |
| |
| |
|
| Mortgage-backed securities | |
| |
| |
| |
| |
| |
| |
| |
| |
| |
| |
| |
|
| U.S. government-sponsored agency guaranteed | $ | 30,994 |
| $ | 438 |
| $ | 2,206 |
| $ | 62 |
| $ | 33,200 |
| $ | 500 |
| |
| U.S. government agency guaranteed | | $ | 11,160 |
| $ | 286 |
| $ | 13,143 |
| $ | 439 |
| $ | 24,303 |
| $ | 725 |
|
| Non-U.S. residential | 753 |
| 6 |
| — |
| — |
| 753 |
| 6 |
| 284 |
| 2 |
| 2 |
| — |
| 286 |
| 2 |
|
| Commercial | 150 |
| 1 |
| 57 |
| 1 |
| 207 |
| 2 |
| 79 |
| 1 |
| 82 |
| 1 |
| 161 |
| 2 |
|
| Total mortgage-backed securities | $ | 31,897 |
| $ | 445 |
| $ | 2,263 |
| $ | 63 |
| $ | 34,160 |
| $ | 508 |
| $ | 11,523 |
| $ | 289 |
| $ | 13,227 |
| $ | 440 |
| $ | 24,750 |
| $ | 729 |
|
| U.S. Treasury and federal agency securities | |
| |
| |
| |
| |
| |
| |
| |
| |
| |
| |
| |
|
| U.S. Treasury | $ | 79,050 |
| $ | 856 |
| $ | 7,404 |
| $ | 115 |
| $ | 86,454 |
| $ | 971 |
| $ | 8,389 |
| $ | 42 |
| $ | 77,883 |
| $ | 1,297 |
| $ | 86,272 |
| $ | 1,339 |
|
| Agency obligations | 8,857 |
| 110 |
| 1,163 |
| 14 |
| 10,020 |
| 124 |
| 277 |
| 2 |
| 8,660 |
| 130 |
| 8,937 |
| 132 |
|
| Total U.S. Treasury and federal agency securities | $ | 87,907 |
| $ | 966 |
| $ | 8,567 |
| $ | 129 |
| $ | 96,474 |
| $ | 1,095 |
| $ | 8,666 |
| $ | 44 |
| $ | 86,543 |
| $ | 1,427 |
| $ | 95,209 |
| $ | 1,471 |
|
| State and municipal | $ | 1,009 |
| $ | 11 |
| $ | 1,155 |
| $ | 234 |
| $ | 2,164 |
| $ | 245 |
| $ | 1,614 |
| $ | 34 |
| $ | 1,303 |
| $ | 228 |
| $ | 2,917 |
| $ | 262 |
|
| Foreign government | 53,206 |
| 356 |
| 9,051 |
| 234 |
| 62,257 |
| 590 |
| 40,655 |
| 265 |
| 15,053 |
| 331 |
| 55,708 |
| 596 |
|
| Corporate | 6,737 |
| 74 |
| 859 |
| 12 |
| 7,596 |
| 86 |
| 4,547 |
| 115 |
| 2,077 |
| 42 |
| 6,624 |
| 157 |
|
| Asset-backed securities | 449 |
| 1 |
| 25 |
| 1 |
| 474 |
| 2 |
| 441 |
| 4 |
| 55 |
| — |
| 496 |
| 4 |
|
| Other debt securities | — |
| — |
| — |
| — |
| — |
| — |
| 1,790 |
| 1 |
| — |
| — |
| 1,790 |
| 1 |
|
Marketable equity securities AFS(1) | 11 |
| 1 |
| — |
| — |
| 11 |
| 1 |
| |
| Total securities AFS | $ | 181,216 |
| $ | 1,854 |
| $ | 21,920 |
| $ | 673 |
| $ | 203,136 |
| $ | 2,527 |
| |
| Total debt securities AFS | | $ | 69,236 |
| $ | 752 |
| $ | 118,258 |
| $ | 2,468 |
| $ | 187,494 |
| $ | 3,220 |
|
| |
(1) | Citi adopted ASU 2016-01 and ASU 2018-03 as of January 1, 2018, resulting in a cumulative effect adjustment from AOCI to retained earnings for net unrealized gains on marketable equity securities AFS. The available-for-sale category was eliminated for equity securities effective January 1, 2018. See Note 1 to the Consolidated Financial Statements for additional details. |
The following table presents the amortized cost and fair value of AFS debt securities by contractual maturity dates:
| | | | September 30, 2018 | December 31, 2017 | March 31, 2019 | December 31, 2018 |
| In millions of dollars | Amortized cost | Fair value | Amortized cost | Fair value | Amortized cost | Fair value | Amortized cost | Fair value |
Mortgage-backed securities(1) | | | | | | |
| Due within 1 year | $ | 434 |
| $ | 431 |
| $ | 45 |
| $ | 45 |
| $ | 68 |
| $ | 68 |
| $ | 14 |
| $ | 14 |
|
| After 1 but within 5 years | 1,201 |
| 1,194 |
| 1,306 |
| 1,304 |
| 706 |
| 707 |
| 662 |
| 661 |
|
| After 5 but within 10 years | 2,159 |
| 2,119 |
| 1,376 |
| 1,369 |
| 1,824 |
| 1,922 |
| 2,779 |
| 2,828 |
|
After 10 years(2) | 44,735 |
| 43,275 |
| 42,504 |
| 42,239 |
| 37,886 |
| 37,895 |
| 41,533 |
| 41,002 |
|
| Total | $ | 48,529 |
| $ | 47,019 |
| $ | 45,231 |
| $ | 44,957 |
| $ | 40,484 |
| $ | 40,592 |
| $ | 44,988 |
| $ | 44,505 |
|
| U.S. Treasury and federal agency securities | | | | | | |
| Due within 1 year | $ | 34,543 |
| $ | 34,471 |
| $ | 4,913 |
| $ | 4,907 |
| $ | 39,674 |
| $ | 39,554 |
| $ | 41,941 |
| $ | 41,867 |
|
| After 1 but within 5 years | 81,735 |
| 79,739 |
| 111,236 |
| 110,238 |
| 68,442 |
| 67,520 |
| 76,139 |
| 74,800 |
|
| After 5 but within 10 years | 1,893 |
| 1,842 |
| 3,008 |
| 3,001 |
| 597 |
| 573 |
| 489 |
| 462 |
|
After 10 years(2) | 90 |
| 91 |
| — |
| — |
| 26 |
| 26 |
| 90 |
| 93 |
|
| Total | $ | 118,261 |
| $ | 116,143 |
| $ | 119,157 |
| $ | 118,146 |
| $ | 108,739 |
| $ | 107,673 |
| $ | 118,659 |
| $ | 117,222 |
|
| State and municipal | | | | | | |
| Due within 1 year | $ | 2,773 |
| $ | 2,772 |
| $ | 1,792 |
| $ | 1,792 |
| $ | 1,674 |
| $ | 1,673 |
| $ | 2,586 |
| $ | 2,586 |
|
| After 1 but within 5 years | 1,575 |
| 1,570 |
| 2,579 |
| 2,576 |
| 1,542 |
| 1,546 |
| 1,676 |
| 1,675 |
|
| After 5 but within 10 years | 572 |
| 590 |
| 514 |
| 528 |
| 573 |
| 595 |
| 585 |
| 602 |
|
After 10 years(2) | 4,742 |
| 4,548 |
| 3,985 |
| 3,869 |
| 4,223 |
| 4,295 |
| 4,525 |
| 4,343 |
|
| Total | $ | 9,662 |
| $ | 9,480 |
| $ | 8,870 |
| $ | 8,765 |
| $ | 8,012 |
| $ | 8,109 |
| $ | 9,372 |
| $ | 9,206 |
|
| Foreign government | | | | | | | | |
| Due within 1 year | $ | 34,686 |
| $ | 34,649 |
| $ | 32,130 |
| $ | 32,100 |
| $ | 41,824 |
| $ | 41,806 |
| $ | 39,078 |
| $ | 39,028 |
|
| After 1 but within 5 years | 47,933 |
| 47,416 |
| 53,034 |
| 53,165 |
| 46,950 |
| 46,936 |
| 50,125 |
| 49,962 |
|
| After 5 but within 10 years | 10,371 |
| 10,386 |
| 12,949 |
| 12,680 |
| 11,034 |
| 11,083 |
| 10,153 |
| 10,149 |
|
After 10 years(2) | 1,947 |
| 2,010 |
| 2,502 |
| 2,588 |
| 1,488 |
| 1,531 |
| 1,516 |
| 1,552 |
|
| Total | $ | 94,937 |
| $ | 94,461 |
| $ | 100,615 |
| $ | 100,533 |
| $ | 101,296 |
| $ | 101,356 |
| $ | 100,872 |
| $ | 100,691 |
|
All other(3) | | | | | | | | |
| Due within 1 year | $ | 6,439 |
| $ | 6,435 |
| $ | 3,998 |
| $ | 3,991 |
| $ | 6,867 |
| $ | 6,865 |
| $ | 6,166 |
| $ | 6,166 |
|
| After 1 but within 5 years | 9,151 |
| 9,068 |
| 9,047 |
| 9,027 |
| 8,199 |
| 8,188 |
| 8,459 |
| 8,416 |
|
| After 5 but within 10 years | 1,614 |
| 1,603 |
| 3,415 |
| 3,431 |
| 1,429 |
| 1,410 |
| 1,474 |
| 1,427 |
|
After 10 years(2) | 595 |
| 573 |
| 1,887 |
| 1,875 |
| 963 |
| 939 |
| 433 |
| 405 |
|
| Total | $ | 17,799 |
| $ | 17,679 |
| $ | 18,347 |
| $ | 18,324 |
| $ | 17,458 |
| $ | 17,402 |
| $ | 16,532 |
| $ | 16,414 |
|
| Total debt securities AFS | $ | 289,188 |
| $ | 284,782 |
| $ | 292,220 |
| $ | 290,725 |
| $ | 275,989 |
| $ | 275,132 |
| $ | 290,423 |
| $ | 288,038 |
|
| |
| (1) | Includes mortgage-backed securities of U.S. government-sponsored agencies. |
| |
| (2) | Investments with no stated maturities are included as contractual maturities of greater than 10 years. Actual maturities may differ due to call or prepayment rights. |
| |
| (3) | Includes corporate, asset-backed and other debt securities. |
Debt Securities Held-to-Maturity
The carrying value and fair value of debt securities HTM were as follows:
|
| | | | | | | | | | | | |
| In millions of dollars | Carrying value | Gross unrealized gains | Gross unrealized losses | Fair value |
| March 31, 2019 | | | | |
| Debt securities held-to-maturity | | | | |
Mortgage-backed securities(1) | | | | |
U.S. government agency guaranteed(2) | $ | 38,286 |
| $ | 392 |
| $ | 296 |
| $ | 38,382 |
|
| Non-U.S. residential | 1,313 |
| 13 |
| 1 |
| 1,325 |
|
| Commercial | 424 |
| 1 |
| 1 |
| 424 |
|
| Total mortgage-backed securities | $ | 40,023 |
| $ | 406 |
| $ | 298 |
| $ | 40,131 |
|
| State and municipal | $ | 7,648 |
| $ | 285 |
| $ | 70 |
| $ | 7,863 |
|
| Foreign government | 1,000 |
| — |
| 11 |
| 989 |
|
Asset-backed securities(1) | 18,171 |
| 6 |
| 86 |
| 18,091 |
|
| Total debt securities held-to-maturity | $ | 66,842 |
| $ | 697 |
| $ | 465 |
| $ | 67,074 |
|
| December 31, 2018 | |
| |
| |
| |
|
| Debt securities held-to-maturity | |
| |
| |
| |
|
Mortgage-backed securities(1) | |
| |
| |
| |
|
| U.S. government agency guaranteed | $ | 34,239 |
| $ | 199 |
| $ | 578 |
| $ | 33,860 |
|
| Non-U.S. residential | 1,339 |
| 12 |
| 1 |
| 1,350 |
|
| Commercial | 368 |
| — |
| — |
| 368 |
|
| Total mortgage-backed securities | $ | 35,946 |
| $ | 211 |
| $ | 579 |
| $ | 35,578 |
|
| State and municipal | $ | 7,628 |
| $ | 167 |
| $ | 138 |
| $ | 7,657 |
|
| Foreign government | 1,027 |
| — |
| 24 |
| 1,003 |
|
Asset-backed securities(1) | 18,756 |
| 8 |
| 112 |
| 18,652 |
|
| Total debt securities held-to-maturity | $ | 63,357 |
| $ | 386 |
| $ | 853 |
| $ | 62,890 |
|
|
| | | | | | | | | | | | |
| In millions of dollars | Carrying value | Gross unrealized gains | Gross unrealized losses | Fair value |
| September 30, 2018 | | | | |
| Debt securities held-to-maturity | | | | |
Mortgage-backed securities(1) | | | | |
| U.S. government agency guaranteed | $ | 25,058 |
| $ | 3 |
| $ | 869 |
| $ | 24,192 |
|
| Alt-A | — |
| — |
| — |
| — |
|
| Non-U.S. residential | 1,288 |
| 19 |
| — |
| 1,307 |
|
| Commercial | 260 |
| — |
| — |
| 260 |
|
| Total mortgage-backed securities | $ | 26,606 |
| $ | 22 |
| $ | 869 |
| $ | 25,759 |
|
| State and municipal | $ | 7,399 |
| $ | 124 |
| $ | 185 |
| $ | 7,338 |
|
| Foreign government | 1,151 |
| — |
| 14 |
| 1,137 |
|
Asset-backed securities(1) | 18,093 |
| 27 |
| 11 |
| 18,109 |
|
| Total debt securities held-to-maturity | $ | 53,249 |
| $ | 173 |
| $ | 1,079 |
| $ | 52,343 |
|
| December 31, 2017 | |
| |
| |
| |
|
| Debt securities held-to-maturity | |
| |
| |
| |
|
Mortgage-backed securities(1) | |
| |
| |
| |
|
| U.S. government agency guaranteed | $ | 23,880 |
| $ | 40 |
| $ | 157 |
| $ | 23,763 |
|
| Alt-A | 141 |
| 57 |
| — |
| 198 |
|
| Non-U.S. residential | 1,841 |
| 65 |
| — |
| 1,906 |
|
| Commercial | 237 |
| — |
| — |
| 237 |
|
| Total mortgage-backed securities | $ | 26,099 |
| $ | 162 |
| $ | 157 |
| $ | 26,104 |
|
State and municipal (2) | $ | 8,897 |
| $ | 378 |
| $ | 73 |
| $ | 9,202 |
|
| Foreign government | 740 |
| — |
| 18 |
| 722 |
|
Asset-backed securities(1) | 17,584 |
| 162 |
| 22 |
| 17,724 |
|
| Total debt securities held-to-maturity | $ | 53,320 |
| $ | 702 |
| $ | 270 |
| $ | 53,752 |
|
| |
| (1) | The Company invests in mortgage-backedmortgage- and asset-backed securities. These securitizations are generally considered VIEs. The Company’s maximum exposure to loss from these VIEs is equal to the carrying amount of the securities, which is reflected in the table above. For mortgage-backedmortgage- and asset-backed securitizations in which the Company has other involvement, see Note 18 to the Consolidated Financial Statements. |
| |
| (2) | In March 2019, Citibank transferred $5 billion of agency residential mortgage-backed securities (RMBS) from AFS classification to HTM classification in accordance with ASC 320. At the second quartertime of 2017, Citi early adopted ASU 2017-08, Receivables—Nonrefundable Feestransfer, the securities were in an unrealized loss position of $56 million. The loss amounts will remain in AOCI and Other Costs (Subtopic 310-20): Premium Amortization on Purchased Callable Debt Securities. Upon adoption, a cumulative effect adjustment was recorded to reduce retained earnings, effective January 1, 2017, forbe amortized over the incremental amortizationremaining life of purchase premiums and cumulative fair value hedge adjustments on callable state and municipal debtthe securities. For additional information, see Note 1 to the Consolidated Financial Statements. |
The table below shows the fair value of debt securities HTM that have been in an unrecognized loss position:
| | | | Less than 12 months | 12 months or longer | Total | Less than 12 months | 12 months or longer | Total |
| In millions of dollars | Fair
value | Gross
unrecognized
losses | Fair
value | Gross
unrecognized
losses | Fair
value | Gross
unrecognized
losses | Fair
value | Gross
unrecognized
losses | Fair
value | Gross
unrecognized
losses | Fair
value | Gross
unrecognized
losses |
| September 30, 2018 | | | | | | |
| March 31, 2019 | | | | | | |
| Debt securities held-to-maturity | | | | | | | | | | |
| Mortgage-backed securities | $ | 13,815 |
| $ | 392 |
| $ | 9,815 |
| $ | 477 |
| $ | 23,630 |
| $ | 869 |
| $ | 4,577 |
| $ | 11 |
| $ | 18,150 |
| $ | 287 |
| $ | 22,727 |
| $ | 298 |
|
| State and municipal | 2,283 |
| 58 |
| 799 |
| 127 |
| 3,082 |
| 185 |
| 206 |
| 6 |
| 954 |
| 64 |
| 1,160 |
| 70 |
|
| Foreign government | 1,138 |
| 14 |
| — |
| — |
| 1,138 |
| 14 |
| 989 |
| 11 |
| — |
| — |
| 989 |
| 11 |
|
| Asset-backed securities | 3,670 |
| 11 |
| 2 |
| — |
| 3,672 |
| 11 |
| 12,581 |
| 86 |
| — |
| — |
| 12,581 |
| 86 |
|
| Total debt securities held-to-maturity | $ | 20,906 |
| $ | 475 |
| $ | 10,616 |
| $ | 604 |
| $ | 31,522 |
| $ | 1,079 |
| $ | 18,353 |
| $ | 114 |
| $ | 19,104 |
| $ | 351 |
| $ | 37,457 |
| $ | 465 |
|
| December 31, 2017 | | | | | | |
| December 31, 2018 | | | | | | |
| Debt securities held-to-maturity | | | | | | | | | | |
| Mortgage-backed securities | $ | 8,569 |
| $ | 50 |
| $ | 6,353 |
| $ | 107 |
| $ | 14,922 |
| $ | 157 |
| $ | 2,822 |
| $ | 20 |
| $ | 18,086 |
| $ | 559 |
| $ | 20,908 |
| $ | 579 |
|
| State and municipal | 353 |
| 5 |
| 835 |
| 68 |
| 1,188 |
| 73 |
| 981 |
| 34 |
| 1,242 |
| 104 |
| 2,223 |
| 138 |
|
| Foreign government | 723 |
| 18 |
| — |
| — |
| 723 |
| 18 |
| 1,003 |
| 24 |
| — |
| — |
| 1,003 |
| 24 |
|
| Asset-backed securities | 71 |
| 3 |
| 134 |
| 19 |
| 205 |
| 22 |
| 13,008 |
| 112 |
| — |
| — |
| 13,008 |
| 112 |
|
| Total debt securities held-to-maturity | $ | 9,716 |
| $ | 76 |
| $ | 7,322 |
| $ | 194 |
| $ | 17,038 |
| $ | 270 |
| $ | 17,814 |
| $ | 190 |
| $ | 19,328 |
| $ | 663 |
| $ | 37,142 |
| $ | 853 |
|
Note: Excluded from the gross unrecognized losses presented in the table above are $(65)$(683) million and $(117)$(653) million of net unrealized losses recorded in AOCI as of September 30, 2018March 31, 2019 and December 31, 2017,2018, respectively, primarily related to the difference between the amortized cost and carrying value of HTM debt securities that were reclassified from AFS. Substantially all of these net unrecognized losses relate to securities that have been in a loss position for 12 months or longer at September 30, 2018March 31, 2019 and December 31, 2017.2018.
The following table presents the carrying value and fair value of HTM debt securities by contractual maturity dates: | | | | September 30, 2018 | December 31, 2017 | March 31, 2019 | December 31, 2018 |
| In millions of dollars | Carrying value | Fair value | Carrying value | Fair value | Carrying value | Fair value | Carrying value | Fair value |
| Mortgage-backed securities | | | | | | |
| Due within 1 year | $ | — |
| $ | — |
| $ | — |
| $ | — |
| $ | 3 |
| $ | 3 |
| $ | 3 |
| $ | 3 |
|
| After 1 but within 5 years | 129 |
| 127 |
| 720 |
| 720 |
| 544 |
| 547 |
| 539 |
| 540 |
|
| After 5 but within 10 years | 101 |
| 99 |
| 148 |
| 149 |
| 1,822 |
| 1,845 |
| 997 |
| 1,011 |
|
After 10 years(1) | 26,376 |
| 25,533 |
| 25,231 |
| 25,235 |
| 37,654 |
| 37,736 |
| 34,407 |
| 34,024 |
|
| Total | $ | 26,606 |
| $ | 25,759 |
| $ | 26,099 |
| $ | 26,104 |
| $ | 40,023 |
| $ | 40,131 |
| $ | 35,946 |
| $ | 35,578 |
|
| State and municipal | | | | | | |
| Due within 1 year | $ | 31 |
| $ | 31 |
| $ | 407 |
| $ | 425 |
| $ | 37 |
| $ | 37 |
| $ | 37 |
| $ | 37 |
|
| After 1 but within 5 years | 131 |
| 133 |
| 259 |
| 270 |
| 221 |
| 228 |
| 168 |
| 174 |
|
| After 5 but within 10 years | 492 |
| 495 |
| 512 |
| 524 |
| 487 |
| 500 |
| 540 |
| 544 |
|
After 10 years(1) | 6,745 |
| 6,679 |
| 7,719 |
| 7,983 |
| 6,903 |
| 7,098 |
| 6,883 |
| 6,902 |
|
| Total | $ | 7,399 |
| $ | 7,338 |
| $ | 8,897 |
| $ | 9,202 |
| $ | 7,648 |
| $ | 7,863 |
| $ | 7,628 |
| $ | 7,657 |
|
| Foreign government | | | | | | |
| Due within 1 year | $ | 114 |
| $ | 114 |
| $ | 381 |
| $ | 381 |
| $ | 20 |
| $ | 20 |
| $ | 60 |
| $ | 36 |
|
| After 1 but within 5 years | 1,037 |
| 1,023 |
| 359 |
| 341 |
| 980 |
| 969 |
| 967 |
| 967 |
|
| After 5 but within 10 years | — |
| — |
| — |
| — |
| — |
| — |
| — |
| — |
|
After 10 years(1) | — |
| — |
| — |
| — |
| — |
| — |
| — |
| — |
|
| Total | $ | 1,151 |
| $ | 1,137 |
| $ | 740 |
| $ | 722 |
| $ | 1,000 |
| $ | 989 |
| $ | 1,027 |
| $ | 1,003 |
|
All other(2) | | | | | | |
| Due within 1 year | $ | — |
| $ | — |
| $ | — |
| $ | — |
| $ | — |
| $ | — |
| $ | — |
| $ | — |
|
| After 1 but within 5 years | — |
| — |
| — |
| — |
| — |
| — |
| — |
| — |
|
| After 5 but within 10 years | 2,244 |
| 2,250 |
| 1,669 |
| 1,680 |
| 3,039 |
| 3,041 |
| 2,535 |
| 2,539 |
|
After 10 years(1) | 15,849 |
| 15,859 |
| 15,915 |
| 16,044 |
| 15,132 |
| 15,050 |
| 16,221 |
| 16,113 |
|
| Total | $ | 18,093 |
| $ | 18,109 |
| $ | 17,584 |
| $ | 17,724 |
| $ | 18,171 |
| $ | 18,091 |
| $ | 18,756 |
| $ | 18,652 |
|
| Total debt securities held-to-maturity | $ | 53,249 |
| $ | 52,343 |
| $ | 53,320 |
| $ | 53,752 |
| $ | 66,842 |
| $ | 67,074 |
| $ | 63,357 |
| $ | 62,890 |
|
| |
| (1) | Investments with no stated maturities are included as contractual maturities of greater than 10 years. Actual maturities may differ due to call or prepayment rights. |
| |
| (2) | Includes corporate and asset-backed securities. |
Evaluating Investments for Other-Than-Temporary Impairment
Overview
The Company conducts periodic reviews of all securities with unrealized losses to evaluate whether the impairment is other-than-temporary. This review applies to all securities that are not measured at fair value through earnings. Effective January 1, 2018, the AFS category was eliminated for equity securities and, therefore, other-than-temporary impairment (OTTI) review is not required for those securities. See Note 1 to the Consolidated Financial Statements for additional details.
An unrealized loss exists when the current fair value of an individual security is less than its amortized cost basis. Unrealized losses that are determined to be temporary in nature are recorded, net of tax, in AOCI for AFS securities. Temporary losses related to HTM debt securities generally are not recorded, as these investments are carried at adjusted amortized cost basis. However, for HTM debt securities with credit-related impairment, the credit loss is recognized in earnings as OTTI, and any difference between the cost basis adjusted for the OTTI and fair value is recognized in AOCI and amortized as an adjustment of yield over the remaining contractual life of the security. For debt securities transferred to HTM from Trading account assets, amortized cost is defined as the fair value of the securities at the date of transfer, plus any accretion income and less any impairment recognized in earnings subsequent to transfer. For debt securities transferred to HTM from AFS, amortized cost is defined as the original purchase cost, adjusted for the cumulative accretion or amortization of any purchase discount or premium, plus or minus any cumulative fair value hedge adjustments, net of accretion or amortization, and less any impairment recognized in earnings.
Regardless of the classification of securities as AFS or HTM, the Company assesses each position with an unrealized loss for OTTI. Factors considered in determining whether a loss is temporary include:
the length of time and the extent to which fair value has been below cost;
the severity of the impairment;
the cause of the impairment and the financial condition and near-term prospects of the issuer;
activity in the market of the issuer that may indicate adverse credit conditions; and
the Company’s ability and intent to hold the investment for a period of time sufficient to allow for any anticipated recovery.
The Company’s review for impairment generally entails:
identification and evaluation of impaired investments;
analysis of individual investments that have fair values less than amortized cost, including consideration of the length of time the investment has been in an unrealized loss position and the expected recovery period;
consideration of evidential matter, including an evaluation of factors or triggers that could cause individual investments to qualify as having other-than-temporary
impairment and those that would not support other-than-temporary impairment; and
documentation of the results of these analyses, as required under business policies.
Debt Securities
Overview
The Company conducts periodic reviews of all debt securities with unrealized losses to evaluate whether the impairment is other-than-temporary. This review applies to all debt securities that are not measured at fair value through earnings.
An unrealized loss exists when the current fair value of an individual debt security is less than its amortized cost basis. Unrealized losses that are determined to be temporary in nature are recorded, net of tax, in AOCI for AFS debt securities. Temporary losses related to HTM debt securities generally are not recorded, as these investments are carried at adjusted amortized cost basis. However, for HTM debt securities with credit-related impairment, the credit loss is recognized in earnings as OTTI, and any difference between the cost basis adjusted for the OTTI and fair value is recognized in AOCI and amortized as an adjustment of yield over the remaining contractual life of the security. For debt securities transferred to HTM from Trading account assets, amortized cost is defined as the fair value of the securities at the date of transfer, plus any accretion income and less any impairment recognized in earnings subsequent to transfer. For debt securities transferred to HTM from AFS, amortized cost is defined as the original purchase cost, adjusted for the cumulative accretion or amortization of any purchase discount or premium, plus or minus any cumulative fair value hedge adjustments, net of accretion or amortization, and less any impairment recognized in earnings.
Regardless of the classification of debt securities as AFS or HTM, the Company assesses each position with an unrealized loss for OTTI. Factors considered in determining whether a loss is temporary include:
the length of time and the extent to which fair value has been below cost;
the severity of the impairment;
the cause of the impairment and the financial condition and near-term prospects of the issuer;
activity in the market of the issuer that may indicate adverse credit conditions; and
the Company’s ability and intent to hold the investment for a period of time sufficient to allow for any anticipated recovery.
The Company’s review for impairment generally entails:
identification and evaluation of impaired investments;
analysis of individual investments that have fair values less than amortized cost, including consideration of the length of time the investment has been in an unrealized loss position and the expected recovery period;
consideration of evidential matter, including an evaluation of factors or triggers that could cause individual investments to qualify as having other-than-temporary impairment and those that would not support other-than-temporary impairment; and
documentation of the results of these analyses, as required under business policies.
The entire difference between amortized cost basis and fair value is recognized in earnings as OTTI for impaired debt securities that the Company has an intent to sell or for which the Company believes it will more-likely-than-not be required to sell prior to recovery of the amortized cost basis. However, for those debt securities that the Company does not intend to sell and is not likely to be required to sell, only the credit-related impairment is recognized in earnings and any non-credit-related impairment is recorded in AOCI.
For debt securities, credit impairment exists where management does not expect to receive contractual principal and interest cash flows sufficient to recover the entire amortized cost basis of a security.
The sections below describe the Company’s process for identifying credit-related impairments for debt security types that have the most significant unrealized losses as of March 31, 2019.
AFS Equity
Mortgage-Backed Securities and Equity Method Investments
For AFS equityU.S. mortgage-backed securities, priorcredit impairment is assessed using a cash flow model that estimates the principal and interest cash flows on the underlying mortgages using the security-specific collateral and transaction structure. The model distributes the estimated cash flows to January 1, 2018, management considered the various factors described above,tranches of securities, considering the transaction structure and any subordination and credit enhancements that exist in that structure. The cash flow model incorporates actual cash flows on the mortgage-backed securities through the current period and then estimates the remaining cash flows using a number of assumptions, including its intentdefault rates, prepayment rates, recovery rates (on foreclosed properties) and abilityloss severity rates (on non-agency mortgage-backed securities).
Management develops specific assumptions using market data, internal estimates and estimates published by rating agencies and other third-party sources. Default rates are projected by considering current underlying mortgage loan performance, generally assuming the default of (i) 10% of current loans, (ii) 25% of 30–59 day delinquent loans, (iii) 70% of 60–90 day delinquent loans and (iv) 100% of 91+ day delinquent loans. These estimates are extrapolated along a default timing curve to hold an equity security for a periodestimate the total lifetime pool default rate. Other assumptions contemplate the actual collateral attributes, including geographic concentrations, rating actions and current market prices.
Cash flow projections are developed using different stress test scenarios. Management evaluates the results of time sufficient for recoverythose stress tests (including the severity of any cash shortfall indicated and the likelihood of the stress scenarios actually occurring based on the underlying pool’s characteristics and performance) to assess whether management expects to recover the amortized cost or whether it was more-likely-than-notbasis of the security. If cash flow projections indicate that the Company does not expect to recover its amortized cost basis, the Company recognizes the estimated credit loss in earnings.
State and Municipal Securities
The process for identifying credit impairments in Citigroup’s AFS and HTM state and municipal bonds is primarily based on a credit analysis that incorporates third-party credit ratings. Citigroup monitors the bond issuers and any insurers providing default protection in the form of financial guarantee insurance. The average external credit rating, ignoring any insurance, is Aa3/AA-. In the event of an external rating downgrade or other indicator of credit impairment (i.e., based on instrument-specific estimates of cash flows or probability of issuer default), the subject bond is specifically reviewed for adverse changes in the amount or timing of expected contractual principal and interest payments.
For state and municipal bonds with unrealized losses that Citigroup plans to sell, or would have beenbe more-likely-than-not required to sell, the security prior to recovery of its cost basis. Where management lacked that intent or ability, the security’s declinefull impairment is recognized in fair value was deemed to be other-than-temporary and was recorded in earnings. Effective January 1, 2018, the AFS category has been eliminated for equity securities and, therefore, OTTI review is not required for those securities. See Note 1 to the Consolidated Financial Statements for additional details.
Equity Method Investments
Management assesses equity method investments that have fair values that are less than their respective carrying values for OTTI. Fair value is measured as price multiplied by quantity if the investee has publicly listed securities. If the investee is not publicly listed, other methods are used (see Note 20 to the Consolidated Financial Statements).
For impaired equity method investments that Citi plans to sell prior to recovery of value or would likely be required to sell, with no expectation that the fair value will recover prior to the expected sale date, the full impairment is recognized in earnings as OTTI regardless of severity and duration. The measurement of the OTTI does not include partial projected recoveries subsequent to the balance sheet date.
For impaired equity method investments that management does not plan to sell and is not likely to be required to sell prior to recovery of value, the evaluation of whether an impairment is other-than-temporary is based on (i) whether and when an equity method investment will recover in value and (ii) whether the investor has the intent and ability to hold that investment for a period of time sufficient to recover the value. The determination of whether the impairment is considered other-than-temporary considers the following indicators:
the cause of the impairment and the financial condition and near-term prospects of the issuer, including any
specific events that may influence the operations of the issuer;
the intent and ability to hold the investment for a period of time sufficient to allow for any anticipated recovery in market value; and
the length of time and extent to which fair value has been less than the carrying value.
The sections below describe the Company’s process for identifying credit-related impairments for security types that have the most significant unrealized losses as of September 30, 2018.
Mortgage-Backed Securities
For U.S. mortgage-backed securities, credit impairment is assessed using a cash flow model that estimates the principal and interest cash flows on the underlying mortgages using the security-specific collateral and transaction structure. The model distributes the estimated cash flows to the various tranches of securities, considering the transaction structure and any subordination and credit enhancements that exist in that structure. The cash flow model incorporates actual cash flows on the mortgage-backed securities through the current period and then estimates the remaining cash flows using a number of assumptions, including default rates, prepayment rates, recovery rates (on foreclosed properties) and loss severity rates (on non-agency mortgage-backed securities).
Management develops specific assumptions using market data, internal estimates and estimates published by rating agencies and other third-party sources. Default rates are projected by considering current underlying mortgage loan performance, generally assuming the default of (i) 10% of current loans, (ii) 25% of 30–59 day delinquent loans,
(iii) 70% of 60–90 day delinquent loans and (iv) 100% of 91+ day delinquent loans. These estimates are extrapolated along a default timing curve to estimate the total lifetime pool default rate. Other assumptions contemplate the actual collateral attributes, including geographic concentrations, rating actions and current market prices.
Cash flow projections are developed using different stress test scenarios. Management evaluates the results of those stress tests (including the severity of any cash shortfall indicated and the likelihood of the stress scenarios actually occurring based on the underlying pool’s characteristics and performance) to assess whether management expects to recover the amortized cost basis of the security. If cash flow projections indicate that the Company does not expect to recover its amortized cost basis, the Company recognizes the estimated credit loss in earnings.
State and Municipal Securities
The process for identifying credit impairments in Citigroup’s AFS and HTM state and municipal bonds is primarily based on a credit analysis that incorporates third-party credit ratings. Citigroup monitors the bond issuers and any insurers providing default protection in the form of financial guarantee insurance. The average external credit rating, ignoring any insurance, is Aa3/AA-. In the event of an external rating downgrade or other indicator of credit impairment (i.e., based on instrument-specific estimates of cash flows or probability of issuer default), the subject bond is specifically reviewed for adverse changes in the amount or timing of expected contractual principal and interest payments.
For state and municipal bonds with unrealized losses that Citigroup plans to sell, or would be more-likely-than-not required to sell, the full impairment is recognized in earnings.
Recognition and Measurement of OTTI
The following tables present total OTTI on Investmentsrecognized in earnings:
|
| | | | | | | | | |
| Three Months Ended
March 31, 2019 |
| In millions of dollars | AFS | HTM | Total |
| Impairment losses related to debt securities that the Company does not intend to sell nor will likely be required to sell: | | | |
| Total OTTI losses recognized during the period | $ | — |
| $ | — |
| $ | — |
|
| Less: portion of impairment loss recognized in AOCI (before taxes) | — |
| — |
| — |
|
| Net impairment losses recognized in earnings for debt securities that the Company does not intend to sell nor will likely be required to sell | $ | — |
| $ | — |
| $ | — |
|
| Impairment losses recognized in earnings for debt securities that the Company intends to sell, would be more-likely-than-not required to sell or will be subject to an issuer call deemed probable of exercise | 3 |
| — |
| 3 |
|
| Total OTTI losses recognized in earnings | $ | 3 |
| $ | — |
| $ | 3 |
|
|
| | | | | | | | | | | | | | | | | | |
| OTTI on Investments | Three Months Ended
September 30, 2018 | Nine Months Ended
September 30, 2018 |
| In millions of dollars | AFS(1) | HTM | Total | AFS(1) | HTM | Total |
| Impairment losses related to debt securities that the Company does not intend to sell nor will likely be required to sell: | | | | | | |
| Total OTTI losses recognized during the period | $ | — |
| $ | — |
| $ | — |
| $ | — |
| $ | — |
| $ | — |
|
| Less: portion of impairment loss recognized in AOCI (before taxes) | — |
| — |
| — |
| — |
| — |
| — |
|
| Net impairment losses recognized in earnings for debt securities that the Company does not intend to sell nor will likely be required to sell | $ | — |
| $ | — |
| $ | — |
| $ | — |
| $ | — |
| $ | — |
|
| Impairment losses recognized in earnings for debt securities that the Company intends to sell, would be more-likely-than-not required to sell or will be subject to an issuer call deemed probable of exercise | 70 |
| — |
| 70 |
| 109 |
| — |
| 109 |
|
| Total OTTI losses recognized in earnings | $ | 70 |
| $ | — |
| $ | 70 |
| $ | 109 |
| $ | — |
| $ | 109 |
|
| |
(1) | For the three and nine months ended September 30, 2018, amounts represent AFS debt securities. Effective January 1, 2018, the AFS category was eliminated for equity securities. See Note 1 to the Consolidated Financial Statements for additional details. |
|
| | | | | | | | | |
| Three Months Ended
March 31, 2018 |
| In millions of dollars | AFS | HTM | Total |
| Impairment losses related to securities that the Company does not intend to sell nor will likely be required to sell: | | | |
| Total OTTI losses recognized during the period | $ | — |
| $ | — |
| $ | — |
|
| Less: portion of impairment loss recognized in AOCI (before taxes) | — |
| — |
| — |
|
| Net impairment losses recognized in earnings for securities that the Company does not intend to sell nor will likely be required to sell | $ | — |
| $ | — |
| $ | — |
|
| Impairment losses recognized in earnings for securities that the Company intends to sell, would be more-likely-than-not required to sell or will be subject to an issuer call deemed probable of exercise | 27 |
| — |
| 27 |
|
| Total impairment losses recognized in earnings | $ | 27 |
| $ | — |
| $ | 27 |
|
|
| | | | | | | | | | | | | | | | | | |
| OTTI on Investments | Three Months Ended
September 30, 2017 | Nine Months Ended
September 30, 2017 |
| In millions of dollars | AFS (1) | HTM | Total | AFS(1) | HTM | Total |
| Impairment losses related to securities that the Company does not intend to sell nor will likely be required to sell: | | | | | | |
| Total OTTI losses recognized during the period | $ | 2 |
| $ | — |
| $ | 2 |
| $ | 2 |
| $ | — |
| $ | 2 |
|
| Less: portion of impairment loss recognized in AOCI (before taxes) | — |
| — |
| — |
| — |
| — |
| — |
|
| Net impairment losses recognized in earnings for securities that the Company does not intend to sell nor will likely be required to sell | $ | 2 |
| $ | — |
| $ | 2 |
| $ | 2 |
| $ | — |
| $ | 2 |
|
| Impairment losses recognized in earnings for securities that the Company intends to sell, would be more-likely-than-not required to sell or will be subject to an issuer call deemed probable of exercise and FX losses | 12 |
| 1 |
| 13 |
| 43 |
| 2 |
| 45 |
|
| Total impairment losses recognized in earnings | $ | 14 |
| $ | 1 |
| $ | 15 |
| $ | 45 |
| $ | 2 |
| $ | 47 |
|
| |
(1) | Includes OTTI on non-marketable equity securities. |
The following are three-month rollforwards of the credit-related impairments recognized in earnings for AFS and HTM debt securities held that the Company does not intend to sell nor will likely will be required to sell:
| | | | Cumulative OTTI credit losses recognized in earnings on debt securities still held | Cumulative OTTI credit losses recognized in earnings on debt securities still held |
| In millions of dollars | June 30, 2018 balance | Credit
impairments
recognized in
earnings on
securities not
previously
impaired | Credit
impairments
recognized in
earnings on
securities that
have
been previously
impaired | Changes due to
credit-impaired
securities sold,
transferred or
matured | September 30, 2018 balance | December 31, 2018 balance | Credit
impairments
recognized in
earnings on
securities not
previously
impaired | Credit
impairments
recognized in
earnings on
securities that
have
been previously
impaired | Changes due to
credit-impaired
securities sold,
transferred or
matured | March 31, 2019 balance |
| AFS debt securities | | | | | | |
Mortgage-backed securities(1) | $ | 1 |
| $ | — |
| $ | — |
| $ | — |
| $ | 1 |
| $ | 1 |
| $ | — |
| $ | — |
| $ | — |
| $ | 1 |
|
| State and municipal | — |
| — |
| — |
| — |
| — |
| — |
| — |
| — |
| — |
| — |
|
| Foreign government securities | — |
| — |
| — |
| — |
| — |
| — |
| — |
| — |
| — |
| — |
|
| Corporate | 4 |
| — |
| — |
| — |
| 4 |
| 4 |
| — |
| — |
| — |
| 4 |
|
| All other debt securities | 2 |
| — |
| — |
| — |
| 2 |
| — |
| — |
| — |
| — |
| — |
|
| Total OTTI credit losses recognized for AFS debt securities | $ | 7 |
| $ | — |
| $ | — |
| $ | — |
| $ | 7 |
| $ | 5 |
| $ | — |
| $ | — |
| $ | — |
| $ | 5 |
|
| HTM debt securities | | | | | | | | |
| Mortgage-backed securities | $ | — |
| $ | — |
| $ | — |
| $ | — |
| $ | — |
| $ | — |
| $ | — |
| $ | — |
| $ | — |
| $ | — |
|
| State and municipal | — |
| — |
| — |
| — |
| — |
| — |
| — |
| — |
| — |
| — |
|
| Total OTTI credit losses recognized for HTM debt securities | $ | — |
| $ | — |
| $ | — |
| $ | — |
| $ | — |
| $ | — |
| $ | — |
| $ | — |
| $ | — |
| $ | — |
|
| |
(1) | Primarily consists of Prime securities. |
|
| | | | | | | | | | | | | | | |
| | Cumulative OTTI credit losses recognized in earnings on debt securities still held |
| In millions of dollars | June 30, 2017 balance | Credit
impairments
recognized in
earnings on
securities not
previously
impaired | Credit
impairments
recognized in
earnings on
securities that
have
been previously
impaired | Reductions due to
credit-impaired
securities sold,
transferred or
matured | September 30, 2017 balance |
| AFS debt securities | | | | | |
| Mortgage-backed securities | $ | — |
| $ | — |
| $ | — |
| $ | — |
| $ | — |
|
| State and municipal | 4 |
| — |
| — |
| — |
| 4 |
|
| Foreign government securities | — |
| — |
| — |
| — |
| — |
|
| Corporate | 4 |
| — |
| — |
| — |
| 4 |
|
| All other debt securities | — |
| — |
| 2 |
| — |
| 2 |
|
| Total OTTI credit losses recognized for AFS debt securities | $ | 8 |
| $ | — |
| $ | 2 |
| $ | — |
| $ | 10 |
|
| HTM debt securities | | | | | |
Mortgage-backed securities(1) | $ | 97 |
| $ | — |
| $ | — |
| $ | — |
| $ | 97 |
|
| State and municipal | 3 |
| — |
| — |
| — |
| 3 |
|
| Total OTTI credit losses recognized for HTM debt securities | $ | 100 |
| $ | — |
| $ | — |
| $ | — |
| $ | 100 |
|
| |
(1) | Primarily consists of Alt-A securities. |
The following are nine-month rollforwards of the credit-related impairments recognized in earnings for AFS and HTM debt securities held that the Company does not intend to sell nor likely will be required to sell:
| | | | Cumulative OTTI credit losses recognized in earnings on debt securities still held | Cumulative OTTI credit losses recognized in earnings on debt securities still held |
| In millions of dollars | December 31, 2017 balance | Credit
impairments
recognized in
earnings on
securities not
previously
impaired | Credit
impairments
recognized in
earnings on
securities that
have
been previously
impaired | Changes due to
credit-impaired
securities sold,
transferred or
matured(1) | September 30, 2018 balance | December 31, 2017 balance | Credit
impairments
recognized in
earnings on
securities not
previously
impaired | Credit
impairments
recognized in
earnings on
securities that
have
been previously
impaired | Reductions due to
credit-impaired
securities sold,
transferred or
matured(1) | March 31, 2018 balance |
| AFS debt securities | | | | | | |
Mortgage-backed securities(2) | $ | 38 |
| $ | — |
| $ | — |
| $ | (37 | ) | $ | 1 |
| $ | 38 |
| $ | — |
| $ | — |
| $ | (13 | ) | $ | 25 |
|
| State and municipal | 4 |
| — |
| — |
| (4 | ) | — |
| 4 |
| — |
| — |
| (4 | ) | — |
|
| Foreign government securities | — |
| — |
| — |
| — |
| — |
| — |
| — |
| — |
| — |
| — |
|
| Corporate | 4 |
| — |
| — |
| — |
| 4 |
| 4 |
| — |
| — |
| — |
| 4 |
|
| All other debt securities | 2 |
| — |
| — |
| — |
| 2 |
| 2 |
| — |
| — |
| — |
| 2 |
|
| Total OTTI credit losses recognized for AFS debt securities | $ | 48 |
| $ | — |
| $ | — |
| $ | (41 | ) | $ | 7 |
| $ | 48 |
| $ | — |
| $ | — |
| $ | (17 | ) | $ | 31 |
|
| HTM debt securities | | | | | | | | |
Mortgage-backed securities(3) | $ | 54 |
| $ | — |
| $ | — |
| $ | (54 | ) | $ | — |
| $ | 54 |
| $ | — |
| $ | — |
| $ | (54 | ) | $ | — |
|
| State and municipal | 3 |
| — |
| — |
| (3 | ) | — |
| 3 |
| — |
| — |
| (3 | ) | — |
|
| Total OTTI credit losses recognized for HTM debt securities | $ | 57 |
| $ | — |
| $ | — |
| $ | (57 | ) | $ | — |
| $ | 57 |
| $ | — |
| $ | — |
| $ | (57 | ) | $ | — |
|
| |
| (1) | Includes $18 million in cumulative OTTI reclassified from HTM to AFS due to the transfer of the related debt securities from HTM to AFS. Citi adopted ASU 2017-12, Targeted Improvements to Accounting for Hedge Activities, on January 1, 2018 and transferred approximately $4 billion of HTM debt securities into AFS classification as permitted as a one-time transfer under the standard. |
| |
| (2) | Primarily consists of Prime securities. |
| |
| (3) | Primarily consists of Alt-A securities. |
|
| | | | | | | | | | | | | | | |
| | Cumulative OTTI credit losses recognized in earnings on debt securities still held |
| In millions of dollars | December 31, 2016 balance | Credit
impairments
recognized in
earnings on
securities not
previously
impaired | Credit
impairments
recognized in
earnings on
securities that
have
been previously
impaired | Reductions due to
credit-impaired
securities sold,
transferred or
matured | September 30, 2017 balance |
| AFS debt securities | | | | | |
| Mortgage-backed securities | $ | — |
| $ | — |
| $ | — |
| $ | — |
| $ | — |
|
| State and municipal | 4 |
| — |
| — |
| — |
| 4 |
|
| Foreign government securities | — |
| — |
| — |
| — |
| — |
|
| Corporate | 5 |
| — |
| — |
| (1 | ) | 4 |
|
| All other debt securities | 22 |
| — |
| 2 |
| (22 | ) | 2 |
|
| Total OTTI credit losses recognized for AFS debt securities | $ | 31 |
| $ | — |
| $ | 2 |
| $ | (23 | ) | $ | 10 |
|
| HTM debt securities | | | | | |
Mortgage-backed securities(1) | $ | 101 |
| $ | — |
| $ | — |
| $ | (4 | ) | $ | 97 |
|
| State and municipal | 3 |
| — |
| — |
| — |
| 3 |
|
| Total OTTI credit losses recognized for HTM debt securities | $ | 104 |
| $ | — |
| $ | — |
| $ | (4 | ) | $ | 100 |
|
| |
(1) | Primarily consists of Alt-A securities. |
Non-Marketable Equity Securities Not Carried at Fair Value
Effective January 1, 2018, non-marketableNon-marketable equity securities are required to be measured at fair value with changes in fair value recognized in earnings unless (i) the measurement alternative is elected or (ii) the investment represents Federal Reserve Bank and Federal Home Loan Bank stock or certain exchange seats that continue to be carried at cost. See Note 1 to the Consolidated Financial Statements for additional details.
The election to measure a non-marketable equity security using the measurement alternative is made on an instrument-by-instrument basis. Under the measurement alternative, an equity security is carried at cost plus or minus changes resulting from observable prices in orderly transactions for the identical or a similar investment of the same issuer. The carrying value of the equity security is adjusted to fair value on the date of an observed transaction. Fair value may differ from the observed transaction price due to a number of factors, including marketability adjustments and differences in rights and obligations when the observed transaction is not for the identical investment held by Citi.
Equity securities under the measurement alternative are also assessed for impairment. On a quarterly basis, management qualitatively assesses whether each equity security under the measurement alternative is impaired. Impairment indicators that are considered include, but are not limited to, the following:
a significant deterioration in the earnings performance, credit rating, asset quality or business prospects of the investee;
a significant adverse change in the regulatory, economic or technological environment of the investee;
a significant adverse change in the general market condition of either the geographical area or the industry in which the investee operates;
a bona fide offer to purchase, an offer by the investee to sell or a completed auction process for the same or similar investment for an amount less than the carrying amount of that investment; and
factors that raise significant concerns about the investee’s ability to continue as a going concern, such as negative cash flows from operations, working capital deficiencies or noncompliance with statutory capital requirements or debt covenants.
When the qualitative assessment indicates that impairment exists, the investment is written down to fair value, with the full difference between the fair value of the investment and its carrying amount recognized in earnings.
Below is the carrying value of non-marketable equity securities measured using the measurement alternative at September 30, 2018,March 31, 2019 and December 31, 2018:
|
| | | | | | |
| In millions of dollars | March 31, 2019 | December 31, 2018 |
| Measurement alternative: | | |
| Carrying value | $ | 630 |
| $ | 538 |
|
Below are amounts recognized in earnings for the three and nine months ended September 30, 2018:March 31, 2019 and 2018, and life-to-date amounts as of March 31, 2019 on non-marketable equity securities measured using the measurement alternative:
| | | | | | | Three Months Ended March 31, |
| In millions of dollars | Three Months Ended September 30, 2018 | Nine Months Ended
September 30, 2018 | 2019 | 2018 |
| Measurement alternative: |
|
|
|
|
|
|
|
|
Balance as of September 30, 2018
| $ | 452 |
| $ | 452 |
| |
Impairment losses(1) | — |
| 4 |
| $ | 5 |
| $ | 1 |
|
Downward changes for observable prices(1) | 14 |
| 18 |
| — |
| 2 |
|
Upward changes for observable prices(1) | 21 |
| 133 |
| 66 |
| 123 |
|
| |
| (1) | See Note 20 to the Consolidated Financial Statements for additional information on these nonrecurring fair value measurements. |
|
| | | |
| | Life-to-date amounts on securities still held |
| In millions of dollars | March 31, 2019 |
| Measurement alternative: | |
| Impairment losses | $ | 12 |
|
| Downward changes for observable prices | 18 |
|
| Upward changes for observable prices | 285 |
|
A similar impairment analysis is performed for non-marketable equity securities carried at cost. For the three and nine months ended September 30,March 31, 2019 and 2018, there was no
impairment loss recognized in earnings for non-marketable equity securities carried at cost.
Investments in Alternative Investment Funds That Calculate Net Asset Value
The Company holds investments in certain alternative investment funds that calculate net asset value (NAV), or its equivalent, including hedge funds, private equity funds, funds
of funds and real estate funds, as provided by third-party asset managers. Investments in such funds are generally classified as non-marketable equity securities carried at fair value. The fair values of these investments are estimated using the NAV of the Company’s ownership interest in the funds. Some of
these investments are in “covered funds” for purposes of the Volcker Rule, which prohibits certain proprietary investment activities and limits the ownership of, and relationships with, covered funds. On April 21, 2017, Citi’s request for extension of the permitted holding period under the Volcker Rule for certain of its investments in illiquid funds was approved, allowing the Company to hold such investments until the earlier of 5five years from the July 21, 2017 expiration date of the general conformance period, or the date such investments mature or are otherwise conformed with the Volcker Rule.
| | | | Fair value | Unfunded
commitments | Redemption frequency (if currently eligible) monthly, quarterly, annually | Redemption notice period | Fair value | Unfunded
commitments | Redemption frequency (if currently eligible) monthly, quarterly, annually | Redemption notice period |
| In millions of dollars | September 30,
2018 | December 31, 2017 | September 30,
2018 | December 31, 2017 | | March 31,
2019 | December 31, 2018 | March 31,
2019 | December 31, 2018 | |
| Hedge funds | $ | — |
| $ | 1 |
| $ | — |
| $ | — |
| Generally quarterly | 10–95 days | $ | — |
| $ | — |
| $ | — |
| $ | — |
| Generally quarterly | 10–95 days |
Private equity funds(1)(2) | 186 |
| 372 |
| 62 |
| 62 |
| — | 160 |
| 168 |
| 62 |
| 62 |
| — |
Real estate funds (2)(3) | 14 |
| 31 |
| 19 |
| 20 |
| — | 14 |
| 14 |
| 19 |
| 19 |
| — |
| Mutual/collective investment funds | 25 |
| — |
| — |
| — |
| — | 25 |
| 25 |
| — |
| — |
| — |
| Total | $ | 225 |
| $ | 404 |
| $ | 81 |
| $ | 82 |
| — | $ | 199 |
| $ | 207 |
| $ | 81 |
| $ | 81 |
| — |
| |
| (1) | Private equity funds include funds that invest in infrastructure, emerging markets and venture capital. |
| |
| (2) | With respect to the Company’s investments in private equity funds and real estate funds, distributions from each fund will be received as the underlying assets held by these funds are liquidated. It is estimated that the underlying assets of these funds will be liquidated over a period of several years as market conditions allow. Private equity and real estate funds do not allow redemption of investments by their investors. Investors are permitted to sell or transfer their investments, subject to the approval of the general partner or investment manager of these funds, which generally may not be unreasonably withheld. |
| |
| (3) | Includes several real estate funds that invest primarily in commercial real estate in the U.S., Europe and Asia. |
13. LOANS
Citigroup loans are reported in two categories: consumer and corporate. These categories are classified primarily according to the segment and subsegment that manage the loans. For additional information regarding Citi’s consumer and corporate loans, including related accounting policies, see Note 14 to the Consolidated Financial Statements in Citi’s 20172018 Annual Report on Form 10-K.
Consumer Loans
Consumer loans represent loans and leases managed primarily by GCB and Corporate/Other. The following table provides Citi’s consumer loans by loan type:
| | | In millions of dollars | September 30,
2018 | December 31, 2017 | March 31,
2019 | December 31, 2018 |
| In U.S. offices | | |
Mortgage and real estate(1) | $ | 61,048 |
| $ | 65,467 |
| $ | 57,461 |
| $ | 60,127 |
|
| Installment, revolving credit and other | 3,515 |
| 3,398 |
| 3,257 |
| 3,398 |
|
| Cards | 137,051 |
| 139,006 |
| 135,206 |
| 143,788 |
|
| Commercial and industrial | 7,686 |
| 7,840 |
| 8,859 |
| 8,256 |
|
| | $ | 209,300 |
| $ | 215,711 |
| |
| Total | | $ | 204,783 |
| $ | 215,569 |
|
| In offices outside the U.S. | | | | |
Mortgage and real estate(1) | $ | 43,714 |
| $ | 44,081 |
| $ | 43,184 |
| $ | 43,379 |
|
| Installment, revolving credit and other | 27,899 |
| 26,556 |
| 27,525 |
| 27,609 |
|
| Cards | 24,971 |
| 26,257 |
| 24,763 |
| 25,400 |
|
| Commercial and industrial | 18,821 |
| 20,238 |
| 18,884 |
| 17,773 |
|
| Lease financing | 52 |
| 76 |
| 47 |
| 49 |
|
| | $ | 115,457 |
| $ | 117,208 |
| |
| Total | | $ | 114,403 |
| $ | 114,210 |
|
| Total consumer loans | $ | 324,757 |
| $ | 332,919 |
| $ | 319,186 |
| $ | 329,779 |
|
| Net unearned income | $ | 712 |
| $ | 737 |
| $ | 701 |
| $ | 708 |
|
| Consumer loans, net of unearned income | $ | 325,469 |
| $ | 333,656 |
| $ | 319,887 |
| $ | 330,487 |
|
| |
| (1) | Loans secured primarily by real estate. |
TheDuring the three months ended March 31, 2019 and 2018, the Company sold and/or reclassified to held-for-sale $0.3HFS $1.9 billion and $3.0$0.8 billion, $0.4 billion and $3.2 billionrespectively, of consumer loans during the three and nine months ended September 30, 2018 and 2017, respectively.loans.
Consumer Loan Delinquency and Non-Accrual Details at September 30, 2018March 31, 2019 | | | In millions of dollars | Total current(1)(2) | 30–89 days past due(3) | ≥ 90 days past due(3) | Past due government guaranteed(4) | Total loans(2) | Total non-accrual | 90 days past due and accruing | Total current(1)(2) | 30–89 days past due(3) | ≥ 90 days past due(3) | Past due government guaranteed(4) | Total loans(2) | Total non-accrual | 90 days past due and accruing |
| In North America offices | | | | | | | | |
Residential first mortgages(5) | $ | 46,038 |
| $ | 503 |
| $ | 263 |
| $ | 903 |
| $ | 47,707 |
| $ | 628 |
| $ | 641 |
| $ | 44,047 |
| $ | 393 |
| $ | 234 |
| $ | 677 |
| $ | 45,351 |
| $ | 564 |
| $ | 456 |
|
Home equity loans(6)(7) | 11,693 |
| 174 |
| 264 |
| — |
| 12,131 |
| 561 |
| — |
| 10,527 |
| 174 |
| 236 |
| — |
| 10,937 |
| 500 |
| — |
|
| Credit cards | 134,721 |
| 1,612 |
| 1,539 |
| — |
| 137,872 |
| — |
| 1,539 |
| 132,572 |
| 1,590 |
| 1,746 |
| — |
| 135,908 |
| — |
| 1,746 |
|
| Installment and other | 3,473 |
| 40 |
| 14 |
| — |
| 3,527 |
| 20 |
| — |
| 3,257 |
| 41 |
| 15 |
| — |
| 3,313 |
| 21 |
| — |
|
| Commercial banking loans | 9,206 |
| 25 |
| 48 |
| — |
| 9,279 |
| 114 |
| — |
| 10,303 |
| 9 |
| 48 |
| — |
| 10,360 |
| 145 |
| — |
|
| Total | $ | 205,131 |
| $ | 2,354 |
| $ | 2,128 |
| $ | 903 |
| $ | 210,516 |
| $ | 1,323 |
| $ | 2,180 |
| $ | 200,706 |
| $ | 2,207 |
| $ | 2,279 |
| $ | 677 |
| $ | 205,869 |
| $ | 1,230 |
| $ | 2,202 |
|
| In offices outside North America | | | | | | | | |
Residential first mortgages(5) | $ | 35,919 |
| $ | 217 |
| $ | 146 |
| $ | — |
| $ | 36,282 |
| $ | 397 |
| $ | — |
| $ | 35,777 |
| $ | 203 |
| $ | 134 |
| $ | — |
| $ | 36,114 |
| $ | 397 |
| $ | — |
|
| Credit cards | 23,638 |
| 420 |
| 356 |
| — |
| 24,414 |
| 314 |
| 223 |
| 23,561 |
| 417 |
| 365 |
| — |
| 24,343 |
| 297 |
| 234 |
|
| Installment and other | 25,192 |
| 267 |
| 108 |
| — |
| 25,567 |
| 163 |
| — |
| 25,687 |
| 244 |
| 97 |
| — |
| 26,028 |
| 130 |
| — |
|
| Commercial banking loans | 28,569 |
| 54 |
| 66 |
| — |
| 28,689 |
| 177 |
| — |
| 27,415 |
| 53 |
| 64 |
| — |
| 27,532 |
| 151 |
| — |
|
| Total | $ | 113,318 |
| $ | 958 |
| $ | 676 |
| $ | — |
| $ | 114,952 |
| $ | 1,051 |
| $ | 223 |
| $ | 112,440 |
| $ | 917 |
| $ | 660 |
| $ | — |
| $ | 114,017 |
| $ | 975 |
| $ | 234 |
|
Total GCB and Corporate/Other— Consumer | $ | 318,449 |
| $ | 3,312 |
| $ | 2,804 |
| $ | 903 |
| $ | 325,468 |
| $ | 2,374 |
| $ | 2,403 |
| $ | 313,146 |
| $ | 3,124 |
| $ | 2,939 |
| $ | 677 |
| $ | 319,886 |
| $ | 2,205 |
| $ | 2,436 |
|
Other(8) | 1 |
| — |
| — |
| — |
| 1 |
| — |
| — |
| 1 |
| — |
| — |
| — |
| 1 |
| — |
| — |
|
| Total Citigroup | $ | 318,450 |
| $ | 3,312 |
| $ | 2,804 |
| $ | 903 |
| $ | 325,469 |
| $ | 2,374 |
| $ | 2,403 |
| $ | 313,147 |
| $ | 3,124 |
| $ | 2,939 |
| $ | 677 |
| $ | 319,887 |
| $ | 2,205 |
| $ | 2,436 |
|
| |
| (1) | Loans less than 30 days past due are presented as current. |
| |
| (2) | Includes $21$20 million of residential first mortgages recorded at fair value. |
| |
| (3) | Excludes loans guaranteed by U.S. government-sponsored entities. |
| |
| (4) | Consists of residential first mortgages that are guaranteed by U.S. government-sponsored entities that are 30–89 days past due of $0.2 billion and 90 days or more past due of $0.7$0.5 billion. |
| |
| (5) | Includes approximately $0.1 billion of residential first mortgage loans in process of foreclosure. |
| |
| (6) | Includes approximately $0.1 billion of home equity loans in process of foreclosure. |
| |
| (7) | Fixed-rate home equity loans and loans extended under home equity lines of credit, which are typically in junior lien positions. |
| |
| (8) | Represents loans classified as consumer loans on the Consolidated Balance Sheet that are not included in GCB or Corporate/Other consumer credit metrics. |
Consumer Loan Delinquency and Non-Accrual Details at December 31, 20172018 | | | In millions of dollars | Total current(1)(2) | 30–89 days past due(3) | ≥ 90 days past due(3) | Past due government guaranteed(4) | Total loans(2) | Total non-accrual | 90 days past due and accruing | Total current(1)(2) | 30–89 days past due(3) | ≥ 90 days past due(3) | Past due government guaranteed(4) | Total loans(2) | Total non-accrual | 90 days past due and accruing |
| In North America offices | | | | | | |
Residential first mortgages(5) | $ | 47,366 |
| $ | 505 |
| $ | 280 |
| $ | 1,225 |
| $ | 49,376 |
| $ | 665 |
| $ | 941 |
| $ | 45,953 |
| $ | 420 |
| $ | 253 |
| $ | 786 |
| $ | 47,412 |
| $ | 583 |
| $ | 549 |
|
Home equity loans(6)(7) | 14,268 |
| 207 |
| 352 |
| — |
| 14,827 |
| 750 |
| — |
| 11,135 |
| 161 |
| 247 |
| — |
| 11,543 |
| 527 |
| — |
|
| Credit cards | 136,588 |
| 1,528 |
| 1,613 |
| — |
| 139,729 |
| — |
| 1,596 |
| 141,106 |
| 1,687 |
| 1,764 |
| — |
| 144,557 |
| — |
| 1,764 |
|
| Installment and other | 3,395 |
| 45 |
| 16 |
| — |
| 3,456 |
| 22 |
| 1 |
| 3,394 |
| 43 |
| 16 |
| — |
| 3,453 |
| 22 |
| — |
|
| Commercial banking loans | 9,395 |
| 51 |
| 65 |
| — |
| 9,511 |
| 213 |
| — |
| 9,662 |
| 20 |
| 46 |
| — |
| 9,728 |
| 109 |
| — |
|
| Total | $ | 211,012 |
| $ | 2,336 |
| $ | 2,326 |
| $ | 1,225 |
| $ | 216,899 |
| $ | 1,650 |
| $ | 2,538 |
| $ | 211,250 |
| $ | 2,331 |
| $ | 2,326 |
| $ | 786 |
| $ | 216,693 |
| $ | 1,241 |
| $ | 2,313 |
|
| In offices outside North America | | | | | | | |
Residential first mortgages(5) | $ | 37,062 |
| $ | 209 |
| $ | 148 |
| $ | — |
| $ | 37,419 |
| $ | 400 |
| $ | — |
| $ | 35,624 |
| $ | 203 |
| $ | 145 |
| $ | — |
| $ | 35,972 |
| $ | 383 |
| $ | — |
|
| Credit cards | 24,934 |
| 427 |
| 366 |
| — |
| 25,727 |
| 323 |
| 259 |
| 24,131 |
| 425 |
| 370 |
| — |
| 24,926 |
| 312 |
| 235 |
|
| Installment and other | 25,634 |
| 275 |
| 123 |
| — |
| 26,032 |
| 157 |
| — |
| 25,085 |
| 254 |
| 107 |
| — |
| 25,446 |
| 152 |
| — |
|
| Commercial banking loans | 27,449 |
| 57 |
| 72 |
| — |
| 27,578 |
| 160 |
| — |
| 27,345 |
| 51 |
| 53 |
| — |
| 27,449 |
| 138 |
| — |
|
| Total | $ | 115,079 |
| $ | 968 |
| $ | 709 |
| $ | — |
| $ | 116,756 |
| $ | 1,040 |
| $ | 259 |
| $ | 112,185 |
| $ | 933 |
| $ | 675 |
| $ | — |
| $ | 113,793 |
| $ | 985 |
| $ | 235 |
|
Total GCB and Corporate/Other— Consumer | $ | 326,091 |
| $ | 3,304 |
| $ | 3,035 |
| $ | 1,225 |
| $ | 333,655 |
| $ | 2,690 |
| $ | 2,797 |
| $ | 323,435 |
| $ | 3,264 |
| $ | 3,001 |
| $ | 786 |
| $ | 330,486 |
| $ | 2,226 |
| $ | 2,548 |
|
Other(8) | 1 |
| — |
| — |
| — |
| 1 |
| — |
| — |
| 1 |
| — |
| — |
| — |
| 1 |
| — |
| — |
|
| Total Citigroup | $ | 326,092 |
| $ | 3,304 |
| $ | 3,035 |
| $ | 1,225 |
| $ | 333,656 |
| $ | 2,690 |
| $ | 2,797 |
| $ | 323,436 |
| $ | 3,264 |
| $ | 3,001 |
| $ | 786 |
| $ | 330,487 |
| $ | 2,226 |
| $ | 2,548 |
|
| |
| (1) | Loans less than 30 days past due are presented as current. |
| |
| (2) | Includes $25$20 million of residential first mortgages recorded at fair value. |
| |
| (3) | Excludes loans guaranteed by U.S. government-sponsored entities. |
| |
| (4) | Consists of residential first mortgages that are guaranteed by U.S. government-sponsored entities that are 30–89 days past due of $0.2 billion and 90 days or more past due of $1.0$0.6 billion. |
| |
| (5) | Includes approximately $0.1 billion of residential first mortgage loans in process of foreclosure. |
| |
| (6) | Includes approximately $0.1 billion of home equity loans in process of foreclosure. |
| |
| (7) | Fixed-rate home equity loans and loans extended under home equity lines of credit, which are typically in junior lien positions. |
| |
| (8) | Represents loans classified as consumer loans on the Consolidated Balance Sheet that are not included in GCB or Corporate/Other consumer credit metrics. |
Consumer Credit Scores (FICO)
The following tables provide details on the FICO scores for Citi’s U.S. consumer loan portfolio based on end-of-period receivables (commercial banking loans are excluded from the table since they are business based and FICO scores are not a primary driver in their credit evaluation). FICO scores are updated monthly for substantially all of the portfolio or, otherwise, on a quarterly basis for the remaining portfolio. | | FICO score distribution in U.S. portfolio(1)(2) | September 30, 2018 | March 31, 2019 |
| In millions of dollars | Less than
680 | 680 to 760 | Greater
than 760 | Less than
680 | 680 to 760 | Greater
than 760 |
| Residential first mortgages | $ | 4,647 |
| $ | 13,854 |
| $ | 26,553 |
| $ | 4,169 |
| $ | 12,922 |
| $ | 25,874 |
|
| Home equity loans | 2,575 |
| 4,495 |
| 4,692 |
| 2,321 |
| 4,093 |
| 4,188 |
|
| Credit cards | 31,379 |
| 56,636 |
| 47,675 |
| 32,056 |
| 55,975 |
| 45,934 |
|
| Installment and other | 624 |
| 1,080 |
| 1,189 |
| 611 |
| 1,009 |
| 1,105 |
|
| Total | $ | 39,225 |
| $ | 76,065 |
| $ | 80,109 |
| $ | 39,157 |
| $ | 73,999 |
| $ | 77,101 |
|
| | FICO score distribution in U.S. portfolio(1)(2) | December 31, 2017 | December 31, 2018 |
In millions of dollars | Less than 680 | 680 to 760 | Greater than 760 | Less than 680 | 680 to 760 | Greater than 760 |
| Residential first mortgages | $ | 5,603 |
| $ | 14,423 |
| $ | 26,271 |
| $ | 4,530 |
| $ | 13,848 |
| $ | 26,546 |
|
| Home equity loans | 3,347 |
| 5,439 |
| 5,650 |
| 2,438 |
| 4,296 |
| 4,471 |
|
| Credit cards | 30,875 |
| 56,443 |
| 48,989 |
| 32,686 |
| 58,722 |
| 51,299 |
|
| Installment and other | 716 |
| 1,020 |
| 1,275 |
| 625 |
| 1,097 |
| 1,121 |
|
| Total | $ | 40,541 |
| $ | 77,325 |
| $ | 82,185 |
| $ | 40,279 |
| $ | 77,963 |
| $ | 83,437 |
|
| |
| (1) | Excludes loans guaranteed by U.S. government entities, loans subject to long-term standby commitments (LTSC) with U.S. government-sponsored entities and loans recorded at fair value. |
| |
| (2) | Excludes balances where FICO was not available. Such amounts are not material. |
Loan to Value (LTV) Ratios
The following tables provide details on the LTV ratios for Citi’s U.S. consumer mortgage portfolios. LTV ratios are updated monthly using the most recent Core Logic Home Price Index data available for substantially all of the portfolio applied at the Metropolitan Statistical Area level, if available, or the state level if not. The remainder of the portfolio is updated in a similar manner using the Federal Housing Finance Agency indices.
|
| | | | | | | | | |
LTV distribution in U.S. portfolio(1)(2) | March 31, 2019 |
| In millions of dollars | Less than or equal to 80% | > 80% but less than or equal to 100% | Greater than 100% |
| Residential first mortgages | $ | 40,112 |
| $ | 2,745 |
| $ | 234 |
|
| Home equity loans | 8,955 |
| 1,224 |
| 380 |
|
| Total | $ | 49,067 |
| $ | 3,969 |
| $ | 614 |
|
|
| | | | | | | | | |
LTV distribution in U.S. portfolio(1)(2) | September 30, 2018 |
| In millions of dollars | Less than or equal to 80% | > 80% but less than or equal to 100% | Greater than 100% |
| Residential first mortgages | $ | 42,823 |
| $ | 2,205 |
| $ | 151 |
|
| Home equity loans | 9,884 |
| 1,366 |
| 446 |
|
| Total | $ | 52,707 |
| $ | 3,571 |
| $ | 597 |
|
| | LTV distribution in U.S. portfolio(1)(2) | December 31, 2017 | December 31, 2018 |
| In millions of dollars | Less than or equal to 80% | > 80% but less than or equal to 100% | Greater than 100% | Less than or equal to 80% | > 80% but less than or equal to 100% | Greater than 100% |
| Residential first mortgages | $ | 43,626 |
| $ | 2,578 |
| $ | 247 |
| $ | 42,379 |
| $ | 2,474 |
| $ | 197 |
|
| Home equity loans | 11,403 |
| 2,147 |
| 800 |
| 9,465 |
| 1,287 |
| 390 |
|
| Total | $ | 55,029 |
| $ | 4,725 |
| $ | 1,047 |
| $ | 51,844 |
| $ | 3,761 |
| $ | 587 |
|
| |
| (1) | Excludes loans guaranteed by U.S. government entities, loans subject to LTSCs with U.S. government-sponsored entities and loans recorded at fair value. |
| |
| (2) | Excludes balances where LTV was not available. Such amounts are not material. |
The following tables present information about impaired consumer loans and interest income recognized on impaired consumer loans:
| | | | | Three Months Ended
September 30, | Nine Months Ended September 30, | | Three Months Ended
March 31, |
| | Balance at September 30, 2018 | 2018 | 2017 | 2018 | 2017 | Balance at March 31, 2019 | 2019 | 2018 |
| In millions of dollars | Recorded investment(1)(2) | Unpaid principal balance | Related specific allowance(3) | Average carrying value(4) | Interest income
recognized(5) | Interest income
recognized(5) | Interest income recognized(5) | Interest income recognized(5) | Recorded investment(1)(2) | Unpaid principal balance | Related specific allowance(3) | Average carrying value(4) | Interest income
recognized(5) | Interest income
recognized(5) |
| Mortgage and real estate | | | | | | | | |
| Residential first mortgages | $ | 2,294 |
| $ | 2,508 |
| $ | 197 |
| $ | 2,670 |
| $ | 21 |
| $ | 29 |
| $ | 63 |
| $ | 97 |
| $ | 2,085 |
| $ | 2,289 |
| $ | 162 |
| $ | 2,250 |
| $ | 17 |
| $ | 21 |
|
| Home equity loans | 704 |
| 980 |
| 125 |
| 815 |
| 2 |
| 7 |
| 10 |
| 21 |
| 672 |
| 938 |
| 123 |
| 698 |
| 2 |
| 7 |
|
| Credit cards | 1,801 |
| 1,828 |
| 654 |
| 1,807 |
| 24 |
| 37 |
| 79 |
| 110 |
| 1,860 |
| 1,891 |
| 702 |
| 1,818 |
| 26 |
| 30 |
|
| Installment and other | | | | | | | | | |
| Individual installment and other | 406 |
| 436 |
| 153 |
| 421 |
| 5 |
| 5 |
| 17 |
| 18 |
| 397 |
| 429 |
| 146 |
| 402 |
| 5 |
| 6 |
|
| Commercial banking | 296 |
| 441 |
| 46 |
| 306 |
| 2 |
| 4 |
| 10 |
| 18 |
| 274 |
| 527 |
| 38 |
| 282 |
| 3 |
| 3 |
|
| Total | $ | 5,501 |
| $ | 6,193 |
| $ | 1,175 |
| $ | 6,019 |
| $ | 54 |
| $ | 82 |
| $ | 179 |
| $ | 264 |
| $ | 5,288 |
| $ | 6,074 |
| $ | 1,171 |
| $ | 5,450 |
| $ | 53 |
| $ | 67 |
|
| |
| (1) | Recorded investment in a loan includes net deferred loan fees and costs, unamortized premium or discount and direct write-downs and includes accrued interest only on credit card loans. |
| |
| (2) | $529508 million of residential first mortgages, $270$255 million of home equity loans and $25$4 million of commercial market loans do not have a specific allowance. |
(3) Included in the Allowance for loan losses.
| |
| (4) | Average carrying value represents the average recorded investment ending balance for the last four quarters and does not include the related specific allowance. |
(5) Includes amounts recognized on both an accrual and cash basis.
| | | | Balance, December 31, 2017 | Balance, December 31, 2018 |
| In millions of dollars | Recorded investment(1)(2) | Unpaid principal balance | Related specific allowance(3) | Average carrying value(4) | Recorded investment(1)(2) | Unpaid principal balance | Related specific allowance(3) | Average carrying value(4) |
| Mortgage and real estate | | |
| Residential first mortgages | $ | 2,877 |
| $ | 3,121 |
| $ | 278 |
| $ | 3,155 |
| $ | 2,130 |
| $ | 2,329 |
| $ | 178 |
| $ | 2,483 |
|
| Home equity loans | 1,151 |
| 1,590 |
| 216 |
| 1,181 |
| 684 |
| 946 |
| 122 |
| 698 |
|
| Credit cards | 1,787 |
| 1,819 |
| 614 |
| 1,803 |
| 1,818 |
| 1,842 |
| 677 |
| 1,815 |
|
| Installment and other | | |
| Individual installment and other | 431 |
| 460 |
| 175 |
| 415 |
| 400 |
| 434 |
| 146 |
| 414 |
|
| Commercial banking | 334 |
| 541 |
| 51 |
| 429 |
| 252 |
| 432 |
| 55 |
| 286 |
|
| Total | $ | 6,580 |
| $ | 7,531 |
| $ | 1,334 |
| $ | 6,983 |
| $ | 5,284 |
| $ | 5,983 |
| $ | 1,178 |
| $ | 5,696 |
|
| |
| (1) | Recorded investment in a loan includes net deferred loan fees and costs, unamortized premium or discount and direct write-downs and includes accrued interest only on credit card loans. |
| |
| (2) | $607484 million of residential first mortgages, $370$263 million of home equity loans and $10$2 million of commercial market loans do not have a specific allowance. |
| |
| (3) | Included in the Allowance for loan losses. |
| |
| (4) | Average carrying value represents the average recorded investment ending balance for the last four quarters and does not include the related specific allowance. |
Consumer Troubled Debt Restructurings
| | | | For the Three Months Ended September 30, 2018 | For the Three Months Ended March 31, 2019 |
| In millions of dollars, except number of loans modified | Number of
loans modified | Post-
modification
recorded
investment(1)(2) | Deferred
principal(3) | Contingent
principal
forgiveness(4) | Principal
forgiveness(5) | Average
interest rate
reduction | Number of
loans modified | Post-
modification
recorded
investment(1)(2) | Deferred
principal(3) | Contingent
principal
forgiveness(4) | Principal
forgiveness(5) | Average
interest rate
reduction |
| North America | | | | | | |
| Residential first mortgages | 461 |
| $ | 66 |
| $ | — |
| $ | — |
| $ | — |
| — | % | 493 |
| $ | 74 |
| $ | — |
| $ | — |
| $ | — |
| — | % |
| Home equity loans | 261 |
| 26 |
| 1 |
| — |
| — |
| 1 |
| 206 |
| 21 |
| 1 |
| — |
| — |
| 2 |
|
| Credit cards | 61,508 |
| 253 |
| — |
| — |
| — |
| 18 |
| 72,247 |
| 305 |
| — |
| — |
| — |
| 18 |
|
| Installment and other revolving | 322 |
| 2 |
| — |
| — |
| — |
| 5 |
| 351 |
| 3 |
| — |
| — |
| — |
| 6 |
|
Commercial banking(6) | 11 |
| 3 |
| — |
| — |
| — |
| — |
| 15 |
| 38 |
| — |
| — |
| — |
| — |
|
Total(8) | 62,563 |
| $ | 350 |
| $ | 1 |
| $ | — |
| $ | — |
|
|
| 73,312 |
| $ | 441 |
| $ | 1 |
| $ | — |
| $ | — |
|
|
|
| International | | | | | | |
| Residential first mortgages | 660 |
| $ | 22 |
| $ | — |
| $ | — |
| $ | — |
| — | % | 725 |
| $ | 20 |
| $ | — |
| $ | — |
| $ | — |
| — | % |
| Credit cards | 18,413 |
| 77 |
| — |
| — |
| 2 |
| 17 |
| 18,493 |
| 75 |
| — |
| — |
| 3 |
| 16 |
|
| Installment and other revolving | 6,421 |
| 34 |
| — |
| — |
| 2 |
| 10 |
| 7,552 |
| 45 |
| — |
| — |
| 2 |
| 10 |
|
Commercial banking(6) | 131 |
| 9 |
| — |
| — |
| — |
| — |
| 99 |
| 32 |
| — |
| — |
| — |
| — |
|
Total(8) | 25,625 |
| $ | 142 |
| $ | — |
| $ | — |
| $ | 4 |
|
|
| 26,869 |
| $ | 172 |
| $ | — |
| $ | — |
| $ | 5 |
|
|
|
| | | | For the Three Months Ended September 30, 2017 | For the Three Months Ended March 31, 2018 |
| In millions of dollars, except number of loans modified | Number of loans modified | Post- modification recorded investment(1)(7) | Deferred principal(3) | Contingent principal forgiveness(4) | Principal forgiveness(5) | Average interest rate reduction | Number of loans modified | Post- modification recorded investment(1)(7) | Deferred principal(3) | Contingent principal forgiveness(4) | Principal forgiveness(5) | Average interest rate reduction |
| North America | | | | | | |
| Residential first mortgages | 1,400 |
| $ | 199 |
| $ | 1 |
| $ | — |
| $ | — |
| — | % | 588 |
| $ | 89 |
| $ | 1 |
| $ | — |
| $ | — |
| — | % |
| Home equity loans | 830 |
| 70 |
| 5 |
| — |
| — |
| 1 |
| 456 |
| 41 |
| 2 |
| — |
| — |
| 1 |
|
| Credit cards | 59,285 |
| 225 |
| — |
| — |
| — |
| 17 |
| 63,203 |
| 244 |
| — |
| — |
| — |
| 18 |
|
| Installment and other revolving | 299 |
| 2 |
| — |
| — |
| — |
| 6 |
| 342 |
| 3 |
| — |
| — |
| — |
| 5 |
|
Commercial banking(6) | 33 |
| 59 |
| — |
| — |
| — |
| — |
| 9 |
| 1 |
| — |
| — |
| — |
| — |
|
Total(8) | 61,847 |
| $ | 555 |
| $ | 6 |
| $ | — |
| $ | — |
| |
| 64,598 |
| $ | 378 |
| $ | 3 |
| $ | — |
| $ | — |
| |
|
| International | | | | | | |
| Residential first mortgages | 703 |
| $ | 25 |
| $ | — |
| $ | — |
| $ | — |
| — | % | 549 |
| $ | 18 |
| $ | — |
| $ | — |
| $ | — |
| — | % |
| Credit cards | 28,254 |
| 103 |
| — |
| — |
| 2 |
| 11 |
| 23,394 |
| 94 |
| — |
| — |
| 2 |
| 15 |
|
| Installment and other revolving | 11,725 |
| 70 |
| — |
| — |
| 3 |
| 11 |
| 9,325 |
| 59 |
| — |
| — |
| 2 |
| 10 |
|
Commercial banking(6) | 97 |
| 11 |
| — |
| — |
| — |
| — |
| 145 |
| 28 |
| — |
| — |
| — |
| 2 |
|
Total(8) | 40,779 |
| $ | 209 |
| $ | — |
| $ | — |
| $ | 5 |
| |
| 33,413 |
| $ | 199 |
| $ | — |
| $ | — |
| $ | 4 |
| |
|
| |
| (1) | Post-modification balances include past due amounts that are capitalized at the modification date. |
| |
| (2) | Post-modification balances in North America include $10$7 million of residential first mortgages and $2 million of home equity loans to borrowers who have gone through Chapter 7 bankruptcy in the three months ended September 30, 2018.March 31, 2019. These amounts include $7$4 million of residential first mortgages and $2 million of home equity loans that were newly classified as TDRs in the three months ended September 30, 2018,March 31, 2019, based on previously received OCC guidance. |
| |
| (3) | Represents portion of contractual loan principal that is non-interest bearing, but still due from the borrower. Such deferred principal is charged off at the time of permanent modification to the extent that the related loan balance exceeds the underlying collateral value. |
| |
| (4) | Represents portion of contractual loan principal that is non-interest bearing and, depending upon borrower performance, eligible for forgiveness. |
| |
| (5) | Represents portion of contractual loan principal that was forgiven at the time of permanent modification. |
| |
| (6) | Commercial banking loans are generally borrower-specific modifications and incorporate changes in the amount and/or timing of principal and/or interest. |
| |
| (7) | Post-modification balances in North America include $12$11 million of residential first mortgages and $5$4 million of home equity loans to borrowers who have gone through Chapter 7 bankruptcy in the three months ended September 30, 2017.March 31, 2018. These amounts include $7$8 million of residential first mortgages and $5$3 million of home equity loans that were newly classified as TDRs in the three months ended September 30, 2017,March 31, 2018, based on previously received OCC guidance. |
| |
| (8) | The above tables reflect activity for loans outstanding that were considered TDRs as of the end of the reporting period. |
|
| | | | | | | | | | | | | | | | |
| | For the Nine Months Ended September 30, 2018 |
| In millions of dollars, except number of loans modified | Number of loans modified | Post- modification recorded investment(1)(2) | Deferred principal(3) | Contingent principal forgiveness(4) | Principal forgiveness(5) | Average interest rate reduction |
| North America | | | | | | |
| Residential first mortgages | 1,544 |
| $ | 233 |
| $ | 2 |
| $ | — |
| $ | — |
| — | % |
| Home equity loans | 1,097 |
| 104 |
| 4 |
| — |
| — |
| 1 |
|
| Credit cards | 180,170 |
| 717 |
| — |
| — |
| — |
| 17 |
|
| Installment and other revolving | 956 |
| 7 |
| — |
| — |
| — |
| 5 |
|
Commercial banking(6) | 37 |
| 5 |
| — |
| — |
| — |
| — |
|
Total(8) | 183,804 |
| $ | 1,066 |
| $ | 6 |
| $ | — |
| $ | — |
| |
| International | | | | | | |
| Residential first mortgages | 1,833 |
| $ | 62 |
| $ | — |
| $ | — |
| $ | — |
| — | % |
| Credit cards | 59,589 |
| 249 |
| — |
| — |
| 7 |
| 16 |
|
| Installment and other revolving | 22,918 |
| 136 |
| — |
| — |
| 6 |
| 10 |
|
Commercial banking(6) | 433 |
| 60 |
| — |
| — |
| — |
| 1 |
|
Total(8) | 84,773 |
| $ | 507 |
| $ | — |
| $ | — |
| $ | 13 |
| |
|
| | | | | | | | | | | | | | | | |
| | For the Nine Months Ended September 30, 2017 |
| In millions of dollars, except number of loans modified | Number of loans modified | Post- modification recorded investment(1)(7) | Deferred principal(3) | Contingent principal forgiveness(4) | Principal forgiveness(5) | Average interest rate reduction |
| North America | | | | | | |
| Residential first mortgages | 3,172 |
| $ | 445 |
| $ | 5 |
| $ | — |
| $ | 2 |
| 1 | % |
| Home equity loans | 2,186 |
| 185 |
| 13 |
| — |
| — |
| 1 |
|
| Credit cards | 171,702 |
| 659 |
| — |
| — |
| — |
| 17 |
|
| Installment and other revolving | 770 |
| 6 |
| — |
| — |
| — |
| 5 |
|
Commercial banking(6) | 89 |
| 107 |
| — |
| — |
| — |
| — |
|
Total(8) | 177,919 |
| $ | 1,402 |
| $ | 18 |
| $ | — |
| $ | 2 |
| |
| International | | | | | | |
| Residential first mortgages | 2,071 |
| $ | 80 |
| $ | — |
| $ | — |
| $ | — |
| — | % |
| Credit cards | 82,042 |
| 286 |
| — |
| — |
| 6 |
| 12 |
|
| Installment and other revolving | 34,654 |
| 194 |
| — |
| — |
| 9 |
| 9 |
|
Commercial banking(6) | 182 |
| 30 |
| — |
| — |
| — |
| — |
|
Total(8) | 118,949 |
| $ | 590 |
| $ | — |
| $ | — |
| $ | 15 |
| |
| |
(1) | Post-modification balances include past due amounts that are capitalized at the modification date. |
| |
(2) | Post-modification balances in North America include $29 million of residential first mortgages and $10 million of home equity loans to borrowers who have gone through Chapter 7 bankruptcy in the nine months ended September 30, 2018. These amounts include $20 million of residential first mortgages and $9 million of home equity loans that were newly classified as TDRs in the nine months ended September 30, 2018, based on previously received OCC guidance.
|
| |
(3) | Represents portion of contractual loan principal that is non-interest bearing but still due from the borrower. Such deferred principal is charged off at the time of permanent modification to the extent that the related loan balance exceeds the underlying collateral value. |
| |
(4) | Represents portion of contractual loan principal that is non-interest bearing and, depending upon borrower performance, eligible for forgiveness. |
| |
(5) | Represents portion of contractual loan principal that was forgiven at the time of permanent modification. |
| |
(6) | Commercial banking loans are generally borrower-specific modifications and incorporate changes in the amount and/or timing of principal and/or interest. |
| |
(7) | Post-modification balances in North America include $42 million of residential first mortgages and $16 million of home equity loans to borrowers who have gone through Chapter 7 bankruptcy in the nine months ended September 30, 2017. These amounts include $28 million of residential first mortgages and $14 million of home equity loans that were newly classified as TDRs in the nine months ended September 30, 2017, based on previously received OCC guidance.
|
| |
(8) | The above tables reflect activity for loans outstanding that were considered TDRs as of the end of the reporting period. |
The following table presents consumer TDRs that defaulted for which the payment default occurred within one year of a permanent modification. Default is defined as 60 days past due, except for classifiably managed commercial banking loans, where default is defined as 90 days past due.
|
| | | | | | |
| | Three Months Ended March 31, |
| In millions of dollars | 2019 | 2018 |
| North America | | |
| Residential first mortgages | $ | 23 |
| $ | 44 |
|
| Home equity loans | 3 |
| 10 |
|
| Credit cards | 70 |
| 59 |
|
| Installment and other revolving | 1 |
| 1 |
|
| Commercial banking | — |
| 8 |
|
| Total | $ | 97 |
| $ | 122 |
|
| International | | |
| Residential first mortgages | $ | 3 |
| $ | 2 |
|
| Credit cards | 38 |
| 53 |
|
| Installment and other revolving | 18 |
| 24 |
|
| Commercial banking | — |
| — |
|
| Total | $ | 59 |
| $ | 79 |
|
|
| | | | | | | | | | | | |
| | Three Months Ended September 30, | Nine Months Ended September 30, |
| In millions of dollars | 2018 | 2017 | 2018 | 2017 |
| North America | | | | |
| Residential first mortgages | $ | 31 |
| $ | 57 |
| $ | 105 |
| $ | 156 |
|
| Home equity loans | 5 |
| 8 |
| 21 |
| 25 |
|
| Credit cards | 57 |
| 54 |
| 173 |
| 163 |
|
| Installment and other revolving | 1 |
| 1 |
| 2 |
| 2 |
|
| Commercial banking | 1 |
| — |
| 22 |
| 2 |
|
| Total | $ | 95 |
| $ | 120 |
| $ | 323 |
| $ | 348 |
|
| International | | | | |
| Residential first mortgages | $ | 2 |
| $ | 3 |
| $ | 6 |
| $ | 8 |
|
| Credit cards | 48 |
| 48 |
| 156 |
| 136 |
|
| Installment and other revolving | 18 |
| 25 |
| 62 |
| 71 |
|
| Commercial banking | 7 |
| — |
| 17 |
| — |
|
| Total | $ | 75 |
| $ | 76 |
| $ | 241 |
| $ | 215 |
|
Corporate Loans
Corporate loans represent loans and leases managed by ICG. The following table presents information by corporate loan type:
| | | In millions of dollars | September 30,
2018 | December 31,
2017 | March 31,
2019 | December 31,
2018 |
| In U.S. offices | | |
| Commercial and industrial | $ | 51,365 |
| $ | 51,319 |
| $ | 56,698 |
| $ | 52,063 |
|
| Financial institutions | 46,255 |
| 39,128 |
| 49,985 |
| 48,447 |
|
Mortgage and real estate(1) | 47,629 |
| 44,683 |
| 49,746 |
| 50,124 |
|
| Installment, revolving credit and other | 32,201 |
| 33,181 |
| 32,768 |
| 33,247 |
|
| Lease financing | 1,445 |
| 1,470 |
| 1,405 |
| 1,429 |
|
| | $ | 178,895 |
| $ | 169,781 |
| $ | 190,602 |
| $ | 185,310 |
|
| In offices outside the U.S. | | | | |
| Commercial and industrial | $ | 98,281 |
| $ | 93,750 |
| $ | 97,844 |
| $ | 94,701 |
|
| Financial institutions | 37,851 |
| 35,273 |
| 39,155 |
| 36,837 |
|
Mortgage and real estate(1) | 7,344 |
| 7,309 |
| 7,005 |
| 7,376 |
|
| Installment, revolving credit and other | 22,827 |
| 22,638 |
| 24,868 |
| 25,684 |
|
| Lease financing | 131 |
| 190 |
| 95 |
| 103 |
|
| Governments and official institutions | 4,898 |
| 5,200 |
| 3,698 |
| 4,520 |
|
| | $ | 171,332 |
| $ | 164,360 |
| $ | 172,665 |
| $ | 169,221 |
|
| Total corporate loans | $ | 350,227 |
| $ | 334,141 |
| $ | 363,267 |
| $ | 354,531 |
|
| Net unearned income | $ | (787 | ) | $ | (763 | ) | $ | (808 | ) | $ | (822 | ) |
| Corporate loans, net of unearned income | $ | 349,440 |
| $ | 333,378 |
| $ | 362,459 |
| $ | 353,709 |
|
| |
| (1) | Loans secured primarily by real estate. |
The Company sold and/or reclassified to held-for-sale $0.3 billion and $0.8$0.1 billion of corporate loans during the three and nine months ended September 30, 2018, respectively,March 31, 2019 and $0.1 billion and $0.6 billion during three and nine months ended September 30, 2017, respectively.2018. The Company did not have significant purchases of corporate loans classified as held-for-investment for the three and nine months ended September 30, 2018March 31, 2019 or 2017.2018.
Lease financing
Citi is a lessor in the power, railcars, shipping and aircraft sectors, where the Company has executed operating, direct financing and leveraged leases. Citi’s $1.5 billion of lease financing receivables, as of March 31, 2019, is composed of approximately equal balances of direct financing lease receivables and net investments in leveraged leases. Citi uses the interest rate implicit in the lease to determine the present value of its lease financing receivables. Citi recognized $21 million of interest income on direct financing and leveraged leases during the three months ended March 31, 2019.
The Company’s leases have an average remaining maturity of approximately 4 years. In certain cases, Citi obtains residual value insurance from third parties and/or the lessee to manage the risk associated with the residual value of the leased assets. The receivable related to the residual value of the leased assets is approximately $0.9 billion as of March 31, 2019, while the amount covered by residual value guarantees is approximately $0.3 billion.
The Company’s operating leases, where Citi is a lessor, are not significant to the consolidated financial statements.
Corporate Loan Delinquency and Non-Accrual Details at September 30, 2018March 31, 2019 |
| | | | | | | | | | | | | | | | | | |
| In millions of dollars | 30–89 days past due and accruing(1) | ≥ 90 days past due and accruing(1) | Total past due and accruing | Total non-accrual(2) | Total current(3) | Total loans(4) |
| Commercial and industrial | $ | 455 |
| $ | 125 |
| $ | 580 |
| $ | 1,177 |
| $ | 151,074 |
| $ | 152,831 |
|
| Financial institutions | 301 |
| 136 |
| 437 |
| 92 |
| 86,487 |
| 87,016 |
|
| Mortgage and real estate | 191 |
| — |
| 191 |
| 182 |
| 56,359 |
| 56,732 |
|
| Leases | 16 |
| 19 |
| 35 |
| — |
| 1,465 |
| 1,500 |
|
| Other | 128 |
| 76 |
| 204 |
| 31 |
| 60,291 |
| 60,526 |
|
| Loans at fair value | | | | | | 3,854 |
|
| Total | $ | 1,091 |
| $ | 356 |
| $ | 1,447 |
| $ | 1,482 |
| $ | 355,676 |
| $ | 362,459 |
|
|
| | | | | | | | | | | | | | | | | | |
| In millions of dollars | 30–89 days past due and accruing(1) | ≥ 90 days past due and accruing(1) | Total past due and accruing | Total non-accrual(2) | Total current(3) | Total loans(4) |
| Commercial and industrial | $ | 430 |
| $ | 30 |
| $ | 460 |
| $ | 1,123 |
| $ | 145,612 |
| $ | 147,195 |
|
| Financial institutions | 146 |
| 9 |
| 155 |
| 74 |
| 82,299 |
| 82,528 |
|
| Mortgage and real estate | 209 |
| 5 |
| 214 |
| 258 |
| 54,492 |
| 54,964 |
|
| Leases | 16 |
| 3 |
| 19 |
| — |
| 1,557 |
| 1,576 |
|
| Other | 79 |
| 41 |
| 120 |
| 85 |
| 58,754 |
| 58,959 |
|
| Loans at fair value | | | | | | 4,218 |
|
| Total | $ | 880 |
| $ | 88 |
| $ | 968 |
| $ | 1,540 |
| $ | 342,714 |
| $ | 349,440 |
|
Corporate Loan Delinquency and Non-Accrual Details at December 31, 20172018 | | | In millions of dollars | 30–89 days past due and accruing(1) | ≥ 90 days past due and accruing(1) | Total past due and accruing | Total non-accrual(2) | Total current(3) | Total loans(4) | 30–89 days past due and accruing(1) | ≥ 90 days past due and accruing(1) | Total past due and accruing | Total non-accrual(2) | Total current(3) | Total loans(4) |
| Commercial and industrial | $ | 249 |
| $ | 13 |
| $ | 262 |
| $ | 1,506 |
| $ | 139,554 |
| $ | 141,322 |
| $ | 365 |
| $ | 42 |
| $ | 407 |
| $ | 919 |
| $ | 143,960 |
| $ | 145,286 |
|
| Financial institutions | 93 |
| 15 |
| 108 |
| 92 |
| 73,557 |
| 73,757 |
| 87 |
| 7 |
| 94 |
| 102 |
| 83,672 |
| 83,868 |
|
| Mortgage and real estate | 147 |
| 59 |
| 206 |
| 195 |
| 51,563 |
| 51,964 |
| 128 |
| 5 |
| 133 |
| 215 |
| 57,116 |
| 57,464 |
|
| Leases | 68 |
| 8 |
| 76 |
| 46 |
| 1,533 |
| 1,655 |
| 5 |
| 10 |
| 15 |
| — |
| 1,516 |
| 1,531 |
|
| Other | 70 |
| 13 |
| 83 |
| 103 |
| 60,145 |
| 60,331 |
| 151 |
| 52 |
| 203 |
| 75 |
| 62,079 |
| 62,357 |
|
| Loans at fair value | | | | 4,349 |
| | | | 3,203 |
|
| Total | $ | 627 |
| $ | 108 |
| $ | 735 |
| $ | 1,942 |
| $ | 326,352 |
| $ | 333,378 |
| $ | 736 |
| $ | 116 |
| $ | 852 |
| $ | 1,311 |
| $ | 348,343 |
| $ | 353,709 |
|
| |
| (1) | Corporate loans that are 90 days past due are generally classified as non-accrual. Corporate loans are considered past due when principal or interest is contractually due but unpaid. |
| |
| (2) | Non-accrual loans generally include those loans that are ≥ 90 days or more past due or those loans for which Citi believes, based on actual experience and a forward-looking assessment of the collectability of the loan in full, that the payment of interest or principal is doubtful. |
| |
| (3) | Loans less than 30 days past due are presented as current. |
| |
| (4) | Total loans include loans at fair value, which are not included in the various delinquency columns. |
Corporate Loans Credit Quality Indicators
| | | | Recorded investment in loans(1) | Recorded investment in loans(1) |
| In millions of dollars | September 30,
2018 | December 31,
2017 | March 31,
2019 | December 31,
2018 |
Investment grade(2) | | |
| Commercial and industrial | $ | 102,875 |
| $ | 101,313 |
| $ | 108,423 |
| $ | 102,722 |
|
| Financial institutions | 70,435 |
| 60,404 |
| 75,708 |
| 73,080 |
|
| Mortgage and real estate | 24,351 |
| 23,213 |
| 25,068 |
| 25,855 |
|
| Leases | 1,054 |
| 1,090 |
| 1,229 |
| 1,036 |
|
| Other | 53,609 |
| 56,306 |
| 53,919 |
| 57,299 |
|
| Total investment grade | $ | 252,324 |
| $ | 242,326 |
| $ | 264,347 |
| $ | 259,992 |
|
Non-investment grade(2) | | |
| Accrual | | |
| Commercial and industrial | $ | 43,196 |
| $ | 38,503 |
| $ | 43,230 |
| $ | 41,645 |
|
| Financial institutions | 12,019 |
| 13,261 |
| 11,216 |
| 10,686 |
|
| Mortgage and real estate | 3,240 |
| 2,881 |
| 3,468 |
| 3,793 |
|
| Leases | 523 |
| 518 |
| 271 |
| 496 |
|
| Other | 5,264 |
| 3,924 |
| 6,577 |
| 4,981 |
|
| Non-accrual | | |
| Commercial and industrial | 1,123 |
| 1,506 |
| 1,177 |
| 919 |
|
| Financial institutions | 74 |
| 92 |
| 92 |
| 102 |
|
| Mortgage and real estate | 258 |
| 195 |
| 182 |
| 215 |
|
| Leases | — |
| 46 |
| — |
| — |
|
| Other | 85 |
| 103 |
| 31 |
| 75 |
|
| Total non-investment grade | $ | 65,782 |
| $ | 61,029 |
| $ | 66,244 |
| $ | 62,912 |
|
Non-rated private bank loans managed on a delinquency basis(2) | $ | 27,116 |
| $ | 25,674 |
| $ | 28,014 |
| $ | 27,602 |
|
| Loans at fair value | 4,218 |
| 4,349 |
| 3,854 |
| 3,203 |
|
| Corporate loans, net of unearned income | $ | 349,440 |
| $ | 333,378 |
| $ | 362,459 |
| $ | 353,709 |
|
| |
| (1) | Recorded investment in a loan includes net deferred loan fees and costs, unamortized premium or discount, less any direct write-downs. |
| |
| (2) | Held-for-investment loans are accounted for on an amortized cost basis. |
Non-Accrual Corporate Loans
The following tables present non-accrual loan information by corporate loan type and interest income recognized on non-accrual corporate loans:
| | | | September 30, 2018 | Three Months Ended
September 30, 2018 | Nine Months Ended
September 30, 2018 | March 31, 2019 | Three Months Ended
March 31, 2019 |
| In millions of dollars | Recorded investment(1) | Unpaid principal balance | Related specific allowance | Average carrying value(2) | Interest income recognized(3) | Interest income recognized(3) | Recorded investment(1) | Unpaid principal balance | Related specific allowance | Average carrying value(2) | Interest income recognized(3) |
| Non-accrual corporate loans | | | | | | | |
| Commercial and industrial | $ | 1,123 |
| $ | 1,379 |
| $ | 207 |
| $ | 1,246 |
| $ | 8 |
| $ | 24 |
| $ | 1,177 |
| $ | 1,336 |
| $ | 127 |
| $ | 1,079 |
| $ | 14 |
|
| Financial institutions | 74 |
| 90 |
| 39 |
| 97 |
| — |
| — |
| 92 |
| 113 |
| 34 |
| 101 |
| — |
|
| Mortgage and real estate | 258 |
| 423 |
| 45 |
| 228 |
| — |
| 1 |
| 182 |
| 376 |
| 15 |
| 231 |
| — |
|
| Lease financing | — |
| 39 |
| — |
| 33 |
| — |
| — |
| — |
| — |
| — |
| 10 |
| — |
|
| Other | 85 |
| 205 |
| 13 |
| 90 |
| — |
| — |
| 31 |
| 117 |
| 19 |
| 69 |
| — |
|
| Total non-accrual corporate loans | $ | 1,540 |
| $ | 2,136 |
| $ | 304 |
| $ | 1,694 |
| $ | 8 |
| $ | 25 |
| $ | 1,482 |
| $ | 1,942 |
| $ | 195 |
| $ | 1,490 |
| $ | 14 |
|
| | | | December 31, 2017 | December 31, 2018 |
| In millions of dollars | Recorded investment(1) | Unpaid principal balance | Related specific allowance | Average carrying value(2) | Recorded investment(1) | Unpaid principal balance | Related specific allowance | Average carrying value(2) |
| Non-accrual corporate loans | | |
| Commercial and industrial | $ | 1,506 |
| $ | 1,775 |
| $ | 368 |
| $ | 1,547 |
| $ | 919 |
| $ | 1,070 |
| $ | 183 |
| $ | 1,099 |
|
| Financial institutions | 92 |
| 102 |
| 41 |
| 212 |
| 102 |
| 123 |
| 35 |
| 99 |
|
| Mortgage and real estate | 195 |
| 324 |
| 11 |
| 183 |
| 215 |
| 323 |
| 39 |
| 233 |
|
| Lease financing | 46 |
| 46 |
| 4 |
| 59 |
| — |
| 28 |
| — |
| 21 |
|
| Other | 103 |
| 212 |
| 2 |
| 108 |
| 75 |
| 165 |
| 6 |
| 83 |
|
| Total non-accrual corporate loans | $ | 1,942 |
| $ | 2,459 |
| $ | 426 |
| $ | 2,109 |
| $ | 1,311 |
| $ | 1,709 |
| $ | 263 |
| $ | 1,535 |
|
| | | | September 30, 2018 | December 31, 2017 | March 31, 2019 | December 31, 2018 |
| In millions of dollars | Recorded investment(1) | Related specific allowance | Recorded investment(1) | Related specific allowance | Recorded investment(1) | Related specific allowance | Recorded investment(1) | Related specific allowance |
| Non-accrual corporate loans with valuation allowances | | | | | | |
| Commercial and industrial | $ | 643 |
| $ | 207 |
| $ | 1,017 |
| $ | 368 |
| $ | 450 |
| $ | 127 |
| $ | 603 |
| $ | 183 |
|
| Financial institutions | 72 |
| 39 |
| 88 |
| 41 |
| 64 |
| 34 |
| 76 |
| 35 |
|
| Mortgage and real estate | 122 |
| 45 |
| 51 |
| 11 |
| 83 |
| 15 |
| 100 |
| 39 |
|
| Lease financing | — |
| — |
| 46 |
| 4 |
| — |
| — |
| — |
| — |
|
| Other | 17 |
| 13 |
| 13 |
| 2 |
| 14 |
| 19 |
| 24 |
| 6 |
|
| Total non-accrual corporate loans with specific allowance | $ | 854 |
| $ | 304 |
| $ | 1,215 |
| $ | 426 |
| $ | 611 |
| $ | 195 |
| $ | 803 |
| $ | 263 |
|
| Non-accrual corporate loans without specific allowance | | | | | | |
| Commercial and industrial | $ | 480 |
| |
| $ | 489 |
| |
| $ | 727 |
| |
| $ | 316 |
| |
|
| Financial institutions | 2 |
| |
| 4 |
| |
| 28 |
| |
| 26 |
| |
|
| Mortgage and real estate | 136 |
| |
| 144 |
| |
| 99 |
| |
| 115 |
| |
|
| Lease financing | — |
| |
| — |
| |
| — |
| |
| — |
| |
|
| Other | 68 |
| |
| 90 |
| |
| 17 |
| |
| 51 |
| |
|
| Total non-accrual corporate loans without specific allowance | $ | 686 |
| N/A |
| $ | 727 |
| N/A |
| $ | 871 |
| N/A |
| $ | 508 |
| N/A |
|
| |
| (1) | Recorded investment in a loan includes net deferred loan fees and costs, unamortized premium or discount, less any direct write-downs. |
| |
| (2) | Average carrying value represents the average recorded investment balance and does not include related specific allowance. |
| |
| (3) | Interest income recognized for the three and nine months ended September 30, 2017March 31, 2018 was $11 million and $30 million, respectively.$4 million. |
N/A Not applicable
Corporate Troubled Debt Restructurings
For the three months ended September 30, 2018:March 31, 2019: |
| | | | | | | | | | | | |
| In millions of dollars | Carrying value of TDRs modified during the period | TDRs involving changes in the amount and/or timing of principal payments(1) | TDRs involving changes in the amount and/or timing of interest payments(2) | TDRs involving changes in the amount and/or timing of both principal and interest payments |
| Commercial and industrial | $ | 16 |
| $ | — |
| $ | — |
| $ | 16 |
|
| Mortgage and real estate | 4 |
| — |
| — |
| 4 |
|
| Total | $ | 20 |
| $ | — |
| $ | — |
| $ | 20 |
|
|
| | | | | | | | | | | | |
| In millions of dollars | Carrying value of TDRs modified during the period | TDRs involving changes in the amount and/or timing of principal payments(1) | TDRs involving changes in the amount and/or timing of interest payments(2) | TDRs involving changes in the amount and/or timing of both principal and interest payments |
| Commercial and industrial | $ | 62 |
| $ | 1 |
| $ | 4 |
| $ | 57 |
|
| Mortgage and real estate | 3 |
| — |
| — |
| 3 |
|
| Total | $ | 65 |
| $ | 1 |
| $ | 4 |
| $ | 60 |
|
For the three months ended September 30, 2017:March 31, 2018: |
| | | | | | | | | | | | |
| In millions of dollars | Carrying value of TDRs modified during the period | TDRs involving changes in the amount and/or timing of principal payments(1) | TDRs involving changes in the amount and/or timing of interest payments(2) | TDRs involving changes in the amount and/or timing of both principal and interest payments |
| Commercial and industrial | $ | 2 |
| $ | — |
| $ | — |
| $ | 2 |
|
| Mortgage and real estate | 1 |
| — |
| — |
| 1 |
|
| Total | $ | 3 |
| $ | — |
| $ | — |
| $ | 3 |
|
|
| | | | | | | | | | | | |
| In millions of dollars | Carrying value of TDRs modified during the period | TDRs involving changes in the amount and/or timing of principal payments(1) | TDRs involving changes in the amount and/or timing of interest payments(2) | TDRs involving changes in the amount and/or timing of both principal and interest payments |
| Commercial and industrial | $ | 175 |
| $ | 99 |
| $ | — |
| $ | 76 |
|
| Mortgage and real estate | 14 |
| — |
| — |
| 14 |
|
| Total | $ | 189 |
| $ | 99 |
| $ | — |
| $ | 90 |
|
For the nine months ended September 30, 2018: |
| | | | | | | | | | | | |
| In millions of dollars | Carrying value of TDRs modified during the period | TDRs involving changes in the amount and/or timing of principal payments(1) | TDRs involving changes in the amount and/or timing of interest payments(2) | TDRs involving changes in the amount and/or timing of both principal and interest payments |
| Commercial and industrial | $ | 103 |
| $ | 5 |
| $ | 8 |
| $ | 90 |
|
| Mortgage and real estate | 6 |
| — |
| — |
| 6 |
|
| Total | $ | 109 |
| $ | 5 |
| $ | 8 |
| $ | 96 |
|
For the nine months ended September 30, 2017: |
| | | | | | | | | | | | |
| In millions of dollars | Carrying value of TDRs modified during the period | TDRs involving changes in the amount and/or timing of principal payments(1) | TDRs involving changes in the amount and/or timing of interest payments(2) | TDRs involving changes in the amount and/or timing of both principal and interest payments |
| Commercial and industrial | $ | 463 |
| $ | 131 |
| $ | — |
| $ | 332 |
|
| Mortgage and real estate | 15 |
| — |
| — |
| 15 |
|
| Other | 18 |
| — |
| — |
| 18 |
|
| Total | $ | 496 |
| $ | 131 |
| $ | — |
| $ | 365 |
|
| |
| (1) | TDRs involving changes in the amount or timing of principal payments may involve principal forgiveness or deferral of periodic and/or final principal payments. Because forgiveness of principal is rare for corporate loans, modifications typically have little to no impact on the loans’ projected cash flows and thus little to no impact on the allowance established for the loans. Charge-offs for amounts deemed uncollectable may be recorded at the time of the restructuring or may have already been recorded in prior periods such that no charge-off is required at the time of the modification. |
| |
| (2) | TDRs involving changes in the amount or timing of interest payments may involve a below-market interest rate. |
The following table presents total corporate loans modified in a TDR as well as those TDRs that defaulted and for which the payment default occurred within one year of a permanent modification. Default is defined as 60 days past due, except for classifiably managed commercial banking loans, where default is defined as 90 days past due. |
| | | | | | | | | | | | |
| In millions of dollars | TDR balances at March 31, 2019 | TDR loans in payment default during the three months ended March 31, 2019 | TDR balances at March 31, 2018 | TDR loans in payment default during the three months ended March 31, 2018 |
| Commercial and industrial | $ | 410 |
| $ | — |
| $ | 507 |
| $ | 59 |
|
| Financial institutions | 13 |
| — |
| 40 |
| — |
|
| Mortgage and real estate | 112 |
| — |
| 98 |
| — |
|
| Other | 4 |
| — |
| 41 |
| — |
|
Total(1) | $ | 539 |
| $ | — |
| $ | 686 |
| $ | 59 |
|
|
| | | | | | | | | | | | | | | | | | |
| In millions of dollars | TDR balances at September 30, 2018 | TDR loans in payment default during the three months ended September 30, 2018 | TDR loans in payment default nine months ended September 30, 2018 | TDR balances at September 30, 2017 | TDR loans in payment default during the three months ended September 30, 2017 | TDR loans in payment default during the nine months ended
September 30, 2017 |
| Commercial and industrial | $ | 480 |
| $ | — |
| $ | 70 |
| $ | 686 |
| $ | — |
| $ | 12 |
|
| Financial institutions | 21 |
| — |
| — |
| 24 |
| — |
| 3 |
|
| Mortgage and real estate | 71 |
| — |
| — |
| 84 |
| — |
| — |
|
| Other | 42 |
| — |
| — |
| 155 |
| — |
| — |
|
Total(1) | $ | 614 |
| $ | — |
| $ | 70 |
| $ | 949 |
| $ | — |
| $ | 15 |
|
| |
| (1) | The above table reflects activity for loans outstanding that were considered TDRs as of the end of the reporting period. |
14. ALLOWANCE FOR CREDIT LOSSES
| | | | Three Months Ended September 30, | Nine Months Ended
September 30, | Three Months Ended March 31, |
| In millions of dollars | 2018 | 2017 | 2018 | 2017 | 2019 | 2018 |
| Allowance for loan losses at beginning of period | $ | 12,126 |
| $ | 12,025 |
| $ | 12,355 |
| $ | 12,060 |
| $ | 12,315 |
| $ | 12,355 |
|
| Gross credit losses | (2,094 | ) | (2,120 | ) | (6,499 | ) | (6,394 | ) | (2,345 | ) | (2,296 | ) |
Gross recoveries(1) | 338 |
| 343 |
| 1,172 |
| 1,198 |
| 397 |
| 429 |
|
| Net credit losses (NCLs) | $ | (1,756 | ) | $ | (1,777 | ) | $ | (5,327 | ) | $ | (5,196 | ) | $ | (1,948 | ) | $ | (1,867 | ) |
| NCLs | $ | 1,756 |
| $ | 1,777 |
| $ | 5,327 |
| $ | 5,196 |
| $ | 1,948 |
| $ | 1,867 |
|
| Net reserve builds (releases) | 169 |
| 419 |
| 302 |
| 466 |
| 67 |
| 102 |
|
| Net specific reserve builds (releases) | (19 | ) | (50 | ) | (125 | ) | (175 | ) | (71 | ) | (166 | ) |
| Total provision for loan losses | $ | 1,906 |
| $ | 2,146 |
| $ | 5,504 |
| $ | 5,487 |
| $ | 1,944 |
| $ | 1,803 |
|
| Other, net (see table below) | 60 |
| (28 | ) | (196 | ) | 15 |
| 18 |
| 63 |
|
| Allowance for loan losses at end of period | $ | 12,336 |
| $ | 12,366 |
| $ | 12,336 |
| $ | 12,366 |
| $ | 12,329 |
| $ | 12,354 |
|
| Allowance for credit losses on unfunded lending commitments at beginning of period | $ | 1,278 |
| $ | 1,406 |
| $ | 1,258 |
| $ | 1,418 |
| $ | 1,367 |
| $ | 1,258 |
|
| Provision (release) for unfunded lending commitments | 42 |
| (175 | ) | 66 |
| (190 | ) | 24 |
| 28 |
|
| Other, net | 1 |
| 1 |
| (3 | ) | 4 |
| — |
| 4 |
|
Allowance for credit losses on unfunded lending commitments at end of period(2) | $ | 1,321 |
| $ | 1,232 |
| $ | 1,321 |
| $ | 1,232 |
| $ | 1,391 |
| $ | 1,290 |
|
| Total allowance for loans, leases and unfunded lending commitments | $ | 13,657 |
| $ | 13,598 |
| $ | 13,657 |
| $ | 13,598 |
| $ | 13,720 |
| $ | 13,644 |
|
| |
| (1) | Recoveries have been reduced by certain collection costs that are incurred only if collection efforts are successful. |
| |
| (2) | Represents additional credit loss reserves for unfunded lending commitments and letters of credit recorded in Other liabilities on the Consolidated Balance Sheet. |
|
| | | | | | |
| Other, net details | Three Months Ended March 31, |
| In millions of dollars | 2019 | 2018 |
| Sales or transfers of various consumer loan portfolios to HFS | | |
| Transfer of real estate loan portfolios | $ | — |
| $ | (53 | ) |
| Transfer of other loan portfolios | — |
| (2 | ) |
| Sales or transfers of various consumer loan portfolios to HFS | $ | — |
| $ | (55 | ) |
| FX translation, consumer | 26 |
| 118 |
|
| Other | (8 | ) | — |
|
| Other, net | $ | 18 |
| $ | 63 |
|
|
| | | | | | | | | | | | |
| Other, net details | Three Months Ended September 30, | Nine Months Ended
September 30, |
| In millions of dollars | 2018 | 2017 | 2018 | 2017 |
| Sales or transfers of various consumer loan portfolios to HFS | | | | |
| Transfer of real estate loan portfolios | $ | (2 | ) | $ | (28 | ) | $ | (88 | ) | $ | (84 | ) |
| Transfer of other loan portfolios | (3 | ) | (6 | ) | (109 | ) | (130 | ) |
| Sales or transfers of various consumer loan portfolios to HFS | $ | (5 | ) | $ | (34 | ) | $ | (197 | ) | $ | (214 | ) |
| FX translation, consumer | 62 |
| 7 |
| 16 |
| 221 |
|
| Other | 3 |
| (1 | ) | (15 | ) | 8 |
|
| Other, net | $ | 60 |
| $ | (28 | ) | $ | (196 | ) | $ | 15 |
|
Allowance for Credit Losses and Investment inEnd-of-Period Loans
| | | | Three Months Ended | Three Months Ended |
| | September 30, 2018 | September 30, 2017 | March 31, 2019 | March 31, 2018 |
| In millions of dollars | Corporate | Consumer | Total | Corporate | Consumer | Total | Corporate | Consumer | Total | Corporate | Consumer | Total |
| Allowance for loan losses at beginning of period | $ | 2,330 |
| $ | 9,796 |
| $ | 12,126 |
| $ | 2,510 |
| $ | 9,515 |
| $ | 12,025 |
| $ | 2,365 |
| $ | 9,950 |
| $ | 12,315 |
| $ | 2,486 |
| $ | 9,869 |
| $ | 12,355 |
|
| Charge-offs | (36 | ) | (2,058 | ) | (2,094 | ) | (49 | ) | (2,071 | ) | (2,120 | ) | (73 | ) | (2,272 | ) | (2,345 | ) | (139 | ) | (2,157 | ) | (2,296 | ) |
| Recoveries | 6 |
| 332 |
| 338 |
| 6 |
| 337 |
| 343 |
| 17 |
| 380 |
| 397 |
| 43 |
| 386 |
| 429 |
|
| Replenishment of net charge-offs | 30 |
| 1,726 |
| 1,756 |
| 43 |
| 1,734 |
| 1,777 |
| 56 |
| 1,892 |
| 1,948 |
| 96 |
| 1,771 |
| 1,867 |
|
| Net reserve builds (releases) | 34 |
| 135 |
| 169 |
| (60 | ) | 479 |
| 419 |
| 7 |
| 60 |
| 67 |
| (19 | ) | 121 |
| 102 |
|
| Net specific reserve builds (releases) | (27 | ) | 8 |
| (19 | ) | 21 |
| (71 | ) | (50 | ) | (61 | ) | (10 | ) | (71 | ) | (155 | ) | (11 | ) | (166 | ) |
| Other | 2 |
| 58 |
| 60 |
| 3 |
| (31 | ) | (28 | ) | (8 | ) | 26 |
| 18 |
| 3 |
| 60 |
| 63 |
|
| Ending balance | $ | 2,339 |
| $ | 9,997 |
| $ | 12,336 |
| $ | 2,474 |
| $ | 9,892 |
| $ | 12,366 |
| $ | 2,303 |
| $ | 10,026 |
| $ | 12,329 |
| $ | 2,315 |
| $ | 10,039 |
| $ | 12,354 |
|
|
| | | | | | | | | | | | | | | | | | |
| | March 31, 2019 | December 31, 2018 |
| In millions of dollars | Corporate | Consumer | Total | Corporate | Consumer | Total |
| Allowance for loan losses | |
| |
| |
| | | |
| Collectively evaluated in accordance with ASC 450 | $ | 2,108 |
| $ | 8,853 |
| $ | 10,961 |
| $ | 2,102 |
| $ | 8,770 |
| $ | 10,872 |
|
| Individually evaluated in accordance with ASC 310-10-35 | 195 |
| 1,171 |
| 1,366 |
| 263 |
| 1,178 |
| 1,441 |
|
| Purchased credit impaired in accordance with ASC 310-30 | — |
| 2 |
| 2 |
| — |
| 2 |
| 2 |
|
| Total allowance for loan losses | $ | 2,303 |
| $ | 10,026 |
| $ | 12,329 |
| $ | 2,365 |
| $ | 9,950 |
| $ | 12,315 |
|
| Loans, net of unearned income | | | | | | |
| Collectively evaluated in accordance with ASC 450 | $ | 357,210 |
| $ | 314,454 |
| $ | 671,664 |
| $ | 349,292 |
| $ | 325,055 |
| $ | 674,347 |
|
| Individually evaluated in accordance with ASC 310-10-35 | 1,395 |
| 5,288 |
| 6,683 |
| 1,214 |
| 5,284 |
| 6,498 |
|
| Purchased credit impaired in accordance with ASC 310-30 | — |
| 125 |
| 125 |
| — |
| 128 |
| 128 |
|
| Held at fair value | 3,854 |
| 20 |
| 3,874 |
| 3,203 |
| 20 |
| 3,223 |
|
| Total loans, net of unearned income | $ | 362,459 |
| $ | 319,887 |
| $ | 682,346 |
| $ | 353,709 |
| $ | 330,487 |
| $ | 684,196 |
|
|
| | | | | | | | | | | | | | | | | | |
| | Nine Months Ended |
| | September 30, 2018 | September 30, 2017 |
| In millions of dollars | Corporate | Consumer | Total | Corporate | Consumer | Total |
| Allowance for loan losses at beginning of period | $ | 2,486 |
| $ | 9,869 |
| $ | 12,355 |
| $ | 2,702 |
| $ | 9,358 |
| $ | 12,060 |
|
| Charge-offs | (195 | ) | (6,304 | ) | (6,499 | ) | (248 | ) | (6,146 | ) | (6,394 | ) |
| Recoveries | 71 |
| 1,101 |
| 1,172 |
| 91 |
| 1,107 |
| 1,198 |
|
| Replenishment of net charge-offs | 124 |
| 5,203 |
| 5,327 |
| 157 |
| 5,039 |
| 5,196 |
|
| Net reserve builds (releases) | (15 | ) | 317 |
| 302 |
| (230 | ) | 696 |
| 466 |
|
| Net specific reserve builds (releases) | (119 | ) | (6 | ) | (125 | ) | (18 | ) | (157 | ) | (175 | ) |
| Other | (13 | ) | (183 | ) | (196 | ) | 20 |
| (5 | ) | 15 |
|
| Ending balance | $ | 2,339 |
| $ | 9,997 |
| $ | 12,336 |
| $ | 2,474 |
| $ | 9,892 |
| $ | 12,366 |
|
|
| | | | | | | | | | | | | | | | | | |
| | September 30, 2018 | December 31, 2017 |
| In millions of dollars | Corporate | Consumer | Total | Corporate | Consumer | Total |
| Allowance for loan losses | |
| |
| |
| | | |
| Collectively evaluated in accordance with ASC 450 | $ | 2,035 |
| $ | 8,820 |
| $ | 10,855 |
| $ | 2,060 |
| $ | 8,531 |
| $ | 10,591 |
|
| Individually evaluated in accordance with ASC 310-10-35 | 304 |
| 1,175 |
| 1,479 |
| 426 |
| 1,334 |
| 1,760 |
|
| Purchased credit impaired in accordance with ASC 310-30 | — |
| 2 |
| 2 |
| — |
| 4 |
| 4 |
|
| Total allowance for loan losses | $ | 2,339 |
| $ | 9,997 |
| $ | 12,336 |
| $ | 2,486 |
| $ | 9,869 |
| $ | 12,355 |
|
| Loans, net of unearned income | | | | | | |
| Collectively evaluated in accordance with ASC 450 | $ | 343,774 |
| $ | 319,816 |
| $ | 663,590 |
| $ | 327,142 |
| $ | 326,884 |
| $ | 654,026 |
|
| Individually evaluated in accordance with ASC 310-10-35 | 1,448 |
| 5,501 |
| 6,949 |
| 1,887 |
| 6,580 |
| 8,467 |
|
| Purchased credit impaired in accordance with ASC 310-30 | — |
| 131 |
| 131 |
| — |
| 167 |
| 167 |
|
| Held at fair value | 4,218 |
| 21 |
| 4,239 |
| 4,349 |
| 25 |
| 4,374 |
|
| Total loans, net of unearned income | $ | 349,440 |
| $ | 325,469 |
| $ | 674,909 |
| $ | 333,378 |
| $ | 333,656 |
| $ | 667,034 |
|
15. GOODWILL AND INTANGIBLE ASSETS
Goodwill
The changes in Goodwill were as follows: |
| | | | | | | | | | | | |
| In millions of dollars | Global Consumer Banking | Institutional Clients Group | Corporate/Other | Total |
| Balance at December 31, 2018 | $ | 12,743 |
| $ | 9,303 |
| $ | — |
| $ | 22,046 |
|
| Foreign currency translation and other | — |
| (9 | ) | — |
| (9 | ) |
| Balance at March 31, 2019 | $ | 12,743 |
| $ | 9,294 |
| $ | — |
| $ | 22,037 |
|
|
| | | | | | | | | | | | |
| In millions of dollars | Global Consumer Banking | Institutional Clients Group | Corporate/Other | Total |
| Balance at December 31, 2017 | $ | 12,784 |
| $ | 9,456 |
| $ | 16 |
| $ | 22,256 |
|
| Foreign currency translation and other | $ | 184 |
| $ | 235 |
| $ | — |
| $ | 419 |
|
Divestiture(1) | — |
| — |
| (16 | ) | (16 | ) |
| Balance at March 31, 2018 | $ | 12,968 |
| $ | 9,691 |
| $ | — |
| $ | 22,659 |
|
| Foreign exchange translation and other | $ | (226 | ) | $ | (375 | ) | $ | — |
| $ | (601 | ) |
| Balance at June 30, 2018 | $ | 12,742 |
| $ | 9,316 |
| $ | — |
| $ | 22,058 |
|
Foreign exchange translation and other
| $ | 7 |
| $ | 122 |
| $ | — |
| $ | 129 |
|
| Balance at September 30, 2018 | $ | 12,749 |
| $ | 9,438 |
| $ | — |
| $ | 22,187 |
|
| |
(1) | Goodwill allocated to the sale of the Citi Colombia consumer business, the only remaining business in Citi Holdings—Consumer Latin America reporting unit reported as part of Corporate/Other, which was classified as HFS beginning the first quarter of 2018. The sale was completed during the second quarter of 2018.
|
There were no triggering events identified and no goodwill was impaired during the first quarter of 2019.
Goodwill impairment testing is performed at the level below each business segment (referred to as a reporting
unit). See Note 3 for further information on business
segments. For additional information regarding Citi’s goodwill impairment testing process, see Notes 1 and 16 to the Consolidated Financial Statements in Citi’s 20172018 Annual Report on Form 10-K.
The Company performed its annual goodwill impairment test as of July 1, 2018. The fair values of the Company’s reporting units exceeded their carrying values by approximately 14% to 243% and no reporting unit is at risk of impairment. Further, there were no triggering events identified and no goodwill was impaired during the three and nine months ended September 30, 2018.
Intangible Assets
The components of intangible assets were as follows:
|
| | | | | | | | | | | | | | | | | | |
| | March 31, 2019 | December 31, 2018 |
| In millions of dollars | Gross carrying amount | Accumulated amortization | Net carrying amount | Gross carrying amount | Accumulated amortization | Net carrying amount |
| Purchased credit card relationships | $ | 5,734 |
| $ | 3,985 |
| $ | 1,749 |
| $ | 5,733 |
| $ | 3,936 |
| $ | 1,797 |
|
Credit card contract-related intangibles(1) | 5,375 |
| 2,875 |
| 2,500 |
| 5,225 |
| 2,791 |
| 2,434 |
|
| Core deposit intangibles | 424 |
| 422 |
| 2 |
| 419 |
| 415 |
| 4 |
|
| Other customer relationships | 453 |
| 288 |
| 165 |
| 470 |
| 299 |
| 171 |
|
| Present value of future profits | 33 |
| 29 |
| 4 |
| 32 |
| 29 |
| 3 |
|
| Indefinite-lived intangible assets | 220 |
| — |
| 220 |
| 218 |
| — |
| 218 |
|
| Other | 84 |
| 79 |
| 5 |
| 84 |
| 75 |
| 9 |
|
| Intangible assets (excluding MSRs) | $ | 12,323 |
| $ | 7,678 |
| $ | 4,645 |
| $ | 12,181 |
| $ | 7,545 |
| $ | 4,636 |
|
Mortgage servicing rights (MSRs)(2) | 551 |
| — |
| 551 |
| 584 |
| — |
| 584 |
|
| Total intangible assets | $ | 12,874 |
| $ | 7,678 |
| $ | 5,196 |
| $ | 12,765 |
| $ | 7,545 |
| $ | 5,220 |
|
|
| | | | | | | | | | | | | | | | | | |
| | September 30, 2018 | December 31, 2017 |
| In millions of dollars | Gross carrying amount | Accumulated amortization | Net carrying amount | Gross carrying amount | Accumulated amortization | Net carrying amount |
| Purchased credit card relationships | $ | 5,732 |
| $ | 3,890 |
| $ | 1,842 |
| $ | 5,375 |
| $ | 3,836 |
| $ | 1,539 |
|
Credit card contract related intangibles(1) | 5,042 |
| 2,708 |
| 2,334 |
| 5,045 |
| 2,456 |
| 2,589 |
|
| Core deposit intangibles | 438 |
| 433 |
| 5 |
| 639 |
| 628 |
| 11 |
|
| Other customer relationships | 463 |
| 289 |
| 174 |
| 459 |
| 272 |
| 187 |
|
| Present value of future profits | 34 |
| 30 |
| 4 |
| 32 |
| 28 |
| 4 |
|
| Indefinite-lived intangible assets | 227 |
| — |
| 227 |
| 244 |
| — |
| 244 |
|
| Other | 84 |
| 72 |
| 12 |
| 100 |
| 86 |
| 14 |
|
| Intangible assets (excluding MSRs) | $ | 12,020 |
| $ | 7,422 |
| $ | 4,598 |
| $ | 11,894 |
| $ | 7,306 |
| $ | 4,588 |
|
Mortgage servicing rights (MSRs)(2) | 618 |
| — |
| 618 |
| 558 |
| — |
| 558 |
|
| Total intangible assets | $ | 12,638 |
| $ | 7,422 |
| $ | 5,216 |
| $ | 12,452 |
| $ | 7,306 |
| $ | 5,146 |
|
| |
| (1) | Primarily reflects contract-related intangibles associated with the American Airlines, The Home Depot, Costco, Sears and AT&T credit card program agreements, which represented 97% of the aggregate net carrying amount as of September 30,March 31, 2019 and December 31, 2018. |
| |
| (2) | For additional information on Citi’s MSRs, see Note 18 to the Consolidated Financial Statements. |
The changes in intangible assets were as follows:
| | | | Net carrying
amount at | | Net carrying amount at | Net carrying
amount at | | Net carrying amount at |
| In millions of dollars | December 31,
2017 | Acquisitions/ divestitures | Amortization | FX translation and other | September 30,
2018 | December 31,
2018 | Acquisitions/ divestitures | Amortization | FX translation and other | March 31,
2019 |
Purchased credit card relationships(1) | $ | 1,539 |
| $ | 429 |
| $ | (124 | ) | $ | (2 | ) | $ | 1,842 |
| $ | 1,797 |
| $ | — |
| $ | (48 | ) | $ | — |
| $ | 1,749 |
|
Credit card contract related intangibles(2) | 2,589 |
| — |
| (255 | ) | — |
| 2,334 |
| |
Credit card contract-related intangibles(2) | | 2,434 |
| — |
| (84 | ) | 150 |
| 2,500 |
|
| Core deposit intangibles | 11 |
| — |
| (6 | ) | — |
| 5 |
| 4 |
| — |
| (2 | ) | — |
| 2 |
|
| Other customer relationships | 187 |
| — |
| (19 | ) | 6 |
| 174 |
| 171 |
| — |
| (6 | ) | — |
| 165 |
|
| Present value of future profits | 4 |
| — |
| — |
| — |
| 4 |
| 3 |
| — |
| — |
| 1 |
| 4 |
|
| Indefinite-lived intangible assets | 244 |
| — |
| — |
| (17 | ) | 227 |
| 218 |
| — |
| — |
| 2 |
| 220 |
|
| Other | 14 |
| — |
| (9 | ) | 7 |
| 12 |
| 9 |
| — |
| (4 | ) | — |
| 5 |
|
| Intangible assets (excluding MSRs) | $ | 4,588 |
| $ | 429 |
| $ | (413 | ) | $ | (6 | ) | $ | 4,598 |
| $ | 4,636 |
| $ | — |
| $ | (144 | ) | $ | 153 |
| $ | 4,645 |
|
Mortgage servicing rights (MSRs)(3) | 558 |
| | 618 |
| 584 |
| | 551 |
|
| Total intangible assets | $ | 5,146 |
| | $ | 5,216 |
| $ | 5,220 |
| | $ | 5,196 |
|
| |
| (1) | Reflects intangibles for the value of cardholder relationships, which are discrete from partner contract intangibles and include credit card accounts primarily in the Costco, Macy’s and Sears portfolios. The increase since December 31, 20172018 reflects the purchase of certain rights related to credit card accounts in the Sears portfolio. |
| |
| (2) | Primarily reflects contract-related intangibles associated with the American Airlines, The Home Depot, Costco, Sears and AT&T credit card program agreements, which represented 97% of the aggregate net carrying amount at September 30, 2018March 31, 2019 and December 31, 2017.2018. |
| |
| (3) | For additional information on Citi’s MSRs, including the rollforward for the ninethree months ended September 30, 2018,March 31, 2019, see Note 18 to the Consolidated Financial Statements. |
16. DEBT
For additional information regarding Citi’s short-term borrowings and long-term debt, see Note 17 to the Consolidated Financial Statements in Citi’s 20172018 Annual Report on Form 10-K.
Short-Term Borrowings
|
| | | | | | |
| In millions of dollars | March 31,
2019 | December 31,
2018 |
| Commercial paper | |
|
Bank(1) | $ | 13,060 |
| $ | 13,238 |
|
Broker-dealer and other(2) | 1,974 |
| — |
|
| Total commercial paper | $ | 15,034 |
| $ | 13,238 |
|
Other borrowings(3) | 24,288 |
| 19,108 |
|
| Total | $ | 39,322 |
| $ | 32,346 |
|
|
| | | | | | |
| In millions of dollars | September 30,
2018 | December 31,
2017 |
| Commercial paper | $ | 12,051 |
| $ | 9,940 |
|
Other borrowings(1) | 21,719 |
| 34,512 |
|
| Total | $ | 33,770 |
| $ | 44,452 |
|
| |
| (1) | Represents Citibank entities as well as other bank entities. |
| |
| (2) | Represents broker-dealer and other non-bank subsidiaries that are consolidated into Citigroup Inc., the parent holding company. |
| |
| (3) | Includes borrowings from Federal Home Loan Banks and other market participants. At September 30, 2018March 31, 2019 and December 31, 2017,2018, collateralized short-term advances from the Federal Home Loan Banks were $10.5$13.3 billion and $23.8$9.5 billion, respectively. |
Long-Term Debt
| | | In millions of dollars | September 30,
2018 | December 31, 2017 | March 31,
2019 | December 31, 2018 |
Citigroup Inc.(1) | $ | 148,183 |
| $ | 152,163 |
| $ | 149,830 |
| $ | 143,767 |
|
Bank(2) | 62,085 |
| 65,856 |
| 61,522 |
| 61,237 |
|
Broker-dealer and other(3) | 25,002 |
| 18,690 |
| 32,214 |
| 26,995 |
|
| Total | $ | 235,270 |
| $ | 236,709 |
| $ | 243,566 |
| $ | 231,999 |
|
| |
| (1) | Represents the parent holding company. |
| |
| (2) | Represents Citibank entities as well as other bank entities. At September 30, 2018March 31, 2019 and December 31, 2017,2018, collateralized long-term advances from the Federal Home Loan Banks were $10.5 billion and $19.3$10.5 billion, respectively. |
| |
| (3) | Represents broker-dealer and other non-bank subsidiaries that are consolidated into Citigroup Inc., the parent holding company. |
Long-term debt outstanding includes trust preferred securities with a balance sheet carrying value of $1.7 billion at both September 30, 2018March 31, 2019 and December 31, 2017.2018.
The following table summarizes Citi’s outstanding trust preferred securities at September 30, 2018:March 31, 2019:
| | | | | | | | Junior subordinated debentures owned by trust | | | | | Junior subordinated debentures owned by trust |
| Trust | Issuance date | Securities issued | Liquidation value(1) | Coupon rate(2) | Common shares issued to parent | Amount | Maturity | Redeemable by issuer beginning | Issuance date | Securities issued | Liquidation value(1) | Coupon rate(2) | Common shares issued to parent | Amount | Maturity | Redeemable by issuer beginning |
In millions of dollars, except share amounts |
|
|
|
|
|
|
|
| |
In millions of dollars, except securities and share amounts | | In millions of dollars, except securities and share amounts |
|
|
|
|
|
|
|
|
| Citigroup Capital III | Dec. 1996 | 194,053 |
| $ | 194 |
| 7.625 | % | 6,003 |
| $ | 200 |
| Dec. 1, 2036 | Not redeemable | Dec. 1996 | 194,053 |
| $ | 194 |
| 7.625 | % | 6,003 |
| $ | 200 |
| Dec. 1, 2036 | Not redeemable |
| Citigroup Capital XIII | Sept. 2010 | 89,840,000 |
| 2,246 |
| 3 mo LIBOR + 637 bps |
| 1,000 |
| 2,246 |
| Oct. 30, 2040 | Oct. 30, 2015 | Sept. 2010 | 89,840,000 |
| 2,246 |
| 3 mo LIBOR + 637 bps |
| 1,000 |
| 2,246 |
| Oct. 30, 2040 | Oct. 30, 2015 |
| Citigroup Capital XVIII | Jun. 2007 | 99,901 |
| 130 |
| 3 mo LIBOR + 88.75 bps |
| 50 |
| 130 |
| Jun. 28, 2067 | June 28, 2017 | Jun. 2007 | 99,901 |
| 130 |
| 3 mo LIBOR + 88.75 bps |
| 50 |
| 130 |
| Jun. 28, 2067 | June 28, 2017 |
| Total obligated | | |
| $ | 2,570 |
| | | $ | 2,576 |
| | | |
| $ | 2,570 |
| | | $ | 2,576 |
| |
Note: Distributions on the trust preferred securities and interest on the subordinated debentures are payable semiannually for Citigroup Capital III and Citigroup Capital XVIII and quarterly for Citigroup Capital XIII.
| |
| (1) | Represents the notional value received by outside investors from the trusts at the time of issuance. |
| |
| (2) | In each case, the coupon rate on the subordinated debentures is the same as that on the trust preferred securities. |
17. CHANGES IN ACCUMULATED OTHER COMPREHENSIVE INCOME (LOSS) (AOCI)
Changes in each component of Citigroup’s Accumulated other comprehensive income (loss) were as follows:
Three Months Ended September 30, 2018March 31, 2019
|
| | | | | | | | | | | | | | | | | | | | | |
| In millions of dollars | Net
unrealized
gains (losses)
on investment securities | Debt valuation adjustment (DVA) | Cash flow hedges(1) | Benefit plans(2) | Foreign
currency
translation
adjustment (CTA), net of hedges(3) | Excluded component of fair value hedges(4) | Accumulated
other
comprehensive income (loss) |
| Balance, June 30, 2018 | $ | (2,717 | ) | $ | (475 | ) | $ | (1,021 | ) | $ | (5,794 | ) | $ | (27,455 | ) | $ | (32 | ) | $ | (37,494 | ) |
| Other comprehensive income before reclassifications | (601 | ) | (294 | ) | (114 | ) | (14 | ) | (221 | ) | 10 |
| (1,234 | ) |
| Increase (decrease) due to amounts reclassified from AOCI | (4 | ) | 7 |
| 40 |
| 40 |
| — |
| — |
| 83 |
|
| Change, net of taxes | $ | (605 | ) | $ | (287 | ) | $ | (74 | ) | $ | 26 |
| $ | (221 | ) | $ | 10 |
| $ | (1,151 | ) |
| Balance at September 30, 2018 | $ | (3,322 | ) | $ | (762 | ) | $ | (1,095 | ) | $ | (5,768 | ) | $ | (27,676 | ) | $ | (22 | ) | $ | (38,645 | ) |
Nine Months Ended September 30, 2018
|
| | | | | | | | | | | | | | | | | | | | | |
| In millions of dollars | Net
unrealized
gains (losses)
on investment securities | Debt valuation adjustment (DVA) | Cash flow hedges(1) | Benefit plans(2) | Foreign
currency
translation
adjustment (CTA), net of hedges(3) | Excluded component of fair value hedges(4) | Accumulated
other
comprehensive income (loss) |
| Balance, December 31, 2017 | $ | (1,158 | ) | $ | (921 | ) | $ | (698 | ) | $ | (6,183 | ) | $ | (25,708 | ) | $ | — |
| $ | (34,668 | ) |
Adjustment to opening balance, net of taxes(5) | (3 | ) | — |
| — |
| — |
| — |
| — |
| (3 | ) |
| Adjusted balance, beginning of period | $ | (1,161 | ) | $ | (921 | ) | $ | (698 | ) | $ | (6,183 | ) | $ | (25,708 | ) | $ | — |
| $ | (34,671 | ) |
| Other comprehensive income before reclassifications | (1,984 | ) | 123 |
| (393 | ) | 288 |
| (1,968 | ) | (22 | ) | (3,956 | ) |
| Increase (decrease) due to amounts reclassified from AOCI | (177 | ) | 36 |
| (4 | ) | 127 |
| — |
| — |
| (18 | ) |
Change, net of taxes | $ | (2,161 | ) | $ | 159 |
| $ | (397 | ) | $ | 415 |
| $ | (1,968 | ) | $ | (22 | ) | $ | (3,974 | ) |
| Balance, September 30, 2018 | $ | (3,322 | ) | $ | (762 | ) | $ | (1,095 | ) | $ | (5,768 | ) | $ | (27,676 | ) | $ | (22 | ) | $ | (38,645 | ) |
Note: Footnotes to the tables above appear on the following page.
|
| | | | | | | | | | | | | | | | | | | | | |
| In millions of dollars | Net
unrealized
gains (losses)
on debt securities | Debt valuation adjustment (DVA)(1) | Cash flow hedges(2) | Benefit plans(3) | Foreign
currency
translation
adjustment (CTA), net of hedges(4) | Excluded component of fair value hedges(5) | Accumulated
other
comprehensive income (loss) |
| Balance, December 31, 2018 | $ | (2,250 | ) | $ | 192 |
| $ | (728 | ) | $ | (6,257 | ) | $ | (28,070 | ) | $ | (57 | ) | $ | (37,170 | ) |
| Other comprehensive income before reclassifications | 1,226 |
| (575 | ) | 186 |
| (110 | ) | 58 |
| 18 |
| 803 |
|
| Increase (decrease) due to amounts reclassified from AOCI | (91 | ) | 4 |
| 100 |
| 46 |
| — |
| — |
| 59 |
|
| Change, net of taxes | $ | 1,135 |
| $ | (571 | ) | $ | 286 |
| $ | (64 | ) | $ | 58 |
| $ | 18 |
| $ | 862 |
|
| Balance at March 31, 2019 | $ | (1,115 | ) | $ | (379 | ) | $ | (442 | ) | $ | (6,321 | ) | $ | (28,012 | ) | $ | (39 | ) | $ | (36,308 | ) |
Three Months Ended September 30, 2017March 31, 2018
|
| | | | | | | | | | | | | | | | | | | | | |
| In millions of dollars | Net
unrealized
gains (losses)
on investment securities | Debt valuation adjustment (DVA) | Cash flow hedges(1) | Benefit plans(2) | Foreign
currency
translation
adjustment (CTA), net of hedges(3) | Excluded component of fair value hedges(4) | Accumulated
other
comprehensive income (loss) |
| Balance, June 30, 2017 | $ | (102 | ) | $ | (496 | ) | $ | (445 | ) | $ | (5,311 | ) | $ | (23,545 | ) | $ | — |
| $ | (29,899 | ) |
| Other comprehensive income before reclassifications | 60 |
| (125 | ) | (27 | ) | (71 | ) | 218 |
| — |
| 55 |
|
| Increase (decrease) due to amounts reclassified from AOCI | (126 | ) | 2 |
| 35 |
| 42 |
| — |
| — |
| (47 | ) |
Change, net of taxes | $ | (66 | ) | $ | (123 | ) | $ | 8 |
| $ | (29 | ) | $ | 218 |
| $ | — |
| $ | 8 |
|
| Balance, September 30, 2017 | $ | (168 | ) | $ | (619 | ) | $ | (437 | ) | $ | (5,340 | ) | $ | (23,327 | ) | $ | — |
| $ | (29,891 | ) |
Nine Months Ended September 30, 2017
| | | In millions of dollars | Net
unrealized
gains (losses)
on investment securities | Debt valuation adjustment (DVA) | Cash flow hedges(1) | Benefit plans(2) | Foreign
currency
translation
adjustment (CTA), net of hedges(3) | Excluded component of fair value hedges(4) | Accumulated
other
comprehensive income (loss) | Net
unrealized
gains (losses)
on debt securities | Debt valuation adjustment (DVA)(1) | Cash flow hedges(2) | Benefit plans(3) | Foreign
currency
translation
adjustment (CTA), net of hedges(4) | Excluded component of fair value hedges(5) | Accumulated
other
comprehensive income (loss) |
| Balance, December 31, 2016 | $ | (799 | ) | $ | (352 | ) | $ | (560 | ) | $ | (5,164 | ) | $ | (25,506 | ) | $ | — |
| $ | (32,381 | ) | |
| Balance, December 31, 2017 | | $ | (1,158 | ) | $ | (921 | ) | $ | (698 | ) | $ | (6,183 | ) | $ | (25,708 | ) | $ | — |
| $ | (34,668 | ) |
Adjustment to opening balance, net of taxes(6) | 504 |
| — |
| — |
| — |
| — |
| — |
| 504 |
| (3 | ) | — |
| — |
| — |
| — |
| — |
| (3 | ) |
| Adjusted balance, beginning of period | $ | (295 | ) | $ | (352 | ) | $ | (560 | ) | $ | (5,164 | ) | $ | (25,506 | ) | $ | — |
| $ | (31,877 | ) | $ | (1,161 | ) | $ | (921 | ) | $ | (698 | ) | $ | (6,183 | ) | $ | (25,708 | ) | $ | — |
| $ | (34,671 | ) |
| Other comprehensive income before reclassifications | 495 |
| (259 | ) | 59 |
| (293 | ) | 2,326 |
| — |
| 2,328 |
| (949 | ) | 101 |
| (243 | ) | 41 |
| 1,120 |
| (4 | ) | 66 |
|
| Increase (decrease) due to amounts reclassified from AOCI | (368 | ) | (8 | ) | 64 |
| 117 |
| (147 | ) | — |
| (342 | ) | (109 | ) | 27 |
| 21 |
| 47 |
| — |
| — |
| (14 | ) |
| Change, net of taxes | $ | 127 |
| $ | (267 | ) | $ | 123 |
| $ | (176 | ) | $ | 2,179 |
| $ | — |
| $ | 1,986 |
| $ | (1,058 | ) | $ | 128 |
| $ | (222 | ) | $ | 88 |
| $ | 1,120 |
| $ | (4 | ) | $ | 52 |
|
| Balance, September 30, 2017 | $ | (168 | ) | $ | (619 | ) | $ | (437 | ) | $ | (5,340 | ) | $ | (23,327 | ) | $ | — |
| $ | (29,891 | ) | |
| Balance, March 31, 2018 | | $ | (2,219 | ) | $ | (793 | ) | $ | (920 | ) | $ | (6,095 | ) | $ | (24,588 | ) | $ | (4 | ) | $ | (34,619 | ) |
| |
| (1) | Changes in DVA are reflected as a component of AOCI, pursuant to the adoption of only the provisions of ASU 2016-01 relating to the presentation of DVA on fair value options liabilities. See Note 1 to the Consolidated Financial Statements in Citi’s 2018 Annual Report on Form 10-K. |
| |
| (2) | Primarily driven by Citigroup’s pay fixed/receive floating interest rate swap programs that hedge the floating rates on liabilities. |
| |
(2)(3) | Primarily reflects adjustments based on the quarterly actuarial valuations of the Company’s significant pension and postretirement plans, annual actuarial valuations of all other plans and amortization of amounts previously recognized in other comprehensive income. |
| |
(3)(4) | Primarily reflects the movements in (by order of impact) the Indian rupee,Mexican peso, Chilean peso, Chinese yuan renminbi, Turkish lira and Brazilian realRussian ruble against the U.S. dollar and changes in related tax effects and hedges for the three months ended September 30, 2018.March 31, 2019. Primarily reflects the movements in (by order of impact) the Brazilian real, Indian rupee, Australian dollar,Mexican peso, Japanese yen, Euro and Argentine peso against the U.S. dollar and changes in related tax effects and hedges for the nine months ended September 30, 2018. Primarily reflects the movements in (by order of impact) the Euro, British pound, Chilean peso and Brazilian realChinese yuan against the U.S. dollar and changes in related tax effects and hedges for the three months ended September 30, 2017. Primarily reflects the movements in (by order of impact) the Mexican peso, Euro, Korean won and Polish zloty against the U.S. dollar and changes in related tax effects and hedges for the nine months ended September 30, 2017.March 31, 2018. Amounts recorded in the CTA component of AOCI remain in AOCI until the sale or substantial liquidation of the foreign entity, at which point such amounts related to the foreign entity are reclassified into earnings. |
| |
(4)(5) | Beginning in the first quarter of 2018, changes in the excluded component of fair value hedges are reflected as a component of AOCI, pursuant to the early adoption of ASU No. 2017-12, Targeted Improvements to Accounting for Hedging Activities. See Note 1 to the Consolidated Financial Statements in Citi’s 2018 Annual Report on Form 10-K for further information regarding this change. |
| |
(5)(6) | Citi adopted ASU 2016-01 and ASU 2018-03 on January 1, 2018. Upon adoption, a cumulative effect adjustment was recorded from AOCI to Retained earnings for net unrealized gains on former AFS equity securities. For additional information, see Note 1 to the Consolidated Financial Statements. |
| |
(6) | In the second quarter of 2017, Citi early adopted ASU 2017-08, Receivables—Nonrefundable Fees and Other Costs (Subtopic 310-20): Premium AmortizationStatements in Citi’s 2018 Annual Report on Purchased Callable Debt Securities. Upon adoption, a cumulative effect adjustment was recorded to reduce Retained earnings, effective January 1, 2017, for the incremental amortization of cumulative fair value hedge adjustments on callable state and municipal debt securities. For additional information, see Note 1 to the Consolidated Financial Statements.Form 10-K.
|
The pretax and after-tax changes in each component of Accumulated other comprehensive income (loss) were as follows:
Three Months Ended September 30, 2018March 31, 2019 |
| | | | | | | | | |
| In millions of dollars | Pretax | Tax effect(1) | After-tax |
| Balance, December 31, 2018 | $ | (44,082 | ) | $ | 6,912 |
| $ | (37,170 | ) |
| Change in net unrealized gains (losses) on debt securities | 1,500 |
| (365 | ) | 1,135 |
|
| Debt valuation adjustment (DVA) | (725 | ) | 154 |
| (571 | ) |
| Cash flow hedges | 378 |
| (92 | ) | 286 |
|
| Benefit plans | (68 | ) | 4 |
| (64 | ) |
| Foreign currency translation adjustment | 69 |
| (11 | ) | 58 |
|
| Excluded component of fair value hedges | 24 |
| (6 | ) | 18 |
|
| Change | $ | 1,178 |
| $ | (316 | ) | $ | 862 |
|
| Balance, March 31, 2019 | $ | (42,904 | ) | $ | 6,596 |
| $ | (36,308 | ) |
|
| | | | | | | | | |
| In millions of dollars | Pretax | Tax effect(1) | After-tax |
| Balance, June 30, 2018 | $ | (44,407 | ) | $ | 6,913 |
| $ | (37,494 | ) |
| Change in net unrealized gains (losses) on AFS debt securities | (810 | ) | 205 |
| (605 | ) |
| Debt valuation adjustment (DVA) | (377 | ) | 90 |
| (287 | ) |
| Cash flow hedges | (97 | ) | 23 |
| (74 | ) |
| Benefit plans | 55 |
| (29 | ) | 26 |
|
| Foreign currency translation adjustment | (192 | ) | (29 | ) | (221 | ) |
| Excluded component of fair value hedges | 13 |
| (3 | ) | 10 |
|
| Change | $ | (1,408 | ) | $ | 257 |
| $ | (1,151 | ) |
| Balance, September 30, 2018 | $ | (45,815 | ) | $ | 7,170 |
| $ | (38,645 | ) |
NineThree Months Ended September 30,March 31, 2018
|
| | | | | | | | | |
| In millions of dollars | Pretax | Tax effect(1) | After-tax |
Balance, December 31, 2017(1) | $ | (41,228 | ) | $ | 6,560 |
| $ | (34,668 | ) |
Adjustment to opening balance(2) | (4 | ) | 1 |
| (3 | ) |
| Adjusted balance, beginning of period | $ | (41,232 | ) | $ | 6,561 |
| $ | (34,671 | ) |
| Change in net unrealized gains (losses) on debt securities | (1,380 | ) | 322 |
| (1,058 | ) |
| Debt valuation adjustment (DVA) | 167 |
| (39 | ) | 128 |
|
| Cash flow hedges | (290 | ) | 68 |
| (222 | ) |
| Benefit plans | 91 |
| (3 | ) | 88 |
|
| Foreign currency translation adjustment | 1,130 |
| (10 | ) | 1,120 |
|
| Excluded component of fair value hedges | (5 | ) | 1 |
| (4 | ) |
| Change | $ | (287 | ) | $ | 339 |
| $ | 52 |
|
| Balance, March 31, 2018 | $ | (41,519 | ) | $ | 6,900 |
| $ | (34,619 | ) |
|
| | | | | | | | | |
| In millions of dollars | Pretax | Tax effect(1) | After-tax |
Balance, December 31, 2017(1) | $ | (41,228 | ) | $ | 6,560 |
| $ | (34,668 | ) |
Adjustment to opening balance(2) | (4 | ) | 1 |
| (3 | ) |
| Adjusted balance, beginning of period | $ | (41,232 | ) | $ | 6,561 |
| $ | (34,671 | ) |
| Change in net unrealized gains (losses) on investment securities | (2,861 | ) | 700 |
| (2,161 | ) |
| Debt valuation adjustment (DVA) | 208 |
| (49 | ) | 159 |
|
| Cash flow hedges | (519 | ) | 122 |
| (397 | ) |
| Benefit plans | 549 |
| (134 | ) | 415 |
|
| Foreign currency translation adjustment | (1,931 | ) | (37 | ) | (1,968 | ) |
| Excluded component of fair value hedges | (29 | ) | 7 |
| (22 | ) |
| Change | $ | (4,583 | ) | $ | 609 |
| $ | (3,974 | ) |
| Balance, September 30, 2018 | $ | (45,815 | ) | $ | 7,170 |
| $ | (38,645 | ) |
| |
| (1) | Includes the impact of ASU 2018-02, which transferred amounts from AOCI to Retained earnings. For additional information, see Note 19 to the Consolidated Financial Statements in Citi’s 20172018 Annual Report on Form 10-K. |
| |
| (2) | Citi adopted ASU 2016-01 and ASU 2018-03 on January 1, 2018. Upon adoption, a cumulative effect adjustment was recorded from AOCI to Retained earnings for net unrealized gains on former AFS equity securities. For additional information, see Note 1 to the Consolidated Financial Statements.Statements in Citi’s 2018 Annual Report on Form 10-K. |
Three Months Ended September 30, 2017
|
| | | | | | | | | |
| In millions of dollars | Pretax | Tax effect | After-tax |
| Balance, June 30, 2017 | $ | (39,106 | ) | $ | 9,207 |
| $ | (29,899 | ) |
| Change in net unrealized gains (losses) on investment securities | (107 | ) | 41 |
| (66 | ) |
| Debt valuation adjustment (DVA) | (195 | ) | 72 |
| (123 | ) |
| Cash flow hedges | 12 |
| (4 | ) | 8 |
|
| Benefit plans | (45 | ) | 16 |
| (29 | ) |
| Foreign currency translation adjustment | 285 |
| (67 | ) | 218 |
|
| Excluded component of fair value hedges | — |
| — |
| — |
|
| Change | $ | (50 | ) | $ | 58 |
| $ | 8 |
|
| Balance, September 30, 2017 | $ | (39,156 | ) | $ | 9,265 |
| $ | (29,891 | ) |
Nine Months Ended September 30, 2017
|
| | | | | | | | | |
| In millions of dollars | Pretax | Tax effect | After-tax |
| Balance, December 31, 2016 | $ | (42,035 | ) | $ | 9,654 |
| $ | (32,381 | ) |
Adjustment to opening balance(1) | 803 |
| (299 | ) | 504 |
|
| Adjusted balance, beginning of period | $ | (41,232 | ) | $ | 9,355 |
| $ | (31,877 | ) |
| Change in net unrealized gains (losses) on investment securities | 194 |
| (67 | ) | 127 |
|
| Debt valuation adjustment (DVA) | (422 | ) | 155 |
| (267 | ) |
| Cash flow hedges | 198 |
| (75 | ) | 123 |
|
| Benefit plans | (266 | ) | 90 |
| (176 | ) |
| Foreign currency translation adjustment | 2,372 |
| (193 | ) | 2,179 |
|
| Excluded component of fair value hedges | — |
| — |
| — |
|
| Change | $ | 2,076 |
| $ | (90 | ) | $ | 1,986 |
|
| Balance, September 30, 2017 | $ | (39,156 | ) | $ | 9,265 |
| $ | (29,891 | ) |
| |
(1) | In the second quarter of 2017, Citi early adopted ASU 2017-08. Upon adoption, a cumulative effect adjustment was recorded to reduce Retained earnings, effective January 1, 2017, for the incremental amortization of cumulative fair value hedge adjustments on callable state and municipal debt securities. See Note 1 to the Consolidated Financial Statements.
|
The Company recognized pretax gains (losses) related to amounts in AOCI reclassified to the Consolidated Statement of Income as follows:
| | | | Increase (decrease) in AOCI due to amounts reclassified to Consolidated Statement of Income | Increase (decrease) in AOCI due to amounts reclassified to Consolidated Statement of Income |
| | Three Months Ended September 30, | Nine Months Ended September 30, | Three Months Ended March 31, |
| In millions of dollars | 2018 | 2018 | 2019 |
| Realized (gains) losses on sales of investments | $ | (69 | ) | $ | (341 | ) | $ | (130 | ) |
| Gross impairment losses | 68 |
| 111 |
| 3 |
|
| Subtotal, pretax | $ | (1 | ) | $ | (230 | ) | $ | (127 | ) |
| Tax effect | (3 | ) | 53 |
| 36 |
|
Net realized (gains) losses on investments after-tax(1) | $ | (4 | ) | $ | (177 | ) | $ | (91 | ) |
| Realized DVA (gains) losses on fair value option liabilities | $ | 9 |
| $ | 46 |
| $ | 5 |
|
| Subtotal, pretax | $ | 9 |
| $ | 46 |
| $ | 5 |
|
| Tax effect | (2 | ) | (10 | ) | (1 | ) |
| Net realized debt valuation adjustment, after-tax | $ | 7 |
| $ | 36 |
| $ | 4 |
|
| Interest rate contracts | $ | 54 |
| $ | 3 |
| $ | 130 |
|
| Foreign exchange contracts | (2 | ) | (8 | ) | 2 |
|
| Subtotal, pretax | $ | 52 |
| $ | (5 | ) | $ | 132 |
|
| Tax effect | (12 | ) | 1 |
| (32 | ) |
Amortization of cash flow hedges, after-tax(2) | $ | 40 |
| $ | (4 | ) | $ | 100 |
|
| Amortization of unrecognized | | | |
| Prior service cost (benefit) | $ | (10 | ) | $ | (32 | ) | $ | (4 | ) |
| Net actuarial loss | 60 |
| 193 |
| 65 |
|
Curtailment/settlement impact(3) | — |
| 6 |
| — |
|
| Subtotal, pretax | $ | 50 |
| $ | 167 |
| $ | 61 |
|
| Tax effect | (10 | ) | (40 | ) | (15 | ) |
Amortization of benefit plans, after-tax(3) | $ | 40 |
| $ | 127 |
| $ | 46 |
|
| Foreign currency translation adjustment | $ | — |
| $ | — |
| $ | — |
|
| Tax effect | — |
| — |
| — |
|
| Foreign currency translation adjustment | $ | — |
| $ | — |
| $ | — |
|
| Total amounts reclassified out of AOCI, pretax | $ | 110 |
| $ | (22 | ) | $ | 71 |
|
| Total tax effect | (27 | ) | 4 |
| (12 | ) |
| Total amounts reclassified out of AOCI, after-tax | $ | 83 |
| $ | (18 | ) | $ | 59 |
|
| |
| (1) | The pretax amount is reclassified to Realized gains (losses) on sales of investments, net and Gross impairment losses in the Consolidated Statement of Income. See Note 12 to the Consolidated Financial Statements for additional details. |
| |
| (2) | See Note 19 to the Consolidated Financial Statements for additional details. |
| |
| (3) | See Note 8 to the Consolidated Financial Statements for additional details. |
The Company recognized pretax gains (losses) related to amounts in AOCI reclassified to the Consolidated Statement of Income as follows:
| | | | Increase (decrease) in AOCI due to amounts reclassified to Consolidated Statement of Income | Increase (decrease) in AOCI due to amounts reclassified to Consolidated Statement of Income |
| | Three Months Ended September 30, | Nine Months Ended September 30, | Three Months Ended March 31, |
| In millions of dollars | 2017 | 2017 | 2018 |
| Realized (gains) losses on sales of investments | $ | (213 | ) | $ | (626 | ) | $ | (170 | ) |
| OTTI gross impairment losses | 15 |
| 47 |
| 27 |
|
| Subtotal, pretax | $ | (198 | ) | $ | (579 | ) | $ | (143 | ) |
| Tax effect | 72 |
| 211 |
| 34 |
|
Net realized (gains) losses on investment securities, after-tax(1) | $ | (126 | ) | $ | (368 | ) | $ | (109 | ) |
| Realized DVA (gains) losses on fair value option liabilities | $ | 3 |
| $ | (13 | ) | $ | 35 |
|
| Subtotal, pretax | $ | 3 |
| $ | (13 | ) | $ | 35 |
|
| Tax effect | $ | (1 | ) | $ | 5 |
| (8 | ) |
| Net realized debt valuation adjustment, after-tax | $ | 2 |
| $ | (8 | ) | $ | 27 |
|
| Interest rate contracts | $ | 48 |
| $ | 94 |
| $ | 31 |
|
| Foreign exchange contracts | 7 |
| 8 |
| (2 | ) |
| Subtotal, pretax | $ | 55 |
| $ | 102 |
| $ | 29 |
|
| Tax effect | (20 | ) | (38 | ) | (8 | ) |
Amortization of cash flow hedges, after-tax(2) | $ | 35 |
| $ | 64 |
| $ | 21 |
|
| Amortization of unrecognized | | | |
| Prior service cost (benefit) | $ | (10 | ) | $ | (32 | ) | $ | (11 | ) |
| Net actuarial loss | 70 |
| 203 |
| 69 |
|
Curtailment/settlement impact(3) | 5 |
| 12 |
| 4 |
|
| Subtotal, pretax | $ | 65 |
| $ | 183 |
| $ | 62 |
|
| Tax effect | (23 | ) | (66 | ) | (15 | ) |
Amortization of benefit plans, after-tax(3) | $ | 42 |
| $ | 117 |
| $ | 47 |
|
| Foreign currency translation adjustment | $ | — |
| $ | (232 | ) | $ | — |
|
| Tax effect | — |
| 85 |
| — |
|
| Foreign currency translation adjustment | $ | — |
| $ | (147 | ) | $ | — |
|
| Total amounts reclassified out of AOCI, pretax | $ | (75 | ) | $ | (539 | ) | $ | (17 | ) |
| Total tax effect | 28 |
| 197 |
| 3 |
|
| Total amounts reclassified out of AOCI, after-tax | $ | (47 | ) | $ | (342 | ) | $ | (14 | ) |
| |
| (1) | The pretax amount is reclassified to Realized gains (losses) on sales of investments, net and Gross impairment losses on in the Consolidated Statement of Income. See Note 12 to the Consolidated Financial Statements for additional details. |
| |
| (2) | See Note 19 to the Consolidated Financial Statements for additional details. |
| |
| (3) | See Note 8 to the Consolidated Financial Statements for additional details. |
18. SECURITIZATIONS AND VARIABLE INTEREST ENTITIES
For additional information regarding Citi’s use of special purpose entities (SPEs) and variable interest entities (VIEs), see Note 21 to the Consolidated Financial Statements in Citi’s 20172018 Annual Report on Form 10-K.
Citigroup’s involvement with consolidated and unconsolidated VIEs with which the Company holds significant variable interests or has continuing involvement through servicing a majority of the assets in a VIE is presented below: |
| | | | | | | | | | | | | | | | | | | | | | | | |
| | As of March 31, 2019 |
| | | | | Maximum exposure to loss in significant unconsolidated VIEs(1) |
| | | | | Funded exposures(2) | Unfunded exposures | |
| In millions of dollars | Total involvement with SPE assets | Consolidated VIE/SPE assets | Significant unconsolidated VIE assets(3) | Debt investments | Equity investments | Funding commitments | Guarantees and derivatives | Total |
| Credit card securitizations | $ | 42,790 |
| $ | 42,790 |
| $ | — |
| $ | — |
| $ | — |
| $ | — |
| $ | — |
| $ | — |
|
Mortgage securitizations(4) | | | | | | | | |
| U.S. agency-sponsored | 116,062 |
| — |
| 116,062 |
| 3,251 |
| — |
| — |
| 61 |
| 3,312 |
|
| Non-agency-sponsored | 32,769 |
| 1,424 |
| 31,345 |
| 500 |
| — |
| — |
| 1 |
| 501 |
|
| Citi-administered asset-backed commercial paper conduits | 17,494 |
| 17,494 |
| — |
| — |
| — |
| — |
| — |
| — |
|
| Collateralized loan obligations (CLOs) | 21,612 |
| — |
| 21,612 |
| 5,408 |
| — |
| — |
| 9 |
| 5,417 |
|
| Asset-based financing | 105,765 |
| 612 |
| 105,153 |
| 22,940 |
| 834 |
| 10,394 |
| — |
| 34,168 |
|
| Municipal securities tender option bond trusts (TOBs) | 8,165 |
| 1,787 |
| 6,378 |
| 21 |
| — |
| 4,278 |
| — |
| 4,299 |
|
| Municipal investments | 18,518 |
| 1 |
| 18,517 |
| 2,768 |
| 3,932 |
| 2,641 |
| — |
| 9,341 |
|
| Client intermediation | 1,649 |
| 1,403 |
| 246 |
| 171 |
| — |
| — |
| 8 |
| 179 |
|
| Investment funds | 1,037 |
| 265 |
| 772 |
| 14 |
| — |
| 20 |
| — |
| 34 |
|
| Other | 62 |
| 2 |
| 60 |
| 49 |
| — |
| 11 |
| — |
| 60 |
|
| Total | $ | 365,923 |
| $ | 65,778 |
| $ | 300,145 |
| $ | 35,122 |
| $ | 4,766 |
| $ | 17,344 |
| $ | 79 |
| $ | 57,311 |
|
|
| | | | | | | | | | | | | | | | | | | | | | | | |
| | As of September 30, 2018 |
| | | | | Maximum exposure to loss in significant unconsolidated VIEs(1) |
| | | | | Funded exposures(2) | Unfunded exposures | |
| In millions of dollars | Total involvement with SPE assets | Consolidated VIE/SPE assets | Significant unconsolidated VIE assets(3) | Debt investments | Equity investments | Funding commitments | Guarantees and derivatives | Total |
| Credit card securitizations | $ | 45,319 |
| $ | 45,319 |
| $ | — |
| $ | — |
| $ | — |
| $ | — |
| $ | — |
| $ | — |
|
Mortgage securitizations(4) | | | | | | | | |
| U.S. agency-sponsored | 113,565 |
| — |
| 113,565 |
| 2,965 |
| — |
| — |
| 68 |
| 3,033 |
|
| Non-agency-sponsored | 25,452 |
| 1,580 |
| 23,872 |
| 356 |
| — |
| — |
| 1 |
| 357 |
|
| Citi-administered asset-backed commercial paper conduits (ABCP) | 17,435 |
| 17,435 |
| — |
| — |
| — |
| — |
| — |
| — |
|
| Collateralized loan obligations (CLOs) | 17,870 |
| — |
| 17,870 |
| 5,524 |
| — |
| — |
| 9 |
| 5,533 |
|
| Asset-based financing | 64,817 |
| 639 |
| 64,178 |
| 20,060 |
| 601 |
| 9,214 |
| — |
| 29,875 |
|
| Municipal securities tender option bond trusts (TOBs) | 8,016 |
| 2,029 |
| 5,987 |
| 37 |
| — |
| 4,106 |
| — |
| 4,143 |
|
| Municipal investments | 17,765 |
| 1 |
| 17,764 |
| 2,622 |
| 3,798 |
| 2,268 |
| — |
| 8,688 |
|
| Client intermediation | 592 |
| 419 |
| 173 |
| 72 |
| — |
| — |
| 9 |
| 81 |
|
| Investment funds | 1,353 |
| 525 |
| 828 |
| 12 |
| — |
| 3 |
| 5 |
| 20 |
|
| Other | 652 |
| 31 |
| 621 |
| 39 |
| 8 |
| 22 |
| 46 |
| 115 |
|
| Total | $ | 312,836 |
| $ | 67,978 |
| $ | 244,858 |
| $ | 31,687 |
| $ | 4,407 |
| $ | 15,613 |
| $ | 138 |
| $ | 51,845 |
|
| | | | As of December 31, 2017 | As of December 31, 2018 |
| | | Maximum exposure to loss in significant unconsolidated VIEs(1) | | Maximum exposure to loss in significant unconsolidated VIEs(1) |
| | | Funded exposures(2) | Unfunded exposures | | | Funded exposures(2) | Unfunded exposures | |
| In millions of dollars | Total involvement with SPE assets | Consolidated VIE/SPE assets | Significant unconsolidated VIE assets(3) | Debt investments | Equity investments | Funding commitments | Guarantees and derivatives | Total | Total involvement with SPE assets | Consolidated VIE/SPE assets | Significant unconsolidated VIE assets(3) | Debt investments | Equity investments | Funding commitments | Guarantees and derivatives | Total |
| Credit card securitizations | $ | 50,795 |
| $ | 50,795 |
| $ | — |
| $ | — |
| $ | — |
| $ | — |
| $ | — |
| $ | — |
| $ | 46,232 |
| $ | 46,232 |
| $ | — |
| $ | — |
| $ | — |
| $ | — |
| $ | — |
| $ | — |
|
Mortgage securitizations(4) | | | | | |
| U.S. agency-sponsored | 116,610 |
| — |
| 116,610 |
| 2,647 |
| — |
| — |
| 74 |
| 2,721 |
| 116,563 |
| — |
| 116,563 |
| 3,038 |
| — |
| — |
| 60 |
| 3,098 |
|
| Non-agency-sponsored | 22,251 |
| 2,035 |
| 20,216 |
| 330 |
| — |
| — |
| 1 |
| 331 |
| 30,886 |
| 1,498 |
| 29,388 |
| 431 |
| — |
| — |
| 1 |
| 432 |
|
| Citi-administered asset-backed commercial paper conduits (ABCP) | 19,282 |
| 19,282 |
| — |
| — |
| — |
| — |
| — |
| — |
| |
| Citi-administered asset-backed commercial paper conduits | | 18,750 |
| 18,750 |
| — |
| — |
| — |
| — |
| — |
| — |
|
| Collateralized loan obligations (CLOs) | 20,588 |
| — |
| 20,588 |
| 5,956 |
| — |
| — |
| 9 |
| 5,965 |
| 21,837 |
| — |
| 21,837 |
| 5,891 |
| — |
| — |
| 9 |
| 5,900 |
|
| Asset-based financing | 60,472 |
| 633 |
| 59,839 |
| 19,478 |
| 583 |
| 5,878 |
| — |
| 25,939 |
| 99,433 |
| 628 |
| 98,805 |
| 21,640 |
| 715 |
| 9,757 |
| — |
| 32,112 |
|
| Municipal securities tender option bond trusts (TOBs) | 6,925 |
| 2,166 |
| 4,759 |
| 138 |
| — |
| 3,035 |
| — |
| 3,173 |
| 7,998 |
| 1,776 |
| 6,222 |
| 9 |
| — |
| 4,262 |
| — |
| 4,271 |
|
| Municipal investments | 19,119 |
| 7 |
| 19,112 |
| 2,709 |
| 3,640 |
| 2,344 |
| — |
| 8,693 |
| 18,044 |
| 3 |
| 18,041 |
| 2,813 |
| 3,922 |
| 2,738 |
| — |
| 9,473 |
|
| Client intermediation | 958 |
| 824 |
| 134 |
| 32 |
| — |
| — |
| 9 |
| 41 |
| 858 |
| 614 |
| 244 |
| 172 |
| — |
| — |
| 2 |
| 174 |
|
| Investment funds | 1,892 |
| 616 |
| 1,276 |
| 14 |
| 7 |
| 13 |
| — |
| 34 |
| 1,272 |
| 440 |
| 832 |
| 12 |
| — |
| 1 |
| 1 |
| 14 |
|
| Other | 677 |
| 36 |
| 641 |
| 27 |
| 9 |
| 34 |
| 47 |
| 117 |
| 63 |
| 3 |
| 60 |
| 37 |
| — |
| 23 |
| — |
| 60 |
|
| Total | $ | 319,569 |
| $ | 76,394 |
| $ | 243,175 |
| $ | 31,331 |
| $ | 4,239 |
| $ | 11,304 |
| $ | 140 |
| $ | 47,014 |
| $ | 361,936 |
| $ | 69,944 |
| $ | 291,992 |
| $ | 34,043 |
| $ | 4,637 |
| $ | 16,781 |
| $ | 73 |
| $ | 55,534 |
|
(1) The definition of maximum exposure to loss is included in the text that follows this table.
| |
| (2) | Included on Citigroup’s September 30, 2018March 31, 2019 and December 31, 20172018 Consolidated Balance Sheet. |
| |
| (3) | A significant unconsolidated VIE is an entity in which the Company has any variable interest or continuing involvement considered to be significant, regardless of the likelihood of loss. |
| |
| (4) | Citigroup mortgage securitizations also include agency and non-agency (private-label)(private label) re-securitization activities. These SPEs are not consolidated. See “Re-securitizations” below for further discussion. |
The previous tables do not include:
certain venture capital investments made by some of the Company’s private equity subsidiaries, as the Company accounts for these investments in accordance with the Investment Company Audit Guide (codified in ASC 946);
certain investment funds for which the Company provides investment management services and personal estate trusts for which the Company provides administrative, trustee and/or investment management services;
certain VIEs structured by third parties in which the Company holds securities in inventory, as these investments are made on arm’s-length terms;
certain positions in mortgage-backed and asset-backed securities held by the Company, which are classified as Trading account assets or Investments, in which the Company has no other involvement with the related securitization entity deemed to be significant (for more information on these positions, see Notes 12 and 20 to the Consolidated Financial Statements);
certain representations and warranties exposures in legacy ICG-sponsored mortgage-backed and asset-backed securitizations in which the Company has no variable interest or continuing involvement as servicer. The outstanding balance of mortgage loans securitized during 2005 to 2008 in which the Company has no variable interest or continuing involvement as servicer was approximately $8 billion and $9 billion at September 30, 2018 and December 31, 2017, respectively;
| |
| • | certain positions in mortgage- and asset-backed securities held by the Company, which are classified as Trading account assets or Investments, in which the Company has no other involvement with the related securitization entity deemed to be significant (for more information on these positions, see Notes 12 and 20 to the Consolidated Financial Statements); |
| |
| • | certain representations and warranties exposures in legacy ICG-sponsored mortgage- and asset-backed securitizations in which the Company has no variable interest or continuing involvement as servicer. The outstanding balance of mortgage loans securitized during 2005 to 2008 in which the Company has no variable interest or continuing involvement as servicer was approximately $7 billion at March 31, 2019 and December 31, 2018; |
certain representations and warranties exposures in Citigroup residential mortgage securitizations, wherein which the original mortgage loan balances are no longer outstanding; and
VIEs such as trust preferred securities trusts used in connection with the Company’s funding activities. The Company does not have a variable interest in these trusts.
The asset balances for consolidated VIEs represent the carrying amounts of the assets consolidated by the Company. The carrying amount may represent the amortized cost or the current fair value of the assets depending on the legal form of the asset (e.g., loan or security) and the Company’s standard accounting policies for the asset type and line of business.
The asset balances for unconsolidated VIEs in which the Company has significant involvement represent the most current information available to the Company. In most cases, the asset balances represent an amortized cost basis without regard to impairments, unless fair value information is readily available to the Company.
The maximum funded exposure represents the balance sheet carrying amount of the Company’s investment in the VIE. It reflects the initial amount of cash invested in the VIE, adjusted for any accrued interest and cash principal payments received. The carrying amount may also be adjusted for increases or declines in fair value or any impairment in value recognized in earnings. The maximum exposure of unfunded positions represents the remaining undrawn committed amount, including liquidity and credit facilities provided by the Company or the notional amount of a derivative instrument considered to be a variable interest. In certain transactions, the Company has entered into derivative instruments or other arrangements that are not considered variable interests in the VIE (e.g., interest rate swaps, cross-currency swaps or where the Company is the purchaser of credit protection under a credit default swap or total return swap where the Company pays the total return on certain assets to the SPE). Receivables under such arrangements are not included in the maximum exposure amounts.
Funding Commitments for Significant Unconsolidated VIEs—Liquidity Facilities and Loan Commitments
The following table presents the notional amount of liquidity facilities and loan commitments that are classified as funding commitments in the VIE tables above:
|
| | | | | | | | | | | | |
| | March 31, 2019 | December 31, 2018 |
| In millions of dollars | Liquidity facilities | Loan/equity commitments | Liquidity facilities | Loan/equity commitments |
| Asset-based financing | $ | — |
| $ | 10,394 |
| $ | — |
| $ | 9,757 |
|
| Municipal securities tender option bond trusts (TOBs) | 4,278 |
| — |
| 4,262 |
| — |
|
| Municipal investments | — |
| 2,641 |
| — |
| 2,738 |
|
| Investment funds | — |
| 20 |
| — |
| 1 |
|
| Other | — |
| 11 |
| — |
| 23 |
|
| Total funding commitments | $ | 4,278 |
| $ | 13,066 |
| $ | 4,262 |
| $ | 12,519 |
|
|
| | | | | | | | | | | | |
| | September 30, 2018 | December 31, 2017 |
| In millions of dollars | Liquidity facilities | Loan/equity commitments | Liquidity facilities | Loan/equity commitments |
| Asset-based financing | $ | — |
| $ | 9,214 |
| $ | — |
| $ | 5,878 |
|
| Municipal securities tender option bond trusts (TOBs) | 4,106 |
| — |
| 3,035 |
| — |
|
| Municipal investments | — |
| 2,268 |
| — |
| 2,344 |
|
| Investment funds | — |
| 3 |
| — |
| 13 |
|
| Other | — |
| 22 |
| — |
| 34 |
|
| Total funding commitments | $ | 4,106 |
| $ | 11,507 |
| $ | 3,035 |
| $ | 8,269 |
|
Significant Interests in Unconsolidated VIEs—Balance Sheet Classification
The following table presents the carrying amounts and classification of significant variable interests in unconsolidated VIEs:
|
| | | | | | |
| In billions of dollars | March 31, 2019 | December 31, 2018 |
| Cash | $ | — |
| $ | — |
|
| Trading account assets | 3.4 |
| 3.0 |
|
| Investments | 10.3 |
| 10.7 |
|
| Total loans, net of allowance | 25.7 |
| 24.5 |
|
| Other | 0.5 |
| 0.5 |
|
| Total assets | $ | 39.9 |
| $ | 38.7 |
|
|
| | | | | | |
| In billions of dollars | September 30, 2018 | December 31, 2017 |
| Cash | $ | — |
| $ | — |
|
| Trading account assets | 8.2 |
| 8.5 |
|
| Investments | 4.7 |
| 4.4 |
|
| Total loans, net of allowance | 22.7 |
| 22.2 |
|
| Other | 0.5 |
| 0.5 |
|
| Total assets | $ | 36.1 |
| $ | 35.6 |
|
Credit Card Securitizations
Substantially all of the Company’s credit card securitization activity is through two trusts—Citibank Credit Card Master Trust (Master Trust) and Citibank Omni Master Trust (Omni
Trust), with the substantial majority through the Master Trust. These trusts are consolidated entities.
The following table reflects amounts related to the Company’s securitized credit card receivables:
| | | In billions of dollars | September 30, 2018 | December 31, 2017 | March 31, 2019 | December 31, 2018 |
Ownership interests in principal amount of trust credit card receivables | | Sold to investors via trust-issued securities | $ | 26.3 |
| $ | 28.8 |
| $ | 24.8 |
| $ | 27.3 |
|
| Retained by Citigroup as trust-issued securities | 7.5 |
| 7.6 |
| 7.6 |
| 7.6 |
|
| Retained by Citigroup via non-certificated interests | 11.6 |
| 14.4 |
| 10.5 |
| 11.3 |
|
| Total | $ | 45.4 |
| $ | 50.8 |
| $ | 42.9 |
| $ | 46.2 |
|
The following tables summarizetable summarizes selected cash flow information related to Citigroup’s credit card securitizations:
|
| | | | | | |
| | Three Months Ended March 31, |
| In billions of dollars | 2019 | 2018 |
| Proceeds from new securitizations | $ | — |
| $ | 2.8 |
|
| Pay down of maturing notes | (2.5 | ) | (2.8 | ) |
|
| | | | | | |
| | Three Months Ended September 30, |
| In billions of dollars | 2018 | 2017 |
| Proceeds from new securitizations | $ | 1.9 |
| $ | 2.2 |
|
| Pay down of maturing notes | (2.9 | ) | (1.8 | ) |
|
| | | | | | |
| | Nine Months Ended September 30, |
| In billions of dollars | 2018 | 2017 |
| Proceeds from new securitizations | $ | 5.8 |
| $ | 9.8 |
|
| Pay down of maturing notes | (8.3 | ) | (4.6 | ) |
Master Trust Liabilities (at Par Value)
The weighted average maturity of the third-party term notes issued by the Master Trust was 3.03.1 years as of September 30, 2018March 31, 2019 and 2.63.0 years as of December 31, 2017.2018.
|
| | | | | | |
| In billions of dollars | Mar. 31, 2019 | Dec. 31, 2018 |
| Term notes issued to third parties | $ | 23.3 |
| $ | 25.8 |
|
| Term notes retained by Citigroup affiliates | 5.7 |
| 5.7 |
|
| Total Master Trust liabilities | $ | 29.0 |
| $ | 31.5 |
|
|
| | | | | | |
| In billions of dollars | Sept. 30, 2018 | Dec. 31, 2017 |
| Term notes issued to third parties | $ | 24.8 |
| $ | 27.8 |
|
| Term notes retained by Citigroup affiliates | 5.7 |
| 5.7 |
|
| Total Master Trust liabilities | $ | 30.5 |
| $ | 33.5 |
|
Omni Trust Liabilities (at Par Value)
The weighted average maturity of the third-party term notes issued by the Omni Trust was 1.71.2 years as of September 30, 2018March 31, 2019 and 1.91.4 years as of December 31, 2017.2018.
| | | In billions of dollars | Sept. 30, 2018 | Dec. 31, 2017 | Mar. 31, 2019 | Dec. 31, 2018 |
| Term notes issued to third parties | $ | 1.5 |
| $ | 1.0 |
| $ | 1.5 |
| $ | 1.5 |
|
| Term notes retained by Citigroup affiliates | 1.9 |
| 1.9 |
| 1.9 |
| 1.9 |
|
| Total Omni Trust liabilities | $ | 3.4 |
| $ | 2.9 |
| $ | 3.4 |
| $ | 3.4 |
|
The following tables summarize selected cash flow information and retained interests related to Citigroup mortgage securitizations:
|
| | | | | | | | | | | | |
| | Three Months Ended March 31, |
| | 2019 | 2018 |
| In billions of dollars | U.S. agency-
sponsored
mortgages | Non-agency-
sponsored
mortgages | U.S. agency-
sponsored
mortgages | Non-agency-
sponsored
mortgages |
| Principal securitized | $ | 1.0 |
| $ | 2.7 |
| $ | 1.2 |
| $ | — |
|
| Proceeds from new securitizations | 1.0 |
| 2.7 |
| 1.2 |
| 1.6 |
|
| Purchases of previously transferred financial assets | — |
| — |
| 0.1 |
| — |
|
|
| | | | | | | | | | | | |
| | Three Months Ended September 30, |
| | 2018 | 2017 |
| In billions of dollars | U.S. agency-
sponsored
mortgages | Non-agency-
sponsored
mortgages | U.S. agency-
sponsored
mortgages | Non-agency-
sponsored
mortgages |
| Proceeds from new securitizations | $ | 7.9 |
| $ | 2.1 |
| $ | 11.7 |
| $ | 4.1 |
|
| Contractual servicing fees received | — |
| — |
| 0.1 |
| — |
|
Note: Excludes re-securitization transactions. |
| | | | | | | | | | | | |
| | Nine Months Ended September 30, |
| | 2018 | 2017 |
| In billions of dollars | U.S. agency-
sponsored
mortgages | Non-agency-
sponsored
mortgages | U.S. agency-
sponsored
mortgages | Non-agency-
sponsored
mortgages |
| Proceeds from new securitizations | $ | 23.7 |
| $ | 8.2 |
| $ | 26.2 |
| $ | 6.9 |
|
| Contractual servicing fees received | 0.1 |
| — |
| 0.2 |
| — |
|
GainsDuring the first quarter of 2019, there were no gains recognized on the securitization of U.S. agency-sponsored mortgages were $6 million and $18 million for the three and nine months ended September 30, 2018, respectively. For the three and nine months ended September 30, 2018, gains recognized on the securitization of non-agency-sponsored mortgages were $5 million and $40 million, respectively.
mortgages. Gains recognized on the securitization of U.S. agency-sponsorednon-agency sponsored mortgages during the first quarter of 2019 were $14$17 million.
Agency and non-agency securitization gains for the quarter ended March 31, 2018 were $5 million and $61 million for the three and nine months ended September 30, 2017, respectively. For the three and nine months ended September 30, 2017, gains recognized on the securitization of non-agency-sponsored mortgages were $29 million and $75$12 million, respectively.
|
| | | | | | | | | | | | | | | | | | |
| | March 31, 2019 | December 31, 2018 |
| | | Non-agency-sponsored mortgages(1) | | Non-agency-sponsored mortgages(1) |
| In millions of dollars | U.S. agency-
sponsored mortgages | Senior
interests | Subordinated
interests | U.S. agency-
sponsored mortgages | Senior
interests | Subordinated
interests |
Carrying value of retained interests(2) | $ | 531 |
| $ | 366 |
| $ | 55 |
| $ | 564 |
| $ | 300 |
| $ | 51 |
|
|
| | | | | | | | | | | | | | | | | | |
| | September 30, 2018 | December 31, 2017 |
| | | Non-agency-sponsored mortgages(1) | | Non-agency-sponsored mortgages(1) |
| In millions of dollars | U.S. agency-
sponsored mortgages | Senior
interests | Subordinated
interests | U.S. agency-
sponsored mortgages | Senior
interests | Subordinated
interests |
| Carrying value of retained interests | $ | 2,092 |
| $ | 296 |
| $ | 112 |
| $ | 1,634 |
| $ | 214 |
| $ | 139 |
|
| |
| (1) | Disclosure of non-agency-sponsored mortgages as senior and subordinated interests is indicative of the interests’ position in the capital structure of the securitization. |
| |
| (2) | Retained interests consist of Level 2 or Level 3 assets depending on the observability of significant inputs. See Note 20 to the Consolidated Financial Statements for more information about fair value measurements. |
Key assumptions used in measuring the fair value of retained interests at the date of sale or securitization of mortgage receivables were as follows:
|
| | | | | | |
| | Three Months Ended September 30, 2018 |
| | | Non-agency-sponsored mortgages(1) |
| | U.S. agency-
sponsored mortgages | Senior
interests | Subordinated
interests |
| Discount rate | 3.0% to 10.4% |
| 3.8% to 4.2% |
| 4.1% to 8.6% |
|
| Weighted average discount rate | 6.9 | % | 4.1 | % | 5.6 | % |
| Constant prepayment rate | 5.3% to 12.8% |
| 7.0% to 10.0% |
| 7.0% to 10.0% |
|
| Weighted average constant prepayment rate | 8.1 | % | 7.9 | % | 8.2 | % |
Anticipated net credit losses(2) | NM |
| 3.4% to 3.7% |
| 3.4% to 3.7% |
|
| Weighted average anticipated net credit losses | NM |
| 3.6 | % | 3.6 | % |
| Weighted average life | 6.9 to 22.1 years |
| 3.0 to 3.9 years |
| 7.3 to 15.7 years |
|
|
| | | | | | |
| | March 31, 2019 |
| | | Non-agency-sponsored mortgages(1) |
| | U.S. agency-
sponsored mortgages | Senior
interests | Subordinated
interests |
| Weighted average discount rate | 6.6 | % | 3.6 | % | 7.1 | % |
| Weighted average constant prepayment rate | 14.1 | % | 6.0 | % | 6.0 | % |
Weighted average anticipated net credit losses(2) | NM |
| 5.0 | % | 3.5 | % |
| Weighted average life | 6.1 years |
| 7.6 years |
| 19.4 years |
|
|
| | | | | | |
| | Three Months Ended September 30, 2017 |
| | | Non-agency-sponsored mortgages(1) |
| | U.S. agency-
sponsored mortgages | Senior
interests | Subordinated
interests |
| Discount rate | 2.0% to 13.2% |
| 1.4% to 4.5% |
| 1.7% to 4.2% |
|
| Weighted average discount rate | 8.5 | % | 2.8 | % | 3.5 | % |
| Constant prepayment rate | 6.6% to 31.6% |
| — |
| — |
|
| Weighted average constant prepayment rate | 10.6 | % | — |
| — |
|
Anticipated net credit losses(2) | NM |
| 6.7% to 6.8% |
| 6.4 | % |
| Weighted average anticipated net credit losses | NM |
| 6.7 |
| 6.4 | % |
| Weighted average life | 2.5 to 10.5 years |
| 4.9 to 9.4 years |
| 5.0 to 9.1 years |
|
|
| | | | | | |
| | March 31, 2018 |
| | | Non-agency-sponsored mortgages(1) |
| | U.S. agency-
sponsored mortgages | Senior
interests | Subordinated
interests |
| Weighted average discount rate | 10.4 | % | 3.4 | % | 3.0 | % |
| Weighted average constant prepayment rate | 4.5 | % | 12.0 | % | 12.0 | % |
Weighted average anticipated net credit losses(2) | NM |
| 5.0 | % | 2.0 | % |
| Weighted average life | 7.7 years |
| 6.9 years |
| 2.5 years |
|
|
| | | | | | |
| | Nine Months Ended September 30, 2018 |
| | | Non-agency-sponsored mortgages(1) |
| | U.S. agency-
sponsored mortgages | Senior
interests | Subordinated
interests |
| Discount rate | 3.0% to 11.4% |
| 1.6% to 4.5% |
| 3.0% to 8.6% |
|
| Weighted average discount rate | 6.3 | % | 3.6 | % | 4.4 | % |
| Constant prepayment rate | 3.5% to 16.0% |
| 7.0% to 12.0% |
| 7.0% to 12.0% |
|
| Weighted average constant prepayment rate | 8.2 | % | 8.8 | % | 9.1 | % |
Anticipated net credit losses(2) | NM |
| 2.0% to 6.7% |
| 2.0% to 4.6% |
|
| Weighted average anticipated net credit losses | NM |
| 4.4 | % | 3.4 | % |
| Weighted average life | 5.0 to 22.1 years |
| 2.5 to 9.9 years |
| 2.5 to 15.7 years |
|
|
| | | | | | |
| | Nine Months Ended September 30, 2017 |
| | | Non-agency-sponsored mortgages(1) |
| | U.S. agency-
sponsored mortgages | Senior
interests | Subordinated
interests |
| Discount rate | 2.0% to 19.9% |
| 1.4% to 4.5% |
| 1.7% to 19.1% |
|
| Weighted average discount rate | 9.1 | % | 2.8 | % | 4.0 | % |
| Constant prepayment rate | 3.8% to 31.6% |
| — |
| — |
|
| Weighted average constant prepayment rate | 9.6 | % | — |
| — |
|
Anticipated net credit losses(2) | NM |
| 6.7% to 6.8% |
| 6.4% to 69.1% |
|
| Weighted average anticipated net credit losses | NM |
| 6.7 | % | 10.8 | % |
| Weighted average life | 2.5 to 14.5 years |
| 4.9 to 10.0 years |
| 5.0 to 10.0 years |
|
| |
| (1) | Disclosure of non-agency-sponsored mortgages as senior and subordinated interests is indicative of the interests’ position in the capital structure of the securitization. |
| |
| (2) | Anticipated net credit losses represent estimated loss severity associated with defaulted mortgage loans underlying the mortgage securitizations disclosed above. Anticipated net credit losses, in this instance, do not represent total credit losses incurred to date, nor do they represent credit losses expected on retained interests in mortgage securitizations. |
| |
| NM | Anticipated net credit losses are not meaningful due to U.S. agency guarantees. |
The interests retained by the Company range from highly rated and/or senior in the capital structure to unrated and/or residual interests.
The key assumptions used to value retained interests, and the sensitivity of the fair value to adverse changes of 10% and 20% in each of the key assumptions, are set forthpresented in the tables below.
below. The negative effect of each change is calculated independently, holding all other assumptions constant. Because the key assumptions may not be independent, the net effect of simultaneous adverse changes in the key assumptions may be less than the sum of the individual effects shown below.
|
| | | | | | |
| | March 31, 2019 |
| | | Non-agency-sponsored mortgages(1) |
| | U.S. agency-
sponsored mortgages | Senior
interests | Subordinated
interests |
| Weighted average discount rate | 7.2 | % | 5.9 | % | 18.4 | % |
| Weighted average constant prepayment rate | 11.1 | % | 1.9 | % | 1.3 | % |
Weighted average anticipated net credit losses(2) | NM |
| 47.0 | % | — |
|
| Weighted average life | 6.0 years |
| 3.1 years |
| 22.0 years |
|
|
| | | | | | |
| | September 30, 2018 |
| | | Non-agency-sponsored mortgages(1) |
| | U.S. agency-
sponsored mortgages | Senior
interests | Subordinated
interests |
| Discount rate | 2.6% to 55.0% |
| 12.2 | % | 4.9% to 5.8% |
|
| Weighted average discount rate | 6.0 | % | 12.2 | % | 5.2 | % |
| Constant prepayment rate | 3.7% to 19.6% |
| 8.0 | % | 5.0% to 16.0% |
|
| Weighted average constant prepayment rate | 8.8 | % | 8.0 | % | 7.7 | % |
Anticipated net credit losses(2) | NM |
| 38.0 | % | 37.0% to 91.0% |
|
| Weighted average anticipated net credit losses | NM |
| 38.0 | % | 49.7 | % |
| Weighted average life | 0.5 to 28.2 years |
| 7.6 years |
| 6.2 to 15.5 years |
|
|
| | | | | |
| | December 31, 2018 |
| | | Non-agency-sponsored mortgages(1) |
| | U.S. agency-
sponsored mortgages | Senior
interests | Subordinated
interests |
| Weighted average discount rate | 7.8 | % | 9.3 | % | — |
| Weighted average constant prepayment rate | 9.1 | % | 8.0 | % | — |
Weighted average anticipated net credit losses(2) | NM |
| 40.0 | % | — |
| Weighted average life | 6.4 years |
| 6.6 years |
| — |
|
| | | | | | |
| | December 31, 2017 |
| | | Non-agency-sponsored mortgages(1) |
| | U.S. agency-
sponsored mortgages | Senior
interests | Subordinated
interests |
| Discount rate | 1.8% to 84.2% |
| 5.8% to 100.0% |
| 2.8% to 35.1% |
|
| Weighted average discount rate | 7.1 | % | 5.8 | % | 9.0 | % |
| Constant prepayment rate | 6.9% to 27.8% |
| 8.9% to 15.5% |
| 8.6% to 13.1% |
|
| Weighted average constant prepayment rate | 11.6 | % | 8.9 | % | 10.6 | % |
Anticipated net credit losses(2) | NM |
| 0.4% to 46.9% |
| 35.1% to 52.1% |
|
| Weighted average anticipated net credit losses | NM |
| 46.9 | % | 44.9 | % |
| Weighted average life | 0.1 to 27.8 years |
| 4.8 to 5.3 years |
| 0.2 to 18.6 years |
|
| |
| (1) | Disclosure of non-agency-sponsored mortgages as senior and subordinated interests is indicative of the interests’ position in the capital structure of the securitization. |
| |
| (2) | Anticipated net credit losses represent estimated loss severity associated with defaulted mortgage loans underlying the mortgage securitizations disclosed above. Anticipated net credit losses, in this instance, do not represent total credit losses incurred to date, nor do they represent credit losses expected on retained interests in mortgage securitizations. |
| |
| NM | Anticipated net credit losses are not meaningful due to U.S. agency guarantees. |
| | | | September 30, 2018 | March 31, 2019 |
| | | Non-agency-sponsored mortgages | | Non-agency-sponsored mortgages |
| In millions of dollars | U.S. agency-
sponsored mortgages | Senior
interests | Subordinated
interests | U.S. agency-
sponsored mortgages | Senior
interests | Subordinated
interests |
| Discount rates | | |
| Discount rate | | |
| Adverse change of 10% | $ | (61 | ) | $ | — |
| $ | (1 | ) | $ | (14 | ) | $ | — |
| $ | — |
|
| Adverse change of 20% | (119 | ) | — |
| (2 | ) | (27 | ) | — |
| — |
|
| Constant prepayment rate | | |
| Adverse change of 10% | (32 | ) | — |
| — |
| (22 | ) | — |
| — |
|
| Adverse change of 20% | (63 | ) | — |
| — |
| (43 | ) | — |
| — |
|
| Anticipated net credit losses | | |
| Adverse change of 10% | NM |
| — |
| — |
| NM |
| — |
| — |
|
| Adverse change of 20% | NM |
| — |
| — |
| NM |
| — |
| — |
|
|
| | | | | | | | | |
| | December 31, 2018 |
| | | Non-agency-sponsored mortgages |
| In millions of dollars | U.S. agency-
sponsored mortgages | Senior
interests | Subordinated
interests |
| Discount rate | | | |
| Adverse change of 10% | $ | (16 | ) | $ | — |
| $ | — |
|
| Adverse change of 20% | (32 | ) | — |
| — |
|
| Constant prepayment rate | | | |
| Adverse change of 10% | (21 | ) | — |
| — |
|
| Adverse change of 20% | (41 | ) | — |
| — |
|
| Anticipated net credit losses | | | |
| Adverse change of 10% | NM |
| — |
| — |
|
| Adverse change of 20% | NM |
| — |
| — |
|
|
| | | | | | | | | |
| | December 31, 2017 |
| | | Non-agency-sponsored mortgages |
| In millions of dollars | U.S. agency-
sponsored mortgages | Senior
interests | Subordinated
interests |
| Discount rates | | | |
| Adverse change of 10% | $ | (44 | ) | $ | (2 | ) | $ | (3 | ) |
| Adverse change of 20% | (85 | ) | (4 | ) | (5 | ) |
| Constant prepayment rate | | | |
| Adverse change of 10% | (41 | ) | (1 | ) | (1 | ) |
| Adverse change of 20% | (84 | ) | (1 | ) | (2 | ) |
| Anticipated net credit losses | | | |
| Adverse change of 10% | NM |
| (3 | ) | — |
|
| Adverse change of 20% | NM |
| (7 | ) | — |
|
| |
| NM | Anticipated net credit losses are not meaningful due to U.S. agency guarantees. |
The following table includes information about loan delinquencies and liquidation losses for assets held in non-consolidated, non-agency-sponsored securitization entities:
|
| | | | | | | | | | | | | | | | | | |
| | | | | | Three Months Ended March 31, |
| | Securitized assets | 90 days past due | Liquidation losses |
| In billions of dollars | Mar. 31, 2019 | Dec. 31, 2018 | Mar. 31, 2019 | Dec. 31, 2018 | 2019 | 2018 |
| Securitized assets | | | | | | |
| Residential mortgage | $ | 5.4 |
| $ | 5.2 |
| $ | 0.4 |
| $ | 0.4 |
| $ | — |
| $ | — |
|
| Commercial and other | 14.5 |
| 13.1 |
| — |
| — |
| — |
| — |
|
| Total | $ | 19.9 |
| $ | 18.3 |
| $ | 0.4 |
| $ | 0.4 |
| $ | — |
| $ | — |
|
Mortgage Servicing Rights (MSRs)
The fair value of Citi’s capitalized MSRs was $618$551 million and $553$587 million at September 30,March 31, 2019 and 2018, and 2017, respectively. The MSRs correspond to principal loan balances of $62$61 billion and $68$64 billion as of September 30,March 31, 2019 and 2018, and 2017, respectively. The following tables summarizetable summarizes the changes in capitalized MSRs:
| | | | Three Months Ended September 30, | | | | | |
| In millions of dollars | 2018 | 2017 | 2019 | 2018 |
| Balance, as of June 30 | $ | 596 |
| $ | 560 |
| |
| Balance, beginning of year | | $ | 584 |
| $ | 558 |
|
| Originations | 14 |
| 19 |
| 12 |
| 17 |
|
| Changes in fair value of MSRs due to changes in inputs and assumptions | 25 |
| (6 | ) | (27 | ) | 46 |
|
Other changes(1) | (17 | ) | (20 | ) | (18 | ) | (17 | ) |
| Sale of MSRs | — |
| — |
| — |
| (17 | ) |
| Balance, as of September 30 | $ | 618 |
| $ | 553 |
| |
| Balance, as of March 31 | | $ | 551 |
| $ | 587 |
|
|
| | | | | | |
| | Nine Months Ended September 30, |
| In millions of dollars | 2018 | 2017 |
| Balance, beginning of year | $ | 558 |
| $ | 1,564 |
|
| Originations | 46 |
| 75 |
|
| Changes in fair value of MSRs due to changes in inputs and assumptions | 82 |
| 50 |
|
Other changes(1) | (50 | ) | (90 | ) |
Sale of MSRs(2) | (18 | ) | (1,046 | ) |
| Balance, as of September 30 | $ | 618 |
| $ | 553 |
|
| |
| (1) | Represents changes due to customer payments and passage of time. |
| |
(2) | See Note 2 to the Consolidated Financial Statements in Citi’s 2017 Annual Report on Form 10-K for more information on the exit of the U.S. mortgage servicing operations and sale of MSRs in 2017. |
The fair value of the MSRs is primarily affected by changes in prepayments of mortgages that result from shifts in mortgage interest rates. Specifically, higher interest rates tend to lead to declining prepayments, which causes the fair value of the MSRs to increase. In managing this risk, Citigroup economically hedges a significant portion of the value of its MSRs through the use of interest rate derivative contracts, forward purchase and sale commitments of mortgage-backed securities and purchased securities, all classified as Trading account assets.
The Company receives fees during the course of servicing previously securitized mortgages. The amounts of these fees were as follows:
|
| | | | | | |
| In millions of dollars | 2019 | 2018 |
| Servicing fees | $ | 41 |
| $ | 46 |
|
| Late fees | 2 |
| 1 |
|
| Ancillary fees | 1 |
| 3 |
|
| Total MSR fees | $ | 44 |
| $ | 50 |
|
|
| | | | | | | | | | | | |
| | Three Months Ended September 30, | Nine Months Ended September 30, |
| In millions of dollars | 2018 | 2017 | 2018 | 2017 |
| Servicing fees | $ | 41 |
| $ | 65 |
| $ | 130 |
| $ | 236 |
|
| Late fees | 1 |
| 2 |
| 3 |
| 8 |
|
| Ancillary fees | 1 |
| 3 |
| 7 |
| 11 |
|
| Total MSR fees | $ | 43 |
| $ | 70 |
| $ | 140 |
| $ | 255 |
|
In the Consolidated Statement of Income these fees are primarily classified as Commissions and fees, and changes in MSR fair values are classified as Other revenue.
Re-securitizations
The Company engages in re-securitization transactions in which debt securities are transferred to a VIE in exchange for new beneficial interests. Citi did not transfer non-agency (private-label)(private label) securities to re-securitization entities during the threequarters ended March 31, 2019 and nine months ended September 30, 2018 and 2017.2018. These securities are backed by either residential or commercial mortgages and are often structured on behalf of clients.
As of September 30,March 31, 2019, Citi held no retained interests in private label re-securitization transactions structured by Citi. As of December 31, 2018, the fair value of Citi-retained interests in private-labelprivate label re-securitization transactions structured by Citi totaled approximately $33 million (all related to re-securitization transactions executed prior to 2016), which has been recorded in Trading account assets. Of this amount, substantially all was related to subordinated beneficial interests. As of December 31, 2017, the fair value of Citi-retained interests in private-label re-securitization transactions structured by Citi totaled approximately $79$16 million (all related to re-securitization transactions executed prior to 2016). Of this amount, substantially all was related to subordinated beneficial interests. The original par value of private-label
private label re-securitization transactions in which Citi holdsheld a retained interest as of September 30, 2018 and December 31, 20172018 was approximately $316 million and $887 million, respectively.$271 million.
The Company also re-securitizes U.S. government-agency guaranteed mortgage-backed (agency) securities. During the threequarters ended March 31, 2019 and nine months ended September 30, 2018, Citi transferred agency securities with a fair value of approximately $6.8$7.6 billion and $20.4$7.0 billion, respectively, to re-securitization entities compared to approximately $9.9 billion and $20.0 billion for the three and nine months ended September 30, 2017, respectively.entities.
As of September 30, 2018,March 31, 2019, the fair value of Citi-retained interests in agency re-securitization transactions structured by Citi totaled approximately $2.4$2.8 billion (including $1.3$1.1 billion related to re-securitization transactions executed in 2018)2019) compared to $2.1$2.5 billion as of December 31, 20172018 (including $854 million$1.4 billion related to re-securitization transactions executed in 2017)2018), which is recorded in Trading account assets. The original fair value of agency re-securitization transactions in which Citi holds a retained interest as of September 30, 2018March 31, 2019 and December 31, 20172018 was approximately $67.2$70.7 billion and $68.3$70.9 billion, respectively.
As of September 30, 2018March 31, 2019 and December 31, 2017,2018, the Company did not consolidate any private-labelprivate label or agency re-securitization entities.
Citi-Administered Asset-Backed Commercial Paper Conduits
At September 30, 2018March 31, 2019 and December 31, 2017,2018, the commercial paper conduits administered by Citi had approximately $17.4$17.5 billion and $19.3$18.8 billion of purchased assets outstanding, respectively, and had incremental funding commitments with clients of approximately $16.3$14.9 billion and $14.5$14.0 billion, respectively.
Substantially all of the funding of the conduits is in the form of short-term commercial paper. At September 30, 2018March 31, 2019 and December 31, 2017,2018, the weighted average remaining lives of the commercial paper issued by the conduits were approximately 5552 and 5153 days, respectively.
The primary credit enhancement provided to the conduit investors is in the form of transaction-specific credit enhancements described above. In addition to the transaction-specific credit enhancements, the conduits, other than the government guaranteed loan conduit, have obtained a letter of credit from the Company, which is equal to at least 8% to 10% of the conduit’s assets with a minimum of $200 million. The letters of credit provided by the Company to the conduits total approximately $1.6 billion and $1.7 billion as of September 30, 2018March 31, 2019 and December 31, 2017.2018, respectively. The net result across multi-seller conduits administered by the Company is that, in the event that defaulted assets exceed the transaction-specific credit enhancements described above, any losses in each conduit are allocated first to the Company and then to the commercial paper investors.
At September 30, 2018March 31, 2019 and December 31, 2017,2018, the Company owned $5.4$4.4 billion and $9.3$5.5 billion, respectively, of the commercial paper issued by its administered conduits. The Company's investments were not driven by market illiquidity and the Company is not obligated under any agreement to purchase the commercial paper issued by the conduits.
Collateralized Loan Obligations (CLOs)
There were no new securitizations during the quarters ended March 31, 2019 and 2018. The following tables summarizetable summarizes selected cash flow information and retained interests related to Citigroup CLOs:
|
| | | | | | |
| In millions of dollars | Mar. 31, 2019 | Dec. 31, 2018 |
| Carrying value of retained interests | $ | 2,766 |
| $ | 3,142 |
|
|
| | | | | | |
| | Three Months Ended September 30, |
| In billions of dollars | 2018 | 2017 |
| Proceeds from new securitizations | $ | 0.4 |
| $ | 1.1 |
|
All of Citi’s retained interests were held-to-maturity securities as of March 31, 2019 and December 31, 2018. |
| | | | | | |
| | Nine Months Ended September 30, |
| In billions of dollars | 2018 | 2017 |
| Proceeds from new securitizations | $ | 4.0 |
| $ | 2.5 |
|
| Cash flows received on retained interests and other cash flows | 0.1 |
| 0.1 |
|
|
| | | | | | |
| In millions of dollars | Sept. 30, 2018 | Dec. 31, 2017 |
| Carrying value of retained interests | $ | 3,461 |
| $ | 4,079 |
|
Asset-Based Financing
The primary types of Citi’s asset-based financings, total assets of the unconsolidated VIEs with significant involvement and Citi’s maximum exposure to loss are shown below. For Citi to realize the maximum loss, the VIE (borrower) would have to default with no recovery from the assets held by the VIE.
| | | | September 30, 2018 | March 31, 2019 |
| In millions of dollars | Total
unconsolidated
VIE assets | Maximum
exposure to
unconsolidated VIEs | Total
unconsolidated
VIE assets | Maximum
exposure to
unconsolidated VIEs |
| Type | | |
| Commercial and other real estate | $ | 18,098 |
| $ | 6,949 |
| $ | 25,189 |
| $ | 6,530 |
|
| Corporate loans | 6,815 |
| 5,764 |
| 7,438 |
| 7,277 |
|
| Hedge funds and equities | 416 |
| 54 |
| 444 |
| 53 |
|
| Airplanes, ships and other assets | 38,849 |
| 17,108 |
| 72,082 |
| 20,308 |
|
| Total | $ | 64,178 |
| $ | 29,875 |
| $ | 105,153 |
| $ | 34,168 |
|
|
| | | | | | |
| | December 31, 2018 |
| In millions of dollars | Total
unconsolidated
VIE assets | Maximum
exposure to
unconsolidated VIEs |
| Type | | |
| Commercial and other real estate | $ | 23,918 |
| $ | 6,928 |
|
| Corporate loans | 6,973 |
| 5,744 |
|
| Hedge funds and equities | 388 |
| 53 |
|
| Airplanes, ships and other assets | 67,526 |
| 19,387 |
|
| Total | $ | 98,805 |
| $ | 32,112 |
|
|
| | | | | | |
| | December 31, 2017 |
| In millions of dollars | Total
unconsolidated
VIE assets | Maximum
exposure to
unconsolidated VIEs |
| Type | | |
| Commercial and other real estate | $ | 15,370 |
| $ | 5,445 |
|
| Corporate loans | 4,725 |
| 3,587 |
|
| Hedge funds and equities | 542 |
| 58 |
|
| Airplanes, ships and other assets | 39,202 |
| 16,849 |
|
| Total | $ | 59,839 |
| $ | 25,939 |
|
Municipal Securities Tender Option Bond (TOB) Trusts
At September 30, 2018March 31, 2019 and December 31, 2017,2018, none of the municipal bonds owned by non-customer TOB trusts were subject to a credit guarantee provided by the Company.
At September 30, 2018March 31, 2019 and December 31, 2017,2018, liquidity agreements provided with respect to customer TOB trusts totaled $4.1$4.3 billion and $3.2 billion, respectively, of which $2.2 billion and $2.0$2.3 billion, respectively, were offset by reimbursement agreements. For the remaining exposure related to TOB transactions, where the residual owned by the customer was at least 25% of the bond value at the inception of the transaction, no reimbursement agreement was executed.
The Company also provides other liquidity agreements or letters of credit to customer-sponsored municipal investment funds, which are not variable interest entities, and municipality-related issuers that totaled $6.1 billion as of September 30, 2018March 31, 2019 and December 31, 2017.2018. These liquidity agreements and letters of credit are offset by reimbursement agreements with various term-out provisions.
The proceeds from new securitizations related to the Company’s client intermediation transactions for the three and nine months ended September 30, 2018 totaled approximately $0.2 billion and $0.7 billion, respectively, compared to $0.2 billion and $0.9 billion for the three and nine months ended September 30, 2017, respectively.
19. DERIVATIVES ACTIVITIES
As of January 1, 2018, Citigroup early adopted ASU 2017-12, Targeted Improvements to Accounting for Hedge Activities. This standard primarily impacts Citi’s accounting for derivatives designated as cash flow hedges and fair value hedges. Refer to the respective sections below for details.
In the ordinary course of business, Citigroup enters into various types of derivative transactions. All derivatives are recorded in Trading account assets/Trading account liabilities on the Consolidated Balance Sheet. For additional information regarding Citi’s use of and accounting for derivatives, see Note 22 to the Consolidated Financial Statements in Citi’s 20172018 Annual Report on Form 10-K.
Information pertaining to Citigroup’s derivative activities, based on notional amounts, is presented in the table below. Derivative notional amounts are reference amounts from which contractual payments are derived and do not represent a complete measure of Citi’s exposure to derivative transactions. Rather, Citi’s derivative exposure arises primarily from market fluctuations (i.e., market risk), counterparty failure (i.e., credit risk) and/or periods of high volatility or financial stress (i.e., liquidity risk), as well as any market valuation adjustments that may be required on the transactions. Moreover, notional amounts do not reflect the netting of offsetting trades. For example, if Citi enters into a receive-fixed interest rate swap with $100 million notional, and offsets this risk with an identical but opposite pay-fixed position with a different counterparty, $200 million in derivative notionals is reported, although these offsetting positions may result in de minimis overall market risk. In addition, aggregate derivative notional amounts can fluctuate from period to period in the normal course of business based on Citi’s market share, levels of client activity and other factors.
Derivative Notionals
|
| | | | | | | | | | | | |
| | Hedging instruments under
ASC 815 | Trading derivative instruments |
| In millions of dollars | March 31,
2019 | December 31,
2018 | March 31,
2019 | December 31,
2018 |
| Interest rate contracts | | | | |
| Swaps | $ | 284,066 |
| $ | 273,636 |
| $ | 19,877,888 |
| $ | 18,138,686 |
|
| Futures and forwards | — |
| — |
| 6,301,489 |
| 4,632,257 |
|
| Written options | — |
| — |
| 3,014,698 |
| 3,018,469 |
|
| Purchased options | — |
| — |
| 2,625,618 |
| 2,532,479 |
|
| Total interest rate contract notionals | $ | 284,066 |
| $ | 273,636 |
| $ | 31,819,693 |
| $ | 28,321,891 |
|
| Foreign exchange contracts | | | | |
| Swaps | $ | 59,696 |
| $ | 57,153 |
| $ | 7,004,203 |
| $ | 6,738,158 |
|
| Futures, forwards and spot | 39,885 |
| 41,410 |
| 5,767,521 |
| 5,115,504 |
|
| Written options | 1,369 |
| 1,726 |
| 1,749,838 |
| 1,566,717 |
|
| Purchased options | 1,699 |
| 2,104 |
| 1,744,873 |
| 1,543,516 |
|
| Total foreign exchange contract notionals | $ | 102,649 |
| $ | 102,393 |
| $ | 16,266,435 |
| $ | 14,963,895 |
|
| Equity contracts | | | | |
| Swaps | $ | — |
| $ | — |
| $ | 216,741 |
| $ | 217,580 |
|
| Futures and forwards | — |
| — |
| 61,707 |
| 52,053 |
|
| Written options | — |
| — |
| 464,551 |
| 454,675 |
|
| Purchased options | — |
| — |
| 345,934 |
| 341,018 |
|
| Total equity contract notionals | $ | — |
| $ | — |
| $ | 1,088,933 |
| $ | 1,065,326 |
|
| Commodity and other contracts | | | | |
| Swaps | $ | — |
| $ | — |
| $ | 83,460 |
| $ | 79,133 |
|
| Futures and forwards | 831 |
| 802 |
| 153,109 |
| 146,647 |
|
| Written options | — |
| — |
| 68,930 |
| 62,629 |
|
| Purchased options | — |
| — |
| 68,302 |
| 61,298 |
|
| Total commodity and other contract notionals | $ | 831 |
| $ | 802 |
| $ | 373,801 |
| $ | 349,707 |
|
Credit derivatives(1) | | | | |
| Protection sold | $ | — |
| $ | — |
| $ | 701,018 |
| $ | 724,939 |
|
| Protection purchased | — |
| — |
| 757,539 |
| 795,649 |
|
| Total credit derivatives | $ | — |
| $ | — |
| $ | 1,458,557 |
| $ | 1,520,588 |
|
| Total derivative notionals | $ | 387,546 |
| $ | 376,831 |
| $ | 51,007,419 |
| $ | 46,221,407 |
|
|
| | | | | | | | | | | | |
| | Hedging instruments under
ASC 815 | Trading derivative instruments |
| In millions of dollars | September 30,
2018 | December 31,
2017 | September 30,
2018 | December 31,
2017 |
| Interest rate contracts | | | | |
| Swaps | $ | 246,079 |
| $ | 189,779 |
| $ | 19,759,439 |
| $ | 18,754,219 |
|
| Futures and forwards | — |
| — |
| 8,297,965 |
| 6,460,539 |
|
| Written options | — |
| — |
| 3,857,773 |
| 3,516,131 |
|
| Purchased options | — |
| — |
| 3,236,924 |
| 3,234,025 |
|
| Total interest rate contract notionals | $ | 246,079 |
| $ | 189,779 |
| $ | 35,152,101 |
| $ | 31,964,914 |
|
| Foreign exchange contracts | | | | |
| Swaps | $ | 54,502 |
| $ | 37,162 |
| $ | 7,004,521 |
| $ | 5,576,357 |
|
| Futures, forwards and spot | 37,769 |
| 33,103 |
| 5,711,577 |
| 3,097,700 |
|
| Written options | 2,497 |
| 3,951 |
| 1,727,916 |
| 1,127,728 |
|
| Purchased options | 2,934 |
| 6,427 |
| 1,695,392 |
| 1,148,686 |
|
| Total foreign exchange contract notionals | $ | 97,702 |
| $ | 80,643 |
| $ | 16,139,406 |
| $ | 10,950,471 |
|
| Equity contracts | | | | |
| Swaps | $ | — |
| $ | — |
| $ | 245,167 |
| $ | 215,834 |
|
| Futures and forwards | — |
| — |
| 70,526 |
| 72,616 |
|
| Written options | — |
| — |
| 436,032 |
| 389,961 |
|
| Purchased options | — |
| — |
| 333,448 |
| 328,154 |
|
| Total equity contract notionals | $ | — |
| $ | — |
| $ | 1,085,173 |
| $ | 1,006,565 |
|
| Commodity and other contracts | | | | |
| Swaps | $ | — |
| $ | — |
| $ | 118,699 |
| $ | 82,039 |
|
| Futures and forwards | 397 |
| 23 |
| 164,427 |
| 153,248 |
|
| Written options | — |
| — |
| 72,021 |
| 62,045 |
|
| Purchased options | — |
| — |
| 69,862 |
| 60,526 |
|
| Total commodity and other contract notionals | $ | 397 |
| $ | 23 |
| $ | 425,009 |
| $ | 357,858 |
|
Credit derivatives(1) | | | | |
| Protection sold | $ | — |
| $ | — |
| $ | 723,060 |
| $ | 735,142 |
|
| Protection purchased | — |
| — |
| 793,792 |
| 777,713 |
|
| Total credit derivatives | $ | — |
| $ | — |
| $ | 1,516,852 |
| $ | 1,512,855 |
|
| Total derivative notionals | $ | 344,178 |
| $ | 270,445 |
| $ | 54,318,541 |
| $ | 45,792,663 |
|
| |
| (1) | Credit derivatives are arrangements designed to allow one party (protection buyer) to transfer the credit risk of a “reference asset” to another party (protection seller). These arrangements allow a protection seller to assume the credit risk associated with the reference asset without directly purchasing that asset. The Company enters into credit derivative positions for purposes such as risk management, yield enhancement, reduction of credit concentrations and diversification of overall risk. |
The following tables present the gross and net fair values of the Company’s derivative transactions and the related offsetting amounts as of September 30, 2018March 31, 2019 and December 31, 2017.2018. Gross positive fair values are offset against gross negative fair values by counterparty, pursuant to enforceable master netting agreements. Under ASC 815-10-45, payables and receivables in respect of cash collateral received from or paid to a given counterparty pursuant to a credit support annex are included in the offsetting amount, if a legal opinion supporting the enforceability of netting and collateral rights has been obtained. GAAP does not permit similar offsetting for security collateral.
In addition, the following tables reflect rule changes adopted by clearing organizations that require or allow entities to treat certain derivative assets, liabilities and the related variation margin as settlement of the related derivative fair values for legal and accounting purposes, as opposed to presenting gross derivative assets and liabilities that are subject to collateral, whereby the counterparties would record a related collateral payable or receivable. As a result, the tables reflect a reduction of approximately $110$120 billion and $100 billion as of September 30, 2018March 31, 2019 and December 31, 2017,2018, respectively, of derivative assets and derivative liabilities that previously would have been reported on a gross basis, but are now settled and not subject to collateral. The tables also present amounts that are not permitted to be offset, such as security collateral or cash collateral posted at third-party custodians, but which would be eligible for offsetting to the extent that an event of default occurred and a legal opinion supporting enforceability of the netting and collateral rights has been obtained.
Derivative Mark-to-Market (MTM) Receivables/Payables
| | | In millions of dollars at September 30, 2018 | Derivatives classified in
Trading account assets/liabilities(1)(2) | |
| In millions of dollars at March 31, 2019 | | Derivatives classified in
Trading account assets/liabilities(1)(2) |
| Derivatives instruments designated as ASC 815 hedges | Assets | Liabilities | Assets | Liabilities |
| Over-the-counter | $ | 1,411 |
| $ | 81 |
| $ | 283 |
| $ | 128 |
|
| Cleared | 137 |
| 575 |
| 1,241 |
| 80 |
|
| Interest rate contracts | $ | 1,548 |
| $ | 656 |
| $ | 1,524 |
| $ | 208 |
|
| Over-the-counter | $ | 1,568 |
| $ | 718 |
| $ | 1,211 |
| $ | 834 |
|
| Cleared | | — |
| 3 |
|
| Foreign exchange contracts | $ | 1,568 |
| $ | 718 |
| $ | 1,211 |
| $ | 837 |
|
| Total derivatives instruments designated as ASC 815 hedges | $ | 3,116 |
| $ | 1,374 |
| $ | 2,735 |
| $ | 1,045 |
|
| Derivatives instruments not designated as ASC 815 hedges | | |
| Over-the-counter | $ | 155,901 |
| $ | 136,989 |
| $ | 170,941 |
| $ | 137,554 |
|
| Cleared | 8,262 |
| 10,062 |
| 13,534 |
| 29,063 |
|
| Exchange traded | 130 |
| 136 |
| 124 |
| 89 |
|
| Interest rate contracts | $ | 164,293 |
| $ | 147,187 |
| $ | 184,599 |
| $ | 166,706 |
|
| Over-the-counter | $ | 169,989 |
| $ | 164,571 |
| $ | 131,291 |
| $ | 129,524 |
|
| Cleared | 3,326 |
| 3,360 |
| 1,821 |
| 1,691 |
|
| Exchange traded | 88 |
| 236 |
| 43 |
| 56 |
|
| Foreign exchange contracts | $ | 173,403 |
| $ | 168,167 |
| $ | 133,155 |
| $ | 131,271 |
|
| Over-the-counter | $ | 19,891 |
| $ | 24,766 |
| $ | 17,049 |
| $ | 19,203 |
|
| Cleared | 10 |
| 9 |
| 4 |
| 54 |
|
| Exchange traded | 10,143 |
| 10,354 |
| 8,730 |
| 12,371 |
|
| Equity contracts | $ | 30,044 |
| $ | 35,129 |
| $ | 25,783 |
| $ | 31,628 |
|
| Over-the-counter | $ | 22,449 |
| $ | 25,024 |
| $ | 14,399 |
| $ | 17,249 |
|
| Exchange traded | 826 |
| 756 |
| 581 |
| 429 |
|
| Commodity and other contracts | $ | 23,275 |
| $ | 25,780 |
| $ | 14,980 |
| $ | 17,678 |
|
| Over-the-counter | $ | 4,240 |
| $ | 5,912 |
| $ | 3,786 |
| $ | 6,906 |
|
| Cleared | 7,326 |
| 5,781 |
| 6,898 |
| 4,579 |
|
| Credit derivatives | $ | 11,566 |
| $ | 11,693 |
| $ | 10,684 |
| $ | 11,485 |
|
| Total derivatives instruments not designated as ASC 815 hedges | $ | 402,581 |
| $ | 387,956 |
| $ | 369,201 |
| $ | 358,768 |
|
| Total derivatives | $ | 405,697 |
| $ | 389,330 |
| $ | 371,936 |
| $ | 359,813 |
|
Cash collateral paid/received(3) | $ | 10,759 |
| $ | 13,676 |
| $ | 11,349 |
| $ | 13,886 |
|
Less: Netting agreements(4) | (322,565 | ) | (322,565 | ) | (292,121 | ) | (292,121 | ) |
Less: Netting cash collateral received/paid(5) | (37,678 | ) | (30,701 | ) | (39,750 | ) | (33,190 | ) |
Net receivables/payables included on the Consolidated Balance Sheet(6) | $ | 56,213 |
| $ | 49,740 |
| $ | 51,414 |
| $ | 48,388 |
|
| Additional amounts subject to an enforceable master netting agreement, but not offset on the Consolidated Balance Sheet | | |
| Less: Cash collateral received/paid | $ | (739 | ) | $ | (83 | ) | $ | (607 | ) | $ | (88 | ) |
| Less: Non-cash collateral received/paid | (12,389 | ) | (11,376 | ) | (11,393 | ) | (15,144 | ) |
Total net receivables/payables(6) | $ | 43,085 |
| $ | 38,281 |
| $ | 39,414 |
| $ | 33,156 |
|
| |
| (1) | The derivatives fair values are also presented in Note 20 to the Consolidated Financial Statements. |
| |
| (2) | Over-the-counter (OTC) derivatives are derivatives executed and settled bilaterally with counterparties without the use of an organized exchange or central clearing house. Cleared derivatives include derivatives executed bilaterally with a counterparty in the OTC market, but then novated to a central clearing house, whereby the central clearing house becomes the counterparty to both of the original counterparties. Exchange-traded derivatives include derivatives executed directly on an organized exchange that provides pre-trade price transparency. |
| |
| (3) | Reflects the net amount of the $41,460$44,539 million and $51,354$53,636 million of gross cash collateral paid and received, respectively. Of the gross cash collateral paid, $30,701$33,190 million was used to offset trading derivative liabilities and, ofliabilities. Of the gross cash collateral received, $37,678$39,750 million was used to offset trading derivative assets. |
| |
| (4) | Represents the netting of derivative receivable and payable balances with the same counterparty under enforceable netting agreements. Approximately $304$283 billion, $9$0 billion and $10$9 billion of the netting against trading account asset/liability balances is attributable to each of the OTC, cleared and exchange-traded derivatives, respectively. |
| |
| (5) | Represents the netting of cash collateral paid and received by counterparty under enforceable credit support agreements. Substantially all cash collateral received and paid is netted against OTC derivative assets and liabilities, respectively. |
| |
| (6) | The net receivables/payables include approximately $6$5 billion of derivative asset and $7$4 billion of derivative liability fair values not subject to enforceable master netting agreements, respectively. |
| | | In millions of dollars at December 31, 2017 | Derivatives classified in
Trading account assets/liabilities(1)(2) | |
| In millions of dollars at December 31, 2018 | | Derivatives classified in
Trading account assets/liabilities(1)(2) |
| Derivatives instruments designated as ASC 815 hedges | Assets | Liabilities | Assets | Liabilities |
| Over-the-counter | $ | 1,969 |
| $ | 134 |
| $ | 1,631 |
| $ | 172 |
|
| Cleared | 110 |
| 92 |
| 238 |
| 53 |
|
| Interest rate contracts | $ | 2,079 |
| $ | 226 |
| $ | 1,869 |
| $ | 225 |
|
| Over-the-counter | $ | 1,143 |
| $ | 1,150 |
| $ | 1,402 |
| $ | 736 |
|
| Cleared | | — |
| 4 |
|
| Foreign exchange contracts | $ | 1,143 |
| $ | 1,150 |
| $ | 1,402 |
| $ | 740 |
|
| Total derivatives instruments designated as ASC 815 hedges | $ | 3,222 |
| $ | 1,376 |
| $ | 3,271 |
| $ | 965 |
|
| Derivatives instruments not designated as ASC 815 hedges | | |
| Over-the-counter | $ | 195,677 |
| $ | 173,937 |
| $ | 161,183 |
| $ | 146,909 |
|
| Cleared | 7,129 |
| 10,381 |
| 8,489 |
| 7,594 |
|
| Exchange traded | 102 |
| 95 |
| 91 |
| 99 |
|
| Interest rate contracts | $ | 202,908 |
| $ | 184,413 |
| $ | 169,763 |
| $ | 154,602 |
|
| Over-the-counter | $ | 119,092 |
| $ | 117,473 |
| $ | 159,099 |
| $ | 156,904 |
|
| Cleared | 1,690 |
| 2,028 |
| 1,900 |
| 1,671 |
|
| Exchange traded | 34 |
| 121 |
| 53 |
| 40 |
|
| Foreign exchange contracts | $ | 120,816 |
| $ | 119,622 |
| $ | 161,052 |
| $ | 158,615 |
|
| Over-the-counter | $ | 17,221 |
| $ | 21,201 |
| $ | 18,253 |
| $ | 21,527 |
|
| Cleared | 21 |
| 25 |
| 17 |
| 32 |
|
| Exchange traded | 9,736 |
| 10,147 |
| 11,623 |
| 12,249 |
|
| Equity contracts | $ | 26,978 |
| $ | 31,373 |
| $ | 29,893 |
| $ | 33,808 |
|
| Over-the-counter | $ | 13,499 |
| $ | 16,362 |
| $ | 16,661 |
| $ | 19,894 |
|
| Exchange traded | 604 |
| 665 |
| 894 |
| 795 |
|
| Commodity and other contracts | $ | 14,103 |
| $ | 17,027 |
| $ | 17,555 |
| $ | 20,689 |
|
| Over-the-counter | $ | 12,972 |
| $ | 12,958 |
| $ | 6,967 |
| $ | 6,155 |
|
| Cleared | 7,562 |
| 8,575 |
| 3,798 |
| 4,196 |
|
| Credit derivatives | $ | 20,534 |
| $ | 21,533 |
| $ | 10,765 |
| $ | 10,351 |
|
| Total derivatives instruments not designated as ASC 815 hedges | $ | 385,339 |
| $ | 373,968 |
| $ | 389,028 |
| $ | 378,065 |
|
| Total derivatives | $ | 388,561 |
| $ | 375,344 |
| $ | 392,299 |
| $ | 379,030 |
|
Cash collateral paid/received(3) | $ | 7,541 |
| $ | 14,308 |
| $ | 11,518 |
| $ | 13,906 |
|
Less: Netting agreements(4) | (306,401 | ) | (306,401 | ) | (311,089 | ) | (311,089 | ) |
Less: Netting cash collateral received/paid(5) | (38,532 | ) | (35,666 | ) | (38,608 | ) | (29,911 | ) |
Net receivables/payables included on the Consolidated Balance Sheet(6) | $ | 51,169 |
| $ | 47,585 |
| $ | 54,120 |
| $ | 51,936 |
|
| Additional amounts subject to an enforceable master netting agreement, but not offset on the Consolidated Balance Sheet | | |
| Less: Cash collateral received/paid | $ | (872 | ) | $ | (121 | ) | $ | (767 | ) | $ | (164 | ) |
| Less: Non-cash collateral received/paid | (12,739 | ) | (6,929 | ) | (13,509 | ) | (13,354 | ) |
Total net receivables/payables(6) | $ | 37,558 |
| $ | 40,535 |
| $ | 39,844 |
| $ | 38,418 |
|
| |
| (1) | The derivatives fair values are also presented in Note 20 to the Consolidated Financial Statements. Derivative mark-to-market receivables/payables previously reported within Other assets/Other liabilities have been reclassified to Trading account assets/Trading account liabilities to conform with the current-period presentation. |
| |
| (2) | Over-the-counter (OTC) derivatives are derivatives executed and settled bilaterally with counterparties without the use of an organized exchange or central clearing house. Cleared derivatives include derivatives executed bilaterally with a counterparty in the OTC market, but then novated to a central clearing house, whereby the central clearing house becomes the counterparty to both of the original counterparties. Exchange-traded derivatives include derivatives executed directly on an organized exchange that provides pre-trade price transparency. |
| |
| (3) | Reflects the net amount of the $43,207$41,429 million and $52,840$52,514 million of gross cash collateral paid and received, respectively. Of the gross cash collateral paid, $35,666$29,911 million was used to offset trading derivative liabilities and, ofliabilities. Of the gross cash collateral received, $38,532$38,608 million was used to offset trading derivative assets. |
| |
| (4) | Represents the netting of derivative receivable and payable balances with the same counterparty under enforceable netting agreements. Approximately $283$296 billion, $14$4 billion and $9$11 billion of the netting against trading account asset/liability balances is attributable to each of the OTC, cleared and exchange-traded derivatives, respectively. |
| |
| (5) | Represents the netting of cash collateral paid and received by counterparty under enforceable credit support agreements. Substantially all cash collateral received and paid is netted against OTC derivative assets and liabilities, respectively. |
| |
| (6) | The net receivables/payables include approximately $6$5 billion of derivative asset and $8$7 billion of derivative liability fair values not subject to enforceable master netting agreements, respectively. |
For the three and nine months ended September 30,March 31, 2019 and 2018, and 2017, the amounts recognized in Principal transactions in the Consolidated Statement of Income related to derivatives not designated in a qualifying hedging relationship, as well as the underlying non-derivative instruments, are presented in Note 6 to the Consolidated Financial Statements. Citigroup presents this disclosure by business classification, showing derivative gains and losses related to its trading activities together with gains and losses related to non-derivative instruments within the same trading portfolios, as this represents how these portfolios are risk managed.
The amounts recognized in Other revenue in the Consolidated Statement of Income related to derivatives not designated in a qualifying hedging relationship are shown below. The table below does not include any offsetting gains (losses) on the economically hedged items to the extent such amounts are also recorded in Other revenue.
|
| | | | | | |
| | Gains (losses) included in
Other revenue |
| Three Months Ended March 31, |
| In millions of dollars | 2019 | 2018 |
| Interest rate contracts | $ | 27 |
| $ | (28 | ) |
| Foreign exchange | (58 | ) | 527 |
|
| Total | $ | (31 | ) | $ | 499 |
|
|
| | | | | | | | | | | | |
| | Gains (losses) included in
Other revenue |
| Three Months Ended September 30, | Nine Months Ended September 30, |
| In millions of dollars | 2018 | 2017 | 2018 | 2017 |
| Interest rate contracts | $ | (22 | ) | $ | (5 | ) | $ | (65 | ) | $ | (72 | ) |
| Foreign exchange | 7 |
| 596 |
| (6 | ) | 1,897 |
|
| Credit derivatives | (200 | ) | (125 | ) | (271 | ) | (501 | ) |
| Total | $ | (215 | ) | $ | 466 |
| $ | (342 | ) | $ | 1,324 |
|
Fair Value Hedges
Hedging of Benchmark Interest Rate Risk
Citigroup’s fair value hedges are primarily hedges of fixed-rate long-term debt or assets, such as available-for-sale debt securities or loans.
For qualifying fair value hedges of interest rate risk, the changes in the fair value of the derivative and the change in the fair value of the hedged item attributable to the hedged risk, either total cash flows or benchmark onlybenchmark-only cash flows are presented within Interest revenue or Interest expense based on whether the hedged item is an asset or a liability. Prior
In the first quarter of 2019, Citigroup executed a last-of-layer hedge, which permits an entity to hedge the adoptioninterest rate risk of ASU 2017-12,a stated portion of a closed portfolio of pre-payable financial assets that are expected to remain outstanding for the designated tenor of the hedge. In accordance with ASC 815, an entity may exclude prepayment risk when measuring the change in fair value of the hedged item attributable to interest rate risk under the last-of-layer approach. Similar to other fair value hedges, where the hedged item is an asset, the fair value of the derivative washedged item attributable to interest rate risk will be presented in OtherInterest revenue or Principal transactions andalong with the difference between the changeschange in the hedged item andfair value of the derivative was defined as ineffectiveness.hedging instrument..
Hedging of Foreign Exchange Risk
Citigroup hedges the change in fair value attributable to foreign exchange rate movements in available-for-sale debt securities and long-term debt that are denominated in currencies other than the functional currency of the entity holding the securities or issuing the debt, which may be within or outside the U.S. The hedging instrument may be a forward foreign exchange contract or a cross-currency swap contract. Citigroup considers the premium associated with forward contracts (i.e., the differential between the spot and contractual forward rates) as the cost of hedging; this amount is excluded from the assessment of hedge effectiveness and reflected directly in earnings over the life of the hedge. Beginning January 1, 2018, Citi also excludes changes in cross-currency basis associated with cross-currency swaps from the assessment of hedge effectiveness and records it in Other comprehensive income.
Hedging of Commodity Price Risk
Citigroup hedges the change in fair value attributable to spot price movements in physical commodities inventory. The hedging instrument is a futures contract to sell the underlying commodity. In this hedge, the change in the value of the hedged inventory is reflected in earnings, which offsets the change in the fair value of the futures contract that is also reflected in earnings. Although the change in the fair value of the hedging instrument recorded in earnings includes changes in forward rates, Citigroup excludes the differential between the spot and the contractual forward rates under the futures contract from the assessment of hedge effectiveness and amortizes it directly into earnings over the life of the hedge.
The following table summarizes the gains (losses) on the Company’s fair value hedges:
| | | | Gains (losses) on fair value hedges(1) | Gains (losses) on fair value hedges(1) |
| | Three Months Ended September 30, | Nine Months Ended September 30, | Three Months Ended March 31, |
| | 2018 | 2017(3) | 2018 | 2017(3) | 2019 | 2018 |
| In millions of dollars | Other revenue | Net interest revenue | Other revenue | Other revenue | Net interest revenue | Other revenue | Other revenue | Net interest revenue | Other revenue | Net interest revenue |
| Gain (loss) on the derivatives in designated and qualifying fair value hedges | | | | | | | | |
| Interest rate hedges | $ | — |
| $ | (857 | ) | $ | (194 | ) | $ | — |
| $ | (497 | ) | $ | (570 | ) | $ | — |
| $ | 963 |
| $ | — |
| $ | 878 |
|
| Foreign exchange hedges | (158 | ) | — |
| (166 | ) | 341 |
| — |
| (803 | ) | 165 |
| — |
| 179 |
| — |
|
| Commodity hedges | (14 | ) | — |
| (11 | ) | (14 | ) | — |
| (20 | ) | 88 |
| — |
| (2 | ) | — |
|
| Total gain (loss) on the derivatives in designated and qualifying fair value hedges | $ | (172 | ) | $ | (857 | ) | $ | (371 | ) | $ | 327 |
| $ | (497 | ) | $ | (1,393 | ) | $ | 253 |
| $ | 963 |
| $ | 177 |
| $ | 878 |
|
| Gain (loss) on the hedged item in designated and qualifying fair value hedges | | | | | | | | |
| Interest rate hedges | $ | — |
| $ | 871 |
| $ | 189 |
| $ | — |
| $ | 525 |
| $ | 532 |
| $ | — |
| $ | (879 | ) | $ | — |
| $ | (866 | ) |
| Foreign exchange hedges | 132 |
| — |
| 144 |
| (464 | ) | — |
| 910 |
| (168 | ) | — |
| (249 | ) | — |
|
| Commodity hedges | 8 |
| — |
| 12 |
| 9 |
| — |
| 22 |
| (70 | ) | — |
| 1 |
| — |
|
| Total gain (loss) on the hedged item in designated and qualifying fair value hedges | $ | 140 |
| $ | 871 |
| $ | 345 |
| $ | (455 | ) | $ | 525 |
| $ | 1,464 |
| $ | (238 | ) | $ | (879 | ) | $ | (248 | ) | $ | (866 | ) |
| Net gain (loss) excluded from assessment of the effectiveness of fair value hedges | | | | | | | | |
| Interest rate hedges | $ | — |
| $ | — |
| $ | — |
| $ | — |
| $ | (5 | ) | $ | (7 | ) | |
Foreign exchange hedges(2) | 7 |
| — |
| (5 | ) | 63 |
| — |
| 75 |
| $ | (2 | ) | $ | — |
| $ | 23 |
| $ | — |
|
| Commodity hedges | (7 | ) | — |
| 1 |
| (5 | ) | — |
| 2 |
| (18 | ) | — |
| 1 |
| — |
|
| Total net gain (loss) excluded from assessment of the effectiveness of fair value hedges | $ | — |
| $ | — |
| $ | (4 | ) | $ | 58 |
| $ | (5 | ) | $ | 70 |
| $ | (20 | ) | $ | — |
| $ | 24 |
| $ | — |
|
| |
| (1) | Beginning January 1, 2018, gainGain (loss) amounts for interest rate risk hedges are included in Interest income/Interest expense, while the remaining amounts including the amounts for interest rate hedges prior to January 1, 2018 are included in Other revenue or Principal transactions on the Consolidated Statement of Income.. The accrued interest income on fair value hedges both prior to and after January 1, 2018 is recorded in Net interest revenue and is excluded from this table.
|
| |
| (2) | Amounts relate to the premium associated with forward contracts (differential between spot and contractual forward rates). These amounts which are excluded from the assessment of hedge effectiveness and are reflected directly in earnings. After January 1, 2018, amountsAmounts also include cross-currency basis, which is recognized in accumulated other comprehensive income.income and not reflected in the table above. The amount of cross-currency basis that was included in accumulated other comprehensive income was $15$24 million and $57$(5) million for the three and nine months ended September 30, 2018, respectively, none of which was recognized in earnings. |
| |
(3) | Hedge ineffectiveness recognized in earnings on designated and qualifying fair value hedges for the three months ended September 30, 2017 was $(5) million for interest rate hedgesMarch 31, 2019 and $(17) million for foreign exchange hedges, for a total of $(22) million. Hedge ineffectiveness recognized in earnings on designated and qualifying fair value hedges for the nine months ended September 30, 2017 was $(31) million for interest rate hedges and $32 million for foreign exchange hedges, for a total of $1 million.March 31, 2018, respectively. |
Cumulative Basis Adjustment
Upon electing to apply ASC 815 fair value hedge accounting, the carrying value of the hedged item is adjusted to reflect the cumulative impact of changes in the hedged risk. The hedge basis adjustment, whether arising from an active or de-designated hedge relationship, remains with the hedged item until the hedged item is derecognized from the balance sheet. The table below presents the carrying amount of Citi’s hedged assets and liabilities under qualifying fair value hedges at September 30,March 31, 2019 and December 31, 2018, along with the cumulative hedge basis adjustments included in the carrying value of those hedged assets and liabilities.
| | | In millions of dollars as of September 30, 2018 | |
| (In millions of dollars) | | (In millions of dollars) |
| Balance sheet line item in which hedged item is recorded | Carrying amount of hedged asset/ liability | Cumulative fair value hedging adjustment increasing (decreasing) the carrying amount | Carrying amount of hedged asset/ liability | Cumulative fair value hedging adjustment increasing (decreasing) the carrying amount |
| Active | De-designated | Active | De-designated |
| As of March 31, 2019 | | As of March 31, 2019 | |
Debt securities
AFS(1)
| | $ | 98,902 |
| $ | 302 |
| $ | 329 |
|
| Long-term debt | | 157,139 |
| 2,275 |
| 1,236 |
|
| As of December 31, 2018 | | As of December 31, 2018 | |
Debt securities AFS
| $ | 80,244 |
| $ | (326 | ) | $ | 421 |
| $ | 81,632 |
| $ | (196 | ) | $ | 295 |
|
| Long-term debt | 154,540 |
| (775 | ) | 1,218 |
| 149,054 |
| 1,211 |
| 869 |
|
| |
| (1) | These amounts include the cumulative basis adjustment ($46 million as of March 31, 2019) related to certain prepayable financial assets designated as the hedged item in a fair value hedge using the last-of-layer approach. The Company designated $2 billion as the hedged amount (from a closed portfolio of prepayable financial assets with a carrying value of $16.5 billion) in a last-of-layer hedging relationship. |
Cash Flow Hedges
Citigroup hedges the variability of forecasted cash flows due to changes in contractually specified rates associated with floating-rate assets/liabilities and other forecasted transactions. Variable cash flows from those liabilities are synthetically converted to fixed-rate cash flows by entering into receive-variable, pay-fixed interest rate swaps and receive-variable, pay-fixed forward-starting interest rate swaps. Variable cash flows associated with certain assets are synthetically converted to fixed-rate cash flows by entering into receive-fixed, pay-variable interest rate swaps. These cash flow hedging relationships use either regression analysis or dollar-offset ratio analysis to assess whether the hedging relationships are highly effective at inception and on an ongoing basis. Prior to the adoption of ASU 2017-12, Citigroup designated the risk being hedged as the risk of overall variability in the hedged cash flows for certain items.
With the adoption of ASU 2017-12, Citigroup hedges the variability from changes in a contractually specified rate and recognizes the entire change in fair value of the cash flow hedging instruments in AOCI. Prior to the adoption of ASU 2017-12, to the extent that these derivatives were not fully effective, changes in their fair values in excess of changes in the value of the hedged transactions were immediately included in Other revenue. With the adoption of ASU 2017-12, such amounts are no longer required to be immediately recognized in income, but instead the full change in the value of the hedging instrument is required to be recognized in AOCI, and then recognized in earnings in the same period that the cash flows impact earnings. The pretax change in AOCI from cash flow hedges is presented below:
|
| | | | | | | | | | | | | | | | | | |
| | Three Months Ended September 30, | Nine Months Ended September 30, |
| In millions of dollars | 2018 | 2017 | 2018 | 2017 |
| Amount of gain (loss) recognized in AOCI on derivative | | | | |
Interest rate contracts(1) | $ | (146 | ) | $ | (36 | ) | $ | (665 | ) | $ | 103 |
|
| Foreign exchange contracts | (3 | ) | (7 | ) | (4 | ) | (7 | ) |
| Total gain (loss) recognized in AOCI | $ | (149 | ) | $ | (43 | ) | $ | (669 | ) | $ | 96 |
|
| Amount of gain (loss) reclassified from AOCI to earnings | Other revenue | Net interest revenue | Other revenue | Other revenue | Net interest revenue | Other revenue |
Interest rate contracts(1) | $ | — |
| $ | (54 | ) | $ | (48 | ) | $ | — |
| $ | (142 | ) | $ | (94 | ) |
| Foreign exchange contracts | 2 |
| — |
| (7 | ) | (8 | ) | — |
| (8 | ) |
| Total gain (loss) reclassified from AOCI into earnings | $ | 2 |
| $ | (54 | ) | $ | (55 | ) | $ | (8 | ) | $ | (142 | ) | $ | (102 | ) |
| |
(1) | After January 1, 2018, all amounts reclassified into earnings for interest rate contracts are included in Interest income/Interest expense (Net interest revenue). For all other hedges, including interest rate hedges prior to January 1, 2018, the amounts reclassified to earnings are included primarily in Other revenue and Net interest revenue on the Consolidated Income Statement.
|
For cash flow hedges, the changesentire change in the fair value of the hedging derivative remainis recognized in AOCI on the Consolidated Balance Sheet and will be includedthen reclassified to earnings in the earnings of future periods to offset the variability ofsame period that the hedged cash flows when such cash flows affectimpact earnings. The net gain (loss) associated with cash flow hedges expected to be reclassified from AOCIwithin 12 months of September 30, 2018March 31, 2019 is approximately $475$334 million. The maximum length of time over which forecasted cash flows are hedged is 10 years.
The pretax change in AOCI from cash flow hedges is presented below. The after-tax impact of cash flow hedges on AOCI is shown in Note 17 to the Consolidated Financial Statements.
|
| | | | | | | | | | | | |
| | Three Months Ended March 31, |
| In millions of dollars | 2019 | 2018 |
| Amount of gain (loss) recognized in AOCI on derivative | | | |
Interest rate contracts(1) | $ | 254 | | $ | (322 | ) |
| Foreign exchange contracts | (8 | ) | 6 | |
| Total gain (loss) recognized in AOCI | $ | 246 | | $ | (316 | ) |
| Amount of gain (loss) reclassified from AOCI to earnings | Other revenue | Net interest revenue | Other revenue | Net interest revenue |
Interest rate contracts(1) | $ | — |
| $ | (130 | ) | $ | — |
| $ | (31 | ) |
| Foreign exchange contracts | (2 | ) |
| 2 |
| — |
|
| Total gain (loss) reclassified from AOCI into earnings | $ | (2 | ) | $ | (130 | ) | $ | 2 |
| $ | (31 | ) |
| Net pretax change in cash flow hedges included within AOCI | | $ | 378 |
| | $ | (287 | ) |
| |
| (1) | All amounts reclassified into earnings for interest rate contracts are included in Interest income/Interest expense (Net interest revenue). For all other hedges, the amounts reclassified to earnings are included primarily in Other revenue and Net interest revenue on the Consolidated Income Statement. |
Net Investment Hedges
The pretax gain (loss) recorded in the Foreign currency translation adjustment account within AOCI, related to net investment hedges, is $(46)$(164) million and $1,587$(491) million for the three and nine months ended September 30,March 31, 2019 and March 31, 2018, and $(245) million and $(1,993) million for the three and nine months ended September 30, 2017, respectively.
Credit Derivatives
The following tables summarize the key characteristics of Citi’s credit derivatives portfolio by counterparty and derivative form:
| | | | Fair values | Notionals | Fair values | Notionals |
| In millions of dollars at September 30, 2018 | Receivable(1) | Payable(2) | Protection
purchased | Protection
sold | |
| In millions of dollars at March 31, 2019 | | Receivable(1) | Payable(2) | Protection
purchased | Protection
sold |
| By industry/counterparty | | | | | | |
| Banks | $ | 5,366 |
| $ | 5,097 |
| $ | 222,802 |
| $ | 234,338 |
| $ | 4,855 |
| $ | 4,613 |
| $ | 202,581 |
| $ | 213,437 |
|
| Broker-dealers | 1,826 |
| 1,661 |
| 66,676 |
| 67,833 |
| 1,776 |
| 1,670 |
| 57,539 |
| 68,978 |
|
| Non-financial | 65 |
| 90 |
| 2,823 |
| 4,247 |
| 80 |
| 93 |
| 5,509 |
| 2,801 |
|
Insurance and other financial institutions | 4,309 |
| 4,845 |
| 501,491 |
| 416,642 |
| 3,973 |
| 5,109 |
| 491,910 |
| 415,802 |
|
| Total by industry/counterparty | $ | 11,566 |
| $ | 11,693 |
| $ | 793,792 |
| $ | 723,060 |
| $ | 10,684 |
| $ | 11,485 |
| $ | 757,539 |
| $ | 701,018 |
|
| By instrument | | | | | | |
| Credit default swaps and options | $ | 10,997 |
| $ | 11,168 |
| $ | 771,239 |
| $ | 712,451 |
| $ | 10,173 |
| $ | 10,514 |
| $ | 733,530 |
| $ | 690,880 |
|
| Total return swaps and other | 569 |
| 525 |
| 22,553 |
| 10,609 |
| 511 |
| 971 |
| 24,009 |
| 10,138 |
|
| Total by instrument | $ | 11,566 |
| $ | 11,693 |
| $ | 793,792 |
| $ | 723,060 |
| $ | 10,684 |
| $ | 11,485 |
| $ | 757,539 |
| $ | 701,018 |
|
| By rating | | | | | | |
| Investment grade | $ | 5,180 |
| $ | 5,014 |
| $ | 616,595 |
| $ | 552,452 |
| $ | 4,788 |
| $ | 5,032 |
| $ | 597,069 |
| $ | 544,124 |
|
| Non-investment grade | 6,386 |
| 6,679 |
| 177,197 |
| 170,608 |
| 5,896 |
| 6,453 |
| 160,470 |
| 156,894 |
|
| Total by rating | $ | 11,566 |
| $ | 11,693 |
| $ | 793,792 |
| $ | 723,060 |
| $ | 10,684 |
| $ | 11,485 |
| $ | 757,539 |
| $ | 701,018 |
|
| By maturity | | | | | | |
| Within 1 year | $ | 1,442 |
| $ | 1,680 |
| $ | 232,670 |
| $ | 204,358 |
| $ | 1,400 |
| $ | 1,874 |
| $ | 217,434 |
| $ | 210,754 |
|
| From 1 to 5 years | 8,083 |
| 7,855 |
| 472,276 |
| 439,089 |
| 7,051 |
| 7,448 |
| 450,084 |
| 411,686 |
|
| After 5 years | 2,041 |
| 2,158 |
| 88,846 |
| 79,613 |
| 2,233 |
| 2,163 |
| 90,021 |
| 78,578 |
|
| Total by maturity | $ | 11,566 |
| $ | 11,693 |
| $ | 793,792 |
| $ | 723,060 |
| $ | 10,684 |
| $ | 11,485 |
| $ | 757,539 |
| $ | 701,018 |
|
| |
| (1) | The fair value amount receivable is composed of $3,657$3,686 million under protection purchased and $7,909$6,998 million under protection sold. |
| |
| (2) | The fair value amount payable is composed of $8,476$7,987 million under protection purchased and $3,217$3,498 million under protection sold. |
| | | | Fair values | Notionals | Fair values | Notionals |
| In millions of dollars at December 31, 2017 | Receivable(1) | Payable(2) | Protection
purchased | Protection
sold | |
| In millions of dollars at December 31, 2018 | | Receivable(1) | Payable(2) | Protection
purchased | Protection
sold |
| By industry/counterparty | | | | | | |
| Banks | $ | 7,471 |
| $ | 6,669 |
| $ | 264,414 |
| $ | 273,711 |
| $ | 4,785 |
| $ | 4,432 |
| $ | 214,842 |
| $ | 218,273 |
|
| Broker-dealers | 2,325 |
| 2,285 |
| 73,273 |
| 83,229 |
| 1,706 |
| 1,612 |
| 62,904 |
| 63,014 |
|
| Non-financial | 70 |
| 91 |
| 1,288 |
| 1,140 |
| 64 |
| 87 |
| 2,687 |
| 1,192 |
|
Insurance and other financial institutions | 10,668 |
| 12,488 |
| 438,738 |
| 377,062 |
| 4,210 |
| 4,220 |
| 515,216 |
| 442,460 |
|
| Total by industry/counterparty | $ | 20,534 |
| $ | 21,533 |
| $ | 777,713 |
| $ | 735,142 |
| $ | 10,765 |
| $ | 10,351 |
| $ | 795,649 |
| $ | 724,939 |
|
| By instrument | | | | | | |
| Credit default swaps and options | $ | 20,251 |
| $ | 20,554 |
| $ | 754,114 |
| $ | 724,228 |
| $ | 10,030 |
| $ | 9,755 |
| $ | 771,865 |
| $ | 712,623 |
|
| Total return swaps and other | 283 |
| 979 |
| 23,599 |
| 10,914 |
| 735 |
| 596 |
| 23,784 |
| 12,316 |
|
| Total by instrument | $ | 20,534 |
| $ | 21,533 |
| $ | 777,713 |
| $ | 735,142 |
| $ | 10,765 |
| $ | 10,351 |
| $ | 795,649 |
| $ | 724,939 |
|
| By rating | | | | | | |
| Investment grade | $ | 10,473 |
| $ | 10,616 |
| $ | 588,324 |
| $ | 557,987 |
| $ | 4,725 |
| $ | 4,544 |
| $ | 637,790 |
| $ | 568,849 |
|
| Non-investment grade | 10,061 |
| 10,917 |
| 189,389 |
| 177,155 |
| 6,040 |
| 5,807 |
| 157,859 |
| 156,090 |
|
| Total by rating | $ | 20,534 |
| $ | 21,533 |
| $ | 777,713 |
| $ | 735,142 |
| $ | 10,765 |
| $ | 10,351 |
| $ | 795,649 |
| $ | 724,939 |
|
| By maturity | | | | | | |
| Within 1 year | $ | 2,477 |
| $ | 2,914 |
| $ | 231,878 |
| $ | 218,097 |
| $ | 2,037 |
| $ | 2,063 |
| $ | 251,994 |
| $ | 225,597 |
|
| From 1 to 5 years | 16,098 |
| 16,435 |
| 498,606 |
| 476,345 |
| 6,720 |
| 6,414 |
| 493,096 |
| 456,409 |
|
| After 5 years | 1,959 |
| 2,184 |
| 47,229 |
| 40,700 |
| 2,008 |
| 1,874 |
| 50,559 |
| 42,933 |
|
| Total by maturity | $ | 20,534 |
| $ | 21,533 |
| $ | 777,713 |
| $ | 735,142 |
| $ | 10,765 |
| $ | 10,351 |
| $ | 795,649 |
| $ | 724,939 |
|
| |
| (1) | The fair value amount receivable is composed of $3,195$5,126 million under protection purchased and $17,339$5,639 under protection sold. |
| |
| (2) | The fair value amount payable is composed of $3,147$5,882 million under protection purchased and $18,386$4,469 million under protection sold. |
Credit Risk-Related Contingent Features in Derivatives
Certain derivative instruments contain provisions that require the Company to either post additional collateral or immediately settle any outstanding liability balances upon the occurrence of a specified event related to the credit risk of the Company. These events, which are defined by the existing derivative contracts, are primarily downgrades in the credit ratings of the Company and its affiliates.
The fair value (excluding CVA) of all derivative instruments with credit risk-related contingent features that were in a net liability position at both September 30, 2018March 31, 2019 and December 31, 20172018 was $37$35 billion and $29$33 billion, respectively. The Company posted $36$35 billion and $28$33 billion as collateral for this exposure in the normal course of business as of September 30, 2018March 31, 2019 and December 31, 2017,2018, respectively.
A downgrade could trigger additional collateral or cash settlement requirements for the Company and certain affiliates. In the event that Citigroup and Citibank were downgraded a single notch by all three major rating agencies as of September 30, 2018,March 31, 2019, the Company could be required to post an additional $1.4$0.7 billion as either collateral or settlement of the derivative transactions. Additionally, the Company could be required to segregate with third-party custodians collateral previously received from existing derivative counterparties in the amount of $0.2$0.1 billion upon the single notch downgrade, resulting in aggregate cash obligations and collateral requirements of approximately $1.6$0.8 billion.
Derivatives Accompanied by Financial Asset Transfers
For transfers of financial assets accounted for as a sale by the Company and for which the Company has retained substantially all of the economic exposure to the transferred asset through a total return swap executed with the same counterparty in contemplation of the initial sale (and still outstanding), both the asset amounts derecognized and the gross cash proceeds received as of the date of derecognition were $3.3$4.6 billion and $3.0$4.1 billion as of September 30, 2018March 31, 2019 and December 31, 2017,2018, respectively.
At September 30, 2018,March 31, 2019, the fair value of these previously derecognized assets was $3.2$4.6 billion. The fair value of the total return swaps as of September 30, 2018March 31, 2019 was $24$89 million recorded as gross derivative assets and $31$7 million recorded as gross derivative liabilities. At December 31, 2017,2018, the fair value of these previously derecognized assets was $3.1$4.1 billion, and the fair value of the total return swaps was $89$55 million recorded as gross derivative assets and $15$9 million recorded as gross derivative liabilities.
The balances for the total return swaps are on a gross basis, before the application of counterparty and cash collateral netting, and are included primarily as equity derivatives in the tabular disclosures in this Note.
20. FAIR VALUE MEASUREMENT
For additional information regarding fair value measurement at Citi, see Note 24 to the Consolidated Financial Statements in Citi’s 20172018 Annual Report on Form 10-K.
Market Valuation Adjustments
The table below summarizes the credit valuation adjustments (CVA) and funding valuation adjustments (FVA) applied to the fair value of derivative instruments at September 30, 2018March 31, 2019 and December 31, 2017:2018:
| | | | Credit and funding valuation adjustments contra-liability (contra-asset) | Credit and funding valuation adjustments contra-liability (contra-asset) |
| In millions of dollars | September 30,
2018 | December 31,
2017 | March 31,
2019 | December 31,
2018 |
| Counterparty CVA | $ | (815 | ) | $ | (970 | ) | $ | (982 | ) | $ | (1,085 | ) |
| Asset FVA | (324 | ) | (447 | ) | (524 | ) | (544 | ) |
| Citigroup (own-credit) CVA | 317 |
| 287 |
| 402 |
| 482 |
|
| Liability FVA | 39 |
| 47 |
| 87 |
| 135 |
|
Total CVA—derivative instruments(1) | $ | (783 | ) | $ | (1,083 | ) | $ | (1,017 | ) | $ | (1,012 | ) |
| |
| (1) | FVA is included with CVA for presentation purposes. |
The table below summarizes pretax gains (losses) related to changes in CVA on derivative instruments, net of hedges, FVA on derivatives and debt valuation adjustments (DVA) on Citi’s own fair value option (FVO) liabilities for the periods indicated:
| | | | Credit/funding/debt valuation adjustments gain (loss) | Credit/funding/debt valuation adjustments gain (loss) |
| | Three Months Ended September 30, | Nine Months Ended
September 30, | Three Months Ended March 31, |
| In millions of dollars | 2018 | 2017 | 2018 | 2017 | 2019 | 2018 |
| Counterparty CVA | $ | 94 |
| $ | 27 |
| $ | 117 |
| $ | 197 |
| $ | 74 |
| $ | 23 |
|
| Asset FVA | 74 |
| (5 | ) | 123 |
| 74 |
| 20 |
| 9 |
|
| Own-credit CVA | (75 | ) | (2 | ) | 24 |
| (127 | ) | (92 | ) | 75 |
|
| Liability FVA | (23 | ) | (16 | ) | (8 | ) | (10 | ) | (48 | ) | (7 | ) |
| Total CVA—derivative instruments | $ | 70 |
| $ | 4 |
| $ | 256 |
| $ | 134 |
| $ | (46 | ) | $ | 100 |
|
DVA related to own FVO liabilities(1) | $ | (377 | ) | $ | (195 | ) | $ | 208 |
| $ | (422 | ) | $ | (725 | ) | $ | 167 |
|
Total CVA and DVA(2) | $ | (307 | ) | $ | (191 | ) | $ | 464 |
| $ | (288 | ) | $ | (771 | ) | $ | 267 |
|
| |
| (1) | See NoteNotes 1 and Note 17 to the Consolidated Financial Statements.Statements in Citi’s 2018 Annual Report on Form 10-K. |
| |
| (2) | FVA is included with CVA for presentation purposes. |
Items Measured at Fair Value on a Recurring Basis
The following tables present for each of the fair value hierarchy levels the Company’s assets and liabilities that are measured at fair value on a recurring basis at September 30, 2018March 31, 2019 and December 31, 2017.2018. The Company may hedge positions that have been classified in the Level 3 category with other financial instruments (hedging instruments) that may be
classified as Level 3, but also with financial instruments classified as Level 1 or Level 2 of the fair value hierarchy. The effects of these hedges are presented gross in the following tables:
| | | In millions of dollars at September 30, 2018 | Level 1(1) | Level 2(1) | Level 3 | Gross
inventory | Netting(2) | Net
balance | |
| In millions of dollars at March 31, 2019 | | Level 1(1) | Level 2(1) | Level 3 | Gross
inventory | Netting(2) | Net
balance |
| Assets | | | | |
| Federal funds sold and securities borrowed and purchased under agreements to resell | $ | — |
| $ | 241,745 |
| $ | 65 |
| $ | 241,810 |
| $ | (63,368 | ) | $ | 178,442 |
| $ | — |
| $ | 241,414 |
| $ | 66 |
| $ | 241,480 |
| $ | (79,364 | ) | $ | 162,116 |
|
| Trading non-derivative assets | | | | |
| Trading mortgage-backed securities | | | | |
| U.S. government-sponsored agency guaranteed | — |
| 20,293 |
| 128 |
| 20,421 |
| — |
| 20,421 |
| — |
| 26,285 |
| 154 |
| 26,439 |
| — |
| 26,439 |
|
| Residential | 1 |
| 730 |
| 215 |
| 946 |
| — |
| 946 |
| — |
| 574 |
| 128 |
| 702 |
| — |
| 702 |
|
| Commercial | — |
| 1,346 |
| 57 |
| 1,403 |
| — |
| 1,403 |
| — |
| 1,359 |
| 69 |
| 1,428 |
| — |
| 1,428 |
|
| Total trading mortgage-backed securities | $ | 1 |
| $ | 22,369 |
| $ | 400 |
| $ | 22,770 |
| $ | — |
| $ | 22,770 |
| $ | — |
| $ | 28,218 |
| $ | 351 |
| $ | 28,569 |
| $ | — |
| $ | 28,569 |
|
| U.S. Treasury and federal agency securities | $ | 22,054 |
| $ | 5,347 |
| $ | 6 |
| $ | 27,407 |
| $ | — |
| $ | 27,407 |
| $ | 36,579 |
| $ | 4,966 |
| $ | — |
| $ | 41,545 |
| $ | — |
| $ | 41,545 |
|
| State and municipal | — |
| 3,612 |
| 200 |
| 3,812 |
| — |
| 3,812 |
| — |
| 2,425 |
| 178 |
| 2,603 |
| — |
| 2,603 |
|
| Foreign government | 44,714 |
| 19,945 |
| 52 |
| 64,711 |
| — |
| 64,711 |
| 51,976 |
| 23,108 |
| 39 |
| 75,123 |
| — |
| 75,123 |
|
| Corporate | 835 |
| 13,409 |
| 253 |
| 14,497 |
| — |
| 14,497 |
| 1,949 |
| 14,371 |
| 378 |
| 16,698 |
| — |
| 16,698 |
|
| Equity securities | 45,556 |
| 8,195 |
| 170 |
| 53,921 |
| — |
| 53,921 |
| 46,995 |
| 8,798 |
| 127 |
| 55,920 |
| — |
| 55,920 |
|
| Asset-backed securities | — |
| 1,628 |
| 1,453 |
| 3,081 |
| — |
| 3,081 |
| — |
| 1,578 |
| 1,429 |
| 3,007 |
| — |
| 3,007 |
|
Other trading assets(3) | 5 |
| 10,355 |
| 730 |
| 11,090 |
| — |
| 11,090 |
| 40 |
| 10,550 |
| 1,042 |
| 11,632 |
| — |
| 11,632 |
|
| Total trading non-derivative assets | $ | 113,165 |
| $ | 84,860 |
| $ | 3,264 |
| $ | 201,289 |
| $ | — |
| $ | 201,289 |
| $ | 137,539 |
| $ | 94,014 |
| $ | 3,544 |
| $ | 235,097 |
| $ | — |
| $ | 235,097 |
|
| Trading derivatives |
| | |
| | |
| Interest rate contracts | $ | 183 |
| $ | 163,345 |
| $ | 2,313 |
| $ | 165,841 |
| | | $ | 283 |
| $ | 184,259 |
| $ | 1,581 |
| $ | 186,123 |
| | |
| Foreign exchange contracts | 6 |
| 174,455 |
| 510 |
| 174,971 |
| | | 1 |
| 134,011 |
| 354 |
| 134,366 |
| | |
| Equity contracts | 2,495 |
| 27,255 |
| 294 |
| 30,044 |
| | | 453 |
| 24,988 |
| 342 |
| 25,783 |
| | |
| Commodity contracts | 15 |
| 22,576 |
| 684 |
| 23,275 |
| | | — |
| 14,246 |
| 734 |
| 14,980 |
| | |
| Credit derivatives | — |
| 10,750 |
| 816 |
| 11,566 |
| | | — |
| 9,934 |
| 750 |
| 10,684 |
| | |
| Total trading derivatives | $ | 2,699 |
| $ | 398,381 |
| $ | 4,617 |
| $ | 405,697 |
| | | $ | 737 |
| $ | 367,438 |
| $ | 3,761 |
| $ | 371,936 |
| | |
Cash collateral paid(4) | | $ | 10,759 |
| | | | $ | 11,349 |
| | |
| Netting agreements | | $ | (322,565 | ) | | | $ | (292,121 | ) | |
| Netting of cash collateral received | | (37,678 | ) | | | (39,750 | ) | |
| Total trading derivatives | $ | 2,699 |
| $ | 398,381 |
| $ | 4,617 |
| $ | 416,456 |
| $ | (360,243 | ) | $ | 56,213 |
| $ | 737 |
| $ | 367,438 |
| $ | 3,761 |
| $ | 383,285 |
| $ | (331,871 | ) | $ | 51,414 |
|
| Investments | | | | |
| Mortgage-backed securities | | | | |
| U.S. government-sponsored agency guaranteed | $ | — |
| $ | 45,127 |
| $ | 34 |
| $ | 45,161 |
| $ | — |
| $ | 45,161 |
| $ | — |
| $ | 39,301 |
| $ | 32 |
| $ | 39,333 |
| $ | — |
| $ | 39,333 |
|
| Residential | — |
| 1,627 |
| — |
| 1,627 |
| — |
| 1,627 |
| — |
| 1,121 |
| — |
| 1,121 |
| — |
| 1,121 |
|
| Commercial | — |
| 226 |
| 5 |
| 231 |
| — |
| 231 |
| — |
| 138 |
| — |
| 138 |
| — |
| 138 |
|
| Total investment mortgage-backed securities | $ | — |
| $ | 46,980 |
| $ | 39 |
| $ | 47,019 |
| $ | — |
| $ | 47,019 |
| $ | — |
| $ | 40,560 |
| $ | 32 |
| $ | 40,592 |
| $ | — |
| $ | 40,592 |
|
| U.S. Treasury and federal agency securities | $ | 106,098 |
| $ | 10,045 |
| $ | — |
| $ | 116,143 |
| $ | — |
| $ | 116,143 |
| $ | 98,793 |
| $ | 8,880 |
| $ | — |
| $ | 107,673 |
| $ | — |
| $ | 107,673 |
|
| State and municipal | — |
| 8,798 |
| 682 |
| 9,480 |
| — |
| 9,480 |
| — |
| 7,199 |
| 910 |
| 8,109 |
| — |
| 8,109 |
|
| Foreign government | 56,866 |
| 37,514 |
| 81 |
| 94,461 |
| — |
| 94,461 |
| 60,695 |
| 40,590 |
| 71 |
| 101,356 |
| — |
| 101,356 |
|
| Corporate | 4,687 |
| 7,693 |
| — |
| 12,380 |
| — |
| 12,380 |
| 4,722 |
| 7,528 |
| 60 |
| 12,310 |
| — |
| 12,310 |
|
| Equity securities | 246 |
| 14 |
| — |
| 260 |
| — |
| 260 |
| |
| Marketable equity securities | | 194 |
| 14 |
| — |
| 208 |
| — |
| 208 |
|
| Asset-backed securities | — |
| 978 |
| 284 |
| 1,262 |
| — |
| 1,262 |
| — |
| 614 |
| 806 |
| 1,420 |
| — |
| 1,420 |
|
| Other debt securities | — |
| 4,037 |
| — |
| 4,037 |
| — |
| 4,037 |
| — |
| 3,672 |
| — |
| 3,672 |
| — |
| 3,672 |
|
Non-marketable equity securities(5) | — |
| 170 |
| 733 |
| 903 |
| — |
| 903 |
| — |
| 100 |
| 505 |
| 605 |
| — |
| 605 |
|
| Total investments | $ | 167,897 |
| $ | 116,229 |
| $ | 1,819 |
| $ | 285,945 |
| $ | — |
| $ | 285,945 |
| $ | 164,404 |
| $ | 109,157 |
| $ | 2,384 |
| $ | 275,945 |
| $ | — |
| $ | 275,945 |
|
Table continues on the next page.
|
| | | | | | | | | | | | | | | | | | |
| In millions of dollars at March 31, 2019 | Level 1(1) | Level 2(1) | Level 3 | Gross
inventory | Netting(2) | Net
balance |
| Loans | $ | — |
| $ | 3,501 |
| $ | 373 |
| $ | 3,874 |
| $ | — |
| $ | 3,874 |
|
| Mortgage servicing rights | — |
| — |
| 551 |
| 551 |
| — |
| 551 |
|
| Non-trading derivatives and other financial assets measured on a recurring basis | $ | 14,577 |
| $ | 5,241 |
| $ | — |
| $ | 19,818 |
| $ | — |
| $ | 19,818 |
|
| Total assets | $ | 317,257 |
| $ | 820,765 |
| $ | 10,679 |
| $ | 1,160,050 |
| $ | (411,235 | ) | $ | 748,815 |
|
Total as a percentage of gross assets(6) | 27.6 | % | 71.5 | % | 0.9 | % |
|
|
|
|
|
|
| Liabilities | | | | | | |
| Interest-bearing deposits | $ | — |
| $ | 1,297 |
| $ | 1,047 |
| $ | 2,344 |
| $ | — |
| $ | 2,344 |
|
| Federal funds purchased and securities loaned and sold under agreements to repurchase | — |
| 124,564 |
| 1,041 |
| 125,605 |
| (79,364 | ) | 46,241 |
|
| Trading account liabilities | | | | | | |
| Securities sold, not yet purchased | 74,650 |
| 13,222 |
| 15 |
| 87,887 |
| — |
| 87,887 |
|
| Other trading liabilities | — |
| 117 |
| — |
| 117 |
| — |
| 117 |
|
| Total trading liabilities | $ | 74,650 |
| $ | 13,339 |
| $ | 15 |
| $ | 88,004 |
| $ | — |
| $ | 88,004 |
|
| Trading derivatives | | | | | | |
| Interest rate contracts | $ | 179 |
| $ | 165,038 |
| $ | 1,697 |
| $ | 166,914 |
| | |
| Foreign exchange contracts | 3 |
| 131,797 |
| 308 |
| 132,108 |
| | |
| Equity contracts | 207 |
| 29,734 |
| 1,687 |
| 31,628 |
| | |
| Commodity contracts | — |
| 17,248 |
| 430 |
| 17,678 |
| | |
| Credit derivatives | — |
| 10,769 |
| 716 |
| 11,485 |
| | |
| Total trading derivatives | $ | 389 |
| $ | 354,586 |
| $ | 4,838 |
| $ | 359,813 |
| | |
Cash collateral received(7) | | | | $ | 13,886 |
| | |
| Netting agreements | | | | | $ | (292,121 | ) | |
| Netting of cash collateral paid | | | | | (33,190 | ) | |
| Total trading derivatives | $ | 389 |
| $ | 354,586 |
| $ | 4,838 |
| $ | 373,699 |
| $ | (325,311 | ) | $ | 48,388 |
|
| Short-term borrowings | $ | — |
| $ | 5,002 |
| $ | 170 |
| $ | 5,172 |
| $ | — |
| $ | 5,172 |
|
| Long-term debt | — |
| 30,354 |
| 13,734 |
| 44,088 |
| — |
| 44,088 |
|
| Total non-trading derivatives and other financial liabilities measured on a recurring basis | $ | 14,577 |
| $ | — |
| $ | — |
| $ | 14,577 |
| $ | — |
| $ | 14,577 |
|
| Total liabilities | $ | 89,616 |
| $ | 529,142 |
| $ | 20,845 |
| $ | 653,489 |
| $ | (404,675 | ) | $ | 248,814 |
|
Total as a percentage of gross liabilities(6) | 14.0 | % | 82.7 | % | 3.3 | % | | | |
|
| | | | | | | | | | | | | | | | | | |
| In millions of dollars at September 30, 2018 | Level 1(1) | Level 2(1) | Level 3 | Gross
inventory | Netting(2) | Net
balance |
| Loans | $ | — |
| $ | 3,856 |
| $ | 383 |
| $ | 4,239 |
| $ | — |
| $ | 4,239 |
|
| Mortgage servicing rights | — |
| — |
| 618 |
| 618 |
| — |
| 618 |
|
| Non-trading derivatives and other financial assets measured on a recurring basis | $ | 19,789 |
| $ | 5,362 |
| $ | — |
| $ | 25,151 |
| $ | — |
| $ | 25,151 |
|
| Total assets | $ | 303,550 |
| $ | 850,433 |
| $ | 10,766 |
| $ | 1,175,508 |
| $ | (423,611 | ) | $ | 751,897 |
|
Total as a percentage of gross assets(6) | 26.1 | % | 73.0 | % | 0.9 | % |
|
|
|
|
|
|
| Liabilities | | | | | | |
| Interest-bearing deposits | $ | — |
| $ | 1,137 |
| $ | 303 |
| $ | 1,440 |
| $ | — |
| $ | 1,440 |
|
| Federal funds purchased and securities loaned and sold under agreements to repurchase | — |
| 110,519 |
| 997 |
| 111,516 |
| (63,368 | ) | 48,148 |
|
| Trading account liabilities | | | | | | |
| Securities sold, not yet purchased | 85,760 |
| 10,281 |
| 387 |
| 96,428 |
| — |
| 96,428 |
|
| Other trading liabilities | — |
| 1,484 |
| — |
| 1,484 |
| — |
| 1,484 |
|
| Total trading liabilities | $ | 85,760 |
| $ | 11,765 |
| $ | 387 |
| $ | 97,912 |
| $ | — |
| $ | 97,912 |
|
| Trading derivatives | | | | | | |
| Interest rate contracts | $ | 189 |
| $ | 145,460 |
| $ | 2,194 |
| $ | 147,843 |
| | |
| Foreign exchange contracts | 7 |
| 168,557 |
| 321 |
| 168,885 |
| | |
| Equity contracts | 2,667 |
| 31,254 |
| 1,208 |
| 35,129 |
| | |
| Commodity contracts | 5 |
| 23,286 |
| 2,489 |
| 25,780 |
| | |
| Credit derivatives | — |
| 9,871 |
| 1,822 |
| 11,693 |
| | |
| Total trading derivatives | $ | 2,868 |
| $ | 378,428 |
| $ | 8,034 |
| $ | 389,330 |
| | |
Cash collateral received(7) | | | | $ | 13,676 |
| | |
| Netting agreements | | | | | $ | (322,565 | ) | |
| Netting of cash collateral paid | | | | | (30,701 | ) | |
| Total trading derivatives | $ | 2,868 |
| $ | 378,428 |
| $ | 8,034 |
| $ | 403,006 |
| $ | (353,266 | ) | $ | 49,740 |
|
| Short-term borrowings | $ | — |
| $ | 5,002 |
| $ | 39 |
| $ | 5,041 |
| $ | — |
| $ | 5,041 |
|
| Long-term debt | — |
| 22,980 |
| 13,791 |
| 36,771 |
| — |
| 36,771 |
|
| Total non-trading derivatives and other financial liabilities measured on a recurring basis | $ | 19,789 |
| $ | 158 |
| $ | — |
| $ | 19,947 |
| $ | — |
| $ | 19,947 |
|
| Total liabilities | $ | 108,417 |
| $ | 529,989 |
| $ | 23,551 |
| $ | 675,633 |
| $ | (416,634 | ) | $ | 258,999 |
|
Total as a percentage of gross liabilities(6) | 16.4 | % | 80.1 | % | 3.6 | % | | | |
| |
| (1) | For the three and nine months ended September 30, 2018, the Company transferred assets of approximately $1.7 billion and $3.4 billion from Level 1 to Level 2, primarily related to foreign government securities and equity securities not traded in active markets. During the three and nine months ended September 30, 2018, the Company transferred assets of approximately $2.6 billion and $7.9 billion from Level 2 to Level 1, primarily related to foreign government bonds, foreign corporate securities, marketable certificates of deposits and equity securities traded with sufficient frequency to constitute an active market. For the three and nine months ended September 30, 2018, there were $0.1 billion and $0.3 billion transfers of liabilities from Level 1 to Level 2. During the three and nine months ended September 30, 2018, the Company transferred liabilities of approximately $0.3 billion and $0.7 billion, from Level 2 to Level 1. |
| |
(2) | Represents netting of (i) the amounts due under securities purchased under agreements to resell and the amounts owed under securities sold under agreements to repurchase and (ii) derivative exposures covered by a qualifying master netting agreement and cash collateral offsetting. |
| |
(3)(2) | Includes positions related to investments in unallocated precious metals, as discussed in Note 21 to the Consolidated Financial Statements. Also includes physical commodities accounted for at the lower of cost or fair value and unfunded credit products. |
| |
(4)(3) | Reflects the net amount of $48,437$44,539 million gross cash collateral paid, of which $37,678$33,190 million was used to offset trading derivative liabilities. |
| |
(5) | Amounts exclude $0.2 billion of investments measured at Net Asset Value (NAV) in accordance with ASU 2015-07, Fair Value Measurement (Topic 820): Disclosures for Investments in Certain Entities That Calculate Net Asset Value per Share (or Its Equivalent).
|
| |
(6)(4) | Because the amount of the cash collateral paid/received has not been allocated to the Level 1, 2 and 3 subtotals, these percentages are calculated based on total assets and liabilities measured at fair value on a recurring basis, excluding the cash collateral paid/received on derivatives. |
| |
(7)(5) | Amounts exclude $0.2 billion of investments measured at net asset value (NAV) in accordance with ASU 2015-07, Fair Value Measurement (Topic 820): Disclosures for Investments in Certain Entities That Calculate Net Asset Value per Share (or Its Equivalent). |
| |
| (6) | Reflects the net amount $44,377$53,636 million of gross cash collateral received, of which $30,701$39,750 million was used to offset trading derivative assets. |
Fair Value Levels
| | | In millions of dollars at December 31, 2017 | Level 1(1) | Level 2(1) | Level 3 | Gross
inventory | Netting(2) | Net
balance | |
| In millions of dollars at December 31, 2018 | | Level 1(1) | Level 2(1) | Level 3 | Gross
inventory | Netting(2) | Net
balance |
| Assets | | | | |
| Federal funds sold and securities borrowed and purchased under agreements to resell | $ | — |
| $ | 188,571 |
| $ | 16 |
| $ | 188,587 |
| $ | (55,638 | ) | $ | 132,949 |
| $ | — |
| $ | 214,570 |
| $ | 115 |
| $ | 214,685 |
| $ | (66,984 | ) | $ | 147,701 |
|
| Trading non-derivative assets | | | | |
| Trading mortgage-backed securities | | | | |
| U.S. government-sponsored agency guaranteed | — |
| 22,801 |
| 163 |
| 22,964 |
| — |
| 22,964 |
| — |
| 24,090 |
| 156 |
| 24,246 |
| — |
| 24,246 |
|
| Residential | — |
| 649 |
| 164 |
| 813 |
| — |
| 813 |
| — |
| 709 |
| 268 |
| 977 |
| — |
| 977 |
|
| Commercial | — |
| 1,309 |
| 57 |
| 1,366 |
| — |
| 1,366 |
| — |
| 1,323 |
| 77 |
| 1,400 |
| — |
| 1,400 |
|
| Total trading mortgage-backed securities | $ | — |
| $ | 24,759 |
| $ | 384 |
| $ | 25,143 |
| $ | — |
| $ | 25,143 |
| $ | — |
| $ | 26,122 |
| $ | 501 |
| $ | 26,623 |
| $ | — |
| $ | 26,623 |
|
| U.S. Treasury and federal agency securities | $ | 17,524 |
| $ | 3,613 |
| $ | — |
| $ | 21,137 |
| $ | — |
| $ | 21,137 |
| $ | 26,439 |
| $ | 4,802 |
| $ | 1 |
| $ | 31,242 |
| $ | — |
| $ | 31,242 |
|
| State and municipal | — |
| 4,426 |
| 274 |
| 4,700 |
| — |
| 4,700 |
| — |
| 3,782 |
| 200 |
| 3,982 |
| — |
| 3,982 |
|
| Foreign government | 39,347 |
| 20,843 |
| 16 |
| 60,206 |
| — |
| 60,206 |
| 43,309 |
| 21,179 |
| 31 |
| 64,519 |
| — |
| 64,519 |
|
| Corporate | 301 |
| 15,129 |
| 275 |
| 15,705 |
| — |
| 15,705 |
| 1,026 |
| 14,510 |
| 360 |
| 15,896 |
| — |
| 15,896 |
|
| Equity securities | 53,305 |
| 6,794 |
| 120 |
| 60,219 |
| — |
| 60,219 |
| 36,342 |
| 7,308 |
| 153 |
| 43,803 |
| — |
| 43,803 |
|
| Asset-backed securities | — |
| 1,198 |
| 1,590 |
| 2,788 |
| — |
| 2,788 |
| — |
| 1,429 |
| 1,484 |
| 2,913 |
| — |
| 2,913 |
|
Other trading assets(3) | 3 |
| 11,105 |
| 615 |
| 11,723 |
| — |
| 11,723 |
| 3 |
| 12,198 |
| 818 |
| 13,019 |
| — |
| 13,019 |
|
| Total trading non-derivative assets | $ | 110,480 |
| $ | 87,867 |
| $ | 3,274 |
| $ | 201,621 |
| $ | — |
| $ | 201,621 |
| $ | 107,119 |
| $ | 91,330 |
| $ | 3,548 |
| $ | 201,997 |
| $ | — |
| $ | 201,997 |
|
| Trading derivatives | | | | |
| Interest rate contracts | $ | 145 |
| $ | 203,134 |
| $ | 1,708 |
| $ | 204,987 |
| | | $ | 101 |
| $ | 169,860 |
| $ | 1,671 |
| $ | 171,632 |
| | |
| Foreign exchange contracts | 19 |
| 121,363 |
| 577 |
| 121,959 |
| | | — |
| 162,108 |
| 346 |
| 162,454 |
| | |
| Equity contracts | 2,364 |
| 24,170 |
| 444 |
| 26,978 |
| | | 647 |
| 28,903 |
| 343 |
| 29,893 |
| | |
| Commodity contracts | 282 |
| 13,252 |
| 569 |
| 14,103 |
| | | — |
| 16,788 |
| 767 |
| 17,555 |
| | |
| Credit derivatives | — |
| 19,624 |
| 910 |
| 20,534 |
| | | — |
| 9,839 |
| 926 |
| 10,765 |
| | |
| Total trading derivatives | $ | 2,810 |
| $ | 381,543 |
| $ | 4,208 |
| $ | 388,561 |
| | | $ | 748 |
| $ | 387,498 |
| $ | 4,053 |
| $ | 392,299 |
| | |
Cash collateral paid(4) | | $ | 7,541 |
| | | | $ | 11,518 |
| | |
| Netting agreements | | $ | (306,401 | ) | | | $ | (311,089 | ) | |
| Netting of cash collateral received | | (38,532 | ) | | | (38,608 | ) | |
| Total trading derivatives | $ | 2,810 |
| $ | 381,543 |
| $ | 4,208 |
| $ | 396,102 |
| $ | (344,933 | ) | $ | 51,169 |
| $ | 748 |
| $ | 387,498 |
| $ | 4,053 |
| $ | 403,817 |
| $ | (349,697 | ) | $ | 54,120 |
|
| Investments | | | | |
| Mortgage-backed securities | | | | |
| U.S. government-sponsored agency guaranteed | $ | — |
| $ | 41,717 |
| $ | 24 |
| $ | 41,741 |
| $ | — |
| $ | 41,741 |
| $ | — |
| $ | 42,988 |
| $ | 32 |
| $ | 43,020 |
| $ | — |
| $ | 43,020 |
|
| Residential | — |
| 2,884 |
| — |
| 2,884 |
| — |
| 2,884 |
| — |
| 1,313 |
| — |
| 1,313 |
| — |
| 1,313 |
|
| Commercial | — |
| 329 |
| 3 |
| 332 |
| — |
| 332 |
| — |
| 172 |
| — |
| 172 |
| — |
| 172 |
|
| Total investment mortgage-backed securities | $ | — |
| $ | 44,930 |
| $ | 27 |
| $ | 44,957 |
| $ | — |
| $ | 44,957 |
| $ | — |
| $ | 44,473 |
| $ | 32 |
| $ | 44,505 |
| $ | — |
| $ | 44,505 |
|
| U.S. Treasury and federal agency securities | $ | 106,964 |
| $ | 11,182 |
| $ | — |
| $ | 118,146 |
| $ | — |
| $ | 118,146 |
| $ | 107,577 |
| $ | 9,645 |
| $ | — |
| $ | 117,222 |
| $ | — |
| $ | 117,222 |
|
| State and municipal | — |
| 8,028 |
| 737 |
| 8,765 |
| — |
| 8,765 |
| — |
| 8,498 |
| 708 |
| 9,206 |
| — |
| 9,206 |
|
| Foreign government | 56,456 |
| 43,985 |
| 92 |
| 100,533 |
| — |
| 100,533 |
| 58,252 |
| 42,371 |
| 68 |
| 100,691 |
| — |
| 100,691 |
|
| Corporate | 1,911 |
| 12,127 |
| 71 |
| 14,109 |
| — |
| 14,109 |
| 4,410 |
| 7,033 |
| 156 |
| 11,599 |
| — |
| 11,599 |
|
| Equity securities | 176 |
| 11 |
| 2 |
| 189 |
| — |
| 189 |
| |
Marketable equity securities
| | 206 |
| 14 |
| — |
| 220 |
| — |
| 220 |
|
| Asset-backed securities | — |
| 3,091 |
| 827 |
| 3,918 |
| — |
| 3,918 |
| — |
| 656 |
| 187 |
| 843 |
| — |
| 843 |
|
| Other debt securities | — |
| 297 |
| — |
| 297 |
| — |
| 297 |
| — |
| 3,972 |
| — |
| 3,972 |
| — |
| 3,972 |
|
Non-marketable equity securities(5) | — |
| 121 |
| 681 |
| 802 |
| — |
| 802 |
| — |
| 96 |
| 586 |
| 682 |
| — |
| 682 |
|
| Total investments | $ | 165,507 |
| $ | 123,772 |
| $ | 2,437 |
| $ | 291,716 |
| $ | — |
| $ | 291,716 |
| $ | 170,445 |
| $ | 116,758 |
| $ | 1,737 |
| $ | 288,940 |
| $ | — |
| $ | 288,940 |
|
Table continues on the next page.
|
| | | | | | | | | | | | | | | | | | |
| In millions of dollars at December 31, 2018 | Level 1(1) | Level 2(1) | Level 3 | Gross
inventory | Netting(2) | Net
balance |
| Loans | $ | — |
| $ | 2,946 |
| $ | 277 |
| $ | 3,223 |
| $ | — |
| $ | 3,223 |
|
| Mortgage servicing rights | — |
| — |
| 584 |
| 584 |
| — |
| 584 |
|
| Non-trading derivatives and other financial assets measured on a recurring basis | $ | 15,839 |
| $ | 4,949 |
| $ | — |
| $ | 20,788 |
| $ | — |
| $ | 20,788 |
|
| Total assets | $ | 294,151 |
| $ | 818,051 |
| $ | 10,314 |
| $ | 1,134,034 |
| $ | (416,681 | ) | $ | 717,353 |
|
Total as a percentage of gross assets(6) | 26.2 | % | 72.9 | % | 0.9 | % | | | |
| Liabilities | | | | | | |
| Interest-bearing deposits | $ | — |
| $ | 980 |
| $ | 495 |
| $ | 1,475 |
| $ | — |
| $ | 1,475 |
|
| Federal funds purchased and securities loaned and sold under agreements to repurchase | — |
| 110,511 |
| 983 |
| 111,494 |
| (66,984 | ) | 44,510 |
|
| Trading account liabilities | | | | | | |
| Securities sold, not yet purchased | 78,872 |
| 11,364 |
| 586 |
| 90,822 |
| — |
| 90,822 |
|
| Other trading liabilities | — |
| 1,547 |
| — |
| 1,547 |
| — |
| 1,547 |
|
| Total trading liabilities | $ | 78,872 |
| $ | 12,911 |
| $ | 586 |
| $ | 92,369 |
| $ | — |
| $ | 92,369 |
|
| Trading account derivatives | | | | | | |
| Interest rate contracts | $ | 71 |
| $ | 152,931 |
| $ | 1,825 |
| $ | 154,827 |
| | |
| Foreign exchange contracts | — |
| 159,003 |
| 352 |
| 159,355 |
| | |
| Equity contracts | 351 |
| 32,330 |
| 1,127 |
| 33,808 |
| | |
| Commodity contracts | — |
| 19,904 |
| 785 |
| 20,689 |
| | |
| Credit derivatives | — |
| 9,486 |
| 865 |
| 10,351 |
| | |
| Total trading derivatives | $ | 422 |
| $ | 373,654 |
| $ | 4,954 |
| $ | 379,030 |
| | |
Cash collateral received(7) | | | | $ | 13,906 |
| | |
| Netting agreements | | | | | $ | (311,089 | ) | |
| Netting of cash collateral paid | | | | | (29,911 | ) | |
| Total trading derivatives | $ | 422 |
| $ | 373,654 |
| $ | 4,954 |
| $ | 392,936 |
| $ | (341,000 | ) | $ | 51,936 |
|
| Short-term borrowings | $ | — |
| $ | 4,446 |
| $ | 37 |
| $ | 4,483 |
| $ | — |
| $ | 4,483 |
|
| Long-term debt | — |
| 25,659 |
| 12,570 |
| 38,229 |
| — |
| 38,229 |
|
| Non-trading derivatives and other financial liabilities measured on a recurring basis | $ | 15,839 |
| $ | 67 |
| $ | — |
| $ | 15,906 |
| $ | — |
| $ | 15,906 |
|
| Total liabilities | $ | 95,133 |
| $ | 528,228 |
| $ | 19,625 |
| $ | 656,892 |
| $ | (407,984 | ) | $ | 248,908 |
|
Total as a percentage of gross liabilities(6) | 14.8 | % | 82.1 | % | 3.1 | % | | | |
|
| | | | | | | | | | | | | | | | | | |
| In millions of dollars at December 31, 2017 | Level 1(1) | Level 2(1) | Level 3 | Gross
inventory | Netting(2) | Net
balance |
| Loans | $ | — |
| $ | 3,824 |
| $ | 550 |
| $ | 4,374 |
| $ | — |
| $ | 4,374 |
|
| Mortgage servicing rights | — |
| — |
| 558 |
| 558 |
| — |
| 558 |
|
| Non-trading derivatives and other financial assets measured on a recurring basis | $ | 13,903 |
| $ | 4,640 |
| $ | 16 |
| $ | 18,559 |
| $ | — |
| $ | 18,559 |
|
| Total assets | $ | 292,700 |
| $ | 790,217 |
| $ | 11,059 |
| $ | 1,101,517 |
| $ | (400,571 | ) | $ | 700,946 |
|
Total as a percentage of gross assets(6) | 26.8 | % | 72.2 | % | 1.0 | % | | | |
| Liabilities | | | | | | |
| Interest-bearing deposits | $ | — |
| $ | 1,179 |
| $ | 286 |
| $ | 1,465 |
| $ | — |
| $ | 1,465 |
|
| Federal funds purchased and securities loaned and sold under agreements to repurchase | — |
| 95,550 |
| 726 |
| 96,276 |
| (55,638 | ) | 40,638 |
|
| Trading account liabilities | | | | | | |
| Securities sold, not yet purchased | 65,843 |
| 10,306 |
| 22 |
| 76,171 |
| — |
| 76,171 |
|
| Other trading liabilities | — |
| 1,409 |
| 5 |
| 1,414 |
| — |
| 1,414 |
|
| Total trading liabilities | $ | 65,843 |
| $ | 11,715 |
| $ | 27 |
| $ | 77,585 |
| $ | — |
| $ | 77,585 |
|
| Trading account derivatives | | | | | | |
| Interest rate contracts | $ | 137 |
| $ | 182,372 |
| $ | 2,130 |
| $ | 184,639 |
| | |
| Foreign exchange contracts | 9 |
| 120,316 |
| 447 |
| 120,772 |
| | |
| Equity contracts | 2,430 |
| 26,472 |
| 2,471 |
| 31,373 |
| | |
| Commodity contracts | 115 |
| 14,482 |
| 2,430 |
| 17,027 |
| | |
| Credit derivatives | — |
| 19,824 |
| 1,709 |
| 21,533 |
| | |
| Total trading derivatives | $ | 2,691 |
| $ | 363,466 |
| $ | 9,187 |
| $ | 375,344 |
| | |
Cash collateral received(7) | | | | $ | 14,308 |
| | |
| Netting agreements | | | | | $ | (306,401 | ) | |
| Netting of cash collateral paid | | | | | (35,666 | ) | |
| Total trading derivatives | $ | 2,691 |
| $ | 363,466 |
| $ | 9,187 |
| $ | 389,652 |
| $ | (342,067 | ) | $ | 47,585 |
|
| Short-term borrowings | $ | — |
| $ | 4,609 |
| $ | 18 |
| $ | 4,627 |
| $ | — |
| $ | 4,627 |
|
| Long-term debt | — |
| 18,310 |
| 13,082 |
| 31,392 |
| — |
| 31,392 |
|
| Non-trading derivatives and other financial liabilities measured on a recurring basis | $ | 13,903 |
| $ | 50 |
| $ | 8 |
| $ | 13,961 |
| $ | — |
| $ | 13,961 |
|
| Total liabilities | $ | 82,437 |
| $ | 494,879 |
| $ | 23,334 |
| $ | 614,958 |
| $ | (397,705 | ) | $ | 217,253 |
|
Total as a percentage of gross liabilities(6) | 13.7 | % | 82.4 | % | 3.9 | % | | | |
| |
| (1) | In 2017, the Company transferred assets of approximately $4.8 billion from Level 1 to Level 2, primarily related to foreign government securities and equity securities not traded in active markets. In 2017, the Company transferred assets of approximately $4.0 billion from Level 2 to Level 1, primarily related to foreign government bonds and equity securities traded with sufficient frequency to constitute a liquid market. In 2017, the Company transferred liabilities of approximately $0.4 billion from Level 1 to Level 2. In 2017, the Company transferred liabilities of approximately $0.3 billion from Level 2 to Level 1. |
| |
(2) | Represents netting of (i) the amounts due under securities purchased under agreements to resell and the amounts owed under securities sold under agreements to repurchase and (ii) derivative exposures covered by a qualifying master netting agreement and cash collateral offsetting. |
| |
(3)(2) | Includes positions related to investments in unallocated precious metals, as discussed in Note 21 to the Consolidated Financial Statements. Also includes physical commodities accounted for at the lower of cost or fair value and unfunded credit products. |
| |
(4)(3) | Reflects the net amount of $43,207$41,429 million of gross cash collateral paid, of which $35,666$29,911 million was used to offset trading derivative liabilities. |
| |
(5) | Amounts exclude $0.4 billion of investments measured at Net Asset Value (NAV) in accordance with ASU No. 2015-07, Fair Value Measurement (Topic 820): Disclosures for Investments in Certain Entities That Calculate Net Asset Value per Share (or Its Equivalent).
|
| |
(6)(4) | Because the amount of the cash collateral paid/received has not been allocated to the Level 1, 2 and 3 subtotals, these percentages are calculated based on total assets and liabilities measured at fair value on a recurring basis, excluding the cash collateral paid/received on derivatives. |
| |
(7)(5) | Amounts exclude $0.2 billion of investments measured at net asset value (NAV) in accordance with ASU 2015-07, Fair Value Measurement (Topic 820): Disclosures for Investments in Certain Entities That Calculate Net Asset Value per Share (or Its Equivalent). |
| |
| (6) | Reflects the net amount of $52,840$52,514 million of gross cash collateral received, of which $38,532$38,608 million was used to offset trading derivative assets. |
Changes in Level 3 Fair Value Category
The following tables present the changes in the Level 3 fair value category for the three and nine months ended September 30, 2018March 31, 2019 and 2017.2018. The gains and losses presented below include changes in the fair value related to both observable and unobservable inputs.
The Company often hedges positions with offsetting positions that are classified in a different level. For example,
the gains and losses for assets and liabilities in the Level 3
category presented in the tables below do not reflect the effect of offsetting losses and gains on hedging instruments that may be classified in the Level 1 or Level 2 categories. In addition, the Company hedges items classified in the Level 3 category with instruments also classified in Level 3 of the fair value hierarchy. The hedged items and related hedges are presented gross in the following tables:
Level 3 Fair Value Rollforward
| | | | | Net realized/unrealized
gains (losses) incl. in | Transfers | | Unrealized
gains
(losses)
still held(3) | | Net realized/unrealized
gains (losses) incl. in | Transfers | | Unrealized
gains
(losses)
still held(3) |
| In millions of dollars | Jun. 30, 2018 | Principal
transactions | Other(1)(2) | into
Level 3 | out of
Level 3 | Purchases | Issuances | Sales | Settlements | Sept. 30, 2018 | Dec. 31, 2018 | Principal
transactions | Other(1)(2) | into
Level 3 | out of
Level 3 | Purchases | Issuances | Sales | Settlements | Mar. 31, 2019 |
| Assets | | | | | | |
Federal funds sold and securities borrowed and purchased under agreements to resell | $ | 66 |
| $ | — |
| $ | — |
| $ | (1 | ) | $ | — |
| $ | 61 |
| $ | — |
| $ | — |
| $ | (61 | ) | $ | 65 |
| $ | 4 |
| $ | 115 |
| $ | (4 | ) | $ | — |
| $ | (4 | ) | $ | 3 |
| $ | 45 |
| $ | — |
| $ | — |
| $ | (89 | ) | $ | 66 |
| $ | (2 | ) |
| Trading non-derivative assets | | | | | | |
Trading mortgage- backed securities | | | | | | |
| U.S. government-sponsored agency guaranteed | 99 |
| (2 | ) | — |
| 3 |
| (7 | ) | 38 |
| — |
| (3 | ) | — |
| 128 |
| (2 | ) | 156 |
| — |
| — |
| — |
| (25 | ) | 48 |
| — |
| (25 | ) | — |
| 154 |
| 3 |
|
| Residential | 132 |
| 111 |
| — |
| 17 |
| (36 | ) | 8 |
| — |
| (17 | ) | — |
| 215 |
| (2 | ) | 268 |
| 1 |
| — |
| 5 |
| (31 | ) | 69 |
| — |
| (184 | ) | — |
| 128 |
| 10 |
|
| Commercial | 51 |
| (2 | ) | — |
| 4 |
| (8 | ) | 29 |
| — |
| (17 | ) | — |
| 57 |
| (1 | ) | 77 |
| 2 |
| — |
| 2 |
| (1 | ) | 24 |
| — |
| (35 | ) | — |
| 69 |
| 1 |
|
Total trading mortgage- backed securities | $ | 282 |
| $ | 107 |
| $ | — |
| $ | 24 |
| $ | (51 | ) | $ | 75 |
| $ | — |
| $ | (37 | ) | $ | — |
| $ | 400 |
| $ | (5 | ) | $ | 501 |
| $ | 3 |
| $ | — |
| $ | 7 |
| $ | (57 | ) | $ | 141 |
| $ | — |
| $ | (244 | ) | $ | — |
| $ | 351 |
| $ | 14 |
|
| U.S. Treasury and federal agency securities | $ | 7 |
| $ | — |
| $ | — |
| $ | — |
| $ | — |
| $ | — |
| $ | — |
| $ | — |
| $ | (1 | ) | $ | 6 |
| $ | — |
| $ | 1 |
| $ | — |
| $ | — |
| $ | — |
| $ | — |
| $ | — |
| $ | — |
| $ | — |
| $ | (1 | ) | $ | — |
| $ | — |
|
| State and municipal | 226 |
| 6 |
| — |
| — |
| (52 | ) | 22 |
| — |
| (2 | ) | — |
| 200 |
| 6 |
| 200 |
| (1 | ) | — |
| — |
| (19 | ) | 1 |
| — |
| (3 | ) | — |
| 178 |
| — |
|
| Foreign government | 36 |
| 27 |
| — |
| — |
| (8 | ) | 4 |
| — |
| (7 | ) | — |
| 52 |
| 26 |
| 31 |
| (1 | ) | — |
| 9 |
| — |
| 3 |
| — |
| (3 | ) | — |
| 39 |
| 1 |
|
| Corporate | 520 |
| (214 | ) | — |
| 24 |
| (15 | ) | 110 |
| — |
| (172 | ) | — |
| 253 |
| 7 |
| 360 |
| 90 |
| — |
| 21 |
| (26 | ) | 69 |
| (33 | ) | (103 | ) | — |
| 378 |
| (35 | ) |
| Equity securities | 293 |
| (87 | ) | — |
| 7 |
| (21 | ) | 24 |
| — |
| (46 | ) | — |
| 170 |
| (99 | ) | |
Marketable equity securities
| | 153 |
| (10 | ) | — |
| 1 |
| (11 | ) | 9 |
| — |
| (15 | ) | — |
| 127 |
| 14 |
|
| Asset-backed securities | 1,688 |
| (44 | ) | — |
| 20 |
| (39 | ) | 305 |
| — |
| (477 | ) | — |
| 1,453 |
| (45 | ) | 1,484 |
| (26 | ) | — |
| 7 |
| (32 | ) | 221 |
| — |
| (225 | ) | — |
| 1,429 |
| 38 |
|
| Other trading assets | 542 |
| 78 |
| — |
| 94 |
| (10 | ) | 185 |
| 2 |
| (157 | ) | (4 | ) | 730 |
| 53 |
| 818 |
| 5 |
| — |
| 13 |
| (32 | ) | 340 |
| 4 |
| (102 | ) | (4 | ) | 1,042 |
| (20 | ) |
Total trading non- derivative assets | $ | 3,594 |
| $ | (127 | ) | $ | — |
| $ | 169 |
| $ | (196 | ) | $ | 725 |
| $ | 2 |
| $ | (898 | ) | $ | (5 | ) | $ | 3,264 |
| $ | (57 | ) | $ | 3,548 |
| $ | 60 |
| $ | — |
| $ | 58 |
| $ | (177 | ) | $ | 784 |
| $ | (29 | ) | $ | (695 | ) | $ | (5 | ) | $ | 3,544 |
| $ | 12 |
|
Trading derivatives, net(4) | | | | | | |
| Interest rate contracts | $ | 86 |
| $ | 10 |
| $ | — |
| $ | (11 | ) | $ | (2 | ) | $ | — |
| $ | 8 |
| $ | — |
| $ | 28 |
| $ | 119 |
| $ | 59 |
| $ | (154 | ) | $ | (51 | ) | $ | — |
| $ | (15 | ) | $ | 27 |
| $ | 6 |
| $ | 12 |
| $ | — |
| $ | 59 |
| $ | (116 | ) | $ | (60 | ) |
| Foreign exchange contracts | 239 |
| (16 | ) | — |
| (15 | ) | 56 |
| 4 |
| — |
| (66 | ) | (13 | ) | 189 |
| (51 | ) | (6 | ) | 60 |
| — |
| (15 | ) | 15 |
| 3 |
| — |
| (4 | ) | (7 | ) | 46 |
| 28 |
|
| Equity contracts | (1,446 | ) | 265 |
| — |
| 3 |
| 372 |
| 3 |
| (15 | ) | (3 | ) | (93 | ) | (914 | ) | 283 |
| (784 | ) | (294 | ) | — |
| (154 | ) | 9 |
| (1 | ) | (59 | ) | 2 |
| (64 | ) | (1,345 | ) | (222 | ) |
| Commodity contracts | (1,906 | ) | (67 | ) | — |
| 44 |
| (16 | ) | 12 |
| — |
| (8 | ) | 136 |
| (1,805 | ) | 1 |
| (18 | ) | 280 |
| — |
| (3 | ) | 10 |
| 54 |
| — |
| (34 | ) | 15 |
| 304 |
| 300 |
|
| Credit derivatives | (848 | ) | (240 | ) | — |
| (6 | ) | 7 |
| — |
| — |
| — |
| 81 |
| (1,006 | ) | (231 | ) | 61 |
| (319 | ) | — |
| (18 | ) | 232 |
| — |
| — |
| — |
| 78 |
| 34 |
| (320 | ) |
Total trading derivatives, net(4) | $ | (3,875 | ) | $ | (48 | ) | $ | — |
| $ | 15 |
| $ | 417 |
| $ | 19 |
| $ | (7 | ) | $ | (77 | ) | $ | 139 |
| $ | (3,417 | ) | $ | 61 |
| $ | (901 | ) | $ | (324 | ) | $ | — |
| $ | (205 | ) | $ | 293 |
| $ | 62 |
| $ | (47 | ) | $ | (36 | ) | $ | 81 |
| $ | (1,077 | ) | $ | (274 | ) |
Table continues on the next page.
| | | | | Net realized/unrealized
gains (losses) incl. in | Transfers | | Unrealized
gains
(losses)
still held(3) | | Net realized/unrealized
gains (losses) incl. in | Transfers | | Unrealized
gains
(losses)
still held(3) |
| In millions of dollars | Jun. 30, 2018 | Principal
transactions | Other(1)(2) | into
Level 3 | out of
Level 3 | Purchases | Issuances | Sales | Settlements | Sept. 30, 2018 | Dec. 31, 2018 | Principal
transactions | Other(1)(2) | into
Level 3 | out of
Level 3 | Purchases | Issuances | Sales | Settlements | Mar. 31, 2019 |
| Investments | | | | | | |
| Mortgage-backed securities | | | | | | |
| U.S. government-sponsored agency guaranteed | $ | 34 |
| $ | — |
| $ | — |
| $ | — |
| $ | — |
| $ | — |
| $ | — |
| $ | — |
| $ | — |
| $ | 34 |
| $ | — |
| $ | 32 |
| $ | — |
| $ | — |
| $ | — |
| $ | — |
| $ | — |
| $ | — |
| $ | — |
| $ | — |
| $ | 32 |
| $ | (2 | ) |
| Residential | — |
| — |
| — |
| — |
| — |
| — |
| — |
| — |
| — |
| — |
| — |
| — |
| — |
| — |
| — |
| — |
| — |
| — |
| — |
| — |
| — |
| — |
|
| Commercial | 6 |
| — |
| — |
| — |
| (1 | ) | — |
| — |
| — |
| — |
| 5 |
| — |
| — |
| — |
| — |
| — |
| — |
| — |
| — |
| — |
| — |
| — |
| — |
|
| Total investment mortgage-backed securities | $ | 40 |
| $ | — |
| $ | — |
| $ | — |
| $ | (1 | ) | $ | — |
| $ | — |
| $ | — |
| $ | — |
| $ | 39 |
| $ | — |
| $ | 32 |
| $ | — |
| $ | — |
| $ | — |
| $ | — |
| $ | — |
| $ | — |
| $ | — |
| $ | — |
| $ | 32 |
| $ | (2 | ) |
| U.S. Treasury and federal agency securities | $ | — |
| $ | — |
| $ | — |
| $ | — |
| $ | — |
| $ | — |
| $ | — |
| $ | — |
| $ | — |
| $ | — |
| $ | — |
| $ | — |
| $ | — |
| $ | — |
| $ | — |
| $ | — |
| $ | — |
| $ | — |
| $ | — |
| $ | — |
| $ | — |
| $ | — |
|
| State and municipal | 762 |
| — |
| (10 | ) | — |
| — |
| 17 |
| — |
| (87 | ) | — |
| 682 |
| (7 | ) | 708 |
| — |
| 52 |
| 3 |
| — |
| 185 |
| — |
| (38 | ) | — |
| 910 |
| 44 |
|
| Foreign government | 54 |
| — |
| (3 | ) | — |
| (2 | ) | 45 |
| — |
| (13 | ) | — |
| 81 |
| (3 | ) | 68 |
| — |
| (4 | ) | — |
| — |
| 39 |
| — |
| (32 | ) | — |
| 71 |
| (1 | ) |
| Corporate | 68 |
| — |
| — |
| — |
| (64 | ) | — |
| — |
| (4 | ) | — |
| — |
| — |
| 156 |
| — |
| — |
| — |
| (94 | ) | — |
| — |
| (2 | ) | — |
| 60 |
| — |
|
| Equity securities | 1 |
| — |
| — |
| — |
| — |
| — |
| — |
| — |
| (1 | ) | — |
| — |
| |
| Marketable equity securities | | — |
| — |
| — |
| — |
| — |
| — |
| — |
| — |
| — |
| — |
| — |
|
| Asset-backed securities | 456 |
| — |
| (6 | ) | — |
| (177 | ) | 34 |
| — |
| (23 | ) | — |
| 284 |
| (5 | ) | 187 |
| — |
| (2 | ) | 94 |
| — |
| 550 |
| — |
| (23 | ) | — |
| 806 |
| (4 | ) |
| Other debt securities | — |
| — |
| — |
| — |
| — |
| — |
| — |
| — |
| — |
| — |
| — |
| — |
| — |
| — |
| — |
| — |
| — |
| — |
| — |
| — |
| — |
| — |
|
| Non-marketable equity securities | 611 |
| — |
| (73 | ) | 163 |
| — |
| 71 |
| — |
| (40 | ) | 1 |
| 733 |
| (70 | ) | 586 |
| — |
| 22 |
| — |
| — |
| 4 |
| — |
| (86 | ) | (21 | ) | 505 |
| (11 | ) |
| Total investments | $ | 1,992 |
| $ | — |
| $ | (92 | ) | $ | 163 |
| $ | (244 | ) | $ | 167 |
| $ | — |
| $ | (167 | ) | $ | — |
| $ | 1,819 |
| $ | (85 | ) | $ | 1,737 |
| $ | — |
| $ | 68 |
| $ | 97 |
| $ | (94 | ) | $ | 778 |
| $ | — |
| $ | (181 | ) | $ | (21 | ) | $ | 2,384 |
| $ | 26 |
|
| Loans | $ | 381 |
| $ | — |
| $ | (27 | ) | $ | — |
| $ | (46 | ) | $ | 79 |
| $ | — |
| $ | (3 | ) | $ | (1 | ) | $ | 383 |
| $ | 95 |
| $ | 277 |
| $ | — |
| $ | 45 |
| $ | 125 |
| $ | (70 | ) | $ | 6 |
| $ | — |
| $ | (10 | ) | $ | — |
| $ | 373 |
| $ | 45 |
|
| Mortgage servicing rights | 596 |
| — |
| 25 |
| — |
| — |
| — |
| 14 |
| — |
| (17 | ) | 618 |
| 26 |
| 584 |
| — |
| (27 | ) | — |
| — |
| — |
| 12 |
| — |
| (18 | ) | 551 |
| (25 | ) |
| Other financial assets measured on a recurring basis | — |
| — |
| 15 |
| — |
| — |
| — |
| — |
| (4 | ) | (11 | ) | — |
| 14 |
| — |
| — |
| 16 |
| — |
| — |
| — |
| (2 | ) | (4 | ) | (10 | ) | — |
| 12 |
|
| Liabilities |
|
|
|
|
|
|
| Interest-bearing deposits | $ | 320 |
| $ | — |
| $ | 14 |
| $ | — |
| $ | — |
| $ | — |
| $ | — |
| $ | — |
| $ | (3 | ) | $ | 303 |
| $ | 14 |
| $ | 495 |
| $ | — |
| $ | (10 | ) | $ | 1 |
| $ | (4 | ) | $ | — |
| $ | 674 |
| $ | — |
| $ | (129 | ) | $ | 1,047 |
| $ | (157 | ) |
| Federal funds purchased and securities loaned and sold under agreements to repurchase | 966 |
| (31 | ) | — |
| — |
| — |
| — |
| — |
| — |
| — |
| 997 |
| 24 |
| 983 |
| 4 |
| — |
| (1 | ) | 4 |
| — |
| — |
| 1 |
| 58 |
| 1,041 |
| (2 | ) |
| Trading account liabilities |
|
|
|
|
|
|
| Securities sold, not yet purchased | 189 |
| (137 | ) | — |
| 28 |
| (55 | ) | 14 |
| 121 |
| (45 | ) | (2 | ) | 387 |
| (90 | ) | 586 |
| 124 |
| — |
| 1 |
| (441 | ) | — |
| — |
| — |
| (7 | ) | 15 |
| 13 |
|
| Other trading liabilities | — |
| — |
| — |
| — |
| — |
| — |
| — |
| — |
| — |
| — |
| — |
| — |
| — |
| — |
| — |
| — |
| — |
| — |
| — |
| — |
| — |
| — |
|
| Short-term borrowings | 90 |
| 1 |
| — |
| — |
| (18 | ) | — |
| 5 |
| — |
| (37 | ) | 39 |
| 19 |
| 37 |
| 23 |
| — |
| 9 |
| (6 | ) | — |
| 153 |
| — |
| — |
| 170 |
| 18 |
|
| Long-term debt | 13,781 |
| (231 | ) | — |
| 445 |
| (646 | ) | — |
| (42 | ) | (1 | ) | 23 |
| 13,791 |
| (298 | ) | 12,570 |
| (407 | ) | — |
| 877 |
| (1,601 | ) | — |
| 5,950 |
| (3 | ) | (4,466 | ) | 13,734 |
| (1,001 | ) |
| Other financial liabilities measured on a recurring basis | — |
| — |
| — |
| — |
| — |
| — |
| — |
| — |
| — |
| — |
| — |
| — |
| — |
| — |
| — |
| — |
| — |
| — |
| — |
| — |
| — |
| — |
|
| |
| (1) | Changes in fair value of available-for-sale debt securities are recorded in AOCI, unless related to other-than-temporary impairment, while gains and losses from sales are recorded in Realized gains (losses) from sales of investments on in the Consolidated Statement of Income. |
| |
| (2) | Unrealized gains (losses) on MSRs are recorded in Other revenue on in the Consolidated Statement of Income. |
| |
| (3) | Represents the amount of total gains or losses for the period, included in earnings (and AOCI for changes in fair value of available-for-sale debt securities), attributable to the change in fair value relating to assets and liabilities classified as Level 3 that are still held at September 30, 2018.March 31, 2019. |
| |
| (4) | Total Level 3 trading derivative assets and liabilities have been netted in these tables for presentation purposes only. |
| | | | | Net realized/unrealized
gains (losses) incl. in | Transfers | | Unrealized
gains
(losses)
still held(3) | | Net realized/unrealized
gains (losses) incl. in | Transfers | | Unrealized
gains
(losses)
still held(3) |
| In millions of dollars | Dec. 31, 2017 | Principal
transactions | Other(1)(2) | into
Level 3 | out of
Level 3 | Purchases | Issuances | Sales | Settlements | Sept. 30, 2018 | Dec. 31, 2017 | Principal
transactions | Other(1)(2) | into
Level 3 | out of
Level 3 | Purchases | Issuances | Sales | Settlements | Mar. 31, 2018 |
| Assets | |
| |
| |
| |
| |
| |
| |
| |
| |
| |
| |
| |
| |
| |
| |
| |
| |
| |
| |
| |
| |
| |
|
| Federal funds sold and securities borrowed and purchased under agreements to resell | 16 |
| 19 |
| — |
| 48 |
| — |
| 61 |
| — |
| — |
| (79 | ) | 65 |
| 10 |
| $ | 16 |
| $ | 18 |
| $ | — |
| $ | — |
| $ | — |
| $ | — |
| $ | — |
| $ | — |
| $ | (18 | ) | $ | 16 |
| $ | 3 |
|
| Trading non-derivative assets | | | | | | |
| Trading mortgage-backed securities | | | | | | |
| U.S. government-sponsored agency guaranteed | 163 |
| — |
| — |
| 92 |
| (97 | ) | 191 |
| — |
| (221 | ) | — |
| 128 |
| — |
| 163 |
| 1 |
| — |
| 86 |
| (49 | ) | 116 |
| — |
| (111 | ) | — |
| 206 |
| — |
|
| Residential | 164 |
| 116 |
| — |
| 75 |
| (124 | ) | 99 |
| — |
| (115 | ) | — |
| 215 |
| (1 | ) | 164 |
| 22 |
| — |
| 35 |
| (77 | ) | 46 |
| — |
| (47 | ) | — |
| 143 |
| 3 |
|
| Commercial | 57 |
| (3 | ) | — |
| 15 |
| (45 | ) | 67 |
| — |
| (34 | ) | — |
| 57 |
| 2 |
| 57 |
| 1 |
| — |
| 4 |
| (35 | ) | 15 |
| — |
| (7 | ) | — |
| 35 |
| 3 |
|
| Total trading mortgage-backed securities | 384 |
| 113 |
| — |
| 182 |
| (266 | ) | 357 |
| — |
| (370 | ) | — |
| 400 |
| 1 |
| $ | 384 |
| $ | 24 |
| $ | — |
| $ | 125 |
| $ | (161 | ) | $ | 177 |
| $ | — |
| $ | (165 | ) | $ | — |
| $ | 384 |
| $ | 6 |
|
| U.S. Treasury and federal agency securities | — |
| — |
| — |
| 6 |
| — |
| 1 |
| — |
| — |
| (1 | ) | 6 |
| — |
| $ | — |
| $ | — |
| $ | — |
| $ | — |
| $ | — |
| $ | — |
| $ | — |
| $ | — |
| $ | — |
| $ | — |
| $ | — |
|
| State and municipal | 274 |
| 16 |
| — |
| — |
| (96 | ) | 35 |
| — |
| (29 | ) | — |
| 200 |
| 8 |
| 274 |
| 6 |
| — |
| — |
| (44 | ) | — |
| — |
| (25 | ) | — |
| 211 |
| (1 | ) |
| Foreign government | 16 |
| 26 |
| — |
| 2 |
| (13 | ) | 50 |
| — |
| (29 | ) | — |
| 52 |
| 26 |
| 16 |
| — |
| — |
| 2 |
| — |
| 14 |
| — |
| (11 | ) | — |
| 21 |
| — |
|
| Corporate | 275 |
| (119 | ) | — |
| 85 |
| (106 | ) | 389 |
| — |
| (271 | ) | — |
| 253 |
| (1 | ) | 275 |
| 43 |
| — |
| 49 |
| (72 | ) | 34 |
| — |
| (77 | ) | — |
| 252 |
| 84 |
|
| Equity securities | 120 |
| (5 | ) | — |
| 24 |
| (41 | ) | 266 |
| — |
| (194 | ) | — |
| 170 |
| (68 | ) | |
| Marketable equity securities | | 120 |
| 75 |
| — |
| 1 |
| (15 | ) | 168 |
| — |
| (112 | ) | — |
| 237 |
| (3 | ) |
| Asset-backed securities | 1,590 |
| 31 |
| — |
| 65 |
| (86 | ) | 994 |
| — |
| (1,141 | ) | — |
| 1,453 |
| (6 | ) | 1,590 |
| 58 |
| — |
| 18 |
| (15 | ) | 316 |
| — |
| (370 | ) | — |
| 1,597 |
| 73 |
|
| Other trading assets | 615 |
| 161 |
| — |
| 179 |
| (52 | ) | 342 |
| 7 |
| (509 | ) | (13 | ) | 730 |
| 31 |
| 615 |
| 135 |
| — |
| 58 |
| (10 | ) | 112 |
| — |
| (194 | ) | (5 | ) | 716 |
| 6 |
|
| Total trading non-derivative assets | 3,274 |
| 223 |
| — |
| 543 |
| (660 | ) | 2,434 |
| 7 |
| (2,543 | ) | (14 | ) | 3,264 |
| (9 | ) | $ | 3,274 |
| $ | 341 |
| $ | — |
| $ | 253 |
| $ | (317 | ) | $ | 821 |
| $ | — |
| $ | (954 | ) | $ | (5 | ) | $ | 3,418 |
| $ | 165 |
|
Trading derivatives, net(4) | | | | | | |
| Interest rate contracts | (422 | ) | 597 |
| — |
| (6 | ) | (74 | ) | 8 |
| 8 |
| (16 | ) | 24 |
| 119 |
| 540 |
| $ | (422 | ) | $ | 381 |
| $ | — |
| $ | 5 |
| $ | 37 |
| $ | 7 |
| $ | — |
| $ | (16 | ) | $ | 2 |
| $ | (6 | ) | $ | (94 | ) |
| Foreign exchange contracts | 130 |
| 89 |
| — |
| (28 | ) | 59 |
| 11 |
| — |
| (71 | ) | (1 | ) | 189 |
| 52 |
| 130 |
| (62 | ) | — |
| (1 | ) | 8 |
| 1 |
| — |
| — |
| 12 |
| 88 |
| (155 | ) |
| Equity contracts | (2,027 | ) | 163 |
| — |
| (70 | ) | 1,123 |
| 20 |
| (15 | ) | (14 | ) | (94 | ) | (914 | ) | 66 |
| (2,027 | ) | (136 | ) | — |
| (57 | ) | 472 |
| 13 |
| — |
| (7 | ) | 1 |
| (1,741 | ) | 156 |
|
| Commodity contracts | (1,861 | ) | (241 | ) | — |
| 1 |
| 82 |
| 39 |
| — |
| (8 | ) | 183 |
| (1,805 | ) | (70 | ) | (1,861 | ) | (33 | ) | — |
| (47 | ) | 8 |
| 20 |
| — |
| — |
| 4 |
| (1,909 | ) | (42 | ) |
| Credit derivatives | (799 | ) | (338 | ) | — |
| (15 | ) | 19 |
| 2 |
| — |
| 1 |
| 124 |
| (1,006 | ) | (468 | ) | (799 | ) | (62 | ) | — |
| 1 |
| (2 | ) | 2 |
| — |
| 1 |
| — |
| (859 | ) | (203 | ) |
Total trading derivatives, net(4) | (4,979 | ) | 270 |
| — |
| (118 | ) | 1,209 |
| 80 |
| (7 | ) | (108 | ) | 236 |
| (3,417 | ) | 120 |
| $ | (4,979 | ) | $ | 88 |
| $ | — |
| $ | (99 | ) | $ | 523 |
| $ | 43 |
| $ | — |
| $ | (22 | ) | $ | 19 |
| $ | (4,427 | ) | $ | (338 | ) |
| Investments | | | | | | |
| Mortgage-backed securities | | | | | | |
| U.S. government-sponsored agency guaranteed | 24 |
| — |
| 10 |
| — |
| — |
| — |
| — |
| — |
| — |
| 34 |
| (12 | ) | $ | 24 |
| $ | — |
| $ | (1 | ) | $ | — |
| $ | — |
| $ | — |
| $ | — |
| $ | — |
| $ | — |
| $ | 23 |
| $ | 2 |
|
| Residential | — |
| — |
| — |
| — |
| — |
| — |
| — |
| — |
| — |
| — |
| — |
| — |
| — |
| — |
| — |
| — |
| — |
| — |
| — |
| — |
| — |
| — |
|
| Commercial | 3 |
| — |
| 2 |
| 1 |
| (1 | ) | — |
| — |
| — |
| — |
| 5 |
| — |
| 3 |
| — |
| 2 |
| — |
| — |
| — |
| — |
| — |
| — |
| 5 |
| — |
|
| Total investment mortgage-backed securities | 27 |
| — |
| 12 |
| 1 |
| (1 | ) | — |
| — |
| — |
| — |
| 39 |
| (12 | ) | $ | 27 |
| $ | — |
| $ | 1 |
| $ | — |
| $ | — |
| $ | — |
| $ | — |
| $ | — |
| $ | — |
| $ | 28 |
| $ | 2 |
|
| U.S. Treasury and federal agency securities | — |
| — |
| — |
| — |
| — |
| — |
| — |
| — |
| — |
| — |
| — |
| $ | — |
| $ | — |
| $ | — |
| $ | — |
| $ | — |
| $ | — |
| $ | — |
| $ | — |
| $ | — |
| $ | — |
| $ | — |
|
| State and municipal | 737 |
| — |
| (23 | ) | — |
| (18 | ) | 157 |
| — |
| (171 | ) | — |
| 682 |
| (32 | ) | 737 |
| — |
| (16 | ) | — |
| (9 | ) | 29 |
| — |
| (59 | ) | — |
| 682 |
| (33 | ) |
| Foreign government | 92 |
| — |
| (7 | ) | 1 |
| (4 | ) | 107 |
| — |
| (108 | ) | — |
| 81 |
| (3 | ) | 92 |
| — |
| (1 | ) | — |
| (2 | ) | 57 |
| — |
| (76 | ) | — |
| 70 |
| — |
|
| Corporate | 71 |
| — |
| (1 | ) | 3 |
| (66 | ) | 3 |
| — |
| (10 | ) | — |
| — |
| — |
| 71 |
| — |
| (1 | ) | 3 |
| — |
| 3 |
| — |
| — |
| — |
| 76 |
| — |
|
| Equity securities | 2 |
| — |
| — |
| — |
| — |
| — |
| — |
| (1 | ) | (1 | ) | — |
| — |
| |
| Marketable equity securities | | 2 |
| — |
| — |
| — |
| — |
| — |
| — |
| (1 | ) | — |
| 1 |
| — |
|
| Asset-backed securities | 827 |
| — |
| (21 | ) | 3 |
| (521 | ) | 45 |
| — |
| (49 | ) | — |
| 284 |
| (6 | ) | 827 |
| — |
| 10 |
| 2 |
| (342 | ) | — |
| — |
| — |
| — |
| 497 |
| 7 |
|
| Other debt securities | — |
| — |
| — |
| — |
| — |
| — |
| — |
| — |
| — |
| — |
| — |
| — |
| — |
| — |
| — |
| — |
| — |
| — |
| — |
| — |
| — |
| — |
|
| Non-marketable equity securities | 681 |
| — |
| (103 | ) | 193 |
| — |
| 86 |
| — |
| (73 | ) | (51 | ) | 733 |
| (56 | ) | 681 |
| — |
| 24 |
| 30 |
| — |
| 15 |
| — |
| — |
| (16 | ) | 734 |
| 22 |
|
| Total investments | 2,437 |
| — |
| (143 | ) | 201 |
| (610 | ) | 398 |
| — |
| (412 | ) | (52 | ) | 1,819 |
| (109 | ) | $ | 2,437 |
| $ | — |
| $ | 17 |
| $ | 35 |
| $ | (353 | ) | $ | 104 |
| $ | — |
| $ | (136 | ) | $ | (16 | ) | $ | 2,088 |
| $ | (2 | ) |
| | | | | Net realized/unrealized
gains (losses) incl. in | Transfers | | Unrealized
gains
(losses)
still held(3) | | Net realized/unrealized
gains (losses) incl. in | Transfers | | Unrealized
gains
(losses)
still held(3) |
| In millions of dollars | Dec. 31, 2017 | Principal
transactions | Other(1)(2) | into
Level 3 | out of
Level 3 | Purchases | Issuances | Sales | Settlements | Sept. 30, 2018 | Dec. 31, 2017 | Principal
transactions | Other(1)(2) | into
Level 3 | out of
Level 3 | Purchases | Issuances | Sales | Settlements | Mar. 31, 2018 |
| Loans | 550 |
| — |
| (282 | ) | — |
| 13 |
| 130 |
| — |
| (25 | ) | (3 | ) | 383 |
| 286 |
| $ | 550 |
| $ | — |
| $ | 19 |
| $ | — |
| $ | (1 | ) | $ | 4 |
| $ | — |
| $ | (16 | ) | $ | (2 | ) | $ | 554 |
| $ | 26 |
|
| Mortgage servicing rights | 558 |
| — |
| 82 |
| — |
| — |
| — |
| 46 |
| (18 | ) | (50 | ) | 618 |
| 83 |
| 558 |
| — |
| 46 |
| — |
| — |
| — |
| 17 |
| (17 | ) | (17 | ) | 587 |
| 46 |
|
| Other financial assets measured on a recurring basis | 16 |
| — |
| 37 |
| — |
| (11 | ) | 4 |
| 12 |
| (8 | ) | (50 | ) | — |
| 53 |
| 16 |
| — |
| 8 |
| — |
| — |
| 4 |
| 12 |
| — |
| (27 | ) | 13 |
| 18 |
|
| Liabilities | | | | | | |
| Interest-bearing deposits | 286 |
| — |
| 37 |
| 12 |
| — |
| — |
| 45 |
| — |
| (3 | ) | 303 |
| (104 | ) | $ | 286 |
| $ | — |
| $ | 26 |
| $ | 12 |
| $ | — |
| $ | — |
| $ | 20 |
| $ | — |
| $ | — |
| $ | 292 |
| $ | 29 |
|
| Federal funds purchased and securities loaned and sold under agreements to repurchase | 726 |
| 8 |
| — |
| — |
| — |
| — |
| 243 |
| — |
| 36 |
| 997 |
| 52 |
| 726 |
| 14 |
| — |
| — |
| — |
| — |
| 147 |
| — |
| (2 | ) | 857 |
| 14 |
|
| Trading account liabilities | | | | | | |
| Securities sold, not yet purchased | 22 |
| (384 | ) | — |
| 35 |
| (86 | ) | 14 |
| 121 |
| (36 | ) | (67 | ) | 387 |
| (128 | ) | 22 |
| (105 | ) | — |
| 3 |
| (19 | ) | — |
| — |
| 3 |
| (66 | ) | 48 |
| (7 | ) |
| Other trading liabilities | 5 |
| 5 |
| — |
| — |
| — |
| — |
| — |
| — |
| — |
| — |
| — |
| 5 |
| 5 |
| — |
| — |
| — |
| — |
| — |
| — |
| — |
| — |
| (5 | ) |
| Short-term borrowings | 18 |
| 2 |
| — |
| 48 |
| (39 | ) | — |
| 54 |
| — |
| (40 | ) | 39 |
| 22 |
| 18 |
| 7 |
| — |
| 45 |
| — |
| — |
| 25 |
| — |
| — |
| 81 |
| (2 | ) |
| Long-term debt | 13,082 |
| (474 | ) | — |
| 2,200 |
| (1,950 | ) | 36 |
| (35 | ) | (45 | ) | 29 |
| 13,791 |
| (1,709 | ) | 13,082 |
| (236 | ) | — |
| 940 |
| (764 | ) | 36 |
| 3 |
| (44 | ) | (5 | ) | 13,484 |
| 254 |
|
| Other financial liabilities measured on a recurring basis | 8 |
| — |
| (2 | ) | 1 |
| (10 | ) | — |
| 2 |
| — |
| (3 | ) | — |
| (9 | ) | 8 |
| — |
| — |
| — |
| (5 | ) | — |
| 2 |
| — |
| (2 | ) | 3 |
| (1 | ) |
| |
| (1) | Changes in fair value of available-for-sale debt securities are recorded in AOCI, unless related to other-than-temporary impairment, while gains and losses from sales are recorded in Realized gains (losses) from sales of investments on in the Consolidated Statement of Income. |
| |
| (2) | Unrealized gains (losses) on MSRs are recorded in Other revenue on in the Consolidated Statement of Income. |
| |
| (3) | Represents the amount of total gains or losses for the period, included in earnings (and AOCI for changes in fair value of available-for-sale debt securities), attributable to the change in fair value relating to assets and liabilities classified as Level 3 that are still held at December 31, 2017.2018. |
| |
| (4) | Total Level 3 trading derivative assets and liabilities have been netted in these tables for presentation purposes only. |
|
| | | | | | | | | | | | | | | | | | | | | | | | | | | | | | | | | |
| | | Net realized/unrealized
gains (losses) incl. in | Transfers | | | | | | Unrealized
gains
(losses)
still held(3) |
| In millions of dollars | Jun. 30, 2017 | Principal
transactions | Other(1)(2) | into
Level 3 | out of
Level 3 | Purchases | Issuances | Sales | Settlements | Sept. 30, 2017 |
| Assets | | | | | | | | | | | |
| Federal funds sold and securities borrowed and purchased under agreements to resell | $ | 1,002 |
| $ | (338 | ) | $ | — |
| $ | — |
| $ | — |
| $ | — |
| $ | — |
| $ | — |
| $ | — |
| $ | 664 |
| $ | (338 | ) |
| Trading non-derivative assets | | | | | | | | | | | |
| Trading mortgage-backed securities | | | | | | | | | | | |
| U.S. government-sponsored agency guaranteed | $ | 204 |
| $ | — |
| $ | — |
| $ | 75 |
| $ | (21 | ) | $ | 174 |
| $ | — |
| $ | (123 | ) | $ | — |
| $ | 309 |
| $ | — |
|
| Residential | 327 |
| 24 |
| — |
| 41 |
| (9 | ) | 39 |
| — |
| (71 | ) | — |
| 351 |
| 12 |
|
| Commercial | 318 |
| 10 |
| — |
| 22 |
| (17 | ) | 11 |
| — |
| (232 | ) | — |
| 112 |
| 5 |
|
| Total trading mortgage-backed securities | $ | 849 |
| $ | 34 |
| $ | — |
| $ | 138 |
| $ | (47 | ) | $ | 224 |
| $ | — |
| $ | (426 | ) | $ | — |
| $ | 772 |
| $ | 17 |
|
| U.S. Treasury and federal agency securities | $ | — |
| $ | — |
| $ | — |
| $ | — |
| $ | — |
| $ | — |
| $ | — |
| $ | — |
| $ | — |
| $ | — |
| $ | — |
|
| State and municipal | 284 |
| (2 | ) | — |
| — |
| — |
| 49 |
| — |
| (61 | ) | — |
| 270 |
| (1 | ) |
| Foreign government | 108 |
| (5 | ) | — |
| 4 |
| (114 | ) | 161 |
| — |
| (59 | ) | — |
| 95 |
| (2 | ) |
| Corporate | 401 |
| 105 |
| — |
| 16 |
| (11 | ) | 148 |
| — |
| (268 | ) | — |
| 391 |
| 103 |
|
| Equity securities | 240 |
| 183 |
| — |
| 3 |
| (41 | ) | 29 |
| — |
| (178 | ) | — |
| 236 |
| 6 |
|
| Asset-backed securities | 1,570 |
| 114 |
| — |
| 5 |
| (6 | ) | 481 |
| — |
| (460 | ) | — |
| 1,704 |
| 26 |
|
| Other trading assets | 1,803 |
| (38 | ) | — |
| 38 |
| (607 | ) | 1,349 |
| 4 |
| (394 | ) | (4 | ) | 2,151 |
| 29 |
|
| Total trading non-derivative assets | $ | 5,255 |
| $ | 391 |
| $ | — |
| $ | 204 |
| $ | (826 | ) | $ | 2,441 |
| $ | 4 |
| $ | (1,846 | ) | $ | (4 | ) | $ | 5,619 |
| $ | 178 |
|
Trading derivatives, net(4) | | | | | | | | | | | |
| Interest rate contracts | (288 | ) | 196 |
| — |
| 4 |
| (4 | ) | 25 |
| — |
| (20 | ) | (114 | ) | (201 | ) | 120 |
|
| Foreign exchange contracts | 184 |
| (92 | ) | — |
| 1 |
| (4 | ) | (6 | ) | — |
| (3 | ) | 68 |
| 148 |
| (92 | ) |
| Equity contracts | (1,647 | ) | 201 |
| — |
| (52 | ) | (34 | ) | 31 |
| — |
| (126 | ) | (221 | ) | (1,848 | ) | (10 | ) |
| Commodity contracts | (2,024 | ) | (248 | ) | — |
| (29 | ) | (10 | ) | — |
| — |
| (3 | ) | (25 | ) | (2,339 | ) | (255 | ) |
| Credit derivatives | (1,339 | ) | (150 | ) | — |
| 25 |
| 115 |
| 7 |
| — |
| — |
| 401 |
| (941 | ) | (185 | ) |
Total trading derivatives, net(4) | $ | (5,114 | ) | $ | (93 | ) | $ | — |
| $ | (51 | ) | $ | 63 |
| $ | 57 |
| $ | — |
| $ | (152 | ) | $ | 109 |
| $ | (5,181 | ) | $ | (422 | ) |
| Investments | | | | | | | | | | | |
| Mortgage-backed securities | | | | | | | | | | | |
| U.S. government-sponsored agency guaranteed | $ | 50 |
| $ | — |
| $ | 12 |
| $ | — |
| $ | (5 | ) | $ | — |
| $ | — |
| $ | — |
| $ | — |
| $ | 57 |
| $ | 28 |
|
| Residential | — |
| — |
| — |
| — |
| — |
| — |
| — |
| — |
| — |
| — |
| — |
|
| Commercial | — |
| — |
| — |
| 3 |
| — |
| — |
| — |
| — |
| — |
| 3 |
| — |
|
| Total investment mortgage-backed securities | $ | 50 |
| $ | — |
| $ | 12 |
| $ | 3 |
| $ | (5 | ) | $ | — |
| $ | — |
| $ | — |
| $ | — |
| $ | 60 |
| $ | 28 |
|
| U.S. Treasury and federal agency securities | $ | 1 |
| $ | — |
| $ | — |
| $ | — |
| $ | — |
| $ | — |
| $ | — |
| $ | (1 | ) | $ | — |
| $ | — |
| $ | — |
|
| State and municipal | 1,285 |
| — |
| (2 | ) | 21 |
| (3 | ) | 16 |
| — |
| (45 | ) | — |
| 1,272 |
| 17 |
|
| Foreign government | 358 |
| — |
| (58 | ) | — |
| (18 | ) | 122 |
| — |
| (103 | ) | — |
| 301 |
| (7 | ) |
| Corporate | 156 |
| — |
| 146 |
| 10 |
| (2 | ) | 41 |
| — |
| (231 | ) | — |
| 120 |
| — |
|
| Equity securities | 9 |
| — |
| (1 | ) | — |
| — |
| — |
| — |
| (5 | ) | — |
| 3 |
| — |
|
| Asset-backed securities | 1,028 |
| — |
| (280 | ) | 2 |
| (7 | ) | 504 |
| — |
| (417 | ) | — |
| 830 |
| (134 | ) |
| Other debt securities | 10 |
| — |
| — |
| — |
| — |
| — |
| — |
| — |
| — |
| 10 |
| — |
|
| Non-marketable equity securities | 939 |
| — |
| (61 | ) | — |
| — |
| 1 |
| — |
| (1 | ) | (49 | ) | 829 |
| (18 | ) |
| Total investments | $ | 3,836 |
| $ | — |
| $ | (244 | ) | $ | 36 |
| $ | (35 | ) | $ | 684 |
| $ | — |
| $ | (803 | ) | $ | (49 | ) | $ | 3,425 |
| $ | (114 | ) |
|
| | | | | | | | | | | | | | | | | | | | | | | | | | | | | | | | | |
| | | Net realized/unrealized
gains (losses) incl. in | Transfers | | | | | | Unrealized
gains
(losses)
still held(3) |
| In millions of dollars | Jun. 30, 2017 | Principal
transactions | Other(1)(2) | into
Level 3 | out of
Level 3 | Purchases | Issuances | Sales | Settlements | Sept. 30, 2017 |
| Loans | $ | 577 |
| $ | — |
| $ | 73 |
| $ | — |
| $ | — |
| $ | 131 |
| $ | — |
| $ | (236 | ) | $ | (1 | ) | $ | 544 |
| $ | 264 |
|
| Mortgage servicing rights | 560 |
| — |
| (6 | ) | — |
| — |
| — |
| 19 |
| — |
| (20 | ) | 553 |
| 3 |
|
| Other financial assets measured on a recurring basis | 17 |
| — |
| 13 |
| — |
| — |
| 1 |
| 43 |
| (4 | ) | (56 | ) | 14 |
| 17 |
|
| Liabilities | | | | | | | | | | | |
| Interest-bearing deposits | $ | 300 |
| $ | — |
| $ | (2 | ) | $ | — |
| $ | — |
| $ | — |
| $ | — |
| $ | — |
| $ | (2 | ) | $ | 300 |
| $ | 6 |
|
| Federal funds purchased and securities loaned and sold under agreements to repurchase | 807 |
| (1 | ) | — |
| — |
| — |
| — |
| — |
| — |
| (43 | ) | 765 |
| 4 |
|
| Trading account liabilities | | | | | | | | | | | |
| Securities sold, not yet purchased | 1,143 |
| 496 |
| — |
| 5 |
| (10 | ) | — |
| — |
| 88 |
| (46 | ) | 684 |
| 24 |
|
| Short-term borrowings | 29 |
| (13 | ) | — |
| 3 |
| (1 | ) | — |
| 12 |
| — |
| — |
| 56 |
| 7 |
|
| Long-term debt | 11,831 |
| 1,057 |
| — |
| 181 |
| (490 | ) | — |
| 419 |
| — |
| 437 |
| 11,321 |
| 716 |
|
| Other financial liabilities measured on a recurring basis | 2 |
| — |
| — |
| — |
| — |
| — |
| 1 |
| — |
| (1 | ) | 2 |
| (1 | ) |
|
| | | | | | | | | | | | | | | | | | | | | | | | | | | | | | | | | |
| | | Net realized/unrealized
gains (losses) incl. in | Transfers | | | | | | Unrealized
gains
(losses)
still held(3) |
| In millions of dollars | Dec. 31, 2016 | Principal
transactions | Other(1)(2) | into
Level 3 | out of
Level 3 | Purchases | Issuances | Sales | Settlements | Sept. 30, 2017 |
| Assets | | | | | | | | | | | |
| Federal funds sold and securities borrowed and purchased under agreements to resell | $ | 1,496 |
| $ | (340 | ) | $ | — |
| $ | — |
| $ | (491 | ) | $ | — |
| $ | — |
| $ | — |
| $ | (1 | ) | $ | 664 |
| $ | — |
|
| Trading non-derivative assets | | | | | | | | | | | |
| Trading mortgage-backed securities | | | | | | | | | | | |
| U.S. government-sponsored agency guaranteed | 176 |
| 4 |
| — |
| 154 |
| (86 | ) | 438 |
| — |
| (377 | ) | — |
| 309 |
| 1 |
|
| Residential | 399 |
| 61 |
| — |
| 88 |
| (58 | ) | 105 |
| — |
| (244 | ) | — |
| 351 |
| 35 |
|
| Commercial | 206 |
| 7 |
| — |
| 66 |
| (46 | ) | 445 |
| — |
| (566 | ) | — |
| 112 |
| (5 | ) |
| Total trading mortgage-backed securities | $ | 781 |
| $ | 72 |
| $ | — |
| $ | 308 |
| $ | (190 | ) | $ | 988 |
| $ | — |
| $ | (1,187 | ) | $ | — |
| $ | 772 |
| $ | 31 |
|
| U.S. Treasury and federal agency securities | $ | 1 |
| $ | — |
| $ | — |
| $ | — |
| $ | — |
| $ | — |
| $ | — |
| $ | (1 | ) | $ | — |
| $ | — |
| $ | — |
|
| State and municipal | 296 |
| 3 |
| — |
| 24 |
| (48 | ) | 137 |
| — |
| (142 | ) | — |
| 270 |
| (1 | ) |
| Foreign government | 40 |
| 2 |
| — |
| 88 |
| (204 | ) | 288 |
| — |
| (119 | ) | — |
| 95 |
| (1 | ) |
| Corporate | 324 |
| 320 |
| — |
| 132 |
| (84 | ) | 424 |
| — |
| (725 | ) | — |
| 391 |
| 167 |
|
| Equity securities | 127 |
| 212 |
| — |
| 135 |
| (54 | ) | 38 |
| — |
| (222 | ) | — |
| 236 |
| 20 |
|
| Asset-backed securities | 1,868 |
| 251 |
| — |
| 28 |
| (87 | ) | 1,185 |
| — |
| (1,541 | ) | — |
| 1,704 |
| 34 |
|
| Other trading assets | 2,814 |
| (88 | ) | — |
| 470 |
| (1,381 | ) | 2,002 |
| 5 |
| (1,652 | ) | (19 | ) | 2,151 |
| 29 |
|
| Total trading non-derivative assets | $ | 6,251 |
| $ | 772 |
| $ | — |
| $ | 1,185 |
| $ | (2,048 | ) | $ | 5,062 |
| $ | 5 |
| $ | (5,589 | ) | $ | (19 | ) | $ | 5,619 |
| $ | 279 |
|
Trading derivatives, net(4) | | | | | | | | | | | |
| Interest rate contracts | $ | (663 | ) | $ | 4 |
| $ | — |
| $ | (24 | ) | $ | 647 |
| $ | 90 |
| $ | — |
| $ | (225 | ) | $ | (30 | ) | $ | (201 | ) | $ | 65 |
|
| Foreign exchange contracts | 413 |
| (389 | ) | — |
| 54 |
| (63 | ) | 32 |
| — |
| (37 | ) | 138 |
| 148 |
| (134 | ) |
| Equity contracts | (1,557 | ) | 98 |
| — |
| (34 | ) | (8 | ) | 180 |
| — |
| (263 | ) | (264 | ) | (1,848 | ) | (22 | ) |
| Commodity contracts | (1,945 | ) | (576 | ) | — |
| 29 |
| 39 |
| — |
| — |
| (3 | ) | 117 |
| (2,339 | ) | (255 | ) |
| Credit derivatives | (1,001 | ) | (535 | ) | — |
| (43 | ) | 91 |
| 5 |
| — |
| 2 |
| 540 |
| (941 | ) | (197 | ) |
Total trading derivatives, net(4) | $ | (4,753 | ) | $ | (1,398 | ) | $ | — |
| $ | (18 | ) | $ | 706 |
| $ | 307 |
| $ | — |
| $ | (526 | ) | $ | 501 |
| $ | (5,181 | ) | $ | (543 | ) |
| Investments | | | | | | | | | | | |
| Mortgage-backed securities | | | | | | | | | | | |
| U.S. government-sponsored agency guaranteed | $ | 101 |
| $ | — |
| $ | 15 |
| $ | 1 |
| $ | (60 | ) | $ | — |
| $ | — |
| $ | — |
| $ | — |
| $ | 57 |
| $ | 30 |
|
| Residential | 50 |
| — |
| 2 |
| — |
| (47 | ) | — |
| — |
| (5 | ) | — |
| — |
| — |
|
| Commercial | — |
| — |
| — |
| 3 |
| — |
| 8 |
| — |
| (8 | ) | — |
| 3 |
| — |
|
| Total investment mortgage-backed securities | $ | 151 |
| $ | — |
| $ | 17 |
| $ | 4 |
| $ | (107 | ) | $ | 8 |
| $ | — |
| $ | (13 | ) | $ | — |
| $ | 60 |
| $ | 30 |
|
| U.S. Treasury and federal agency securities | $ | 2 |
| $ | — |
| $ | — |
| $ | — |
| $ | — |
| $ | — |
| $ | — |
| $ | (2 | ) | $ | — |
| $ | — |
| $ | — |
|
| State and municipal | 1,211 |
| — |
| 37 |
| 70 |
| (36 | ) | 92 |
| — |
| (102 | ) | — |
| 1,272 |
| 35 |
|
| Foreign government | 186 |
| — |
| (47 | ) | 2 |
| (37 | ) | 455 |
| — |
| (258 | ) | — |
| 301 |
| (5 | ) |
| Corporate | 311 |
| — |
| 11 |
| 74 |
| (6 | ) | 224 |
| — |
| (494 | ) | — |
| 120 |
| — |
|
| Equity securities | 9 |
| — |
| (1 | ) | — |
| — |
| — |
| — |
| (5 | ) | — |
| 3 |
| — |
|
| Asset-backed securities | 660 |
| — |
| (98 | ) | 23 |
| (20 | ) | 864 |
| — |
| (599 | ) | — |
| 830 |
| (134 | ) |
| Other debt securities | — |
| — |
| — |
| — |
| — |
| 21 |
| — |
| (11 | ) | — |
| 10 |
| — |
|
| Non-marketable equity securities | 1,331 |
| — |
| (124 | ) | 2 |
| — |
| 10 |
| — |
| (228 | ) | (162 | ) | 829 |
| 49 |
|
| Total investments | $ | 3,861 |
| $ | — |
| $ | (205 | ) | $ | 175 |
| $ | (206 | ) | $ | 1,674 |
| $ | — |
| $ | (1,712 | ) | $ | (162 | ) | $ | 3,425 |
| $ | (25 | ) |
|
| | | | | | | | | | | | | | | | | | | | | | | | | | | | | | | | | |
| | | Net realized/unrealized
gains (losses) incl. in | Transfers | | | | | | Unrealized
gains
(losses)
still held(3) |
| In millions of dollars | Dec. 31, 2016 | Principal
transactions | Other(1)(2) | into
Level 3 | out of
Level 3 | Purchases | Issuances | Sales | Settlements | Sept. 30, 2017 |
| Loans | $ | 568 |
| $ | — |
| $ | 57 |
| $ | 80 |
| $ | (16 | ) | $ | 173 |
| $ | — |
| $ | (312 | ) | $ | (6 | ) | $ | 544 |
| $ | 266 |
|
| Mortgage servicing rights | 1,564 |
| — |
| 50 |
| — |
| — |
| — |
| 75 |
| (1,046 | ) | (90 | ) | 553 |
| (40 | ) |
| Other financial assets measured on a recurring basis | 34 |
| — |
| (147 | ) | 3 |
| (8 | ) | 1 |
| 303 |
| (8 | ) | (164 | ) | 14 |
| (68 | ) |
| Liabilities | | | | | | | | | | | |
| Interest-bearing deposits | $ | 293 |
| $ | — |
| $ | 9 |
| $ | 40 |
| $ | — |
| $ | — |
| $ | — |
| $ | — |
| $ | (24 | ) | $ | 300 |
| $ | 6 |
|
| Federal funds purchased and securities loaned and sold under agreements to repurchase | 849 |
| 7 |
| — |
| — |
| — |
| — |
| — |
| — |
| (77 | ) | 765 |
| 4 |
|
| Trading account liabilities | | | | | | | | | | | |
| Securities sold, not yet purchased | 1,177 |
| 490 |
| — |
| 18 |
| (53 | ) | — |
| — |
| 265 |
| (233 | ) | 684 |
| 24 |
|
| Short-term borrowings | 42 |
| 18 |
| — |
| 4 |
| (1 | ) | — |
| 31 |
| — |
| (2 | ) | 56 |
| 7 |
|
| Long-term debt | 9,744 |
| 456 |
| — |
| 702 |
| (1,457 | ) | — |
| 2,701 |
| — |
| 87 |
| 11,321 |
| 708 |
|
| Other financial liabilities measured on a recurring basis | 8 |
| — |
| — |
| — |
| — |
| — |
| 3 |
| (1 | ) | (8 | ) | 2 |
| (1 | ) |
| |
(1) | Changes in fair value of available-for-sale investments are recorded in AOCI, unless related to other-than-temporary impairment, while gains and losses from sales are recorded in Realized gains (losses) from sales of investments on the Consolidated Statement of Income.
|
| |
(2) | Unrealized gains (losses) on MSRs are recorded in Other revenue on the Consolidated Statement of Income.
|
| |
(3) | Represents the amount of total gains or losses for the period, included in earnings (and AOCI for changes in fair value of available-for-sale investments), attributable to the change in fair value relating to assets and liabilities classified as Level 3 that are still held at June 30, 2017. |
| |
(4) | Total Level 3 derivative assets and liabilities have been netted in these tables for presentation purposes only. |
Level 3 Fair Value Rollforward
The following were the significant Level 3 transfers for the period December 31, 20172018 to September 30, 2018:March 31, 2019.
| |
| • | Transfers of Long-term debt of $0.9 billion from Level 2 to Level 3, and of $1.6 billion from Level 3 to Level 2, mainly related to structured debt, reflecting changes in the significance of unobservable inputs as well as certain underlying market inputs becoming less or more observable. |
During the three and nine months ended September 30, 2018, transfers of Long-term debt of $0.4 billion and $2.2 billion from Level 2 to Level 3, and of $0.6 billion and $2.0 billion from Level 3 to Level 2, mainly related to structured debt, reflecting changes in the significance of unobservable inputs as well as certain underlying market inputs becoming less or more observable.
The were no significant Level 3 transfers for the period from June 30, 2017 to September 30, 2017.
The following were the significant Level 3 transfers for the period December 31, 20162017 to September 30, 2017:March 31, 2018.
| |
| • | Transfers of Long-term debt of $0.9 billion from Level 2 to Level 3, and of $0.8 billion from Level 3 to Level 2, mainly related to structured debt, reflecting changes in the significance of unobservable inputs as well as certain underlying market inputs becoming less or more observable. |
Transfers of Long-term debt of $0.7 billion from Level 2 to Level 3, and of $1.5 billion from Level 3 to Level 2, mainly related to structured debt, reflecting changes in the significance of unobservable inputs as well as certain underlying market inputs becoming less or more observable.
Valuation Techniques and Inputs for Level 3 Fair Value Measurements
The following tables present the valuation techniques covering the majority of Level 3 inventory and the most significant unobservable inputs used in Level 3 fair value measurements. Differences between this table and amounts presented in the Level 3 Fair Value Rollforward table represent individually immaterial items that have been measured using a variety of valuation techniques other than those listed.
| | | As of September 30, 2018 | Fair value(1) (in millions) | Methodology | Input | Low(2)(3) | High(2)(3) | Weighted average(4) | |
| As of March 31, 2019 | | Fair value(1) (in millions) | Methodology | Input | Low(2)(3) | High(2)(3) | Weighted average(4) |
| Assets | | | | | | | | |
| Federal funds sold and securities borrowed and purchased under agreements to resell | $ | 65 |
| Model-based | Interest rate | 2.27 | % | 3.67 | % | 3.54 | % | $ | 66 |
| Model-based | Interest rate | 2.27 | % | 3.67 | % | 3.40 | % |
| Mortgage-backed securities | $ | 273 |
| Price-based | Price | $ | 37.40 |
| $ | 108.00 |
| $ | 92.56 |
| $ | 192 |
| Yield analysis | Yield | 2.49 | % | 4.63 | % | 3.47 | % |
| | 137 |
| Yield analysis | Yield | 3.13 | % | 14.29 | % | 4.72 | % | 166 |
| Price-based | Price | $ | 35.00 |
| $ | 320.00 |
| $ | 91.58 |
|
| |
|
| | | |
| State and municipal, foreign government, corporate and other debt securities | $ | 930 |
| Price-based | Price | $ | — |
| $ | 108.15 |
| $ | 79.65 |
| $ | 1,436 |
| Price-based | Price | $ | — |
| $ | 568.28 |
| $ | 78.53 |
|
| | 926 |
| Model-based | Credit spread | 35 bps |
| 446 bps |
| 246 bps |
| 1,037 |
| Model-based | Credit spread | 35 bps |
| 375 bps |
| 238 bps |
|
Equity securities(5) | $ | 124 |
| Price-based | Price | $ | — |
| $ | 865.86 |
| $ | 3.50 |
| |
| | 46 |
| Model-based | WAL | 1.73 years |
| 1.73 years |
| 1.73 years |
| |
Marketable equity securities(5) | | $ | 110 |
| Price-based | Price | $ | 0.01 |
| $ | 28,822.00 |
| $ | 2,698.08 |
|
| |
| |
| 16 |
| Model-based | |
|
|
|
|
|
|
| Asset-backed securities | $ | 1,666 |
| Price-based | Price | $ | 3.56 |
| $ | 100.91 |
| $ | 69.41 |
| $ | 2,154 |
| Price-based | Price | $ | 4.20 |
| $ | 101.20 |
| $ | 79.18 |
|
| Non-marketable equities | $ | 428 |
| Comparables analysis | Net operating income multiple | $ | 7.30 |
| $ | 25.00 |
| $ | 10.49 |
| $ | 266 |
| Comparables analysis | Discount to price | — | % | 10.00 | % | 1.11 | % |
| | | 219 |
| Price based | EBITDA multiples | 7.75 | x | 11.50 | x | 8.66 | x |
| | | | | Price | $ | 13.80 |
| $ | 1,345.00 |
| $ | 711.39 |
|
| | $ | 282 |
| Price-based | Discount to price | — | % | 100.00 | % | 0.62 | % |
| | Revenue multiple | 1.50 | x | 18.40 | x | 7.17 | x |
Derivatives—gross(6) | | | | | | |
| Interest rate contracts (gross) | $ | 4,470 |
| Model-based | Mean reversion | 1.00 | % | 20.00 | % | 10.50 | % | $ | 3,248 |
| Model-based | Inflation volatility | 0.22 | % | 2.63 | % | 0.79 | % |
| | | | IR normal volatility | 0.14 | % | 78.79 | % | 53.37 | % | | | Mean reversion | 1.00 | % | 20.00 | % | 10.50 | % |
| | | | Inflation volatility | 0.20 | % | 2.56 | % | 0.76 | % | | | IR normal volatility | 0.16 | % | 71.90 | % | 49.46 | % |
| Foreign exchange contracts (gross) | $ | 749 |
| Model-based | FX volatility | 3.15 | % | 17.35 | % | 10.96 | % | $ | 597 |
| Model-based | FX volatility | 3.15 | % | 18.85 | % | 11.34 | % |
| | $ | 82 |
| Cash flow | Credit spread | 39 bps |
| 880 bps |
| 379 bps |
|
| | IR-IR correlation | (51.00 | )% | 40.00 | % | 31.87 | % |
| | | | IR-IR correlation | (51.00 | )% | 40.00 | % | 33.60 | % | | | IR-FX correlation | 40.00 | % | 60.00 | % | 50.00 | % |
| | | | IR-FX correlation | 40.00 | % | 60.00 | % | 50.00 | % | | | Interest rate | 5.05 | % | 12.89 | % | 9.00 | % |
| | | | FX rate | — | % | 0.04 | % | 0.03 | % | | | Credit spread | 34 bps |
| 642 bps |
| 403 bps |
|
| | | | IR basis | (0.79 | )% | 9.00 | % | 0.67 | % | | | IR Normal Volatility | 0.16 | % | 71.90 | % | 50.81 | % |
| Equity contracts (gross) | $ | 1,478 |
| Model-based | Equity volatility | 3.00 | % | 83.72 | % | 28.96 | % | $ | 2,026 |
| Model-based | Equity volatility | 3.00 | % | 82.43 | % | 41.37 | % |
| | | | Forward price | 63.10 | % | 159.10 | % | 97.77 | % | | | Forward price | 64.31 | % | 132.11 | % | 108.84 | % |
| | | | WAL | 1.73 years |
| 1.73 years |
| 1.73 years |
| |
| Commodity and other contracts (gross) | $ | 3,049 |
| Model-based | Forward price | 45.19 | % | 549.00 | % | 129.77 | % | $ | 1,163 |
| Model-based | Forward price | 71.67 | % | 524.74 | % | 137.37 | % |
| | | | Commodity volatility | 7.60 | % | 55.00 | % | 17.32 | % | | | Commodity volatility | 6.88 | % | 55.75 | % | 18.17 | % |
| | | | Commodity Correlation | (52.45 | )% | 91.37 | % | 17.71 | % | | | Commodity correlation | (38.66 | )% | 89.50 | % | 48.87 | % |
| Credit derivatives (gross) | $ | 1,924 |
| Model-based | Credit correlation | 25.00 | % | 85.00 | % | 43.50 | % | $ | 816 |
| Model-based | Upfront points | 6.17 | % | 99.00 | % | 61.76 | % |
| | 714 |
| Price-based | Upfront points | 5.13 | % | 97.98 | % | 53.49 | % | 650 |
| Price-based | Credit spread | 3 bps |
| 530 bps |
| 86 bps |
|
| | | | Credit spread | 2 bps |
| 1,260 bps |
| 84 bps |
| | | Credit correlation | 25.00 | % | 85.00 | % | 43.55 | % |
| | | | Price | $ | 31.77 |
| $ | 98.00 |
| $ | 79.28 |
| | | Recovery rate | 5.00 | % | 65.00 | % | 42.85 | % |
| | | | Recovery rate | 5.00 | % | 65.00 | % | 48.09 | % | | | Price | $ | 12.00 |
| $ | 98.00 |
| $ | 76.69 |
|
| | | As of September 30, 2018 | Fair value(1) (in millions) | Methodology | Input | Low(2)(3) | High(2)(3) | Weighted average(4) | |
| As of March 31, 2019 | | Fair value(1) (in millions) | Methodology | Input | Low(2)(3) | High(2)(3) | Weighted average(4) |
| Loans and leases | $ | 318 |
| Model-based | Credit spread | 128 bps |
| 215 bps |
| 161 bps |
| $ | 353 |
| Model-based | Credit spread | 115 bps |
| 470 bps |
| 129 bps |
|
| | 66 |
| Price-based | Yield | 4.15 | % | 4.15 | % | 4.15 | % |
|
| | Equity volatility | 26.53 | % | 30.83 | % | 28.66 | % |
| | | |
| | | Yield | — | % | — | % | — | % |
| Mortgage servicing rights | $ | 531 |
| Cash flow | Yield | 4.79 | % | 12.00 | % | 8.31 | % | $ | 467 |
| Cash flow | Yield | 4.42 | % | 12.00 | % | 7.30 | % |
| | 87 |
| Model-based | WAL | 4.11 years |
| 8.10 years |
| 6.92 years |
| 83 |
| Model-based | WAL | 3.35 years |
| 6.91 years |
| 5.99 years |
|
| Liabilities | | | | | | |
| Interest-bearing deposits | $ | 303 |
| Model-based | Mean reversion | — | % | 20.00 | % | 7.95 | % | $ | 1,047 |
| Model-based | Mean reversion | 1.00 | % | 20.00 | % | 10.50 | % |
| | | | Forward price | 99.23 | % | 106.69 | % | 101.80 | % | |
| | | | Equity volatility | 7.34 | % | 20.78 | % | 17.98 | % | |
| Federal funds purchased and securities loaned and sold under agreement to repurchase | $ | 997 |
| Model-based | Interest rate | 2.27 | % | 3.41 | % | 3.14 | % | $ | 1,041 |
| Model-based | Interest rate | 2.27 | % | 2.89 | % | 2.52 | % |
| Trading account liabilities | | | | | | |
| Securities sold, not yet purchased | $ | 360 |
| Model-based | Forward price | 45.19 | % | 549.00 | % | 100.21 | % | $ | 8 |
| Price-based | Price | $ | — |
| $ | 994.85 |
| $ | 89.80 |
|
| |
| | Equity volatility | 3.00 | % | 83.72 | % | 22.17 | % | 6 |
| Model-based | |
|
| | | | Equity-equity correlation | (81.39 | )% | 100.00 | % | 41.02 | % | |
| | | | Equity-FX correlation | (82.74 | )% | 54.00 | % | (32.58 | )% | |
| | | | Mean reversion | 1.00 | % | 20.00 | % | 10.50 | % | |
| | | |
| |
| Short-term borrowings and long-term debt | $ | 12,944 |
| Model-based | Mean reversion | 1.00 | % | 20.00 | % | 10.50 | % | $ | 14,026 |
| Model-based | Mean reversion | 1.00 | % | 20.00 | % | 10.50 | % |
| | | | Forward price | 65.99 | % | 259.53 | % | 103.59 | % | | | Forward price | 64.31 | % | 524.74 | % | 109.75 | % |
| | | | Equity volatility | 3.00 | % | 83.72 | % | 19.28 | % | | | IR normal volatility | 0.16 | % | 71.90 | % | 52.74 | % |
| | | As of December 31, 2017 | Fair value(1) (in millions) | Methodology | Input | Low(2)(3) |
| High(2)(3) | Weighted average(4) | |
| As of December 31, 2018 | | Fair value(1) (in millions) | Methodology | Input | Low(2)(3) |
| High(2)(3) | Weighted average(4) |
| Assets | | | |
| | | | |
| |
| Federal funds sold and securities borrowed and purchased under agreements to resell | $ | 16 |
| Model-based | Interest rate | 1.43 | % | 2.16 | % | 2.09 | % | $ | 115 |
| Model-based | Interest rate | 2.52 | % | 7.43 | % | 5.08 | % |
| Mortgage-backed securities | $ | 214 |
| Price-based | Price | $ | 2.96 |
| $ | 101.00 |
| $ | 56.52 |
| $ | 313 |
| Price-based | Price | $ | 11.25 |
| $ | 110.35 |
| $ | 90.07 |
|
| | 184 |
| Yield analysis | Yield | 2.52 | % | 14.06 | % | 5.97 | % | 198 |
| Yield analysis | Yield | 2.27 | % | 8.70 | % | 3.74 | % |
| State and municipal, foreign government, corporate and other debt securities | $ | 949 |
| Model-based | Price | $ | — |
| $ | 184.04 |
| $ | 91.74 |
| $ | 1,212 |
| Price-based | Price | $ | — |
| $ | 103.75 |
| $ | 91.39 |
|
| | 914 |
| Price-based | Credit spread | 35 bps |
| 500 bps |
| 249 bps |
| 938 |
| Model-based | Credit spread | 35 bps |
| 446 bps |
| 238 bps |
|
| |
|
| | Yield | 2.36 | % | 14.25 | % | 6.03 | % | |
Equity securities(5) | $ | 65 |
| Price-based | Price | $ | — |
| $ | 25,450.00 |
| $ | 2,526.62 |
| |
Marketable equity securities(5) | | $ | 108 |
| Price-based | Price | $ | — |
| $ | 20,255.00 |
| $ | 1,247.85 |
|
| | 55 |
| Model-based | WAL | 2.50 years |
| 2.50 years |
| 2.50 years |
| 45 |
| Model-based | WAL | 1.47years |
| 1.47years |
| 1.47years |
|
| Asset-backed securities | $ | 2,287 |
| Price-based | Price | $ | 4.25 |
| $ | 100.60 |
| $ | 74.57 |
| $ | 1,608 |
| Price-based | Price | $ | 2.75 |
| $ | 101.03 |
| $ | 66.18 |
|
| Non-marketable equity | $ | 423 |
| Comparables analysis | EBITDA multiples | 6.90 | x | 12.80 | x | 8.66 | x | $ | 293 |
| Comparables analysis | Discount to price | — | % | 100.00 | % | 0.66 | % |
| | 223 |
| Price-based | Discount to price | — | % | 100.00 | % | 11.83 | % | 255 |
| Price-based | EBITDA multiples | 5.00 | x | 34.00 | x | 9.73 | x |
| |
|
| | Price-to-book ratio | 0.05 | x | 1.00 | x | 0.32 | x |
|
| | Net operating income multiple | 24.70 | x | 24.70 | x | 24.70 | x |
| | | | | Price | $ | 2.38 |
| $ | 1,073.80 |
| $ | 420.24 |
|
| | | | | Revenue multiple | 2.25 | x | 16.50 | x | 7.06 | x |
Derivatives—gross(6) |
| |
|
|
|
| |
|
|
|
| Interest rate contracts (gross) | $ | 3,818 |
| Model-based | IR normal volatility | 9.40 | % | 77.40 | % | 58.86 | % | $ | 3,467 |
| Model-based | Mean reversion | 1.00 | % | 20.00 | % | 10.50 | % |
| | | | Mean reversion | 1.00 | % | 20.00 | % | 10.50 | % | | | Inflation volatility | 0.22 | % | 2.65 | % | 0.77 | % |
| | | | | IR Normal volaitility | 0.16 | % | 86.31 | % | 56.24 | % |
| Foreign exchange contracts (gross) | $ | 940 |
| Model-based | Foreign exchange (FX) volatility | 4.58 | % | 15.02 | % | 8.16 | % | $ | 626 |
| Model-based | Foreign exchange (FX) volatility | 3.15 | % | 17.35 | % | 11.37 | % |
| | | 73 |
| Cash flow | IR-IR correlation | (51.00 | )% | 40.00 | % | 32.69 | % |
| | | | | IR-FX correlation | 40.00 | % | 60.00 | % | 50.00 | % |
| | |
|
| | Credit spread | 39 bps |
| 676 bps |
| 423 bps |
|
| | | As of December 31, 2017 | Fair value(1) (in millions) | Methodology | Input | Low(2)(3) |
| High(2)(3) | Weighted average(4) | |
| As of December 31, 2018 | | Fair value(1) (in millions) | Methodology | Input | Low(2)(3) |
| High(2)(3) | Weighted average(4) |
| | | | | IR basis | (0.65 | )% | 0.11 | % | (0.17 | )% |
| | | | | Yield | 6.98 | % | 7.48 | % | 7.23 | % |
Equity contracts (gross)(7) | | $ | 1,467 |
| Model-based | Equity volatility | 3.00 | % | 78.39 | % | 37.53 | % |
| |
|
| | Interest rate | (0.55 | )% | 0.28 | % | 0.04 | % | | | Forward price | 64.66 | % | 144.45 | % | 98.55 | % |
| | | | IR-IR correlation | (51.00 | )% | 40.00 | % | 36.56 | % | | | Equity-Equity correlation | (81.39 | )% | 100.00 | % | 35.49 | % |
| |
|
| | IR-FX correlation | (7.34 | )% | 60.00 | % | 49.04 | % | | | Equity-FX correlation | (86.27 | )% | 70.00 | % | (1.20 | )% |
| | | | Credit spread | 11 bps |
| 717 bps |
| 173 bps |
| |
Equity contracts (gross)(7) | $ | 2,897 |
| Model-based | Equity volatility | 3.00 | % | 68.93 | % | 24.66 | % | |
| |
|
| | Forward price | 69.74 | % | 154.19 | % | 92.80 | % |
|
| | WAL | 1.47 years |
| 1.47 years |
| 1.47 years |
|
| Commodity contracts (gross) | $ | 2,937 |
| Model-based | Forward price | 3.66 | % | 290.59 | % | 114.16 | % | $ | 1,552 |
| Model-based | Forward price | 15.30 | % | 585.07 | % | 145.08 | % |
| | | | Commodity volatility | 8.60 | % | 66.73 | % | 25.04 | % | | | Commodity volatility | 8.92 | % | 59.86 | % | 20.34 | % |
| |
|
| | Commodity correlation | (37.64 | )% | 91.71 | % | 15.21 | % |
|
| | Commodity correlation | (51.90 | )% | 92.11 | % | 40.71 | % |
| Credit derivatives (gross) | $ | 1,797 |
| Model-based | Credit correlation | 25.00 | % | 90.00 | % | 44.64 | % | $ | 1,089 |
| Model-based | Credit correlation | 5.00 | % | 85.00 | % | 41.06 | % |
| | 823 |
| Price-based | Upfront points | 6.03 | % | 97.26 | % | 62.88 | % | 701 |
| Price-based | Upfront points | 7.41 | % | 99.04 | % | 58.95 | % |
| | | | Credit spread | 3 bps |
| 1,636 bps |
| 173 bps |
| |
| | | | Price | $ | 1.00 |
| $ | 100.24 |
| $ | 57.63 |
| |
Nontrading derivatives and other financial assets and liabilities measured on a recurring basis (gross)(6) | $ | 24 |
| Model-based | Recovery rate | 25.00 | % | 40.00 | % | 31.56 | % | |
| |
| | Redemption rate | 10.72 | % | 99.50 | % | 74.24 | % | | | Credit spread | 2 bps |
| 1127 bps |
| 87 bps |
|
| |
| | Credit spread | 38 bps |
| 275 bps |
| 127 bps |
| | | Recovery rate | 5.00 | % | 65.00 | % | 46.40 | % |
| |
| | Upfront points | 61.00 | % | 61.00 | % | 61.00 | % | | | Price | $ | 16.59 |
| $ | 98.00 |
| $ | 81.19 |
|
| Loans and leases | $ | 391 |
| Model-based | Equity volatility | 3.00 | % | 68.93 | % | 22.52 | % | $ | 248 |
| Model-based | Credit spread | 138 bps |
| 255 bps |
| 147 bps |
|
| | 148 |
| Price-based | Credit spread | 134 bps |
| 500 bps |
| 173 bps |
| 29 |
| Price-based | Yield | 0.30 | % | 0.47 | % | 0.32 | % |
| |
| | Yield | 3.09 | % | 4.40 | % | 3.13 | % | | | Price | $ | 55.83 |
| $ | 110.00 |
| $ | 92.40 |
|
| Mortgage servicing rights | $ | 471 |
| Cash flow | Yield | 8.00 | % | 16.38 | % | 11.47 | % | $ | 500 |
| Cash flow | Yield | 4.60 | % | 12.00 | % | 7.79 | % |
| | 87 |
| Model-based | WAL | 3.83 years |
| 6.89 years |
| 5.93 years |
| 84 |
| Model-based | WAL | 3.55 years |
| 7.45 years |
| 6.39 years |
|
| Liabilities | | | | | | |
| Interest-bearing deposits | $ | 286 |
| Model-based | Mean reversion | 1.00 | % | 20.00 | % | 10.50 | % | $ | 495 |
| Model-based | Mean reversion | 1.00 | % | 20.00 | % | 10.50 | % |
| |
|
| | Forward price | 99.56 | % | 99.95 | % | 99.72 | % | | | Forward price | 64.66 | % | 144.45 | % | 98.55 | % |
| | |
|
| | Equity volatility | 3.00 | % | 78.39 | % | 43.49 | % |
| Federal funds purchased and securities loaned and sold under agreements to repurchase | $ | 726 |
| Model-based | Interest rate | 1.43 | % | 2.16 | % | 2.09 | % | $ | 983 |
| Model-based | Interest rate | 2.52 | % | 3.21 | % | 2.87 | % |
| Trading account liabilities | | | | | | |
| Securities sold, not yet purchased | $ | 21 |
| Price-based | Price | $ | 1.00 |
| $ | 287.64 |
| $ | 88.19 |
| $ | 509 |
| Model-based | Forward price | 15.30 | % | 585.07 | % | 105.69 | % |
| | | 77 |
| Price-based | Equity volatility | 3.00 | % | 78.39 | % | 43.49 | % |
| | | | | Equity-Equity correlation | (81.39 | )% | 100.00 | % | 34.04 | % |
| | | | | Equity-FX correlation | (86.27 | )% | 70.00 | % | (1.20 | )% |
| | | | | Commodity volatility | 8.92 | % | 59.86 | % | 20.34 | % |
| | | | | Commodity correlation | (51.90 | )% | 92.11 | % | 40.71 | % |
| | | | | Equity-IR correlation | (40.00 | )% | 70.37 | % | 30.80 | % |
| Short-term borrowings and long-term debt | $ | 13,100 |
| Model-based | Forward price | 69.74 | % | 161.11 | % | 100.70 | % | $ | 12,289 |
| Model-based | Mean reversion | 1.00 | % | 20.00 | % | 10.50 | % |
| | | | | IR normal volatility | 0.16 | % | 86.31 | % | 56.61 | % |
| | | | | Forward price | 64.66 | % | 144.45 | % | 98.58 | % |
| | | | | Equity volatility | 3.00 | % | 78.39 | % | 43.24 | % |
| |
| (1) | The fair value amounts presented in these tables represent the primary valuation technique or techniques for each class of assets or liabilities. |
| |
| (2) | Some inputs are shown as zero due to rounding. |
| |
| (3) | When the low and high inputs are the same, there is either a constant input applied to all positions, or the methodology involving the input applies to only one large position. |
| |
| (4) | Weighted averages are calculated based on the fair values of the instruments. |
| |
| (5) | For equity securities, the price inputs are expressed on an absolute basis, not as a percentage of the notional amount. |
| |
| (6) | Both trading and nontrading account derivatives—assets and liabilities—are presented on a gross absolute value basis. |
| |
| (7) | Includes hybrid products. |
Items Measured at Fair Value on a Nonrecurring Basis
Certain assets and liabilities are measured at fair value on a nonrecurring basis and, therefore, are not included in the tables above. These include assets measured at cost that have been written down to fair value during the periods as a result of an impairment. These also include non-marketable equity investmentssecurities that have been measured using the measurement alternative and are either (i) written down to fair value during the periods as a result of an impairment or (ii) adjusted upward or downward to fair value as a result of a transaction observed during the periods for the identical or similar investment of the same issuer. In addition, these assets include loans held-for-sale and other real estate owned that are measured at the lower of cost or market value.
The following table presentstables present the carrying amounts of all assets that were still held for which a nonrecurring fair value measurement was recorded:
|
| | | | | | | | | |
| In millions of dollars | Fair value | Level 2 | Level 3 |
| March 31, 2019 | | | |
Loans HFS(1) | $ | 3,304 |
| $ | 1,869 |
| $ | 1,435 |
|
| Other real estate owned | 67 |
| 55 |
| 12 |
|
Loans(2) | 361 |
| 128 |
| 233 |
|
| Non-marketable equity securities measured using the measurement alternative | 268 |
| 144 |
| 124 |
|
| Total assets at fair value on a nonrecurring basis | $ | 4,000 |
| $ | 2,196 |
| $ | 1,804 |
|
|
| | | | | | | | | |
| In millions of dollars | Fair value | Level 2 | Level 3 |
| September 30, 2018 | | | |
Loans HFS(1) | $ | 4,823 |
| $ | 1,870 |
| $ | 2,953 |
|
| Other real estate owned | 85 |
| 68 |
| 17 |
|
Loans(2) | 349 |
| 155 |
| 194 |
|
| Non-marketable equity investments measured using the measurement alternative | 115 |
| 115 |
| — |
|
| Total assets at fair value on a nonrecurring basis | $ | 5,372 |
| $ | 2,208 |
| $ | 3,164 |
|
|
| | | | | | | | | |
| In millions of dollars | Fair value | Level 2 | Level 3 |
| December 31, 2018 | | | |
Loans HFS(1) | $ | 5,055 |
| $ | 3,261 |
| $ | 1,794 |
|
| Other real estate owned | 78 |
| 62 |
| 16 |
|
Loans(2) | 390 |
| 139 |
| 251 |
|
| Non-marketable equity securities measured using the measurement alternative | 261 |
| 192 |
| 69 |
|
| Total assets at fair value on a nonrecurring basis | $ | 5,784 |
| $ | 3,654 |
| $ | 2,130 |
|
|
| | | | | | | | | |
| In millions of dollars | Fair value | Level 2 | Level 3 |
| December 31, 2017 | | | |
Loans HFS(1) | $ | 5,675 |
| $ | 2,066 |
| $ | 3,609 |
|
| Other real estate owned | 54 |
| 10 |
| 44 |
|
Loans(2) | 630 |
| 216 |
| 414 |
|
| Total assets at fair value on a nonrecurring basis | $ | 6,359 |
| $ | 2,292 |
| $ | 4,067 |
|
| |
| (1) | Net of fair value amounts on the unfunded portion of loans HFS recognized as Other liabilities on the Consolidated Balance Sheet. |
| |
| (2) | Represents impaired loans held for investment whose carrying amount is based on the fair value of the underlying collateral less costs to sell, primarily real estate. |
Valuation Techniques and Inputs for Level 3 Nonrecurring Fair Value Measurements
The following table presentstables present the valuation techniques covering the majority of Level 3 nonrecurring fair value measurements and the most significant unobservable inputs used in those measurements:
|
| | | | | | | | | | | | | | |
| As of March 31, 2019 | Fair value(1) (in millions) | Methodology | Input | Low(2) | High | Weighted average(3) |
| Loans held-for-sale | $ | 1,334 |
| Price-based | Price | $ | 0.77 |
| $ | 100.00 |
| $ | 89.97 |
|
| Other real estate owned | $ | 9 |
| Price-based | Appraised value(4) | $ | 2,993,681 |
| $ | 8,394,102 |
| $ | 6,974,411 |
|
| | $ | 3 |
| Cashflow | Discount to price(5) | 13.00 | % | 13.00 | % | 13.00 | % |
Loans(6) | $ | 184 |
| Recovery analysis | Recovery rate | 39.27 | % | 99.26 | % | 78.25 | % |
| | $ | 27 |
| Price-based | Price | $ | 2.60 |
| $ | 54.00 |
| $ | 3.40 |
|
| Non-marketable equity securities measured using the measurement alternative | $ | 78 |
| Price-based | Price | $ | 33.65 |
| $ | 2,018.12 |
| $ | 725.12 |
|
| | 40 |
| Price-based | Price | $ | 2.84 |
| $ | 2.84 |
| $ | 2.84 |
|
| | | As of September 30, 2018 | Fair value(1) (in millions) | Methodology | Input | Low(2) | High | Weighted average(3) | |
| As of December 31, 2018 | | Fair value(1) (in millions) | Methodology | Input | Low(2) | High | Weighted average(3) |
| Loans held-for-sale | $ | 2,533 |
| Price-based | Price | $ | 80.90 |
| $ | 100.00 |
| $ | 99.26 |
| $ | 1,729 |
| Price-based | Price | $ | 0.79 |
| $ | 100.00 |
| $ | 69.52 |
|
| Other real estate owned | $ | 17 |
| Price-based | Appraised value | $ | 2,353,777 |
| $ | 8,394,102 |
| $ | 7,071,276 |
| $ | 15 |
| Price-based | Appraised value(4) | $ | 8,394,102 |
| $ | 8,394,102 |
| $ | 8,394,102 |
|
| |
| | Discount to price | 13.00 | % | 13.00 | % | 13.00 | % | 2 |
| Recovery analysis | Discount to price(5) | 13.00 | % | 13.00 | % | 13.00 | % |
| | | | Price | $ | 56.31 |
| $ | 56.31 |
| $ | 56.31 |
|
|
| | Price | $ | 56.30 |
| $ | 83.08 |
| $ | 58.27 |
|
Loans(5)(6) | $ | 123 |
| Recovery analysis | Price | $ | 13.36 |
| $ | 100.00 |
| $ | 92.33 |
| $ | 251 |
| Recovery analysis | Recovery rate | 30.60 | % | 100.00 | % | 50.51 | % |
| | 54 |
| Price-based | Recovery rate | 9.00 | % | 90.00 | % | 76.62 | % |
|
| | Price | $ | 2.60 |
| $ | 85.04 |
| $ | 28.21 |
|
| | | | Appraised Value | $ | 9,855,140 |
| $ | 55,972,000 |
| $ | 38,154,269 |
| |
| Non-marketable equity securities measured using the measurement alternative | | 66 |
| Price-based | Price | $ | 45.80 |
| $ | 1,514.00 |
| $ | 570.26 |
|
|
| | | | | | | | | | | | | | |
| As of December 31, 2017 | Fair value(1) (in millions) | Methodology | Input | Low(2) | High | Weighted average(3) |
| Loans held-for-sale | $ | 3,186 |
| Price-based | Price | $ | 77.93 |
| $ | 100.00 |
| $ | 99.26 |
|
| Other real estate owned | $ | 42 |
| Price-based | Appraised value(4) | $ | 20,278 |
| $ | 8,091,760 |
| $ | 4,016,665 |
|
| | | | Discount to price(5) | 34.00 | % | 34.00 | % | 34.00 | % |
| |
|
| | Price | $ | 30.00 |
| $ | 50.36 |
| $ | 49.09 |
|
Loans(6) | $ | 133 |
| Price-based | Price | $ | 2.80 |
| $ | 100.00 |
| $ | 62.46 |
|
| | 129 |
| Cash flow | Recovery rate | 50.00 | % | 100.00 | % | 63.59 | % |
| | 127 |
| Recovery analysis | Appraised value | $ | — |
| $ | 45,500,000 |
| $ | 38,785,667 |
|
| |
| (1) | The fair value amounts presented in this table represent the primary valuation technique or techniques for each class of assets or liabilities. |
| |
| (2) | Some inputs are shown as zero due to rounding. |
| |
| (3) | Weighted averages are calculated based on the fair values of the instruments. |
| |
| (4) | Appraised values are disclosed in whole dollars. |
| |
| (5) | Includes estimated costs to sell. |
| |
| (6) | Represents impaired loans held for investment whose carrying amounts are based on the fair value of the underlying collateral, primarily real estate secured loans. |
Nonrecurring Fair Value Changes
The following table presentstables present total nonrecurring fair value measurements for the period, included in earnings, attributable to the change in fair value relating to assets that were still held:
|
| | | | | | |
| | Three Months Ended September 30, |
| In millions of dollars | 2018 | 2017 |
| Loans HFS | $ | (1 | ) | $ | 10 |
|
| Other real estate owned | (1 | ) | (4 | ) |
Loans(1) | (22 | ) | (66 | ) |
Non-marketable equity investments measured using the measurement alternative
| 7 |
| — |
|
Total nonrecurring fair value gains (losses) | $ | (17 | ) | $ | (60 | ) |
| |
(1) | Represents loans held for investment whose carrying amount is based on the fair value of the underlying collateral, primarily real estate. |
| | | | Nine Months Ended September 30, | Three Months Ended March 31, |
| In millions of dollars | 2018 | 2017 | 2019 |
| Loans HFS | $ | 8 |
| $ | (15 | ) | $ | (2 | ) |
| Other real estate owned | (2 | ) | (6 | ) | 1 |
|
Loans(1) | (51 | ) | (110 | ) | (27 | ) |
| Non-marketable equity investments measured using the measurement alternative | 111 |
| — |
| |
Non-marketable equity securities measured using the measurement alternative
| | 61 |
|
Total nonrecurring fair value gains (losses) | $ | 66 |
| $ | (131 | ) | $ | 33 |
|
| |
| (1) | Represents loans held for investment whose carrying amount is based on the fair value of the underlying collateral, primarily real estate. |
|
| | | |
| | Three Months Ended March 31, |
| In millions of dollars | 2018 |
| Loans HFS | $ | (35 | ) |
| Other real estate owned | (3 | ) |
Loans(1) | (32 | ) |
| Non-marketable equity securities measured using the measurement alternative | 120 |
|
Total nonrecurring fair value gains (losses) | $ | 50 |
|
| |
| (1) | Represents loans held for investment whose carrying amount is based on the fair value of the underlying collateral, primarily real estate. |
Estimated Fair Value of Financial Instruments Not Carried at Fair Value
The following table presents the carrying value and fair value of Citigroup’s financial instruments that are not carried at fair value. The table below therefore excludes items measured at fair value on a recurring basis presented in the tables above.
| | | | September 30, 2018 | Estimated fair value | March 31, 2019 | Estimated fair value |
| | Carrying value | Estimated fair value | | Carrying value | Estimated fair value | |
| In billions of dollars | Level 1 | Level 2 | Level 3 | Level 1 | Level 2 | Level 3 |
| Assets | | |
| Investments | $ | 58.9 |
| $ | 58.0 |
| $ | 1.1 |
| $ | 54.9 |
| $ | 2.0 |
| $ | 72.5 |
| $ | 72.7 |
| $ | 1.0 |
| $ | 69.6 |
| $ | 2.1 |
|
| Federal funds sold and securities borrowed and purchased under agreements to resell | 102.5 |
| 102.5 |
| — |
| 100.5 |
| 2.0 |
| 102.4 |
| 102.4 |
| — |
| 102.2 |
| 0.2 |
|
Loans(1)(2) | 656.7 |
| 655.2 |
| — |
| 5.2 |
| 650.0 |
| 664.6 |
| 669.3 |
| — |
| 11.0 |
| 658.3 |
|
Other financial assets(2)(3) | 263.9 |
| 264.4 |
| 184.6 |
| 14.7 |
| 65.1 |
| 276.5 |
| 277.0 |
| 189.4 |
| 16.5 |
| 71.1 |
|
| Liabilities | | |
| Deposits | $ | 1,003.7 |
| $ | 1,002.8 |
| $ | — |
| $ | 836.7 |
| $ | 166.1 |
| $ | 1,028.0 |
| $ | 1,026.2 |
| $ | — |
| $ | 824.0 |
| $ | 202.2 |
|
| Federal funds purchased and securities loaned or sold under agreements to repurchase | 127.8 |
| 127.8 |
| — |
| 127.8 |
| — |
| |
| Federal funds purchased and securities loaned and sold under agreements to repurchase | | 144.1 |
| 144.1 |
| — |
| 144.1 |
| — |
|
Long-term debt(4) | 198.5 |
| 200.6 |
| — |
| 186.3 |
| 14.3 |
| 199.4 |
| 204.0 |
| — |
| 188.0 |
| 16.0 |
|
Other financial liabilities(5) | 110.6 |
| 110.6 |
| — |
| 16.1 |
| 94.5 |
| 111.2 |
| 111.2 |
| — |
| 18.9 |
| 92.3 |
|
| | | | December 31, 2017 | Estimated fair value | December 31, 2018 | Estimated fair value |
| | Carrying value | Estimated fair value | | Carrying value | Estimated fair value | |
| In billions of dollars | Level 1 | Level 2 | Level 3 | Level 1 | Level 2 | Level 3 |
| Assets | | |
| Investments | $ | 60.2 |
| $ | 60.6 |
| $ | 0.5 |
| $ | 57.5 |
| $ | 2.6 |
| $ | 68.9 |
| $ | 68.5 |
| $ | 1.0 |
| $ | 65.4 |
| $ | 2.1 |
|
| Federal funds sold and securities borrowed and purchased under agreements to resell | 99.5 |
| 99.5 |
| — |
| 94.4 |
| 5.1 |
| 123.0 |
| 123.0 |
| — |
| 121.6 |
| 1.4 |
|
Loans(1)(2) | 648.6 |
| 644.9 |
| — |
| 6.0 |
| 638.9 |
| 667.1 |
| 666.9 |
| — |
| 5.6 |
| 661.3 |
|
Other financial assets(2)(3) | 242.6 |
| 243.0 |
| 166.4 |
| 14.1 |
| 62.5 |
| 249.7 |
| 250.1 |
| 172.3 |
| 15.8 |
| 62.0 |
|
| Liabilities | | |
| Deposits | $ | 958.4 |
| $ | 955.6 |
| $ | — |
| $ | 816.1 |
| $ | 139.5 |
| $ | 1,011.7 |
| $ | 1,009.5 |
| $ | — |
| $ | 847.1 |
| $ | 162.4 |
|
| Federal funds purchased and securities loaned or sold under agreements to repurchase | 115.6 |
| 115.6 |
| — |
| 115.6 |
| — |
| |
| Federal funds purchased and securities loaned and sold under agreements to repurchase | | 133.3 |
| 133.3 |
| — |
| 133.3 |
| — |
|
Long-term debt(4) | 205.3 |
| 214.0 |
| — |
| 187.2 |
| 26.8 |
| 193.8 |
| 193.7 |
| — |
| 178.4 |
| 15.3 |
|
Other financial liabilities(5) | 129.9 |
| 129.9 |
| — |
| 15.5 |
| 114.4 |
| 103.8 |
| 103.8 |
| — |
| 17.2 |
| 86.6 |
|
| |
| (1) | The carrying value of loans is net of the Allowance for loan losses of $12.3 billion for September 30, 2018March 31, 2019 and $12.4$12.3 billion for December 31, 2017.2018. In addition, the carrying values exclude $1.6$1.5 billion and $1.7$1.6 billion of lease finance receivables at September 30, 2018March 31, 2019 and December 31, 2017,2018, respectively. |
| |
| (2) | Includes items measured at fair value on a nonrecurring basis. |
| |
| (3) | Includes cash and due from banks, deposits with banks, brokerage receivables, reinsurance recoverables and other financial instruments included in Other assets on the Consolidated Balance Sheet, for all of which the carrying value is a reasonable estimate of fair value. |
| |
| (4) | The carrying value includes long-term debt balances under qualifying fair value hedges. |
| |
| (5) | Includes brokerage payables, separate and variable accounts, short-term borrowings (carried at cost) and other financial instruments included in Other liabilities on the Consolidated Balance Sheet, for all of which the carrying value is a reasonable estimate of fair value. |
The estimated fair values of the Company’s corporate unfunded lending commitments at September 30, 2018March 31, 2019 and December 31, 20172018 were liabilities of $3.2$7.4 billion and $7.8 billion, respectively, substantially all of which are classified as Level 3. The Company does not estimate the fair values of
consumer unfunded lending commitments, which are generally cancellable by providing notice to the borrower.
21. FAIR VALUE ELECTIONS
The Company may elect to report most financial instruments and certain other items at fair value on an instrument-by-instrument basis with changes in fair value reported in earnings, other than DVA (see below). The election is made upon the initial recognition of an eligible financial asset, financial liability or firm commitment or when certain specified reconsideration events occur. The fair value election may not be revoked once an election is made. The changes in
fair value are recorded in current earnings, other than DVA, which from January 1, 2016 are reported in AOCI. Additional discussion regarding the applicable areas in which fair value elections were made is presented in Note 20 to the Consolidated Financial Statements.
The Company has elected fair value accounting for its mortgage servicing rights. See Note 18 to the Consolidated Financial Statements for further discussions regarding the accounting and reporting of MSRs.
The following table presents the changes in fair value of those items for which the fair value option has been elected: |
| | | | | | |
| | Changes in fair value—gains (losses) |
| | Three Months Ended March 31, |
| In millions of dollars | 2019 | 2018 |
| Assets | | |
| Federal funds sold and securities borrowed and purchased under agreements to resell | $ | 29 |
| $ | (16 | ) |
| Trading account assets | 167 |
| (16 | ) |
| Investments | — |
| — |
|
| Loans | | |
| Certain corporate loans | (133 | ) | (123 | ) |
| Certain consumer loans | — |
| — |
|
| Total loans | $ | (133 | ) | $ | (123 | ) |
| Other assets | | |
| MSRs | $ | (27 | ) | $ | 46 |
|
Certain mortgage loans HFS(1) | 16 |
| 2 |
|
| Total other assets | $ | (11 | ) | $ | 48 |
|
| Total assets | $ | 52 |
| $ | (107 | ) |
| Liabilities | | |
| Interest-bearing deposits | $ | (91 | ) | $ | 28 |
|
| Federal funds purchased and securities loaned and sold under agreements to repurchase | 35 |
| (111 | ) |
| Trading account liabilities | 11 |
| (6 | ) |
| Short-term borrowings | (175 | ) | 177 |
|
Long-term debt(2) | (2,681 | ) | 618 |
|
| Total liabilities | $ | (2,901 | ) | $ | 706 |
|
|
| | | | | | | | | | | | |
| | Changes in fair value—gains (losses) |
| | Three Months Ended September 30, | Nine Months Ended September 30, |
| In millions of dollars | 2018 | 2017 | 2018 | 2017 |
| Assets | | | | |
| Federal funds sold and securities borrowed and purchased under agreements to resell | $ | (17 | ) | $ | (17 | ) | $ | (14 | ) | $ | (108 | ) |
| Trading account assets | 3 |
| 581 |
| (98 | ) | 1,243 |
|
| Investments | — |
| — |
| — |
| (3 | ) |
| Loans | | | | |
| Certain corporate loans | 11 |
| (61 | ) | (115 | ) | (42 | ) |
| Certain consumer loans | — |
| 1 |
| — |
| 3 |
|
| Total loans | $ | 11 |
| $ | (60 | ) | $ | (115 | ) | $ | (39 | ) |
| Other assets | | | | |
| MSRs | $ | 25 |
| $ | (6 | ) | $ | 82 |
| $ | 50 |
|
Certain mortgage loans held-for-sale(1) | 9 |
| 34 |
| 21 |
| 115 |
|
| Total other assets | $ | 34 |
| $ | 28 |
| $ | 103 |
| $ | 165 |
|
| Total assets | $ | 31 |
| $ | 532 |
| $ | (124 | ) | $ | 1,258 |
|
| Liabilities | | | | |
| Interest-bearing deposits | $ | (20 | ) | $ | (16 | ) | $ | 18 |
| $ | (60 | ) |
| Federal funds purchased and securities loaned and sold under agreements to repurchase | 230 |
| 97 |
| 104 |
| 183 |
|
| Trading account liabilities | 25 |
| 19 |
| 4 |
| 70 |
|
| Short-term borrowings | 20 |
| (30 | ) | 138 |
| (110 | ) |
| Long-term debt | (270 | ) | (510 | ) | 1,269 |
| (981 | ) |
| Total liabilities | $ | (15 | ) | $ | (440 | ) | $ | 1,533 |
| $ | (898 | ) |
| |
| (1) | Includes gains (losses) associated with interest rate lock commitments for those loans that have been originated and elected under the fair value option. |
| |
| (2) | Includes a loss of ($0.7) billion and a gain of $0.2 billion of DVA which is included in AOCI for the three months ended March 31, 2019 and 2018, respectively. |
Own Debt Valuation Adjustments (DVA)
Own debt valuation adjustments are recognized on Citi’s liabilities for which the fair value option has been elected using Citi’s credit spreads observed in the bond market. Effective January 1, 2016, changes in fair value of fair value option liabilities related to changes in Citigroup’s own credit spreads (DVA) are reflected as a component of AOCI; previously these amounts were recognized in Citigroup’s Revenues and Net income along with all other changes in fair value.AOCI. See Note 1 to the Consolidated Financial Statements for additional information.
Among other variables, the fair value of liabilities for which the fair value option has been elected (other than non-recourse and similar liabilities) is impacted by the narrowing or widening of the Company’s credit spreads.
The estimated changechanges in the fair value of these liabilities due to such changes in the Company’s own credit spread (or instrument-specific credit risk) was a loss of $377$725 million and a lossgain of $195$167 million for the three months ended September 30,March 31, 2019 and 2018, and 2017, and a gain of $208 million and a loss of $422 million for the nine months ended September 30, 2018 and 2017, respectively. Changes in fair value resulting from changes in instrument-specific credit risk were estimated by incorporating the Company’s current credit spreads observable in the bond market into the relevant valuation technique used to value each liability as described above.
The Fair Value Option for Financial Assets and Financial Liabilities
Selected Portfolios of Securities Purchased Under Agreements to Resell, Securities Borrowed, Securities Sold Under Agreements to Repurchase, Securities Loaned and Certain Non-Collateralized Short-Term Borrowings
The Company elected the fair value option for certain portfolios of fixed income securities purchased under agreements to resell and fixed income securities sold under agreements to repurchase, securities borrowed, securities loaned and certain non-collateralized short-term borrowings held primarily by broker-dealer entities in the United States, United Kingdom and Japan. In each case, the election was made because the related interest rate risk is managed on a portfolio basis, primarily with offsetting derivative instruments that are accounted for at fair value through earnings.
Changes in fair value for transactions in these portfolios are recorded in Principal transactions. The related interest revenue and interest expense are measured based on the contractual rates specified in the transactions and are reported as Interest revenue and Interest expense in the Consolidated Statement of Income.
Certain Loans and Other Credit Products
Citigroup has also elected the fair value option for certain other originated and purchased loans, including certain unfunded loan products, such as guarantees and letters of credit, executed by Citigroup’s lending and trading businesses. None of these credit products are highly leveraged financing commitments. Significant groups of transactions include loans and unfunded loan products that are expected to be either sold or securitized in the near term, or transactions where the economic risks are hedged with derivative instruments, such as purchased credit default swaps or total return swaps where the Company pays the total return on the underlying loans to a third party. Citigroup has elected the fair value option to mitigate accounting mismatches in cases where hedge accounting is complex and to achieve operational simplifications. Fair value was not elected for most lending transactions across the Company.
The following table provides information about certain credit products carried at fair value:
|
| | | | | | | | | | | | |
| | March 31, 2019 | December 31, 2018 |
| In millions of dollars | Trading assets | Loans | Trading assets | Loans |
| Carrying amount reported on the Consolidated Balance Sheet | $ | 9,287 |
| $ | 3,874 |
| $ | 10,108 |
| $ | 3,224 |
|
| Aggregate unpaid principal balance in excess of (less than) fair value | 870 |
| 750 |
| 435 |
| 741 |
|
| Balance of non-accrual loans or loans more than 90 days past due | — |
| 1 |
| — |
| 1 |
|
| Aggregate unpaid principal balance in excess of fair value for non-accrual loans or loans more than 90 days past due | — |
| — |
| — |
| — |
|
|
| | | | | | | | | | | | |
| | September 30, 2018 | December 31, 2017 |
| In millions of dollars | Trading assets | Loans | Trading assets | Loans |
| Carrying amount reported on the Consolidated Balance Sheet | $ | 8,922 |
| $ | 4,239 |
| $ | 8,851 |
| $ | 4,374 |
|
| Aggregate unpaid principal balance in excess of (less than) fair value | 432 |
| 538 |
| 623 |
| 682 |
|
| Balance of non-accrual loans or loans more than 90 days past due | — |
| 1 |
| — |
| 1 |
|
| Aggregate unpaid principal balance in excess of fair value for non-accrual loans or loans more than 90 days past due | — |
| — |
| — |
| 1 |
|
In addition to the amounts reported above, $1,043$1,142 million and $508$1,137 million of unfunded commitments related to certain credit products selected for fair value accounting were outstanding as of September 30, 2018March 31, 2019 and December 31, 2017,2018, respectively.
Changes in the fair value of funded and unfunded credit products are classified in Principal transactions in Citi’s Consolidated Statement of Income. Related interest revenue is measured based on the contractual interest rates and reported as Interest revenue on Trading account assets or loan interest depending on the balance sheet classifications of the credit products. The changes in fair value for the ninethree months ended September 30,March 31, 2019 and 2018 and 2017 due to instrument-specific credit risk totaled to gains of $18 million and a loss of $13$19 million, and a gain of $57 million, respectively.
Certain Investments in Unallocated Precious Metals
Citigroup invests in unallocated precious metals accounts (gold, silver, platinum and palladium) as part of its commodity and foreign currency trading activities or to economically hedge certain exposures from issuing structured liabilities. Under ASC 815, the investment is bifurcated into a debt host contract and a commodity forward derivative instrument. Citigroup elects the fair value option for the debt host contract, and reports the debt host contract within Trading account assets on the Company’s Consolidated Balance Sheet. The total carrying amount of debt host contracts across unallocated precious metals accounts was approximately $0.5 billion and $0.4 billion and $0.9 billion at September 30, 2018March 31, 2019 and December 31, 2017,2018, respectively. The amounts are expected to fluctuate based on trading activity in future periods.
As part of its commodity and foreign currency trading activities, Citi trades unallocated precious metals investments and executes forward purchase and forward sale derivative contracts with trading counterparties. When Citi sells an unallocated precious metals investment, Citi’s receivable from its depository bank is repaid and Citi derecognizes its investment in the unallocated precious metal. The forward purchase or sale contract with the trading counterparty indexed to unallocated precious metals is accounted for as a derivative, at fair value through earnings. As of September 30, 2018,March 31, 2019, there were approximately $12.0$9.6 billion and $10.6$6.9 billion of notional amounts of such forward purchase and forward sale derivative contracts outstanding, respectively.
Certain Investments in Private Equity and
Real Estate Ventures and Certain Equity Method and Other Investments
Citigroup invests in private equity and real estate ventures for the purpose of earning investment returns and for capital appreciation. The Company has elected the fair value option for certain of these ventures, because such investments are considered similar to many private equity or hedge fund activities in Citi’s investment companies, which are reported at fair value. The fair value option brings consistency in the accounting and evaluation of these investments. All investments (debt and equity) in such private equity and real estate entities are accounted for at fair value. These investments are classified as Investments on Citigroup’s Consolidated Balance Sheet.
Changes in the fair values of these investments are classified in Other revenue in the Company’s Consolidated Statement of Income.
Citigroup also elected the fair value option for certain non-marketable equity securities, whose risk is managed with derivative instruments that are accounted for at fair value through earnings. These securities are classified as Trading account assets on Citigroup’s Consolidated Balance Sheet. Changes in the fair value of these securities and the related derivative instruments are recorded in Principal transactions. Effective January 1, 2018, under ASU 2016-01 and ASU 2018-03, a fair value option election is no longer required to measure these non-marketable equity securities at fair value through earnings. See Note 1 to the Consolidated Financial Statements for additional details.
Certain Mortgage Loans Held-for-Sale (HFS)
Citigroup has elected the fair value option for certain purchased and originated prime fixed-rate and conforming adjustable-rate first mortgage loans HFS. These loans are intended for sale or securitization and are hedged with derivative instruments. The Company has elected the fair value option to mitigate accounting mismatches in cases where hedge accounting is complex and to achieve operational simplifications.
The following table provides information about certain mortgage loans HFS carried at fair value:
|
| | | | | | |
| In millions of dollars | March 31,
2019 | December 31, 2018 |
| Carrying amount reported on the Consolidated Balance Sheet | $ | 459 |
| $ | 556 |
|
| Aggregate fair value in excess of (less than) unpaid principal balance | 18 |
| 21 |
|
| Balance of non-accrual loans or loans more than 90 days past due | — |
| — |
|
| Aggregate unpaid principal balance in excess of fair value for non-accrual loans or loans more than 90 days past due | — |
| — |
|
|
| | | | | | |
| In millions of dollars | September 30,
2018 | December 31, 2017 |
| Carrying amount reported on the Consolidated Balance Sheet | $ | 480 |
| $ | 426 |
|
| Aggregate fair value in excess of (less than) unpaid principal balance | 9 |
| 14 |
|
| Balance of non-accrual loans or loans more than 90 days past due | — |
| — |
|
| Aggregate unpaid principal balance in excess of fair value for non-accrual loans or loans more than 90 days past due | — |
| — |
|
The changes in the fair values of these mortgage loans are reported in Other revenue in the Company’s Consolidated Statement of Income. There was no net change in fair value during the ninethree months ended September 30,March 31, 2019 and 2018 and 2017 due to instrument-specific credit risk. Related interest income continues to be measured based on the contractual interest rates and reported as Interest revenue in the Consolidated Statement of Income.
Certain Structured Liabilities
The Company has elected the fair value option for certain structured liabilities whose performance is linked to structured interest rates, inflation, currency, equity, referenced credit or commodity risks. The Company elected the fair value option because these exposures are considered to be trading-related positions and, therefore, are managed on a fair value basis. These positions will continue to be classified as debt, deposits or derivatives (Trading account liabilities) on the Company’s Consolidated Balance Sheet according to their legal form.
The following table provides information about the carrying value of structured notes, disaggregated by type of embedded derivative instrument:
|
| | | | | | |
| In billions of dollars | March 31, 2019 | December 31, 2018 |
| Interest rate linked | $ | 18.7 |
| $ | 17.3 |
|
| Foreign exchange linked | 1.0 |
| 0.5 |
|
| Equity linked | 17.9 |
| 14.8 |
|
| Commodity linked | 1.2 |
| 1.2 |
|
| Credit linked | 2.0 |
| 1.9 |
|
| Total | $ | 40.8 |
| $ | 35.7 |
|
|
| | | | | | |
| In billions of dollars | September 30, 2018 | December 31, 2017 |
| Interest rate linked | $ | 16.8 |
| $ | 13.9 |
|
| Foreign exchange linked | 0.4 |
| 0.3 |
|
| Equity linked | 15.2 |
| 13.0 |
|
| Commodity linked | 0.2 |
| 0.2 |
|
| Credit linked | 1.4 |
| 1.9 |
|
| Total | $ | 34.0 |
| $ | 29.3 |
|
Prior to 2016, the total change in the fair value of these structured liabilities was reported in Principal transactions in the Company’s Consolidated Statement of Income. Beginning in the first quarter of 2016, the portion of the changes in fair value attributable to changes in Citigroup’s own credit spreads (DVA) is reflected as a component of AOCI while all other changes in fair value will continue to be reported in Principal transactions. Changes in the fair value of these structured liabilities include accrued interest, which is also included in the change in fair value reported in Principal transactions.
Certain Non-Structured Liabilities
The Company has elected the fair value option for certain non-structured liabilities with fixed and floating interest rates. The Company has elected the fair value option where the interest rate risk of such liabilities may be economically hedged with derivative contracts or the proceeds are used to purchase financial assets that will also be accounted for at fair value through earnings. The elections have been made to mitigate accounting mismatches and to achieve operational simplifications. These positions are reported in Short-term borrowings and Long-term debt on the Company’s Consolidated Balance Sheet. Prior to 2016, the total change in the fair value of these non-structured liabilities was reported in Principal transactions in the Company’s Consolidated Statement of Income. Beginning in the first quarter of 2016, theThe portion of the changes in fair value attributable to changes in Citigroup’s own credit spreads (DVA) is reflected as a component of AOCI while all other changes in fair value will continue to be reported in Principal transactions.transactions.
Interest expense on non-structured liabilities is measured based on the contractual interest rates and reported as Interest expense in the Consolidated Statement of Income.
The following table provides information about long-term debt carried at fair value:
|
| | | | | | |
| In millions of dollars | March 31, 2019 | December 31, 2018 |
| Carrying amount reported on the Consolidated Balance Sheet | $ | 44,088 |
| $ | 38,229 |
|
| Aggregate unpaid principal balance in excess of (less than) fair value | 2,610 |
| 3,814 |
|
|
| | | | | | |
| In millions of dollars | September 30, 2018 | December 31, 2017 |
| Carrying amount reported on the Consolidated Balance Sheet | $ | 36,772 |
| $ | 31,392 |
|
| Aggregate unpaid principal balance in excess of (less than) fair value | 1,967 |
| (579 | ) |
The following table provides information about short-term borrowings carried at fair value:
|
| | | | | | |
| In millions of dollars | March 31, 2019 | December 31, 2018 |
| Carrying amount reported on the Consolidated Balance Sheet | $ | 5,172 |
| $ | 4,483 |
|
| Aggregate unpaid principal balance in excess of fair value | 631 |
| 861 |
|
|
| | | | | | |
| In millions of dollars | September 30, 2018 | December 31, 2017 |
| Carrying amount reported on the Consolidated Balance Sheet | $ | 5,042 |
| $ | 4,627 |
|
| Aggregate unpaid principal balance in excess of fair value | 781 |
| 74 |
|
22. GUARANTEES, LEASES AND COMMITMENTS
Citi provides a variety of guarantees and indemnifications to its customers to enhance their credit standing and enable them to complete a wide variety of business transactions. For
certain contracts meeting the definition of a guarantee, the guarantor must recognize, at inception, a liability for the fair value of the obligation undertaken in issuing the guarantee.
In addition, the guarantor must disclose the maximum potential amount of future payments that the guarantor could be required to make under the guarantee, if there were a total
default by the guaranteed parties. The determination of the maximum potential future payments is based on the notional amount of the guarantees without consideration of possible
recoveries under recourse provisions or from collateral held or pledged. As such, Citi believes such amounts bear no relationship to the anticipated losses, if any, on these guarantees.
For additional information regarding Citi’s guarantees and indemnifications included in the tables below, as well as its other guarantees and indemnifications excluded from the tables below, see Note 26 to the Consolidated Financial Statements in Citi’s 20172018 Annual Report on Form 10-K.
The following tables present information about Citi’s guarantees at September 30, 2018March 31, 2019 and December 31, 2017:2018:
| | | | Maximum potential amount of future payments | | Maximum potential amount of future payments | |
| In billions of dollars at September 30, 2018 except carrying value in millions | Expire within 1 year | Expire after 1 year | Total amount outstanding | Carrying value (in millions of dollars) | |
| In billions of dollars at March 31, 2019 | | Expire within 1 year | Expire after 1 year | Total amount outstanding | Carrying value (in millions of dollars) |
| Financial standby letters of credit | $ | 29.9 |
| $ | 65.5 |
| $ | 95.4 |
| $ | 165 |
| $ | 33.5 |
| $ | 63.6 |
| $ | 97.1 |
| $ | 163 |
|
| Performance guarantees | 7.8 |
| 4.0 |
| 11.8 |
| 30 |
| 8.2 |
| 3.9 |
| 12.1 |
| 28 |
|
| Derivative instruments considered to be guarantees | 21.2 |
| 84.5 |
| 105.7 |
| 307 |
| 46.4 |
| 73.4 |
| 119.8 |
| 326 |
|
| Loans sold with recourse | — |
| 1.4 |
| 1.4 |
| 9 |
| — |
| 1.3 |
| 1.3 |
| 8 |
|
Securities lending indemnifications(1) | 120.5 |
| — |
| 120.5 |
| — |
| 105.1 |
| — |
| 105.1 |
| — |
|
Credit card merchant processing(1)(2) | 95.5 |
| — |
| 95.5 |
| — |
| 85.6 |
| — |
| 85.6 |
| — |
|
| Credit card arrangements with partners | — |
| 1.1 |
| 1.1 |
| 162 |
| 0.2 |
| 0.8 |
| 1.0 |
| 136 |
|
| Custody indemnifications and other | — |
| 38.6 |
| 38.6 |
| 62 |
| — |
| 32.9 |
| 32.9 |
| 41 |
|
| Total | $ | 274.9 |
| $ | 195.1 |
| $ | 470.0 |
| $ | 735 |
| $ | 279.0 |
| $ | 175.9 |
| $ | 454.9 |
| $ | 702 |
|
| | | | Maximum potential amount of future payments | | Maximum potential amount of future payments | |
| In billions of dollars at December 31, 2017 except carrying value in millions | Expire within 1 year | Expire after 1 year | Total amount outstanding | Carrying value (in millions of dollars) | |
| In billions of dollars at December 31, 2018 | | Expire within 1 year | Expire after 1 year | Total amount outstanding | Carrying value (in millions of dollars) |
| Financial standby letters of credit | $ | 27.9 |
| $ | 65.9 |
| $ | 93.8 |
| $ | 93 |
| $ | 31.8 |
| $ | 65.3 |
| $ | 97.1 |
| $ | 131 |
|
| Performance guarantees | 7.2 |
| 4.1 |
| 11.3 |
| 20 |
| 7.7 |
| 4.2 |
| 11.9 |
| 29 |
|
| Derivative instruments considered to be guarantees | 11.0 |
| 84.9 |
| 95.9 |
| 423 |
| 23.5 |
| 87.4 |
| 110.9 |
| 567 |
|
| Loans sold with recourse | — |
| 1.4 |
| 1.4 |
| 9 |
| — |
| 1.2 |
| 1.2 |
| 9 |
|
Securities lending indemnifications(1) | 103.7 |
| — |
| 103.7 |
| — |
| 98.3 |
| — |
| 98.3 |
| — |
|
Credit card merchant processing(1)(2) | 85.5 |
| — |
| 85.5 |
| — |
| 95.0 |
| — |
| 95.0 |
| — |
|
| Credit card arrangements with partners | 0.3 |
| 1.1 |
| 1.4 |
| 205 |
| 0.3 |
| 0.8 |
| 1.1 |
| 162 |
|
| Custody indemnifications and other | — |
| 36.0 |
| 36.0 |
| 59 |
| — |
| 35.4 |
| 35.4 |
| 41 |
|
| Total | $ | 235.6 |
| $ | 193.4 |
| $ | 429.0 |
| $ | 809 |
| $ | 256.6 |
| $ | 194.3 |
| $ | 450.9 |
| $ | 939 |
|
| |
| (1) | The carrying values of securities lending indemnifications and credit card merchant processing were not material for either period presented, as the probability of potential liabilities arising from these guarantees is minimal. |
| |
| (2) | At September 30, 2018March 31, 2019 and December 31, 2017,2018, this maximum potential exposure was estimated to be $96$86 billion and $86$95 billion, respectively. However, Citi believes that the maximum exposure is not representative of the actual potential loss exposure based on its historical experience. This contingent liability is unlikely to arise, as most products and services are delivered when purchased and amounts are refunded when items are returned to merchants. |
Loans soldSold with recourseRecourse
Loans sold with recourse represent Citi’s obligations to
reimburse the buyers for loan losses under certain
circumstances. Recourse refers to the clause in a sales
agreement under which a seller/lender will fully reimburse
the buyer/investor for any losses resulting from the
purchased loans. This may be accomplished by the seller
taking back any loans that become delinquent.
In addition to the amounts shown in the tables above,
Citi has recorded a repurchase reserve for its potential
repurchases or make-whole liability regarding residential
mortgage representation and warranty claims related to its
whole loan sales to U.S. government-sponsored
enterprises (GSEs) and, to a lesser extent, private investors.
The repurchase reserve was approximately $54$47 million and $66$49 million at September 30, 2018March 31, 2019 and December 31, 2017,2018, respectively, and these amounts are included in Other liabilities on the Consolidated Balance Sheet.
Credit card arrangementsCard Arrangements with partnersPartners
Citi, in certain of its credit card partner arrangements,
provides guarantees to the partner regarding the volume of
certain customer originations during the term of the
agreement. To the extent that such origination targets are not met,
the guarantees serve to compensate the partner for certain
payments that otherwise would have been generated in
connection with such originations.
Other guaranteesGuarantees and indemnificationsIndemnifications
Credit Card Protection Programs
Citi, through its credit card businesses, provides various
cardholder protection programs on several of its card
products, including programs that provide insurance
coverage for rental cars, coverage for certain losses
associated with purchased products, price protection for
certain purchases and protection for lost luggage. These
guarantees are not included in the table, since the total
outstanding amount of the guarantees and Citi’s maximum
exposure to loss cannot be quantified. The protection is
limited to certain types of purchases and losses, and it is not
possible to quantify the purchases that would qualify for
these benefits at any given time. Citi assesses the probability
and amount of its potential liability related to these programs
based on the extent and nature of its historical loss
experience. At September 30, 2018March 31, 2019 and December 31, 2017,2018, the actual and estimated losses incurred and the carrying value of Citi’s obligations related to these programs were
immaterial.
Value-Transfer Networks
Citi is a member of, or shareholder in, hundreds of value-transfer networks (VTNs) (payment, clearing and settlement
systems as well as exchanges) around the world. As a
condition of membership, many of these VTNs require that
members stand ready to pay a pro rata share of the losses
incurred by the organization due to another member’s default
on its obligations. Citi’s potential obligations may be limited
to its membership interests in the VTNs, contributions to the
VTN’s funds, or, in limited cases, the obligation may be unlimited. The maximum exposure cannot be estimated as
this would require an assessment of claims that have
not yet occurred. Citi believes the risk of loss is remote
given historical experience with the VTNs. Accordingly,
Citi’s participation in VTNs is not reported in the guarantees
tables above, and there are no amounts reflected on the
Consolidated Balance Sheet as of September 30, 2018March 31, 2019 or
December 31, 20172018 for potential obligations that could arise
from Citi’s involvement with VTN associations.
Long-Term Care Insurance Indemnification
In 2000, Travelers Life & Annuity (Travelers), then a subsidiary of Citi, entered into a reinsurance agreement to transfer the risks and rewards of its long-term care (LTC) business to GE Life (now Genworth Financial Inc., or Genworth), then a subsidiary of the General Electric Company (GE). As part of this transaction, the reinsurance obligations were provided by two regulated insurance subsidiaries of GE Life, which funded two collateral trusts with securities. Presently, as discussed below, the trusts are referred to as the Genworth Trusts.
As part of GE’s spin-off of Genworth in 2004, GE retained the risks and rewards associated with the 2000 Travelers reinsurance agreement by providing a reinsurance contract to Genworth through its Union Fidelity Life Insurance Company (UFLIC) subsidiary that covers the Travelers LTC policies. In addition, GE provided a capital maintenance agreement in favor of UFLIC that is designed to assure that UFLIC will have the funds to pay its reinsurance obligations. As a result of these reinsurance agreements and the spin-off of Genworth, Genworth has reinsurance protection from UFLIC (supported by GE) and has reinsurance obligations in connection with the Travelers LTC policies. As noted below, the Genworth reinsurance obligations now benefit Brighthouse Financial, Inc. (Brighthouse). While neither Brighthouse nor Citi are direct beneficiaries of the capital maintenance agreement between GE and UFLIC, Brighthouse and Citi benefit indirectly from the existence of the capital maintenance agreement, which helps assure that UFLIC will continue to have funds necessary to pay its reinsurance obligations to Genworth.
In connection with Citi’s 2005 sale of Travelers to MetLife Inc. (MetLife), Citi provided an indemnification to MetLife for losses (including policyholder claims) relating to the LTC business for the entire term of the Travelers LTC policies, which, as noted above, are reinsured by subsidiaries of Genworth. In 2017, MetLife spun off its retail insurance business to Brighthouse. As a result, the Travelers LTC policies now reside with Brighthouse. The original reinsurance agreement between Travelers (now Brighthouse) and Genworth remains in place and Brighthouse is the sole beneficiary of the Genworth Trusts. The fair value of the Genworth Trusts is approximately $7.4$7.9 billion as of September 30, 2018,March 31, 2019, compared to approximately $7.5 billion at December 31, 2017.2018. The Genworth Trusts are designed to provide collateral to Brighthouse in an amount equal to the statutory liabilities of Brighthouse in respect of the Travelers LTC policies. The assets in the Genworth Trusts are
evaluated and adjusted periodically to ensure that the fair value of the assets continues to provide collateral in an amount equal to these estimated statutory liabilities, as the liabilities change over time.
If both (i) Genworth fails to perform under the original
Travelers/GE Life reinsurance agreement for any reason,
including insolvency or the failure of UFLIC to perform in a timely manner, and (ii) the assets of the two Genworth Trusts
are insufficient or unavailable, then Citi, through its LTC
reinsurance indemnification, must reimburse Brighthouse for
any losses incurred in connection with the LTC policies. Since both events would have to occur before Citi would become responsible for any payment to Brighthouse pursuant to its indemnification obligation, and the likelihood of such events occurring is currently not probable, there is no liability reflected on the Consolidated Balance Sheet as of September 30, 2018March 31, 2019 and December 31, 20172018 related to this indemnification. Citi continues to closely monitor its potential exposure under this indemnification obligation.
Separately, Genworth announced that it had agreed to
be purchased by China Oceanwide Holdings Co., Ltd, subject to a series of conditions and regulatory approvals. Citi is monitoring these developments.
Futures and over-the-counter derivatives clearingOver-the-Counter Derivatives Clearing
Citi provides clearing services on central clearing parties (CCP) for clients that need to clear exchange-traded and over-the-counter (OTC) derivative contracts with CCPs. Based on all relevant facts and circumstances, Citi has concluded that it acts as an agent for accounting purposes in its role as clearing member for these client transactions. As such, Citi does not reflect the underlying exchange-traded or OTC derivatives contracts in its Consolidated Financial Statements. See Note 19 for a discussion of Citi’s derivatives activities that are reflected in its Consolidated Financial Statements.
As a clearing member, Citi collects and remits cash and securities collateral (margin) between its clients and the
respective CCP. In certain circumstances, Citi collects a higher amount of cash (or securities) from its clients than it needs to remit to the CCPs. This excess cash is then held at depository institutions such as banks or carry brokers.
There are two types of margin: initial and variation. Where Citi obtains benefits from or controls cash initial margin (e.g., retains an interest spread), cash initial margin collected from clients and remitted to the CCP or depository institutions is reflected within Brokerage payables (payables to customers) and Brokerage receivables (receivables from brokers, dealers and clearing organizations) or Cash and due from banks, respectively.
However, for exchange-traded and OTC-cleared derivative contracts where Citi does not obtain benefits from or control the client cash balances, the client cash initial margin collected from clients and remitted to the CCP or depository institutions is not reflected on Citi’s Consolidated Balance Sheet. These conditions are met when Citi has contractually agreed with the client that (i) Citi will pass through to the client all interest paid by the CCP or depository institutions on the cash initial margin, (ii) Citi
will not utilize its right as a clearing member to transform cash margin into other assets, (iii) Citi does not guarantee and is not liable to the client for the performance of the CCP or the depository institution and (iv) the client cash balances are legally isolated from Citi’s bankruptcy estate. The total amount of cash initial margin collected and remitted in this manner was approximately $13.2$13.1 billion and $10.7$13.8 billion as of September 30, 2018March 31, 2019 and December 31, 2017,2018, respectively.
Variation margin due from clients to the respective CCP, or from the CCP to clients, reflects changes in the value of the client’s derivative contracts for each trading day. As a clearing member, Citi is exposed to the risk of non-performance by clients (e.g., failure of a client to post
variation margin to the CCP for negative changes in the
value of the client’s derivative contracts). In the event of
non-performance by a client, Citi would move to close out
the client’s positions. The CCP would typically utilize initial
margin posted by the client and held by the CCP, with any
remaining shortfalls required to be paid by Citi as clearing
member. Citi generally holds incremental cash or securities
margin posted by the client, which would typically be
expected to be sufficient to mitigate Citi’s credit risk in the
event the client fails to perform.
As required by ASC 860-30-25-5, securities collateral posted by clients is not recognized on Citi’s Consolidated Balance Sheet.
Carrying Value—Guarantees and Indemnifications
At September 30, 2018March 31, 2019 and December 31, 2017,2018, the total carrying amounts of the liabilities related to the guarantees and indemnifications included in the tables above amounted
to approximately $0.7 billion and $0.8 billion.$0.9 billion, respectively. The carrying value of financial and performance guarantees is included in Other liabilities. For loans sold with recourse, the carrying value of the liability is included in Other liabilities.
Collateral
Cash collateral available to Citi to reimburse losses realized under these guarantees and indemnifications amounted to $51$67 billion and $46$55 billion at September 30, 2018March 31, 2019 and December 31, 2017,2018, respectively. Securities and other marketable assets held as collateral amounted to $82approximately $57 billion and $70$55 billion at September 30, 2018March 31, 2019 and December 31, 2017,2018, respectively. The majority of collateral is held to reimburse losses realized under securities lending indemnifications. Additionally, letters of credit in favor of Citi held as collateral amounted to $3.9$3.8 billion and $3.7$4.1 billion at September 30, 2018March 31, 2019 and December 31, 2017, respectively.2018. Other property may also be available to Citi to cover losses under certain guarantees and indemnifications; however, the value of such property has not been determined.
Performance riskRisk
Presented in the tables below are the maximum potential amounts of future payments that are classified based upon internal and external credit ratings. The determination of the maximum potential future payments is based on the notional amount of the guarantees without consideration of possible recoveries under recourse provisions or from collateral held or pledged. As such, Citi believes such amounts bear no relationship to the anticipated losses, if any, on these guarantees.
| | | | Maximum potential amount of future payments | Maximum potential amount of future payments |
| In billions of dollars at September 30, 2018 | Investment grade | Non-investment grade | Not rated | Total | |
| In billions of dollars at March 31, 2019 | | Investment grade | Non-investment grade | Not rated | Total |
| Financial standby letters of credit | $ | 68.0 |
| $ | 11.4 |
| $ | 16.0 |
| $ | 95.4 |
| $ | 69.4 |
| $ | 11.5 |
| $ | 16.2 |
| $ | 97.1 |
|
| Performance guarantees | 8.6 |
| 2.2 |
| 1.0 |
| 11.8 |
| 9.8 |
| 1.9 |
| 0.4 |
| 12.1 |
|
| Derivative instruments deemed to be guarantees | — |
| — |
| 105.7 |
| 105.7 |
| — |
| — |
| 119.8 |
| 119.8 |
|
| Loans sold with recourse | — |
| — |
| 1.4 |
| 1.4 |
| — |
| — |
| 1.3 |
| 1.3 |
|
| Securities lending indemnifications | — |
| — |
| 120.5 |
| 120.5 |
| — |
| — |
| 105.1 |
| 105.1 |
|
| Credit card merchant processing | — |
| — |
| 95.5 |
| 95.5 |
| — |
| — |
| 85.6 |
| 85.6 |
|
| Credit card arrangements with partners | — |
| — |
| 1.1 |
| 1.1 |
| — |
| — |
| 1.0 |
| 1.0 |
|
| Custody indemnifications and other | 25.7 |
| 12.9 |
| — |
| 38.6 |
| 19.8 |
| 13.1 |
| — |
| 32.9 |
|
| Total | $ | 102.3 |
| $ | 26.5 |
| $ | 341.2 |
| $ | 470.0 |
| $ | 99.0 |
| $ | 26.5 |
| $ | 329.4 |
| $ | 454.9 |
|
|
| | | | | | | | | | | | |
| | Maximum potential amount of future payments |
| In billions of dollars at December 31, 2018 | Investment grade | Non-investment grade | Not rated | Total |
| Financial standby letters of credit | $ | 68.3 |
| $ | 11.8 |
| $ | 17.0 |
| $ | 97.1 |
|
| Performance guarantees | 9.2 |
| 2.1 |
| 0.6 |
| 11.9 |
|
| Derivative instruments deemed to be guarantees | — |
| — |
| 110.9 |
| 110.9 |
|
| Loans sold with recourse | — |
| — |
| 1.2 |
| 1.2 |
|
| Securities lending indemnifications | — |
| — |
| 98.3 |
| 98.3 |
|
| Credit card merchant processing | — |
| — |
| 95.0 |
| 95.0 |
|
| Credit card arrangements with partners | — |
| — |
| 1.1 |
| 1.1 |
|
| Custody indemnifications and other | 22.2 |
| 13.2 |
| — |
| 35.4 |
|
| Total | $ | 99.7 |
| $ | 27.1 |
| $ | 324.1 |
| $ | 450.9 |
|
Leases
The Company’s operating leases, where Citi is a lessee, include real estate, such as office space and branches, and various types of equipment. These leases have a weighted-average lease term of approximately nine years as of March 31, 2019. The operating lease ROU asset and lease liability were both approximately $4.1 billion as of March 31, 2019. The Company recognizes fixed lease costs on a straight-line basis throughout the lease term in the Consolidated Statement of Income. Additionally, variable lease costs are recognized in the period in which the obligation for those payments is incurred. The total operating lease expense (principally for offices, branches and equipment), net of approximately $19 million sublease income, was approximately $270 million for the three months ended March 31, 2019.
While Citi has, as a lessee, certain equipment finance leases, such leases are not material to the Company's Consolidated Financial Statements.
Citi’s lease arrangements that have not yet commenced as of March 31, 2019 and the Company’s short-term lease costs, variable lease costs and finance lease costs, for the three months ended March 31, 2019 are not material to the Consolidated Financial Statements. Citi’s operating cash outflows related to operating leases were approximately $234 million for the three months ended March 31, 2019, while the future lease payments are as follows:
|
| | | |
| In millions of dollars | Operating leases |
| As of March 31, 2019 | |
2019 (excluding the three months ended March 31, 2019) | $ | 704 |
|
| 2020 | 755 |
|
| 2021 | 638 |
|
| 2022 | 514 |
|
| 2023 | 405 |
|
| Thereafter | 1,794 |
|
| Total future lease payments | $ | 4,810 |
|
| Less imputed interest (based on weighted-average discount rate of 3.5%) | (698 | ) |
| Lease liability | $ | 4,112 |
|
|
| | | | | | | | | | | | |
| | Maximum potential amount of future payments |
| In billions of dollars at December 31, 2017 | Investment grade | Non-investment grade | Not rated | Total |
| Financial standby letters of credit | $ | 68.1 |
| $ | 10.9 |
| $ | 14.8 |
| $ | 93.8 |
|
| Performance guarantees | 7.9 |
| 2.4 |
| 1.0 |
| 11.3 |
|
| Derivative instruments deemed to be guarantees | — |
| — |
| 95.9 |
| 95.9 |
|
| Loans sold with recourse | — |
| — |
| 1.4 |
| 1.4 |
|
| Securities lending indemnifications | — |
| — |
| 103.7 |
| 103.7 |
|
| Credit card merchant processing | — |
| — |
| 85.5 |
| 85.5 |
|
| Credit card arrangements with partners | — |
| — |
| 1.4 |
| 1.4 |
|
| Custody indemnifications and other | 23.7 |
| 12.3 |
| — |
| 36.0 |
|
| Total | $ | 99.7 |
| $ | 25.6 |
| $ | 303.7 |
| $ | 429.0 |
|
Credit Commitments and Lines of Credit
The table below summarizes Citigroup’s credit commitments:
|
| | | | | | | | | | | | |
| In millions of dollars | U.S. | Outside of U.S. | March 31,
2019 | December 31, 2018 |
| Commercial and similar letters of credit | $ | 834 |
| $ | 5,061 |
| $ | 5,895 |
| $ | 5,461 |
|
| One- to four-family residential mortgages | 1,750 |
| 1,669 |
| 3,419 |
| 2,671 |
|
| Revolving open-end loans secured by one- to four-family residential properties | 9,977 |
| 1,335 |
| 11,312 |
| 11,374 |
|
| Commercial real estate, construction and land development | 9,798 |
| 1,638 |
| 11,436 |
| 11,293 |
|
| Credit card lines | 615,230 |
| 92,865 |
| 708,095 |
| 696,007 |
|
| Commercial and other consumer loan commitments | 194,289 |
| 112,053 |
| 306,342 |
| 300,115 |
|
| Other commitments and contingencies | 2,384 |
| 563 |
| 2,947 |
| 3,321 |
|
| Total | $ | 834,262 |
| $ | 215,184 |
| $ | 1,049,446 |
| $ | 1,030,242 |
|
|
| | | | | | | | | | | | |
| In millions of dollars | U.S. | Outside of U.S. | September 30,
2018 | December 31, 2017 |
| Commercial and similar letters of credit | $ | 798 |
| $ | 4,290 |
| $ | 5,088 |
| $ | 5,000 |
|
| One- to four-family residential mortgages | 1,199 |
| 1,709 |
| 2,908 |
| 2,674 |
|
| Revolving open-end loans secured by one- to four-family residential properties | 10,212 |
| 1,391 |
| 11,603 |
| 12,323 |
|
| Commercial real estate, construction and land development | 12,175 |
| 1,971 |
| 14,146 |
| 11,151 |
|
| Credit card lines | 605,614 |
| 94,646 |
| 700,260 |
| 678,300 |
|
| Commercial and other consumer loan commitments | 199,722 |
| 107,517 |
| 307,239 |
| 272,655 |
|
| Other commitments and contingencies | 3,165 |
| 516 |
| 3,681 |
| 3,071 |
|
| Total | $ | 832,885 |
| $ | 212,040 |
| $ | 1,044,925 |
| $ | 985,174 |
|
The majority of unused commitments are contingent upon customers maintaining specific credit standards.
Commercial commitments generally have floating interest rates and fixed expiration dates and may require payment of fees. Such fees (net of certain direct costs) are deferred and, upon exercise of the commitment, amortized over the life of
the loan or, if exercise is deemed remote, amortized over the commitment period.
Other commitments and contingencies
Other commitments and contingencies include all other transactions related to commitments and contingencies not reported on the lines above.
Unsettled reverse repurchase and securities borrowing agreements and unsettled repurchase and securities lending agreements
In addition, in the normal course of business, Citigroup enters into reverse repurchase and securities borrowing agreements, as well as repurchase and securities lending agreements, which settle at a future date. At September 30, 2018,March 31, 2019 and December 31, 2017,2018, Citigroup had $54.1approximately $64.9 billion and $35.0$36.1 billion of unsettled reverse repurchase and securities borrowing agreements, respectively, and $43.0approximately $55.3 billion and $19.1$30.7 billion of unsettled repurchase and securities lending agreements, respectively. For a further discussion of securities purchased under agreements to resell and securities borrowed, and securities sold under agreements to repurchase and securities loaned, including the Company’s policy for offsetting repurchase and reverse repurchase agreements, see Note 10 to the Consolidated Financial Statements.
Restricted Cash
Citigroup defines restricted cash (as cash subject to withdrawal restrictions) to include cash deposited with central banks that must be maintained to meet minimum regulatory requirements, and cash set aside for the benefit of customers or for other purposes such as compensating balance arrangements or debt retirement. Restricted cash includes minimum reserve requirements with the Federal
Reserve Bank and certain other central banks and cash segregated to satisfy rules regarding the protection of customer assets as required by Citigroup broker-dealers’ primary regulators, including the United States Securities and Exchange Commission (SEC), the Commodities Futures Trading Commission and the United Kingdom’s Prudential Regulation Authority.
Restricted cash is included on the Consolidated Balance Sheet within the following balance sheet lines:
|
| | | | | | |
| In millions of dollars | March 31,
2019 | December 31, 2018 |
| Cash and due from banks | $ | 3,601 |
| $ | 4,000 |
|
| Deposits with banks | 23,832 |
| 27,208 |
|
| Total | $ | 27,433 |
| $ | 31,208 |
|
|
| | | | | | |
| In millions of dollars | September 30,
2018 | December 31, 2017 |
| Cash and due from banks | $ | 3,488 |
| $ | 3,151 |
|
| Deposits with banks | 24,106 |
| 27,664 |
|
| Total | $ | 27,594 |
| $ | 30,815 |
|
23. CONTINGENCIES
The following information supplements and amends, as applicable, the disclosuresdisclosure in Note 23 to the Consolidated Financial Statements of Citigroup’s First Quarter of 2018 Form 10-Q and Second Quarter of 2018 Form 10-Q and Note 27 to the Consolidated Financial Statements of Citigroup’s 20172018 Annual Report on Form 10-K. For purposes of this Note, Citigroup, its affiliates and subsidiaries and current and former officers, directors and employees, are sometimes collectively referred to as Citigroup and Related Parties.
In accordance with ASC 450, Citigroup establishes accruals for contingencies, including the litigation and regulatory matters disclosed herein, when Citigroup believes it is probable that a loss has been incurred and the amount of the loss can be reasonably estimated. Once established, accruals are adjusted from time to time, as appropriate, in light of additional information. The amount of loss ultimately incurred in relation to those matters may be substantially higher or lower than the amounts accrued for those matters.
If Citigroup has not accrued for a matter because the matter does not meet the criteria for accrual (as set forth above), or Citigroup believes an exposure to loss exists in excess of the amount accrued for a particular matter, in each case assuming a material loss is reasonably possible, Citigroup discloses the matter. In addition, for such matters, Citigroup discloses an estimate of the aggregate reasonably possible loss or range of loss in excess of the amounts accrued for those matters as to which an estimate can be made. At September 30, 2018,March 31, 2019, Citigroup’s estimate of the reasonably possible unaccrued loss for these matters was materially unchanged from the estimate of approximately $1.0 billion in the aggregate as of June 30,December 31, 2018.
As available information changes, the matters for which Citigroup is able to estimate will change, and the estimates themselves will change. In addition, while many estimates presented in financial statements and other financial disclosures involve significant judgment and may be subject to significant uncertainty, estimates of the range of reasonably possible loss arising from litigation and regulatory proceedings are subject to particular uncertainties. For example, at the time of making an estimate, Citigroup may have only preliminary, incomplete or inaccurate information about the facts underlying the claim; its assumptions about the future rulings of the court or other tribunal on significant issues, or the behavior and incentives of adverse parties or regulators, may prove to be wrong; and the outcomes it is attempting to predict are often not amenable to the use of statistical or other quantitative analytical tools. In addition, from time to time an outcome may occur that Citigroup had not accounted for in its estimates because it had deemed such an outcome to be remote. For all these reasons, the amount of loss in excess of accruals ultimately incurred for the matters as to which an estimate has been made could be substantially higher or lower than the range of loss included in the estimate.
Subject to the foregoing, it is the opinion of Citigroup's management, based on current knowledge and after taking into account its current legal accruals, that the eventual outcome of all matters described in this Note would not be likely to have a
material adverse effect on the consolidated financial condition of Citigroup. Nonetheless, given the substantial or
indeterminate amounts sought in certain of these matters and the inherent unpredictability of such matters, an adverse outcome in certain of these matters could, from time to time, have a material adverse effect on Citigroup’s consolidated results of operations or cash flows in particular quarterly or annual periods.
For further information on ASC 450 and Citigroup's accounting and disclosure framework for contingencies, including for litigation and regulatory matters disclosed herein, see Note 27 to the Consolidated Financial Statements of Citigroup’s 20172018 Annual Report on Form 10-K.
Depositary ReceiptsCredit Crisis-Related Litigation and Other Matters
Regulatory
Mortgage-Related Litigation and Other Matters
Mortgage-Backed Securities Trustee Actions: The SEC’s Division of Enforcement has been investigating depositary banks and broker-dealers, including Citigroup and Related Parties, in connection with activity relating to pre-released American Depositary Receipts from 2011 to 2015. Citi has been in active discussions with the SEC about a potential resolution of the investigation.
Other Litigation:On AugustMarch 20, 2018, plaintiffs filed a motion for preliminary approval of a class action settlement, which2019, the court subsequently granted. A hearing for final approval ofgranted Citibank’s motion to dismiss the settlement is scheduled for December 21, 2018.Federal Deposit Insurance Corporation’s amended complaint. Additional information concerning this action is publicly available in court filings under the docket number 15 Civ. 918515-cv-6574 (S.D.N.Y.) (McMahon, C.(Carter, J.).
Tribune Company Bankruptcy
On April 4, 2019, the litigation trustee in KIRSCHNER v. FITZSIMONS, ET AL. filed a motion for leave to amend the complaint to avoid and recover as constructive fraudulent transfers the transfers of Tribune stock that occurred as a part of the leveraged buyout. The motion was denied on April 23, 2019.
On February 21, 2019, the litigation trustee appealed to the United States Court of Appeals for the Second Circuit from the January 23, 2019 dismissal of a separate action related to Citigroup Global Markets Inc.’s (CGMI) role as advisor to Tribune. Additional information concerning these actions is publicly available in court filings under the docket numbers 08-13141 (Bankr. D. Del.) (Carey, J.), 11 MD 02296 (S.D.N.Y.) (Cote, J.), 12 MC 2296 (S.D.N.Y.) (Cote, J.), 13-3992, 13-3875, 13-4196, 19-449 (2d Cir.) and 16-317 (U.S.).
Foreign Exchange Matters
Antitrust and Other Litigation: On August 6, 2018,March 1, 2019, in IN RE
FOREIGN EXCHANGE BENCHMARK RATES
ANTITRUST LITIGATION, the court granted plaintiffs’ motion for final approval of the proposed class settlements withALLIANZ GLOBAL INVESTORS, ET AL. v. BANK OF AMERICA CORPORATION, ET AL., plaintiffs filed an amended complaint. On April 1, 2019, Citigroup, Citibank, Citicorp,CGMI, and Citigroup Global Markets Inc. (CGMI), and certain other defendants.defendants filed a motion to dismiss the amended complaint. Additional information concerning this action is publicly available in court filings under the docket number 1318 Civ. 778910364 (S.D.N.Y.) (Schofield, J.).
On June 20, 2018,April 25, 2019, the plaintiffs in NYPLALLIANZ GLOBAL INVESTORS GMBH AND OTHERS v. JPMORGAN CHASE & CO., ET AL., the court denied plaintiffs’ request to expandBARCLAYS BANK PLC AND OTHERS served their class to include credit card, wireclaim on Citigroup and ATM transactions with a foreign currency exchange component. On September 6, 2018, the court denied plaintiffs’ motion for reconsideration. Additional information concerning this action is publicly available in court filings under the docket numbers 15 Civ. 2290 (N.D. Cal.) (Chhabria, J.) and 15 Civ. 9300 (S.D.N.Y.) (Schofield, J.).
On August 21, 2018, in CONTANT, ET AL. v. BANK OF AMERICA CORPORATION, ET AL., plaintiffs moved for preliminary approval of a proposed class settlement with Citigroup, Citibank, Citicorp and CGMI.Citibank. Additional information concerning this action is publicly available in court filings under the docket number 17CL-2018-000840.
In January 2019, in NYPL v. JPMORGAN CHASE & CO., ET AL., plaintiffs renewed their previous motion for leave to amend their complaint, which defendants have opposed. Additional information concerning this action is
publicly available in court filings under the docket number 15 Civ. 31399300 (S.D.N.Y.) (Schofield, J.).
Interbank Offered Rates-Related Litigation and Other
Matters
Antitrust and Other Litigation: On July 19, 2018,March 25, 2019, in IN RE LIBOR-BASED FINANCIAL INSTRUMENTS ANTITRUST LITIGATION, the court granted preliminary approval of the settlement between a putative class of plaintiffs (lending institutions with interestsissued an opinion granting in loans tied to USD LIBOR) and Citigroup and Citibank.
On August 1, 2018, the court granted final approval of the settlement between the largest plaintiffs’ class (investors who purchased over-the-counter derivatives from USD LIBOR panel banks) and Citigroup and Citibank.
On September 8, 2018, a putative class of plaintiffs (investors who transacted in Eurodollar futures or options on exchanges) filedpart motions for approval of a settlement with Citigroup, Citibank, CGMI and other settling defendants.
leave to further amend complaints filed by certain plaintiffs asserting individual claims. Additional information concerning these actions and related actions and appeals is publicly available in court filings under the docket numbers 11 MD 2262 (S.D.N.Y.) (Buchwald, J.) and 16-118917-1569 (2d Cir.).
On OctoberMarch 28, 2019, in SCS BANQUE DELUBAC & CIE v. CITIGROUP INC. ET AL., the Court of Appeal of Nîmes held that neither the Commercial Court of Aubenas nor the Commercial Court of Marseille has territorial jurisdiction over Banque Delubac’s claims. This case is in the Commercial Court of Marseille, RG no. 2018F02750, and was in the Court of Appeal of Nîmes, no. 18/04390.
On January 31 and on March 4, 2018, in FRONTPOINT ASIAN EVENT DRIVEN FUND, LTD., ET AL.2019, two additional putative class actions, which have been consolidated with PUTNAM BANK v. CITIBANK, N.A.INTERCONTINENTAL EXCHANGE, INC., ET AL., were filed in the court allowed FrontPoint Asian Event Driven Fund, Ltd.’s antitrust claimUnited States District Court for the Southern District of New York against ICE, Citigroup, Citibank, CGMI, and claimvarious other banks. Each of these complaints asserts claims under the Sherman Act and for breachunjust enrichment based on alleged suppression of the implied covenant of good faithICE LIBOR and fair dealing based on transactions linked to the Singapore dollar Singapore Interbank Offered Rate to proceed. The court also dismissed Sonterra Capital Master Fund, Ltd.’s antitrust claimsseeks disgorgement and both named plaintiffs’ RICO claims in their entirety.treble damages where authorized by statute. Additional information concerningrelating to this action is publicly available in court filings under the docket number 1619 Civ. 526300439 (S.D.N.Y.) (Hellerstein,(Daniels, J.).
Interchange Fee Litigation
On September 18, 2018, the plaintiffs purporting to act on behalf of the putative class primarily seeking damages (the Damages Class) moved for preliminary approval of a proposed amended settlement agreement that supersedes the original settlement agreement as of October 19, 2012 to resolve claims of the Damages Class in IN RE PAYMENT CARD INTERCHANGE FEE AND MERCHANT DISCOUNT ANTITRUST LITIGATION. Additional information regarding this matter is publicly available under the docket number MDL 05-1720 (E.D.N.Y.) (Brodie, J.).
Interest Rate Swaps Matters
Antitrust and Other Litigation:On August 7, 2018,February 20, 2019, the putative class plaintiffs in TRUEEX LLC v. BANK OF AMERICA CORPORATION, ET AL., plaintiff filed an amended complaint.the action captioned IN RE: INTEREST RATE SWAPS ANTITRUST LITIGATION moved for class certification and appointment of class counsel. On August 28, 2018, defendants movedMarch 13, 2019, the district court granted in part and denied in part the putative class plaintiffs’ motion for leave to dismiss the amendedfile a fourth consolidated class action complaint. Additional information concerning this action is publicly available in court filings under the docket numbers 18-CV-5361number 16-MD-2704 (S.D.N.Y.) (Engelmayer, J.) and 16-MDL-2704 (S.D.N.Y.) (Engelmayer, J.).
Oceanografía Fraud and Related MattersParmalat Litigation
Other Litigation: On September 28, 2018,April 15, 2019, the Italian Supreme Court upheld the 2014 decision of an Italian court of appeal in the action commenced by Oceanografia and its former controlling shareholder, Amado Yáñez Osuna, the court granted defendants’ motion to dismiss with prejudice as to the breach of contract claim and without prejudice as to the remaining claims for malicious prosecution, tortious interference with contract and fraud on forum non conveniens grounds.Citigroup’s favor. Additional information concerning this action is publicly available in court filings under the docket number 1:17-cv-01434 (S.D.N.Y.) (Sullivan, J.).27618/2014 or decision number 10540/2019.
Sovereign Securities Matters
Antitrust and Other Litigation:On August 24, 2018, the court granted defendants’ motion to dismiss consolidatedFebruary 7, 2019, a putative class action complaints related tocaptioned STACHON v. BANK OF AMERICA, N.A., ET AL., was filed in the United States District Court for the Southern District of New York against Citigroup, Citibank, CGMI, and Citigroup Global Markets Limited (CGML) and other defendants, on behalf of indirect
purchasers of supranational, sub-sovereign and agency (SSA) bonds. Plaintiffs assert claims under New York antitrust laws based on the same conduct alleged in the previously filed SSA bond market. Plaintiffs may filelawsuits and seek treble damages and injunctive relief. The action is currently stayed pending a seconddecision on the motion to dismiss in the consolidated direct purchaser action captioned IN RE SSA BONDS ANTITRUST LITIGATION. Additional information relating to these actions is publicly available in court filings under the docket numbers 19 Civ. 01205 (S.D.N.Y.) (Swain, J.), and 16-cv-03711 (S.D.N.Y.) (Ramos, J.).
On January 24, 2019, in an action filed in the Canadian Federal Court related to the SSA bond market, plaintiffs delivered an amended complaint by November 6, 2018.statement of claim, in which they continue to assert claims for breach of the competition law and breach of foreign law, while also asserting additional claims of civil conspiracy, unjust enrichment, waiver of tort and breach of contract. Additional information relating to this action is publicly available in court filings under the docket number 16 Civ. 3711 (S.D.N.Y.) (Ramos, J.T-1871-17 (Fed. Ct.).
On September 17, 2018, inBetween February 22 and April 11, 2019, 12 putative class actions, which have been consolidated under the caption IN RE MEXICAN GOVERNMENTGSE BONDS ANTITRUST LITIGATION, were filed in the United States District Court for the Southern District of New York against Citigroup, CGMI, and numerous other defendants, movedon behalf of purported classes of persons or entities that transacted in bonds issued by United States government-sponsored entities with one or more of the defendants. Plaintiffs assert claims under the Sherman Act and for unjust enrichment based on defendants’ alleged conspiracy to dismissmanipulate the consolidated amended complaint.market for such bonds, and seek treble damages and injunctive relief. Additional information concerningrelating to this action is publicly available in court filings under the docket number 1819 Civ. 28301704 (S.D.N.Y.) (Oetken,(Rakoff, J.).
Variable Rate Demand Obligation Litigation
In February and March 2019, certain financial institutions that served as remarketing agents for municipal bonds called variable rate demand obligations (VRDOs), including Citigroup, Citibank, CGMI, CGML and numerous other industry participants, were named as defendants in putative class actions filed by the City of Philadelphia and the City of Baltimore in the United States District Court for the Southern District of New York. Plaintiffs allege that defendants colluded to set artificially high VRDO interest rates. The complaints assert violations of the Sherman Act, as well as claims for breach of contract and unjust enrichment, and seek damages and injunctive relief. On April 5, 2019, the two suits were consolidated for pre-trial purposes. Additional information concerning these actions is publicly available in court filings under the docket numbers 19-CV-1608 (S.D.N.Y.) (Furman, J.) and 19-CV-2667 (S.D.N.Y.) (Furman, J.).
Settlement Payments
Payments required in settlement agreements described above have been made or are covered by existing litigation accruals.
24. CONDENSED CONSOLIDATING FINANCIAL STATEMENTS
Citigroup amended its Registration Statement on Form S-3 on file with the SEC (File No. 33-192302) to add its wholly owned subsidiary, Citigroup Global Markets Holdings Inc. (CGMHI), as a co-registrant. Any securities issued by CGMHI under the Form S-3 will be fully and unconditionally guaranteed by Citigroup.
The following are the Condensed Consolidating Statements of Income and Comprehensive Income for the three and nine months ended September 30,March 31, 2019 and 2018, and 2017, Condensed Consolidating Balance Sheet as of September 30, 2018March 31, 2019 and December 31, 20172018 and Condensed Consolidating Statement of Cash Flows for the ninethree months ended September 30,March 31, 2019 and 2018 and 2017 for Citigroup Inc., the parent holding company (Citigroup parent company), CGMHI, other Citigroup subsidiaries and eliminations and total consolidating adjustments. “Other Citigroup subsidiaries and eliminations” includes all other subsidiaries of Citigroup, intercompany eliminations and income (loss) from discontinued operations. “Consolidating adjustments” includes Citigroup parent company elimination of distributed and undistributed income of subsidiaries and investment in subsidiaries.
These Condensed Consolidating Financial Statements have been prepared and presented in accordance with SEC Regulation S-X Rule 3-10, “Financial Statements of Guarantors and Issuers of Guaranteed Securities Registered or Being Registered.”
These Condensed Consolidating Financial Statements are presented for purposes of additional analysis, but should be considered in relation to the Consolidated Financial Statements of Citigroup taken as a whole.
Condensed Consolidating Statements of Income and Comprehensive Income |
| | | | | | | | | | | | | | | | | | | |
| | Three Months Ended March 31, 2019 |
| In millions of dollars | Citigroup parent company | | CGMHI | | Other Citigroup subsidiaries and eliminations | | Consolidating adjustments | | Citigroup consolidated |
| Revenues | | | | | | | | | |
| Dividends from subsidiaries | $ | 9,167 |
| | $ | — |
| | $ | — |
| | $ | (9,167 | ) | | $ | — |
|
| Interest revenue | — |
| | 2,572 |
| | 16,504 |
| | — |
| | 19,076 |
|
| Interest revenue—intercompany | 1,325 |
| | 503 |
| | (1,828 | ) | | — |
| | — |
|
| Interest expense | 1,271 |
| | 1,824 |
| | 4,222 |
| | — |
| | 7,317 |
|
| Interest expense—intercompany | 312 |
| | 1,075 |
| | (1,387 | ) | | — |
| | — |
|
| Net interest revenue | $ | (258 | ) | | $ | 176 |
| | $ | 11,841 |
| | $ | — |
| | $ | 11,759 |
|
| Commissions and fees | $ | — |
| | $ | 1,307 |
| | $ | 1,619 |
| | $ | — |
| | $ | 2,926 |
|
| Commissions and fees—intercompany | (1 | ) | | 121 |
| | (120 | ) | | — |
| | — |
|
| Principal transactions | (825 | ) | | (1,034 | ) | | 4,663 |
| | — |
| | 2,804 |
|
| Principal transactions—intercompany | 447 |
| | 2,036 |
| | (2,483 | ) | | — |
| | — |
|
| Other income | 319 |
| | 99 |
| | 669 |
| | — |
| | 1,087 |
|
| Other income—intercompany | (34 | ) | | 42 |
| | (8 | ) | | — |
| | — |
|
| Total non-interest revenues | $ | (94 | ) | | $ | 2,571 |
| | $ | 4,340 |
| | $ | — |
| | $ | 6,817 |
|
| Total revenues, net of interest expense | $ | 8,815 |
| | $ | 2,747 |
| | $ | 16,181 |
| | $ | (9,167 | ) | | $ | 18,576 |
|
| Provisions for credit losses and for benefits and claims | $ | — |
| | $ | — |
| | $ | 1,980 |
| | $ | — |
| | $ | 1,980 |
|
| Operating expenses | | | | |
|
| | | | |
| Compensation and benefits | $ | 33 |
| | $ | 1,284 |
| | $ | 4,341 |
| | $ | — |
| | $ | 5,658 |
|
| Compensation and benefits—intercompany | 26 |
| | — |
| | (26 | ) | | — |
| | — |
|
| Other operating | 5 |
| | 553 |
| | 4,368 |
| | — |
| | 4,926 |
|
| Other operating—intercompany | 5 |
| | 582 |
| | (587 | ) | | — |
| | — |
|
| Total operating expenses | $ | 69 |
| | $ | 2,419 |
| | $ | 8,096 |
| | $ | — |
| | $ | 10,584 |
|
| Equity in undistributed income of subsidiaries | $ | (4,203 | ) | | $ | — |
| | $ | — |
| | $ | 4,203 |
| | $ | — |
|
| Income (loss) from continuing operations before income taxes | $ | 4,543 |
| | $ | 328 |
| | $ | 6,105 |
| | $ | (4,964 | ) | | $ | 6,012 |
|
| Provision (benefit) for income taxes | (167 | ) | | 140 |
| | 1,302 |
| | — |
| | 1,275 |
|
| Income (loss) from continuing operations | $ | 4,710 |
| | $ | 188 |
| | $ | 4,803 |
| | $ | (4,964 | ) | | $ | 4,737 |
|
| Loss from discontinued operations, net of taxes | — |
| | — |
| | (2 | ) | | — |
| | (2 | ) |
| Net income before attribution of noncontrolling interests | $ | 4,710 |
| | $ | 188 |
| | $ | 4,801 |
| | $ | (4,964 | ) | | $ | 4,735 |
|
| Noncontrolling interests | — |
| | — |
| | 25 |
| | — |
| | 25 |
|
| Net income (loss) | $ | 4,710 |
| | $ | 188 |
| | $ | 4,776 |
| | $ | (4,964 | ) | | $ | 4,710 |
|
| Comprehensive income | | | | | | | | | |
| Add: Other comprehensive income (loss) | $ | 862 |
| | $ | (289 | ) | | $ | 999 |
| | $ | (710 | ) | | $ | 862 |
|
| Total Citigroup comprehensive income (loss) | $ | 5,572 |
|
| $ | (101 | ) |
| $ | 5,775 |
|
| $ | (5,674 | ) |
| $ | 5,572 |
|
| Add: Other comprehensive income attributable to noncontrolling interests | $ | — |
| | $ | — |
| | $ | (13 | ) | | $ | — |
| | $ | (13 | ) |
| Add: Net income attributable to noncontrolling interests | — |
| | — |
| | 25 |
| | — |
| | 25 |
|
| Total comprehensive income (loss) | $ | 5,572 |
|
| $ | (101 | ) |
| $ | 5,787 |
|
| $ | (5,674 | ) |
| $ | 5,584 |
|
|
| | | | | | | | | | | | | | | | | | | |
| | Three Months Ended September 30, 2018 |
| In millions of dollars | Citigroup parent company | | CGMHI | | Other Citigroup subsidiaries and eliminations | | Consolidating adjustments | | Citigroup consolidated |
| Revenues | | | | | | | | | |
| Dividends from subsidiaries | $ | 7,948 |
| | $ | — |
| | $ | — |
| | $ | (7,948 | ) | | $ | — |
|
| Interest revenue | 1 |
| | 2,291 |
| | 15,878 |
| | — |
| | 18,170 |
|
| Interest revenue—intercompany | 1,281 |
| | 424 |
| | (1,705 | ) | | — |
| | — |
|
| Interest expense | 1,068 |
| | 1,405 |
| | 3,895 |
| | — |
| | 6,368 |
|
| Interest expense—intercompany | 492 |
| | 899 |
| | (1,391 | ) | | — |
| | — |
|
| Net interest revenue | $ | (278 | ) | | $ | 411 |
| | $ | 11,669 |
| | $ | — |
| | $ | 11,802 |
|
| Commissions and fees | $ | — |
| | $ | 1,194 |
| | $ | 1,609 |
| | $ | — |
| | $ | 2,803 |
|
| Commissions and fees—intercompany | — |
| | 72 |
| | (72 | ) | | — |
| | — |
|
| Principal transactions | (100 | ) | | 581 |
| | 2,085 |
| | — |
| | 2,566 |
|
| Principal transactions—intercompany | (303 | ) | | (10 | ) | | 313 |
| | — |
| | — |
|
| Other income | 266 |
| | 325 |
| | 627 |
| | — |
| | 1,218 |
|
| Other income—intercompany | (46 | ) | | 57 |
| | (11 | ) | | — |
| | — |
|
| Total non-interest revenues | $ | (183 | ) | | $ | 2,219 |
| | $ | 4,551 |
| | $ | — |
| | $ | 6,587 |
|
| Total revenues, net of interest expense | $ | 7,487 |
| | $ | 2,630 |
| | $ | 16,220 |
| | $ | (7,948 | ) | | $ | 18,389 |
|
| Provisions for credit losses and for benefits and claims | $ | — |
| | $ | 3 |
| | $ | 1,971 |
| | $ | — |
| | $ | 1,974 |
|
| Operating expenses | | | | | | | | | |
| Compensation and benefits | $ | 14 |
| | $ | 1,148 |
| | $ | 4,157 |
| | $ | — |
| | $ | 5,319 |
|
| Compensation and benefits—intercompany | 19 |
| | — |
| | (19 | ) | | — |
| | — |
|
| Other operating | (201 | ) | | 558 |
| | 4,635 |
| | — |
| | 4,992 |
|
| Other operating—intercompany | 13 |
| | 564 |
| | (577 | ) | | — |
| | — |
|
| Total operating expenses | $ | (155 | ) | | $ | 2,270 |
| | $ | 8,196 |
| | $ | — |
| | $ | 10,311 |
|
| Equity in undistributed income of subsidiaries | $ | (3,098 | ) | | $ | — |
| | $ | — |
| | $ | 3,098 |
| | $ | — |
|
| Income (loss) from continuing operations before income taxes | $ | 4,544 |
| | $ | 357 |
| | $ | 6,053 |
| | $ | (4,850 | ) | | $ | 6,104 |
|
| Provision (benefit) for income taxes | (78 | ) | | 169 |
| | 1,380 |
| | — |
| | 1,471 |
|
| Income (loss) from continuing operations | $ | 4,622 |
| | $ | 188 |
| | $ | 4,673 |
| | $ | (4,850 | ) | | $ | 4,633 |
|
| Loss from discontinued operations, net of taxes | — |
| | — |
| | (8 | ) | | — |
| | (8 | ) |
| Net income before attribution of noncontrolling interests | $ | 4,622 |
| | $ | 188 |
| | $ | 4,665 |
| | $ | (4,850 | ) | | $ | 4,625 |
|
| Noncontrolling interests | — |
| | — |
| | 3 |
| | — |
| | 3 |
|
| Net income (loss) | $ | 4,622 |
| | $ | 188 |
| | $ | 4,662 |
| | $ | (4,850 | ) | | $ | 4,622 |
|
| Comprehensive income | | | | | | | | | |
| Add: Other comprehensive income (loss) | $ | (1,151 | ) | | $ | (196 | ) | | $ | (458 | ) | | $ | 654 |
| | $ | (1,151 | ) |
| Total Citigroup comprehensive income (loss) | $ | 3,471 |
|
| $ | (8 | ) |
| $ | 4,204 |
|
| $ | (4,196 | ) |
| $ | 3,471 |
|
| Add: Other comprehensive income attributable to noncontrolling interests | $ | — |
| | $ | — |
| | $ | 8 |
| | $ | — |
| | $ | 8 |
|
| Add: Net income attributable to noncontrolling interests | — |
| | — |
| | 3 |
| | — |
| | 3 |
|
| Total comprehensive income (loss) | $ | 3,471 |
|
| $ | (8 | ) |
| $ | 4,215 |
|
| $ | (4,196 | ) |
| $ | 3,482 |
|
Condensed Consolidating Statements of Income and Comprehensive Income
| | | | Three Months Ended September 30, 2017 | Three Months Ended March 31, 2018 |
| In millions of dollars | Citigroup parent company | | CGMHI | | Other Citigroup subsidiaries and eliminations | | Consolidating adjustments | | Citigroup consolidated | Citigroup parent company | | CGMHI | | Other Citigroup subsidiaries and eliminations | | Consolidating adjustments | | Citigroup consolidated |
| Revenues | | | | | | | | | | | | | | | | | | |
| Dividends from subsidiaries | $ | 5,360 |
| | $ | — |
| | $ | — |
| | $ | (5,360 | ) | | $ | — |
| $ | 5,585 |
| | $ | — |
| | $ | — |
| | $ | (5,585 | ) | | $ | — |
|
| Interest revenue | — |
| | 1,442 |
| | 14,472 |
| | — |
| | 15,914 |
| 52 |
| | 1,656 |
| | 14,624 |
| | — |
| | 16,332 |
|
| Interest revenue—intercompany | 1,040 |
| | 313 |
| | (1,353 | ) | | — |
| | — |
| 1,130 |
| | 383 |
| | (1,513 | ) | | — |
| | — |
|
| Interest expense | 1,195 |
| | 643 |
| | 2,541 |
| | — |
| | 4,379 |
| 1,238 |
| | 1,013 |
| | 2,909 |
| | — |
| | 5,160 |
|
| Interest expense—intercompany | 240 |
| | 580 |
| | (820 | ) | | — |
| | — |
| 259 |
| | 772 |
| | (1,031 | ) | | — |
| | — |
|
| Net interest revenue | $ | (395 | ) | | $ | 532 |
| | $ | 11,398 |
| | $ | — |
| | $ | 11,535 |
| $ | (315 | ) | | $ | 254 |
| | $ | 11,233 |
| | $ | — |
| | $ | 11,172 |
|
| Commissions and fees | $ | — |
| | $ | 1,262 |
| | $ | 1,979 |
| | $ | — |
| | $ | 3,241 |
| $ | — |
| | $ | 1,252 |
| | $ | 1,778 |
| | $ | — |
| | $ | 3,030 |
|
| Commissions and fees—intercompany | — |
| | 13 |
| | (13 | ) | | — |
| | — |
| — |
| | — |
| | — |
| | — |
| | — |
|
| Principal transactions | 610 |
| | 501 |
| | 1,137 |
| | — |
| | 2,248 |
| 1,031 |
| | 921 |
| | 1,290 |
| | — |
| | 3,242 |
|
| Principal transactions—intercompany | 168 |
| | (401 | ) | | 233 |
| | — |
| | — |
| (386 | ) | | 192 |
| | 194 |
| | — |
| | — |
|
| Other income | (860 | ) | | 729 |
| | 1,526 |
| | — |
| | 1,395 |
| (928 | ) | | 153 |
| | 2,203 |
| | — |
| | 1,428 |
|
| Other income—intercompany | 32 |
| | 153 |
| | (185 | ) | | — |
| | — |
| 55 |
| | 55 |
| | (110 | ) | | — |
| | — |
|
| Total non-interest revenues | $ | (50 | ) | | $ | 2,257 |
| | $ | 4,677 |
|
| $ | — |
| | $ | 6,884 |
| $ | (228 | ) | | $ | 2,573 |
| | $ | 5,355 |
|
| $ | — |
| | $ | 7,700 |
|
| Total revenues, net of interest expense | $ | 4,915 |
| | $ | 2,789 |
| | $ | 16,075 |
| | $ | (5,360 | ) | | $ | 18,419 |
| $ | 5,042 |
| | $ | 2,827 |
| | $ | 16,588 |
| | $ | (5,585 | ) | | $ | 18,872 |
|
| Provisions for credit losses and for benefits and claims | $ | — |
| | $ | (1 | ) | | $ | 2,000 |
| | $ | — |
| | $ | 1,999 |
| $ | — |
| | $ | — |
| | $ | 1,857 |
| | $ | — |
| | $ | 1,857 |
|
| Operating expenses | | | | | | | | | | | | | | | | | | |
| Compensation and benefits | $ | (3 | ) | | $ | 1,104 |
| | $ | 4,203 |
| | $ | — |
| | $ | 5,304 |
| $ | 134 |
| | $ | 1,265 |
| | $ | 4,408 |
| | $ | — |
| | $ | 5,807 |
|
| Compensation and benefits—intercompany | 46 |
| | — |
| | (46 | ) | | — |
| | — |
| 34 |
| | — |
| | (34 | ) | | — |
| | — |
|
| Other operating | (18 | ) | | 560 |
| | 4,571 |
| | — |
| | 5,113 |
| 43 |
| | 550 |
| | 4,525 |
| | — |
| | 5,118 |
|
| Other operating—intercompany | 8 |
| | 310 |
| | (318 | ) | | — |
| | — |
| 12 |
| | 582 |
| | (594 | ) | | — |
| | — |
|
| Total operating expenses | $ | 33 |
| | $ | 1,974 |
| | $ | 8,410 |
| | $ | — |
| | $ | 10,417 |
| $ | 223 |
| | $ | 2,397 |
| | $ | 8,305 |
| | $ | — |
| | $ | 10,925 |
|
| Equity in undistributed income of subsidiaries | $ | (1,015 | ) | | $ | — |
| | $ | — |
| | $ | 1,015 |
| | $ | — |
| $ | (446 | ) | | $ | — |
| | $ | — |
| | $ | 446 |
| | $ | — |
|
Income (loss) from continuing operations before income taxes | $ | 3,867 |
| | $ | 816 |
| | $ | 5,665 |
| | $ | (4,345 | ) | | $ | 6,003 |
| $ | 4,373 |
| | $ | 430 |
| | $ | 6,426 |
| | $ | (5,139 | ) | | $ | 6,090 |
|
| Provision (benefit) for income taxes | (266 | ) | — |
| 324 |
| | 1,808 |
| | — |
| | 1,866 |
| (247 | ) | — |
| 65 |
| | 1,623 |
| | — |
| | 1,441 |
|
| Income (loss) from continuing operations | $ | 4,133 |
| | $ | 492 |
| | $ | 3,857 |
| | $ | (4,345 | ) | | $ | 4,137 |
| $ | 4,620 |
| | $ | 365 |
| | $ | 4,803 |
| | $ | (5,139 | ) | | $ | 4,649 |
|
| Loss from discontinued operations, net of taxes | — |
| | — |
| | (5 | ) | | — |
| | (5 | ) | — |
| | — |
| | (7 | ) | | — |
| | (7 | ) |
| Net income (loss) before attribution of noncontrolling interests | $ | 4,133 |
| | $ | 492 |
| | $ | 3,852 |
| | $ | (4,345 | ) | | $ | 4,132 |
| $ | 4,620 |
| | $ | 365 |
| | $ | 4,796 |
| | $ | (5,139 | ) | | $ | 4,642 |
|
| Noncontrolling interests | — |
| | — |
| | (1 | ) | | — |
| | (1 | ) | — |
| | — |
| | 22 |
| | — |
| | 22 |
|
| Net income (loss) | $ | 4,133 |
| | $ | 492 |
| | $ | 3,853 |
| | $ | (4,345 | ) | | $ | 4,133 |
| $ | 4,620 |
| | $ | 365 |
| | $ | 4,774 |
| | $ | (5,139 | ) | | $ | 4,620 |
|
| Comprehensive income | | | | | | | | | | | | | | | | | | |
| Add: Other comprehensive income (loss) | $ | 8 |
| | $ | (84 | ) | | $ | (762 | ) | | $ | 846 |
| | $ | 8 |
| $ | 52 |
| | $ | 82 |
| | $ | (3,156 | ) | | $ | 3,074 |
| | $ | 52 |
|
| Total Citigroup comprehensive income (loss) | $ | 4,141 |
|
|
| $ | 408 |
|
|
| $ | 3,091 |
|
| $ | (3,499 | ) |
| $ | 4,141 |
| $ | 4,672 |
|
|
| $ | 447 |
|
|
| $ | 1,618 |
|
| $ | (2,065 | ) |
| $ | 4,672 |
|
| Add: Other comprehensive income attributable to noncontrolling interests | $ | — |
| | $ | — |
| — |
| $ | 12 |
| | $ | — |
| | $ | 12 |
| $ | — |
| | $ | — |
| — |
| $ | 14 |
| | $ | — |
| | $ | 14 |
|
| Add: Net income attributable to noncontrolling interests | — |
| | — |
| — |
| (1 | ) | | — |
| | (1 | ) | — |
| | — |
| — |
| 22 |
| | — |
| | 22 |
|
| Total comprehensive income (loss) | $ | 4,141 |
|
|
| $ | 408 |
|
|
| $ | 3,102 |
|
| $ | (3,499 | ) | | $ | 4,152 |
| $ | 4,672 |
|
|
| $ | 447 |
|
|
| $ | 1,654 |
|
| $ | (2,065 | ) | | $ | 4,708 |
|
Condensed Consolidating Statements of Income and Comprehensive Income
|
| | | | | | | | | | | | | | | | | | | |
| | Nine Months Ended September 30, 2018 |
| In millions of dollars | Citigroup parent company | | CGMHI | | Other Citigroup subsidiaries and eliminations | | Consolidating adjustments | | Citigroup consolidated |
| Revenues | | | | | | | | | |
| Dividends from subsidiaries | $ | 16,648 |
| | $ | — |
| | $ | — |
| | $ | (16,648 | ) | | $ | — |
|
| Interest revenue | 67 |
| | 6,344 |
| | 45,641 |
| | — |
| | 52,052 |
|
| Interest revenue—intercompany | 3,636 |
| | 1,206 |
| | (4,842 | ) | | — |
| | — |
|
| Interest expense | 3,119 |
| | 3,732 |
| | 10,562 |
| | — |
| | 17,413 |
|
| Interest expense—intercompany | 1,467 |
| | 2,567 |
| | (4,034 | ) | | — |
| | — |
|
| Net interest revenue | $ | (883 | ) | | $ | 1,251 |
|
| $ | 34,271 |
| | $ | — |
|
| $ | 34,639 |
|
| Commissions and fees | $ | — |
| | $ | 3,793 |
| | $ | 5,151 |
| | $ | — |
| | $ | 8,944 |
|
| Commissions and fees—intercompany | (1 | ) | | 163 |
| | (162 | ) | | — |
| | — |
|
| Principal transactions | (275 | ) | | 805 |
| | 7,476 |
| | — |
| | 8,006 |
|
| Principal transactions—intercompany | (1,161 | ) | | 1,461 |
| | (300 | ) | | — |
| | — |
|
| Other income | 817 |
| | 666 |
| | 2,658 |
| | — |
| | 4,141 |
|
| Other income—intercompany | (111 | ) | | 88 |
| | 23 |
| | — |
| | — |
|
| Total non-interest revenues | $ | (731 | ) | | $ | 6,976 |
| | $ | 14,846 |
| | $ | — |
| | $ | 21,091 |
|
| Total revenues, net of interest expense | $ | 15,034 |
| | $ | 8,227 |
| | $ | 49,117 |
| | $ | (16,648 | ) | | $ | 55,730 |
|
| Provisions for credit losses and for benefits and claims | $ | — |
| | $ | (21 | ) | | $ | 5,664 |
| | $ | — |
| | $ | 5,643 |
|
| Operating expenses | | | | | | | | | |
| Compensation and benefits | $ | 149 |
| | $ | 3,695 |
| | $ | 12,734 |
| | $ | — |
| | $ | 16,578 |
|
| Compensation and benefits—intercompany | 82 |
| | — |
| | (82 | ) | | — |
| | — |
|
| Other operating | (210 | ) | | 1,684 |
| | 13,896 |
| | — |
| | 15,370 |
|
| Other operating—intercompany | 38 |
| | 1,835 |
| | (1,873 | ) | | — |
| | — |
|
| Total operating expenses | $ | 59 |
| | $ | 7,214 |
| | $ | 24,675 |
| | $ | — |
| | $ | 31,948 |
|
| Equity in undistributed income of subsidiaries | $ | (2,060 | ) | | $ | — |
| | $ | — |
| | $ | 2,060 |
| | $ | — |
|
| Income (loss) from continuing operations before income taxes | $ | 12,915 |
| | $ | 1,034 |
| | $ | 18,778 |
| | $ | (14,588 | ) | | $ | 18,139 |
|
| Provision (benefit) for income taxes | (817 | ) | | 853 |
| | 4,320 |
| | — |
| | 4,356 |
|
| Income (loss) from continuing operations | $ | 13,732 |
| | $ | 181 |
| | $ | 14,458 |
| | $ | (14,588 | ) | | $ | 13,783 |
|
| Net income (loss) before attribution of noncontrolling interests | $ | 13,732 |
| | $ | 181 |
| | $ | 14,458 |
| | $ | (14,588 | ) | | $ | 13,783 |
|
| Noncontrolling interests | — |
| | — |
| | 51 |
| | — |
| | 51 |
|
| Net income (loss) | $ | 13,732 |
| | $ | 181 |
| | $ | 14,407 |
| | $ | (14,588 | ) | | $ | 13,732 |
|
| Comprehensive income | | | | | | | | | |
| Add: Other comprehensive income (loss) | $ | (3,974 | ) | | $ | (186 | ) | | $ | 1,787 |
| | $ | (1,601 | ) | | $ | (3,974 | ) |
| Total Citigroup comprehensive income (loss) | $ | 9,758 |
| | $ | (5 | ) | | $ | 16,194 |
| | $ | (16,189 | ) | | $ | 9,758 |
|
| Add: Other comprehensive income attributable to noncontrolling interests | $ | — |
| | $ | — |
| | $ | (35 | ) | | $ | — |
| | $ | (35 | ) |
| Add: Net income attributable to noncontrolling interests | — |
| | — |
| | 51 |
| | — |
| | 51 |
|
| Total comprehensive income (loss) | $ | 9,758 |
|
| $ | (5 | ) |
| $ | 16,210 |
|
| $ | (16,189 | ) |
| $ | 9,774 |
|
Condensed Consolidating Statements of Income and Comprehensive Income
|
| | | | | | | | | | | | | | | | | | | |
| | Nine Months Ended September 30, 2017 |
| In millions of dollars | Citigroup parent company | | CGMHI | | Other Citigroup subsidiaries and eliminations | | Consolidating adjustments | | Citigroup consolidated |
| Revenues | | | | | | | | | |
| Dividends from subsidiaries | $ | 11,625 |
| | $ | — |
| | $ | — |
| | $ | (11,625 | ) | | $ | — |
|
| Interest revenue | — |
| | 3,873 |
| | 41,856 |
| | — |
| | 45,729 |
|
| Interest revenue—intercompany | 2,909 |
| | 847 |
| | (3,756 | ) | | — |
| | — |
|
| Interest expense | 3,549 |
| | 1,578 |
| | 6,854 |
| | — |
| | 11,981 |
|
| Interest expense—intercompany | 593 |
| | 1,666 |
| | (2,259 | ) | | — |
| | — |
|
| Net interest revenue | $ | (1,233 | ) | | $ | 1,476 |
| | $ | 33,505 |
| | $ | — |
| | $ | 33,748 |
|
| Commissions and fees | $ | — |
| | $ | 3,933 |
| | $ | 5,619 |
| | $ | — |
| | $ | 9,552 |
|
| Commissions and fees—intercompany | (1 | ) | | 123 |
| | (122 | ) | | — |
| | — |
|
| Principal transactions | 1,569 |
| | 2,377 |
| | 4,039 |
| | — |
| | 7,985 |
|
| Principal transactions—intercompany | 768 |
| | (207 | ) | | (561 | ) | | — |
| | — |
|
| Other income | (2,500 | ) | | 868 |
| | 5,287 |
| | — |
| | 3,655 |
|
| Other income—intercompany | 70 |
| | 156 |
| | (226 | ) | | — |
| | — |
|
| Total non-interest revenues | $ | (94 | ) | | $ | 7,250 |
| | $ | 14,036 |
| | $ | — |
| | $ | 21,192 |
|
| Total revenues, net of interest expense | $ | 10,298 |
| | $ | 8,726 |
| | $ | 47,541 |
| | $ | (11,625 | ) | | $ | 54,940 |
|
| Provisions for credit losses and for benefits and claims | $ | — |
| | $ | — |
| | $ | 5,378 |
| | $ | — |
| | $ | 5,378 |
|
| Operating expenses | | | | | | | | | |
| Compensation and benefits | $ | (18 | ) | | $ | 3,578 |
| | $ | 12,741 |
| | $ | — |
| | $ | 16,301 |
|
| Compensation and benefits—intercompany | 97 |
| | — |
| | (97 | ) | | — |
| | — |
|
| Other operating | (334 | ) | | 1,605 |
| | 14,328 |
| | — |
| | 15,599 |
|
| Other operating—intercompany | (41 | ) | | 1,633 |
| | (1,592 | ) | | — |
| | — |
|
| Total operating expenses | $ | (296 | ) | | $ | 6,816 |
| | $ | 25,380 |
| | $ | — |
| | $ | 31,900 |
|
| Equity in undistributed income of subsidiaries | $ | 755 |
| | $ | — |
| | $ | — |
| | $ | (755 | ) | | $ | — |
|
| Income (loss) from continuing operations before income taxes | $ | 11,349 |
| | $ | 1,910 |
| | $ | 16,783 |
| | $ | (12,380 | ) | | $ | 17,662 |
|
| Provision (benefit) for income taxes | (746 | ) | | 800 |
| | 5,470 |
| | — |
| | 5,524 |
|
| Income (loss) from continuing operations | $ | 12,095 |
| | $ | 1,110 |
| | $ | 11,313 |
| | $ | (12,380 | ) | | $ | 12,138 |
|
| Loss from discontinued operations, net of taxes | — |
| | — |
| | (2 | ) | | — |
| | (2 | ) |
| Net income (loss) before attribution of noncontrolling interests | $ | 12,095 |
| | $ | 1,110 |
| | $ | 11,311 |
| | $ | (12,380 | ) | | $ | 12,136 |
|
| Noncontrolling interests | — |
| | — |
| | 41 |
| | — |
| | 41 |
|
| Net income (loss) | $ | 12,095 |
| | $ | 1,110 |
| | $ | 11,270 |
| | $ | (12,380 | ) | | $ | 12,095 |
|
| Comprehensive income | | | | | | | | | |
| Add: Other comprehensive income (loss) | $ | 1,986 |
| | $ | (142 | ) | | $ | (4,638 | ) | | $ | 4,780 |
| | $ | 1,986 |
|
| Total Citigroup comprehensive income (loss) | $ | 14,081 |
| | $ | 968 |
| | $ | 6,632 |
| | $ | (7,600 | ) | | $ | 14,081 |
|
| Add: Other comprehensive income attributable to noncontrolling interests | $ | — |
| | $ | — |
| | $ | 82 |
| | $ | — |
| | $ | 82 |
|
| Add: Net income attributable to noncontrolling interests | — |
| | — |
| | 41 |
| | — |
| | 41 |
|
| Total comprehensive income (loss) | $ | 14,081 |
| | $ | 968 |
| | $ | 6,755 |
| | $ | (7,600 | ) | | $ | 14,204 |
|
Condensed Consolidating Balance Sheet
| | | | September 30, 2018 | March 31, 2019 |
| In millions of dollars | Citigroup parent company | | CGMHI | | Other Citigroup subsidiaries and eliminations | | Consolidating adjustments | | Citigroup consolidated | Citigroup parent company | | CGMHI | | Other Citigroup subsidiaries and eliminations | | Consolidating adjustments | | Citigroup consolidated |
| Assets | | | | | | | | | | | | | | | | | | |
| Cash and due from banks | $ | 1 |
| | $ | 543 |
| | $ | 25,183 |
| | $ | — |
| | $ | 25,727 |
| $ | 1 |
| | $ | 963 |
| | $ | 23,484 |
| | $ | — |
| | $ | 24,448 |
|
| Cash and due from banks—intercompany | 17 |
| | 2,104 |
| | (2,121 | ) | | — |
| | — |
| 11 |
| | 3,953 |
| | (3,964 | ) | | — |
| | — |
|
| Deposits with banks | — |
| | 3,302 |
| | 170,257 |
| | — |
| | 173,559 |
| — |
| | 5,287 |
| | 176,158 |
| | — |
| | 181,445 |
|
| Deposits with banks—intercompany | 3,000 |
| | 6,386 |
| | (9,386 | ) | | — |
| | — |
| 3,000 |
| | 6,235 |
| | (9,235 | ) | | — |
| | — |
|
| Federal funds sold and resale agreements | — |
| | 227,147 |
| | 53,794 |
| | — |
| | 280,941 |
| — |
| | 210,012 |
| | 54,483 |
| | — |
| | 264,495 |
|
| Federal funds sold and resale agreements—intercompany | — |
| | 19,572 |
| | (19,572 | ) | | — |
| | — |
| — |
| | 16,034 |
| | (16,034 | ) | | — |
| | — |
|
| Trading account assets | 258 |
| | 144,440 |
| | 112,804 |
| | — |
| | 257,502 |
| 296 |
| | 163,582 |
| | 122,633 |
| | — |
| | 286,511 |
|
| Trading account assets—intercompany | 963 |
| | 2,934 |
| | (3,897 | ) | | — |
| | — |
| 825 |
| | 1,770 |
| | (2,595 | ) | | — |
| | — |
|
| Investments | 7 |
| | 215 |
| | 345,291 |
| | — |
| | 345,513 |
| 5 |
| | 241 |
| | 349,035 |
| | — |
| | 349,281 |
|
| Loans, net of unearned income | — |
| | 1,518 |
| | 673,391 |
| | — |
| | 674,909 |
| — |
| | 1,731 |
| | 680,615 |
| | — |
| | 682,346 |
|
| Loans, net of unearned income—intercompany | — |
| | — |
| | — |
| | — |
| | — |
| — |
| | — |
| | — |
| | — |
| | — |
|
| Allowance for loan losses | — |
| | — |
| | (12,336 | ) | | — |
| | (12,336 | ) | — |
| | — |
| | (12,329 | ) | | — |
| | (12,329 | ) |
| Total loans, net | $ | — |
| | $ | 1,518 |
| | $ | 661,055 |
| | $ | — |
| | $ | 662,573 |
| $ | — |
| | $ | 1,731 |
| | $ | 668,286 |
| | $ | — |
| | $ | 670,017 |
|
| Advances to subsidiaries | $ | 146,339 |
| | $ | — |
| | $ | (146,339 | ) | | $ | — |
| | $ | — |
| $ | 142,884 |
| | $ | — |
| | $ | (142,884 | ) | | $ | — |
| | $ | — |
|
| Investments in subsidiaries | 203,896 |
| | — |
| | — |
| | (203,896 | ) | | — |
| 201,016 |
| | — |
| | — |
| | (201,016 | ) | | — |
|
Other assets(1) | 12,517 |
| | 67,087 |
| | 99,746 |
| | — |
| | 179,350 |
| 11,957 |
| | 63,919 |
| | 106,340 |
| | — |
| | 182,216 |
|
| Other assets—intercompany | 3,638 |
| | 45,654 |
| | (49,292 | ) | | — |
| | — |
| 3,734 |
| | 50,591 |
| | (54,325 | ) | | — |
| | — |
|
| Total assets | $ | 370,636 |
| | $ | 520,902 |
| | $ | 1,237,523 |
| | $ | (203,896 | ) | | $ | 1,925,165 |
| $ | 363,729 |
| | $ | 524,318 |
| | $ | 1,271,382 |
| | $ | (201,016 | ) | | $ | 1,958,413 |
|
| Liabilities and equity |
|
| |
| |
| |
| |
|
|
| |
| |
| |
| |
|
| Deposits | $ | — |
| | $ | — |
| | $ | 1,005,176 |
| | $ | — |
| | $ | 1,005,176 |
| $ | — |
| | $ | — |
| | $ | 1,030,355 |
| | $ | — |
| | $ | 1,030,355 |
|
| Deposits—intercompany | — |
| | — |
| | — |
| | — |
| | — |
| — |
| | — |
| | — |
| | — |
| | — |
|
| Federal funds purchased and securities loaned and sold | — |
| | 154,341 |
| | 21,574 |
| | — |
| | 175,915 |
| — |
| | 163,595 |
| | 26,777 |
| | — |
| | 190,372 |
|
| Federal funds purchased and securities loaned and sold—intercompany | — |
| | 34,948 |
| | (34,948 | ) | | — |
| | — |
| — |
| | 28,561 |
| | (28,561 | ) | | — |
| | — |
|
| Trading account liabilities | 16 |
| | 94,163 |
| | 53,473 |
| | — |
| | 147,652 |
| 14 |
| | 94,159 |
| | 42,219 |
| | — |
| | 136,392 |
|
| Trading account liabilities—intercompany | 448 |
| | 3,143 |
| | (3,591 | ) | | — |
| | — |
| 1,863 |
| | 1,919 |
| | (3,782 | ) | | — |
| | — |
|
| Short-term borrowings | 254 |
| | 4,358 |
| | 29,158 |
| | — |
| | 33,770 |
| 234 |
| | 6,485 |
| | 32,603 |
| | — |
| | 39,322 |
|
| Short-term borrowings—intercompany | — |
| | 18,100 |
| | (18,100 | ) | | — |
| | — |
| — |
| | 20,468 |
| | (20,468 | ) | | — |
| | — |
|
| Long-term debt | 148,183 |
| | 24,324 |
| | 62,763 |
| | — |
| | 235,270 |
| 149,830 |
| | 30,542 |
| | 63,194 |
| | — |
| | 243,566 |
|
| Long-term debt—intercompany | — |
| | 65,811 |
| | (65,811 | ) | | — |
| | — |
| — |
| | 73,094 |
| | (73,094 | ) | | — |
| | — |
|
| Advances from subsidiaries | 21,965 |
| | — |
| | (21,965 | ) | | — |
| | — |
| 11,634 |
| | — |
| | (11,634 | ) | | — |
| | — |
|
| Other liabilities | 2,440 |
| | 73,178 |
| | 53,901 |
| | — |
| | 129,519 |
| 3,308 |
| | 62,484 |
| | 55,599 |
| | — |
| | 121,391 |
|
| Other liabilities—intercompany | 326 |
| | 16,369 |
| | (16,695 | ) | | — |
| | — |
| 594 |
| | 10,443 |
| | (11,037 | ) | | — |
| | — |
|
| Stockholders’ equity | 197,004 |
| | 32,167 |
| | 172,588 |
| | (203,896 | ) | | 197,863 |
| 196,252 |
| | 32,568 |
| | 169,211 |
| | (201,016 | ) | | 197,015 |
|
| Total liabilities and equity | $ | 370,636 |
| | $ | 520,902 |
| | $ | 1,237,523 |
| | $ | (203,896 | ) | | $ | 1,925,165 |
| $ | 363,729 |
| | $ | 524,318 |
| | $ | 1,271,382 |
| | $ | (201,016 | ) | | $ | 1,958,413 |
|
| |
| (1) | Other assets for Citigroup parent company at September 30, 2018March 31, 2019 included $30.9$47.4 billion of placements to Citibank and its branches, of which $18.1$35.8 billion had a remaining term of less than 30 days. |
Condensed Consolidating Balance Sheet
| | | | December 31, 2017 | December 31, 2018 |
| In millions of dollars | Citigroup parent company | | CGMHI | | Other Citigroup subsidiaries and eliminations | | Consolidating adjustments | | Citigroup consolidated | Citigroup parent company | | CGMHI | | Other Citigroup subsidiaries and eliminations | | Consolidating adjustments | | Citigroup consolidated |
| Assets | | | | | | | | | | | | | | | | | | |
| Cash and due from banks | $ | — |
| | $ | 378 |
| | $ | 23,397 |
| | $ | — |
| | $ | 23,775 |
| $ | 1 |
| | $ | 689 |
| | $ | 22,955 |
| | $ | — |
| | $ | 23,645 |
|
| Cash and due from banks—intercompany | 13 |
| | 3,750 |
| | (3,763 | ) | | — |
| | — |
| 19 |
| | 3,545 |
| | (3,564 | ) | | — |
| | — |
|
| Deposits with banks | — |
| | 3,348 |
| | 153,393 |
| | — |
| | 156,741 |
| — |
| | 4,915 |
| | 159,545 |
| | — |
| | 164,460 |
|
| Deposits with banks—intercompany | 11,000 |
| | 5,219 |
| | (16,219 | ) | | — |
| | — |
| 3,000 |
| | 6,528 |
| | (9,528 | ) | | — |
| | — |
|
| Federal funds sold and resale agreements | — |
| | 182,685 |
| | 49,793 |
| | — |
| | 232,478 |
| — |
| | 212,720 |
| | 57,964 |
| | — |
| | 270,684 |
|
| Federal funds sold and resale agreements—intercompany | — |
| | 16,091 |
| | (16,091 | ) | | — |
| | — |
| — |
| | 20,074 |
| | (20,074 | ) | | — |
| | — |
|
| Trading account assets | — |
| | 139,462 |
| | 113,328 |
| | — |
| | 252,790 |
| 302 |
| | 146,233 |
| | 109,582 |
| | — |
| | 256,117 |
|
| Trading account assets—intercompany | 38 |
| | 2,711 |
| | (2,749 | ) | | — |
| | — |
| 627 |
| | 1,728 |
| | (2,355 | ) | | — |
| | — |
|
| Investments | 27 |
| | 181 |
| | 352,082 |
| | — |
| | 352,290 |
| 7 |
| | 224 |
| | 358,376 |
| | — |
| | 358,607 |
|
| Loans, net of unearned income | — |
| | 900 |
| | 666,134 |
| | — |
| | 667,034 |
| — |
| | 1,292 |
| | 682,904 |
| | — |
| | 684,196 |
|
| Loans, net of unearned income—intercompany | — |
| | — |
| | — |
| | — |
| | — |
| — |
| | — |
| | — |
| | — |
| | — |
|
| Allowance for loan losses | — |
| | — |
| | (12,355 | ) | | — |
| | (12,355 | ) | — |
| | — |
| | (12,315 | ) | | — |
| | (12,315 | ) |
| Total loans, net | $ | — |
| | $ | 900 |
| | $ | 653,779 |
| | $ | — |
| | $ | 654,679 |
| $ | — |
| | $ | 1,292 |
| | $ | 670,589 |
| | $ | — |
| | $ | 671,881 |
|
| Advances to subsidiaries | $ | 139,722 |
| | $ | — |
| | $ | (139,722 | ) | | $ | — |
| | $ | — |
| $ | 143,119 |
| | $ | — |
| | $ | (143,119 | ) | | $ | — |
| | $ | — |
|
| Investments in subsidiaries | 210,537 |
| | — |
| | — |
| | (210,537 | ) | | — |
| 205,337 |
| | — |
| | — |
| | (205,337 | ) | | — |
|
Other assets(1) | 10,844 |
| | 58,299 |
| | 100,569 |
| | — |
| | 169,712 |
| 9,861 |
| | 59,734 |
| | 102,394 |
| | — |
| | 171,989 |
|
| Other assets—intercompany | 3,428 |
| | 43,613 |
| | (47,041 | ) | | — |
| | — |
| 3,037 |
| | 44,255 |
| | (47,292 | ) | | — |
| | — |
|
| Total assets | $ | 375,609 |
| | $ | 456,637 |
| | $ | 1,220,756 |
| | $ | (210,537 | ) | | $ | 1,842,465 |
| $ | 365,310 |
| | $ | 501,937 |
| | $ | 1,255,473 |
| | $ | (205,337 | ) | | $ | 1,917,383 |
|
| Liabilities and equity |
| |
| |
| |
| |
|
|
| |
| |
| |
| |
|
|
| Deposits | $ | — |
| | $ | — |
| | $ | 959,822 |
| | $ | — |
| | $ | 959,822 |
| $ | — |
| | $ | — |
| | $ | 1,013,170 |
| | $ | — |
| | $ | 1,013,170 |
|
| Deposits—intercompany | — |
| | — |
| | — |
| | — |
| | — |
| — |
| | — |
| | — |
| | — |
| | — |
|
| Federal funds purchased and securities loaned and sold | — |
| | 134,888 |
| | 21,389 |
| | — |
| | 156,277 |
| — |
| | 155,830 |
| | 21,938 |
| | — |
| | 177,768 |
|
| Federal funds purchased and securities loaned and sold—intercompany | — |
| | 18,597 |
| | (18,597 | ) | | — |
| | — |
| — |
| | 21,109 |
| | (21,109 | ) | | — |
| | — |
|
| Trading account liabilities | — |
| | 80,801 |
| | 44,369 |
| | — |
| | 125,170 |
| 1 |
| | 95,571 |
| | 48,733 |
| | — |
| | 144,305 |
|
| Trading account liabilities—intercompany | 15 |
| | 2,182 |
| | (2,197 | ) | | — |
| | — |
| 410 |
| | 1,398 |
| | (1,808 | ) | | — |
| | — |
|
| Short-term borrowings | 251 |
| | 3,568 |
| | 40,633 |
| | — |
| | 44,452 |
| 207 |
| | 3,656 |
| | 28,483 |
| | — |
| | 32,346 |
|
| Short-term borrowings—intercompany | — |
| | 32,871 |
| | (32,871 | ) | | — |
| | — |
| — |
| | 11,343 |
| | (11,343 | ) | | — |
| | — |
|
| Long-term debt | 152,163 |
| | 18,048 |
| | 66,498 |
| | — |
| | 236,709 |
| 143,768 |
| | 25,986 |
| | 62,245 |
| | — |
| | 231,999 |
|
| Long-term debt—intercompany | — |
| | 60,765 |
| | (60,765 | ) | | — |
| | — |
| — |
| | 73,884 |
| | (73,884 | ) | | — |
| | — |
|
| Advances from subsidiaries | 19,136 |
| | — |
| | (19,136 | ) | | — |
| | — |
| 21,471 |
| | — |
| | (21,471 | ) | | — |
| | — |
|
| Other liabilities | 2,673 |
| | 62,113 |
| | 53,577 |
| | — |
| | 118,363 |
| 3,010 |
| | 66,732 |
| | 50,979 |
| | — |
| | 120,721 |
|
| Other liabilities—intercompany | 631 |
| | 9,753 |
| | (10,384 | ) | | — |
| | — |
| 223 |
| | 13,763 |
| | (13,986 | ) | | — |
| | — |
|
| Stockholders’ equity | 200,740 |
| | 33,051 |
| | 178,418 |
| | (210,537 | ) | | 201,672 |
| 196,220 |
| | 32,665 |
| | 173,526 |
| | (205,337 | ) | | 197,074 |
|
| Total liabilities and equity | $ | 375,609 |
| | $ | 456,637 |
| | $ | 1,220,756 |
| | $ | (210,537 | ) | | $ | 1,842,465 |
| $ | 365,310 |
| | $ | 501,937 |
| | $ | 1,255,473 |
| | $ | (205,337 | ) | | $ | 1,917,383 |
|
| |
| (1) | Other assets for Citigroup parent company at December 31, 20172018 included $29.7$34.7 billion of placements to Citibank and its branches, of which $18.9$22.4 billion had a remaining term of less than 30 days. |
Condensed Consolidating Statement of Cash Flows
|
| | | | | | | | | | | | | | | | | | | |
| | Three Months Ended March 31, 2019 |
| In millions of dollars | Citigroup parent company | | CGMHI | | Other Citigroup subsidiaries and eliminations | | Consolidating adjustments | | Citigroup consolidated |
| Net cash provided by (used in) operating activities of continuing operations | $ | 10,950 |
| | $ | (30,786 | ) | | $ | (17,780 | ) | | $ | — |
| | $ | (37,616 | ) |
| Cash flows from investing activities of continuing operations | | | | | | | | | |
| Purchases of investments | $ | — |
| | $ | — |
| | $ | (69,673 | ) | | $ | — |
| | $ | (69,673 | ) |
| Proceeds from sales of investments | — |
| | — |
| | 31,436 |
| | — |
| | 31,436 |
|
| Proceeds from maturities of investments | — |
| | — |
| | 47,363 |
| | — |
| | 47,363 |
|
| Change in loans | — |
| | — |
| | (892 | ) | | — |
| | (892 | ) |
| Proceeds from sales and securitizations of loans | — |
| | — |
| | 2,062 |
| | — |
| | 2,062 |
|
| Change in federal funds sold and resales | — |
| | 6,748 |
| | (559 | ) | | — |
| | 6,189 |
|
| Changes in investments and advances—intercompany | (106 | ) | | (6,636 | ) | | 6,742 |
| | — |
| | — |
|
| Other investing activities | — |
| | (17 | ) | | (425 | ) | | — |
| | (442 | ) |
| Net cash provided by (used in) investing activities of continuing operations | $ | (106 | ) | | $ | 95 |
| | $ | 16,054 |
| | $ | — |
| | $ | 16,043 |
|
| Cash flows from financing activities of continuing operations | | | | | | | | | |
| Dividends paid | $ | (1,320 | ) | | $ | — |
| | $ | — |
| | $ | — |
| | $ | (1,320 | ) |
| Redemption of preferred stock | (480 | ) | | — |
| | — |
| | — |
| | (480 | ) |
| Treasury stock acquired | (4,055 | ) | | — |
| | — |
| | — |
| | (4,055 | ) |
| Proceeds (repayments) from issuance of long-term debt, net | 5,199 |
| | 5,576 |
| | (1,791 | ) | | — |
| | 8,984 |
|
| Proceeds (repayments) from issuance of long-term debt—intercompany, net | — |
| | (1,295 | ) | | 1,295 |
| | — |
| | — |
|
| Change in deposits | — |
| | — |
| | 17,186 |
| | — |
| | 17,186 |
|
| Change in federal funds purchased and repos | — |
| | 15,217 |
| | (2,613 | ) | | — |
| | 12,604 |
|
| Change in short-term borrowings | — |
| | 2,829 |
| | 4,147 |
| | — |
| | 6,976 |
|
| Net change in short-term borrowings and other advances—intercompany | (9,838 | ) | | 9,125 |
| | 713 |
| | — |
| | — |
|
| Other financing activities | (358 | ) | | — |
| | — |
| | — |
| | (358 | ) |
| Net cash provided by (used in) financing activities of continuing operations | $ | (10,852 | ) | | $ | 31,452 |
| | $ | 18,937 |
| | $ | — |
| | $ | 39,537 |
|
| Effect of exchange rate changes on cash and due from banks | $ | — |
| | $ | — |
| | $ | (176 | ) | | $ | — |
| | $ | (176 | ) |
Change in cash and due from banks and deposits with banks
| $ | (8 | ) |
| $ | 761 |
|
| $ | 17,035 |
|
| $ | — |
| | $ | 17,788 |
|
| Cash and due from banks and deposits with banks at beginning of period | 3,020 |
| | 15,677 |
| | 169,408 |
| | — |
| | 188,105 |
|
| Cash and due from banks and deposits with banks at end of period | $ | 3,012 |
| | $ | 16,438 |
| | $ | 186,443 |
| | $ | — |
| | $ | 205,893 |
|
| Cash and due from banks | $ | 12 |
| | $ | 4,916 |
| | $ | 19,520 |
| | $ | — |
| | $ | 24,448 |
|
| Deposits with banks | 3,000 |
| | 11,522 |
| | 166,923 |
| | — |
| | 181,445 |
|
| Cash and due from banks and deposits with banks at end of period | $ | 3,012 |
| | $ | 16,438 |
| | $ | 186,443 |
| | $ | — |
| | $ | 205,893 |
|
| Supplemental disclosure of cash flow information for continuing operations | | | | | | | | | |
| Cash paid during the year for income taxes | $ | 306 |
| | $ | 57 |
| | $ | 962 |
| | $ | — |
| | $ | 1,325 |
|
| Cash paid during the year for interest | 956 |
| | 2,694 |
| | 3,281 |
| | — |
| | 6,931 |
|
| Non-cash investing activities | | | | | | | | | |
| Transfers to loans HFS from loans | $ | — |
| | $ | — |
| | $ | 2,000 |
| | $ | — |
| | $ | 2,000 |
|
| Transfers to OREO and other repossessed assets | — |
| | — |
| | 36 |
| | — |
| | 36 |
|
|
| | | | | | | | | | | | | | | | | | | |
| | Nine Months Ended September 30, 2018 |
| In millions of dollars | Citigroup parent company | | CGMHI | | Other Citigroup subsidiaries and eliminations | | Consolidating adjustments | | Citigroup consolidated |
| Net cash provided by operating activities of continuing operations | $ | 12,581 |
| | $ | 16,232 |
| | $ | 1,253 |
| | $ | — |
| | $ | 30,066 |
|
| Cash flows from investing activities of continuing operations | | | | | | | | | |
| Purchases of investments | $ | (7,955 | ) | | $ | (18 | ) | | $ | (121,081 | ) | | $ | — |
| | $ | (129,054 | ) |
| Proceeds from sales of investments | 7,634 |
| | 3 |
| | 44,533 |
| | — |
| | 52,170 |
|
| Proceeds from maturities of investments | — |
| | — |
| | 82,940 |
| | — |
| | 82,940 |
|
| Change in loans | — |
| | — |
| | (16,131 | ) | | — |
| | (16,131 | ) |
| Proceeds from sales and securitizations of loans | — |
| | — |
| | 4,021 |
| | — |
| | 4,021 |
|
| Proceeds from significant disposals | — |
| | — |
| | 314 |
| | — |
| | 314 |
|
| Change in federal funds sold and resales | — |
| | (47,943 | ) | | (519 | ) | | — |
| | (48,462 | ) |
| Changes in investments and advances—intercompany | (7,769 | ) | | (2,338 | ) | | 10,107 |
| | — |
| | — |
|
| Other investing activities | 214 |
| | (41 | ) | | (2,534 | ) | | — |
| | (2,361 | ) |
| Net cash provided by (used in) investing activities of continuing operations | $ | (7,876 | ) | | $ | (50,337 | ) | | $ | 1,650 |
| | $ | — |
| | $ | (56,563 | ) |
| Cash flows from financing activities of continuing operations | | | | | | | | | |
| Dividends paid | $ | (3,616 | ) | | $ | — |
| | $ | — |
| | $ | — |
| | $ | (3,616 | ) |
| Redemption of preferred stock | (218 | ) | | — |
| | — |
| | — |
| | (218 | ) |
| Treasury stock acquired | (9,848 | ) | | — |
| | — |
| | — |
| | (9,848 | ) |
| Proceeds (repayments) from issuance of long-term debt, net | (883 | ) | | 7,538 |
| | (829 | ) | | — |
| | 5,826 |
|
| Proceeds (repayments) from issuance of long-term debt—intercompany, net | — |
| | 5,048 |
| | (5,048 | ) | | — |
| | — |
|
| Change in deposits | — |
| | — |
| | 45,354 |
| | — |
| | 45,354 |
|
| Change in federal funds purchased and repos | — |
| | 35,804 |
| | (16,166 | ) | | — |
| | 19,638 |
|
| Change in short-term borrowings | 32 |
| | 790 |
| | (11,503 | ) | | — |
| | (10,681 | ) |
| Net change in short-term borrowings and other advances—intercompany | 2,312 |
| | (14,771 | ) | | 12,459 |
| | — |
| | — |
|
| Capital contributions from (to) parent | — |
| | (663 | ) | | 663 |
| | — |
| | — |
|
| Other financing activities | (479 | ) | | — |
| | — |
| | — |
| | (479 | ) |
| Net cash provided by (used in) financing activities of continuing operations | $ | (12,700 | ) | | $ | 33,746 |
| | $ | 24,930 |
| | $ | — |
| | $ | 45,976 |
|
| Effect of exchange rate changes on cash and due from banks | $ | — |
| | $ | — |
| | $ | (709 | ) | | $ | — |
| | $ | (709 | ) |
Change in cash and due from banks and deposits with banks
| $ | (7,995 | ) |
| $ | (359 | ) |
| $ | 27,124 |
|
| $ | — |
| | $ | 18,770 |
|
| Cash and due from banks and deposits with banks at beginning of period | 11,013 |
| | 12,695 |
| | 156,808 |
| | — |
| | 180,516 |
|
| Cash and due from banks and deposits with banks at end of period | $ | 3,018 |
| | $ | 12,336 |
| | $ | 183,932 |
| | $ | — |
| | $ | 199,286 |
|
| Cash and due from banks | $ | 18 |
| | $ | 2,648 |
| | $ | 23,061 |
| | $ | — |
| | $ | 25,727 |
|
| Deposits with banks | 3,000 |
| | 9,688 |
| | 160,871 |
| | — |
| | 173,559 |
|
| Cash and due from banks and deposits with banks at end of period | $ | 3,018 |
| | $ | 12,336 |
| | $ | 183,932 |
| | $ | — |
| | $ | 199,286 |
|
| Supplemental disclosure of cash flow information for continuing operations | | | | | | | | | |
| Cash paid during the year for income taxes | $ | 873 |
| | $ | 138 |
| | $ | 2,250 |
| | $ | — |
| | $ | 3,261 |
|
| Cash paid during the year for interest | 2,870 |
| | 6,045 |
| | 7,363 |
| | — |
| | 16,278 |
|
| Non-cash investing activities | | | | | | | | | |
| Transfers to loans HFS from loans | $ | — |
| | $ | — |
| | $ | 3,300 |
| | $ | — |
| | $ | 3,300 |
|
| Transfers to OREO and other repossessed assets | — |
| | — |
| | 94 |
| | — |
| | 94 |
|
Condensed Consolidating Statement of Cash Flows |
| | | | | | | | | | | | | | | | | | | |
| | Three Months Ended March 31, 2018 |
| In millions of dollars | Citigroup parent company | | CGMHI | | Other Citigroup subsidiaries and eliminations | | Consolidating adjustments | | Citigroup consolidated |
| Net cash provided by (used in) operating activities of continuing operations | $ | 5,268 |
| | $ | 7,046 |
| | $ | (5,358 | ) | | $ | — |
| | $ | 6,956 |
|
| Cash flows from investing activities of continuing operations | | | | | | | | |
|
|
| Purchases of investments | $ | (7,955 | ) | | $ | — |
| | $ | (33,075 | ) | | $ | — |
| | $ | (41,030 | ) |
| Proceeds from sales of investments | — |
| | — |
| | 20,688 |
| | — |
| | 20,688 |
|
| Proceeds from maturities of investments | — |
| | — |
| | 21,509 |
| | — |
| | 21,509 |
|
| Change in loans | — |
| | — |
| | (8,717 | ) | | — |
| | (8,717 | ) |
| Proceeds from sales and securitizations of loans | — |
| | — |
| | 1,654 |
| | — |
| | 1,654 |
|
| Proceeds from significant disposals | — |
| | — |
| | — |
| | — |
| | — |
|
| Change in federal funds sold and resales | — |
| | (22,167 | ) | | (3,242 | ) | | — |
| | (25,409 | ) |
| Changes in investments and advances—intercompany | (1,463 | ) | | (3,603 | ) | | 5,066 |
| | — |
| | — |
|
| Other investing activities | (729 | ) | | (9 | ) | | (81 | ) | | — |
| | (819 | ) |
| Net cash provided by (used in) investing activities of continuing operations | $ | (10,147 | ) | | $ | (25,779 | ) | | $ | 3,802 |
| | $ | — |
| | $ | (32,124 | ) |
| Cash flows from financing activities of continuing operations | | | | | | | | | |
| Dividends paid | $ | (1,095 | ) | | $ | — |
| | $ | — |
| | $ | — |
| | $ | (1,095 | ) |
| Redemption of preferred stock | (97 | ) | | — |
| | — |
| | — |
| | (97 | ) |
| Treasury stock acquired | (2,378 | ) | | — |
| | — |
| | — |
| | (2,378 | ) |
| Proceeds from issuance of long-term debt, net | 699 |
| | 2,004 |
| | 184 |
| | — |
| | 2,887 |
|
| Proceeds (repayments) from issuance of long-term debt—intercompany, net | — |
| | (412 | ) | | 412 |
| | — |
| | — |
|
| Change in deposits | — |
| | — |
| | 41,397 |
| | — |
| | 41,397 |
|
| Change in federal funds purchased and repos | — |
| | 11,359 |
| | 4,123 |
| | — |
| | 15,482 |
|
| Change in short-term borrowings | — |
| | (409 | ) | | (7,949 | ) | | — |
| | (8,358 | ) |
| Net change in short-term borrowings and other advances—intercompany | 14 |
| | 8,226 |
| | (8,240 | ) | | — |
| | — |
|
| Capital contributions from parent | — |
| | (585 | ) | | 585 |
| | — |
| | — |
|
| Other financing activities | (261 | ) | | — |
| | (214 | ) | | — |
| | (475 | ) |
| Net cash provided by (used in) financing activities of continuing operations | $ | (3,118 | ) | | $ | 20,183 |
| | $ | 30,298 |
| | $ | — |
| | $ | 47,363 |
|
| Effect of exchange rate changes on cash and due from banks | $ | — |
| | $ | — |
| | $ | (7 | ) | | $ | — |
| | $ | (7 | ) |
Change in cash and due from banks and deposits with banks
| $ | (7,997 | ) | | $ | 1,450 |
| | $ | 28,735 |
| | $ | — |
| | $ | 22,188 |
|
| Cash and due from banks and deposits with banks at beginning of period | 11,013 |
| | 12,695 |
| | 156,808 |
| | — |
| | 180,516 |
|
| Cash and due from banks and deposits with banks at end of period | $ | 3,016 |
| | $ | 14,145 |
| | $ | 185,543 |
| | $ | — |
| | $ | 202,704 |
|
| Cash and due from banks | $ | 16 |
| | $ | 5,648 |
| | $ | 16,186 |
| | $ | — |
| | $ | 21,850 |
|
| Deposits with banks | 3,000 |
| | 8,497 |
| | 169,357 |
| | — |
| | 180,854 |
|
| Cash and due from banks and deposits with banks at end of period | $ | 3,016 |
| | $ | 14,145 |
| | $ | 185,543 |
| | $ | — |
| | $ | 202,704 |
|
| Supplemental disclosure of cash flow information for continuing operations | | | | | | | | | |
| Cash paid (received) during the year for income taxes | $ | (266 | ) | | $ | 29 |
| | $ | 975 |
| | $ | — |
| | $ | 738 |
|
| Cash paid during the year for interest | 883 |
| | 1,627 |
| | 2,076 |
| | — |
| | 4,586 |
|
| Non-cash investing activities | | | | | | | | | |
| Transfers to loans HFS from loans | $ | — |
| | $ | — |
| | $ | 900 |
| | $ | — |
| | $ | 900 |
|
| Transfers to OREO and other repossessed assets | — |
| | — |
| | 26 |
| | — |
| | 26 |
|
|
| | | | | | | | | | | | | | | | | | | |
| | Nine Months Ended September 30, 2017 |
| In millions of dollars | Citigroup parent company | | CGMHI | | Other Citigroup subsidiaries and eliminations | | Consolidating adjustments | | Citigroup consolidated |
| Net cash provided by (used in) operating activities of continuing operations | $ | 5,712 |
| | $ | (15,236 | ) | | $ | 6,063 |
| | $ | — |
| | $ | (3,461 | ) |
| Cash flows from investing activities of continuing operations | | | | | | | | |
|
|
| Purchases of investments | $ | — |
| | $ | — |
| | $ | (151,362 | ) | | $ | — |
| | $ | (151,362 | ) |
| Proceeds from sales of investments | 132 |
| | — |
| | 89,592 |
| | — |
| | 89,724 |
|
| Proceeds from maturities of investments | — |
| | — |
| | 67,166 |
| | — |
| | 67,166 |
|
| Change in loans | — |
| | — |
| | (41,569 | ) | | — |
| | (41,569 | ) |
| Proceeds from sales and securitizations of loans | — |
| | — |
| | 7,019 |
| | — |
| | 7,019 |
|
| Proceeds from significant disposals | — |
| | — |
| | 3,411 |
| | — |
| | 3,411 |
|
| Change in federal funds sold and resales | — |
| | (8,840 | ) | | (6,955 | ) | | — |
| | (15,795 | ) |
| Changes in investments and advances—intercompany | 13,269 |
| | (5,439 | ) | | (7,830 | ) | | — |
| | — |
|
| Other investing activities | — |
| | — |
| | (2,054 | ) | | — |
| | (2,054 | ) |
| Net cash provided by (used in) investing activities of continuing operations | $ | 13,401 |
| | $ | (14,279 | ) | | $ | (42,582 | ) | | $ | — |
| | $ | (43,460 | ) |
| Cash flows from financing activities of continuing operations | | | | | | | | | |
| Dividends paid | $ | (2,639 | ) | | $ | — |
| | $ | — |
| | $ | — |
| | $ | (2,639 | ) |
| Treasury stock acquired | (9,071 | ) | | — |
| | — |
| | — |
| | (9,071 | ) |
| Proceeds from issuance of long-term debt, net | 6,665 |
| | 4,385 |
| | 11,458 |
| | — |
| | 22,508 |
|
| Proceeds (repayments) from issuance of long-term debt—intercompany, net | — |
| | (1,300 | ) | | 1,300 |
| | — |
| | — |
|
| Change in deposits | — |
| | — |
| | 34,632 |
| | — |
| | 34,632 |
|
| Change in federal funds purchased and repos | — |
| | 6,910 |
| | 12,551 |
| | — |
| | 19,461 |
|
| Change in short-term borrowings | 44 |
| | 1,865 |
| | 5,539 |
| | — |
| | 7,448 |
|
| Net change in short-term borrowings and other advances—intercompany | (23,342 | ) | | 6,573 |
| | 16,769 |
| | — |
| | — |
|
| Capital contributions from parent | — |
| | (60 | ) | | 60 |
| | — |
| | — |
|
| Other financing activities | (402 | ) | | — |
| | — |
| | — |
| | (402 | ) |
| Net cash provided by (used in) financing activities of continuing operations | $ | (28,745 | ) | | $ | 18,373 |
| | $ | 82,309 |
| | $ | — |
| | $ | 71,937 |
|
| Effect of exchange rate changes on cash and due from banks | $ | — |
| | $ | — |
| | $ | 599 |
| | $ | — |
| | $ | 599 |
|
Change in cash and due from banks and deposits with banks
| $ | (9,632 | ) | | $ | (11,142 | ) | | $ | 46,389 |
| | $ | — |
| | $ | 25,615 |
|
| Cash and due from banks and deposits with banks at beginning of period | 20,811 |
| | 25,118 |
| | 114,565 |
| | — |
| | 160,494 |
|
| Cash and due from banks and deposits with banks at end of period | $ | 11,179 |
| | $ | 13,976 |
| | $ | 160,954 |
| | $ | — |
| | $ | 186,109 |
|
| Cash and due from banks | $ | 179 |
| | $ | 4,519 |
| | $ | 17,906 |
| | $ | — |
| | $ | 22,604 |
|
| Deposits with banks | 11,000 |
| | 9,457 |
| | 143,048 |
| | — |
| | 163,505 |
|
| Cash and due from banks and deposits with banks at end of period | $ | 11,179 |
| | $ | 13,976 |
| | $ | 160,954 |
| | $ | — |
| | $ | 186,109 |
|
| Supplemental disclosure of cash flow information for continuing operations | | | | | | | | | |
| Cash paid (received) during the year for income taxes | $ | (772 | ) | | $ | 470 |
| | $ | 3,016 |
| | $ | — |
| | $ | 2,714 |
|
| Cash paid during the year for interest | 3,319 |
| | 3,175 |
| | 5,110 |
| | — |
| | 11,604 |
|
| Non-cash investing activities | | | | | | | | | |
| Transfers to loans HFS from loans | $ | — |
| | $ | — |
| | $ | 3,800 |
| | $ | — |
| | $ | 3,800 |
|
| Transfers to OREO and other repossessed assets | — |
| | — |
| | 85 |
| | — |
| | 85 |
|
UNREGISTERED SALES OF EQUITY SECURITIES, PURCHASES OF EQUITY SECURITIES AND DIVIDENDS
Unregistered Sales of Equity Securities
None.
Equity Security Repurchases
The following table summarizes Citi’s equity security repurchases, which consisted entirely of common stock repurchases:
| | | In millions, except per share amounts | Total shares purchased | Average price paid per share | Approximate dollar value of shares that may yet be purchased under the plan or programs | Total shares purchased | Average price paid per share | Approximate dollar value of shares that may yet be purchased under the plan or programs |
| July 2018 | | | |
| January 2019 | | | |
Open market repurchases(1) | 21.0 |
| $ | 69.06 |
| $ | 16,146 |
| 24.1 |
| $ | 59.35 |
| $ | 6,201 |
|
Employee transactions(2) | — |
| — |
| N/A |
| — |
| — |
| N/A |
|
| August 2018 | | | |
| February 2019 | | | |
Open market repurchases(1) | 30.0 |
| 71.05 |
| 14,018 |
| 21.1 |
| 63.60 |
| 4,857 |
|
Employee transactions(2) | — |
| — |
| N/A |
| — |
| — |
| N/A |
|
| September 2018 | | | |
| March 2019 | | | |
Open market repurchases(1) | 23.6 |
| 71.62 |
| 12,330 |
| 20.4 |
| 62.98 |
| 3,575 |
|
Employee transactions(2) | — |
| — |
| N/A |
| — |
| — |
| N/A |
|
| Total for 3Q18 and remaining program balance as of September 30, 2018 | 74.6 |
| $ | 70.67 |
| $ | 12,330 |
| |
| Total for 1Q19 and remaining program balance as of March 31, 2019 | | 65.6 |
| $ | 61.85 |
| $ | 3,575 |
|
| |
| (1) | Represents repurchases under the $17.6 billion 2018 common stock repurchase program (2018 Repurchase Program) that was approved by Citigroup’s Board of Directors and announced on June 28, 2018. The 2018 Repurchase Program was part of the planned capital actions included by Citi in its 2018 Comprehensive Capital Analysis and Review (CCAR). The 2018 Repurchase Program expires on June 30, 2019. Shares repurchased under the 2018 Repurchase Program were added to treasury stock. |
| |
| (2) | Consisted of shares added to treasury stock related to (i) certain activity on employee stock option program exercises where the employee delivers existing shares to cover the option exercise, or (ii) under Citi’s employee restricted share awards where shares are withheld to satisfy tax requirements. |
N/A Not applicable
Dividends
In addition to Board of Directors’ approval, Citi’s ability to pay common stock dividends substantially depends on regulatory approval, including an annual regulatory review of the results of the CCAR process required by the Federal Reserve Board and the supervisory stress tests required under the Dodd-Frank Act. For additional information regarding Citi’s capital planning and stress testing, see “Capital Resources—Current RegulatoryStress Testing Component of Capital Standards”Planning” and “Regulatory“Capital Resources—Regulatory Capital Standards Developments” above and “Risk Factors—Strategic Risks” and “Stress Testing Component on Capital Planning” in Citi’s 20172018 Annual Report on Form 10-K.
For information on the ability of Citigroup’s subsidiary depository institutions to pay dividends, see Note 18 to the
Consolidated Financial Statements in Citi’s 20172018 Annual Report on Form 10-K.
SIGNATURES
Pursuant to the requirements of the Securities Exchange Act of 1934, the Registrant has duly caused this report to be signed on its behalf by the undersigned, thereunto duly authorized, on the 30th day of October, 2018.April, 2019.
CITIGROUP INC.
(Registrant)
By /s/ John C. GerspachMark A. L. Mason
John C. GerspachMark A. L. Mason
Chief Financial Officer
(Principal Financial Officer)
By /s/ Raja J. Akram
Raja J. Akram
Controller and Chief Accounting Officer
(Principal Accounting Officer)
EXHIBIT INDEX
|
| | |
| Exhibit | | |
| Number | | Description of Exhibit |
| |
|
| | | |
| |
|
| | |
| | |
| | |
| | |
| | | |
| | |
| | | |
| | |
| | | |
| | Financial statements from the Quarterly Report on Form 10-Q of the Company for the quarter ended September 30, 2018,March 31, 2019, filed on OctoberApril 30, 2018,2019, formatted in XBRL: (i) the Consolidated Statement of Income, (ii) the Consolidated Balance Sheet, (iii) the Consolidated Statement of Changes in Equity, (iv) the Consolidated Statement of Cash Flows and (v) the Notes to Consolidated Financial Statements. |
The total amount of securities authorized pursuant to any instrument defining rights of holders of long-term debt of the Company does not exceed 10% of the total assets of the Company and its consolidated subsidiaries. The Company will furnish copies of any such instrument to the SEC upon request.
* Denotes a management contract or compensatory plan or arrangement.
+ Filed herewith.