0000831001us-gaap:ResidentialMortgageMemberus-gaap:ConsumerPortfolioSegmentMember2023-06-300000831001us-gaap:NotDesignatedAsHedgingInstrumentTradingMemberc:EquityFutureandForwardMember2022-12-310000831001us-gaap:MeasurementInputCreditSpreadMemberc:ValuationTechniqueModelbasedMemberus-gaap:FairValueInputsLevel3Memberus-gaap:CreditRiskContractMembersrt:MinimumMember2023-06-300000831001c:PersonalSmallBusinessAndOtherMemberus-gaap:ContractualInterestRateReductionMembersrt:NorthAmericaMemberus-gaap:ConsumerPortfolioSegmentMember2024-01-012024-03-310000831001us-gaap:OtherDebtSecuritiesMemberc:InvestmentsExcludingTradingSecuritiesMember2023-12-31
UNITED STATES
SECURITIES AND EXCHANGE COMMISSION
WASHINGTON, D.C. 20549
FORM 10-Q
(Mark One)
| | | | | |
| ☒ | QUARTERLY REPORT PURSUANT TO SECTION 13 OR 15(d) OF THE SECURITIES EXCHANGE ACT OF 1934 |
For the quarterly period ended June 30, 2023March 31, 2024
OR
| | | | | |
| ☐ | TRANSITION REPORT PURSUANT TO SECTION 13 OR 15(d) OF THE SECURITIES EXCHANGE ACT OF 1934 |
For the transition period from to
Commission file number 1-9924
Citigroup Inc.
(Exact name of registrant as specified in its charter)
| | | | | | | | | | | | | | |
| Delaware | | 52-1568099 |
| (State or other jurisdiction of incorporation or organization) | | (I.R.S. Employer Identification No.) |
| 388 Greenwich Street, | New York | NY | | 10013 |
| (Address of principal executive offices) | | (Zip code) |
(212) 559-1000
(Registrant's telephone number, including area code)
Securities registered pursuant to Section 12(b) of the Securities Exchange Act of 1934 formatted in Inline XBRL: See Exhibit 99.01
Indicate by check mark whether the registrant (1) has filed all reports required to be filed by Section 13 or 15(d) of the Securities Exchange Act of 1934 during the preceding 12 months (or for such shorter period that the registrant was required to file such reports), and (2) has been subject to such filing requirements for the past 90 days. Yes ☒ No ☐
Indicate by check mark whether the registrant has submitted electronically every Interactive Data File required to be submitted pursuant to Rule 405 of Regulation S-T (§232.405 of this chapter) during the preceding 12 months (or for such shorter period that the registrant was required to submit such files). Yes ☒ No ☐
Indicate by check mark whether the registrant is a large accelerated filer, an accelerated filer, a non-accelerated filer, a smaller reporting company, or an emerging growth company. See the definitions of “large accelerated filer,” “accelerated filer,” “smaller reporting company,” and “emerging growth company” in Rule 12b-2 of the Exchange Act.
| | | | | | | | | | | | | | | | | | | | | | | |
| Large accelerated filer | ☒ | Accelerated filer | ☐ | Non-accelerated filer | ☐ | Smaller reporting company | ☐ |
| | | | | | Emerging growth company | ☐ |
If an emerging growth company, indicate by check mark if the registrant has elected not to use the extended transition period for complying with any new or revised financial accounting standards provided pursuant to Section 13(a) of the Exchange Act. ☐
Indicate by check mark whether the registrant is a shell company (as defined in Rule 12b-2 of the Exchange Act). Yes ☐ No ☒
Number of shares of Citigroup Inc. common stock outstanding on June 30, 2023: 1,925,702,484March 31, 2024: 1,907,439,613
Available on the web at www.citigroup.com
This page intentionally left blank.
CITIGROUP’S SECONDFIRST QUARTER 2023—2024—FORM 10-Q
| | | | | | | | |
| OVERVIEW | |
| Citigroup Reportable Operating Segments | |
| MANAGEMENT’S DISCUSSION AND
ANALYSIS OF FINANCIAL CONDITION AND
RESULTS OF OPERATIONS | |
| Executive Summary | |
| Summary of Selected Financial Data | |
| Segment Revenues and Income (Loss) | |
| SegmentSelect Balance Sheet Items by Segment | |
| Institutional Clients GroupServices | |
| Personal Markets | |
| Banking and Wealth Management | |
| Legacy FranchisesU.S. Personal Banking | |
| Corporate/OtherWealth | |
| CAPITAL RESOURCESAll Other—Divestiture-Related Impacts
(Reconciling Items) | |
| All Other—Managed Basis | |
| CAPITAL RESOURCES | |
| MANAGING GLOBAL RISK TABLE OF
| |
| MANAGING GLOBAL RISK | |
| SIGNIFICANT ACCOUNTING POLICIES AND
SIGNIFICANT ESTIMATES | |
| DISCLOSURE CONTROLS AND
| |
| DISCLOSURE PURSUANT TO SECTION 219 OF
THE IRAN THREAT REDUCTION AND SYRIA
HUMAN RIGHTS ACT | |
| FORWARD-LOOKING STATEMENTS | |
| FINANCIAL STATEMENTS AND NOTES
TABLE OF CONTENTS | |
| CONSOLIDATED FINANCIAL STATEMENTS | |
| NOTES TO CONSOLIDATED FINANCIAL
STATEMENTS (UNAUDITED) | |
| UNREGISTERED SALES OF EQUITY SECURITIES,
REPURCHASES OF EQUITY SECURITIES AND
DIVIDENDS | |
| OTHER INFORMATION | |
| GLOSSARY OF TERMS AND ACRONYMS | |
OVERVIEW
This Quarterly Report on Form 10-Q should be read in conjunction with Citigroup’s Annual Report on Form 10-K for the year ended December 31, 20222023 (referred to herein as the 2022Citi’s 2023 Form 10-K) and Citigroup’s Quarterly Report on Form 10-Q for the quarter ended March 31, 2023 (First Quarter of 2023 Form 10-Q).
Throughout this report, “Citigroup,” “Citi” and “the Company” refer to Citigroup Inc. and its consolidated subsidiaries. All “Note” references correspond to the Notes to the Consolidated Financial Statements herein, unless otherwise indicated.
For a list of certain terms and acronyms used in this Quarterly Report on Form 10-Q and other Citigroup presentations, see “Glossary of Terms and Acronyms” at the end of this report.
Additional information about Citigroup is available on Citi’s website at www.citigroup.com. Citigroup’s recent annual reports on Form 10-K, quarterly reports on Form 10-Q, current reports on Form 8-K and proxy statements, as well as other filings with the U.S. Securities and Exchange Commission (SEC) are available free of charge through Citi’s website by clicking on “SEC Filings” under the “Investors” tab. The SEC’s website also contains these filings and other information regarding Citi at www.sec.gov.
Please see “Risk Factors” in Citi’s 20222023 Form 10-K for a discussion of material risks and uncertainties that could impact Citigroup’s businesses, results of operations and financial condition.
Non-GAAP Financial Measures
Citi prepares its financial statements in accordance with U.S. generally accepted accounting principles (GAAP) and also presents certain non-GAAP financial measures (non-GAAP measures) that exclude certain items or otherwise include components that differ from the most directly comparable measures calculated in accordance with U.S. GAAP. Non-GAAPCiti believes the presentation of these non-GAAP measures are provided as additional useful information to assess Citi’s financial condition and results of operations, including providing an additionalprovides a meaningful depiction of the underlying fundamentals of period-to-period operating results.results for investors, industry analysts and others, including increased transparency and clarity into Citi’s results, and improved visibility into management decisions and their impacts on operational performance; enables better comparison to peer companies; and allows Citi to provide a long-term strategic view of its businesses and results going forward. These non-GAAP measures are not intended as a substitute for GAAP financial measures and may not be defined or calculated the same way as non-GAAP measures with similar names used by other companies.
Citi’s non-GAAP financial measures in this Form 10-Q include:
•ResultsRevenues excluding divestiture-related impacts
• Expenses excluding the Federal Deposit Insurance Corporation (FDIC) special assessment and divestiture-related impacts
•All Other (managed basis), which excludes divestiture-related impacts
•Tangible common equity (TCE), return on tangible common equity (RoTCE) and tangible book value per share (TBVPS)
•Banking and Corporate lendingLending revenues excluding gains (losses)gain (loss) on loan hedges
•Non-ICGMarkets Markets net interest income
For more information on the FDIC special assessment, see “Executive Summary” below.
Citi’s results excluding divestiture-related impacts represent as reported, or GAAP, financial results adjusted for items that are incurred and recognized, which are wholly and necessarily a consequence of actions taken to sell (including through a public offering), dispose of or wind down business activities associated with Citi’s previously announced 14 exit markets.markets within All Other—Legacy Franchises. Citi’s Chief Executive Officer, its chief operating decision maker, regularly reviews financial information for All Other on a managed basis that excludes these divestiture-related impacts. For additionalmore information on Citi’s results excluding divestiture-related impacts, see “Executive Summary” and “Legacy FranchisesAll Other—Divestiture-Related Impacts (Reconciling Items)” below.
For more information on TCE, RoTCE and TBVPS, see “Capital Resources—Tangible Common Equity, Book Value Per Share, Tangible Book Value Per Share and Return on Equity” below.
For more information on Banking and Corporate lendingLending revenues excluding gains (losses) on loan hedges, see “Executive Summary” and “Institutional Clients GroupBanking” below.
For more information on non-ICGMarkets Markets net interest income, see “Market Risk—Non-ICGMarkets Markets Net Interest Income” below.
Citigroup is managed pursuant to threefive operating segments: Institutional Clients GroupServices,Markets, Banking, U.S. Personal Banking Personal Banking and Wealth Management andWealth. Legacy Franchises. Activities not assigned to the operating segments are included in Corporate/Other.All Other. For additional information, see the results of operations for each of the operating segments within “Management’s Discussion and Analysis of Financial Condition and Results of Operations” below.
| | | | | | | | | | | | | | | | | | | | | | | | | | | | | |
Citigroup Operating Segments |
| | | | | | | | | |
| | | | | | | | | |
Institutional
Clients Group
(ICG) | | | Personal Banking
and Wealth Management
(PBWM) | | | Legacy
Franchises |
| | | |
•Services
–Treasury and trade solutions (TTS)
–Securities services
•Markets
–Equity markets
–Fixed income markets
•Banking
–Investment banking
–Corporate lending
| | | •U.S. Personal Banking
–Cards
◦Branded cards
◦Retail services
–Retail banking
•Global Wealth Management
(Global Wealth)
–Private bank
–Wealth at Work
–Citigold
| | | •Asia Consumer Banking
(Asia Consumer)
–Retail banking and Branded cards for the remaining 6 exit markets (China, Indonesia, Korea, Poland, Russia and Taiwan)
•Mexico Consumer Banking (Mexico Consumer) and Mexico Small Business and Middle-Market Banking (Mexico SBMM)
–Retail banking and Branded cards
–Traditional middle-market banking products and services
•Legacy Holdings Assets
–Certain North America consumer mortgage loans
–Other legacy assets
|
| | | | | | | | | |
| | | | Corporate/Other | | | | |
| •Corporate Treasury managed activities
•Operations and technology
•Global staff functions and other corporate expenses
•Discontinued operations
| |
For additional information on ICG, PBWM and Legacy Franchises, including their businesses and products and services, see each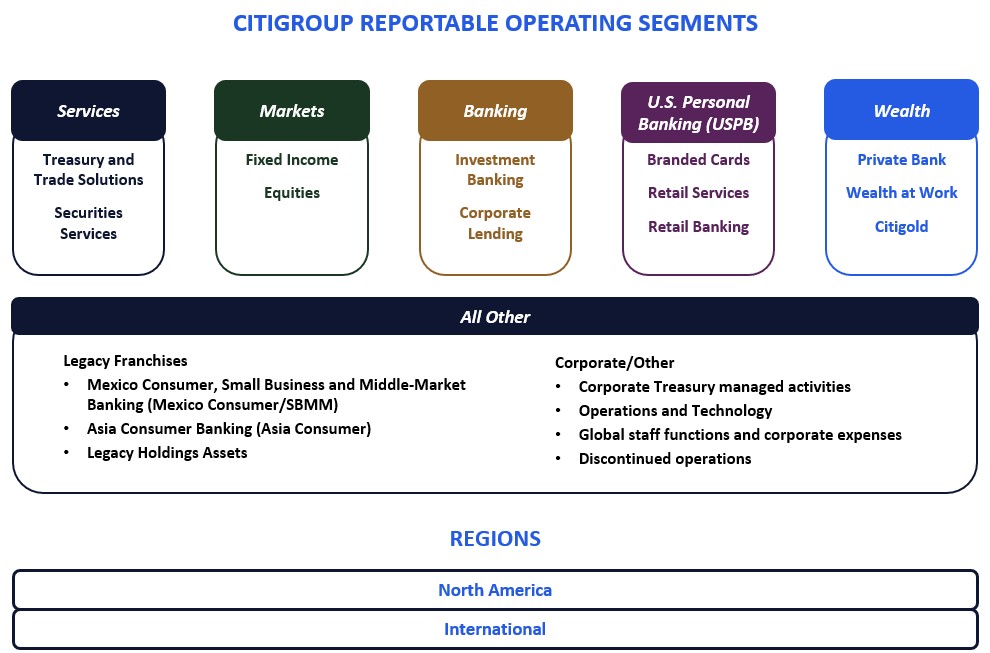
operating segment’s discussion and analysis of its results of operations below.
The following are the four regionsNote: Mexico is included in which Citigroup operates. The regional results are fully reflected in the operating segments and Corporate/Other above.
| | | | | | | | | | | | | | | | | | | | | | | | | | | | | | | | | | | |
Citigroup Regions(1)
|
| | | | | | | | | | | |
| | | | | | | | | | | |
North
America | | Europe,
Middle East
and Africa
(EMEA)
| | | Latin
America | | Asia |
(1) North America includes the U.S., Canada and Puerto Rico, Latin America includes Mexico and Asia includes Japan.International.
MANAGEMENT’S DISCUSSION AND ANALYSIS OF FINANCIAL CONDITION
AND RESULTS OF OPERATIONS
EXECUTIVE SUMMARY
SecondFirst Quarter of 2023—2024—Results Continued to Benefit from DiversifiedDemonstrated Improved Business ModelPerformance and Strong Balance SheetProgress Toward Citi’s
Priorities
As described further throughout this Executive Summary, during the secondfirst quarter of 2023:2024:
•Citi’s revenues decreased 1%2% versus the prior-year period both on a reported basis and excludingbasis. Excluding divestiture-related impacts (see “Legacy Franchises” below). The decreaseof approximately $1 billion, primarily consisting of a gain from the sale of the India consumer business in the prior-year period, revenues was primarilyincreased 3%, driven by lower non-interest revenues, mainlygrowth across Banking, U.S. Personal Banking (USPB) and Services, partially offset by higher net interest income.declines in Markets and Wealth.
•Citi’s expenses increased 9%7% versus the prior-year period, both on a reported basisperiod. The increase included repositioning costs of $258 million, an incremental FDIC special assessment of $251 million and excludingnet restructuring charges of $225 million. Excluding divestiture-related impacts (see “Legacy Franchises” below)in both the current quarter and the prior-year period and the incremental FDIC special assessment, expenses increased 5%, largely driven by continued investments in riskinflation and controls, business-led and enterprise-led investments, volume growth and macroeconomic factors, including inflation, as well as severance costs. The expense increase wasvolume-related expenses, partially offset by productivity savings and an expense reduction from the exited markets and continued wind-downs (see “Expenses” below).
•Citi’s cost of credit was $1.8approximately $2.4 billion versus $1.3$2.0 billion in the prior-year period. The increase was primarily driven by higher net credit losses, reflecting the continued normalization incards net credit losses in Branded cardsCards and Retail services.Services in USPB, largely reflecting the continued maturation of cards loan vintages originated during the pandemic, as well as the impact of the higher inflationary and interest rate environment, partially offset by a lower build in the allowance for credit losses (ACL) in the current quarter (see “Cost of Credit” below).
•Citi returned $2.0$1.5 billion to common shareholders in the form of dividends ($1.0 billion) and share repurchases. As previously disclosed, in July 2023 Citi’s Board of Directors declared a quarterly common stock dividend of $0.53 per share for the third quarter of 2023, up from $0.51 in the previous quarter. Citi intends to maintain a quarterly common dividend of at least $0.53 per share, subject to financial and macroeconomic conditions, as well as Board of Directors approval.repurchases ($0.5 billion).
•Citi’s Common Equity Tier 1 (CET1) Capital ratio under the Basel III Standardized Approach increasedwas 13.5% as of March 31, 2024 (compared to 13.4% as of June 30, 2023, compared to 12.0% as of June 30, 2022March 31, 2023) (see “Capital Resources” below). This compares to Citi’s required regulatory CET1 Capital ratio of 12.3% as of March 31, 2024 and 12.0% as of January 1,March 31, 2023 under the Basel III Standardized Approach. As previously disclosed, on October 1, 2023, Citi’s required regulatory CET1 Capital ratio will increase to 12.3% from 12.0% under the Standardized Approach reflecting the increase in the Stress Capital Buffer (SCB) requirement to 4.3% from 4.0% (see “Capital Resources—Stress Capital Buffer” below).
•In May 2023, Citi announced that it intends to pursue an initial public offering (IPO) of its consumer, small business and middle-market banking operations in Mexico, following the planned separation from Citi’s Institutional Clients Group (ICG) and Private bank businesses in Mexico, both of which will remain part of Citi.
•Citi continued to make progress on its other consumer banking business divestitures in the second quarter of 2023, including working toward the closing of its Taiwan and Indonesia sale transactions in the second half of 2023, as well as progressing with the continued wind-downs of the Korea and China consumer banking businesses and the Russia consumer, local commercial and institutional businesses. In addition, Citi intends to restartbusinesses, as well as the exit process for theseparation involving Citi’s consumer banking and small business and middle-market banking operations in Poland laterMexico in 2023, subject to market conditions.preparation for a planned initial public offering in 2025.
Second
First Quarter of 20232024 Results Summary
Citigroup
Citigroup reported net income of $2.9$3.4 billion, or $1.33$1.58 per share, compared to net income of $4.5$4.6 billion, or $2.19 per share in the prior-year period. The decrease in netNet income was primarilydecreased 27% versus the prior-year period, driven by the higher expenses, and the higher cost of credit as well asand the lower revenues. Citigroup’s effective tax rate was approximately 27%25% in both the current and prior-year periods. Average diluted shares outstanding decreased 1%.
Citigroup revenues of $21.1 billion in the currentfirst quarter of 2024 decreased 2% versus 20%the prior-year period on a reported basis. Excluding the divestiture-related impacts in both quarters, primarily consisting of the gain from the sale of the India consumer business in the prior-year period, largelyrevenues of $21.1 billion increased 3%, driven by the geographic mix of earnings (see “Income Taxes” below)growth across Banking, USPB and Services, partially offset by declines in Markets and Wealth. Earnings per share (EPS) decreased 39% from(For additional information on the prior-year period, reflecting the lower net income and an approximate 1% increase in average diluted shares outstanding.
Results for the second quarter of 2023 included divestiture-related impacts, of $(73) million in earnings before taxes ($(92) million after-tax). Seesee “Legacy Franchises” and “Corporate/All Other—Divestiture-Related Impacts (Reconciling Items)” below for details about the divestiture-related impacts.
These divestiture-related impacts, collectively, had a $(0.04) negative impact on EPS in the current quarter. Excluding these divestiture-related impacts, EPS was $1.37.below.) (As used throughout this Form 10-Q, Citi’s results of operations and financial condition excluding the impact of divestiture-related impacts are non-GAAP financial measures.)
Results for the second quarter of 2022 included divestiture-related impacts of $48 million in earnings before taxes ($35 million after-tax). See “Legacy FranchisesBanking ” below for details about the divestiture-related impacts.
These divestiture-related impacts, collectively, had a $0.02 beneficial impact on EPS in the prior-year period. Excluding these divestiture-related impacts, EPS was $2.17.
Citigroup revenues of $19.4 billion in the second quarter of 2023 decreased 1% from the prior-year period, both on a reported basis and excluding divestiture-related impacts. The lower revenues reflected a declinerecovery of the global investment banking wallet, Services revenues were driven by higher revenues in revenues across Marketsboth Treasury and Investment banking inTrade Solutions (TTS) and Securities Services and ICGUSPB and Global Wealth Management (Global Wealth)revenues benefited from strong loan growth in Personal Banking and Wealth Management (PBWM), as well as a revenue reduction from the exited markets and continued wind-downs in Legacy Franchises. cards. The decline in Marketsrevenues was largelyprimarily due to lower Fixed Income markets revenues, while Wealth revenues offsetwere largely impacted by strength across Services in ICG, U.S. Personal Banking revenues in PBWM higher mortgage funding costs and higher revenues from the investment portfolio in Corporate/Other.lower deposit spreads.
Citigroup’s end-of-period loans were $661$675 billion, up 1%3% versus the prior-year period, driven bylargely reflecting the growth in PBWM, primarily driven by U.S. Personal Banking, largely offset by declinescards and mortgages in ICGUSPB and higher loans in Legacy FranchisesMarkets.
Citigroup’s end-of-period deposits were approximately $1.3 trillion, largely unchangeddown 2% versus the prior-year period, aslargely due to a decreasereduction in ICGServices, primarily driven by Securities services, was offset by an increase in institutional certificates of deposit in Corporate/Other. reflecting quantitative tightening. For additional information about Citi’s deposits by business, including drivers and deposit trends, see each respective business’s results of operations and “Liquidity Risk—Deposits” below.
Expenses
Citigroup’s operating expenses of $13.6$14.2 billion increased 9%7% from the prior-year period. As discussed above, results for the first quarter of 2024 included the following notable items recorded in operating expenses in Corporate/Other within All Other (managed basis):
•$251 million charge to operating expenses related to the FDIC’s notification to Citi that it had increased its estimated loss attributable to the protection of uninsured depositors at Silicon Valley Bank and Signature Bank (see Note 27)
•$225 million of net restructuring charges related to actions taken as part of Citi’s organizational simplification initiatives (see Note 9)
In the first quarter of 2024, expenses also included repositioning costs of $258 million and divestiture-related impacts of $110 million (compared to $73 million in the prior-year period). Excluding divestiture-related impacts in both periods and the incremental FDIC special assessment, expenses increased 5% versus the prior-year period, both on a reported basisdriven by inflation and excluding divestiture-related impacts. The highervolume-related expenses, largely reflected continued investments in risk and controls, business-led and enterprise-led investments, volume growth and macroeconomic factors, including inflation, as well as severance costs. The higher expenses were partially offset by productivity savingssavings. (As used throughout this Form 10-Q, Citi’s results of operations and expense reductions fromfinancial condition excluding divestiture-related impacts and the exited markets and wind-downs in Legacy Franchises.incremental FDIC special assessment are non-GAAP financial measures.)
As previously disclosed,announced, Citi expects a sequential increase in expenses forto incur additional repositioning costs during the third quarterremainder of 2023, primarily reflecting continued investments in Citi’s transformation and other risk and controls.2024.
Cost of Credit
Citi’s total provisions for credit losses and for benefits and claims was a cost of $1.8$2.4 billion, compared to $1.3$2.0 billion in the prior-year period. ThisThe increase was primarily driven by higher net credit losses (see below),in Branded Cards and Retail Services, largely reflecting continued maturation of cards loan vintages originated during the pandemic, with delayed losses due to unprecedented levels of government stimulus, as well as macroeconomic pressures related to the higher inflationary and interest rate environment impacting both cards portfolios, partially offset by a lower net build of $320 million in the ACLallowance for loans and unfunded commitments and other provisions. The net ACL build and other provisions in the current quarter were primarily driven by growth in card balances in Branded cards and Retail services. This compared to a net ACL build and other provisions of $424 million in the prior-year period.credit losses (ACL). For additional information on Citi’s ACL, see “Significant Accounting Policies and Significant Estimates—Citi’s Allowance for Credit Losses (ACL)” below.
Net credit losses of $1.5$2.3 billion increased 77% from the prior year.prior-year period. Consumer net credit losses of $1.4$2.1 billion increased 73%67%, largely reflecting ongoing normalization, particularlythe rise in Branded cards and Retail services.net credit loss rates. Corporate net credit losses increased to $75$164 million from $23$22 million.
As previously announced, Citi also expects to incur higher year-over-yearfull-year net credit lossesloss rates for the third quarter of 2023, primarily driven by continued normalization, particularlyboth Branded Cards and Retail Services to be higher in 2024. The higher net credit loss expectations are already reflected in the cards business in PBWM.ACL on loans for outstanding balances at March 31, 2024.
For additional information on Citi’s consumer and corporate credit costs, see each respective business’s results of operations and “Credit Risk” below.
Capital
Citigroup’s CET1 Capital ratio wasincreased modestly to 13.5% as of March 31, 2024, compared to 13.4% as of June 30,March 31, 2023, compared to 12.0% as of June 30, 2022, based on the Basel III Standardized Approach for determining risk-weighted assets (RWA). The increase was primarily driven by
net income, theinterest rate impacts on Citigroup’s investment portfolio, impacts from the closingsales of thecertain Asia consumer banking business sales(Asia Consumer) businesses and business actions, including a reductiondecrease in RWA, partially offset by the payment of common dividends and share repurchases.repurchases and higher disallowed deferred tax assets.
As previously announced, duringIn the secondfirst quarter of 2023,2024, Citi resumedrepurchased $0.5 billion of common share repurchases,shares and repurchasedpaid $1.0 billion of common sharesdividends (see “Unregistered Sales of Equity Securities, Repurchases of Equity Securities and Dividends” below). Citi will continue to assess common share repurchases on a quarter-by-quarterquarterly basis given uncertainty regarding regulatory capital requirements. For additional information on capital-related risks, trends and
uncertainties, see “Capital Resources—Regulatory Capital Standards and Developments” below.below and “Risk Factors—Strategic Risks,” “—Operational Risks” and “—Compliance Risks” in Citi’s 2023 Form 10-K.
Citigroup’s Supplementary Leverage ratio as of June 30, 2023March 31, 2024 was 6.0%5.8%, compared to 5.7%6.0% as of June 30, 2022.March 31, 2023. The increasedecrease was driven by highera decrease in Tier 1 Capital partially offset byand an increase in Total Leverage Exposure. For additional information on Citi’s capital ratios and related components, see “Capital Resources” below.
Institutional Clients GroupServices
ICG Servicesnet income of $2.2$1.5 billion increased 15% from the prior-year period, largely driven by higher revenues, partially offset by higher expenses and cost of credit. Services expenses of $2.7 billion increased 11%, largely driven by continued investments in technology, other risk and controls and product innovation. Cost of credit was $64 million, compared to a net benefit of $14 million in the prior-year period.
Services revenues of $4.8 billion increased 8%, largely driven by continued momentum across TTS and Securities Services. Net interest income increased 6%, driven by higher deposit and trade loan spreads, and non-interest revenue increased 14%, largely driven by continued strength across underlying fee drivers.
TTS revenues of $3.5 billion increased 5%, driven by a 4% increase in net interest income, primarily driven by higher spreads, and a 9% increase in non-interest revenue, reflecting continued growth in underlying drivers, including cross-border volumes, U.S. dollar clearing volumes and commercial card spend.
Securities Services revenues of $1.3 billion increased 18%, driven by a 16% increase in net interest income on higher deposit spreads, and a 21% increase in non-interest revenue, primarily driven by higher assets under custody and administration (AUC/AUA) balances from higher market valuations, as well as new client onboarding, and elevated corporate activity in Issuer Services.
For additional information on the results of operations of Services in the first quarter of 2024, see “Services” below.
Markets
Markets net income of $1.4 billion decreased 45%, primarily25% from the prior-year period, driven by lower revenues, higher expenses and higher cost of credit. ICGMarkets operating expenses of $7.3$3.4 billion increased 13%7%, largely driven by the absence of a legal reserve release in the prior-year period. Cost of credit increased to $200 million from $83 million in the prior-year period, reflecting a higher net ACL build, primarily driven by continued investmentschanges in Treasurymacroeconomic variable assumptions related to loans in spread products, and trade solutions (TTS)higher net credit losses.
Markets revenues of $5.4 billion decreased 7%, continued risk and controls investments and severance costsdriven by a 10% decrease in Markets and Investment banking,Fixed Income markets, partially offset by productivity savings.
ICG revenues of $10.4 billion decreased 9% (including gain (loss) on loan hedges), primarilya 5% increase in Equity markets. The decrease in Fixed Income markets was largely driven by a decline in Marketsrates and Banking,currencies, largely reflecting lower volatility, decreased institutional client activity and a strong prior-year comparison, partially offset by growthstrength in Services. Results included a loss on loan hedges of $66 million in the second quarter of 2023, compared with a gain on loan hedges of $494 million in the prior-year period.
Services revenues of $4.7 billion increased 15%. TTS revenues of $3.5 billion increased 15%, driven by 18% growth in net interestspread products and other fixed income, and 8% growth in non-interest revenue. Strong performance in TTS was primarily driven by higher interest rates and non-interest revenue benefits from continued growth of underlying drivers, primarily an 11% increase in cross-border transaction value and a 15% increase in commercial card spend volume. Securities services revenues of $1.1 billion increased 15%, as net interest income increased 62%, largely driven by higher interest rates across currencies.
Markets revenues of $4.6 billion decreased 13%, driven by lower revenues in both Fixed income markets and Equity markets relative to strong performance in the prior-year period, as well as low volatility in the second quarter of 2023. Fixed income markets revenues of $3.5 billion decreased 13%, driven by declines in currencies and commodities, partially offset by modest growth in rates. Equity markets revenues of $1.1 billion decreased 10%up 26%, primarily reflecting a declinean increase in equity derivatives revenues.
Banking revenues of $1.2 billion decreased 44%, including the gain (loss) on loan hedges in the current quarter and the prior-year period. Excluding the gain (loss) on loan hedges, Banking revenues of $1.2 billion decreased 22%, driven by lower revenues in Investment banking and Corporate lending. Investment banking revenues of $612 million decreased 24%, reflecting a decline in the overallclient
activity. The increase in Equity markets was driven by growth in cash trading and higher equity derivatives revenues.
For additional information on the results of operations of Markets in the first quarter of 2024, see “Markets” below.
Banking
Banking net income was $536 million, compared to $55 million in the prior-year period, driven by higher revenues and lower expenses, with cost of credit largely unchanged. Banking expenses of $1.2 billion decreased 4%, primarily driven by benefits from repositioning actions and other actions to lower the expense base, partially offset by business-led investments.
Banking revenues of $1.7 billion increased 49%, driven by growth in Investment Banking and Corporate Lending, as well as lower losses on loan hedges. Excluding the losses on loan hedges, Banking revenues of $1.8 billion increased 35%. Investment Banking revenues increased 35%, driven by the Debt Capital Markets (DCM) and Equity Capital Markets (ECM) businesses, as improved market wallet, as continued macroeconomic and geopolitical uncertainty continuedsentiment led to adverselyan increase in issuance activity. This increase in revenues was partially offset by lower Advisory revenues, reflecting the impact client activity.of lower merger activity announced in the second half of 2023. Corporate lendingLending revenues decreased 56%increased 68%, including the impact of the gain (loss)losses on loan hedges. Excluding the impact of the gain (loss)losses on loan hedges, Corporate lendingLending revenues decreased 20% versus the prior-year period, primarilyincreased 34%, largely driven by the impacts of foreign currency translation and lower lending volumes.higher revenue share. (As used throughout this Form 10-Q, Citi’s results of operations and financial condition excluding the impact of the gain (loss)losses on loan hedges are non-GAAP financial measures.)
For additional information on the results of operations of ICG Bankingfor in the secondfirst quarter of 2023,2024, see “Institutional Clients GroupBanking” below.
U.S. Personal Banking and Wealth Management
PBWM USPBnet income of $494$347 million decreased 11%,14% from the prior-year period, driven by higher cost of credit, and higher expenses, partially offset by higher revenues. PBWM USPBoperating expenses of $4.2$2.5 billion were largely unchanged, as lower compensation costs were offset by higher repositioning costs and volume-related expenses. Cost of credit increased to $2.2 billion, compared to $1.6 billion in the prior-year period. Net credit losses increased 74%, reflecting the continued maturation of cards loan vintages originated during the pandemic, with delayed losses due to unprecedented levels of government stimulus, as well as macroeconomic pressures related to the higher inflationary and interest rate environment impacting both cards portfolios.
USPB revenues of $5.2 billion increased 5%10%, primarily driven by continued risk and controls investments.
PBWM revenues of $6.4 billion increased 6%, ashigher net interest income growth, driven by strongdue to loan growth across U.S. Personal Banking, was partially offset by a decline in cards and higher non-interest revenue driven bydue to lower investment product revenues in Global Wealth.
U.S. Personal Bankingpartner payments. Branded Cards revenues of $4.6$2.6 billion increased 11%, primarily driven by higher revenues in cards, partially offset by lower Retail banking revenues. Branded cards revenues of $2.4 billion increased 8%7%, primarily driven by the higher net interest income, as average loans increased 14%.reflecting the strong loan growth. Retail servicesServices revenues of $1.6$1.9 billion increased 27%18%, primarily driven by the lower partner payments due to higher net credit losses, as well as higher net interest income as well as lower partner payments.on higher loan balances. Retail bankingBanking revenues of $594$638 million decreased 9%increased 1%, primarily reflectingdriven by higher deposit spreads, loan growth and improved mortgage margins, largely offset by the impact of the transfer of certain relationships and the associated deposit balances to Global Wealth.
Global Wealth revenues of $1.8 billion decreased 5%, largely driven by continued investment product revenue headwinds and higher interest rates paid on deposits, partially offset by the benefits from the continued transfer of Retail banking relationships.
For additional information on the results of operations of PBWMWealth for the second quarter of 2023, see “Personal Banking and Wealth Management” below.
Legacy Franchises
Legacy Franchises recorded a net loss of $125 million, compared to a net loss of $17 million in the prior-year period, primarily driven by higher cost of credit, partially offset by lower expenses. Legacy Franchises expenses of $1.8 billion decreased 2%, primarily driven by the impact of exited markets and continued wind-downs.
Legacy Franchises revenues of $1.9 billion decreased 1%, driven by the reductions from exited markets and continued wind-downs, partially offset by the benefit of higher rates and lending volumes in Mexico Consumer/SBMM, as well as higher revenues in Legacy Holdings Assets..
For additional information on the results of operations of Legacy FranchisesUSPB forin the secondfirst quarter of 2023,2024, see “Legacy FranchisesU.S. Personal Banking” below.
Corporate/OtherWealth
Corporate/OtherWealth net income was $356$150 million, compared to $50$159 million in the prior-year period, as lower revenues and higher expenses were largely offset by lower cost of credit. Wealth expenses increased 3% to $1.7 billion, driven by higher net interest income from Deposits with bankstechnology investments focused on risk and the investment portfolio, a reserve release related to the repayment of the previously disclosed First Republic Bank deposit and the prior-year release of a CTA loss (net of hedges) from AOCI (for additional information, see Note 2). The increase in net income wascontrols, as well as platform enhancements, partially offset by lower income taxinitial benefits from repositioning and higher expenses. Corporate/Other operating expensesrestructuring actions. Cost of $302credit was a benefit of $170 million, increased from $160compared to a benefit of $58 million in the prior-year period, primarily driven by the impact of inflation and severance costs and the absence of certain settlements that occurred in the prior-year period, partiallyas net credit losses were more than offset by lower consulting expenses.a higher net ACL release, reflecting a change in ACL associated with the margin lending portfolio.
Corporate/OtherWealth revenues of $677 million increased from $255 million in the prior-year period, primarily$1.7 billion decreased 4%, largely driven by highera 13% decrease in net interest income from Deposits with bankshigher mortgage funding costs and thelower deposit spreads, partially offset by an 11% increase in non-interest revenue, largely reflecting higher investment portfolio, largely due to higher interest rates.fee revenues.
For additional information on the results of operations of Corporate/OtherWealth forin the secondfirst quarter of 2023,2024, see “Corporate/OtherWealth” below.
All Other (Managed Basis)
All Other (managed basis) net lossof $457 million, compared to net income of $198 million in the prior-year period, was primarily driven by higher expenses, lower revenues and lower income tax benefits, partially offset by lower cost of credit. All Other (managed basis) expenses of $2.7 billion increased 18%, driven by the incremental FDIC special assessment and the restructuring charges, partially offset by lower expenses from the closed exits and wind-downs. Cost of credit of $185 million decreased 59%, largely driven by the absence of a net ACL build in the prior-year period, partially offset by higher net credit losses in Mexico Consumer.
All Other (managed basis) revenues decreased 9% from the prior-year period, primarily driven by higher funding costs in Corporate/Other.
Legacy Franchises (managed basis) revenues of $1.8 billion were largely unchanged from the prior-year period, as higher revenues in Mexico Consumer/SBMM (managed basis), mainly due to higher volumes and Mexican peso appreciation, were offset by lower revenues in Asia Consumer (managed basis), reflecting the impacts of the closed exits and wind-downs.
For additional information on the results of operations of All Other (managed basis) in the first quarter of 2024, see “All Other—Divestiture-Related Impacts (Reconciling Items)” and “All Other (Managed Basis)” below.
Macroeconomic and Other Risks and Uncertainties
Various geopolitical, macroeconomic and regulatory challenges and uncertainties continue to adversely impactaffect economic conditions in the U.S. and globally, including, central banks continuing to increaseamong others, continued elevated interest rates continued elevated levels ofand inflation, and economic and geopolitical challenges related to both China, and the Russia–Ukraine war.war and escalating conflicts in the Middle East. These and other factors have adversely affected financial markets, negatively impacted global economic growth rates and raised fearsconsumer sentiment and have
resulted in a continued risk of recession in the U.S., Europe and othervarious regions and countries.countries globally. In addition, these and other factors could adversely affect Citi’s customers, clients, businesses, funding costs, expensescost of credit and overall results of operations and financial condition during the remainder of 2023.
In May 2023, the Federal Deposit Insurance Corporation (FDIC) issued a proposal that would implement a special assessment to recover its uninsured deposit losses from recent bank failures. The FDIC estimated that the preliminary cost of the failures is approximately $15.8 billion, an estimate that would be periodically adjusted. If finalized as proposed, the FDIC is proposing to collect the special assessment at an annual rate of approximately 12.5 basis points of uninsured deposits, over eight quarterly assessment periods beginning in 2024. Citi is likely to incur a significant increase in its operating expenses if the final rule for the FDIC special assessment is enacted as proposed, which is expected before the end of 2023. For additional information on the expected impact, see Note 26.
In July 2023, the U.S. banking agencies issued a notice of proposed rulemaking, known as the Basel III Endgame, related to regulatory capital requirements. The rule as proposed would have a material impact on Citi’s current capital position; however, its finalization and implementation will be a
multiyear process, including phase-in periods to meet the new capital requirements. Citi plans to comment on the proposal and adapt business activities to address associated impacts, if necessary, and will be in compliance with the final rule, once it is in effect and implemented. For additional information, see “Capital Resources—Regulatory Capital Standards and Developments” below.
For a further discussion of trends, uncertainties and risks that will or could impact Citi’s businesses, results of operations, capital and other financial condition during the remainder of 2023,2024, see “Second“First Quarter of 20232024 Results Summary” above and each respective business’s results of operations, “Managing Global Risk,” including “Managing Global Risk—Other Risks—Country Risk—Russia” and “—Argentina,” and “Forward-Looking Statements” below and “Risk Factors” in Citi’s 20222023 Form 10-K.
This page intentionally left blank.
RESULTS OF OPERATIONS
SUMMARY OF SELECTED FINANCIAL DATA
Citigroup Inc. and Consolidated Subsidiaries
| | Second Quarter | | Six Months | |
| First Quarter | |
| First Quarter | |
| First Quarter | |
| In millions of dollars, except per share amounts | |
| In millions of dollars, except per share amounts | |
| In millions of dollars, except per share amounts | In millions of dollars, except per share amounts | 2023 | 2022 | % Change | 2023 | 2022 | % Change |
| Net interest income | Net interest income | $ | 13,900 | | $ | 11,964 | | 16 | % | $ | 27,248 | | $ | 22,835 | | 19 | % |
| Net interest income | |
| Net interest income | |
| Non-interest revenue | |
| Non-interest revenue | |
| Non-interest revenue | Non-interest revenue | 5,536 | | 7,674 | | (28) | | 13,635 | | 15,989 | | (15) | |
| Revenues, net of interest expense | Revenues, net of interest expense | $ | 19,436 | | $ | 19,638 | | (1) | % | $ | 40,883 | | $ | 38,824 | | 5 | % |
| Revenues, net of interest expense | |
| Revenues, net of interest expense | |
| Operating expenses | |
| Operating expenses | |
| Operating expenses | Operating expenses | 13,570 | | 12,393 | | 9 | | 26,859 | | 25,558 | | 5 | |
| Provisions for credit losses and for benefits and claims | Provisions for credit losses and for benefits and claims | 1,824 | | 1,274 | | 43 | | 3,799 | | 2,029 | | 87 | |
| Provisions for credit losses and for benefits and claims | |
| Provisions for credit losses and for benefits and claims | |
| Income from continuing operations before income taxes | |
| Income from continuing operations before income taxes | |
| Income from continuing operations before income taxes | Income from continuing operations before income taxes | $ | 4,042 | | $ | 5,971 | | (32) | % | $ | 10,225 | | $ | 11,237 | | (9) | % |
| Income taxes | Income taxes | 1,090 | | 1,182 | | (8) | | 2,621 | | 2,123 | | 23 | |
| Income taxes | |
| Income taxes | |
| Income from continuing operations | |
| Income from continuing operations | |
| Income from continuing operations | Income from continuing operations | $ | 2,952 | | $ | 4,789 | | (38) | % | $ | 7,604 | | $ | 9,114 | | (17) | % |
| Income (loss) from discontinued operations, net of taxes | Income (loss) from discontinued operations, net of taxes | (1) | | (221) | | 100 | | (2) | | (223) | | 99 | |
| Income (loss) from discontinued operations, net of taxes | |
| Income (loss) from discontinued operations, net of taxes | |
| Net income before attribution of noncontrolling interests | |
| Net income before attribution of noncontrolling interests | |
| Net income before attribution of noncontrolling interests | Net income before attribution of noncontrolling interests | $ | 2,951 | | $ | 4,568 | | (35) | % | $ | 7,602 | | $ | 8,891 | | (14) | % |
| Net income attributable to noncontrolling interests | Net income attributable to noncontrolling interests | 36 | | 21 | | 71 | | 81 | | 38 | | NM |
| Net income attributable to noncontrolling interests | |
| Net income attributable to noncontrolling interests | |
| Citigroup’s net income | |
| Citigroup’s net income | |
| Citigroup’s net income | Citigroup’s net income | $ | 2,915 | | $ | 4,547 | | (36) | % | $ | 7,521 | | $ | 8,853 | | (15) | % |
| Earnings per share | Earnings per share | | | | |
| Earnings per share | |
| Earnings per share | |
| Basic | |
| Basic | |
| Basic | Basic | | | | |
| Income from continuing operations | Income from continuing operations | $ | 1.34 | | $ | 2.32 | | (42) | % | $ | 3.55 | | $ | 4.34 | | (18) | % |
| Income from continuing operations | |
| Income from continuing operations | |
| Net income | |
| Net income | |
| Net income | Net income | 1.34 | | 2.20 | | (39) | | 3.54 | | 4.23 | | (16) | |
| Diluted | Diluted | | | |
| Diluted | |
| Diluted | |
| Income from continuing operations | |
| Income from continuing operations | |
| Income from continuing operations | Income from continuing operations | $ | 1.33 | | $ | 2.30 | | (42) | % | $ | 3.52 | | $ | 4.32 | | (19) | % |
| Net income | Net income | 1.33 | | 2.19 | | (39) | | 3.52 | | 4.20 | | (16) | |
| Net income | |
| Net income | |
| Dividends declared per common share | |
| Dividends declared per common share | |
| Dividends declared per common share | Dividends declared per common share | 0.51 | | 0.51 | | — | | 1.02 | | 1.02 | | — | |
| Common dividends | Common dividends | $ | 1,004 | | $ | 1,010 | | (1) | % | $ | 2,004 | | $ | 2,024 | | (1) | % |
Preferred dividends(1) | 288 | | 238 | | 21 | | 565 | | 517 | | 9 | |
| Common dividends | |
| Common dividends | |
| Preferred dividends | |
| Preferred dividends | |
| Preferred dividends | |
| Common share repurchases | Common share repurchases | 1,000 | | 250 | | NM | 1,000 | | 3,250 | | (69) | |
| Common share repurchases | |
| Common share repurchases | |
Table continues on the next page, including footnotes.
SUMMARY OF SELECTED FINANCIAL DATA
(Continued)
Citigroup Inc. and Consolidated Subsidiaries
| In millions of dollars, except per share amounts,
ratios and direct staff | In millions of dollars, except per share amounts,
ratios and direct staff | Second Quarter | | Six Months | |
| 2023 | 2022 | % Change | 2023 | 2022 | % Change |
| At June 30: | | | |
In millions of dollars, except per share amounts,
ratios and direct staff | |
| | 2024 | |
| 2024 | |
| At March 31: | |
| At March 31: | |
| At March 31: | |
| Total assets | |
| Total assets | |
| Total assets | Total assets | $ | 2,423,675 | | $ | 2,380,904 | | 2 | % | | |
| Total deposits | Total deposits | 1,319,867 | | 1,321,848 | | — | | | |
| Total deposits | |
| Total deposits | |
| Long-term debt | |
| Long-term debt | |
| Long-term debt | Long-term debt | 274,510 | | 257,425 | | 7 | | | |
| Citigroup common stockholders’ equity | Citigroup common stockholders’ equity | 188,474 | | 180,019 | | 5 | | | |
| Citigroup common stockholders’ equity | |
| Citigroup common stockholders’ equity | |
| Total Citigroup stockholders’ equity | |
| Total Citigroup stockholders’ equity | |
| Total Citigroup stockholders’ equity | Total Citigroup stockholders’ equity | 208,719 | | 199,014 | | 5 | | | |
| Average assets | Average assets | 2,465,614 | | 2,380,053 | | 4 | | $ | 2,463,929 | | $ | 2,377,047 | | 4 | % |
| Average assets | |
| Average assets | |
Direct staff (in thousands) | |
Direct staff (in thousands) | |
Direct staff (in thousands) | Direct staff (in thousands) | 240 | | 231 | | 4 | % | | |
| Performance metrics | Performance metrics | | | |
| Performance metrics | |
| Performance metrics | |
| Return on average assets | Return on average assets | 0.47 | % | 0.77 | % | | 0.62 | % | 0.75 | % | |
Return on average common stockholders’ equity(2) | 5.6 | | 9.7 | | | 7.5 | | 9.3 | | |
Return on average total stockholders’ equity(2) | 5.6 | | 9.2 | | | 7.4 | | 9.0 | | |
Return on tangible common equity (RoTCE)(3) | 6.4 | | 11.2 | | | 8.7 | | 10.8 | | |
| Return on average assets | |
| Return on average assets | |
Return on average common stockholders’ equity(1) | |
Return on average common stockholders’ equity(1) | |
Return on average common stockholders’ equity(1) | |
Return on average total stockholders’ equity(1) | |
Return on average total stockholders’ equity(1) | |
Return on average total stockholders’ equity(1) | |
Return on tangible common equity (RoTCE)(2) | |
Return on tangible common equity (RoTCE)(2) | |
Return on tangible common equity (RoTCE)(2) | |
| Efficiency ratio (total operating expenses/total revenues, net) | |
| Efficiency ratio (total operating expenses/total revenues, net) | |
| Efficiency ratio (total operating expenses/total revenues, net) | Efficiency ratio (total operating expenses/total revenues, net) | 69.8 | | 63.1 | | | 65.7 | | 65.8 | | |
| Basel III ratios | Basel III ratios | | | |
CET1 Capital(4)(5) | 13.37 | % | 11.95 | % | | | |
Tier 1 Capital(4)(5) | 15.24 | | 13.62 | | | | |
Total Capital(4)(5) | 16.04 | | 15.20 | | | | |
Supplementary Leverage ratio(5) | 5.97 | | 5.66 | | | | |
| Basel III ratios | |
| Basel III ratios | |
CET1 Capital(3) | |
CET1 Capital(3) | |
CET1 Capital(3) | |
Tier 1 Capital(3) | |
Tier 1 Capital(3) | |
Tier 1 Capital(3) | |
Total Capital(3) | |
Total Capital(3) | |
Total Capital(3) | |
| Supplementary Leverage ratio | |
| Supplementary Leverage ratio | |
| Supplementary Leverage ratio | |
| Citigroup common stockholders’ equity to assets | |
| Citigroup common stockholders’ equity to assets | |
| Citigroup common stockholders’ equity to assets | Citigroup common stockholders’ equity to assets | 7.78 | % | 7.56 | % | | | |
| Total Citigroup stockholders’ equity to assets | Total Citigroup stockholders’ equity to assets | 8.61 | | 8.36 | | | | |
Dividend payout ratio(6) | 38 | | 23 | | | 29 | % | 24 | % | |
Total payout ratio(7) | 76 | | 29 | | | 43 | | 63 | | |
| Total Citigroup stockholders’ equity to assets | |
| Total Citigroup stockholders’ equity to assets | |
Dividend payout ratio(4) | |
Dividend payout ratio(4) | |
Dividend payout ratio(4) | |
Total payout ratio(5) | |
Total payout ratio(5) | |
Total payout ratio(5) | |
| Book value per common share | Book value per common share | $ | 97.87 | | $ | 92.95 | | 5 | % | | |
Tangible book value per share (TBVPS)(3) | 85.34 | | 80.25 | | 6 | | | |
| Book value per common share | |
| Book value per common share | |
Tangible book value per share (TBVPS)(2) | |
Tangible book value per share (TBVPS)(2) | |
Tangible book value per share (TBVPS)(2) | |
(1) Certain series of preferred stock have semiannual payment dates. See Note 21 to the Consolidated Financial Statements in Citi’s 2022 Form 10-K.
(2) The return on average common stockholders’ equity is calculated using net income less preferred stock dividends divided by average common stockholders’ equity. The return on average total Citigroup stockholders’ equity is calculated using net income divided by average Citigroup stockholders’ equity.
(3)(2) RoTCE and TBVPS are non-GAAP financial measures. For information on RoTCE and TBVPS, see “Capital Resources—Tangible Common Equity, Book Value Per Share, Tangible Book Value Per Share and Return on Equity” below.
(4)(3) Citi’s binding CET1 Capital and Tier 1 Capital ratios were derived under the Basel III Standardized Approach, whereas Citi’s binding Total Capital ratio was derived under the Basel III Advanced Approaches framework for both periods presented.
(5) Certain of the above prior-period amounts have been revised to conform with enhancements made in the current period.
(6)(4) Dividends declared per common share as a percentage of net income per diluted share.
(7)(5) Total common dividends declared plus common share repurchases as a percentage of net income available to common shareholders (Net income less preferred dividends). See “Consolidated Statement of Changes in Stockholders’ Equity,” Note 910 and “Equity Security Repurchases” below for the component details.
NM Not meaningful
SEGMENT REVENUES AND INCOME (LOSS)
REVENUES
| | | | | | | | | | | | | | | | | | | | |
| Second Quarter | | Six Months | |
| In millions of dollars | 2023 | 2022 | % Change | 2023 | 2022 | % Change |
| Institutional Clients Group | $ | 10,441 | | $ | 11,419 | | (9) | % | $ | 21,674 | | $ | 22,579 | | (4) | % |
| Personal Banking and Wealth Management | 6,395 | | 6,029 | | 6 | | 12,843 | | 11,934 | | 8 | |
| Legacy Franchises | 1,923 | | 1,935 | | (1) | | 4,775 | | 3,866 | | 24 | |
| Corporate/Other | 677 | | 255 | | NM | 1,591 | | 445 | | NM |
| Total Citigroup net revenues | $ | 19,436 | | $ | 19,638 | | (1) | % | $ | 40,883 | | $ | 38,824 | | 5 | % |
| | | | | | | | | | | | | | |
| First Quarter | | | |
| In millions of dollars | 2024 | 2023 | % Change | | | |
| Services | $ | 4,766 | | $ | 4,394 | | 8 | % | | | |
| Markets | 5,378 | | 5,790 | | (7) | | | | |
| Banking | 1,714 | | 1,151 | | 49 | | | | |
| USPB | 5,178 | | 4,711 | | 10 | | | | |
| Wealth | 1,695 | | 1,766 | | (4) | | | | |
All Other—managed basis(1) | 2,385 | | 2,617 | | (9) | | | | |
All Other—divestiture-related impacts (Reconciling Items)(1) | (12) | | 1,018 | | NM | | | |
| Total Citigroup net revenues | $ | 21,104 | | $ | 21,447 | | (2) | % | | | |
NM Not meaningful
INCOME
| | Second Quarter | | Six Months | |
| First Quarter | |
| First Quarter | |
| First Quarter | |
| In millions of dollars | |
| In millions of dollars | |
| In millions of dollars | In millions of dollars | 2023 | 2022 | % Change | 2023 | 2022 | % Change |
| Income (loss) from continuing operations | Income (loss) from continuing operations | | | |
| Institutional Clients Group | $ | 2,219 | | $ | 3,978 | | (44) | % | $ | 5,517 | | $ | 6,636 | | (17) | % |
| Personal Banking and Wealth Management | 494 | | 553 | | (11) | | 983 | | 2,413 | | (59) | |
| Legacy Franchises | (122) | | (15) | | NM | 484 | | (400) | | NM |
| Corporate/Other | 361 | | 273 | | 32 | | 620 | | 465 | | 33 | |
| Income (loss) from continuing operations | |
| Income (loss) from continuing operations | |
| Services | |
| Services | |
| Services | |
| Markets | |
| Markets | |
| Markets | |
| Banking | |
| Banking | |
| Banking | |
| USPB | |
| USPB | |
| USPB | |
| Wealth | |
| Wealth | |
| Wealth | |
All Other—managed basis(1) | |
All Other—managed basis(1) | |
All Other—managed basis(1) | |
All Other—divestiture-related impacts (Reconciling Items)(1) | |
All Other—divestiture-related impacts (Reconciling Items)(1) | |
All Other—divestiture-related impacts (Reconciling Items)(1) | |
| Income from continuing operations | |
| Income from continuing operations | |
| Income from continuing operations | Income from continuing operations | $ | 2,952 | | $ | 4,789 | | (38) | % | $ | 7,604 | | $ | 9,114 | | (17) | % |
| Discontinued operations | Discontinued operations | $ | (1) | | $ | (221) | | 100 | % | $ | (2) | | $ | (223) | | 99 | % |
| Discontinued operations | |
| Discontinued operations | |
| Less: Net income attributable to noncontrolling interests | |
| Less: Net income attributable to noncontrolling interests | |
| Less: Net income attributable to noncontrolling interests | Less: Net income attributable to noncontrolling interests | 36 | | 21 | | 71 | | 81 | | 38 | | NM |
| Citigroup’s net income | Citigroup’s net income | $ | 2,915 | | $ | 4,547 | | (36) | % | $ | 7,521 | | $ | 8,853 | | (15) | % |
| Citigroup’s net income | |
| Citigroup’s net income | |
(1) All Other (managed basis) excludes divestiture-related impacts (Reconciling Items) related to (i) Citi’s divestitures of its Asia Consumer businesses and (ii) the planned IPO of Mexico consumer banking and small business and middle-market banking within Legacy Franchises. The Reconciling Items are fully reflected in the various line items in Citi’s Consolidated Statement of Income. See “All Other—Divestiture-Related Impacts (Reconciling Items)” below.
NM Not meaningful
SEGMENTSELECT BALANCE SHEET ITEMS BY SEGMENT(1)—JUNE 30, 2023MARCH 31, 2024
| | | | | | | | | | | | | | | | | | | | |
| In millions of dollars | Institutional
Clients
Group | Personal Banking
and Wealth Management | Legacy Franchises | Corporate/Other and consolidating eliminations(2) | Citigroup parent company- issued long-term debt and stockholders’ equity(3) | Total
Citigroup
consolidated |
| Assets | | | | | | |
| Cash and deposits with banks, net of allowance | $ | 98,975 | | $ | 5,764 | | $ | 3,393 | | $ | 188,776 | | $ | — | | $ | 296,908 | |
| Securities borrowed and purchased under agreements to resell, net of allowance | 336,768 | | 30 | | 305 | | — | | — | | 337,103 | |
| Trading account assets | 409,408 | | 1,307 | | 705 | | 11,769 | | — | | 423,189 | |
| Investments, net of allowance | 141,868 | | 13 | | 1,618 | | 363,646 | | — | | 507,145 | |
| Loans, net of unearned income and allowance for credit losses on loans | 275,323 | | 331,717 | | 36,076 | | — | | — | | 643,116 | |
| Other assets, net of allowance | 119,689 | | 25,912 | | 25,284 | | 45,329 | | — | | 216,214 | |
Net intersegment liquid assets(4) | 382,785 | | 108,050 | | 25,031 | | (515,866) | | — | | — | |
| Total assets | $ | 1,764,816 | | $ | 472,793 | | $ | 92,412 | | $ | 93,654 | | $ | — | | $ | 2,423,675 | |
| Liabilities and equity | | | | | | |
| Total deposits | $ | 818,244 | | $ | 426,791 | | $ | 52,981 | | $ | 21,851 | | $ | — | | $ | 1,319,867 | |
Securities loaned and sold under
agreements to repurchase | 257,262 | | 45 | | 2,728 | | — | | — | | 260,035 | |
| Trading account liabilities | 169,183 | | 476 | | 254 | | 751 | | — | | 170,664 | |
| Short-term borrowings | 29,765 | | 1 | | — | | 10,664 | | — | | 40,430 | |
Long-term debt(3) | 101,111 | | 189 | | 84 | | 10,083 | | 163,043 | | 274,510 | |
| Other liabilities | 98,710 | | 11,417 | | 23,679 | | 14,941 | | — | | 148,747 | |
Net intersegment funding (lending)(3) | 290,541 | | 33,874 | | 12,686 | | 34,661 | | (371,762) | | — | |
| Total liabilities | $ | 1,764,816 | | $ | 472,793 | | $ | 92,412 | | $ | 92,951 | | $ | (208,719) | | $ | 2,214,253 | |
Total equity(5) | — | | — | | — | | 703 | | 208,719 | | 209,422 | |
| Total liabilities and equity | $ | 1,764,816 | | $ | 472,793 | | $ | 92,412 | | $ | 93,654 | | $ | — | | $ | 2,423,675 | |
| | | | | | | | | | | | | | | | | | | | | | | | | | |
| In millions of dollars | Services | Markets | Banking | USPB | Wealth | All Other and consolidating eliminations(2) | Citigroup parent company- issued long-term debt(3) | Total
Citigroup
consolidated |
| | | | | | | | |
| Cash and deposits with banks, net of allowance | $ | 13,766 | | $ | 84,801 | | $ | 373 | | $ | 4,576 | | $ | 1,765 | | $ | 167,449 | | $ | — | | $ | 272,730 | |
| Securities borrowed and purchased under agreements to resell, net of allowance | 6,630 | | 336,860 | | 33 | | — | | 400 | | 341 | | — | | 344,264 | |
| Trading account assets | 82 | | 418,513 | | 833 | | 259 | | 946 | | 10,835 | | — | | 431,468 | |
| Investments, net of allowance | 724 | | 143,739 | | 1,423 | | — | | 3 | | 369,294 | | — | | 515,183 | |
| Loans, net of unearned income and allowance for credit losses on loans | 80,104 | | 117,618 | | 85,986 | | 190,963 | | 148,386 | | 33,225 | | — | | 656,282 | |
| | | | | | | | |
| Deposits | $ | 787,431 | | $ | 23,598 | | $ | 653 | | $ | 99,613 | | $ | 323,162 | | $ | 72,706 | | $ | — | | $ | 1,307,163 | |
| Securities loaned and sold under agreements to repurchase | 907 | | 295,746 | | 1 | | — | | 196 | | 2,537 | | — | | 299,387 | |
| Trading account liabilities | 70 | | 155,455 | | 65 | | 146 | | 251 | | 665 | | — | | 156,652 | |
| Short-term borrowings | 51 | | 27,898 | | 2 | | — | | 1 | | 3,958 | | — | | 31,910 | |
Long-term debt(3) | — | | 96,620 | | — | | — | | 456 | | 21,695 | | 166,724 | | 285,495 | |
(1)The supplemental information presented in the table above reflects Citigroup’s consolidatedselect GAAP balance sheet items by reportable segment and component. The respective segment information depicts the assets and liabilities managed by each segment.This table does not include intersegment funding.
(2)Consolidating eliminations for total Citigroup and Citigroup parent company assets and liabilitiesitems are recorded within Corporate/Other.All Other.
(3)The total equity and the majority of long-term debt of Citigroup areis reflected on the Citigroup parent company balance sheet (see Notes 1718 and 27)28). Citigroup allocates stockholders’ equity and long-term debt to its businesses through intersegment allocations as shown above.businesses.
(4)Represents the attribution of Citigroup’s liquid assets (primarily consisting of cash, marketable equity securities and AFS debt securities) to the various businesses based on Liquidity Coverage ratio (LCR) assumptions.
(5)Corporate/Other equity represents noncontrolling interests.
INSTITUTIONAL CLIENTS GROUPSERVICES
Institutional Clients Group (ICG)Services includes Treasury and Trade Solutions (TTS) and Securities Services. TTS provides an integrated suite of tailored cash management, trade and working capital solutions to multinational corporations, financial institutions and public sector organizations. Securities Services provides cross-border support for clients, providing on-the-ground local market expertise, post-trade technologies, customized data solutions and a wide range of securities services solutions that can be tailored to meet clients’ needs.
Services includes Services, Marketsrevenue is generated primarily from fees and Banking (forspreads associated with these activities. Services earns fee income for assisting clients with transactional services and clearing. Revenue generated from these activities is recorded in Commissions and fees. Revenue is also generated from assets under custody and administration and is recognized when the associated service is satisfied, which normally occurs at the point in time the service is requested by the client and provided by Citi. Revenue generated from these activities is primarily recorded in Administration and other fiduciary fees. For additional information on these businesses,various types of revenues, see “Citigroup Operating Segments” above)Note 5. Services revenues also include revenues earned by Citi that are subject to a revenue sharing arrangement with Banking—Corporate Lending for Investment Banking, Markets and Services products sold to Corporate Lending clients.
At March 31, 2024, Services had $577 billion in assets and $787 billion in deposits. Securities Services managed $24.0 trillion in assets under custody and administration, of which Citi provided both custody and administrative services to certain clients related to $1.9 trillion of such assets.
| | | | | | | | | | | | | | |
| First Quarter | | | |
| In millions of dollars, except as otherwise noted | 2024 | 2023 | % Change | | | |
| Net interest income (including dividends) | $ | 3,317 | | $ | 3,126 | | 6 | % | | | |
| Fee revenue | | | | | | |
| Commissions and fees | 797 | | 741 | | 8 | | | | |
| Fiduciary and administrative, and other | 685 | | 604 | | 13 | | | | |
| Total fee revenue | $ | 1,482 | | $ | 1,345 | | 10 | % | | | |
| Principal transactions | 248 | | 226 | | 10 | | | | |
All other(1) | (281) | | (303) | | 7 | | | | |
| Total non-interest revenue | $ | 1,449 | | $ | 1,268 | | 14 | % | | | |
| Total revenues, net of interest expense | $ | 4,766 | | $ | 4,394 | | 8 | % | | | |
| Total operating expenses | $ | 2,666 | | $ | 2,409 | | 11 | % | | | |
| Net credit losses on loans | 6 | | 6 | | — | | | | |
| Credit reserve build (release) for loans | 34 | | (72) | | NM | | | |
| Provision for credit losses on unfunded lending commitments | 12 | | 7 | | 71 | | | | |
| Provisions for credit losses on other assets and HTM debt securities | 12 | | 45 | | (73) | | | | |
| Provision (release) for credit losses | $ | 64 | | $ | (14) | | NM | | | |
| Income from continuing operations before taxes | $ | 2,036 | | $ | 1,999 | | 2 | % | | | |
| Income taxes | 517 | | 690 | | (25) | | | | |
| Income from continuing operations | $ | 1,519 | | $ | 1,309 | | 16 | % | | | |
| Noncontrolling interests | 25 | | 13 | | 92 | | | | |
| Net income | $ | 1,494 | | $ | 1,296 | | 15 | % | | | |
Balance Sheet data (in billions of dollars) | | | | | | |
| EOP assets | $ | 577 | | $ | 585 | | (1) | % | | | |
| Average assets | 580 | | 598 | | (3) | | | | |
| Efficiency ratio | 56 | % | 55 | % | | | | |
| Revenue by component | | | | | | |
| Net interest income | $ | 2,723 | | $ | 2,612 | | 4 | % | | | |
| Non-interest revenue | 793 | | 727 | | 9 | | | | |
| Treasury and Trade Solutions (TTS) | $ | 3,516 | | $ | 3,339 | | 5 | % | | | |
| Net interest income | $ | 594 | | $ | 514 | | 16 | % | | | |
| Non-interest revenue | 656 | | 541 | | 21 | | | | |
| Securities Services | $ | 1,250 | | $ | 1,055 | | 18 | % | | | |
Total Services | $ | 4,766 | | $ | 4,394 | | 8 | % | | | |
| | | | | | | | | | | | | | |
| Revenue by geography | | | | | | |
| North America | $ | 1,243 | | $ | 1,205 | | 3 | % | | | |
| International | 3,523 | | 3,189 | | 10 | | | | |
| Total | $ | 4,766 | | $ | 4,394 | | 8 | % | | | |
Key drivers(2) | | | | | | |
Average loans by reporting unit (in billions of dollars) | | | | | | |
| TTS | $ | 81 | | $ | 78 | | 4 | % | | | |
| Securities Services | 1 | | 1 | | — | | | | |
| Total | $ | 82 | | $ | 79 | | 4 | % | | | |
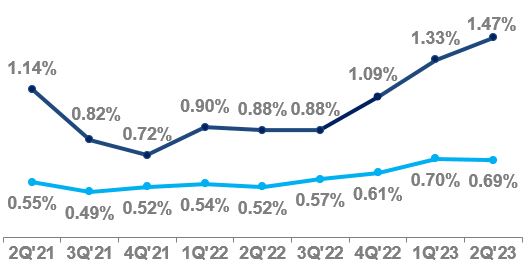
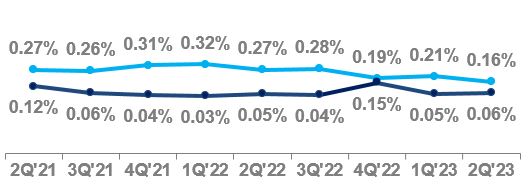
ACLL as a percentage of EOP loans(3) | 0.54 | % | 0.36 | % | | | | |
Average deposits by reporting unit and selected component (in billions of dollars) | | | | | | |
| TTS | $ | 684 | | $ | 705 | | (3) | % | | | |
| Securities Services | 124 | | 125 | | (1) | | | | |
| Total | $ | 808 | | $ | 830 | | (3) | % | | | |
(1) Includes revenues earned by Citi that are subject to a revenue sharing arrangement with Banking—Corporate Lending for Investment Banking, Markets and Services products sold to Corporate Lending clients.
(2) Management uses this information in reviewing the segment’s results and believes it is useful to investors concerning underlying segment performance and trends.
(3) Excludes loans that are carried at fair value for all periods.
NM Not meaningful
1Q24 vs. 1Q23
Net income of $1.5 billion increased 15%, primarily driven by higher revenue, partially offset by higher expenses and cost of credit.
Revenues increased 8%, driven by higher revenues in both TTS and Securities Services, largely driven by both net interest income and non-interest revenue growth.
TTS revenues increased 5%, reflecting 4% growth in net interest income and 9% increase in non-interest revenue. The increase in net interest income was primarily driven by higher spreads, partially offset by lower deposits. The growth in non-interest revenue was largely driven by continued strength across underlying fee drivers, including higher cross-border flows (up 9%), U.S. dollar clearing volumes (up 3%) and commercial card spend (up 5%). Average deposits were down 3%, as the impact of quantitative tightening more than offset new client acquisitions and deepening with existing clients.
Securities Services revenues increased 18%, due to 16% growth in net interest income, driven by higher deposit spreads, and 21% growth in non-interest revenue. The increase in non-interest revenue was driven by fee growth, primarily due to higher AUC/AUA balances from higher market valuations, as well as new client onboarding along with continued elevated levels of corporate activity in Issuer Services.
Expenses ICGwere up 11%, primarily driven by investments in technology, other risk and controls and product innovation.
Provisions were $64 million, compared to $(14) million in the prior-year period, primarily driven by an ACL build for loans, compared to a release in the prior-year period.
The net ACL build was primarily due to changes in loan portfolio mix. For additional information on Citi’s ACL, see “Significant Accounting Policies and Significant Estimates” below.
For additional information on Services’ corporate credit portfolio, see “Managing Global Risk—Credit Risk—Corporate Credit” below.
For additional information on trends in Services’ deposits and loans, see “Managing Global Risk—Liquidity Risk—Loans” and “—Deposits” below.
For additional information about trends, uncertainties and risks related to Services’ future results, see “Executive Summary” above and “Managing Global Risk—Other Risks—Country Risk—Argentina” and “—Russia” below, and “Risk Factors” in Citi’s 2023 Form 10-K.
MARKETS
Markets provides corporate, institutional and public sector clients around the world with a full range of wholesale banking products and services, including fixed income and equity sales and trading services across equities, foreign exchange, rates, spread products and commodities. The range of services includes market-making across asset classes, risk management solutions, financing, prime brokerage, derivative services, equityresearch, securities clearing and fixed income research, corporate lending, investment banking and advisory services, cash management, trade finance and securities services. ICG transacts with clients in both cash instruments and derivatives, including fixed income, foreign currency, equity and commodity products. For more information on ICG’s business activities, see “Institutional Clients Group” in Citi’s 2022 Form 10-K.settlement.
ICGAs a market maker, ’sMarkets facilitates transactions, including holding product inventory to meet client demand, and earns the differential between the price at which it buys and sells the products. These price differentials and the unrealized gains and losses on the inventory are recorded in Principal transactions. Other primarily includes realized gains and losses on available-for-sale (AFS) debt securities, gains and losses on equity securities not held in trading accounts and other non-recurring gains and losses. Interest income earned on assets held, less interest paid on long- and short-term debt, secured funding transactions and customer deposits, is recorded as Net interest income.
The amount and types of Markets revenues are impacted by a variety of interrelated factors, including market liquidity; changes in market variables such as interest rates, foreign exchange rates, equity prices, commodity prices and credit spreads, as well as their implied volatilities; investor confidence; and other macroeconomic conditions. Markets revenues include revenues earned by Citi that are subject to a revenue sharing arrangement with Banking—Corporate Lending for Investment Banking, Markets and Services products sold to Corporate Lending clients.
Assuming all other market conditions do not change, increases in client activity levels or bid/offer spreads generally result in increases in revenues. However, changes in market conditions can significantly impact client activity levels, bid/offer spreads and the fair value of product inventory. Management of the Markets businesses involves daily monitoring and evaluation of the above factors.
Markets international presence is supported by trading floors in approximately 80 countries and a proprietary network in 95 countries and jurisdictions. As previously disclosed, as of March 31, 2023, Citi ended nearly all of the institutional banking services it offered in Russia, with the remaining services only those necessary to fulfill its remaining legal and regulatory obligations. For additional information about Citi’s continued efforts to reduce its operations and exposure in Russia, see “Legacy Franchises” and “Managing Global Risk—Other Risks—Country Risk—Russia” below.
At June 30, 2023, ICG had $1.8 trillion in assets and $818 billion in deposits. Securities services managed $23.7 trillion in assets under custody and administration at June 30, 2023, of which Citi provided both custody and administrative services to certain clients related to $2.2 trillion of such assets. Managed assets under trust were $4.1 trillion at June 30, 2023. For additional information on these operations, see “Administration and Other Fiduciary Fees” in Note 5.
| | | | | | | | | | | | | | | | | | | | |
| Second Quarter | | Six Months | |
| In millions of dollars, except as otherwise noted | 2023 | 2022 | % Change | 2023 | 2022 | % Change |
| Commissions and fees | $ | 1,126 | | $ | 1,125 | | — | % | $ | 2,276 | | $ | 2,255 | | 1 | % |
| Administration and other fiduciary fees | 709 | | 732 | | (3) | | 1,363 | | 1,404 | | (3) | |
Investment banking fees(1) | 686 | | 990 | | (31) | | 1,520 | | 2,029 | | (25) | |
| Principal transactions | 2,463 | | 4,358 | | (43) | | 6,172 | | 8,800 | | (30) | |
| Other | (166) | | (306) | | 46 | | (308) | | (213) | | (45) | |
| Total non-interest revenue | $ | 4,818 | | $ | 6,899 | | (30) | % | $ | 11,023 | | $ | 14,275 | | (23) | % |
| Net interest income (including dividends) | 5,623 | | 4,520 | | 24 | | 10,651 | | 8,304 | | 28 | |
| Total revenues, net of interest expense | $ | 10,441 | | $ | 11,419 | | (9) | % | $ | 21,674 | | $ | 22,579 | | (4) | % |
| Total operating expenses | $ | 7,286 | | $ | 6,434 | | 13 | % | $ | 14,259 | | $ | 13,157 | | 8 | % |
| Net credit losses on loans | $ | 73 | | $ | 18 | | NM | $ | 95 | | $ | 48 | | 98 | % |
| Credit reserve build (release) for loans | (150) | | (76) | | (97) | % | (225) | | 520 | | NM |
| Provision (release) for credit losses on unfunded lending commitments | (88) | | (169) | | 48 | | (258) | | 183 | | NM |
| Provisions (releases) for credit losses on HTM debt securities and other assets | 223 | | 25 | | NM | 374 | | 18 | | NM |
| Provisions (releases) for credit losses | $ | 58 | | $ | (202) | | NM | $ | (14) | | $ | 769 | | NM |
| Income from continuing operations before taxes | $ | 3,097 | | $ | 5,187 | | (40) | % | $ | 7,429 | | $ | 8,653 | | (14) | % |
| Income taxes | 878 | | 1,209 | | (27) | | 1,912 | | 2,017 | | (5) | |
| Income from continuing operations | $ | 2,219 | | $ | 3,978 | | (44) | % | $ | 5,517 | | $ | 6,636 | | (17) | % |
| Noncontrolling interests | 29 | | 17 | | 71 | | 69 | | 35 | | 97 | |
| Net income | $ | 2,190 | | $ | 3,961 | | (45) | % | $ | 5,448 | | $ | 6,601 | | (17) | % |
Balance Sheet data (in billions of dollars) | | | | | | |
| EOP assets | $ | 1,765 | | $ | 1,700 | | 4 | % | | | |
| Average assets | 1,795 | | 1,698 | | 6 | | $ | 1,785 | | $ | 1,692 | | 5 | % |
| Efficiency ratio | 70 | % | 56 | % | | 66 | % | 58 | % | |
Average loans by reporting unit (in billions of dollars) | | | | | | |
| Services | $ | 80 | | $ | 85 | | (6) | % | $ | 80 | | $ | 82 | | (2) | % |
| Banking | 185 | | 199 | | (7) | | 188 | | 197 | | (5) | |
| Markets | 13 | | 13 | | — | | 13 | | 14 | | (7) | |
| Total | $ | 278 | | $ | 297 | | (6) | % | $ | 281 | | $ | 293 | | (4) | % |
Average deposits by reporting unit (in billions of dollars) | | | | | | |
| TTS | $ | 688 | | $ | 672 | | 2 | % | $ | 696 | | $ | 671 | | 4 | % |
| Securities services | 125 | | 137 | | (9) | | 125 | | 136 | | (8) | |
| | | | | | | | | | | | | | |
| First Quarter | | | |
| In millions of dollars, except as otherwise noted | 2024 | 2023 | % Change | | | |
| Net interest income (including dividends) | $ | 1,713 | | $ | 1,562 | | 10 | % | | | |
| Fee revenue | | | | | | |
| Brokerage and fees | 336 | | 385 | | (13) | | | | |
Investment banking fees(1) | 95 | | 89 | | 7 | | | | |
Other(2) | 62 | | 40 | | 55 | | | | |
| Total fee revenue | $ | 493 | | $ | 514 | | (4) | % | | | |
| Principal transactions | 3,178 | | 3,889 | | (18) | | | | |
All other(3) | (6) | | (175) | | 97 | | | | |
| Total non-interest revenue | $ | 3,665 | | $ | 4,228 | | (13) | % | | | |
Total revenues, net of interest expense(3) | $ | 5,378 | | $ | 5,790 | | (7) | % | | | |
| Total operating expenses | $ | 3,380 | | $ | 3,162 | | 7 | % | | | |
| Net credit losses (recoveries) on loans | 78 | | 4 | | NM | | | |
| Credit reserve build (release) for loans | 120 | | 64 | | 88 | | | | |
| Provision (release) for credit losses on unfunded lending commitments | (1) | | (4) | | 75 | | | | |
| Provisions for credit losses for other assets and HTM debt securities | 3 | | 19 | | (84) | | | | |
| Provision (release) for credit losses | $ | 200 | | $ | 83 | | NM | | | |
| Income (loss) from continuing operations before taxes | $ | 1,798 | | $ | 2,545 | | (29) | % | | | |
| Income taxes (benefits) | 388 | | 676 | | (43) | | | | |
| Income (loss) from continuing operations | $ | 1,410 | | $ | 1,869 | | (25) | % | | | |
| Noncontrolling interests | 15 | | 21 | | (29) | | | | |
| Net income (loss) | $ | 1,395 | | $ | 1,848 | | (25) | % | | | |
Balance Sheet data (in billions of dollars) | | | | | | |
| EOP assets | $ | 1,037 | | $ | 1,020 | | 2 | % | | | |
| Average assets | 1,048 | | 1,004 | | 4 | | | | |
| Efficiency ratio | 63 | % | 55 | % | | | | |
| Revenue by component | | | | | | |
| Fixed Income markets | $ | 4,151 | | $ | 4,623 | | (10) | % | | | |
| Equity markets | 1,227 | | 1,167 | | 5 | | | | |
| Total | $ | 5,378 | | $ | 5,790 | | (7) | % | | | |
| | | | | | | | | | | | | | | | | | | | |
| Services | $ | 813 | | $ | 809 | | — | % | $ | 821 | | $ | 807 | | 2 | % |
| Markets and Banking | 24 | | 21 | | 14 | | 24 | | 21 | | 14 | |
| Total | $ | 837 | | $ | 830 | | 1 | % | $ | 845 | | $ | 828 | | 2 | % |
| | | | | | | | | | | | | | |
| Rates and currencies | $ | 2,799 | | $ | 3,551 | | (21) | % | | | |
| Spread products/other fixed income | 1,352 | | 1,072 | | 26 | | | | |
| Total Fixed Income markets revenues | $ | 4,151 | | $ | 4,623 | | (10) | % | | | |
| Revenue by geography | | | | | | |
| North America | $ | 2,087 | | $ | 2,062 | | 1 | % | | | |
| International | 3,291 | | 3,728 | | (12) | | | | |
| Total | $ | 5,378 | | $ | 5,790 | | (7) | % | | | |
Key drivers(4) (in billions of dollars) | | | | | | |
| Average loans | $ | 120 | | $ | 111 | | 8 | % | | | |
| NCLs as a percentage of average loans | 0.26 | % | 0.01 | % | | | | |
ACLL as a percentage of EOP loans(5) | 0.85 | % | 0.66 | % | | | | |
| Average trading account assets | $ | 408 | | $ | 350 | | 17 | | | | |
| Average deposits | 24 | | 23 | | 4 | | | | |
(1) Investment banking fees are substantiallyprimarily composed of underwriting, advisory, loan syndication structuring and advisory revenues.
NM Not meaningfulother related financing activity.
ICG Revenue Details
| | | | | | | | | | | | | | | | | | | | |
| Second Quarter | | Six Months | |
| In millions of dollars | 2023 | 2022 | % Change | 2023 | 2022 | % Change |
| Services | | | | | | |
| Net interest income | $ | 2,914 | | $ | 2,354 | | 24 | % | $ | 5,753 | | $ | 4,278 | | 34 | % |
| Non-interest revenue | 1,741 | | 1,696 | | 3 | | 3,369 | | 3,237 | | 4 | |
| Total Services revenues | $ | 4,655 | | $ | 4,050 | | 15 | % | $ | 9,122 | | $ | 7,515 | | 21 | % |
| Net interest income | $ | 2,425 | | $ | 2,053 | | 18 | % | $ | 4,783 | | $ | 3,729 | | 28 | % |
| Non-interest revenue | 1,085 | | 1,003 | | 8 | | 2,138 | | 1,934 | | 11 | |
| TTS revenues | $ | 3,510 | | $ | 3,056 | | 15 | % | $ | 6,921 | | $ | 5,663 | | 22 | % |
| Net interest income | $ | 489 | | $ | 301 | | 62 | % | $ | 970 | | $ | 549 | | 77 | % |
| Non-interest revenue | 656 | | 693 | | (5) | | 1,231 | | 1,303 | | (6) | |
| Securities services revenues | $ | 1,145 | | $ | 994 | | 15 | % | $ | 2,201 | | $ | 1,852 | | 19 | % |
| Markets | | | | | | |
| Net interest income | $ | 1,982 | | $ | 1,355 | | 46 | % | $ | 3,452 | | $ | 2,447 | | 41 | % |
| Non-interest revenue | 2,637 | | 3,937 | | (33) | | 6,768 | | 8,654 | | (22) | |
Total Markets revenues(1) | $ | 4,619 | | $ | 5,292 | | (13) | % | $ | 10,220 | | $ | 11,101 | | (8) | % |
| Fixed income markets | $ | 3,529 | | $ | 4,078 | | (13) | % | $ | 7,983 | | $ | 8,367 | | (5) | % |
| Equity markets | 1,090 | | 1,214 | | (10) | | 2,237 | | 2,734 | | (18) | |
| Total Markets revenues | $ | 4,619 | | $ | 5,292 | | (13) | % | $ | 10,220 | | $ | 11,101 | | (8) | % |
| Rates and currencies | $ | 2,844 | | $ | 3,249 | | (12) | % | $ | 6,484 | | $ | 6,463 | | — | % |
| Spread products / other fixed income | 685 | | 829 | | (17) | | 1,499 | | 1,904 | | (21) | |
| Total Fixed income markets revenues | $ | 3,529 | | $ | 4,078 | | (13) | % | $ | 7,983 | | $ | 8,367 | | (5) | % |
| Banking | | | | | | |
| Net interest income | $ | 727 | | $ | 811 | | (10) | % | $ | 1,446 | | $ | 1,579 | | (8) | % |
| Non-interest revenue | 440 | | 1,266 | | (65) | | 886 | | 2,384 | | (63) | |
| Total Banking revenues | $ | 1,167 | | $ | 2,077 | | (44) | % | $ | 2,332 | | $ | 3,963 | | (41) | % |
| Investment banking | | | | | | |
| Advisory | $ | 162 | | $ | 357 | | (55) | % | $ | 451 | | $ | 704 | | (36) | % |
| Equity underwriting | 162 | | 177 | | (8) | | 271 | | 362 | | (25) | |
| Debt underwriting | 288 | | 271 | | 6 | | 664 | | 767 | | (13) | |
| Total Investment banking revenues | $ | 612 | | $ | 805 | | (24) | % | $ | 1,386 | | $ | 1,833 | | (24) | % |
Corporate lending (excluding gains (losses) on loan hedges)(2) | $ | 621 | | $ | 778 | | (20) | % | $ | 1,211 | | $ | 1,467 | | (17) | % |
Total Banking revenues (excluding gains (losses) on loan hedges)(2) | $ | 1,233 | | $ | 1,583 | | (22) | % | $ | 2,597 | | $ | 3,300 | | (21) | % |
Gain (loss) on loan hedges(2) | (66) | | 494 | | NM | (265) | | 663 | | NM |
Total Banking revenues (including gains (losses) on loan hedges)(2) | $ | 1,167 | | $ | 2,077 | | (44) | % | $ | 2,332 | | $ | 3,963 | | (41) | % |
Total ICG revenues, net of interest expense | $ | 10,441 | | $ | 11,419 | | (9) | % | $ | 21,674 | | $ | 22,579 | | (4) | % |
(1)(3) Citi assesses its Markets business performance on a total revenue basis, as offsets may occur across revenue line items. For example, securities that generate Net interest income may be risk managed withby derivatives that are recorded in Principal transactions revenue within Non-interest revenue. For a description of the composition of these revenue line items, see Notes 4, 5 and 6.
(4) Management uses this information in reviewing the segment’s results and believes it is useful to investors concerning underlying segment performance and trends.
(5) Excludes loans that are carried at fair value for all periods.
NM Not meaningful
1Q24 vs. 1Q23
Net income of $1.4 billion decreased 25%, primarily driven by lower revenues, higher expenses and higher cost of credit.
Revenues decreased 7%, primarily driven by lower Fixed Income markets revenues, partially offset by higher Equity markets revenues.
Fixed Income markets revenues decreased 10%, reflecting a decline in rates and currencies revenues, partially offset by higher revenues in spread products and other fixed income. Rates and currencies revenues decreased 21%, largely reflecting lower volatility, decreased institutional client activity and a strong prior-year performance. Spread products and other fixed income revenues increased 26%, driven by spread products, primarily due to increased client activity, particularly in asset-backed lending. The increase was partially offset by a decline in commodities revenues.
Equity markets revenues increased 5%, driven by growth in cash equity trading, due to higher volumes and increased trading activity, and higher equity derivatives revenues, due to increased corporate client activity. Equity markets also continued to experience an increase in prime balances.
Expenses increased 7%, primarily driven by the absence of a legal reserve release in the prior-year period.
Provisions were $200 million, compared to $83 million in the prior-year period, driven by a net ACL build of $122 million, compared to $79 million in the prior-year period, and net credit losses of $78 million, compared to $4 million in the prior-year period. The net ACL build was primarily driven by changes in macroeconomic variable assumptions related to loans in spread products. For additional information on Citi’s ACL, see “Significant Accounting Policies and Significant Estimates” below.
For additional information on Markets’corporate credit portfolio, see “Managing Global Risk—Credit Risk—Corporate Credit” below.
For additional information on trends in Markets’ deposits and loans, see “Managing Global Risk—Liquidity Risk—Loans” and “—Deposits” below.
For additional information about trends, uncertainties and risks related to Markets’ future results, see “Executive Summary” above and “Managing Global Risk—Other Risks—Country Risk—Argentina” and “—Russia” below, and “Risk Factors” in Citi’s 2023 Form 10-K.
BANKING
Banking includes Investment Banking, which supports clients’ capital-raising needs to help strengthen and grow their businesses, including equity and debt capital markets-related strategic financing solutions, as well as advisory services related to mergers and acquisitions, divestitures, restructurings and corporate defense activities; and Corporate Lending, which includes corporate and commercial banking, serving as the conduit of Citi’s full product suite to clients.
Banking revenues include revenues earned by Citi that are subject to a revenue sharing arrangement for Investment Banking, Markets and Services products sold to Corporate Lending clients.
At March 31, 2024, Banking had $152 billion in assets including $87 billion in loans, and $0.7 billion in deposits.
| | | | | | | | | | | | | | |
| First Quarter | | | |
| In millions of dollars, except as otherwise noted | 2024 | 2023 | % Change | | | |
| Net interest income (including dividends) | $ | 574 | | $ | 500 | | 15 | % | | | |
| Fee revenue | | | | | | |
Investment banking fees(1) | 977 | | 740 | | 32 | | | | |
| Other | 42 | | 42 | | — | | | | |
| Total fee revenue | $ | 1,019 | | $ | 782 | | 30 | % | | | |
| Principal transactions | (227) | | (335) | | 32 | | | | |
All other(2) | 348 | | 204 | | 71 | | | | |
| Total non-interest revenue | $ | 1,140 | | $ | 651 | | 75 | % | | | |
| Total revenues, net of interest expense | 1,714 | | 1,151 | | 49 | | | | |
| Total operating expenses | $ | 1,184 | | $ | 1,236 | | (4) | % | | | |
| Net credit losses on loans | 66 | | 12 | | NM | | | |
| Credit reserve build (release) for loans | (89) | | (50) | | (78) | | | | |
| Provision (release) for credit losses on unfunded lending commitments | (96) | | (171) | | 44 | | | | |
| Provisions (releases) for credit losses for other assets and HTM debt securities | (10) | | 86 | | NM | | | |
| Provisions (releases) for credit losses | $ | (129) | | $ | (123) | | (5) | % | | | |
| Income (loss) from continuing operations before taxes | $ | 659 | | $ | 38 | | NM | | | |
| Income taxes (benefits) | 120 | | (19) | | NM | | | |
| Income (loss) from continuing operations | $ | 539 | | $ | 57 | | NM | | | |
| Noncontrolling interests | 3 | | 2 | | 50 | % | | | |
| Net income (loss) | $ | 536 | | $ | 55 | | NM | | | |
Balance Sheet data (in billions of dollars) | | | | | | |
| EOP assets | $ | 152 | | $ | 148 | | 3 | % | | | |
| Average assets | 155 | | 157 | | (1) | | | | |
| Efficiency ratio | 69 | % | 107 | % | | | | |
| Revenue by component | | | | | | |
| Total Investment Banking | $ | 903 | | $ | 667 | | 35 | % | | | |
Corporate Lending (excluding gain (loss) on loan hedges)(2)(3) | 915 | | 683 | | 34 | | | | |
Total Banking revenues (excluding gain (loss) on loan hedges)(2)(3) | $ | 1,818 | | $ | 1,350 | | 35 | % | | | |
Gain (loss) on loan hedges(2)(3) | (104) | | (199) | | 48 | | | | |
Total Banking revenues (including gain (loss) on loan hedges)(2)(3) | $ | 1,714 | | $ | 1,151 | | 49 | % | | | |
| Business metrics—investment banking fees | | | | | | |
| Advisory | $ | 230 | | $ | 276 | | (17) | % | | | |
| Equity underwriting (Equity Capital Markets (ECM)) | 171 | | 109 | | 57 | | | | |
| Debt underwriting (Debt Capital Markets (DCM)) | 576 | | 355 | | 62 | | | | |
| Total | $ | 977 | | $ | 740 | | 32 | % | | | |
| | | | | | | | | | | | | | |
| Revenue by geography | | | | | | |
| North America | $ | 751 | | $ | 370 | | NM | | | |
| International | 963 | | 781 | | 23 | % | | | |
| Total | $ | 1,714 | | $ | 1,151 | | 49 | % | | | |
Key drivers(4) (in billions of dollars) | | | | | | |
| Average loans | $ | 89 | | $ | 95 | | (6) | % | | | |
| NCLs as a percentage of average loans | 0.30 | % | 0.05 | % | | | | |
ACLL as a percentage of EOP loans(5) | 1.47 | % | 1.84 | % | | | | |
| Average deposits | $ | 1 | | $ | 1 | | — | | | | |
(1) Investment banking fees are primarily composed of underwriting, advisory, loan syndication structuring and other related financing activity.
(2) Includes revenues earned by Citi that are subject to a revenue sharing arrangement with Investment Banking, Markets and Services products sold to Corporate Lending clients.
(3) Credit derivatives are used to economically hedge a portion of the corporate loan portfolio that includes both accrual loans and loans at fair value. Gain (loss) on loan hedges includeincludes the mark-to-market on the credit derivatives, andpartially offset by the mark-to-market on the loans in the portfolio that are at fair value. Hedges on accrual loans reflect the mark-to-market on credit derivatives used to economically hedge the corporate loan accrual portfolio. The fixed premium
costs of these hedges are netted against the corporate lending revenues to reflect the cost of credit protection. Citigroup’s results of operations excluding the impact of gain (loss) on loan hedges are non-GAAP financial measures.
(4) Management uses this information in reviewing the segment’s results and believes it is useful to investors concerning underlying segment performance and trends.
(5) Excludes loans that are carried at fair value for all periods.
NM Not meaningful
The discussion of the results of operations for ICGBanking below excludes (where noted) the impact of any gain (loss) on hedges of accrual loans, which are non-GAAP financial measures. For a reconciliation of these metrics to the reported results, see the table above.
2Q231Q24 vs. 2Q221Q23
Net income was $536 million, compared to net income of $2.2 billion decreased 45%$55 million in the prior-year period, driven by higher revenues and lower expenses.
Revenues increased 49% (including losses on loan hedges), primarily reflecting higher Investment Banking revenues, driven by recovery of the global investment banking wallet, higher revenues in Corporate Lending and lower losses on loan hedges ($104 million loss versus $199 million loss in the prior-year period). Excluding the impact of losses on loan hedges, Banking revenues increased 35%.
Investment Banking revenues increased 35%, driven by the DCM and ECM businesses, as improved market sentiment led to an increase in issuance activity. DCM underwriting fees increased 62%, driven by elevated debt issuance activity, particularly investment grade. ECM underwriting fees increased 57%, primarily driven by lower revenues, higher expensesan increase in convertibles issuance. The increase in DCM and higher cost of credit.
Revenues decreased 9% (including gain (loss) on loan hedges), driven by lower Banking and Markets revenues,ECM underwriting fees was partially offset by higher Services revenues. Banking revenues were down 44% (including the impact of the gain (loss) on loan hedges), reflecting lower revenues in both Investment banking and Corporate lending. Markets revenues were down 13%Advisory fees (down 17%), driven by lower revenues in both Fixed income markets and Equity markets, due to lower client activity, driven by decreased volatility and a strong prior-year comparison. Services revenues were up 15%, driven by higher revenues in both TTS and Securities services.
Citi expects that revenues in its Markets and Investment banking businesses will continue to reflect the overall market environment during the remainder of 2023.
Within Services:
•TTS revenues increased 15%, driven by 18% growth in net interest income and 8% growth in non-interest revenue, reflecting strong growth across all client segments. The increase in net interest income was primarily driven by higher interest rates as well as growth in deposits, partially offset by higher interest rates paid on deposits. Average deposits increased 2%, largely driven by growth in EMEA and Latin America. Average loans decreased 6%, reflecting business actions taken to reduce RWA. The increase in non-interest revenue was primarily driven by strong fee growth in the cash business, reflecting solid client engagement and continued growth of underlying drivers, reflecting higher cross-border flows (up 11%) and commercial card spend (up 15%).
•Securities services revenues increased 15%, as net interest income grew 63%, driven by higher interest rates across currencies and cost of funds management, partially offset by the impact of an 8% decline in average deposits. Non-interest revenues decreased 5%, primarily driven by custody fee spread compression, partially offset by higher assets under custody and administration and continued elevated levels of corporatelow merger activity in Issuer services.
Within Markets:
•Fixed income markets revenues decreased 13%, driven by North America, EMEA and Asia, largely due to decreased institutional and corporate client activity.
Rates and currencies decreased 12%, largely due to a declineannounced in the currencies business, driven by EMEA, primarily reflecting lower volatility and a strong prior-year comparison, partially offset by a modest increase in the rates business. Spread products and other fixed income revenues decreased 17%, due to a decline across
second half of 2023.regions in commodities, driven by lower corporate and institutional client activity, as well as a decline in the financing and securitization business, as the business further reduced its subscription credit facilities portfolio.
•Equity markets revenues decreased 10%, driven by North America and Asia. The decline primarily reflected lower equity derivatives revenues, driven by a more challenging macroeconomic environment, lower volatility and a strong prior-year comparison. The decline in equity derivatives revenues was partially offset by an increase in equity cash, reflecting a modest increase in institutional client activity. Prime finance revenues were largely unchanged, while prime finance balances continued to grow in the quarter.
Within Banking:
•Investment banking revenues declined 24%, reflecting a decline in the overall market wallet, as ongoing macroeconomic and geopolitical uncertainty continued to adversely impact client activity. Advisory revenues decreased 55%, reflecting a decline in North America and Asia, partially offset by growth in EMEA. The decrease in advisory revenues was driven by the lower market wallet as well as lower wallet share. Equity underwriting revenues decreased 8%, reflecting a decline in North America, Asia and EMEA, driven by lower wallet share, partially offset by growth in the market wallet. Debt underwritingCorporate Lending revenues increased 6%, reflecting growth in North America and EMEA, driven by wallet share gains, largely in the investment-grade portfolio, partially offset by the decline in the market wallet.
•Corporate lending revenues decreased 56%68%, including the impact of gains (losses)losses on loan hedges. Excluding the impact of gains (losses)losses on loan hedges, Corporate Lending revenues increased 34%, largely driven by higher revenue share.
Expensesdecreased 20%4%, primarily driven by benefits from repositioning actions and other actions to lower the impacts of foreign currency translation and lower lending volumes.
Expenses increased 13%, primarily driven by continued investment in TTS, risk and controls investments and severance costs in Markets and Investment banking,expense base, partially offset by productivity savings.business-led investments.
Provisions reflected a costbenefit of $58$129 million, compared to a benefit of $202$123 million in the prior-year period, largely driven by an ACL build for other assets and higher net credit losses.period. Net credit losses were $73increased to $66 million, compared to $18 million in the prior-year period.
The ACL release was $15 million, compared to a release of $220$12 million in the prior-year period. The $15 millionnet ACL release was $195 million, compared to a net release of $135 million in the prior-year
period, primarily driven by a net ACL release for loans and unfunded lending commitments of $238 million, primarily due to an improved macroeconomic outlook, partially offset by a $223 million build for other assets, primarily related to an increasechanges in transfer risk associated with exposures outside the
U.S. driven by safety and soundness considerations under U.S. banking law.portfolio composition. For additional information on Citi’s ACL, see “Significant Accounting Policies and Significant Estimates” below.
For additional information on ICGBanking’s corporate credit portfolio, see “Managing Global Risk—Credit Risk—Corporate Credit” below.
For additional information on trends in ICGBanking’s deposits and loans, see “Managing Global Risk—Liquidity Risk—Loans” and “—Deposits” below.
For additional information about trends, uncertainties and risks related to ICGBanking’s future results, see “Executive Summary” above and “Managing Global Risk—Other Risks—Country Risk—Argentina” and “—Russia” and “Forward-Looking Statements” below, and “Risk Factors” in Citi’s 20222023 Form 10-K.
2Q23 YTD vs. 2Q22 YTD
Net income of $5.4 billion decreased 17%, primarily driven by lower revenues and higher expenses, partially offset by lower cost of credit.
Revenues decreased 4% (including gain (loss) on loan hedges), driven by lower Banking and Markets revenues, partially offset by higher Services revenues. Banking revenues were down 41% (including the impact of the gain (loss) on loan hedges), reflecting lower revenues in both Investment banking and Corporate lending. Markets revenues were down 8%, driven by lower revenues in both Equity markets and Fixed income markets, also reflecting lower client activity, driven by decreased volatility and a strong prior-year comparison. Services revenues were up 21%, driven by higher revenues in both TTS and Securities services.
Within Services:
•TTS revenues increased 22%, with growth in net interest income of 28% and non-interest revenue of 11%, driven by the same factors described above.
•Securities services revenues increased 19%, reflecting higher net interest income, driven by the same factors described above. Non-interest revenue declined 6%, as a decrease in revenues in the custody business was partially offset by an increase in Issuer services.
Within Markets:
•Fixed income marketsrevenues decreased 5%, primarily due to EMEA, reflecting a decline in spread products and other fixed income, driven by the same factors described above, as rates and currencies revenues were largely unchanged.
•Equity markets revenues decreased 18%, primarily due to a decline in equity derivatives, driven by the same factors as described above, as well as a modest decline in equity cash. Prime finance balances continued to grow year to date.
Within Banking:
•Investment banking revenues decreased 24%. Advisory revenues decreased 36% and equity underwriting revenues decreased 25%, driven by the same factors described above. Debt underwriting revenues decreased 13%, largely driven by the lower market wallet.
•Corporate lendingrevenues decreased 56%, including the impact of gains (losses) on loan hedges. Excluding the impact of gains (losses) on loan hedges, revenues decreased 17%, driven by the same factors described above.
Expenses increased 8%, primarily driven by continued investment in Citi’s transformation, investments in TTS, other risk and controls investments, volume-related expenses and other structural expenses, including severance costs, partially offset by productivity savings and foreign exchange translation.
Provisions reflected a benefit of $14 million, compared to a cost of $769 million in the prior-year period, largely driven by a net ACL release for loans and unfunded lending commitments, compared to an ACL build in the prior-year period. Net credit losses were $95 million, compared to $48 million in the prior-year period.
The ACL release was $109 million, compared to a build of $721 million in the prior-year period, driven by a net ACL release for loans and unfunded lending commitments of $483 million, due to an improved macroeconomic outlook and Russia loan reductions, partially offset by a $374 million build for other assets, primarily related to an increase in transfer risk associated with exposures outside the U.S. driven by safety and soundness considerations under U.S. banking law.
U.S. PERSONAL BANKING AND WEALTH MANAGEMENT
Personal Banking and Wealth Management (PBWM) consists of U.S. Personal Banking and Global Wealth Management (Global Wealth). U.S. Personal Banking (USPB) includes Branded cardsCards and Retail services, which haveServices, with proprietary card portfolios (Cash,(Value, Rewards and Value)Cash) and co-branded cardscard portfolios (including Costco and American Airlines) within Branded cards,Cards, and co-brand and private label relationships within Retail servicesServices (including, among others, Best Buy, The Home Depot, Best Buy, SearsMacy’s and Macy’s)Sears). U.S. Personal BankingUSPB also includes Retail banking,Banking, which provides traditional banking services to retail and small business customers.
At March 31, 2024, USPB had 645 retail bank branches concentrated in the six key metropolitan areas of New York, Chicago, Los Angeles, San Francisco, Miami and Washington, D.C. USPB had $159 billion in outstanding credit card balances, $100 billion in deposits, $41 billion in mortgages and $5 billion in personal and small business loans. For additional information on USPB’s end-of-period consumer loan portfolios and metrics, see “Managing Global Risk—Credit Risk—Consumer Credit” below.
| | | | | | | | | | | | | | |
| First Quarter | | | |
| In millions of dollars, except as otherwise noted | 2024 | 2023 | % Change | | | |
| Net interest income | $ | 5,226 | | $ | 4,854 | | 8 | % | | | |
| Fee revenue | | | | | | |
| Interchange fees | 2,352 | | 2,277 | | 3 | | | | |
| Card rewards and partner payments | (2,580) | | (2,590) | | — | | | | |
| Other | 105 | | 104 | | 1 | | | | |
| Total fee revenue | $ | (123) | | $ | (209) | | 41 | % | | | |
| All other | 75 | | 66 | | 14 | | | | |
| Total non-interest revenue | $ | (48) | | $ | (143) | | 66 | % | | | |
| Total revenues, net of interest expense | 5,178 | | 4,711 | | 10 | | | | |
| Total operating expenses | $ | 2,519 | | $ | 2,529 | | — | % | | | |
| Net credit losses on loans | 1,864 | | 1,074 | | 74 | | | | |
| Credit reserve build (release) for loans | 337 | | 576 | | (41) | | | | |
| Provision for credit losses on unfunded lending commitments | — | | — | | — | | | | |
| Provisions for benefits and claims (PBC), and other assets | 3 | | (1) | | NM | | | |
| Provisions for credit losses and PBC | $ | 2,204 | | $ | 1,649 | | 34 | % | | | |
| Income from continuing operations before taxes | $ | 455 | | $ | 533 | | (15) | % | | | |
| Income taxes | 108 | | 131 | | (18) | | | | |
| Income from continuing operations | $ | 347 | | $ | 402 | | (14) | % | | | |
| Noncontrolling interests | — | | — | | — | | | | |
| Net income | $ | 347 | | $ | 402 | | (14) | % | | | |
Balance Sheet data (in billions of dollars) | | | | | | |
| EOP assets | $ | 237 | | $ | 228 | | 4 | % | | | |
| Average assets | 233 | | 231 | | 1 | | | | |
| Efficiency ratio | 49 | % | 54 | % | | | | |
| Revenue by component | | | | | | |
| Branded Cards | $ | 2,640 | | $ | 2,472 | | 7 | % | | | |
| Retail Services | 1,900 | | 1,610 | | 18 | | | | |
| Retail Banking | 638 | | 629 | | 1 | | | | |
| Total | $ | 5,178 | | $ | 4,711 | | 10 | % | | | |
Average loans and deposits (in billions of dollars) | | | | | | |
| Average loans | $ | 204 | | $ | 184 | | 11 | % | | | |
ACLL as a percentage of EOP loans(1) | 6.58 | % | 6.62 | % | | | | |
| Average deposits | 100 | | 111 | | (10) | | | | |
(1) Excludes loans that are carried at fair value for all periods.
NM Not meaningful
1Q24 vs. 1Q23
Net income was $347 million, compared to $402 million in the prior-year period, reflecting higher cost of credit, partially offset by higher revenues.
Revenues increased 10%, due to higher net interest income (up 8%), largely driven by strong loan growth in cards, as well as higher non-interest revenue (up 66%). The increase in non-interest revenue was largely driven by lower partner payments in Retail Services, due to higher net credit losses.
Cards revenues increased 11%. Branded Cards revenues increased 7%, primarily driven by the higher net interest income, reflecting the strong loan growth. Branded Cards average loans increased 11%, reflecting the higher card spend volumes and lower card payment rates. Branded Cards card spend volumes increased 4%, driven by more affluent customers.
Retail Services revenues increased 18%, primarily driven by higher non-interest revenue due to the lower partner payments, driven by higher net credit losses (see “Provisions” below and Note 5), as well as higher net interest income on higher loan balances. Retail Services average loans increased 6%, largely reflecting lower card payment rates, and credit card spend volumes decreased 4%, primarily due to lower in-store foot traffic.
Retail Banking revenues increased 1%, primarily driven by the higher deposit spreads, loan growth and improved mortgage margins, largely offset by the impact of the transfer of certain relationships and the associated deposit balances to Wealth. Average mortgage loans increased 18%, primarily driven by lower refinancings due to high interest rates and mortgage originations exceeding prepayments. Average deposits decreased 10%, largely reflecting the transfer of certain relationships and the associated deposit balances to Wealth ($16 billion over the last 12 months).
Expenses were largely unchanged, as lower compensation costs were offset by higher repositioning costs and volume-related expenses.
Provisions were $2.2 billion, compared to $1.6 billion in the prior-year period, largely driven by higher net credit losses, partially offset by a lower ACL build for loans. Net credit losses increased 74%, primarily reflecting the continued maturation of cards loan vintages originated during the pandemic, with delayed losses due to unprecedented levels of government stimulus, as well as macroeconomic pressures related to the higher inflationary and interest rate environment impacting both cards portfolios. Branded Cards net credit losses were up 87% to $1 billion and Retail Services net credit losses were up 65% to $0.8 billion.
The net ACL build was $0.3 billion, compared to $0.6 billion in the prior-year period. The net ACL build in the current quarter primarily reflected the impact of macroeconomic pressures related to the higher inflationary and interest rate environment and the seasonal mix shift from transactors to revolvers, partially offset by lower end-of-period cards balances. For additional information on Citi’s ACL, see “Significant Accounting Policies and Significant Estimates” below.
For additional information on USPB’s Branded Cards, Retail Services and Retail Banking loan portfolios, see “Managing Global Risk—Credit Risk—Consumer Credit” below.
For additional information about trends, uncertainties and risks related to USPB’s future results, see “Executive Summary” above and “Risk Factors—Strategic Risks” in Citi’s 2023 Form 10-K.
Wealth includes Private bank,Bank, Wealth at Work and Citigold and provides financial services to clients froma range of client segments including affluent, to ultra-high-net-worthhigh net worth and ultra-high net worth clients through banking, lending, mortgages, investment, custody and trust product offerings in 20 countries, including the U.S., Mexico and four wealth management centers: Singapore, Hong Kong, the UAE and London. Private Bank provides financial services to ultra-high net worth clients through customized product offerings. Wealth at Work provides financial services to professional industries (including law firms, consulting groups, accounting and asset management) through tailored solutions. Citigold includes Citigold and Citigold Private Clients, which both provide financial services to affluent and high net worth clients through elevated product offerings and financial relationships.
At June 30, 2023, U.S. Personal BankingMarch 31, 2024, Wealth had 653 retail bank branches concentrated in the six key metropolitan areas of New York, Chicago, Los Angeles, San Francisco, Miami and Washington, D.C. U.S. Personal Banking had $153 billion in outstanding credit card balances, $112$323 billion in deposits $38and $149 billion in mortgages and $4 billion in personal and small business loans. Global Wealth had $315 billion in deposits, $87loans, including $90 billion in mortgage loans, $59$27 billion in margin loans, $27 billion in personal and small business loans and $5 billion in outstanding credit card balances. For additional information on Wealth’s end-of-period consumer loan portfolios and metrics, see “Managing Global Risk—Credit Risk—Consumer Credit” below.
| | Second Quarter | | Six Months | |
| First Quarter | |
| First Quarter | |
| First Quarter | |
| In millions of dollars, except as otherwise noted | |
| In millions of dollars, except as otherwise noted | |
| In millions of dollars, except as otherwise noted | In millions of dollars, except as otherwise noted | 2023 | 2022 | % Change | 2023 | 2022 | % Change |
| Net interest income | Net interest income | $ | 5,963 | | $ | 5,569 | | 7 | % | $ | 11,897 | | $ | 10,954 | | 9 | % |
| Non-interest revenue | 432 | | 460 | | (6) | | 946 | | 980 | | (3) | |
| Net interest income | |
| Net interest income | |
| Fee revenue | |
| Fee revenue | |
| Fee revenue | |
| Commissions and fees | |
| Commissions and fees | |
| Commissions and fees | |
| Other | |
| Other | |
| Other | |
| Total fee revenue | |
| Total fee revenue | |
| Total fee revenue | |
| All other | |
| All other | |
| All other | |
| Total non-interest revenue | |
| Total non-interest revenue | |
| Total non-interest revenue | |
| Total revenues, net of interest expense | |
| Total revenues, net of interest expense | |
| Total revenues, net of interest expense | Total revenues, net of interest expense | $ | 6,395 | | $ | 6,029 | | 6 | % | $ | 12,843 | | $ | 11,934 | | 8 | % |
| Total operating expenses | Total operating expenses | $ | 4,204 | | $ | 3,985 | | 5 | % | $ | 8,458 | | $ | 7,874 | | 7 | % |
| Total operating expenses | |
| Total operating expenses | |
| Net credit losses on loans | |
| Net credit losses on loans | |
| Net credit losses on loans | Net credit losses on loans | $ | 1,241 | | $ | 699 | | 78 | % | $ | 2,335 | | $ | 1,390 | | 68 | % |
| Credit reserve build (release) for loans | Credit reserve build (release) for loans | 333 | | 638 | | (48) | | 840 | | (424) | | NM |
| Credit reserve build (release) for loans | |
| Credit reserve build (release) for loans | |
| Provision (release) for credit losses on unfunded lending commitments | |
| Provision (release) for credit losses on unfunded lending commitments | |
| Provision (release) for credit losses on unfunded lending commitments | Provision (release) for credit losses on unfunded lending commitments | 2 | | 13 | | (85) | | (4) | | 11 | | NM |
| Provisions for benefits and claims (PBC), and other assets | Provisions for benefits and claims (PBC), and other assets | 3 | | 5 | | (40) | | (1) | | 2 | | NM |
| Provisions for benefits and claims (PBC), and other assets | |
| Provisions for benefits and claims (PBC), and other assets | |
| Provisions (releases) for credit losses and PBC | |
| Provisions (releases) for credit losses and PBC | |
| Provisions (releases) for credit losses and PBC | Provisions (releases) for credit losses and PBC | $ | 1,579 | | $ | 1,355 | | 17 | % | $ | 3,170 | | $ | 979 | | NM |
| Income from continuing operations before taxes | Income from continuing operations before taxes | $ | 612 | | $ | 689 | | (11) | % | $ | 1,215 | | $ | 3,081 | | (61) | % |
| Income from continuing operations before taxes | |
| Income from continuing operations before taxes | |
| Income taxes | |
| Income taxes | |
| Income taxes | Income taxes | 118 | | 136 | | (13) | | 232 | | 668 | | (65) | |
| Income from continuing operations | Income from continuing operations | $ | 494 | | $ | 553 | | (11) | % | $ | 983 | | $ | 2,413 | | (59) | % |
| Income from continuing operations | |
| Income from continuing operations | |
| Noncontrolling interests | |
| Noncontrolling interests | |
| Noncontrolling interests | Noncontrolling interests | — | | — | | — | | — | | — | | — | |
| Net income | Net income | $ | 494 | | $ | 553 | | (11) | % | $ | 983 | | $ | 2,413 | | (59) | % |
| Net income | |
| Net income | |
Balance Sheet data (in billions of dollars) | |
Balance Sheet data (in billions of dollars) | |
Balance Sheet data (in billions of dollars) | Balance Sheet data (in billions of dollars) | | | |
| EOP assets | EOP assets | $ | 473 | | $ | 479 | | (1) | % | | |
| EOP assets | |
| EOP assets | |
| Average assets | Average assets | 484 | | 474 | | 2 | | $ | 490 | | $ | 474 | | 3 | % |
| Average loans | 339 | | 317 | | 7 | | 336 | | 315 | | 7 | |
| Average deposits | 431 | | 435 | | (1) | | 433 | | 441 | | (2) | |
| Average assets | |
| Average assets | |
| Efficiency ratio | Efficiency ratio | 66 | % | 66 | % | | 66 | % | 66 | % | |
| Net credit losses as a percentage of average loans | 1.47 | | 0.88 | | | 1.40 | | 0.89 | | |
| Revenue by reporting unit and component | | | |
| Branded cards | $ | 2,352 | | $ | 2,168 | | 8 | % | $ | 4,818 | | $ | 4,258 | | 13 | % |
| Retail services | 1,646 | | 1,300 | | 27 | | 3,259 | | 2,599 | | 25 | |
| Retail banking | 594 | | 656 | | (9) | | 1,207 | | 1,251 | | (4) | |
| U.S. Personal Banking | $ | 4,592 | | $ | 4,124 | | 11 | % | $ | 9,284 | | $ | 8,108 | | 15 | % |
| Private bank | $ | 605 | | $ | 745 | | (19) | % | $ | 1,172 | | $ | 1,524 | | (23) | % |
| Efficiency ratio | |
| Efficiency ratio | |
| Revenue by component | |
| Revenue by component | |
| Revenue by component | |
| Private Bank | |
| Private Bank | |
| Private Bank | |
| Wealth at Work | |
| Wealth at Work | |
| Wealth at Work | Wealth at Work | 224 | | 170 | | 32 | | 417 | | 353 | | 18 | |
| Citigold | Citigold | 974 | | 990 | | (2) | | 1,970 | | 1,949 | | 1 | |
| Global Wealth | $ | 1,803 | | $ | 1,905 | | (5) | % | $ | 3,559 | | $ | 3,826 | | (7) | % |
| Citigold | |
| Citigold | |
| Total | Total | $ | 6,395 | | $ | 6,029 | | 6 | % | $ | 12,843 | | $ | 11,934 | | 8 | % |
| Total | |
| Total | |
| Revenue by geography | |
| Revenue by geography | |
| Revenue by geography | |
| North America | |
| North America | |
| North America | |
| International | |
| International | |
| International | |
| Total | |
| Total | |
| Total | |
Key drivers(1) (in billions of dollars) | |
Key drivers(1) (in billions of dollars) | |
Key drivers(1) (in billions of dollars) | |
| EOP client balances | |
| EOP client balances | |
| EOP client balances | |
Client investment assets(2) | |
Client investment assets(2) | |
Client investment assets(2) | |
| Deposits | |
| Deposits | |
| Deposits | |
| Loans | |
| Loans | |
| Loans | |
| Total | |
| Total | |
| Total | |
| ACLL as a percentage of EOP loans | |
| ACLL as a percentage of EOP loans | |
| ACLL as a percentage of EOP loans | |
(1) Management uses this information in reviewing the segment’s results and believes it is useful to investors concerning underlying segment performance and trends.
(2) Includes assets under management, and trust and custody assets.
NM Not meaningful
2Q231Q24 vs. 2Q221Q23
Net income was $494of $150 million compared to $553$159 million in the prior-year period, driven by higher cost of creditas lower revenues and higher expenses partiallywere largely offset by higher revenues.lower cost of credit.
Revenues increased 6%decreased 4%, primarily due to higherlargely driven by lower net interest income driven by strong loan growth across U.S. Personal Banking.(down 13%), due to lower deposit spreads and higher mortgage funding costs. The increasedecrease in revenues was partially offset by loweran increase in non-interest revenue primarily reflecting lower(up 11%), largely driven by higher investment product revenues in Global Wealth.fee revenues.
U.S. Personal Banking revenuesClient balances increased 11%, reflecting higher revenues in cards, partially offset by lower revenues in Retail banking.
Cards revenues increased 15%. Branded cards revenues increased 8%6%, primarily driven by higher client investment assets (up 12%) across regions, reflecting the benefit of higher market valuations and net interest income, reflecting strength in underlying drivers. Branded cards new account acquisitions increased 6% and card spend volumes increased 4%. investment asset flows.
Average loans increased 14%, reflectingwere largely unchanged, as the higher card spend volumes and lower payment rates.
Retail services revenues increased 27%, primarily driven by higher net interest income on higher loan balances and lower partner payments. Retail services card spend volumes decreased 5%, primarily driven by lower discretionary retail spend. Average loans increased 9%, reflecting lower payment rates, partially offset by the lower card spend volumes.
Retail banking revenues decreased 9%, primarily driven by the impact of the transfer of certain relationships and the associated deposit balancesbusiness continued to Global Wealth. Average loans increased 17%, primarily driven by higher mortgage originations.optimize regulatory capital usage. Average deposits decreased 3%1%, largelyprimarily reflecting the transfer of certain relationshipslower deposits in Private Bank and Wealth at Work and the associated deposit balancescontinued transfers to Global Wealth.
Global Wealth revenues decreased 5%,higher-yielding investments on Citi’s platform. This decrease in deposits was largely reflecting investment product revenue headwinds and lower net interest income, partially offset by the benefits of the transfer of certain relationships and the associated deposit balances from Retail banking. Average deposits and average loans were largely unchanged. Client assetsUSPB ($16 billion over the last 12 months).
Private Bank revenues increased 5%1%, primarily driven by increases in market valuations. Client advisors decreased 1%, reflecting the re-pacing of strategic hiring. Private bankimproved deposit spreads and investment fee revenues, decreased 19%, drivenlargely offset by the investment product revenue headwinds and higher interest rates paid on deposits. mortgage funding costs.
Wealth at Work revenues increased 32%, driven by strong lending results, primarily in mortgages, and Citigold revenues decreased 2%6%, driven by the lower net interest incomedeposit spreads and the higher mortgage funding costs, partially offset by the higher investment fee revenues.
Citigold revenues decreased 6%, driven by the lower deposit spreads, partially offset by the higher investment product revenue.fee revenues and higher deposit volumes.
Expenses increased 5%3%, largelyprimarily driven by technology investments focused on risk and controls investments,and platform enhancements, partially offset by productivity savings.initial benefits from repositioning and restructuring actions.
Provisionswere $1.6 billion,a benefit of $170 million, compared to $1.4 billiona benefit of $58 million in the prior-year period, largely driven by a higher net credit losses, partially offsetACL release.
The highernet ACL release was primarily driven by a lower netchange in ACL build for loans. Net credit losses increased 78%, reflecting ongoing normalization in U.S. cards from near historically low levels,associated with Branded cards net credit losses up 87% to $614 million and Retail services net credit losses up 88% to $545 million. Both Branded cards and Retail services net credit losses are expected to normalize by the end of 2023.
The net ACL build was $0.3 billion, compared to $0.7 billion in the prior-year period, primarily reflecting growth in U.S. cards balances.margin lending portfolio. For additional information on Citi’sCiti's ACL, see “Significant Accounting Policies and Significant Estimates” below.
For additional information on U.S. Personal Banking’s Branded cards, Retail services and Retail bankingWealth’sloan portfolios, see “Credit“Managing Global Risk—Credit Risk—Consumer Credit” below.
For additional information about trends, uncertainties and risks related to PBWMWealth’s future results, see “Executive Summary” above and “Forward-Looking Statements” below, and “Risk Factors—Strategic Risks” in Citi’s 20222023 Form 10-K.
2Q23 YTD vs. 2Q22 YTD
ALL OTHER—Divestiture-Related Impacts (Reconciling Items)
Year-to-date,
PBWMAll Other experienced similar trendsincludes activities not assigned to those described above. Net income was $983 million, compared to $2.4 billionthe reportable operating segments (Services, Markets, Banking, USPB and Wealth), including Legacy Franchises and Corporate/Other. For additional information about Legacy Franchises and Corporate/Other, see “All Other (Managed Basis)” below.
All Other (managed basis) results exclude divestiture-related impacts (see the “Reconciling Items” column in the prior-year period, largely driven by higher costtable below) related to (i) Citi’s divestitures of creditits Asia consumer banking businesses and higher expenses, partially offset by higher revenues.(ii) the planned IPO of Mexico consumer banking and small business and middle-market banking, within Legacy Franchises. Legacy Franchises (managed basis) results also exclude these divestiture-related impacts. Certain of the results of operations of All Other (managed basis) and Legacy Franchises (managed basis) are non-GAAP financial measures (see “Overview—Non-GAAP Financial Measures” above).
RevenuesThe table below presents a reconciliation from All Other increased 8%(U.S. GAAP) to All Other (managed basis). All Other (U.S. GAAP), largely due to higher revenuesless Reconciling Items, equals All Other (managed basis). The Reconciling Items are fully reflected on each respective line item in U.S. Personal Banking. U.S. Personal Banking revenues increased 15%, reflecting higher revenues in cards, largely driven by the same factors described above. Global Wealth revenues decreased 7%, largely driven by the same factors described above.Citi’s Consolidated Statement of Income.
Expenses
| | | | | | | | | | | | | | | | | | | | |
| First Quarter |
| 2024 | 2023 |
| In millions of dollars, except as otherwise noted | All Other
(U.S. GAAP) | Reconciling Items(1) | All Other
(managed basis) | All Other
(U.S. GAAP) | Reconciling Items(2) | All Other
(managed basis) |
| Net interest income | $ | 1,698 | | $ | — | | $ | 1,698 | | $ | 2,185 | | $ | — | | $ | 2,185 | |
| Non-interest revenue | 675 | | (12) | | 687 | | 1,450 | | 1,018 | | 432 | |
| Total revenues, net of interest expense | $ | 2,373 | | $ | (12) | | $ | 2,385 | | $ | 3,635 | | $ | 1,018 | | $ | 2,617 | |
| Total operating expenses | $ | 2,778 | | $ | 110 | | $ | 2,668 | | $ | 2,327 | | $ | 73 | | $ | 2,254 | |
| Net credit losses on loans | 260 | | 11 | | 249 | | 186 | | (12) | | 198 | |
| Credit reserve build (release) for loans | (93) | | — | | (93) | | (14) | | 3 | | (17) | |
| Provision for credit losses on unfunded lending commitments | (5) | | — | | (5) | | (20) | | 1 | | (21) | |
| Provisions for benefits and claims (PBC), other assets and HTM debt securities | 34 | | — | | 34 | | 286 | | — | | 286 | |
| Provisions (benefits) for credit losses and PBC | $ | 196 | | $ | 11 | | $ | 185 | | $ | 438 | | $ | (8) | | $ | 446 | |
| Income (loss) from continuing operations before taxes | $ | (601) | | $ | (133) | | $ | (468) | | $ | 870 | | $ | 953 | | $ | (83) | |
| Income taxes (benefits) | (44) | | (39) | | (5) | | 14 | | 305 | | (291) | |
| Income (loss) from continuing operations | $ | (557) | | $ | (94) | | $ | (463) | | $ | 856 | | $ | 648 | | $ | 208 | |
| Income (loss) from discontinued operations, net of taxes | (1) | | — | | (1) | | (1) | | — | | (1) | |
| Noncontrolling interests | (7) | | — | | (7) | | 9 | | — | | 9 | |
| Net income (loss) | $ | (551) | | $ | (94) | | $ | (457) | | $ | 846 | | $ | 648 | | $ | 198 | |
| Asia Consumer revenues | $ | 242 | | $ | (12) | | $ | 254 | | $ | 1,521 | | $ | 1,018 | | $ | 503 | |
| |
| | |
| | | | | | |
| | | | | | |
| | | | | | |
| | | | | | |
| | | | | | |
| | | | | | |
| | | | | | |
| | | | | | |
| | | | | | |
| | | | | | |
| | | | | | |
| | | | | | |
| | | | | | |
| | | | | | |
| | | | | | |
| | | | | | |
| | | | | | |
increased 7%
(1) The first quarter of 2024 includes approximately $110 million in operating expenses (approximately $77 million after-tax), primarily driven by continued investmentsrelated to separation costs in Citi’s transformation, other risk and controls investmentsMexico and severance costs partially offset by productivity savings.
Provisions were $3.2 billion, compared to $1.0 billion in the prior-yearAsia exit markets.
(2) The first quarter of 2023 includes an approximate $1.059 billion gain on sale recorded in revenue (approximately $727 million after various taxes) related to Citi’s sale of the India consumer banking business. For additional information, see Citi’s Quarterly Report on Form 10-Q for the period due to a net ACL build for loans, as well as higher net credit losses, primarily driven by ongoing normalization in U.S. cards.
The net ACL build was $0.8 billion, primarily driven by U.S. cards loan growth, compared to a release of $0.4 billion in the prior-year period.
LEGACY FRANCHISESALL OTHER—Managed Basis
As of June 30, 2023,At March 31, 2024, Legacy FranchisesAll Other included (i)(managed basis) had $200 billion in assets, primarily related to Mexico Consumer/SBMM and Asia Consumer Banking (Asia Consumer)reported within Legacy Franchises (managed basis), representingas well as Corporate Treasury investment securities and the consumer banking operations of the remaining six Asia and EMEA exit countries, (ii)Company’s deferred tax assets (DTAs) reported within Corporate/Other.
Legacy Franchises (Managed Basis)
Legacy Franchises (managed basis) includes (i) Mexico Consumer Banking (Mexico Consumer) and Mexico Small Business and Middle-Market Banking (Mexico SBMM), collectively Mexico Consumer/SBMM, (ii) Asia Consumer Banking (Asia Consumer), representing the consumer banking operations of the remaining four exit countries (Korea, Poland, China and Russia), and (iii) Legacy Holdings Assets, (certain North Americaprimarily legacy consumer mortgage loans and other legacy assets). Asia Consumer provides traditional retail banking and branded card productsin North America that the Company continues to retail and small business customers. wind down.
Mexico Consumer/SBMM operates in Mexico through Citibanamex and provides traditional retail banking and branded card products to consumers and small business customers and traditional middle-market banking products and services to commercial customers through Citibanamex.
Legacy Franchises also included the following seven consumer banking businesses prior to their sale: Australia, until its closing on June 1, 2022; the Philippines, until its closing on August 1, 2022; Thailand and Malaysia, until their closings on November 1, 2022; Bahrain, until its closing on December 1, 2022; and India and Vietnam, until their closings on March 1, 2023.
In addition,customers. As previously disclosed, Citi has entered into agreements to sell its consumer banking businesses in Indonesia and Taiwan, and has continued to make progress on its wind-downs of consumer banking operations in Korea and China and consumer banking and local commercial banking operations in Russia (see below). See Note 2 for additional information on Legacy Franchises’ consumer banking business sales and wind-downs.
In May 2023, Citi announced it intends to pursue an IPO of its consumer, small business and middle-market banking operations in Mexico. Citi will retain its ICGServices, Markets, Banking and Private bankWealth businesses in Mexico. Citi currently expects that the separation of the businesses will be completed in the second half of 2024 and that the IPO will take place in 2025.
Legacy Franchises (managed basis) also included the following four Asia Consumer businesses prior to their sales: India and Vietnam, until their closings in March 2023; Taiwan, until its closing in August 2023; and Indonesia until its closing in November 2023.
Citi has continued to make progress on its wind-downs in China, Korea and Russia, including in October 2023, when Citi announced the signing of an agreement to sell its onshore consumer wealth business in China. In connection with Citi’s wind-downaddition, Citi has restarted the sales process of its consumer and local commercial banking businessesbusiness in Russia, Citi expects to incur approximately $140 million in total estimated charges (excluding the impact from any portfolio sales) related toPoland. See Note 2 for additional information on Legacy Franchises. Citi’s previously disclosed referral agreement with a Russian bank to settle a portfolio of ruble-denominated credit card loans, subject to customer consents, was signed in May 2023. The outstanding card loan balances with Citi ($131 million as of June 30, 2023) are to be settled upon referralFranchises’ consumer banking business sales and refinancing, and the portfolio has not been designated as held-for-sale (HFS).wind-downs. For additional information about Citi’s continued efforts to reduce its operations and exposures in Russia, see “Institutional Clients Group” above and “Managing Global Risk—Other Risks—Country Risk—Russia” below as well asand “Risk Factors” in Citi’s 20222023 Form 10-K.
At June 30, 2023,March 31, 2024, on a combined basis, Legacy Franchises (managed basis) had 1,4131,343 retail branches, $21$20 billion in retail banking loans and $53$50 billion in deposits. In addition, the businessesLegacy Franchises (managed basis) had $9 billion in outstanding card loan balances, andwhile Mexico SBMM had $8$6 billion in outstanding corporate loan balances. These loan and deposit amounts exclude approximately $8 billion of loans ($7 billion of retail banking loans and $1 billion of credit card loan balances) and approximately $11 billion of deposits, all of which were reclassified to HFS (e.g., as Other assets and Other liabilities on the Consolidated Balance Sheet) as a result of Citi’s entry into agreements to sell certain remaining consumer banking businesses. See Note 2 for additional information.
| | | | | | | | | | | | | | | | | | | | |
| Second Quarter | | Six Months | % Change |
| In millions of dollars, except as otherwise noted | 2023 | 2022 | % Change | 2023 | 2022 |
| Net interest income | $ | 1,345 | | $ | 1,474 | | (9) | % | $ | 2,635 | | $ | 2,982 | | (12) | % |
| Non-interest revenue | 578 | | 461 | | 25 | | 2,140 | | 884 | | NM |
| Total revenues, net of interest expense | $ | 1,923 | | $ | 1,935 | | (1) | % | $ | 4,775 | | $ | 3,866 | | 24 | % |
| Total operating expenses | $ | 1,778 | | $ | 1,814 | | (2) | % | $ | 3,530 | | $ | 4,107 | | (14) | % |
| Net credit losses on loans | $ | 190 | | $ | 133 | | 43 | % | $ | 376 | | $ | 284 | | 32 | % |
| Credit reserve build (release) for loans | 74 | | (28) | | NM | 77 | | (174) | | NM |
| Provision (release) for credit losses on unfunded lending commitments | (10) | | (3) | | NM | (28) | | 121 | | NM |
| Provisions for benefits and claims (PBC), HTM debt securities and other assets | 46 | | 19 | | NM | 220 | | 50 | | NM |
| Provisions (releases) for credit losses and PBC | $ | 300 | | $ | 121 | | NM | $ | 645 | | $ | 281 | | NM |
| Income (loss) from continuing operations before taxes | $ | (155) | | $ | — | | — | % | $ | 600 | | $ | (522) | | NM |
| Income taxes | (33) | | 15 | | NM | 116 | | (122) | | NM |
| Income (loss) from continuing operations | $ | (122) | | $ | (15) | | NM | $ | 484 | | $ | (400) | | NM |
| Noncontrolling interests | 3 | | 2 | | 50 | % | 5 | | — | | — | % |
| Net income (loss) | $ | (125) | | $ | (17) | | NM | $ | 479 | | $ | (400) | | NM |
Balance Sheet data (in billions of dollars) | | | | | | |
| EOP assets | $ | 92 | | $ | 108 | | (15) | % | | | |
| Average assets | 92 | | 115 | | (20) | | $ | 95 | | $ | 120 | | (21) | % |
| EOP loans | 38 | | 41 | | (7) | | | | |
| EOP deposits | 53 | | 53 | | 1 | | | | |
| | | | | | | | | | | | | | | | | | | | |
| Efficiency ratio | 92 | % | 94 | % | | 74 | % | 106 | % | |
| Revenue by reporting unit and component | | | | | | |
| Asia Consumer | $ | 454 | | $ | 880 | | (48) | % | $ | 1,963 | | $ | 1,667 | | 18 | % |
| Mexico Consumer/SBMM | 1,449 | | 1,184 | | 22 | | 2,771 | | 2,323 | | 19 | |
| Legacy Holdings Assets | 20 | | (129) | | NM | 41 | | (124) | | NM |
| Total | $ | 1,923 | | $ | 1,935 | | (1) | % | $ | 4,775 | | $ | 3,866 | | 24 | % |
NM Not meaningful
2Q23 vs. 2Q22
Net loss was $125 million, compared to a net loss of $17 million in the prior-year period, driven by higher cost of credit, partially offset by lower expenses.
Results for the second quarter of 2023 included divestiture-related impacts of $(73) million in earnings before taxes ($(52) million after-tax), reflecting the following:
•$(6) million of aggregate divestiture-related revenue impacts
•$79 million of aggregate divestiture-related expenses, largely relating to separation costs in Mexico and severance costs in the Asia exit markets
•$(12) million benefit of divestiture-related credit costs
•$(21) million of related tax benefits
Results for the second quarter of 2022 included divestiture-related impacts of $48 million ($35 million after-tax), reflecting the following:
•$78 million of aggregate divestiture-related revenue impacts, including a $20 million reduction of the loss on sale for the Australia consumer business
•$(28) million benefit recorded in expenses related to the Korea Voluntary Early Retirement Program (VERP) pension settlement
•$58 million of divestiture-related credit costs
•$13 million of related taxes
Revenues decreased 1%, driven by lower revenues in Asia Consumer, partially offset by higher revenues in Mexico Consumer/SBMM and Legacy Holdings Assets.
Asia Consumer revenues of $454 million decreased from $880 million in the prior-year period, mainly driven by the reduction from exited markets and continued wind-downs.
Mexico Consumer/SBMM revenues increased 22%, as cards revenues increased 38%, SBMM revenues increased 25% and retail banking revenues increased 16%, primarily due to higher interest rates and higher lending volumes.
Legacy Holdings Assets revenues of $20 million increased from $(129) million in the prior-year period, largely driven by a release of a CTA loss (net of hedges) recorded in AOCI in the second quarter of 2022.
Expenses decreased 2%, mainly driven by the impact of the exited markets and continued wind-downs.
Provisions were $300 million, compared to $121 million in the prior-year period, primarily driven by higher net credit losses and a net ACL build. Net credit losses increased 43% to $190 million, driven by higher lending volumes in Mexico Consumer. The build for credit losses was $110 million,
compared to a release of $12 million in the prior-year period, primarily due to higher lending volumes in Mexico Consumer.
For additional information about trends, uncertainties and risks related to Legacy Franchises’ future results, see “Executive Summary” above, “Managing Global Risk—Other Risks—Country Risk—Russia” and “Forward-Looking Statements” below and “Risk Factors—Strategic Risks” in Citi’s 2022 Form 10-K.
2Q23 YTD vs. 2Q22 YTD
Net income was $479 million, compared to a net loss of $400 million in the prior-year period, driven by higher revenues and lower expenses, partially offset by higher cost of credit.
Results for year-to-date 2023 included divestiture-related impacts of approximately $880 million (approximately $596 million after-tax), reflecting the following:
•$1,012 million of net divestiture gains, primarily related to a gain on sale of the India consumer banking business, recorded in other revenue
•$152 million of aggregate divestiture-related expenses
•$(20) million benefit of divestiture-related credit costs
•$284 million of related taxes
Results for year-to-date 2022 included divestiture-related impacts of approximately $(629) million (approximately $(553) million after-tax), primarily reflecting the following:
•$(98) million pretax loss primarily reflecting an ACL release of $(104) million related to the Australia consumer banking business sale
•$129 million cost of credit reclassification to revenues, as once a divestiture is classified as held-for-sale, credit costs, including ACL builds/releases and net credit losses, are reclassified to revenues
•$535 million goodwill impairment, recorded in expenses, due to the re-segmentation and sequencing of divestitures
•$(76) million of related tax benefits
Revenues increased 24%, driven by higher revenues in Asia Consumer, Mexico Consumer/SBMM and Legacy Holdings Assets.
Asia Consumer revenues increased 18%, primarily driven by the India gain on sale, partially offset by the reduction from exited markets and wind-downs. Mexico Consumer/SBMM revenues increased 19%, mainly due to the benefit of FX translation as well as higher interest rates and higher lending volumes. Legacy Holdings Assets revenues of $41 million increased from $(124) million in the prior-year period, primarily driven by the release of the CTA loss (net of hedges) recorded in AOCI in the second quarter of 2022.
Expenses decreased 14%, mainly driven by the absence of the goodwill impairment in the prior-year period and the benefit of the closed exit markets and wind-downs.
Provisions were $645 million, compared to $281 million in the prior-year period, driven by higher lending volumes and net credit losses in Mexico Consumer, and a build for transfer risk associated with exposures outside the U.S., driven by safety and soundness considerations under U.S. banking law.
CORPORATE/OTHER
Activities not assigned to the operating segments (ICG, PBWM and Legacy Franchises) are included in Corporate/Other.Corporate/Other includedincludes certain unallocated costs of global staff functions (including finance, risk, human resources, legal and compliance-related costs), other corporate expenses and unallocated global operations and technology expenses and income taxes, as well as results of Corporate Treasury investment activities and discontinued operations. At June 30, 2023, Corporate/Other had $94 billion in assets, including Corporate Treasury investment securities and the Company’s deferred tax assets (DTAs).
| | | | | | | | | | | | | | | | | | | | |
| Second Quarter | | Six Months | % Change |
| In millions of dollars | 2023 | 2022 | % Change | 2023 | 2022 |
| Net interest income | $ | 969 | | $ | 401 | | NM | $ | 2,065 | | $ | 595 | | NM |
| Non-interest revenue | (292) | | (146) | | (100) | % | (474) | | (150) | | NM |
| Total revenues, net of interest expense | $ | 677 | | $ | 255 | | NM | $ | 1,591 | | $ | 445 | | NM |
| Total operating expenses | $ | 302 | | $ | 160 | | 89 | % | $ | 612 | | $ | 420 | | 46 | % |
| Provisions for HTM debt securities and other assets | $ | (113) | | $ | — | | — | % | $ | (2) | | $ | — | | — | % |
| Income (loss) from continuing operations before taxes | $ | 488 | | $ | 95 | | NM | $ | 981 | | $ | 25 | | NM |
| Income taxes (benefits) | 127 | | (178) | | NM | 361 | | (440) | | NM |
| Income from continuing operations | $ | 361 | | $ | 273 | | 32 | % | $ | 620 | | $ | 465 | | 33 | % |
| Income (loss) from discontinued operations, net of taxes | (1) | | (221) | | 100 | | (2) | | (223) | | 99 | |
| Net income before attribution to noncontrolling interests | $ | 360 | | $ | 52 | | NM | $ | 618 | | $ | 242 | | NM |
| Noncontrolling interests | 4 | | 2 | | NM | 7 | | 3 | | NM |
| Net income | $ | 356 | | $ | 50 | | NM | $ | 611 | | $ | 239 | | NM |
| | | | | | | | | | | | | | |
| First Quarter | | | |
| In millions of dollars, except as otherwise noted | 2024 | 2023 | % Change | | |
| Net interest income | $ | 1,698 | | $ | 2,185 | | (22) | % | | | |
| Non-interest revenue | 687 | | 432 | | 59 | | | | |
| Total revenues, net of interest expense | $ | 2,385 | | $ | 2,617 | | (9) | % | | | |
| Total operating expenses | $ | 2,668 | | $ | 2,254 | | 18 | % | | | |
| Net credit losses on loans | 249 | | 198 | | 26 | | | | |
| Credit reserve build (release) for loans | (93) | | (17) | | NM | | | |
| Provision (release) for credit losses on unfunded lending commitments | (5) | | (21) | | 76 | | | | |
| Provisions for benefits and claims (PBC), other assets and HTM debt securities | 34 | | 286 | | (88) | | | | |
| Provisions for credit losses and PBC | $ | 185 | | $ | 446 | | (59) | % | | | |
| Income (loss) from continuing operations before taxes | $ | (468) | | $ | (83) | | NM | | | |
| Income taxes (benefits) | (5) | | (291) | | 98 | % | | | |
| Income (loss) from continuing operations | $ | (463) | | $ | 208 | | NM | | | |
| Income (loss) from discontinued operations, net of taxes | (1) | | (1) | | — | % | | | |
| Noncontrolling interests | (7) | | 9 | | NM | | | |
| Net income (loss) | $ | (457) | | $ | 198 | | NM | | | |
Balance Sheet data (in billions of dollars) | | | | | | |
| EOP assets | $ | 200 | | $ | 216 | | (7) | % | | | |
| Average assets | 196 | | 211 | | (7) | | | | |
| Revenue by reporting unit and component | | | | | | |
| Mexico Consumer/SBMM | $ | 1,571 | | $ | 1,294 | | 21 | % | | | |
| Asia Consumer | 254 | | 503 | | (50) | | | | |
| Legacy Holdings Assets | (11) | | 8 | | NM | | | |
| Corporate/Other | 571 | | 812 | | (30) | | | | |
| Total | $ | 2,385 | | $ | 2,617 | | (9) | % | | | |
Mexico Consumer/SBMM—key indicators (in billions of dollars) | | | | | | |
| EOP loans | $ | 26.0 | | $ | 22.0 | | 18 | % | | | |
| EOP deposits | 41.0 | | 36.7 | | 12 | | | | |
| Average loans | 25.0 | | 20.8 | | 20 | | | | |
| NCLs as a percentage of average loans (Mexico Consumer only) | 4.67 | % | 3.87 | % | | | | |
| Loans 90+ days past due as a percentage of EOP loans (Mexico Consumer only) | 1.32 | | 1.24 | | | | | |
| Loans 30–89 days past due as a percentage of EOP loans (Mexico Consumer only) | 1.33 | | 1.26 | | | | | |
Asia Consumer—key indicators(1) (in billions of dollars) | | | | | | |
| EOP loans | $ | 6.5 | | $ | 10.0 | | (35) | % | | | |
| EOP deposits | 9.0 | | 14.4 | | (38) | | | | |
| Average loans | 6.9 | | 12.1 | | (43) | | | | |
Legacy Holdings Assets—key indicators (in billions of dollars) | | | | | | |
| EOP loans | $ | 2.3 | | $ | 2.8 | | (18) | % | | | |
(1) The key indicators for Asia Consumer reflect the reclassification of loans and deposits to Other assets and Other liabilities under HFS accounting on Citi’s Consolidated Balance Sheet.
NM Not meaningful
2Q231Q24 vs. 2Q221Q23
Net incomeloss was $356$457 million, compared to $50 million in the prior-year period. The increase in net income was primarily driven by higher revenues, benefits from cost of credit and the prior-year release of a CTA loss (net of hedges) from AOCI (for additional information, see Note 2). These increases were partially offset by higher expenses and lower income tax benefits. Results for the quarter also included a $40 million withholding tax related to an exit market, which is a divestiture-related impact.
Revenues were $677 million, compared to $255$198 million in the prior-year period, driven by higher expenses, lower revenues and lower income tax benefits, partially offset by lower cost of credit.
All Other (managed basis) revenues decreased 9%, driven by lower revenues in Corporate/Other.
Legacy Franchises (managed basis) revenues were largely unchanged, as higher revenues in Mexico Consumer/SBMM (managed basis) were offset by lower revenues in Asia Consumer (managed basis).
Mexico Consumer/SBMM (managed basis) revenues increased 21%, as cards revenues in Mexico Consumer increased 27%, SBMM revenues increased 28% and retail banking revenues increased 18%, mainly due to higher deposit and loan volumes and Mexican peso appreciation.
Asia Consumer (managed basis) revenues decreased 50%, primarily driven by higher net interest income from the closed exits and wind-downs.
Deposits with banksCorporate/Other revenues and the investment portfolio, largely duedecreased to higher interest rates.
Expenses were $302$571 million, compared to $160$812 million in the prior-year period, driven by higher cost of funds.
Expenses increased 18%, primarily reflectingdriven by the impact of inflation, higher severance costsincremental FDIC special assessment and the restructuring charges (see Note 9), partially offset by lower expenses from closed exits and wind-downs.
Provisions were $185 million, compared to $446 million in the prior-year period, largely driven by the absence of certain settlements that occurreda net ACL build in the prior-year period, partially offset by lower consulting expenses.
Provisions were a $113 million benefit,higher net credit losses. Net credit losses increased 26%, primarily driven by a reserve release related to the repayment of the First Republic Bank deposit.higher lending volumes in Mexico Consumer.
For additional information on Citi’s ACL, see “Significant Accounting Policies and Significant Estimates” below.
For additional information about trends, uncertainties and risks related to Corporate/All Other’s (managed basis) future results, see “Executive Summary” above “Forward-Looking Statements”and “Managing Global Risk—Other Risks—Country Risk—Russia” below, and “Risk Factors—Strategic Risks”Factors” in Citi’s 20222023 Form 10-K.
2Q23 YTD vs. 2Q22 YTD
Year-to-date, Corporate/Other experienced similar trends to those described above. Net income was $611 million, compared to net income of $239 million in the prior-year period, largely driven by the same factors described above.
Revenues were $1.6 billion, compared to $445 million in the prior-year period, driven by the same factors described above.
Expenses were $612 million, compared to $420 million in the prior-year period, driven by the same factors described above.
Provisions were a $2 million benefit, as the reserve build for the First Republic Bank deposit in the first quarter of 2023 was released in the second quarter of 2023.
CAPITAL RESOURCES
For additional information about capital resources, including Citi’s capital management, regulatory capital buffers, the stress testing component of capital planning and current regulatory capital standards and developments, see “Capital Resources” and “Risk Factors” in Citi’s 20222023 Form 10-K.
During the secondfirst quarter of 2023,2024, Citi returned a total of $2.0$1.5 billion of capital to common shareholders in the form of $1.0 billion in dividends and $1.0$0.5 billion in share repurchases totaling approximately 21(approximately 8 million common shares.shares). For additional information, see “Unregistered Sales of Equity Securities, Repurchases of Equity Securities and Dividends” below.
Citi paid common dividends of $0.51$0.53 per share for the secondfirst quarter of 2023,2024, and on July 20, 2023,April 3, 2024, declared common dividends of $0.53 per share for the thirdsecond quarter of 2023.2024. Citi intends to maintain a quarterly common dividend of at least $0.53 per share, subject to financial and macroeconomic conditions as well as its Board of Directors’ approval. In addition, as previously announced, Citi will continue to assess common share repurchases on a quarter-by-quarter basis given uncertainty regarding regulatory capital requirements. For additional information, see “Capital Resources—Regulatory“Regulatory Capital Standards and Developments” below.
Common Equity Tier 1 Capital Ratio
Citi’s Common Equity Tier 1 (CET1) Capital ratio under the Basel III Standardized Approach was 13.5% as of March 31, 2024, compared to 13.4% as of June 30, 2023, largely unchanged from MarchDecember 31, 2023, relative to a required regulatory CET1 Capital ratio of 12.0%12.3% as of such dates under the Standardized Approach. This compares to a CET1 Capital ratio of 13.0% as of December 31, 2022, relative to a required regulatory CET1 Capital ratio of 11.5% as of such date under the Standardized Approach.
Citi’s CET1 Capital ratio under the Basel III Advanced Approaches was 12.5%12.0% as of June 30, 2023,March 31, 2024, compared to 12.3%12.1% as of MarchDecember 31, 2023, relative to a required regulatory CET1 Capital ratio of 10.5% as of such dates under the Advanced Approaches framework. This compares to a CET1 Capital ratio of 12.2% as of December 31, 2022, relative to a required regulatory CET1 Capital ratio of 10.0% as of such date under the Advanced Approaches.
Citi’s CET1 Capital ratio under the Standardized Approach remained largely unchanged from March 31, 2023, as the return of capital to common shareholders and an increase in RWA were offset by net income. Citi’s CET1 Capital ratio increased under the Advanced ApproachesStandardized Approach from MarchDecember 31, 2023, driven primarily by net income and a decrease in RWA, partially offset by the return of capital to common shareholders.
Citi’s CET1 Capital ratio increased under both the Standardized Approach and Advanced Approaches from year-end 2022, driven primarily by year-to-date net income of $7.5 billion,RWA, partially offset by the return of capital to common shareholders and higher deferred tax assets. Citi’s CET1 Capital ratio decreased under the Advanced Approaches from December 31, 2023, driven primarily by the return of capital to common shareholders, an increase in RWA.Advanced Approaches RWA and higher deferred tax assets, partially offset by net income.
Stress Capital Buffer
In July 2023, the FRB confirmed Citi’s Stress Capital Buffer (SCB) requirementAs of 4.3%, as compared to the current requirement of 4.0%, for the four-quarter window starting from October 1, 2023, to September 30, 2024.
Accordingly, effective October 1, 2023, Citi will beCiti’s required to maintain a 12.3%regulatory CET1 Capital ratio increased to 12.3% from 12.0% under the Standardized Approach, incorporating the 4.3% SCBStress Capital Buffer (SCB) through September 30, 2024 and itsCiti’s current GSIB surcharge of 3.5%. Citi’s required regulatory CET1 Capital ratio under the Advanced Approaches (using the fixed 2.5% Capital Conservation Buffer) will remainwas unchanged at 10.5%. The SCB applies to Citigroup only; the regulatory capital framework applicable to Citibank, including the Capital Conservation Buffer, is unaffected by Citigroup’s SCB.
For additional information regarding regulatory capital buffers, including the SCB and GSIB surcharge, see “Capital Resources—Regulatory Capital Buffers” in Citi’s 20222023 Form 10-K.
Citigroup’s Capital Resources
The following table presents Citi’s required risk-based capital ratios as of June 30, 2023, March 31, 20232024 and December 31, 2022:2023:
| | | | | | | | | | | | | | | | | | | | |
| Advanced Approaches | Standardized Approach |
| June 30,
2023 | March 31,
2023 | December 31,
2022 | June 30,
2023 | March 31,
2023 | December 31,
2022 |
CET1 Capital ratio(1) | 10.5 | % | 10.5 | % | 10.0 | % | 12.0 | % | 12.0 | % | 11.5 | % |
Tier 1 Capital ratio(1) | 12.0 | | 12.0 | | 11.5 | | 13.5 | | 13.5 | | 13.0 | |
Total Capital ratio(1) | 14.0 | | 14.0 | | 13.5 | | 15.5 | | 15.5 | | 15.0 | |
| | | | | | | | | | | | | | |
| Advanced Approaches | Standardized Approach(1) |
| March 31,
2024 | December 31,
2023 | March 31,
2024 | December 31,
2023 |
CET1 Capital ratio(2) | 10.5 | % | 10.5 | % | 12.3 | % | 12.3 | % |
Tier 1 Capital ratio(2) | 12.0 | | 12.0 | | 13.8 | | 13.8 | |
Total Capital ratio(2) | 14.0 | | 14.0 | | 15.8 | | 15.8 | |
(1)As of JanuaryOctober 1, 2023, Citi’s required regulatory CET1 Capital ratio increased from 12.0% to 12.3% under the Standardized Approach, incorporating the 4.3% SCB and its GSIB surcharge of 3.5%.
(2)Citi’s required risk-based capital ratios included the 4.0%4.3% SCB and 3.5% GSIB surcharge under the Standardized Approach, and the 2.5% Capital Conservation Buffer and 3.5% GSIB surcharge under the Advanced Approaches (all of which must be composed of CET1 Capital). These requirements are applicable through September 30, 2023. See “Stress Capital Buffer” above for more information.
The following tables present Citi’s capital components and ratios as of June 30, 2023, March 31, 20232024 and December 31, 2022:2023:
| | Advanced Approaches | Standardized Approach |
| Advanced Approaches | | | Advanced Approaches | Standardized Approach |
| In millions of dollars, except ratios | In millions of dollars, except ratios | June 30,
2023 | March 31,
2023 | December 31,
2022 | June 30,
2023 | March 31,
2023 | December 31,
2022 | In millions of dollars, except ratios | March 31,
2024 | December 31,
2023 | March 31,
2024 | December 31,
2023 |
CET1 Capital(1) | CET1 Capital(1) | $ | 154,243 | | $ | 153,753 | | $ | 148,930 | | $ | 154,243 | | $ | 153,753 | | $ | 148,930 | |
Tier 1 Capital(1) | Tier 1 Capital(1) | 175,743 | | 175,249 | | 169,145 | | 175,743 | | 175,249 | | 169,145 | |
Total Capital (Tier 1 Capital + Tier 2 Capital)(1) | Total Capital (Tier 1 Capital + Tier 2 Capital)(1) | 198,036 | | 194,998 | | 188,839 | | 206,852 | | 203,586 | | 197,543 | |
| Total Risk-Weighted Assets | Total Risk-Weighted Assets | 1,234,271 | | 1,252,390 | | 1,221,538 | | 1,153,450 | | 1,144,359 | | 1,142,985 | |
Credit Risk(1) | Credit Risk(1) | $ | 874,707 | | $ | 883,746 | | $ | 851,875 | | $ | 1,090,440 | | $ | 1,072,110 | | $ | 1,069,992 | |
| Market Risk | Market Risk | 62,261 | | 71,341 | | 71,889 | | 63,010 | | 72,249 | | 72,993 | |
| Operational Risk | Operational Risk | 297,303 | | 297,303 | | 297,774 | | — | | — | | — | |
CET1 Capital ratio(2) | CET1 Capital ratio(2) | 12.50 | % | 12.28 | % | 12.19 | % | 13.37 | % | 13.44 | % | 13.03 | % | CET1 Capital ratio(2) | 11.95 | % | 12.11 | % | 13.45 | % | 13.37 | % |
Tier 1 Capital ratio(2) | Tier 1 Capital ratio(2) | 14.24 | | 13.99 | | 13.85 | | 15.24 | | 15.31 | | 14.80 | |
Total Capital ratio(2) | Total Capital ratio(2) | 16.04 | | 15.57 | | 15.46 | | 17.93 | | 17.79 | | 17.28 | |
| | In millions of dollars, except ratios | In millions of dollars, except ratios | Required
Capital Ratios | June 30, 2023 | March 31, 2023 | December 31, 2022 | In millions of dollars, except ratios | Required
Capital Ratios | March 31, 2024 | December 31, 2023 |
Quarterly Adjusted Average Total Assets(1)(3) | Quarterly Adjusted Average Total Assets(1)(3) | | $ | 2,429,306 | | $ | 2,426,430 | | $ | 2,395,863 | |
Total Leverage Exposure(1)(4) | Total Leverage Exposure(1)(4) | | 2,943,546 | | 2,939,744 | | 2,906,773 | |
| Leverage ratio | Leverage ratio | 4.0 | % | 7.23 | % | 7.22 | % | 7.06 | % | Leverage ratio | 4.0 | % | 7.13 | % | 7.20 | % |
| Supplementary Leverage ratio | Supplementary Leverage ratio | 5.0 | | 5.97 | | 5.96 | | 5.82 | |
(1)Citi’s regulatory capital ratios and components reflect certain deferrals based on the modified regulatory capital transition provision related to the current expected credit losses (CECL) standard. For additional information, seeSee “Capital Resources—Regulatory Capital Treatment—Modified Transition of the Current Expected Credit Losses Methodology” in Citi’s 20222023 Form 10-K.
(2)Citi’s binding CET1 Capital and Tier 1 Capital ratios were derived under the Basel III Standardized Approach, whereas Citi’s binding Total Capital ratio was derived under the Basel III Advanced Approaches framework for all periods presented.
(3)Leverage ratio denominator. Represents quarterly average total assets less amounts deducted from Tier 1 Capital.
(4)Supplementary Leverage ratio denominator.
As indicated in the table above, Citigroup’s capital ratios at June 30, 2023March 31, 2024 were in excess of the regulatory capital requirements under the U.S. Basel III rules. In addition, Citi was “well capitalized” under current federal bank regulatory agencies definitions as of June 30, 2023.March 31, 2024.
Components of Citigroup Capital
| | In millions of dollars | In millions of dollars | June 30,
2023 | December 31,
2022 | In millions of dollars | March 31,
2024 | December 31,
2023 |
| CET1 Capital | CET1 Capital | |
Citigroup common stockholders’ equity(1) | Citigroup common stockholders’ equity(1) | $ | 188,610 | | $ | 182,325 | |
Citigroup common stockholders’ equity(1) | |
Citigroup common stockholders’ equity(1) | |
| Add: Qualifying noncontrolling interests | Add: Qualifying noncontrolling interests | 209 | | 128 | |
| Regulatory capital adjustments and deductions: | Regulatory capital adjustments and deductions: | |
Add: CECL transition provision(2) | |
Add: CECL transition provision(2) | |
Add: CECL transition provision(2) | Add: CECL transition provision(2) | 1,514 | | 2,271 | |
| Less: Accumulated net unrealized gains (losses) on cash flow hedges, net of tax | Less: Accumulated net unrealized gains (losses) on cash flow hedges, net of tax | (1,990) | | (2,522) | |
| Less: Cumulative unrealized net gain (loss) related to changes in fair value of financial liabilities attributable to own creditworthiness, net of tax | Less: Cumulative unrealized net gain (loss) related to changes in fair value of financial liabilities attributable to own creditworthiness, net of tax | 307 | | 1,441 | |
| Less: Intangible assets: | Less: Intangible assets: | |
Goodwill, net of related DTLs(3) | Goodwill, net of related DTLs(3) | 18,933 | | 19,007 | |
Goodwill, net of related DTLs(3) | |
Goodwill, net of related DTLs(3) | |
Identifiable intangible assets other than MSRs, net of related DTLs | Identifiable intangible assets other than MSRs, net of related DTLs | 3,531 | | 3,411 | |
| Less: Defined benefit pension plan net assets; other | 2,020 | | 1,935 | |
| Less: Defined benefit pension plan net assets and other | |
Less: DTAs arising from net operating loss, foreign tax credit and general business credit carry-forwards(4) | Less: DTAs arising from net operating loss, foreign tax credit and general business credit carry-forwards(4) | 11,461 | | 12,197 | |
Less: Excess over 10%/15% limitations for other DTAs, certain common stock investments, and MSRs(4)(5) | Less: Excess over 10%/15% limitations for other DTAs, certain common stock investments, and MSRs(4)(5) | 1,828 | | 325 | |
| Total CET1 Capital (Standardized Approach and Advanced Approaches) | Total CET1 Capital (Standardized Approach and Advanced Approaches) | $ | 154,243 | | $ | 148,930 | |
| Additional Tier 1 Capital | Additional Tier 1 Capital | |
Qualifying noncumulative perpetual preferred stock(1) | Qualifying noncumulative perpetual preferred stock(1) | $ | 20,109 | | $ | 18,864 | |
Qualifying noncumulative perpetual preferred stock(1) | |
Qualifying noncumulative perpetual preferred stock(1) | |
Qualifying trust preferred securities(6) | Qualifying trust preferred securities(6) | 1,410 | | 1,406 | |
| Qualifying noncontrolling interests | Qualifying noncontrolling interests | 30 | | 30 | |
| Regulatory capital deductions: | Regulatory capital deductions: | |
| Less: Other | |
| Less: Other | |
| Less: Other | Less: Other | 49 | | 85 | |
| Total Additional Tier 1 Capital (Standardized Approach and Advanced Approaches) | Total Additional Tier 1 Capital (Standardized Approach and Advanced Approaches) | $ | 21,500 | | $ | 20,215 | |
Total Tier 1 Capital (CET1 Capital + Additional Tier 1 Capital) (Standardized Approach and Advanced Approaches) | Total Tier 1 Capital (CET1 Capital + Additional Tier 1 Capital) (Standardized Approach and Advanced Approaches) | $ | 175,743 | | $ | 169,145 | |
| Tier 2 Capital | Tier 2 Capital | |
| Qualifying subordinated debt | Qualifying subordinated debt | $ | 17,669 | | $ | 15,530 | |
| Qualifying subordinated debt | |
| Qualifying subordinated debt | |
| Qualifying noncontrolling interests | Qualifying noncontrolling interests | 37 | | 37 | |
Eligible allowance for credit losses(2)(7) | Eligible allowance for credit losses(2)(7) | 13,715 | | 13,426 | |
| Regulatory capital deduction: | Regulatory capital deduction: | |
| Less: Other | |
| Less: Other | |
| Less: Other | Less: Other | 312 | | 595 | |
| Total Tier 2 Capital (Standardized Approach) | Total Tier 2 Capital (Standardized Approach) | $ | 31,109 | | $ | 28,398 | |
| Total Capital (Tier 1 Capital + Tier 2 Capital) (Standardized Approach) | Total Capital (Tier 1 Capital + Tier 2 Capital) (Standardized Approach) | $ | 206,852 | | $ | 197,543 | |
Adjustment for excess of eligible credit reserves over expected credit losses(2)(7) | Adjustment for excess of eligible credit reserves over expected credit losses(2)(7) | $ | (8,816) | | $ | (8,704) | |
| Total Tier 2 Capital (Advanced Approaches) | Total Tier 2 Capital (Advanced Approaches) | $ | 22,293 | | $ | 19,694 | |
| Total Capital (Tier 1 Capital + Tier 2 Capital) (Advanced Approaches) | Total Capital (Tier 1 Capital + Tier 2 Capital) (Advanced Approaches) | $ | 198,036 | | $ | 188,839 | |
(1)Issuance costs of $136$74 million and $131$84 million related to outstanding noncumulative perpetual preferred stock at June 30, 2023March 31, 2024 and December 31, 2022,2023, respectively, were excluded from common stockholders’ equity and netted against such preferred stock in accordance with Federal Reserve Board regulatory reporting requirements, which differ from those under U.S. GAAP.
(2)Citi’s regulatory capital ratios and components reflect certain deferrals based on the modified regulatory capital transition provision related to the CECL standard. For additional information, seeSee “Capital Resources—Regulatory Capital Treatment—Modified Transition of the Current Expected Credit Losses Methodology” in Citi’s 20222023 Form 10-K.
(3)Includes goodwill “embedded” in the valuation of significant common stock investments in unconsolidated financial institutions.
(4)Of Citi’s $28.5$29.9 billion of net DTAs at June 30, 2023, $11.5March 31, 2024, $11.9 billion of net DTAs arising from net operating loss, foreign tax credit and general business credit tax carry-forwards, as well as $1.8$3.6 billion of DTAs arising from temporary differences that exceeded 10%/15% limitations, were excluded from Citi’s CET1 Capital as of June 30, 2023.March 31, 2024. DTAs arising from net operating loss, foreign tax credit and general business credit tax carry-forwards are required to be entirely deducted from CET1 Capital under the U.S. Basel III rules. DTAs arising from temporary differences are required to be deducted from capital only if they exceed 10%/15% limitations under the U.S. Basel III rules.
Footnotes continue on the following page.page
(5)Assets subject to 10%/15% limitations include MSRs, DTAs arising from temporary differences and significant common stock investments in unconsolidated financial institutions. At June 30, 2023March 31, 2024 and December 31, 2022,2023, this deduction related only to DTAs arising from temporary differences that exceeded the 10% limitation.
(6)Represents Citigroup Capital XIII trust preferred securities, which are permanently grandfathered as Tier 1 Capital under the U.S. Basel III rules.
(7)Under the Standardized Approach, the allowance for credit losses is eligible for inclusion in Tier 2 Capital up to 1.25% of credit risk-weighted assets, with any excess allowance for credit losses being deducted in arriving at credit risk-weighted assets, which differs from the Advanced Approaches framework, in which eligible credit reserves that exceed expected credit losses are eligible for inclusion in Tier 2 Capital to the extent that the excess reserves do not exceed 0.6% of credit risk-weighted assets. The total amount of eligible credit reserves in excess of expected credit losses that were eligible for inclusion in Tier 2 Capital, subject to limitation, under the Advanced Approaches framework were $4.9 billion and $4.7$3.9 billion at June 30, 2023March 31, 2024 and December 31, 2022,2023, respectively.
Citigroup Capital Rollforward
| | | | | | | | | |
| In millions of dollars | Three Months Ended
June 30, 2023 | Six Months Ended June 30, 2023 | |
| CET1 Capital, beginning of period | $ | 153,753 | | $ | 148,930 | | |
| Net income | 2,915 | | 7,521 | | |
| Common and preferred dividends declared | (1,292) | | (2,569) | | |
| Net increase in treasury stock | (985) | | (280) | | |
| Net increase in common stock and additional paid-in capital | 210 | | 126 | | |
| Net change in CTA net of hedges, net of tax | 23 | | 865 | | |
| Net change in unrealized gains (losses) on debt securities AFS, net of tax | 126 | | 962 | | |
| Net increase in defined benefit plans liability adjustment, net of tax | (136) | | (240) | | |
| Net change in adjustment related to change in fair value of financial liabilities attributable to own creditworthiness, net of tax | 111 | | 189 | | |
| Net decrease in excluded component of fair value hedges | 11 | | 23 | | |
| Net change in goodwill, net of related DTLs | (89) | | 74 | | |
| Net change in identifiable intangible assets other than MSRs, net of related DTLs | 76 | | (120) | | |
| Net increase in defined benefit pension plan net assets | (66) | | (59) | | |
| Net decrease in DTAs arising from net operating loss, foreign tax credit and general business credit carry-forwards | 322 | | 736 | | |
| Net increase in excess over 10%/15% limitations for other DTAs, certain common stock investments and MSRs | (783) | | (1,503) | | |
| Net decrease in CECL transition provision | — | | (757) | | |
| Other | 47 | | 345 | | |
| Net increase in CET1 Capital | $ | 490 | | $ | 5,313 | | |
CET1 Capital, end of period (Standardized Approach and Advanced Approaches) | $ | 154,243 | | $ | 154,243 | | |
| Additional Tier 1 Capital, beginning of period | $ | 21,496 | | $ | 20,215 | | |
| Net increase in qualifying perpetual preferred stock | — | | 1,245 | | |
| Net increase in qualifying trust preferred securities | 2 | | 4 | | |
| Other | 2 | | 36 | | |
| Net increase in Additional Tier 1 Capital | $ | 4 | | $ | 1,285 | | |
Tier 1 Capital, end of period (Standardized Approach and Advanced Approaches) | $ | 175,743 | | $ | 175,743 | | |
| Tier 2 Capital, beginning of period (Standardized Approach) | $ | 28,337 | | $ | 28,398 | | |
| Net increase in qualifying subordinated debt | 2,489 | | 2,139 | | |
| Net increase in eligible allowance for credit losses | 239 | | 289 | | |
| Other | 44 | | 283 | | |
| Net increase in Tier 2 Capital (Standardized Approach) | $ | 2,772 | | $ | 2,711 | | |
| Tier 2 Capital, end of period (Standardized Approach) | $ | 31,109 | | $ | 31,109 | | |
| Total Capital, end of period (Standardized Approach) | $ | 206,852 | | $ | 206,852 | | |
| Tier 2 Capital, beginning of period (Advanced Approaches) | $ | 19,749 | | $ | 19,694 | | |
| Net increase in qualifying subordinated debt | 2,489 | | 2,139 | | |
| Net increase in excess of eligible credit reserves over expected credit losses | 11 | | 177 | | |
| Other | 44 | | 283 | | |
| Net increase in Tier 2 Capital (Advanced Approaches) | $ | 2,544 | | $ | 2,599 | | |
| Tier 2 Capital, end of period (Advanced Approaches) | $ | 22,293 | | $ | 22,293 | | |
| Total Capital, end of period (Advanced Approaches) | $ | 198,036 | | $ | 198,036 | | |
| | | | | | |
| In millions of dollars | | Three Months Ended March 31, 2024 |
| CET1 Capital, beginning of period | | $ | 153,595 | |
| Net income | | 3,371 | |
| Common and preferred dividends declared | | (1,309) | |
| Treasury stock | | 373 | |
| Common stock and additional paid-in capital | | (373) | |
| CTA net of hedges, net of tax | | (1,053) | |
| Unrealized gains (losses) on debt securities AFS, net of tax | | 100 | |
| Defined benefit plans liability adjustment, net of tax | | 77 | |
Adjustment related to change in fair value of financial liabilities attributable to own creditworthiness, net of tax(1) | | 59 | |
Other Accumulated other comprehensive income (loss) (AOCI) | | 17 | |
| Goodwill, net of related DTLs | | 131 | |
| Identifiable intangible assets other than MSRs, net of related DTLs | | 91 | |
| Defined benefit pension plan net assets | | (41) | |
| DTAs arising from net operating loss, foreign tax credit and general business credit carry-forwards | | 139 | |
| Excess over 10%/15% limitations for other DTAs, certain common stock investments and MSRs | | (1,245) | |
| CECL transition provision | | (757) | |
| Other | | (33) | |
| Net change in CET1 Capital | | $ | (453) | |
| CET1 Capital, end of period (Standardized Approach and Advanced Approaches) | | $ | 153,142 | |
| Additional Tier 1 Capital, beginning of period | | $ | 18,909 | |
| Qualifying perpetual preferred stock | | 10 | |
| Qualifying trust preferred securities | | 3 | |
| Other | | 1 | |
| Net change in Additional Tier 1 Capital | | $ | 14 | |
| Tier 1 Capital, end of period (Standardized Approach and Advanced Approaches) | | $ | 172,065 | |
| Tier 2 Capital, beginning of period (Standardized Approach) | | $ | 29,264 | |
| Qualifying subordinated debt | | 1,865 | |
| Eligible allowance for credit losses | | (99) | |
| Other | | (3) | |
| Net change in Tier 2 Capital (Standardized Approach) | | $ | 1,763 | |
| Tier 2 Capital, end of period (Standardized Approach) | | $ | 31,027 | |
| Total Capital, end of period (Standardized Approach) | | $ | 203,092 | |
| Tier 2 Capital, beginning of period (Advanced Approaches) | | $ | 19,415 | |
| Qualifying subordinated debt | | 1,865 | |
| Excess of eligible credit reserves over expected credit losses | | 1,024 | |
| Other | | (3) | |
| Net change in Tier 2 Capital (Advanced Approaches) | | $ | 2,886 | |
| Tier 2 Capital, end of period (Advanced Approaches) | | $ | 22,301 | |
| Total Capital, end of period (Advanced Approaches) | | $ | 194,366 | |
Citigroup Risk-Weighted Assets Rollforward (Basel III Standardized Approach)
| | | | | | | | | |
| In millions of dollars | Three Months Ended
June 30, 2023 | Six Months Ended June 30, 2023 | |
| Total Risk-Weighted Assets, beginning of period | $ | 1,144,359 | | $ | 1,142,985 | | |
| Changes in Credit Risk-Weighted Assets | | | |
General credit risk exposures(1) | 4,990 | | (9,362) | | |
Derivatives(2) | 10,313 | | 11,470 | | |
Repo-style transactions(3) | 1,119 | | 12,044 | | |
| Securitization exposures | (364) | | 92 | | |
Equity exposures(4) | 589 | | 2,377 | | |
Other exposures(5) | 1,683 | | 3,827 | | |
| Net increase in Credit Risk-Weighted Assets | $ | 18,330 | | $ | 20,448 | | |
| Changes in Market Risk-Weighted Assets | | | |
| Risk levels | $ | (6,795) | | $ | (8,876) | | |
| Model and methodology updates | (2,444) | | (1,107) | | |
Net decrease in Market Risk-Weighted Assets(6) | $ | (9,239) | | $ | (9,983) | | |
| Total Risk-Weighted Assets, end of period | $ | 1,153,450 | | $ | 1,153,450 | | |
| | | | | | | |
| In millions of dollars | | Three Months Ended March 31, 2024 | |
| Total Risk-Weighted Assets, beginning of period | | $ | 1,148,608 | | |
General credit risk exposures(1) | | (14,595) | | |
Derivatives(2) | | (2,038) | | |
Repo-style transactions(3) | | 5,719 | | |
| Securitization exposures | | 284 | | |
| Equity exposures | | 1,077 | | |
| Other exposures | | (700) | | |
| Net decrease in Credit Risk-Weighted Assets | | $ | (10,253) | | |
| Net increase in Market Risk-Weighted Assets | | $ | 191 | | |
| Total Risk-Weighted Assets, end of period | | $ | 1,138,546 | | |
(1)General credit risk exposures include cash and balances due from depository institutions, securities, and loans and leases. General credit risk exposures increaseddecreased during the three months ended June 30, 2023,March 31, 2024, primarily due to an increasea decrease in lending exposures and card activities. General credit risk exposures
(2)Derivatives decreased during the sixthree months ended June 30, 2023, primarily driven by divestitures and non-strategic portfolio exits.
(2)Derivative exposures increased during the three and six months ended June 30, 2023,March 31, 2024, mainly driven by movements across multiple business areas, notablya decrease in rates and currencies.exposures.
(3)Repo-style transactions include repurchase and reverse repurchase transactions, as well as securities borrowing and securities lending transactions. Repo-style transactions increased during the three and six months ended June 30, 2023, mainly due toMarch 31, 2024, primarily driven by increased activities across multiple business areas.activities.
(4)Equity exposures increased during the three and six months ended June 30, 2023, primarily due to increases in investment market share prices.
(5)Other exposures increased during the three and six months ended June 30, 2023, mainly driven by increases in other assets.
(6)Market risk-weighted assets decreased during the three and six months ended June 30, 2023, primarily due to exposure changes, partially offset by changes in model inputs related to volatility and correlation between market risk factors.
Citigroup Risk-Weighted Assets Rollforward (Basel III Advanced Approaches)
| | | | | | | | | |
| In millions of dollars | Three Months Ended
June 30, 2023 | Six Months Ended June 30, 2023 | |
| Total Risk-Weighted Assets, beginning of period | $ | 1,252,390 | | $ | 1,221,538 | | |
| Changes in Credit Risk-Weighted Assets | | | |
General credit risk exposures(1) | (4,478) | | 13,130 | | |
Derivatives(2) | (8,382) | | (3,366) | | |
Repo-style transactions(3) | 2,201 | | 3,498 | | |
| Securitization exposures | (1,561) | | 532 | | |
Equity exposures(4) | 417 | | 2,828 | | |
Other exposures(5) | 2,764 | | 6,210 | | |
| Net increase in Credit Risk-Weighted Assets | $ | (9,039) | | $ | 22,832 | | |
| Changes in Market Risk-Weighted Assets | | | |
| Risk levels | $ | (6,636) | | $ | (8,521) | | |
| Model and methodology updates | (2,444) | | (1,107) | | |
Net decrease in Market Risk-Weighted Assets(6) | $ | (9,080) | | $ | (9,628) | | |
| Net decrease in Operational Risk-Weighted Assets | $ | — | | $ | (471) | | |
| Total Risk-Weighted Assets, end of period | $ | 1,234,271 | | $ | 1,234,271 | | |
| | | | | | | |
| In millions of dollars | | Three Months Ended March 31, 2024 | |
| Total Risk-Weighted Assets, beginning of period | | $ | 1,268,723 | | |
General credit risk exposures(1) | | (4,218) | | |
Derivatives(2) | | (4,713) | | |
Repo-style transactions(3) | | 5,509 | | |
| Securitization exposures | | 1,089 | | |
| Equity exposures | | 1,122 | | |
| Other exposures | | 444 | | |
| Net decrease in Credit Risk-Weighted Assets | | $ | (767) | | |
| Net increase in Market Risk-Weighted Assets | | $ | 76 | | |
Net increase in Operational Risk-Weighted Assets(4) | | $ | 13,054 | | |
| Total Risk-Weighted Assets, end of period | | $ | 1,281,086 | | |
(1)General credit risk exposures include cash and balances due from depository institutions, securities, and loans and leases. General credit risk exposures decreased during the three months ended June 30, 2023, mainly driven by loans, partly offset by an increaseMarch 31, 2024, primarily due to a decrease in card activities. General credit risk exposures increased during the six months ended June 30, 2023, primarily driven by card activities.lending exposures.
(2)Derivative exposuresDerivatives decreased during the three and six months ended June 30, 2023,March 31, 2024, mainly driven by changesa decrease in CVA.exposures.
(3)Repo-style transactions include repurchase and reverse repurchase transactions, as well as securities borrowing and securities lending transactions. Repo-style transactions increased during the three and six months ended June 30, 2023, mainly due toMarch 31, 2024, primarily driven by increased activities across multiple business areas.activities.
(4)Equity exposuresOperational risk increased during the three and six months ended June 30, 2023,March 31, 2024, primarily due to increases in investment market share prices.model parameter updates.
(5)Other exposures increased during the three and six months ended June 30, 2023, mainly driven by increases in other assets.
(6)Market risk-weighted assets decreased during the three and six months ended June 30, 2023, primarily due to exposure changes, partially offset by changes in model inputs related to volatility and correlation between market risk factors.
Supplementary Leverage Ratio
The following table presents Citi’s Supplementary Leverage ratio and related components as of June 30, 2023, March 31, 20232024 and December 31, 2022:2023:
| | In millions of dollars, except ratios | In millions of dollars, except ratios | June 30, 2023 | March 31, 2023 | December 31, 2022 | |
| In millions of dollars, except ratios | |
| In millions of dollars, except ratios | |
| Tier 1 Capital | |
| Tier 1 Capital | |
| Tier 1 Capital | Tier 1 Capital | $ | 175,743 | | $ | 175,249 | | $ | 169,145 | | |
| Total Leverage Exposure | Total Leverage Exposure | | |
| Total Leverage Exposure | |
| Total Leverage Exposure | |
On-balance sheet assets(1)(2) | |
On-balance sheet assets(1)(2) | |
On-balance sheet assets(1)(2) | On-balance sheet assets(1)(2) | $ | 2,467,128 | | $ | 2,463,758 | | $ | 2,432,823 | | |
Certain off-balance sheet exposures(3) | Certain off-balance sheet exposures(3) | | |
Certain off-balance sheet exposures(3) | |
Certain off-balance sheet exposures(3) | |
| Potential future exposure on derivative contracts | |
| Potential future exposure on derivative contracts | |
| Potential future exposure on derivative contracts | Potential future exposure on derivative contracts | 144,823 | | 143,328 | | 133,071 | | |
Effective notional of sold credit derivatives, net(4) | Effective notional of sold credit derivatives, net(4) | 31,833 | | 30,931 | | 34,117 | | |
Effective notional of sold credit derivatives, net(4) | |
Effective notional of sold credit derivatives, net(4) | |
Counterparty credit risk for repo-style transactions(5) | |
Counterparty credit risk for repo-style transactions(5) | |
Counterparty credit risk for repo-style transactions(5) | Counterparty credit risk for repo-style transactions(5) | 19,399 | | 18,255 | | 17,169 | | |
| Other off-balance sheet exposures | Other off-balance sheet exposures | 318,185 | | 320,800 | | 326,553 | | |
| Other off-balance sheet exposures | |
| Other off-balance sheet exposures | |
| Total of certain off-balance sheet exposures | |
| Total of certain off-balance sheet exposures | |
| Total of certain off-balance sheet exposures | Total of certain off-balance sheet exposures | $ | 514,240 | | $ | 513,314 | | $ | 510,910 | | |
| Less: Tier 1 Capital deductions | Less: Tier 1 Capital deductions | 37,822 | | 37,328 | | 36,960 | | |
| Less: Tier 1 Capital deductions | |
| Less: Tier 1 Capital deductions | |
| Total Leverage Exposure | |
| Total Leverage Exposure | |
| Total Leverage Exposure | Total Leverage Exposure | $ | 2,943,546 | | $ | 2,939,744 | | $ | 2,906,773 | | |
| Supplementary Leverage ratio | Supplementary Leverage ratio | 5.97 | % | 5.96 | % | 5.82 | % | |
| Supplementary Leverage ratio | |
| Supplementary Leverage ratio | |
(1)Represents the daily average of on-balance sheet assets for the quarter.
(2)Citi’s regulatory capital ratios and components reflect certain deferrals based on the modified regulatory capital transition provision related to the CECL standard. For additional information, seeSee “Capital Resources—Regulatory Capital Treatment—Modified Transition of the Current Expected Credit Losses Methodology” in Citi’s 20222023 Form 10-K.
(3)Represents the average of certain off-balance sheet exposures calculated as of the last day of each month in the quarter.
(4)Under the U.S. Basel III rules, banking organizations are required to include in Total Leverage Exposure the effective notional amount of sold credit derivatives, with netting of exposures permitted if certain conditions are met.
(5)Repo-style transactions include repurchase and reverse repurchase transactions as well as securities borrowing and securities lending transactions.
As presented in the table above, Citigroup’s Supplementary Leverage ratio was approximately 6.0%5.8% at June 30, 2023 and March 31, 2023, compared to approximately 5.8% at2024 and December 31, 2022. The ratio remained largely unchanged from the first quarter of 2023. The ratio increased slightly from the fourth quarter of 2022, primarily driven by an increase in Tier 1 Capital due to year-to-date net income of $7.5 billion, partially offset by an increase in Total Leverage Exposure, largely driven by higher average on-balance sheet assets.2023.
Capital Resources of Citigroup’s Subsidiary U.S. Depository Institutions
Citigroup’s subsidiary U.S. depository institutions are also subject to regulatory capital standards issued by their respective primary bank regulatory agencies, which are similar to the standards of the Federal Reserve Board.
The following tables present the capital components and ratios for Citibank, Citi’s primary subsidiary U.S. depository institution, as of June 30, 2023, March 31, 20232024 and December 31, 2022:2023:
| | | | | | | | | | | | | | | | | | | | | | | |
| | Advanced Approaches | Standardized Approach |
| In millions of dollars, except ratios | Required Capital Ratios(1) | June 30,
2023 | March 31,
2023 | December 31,
2022 | June 30,
2023 | March 31,
2023 | December 31,
2022 |
CET1 Capital(2) | | $ | 150,482 | | $ | 151,724 | | $ | 149,593 | | $ | 150,482 | | $ | 151,724 | | $ | 149,593 | |
Tier 1 Capital(2) | | 152,612 | | 153,853 | | 151,720 | | 152,612 | | 153,853 | | 151,720 | |
Total Capital (Tier 1 Capital + Tier 2 Capital)(2)(3) | | 165,840 | | 167,065 | | 165,131 | | 173,517 | | 174,608 | | 172,647 | |
| Total Risk-Weighted Assets | | 1,041,217 | | 1,038,394 | | 1,003,747 | | 986,744 | | 968,749 | | 982,914 | |
Credit Risk(2) | | $ | 758,445 | | $ | 762,148 | | $ | 728,082 | | $ | 944,565 | | $ | 932,787 | | $ | 948,150 | |
| Market Risk | | 42,058 | | 35,532 | | 34,403 | | 42,179 | | 35,962 | | 34,764 | |
| Operational Risk | | 240,714 | | 240,714 | | 241,262 | | — | | — | | — | |
CET1 Capital ratio(4)(5) | 7.0 | % | 14.45 | % | 14.61 | % | 14.90 | % | 15.25 | % | 15.66 | % | 15.22 | % |
Tier 1 Capital ratio(4)(5) | 8.5 | | 14.66 | | 14.82 | | 15.12 | | 15.47 | | 15.88 | | 15.44 | |
Total Capital ratio(4)(5) | 10.5 | | 15.93 | | 16.09 | | 16.45 | | 17.58 | | 18.02 | | 17.56 | |
| | | | | | | | | | | | | | |
| In millions of dollars, except ratios | Required
Capital Ratios | June 30, 2023 | March 31, 2023 | December 31, 2022 |
Quarterly Adjusted Average Total Assets(2)(6) | | $ | 1,716,982 | | $ | 1,743,596 | | $ | 1,738,744 | |
Total Leverage Exposure(2)(7) | | 2,162,693 | | 2,191,870 | | 2,189,541 | |
Leverage ratio(5) | 5.0 | % | 8.89 | % | 8.82 | % | 8.73 | % |
Supplementary Leverage ratio(5) | 6.0 | | 7.06 | | 7.02 | | 6.93 | |
| | | | | | | | | | | | | | | | | |
| | Advanced Approaches | Standardized Approach |
| In millions of dollars, except ratios | Required Capital Ratios(1) | March 31,
2024 | December 31,
2023 | March 31,
2024 | December 31,
2023 |
CET1 Capital(2) | | $ | 149,078 | | $ | 147,109 | | $ | 149,078 | | $ | 147,109 | |
Tier 1 Capital(2) | | 151,208 | | 149,238 | | 151,208 | | 149,238 | |
Total Capital (Tier 1 Capital + Tier 2 Capital)(2)(3) | | 163,065 | | 160,706 | | 170,433 | | 168,571 | |
| Total Risk-Weighted Assets | | 1,062,119 | | 1,057,194 | | 971,207 | | 983,960 | |
Credit Risk(2) | | $ | 768,968 | | $ | 769,940 | | $ | 927,542 | | $ | 937,319 | |
| Market Risk | | 43,619 | | 46,540 | | 43,665 | | 46,641 | |
| Operational Risk | | 249,532 | | 240,714 | | — | | — | |
CET1 Capital ratio(4)(5) | 7.0 | % | 14.04 | % | 13.92 | % | 15.35 | % | 14.95 | % |
Tier 1 Capital ratio(4)(5) | 8.5 | | 14.24 | | 14.12 | | 15.57 | | 15.17 | |
Total Capital ratio(4)(5) | 10.5 | | 15.35 | | 15.20 | | 17.55 | | 17.13 | |
| | | | | | | | | | | |
| In millions of dollars, except ratios | Required
Capital Ratios | March 31, 2024 | December 31, 2023 |
Quarterly Adjusted Average Total Assets(2)(6) | | $ | 1,680,951 | | $ | 1,666,609 | |
Total Leverage Exposure(2)(7) | | 2,151,044 | | 2,166,334 | |
Leverage ratio(5) | 5.0 | % | 9.00 | % | 8.95 | % |
Supplementary Leverage ratio(5) | 6.0 | | 7.03 | | 6.89 | |
(1)Citibank’s required risk-based capital ratios are inclusive of the 2.5% Capital Conservation Buffer (all of which must be composed of CET1 Capital).
(2)Citibank’s regulatory capital ratios and components reflect certain deferrals based on the modified regulatory capital transition provision related to the CECL standard. For additional information, seeSee “Capital Resources—Regulatory Capital Treatment—Modified Transition of the Current Expected Credit Losses Methodology” in Citi’s 20222023 Form 10-K.
(3)Under the Standardized Approach, the allowance for credit losses is eligible for inclusion in Tier 2 Capital up to 1.25% of credit risk-weighted assets, with any excess allowance for credit losses being deducted in arriving at credit risk-weighted assets, which differs from the Advanced Approaches framework, in which eligible credit reserves that exceed expected credit losses are eligible for inclusion in Tier 2 Capital to the extent that the excess reserves do not exceed 0.6% of credit risk-weighted assets.
(4)Citibank’s binding CET1 Capital, Tier 1 Capital and Total Capital ratios were derived under the Basel III Advanced Approaches framework for all periods presented.
(5)Citibank must maintain required CET1 Capital, Tier 1 Capital, Total Capital and Leverage ratios of 6.5%, 8.0%, 10.0% and 5.0%, respectively, to be considered “well capitalized” under the revised Prompt Corrective Action (PCA) regulations applicable to insured depository institutions as established by the U.S. Basel III rules. Citibank must also maintain a required Supplementary Leverage ratio of 6.0% to be considered “well capitalized.”
(6)Leverage ratio denominator. Represents quarterly average total assets less amounts deducted from Tier 1 Capital.
(7)Supplementary Leverage ratio denominator.
As indicatedpresented in the table above, Citibank’s capital ratios at June 30, 2023March 31, 2024 were in excess of the regulatory capital requirements under the U.S. Basel III rules. In addition, Citibank was “well capitalized” as of June 30, 2023.March 31, 2024.
As presented in the table above, Citibank’s Supplementary Leverage ratio was 7.1% at June 30, 2023 and 7.0% at March 31, 2023,2024, compared to 6.9% at December 31, 2022.2023. The quarter-over-quarter increase was primarily driven
by an increase in Tier 1 Capital due to net income in the secondfirst quarter of 2023, partially offset by dividends,2024 and a decrease in Total Leverage Exposure, primarily driven by higher average on-balance sheet assets. The year-to-date increase was primarily driven by an increase in Tier 1 Capital due to net income in 2023, partially offset by dividends, and a decreaseadverse net movements in Total Leverage Exposure, primarily driven by higher average on-balance sheet assets and off-balance sheet exposures.AOCI.
Impact of Changes on Citigroup and Citibank Capital Ratios
The following tables present the estimated sensitivity of Citigroup’s and Citibank’s capital ratios to changes of $100 million in CET1 Capital, Tier 1 Capital and Total Capital (numerator), and changes of $1 billion in Advanced Approaches and Standardized Approach risk-weighted assets and quarterly adjusted average total assets, as well as Total Leverage Exposure (denominator), as of June 30, 2023.March 31, 2024. This information is provided for the purpose of analyzing the
impact that a change in Citigroup’s or Citibank’s financial position or results of operations could have on these ratios. These sensitivities only consider a single change to either a component of capital, risk-weighted assets, quarterly adjusted average total assets or Total Leverage Exposure. Accordingly, an event that affects more than one factor may have a larger basis point impact than is reflected in these tables.
| | Common Equity Tier 1 Capital ratio | Tier 1 Capital ratio | Total Capital ratio |
| CET1 Capital ratio | | | CET1 Capital ratio | Tier 1 Capital ratio | Total Capital ratio |
| In basis points | In basis points | Impact of $100 million change in Common Equity Tier 1 Capital | Impact of $1 billion change in risk- weighted assets | Impact of $100 million change in Tier 1 Capital | Impact of $1 billion change in risk- weighted assets | Impact of $100 million change in Total Capital | Impact of $1 billion change in risk- weighted assets | In basis points | Impact of $100 million change in CET1 Capital | Impact of $1 billion change in risk- weighted assets | Impact of $100 million change in Tier 1 Capital | Impact of $1 billion change in risk- weighted assets | Impact of $100 million change in Total Capital | Impact of $1 billion change in risk- weighted assets |
| Citigroup | Citigroup | | | | | |
| Advanced Approaches | |
| Advanced Approaches | |
| Advanced Approaches | Advanced Approaches | 0.8 | 1.0 | 0.8 | 1.2 | 0.8 | 1.3 | 0.8 | 0.9 | 0.8 | 1.0 | 0.8 | 1.2 |
| Standardized Approach | Standardized Approach | 0.9 | 1.2 | 0.9 | 1.3 | 0.9 | 1.6 | Standardized Approach | 0.9 | 1.2 | 0.9 | 1.3 | 0.9 | 1.6 |
| Citibank | Citibank | | | | | |
| Advanced Approaches | Advanced Approaches | 1.0 | 1.4 | 1.0 | 1.4 | 1.0 | 1.5 |
| Advanced Approaches | |
| Advanced Approaches | | 0.9 | 1.3 | 0.9 | 1.3 | 0.9 | 1.4 |
| Standardized Approach | Standardized Approach | 1.0 | 1.5 | 1.0 | 1.6 | 1.0 | 1.8 | Standardized Approach | 1.0 | 1.6 | 1.0 | 1.6 | 1.0 | 1.8 |
| | | | | | | | | | | | | | |
| Leverage ratio | Supplementary Leverage ratio |
| In basis points | Impact of $100 million change in Tier 1 Capital | Impact of $1 billion change in quarterly adjusted average total assets | Impact of $100 million change in Tier 1 Capital | Impact of $1 billion change in Total Leverage Exposure |
| Citigroup | 0.4 | 0.3 | 0.3 | 0.2 |
| Citibank | 0.6 | 0.5 | 0.5 | 0.3 |
Citigroup Broker-Dealer Subsidiaries
At June 30, 2023,March 31, 2024, Citigroup Global Markets Inc., a U.S. broker-dealer registered with the SEC that is an indirect wholly owned subsidiary of Citigroup, had net capital, computed in accordance with the SEC’s net capital rule, of $15$19 billion, which exceeded the minimum requirement by $11$14 billion.
Moreover, Citigroup Global Markets Limited, a broker-dealer registered with the United Kingdom’s Prudential Regulation Authority (PRA) that is also an indirect wholly owned subsidiary of Citigroup, had total regulatory capital of $27 billion at June 30, 2023,March 31, 2024, which exceeded the PRA’s minimum regulatory capital requirements.
In addition, certain of Citi’s other broker-dealer subsidiaries are subject to regulation in the countries in which they do business, including requirements to maintain specified levels of net capital or its equivalent. Citigroup’s other principal broker-dealer subsidiaries were in compliance with their regulatory capital requirements at June 30, 2023.March 31, 2024.
Total Loss-Absorbing Capacity (TLAC)
The table below details Citi’s eligible external TLAC and long-term debt (LTD) amounts and ratios, and each TLAC and LTD regulatory requirement, as well as the surplus amount in dollars in excess of each requirement:
| | June 30, 2023 |
| March 31, 2024 | | | March 31, 2024 |
| In billions of dollars, except ratios | In billions of dollars, except ratios | External TLAC | LTD | In billions of dollars, except ratios | External TLAC | LTD |
| Total eligible amount | Total eligible amount | $ | 338 | | $ | 154 | |
% of Advanced Approaches risk-
weighted assets | % of Advanced Approaches risk-
weighted assets | 27.4 | % | 12.5 | % | % of Advanced Approaches risk-
weighted assets | 26.1 | % | 11.8 | % |
Regulatory requirement(1)(2) | Regulatory requirement(1)(2) | 22.5 | | 9.5 | |
| Surplus amount | Surplus amount | $ | 60 | | $ | 37 | |
| % of Total Leverage Exposure | % of Total Leverage Exposure | 11.5 | % | 5.2 | % | % of Total Leverage Exposure | 11.3 | % | 5.1 | % |
| Regulatory requirement | Regulatory requirement | 9.5 | | 4.5 | |
| Surplus amount | Surplus amount | $ | 58 | | $ | 22 | |
(1) External TLAC includes method 1 GSIB surcharge of 2.0%.
(2) LTD includes method 2 GSIB surcharge of 3.5%.
As of June 30, 2023,March 31, 2024, Citi exceeded each of the TLAC and LTD regulatory requirements, resulting in a $22$18 billion surplus above its binding TLAC requirement of LTD as a percentage of Total Leverage Exposure.
For additional information on Citi’s TLAC-related requirements, see “Capital Resources—Total Loss-Absorbing Capacity (TLAC)” in Citi’s 20222023 Form 10-K.
Capital Resources (Full Adoption of CECL)(1)
The following tables present Citigroup’s and Citibank’s capital components and ratios under a hypothetical scenario where the full impact of CECL is reflected as of June 30, 2023:
| | Citigroup | Citibank |
| Required Capital Ratios, Advanced Approaches | Required Capital Ratios, Standardized Approach | Advanced Approaches | Standardized Approach | Required Capital Ratios(2) | Advanced Approaches | Standardized Approach |
| Citigroup | | | Citigroup | Citibank |
| Required Capital Ratios, Advanced Approaches | | | Required Capital Ratios, Advanced Approaches | Required Capital Ratios, Standardized Approach | Advanced Approaches | Standardized Approach | Required Capital Ratios(2) | Advanced Approaches | Standardized Approach |
| CET1 Capital ratio | CET1 Capital ratio | 10.5 | % | 12.0 | % | 12.35 | % | 13.21 | % | 7.0 | % | 14.32 | % | 15.11 | % | CET1 Capital ratio | 10.5 | % | 12.3 | % | 11.88 | % | 13.37 | % | 7.0 | % | 13.97 | % | 15.28 | % |
| Tier 1 Capital ratio | Tier 1 Capital ratio | 12.0 | | 13.5 | | 14.09 | | 15.08 | | 8.5 | | 14.53 | | 15.33 | |
| Total Capital ratio | Total Capital ratio | 14.0 | | 15.5 | | 15.90 | | 17.78 | | 10.5 | | 15.80 | | 17.45 | |
| | Required Capital Ratios | Citigroup | Required Capital Ratios | Citibank |
| Required Capital Ratios | | | Required Capital Ratios | Citigroup | Required Capital Ratios | Citibank |
| Leverage ratio | Leverage ratio | 4.0 | % | 7.15 % | 5.0 | % | 8.81 % | Leverage ratio | 4.0 | % | 7.09 % | 5.0 | % | 8.96 % |
| Supplementary Leverage ratio | Supplementary Leverage ratio | 5.0 | | 5.90 | 6.0 | | 6.99 | Supplementary Leverage ratio | 5.0 | | 5.80 | 5.80 | 6.0 | | 7.00 | 7.00 |
(1)See footnote 2 on the “Components of Citigroup Capital” table above.
(2)Citibank’s required capital ratios were the same under the Standardized Approach and the Advanced Approaches framework.
Regulatory Capital Standards and Developments
Basel III Revisions
On July 27, 2023, the U.S. banking agencies issued a notice of proposed rulemaking, known as the Basel III Endgame (capital proposal), that would amend U.S. regulatory capital requirements.
The capital proposal would maintain the current capital rule’s dual-requirement structure for risk-weighted assets, but would eliminate the use of internal models to calculate credit risk and operational risk components of risk-weighted assets. The capital proposal would also replace the current market risk framework with a new standardized methodology and a new models-based methodology for calculating risk-weighted assets for market risk. Large banking organizations, such as Citi, would be required to calculate their risk-based capital ratios under both the new expanded risk-based approach and the Standardized Approach and use the lower of the two for each risk-based capital ratio for determining the binding constraints.
The expanded risk-based approach is designed to align with the international capital standards adopted by the Basel Committee on Banking Supervision (Basel Committee). The Basel Committee finalized the Basel III reforms in December 2017, which included revisions to the methodologies to determine credit, market and operational risk-weighted asset amounts.
If adopted as proposed, the capital proposal’s impact on risk-weighted asset amounts would also affect several other requirements including TLAC, external long-term debt and the short-term wholesale funding score included in the GSIB surcharge under method 2 (see “GSIB Surcharge” below for additional changes in that area)below). The proposal has a three-year transition period that would begin on July 1, 2025. Citi is currently reviewingIf finalized as proposed, the capital proposal would materially increase Citi’s required regulatory capital.
For information about risks related to changes in regulatory capital requirements, see “Risk Factors—Strategic Risks,” “—Operational Risks” and will participate“—Compliance Risks” in the 120-day comment period. For additional information, see “Executive Summary” above.
GSIB Surcharge
Separately on July 27, 2023, the FRBFederal Reserve Board proposed changes to the GSIB surcharge rule that aim to make it more risk sensitive. Proposed changes include measuring certain systemic indicators on a daily versus quarterly average basis, changing certain of the risk indicators and shortening the time to come into compliance with each year’s surcharge. In addition, the proposal would narrow surcharge bands under method 2 from 50 bps to 10 bps to reduce cliff effects when moving between bands. This proposal
Long-Term Debt Requirements
On August 29, 2023, the Federal Reserve Board issued a notice of proposed rulemaking to amend the TLAC rule to change the haircuts (i.e., the percentage reductions) that are applied to eligible long-term debt. Under the proposed rule, only 50% of eligible long-term debt with a maturity of one year or more but less than two years would count toward the TLAC requirement, instead of the current 100%. These proposed revisions are estimated to decrease the TLAC percentage of Advanced Approaches RWA as well as the TLAC percentage of Total Leverage Exposure. The proposed rule in its current form has no proposed transition period for its implementation and is also subjectnot expected to a 120-day comment period and provides that it would be effective two full calendar quarters after its finalization.material to Citi.
Tangible Common Equity, Book Value Per Share, Tangible Book Value Per Share and Return on Equity
Tangible common equity (TCE), as defined by Citi, represents common stockholders’ equity less goodwill and identifiable intangible assets (other than mortgage servicing rights (MSRs)). Return on tangible common equity (RoTCE) represents annualized net income available to common shareholders as a percentage of average TCE. Tangible book value per share (TBVPS) represents average TCE divided by average common shares outstanding. Other companies may calculate these measures differently. TCE, RoTCE and TBVPS are non-GAAP financial measures. Citi believes TCE, TBVPS and RoTCE provide alternative measures of returns, capital strength and performance for investors, industry analysts and others.
| | In millions of dollars or shares, except per share amounts | In millions of dollars or shares, except per share amounts | June 30,
2023 | December 31,
2022 | In millions of dollars or shares, except per share amounts | March 31,
2024 | December 31,
2023 |
| Total Citigroup stockholders’ equity | Total Citigroup stockholders’ equity | $ | 208,719 | | $ | 201,189 | |
| Less: Preferred stock | Less: Preferred stock | 20,245 | | 18,995 | |
| Common stockholders’ equity | Common stockholders’ equity | $ | 188,474 | | $ | 182,194 | |
| Less: | Less: | |
| Goodwill | Goodwill | 19,998 | | 19,691 | |
| Goodwill | |
| Goodwill | |
| Identifiable intangible assets (other than MSRs) | Identifiable intangible assets (other than MSRs) | 3,895 | | 3,763 | |
Goodwill and identifiable intangible assets (other than MSRs) related to assets held-for-sale (HFS) | 246 | | 589 | |
| | Tangible common equity (TCE) | |
| Tangible common equity (TCE) | |
| Tangible common equity (TCE) | Tangible common equity (TCE) | $ | 164,335 | | $ | 158,151 | |
| Common shares outstanding (CSO) | Common shares outstanding (CSO) | 1,925.7 | | 1,937.0 | |
| Book value per share (common stockholders’ equity/CSO) | Book value per share (common stockholders’ equity/CSO) | $ | 97.87 | | $ | 94.06 | |
| Tangible book value per share (TCE/CSO) | Tangible book value per share (TCE/CSO) | 85.34 | | 81.65 | |
| | Three Months Ended June 30, | Six Months Ended June 30, |
| Three Months Ended March 31, | |
| Three Months Ended March 31, | |
| Three Months Ended March 31, | |
| In millions of dollars | |
| In millions of dollars | |
| In millions of dollars | In millions of dollars | 2023 | 2022 | 2023 | 2022 |
| Net income available to common shareholders | Net income available to common shareholders | $ | 2,627 | | $ | 4,309 | | $ | 6,956 | | $ | 8,336 | |
| Net income available to common shareholders | |
| Net income available to common shareholders | |
| Average common stockholders’ equity | Average common stockholders’ equity | 188,214 | | 178,981 | | 186,161 | | 180,075 | |
| Average common stockholders’ equity | |
| Average common stockholders’ equity | |
| Less: | |
| Less: | |
| Less: | |
| Average goodwill | |
| Average goodwill | |
| Average goodwill | |
| Average intangible assets (other than MSRs) | |
| Average intangible assets (other than MSRs) | |
| Average intangible assets (other than MSRs) | |
Average goodwill and identifiable intangible assets
(other than MSRs) related to assets HFS | |
Average goodwill and identifiable intangible assets
(other than MSRs) related to assets HFS | |
Average goodwill and identifiable intangible assets
(other than MSRs) related to assets HFS | |
| Average TCE | |
| Average TCE | |
| Average TCE | Average TCE | 164,142 | | 154,439 | | 162,145 | | 155,318 | |
| Return on average common stockholders’ equity | Return on average common stockholders’ equity | 5.6 | % | 9.7 | % | 7.5 | % | 9.3 | % |
| Return on average common stockholders’ equity | |
| Return on average common stockholders’ equity | |
| RoTCE | RoTCE | 6.4 | | 11.2 | | 8.7 | | 10.8 | |
| RoTCE | |
| RoTCE | |
Managing Global Risk Table of Contents
| | | | | | | | | | | |
| MANAGING GLOBAL RISK | | |
| CREDIT RISK(1) | | |
| Loans | | |
| Corporate Credit | | |
| Consumer Credit | | |
| Additional Consumer and Corporate Credit Details | | |
| Loans Outstanding | | |
| Details of Credit Loss Experience | | |
| Allowance for Credit Losses on Loans (ACLL) | | 5054 |
| Non-Accrual Loans and Assets | | |
| LIQUIDITY RISK | | |
| High-Quality Liquid Assets (HQLA) | | |
| Liquidity Coverage Ratio (LCR) | | |
| Deposits | | 5559 |
| Long-Term Debt | | 5660 |
| Secured Funding Transactions and Short-Term Borrowings | | 5862 |
| Credit Ratings | | 5963 |
| MARKET RISK(1) | | |
| Market Risk of Non-Trading Portfolios | | |
| Market Risk of Trading Portfolios | | |
OTHER RISKS | | |
LIBOR Transition Risk | | |
Country Risk | | |
Russia | | |
| UkraineOTHER RISKS | | |
| Country Risk | | |
| Russia | | |
| Ukraine | | |
| Argentina | | |
(1) For additional information regarding certain credit risk, market risk and other quantitative and qualitative information, refer to
Citi’s Pillar 3 Basel III Advanced Approaches Disclosures, as required by the rules of the Federal Reserve Board, on Citi’s
Investor Relations website.
MANAGING GLOBAL RISK
For Citi, effective risk management is of primary importance to its overall operations. Accordingly, Citi’s risk management process has been designed to monitor, evaluate and manage the principal risks it assumes in conducting its activities. Specifically, the activities that Citi engages in, and the risks those activities generate, must be consistent with Citi’s Mission and Value Proposition and the key Leadership Principles that support it, as well as Citi’s risk appetite. For more information on managing global risk at Citi, see “Managing Global Risk” in Citi’s 20222023 Form 10-K.
CREDIT RISK
For more information on credit risk, including Citi’s credit risk management, measurement and stress testing, and Citi’s consumer and corporate credit portfolios, see “Credit Risk” and “Risk Factors” in Citi’s 20222023 Form 10-K.
Loans
The table below details the average loans, by business and/or segment, and the total Citigroup end-of-period loans for each of the periods indicated:
| | | | | | | | | | | |
| In billions of dollars | 2Q23 | 1Q23 | 2Q22 |
| Personal Banking and Wealth Management | | | |
| U.S. Retail banking | $ | 40 | | $ | 38 | | $ | 34 | |
| U.S. Cards | 149 | | 146 | | 133 | |
| Global Wealth | 150 | | 149 | | 150 | |
| Total | $ | 339 | | $ | 333 | | $ | 317 | |
| Institutional Clients Group | | | |
| Services | $ | 80 | | $ | 79 | | $ | 85 | |
| Banking | 185 | | 191 | | 199 | |
| Markets | 13 | | 13 | | 13 | |
| Total | $ | 278 | | $ | 283 | | $ | 297 | |
Total Legacy Franchises(1) | $ | 37 | | $ | 38 | | $ | 43 | |
| Total Citigroup loans (AVG) | $ | 654 | | $ | 654 | | $ | 657 | |
| Total Citigroup loans (EOP) | $ | 661 | | $ | 652 | | $ | 657 | |
(1)See footnote 2 to the table in “Credit Risk—Consumer Credit—Consumer Credit Portfolio” below. | | | | | | | | | | | |
| In billions of dollars | 1Q24 | 4Q23 | 1Q23 |
| Services | $ | 82 | | $ | 83 | | $ | 79 | |
| Markets | 120 | | 115 | | 111 | |
| Banking | 89 | | 89 | | 95 | |
| USPB | | | |
| Branded Cards | $ | 108 | | $ | 107 | | $ | 97 | |
| Retail Services | 52 | | 52 | | 49 | |
| Retail Banking | 44 | | 43 | | 38 | |
Total USPB | $ | 204 | | $ | 202 | | $ | 184 | |
| Wealth | $ | 150 | | $ | 150 | | $ | 150 | |
| All Other | $ | 34 | | $ | 36 | | $ | 35 | |
| Total Citigroup loans (AVG) | $ | 679 | | $ | 675 | | $ | 654 | |
| Total Citigroup loans (EOP) | $ | 675 | | $ | 689 | | $ | 652 | |
Citi’s loan portfolio is well diversified across consumerEnd-of-period loans increased 3% year-over-year, largely reflecting growth in cards in USPB and corporateMarkets. End-of-period loans with an aggregate duration of 1.2 years, as a majority of loans are at variable rates.decreased 2% sequentially, primarily driven by seasonality in USPB.
On an average basis, loans were largely unchangedincreased 4% year-over-year and sequentially as1% sequentially. The year-over-year increase was largely due to growth in PBWMUSPB, Services wasand Markets, partially offset by a decline in ICG Bankingand .
Legacy Franchises. PBWM
As of the first quarter of 2024, average loans for:
•USPBincreased 7%11% year-over-year, driven by growth in Branded Cards, Retail Banking and Retail Services.
•Wealth were largely unchanged.
•Services increased 4% year-over-year, primarily driven by loan growthstrong demand for working capital loans in cards, mortgagesTTS in North America and installmentinternationally.
•Markets increased 8% year-over-year, reflecting increased client demand in asset-backed lending.
•ICG Bankingaverage loans decreased 6% year-over-year, reflecting actions taken to reduce RWA. Legacy Franchises average loans decreased 14%, primarily reflecting the impact of the continued wind-downs, particularly in Korea, partially offsetdriven by higher lending volumes in Mexico Consumer.
End-of-period loans increased 1% year-over-year, as growth in PBWM, reflecting an increase in U.S. Personal Banking, was largely offset by declines in ICG and Legacy Franchises. End-of-period loans increased 1% sequentially.regulatory capital optimization efforts.
The following table details Citi’s corporate credit portfolio within ICGServices, Markets, Banking and the Mexico SBMM component of All Other—Legacy Franchises (excluding certain loans managed on a delinquency basis, loans carried at fair value and loans held-for-sale), and before consideration of collateral or hedges, by remaining tenor for the periods indicated:
| | | | June 30, 2023 | March 31, 2023 | December 31, 2022 | | March 31, 2024 | December 31, 2023 | March 31, 2023 |
| In billions of dollars | In billions of dollars | Due
within
1 year | Greater
than 1 year
but within
5 years | Greater
than
5 years | Total
exposure | Due
within
1 year | Greater
than 1 year
but within
5 years | Greater
than
5 years | Total
exposure | Due
within
1 year | Greater
than 1 year
but within
5 years | Greater
than
5 years | Total
exposure | In billions of dollars | Due
within
1 year | Greater
than 1 year
but within
5 years | Greater
than
5 years | Total
exposure | Due
within
1 year | Greater
than 1 year
but within
5 years | Greater
than
5 years | Total
exposure | Due
within
1 year | Greater
than 1 year
but within
5 years | Greater
than
5 years | Total
exposure |
Direct outstandings (on-balance sheet)(1) | Direct outstandings (on-balance sheet)(1) | $ | 127 | | $ | 118 | | $ | 35 | | $ | 280 | | $ | 124 | | $ | 124 | | $ | 35 | | $ | 283 | | $ | 134 | | $ | 122 | | $ | 27 | | $ | 283 | |
Unfunded lending commitments (off-balance sheet)(2) | Unfunded lending commitments (off-balance sheet)(2) | 135 | | 260 | | 16 | | 411 | | 126 | | 256 | | 16 | | 398 | | 140 | | 256 | | 10 | | 406 | |
| Total exposure | Total exposure | $ | 262 | | $ | 378 | | $ | 51 | | $ | 691 | | $ | 250 | | $ | 380 | | $ | 51 | | $ | 681 | | $ | 274 | | $ | 378 | | $ | 37 | | $ | 689 | |
(1) Includes drawn loans, overdrafts, bankers’ acceptances and leases.
(2) Includes unused commitments to lend, letters of credit and financial guarantees.
Portfolio Mix—Geography and Counterparty
Citi’s corporate credit portfolio is diverse across geography and counterparty. The following table presents the percentage of this portfolio by region based on Citi’s internal management geography:
| | | | | | | | | | | |
| June 30,
2023 | March 31, 2023 | December 31,
2022 |
| North America | 56 | % | 56 | % | 56 | % |
| EMEA | 25 | | 25 | | 25 | |
| Asia | 12 | | 12 | | 12 | |
| Latin America | 7 | | 7 | | 7 | |
| Total | 100 | % | 100 | % | 100 | % |
| | | | | | | | | | | |
| March 31,
2024 | December 31, 2023 | March 31,
2023 |
| North America | 57 | % | 56 | % | 56 | % |
| International | 43 | | 44 | | 44 | |
| Total | 100 | % | 100 | % | 100 | % |
The maintenance of accurate and consistent risk ratings across the corporate credit portfolio facilitates the comparison of credit exposure across all lines of business, geographic regionsgeographies and products. Counterparty risk ratings reflect an estimated probability of default for a counterparty, and internal risk ratings are derived by leveraging validated statistical models and scorecards in combination with consideration of factors specific to the obligor or market, such as management experience, competitive position, regulatory environment and commodity prices. Facility risk ratings are assigned that reflect the probability of default of the obligor and factors that affect the loss given default of the facility, such as support or collateral. Internal obligor ratings that generally correspond to BBB and above are considered investment grade, while those below are considered non-investment grade.
The following table presents the corporate credit portfolio by facility risk rating as a percentage of the total corporate credit portfolio:
| | | | Total exposure | | Total exposure |
| | | June 30,
2023 | March 31,
2023 | December 31,
2022 | | March 31,
2024 | December 31,
2023 | March 31,
2023 |
| AAA/AA/A | AAA/AA/A | 49 | % | 50 | % | 50 | % | AAA/AA/A | 50 | % | 50 | % | 50 | % |
| BBB | BBB | 34 | | 33 | | 34 | |
| BB/B | BB/B | 15 | | 15 | | 14 | |
| CCC or below | CCC or below | 2 | | 2 | | 2 | |
| Total | Total | 100 | % | 100 | % | 100 | % | Total | 100 | % | 100 | % | 100 | % |
Note: Total exposure includes direct outstandings and unfunded lending commitments.
In addition to the obligor and facility risk ratings assigned to all exposures, Citi may classify exposures in the corporate credit portfolio. These classifications are consistent with Citi’s interpretation of the U.S. banking regulators’ definition of criticized exposures, which may categorize exposures as special mention, substandard, doubtful or loss.
Risk ratings and classifications are reviewed regularly and adjusted as appropriate. The credit review process incorporates quantitative and qualitative factors, including financial and non-financial disclosures or metrics, idiosyncratic events or changes to the competitive, regulatory or macroeconomic environment.
Citi believes the corporate credit portfolio to be appropriately rated and classified as of June 30, 2023.March 31, 2024. Citi has taken action to adjust internal ratings and classifications of exposures as both the macroeconomic environment and obligor-specific factors have changed, particularly where additional stress has been seen.observed.
As obligor risk ratings are downgraded, the probability of default increases. Downgrades of obligor risk ratings tend to result in a higher provision for credit losses. In addition, appetite per obligor is reduced consistent with the ratings, and downgrades may result in the purchase of additional credit derivatives or other risk/structural mitigants to hedge the incremental credit risk, or may result in Citi’sCiti seeking to reduce exposure to an obligor or an industry sector. Citi will continue to review exposures to ensure that the appropriate probability of default is incorporated into all risk assessments.
See Note 1314 for additional information on Citi’s corporate credit portfolio.
Portfolio Mix—Industry
Citi’s corporate credit portfolio is diversified by industry. The following table details the allocation of Citi’s total corporate credit portfolio by industry:
| | | | Total exposure | | Total exposure |
| | | June 30,
2023 | March 31,
2023 | December 31,
2022 | | March 31,
2024 | December 31,
2023 | March 31,
2023 |
| Transportation and industrials | Transportation and industrials | 21 | % | 21 | % | 20 | % | Transportation and industrials | 20 | % | 21 | % | 21 | % |
| Technology, media and telecom | Technology, media and telecom | 12 | | 12 | | 12 | |
Banks and finance companies(1) | |
| Consumer retail | Consumer retail | 12 | | 12 | | 11 | |
| Real estate | Real estate | 10 | | 10 | | 10 | |
| Commercial | Commercial | 8 | | 8 | | 8 | |
| Residential | Residential | 2 | | 2 | | 2 | |
Banks and finance companies(1) | 10 | | 10 | | 10 | |
| Power, chemicals, metals and mining | Power, chemicals, metals and mining | 9 | | 9 | | 9 | |
| Energy and commodities | Energy and commodities | 7 | | 7 | | 7 | |
| Health | Health | 6 | | 5 | | 6 | |
| Insurance | Insurance | 4 | | 4 | | 4 | |
| Public sector | |
| Asset managers and funds | Asset managers and funds | 3 | | 4 | | 5 | |
| Public sector | 3 | | 3 | | 3 | |
| Financial markets infrastructure | Financial markets infrastructure | 2 | | 2 | | 2 | |
| | Other industries | Other industries | 1 | | 1 | | 1 | |
| Other industries | |
| Other industries | |
| Total | Total | 100 | % | 100 | % | 100 | % | Total | 100 | % | 100 | % | 100 | % |
(1) As of the periods in the table, Citi had less than 1% exposure to securities firms. See corporate credit portfolio by industry, below.
The following table details Citi’s corporate credit portfolio by industry as of June 30, 2023:March 31, 2024:
| | Non-investment grade | | Selected metrics |
| | | | | Non-investment grade | |
| | | | | Non-investment grade | |
| | | | | Non-investment grade | | | Selected metrics |
| In millions of dollars | In millions of dollars | Total credit exposure | Funded(1) | Unfunded(1) | Investment grade | Non-criticized | Criticized performing | Criticized non-performing(2) | | 30 days or more past due and accruing | Net credit losses (recoveries) | Credit derivative hedges(3) | In millions of dollars | Total credit exposure | Funded(1) | Unfunded | Investment grade | Non-criticized | Criticized performing | Criticized non-performing(2) | | 30 days or more past due and accruing | Net credit losses (recoveries) | Credit derivative hedges(3) |
| Transportation and industrials | Transportation and industrials | $ | 143,468 | | $ | 58,248 | | $ | 85,220 | | $ | 112,885 | | $ | 23,826 | | $ | 6,452 | | $ | 305 | | | $ | 169 | | $ | 28 | | $ | (7,471) | |
Autos(4) | Autos(4) | 47,759 | | 21,016 | | 26,743 | | 41,253 | | 5,187 | | 1,268 | | 51 | | | 9 | | 18 | | (2,444) | |
| Transportation | Transportation | 26,137 | | 10,325 | | 15,812 | | 18,924 | | 4,842 | | 2,286 | | 85 | | | 15 | | 8 | | (1,234) | |
| Industrials | Industrials | 69,572 | | 26,907 | | 42,665 | | 52,708 | | 13,797 | | 2,898 | | 169 | | | 145 | | 2 | | (3,793) | |
| Technology, media and telecom | Technology, media and telecom | 81,826 | | 28,948 | | 52,878 | | 65,469 | | 12,272 | | 3,769 | | 316 | | | 101 | | 13 | | (6,323) | |
| Banks and finance companies | |
| Consumer retail | Consumer retail | 81,114 | | 34,327 | | 46,787 | | 64,081 | | 13,672 | | 3,102 | | 259 | | | 142 | | 13 | | (5,373) | |
| Real estate | Real estate | 69,162 | | 48,142 | | 21,020 | | 61,329 | | 4,018 | | 3,640 | | 175 | | | 57 | | 5 | | (681) | |
| Commercial | Commercial | 54,395 | | 35,155 | | 19,240 | | 46,639 | | 4,012 | | 3,569 | | 175 | | | 57 | | 5 | | (681) | |
| Residential | Residential | 14,767 | | 12,987 | | 1,780 | | 14,690 | | 6 | | 71 | | — | | | — | | — | | — | |
| Banks and finance companies | 71,627 | | 43,277 | | 28,350 | | 60,984 | | 9,138 | | 1,360 | | 145 | | | 12 | | 31 | | (801) | |
| Power, chemicals, metals and mining | Power, chemicals, metals and mining | 60,783 | | 19,869 | | 40,914 | | 47,267 | | 11,649 | | 1,706 | | 161 | | | 149 | | 8 | | (4,964) | |
| Power | Power | 24,033 | | 4,878 | | 19,155 | | 19,936 | | 3,371 | | 598 | | 128 | | | 22 | | 7 | | (2,239) | |
| Chemicals | Chemicals | 22,477 | | 8,658 | | 13,819 | | 17,252 | | 4,503 | | 711 | | 11 | | | 44 | | 1 | | (2,084) | |
| Metals and mining | Metals and mining | 14,273 | | 6,333 | | 7,940 | | 10,079 | | 3,775 | | 397 | | 22 | | | 83 | | — | | (641) | |
Energy and commodities(5) | Energy and commodities(5) | 44,895 | | 12,799 | | 32,096 | | 37,771 | | 5,970 | | 1,040 | | 114 | | | 43 | | (12) | | (3,337) | |
| Health | Health | 38,213 | | 9,560 | | 28,653 | | 32,247 | | 4,457 | | 1,360 | | 149 | | | 22 | | 7 | | (2,935) | |
| Insurance | Insurance | 29,640 | | 4,101 | | 25,539 | | 28,732 | | 884 | | 24 | | — | | | 9 | | — | | (4,775) | |
| Asset managers and funds | 23,503 | | 6,384 | | 17,119 | | 21,880 | | 1,537 | | 73 | | 13 | | | 227 | | — | | (272) | |
| Public sector | Public sector | 24,042 | | 10,849 | | 13,193 | | 20,839 | | 2,732 | | 462 | | 9 | | | 23 | | 4 | | (1,562) | |
| Financial markets infrastructure | Financial markets infrastructure | 16,701 | | 141 | | 16,560 | | 16,701 | | — | | — | | — | | | 66 | | — | | (7) | |
| Asset managers and funds | |
| Securities firms | Securities firms | 1,216 | | 292 | | 924 | | 788 | | 395 | | 33 | | — | | | 5 | | — | | (2) | |
| Other industries | 5,139 | | 2,914 | | 2,225 | | 3,157 | | 1,717 | | 252 | | 13 | | | 40 | | — | | (10) | |
Other industries(6) | |
| Total | Total | $ | 691,329 | | $ | 279,851 | | $ | 411,478 | | $ | 574,130 | | $ | 92,267 | | $ | 23,273 | | $ | 1,659 | | | $ | 1,065 | | $ | 97 | | $ | (38,513) | |
(1) Excludes $0.6 billion and $0.1 billion of funded and unfunded exposure at June 30, 2023, respectively, primarily related to the delinquency-managed loans. Funded balances also excludeexcludes loans carried at fair value of $5.5$8.6 billion at June 30, 2023.March 31, 2024.
(2) Includes non-accrual loan exposures and related criticized unfunded exposures.
(3) Represents the amount of purchased credit protection in the form of derivatives to economically hedge funded and unfunded exposures. Of the $38.5$38.4 billion of purchased credit protection, $35.9$35.5 billion represents the total notional amount of purchased credit derivatives on individual reference entities. The remaining $2.6$2.9 billion represents the first loss tranche of portfolios of purchased credit derivatives with a total notional of $20.9$22.3 billion, where the protection seller absorbs the first loss on the referenced loan portfolios.
(4) Autos total credit exposure includes securitization financing facilities secured by auto loans and leases, extended mainly to the finance company subsidiaries of global auto manufacturers, bank subsidiaries and independent auto finance companies, of approximately $16.9$16.1 billion ($8.77.9 billion in funded, with 100% rated investment grade) as of June 30, 2023.March 31, 2024.
(5) In addition to this exposure, Citi has energy-related exposure within the public sector (e.g., energy-related state-owned entities) and the transportation and industrials sector (e.g., off-shore drilling entities) included in the table above. As of June 30, 2023,March 31, 2024, Citi’s total exposure to these energy-related entities was approximately $4.8$5.0 billion, of which approximately $2.4$2.5 billion consisted of direct outstanding funded loans.
(6) Includes $0.8 billion and $0.1 billion of funded and unfunded exposure at March 31, 2024, respectively, primarily related to commercial credit card delinquency-managed loans.
Exposure to Commercial Real Estate
As of June 30, 2023,March 31, 2024, Citi’s total credit exposure to commercial real estate (CRE) was $64 billion (compared to $66 billion (unchanged from Marchat December 31, 2023), including $8 billion of exposure related to office buildings. This total CRE exposure consisted of (i) approximately $55$53 billion related to corporate clients, (unchanged from March 31, 2023), mainly included in the real estate category in the table above, and (ii) approximately $11 billion related to Private bankWealth clients (unchanged from March 31, 2023) within PBWM that is not in the table above as they are not considered corporate exposures.
In addition, as of June 30, 2023,March 31, 2024, approximately 87%78% of Citi’s total CRE exposure was rated investment grade and more than 76%77% was to borrowers in the U.S.
As of June 30, 2023,March 31, 2024, the ACLL attributed to the total funded CRE exposure (including the Private bank)Wealth) was approximately 1.24%1.76%, and there were $160$678 million of non-accrual CRE loans.
The following table details Citi’s corporate credit portfolio by industry as of December 31, 2022:2023:
| | Non-investment grade | | Selected metrics |
| | | | | Non-investment grade | |
| | | | | Non-investment grade | |
| | | | | Non-investment grade | | | Selected metrics |
| In millions of dollars | In millions of dollars | Total credit exposure | Funded(1) | Unfunded(1) | Investment grade | Non-criticized | Criticized performing | Criticized non-performing(2) | | 30 days or more past due and accruing | Net credit losses (recoveries) | Credit derivative hedges(3) | In millions of dollars | Total credit exposure | Funded(1) | Unfunded | Investment grade | Non-criticized | Criticized performing | Criticized non-performing(2) | | 30 days or more past due and accruing | Net credit losses (recoveries) | Credit derivative hedges(3) |
| Transportation and industrials | Transportation and industrials | $ | 139,225 | | $ | 57,271 | | $ | 81,954 | | $ | 109,197 | | $ | 19,697 | | $ | 9,850 | | $ | 481 | | | $ | 403 | | $ | — | | $ | (8,459) | |
Autos(4) | Autos(4) | 47,482 | | 21,995 | | 25,487 | | 40,795 | | 5,171 | | 1,391 | | 125 | | | 52 | | — | | (3,084) | |
| Transportation | Transportation | 24,843 | | 10,374 | | 14,469 | | 18,078 | | 3,156 | | 3,444 | | 165 | | | 57 | | (30) | | (1,270) | |
| Industrials | Industrials | 66,900 | | 24,902 | | 41,998 | | 50,324 | | 11,370 | | 5,015 | | 191 | | | 294 | | 30 | | (4,105) | |
| Technology, media and telecom | Technology, media and telecom | 81,211 | | 28,931 | | 52,280 | | 65,386 | | 12,308 | | 3,308 | | 209 | | | 169 | | 11 | | (6,050) | |
| Banks and finance companies | |
| Consumer retail | Consumer retail | 78,255 | | 32,687 | | 45,568 | | 60,215 | | 14,830 | | 2,910 | | 300 | | | 195 | | 28 | | (5,395) | |
| Real estate | Real estate | 70,676 | | 48,539 | | 22,137 | | 63,023 | | 4,722 | | 2,881 | | 50 | | | 138 | | 2 | | (739) | |
| Commercial | Commercial | 54,139 | | 34,112 | | 20,027 | | 46,670 | | 4,716 | | 2,703 | | 50 | | | 96 | | 2 | | (739) | |
| Residential | Residential | 16,537 | | 14,427 | | 2,110 | | 16,353 | | 6 | | 178 | | — | | | 42 | | — | | — | |
| Banks and finance companies | 65,623 | | 42,276 | | 23,347 | | 57,368 | | 5,718 | | 2,387 | | 150 | | | 266 | | 65 | | (1,113) | |
| Power, chemicals, metals and mining | Power, chemicals, metals and mining | 59,404 | | 18,326 | | 41,078 | | 47,395 | | 10,466 | | 1,437 | | 106 | | | 226 | | 34 | | (5,063) | |
| Power | Power | 22,718 | | 4,827 | | 17,891 | | 18,822 | | 3,325 | | 512 | | 59 | | | 129 | | (3) | | (2,306) | |
| Chemicals | Chemicals | 23,147 | | 7,765 | | 15,382 | | 19,033 | | 3,534 | | 564 | | 16 | | | 55 | | 30 | | (2,098) | |
| Metals and mining | Metals and mining | 13,539 | | 5,734 | | 7,805 | | 9,540 | | 3,607 | | 361 | | 31 | | | 42 | | 7 | | (659) | |
Energy and commodities(5) | Energy and commodities(5) | 46,309 | | 13,069 | | 33,240 | | 38,918 | | 6,076 | | 1,200 | | 115 | | | 180 | | 11 | | (3,852) | |
| Health | Health | 41,836 | | 8,771 | | 33,065 | | 36,954 | | 3,737 | | 978 | | 167 | | | 84 | | 7 | | (2,855) | |
| Insurance | Insurance | 29,932 | | 4,417 | | 25,515 | | 29,090 | | 801 | | 41 | | — | | | 44 | | — | | (3,884) | |
| Public sector | |
| Asset managers and funds | Asset managers and funds | 35,983 | | 13,162 | | 22,821 | | 34,431 | | 1,492 | | 60 | | — | | | 95 | | — | | (759) | |
| Public sector | 23,705 | | 11,736 | | 11,969 | | 20,663 | | 2,084 | | 956 | | 2 | | | 77 | | 4 | | (1,633) | |
| Financial markets infrastructure | Financial markets infrastructure | 8,742 | | 60 | | 8,682 | | 8,672 | | 70 | | — | | — | | | — | | — | | (18) | |
| Securities firms | Securities firms | 1,462 | | 569 | | 893 | | 625 | | 678 | | 157 | | 2 | | | 2 | | — | | (2) | |
| Other industries | 6,697 | | 3,651 | | 3,046 | | 4,842 | | 1,568 | | 238 | | 49 | | | 19 | | 16 | | (8) | |
Other industries(6) | |
| Total | Total | $ | 689,060 | | $ | 283,465 | | $ | 405,595 | | $ | 576,779 | | $ | 84,247 | | $ | 26,403 | | $ | 1,631 | | | $ | 1,898 | | $ | 178 | | $ | (39,830) | |
(1) Excludes $0.6 billion and $0.1 billion of funded and unfunded exposure at December 31, 2022, respectively, primarily related to the delinquency-managed loans. Funded balances also excludeexcludes loans carried at fair value of $5.1$7.3 billion at December 31, 2022.2023.
(2) Includes non-accrual loan exposures and related criticized unfunded exposures.
(3) Represents the amount of purchased credit protection in the form of derivatives to economically hedge funded and unfunded exposures. Of the $39.8$35.9 billion of purchased credit protection, $36.6$33.7 billion represents the total notional amount of purchased credit derivatives on individual reference entities. The remaining $3.2$2.2 billion represents the first loss tranche of portfolios of purchased credit derivatives with a total notional of $27.6$16.7 billion, where the protection seller absorbs the first loss on the referenced loan portfolios.
(4) Autos total credit exposure includes securitization financing facilities secured by auto loans and leases, extended mainly to the finance company subsidiaries of global auto manufacturers, bank subsidiaries and independent auto finance companies, of approximately $17.4$16.9 billion ($10.310.6 billion in funded, with more than 99%100% rated investment grade) as of December 31, 2022.2023.
(5) In addition to this exposure, Citi has energy-related exposure within the public sector (e.g., energy-related state-owned entities) and the transportation and industrials sector (e.g., off-shore drilling entities) included in the table above. As of December 31, 2022,2023, Citi’s total exposure to these energy-related entities was approximately $4.7$4.9 billion, of which approximately $2.4$2.5 billion consisted of direct outstanding funded loans.
(6) Includes $0.6 billion and $0.1 billion of funded and unfunded exposure at December 31, 2023, respectively, primarily related to commercial credit card delinquency-managed loans.
Credit Risk Mitigation
As part of its overall risk management activities, Citigroup uses credit derivatives, both partial and full term, and other risk mitigants to economically hedge portions of the credit risk in its corporate credit portfolio, in addition to outright asset sales. Citi may enter into partial-term hedges as well as full-term hedges. In advance of the expiration of partial-term economic hedges, Citi will determine, among other factors, the economic feasibility of hedging the remaining life of the instrument. The results of the mark-to-market and any realized gains or losses on credit derivatives are reflected primarily in Principal transactions in the Consolidated Statement of Income.
At June 30,March 31, 2024, December 31, 2023 and March 31, 2023, and Dec 31, 2022, ICGBanking had economic hedges on the corporate credit portfolio of $38.5$38.4 billion, $39.8$35.9 billion and $39.8 billion, respectively. Citi’s expected credit loss model used in the calculation of its ACL does not include the favorable impact of credit derivatives and other mitigants that are marked-to-market. In addition, the reported amounts of direct outstandings and unfunded lending commitments in the tables above do not reflect the impact of these hedging transactions. The credit protection was economically hedging underlying ICGBanking corporate credit portfolio exposures with the following risk rating distribution:
Rating of Hedged Exposure
| | June 30,
2023 | March 31,
2023 | December 31,
2022 |
| March 31,
2024 | | | March 31,
2024 | December 31,
2023 | March 31,
2023 |
| AAA/AA/A | AAA/AA/A | 42 | % | 42 | % | 39 | % | AAA/AA/A | 45 | % | 45 | % | 42 | % |
| BBB | BBB | 43 | | 44 | | 45 | |
| BB/B | BB/B | 13 | | 11 | | 12 | |
| CCC or below | CCC or below | 2 | | 3 | | 4 | |
| Total | Total | 100 | % | 100 | % | 100 | % | Total | 100 | % | 100 | % | 100 | % |
Consumer Credit Portfolio
The following table presents Citi’s quarterly end-of-period consumer loans(1):
| | In billions of dollars | In billions of dollars | 2Q22(2) | 3Q22(2) | 4Q22(2) | 1Q23(2) | 2Q23(2) | In billions of dollars | 1Q23 | 2Q23 | 3Q23 | 4Q23 | 1Q24 |
| Personal Banking and Wealth Management | |
| U.S. Personal Banking | |
| USPB | |
| Branded Cards | |
| Branded Cards | |
| Branded Cards | |
| Retail Services | |
| Retail Banking | | Retail Banking | 39.2 | 41.5 | 43.1 | 44.4 | 45.6 |
Mortgages(2) | |
| Personal, small business and other | |
| Total | |
Wealth(3)(4) | |
Mortgages(2) | |
Mortgages(2) | |
Mortgages(2) | |
Margin lending(5) | |
Personal, small business and other(6) | |
| Cards | Cards | |
| Branded cards | $ | 91.6 | | $ | 93.7 | | $ | 100.2 | | $ | 97.1 | | $ | 103.0 | |
| Retail services | 45.8 | | 46.7 | | 50.5 | | 48.4 | | 50.0 | |
| Retail banking | |
Mortgages(5) | 32.3 | | 32.3 | | 33.4 | | 35.3 | | 37.4 | |
| Personal, small business and other | 3.1 | | 3.5 | | 3.7 | | 3.9 | | 4.1 | |
Global Wealth(3)(4) | |
| Cards | 4.0 | | 4.0 | | 4.6 | | 4.4 | | 4.5 | |
Mortgages(5) | 77.8 | | 82.0 | | 84.0 | | 85.2 | | 87.0 | |
Personal, small business and other(6) | 67.0 | | 65.1 | | 60.6 | | 60.3 | | 59.0 | |
| Total | Total | $ | 321.6 | | $ | 327.3 | | $ | 337.0 | | $ | 334.6 | | $ | 345.0 | |
| Legacy Franchises | |
All Other—Legacy Franchises | |
| Mexico Consumer (excludes Mexico SBMM) | |
| Mexico Consumer (excludes Mexico SBMM) | |
| Mexico Consumer (excludes Mexico SBMM) | |
Asia Consumer(7) | Asia Consumer(7) | $ | 17.3 | | $ | 13.4 | | $ | 13.3 | | $ | 10.0 | | $ | 9.1 | |
| Mexico Consumer (excludes Mexico SBMM) | 13.5 | | 13.7 | | 14.8 | | 16.3 | | 17.8 | |
Legacy Holdings Assets(8) | Legacy Holdings Assets(8) | 3.2 | | 3.2 | | 3.0 | | 2.8 | | 2.7 | |
| Total | Total | $ | 34.0 | | $ | 30.3 | | $ | 31.1 | | $ | 29.1 | | $ | 29.6 | |
| Total consumer loans | Total consumer loans | $ | 355.6 | | $ | 357.6 | | $ | 368.1 | | $ | 363.7 | | $ | 374.6 | |
(1)End-of-period loans include interest and fees on credit cards.
(2)Asia Consumer loan balances, reported within Legacy Franchises, exclude any loans reclassified to held-for-sale (HFS) as of the date Citi enters into a sale agreement for the respective Asia Consumer banking business. These reclassified HFS loans are instead reported in Other assets on the Consolidated Balance Sheet until sale closing. The remaining Asia Consumer loan portfolios—China, Korea, Russia and Poland—are held-for-investment and included in end-of-period consumer loans for all periods presented. All HFS portfolios were reclassified prior to the end of 1Q22 except for a $1.8 billion portfolio, which was moved to HFS in 1Q23.
(3)Consists of $99.5 billion, $98.9 billion, $98.2 billion, $99.3 billion and $94.6 billion of loans in North America as of June 30, 2023, March 31, 2023, December 31, 2022, September 30, 2022 and June 30, 2022, respectively. For additional information on the credit quality of the Global Wealth portfolio, see Note 13.
(4)Consists of $51.0 billion, $51.0 billion, $51.0 billion, $51.8 billion and $54.2 billion of loans outside North America as of June 30, 2023, March 31, 2023, December 31, 2022, September 30, 2022 and June 30, 2022, respectively.
(5)See Note 1314 for details on loan-to-value ratios for the portfolios and FICO scores for the U.S. portfolio.
(6)(3)AtConsists of $100.0 billion, $101.6 billion, $101.1 billion, $99.5 billion and $98.9 billion of loans in North America as of March 31, 2024, December 31, 2023, September 30, 2023, June 30, 2023 and March 31, 2023, respectively. For additional information on the credit quality of the Wealth portfolio, see Note 14.
(4)Consists of $49.0 billion, $49.9 billion, $49.5 billion, $51.0 billion and $51.0 billion of loans outside North America as of March 31, 2024, December 31, 2023, September 30, 2023, June 30, 2023 and March 31, 2023, respectively.
(5)At March 31, 2024, includes approximately $48$22 billion of classifiably managed loans fully collateralized by eligible financial assets and securities that have experienced very low historical net credit losses (NCLs). Approximately 76% of the classifiably managed portion of these loans are investment grade.
(6)At March 31, 2024, includes approximately $22 billion of classifiably managed loans. Over 90%Approximately 87% of these loans are fully collateralized (consisting primarily of marketable investment securities, commercial real estate and limited partner capital commitments in private equity) and have experienced very low historical net credit losses (NCLs). As discussed below, approximately 97%85% of the classifiably managed portion of these loans are investment grade. See “Consumer Loan Delinquencies Amounts and Ratios” below for details on the delinquency-managed portfolio.
(7)Asia Consumer also includes loansloan balances, reported within All Other—Legacy Franchises, include the four remaining Asia Consumer loan portfolios: Korea, Poland, China and leases in certain EMEA countries for all periods presented.Russia.
(8)Primarily consists of certain North America consumer mortgages.
For information on changes to Citi’s consumer loans, see “Credit Risk—Loans” above.
Consumer Credit Trends
Personal Banking and Wealth Management (PBWM)
| | |
U.S. Personal Banking and Wealth Management |
As indicated above, PBWMUSPB consists of U.S. Personal Banking and Global Wealth Management (Global Wealth). U.S. Personal Banking provides card products through Branded cardsCards and Retail services,Services, and also includes mortgages and home equity, small business and personal consumer loans through Citi’s Retail bankingBanking network. The Retail bankBanking is concentrated in six major U.S. metropolitan areas. Global WealthUSPB also provides investment services, cards, mortgages and personal, small business and other consumer loans through the Private bank, Wealth at Work and Citigold.correspondent channels.
As of June 30, 2023, 44%March 31, 2024, approximately 78% of PBWMUSPB consumerEOP loans consisted of U.S. cards loans.Branded Cards and Retail Services card loans, which generally drives the overall credit performance of USPB,as U.S. cards net credit losses represented approximately 93%96% of total PBWMUSPB losses.net credit losses for the first quarter of 2024. As of March 31, 2024, Branded Cards represented 68% of total U.S. cards EOP loans and Retail Services represented 32% of U.S. cards EOP loans.
As shownpresented in the chart above, the secondfirst quarter of 20232024 net credit loss rate in PBWM increased quarter-over-quarter and year-over-year, driven by a continued increase in net flow rates, primarily reflecting ongoing normalization from recent low levels in U.S. cards.
PBWM’s 90+ days past due delinquency rate was broadly stablein USPB increased quarter-over-quarter and increased year-over-year. The year-over-year, increase was largely driven by a continued increase in net flow rates, primarily reflecting the ongoing normalization in U.S. cards.continued maturation of cards loan vintages originated during the pandemic, with delayed losses due to unprecedented levels of government stimulus as well as the macroeconomic pressures related to the higher inflationary and interest rate environment impacting both cards portfolios.
U.S. Personal Banking’s’s Branded cardsCards portfolio includes proprietary and co-branded cards.
As shownpresented in the chart above, the secondfirst quarter of 20232024 net credit loss rate in Branded cards increased quarter-over-quarter and year-over-year, driven by a continued increase in net flow rates, primarily reflecting ongoing normalization toward pre-pandemic levels from recent low levels (for example, the 4Q’19 and 1Q’20 net credit loss rates were 3.10% and 3.40%, respectively).
The 90+ days past due delinquency rate in Branded Cards increased quarter-over-quarter and year-over-year, also driven by a continued increase in net flow rates, primarily reflecting the ongoing normalization toward pre-pandemiccontinued maturation of cards loan vintages originated during the pandemic, with delayed losses due to unprecedented levels from recent low levels (for example,of government stimulus as well as the 4Q’19impact of macroeconomic pressures related to the higher inflationary and 1Q’20 90+ days past due delinquency rates were 0.95% and 1.01%, respectively).interest rate environment impacting both cards portfolios.
U.S. Personal Banking’sUSPB’s Retail servicesServices partners directly with more than 20 retailers and dealers to offer private label and co-branded cards. Retail services’Services’ target market focuses on select industry segments such as home improvement, specialty retail, consumer electronics and fuel. Retail servicesServices continually evaluates opportunities to add partners within target industries that have strong loyalty, lending or payment programs and growth potential.
As shownpresented in the chart above, the secondfirst quarter of 20232024 net credit loss rate in Retail services increased quarter-over-quarter and year-over-year, driven by a continued increase in net flow rates, primarily reflecting the ongoing normalization toward pre-pandemic levels from recent low levels (for example, the 4Q’19 and 1Q’20 net credit loss rates were 5.05% and 5.35%, respectively).
The 90+ days past due delinquency rate was broadly stablein Retail Services increased quarter-over-quarter and increased year-over-year. The year-over-year, increase was driven by a continued increase in net flow rates, primarily reflecting the ongoing normalization (for example,continued maturation of cards loan vintages originated during the 4Q’19pandemic, with delayed losses due to unprecedented levels of government stimulus as well as the impact of macroeconomic pressures related to the higher inflationary and 1Q’20 90+ days past due delinquency rates were 1.91% and 1.96%, respectively).interest rate environment impacting both cards portfolios.
For additional information on cost of credit, loan delinquency and other information for Citi’s cards portfolios, see each respective business’s results of operations above and Note 13.14.
U.S. Personal Banking’sUSPB’s Retail bankingBanking portfolio consists primarily of consumer mortgages (including home equity) and unsecured lending products, such as small business loans and personal loans. The portfolio is generally delinquency managed, where Citi evaluates credit risk based on FICO scores, delinquencies and the value of underlying collateral. The consumer mortgages in this portfolio have historically been extended to high credit quality customers, generally with loan-to-value ratios that are less than or equal to 80% on first and second mortgages. For additional information, see “Loan-to-Value (LTV) Ratios” in Note 13.14.
As shownpresented in the chart above, the net credit loss rate in Retail bankingBanking for the secondfirst quarter of 2023 decreased2024 increased quarter-over-quarter, due to a decrease in overdraft losses, and decreased year-over-year, primarily driven by the impact of industry-wide episodicconsumer overdraft losses in the prior-year period.loans, and was broadly stable year-over-year.
The 90+ days past due delinquency rate decreased quarter-over-quarter and year-over-year, primarily driven by lower delinquencies in U.S. mortgages, which reflected the lasting effects of government stimulus, unemployment benefits and consumer relief programs.mortgages.
As discussedindicated above, the Global Wealth credit portfolio primarily consists of provides consumer mortgages, margin lending, cards and other lending products extended to customer segments that range from the affluent to ultra-high-net-worthultra-high net worth through the Private bank,Bank, Wealth at Work and Citigold. These customer segments represent a target market that is characterized by historically low default rates and delinquencies.delinquencies and includes loans that are delinquency managed or classifiably managed. The delinquency-managed portfolio consists primarily of mortgages, margin lending and cards.
As of June 30, 2023,March 31, 2024, approximately $48$44 billion, or 32%30%, of the portfolio wasportfolios were classifiably managed and primarily consisted of margin lending, commercial real estate, subscription credit finance and other lending programs. These
classifiably managed loans are primarily evaluated for credit risk based on their internal risk rating, of which 97%81% is rated investment grade. While the delinquency rate in the chart above is calculated only for the delinquency-managed portfolio, the net credit loss rate is calculated using net credit losses for both the delinquency and classifiably managed portfolios.
As shownpresented in the chart above, the first quarter of 2024 net credit loss rate and 90+ days past due delinquency rate in Wealth was broadly stable quarter-over-quarter and year-over-year. The low net credit loss and 90+ days past due delinquency rates in Global Wealth for the second quarter of 2023 were broadly stable quarter-over-quarter and year-over-year. The low levels of net credit losses and the 90+ days past due delinquency rate continued to reflect the strong credit profiles of the portfolios.
Legacy Franchises
(1)Asia Consumer includes Legacy Franchises activities in certain EMEA countries for all periods presented.
Asia Consumer provides credit cards, consumer mortgages and small business and personal loans. Asia Consumer also includes loans and leases in certain EMEA countries for all periods presented.
As shown in the chart above, the net credit loss rate in Asia Consumer (for the remaining consumer banking portfolios held-for-investment (China, Korea, Russia and Poland)) for the second quarter of 2023 increased quarter-over-quarter and year-over-year. The increases were primarily driven by lower average loans due to the ongoing wind-downs of the remaining businesses, particularly Korea, and the reclassification of a portfolio to HFS in the first quarter of 2023.
The 90+ days past due delinquency rate was unchanged quarter-over-quarter and increased year-over-year, mainly driven by lower loans due to the ongoing wind-downs of the remaining businesses and the reclassification of a portfolio to HFS in the first quarter of 2023. The overall performance of the remaining Asia Consumer portfolios continues to reflect the strong credit profiles of the customer segments.
Mexico Consumer operates in Mexico through Citibanamex and provides credit cards, consumer mortgages and small business and personal loans. Mexico Consumer serves a more mass-market segment in Mexico and focuses on developing multiproduct relationships with customers.
As shownpresented in the chart above, the first quarter of 2024 net credit loss rate in Mexico Consumer for the second quarter of 2023 decreasedincreased quarter-over-quarter primarily due to higher recoveries in the second quarter of 2023, and increased year-over-year, primarily driven by the gradualongoing normalization of loss rates after peak losses experienced during the pandemic.from post-pandemic lows.
The 90+ days past due delinquency rate increasedwas broadly stable quarter-over-quarter and increased year-over-year, primarily driven by the gradualongoing normalization of delinquency rates after peak delinquencies during the pandemic.from post-pandemic lows.
For additional informationdetails on cost of credit, loan delinquency and other information for Citi’s consumer loan portfolios, see each respective business’s results of operations above and Note 13.14.
U.S. Cards FICO Distribution
The following tables present the current FICO score distributions for Citi’s Branded cardsCards and Retail servicesServices portfolios based on end-of-period receivables. FICO scores are updated monthly for substantially all of the portfolioas they become available. The following FICO bands were updated from previous disclosures (> 760, 680–760, and on a quarterly basis for the remaining portfolio.< 680).
Branded Cards
| | | | | | | | | | | |
FICO distribution(1) | June 30, 2023 | March 31, 2023 | June 30, 2022 |
| > 760 | 47 | % | 45 | % | 49 | % |
| 680–760 | 38 | | 39 | | 38 | |
| < 680 | 15 | | 16 | | 13 | |
| Total | 100 | % | 100 | % | 100 | % |
| | | | | | | | | | | |
FICO distribution(1) | March 31, 2024 | December 31, 2023 | March 31, 2023 |
| ≥ 740 | 55 | % | 57 | % | 56 | % |
| 660–739 | 34 | | 33 | | 34 | |
| < 660 | 11 | | 10 | | 10 | |
| Total | 100 | % | 100 | % | 100 | % |
Retail Services
| | | | | | | | | | | |
FICO distribution(1) | June 30, 2023 | March 31, 2023 | June 30, 2022 |
| > 760 | 27 | % | 26 | % | 28 | % |
| 680–760 | 42 | | 42 | | 43 | |
| < 680 | 31 | | 32 | | 29 | |
| Total | 100 | % | 100 | % | 100 | % |
| | | | | | | | | | | |
FICO distribution(1) | March 31, 2024 | December 31, 2023 | March 31, 2023 |
| ≥ 740 | 34 | % | 35 | % | 35 | % |
| 660–739 | 42 | | 42 | | 43 | |
| < 660 | 24 | | 23 | | 22 | |
| Total | 100 | % | 100 | % | 100 | % |
(1) TheExcludes immaterial balances for Canada and for customers for which no FICO bands in the tablesscores are consistent with general industry peer presentations.available.
The FICO distribution of both card portfolios trended updeclined slightly from the prior quarter reflecting seasonal portfolio quality improvements, and declined from the prior year, primarily reflecting continued maturation of cards loan vintages originated during the ongoing normalization in net credit losspandemic, as well as macroeconomic pressures related to the higher inflationary and delinquency rates ininterest rate environment impacting both cards portfolios. The FICO distribution continued to reflect strong underlying credit quality and benefits fromof the continued impacts of government stimulus, unemployment benefits and customer relief programs.portfolios. See Note 1314 for additional information on FICO scores.
Additional Consumer Credit Details
Consumer Loan Delinquencies Amounts and Ratios
| | | | EOP loans(1) | 90+ days past due(2) | 30–89 days past due(2) | | EOP loans(1) | 90+ days past due(2) | 30–89 days past due(2) |
In millions of dollars,
except EOP loan amounts in billions | In millions of dollars,
except EOP loan amounts in billions | June 30,
2023 | June 30,
2023 | March 31,
2023 | June 30,
2022 | June 30,
2023 | March 31,
2023 | June 30,
2022 | In millions of dollars,
except EOP loan amounts in billions | March 31,
2024 | March 31,
2024 | December 31,
2023 | March 31,
2023 | March 31,
2024 | December 31,
2023 | March 31,
2023 |
Personal Banking and Wealth Management(3)(4)(5) | | | | | |
USPB(3)(4) | |
| Total | Total | $ | 345.0 | | $ | 2,041 | | $ | 1,982 | | $ | 1,383 | | $ | 2,213 | | $ | 1,987 | | $ | 1,435 | |
| Ratio | | 0.69 | % | 0.70 | % | 0.52 | % | 0.75 | % | 0.70 | % | 0.54 | % |
| U.S. Personal Banking | | | | | |
| Total | |
| Total | Total | $ | 194.5 | | $ | 1,882 | | $ | 1,772 | | $ | 1,128 | | $ | 1,974 | | $ | 1,725 | | $ | 1,201 | |
| Ratio | Ratio | | 0.97 | % | 0.96 | % | 0.66 | % | 1.02 | % | 0.94 | % | 0.70 | % | Ratio | | 1.33 | % | 1.26 | % | 0.96 | % | 1.19 | % | 1.23 | % | 0.94 | % |
Cards(4) | Cards(4) | | | | | |
| Total | Total | 153.0 | | 1,723 | | 1,608 | | 949 | | 1,741 | | 1,545 | | 1,009 | |
| Ratio | | 1.13 | % | 1.11 | % | 0.69 | % | 1.14 | % | 1.06 | % | 0.73 | % |
| Branded cards | 103.0 | | 837 | | 754 | | 420 | | 834 | | 740 | | 428 | |
| Ratio | | 0.81 | % | 0.78 | % | 0.46 | % | 0.81 | % | 0.76 | % | 0.47 | % |
| Retail services | 50.0 | | 886 | | 854 | | 529 | | 907 | | 805 | | 581 | |
| Ratio | | 1.77 | % | 1.76 | % | 1.16 | % | 1.81 | % | 1.66 | % | 1.27 | % |
Retail banking(3) | 41.5 | | 159 | | 164 | | 179 | | 233 | | 180 | | 192 | |
| Ratio | | 0.39 | % | 0.42 | % | 0.52 | % | 0.57 | % | 0.47 | % | 0.55 | % |
Global Wealth delinquency-managed loans(5) | $ | 102.1 | | $ | 159 | | $ | 210 | | $ | 255 | | $ | 239 | | $ | 262 | | $ | 234 | |
| Ratio | | 0.16 | % | 0.21 | % | 0.27 | % | 0.23 | % | 0.26 | % | 0.25 | % |
Global Wealth classifiably managed loans(6) | $ | 48.4 | | N/A | N/A | N/A | N/A |
| Legacy Franchises | | | | | |
| Total | |
| Total | Total | $ | 29.6 | | $ | 413 | | $ | 393 | | $ | 393 | | $ | 359 | | $ | 338 | | $ | 293 | |
| Ratio | Ratio | | 1.40 | % | 1.36 | % | 1.16 | % | 1.22 | % | 1.17 | % | 0.87 | % | Ratio | | 1.61 | % | 1.49 | % | 1.11 | % | 1.38 | % | 1.39 | % | 1.06 | % |
Asia Consumer(7)(8) | 9.1 | | 50 | | 55 | | 51 | | 60 | | 65 | | 70 | |
| Branded Cards | |
| Ratio | | Ratio | | 1.19 | % | 1.07 | % | 0.78 | % | 1.01 | % | 1.03 | % | 0.76 | % |
| Retail Services | |
| Ratio | | Ratio | | 2.53 | % | 2.36 | % | 1.76 | % | 2.18 | % | 2.15 | % | 1.66 | % |
Retail Banking(3) | |
| Ratio | | Ratio | | 0.35 | % | 0.40 | % | 0.42 | % | 0.53 | % | 0.62 | % | 0.47 | % |
Wealth delinquency-managed loans(5) | |
| Ratio | | Ratio | | 0.20 | % | 0.18 | % | 0.21 | % | 0.31 | % | 0.30 | % | 0.26 | % |
Wealth classifiably managed loans(6) | | Wealth classifiably managed loans(6) | $ | 44.3 | | N/A | N/A | N/A | N/A |
| All Other | |
| Total | |
| Total | |
| Total | |
| Ratio | Ratio | | 0.55 | % | 0.55 | % | 0.29 | % | 0.66 | % | 0.65 | % | 0.40 | % | Ratio | | 1.36 | % | 1.43 | % | 1.36 | % | 1.31 | % | 1.35 | % | 1.17 | % |
| Mexico Consumer | Mexico Consumer | 17.8 | | 243 | | 202 | | 174 | | 228 | | 205 | | 159 | |
| Ratio | | Ratio | | 1.32 | % | 1.35 | % | 1.24 | % | 1.33 | % | 1.35 | % | 1.26 | % |
Asia Consumer(7)(8) | |
| Ratio | Ratio | | 1.37 | % | 1.24 | % | 1.29 | % | 1.28 | % | 1.26 | % | 1.18 | % | Ratio | | 0.43 | % | 0.69 | % | 0.55 | % | 0.58 | % | 0.80 | % | 0.65 | % |
Legacy Holdings Assets (consumer)(9) | Legacy Holdings Assets (consumer)(9) | 2.7 | | 120 | | 136 | | 168 | | 71 | | 68 | | 64 | |
| Ratio | Ratio | | 4.80 | % | 5.44 | % | 5.60 | % | 2.84 | % | 2.72 | % | 2.13 | % | Ratio | | 4.67 | % | 4.52 | % | 5.44 | % | 3.33 | % | 3.17 | % | 2.72 | % |
| Total Citigroup consumer | Total Citigroup consumer | $ | 374.6 | | $ | 2,454 | | $ | 2,375 | | $ | 1,776 | | $ | 2,572 | | $ | 2,325 | | $ | 1,728 | |
| Ratio | Ratio | | 0.75 | % | 0.76 | % | 0.59 | % | 0.79 | % | 0.74 | % | 0.58 | % | Ratio | | 0.98 | % | 0.94 | % | 0.76 | % | 0.93 | % | 0.95 | % | 0.74 | % |
(1)End-of-period (EOP) loans include interest and fees on credit cards.
(2)The ratios of 90+ days past due and 30–89 days past due are calculated based on EOP loans, net of unearned income.
(3)The 90+ days past due and 30–89 days past due and related ratios for Retail bankingBanking exclude loans guaranteed by U.S. government-sponsored agencies since the potential risk of loss predominantly resides with the U.S. government-sponsored agencies. The amounts excluded for loans 90+ days past due and (EOP loans) were $73$64 million ($0.5 billion), $63 million ($0.5 billion) and $80 million ($0.6 billion) and $119 million ($0.7 billion) at June 30, 2023, March 31, 2024, December 31, 2023 and June 30, 2022,March 31, 2023, respectively. The amounts excluded for loans 30–89 days past due (the 30–89 days past due EOP loans have the same adjustments as the 90+ days past due EOP loans) were $68$66 million, $73 million and $57 million and $72 million at June 30, 2023, March 31, 2024, December 31, 2023 and June 30, 2022,March 31, 2023, respectively. The EOP loans in the table include the guaranteed loans.
(4)The 90+ days past due balances for Branded cardsCards and Retail servicesServices are generally still accruing interest. Citi’s policy is generally to accrue interest on credit card loans until 180 days past due, unless notification of bankruptcy filing has been received earlier.
(5)Excludes EOP classifiably managed Private bankBank loans. These loans are not included in the delinquency numerator, denominator and ratios.
(6)These loans are evaluated for non-accrual status and write-off primarily based on their internal risk classification and not solely on their delinquency status and therefore, delinquency metrics are excluded from this table. As of June 30,March 31, 2024, December 31, 2023 and March 31, 2023, 81%, 85% and June 30, 2022, 97%, 93% and 94% of Global Wealth classifiably managed loans were rated investment grade. For additional information on the credit quality of the Global Wealth portfolio, including classifiably managed portfolios, see “Consumer Credit Trends” above.
(7)Asia Consumer includes delinquencies and loans in certain EMEAcountriesPoland and Russia for all periods presented.
(8)Citi has entered into agreements to sell certain Asia consumerConsumer banking businesses. Accordingly, the loans of these businesses have been reclassified as HFS in Other assets on the Consolidated Balance Sheet and, hence, the loans and related delinquencies and ratios are not included in this table. The most recent reclassifications commenced as follows: Bahrain, India,Taiwan and Indonesia Malaysia,in 1Q22; Taiwan Thailand and Vietnam in 1Q22 (Bahrain, Malaysia and Thailand closed in 4Q22; India3Q23 and VietnamIndonesia closed in 1Q23).4Q23. In addition, a portfolio was reclassified to HFS in the first quarter of 2023 and subsequently sold in the second quarter of 2023. See Note 2 for additional information.2.
(9)The 90+ days past due and 30–89 days past due and related ratios exclude U.S. mortgage loans that are primarily related to U.S. mortgages guaranteed by U.S. government-sponsored agencies since the potential risk of loss predominantly resides with the U.S. agencies. The amounts excluded for 90+ days past due and (EOP
(EOP loans) were $77$66 million ($0.2 billion), $67 million ($0.2 billion) and $81 million ($0.3 billion) and $84 million ($0.2 billion) at June 30, 2023, March 31, 2024, December 31, 2023 and June 30, 2022,March 31, 2023, respectively. The amounts excluded for loans 30–89 days past due (the 30–89 days past due EOP loans have the same adjustments as the 90+ days past due EOP loans) were $31$33 million, $36 million and $30 million and $27 million at June 30, 2023, March 31, 2024, December 31, 2023 and June 30, 2022,March 31, 2023, respectively. The EOP loans in the table include the guaranteed loans.
N/A Not applicable
Consumer Loan Net Credit Losses (NCLs) and Ratios
| | | |
| | | | Average loans(1) | Net credit losses(2) | |
| In millions of dollars, except average loan amounts in billions | In millions of dollars, except average loan amounts in billions | 2Q23 | 1Q23 | 2Q22 | |
Personal Banking and Wealth Management(2) | | | | |
| In millions of dollars, except average loan amounts in billions | |
| In millions of dollars, except average loan amounts in billions | |
| USPB | |
| USPB | |
| USPB | |
| Total | |
| Total | |
| Total | Total | $ | 338.7 | | $ | 1,241 | | $ | 1,094 | | $ | 699 | | |
| Ratio | Ratio | | 1.47 | % | 1.33 | % | 0.88 | % | |
| U.S. Personal Banking | | | | |
| Ratio | |
| Ratio | |
| Cards | |
| Cards | |
| Cards | |
| Total | |
| Total | |
| Total | Total | $ | 189.1 | | $ | 1,218 | | $ | 1,074 | | $ | 679 | | |
| Ratio | Ratio | | 2.58 | % | 2.37 | % | 1.63 | % | |
| Cards | | | | |
| Ratio | |
| Ratio | |
| Branded Cards | |
| Branded Cards | |
| Branded Cards | |
| Ratio | |
| Ratio | |
| Ratio | |
| Retail Services | |
| Retail Services | |
| Retail Services | |
| Ratio | |
| Ratio | |
| Ratio | |
| Retail Banking | |
| Retail Banking | |
| Retail Banking | |
| Ratio | |
| Ratio | |
| Ratio | |
| Wealth | |
| Wealth | |
| Wealth | |
| Ratio | |
| Ratio | |
| Ratio | |
All Other—Legacy Franchises (managed basis)(3) | |
All Other—Legacy Franchises (managed basis)(3) | |
All Other—Legacy Franchises (managed basis)(3) | |
| Total | |
| Total | |
| Total | Total | 148.8 | | 1,159 | | 1,012 | | 619 | | |
| Ratio | Ratio | | 3.12 | % | 2.82 | % | 1.87 | % | |
| Branded cards | 99.8 | | 614 | | 521 | | 329 | | |
| Ratio | Ratio | | 2.47 | % | 2.18 | % | 1.50 | % | |
| Retail services | 49.0 | | 545 | | 491 | | 290 | | |
| Ratio | | 4.46 | % | 4.08 | % | 2.60 | % | |
| Retail banking | 40.3 | | 59 | | 62 | | 60 | | |
| Ratio | | 0.59 | % | 0.66 | % | 0.70 | % | |
| Global Wealth | $ | 149.6 | | $ | 23 | | $ | 20 | | $ | 20 | | |
| Ratio | | 0.06 | % | 0.05 | % | 0.05 | % | |
| Legacy Franchises | | | | |
| Total | $ | 29.1 | | $ | 188 | | $ | 186 | | $ | 128 | | |
| Ratio | | 2.59 | % | 2.47 | % | 1.45 | % | |
Asia Consumer(3)(4) | 9.5 | | 41 | | 44 | | 35 | | |
| Ratio | Ratio | | 1.73 | % | 1.47 | % | 0.77 | % | |
| Mexico Consumer | Mexico Consumer | 16.8 | | 153 | | 148 | | 105 | | |
| Mexico Consumer | |
| Mexico Consumer | |
| Ratio | |
| Ratio | |
| Ratio | |
Asia Consumer (managed basis)(3)(4) | |
Asia Consumer (managed basis)(3)(4) | |
Asia Consumer (managed basis)(3)(4) | |
| Ratio | |
| Ratio | |
| Ratio | Ratio | | 3.65 | % | 3.87 | % | 3.12 | % | |
| Legacy Holdings Assets (consumer) | Legacy Holdings Assets (consumer) | 2.8 | | (6) | | (6) | | (12) | | |
| Legacy Holdings Assets (consumer) | |
| Legacy Holdings Assets (consumer) | |
| Ratio | Ratio | | (0.86) | % | (0.84) | % | (1.34) | % | |
| Ratio | |
| Ratio | |
Reconciling Items(3) | |
Reconciling Items(3) | |
Reconciling Items(3) | |
| Total Citigroup | |
| Total Citigroup | |
| Total Citigroup | Total Citigroup | $ | 367.8 | | $ | 1,429 | | $ | 1,280 | | $ | 827 | | |
| Ratio | Ratio | | 1.56 | % | 1.43 | % | 0.94 | % | |
| Ratio | |
| Ratio | |
(1)Average loans include interest and fees on credit cards.
(2)The ratios of net credit losses are calculated based on average loans, net of unearned income.
(3)All Other (managed basis) excludes divestiture-related impacts (Reconciling Items) related to (i) Citi’s divestitures of its Asia Consumer businesses and (ii) the
planned IPO of Mexico consumer banking and small business and middle-market banking within Legacy Franchises. The Reconciling Items are fully reflected in the various line items in Citi’s Consolidated Statement of Income. See “All Other—Divestiture-Related Impacts (Reconciling Items)” above.
(4)Asia Consumer also includes NCLs and average loans in certain EMEA countries (RussiaPoland and Poland)Russia for all periods presented.
(4)Approximately $8 million, $11 million and $50 million in NCLs relating to certain Asia Consumer businesses classified as held-for-sale in Other assets and Other liabilities on the Consolidated Balance Sheet were recorded as a reduction in revenue (Other revenue) in 2Q23, 1Q23 and 2Q22, respectively. Accordingly, these NCLs are not included in this table. See Note 2 for additional information regarding businesses held-for-sale.
ADDITIONAL CONSUMER AND CORPORATE CREDIT DETAILS
Loans Outstanding
| | 2nd Qtr. | 1st Qtr. | 4th Qtr. | 3rd Qtr. | 2nd Qtr. |
| 1st Qtr. | | | 1st Qtr. | 4th Qtr. | 3rd Qtr. | 2nd Qtr. | 1st Qtr. |
| In millions of dollars | In millions of dollars | 2023 | 2023 | 2022 | In millions of dollars | 2024 | 2023 |
| Consumer loans | Consumer loans | |
In North America offices(1) | In North America offices(1) | |
In North America offices(1) | |
In North America offices(1) | |
Residential first mortgages(2) | |
Residential first mortgages(2) | |
Residential first mortgages(2) | Residential first mortgages(2) | $ | 102,680 | | $ | 98,790 | | $ | 96,039 | | $ | 93,381 | | $ | 88,662 | |
Home equity loans(2) | Home equity loans(2) | 4,000 | | 4,244 | | 4,580 | | 4,794 | | 5,074 | |
| Credit cards | Credit cards | 152,951 | | 145,543 | | 150,643 | | 140,404 | | 137,412 | |
| Personal, small business and other | Personal, small business and other | 37,161 | | 37,812 | | 37,752 | | 40,110 | | 39,436 | |
| Total | Total | $ | 296,792 | | $ | 286,389 | | $ | 289,014 | | $ | 278,689 | | $ | 270,584 | |
In offices outside North America(1) | In offices outside North America(1) | |
Residential mortgages(2) | Residential mortgages(2) | $ | 27,090 | | $ | 26,913 | | $ | 28,114 | | $ | 27,281 | | $ | 28,129 | |
Residential mortgages(2) | |
Residential mortgages(2) | |
| Credit cards | Credit cards | 13,714 | | 13,033 | | 12,955 | | 11,764 | | 11,858 | |
| Personal, small business and other | Personal, small business and other | 36,995 | | 37,361 | | 37,984 | | 39,849 | | 45,034 | |
| Total | Total | $ | 77,799 | | $ | 77,307 | | $ | 79,053 | | $ | 78,894 | | $ | 85,021 | |
Consumer loans, net of unearned income, excluding portfolio layer cumulative basis adjustments(3) | |
| Unallocated portfolio layer cumulative basis adjustments | |
Consumer loans, net of unearned income(3) | Consumer loans, net of unearned income(3) | $ | 374,591 | | $ | 363,696 | | $ | 368,067 | | $ | 357,583 | | $ | 355,605 | |
| Corporate loans | Corporate loans | |
In North America offices(1) | In North America offices(1) | |
In North America offices(1) | |
In North America offices(1) | |
| Commercial and industrial | |
| Commercial and industrial | |
| Commercial and industrial | Commercial and industrial | $ | 59,790 | | $ | 59,790 | | $ | 56,176 | | $ | 52,990 | | $ | 55,823 | |
| Financial institutions | Financial institutions | 36,268 | | 38,524 | | 43,399 | | 43,667 | | 46,088 | |
Mortgage and real estate(2) | Mortgage and real estate(2) | 17,495 | | 18,562 | | 17,829 | | 17,762 | | 17,359 | |
| Installment and other | Installment and other | 22,153 | | 23,578 | | 23,767 | | 21,222 | | 20,466 | |
| Lease financing | Lease financing | 224 | | 299 | | 308 | | 383 | | 379 | |
| Total | Total | $ | 135,930 | | $ | 140,753 | | $ | 141,479 | | $ | 136,024 | | $ | 140,115 | |
In offices outside North America(1) | In offices outside North America(1) | |
| Commercial and industrial | Commercial and industrial | $ | 95,836 | | $ | 92,803 | | $ | 93,967 | | $ | 100,570 | | $ | 108,274 | |
| Commercial and industrial | |
| Commercial and industrial | |
| Financial institutions | Financial institutions | 21,701 | | 22,272 | | 21,931 | | 23,604 | | 24,654 | |
Mortgage and real estate(2) | Mortgage and real estate(2) | 6,076 | | 4,975 | | 4,179 | | 4,005 | | 4,455 | |
| Installment and other | Installment and other | 23,395 | | 24,800 | | 23,347 | | 19,653 | | 19,862 | |
| Lease financing | Lease financing | 49 | | 49 | | 46 | | 48 | | 53 | |
| Governments and official institutions | Governments and official institutions | 3,034 | | 2,647 | | 4,205 | | 4,473 | | 4,315 | |
| Total | Total | $ | 150,091 | | $ | 147,546 | | $ | 147,675 | | $ | 152,353 | | $ | 161,613 | |
Corporate loans, net of unearned income, excluding portfolio layer cumulative basis adjustments(4) | |
| Unallocated portfolio layer cumulative basis adjustments | |
Corporate loans, net of unearned income(4) | Corporate loans, net of unearned income(4) | $ | 286,021 | | $ | 288,299 | | $ | 289,154 | | $ | 288,377 | | $ | 301,728 | |
| Total loans—net of unearned income | Total loans—net of unearned income | $ | 660,612 | | $ | 651,995 | | $ | 657,221 | | $ | 645,960 | | $ | 657,333 | |
| Allowance for credit losses on loans (ACLL) | Allowance for credit losses on loans (ACLL) | (17,496) | | (17,169) | | (16,974) | | (16,309) | | (15,952) | |
| Total loans—net of unearned income and ACLL | Total loans—net of unearned income and ACLL | $ | 643,116 | | $ | 634,826 | | $ | 640,247 | | $ | 629,651 | | $ | 641,381 | |
ACLL as a percentage of total loans—
net of unearned income(5) | ACLL as a percentage of total loans—
net of unearned income(5) | 2.67 | % | 2.65 | % | 2.60 | % | 2.54 | % | 2.44 | % | ACLL as a percentage of total loans—
net of unearned income(5) | 2.75 | % | 2.66 | % | 2.68 | % | 2.67 | % | 2.65 | % |
ACLL for consumer loan losses as a percentage of
total consumer loans—net of unearned income(5) | ACLL for consumer loan losses as a percentage of
total consumer loans—net of unearned income(5) | 3.97 | % | 3.96 | % | 3.84 | % | 3.74 | % | 3.65 | % | ACLL for consumer loan losses as a percentage of
total consumer loans—net of unearned income(5) | 4.07 | % | 3.97 | % | 3.95 | % | 3.97 | % | 3.96 | % |
ACLL for corporate loan losses as a percentage of
total corporate loans—net of unearned income(5) | ACLL for corporate loan losses as a percentage of
total corporate loans—net of unearned income(5) | 0.94 | % | 0.98 | % | 1.01 | % | 1.04 | % | 1.00 | % | ACLL for corporate loan losses as a percentage of
total corporate loans—net of unearned income(5) | 0.97 | % | 0.93 | % | 0.97 | % | 0.94 | % | 0.98 | % |
(1)North America includes the U.S., Canada and Puerto Rico. Mexico is included in offices outside North America. The classification of corporate loans between offices in North America and outside North America is based on the domicile of the booking unit. The difference between the domicile of the booking unit and the domicile of the managing unit is not material.
(2)Loans secured primarily by real estate.
(3)Consumer loans are net of unearned income of $828 million, $802 million, $789 million, $769 million and $748 million $712 million, $671 million and $631 million at March 31, 2024, December 31, 2023, September 30, 2023, June 30, 2023 and March 31, 2023, December 31, 2022, September 30, 2022 and June 30, 2022, respectively. Unearned income on consumer loans primarily represents unamortizedloan origination fees, net of certain direct origination costs, that are deferred and costs, premiums and discounts.recognized as Interest income over the lives of the related loans.
(4)Corporate loans include Mexico SBMM loans and are net of unearned income of $(795)($968) million, $(801)($917) million, $(797)($806) million, $(750)($795) million and $(759)($801) million at March 31, 2024, December 31, 2023, September 30, 2023, June 30, 2023 and March 31, 2023, December 31, 2022, September 30, 2022 and June 30, 2022, respectively. Unearned income on corporate loans primarily represents interest received in advance, but not yet earned, on loans originated on a discounted basis.loan origination fees, net of certain direct origination costs, that are deferred and recognized as Interest income over the lives of the related loans.
(5)Because loans carried at fair value do not have an ACLL, they are excluded from the ACLL ratio calculation.
Details of Credit Loss Experience
| | | | | | | | | | | | | | | | | |
| 1st Qtr. | 4th Qtr. | 3rd Qtr. | 2nd Qtr. | 1st Qtr. |
| In millions of dollars | 2024 | 2023 | 2023 | 2023 | 2023 |
| Allowance for credit losses on loans (ACLL) at beginning of period | $ | 18,145 | | $ | 17,629 | | $ | 17,496 | | $ | 17,169 | | $ | 16,974 | |
| Adjustment to opening balance: | | | | | |
Financial instruments—TDRs and vintage disclosures(1) | $ | — | | $ | — | | $ | — | | $ | — | | $ | (352) | |
| | | | | |
| Adjusted ACLL at beginning of period | $ | 18,145 | | $ | 17,629 | | $ | 17,496 | | $ | 17,169 | | $ | 16,622 | |
| Provision for credit losses on loans (PCLL) | | | | | |
| Consumer | $ | 2,201 | | $ | 2,371 | | $ | 1,656 | | $ | 1,838 | | $ | 1,800 | |
| Corporate | 221 | | 101 | | 160 | | (77) | | (63) | |
| Total | $ | 2,422 | | $ | 2,472 | | $ | 1,816 | | $ | 1,761 | | $ | 1,737 | |
| Gross credit losses on loans | | | | | |
| Consumer | | | | | |
| In U.S. offices | $ | 2,190 | | $ | 1,886 | | $ | 1,611 | | $ | 1,513 | | $ | 1,329 | |
| In offices outside the U.S. | 322 | | 351 | | 317 | | 280 | | 266 | |
| Corporate | | | | | |
| In U.S. offices | 83 | | 106 | | 16 | | 26 | | 16 | |
| In offices outside the U.S. | 95 | | 25 | | 56 | | 60 | | 23 | |
| Total | $ | 2,690 | | $ | 2,368 | | $ | 2,000 | | $ | 1,879 | | $ | 1,634 | |
| Gross recoveries on loans | | | | | |
| Consumer | | | | | |
| In U.S. offices | $ | 328 | | $ | 287 | | $ | 274 | | $ | 301 | | $ | 262 | |
| In offices outside the U.S. | 45 | | 51 | | 75 | | 63 | | 53 | |
| Corporate | | | | | |
| In U.S. offices | 9 | | 12 | | 9 | | 7 | | 10 | |
| In offices outside the U.S. | 5 | | 24 | | 5 | | 4 | | 7 | |
| Total | $ | 387 | | $ | 374 | | $ | 363 | | $ | 375 | | $ | 332 | |
| Net credit losses on loans (NCLs) | | | | | |
| In U.S. offices | $ | 1,936 | | $ | 1,693 | | $ | 1,344 | | $ | 1,231 | | $ | 1,073 | |
| In offices outside the U.S. | 367 | | 301 | | 293 | | 273 | | 229 | |
| Total | $ | 2,303 | | $ | 1,994 | | $ | 1,637 | | $ | 1,504 | | $ | 1,302 | |
Other—net(2)(3)(4)(5)(6)(7) | $ | 32 | | $ | 38 | | $ | (46) | | $ | 70 | | $ | 112 | |
| Allowance for credit losses on loans (ACLL) at end of period | $ | 18,296 | | $ | 18,145 | | $ | 17,629 | | $ | 17,496 | | $ | 17,169 | |
ACLL as a percentage of EOP loans(8) | 2.75 | % | 2.66 | % | 2.68 | % | 2.67 | % | 2.65 | % |
Allowance for credit losses on unfunded lending commitments (ACLUC)(9) | $ | 1,629 | | $ | 1,728 | | $ | 1,806 | | $ | 1,862 | | $ | 1,959 | |
| Total ACLL and ACLUC | $ | 19,925 | | $ | 19,873 | | $ | 19,435 | | $ | 19,358 | | $ | 19,128 | |
| Net consumer credit losses on loans | $ | 2,139 | | $ | 1,899 | | $ | 1,579 | | $ | 1,429 | | $ | 1,280 | |
| As a percentage of average consumer loans | 2.25 | % | 1.98 | % | 1.67 | % | 1.56 | % | 1.43 | % |
| Net corporate credit losses on loans | $ | 164 | | $ | 95 | | $ | 58 | | $ | 75 | | $ | 22 | |
| As a percentage of average corporate loans | 0.22 | % | 0.13 | % | 0.08 | % | 0.11 | % | 0.03 | % |
ACLL by type at end of period(10) | | | | | |
| Consumer | $ | 15,524 | | $ | 15,431 | | $ | 14,912 | | $ | 14,866 | | $ | 14,389 | |
| Corporate | 2,772 | | 2,714 | | 2,717 | | 2,630 | | 2,780 | |
| Total | $ | 18,296 | | $ | 18,145 | | $ | 17,629 | | $ | 17,496 | | $ | 17,169 | |
| | | | | | | | | | | | | | | | | |
| 2nd Qtr. | 1st Qtr. | 4th Qtr. | 3rd Qtr. | 2nd Qtr. |
| In millions of dollars | 2023 | 2023 | 2022 | 2022 | 2022 |
| Allowance for credit losses on loans (ACLL) at beginning of period | $ | 17,169 | | $ | 16,974 | | $ | 16,309 | | $ | 15,952 | | $ | 15,393 | |
| Adjustment to opening balance: | | | | | |
Financial instruments—TDRs and vintage disclosures(1) | $ | — | | $ | (352) | | $ | — | | $ | — | | $ | — | |
| | | | | |
| Adjusted ACLL at beginning of period | $ | 17,169 | | $ | 16,622 | | $ | 16,309 | | $ | 15,952 | | $ | 15,393 | |
| Provision for credit losses on loans (PCLL) | | | | | |
| Consumer | $ | 1,838 | | $ | 1,800 | | $ | 1,779 | | $ | 1,281 | | $ | 1,440 | |
| Corporate | (77) | | (63) | | (6) | | 47 | | (56) | |
| Total | $ | 1,761 | | $ | 1,737 | | $ | 1,773 | | $ | 1,328 | | $ | 1,384 | |
| Gross credit losses on loans | | | | | |
| Consumer | | | | | |
| In U.S. offices | $ | 1,513 | | $ | 1,329 | | $ | 1,117 | | $ | 946 | | $ | 934 | |
| In offices outside the U.S. | 280 | | 266 | | 220 | | 248 | | 221 | |
| Corporate | | | | | |
| In U.S. offices | 26 | | 16 | | 51 | | 8 | | 21 | |
| In offices outside the U.S. | 60 | | 23 | | 79 | | 35 | | 36 | |
| Total | $ | 1,879 | | $ | 1,634 | | $ | 1,467 | | $ | 1,237 | | $ | 1,212 | |
| Gross recoveries on loans | | | | | |
| Consumer | | | | | |
| In U.S. offices | $ | 301 | | $ | 262 | | $ | 235 | | $ | 252 | | $ | 265 | |
| In offices outside the U.S. | 63 | | 53 | | 40 | | 61 | | 63 | |
| Corporate | | | | | |
| In U.S. offices | 7 | | 10 | | 1 | | 34 | | 2 | |
| In offices outside the U.S. | 4 | | 7 | | 11 | | 3 | | 32 | |
| Total | $ | 375 | | $ | 332 | | $ | 287 | | $ | 350 | | $ | 362 | |
| Net credit losses on loans (NCLs) | | | | | |
| In U.S. offices | $ | 1,231 | | $ | 1,073 | | $ | 932 | | $ | 668 | | $ | 688 | |
| In offices outside the U.S. | 273 | | 229 | | 248 | | 219 | | 162 | |
| Total | $ | 1,504 | | $ | 1,302 | | $ | 1,180 | | $ | 887 | | $ | 850 | |
Other—net(2)(3)(4)(5)(6)(7) | $ | 70 | | $ | 112 | | $ | 72 | | $ | (84) | | $ | 25 | |
| Allowance for credit losses on loans (ACLL) at end of period | $ | 17,496 | | $ | 17,169 | | $ | 16,974 | | $ | 16,309 | | $ | 15,952 | |
ACLL as a percentage of EOP loans(8) | 2.67 | % | 2.65 | % | 2.60 | % | 2.54 | % | 2.44 | % |
Allowance for credit losses on unfunded lending commitments (ACLUC)(9) | $ | 1,862 | | $ | 1,959 | | $ | 2,151 | | $ | 2,089 | | $ | 2,193 | |
| Total ACLL and ACLUC | $ | 19,358 | | $ | 19,128 | | $ | 19,125 | | $ | 18,398 | | $ | 18,145 | |
| Net consumer credit losses on loans | $ | 1,429 | | $ | 1,280 | | $ | 1,062 | | $ | 881 | | $ | 827 | |
| As a percentage of average consumer loans | 1.56 | % | 1.43 | % | 1.17 | % | 0.98 | % | 0.94 | % |
| Net corporate credit losses on loans | $ | 75 | | $ | 22 | | $ | 118 | | $ | 6 | | $ | 23 | |
| As a percentage of average corporate loans | 0.11 | % | 0.03 | % | 0.16 | % | 0.01 | % | 0.03 | % |
ACLL by type at end of period(10) | | | | | |
| Consumer | $ | 14,866 | | $ | 14,389 | | $ | 14,119 | | $ | 13,361 | | $ | 12,983 | |
| Corporate | 2,630 | | 2,780 | | 2,855 | | 2,948 | | 2,969 | |
| Total | $ | 17,496 | | $ | 17,169 | | $ | 16,974 | | $ | 16,309 | | $ | 15,952 | |
(1)On January 1, 2023, Citi adopted Accounting Standards Update (ASU) 2022-02, Financial Instruments—Credit Losses (Topic 326): TDRs and Vintage Disclosures. The ASU eliminated the accounting and disclosure requirements for TDRs, including the requirement to measure the ACLL for TDRs using a
discounted cash flow (DCF) approach. On January 1, 2023, Citi recorded a $352 million decrease in the Allowance for loan losses, along with a $290 million after-tax increase to Retained earnings. See Note 1.
(2)Includes all adjustments to the allowance for credit losses, such as changes in the allowance from acquisitions, dispositions, securitizations, FX translation, purchase accounting adjustments, etc.
(3)The first quarter of 2024 includes an increase of approximately $32 million related to FX translation.
(4)The fourth quarter of 2023 includes an increase of approximately $38 million related to FX translation.
(5)The third quarter of 2023 includes a decrease of approximately $46 million related to FX translation.
(6)The second quarter of 2023 includes an increase of approximately $70 million related to FX translation.
(4)(7)The first quarter of 2023 includes an increase of approximately $112 million related to FX translation.
(5)The fourth quarter of 2022 includes an increase of approximately $72 million related to FX translation.
(6)The third quarter of 2022 includes a decrease of approximately $84 million related to FX translation.
(7)The second quarter of 2022 includes an increase of approximately $25 million related to FX translation.
(8)March 31, 2024, December 31, 2023, September 30, 2023, June 30, 2023 and March 31, 2023 December 31, 2022, September 30, 2022 and June 30, 2022 exclude $8.9 billion, $7.6 billion, $7.4 billion, $5.8 billion $5.1 billion, $5.4 billion, $3.9 billion and $4.5$5.1 billion, respectively, of loans that are carried at fair value.
(9)Represents additional credit reserves recorded as Other liabilities on the Consolidated Balance Sheet.
(10)See “Significant Accounting Policies and Significant Estimates” below. Attribution of the allowance is made for analytical purposes only and is available to absorb probable credit losses inherent in the overall portfolio.
Allowance for Credit Losses on Loans (ACLL)
The following tables detail information on Citi’s ACLL, loans and coverage ratios:
| | | | June 30, 2023 | | March 31, 2024 |
| In billions of dollars | In billions of dollars | ACLL | EOP loans, net of
unearned income | ACLL as a percentage of EOP loans(1) | In billions of dollars | ACLL | EOP loans, net of
unearned income | ACLL as a % of EOP loans(1) |
| Consumer | Consumer | |
North America cards(2) | |
North America cards(2) | |
North America cards(2) | North America cards(2) | $ | 12.0 | | $ | 153.0 | | 7.9 | % | $ | 13.0 | | $ | 158.8 | | 8.2 | 8.2 | % |
North America mortgages(3) | North America mortgages(3) | 0.4 | | 106.5 | | 0.4 | |
North America other(3) | North America other(3) | 0.6 | | 37.2 | | 1.5 | |
| International cards | International cards | 0.9 | | 13.7 | | 6.7 | |
International other(3) | International other(3) | 1.0 | | 63.9 | | 1.5 | |
Total(1) | Total(1) | $ | 14.9 | | $ | 374.3 | | 4.0 | % | Total(1) | $ | 15.5 | | $ | 381.4 | | 4.1 | 4.1 | % |
| Corporate | |
Corporate(4) | |
| Commercial and industrial | |
| Commercial and industrial | |
| Commercial and industrial | Commercial and industrial | $ | 1.7 | | $ | 152.6 | | 1.1 | % | $ | 1.6 | | $ | 148.0 | | 1.1 | 1.1 | % |
| Financial institutions | Financial institutions | 0.3 | | 57.6 | | 0.5 | |
| Mortgage and real estate | 0.5 | | 23.5 | | 2.1 | |
Mortgage and real estate(4) | |
| Installment and other | Installment and other | 0.1 | | 46.8 | | 0.2 | |
Total(1) | Total(1) | $ | 2.6 | | $ | 280.5 | | 0.9 | % | Total(1) | $ | 2.8 | | $ | 284.3 | | 1.0 | 1.0 | % |
Loans at fair value(1) | Loans at fair value(1) | N/A | $ | 5.8 | | N/A | Loans at fair value(1) | N/A | $ | 8.9 | | N/A | N/A |
| Total Citigroup | Total Citigroup | $ | 17.5 | | $ | 660.6 | | 2.7 | % | Total Citigroup | $ | 18.3 | | $ | 674.6 | | 2.8 | 2.8 | % |
| | | | December 31, 2022 | | December 31, 2023 |
| In billions of dollars | In billions of dollars | ACLL | EOP loans, net of
unearned income | ACLL as a percentage of EOP loans(1) | In billions of dollars | ACLL | EOP loans, net of
unearned income | ACLL as a % of EOP loans(1) |
| Consumer | Consumer | |
North America cards(2) | |
North America cards(2) | |
North America cards(2) | North America cards(2) | $ | 11.4 | | $ | 150.6 | | 7.6 | % | $ | 12.6 | | $ | 164.7 | | 7.7 | 7.7 | % |
North America mortgages(3) | North America mortgages(3) | 0.5 | | 100.4 | | 0.5 | |
North America other(3) | North America other(3) | 0.6 | | 37.8 | | 1.6 | |
| International cards | International cards | 0.8 | | 13.0 | | 6.2 | |
International other(3) | International other(3) | 0.8 | | 66.0 | | 1.2 | |
Total(1) | Total(1) | $ | 14.1 | | $ | 367.8 | | 3.8 | % | Total(1) | $ | 15.4 | | $ | 388.9 | | 4.0 | 4.0 | % |
| Corporate | |
Corporate(4) | |
| Commercial and industrial | |
| Commercial and industrial | |
| Commercial and industrial | Commercial and industrial | $ | 1.9 | | $ | 147.8 | | 1.3 | % | $ | 1.7 | | $ | 151.5 | | 1.1 | 1.1 | % |
| Financial institutions | Financial institutions | 0.4 | | 64.9 | | 0.6 | |
| Mortgage and real estate | 0.4 | | 21.9 | | 1.8 | |
Mortgage and real estate(4) | |
| Installment and other | Installment and other | 0.2 | | 49.4 | | 0.4 | |
Total(1) | Total(1) | $ | 2.9 | | $ | 284.0 | | 1.0 | % | Total(1) | $ | 2.7 | | $ | 292.9 | | 0.9 | 0.9 | % |
Loans at fair value(1) | Loans at fair value(1) | N/A | $ | 5.4 | | N/A | Loans at fair value(1) | N/A | $ | 7.6 | | N/A | N/A |
| Total Citigroup | Total Citigroup | $ | 17.0 | | $ | 657.2 | | 2.6 | % | Total Citigroup | $ | 18.1 | | $ | 689.4 | | 2.7 | 2.7 | % |
(1)Excludes loans carried at fair value, since they do not have an ACLL and are excluded from the ACLL ratio calculation.
(2)Includes both Branded cardsCards and Retail services.Services. As of June 30, 2023,March 31, 2024, the $12.0$13.0 billion of ACLL represented approximately 3122 months of coincident net credit loss coverage (based on 2Q231Q24 NCLs). As of June 30, 2023,March 31, 2024, Branded cardsCards ACLL as a percentage of EOP loans was 6.3%6.4% and Retail servicesServices ACLL as a percentage of EOP loans was 11.2%11.9%. As of December 31, 2022,2023, the $11.4$12.6 billion of ACLL represented approximately 4325 months of coincident net credit loss
coverage (based on 4Q224Q23 NCLs). As of December 31, 2022,2023, Branded cardsCards ACLL as a percentage of EOP loans was 6.2%6.0% and Retail servicesServices ACLL as a percentage of EOP loans was 10.3%11.1%.
(3)Includes residential mortgages, retail loans and personal, small business and other loans, including those extended through the Private bankBank network.
(4)The above corporate loan classifications are broadly based on the loan’s collateral, purpose and type of borrower, which may be different from the following industry table. For example, commercial and industrial, financial institutions, and installment and other loan classifications include various forms of loans to borrowers across multiple industries, whereas mortgage and real estate includes loans secured primarily by real estate.
N/A Not applicable
The following table details Citi’s corporate credit ACLL by industry exposure:
| | | | | | | | | | | |
| June 30, 2023 |
| In millions of dollars, except percentages | Funded exposure(1) | ACLL | ACLL as a % of funded exposure |
| Transportation and industrials | $ | 58,248 | | $ | 566 | | 1.0 | % |
| Technology, media and telecom | 28,948 | | 321 | | 1.1 | |
| Consumer retail | 34,327 | | 299 | | 0.9 | |
Real estate(2) | 48,142 | | 572 | | 1.2 | |
| Commercial | 35,155 | | 507 | | 1.4 | |
| Residential | 12,987 | | 65 | | 0.5 | |
| Banks and finance companies | 43,277 | | 219 | | 0.5 | |
| Power, chemicals, metals and mining | 19,869 | | 228 | | 1.1 | |
| Energy and commodities | 12,799 | | 175 | | 1.4 | |
| Health | 9,560 | | 75 | | 0.8 | |
| Insurance | 4,101 | | 15 | | 0.4 | |
| Asset managers and funds | 6,384 | | 33 | | 0.5 | |
| Public sector | 10,849 | | 57 | | 0.5 | |
| Financial markets infrastructure | 141 | | 1 | | 0.7 | |
| Securities firms | 292 | | 14 | | 4.8 | |
| Other industries | 2,914 | | 48 | | 1.6 | |
Total classifiably managed loans(3) | $ | 279,851 | | $ | 2,623 | | 0.9 | % |
Loans managed on a delinquency basis(4) | $ | 641 | | $ | 7 | | 1.1 | % |
| Total | $ | 280,492 | | $ | 2,630 | | 0.9 | % |
(1) Funded exposure excludes loans carried at fair value of $5.5 billion that are not subject to ACLL under the CECL standard.
(2) As of June 30, 2023, the portion of the ACLL attributed to the total funded CRE exposure (including the Private bank) was approximately 1.2%.
(3) As of June 30, 2023, the ACLL shown above reflects coverage of 0.4% of funded investment-grade exposure and 2.7% of funded non-investment-grade exposure.
(4) Primarily associated with delinquency-managed loans including commercial credit cards and other loans at June 30, 2023.
The following table details Citi’s corporate credit ACLL by industry exposure:
| | | December 31, 2022 |
| March 31, 2024 | | | March 31, 2024 |
| In millions of dollars, except percentages | In millions of dollars, except percentages | Funded exposure(1) | ACLL | ACLL as a % of funded exposure | In millions of dollars, except percentages | Funded exposure(1) | ACLL | ACLL as a % of funded exposure |
| Transportation and industrials | Transportation and industrials | $ | 57,271 | | $ | 699 | | 1.2 | % | Transportation and industrials | $ | 55,231 | | $ | 420 | | 0.8 | 0.8 | % |
| Technology, media and telecom | 28,931 | | 330 | | 1.1 | |
| Consumer retail | 32,687 | | 358 | | 1.1 | |
| Real estate | 48,539 | | 500 | | 1.0 | |
| Banks and finance companies | |
Real estate(2) | |
| Commercial | Commercial | 34,112 | | 428 | | 1.3 | |
| Residential | Residential | 14,427 | | 72 | | 0.5 | |
| Consumer retail | |
| Technology, media and telecom | |
| Power, chemicals, metals and mining | Power, chemicals, metals and mining | 18,326 | | 288 | | 1.6 | |
| Banks and finance companies | 42,276 | | 225 | | 0.5 | |
| Public sector | |
| Energy and commodities | Energy and commodities | 13,069 | | 188 | | 1.4 | |
| Health | |
| Asset managers and funds | Asset managers and funds | 13,162 | | 38 | | 0.3 | |
| Health | 8,771 | | 81 | | 0.9 | |
| Insurance | Insurance | 4,417 | | 11 | | 0.2 | |
| Public sector | 11,736 | | 58 | | 0.5 | |
| Securities firms | |
| Financial markets infrastructure | Financial markets infrastructure | 60 | | — | | — | |
| Securities firms | 569 | | 11 | | 1.9 | |
| Other industries | 3,651 | | 59 | | 1.6 | |
Total classifiably managed loans(2) | $ | 283,465 | | $ | 2,846 | | 1.0 | % |
Loans managed on a delinquency basis(3) | $ | 566 | | $ | 9 | | 1.6 | % |
| Total | $ | 284,031 | | $ | 2,855 | | 1.0 | % |
Other industries(3) | |
Total(4) | | Total(4) | $ | 284,269 | | $ | 2,772 | | 1.0 | % |
(1) Funded exposure excludes loans carried at fair value of $5.1$8.6 billion that are not subject to ACLL under the CECL standard.
(2) As of DecemberMarch 31, 2022,2024, the portion of the ACLL shownattributed to the total funded CRE exposure (including the Private Bank) was approximately 1.76%.
(3) Includes $0.9 billion of funded exposure at March 31, 2024, primarily related to commercial credit card delinquency-managed loans.
(4) As of March 31, 2024, the ACLL above reflects coverage of 0.4% of funded investment-grade exposure and 3.0%2.9% of funded non-investment-grade exposure.
(3) Primarily associated with delinquency-managed
The following table details Citi’s corporate credit ACLL by industry exposure:
| | | | | | | | | | | |
| |
| December 31, 2023 |
| In millions of dollars, except percentages | Funded exposure(1) | ACLL | ACLL as a % of funded exposure |
| Transportation and industrials | $ | 59,917 | | $ | 453 | | 0.8 | % |
| Banks and finance companies | 52,569 | | 179 | | 0.3 | |
Real estate(2) | 51,660 | | 663 | | 1.3 | |
| Commercial | 35,058 | | 599 | | 1.7 | |
| Residential | 16,602 | | 64 | | 0.4 | |
| Consumer retail | 33,548 | | 282 | | 0.8 | |
| Technology, media and telecom | 29,832 | | 376 | | 1.3 | |
| Power, chemicals, metals and mining | 19,004 | | 270 | | 1.4 | |
| Public sector | 12,621 | | 102 | | 0.8 | |
| Energy and commodities | 12,606 | | 166 | | 1.3 | |
| Health | 9,135 | | 72 | | 0.8 | |
| Asset managers and funds | 4,232 | | 36 | | 0.9 | |
| Insurance | 2,390 | | 14 | | 0.6 | |
| Securities firms | 734 | | 23 | | 3.1 | |
| Financial markets infrastructure | 156 | | — | | — | |
Other industries(3) | 4,480 | | 78 | | 1.7 | |
Total(4) | $ | 292,884 | | $ | 2,714 | | 0.9 | % |
(1) Funded exposure excludes loans including commercial credit cards and other loanscarried at December 31, 2022.fair value of $7.3 billion that are not subject to ACLL under the CECL standard.
(2) As of December 31, 2023, the portion of the ACLL attributed to the total funded CRE exposure (including the Private Bank) was approximately 1.49%.
(3) Includes $0.6 billion of funded exposure at December 31, 2023, primarily related to commercial credit card delinquency-managed loans.
(4) As of December 31, 2023, the ACLL above reflects coverage of 0.3% of funded investment-grade exposure and 2.9% of funded non-investment-grade exposure.
Non-Accrual Loans and Assets
For additional information on Citi’s non-accrual loans and assets, see “Non-Accrual Loans and Assets” in Citi’s 20222023 Form 10-K.
Non-Accrual Loans
The table below summarizes Citigroup’s non-accrual loans as of the periods indicated. Non-accrual loans may still be current on interest payments. In situations where Citi reasonably expects that only a portion of the principal owed will ultimately be collected, all payments received are reflected as a reduction of principal and not as interest income. For all other non-accrual loans, cash interest receipts are generally recorded as revenue.
| | Jun. 30, | Mar. 31, | Dec. 31, | Sept. 30, | Jun. 30, |
| Mar. 31, | | | Mar. 31, | Dec. 31, | Sept. 30, | Jun. 30, | Mar. 31, |
| In millions of dollars | In millions of dollars | 2023 | 2023 | 2022 | In millions of dollars | 2024 | 2023 |
Corporate non-accrual loans by region(1)(2)(3) | Corporate non-accrual loans by region(1)(2)(3) | |
| North America | $ | 358 | | $ | 285 | | $ | 138 | | $ | 276 | | $ | 304 | |
| EMEA | 350 | | 383 | | 502 | | 598 | | 712 | |
| Latin America | 428 | | 462 | | 429 | | 555 | | 563 | |
| Asia | 125 | | 83 | | 53 | | 56 | | 76 | |
North America(4) | |
North America(4) | |
North America(4) | |
| International | |
| Total | Total | $ | 1,261 | | $ | 1,213 | | $ | 1,122 | | $ | 1,485 | | $ | 1,655 | |
Corporate non-accrual loans(1)(2)(3) | Corporate non-accrual loans(1)(2)(3) | |
| Banking | Banking | $ | 931 | | $ | 868 | | $ | 767 | | $ | 1,085 | | $ | 1,015 | |
| Banking | |
| Banking | |
| Services | Services | 123 | | 133 | | 153 | | 185 | | 353 | |
| Markets | 1 | | 3 | | 3 | | — | | 11 | |
Markets(4) | |
| Mexico SBMM | Mexico SBMM | 206 | | 209 | | 199 | | 215 | | 276 | |
| Total | Total | $ | 1,261 | | $ | 1,213 | | $ | 1,122 | | $ | 1,485 | | $ | 1,655 | |
Consumer non-accrual loans(1) | Consumer non-accrual loans(1) | |
| U.S. Personal Banking and Global Wealth | $ | 536 | | $ | 608 | | $ | 541 | | $ | 585 | | $ | 536 | |
Asia Consumer(4) | 24 | | 29 | | 30 | | 30 | | 34 | |
| USPB | |
| USPB | |
| USPB | |
| Wealth | |
| Mexico Consumer | Mexico Consumer | 498 | | 480 | | 457 | | 486 | | 493 | |
| Legacy Holdings Assets—Consumer | 263 | | 278 | | 289 | | 300 | | 317 | |
Asia Consumer(5) | |
| Legacy Holdings Assets (consumer) | |
| Total | Total | $ | 1,321 | | $ | 1,395 | | $ | 1,317 | | $ | 1,401 | | $ | 1,380 | |
| Total non-accrual loans | Total non-accrual loans | $ | 2,582 | | $ | 2,608 | | $ | 2,439 | | $ | 2,886 | | $ | 3,035 | |
(1)Corporate loans are placed on non-accrual status based uponon a review by Citigroup’s risk officers. Corporate non-accrual loans may still be current on interest payments. With limited exceptions, the following practices are applied for consumer loans: consumer loans, excluding credit cards and mortgages, are placed on non-accrual status at 90 days past due and are charged off at 120 days past due; residential mortgage loans are placed on non-accrual status at 90 days past due and written down to net realizable value at 180 days past due. Consistent with industry conventions, Citigroup generally accrues interest on credit card loans until such loans are charged off, which typically occurs at 180 days contractual delinquency. As such, the non-accrual loan disclosures do not include credit card loans. The balances above represent non-accrual loans within Corporate loans and Consumer loans on the Consolidated Balance Sheet.
(2)Approximately 51%, 61%, 50%, 68%62%, 51% and 52%61% of Citi’s corporate non-accrual loans were performingremain current on interest and principal payments at March 31, 2024, December 31, 2023, September 30, 2023, June 30, 2023 and March 31, 2023, December 31, 2022, September 30, 2022 and June 30, 2022, respectively.
(3)The JuneMarch 31, 2024 total corporate non-accrual loans represented 0.51% of total corporate loans.
(4)The increase at September 30, 2023 total corporate non-accrual loans represented 0.44% of total corporate loans.was primarily related to two commercial real estate loans.
(4)(5) Asia Consumer includes balances in certain EMEAcountriesPoland and Russia for all periods presented.
Modified Loans
On January 1, 2023, Citi adopted ASU 2022-02, which eliminated the accounting and disclosure requirements for TDRs (see Note 1 for additional information). See Note 13 for information on loan modifications during the six months ended June 30, 2023.
The changes in Citigroup’s non-accrual loans were as follows:
| | Three Months Ended | Three Months Ended |
| June 30, 2023 | June 30, 2022 |
| Three Months Ended | | | Three Months Ended | Three Months Ended |
| March 31, 2024 | | | March 31, 2024 | March 31, 2023 |
| In millions of dollars | In millions of dollars | Corporate | Consumer | Total | Corporate | Consumer | Total | In millions of dollars | Corporate | Consumer | Total | Corporate | Consumer | Total |
| Non-accrual loans at beginning of quarter | Non-accrual loans at beginning of quarter | $ | 1,213 | | $ | 1,395 | | $ | 2,608 | | $ | 1,866 | | $ | 1,517 | | $ | 3,383 | |
| Additions | Additions | 289 | | 339 | | 628 | | 721 | | 344 | | 1,065 | |
| Sales and transfers to HFS | Sales and transfers to HFS | — | | (8) | | (8) | | (5) | | (36) | | (41) | |
| Returned to performing | Returned to performing | (14) | | (128) | | (142) | | (120) | | (77) | | (197) | |
| Paydowns/settlements | Paydowns/settlements | (151) | | (99) | | (250) | | (746) | | (199) | | (945) | |
| Charge-offs | Charge-offs | (74) | | (196) | | (270) | | (56) | | (140) | | (196) | |
| Other | Other | (2) | | 18 | | 16 | | (5) | | (29) | | (34) | |
| Ending balance | Ending balance | $ | 1,261 | | $ | 1,321 | | $ | 2,582 | | $ | 1,655 | | $ | 1,380 | | $ | 3,035 | |
| | Six Months Ended | Six Months Ended |
| | June 30, 2023 | June 30, 2022 |
| In millions of dollars | Corporate | Consumer | Total | Corporate | Consumer | Total |
| Non-accrual loans at beginning of year | $ | 1,122 | | $ | 1,317 | | $ | 2,439 | | $ | 1,553 | | $ | 1,826 | | $ | 3,379 | |
| Additions | 689 | | 781 | | 1,470 | | 1,541 | | 643 | | 2,184 | |
| Sales and transfers to HFS | (25) | | (14) | | (39) | | (6) | | (224) | | (230) | |
| Returned to performing | (89) | | (176) | | (265) | | (253) | | (256) | | (509) | |
| Paydowns/settlements | (320) | | (235) | | (555) | | (1,069) | | (295) | | (1,364) | |
| Charge-offs | (106) | | (388) | | (494) | | (105) | | (295) | | (400) | |
| Other | (10) | | 36 | | 26 | | (6) | | (19) | | (25) | |
| Ending balance | $ | 1,261 | | $ | 1,321 | | $ | 2,582 | | $ | 1,655 | | $ | 1,380 | | $ | 3,035 | |
|
The table below summarizes Citigroup’s other real estate owned (OREO) assets. OREO is recorded on the Consolidated Balance Sheet within Other assets. This represents the carrying value of all real estate property acquired by foreclosure or other legal proceedings when Citi has taken possession of the collateral:
| | Jun. 30, | Mar. 31, | Dec. 31, | Sept. 30, | Jun. 30, |
| Mar. 31, | | | Mar. 31, | Dec. 31, | Sept. 30, | Jun. 30, | Mar. 31, |
| In millions of dollars | In millions of dollars | 2023 | 2023 | 2022 | In millions of dollars | 2024 | 2023 |
| OREO | OREO | |
| North America | North America | $ | 17 | | $ | 15 | | $ | 10 | | $ | 9 | | $ | 7 | |
| EMEA | — | | — | | — | | — | | — | |
| Latin America | 13 | | 5 | | 4 | | 5 | | 5 | |
| Asia | 1 | | 1 | | 1 | | 2 | | 1 | |
| North America | |
| North America | |
| International | |
| Total OREO | Total OREO | $ | 31 | | $ | 21 | | $ | 15 | | $ | 16 | | $ | 13 | |
| | Non-accrual assets | Non-accrual assets | |
| Non-accrual assets | |
| Non-accrual assets | |
| Corporate non-accrual loans | |
| Corporate non-accrual loans | |
| Corporate non-accrual loans | Corporate non-accrual loans | $ | 1,261 | | $ | 1,213 | | $ | 1,122 | | $ | 1,485 | | $ | 1,655 | |
| Consumer non-accrual loans | Consumer non-accrual loans | 1,321 | | 1,395 | | 1,317 | | 1,401 | | 1,380 | |
| Non-accrual loans (NAL) | Non-accrual loans (NAL) | $ | 2,582 | | $ | 2,608 | | $ | 2,439 | | $ | 2,886 | | $ | 3,035 | |
| OREO | OREO | $ | 31 | | $ | 21 | | $ | 15 | | $ | 16 | | $ | 13 | |
| Non-accrual assets (NAA) | Non-accrual assets (NAA) | $ | 2,613 | | $ | 2,629 | | $ | 2,454 | | $ | 2,902 | | $ | 3,048 | |
| NAL as a percentage of total loans | NAL as a percentage of total loans | 0.39 | % | 0.40 | % | 0.37 | % | 0.45 | % | 0.46 | % | NAL as a percentage of total loans | 0.41 | % | 0.46 | % | 0.49 | % | 0.39 | % | 0.40 | % |
| NAA as a percentage of total assets | NAA as a percentage of total assets | 0.11 | | 0.11 | | 0.10 | | 0.12 | | 0.13 | |
ACLL as a percentage of NAL(1) | ACLL as a percentage of NAL(1) | 678 | | 658 | | 696 | | 565 | | 526 | |
(1)The ACLL includes the allowance for Citi’s credit card portfolios and purchased credit-deteriorated loans, while the non-accrual loans exclude credit card balances (with the exception of certain international portfolios).
LIQUIDITY RISK
For additional information on funding and liquidity at Citi, including its objectives, management and measurement, see “Liquidity Risk” and “Risk Factors—Liquidity Risks” in Citi’s 20222023 Form 10-K.
High-Quality Liquid Assets (HQLA)
| | Citibank | Citi non-bank and other entities | Total |
| Citibank | | | Citibank | Citi non-bank and other entities | Total |
| In billions of dollars | In billions of dollars | Jun. 30, 2023 | Mar. 31, 2023 | Jun. 30, 2022 | Jun. 30, 2023 | Mar. 31, 2023 | Jun. 30, 2022 | Jun. 30, 2023 | Mar. 31, 2023 | Jun. 30, 2022 | In billions of dollars | Mar. 31, 2024 | Dec. 31, 2023 | Mar. 31, 2023 | Mar. 31, 2024 | Dec. 31, 2023 | Mar. 31, 2023 | Mar. 31, 2024 | Dec. 31, 2023 | Mar. 31, 2023 |
| Available cash | Available cash | $ | 254.3 | | $ | 267.1 | | $ | 188.1 | | $ | 4.9 | | $ | 3.9 | | $ | 1.7 | | $ | 259.2 | | $ | 271.0 | | $ | 189.8 | |
| U.S. sovereign | U.S. sovereign | 120.3 | | 111.9 | | 149.4 | | 74.7 | | 77.9 | | 55.4 | | 195.0 | | 189.8 | | 204.8 | |
| U.S. agency/agency MBS | U.S. agency/agency MBS | 45.1 | | 42.5 | | 54.4 | | 3.8 | | 3.9 | | 4.6 | | 48.9 | | 46.4 | | 59.0 | |
Foreign government debt(1) | Foreign government debt(1) | 60.9 | | 54.9 | | 60.4 | | 19.1 | | 20.6 | | 13.9 | | 80.0 | | 75.5 | | 74.3 | |
| Other investment grade | Other investment grade | 0.5 | | 1.3 | | 2.0 | | 0.2 | | 0.3 | | 1.3 | | 0.7 | | 1.6 | | 3.3 | |
| Total HQLA (AVG) | Total HQLA (AVG) | $ | 481.1 | | $ | 477.7 | | $ | 454.3 | | $ | 102.7 | | $ | 106.6 | | $ | 76.9 | | $ | 583.8 | | $ | 584.3 | | $ | 531.2 | |
Note: The amounts shown in the table above are presented on an average basis. For securities, the amounts represent the liquidity value that potentially could be realized and, therefore, exclude any securities that are encumbered and incorporate any haircuts applicable under the U.S. LCR rule. The table above incorporates various restrictions that could limit the transferability of liquidity between legal entities, including Section 23A of the Federal Reserve Act.
(1) Foreign government debt includes securities issued or guaranteed by foreign sovereigns, agencies and multilateral development banks. Foreign government debt securities are held largely to support local liquidity requirements and Citi’s local franchises and principally include government bonds from Japan, Korea, Mexico, IndiaHong Kong and Singapore.India.
The table above includes average amounts of HQLA held at Citigroup’s operating entities that are eligible for inclusion in the calculation of Citigroup’s consolidated Liquidity Coverage ratio (LCR), pursuant to the U.S. LCR rules. These amounts include the HQLA needed to meet the minimum requirements at these entities as well as any amounts in excess of these minimums that are available to be transferred to other entities within Citigroup. Citigroup’s total average HQLA decreased quarter-over-quarter as of the secondfirst quarter of 2023 remained largely unchanged sequentially.2024, primarily driven by a reduction in short-term borrowings.
As of June 30, 2023,March 31, 2024, Citigroup had approximately $993$965 billion of available liquidity resources to support client and business needs, including end-of-period HQLA ($591555 billion); additional unencumbered HQLA, including excess liquidity held at bank entities that is non-transferable to other entities within Citigroup ($212226 billion); and unused borrowing capacity from available assets not already accounted for within Citi’s HQLA to support additional advances from the Federal Home Loan Bank (FHLB) and the Federal Reserve Bank discount window ($190184 billion).
Short-Term Liquidity Measurement: Liquidity Coverage Ratio (LCR)
In addition to internal 30-day liquidity stress testing performed for Citi’s major entities, operating subsidiaries and countries, Citi also monitors its liquidity by reference to the LCR. The table below details the components of Citi’s LCR calculation and HQLA in excess of net outflows for the periods indicated:
| | In billions of dollars | In billions of dollars | Jun. 30, 2023 | Mar. 31, 2023 | Jun. 30, 2022 | In billions of dollars | Mar. 31, 2024 | Dec. 31, 2023 | Mar. 31, 2023 |
| HQLA | HQLA | $ | 583.8 | | $ | 584.3 | | $ | 531.2 | |
| Net outflows | Net outflows | 491.9 | | 488.2 | | 460.2 | |
| LCR | LCR | 119 | % | 120 | % | 115 | % | LCR | 117 | % | 116 | % | 120 | % |
| HQLA in excess of net outflows | HQLA in excess of net outflows | $ | 91.9 | | $ | 96.1 | | $ | 71.0 | |
Note: The amounts are presented on an average basis.
As of June 30, 2023,March 31, 2024, Citigroup’s average LCR decreased,increased from the quarter ended MarchDecember 31, 2023. The decreaseincrease was primarily driven by the decrease in net outflows, partially offset by the reduction in unsecured long-term debt.average HQLA.
In addition, considering Citi’s total available liquidity resources at quarter end of $993$965 billion, Citi maintained approximately $501$492 billion of excess liquidity resources above the stressed average net outflow of approximately $492$473 billion, shownpresented in the LCR table above.
Long-Term Liquidity Measurement: Net Stable Funding Ratio (NSFR)
As previously disclosed, the U.S. banking agencies adopted a rule to assess the availability of a bank’s stable funding against a required level.
In general, a bank’s available stable funding includes portions of equity, deposits and long-term debt, while its required stable funding will be based on the liquidity characteristics of its assets, derivatives and commitments. Standardized weightings are required to be applied to the various asset and liability classes. The rule became effective beginning July 1, 2021, while public disclosureratio of the ratioavailable stable funding to required stable funding is required to occur on a semiannual basis beginning as of June 30, 2023. Citibe greater than 100%.
For the quarter ended March 31, 2024, Citigroup’s consolidated NSFR was in compliancecompliant with the rule as of Junerule. Refer to Citi’s U.S. NSFR Disclosure report covering December 31, 2023 and September 30, 2023.2023 on Citi’s Investor Relations website for additional information.
Select Balance Sheet Items
This section provides details of select liquidity-related assets and liabilities reported on Citigroup’s Consolidated Balance Sheet on an average and end-of-period basis.
Cash and Investments
The table below details average and end-of-period Cash and due from banks, Deposits with banks (collectively cash) and Investment securities. Citi’s investment portfolio consists largely of highly liquid U.S. Treasury, U.S. agency and other sovereign bonds, with an aggregate duration of less than three years. At June 30, 2023,March 31, 2024, Citi’s EOP cash and Investment securities comprised approximately 33%32% of Citigroup’s total assets:
| | In billions of dollars | In billions of dollars | 2Q23 | 1Q23 | 2Q22 | In billions of dollars | 1Q24 | 4Q23 | 1Q23 |
| Cash and due from banks | Cash and due from banks | $ | 28 | | $ | 28 | | $ | 44 | |
| Deposits with banks | Deposits with banks | 310 | | 326 | | 227 | |
| Investment securities | Investment securities | 508 | | 516 | | 520 | |
| Total Citigroup cash and Investment securities (AVG) | Total Citigroup cash and Investment securities (AVG) | $ | 846 | | $ | 870 | | $ | 791 | |
| Total Citigroup cash and Investment securities (EOP) | Total Citigroup cash and Investment securities (EOP) | $ | 804 | | $ | 842 | | $ | 798 | |
Deposits
The table below details the average deposits, by business and/or segment, and the total Citigroup end-of-period deposits for each of the periods indicated:
| | | | | | | | | | | |
| In billions of dollars | 2Q23 | 1Q23 | 2Q22 |
| Personal Banking and Wealth Management | | | |
| U.S. Personal Banking | $ | 113 | | $ | 111 | | $ | 116 | |
| Global Wealth | 318 | | 323 | | 319 | |
| Total | $ | 431 | | $ | 434 | | $ | 435 | |
| Institutional Clients Group | | | |
| TTS | $ | 688 | | $ | 704 | | $ | 672 | |
| Securities services | 125 | | 125 | | 137 | |
| Markets and Banking | 24 | | 24 | | 21 | |
| Total | $ | 837 | | $ | 853 | | $ | 830 | |
Legacy Franchises(1) | $ | 51 | | $ | 50 | | $ | 51 | |
| Corporate/Other | $ | 19 | | $ | 26 | | $ | 7 | |
| Total Citigroup deposits (AVG) | $ | 1,338 | | $ | 1,363 | | $ | 1,323 | |
| Total Citigroup deposits (EOP) | $ | 1,320 | | $ | 1,330 | | $ | 1,322 | |
| | | | | | | | | | | |
| In billions of dollars | 1Q24 | 4Q23 | 1Q23 |
| Services | $ | 808 | | $ | 803 | | $ | 830 | |
| TTS | 684 | | 681 | | 705 | |
| Securities Services | 124 | | 122 | | 125 | |
| Markets | 24 | | 23 | | 23 | |
| Banking | 1 | | 1 | | 1 | |
| USPB | 100 | | 105 | | 111 | |
| Wealth | 319 | | 312 | | 323 | |
All Other—Legacy Franchises | 48 | | 48 | | 49 | |
All Other—Corporate/Other | 26 | | 28 | | 26 | |
| Total Citigroup deposits (AVG) | $ | 1,326 | | $ | 1,320 | | $ | 1,363 | |
| Total Citigroup deposits (EOP) | $ | 1,307 | | $ | 1,309 | | $ | 1,330 | |
(1)
See footnote 2 to the table in “Credit Risk—Consumer Credit—Consumer Credit Portfolio” above.
Citi’s deposit base is spread across a diversified set of countries, industries, clients and currencies.
End-of-period deposits decreased 2% year-over-year, largely due to a reduction in Services reflecting quantitative tightening. End-of-period deposits were largely unchanged sequentially.
On an average basis, deposits declined 3% year-over-year and increased 1% sequentially. In the first quarter of 2024, average deposits for:
•Services decreased 3% year-over-year, as TTS and were down 2% sequentially. The year-over-year increaseSecurities Services decreased 3% and 1%, respectively. These declines primarily reflected an increase in Corporate/Other and ICG,the impact of quantitative tightening, partially offset by a decline in higher deposits from new client acquisitions and deepening of relationships with existing clients.
•PBWMUSPB. Corporate/Other average deposits increased $12 billion decreased 10% year-over-year, primarily driven by the issuancetransfer of institutional certificates of deposit.relationships and the associated deposits to ICG Wealthaverage deposits increased 1% year-over-year, driven by TTS. .
•PBWM Wealthaverage deposits decreased 1% year-over-year, largelyprimarily reflecting lower deposits in the reallocationPrivate Bank and Wealth at Work and the continued shift of deposits to higher-yielding investments.investments on Citi’s platform, largely offset by the transfer of relationships and the associated deposits from Legacy Franchises average deposits were largely unchanged year-over-year. The quarter-over-quarter decrease was largely driven by TTS, reflecting some non-operational outflows as expected in light of quantitative tightening, and Corporate/OtherUSPB. Despite this decline, TTS had strong growth in operating accounts as the business continued to attract new clients and deepen existing relationships.
End-of-period deposits were largely unchanged year-over-year, as an increase in institutional certificates of deposit in
Corporate/Other was offset by a decrease in ICG, driven by Securities services. End-of-period deposits decreased 1% sequentially, reflecting seasonal activity in TTS and Global Wealth.
The majority of Citi’s $1.3 trillion of end-of-period deposits are institutional (approximately $818 billion), and span approximately 90 countries. A large majority of these institutional deposits are within TTS, and of these, approximately 80% are from clients that use all three TTS integrated services: payments and collections, liquidity management and working capital solutions. In addition, nearly 80% of TTS deposits are from clients that have a greater than 15-year relationship with Citi. Over the past year, TTS deposits grew at a faster rate than total Citi deposits on both an average and end-of-period basis. Citi also has a strong consumer and wealth deposit base, with $427 billion of U.S. Retail banking and Global Wealth deposits as of end-of-period, which are diversified across the Private bank, Citigold, Retail banking and Wealth at Work. As of year-end 2022, approximately 75% of U.S. Citigold clients have been with Citi for more than 10 years and approximately 50% of Private bank ultra-high-net-worth clients have been with Citi for more than 10 years. U.S. Personal Banking deposits are spread across six core urban centers.
Long-Term Debt
Weighted AverageWeighted-Average Maturity (WAM)
The following table presents Citigroup and its affiliates’
(including Citibank) WAM of unsecured long-term debt issued with a remaining life greater than one year:
| | WAM in years | WAM in years | Jun. 30, 2023 | Mar. 31, 2023 | Jun. 30, 2022 | WAM in years | Mar. 31, 2024 | Dec. 31, 2023 | Mar. 31, 2023 |
| Unsecured debt | Unsecured debt | 7.7 | | 7.5 | | 8.0 | |
| Non-bank benchmark debt | Non-bank benchmark debt | 7.3 | | 7.2 | | 7.5 | |
| Customer-related debt | |
| TLAC-eligible debt | TLAC-eligible debt | 8.9 | | 8.8 | | 9.1 | |
The WAM is calculated based on the contractual maturity of each security. For securities that are redeemable prior to maturity atwhere the option ofis not held by the holder,issuer, the WAM is calculated based on the earliest date an option becomes exercisable.
Long-Term Debt Outstanding
Citi’s long-term debt outstanding at the Citigroup parent company includes benchmark senior and subordinated debt and what Citi refers to as customer-related debt, consisting of structured notes, such as equity- and credit-linked notes, as well as non-structured notes. Citi’s issuance of customer-related debt is generally driven by customer demand and complements benchmark debt issuance as a source of funding for Citi’s non-bank entities. Citi’s long-term debt at the bank includes bank notes, FHLB advances and securitizations.
The following table presents Citi’s end-of-period total long-term debt outstanding for each of the dates indicated:
| | In billions of dollars | In billions of dollars | Jun. 30, 2023 | Mar. 31, 2023 | Jun. 30, 2022 | In billions of dollars | Mar. 31, 2024 | Dec. 31, 2023 | Mar. 31, 2023 |
Non-bank(1) | Non-bank(1) | |
| Benchmark debt: | Benchmark debt: | |
| Benchmark debt: | |
| Benchmark debt: | |
| Senior debt | |
| Senior debt | |
| Senior debt | Senior debt | $ | 111.1 | | $ | 117.1 | | $ | 120.3 | |
| Subordinated debt | Subordinated debt | 24.5 | | 22.7 | | 24.0 | |
| Trust preferred | Trust preferred | 1.6 | | 1.6 | | 1.6 | |
| Customer-related debt | Customer-related debt | 110.3 | | 109.7 | | 84.9 | |
Local country and other(2) | Local country and other(2) | 7.9 | | 8.7 | | 7.8 | |
| Total non-bank | Total non-bank | $ | 255.4 | | $ | 259.8 | | $ | 238.6 | |
| Bank | Bank | |
| FHLB borrowings | FHLB borrowings | $ | 7.5 | | $ | 7.3 | | $ | 2.3 | |
| FHLB borrowings | |
| FHLB borrowings | |
Securitizations(3) | Securitizations(3) | 5.5 | | 6.6 | | 9.5 | |
| Citibank benchmark senior debt | Citibank benchmark senior debt | 2.6 | | 2.6 | | 2.6 | |
Local country and other(2) | Local country and other(2) | 3.5 | | 3.4 | | 4.4 | |
| Total bank | Total bank | $ | 19.1 | | $ | 19.9 | | $ | 18.8 | |
| Total long-term debt | Total long-term debt | $ | 274.5 | | $ | 279.7 | | $ | 257.4 | |
Note: Amounts represent the current value of long-term debt on Citi’s Consolidated Balance Sheet that, for certain debt instruments, includes consideration of fair value, hedging impacts and unamortized discounts and premiums.
(1)Non-bank includes long-term debt issued to third parties by the parent holding company (Citigroup) and Citi’s non-bank subsidiaries (including broker-dealer subsidiaries) that are consolidated into Citigroup. As of June 30, 2023,March 31, 2024, non-bank included $92.4$89.4 billion of long-term debt issued by Citi’s broker-dealer and other subsidiaries that are consolidated into
Citigroup. Certain Citigroup consolidated hedging activities are also included in this line.
(2)Local country and other includes debt issued by Citi’s affiliates in support of their local operations. Within non-bank, certain secured financing is also included.
(3)Predominantly credit card securitizations, primarily backed by Branded cardsCards receivables.
Citi’s total long-term debt outstanding increased 7%2% year-over-year, largely driven by the issuance of customer-relatedsubordinated debt atin the non-bank entities, as well as increased senior benchmark debt and increased FHLB borrowings at the bank. The increase was partially offset by the decline in senior benchmark debt at the non-bank entities, as well as lower securitizations at the bank. Sequentially, long-term debt outstanding decreased 2%, largely driven by a decline in senior benchmark debt at the non-bank entities. Sequentially, long-term debt outstanding was largely unchanged.
As part of its liability management, Citi has considered, and may continue to consider, opportunities to redeem or repurchase its long-term debt pursuant to open market purchases, tender offers or other means. Such redemptions and repurchases help reduce Citi’s overall funding costs. During the secondfirst quarter of 2023,2024, Citi redeemed or repurchased an aggregate of approximately $8.9$9.4 billion of its outstanding long-term debt.
Long-Term Debt Issuances and Maturities
The table below details Citi’s long-term debt issuances and maturities (including repurchases and redemptions) during the periods presented:
| | | | 2Q23 | 1Q23 | 2Q22 | | 1Q24 | 4Q23 | 1Q23 |
| In billions of dollars | In billions of dollars | Maturities | Issuances | Maturities | Issuances | Maturities | Issuances | In billions of dollars | Maturities | Issuances | Maturities | Issuances | Maturities | Issuances |
| Non-bank | Non-bank | | | | | |
| Benchmark debt: | Benchmark debt: | | | | | |
| Benchmark debt: | |
| Benchmark debt: | |
| Senior debt | |
| Senior debt | |
| Senior debt | Senior debt | $ | 5.3 | | $ | — | | $ | 1.7 | | $ | — | | $ | 3.5 | | $ | 6.0 | |
| Subordinated debt | Subordinated debt | 1.3 | | 3.2 | | — | | — | | — | | — | |
| Trust preferred | Trust preferred | — | | — | | — | | — | | — | | — | |
| Customer-related debt | Customer-related debt | 12.5 | | 10.6 | | 9.0 | | 14.1 | | 5.0 | | 21.8 | |
| Local country and other | Local country and other | 0.9 | | 0.6 | | 0.4 | | 1.5 | | 0.3 | | 0.4 | |
| Total non-bank | Total non-bank | $ | 20.0 | | $ | 14.4 | | $ | 11.1 | | $ | 15.6 | | $ | 8.8 | | $ | 28.2 | |
| Bank | Bank | | | | | |
| FHLB borrowings | FHLB borrowings | $ | 2.3 | | $ | 2.5 | | $ | — | | $ | — | | $ | 1.0 | | $ | 2.3 | |
| FHLB borrowings | |
| FHLB borrowings | |
| Securitizations | Securitizations | 1.1 | | — | | 1.0 | | — | | — | | — | |
| Citibank benchmark senior debt | Citibank benchmark senior debt | — | | — | | — | | — | | 0.9 | | — | |
| Local country and other | Local country and other | 0.1 | | — | | 0.3 | | 0.1 | | 0.6 | | 0.1 | |
| Total bank | Total bank | $ | 3.5 | | $ | 2.5 | | $ | 1.3 | | $ | 0.1 | | $ | 2.5 | | $ | 2.4 | |
| Total | Total | $ | 23.5 | | $ | 16.9 | | $ | 12.4 | | $ | 15.7 | | $ | 11.3 | | $ | 30.6 | |
The table below details Citi’s aggregate long-term debt maturities (including repurchases and redemptions) during the first quarter of 2023,2024, as well as its aggregate expected remaining long-term debt maturities by year as of June 30, 2023:March 31, 2024:
| | | | 2Q23 YTD | Maturities | | | Maturities |
| In billions of dollars | In billions of dollars | 2023 | 2024 | 2025 | 2026 | 2027 | 2028 | Thereafter | Total | In billions of dollars | 1Q24 | Remaining
2024 | 2025 | 2026 | 2027 | 2028 | 2029 | Thereafter | Total |
| Non-bank | Non-bank | | | | |
| Benchmark debt: | Benchmark debt: | | | | |
| Benchmark debt: | |
| Benchmark debt: | |
| Senior debt | |
| Senior debt | |
| Senior debt | Senior debt | $ | 7.0 | | $ | 3.2 | | $ | 5.4 | | $ | 11.9 | | $ | 23.6 | | $ | 6.9 | | $ | 14.8 | | $ | 45.3 | | $ | 111.1 | |
| Subordinated debt | Subordinated debt | 1.3 | | — | | 0.9 | | 4.8 | | 2.3 | | 3.6 | | 2.0 | | 10.9 | | 24.5 | |
| Trust preferred | Trust preferred | — | | — | | — | | — | | — | | — | | — | | 1.6 | | 1.6 | |
| Customer-related debt | Customer-related debt | 21.5 | | 8.9 | | 24.1 | | 15.7 | | 8.9 | | 10.0 | | 6.8 | | 35.9 | | 110.3 | |
| Local country and other | Local country and other | 1.3 | | 0.9 | | 1.1 | | 1.8 | | 0.7 | | — | | 0.9 | | 2.5 | | 7.9 | |
| Total non-bank | Total non-bank | $ | 31.1 | | $ | 13.0 | | $ | 31.5 | | $ | 34.2 | | $ | 35.5 | | $ | 20.5 | | $ | 24.5 | | $ | 96.2 | | $ | 255.4 | |
| Bank | Bank | | | | |
| FHLB borrowings | FHLB borrowings | $ | 2.3 | | $ | 2.0 | | $ | 3.0 | | $ | 2.5 | | $ | — | | $ | — | | $ | — | | $ | — | | $ | 7.5 | |
| FHLB borrowings | |
| FHLB borrowings | |
| Securitizations | Securitizations | 2.1 | | 0.1 | | 1.3 | | 1.6 | | — | | 0.8 | | 1.0 | | 0.7 | | 5.5 | |
| Citibank benchmark senior debt | Citibank benchmark senior debt | — | | — | | 2.6 | | — | | — | | — | | — | | — | | 2.6 | |
| Local country and other | Local country and other | 0.4 | | 0.5 | | 1.0 | | 0.2 | | 0.3 | | — | | 0.3 | | 1.2 | | 3.5 | |
| Total bank | Total bank | $ | 4.8 | | $ | 2.6 | | $ | 7.9 | | $ | 4.3 | | $ | 0.3 | | $ | 0.8 | | $ | 1.3 | | $ | 1.9 | | $ | 19.1 | |
| Total long-term debt | Total long-term debt | $ | 35.9 | | $ | 15.6 | | $ | 39.4 | | $ | 38.5 | | $ | 35.8 | | $ | 21.3 | | $ | 25.8 | | $ | 98.1 | | $ | 274.5 | |
Secured Funding Transactions and Short-Term Borrowings
Citi supplements its primary sources of funding with short-term financings that generally include (i) secured funding transactions consisting of securities loaned or sold under agreements to repurchase, i.e., repos, and (ii) to a lesser extent, short-term borrowings consisting of commercial paper and borrowings from the FHLB and other market participants.
Secured Funding Transactions
Secured funding is primarily accessed through Citi’s broker-dealer subsidiaries, with a smaller portion executed through Citi’s bank entities to efficiently fund both (i) secured lending activity and (ii) a portion of the securities inventory held in the context of market making and customer activities. Secured funding transactions are predominantly collateralized by government debt securities. Generally, changes in the level of Citi’s secured funding are primarily due to fluctuations in secured lending activity in the matched book (as described below) and changes in securities inventory. In order to maintain reliable funding under a wide range of market conditions, Citi manages risks related to its secured funding by establishing secured funding limits and conducting daily stress tests that account for risks related to capacity, tenor, haircut, collateral type, counterparty and client actions.
Secured funding of $260$299 billion as of June 30, 2023March 31, 2024 increased 31%16% year-over-year and 1%8% sequentially, largely driven by additional financing to support increases in trading-related assets within Citi’s broker-dealer subsidiaries. As of the quarter ended June 30, 2023,March 31, 2024, on an average basis, secured funding was $262$311 billion. The portion of secured funding in the broker-dealer subsidiaries that funds secured lending is commonly referred to as “matched book” activity and is primarily secured by high-quality liquid securities such as U.S. Treasury securities, U.S. agency securities and foreign government debt securities. Other “matched book” activity is secured by less liquid securities, including equity securities, corporate bonds and asset-backed securities, the tenor of which is generally equal to or longer than the tenor of the corresponding assets. As indicated above, the remaining portion of secured funding is used to fund securities inventory held in the context of market making and customer activities.
Short-Term Borrowings
Citi’s short-term borrowings of $40$32 billion as of the second quarter of 2023 was largely unchanged bothMarch 31, 2024 decreased 21% year-over-year and 15% sequentially, both reflecting lower commercial paper issuances at the broker-dealer subsidiaries (see Note 1718 for further information on Citigroup’s and its affiliates’ outstanding short-term borrowings).
Credit Ratings
The table below presents the ratings for Citigroup and Citibank as of June 30, 2023.March 31, 2024. While not included in the table below, the long-term and short-term ratings of Citigroup Global Markets Holdings Inc. (CGMHI) were A+/F1 at Fitch Ratings, A2/P-1 at Moody’s Investors Service and A/A-1 at S&P Global Ratings as of June 30, 2023.March 31, 2024.
Ratings as of June 30, 2023March 31, 2024
| | | | | | | | | | | | | | | | | | | | |
| Citigroup Inc. | Citibank, N.A. |
| | Long-term | Short-term | Outlook | Long-
term | Short-
term | Outlook |
| Fitch Ratings (Fitch) | A | F1 | Stable | A+ | F1 | Stable |
| Moody’s Investors Service (Moody’s) | A3 | P-2 | Stable | Aa3 | P-1 | Stable |
| S&P Global Ratings (S&P) | BBB+ | A-2 | Stable | A+ | A-1 | Stable |
Potential Impacts of Ratings Downgrades
Ratings downgrades by Fitch, Moody’s or S&P could negatively impact Citigroup’s and/or Citibank’s funding and liquidity due to reduced funding capacity, including derivative triggers, which could take the form of cash obligations and collateral requirements.
For additional information on the impact of credit rating changes on Citi and its applicable subsidiaries, see “Risk Factors—Liquidity Risks” and “Credit Ratings” in Citi’s 20222023 Form 10-K.
Citigroup Inc. and Citibank—Potential Derivative Triggers
As of June 30, 2023,March 31, 2024, Citi estimates that a hypothetical one-notch downgrade of the senior debt/long-term rating of Citigroup Inc. across all three major rating agencies could impact Citigroup’s funding and liquidity due to derivative triggers by approximately $0.4$0.2 billion compared to $0.3 billion as of March(unchanged from December 31, 2023.2023). Other funding sources, such as secured fundingfinancing transactions and other margin requirements, for which there are no explicit triggers, could also be adversely affected.
As of June 30, 2023,March 31, 2024, Citi estimates that a hypothetical one-notch downgrade of the senior debt/long-term rating of Citibank across all three major rating agencies could impact Citibank’s funding and liquidity due to derivative triggers by approximately $0.4 billion, compared to $0.3 billion as of March(unchanged from December 31, 2023.2023). Other funding sources, such as secured funding transactions and other margin requirements, for which there are no explicit triggers, could also be adversely impacted.
In total, as of June 30, 2023,March 31, 2024, Citi estimates that a one-notch downgrade of Citigroup Inc. and Citibank across all three major rating agencies could result in increased aggregate cash obligations and collateral requirements of approximately $0.8$0.6 billion, compared to $0.6$0.5 billion as of MarchDecember 31, 2023 (see also Note 21).2023. As detailed under “High-Quality Liquid Assets (HQLA)” above, Citigroup has various liquidity resources available to its bank and non-bank entities in part as a contingency for the potential events described above.
Citibank—Additional Potential Impacts
In addition to the above derivative triggers, Citi believes that a potential downgrade of Citibank’s senior debt/long-term rating across any of the three major rating agencies could also have an adverse impact on the commercial paper/short-term rating of Citibank. Citibank has provided liquidity commitments to consolidated asset-backed commercial paper conduits, primarily in the form of asset purchase agreements. As of June 30, 2023,March 31, 2024, Citibank had liquidity commitments of approximately $10.9$11.1 billion to consolidated asset-backed commercial paper conduits which was largely unchanged from March(compared to $11.0 billion at December 31, 20232023) (see Note 20 for additional information)21).
In addition to the above-referenced liquidity resources of certain Citibank entities, Citibank could reduce the funding and liquidity risk, if any, of the potential downgrades described above through mitigating actions, including repricing or reducing certain commitments to commercial paper conduits. In the event of the potential downgrades described above, Citi believes that certain corporate customers could reevaluatere-evaluate their deposit relationships with Citibank. This reevaluationre-evaluation could result in clients adjusting their discretionary deposit levels or changing their depository institution, which could potentially reduce certain deposit levels at Citibank. However, Citi could choose to adjust pricing, offer alternative deposit products to its existing customers or seek to attract deposits from new customers, in addition to the mitigating actions referenced above.
MARKET RISK
Market risk arises from both Citi’s trading and non-trading portfolios. For additional information on market risk and market risk management at Citi, see “Market Risk—Overview” and “Risk Factors” in Citi’s 20222023 Form 10-K.
Market Risk of Non-Trading PortfoliosMARKET RISK OF NON-TRADING PORTFOLIOS
Market risk from non-trading portfolios stems predominantly from the potential impact of changes in interest rates and foreign exchange rates on Citi’s net interest income and on Citi’s Accumulated other comprehensive income (loss) (AOCI) from its investment securities portfolios. Market risk from non-trading portfolios also includes the potential impact of changes in foreign exchange rates on Citi’s capital invested in foreign currencies.
Banking Book Interest Rate Risk
For interest rate risk purposes, Citi’s non-trading portfolios are referred to as the Banking Book. Management of interest rate risk in the Banking Book is governed by Citi’s Non-Trading Market Risk Policy. Management’s Asset & Liability Committee (ALCO) establishes Citi’s risk appetite and related limits for interest rate risk in the Banking Book, which are subject to approval by Citigroup’s Board of Directors. Corporate Treasury is responsible for the day-to-day management of Citi’s Banking Book interest rate risk as well as periodically reviewing it with the ALCO. Citi’s Banking Book interest rate risk management is also subject to independent oversight from the second line of defense team reporting to the Chief Risk Officer.
Changes in interest rates impact Citi’s net income, AOCI and CET1. These changes primarily affect Citi’s Banking Book through net interest income, due to a variety of risk factors, including:
•Differences in timing and amounts of the maturity or repricing of assets, liabilities and off-balance sheet instruments;
•Changes in the level and/or shape of interest rate curves;
•Client behavior in response to changes in interest rates (e.g., mortgage prepayments, deposit betas); and
•Changes in the maturity of instruments resulting from changes in the interest rate environment.
As part of their ongoing activities, Citi’s businesses generate interest rate-sensitive positions from their client-facing products, such as loans and deposits. The component of this interest rate risk that can be hedged is transferred via Citi’s funds transfer pricing process to Corporate Treasury. Corporate Treasury uses various tools to manage the total interest rate risk position within the established risk appetite and target Citi’s desired risk profile, including its investment securities portfolio, company-issued debt and interest rate derivatives.
In addition, Citi uses multiple metrics to measure its Banking Book interest rate risk. Interest Rate Exposure (IRE) is a key metric that analyzes the impact of a range of scenarios on Citi’s Banking Book net interest income and certain other interest rate-sensitive income versus a base case. IRE does not represent a forecast of Citi’s net interest income.
The scenarios, methodologies and assumptions used in this analysis are periodically evaluated and enhanced in response to changes in the market environment, changes in Citi’s balance sheet composition, enhancements in Citi’s modeling and other factors.
Since the third quarter of 2022, Citi has employed enhanced IRE methodologies and changes to certain assumptions. The changes included, among other things, assumptions around the projected balance sheet and revisions to the treatment of certain business contributions (notably accrual positions in ICG’sMarketsbusinesses). These changes resulted in a higher impact to Citi’s net interest income over a 12-month period.
Under the enhanced methodology, Citi utilizes the most recent quarter-end balance sheet, assuming no changes to its composition and size over the forecasted horizon (holding the balance sheet static). The forecasts incorporate expectations and assumptions of deposit pricing, loan spreads and mortgage prepayment behavior implied by the interest rate curves in each scenario. The base case scenario reflects the market impliedmarket-implied forward interest rates, and sensitivity scenarios assume instantaneous shocks to the base case. The forecasts do not assume Citi takes any risk-mitigating actions in response to changes in the interest rate environment. Certain interest rates are subject to flooring assumptions in downward rate scenarios. Deposit pricing sensitivities (i.e., deposit betas), are informed by historical and expected behavior. Actual deposit pricing could differ from the assumptions used in these forecasts.
Citi’s IRE analysis primarily reflects the impacts from the following Banking Book assets and liabilities: loans, client deposits, Citi’s deposits with other banks, investment securities, long-term debt, any related interest rate hedges and the funds transfer pricing of positions in total trading and credit portfolio value at risk (VAR). It excludes impacts from any positions that are included in total trading and credit portfolio VAR.
In addition to IRE, Citi analyzes economic value sensitivity (EVS) as a longer-term interest rate risk metric. EVS is a net present value (NPV)–based measure of the lifetime cash flows of Citi’s Banking Book. It estimates the interest rate sensitivity of the Banking Book’s economic value from longer-term assets being potentially funded with shorter-term liabilities, or vice versa. Citi manages EVS within risk limits approved by Citigroup’s Board of Directors that are aligned with Citi’s interest rate risk appetite.
Interest Rate Risk of Investment Portfolios—Impact on AOCI
Citi also measures the potential impacts of changes in interest rates on the value of its AOCI, which can in turn impact Citi’s common equity and tangible common equity. This will impact Citi’s CET1 and other regulatory capital ratios. Citi seeks to manage its exposure to changes in the market level of interest rates, while limiting the potential impact on its AOCI and regulatory capital position.
AOCI at risk is managed as part of the Company-wide interest rate risk position. AOCI at risk considers potential
changes in AOCI (and the corresponding impact on the CET1 Capital ratio) relative to Citi’s capital generation capacity.
Citi uses 100 basis point (bps) shocks in each scenario to reflect its net interest income sensitivity to unanticipated changes in market interest rates, as potential monetary policy decisions and changes in economic conditions may be reflected in current market impliedmarket-implied forward rates. The following table presents the 12-month estimated impact to Citi’s net interest income, AOCI and the CET1 Capital ratio, each assuming an unanticipated parallel instantaneous 100 bps increase in interest rates:
| | In millions of dollars, except as otherwise noted | In millions of dollars, except as otherwise noted | Jun. 30, 2023 | Mar. 31, 2023 | Jun. 30, 2022 | In millions of dollars, except as otherwise noted | Mar. 31, 2024 | Dec. 31, 2023 | Mar. 31, 2023 |
| Parallel interest rate shock +100 bps | Parallel interest rate shock +100 bps | |
Interest rate exposure(1)(2) | Interest rate exposure(1)(2) | |
Interest rate exposure(1)(2) | |
Interest rate exposure(1)(2) | |
| U.S. dollar | |
| U.S. dollar | |
| U.S. dollar | U.S. dollar | $ | (55) | | $ | 304 | | $ | 605 | |
| All other currencies | All other currencies | 1,468 | | 1,361 | | 2,185 | |
| Total | Total | $ | 1,413 | | $ | 1,665 | | $ | 2,790 | |
| As a percentage of average interest-earning assets | As a percentage of average interest-earning assets | 0.06 | % | 0.07 | % | 0.11 | % | As a percentage of average interest-earning assets | 0.06 | % | 0.05 | % | 0.07 | % |
Estimated initial negative impact to AOCI (after-tax)(3) | $ | (1,416) | | $ | (1,557) | | $ | (2,522) | |
Estimated initial impact on CET1 Capital ratio (bps) from AOCI scenario | (12) | | (11) | | (10) | |
Estimated initial negative impact to AOCI (after-tax)(2) | |
Estimated initial impact on CET1 Capital ratio (bps) from AOCI scenario(3) | |
(1)Excludes trading book and fair value option banking book portfolios and replaces them with the associated transfer pricing.
(2)IRE as of June 30, 2022 does not reflect certain IRE methodology enhancements that were subsequently implemented in September 2022, most notably the Banking Book revisions to the treatment of certain business activities.
(3)Includes the effect of changes in interest rates on AOCI related to investment securities, cash flow hedges and pension liability adjustments.
(3)Excludes the effect of changes in interest rates on AOCI related to cash flow hedges, as those changes are excluded from CET1 Capital.
The “AllAll other currencies”currencies of $1,468$1,398 million as of June 30, 2023March 31, 2024 in the table above includes the impact from the following top sixfive non-U.S. dollar currencies, which represents nearlyapproximately 50% of the total non-U.S. dollar currency impact: approximately $0.2 billion each from the British pound sterling and Japanese yen, and approximately $0.1 billion each from Japanese yen,the Indian rupee, Singapore dollar Taiwan dollar, Indian rupee and Swiss franc.South Korean won. These impacts per currency are generally in the same direction (estimated positive impact in the +100 bps shock scenario) and not offsetting.
Citi’s balance sheet is asset sensitive (assets reprice faster than liabilities), resulting in higher net interest income in increasing interest rate scenarios. The estimated impact to Citi’s net interest income in a 100 bps upward rate shock scenario as of the second quarter of 2023 decreasedMarch 31, 2024 was largely unchanged quarter-over-quarter and decreased year-over-year, primarily reflecting the net impact of lower expected gains due to U.S. dollar interest rate moves that have already been realized and changes in deposit composition and levels, partially offset by hedging actions.Citi’s balance sheet. At progressively higher interest rate levels, the marginal net interest income benefit is lower, as Citi assumes it will pass on a larger share of rate changes to depositors (i.e., higher betas), further reducing Citi’s IRE sensitivity. Currency-specific interest rate changes and balance sheet factors may drive quarter-to-quarter volatility in Citi’s estimated IRE.
In a 100 bps upward rate shock scenario, Citi expects that the approximate $1.4$1.2 billion initial negative impact to AOCI could potentially be offset in shareholders’ equity through the expected recovery of the impact on AOCI through accretion of Citi’s investment portfolio and expected net interest income benefit over a period of approximately six months.
Scenario Analysis
The following table presents the estimated impact to Citi’s net interest income, AOCI and CET1 Capital ratio (on a fully implemented basis) under six different scenarios of changes in interest rates for the U.S. dollar and all other currencies in which Citi has invested capital as of June 30, 2023.March 31, 2024. The 100 bps downward rate scenarios are impacted by the low level of interest rates in several countries and the assumption that market interest rates, as well as rates paid to depositors and charged to borrowers, do not fall below zero (i.e., the “flooring assumption”). The interest rate scenarios are also impacted by convexity related to mortgage products.products and deposit pricing.
| | In millions of dollars, except as otherwise noted | In millions of dollars, except as otherwise noted | Scenario 1 | Scenario 2 | Scenario 3 | Scenario 4 | Scenario 5 | Scenario 6 | In millions of dollars, except as otherwise noted | Scenario 1 | Scenario 2 | Scenario 3 | Scenario 4 | Scenario 5 | Scenario 6 |
| Overnight rate change (bps) | Overnight rate change (bps) | 100 | | 100 | | — | | — | | (100) | | (100) | |
| 10-year rate change (bps) | 10-year rate change (bps) | 100 | | — | | 100 | | (100) | | — | | (100) | |
| Interest rate exposure | Interest rate exposure | |
| U.S. dollar | U.S. dollar | $ | (55) | | $ | (95) | | $ | 38 | | $ | (67) | | $ | (10) | | $ | (93) | |
| U.S. dollar | |
| U.S. dollar | |
All other currencies(1) | All other currencies(1) | 1,468 | | 1,262 | | 210 | | (190) | | (1,152) | | (1,348) | |
| Total | Total | $ | 1,413 | | $ | 1,167 | | $ | 248 | | $ | (257) | | $ | (1,162) | | $ | (1,441) | |
Estimated initial impact to AOCI (after-tax)(2) | Estimated initial impact to AOCI (after-tax)(2) | $ | (1,416) | | $ | (1,242) | | $ | (191) | | $ | 90 | | $ | 1,237 | | $ | 1,353 | |
Estimated initial impact to CET1 Capital ratio (bps) from AOCI scenario | Estimated initial impact to CET1 Capital ratio (bps) from AOCI scenario | (12) | | (8) | | (4) | | 3 | | 8 | | 12 | |
Note: Each scenario assumes that the rate change will occur instantaneously. Changes in interest rates for maturities between the overnight rate and the 10-year rate are interpolated. The interest rate exposure in the table above assumes no change in deposit size or mix from the baseline forecast included in the different interest scenarios presented. As a result, in higher interest rate scenarios, customer activity resulting in a shift from non-interest-bearing and low interest rate deposit products to higher-yielding deposits would reduce the expected benefit to net interest income. Conversely, in lower interest rate scenarios, customer activity resulting in a shift from higher-yielding deposits to non-interest-bearing and low interest rate deposit products would reduce the expected decrease to net interest income.
(1)Scenario 1 includes the impact from the following top sixfive non-U.S. dollar currencies, which represents nearlyapproximately 50% of the total non-U.S. dollar currency impact: approximately $0.2 billion each from the British pound sterling and Japanese yen, and approximately $0.1 millionbillion each from Japanese yen,the Indian rupee, Singapore dollar Taiwan dollar, Indian rupee and Swiss franc.South Korean won. These impacts per currency are generally in the same direction (estimated positive impact in the +100 bps shock scenario) and not offsetting.
(2)Includes the effect of changes in interest rates on AOCI related to investment securities, cash flow hedges and pension liability adjustments.
As shownpresented in the table above, the estimated impact to Citi’s net interest income is larger under Scenario 2 than Scenario 3, as Citi’s Banking Book has relatively higher interest rate exposure to the short end of the yield curve. For U.S. dollars, exposure to downward rate shocks is larger in magnitude than to upward rate shocks. This is because of the lower benefit to net interest income from Citi’s deposit base at higher rate levels, as well as the prepayment effects on mortgage loans and mortgage-backed securities. For other non-U.S. dollar currencies, exposure to downward rate shocks is smaller in magnitude as a result of Citi’s flooring assumption, given low rate levels for certain non-U.S. dollar currencies.
The magnitude of the impact to AOCI is greater under Scenario 2 compared to Scenario 3. This is because the combination of changes to Citi’s investment portfolio, partially offset by changes related to Citi’s pension liabilities, results in a net position that is more sensitive to rates at shorter- and intermediate-term maturities.
Changes in Foreign Exchange Rates—Impacts on AOCI and Capital
As of June 30, 2023,March 31, 2024, Citi estimates that an unanticipated parallel instantaneous 5% appreciation of the U.S. dollar against all of the other currencies in which Citi has invested capital could reduce Citi’s tangible common equity (TCE) by approximately $1.7 billion, or 0.96%1.0%, as a result of changes to Citi’s CTA in AOCI, net of hedges. This impact would be primarily due to changes in the value of the Mexican peso, Euro, Singapore dollar and Indian rupee.
This impact is also before any mitigating actions Citi may take, including ongoing management of its foreign currency
translation exposure. Specifically, as currency movements change the value of Citi’s net investments in foreign currency-denominated capital, these movements also change the value of Citi’s risk-weighted assets denominated in those currencies.
This, coupled with Citi’s foreign currency hedging strategies, such as foreign currency borrowings, foreign currency forwards and other currency hedging instruments, lessens the impact of foreign currency movements on Citi’s CET1 Capital ratio. Changes in these hedging strategies, as well as hedging costs, divestitures and tax impacts, can further affect the actual impact of changes in foreign exchange rates on Citi’s capital compared to an unanticipated parallel shock, as described above.
The effect of Citi’s ongoing management strategies with respect to quarterly changes in foreign exchange rates, and the quarterly impact of these changes on Citi’s TCE and CET1 Capital ratio, are shownpresented in the table below. See Note 1819 for additional information on the changes in AOCI.
| | For the quarter ended |
| For the quarter ended | | | For the quarter ended |
| In millions of dollars, except as otherwise noted | In millions of dollars, except as otherwise noted | Jun. 30, 2023 | Mar. 31, 2023 | Jun. 30, 2022 | In millions of dollars, except as otherwise noted | Mar. 31, 2024 | Dec. 31, 2023 | Mar. 31, 2023 |
Change in FX spot rate(1) | Change in FX spot rate(1) | (0.2) | % | 1.5 | % | (4.9) | % | Change in FX spot rate(1) | (1.7) | % | 3.2 | % | 1.5 | % |
| Change in TCE due to FX translation, net of hedges | Change in TCE due to FX translation, net of hedges | $ | (98) | | $ | 636 | | $ | (1,335) | |
| As a percentage of TCE | As a percentage of TCE | (0.1) | % | 0.4 | % | (0.9) | % | As a percentage of TCE | (0.6) | % | 0.1 | % | — | % |
Estimated impact to CET1 Capital ratio (on a fully implemented basis)
due to changes in FX translation, net of hedges (bps) | Estimated impact to CET1 Capital ratio (on a fully implemented basis)
due to changes in FX translation, net of hedges (bps) | — | | 1 | | 5 | |
(1) FX spot rate change is a weighted average based on Citi’s quarterly average GAAP capital exposure to foreign countries.
Interest Revenue/Income/Expense and Net Interest Margin (NIM)
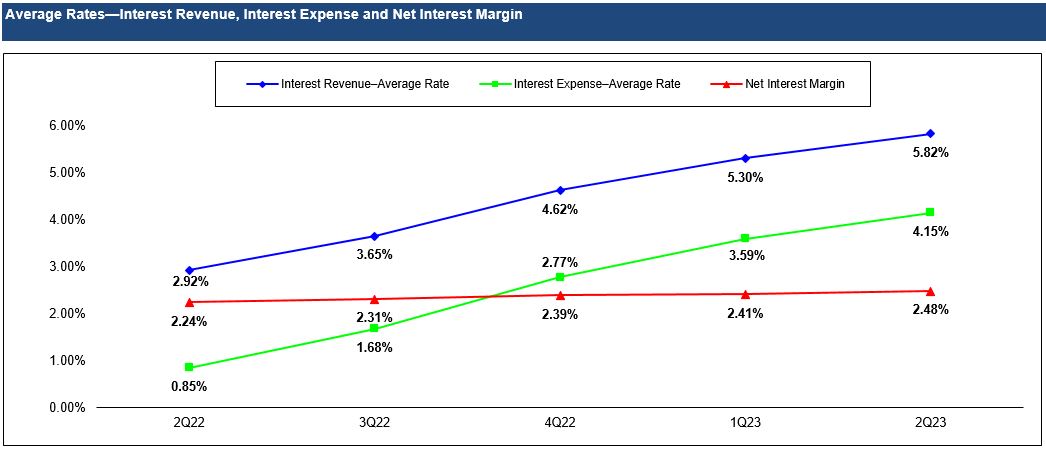
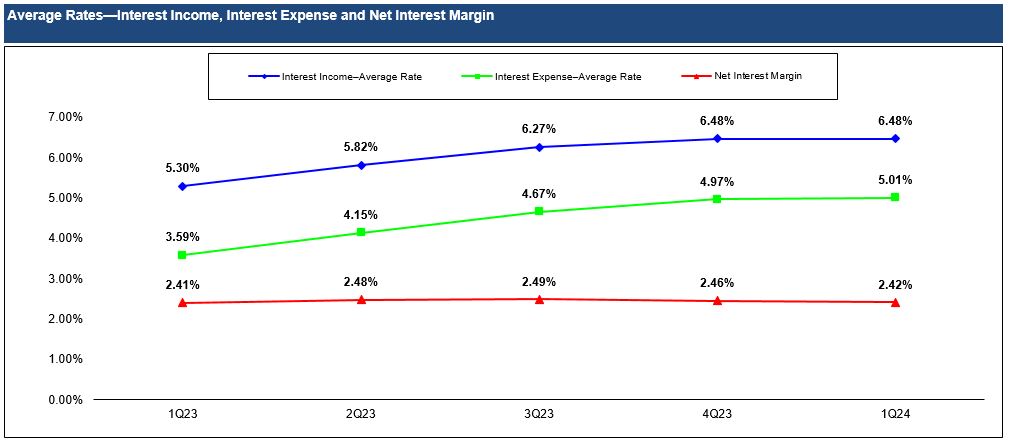
| | 2nd Qtr. | | 1st Qtr. | | 2nd Qtr. | | Change |
| 1st Qtr. | | | 1st Qtr. | | 4th Qtr. | | 1st Qtr. | | Change |
| In millions of dollars, except as otherwise noted | In millions of dollars, except as otherwise noted | 2023 | | 2023 | | 2022 | | 2Q23 vs. 2Q22 | In millions of dollars, except as otherwise noted | 2024 | | 2023 | | 2023 | | 1Q24 vs. 1Q23 |
Interest revenue(1) | $ | 32,660 | | | $ | 29,439 | | | $ | 15,674 | | | 108 | % | |
Interest income(1) | |
Interest expense(2) | |
Interest expense(2) | |
Interest expense(2) | Interest expense(2) | 18,747 | | | 16,047 | | | 3,666 | | | 411 | | |
Net interest income, taxable equivalent basis(1) | Net interest income, taxable equivalent basis(1) | $ | 13,913 | | | $ | 13,392 | | | $ | 12,008 | | | 16 | % | |
Interest revenue—average rate(3) | 5.82 | % | | 5.30 | % | | 2.92 | % | | 290 | | bps |
Net interest income, taxable equivalent basis(1) | |
Net interest income, taxable equivalent basis(1) | |
Interest income—average rate(3) | |
Interest income—average rate(3) | |
Interest income—average rate(3) | | 6.48 | % | | 6.48 | % | | 5.30 | % | | 118 | | bps |
| Interest expense—average rate | Interest expense—average rate | 4.15 | | | 3.59 | | | 0.85 | | | 330 | | bps | Interest expense—average rate | 5.01 | | | 4.97 | | 4.97 | | | 3.59 | | 3.59 | | | 142 | | 142 | | bps | bps |
Net interest margin(3)(4) | Net interest margin(3)(4) | 2.48 | | | 2.41 | | | 2.24 | | | 24 | | bps | Net interest margin(3)(4) | 2.42 | | | 2.46 | | 2.46 | | | 2.41 | | 2.41 | | | 1 | | 1 | | bps | bps |
| Interest rate benchmarks | Interest rate benchmarks | | | Interest rate benchmarks | | | | | | | | |
| Two-year U.S. Treasury note—average rate | Two-year U.S. Treasury note—average rate | 4.26 | % | | 4.34 | % | | 2.72 | % | | 154 | | bps | Two-year U.S. Treasury note—average rate | 4.48 | % | | 4.81 | % | | 4.34 | % | | 14 | | bps | bps |
| 10-year U.S. Treasury note—average rate | 10-year U.S. Treasury note—average rate | 3.60 | | | 3.65 | | | 2.93 | | | 67 | | bps | 10-year U.S. Treasury note—average rate | 4.16 | | | | 4.45 | | | | 3.65 | | | 51 | | 51 | | bps | bps |
| 10-year vs. two-year spread | 10-year vs. two-year spread | (66) | | bps | (69) | | bps | 21 | | bps | | 10-year vs. two-year spread | (32) | | bps | bps | (36) | | bps | bps | (69) | | bps | bps | |
(1)Interest revenueincome and Net interest income include the taxable equivalent adjustments primarily related to the tax-exempt bond portfolio and certain tax-advantaged loan programs (based on the U.S. federal statutory tax rate of 21%) of $13$23 million, $44$21 million and $44 million for the three months ended June 30,March 31, 2024, December 31, 2023 and March 31, 2023, and June 30, 2022, respectively.
(2)Interest expense associated with certain hybrid financial instruments, which are classified as Long-term debt and accounted for at fair value, is reported together with any changes in fair value as part of Principal transactions in the Consolidated Statement of Income and is therefore not reflected in Interest expense in the table above.
(3)The average rate on interest revenueincome and net interest margin reflects the taxable equivalent gross-up adjustment. See footnote 1 above.
(4)Citi’s NIM is calculated by dividing net interest income by average interest-earning assets.
Non-ICG MarketsMarkets Net Interest Income
| | 2nd Qtr. | 1st Qtr. | 2nd Qtr. | Change |
| 1st Qtr. | | | 1st Qtr. | 4th Qtr. | 1st Qtr. | Change |
| In millions of dollars | In millions of dollars | 2023 | 2023 | 2022 | 2Q23 vs. 2Q22 | In millions of dollars | 2024 | 2023 | 1Q24 vs. 1Q23 |
Net interest income—taxable equivalent basis(1) per above | Net interest income—taxable equivalent basis(1) per above | $ | 13,913 | | $ | 13,392 | | $ | 12,008 | | 16 | % | Net interest income—taxable equivalent basis(1) per above | $ | 13,530 | | $ | 13,845 | | $ | 13,392 | | 1 | 1 | % |
ICG Markets net interest income—taxable equivalent basis(1) | 1,983 | | 1,471 | | 1,358 | | 46 | |
Non-ICG Markets net interest income—taxable equivalent basis(1) | $ | 11,930 | | $ | 11,921 | | $ | 10,650 | | 12 | % |
Markets net interest income—taxable equivalent basis(1) | |
Non-Markets net interest income—taxable equivalent basis(1) | | Non-Markets net interest income—taxable equivalent basis(1) | $ | 11,794 | | $ | 11,830 | | $ | 11,786 | | — | % |
(1)Interest revenueincome and Net interest income include the taxable equivalent adjustments discussed in the table above.
Citi’s net interest income in the secondfirst quarter of 2023 increased 16% to $13.92024 was $13.5 billion, on both a reported and taxable equivalent basis, an increase of $0.1 billion versus the prior-year period. As presented in the table above, Citi’s net interest income on a taxable equivalent basis also increased 16% year-over-year, or $1.9 billion. The increase wasperiod, primarily driven by higher net interest income in non-ICGMarkets. Markets, which increased 12%, and ICG Markets, which increased 46%. The increase in net interest income in non-ICG Markets primarily reflected higher interest rates, growth in U.S. cards interest-earning balances and higher income from Citi’s investment portfolio, partially offset by the reduction from the exited markets and continued wind-downs in Legacy Franchises. The increase in ICGMarkets Markets net interest income was primarily driven by Fixed Income markets. Non-Markets net interest income was largely unchanged, as the impact from higher interest rates as well as a changeand the growth in U.S. cards interest-earning balances in USPB were offset by higher funding costs in the mix of trading positionsmortgage-backed securities portfolio in support of client activity.Corporate Treasury within All Other.
Citi’s net interest margin was 2.48%2.42% on a taxable equivalent basis in the secondfirst quarter of 2023, an increase2024, a decrease of 7four basis points from the prior quarter, primarilylargely driven by the benefits of dividend seasonality in ICG Markets and higher interest rates, partially offset by a mix shift to higher cost deposits.
Additional Interest Rate Details
Average Balances and Interest Rates—Assets(1)(2)(3)
Taxable Equivalent Basis
| | | | | | | | | | | | | | | | | | | | | | | | | | | | | |
| Quarterly—Assets | Average balance | Interest revenue | % Average rate |
| 2nd Qtr. | 1st Qtr. | 2nd Qtr. | 2nd Qtr. | 1st Qtr. | 2nd Qtr. | 2nd Qtr. | 1st Qtr. | 2nd Qtr. |
| In millions of dollars, except rates | 2023 | 2023 | 2022 | 2023 | 2023 | 2022 | 2023 | 2023 | 2022 |
Deposits with banks(4) | $ | 310,047 | | $ | 328,141 | | $ | 227,377 | | $ | 3,049 | | $ | 3,031 | | $ | 658 | | 3.94 | % | 3.75 | % | 1.16 | % |
Securities borrowed and purchased under agreements to resell(5) | | | | | | | | | |
| In U.S. offices | $ | 182,676 | | $ | 186,573 | | $ | 190,065 | | $ | 3,227 | | $ | 2,840 | | $ | 458 | | 7.09 | % | 6.17 | % | 0.97 | % |
In offices outside the U.S.(4) | 183,028 | | 181,476 | | 159,455 | | 3,027 | | 2,334 | | 347 | | 6.63 | | 5.22 | | 0.87 | |
| Total | $ | 365,704 | | $ | 368,049 | | $ | 349,520 | | $ | 6,254 | | $ | 5,174 | | $ | 805 | | 6.86 | % | 5.70 | % | 0.92 | % |
Trading account assets(6)(7) | | | | | | | | | |
| In U.S. offices | $ | 180,214 | | $ | 164,217 | | $ | 139,087 | | $ | 2,071 | | $ | 1,773 | | $ | 632 | | 4.61 | % | 4.38 | % | 1.82 | % |
In offices outside the U.S.(4) | 149,015 | | 134,607 | | 136,850 | | 1,681 | | 975 | | 1,030 | | 4.52 | | 2.94 | | 3.02 | |
| Total | $ | 329,229 | | $ | 298,824 | | $ | 275,937 | | $ | 3,752 | | $ | 2,748 | | $ | 1,662 | | 4.57 | % | 3.73 | % | 2.42 | % |
| Investments | | | | | | | | | |
| In U.S. offices | | | | | | | | | |
| Taxable | $ | 337,957 | | $ | 344,776 | | $ | 357,249 | | $ | 2,238 | | $ | 2,149 | | $ | 1,132 | | 2.66 | % | 2.53 | % | 1.27 | % |
| Exempt from U.S. income tax | 11,577 | | 11,608 | | 11,898 | | 108 | | 116 | | 108 | | 3.74 | | 4.05 | | 3.64 | |
In offices outside the U.S.(4) | 158,415 | | 160,140 | | 150,435 | | 2,110 | | 1,894 | | 1,147 | | 5.34 | | 4.80 | | 3.06 | |
| Total | $ | 507,949 | | $ | 516,524 | | $ | 519,582 | | $ | 4,456 | | $ | 4,159 | | $ | 2,387 | | 3.52 | % | 3.27 | % | 1.84 | % |
Consumer loans(8) | | | | | | | | | |
| In U.S. offices | $ | 289,122 | | $ | 283,493 | | $ | 264,240 | | $ | 7,294 | | $ | 7,051 | | $ | 5,348 | | 10.12 | % | 10.09 | % | 8.12 | % |
In offices outside the U.S.(4) | 78,730 | | 80,176 | | 88,291 | | 1,668 | | 1,573 | | 1,253 | | 8.50 | | 7.96 | | 5.69 | |
| Total | $ | 367,852 | | $ | 363,669 | | $ | 352,531 | | $ | 8,962 | | $ | 8,624 | | $ | 6,601 | | 9.77 | % | 9.62 | % | 7.51 | % |
Corporate loans(8) | | | | | | | | | |
| In U.S. offices | $ | 135,716 | | $ | 137,733 | | $ | 142,180 | | $ | 1,791 | | $ | 1,736 | | $ | 1,285 | | 5.29 | % | 5.11 | % | 3.63 | % |
In offices outside the U.S.(4) | 150,023 | | 152,335 | | 162,776 | | 3,311 | | 2,951 | | 1,632 | | 8.85 | | 7.86 | | 4.02 | |
| Total | $ | 285,739 | | $ | 290,068 | | $ | 304,956 | | $ | 5,102 | | $ | 4,687 | | $ | 2,917 | | 7.16 | % | 6.55 | % | 3.84 | % |
Total loans(8) | | | | | | | | | |
| In U.S. offices | $ | 424,838 | | $ | 421,226 | | $ | 406,420 | | $ | 9,085 | | $ | 8,787 | | $ | 6,633 | | 8.58 | % | 8.46 | % | 6.55 | % |
In offices outside the U.S.(4) | 228,753 | | 232,511 | | 251,067 | | 4,979 | | 4,524 | | 2,885 | | 8.73 | | 7.89 | | 4.61 | |
| Total | $ | 653,591 | | $ | 653,737 | | $ | 657,487 | | $ | 14,064 | | $ | 13,311 | | $ | 9,518 | | 8.63 | % | 8.26 | % | 5.81 | % |
Other interest-earning assets(9) | $ | 85,083 | | $ | 87,758 | | $ | 121,629 | | $ | 1,085 | | $ | 1,016 | | $ | 644 | | 5.11 | % | 4.70 | % | 2.12 | % |
| Total interest-earning assets | $ | 2,251,603 | | $ | 2,253,033 | | $ | 2,151,532 | | $ | 32,660 | | $ | 29,439 | | $ | 15,674 | | 5.82 | % | 5.30 | % | 2.92 | % |
Non-interest-earning assets(6) | $ | 214,011 | | $ | 209,211 | | $ | 228,521 | | | | | | | |
| | | | | | | | | |
| Total assets | $ | 2,465,614 | | $ | 2,462,244 | | $ | 2,380,053 | | | | | | | |
| | | | | | | | | |
| | | | | | | | | |
| | | | | | | | | |
| | | | | | | | | |
| | | | | | | | | |
| | | | | | | | | |
| | | | | | | | | |
| | | | | | | | | |
| | | | | | | | | |
| | Six Months—Assets | Average balance | Interest revenue | % Average rate |
| Six Months | | Six Months | Six Months | | Six Months | Six Months | | Six Months |
| Quarterly—Assets | | Quarterly—Assets | Average balance | Interest income | % Average rate |
| 1st Qtr. | | | 1st Qtr. | 4th Qtr. | 1st Qtr. | 1st Qtr. | 4th Qtr. | 1st Qtr. | 1st Qtr. | 4th Qtr. | 1st Qtr. |
| In millions of dollars, except rates | In millions of dollars, except rates | 2023 | | 2022 | 2023 | | 2022 | 2023 | | 2022 | In millions of dollars, except rates | 2024 | 2023 | 2024 | 2023 | 2024 | 2023 |
Deposits with banks(4) | Deposits with banks(4) | $ | 319,094 | | | $ | 243,957 | | $ | 6,080 | | | $ | 954 | | 3.84 | % | | 0.79 | % | Deposits with banks(4) | $ | 251,928 | | $ | 251,723 | | $ | 328,141 | | $ | 2,647 | | $ | 2,513 | | $ | 3,031 | | 4.23 | 4.23 | % | 3.96 | % | 3.75 | % |
Securities borrowed and purchased under agreements to resell(5) | Securities borrowed and purchased under agreements to resell(5) | | | | | |
| In U.S. offices | |
| In U.S. offices | |
| In U.S. offices | In U.S. offices | $ | 184,624 | | | $ | 184,030 | | $ | 6,067 | | | $ | 567 | | 6.63 | % | | 0.62 | % | $ | 146,905 | | $ | 150,420 | | $ | 186,573 | | $ | 3,424 | | $ | 3,550 | | $ | 2,840 | | 9.37 | 9.37 | % | 9.36 | % | 6.17 | % |
In offices outside the U.S.(4) | In offices outside the U.S.(4) | 182,252 | | | 162,548 | | 5,361 | | | 632 | | 5.93 | | | 0.78 | |
| Total | Total | $ | 366,876 | | | $ | 346,578 | | $ | 11,428 | | | $ | 1,199 | | 6.28 | % | | 0.70 | % | Total | $ | 358,699 | | $ | 357,058 | | $ | 368,049 | | $ | 7,822 | | $ | 8,096 | | $ | 5,174 | | 8.77 | 8.77 | % | 9.00 | % | 5.70 | % |
Trading account assets(6)(7) | Trading account assets(6)(7) | | | | | |
| In U.S. offices | In U.S. offices | $ | 172,215 | | | $ | 137,972 | | $ | 3,844 | | | $ | 1,224 | | 4.50 | % | | 1.79 | % |
| In U.S. offices | |
| In U.S. offices | | $ | 221,725 | | $ | 210,311 | | $ | 164,217 | | $ | 2,660 | | $ | 2,630 | | $ | 1,773 | | 4.83 | % | 4.96 | % | 4.38 | % |
In offices outside the U.S.(4) | In offices outside the U.S.(4) | 141,811 | | | 135,227 | | 2,656 | | | 1,586 | | 3.78 | | | 2.37 | |
| Total | Total | $ | 314,026 | | | $ | 273,199 | | $ | 6,500 | | | $ | 2,810 | | 4.17 | % | | 2.07 | % | Total | $ | 369,681 | | $ | 354,090 | | $ | 298,824 | | $ | 4,128 | | $ | 4,067 | | $ | 2,748 | | 4.49 | 4.49 | % | 4.56 | % | 3.73 | % |
| Investments | Investments | | | | | |
| In U.S. offices | In U.S. offices | | | | | |
| In U.S. offices | |
| In U.S. offices | |
| Taxable | |
| Taxable | |
| Taxable | Taxable | $ | 341,366 | | | $ | 355,577 | | $ | 4,387 | | | $ | 2,153 | | 2.59 | % | | 1.22 | % | $ | 321,048 | | $ | 327,647 | | $ | 344,776 | | $ | 2,144 | | $ | 2,229 | | $ | 2,149 | | 2.69 | 2.69 | % | 2.70 | % | 2.53 | % |
| Exempt from U.S. income tax | Exempt from U.S. income tax | 11,593 | | | 11,755 | | 224 | | | 203 | | 3.90 | | | 3.48 | |
In offices outside the U.S.(4) | In offices outside the U.S.(4) | 159,278 | | | 151,869 | | 4,004 | | | 2,098 | | 5.07 | | | 2.79 | |
| Total | Total | $ | 512,237 | | | $ | 519,201 | | $ | 8,615 | | | $ | 4,454 | | 3.39 | % | | 1.73 | % | Total | $ | 516,121 | | $ | 516,272 | | $ | 516,524 | | $ | 4,857 | | $ | 4,993 | | $ | 4,159 | | 3.78 | 3.78 | % | 3.84 | % | 3.27 | % |
Consumer loans(8) | Consumer loans(8) | | | | | |
| In U.S. offices | In U.S. offices | $ | 286,307 | | | $ | 260,748 | | $ | 14,345 | | | $ | 10,393 | | 10.10 | % | | 8.04 | % |
| In U.S. offices | |
| In U.S. offices | | $ | 305,469 | | $ | 304,109 | | $ | 283,493 | | $ | 8,038 | | $ | 7,975 | | $ | 7,051 | | 10.58 | % | 10.40 | % | 10.09 | % |
In offices outside the U.S.(4) | In offices outside the U.S.(4) | 79,453 | | | 91,632 | | 3,241 | | | 2,470 | | 8.23 | | | 5.44 | |
| Total | Total | $ | 365,760 | | | $ | 352,380 | | $ | 17,586 | | | $ | 12,863 | | 9.70 | % | | 7.36 | % | Total | $ | 381,800 | | $ | 380,430 | | $ | 363,669 | | $ | 9,798 | | $ | 9,669 | | $ | 8,624 | | 10.32 | 10.32 | % | 10.08 | % | 9.62 | % |
Corporate loans(8) | Corporate loans(8) | | | | | |
| In U.S. offices | In U.S. offices | $ | 136,725 | | | $ | 139,528 | | $ | 3,527 | | | $ | 2,397 | | 5.20 | % | | 3.46 | % |
| In U.S. offices | |
| In U.S. offices | | $ | 136,929 | | $ | 136,867 | | $ | 137,733 | | $ | 2,200 | | $ | 2,172 | | $ | 1,736 | | 6.46 | % | 6.30 | % | 5.11 | % |
In offices outside the U.S.(4) | In offices outside the U.S.(4) | 151,179 | | | 161,123 | | 6,262 | | | 2,997 | | 8.35 | | | 3.75 | |
| Total | Total | $ | 287,904 | | | $ | 300,651 | | $ | 9,789 | | | $ | 5,394 | | 6.86 | % | | 3.62 | % | Total | $ | 296,955 | | $ | 294,242 | | $ | 290,068 | | $ | 5,759 | | $ | 5,832 | | $ | 4,687 | | 7.80 | 7.80 | % | 7.86 | % | 6.55 | % |
Total loans(8) | Total loans(8) | | | | | |
| In U.S. offices | |
| In U.S. offices | |
| In U.S. offices | In U.S. offices | $ | 423,032 | | | $ | 400,276 | | $ | 17,872 | | | $ | 12,790 | | 8.52 | % | | 6.44 | % | $ | 442,398 | | $ | 440,976 | | $ | 421,226 | | $ | 10,238 | | $ | 10,147 | | $ | 8,787 | | 9.31 | 9.31 | % | 9.13 | % | 8.46 | % |
In offices outside the U.S.(4) | In offices outside the U.S.(4) | 230,632 | | | 252,755 | | 9,503 | | | 5,467 | | 8.31 | | | 4.36 | |
| Total | Total | $ | 653,664 | | | $ | 653,031 | | $ | 27,375 | | | $ | 18,257 | | 8.45 | % | | 5.64 | % | Total | $ | 678,755 | | $ | 674,672 | | $ | 653,737 | | $ | 15,557 | | $ | 15,501 | | $ | 13,311 | | 9.22 | 9.22 | % | 9.12 | % | 8.26 | % |
Other interest-earning assets(9) | Other interest-earning assets(9) | $ | 86,421 | | | $ | 120,722 | | $ | 2,101 | | | $ | 1,193 | | 4.90 | % | | 1.99 | % | Other interest-earning assets(9) | $ | 75,001 | | $ | 76,483 | | $ | 87,758 | | $ | 1,235 | | $ | 1,230 | | $ | 1,016 | | 6.62 | 6.62 | % | 6.38 | % | 4.70 | % |
| Total interest-earning assets | Total interest-earning assets | $ | 2,252,318 | | | $ | 2,156,688 | | $ | 62,099 | | | $ | 28,867 | | 5.56 | % | | 2.70 | % | Total interest-earning assets | $ | 2,250,185 | | $ | 2,230,298 | | $ | 2,253,033 | | $ | 36,246 | | $ | 36,400 | | $ | 29,439 | | 6.48 | 6.48 | % | 6.48 | % | 5.30 | % |
Non-interest-earning assets(6) | Non-interest-earning assets(6) | $ | 211,611 | | | $ | 220,359 | | | | | |
| | Total assets | |
| | Total assets | |
| | Total assets | Total assets | $ | 2,463,929 | | | $ | 2,377,047 | | | | | |
| | |
(1)Interest revenueincome and Net interest income include the taxable equivalent adjustments primarily related to the tax-exempt bond portfolio and certain tax-advantaged loan programs (based on the U.S. federal statutory tax rate of 21%) of $13$23 million, $44$21 million and $44 million for the three months ended June 30,March 31, 2024, December 31, 2023 and March 31, 2023, and June 30, 2022, respectively, and $57 million and $86 million for the six months ended June 30, 2023 and 2022, respectively.
(2)Interest rates and amounts include the effects of risk management activities associated with the respective asset categories.
(3)Monthly or quarterly averages have been used by certain subsidiaries where daily averages are unavailable.
(4)Average rates reflect prevailing local interest rates, including inflationary effects and monetary corrections in certain countries.
(5)Average volumes of securities borrowed or purchased under agreements to resell are reported net pursuant to ASC 210-20-45. However, Interest revenueincome excludes the impact of ASC 210-20-45.
(6)The fair value carrying amounts of derivative contracts are reported net, pursuant to ASC 815-10-45, in Non-interest-earning assets and Other non-interest-bearing liabilities.
(7)Interest expense on Trading account liabilities of ICGServices, Markets and Banking is reported as a reduction of Interest revenueincome. Interest revenueincome and Interest expense on cash collateral positions are reported in interest on Trading account assets and Trading account liabilities, respectively.
(8)Net of unearned income. Includes cash-basis loans.
(9)Includes assets from businesses held-for-sale (see Note 2) and Brokerage receivables.
Average Balances and Interest Rates—Liabilities and Equity, and Net Interest Income(1)(2)(3)
Taxable Equivalent Basis
| | | | | | | | | | | | | | | | | | | | | | | | | | | | | |
| Quarterly—Liabilities | Average balance | Interest expense | % Average rate |
| 2nd Qtr. | 1st Qtr. | 2nd Qtr. | 2nd Qtr. | 1st Qtr. | 2nd Qtr. | 2nd Qtr. | 1st Qtr. | 2nd Qtr. |
| In millions of dollars, except rates | 2023 | 2023 | 2022 | 2023 | 2023 | 2022 | 2023 | 2023 | 2022 |
| Deposits | | | | | | | | | |
In U.S. offices(4) | $ | 595,476 | | $ | 603,997 | | $ | 554,182 | | $ | 4,983 | | $ | 4,432 | | $ | 545 | | 3.36 | % | 2.98 | % | 0.39 | % |
In offices outside the U.S.(5) | 536,735 | | 543,179 | | 513,820 | | 3,744 | | 3,276 | | 875 | | 2.80 | | 2.45 | | 0.68 | |
| Total | $ | 1,132,211 | | $ | 1,147,176 | | $ | 1,068,002 | | $ | 8,727 | | $ | 7,708 | | $ | 1,420 | | 3.09 | % | 2.72 | % | 0.53 | % |
Securities loaned and sold under agreements to repurchase(6) | | | | | | | | | |
| In U.S. offices | $ | 170,226 | | $ | 131,235 | | $ | 112,011 | | $ | 3,084 | | $ | 2,232 | | $ | 391 | | 7.27 | % | 6.90 | % | 1.40 | % |
In offices outside the U.S.(5) | 91,921 | | 92,473 | | 96,388 | | 1,869 | | 1,334 | | 264 | | 8.16 | | 5.85 | | 1.10 | |
| Total | $ | 262,147 | | $ | 223,708 | | $ | 208,399 | | $ | 4,953 | | $ | 3,566 | | $ | 655 | | 7.58 | % | 6.46 | % | 1.26 | % |
Trading account liabilities(7)(8) | | | | | | | | | |
| In U.S. offices | $ | 50,429 | | $ | 52,236 | | $ | 52,714 | | $ | 479 | | $ | 412 | | $ | 24 | | 3.81 | % | 3.20 | % | 0.18 | % |
In offices outside the U.S.(5) | 77,925 | | 77,125 | | 72,096 | | 391 | | 375 | | 113 | | 2.01 | | 1.97 | | 0.63 | |
| Total | $ | 128,354 | | $ | 129,361 | | $ | 124,810 | | $ | 870 | | $ | 787 | | $ | 137 | | 2.72 | % | 2.47 | % | 0.44 | % |
Short-term borrowings and other interest-bearing liabilities(9) | | | | | | | | | |
| In U.S. offices | $ | 86,990 | | $ | 96,092 | | $ | 94,028 | | $ | 1,608 | | $ | 1,482 | | $ | 217 | | 7.41 | % | 6.25 | % | 0.93 | % |
In offices outside the U.S.(5) | 39,744 | | 47,930 | | 60,211 | | 169 | | 167 | | 51 | | 1.71 | | 1.41 | | 0.34 | |
| Total | $ | 126,734 | | $ | 144,022 | | $ | 154,239 | | $ | 1,777 | | $ | 1,649 | | $ | 268 | | 5.62 | % | 4.64 | % | 0.70 | % |
Long-term debt(10) | | | | | | | | | |
| In U.S. offices | $ | 159,803 | | $ | 167,852 | | $ | 164,832 | | $ | 2,367 | | $ | 2,285 | | $ | 1,143 | | 5.94 | % | 5.52 | % | 2.78 | % |
In offices outside the U.S.(5) | 2,524 | | 2,681 | | 3,892 | | 53 | | 52 | | 43 | | 8.42 | | 7.87 | | 4.43 | |
| Total | $ | 162,327 | | $ | 170,533 | | $ | 168,724 | | $ | 2,420 | | $ | 2,337 | | $ | 1,186 | | 5.98 | % | 5.56 | % | 2.82 | % |
| Total interest-bearing liabilities | $ | 1,811,773 | | $ | 1,814,800 | | $ | 1,724,174 | | $ | 18,747 | | $ | 16,047 | | $ | 3,666 | | 4.15 | % | 3.59 | % | 0.85 | % |
| Demand deposits in U.S. offices | $ | 113,639 | | $ | 120,670 | | $ | 143,426 | | | | | | | |
Other non-interest-bearing liabilities(7) | 331,119 | | 322,464 | | 313,926 | | | | | | | |
| | | | | | | | | |
| Total liabilities | $ | 2,256,531 | | $ | 2,257,934 | | $ | 2,181,526 | | | | | | | |
| Citigroup stockholders’ equity | $ | 208,459 | | $ | 203,727 | | $ | 197,976 | | | | | | | |
| Noncontrolling interests | 624 | | 583 | | 551 | | | | | | | |
| Total equity | $ | 209,083 | | $ | 204,310 | | $ | 198,527 | | | | | | | |
| Total liabilities and stockholders’ equity | $ | 2,465,614 | | $ | 2,462,244 | | $ | 2,380,053 | | | | | | | |
Net interest income as a percentage of average interest-earning assets(11) | | | | | | | | | |
| In U.S. offices | $ | 1,336,146 | | $ | 1,340,929 | | $ | 1,247,713 | | $ | 6,961 | | $ | 7,455 | | $ | 7,070 | | 2.09 | % | 2.25 | % | 2.27 | % |
In offices outside the U.S.(6) | 915,457 | | 912,104 | | 903,819 | | 6,952 | | 5,937 | | 4,938 | | 3.05 | | 2.64 | | 2.19 | |
| Total | $ | 2,251,603 | | $ | 2,253,033 | | $ | 2,151,532 | | $ | 13,913 | | $ | 13,392 | | $ | 12,008 | | 2.48 | % | 2.41 | % | 2.24 | % |
| | | | | | | | | |
| | | | | | | | | |
| | | | | | | | | |
| | | | | | | | | |
| | | | | | | | | |
| | | | | | | | | |
| | | | | | | | | |
| | | | | | | | | |
| | | | | | | | | |
| | | | | | | | | |
| | Six Months—Liabilities | Average balance | Interest expense | % Average rate |
| Six Months | | Six Months | Six Months | | Six Months | Six Months | | Six Months |
| Quarterly—Liabilities | | Quarterly—Liabilities | Average balance | Interest expense | % Average rate |
| 1st Qtr. | | | 1st Qtr. | 4th Qtr. | 1st Qtr. | 1st Qtr. | 4th Qtr. | 1st Qtr. | 1st Qtr. | 4th Qtr. | 1st Qtr. |
| In millions of dollars, except rates | In millions of dollars, except rates | 2023 | | 2022 | 2023 | | 2022 | 2023 | | 2022 | In millions of dollars, except rates | 2024 | 2023 | 2024 | 2023 | 2024 | 2023 |
| Deposits | Deposits | | | | | | Deposits | | | | | | | | | |
In U.S. offices(4) | In U.S. offices(4) | $ | 599,736 | | | $ | 557,100 | | $ | 9,415 | | | $ | 782 | | 3.17 | % | | 0.28 | % | In U.S. offices(4) | $ | 590,112 | | $ | 591,972 | | $ | 603,997 | | $ | 5,901 | | $ | 5,797 | | $ | 4,432 | | 4.02 | 4.02 | % | 3.89 | % | 2.98 | % |
In offices outside the U.S.(5) | In offices outside the U.S.(5) | 539,957 | | | 516,954 | | 7,020 | | | 1,509 | | 2.62 | | | 0.59 | |
| Total | Total | $ | 1,139,693 | | | $ | 1,074,054 | | $ | 16,435 | | | $ | 2,291 | | 2.91 | % | | 0.43 | % | Total | $ | 1,132,197 | | $ | 1,124,798 | | $ | 1,147,176 | | $ | 10,411 | | $ | 10,235 | | $ | 7,708 | | 3.70 | 3.70 | % | 3.61 | % | 2.72 | % |
Securities loaned and sold under agreements to repurchase(6) | Securities loaned and sold under agreements to repurchase(6) | | | | | |
| In U.S. offices | In U.S. offices | $ | 150,731 | | | $ | 114,902 | | $ | 5,316 | | | $ | 552 | | 7.11 | % | | 0.97 | % |
| In U.S. offices | |
| In U.S. offices | | $ | 214,904 | | $ | 191,644 | | $ | 131,235 | | $ | 4,310 | | $ | 4,056 | | $ | 2,232 | | 8.07 | % | 8.40 | % | 6.90 | % |
In offices outside the U.S.(5) | In offices outside the U.S.(5) | 92,197 | | | 94,348 | | 3,203 | | | 385 | | 7.01 | | | 0.82 | |
| Total | Total | $ | 242,928 | | | $ | 209,250 | | $ | 8,519 | | | $ | 937 | | 7.07 | % | | 0.90 | % | Total | $ | 310,540 | | $ | 288,144 | | $ | 223,708 | | $ | 6,966 | | $ | 6,830 | | $ | 3,566 | | 9.02 | 9.02 | % | 9.40 | % | 6.46 | % |
Trading account liabilities(7)(8) | Trading account liabilities(7)(8) | | | | | |
| In U.S. offices | In U.S. offices | $ | 51,333 | | | $ | 50,653 | | $ | 891 | | | $ | 60 | | 3.50 | % | | 0.24 | % |
| In U.S. offices | |
| In U.S. offices | | $ | 43,045 | | $ | 41,745 | | $ | 52,236 | | $ | 440 | | $ | 462 | | $ | 412 | | 4.11 | % | 4.39 | % | 3.20 | % |
In offices outside the U.S.(5) | In offices outside the U.S.(5) | 77,525 | | | 68,908 | | 766 | | | 224 | | 1.99 | | | 0.66 | |
| Total | Total | $ | 128,858 | | | $ | 119,561 | | $ | 1,657 | | | $ | 284 | | 2.59 | % | | 0.48 | % | Total | $ | 103,674 | | $ | 106,399 | | $ | 129,361 | | $ | 831 | | $ | 878 | | $ | 787 | | 3.22 | 3.22 | % | 3.27 | % | 2.47 | % |
Short-term borrowings and other interest bearing liabilities(9) | | | | | |
Short-term borrowings and other interest-bearing liabilities(9) | |
| In U.S. offices | |
| In U.S. offices | |
| In U.S. offices | In U.S. offices | $ | 91,541 | | | $ | 86,345 | | $ | 3,090 | | | $ | 230 | | 6.81 | % | | 0.54 | % | $ | 78,408 | | $ | 89,880 | | $ | 96,092 | | $ | 1,702 | | $ | 1,834 | | $ | 1,482 | | 8.73 | 8.73 | % | 8.10 | % | 6.25 | % |
In offices outside the U.S.(5) | In offices outside the U.S.(5) | 43,837 | | | 60,205 | | 336 | | | 93 | | 1.55 | | | 0.31 | |
| Total | Total | $ | 135,378 | | | $ | 146,550 | | $ | 3,426 | | | $ | 323 | | 5.10 | % | | 0.44 | % | Total | $ | 108,600 | | $ | 116,054 | | $ | 144,022 | | $ | 1,956 | | $ | 2,056 | | $ | 1,649 | | 7.24 | 7.24 | % | 7.03 | % | 4.64 | % |
Long-term debt(10) | Long-term debt(10) | | | | | |
| In U.S. offices | In U.S. offices | $ | 163,827 | | | $ | 165,903 | | $ | 4,652 | | | $ | 2,032 | | 5.73 | % | | 2.47 | % |
| In U.S. offices | |
| In U.S. offices | | $ | 166,128 | | $ | 162,878 | | $ | 167,852 | | $ | 2,500 | | $ | 2,503 | | $ | 2,285 | | 6.05 | % | 6.10 | % | 5.52 | % |
In offices outside the U.S.(5) | In offices outside the U.S.(5) | 2,603 | | | 3,923 | | 105 | | | 79 | | 8.13 | | | 4.06 | |
| Total | Total | $ | 166,430 | | | $ | 169,826 | | $ | 4,757 | | | $ | 2,111 | | 5.76 | % | | 2.51 | % | Total | $ | 168,628 | | $ | 165,349 | | $ | 170,533 | | $ | 2,552 | | $ | 2,556 | | $ | 2,337 | | 6.09 | 6.09 | % | 6.13 | % | 5.56 | % |
| Total interest-bearing liabilities | Total interest-bearing liabilities | $ | 1,813,287 | | | $ | 1,719,241 | | $ | 34,794 | | | $ | 5,946 | | 3.87 | % | | 0.70 | % | Total interest-bearing liabilities | $ | 1,823,639 | | $ | 1,800,744 | | $ | 1,814,800 | | $ | 22,716 | | $ | 22,555 | | $ | 16,047 | | 5.01 | 5.01 | % | 4.97 | % | 3.59 | % |
| Demand deposits in U.S. offices | $ | 117,155 | | | $ | 136,388 | | | | | |
Non-interest-bearing deposits(11) | |
Other non-interest-bearing liabilities(7) | |
Other non-interest-bearing liabilities(7) | |
Other non-interest-bearing liabilities(7) | Other non-interest-bearing liabilities(7) | 326,946 | | | 321,748 | | | | | |
| | Total liabilities | Total liabilities | $ | 2,257,388 | | | $ | 2,177,377 | | | | | |
| | Total liabilities | |
| | Total liabilities | |
| Citigroup stockholders’ equity | |
| Citigroup stockholders’ equity | |
| Citigroup stockholders’ equity | Citigroup stockholders’ equity | $ | 205,937 | | | $ | 199,070 | | | | | |
| Noncontrolling interests | Noncontrolling interests | 604 | | | 600 | | | | | |
| Noncontrolling interests | |
| Noncontrolling interests | |
| Total equity | |
| Total equity | |
| Total equity | Total equity | $ | 206,541 | | | $ | 199,670 | | | | | |
| Total liabilities and stockholders’ equity | Total liabilities and stockholders’ equity | $ | 2,463,929 | | | $ | 2,377,047 | | | | | |
Net interest income as a percentage of average interest-earning assets(11) | | | | | |
| Total liabilities and stockholders’ equity | |
| Total liabilities and stockholders’ equity | |
Net interest income as a percentage of average interest-earning assets(12) | |
Net interest income as a percentage of average interest-earning assets(12) | |
Net interest income as a percentage of average interest-earning assets(12) | |
| In U.S. offices | |
| In U.S. offices | |
| In U.S. offices | In U.S. offices | $ | 1,338,537 | | | $ | 1,247,385 | | $ | 14,416 | | | $ | 13,928 | | 2.17 | % | | 2.25 | % | $ | 1,294,095 | | $ | 1,293,480 | | $ | 1,340,929 | | $ | 6,032 | | $ | 6,245 | | $ | 7,455 | | 1.87 | 1.87 | % | 1.92 | % | 2.25 | % |
In offices outside the U.S.(6) | In offices outside the U.S.(6) | 913,781 | | | 909,303 | | 12,889 | | | 8,993 | | 2.84 | | | 1.99 | |
| Total | Total | $ | 2,252,318 | | | $ | 2,156,688 | | $ | 27,305 | | | $ | 22,921 | | 2.44 | % | | 2.14 | % | Total | $ | 2,250,185 | | $ | 2,230,298 | | $ | 2,253,033 | | $ | 13,530 | | $ | 13,845 | | $ | 13,392 | | 2.42 | 2.42 | % | 2.46 | % | 2.41 | % |
| |
(1)Interest revenueincome and Net interest income include the taxable equivalent adjustments discussed in the table above.
(2)Interest rates and amounts include the effects of risk management activities associated with the respective liability categories.
(3)Monthly or quarterly averages have been used by certain subsidiaries where daily averages are unavailable.
(4)Consists of other time deposits and savings deposits. Savings deposits are made up of insured money market accounts, NOW accounts and other savings deposits.
(5)Average rates reflect prevailing local interest rates, including inflationary effects and monetary corrections in certain countries.
(6)Average volumes of securities sold under agreements to repurchase are reported net pursuant to ASC 210-20-45. However, Interest expense excludes the impact of ASC 210-20-45.
(7)The fair value carrying amounts of derivative contracts are reported net, pursuant to ASC 815-10-45, in Non-interest-earning assets and Other non-interest-bearing liabilities.
(8)Interest expense on Trading account liabilities of ICGServices, Markets and Banking is reported as a reduction of Interest revenueincome. Interest revenueincome and Interest expense on cash collateral positions are reported in interest on Trading account assets and Trading account liabilities, respectively.
(9)Includes Brokerage payables.
(10)Excludes hybrid financial instruments and beneficial interests in consolidated VIEs that are classified as Long-term debt, as the changes in fair value for these obligations are recorded in Principal transactions.
(11)Includes non-interest-bearing deposits in both the U.S. and outside of the U.S.
(12)Includes allocations for capital and funding costs based on the location of the asset.
Market Risk of Trading PortfoliosMARKET RISK OF TRADING PORTFOLIOS
Value at Risk (VAR)
Citi believes its VAR model is conservatively calibrated to incorporate fat-tail scaling and the greater of short-term (approximately the most recent month) and long-term (18 months for commodities and three years for others) market volatility. As of June 30, 2023,March 31, 2024, Citi estimates that the conservative features of the VAR calibration contribute an approximate 48%30% add-on to what would be a VAR estimated under the assumption of stable and perfectly, normally distributed markets. As of MarchDecember 31, 2023, the add-on was 65%30%.
As presented in the table below, Citi’s average trading VAR for the secondfirst quarter of 2024 increased 10% from the fourth quarter of 2023, decreased 3% quarter-over-quarter, primarily fromdue to inventory changes in theICG MarketsMarkets businesses. businesses and updates to reflect changes in volatilities.
Quarter-end and Average Trading VAR and Trading and Credit Portfolio VAR
| | Second Quarter | | First Quarter | | Second Quarter |
| | First Quarter | | | | First Quarter | | Fourth Quarter | | First Quarter |
| In millions of dollars | In millions of dollars | June 30, 2023 | 2023 Average | March 31, 2023 | 2023 Average | June 30, 2022 | 2022 Average | In millions of dollars | March 31, 2024 | 2024 Average | December 31, 2023 | 2023 Average | March 31, 2023 | 2023 Average |
| Interest rate | Interest rate | $ | 109 | | $ | 129 | | $ | 172 | | $ | 131 | | $ | 122 | | $ | 94 | |
| Credit spread | Credit spread | 63 | | 69 | | 80 | | 76 | | 69 | | 70 | |
Covariance adjustment(1) | Covariance adjustment(1) | (48) | | (49) | | (55) | | (52) | | (45) | | (45) | |
Fully diversified interest rate and credit spread(2) | Fully diversified interest rate and credit spread(2) | $ | 124 | | $ | 149 | | $ | 197 | | $ | 155 | | $ | 146 | | $ | 119 | |
| Foreign exchange | Foreign exchange | 20 | | 18 | | 15 | | 19 | | 35 | | 36 | |
| Equity | Equity | 30 | | 22 | | 22 | | 24 | | 25 | | 24 | |
| Commodity | Commodity | 29 | | 37 | | 43 | | 36 | | 38 | | 45 | |
Covariance adjustment(1) | Covariance adjustment(1) | (91) | | (89) | | (94) | | (93) | | (96) | | (106) | |
Total trading VAR—all market risk factors, including general and specific risk (excluding credit portfolios)(2) | Total trading VAR—all market risk factors, including general and specific risk (excluding credit portfolios)(2) | $ | 112 | | $ | 137 | | $ | 183 | | $ | 141 | | $ | 148 | | $ | 118 | |
Specific risk-only component(3) | Specific risk-only component(3) | $ | (15) | | $ | (9) | | $ | (4) | | $ | (6) | | $ | 4 | | $ | (2) | |
| Total trading VAR—general market risk factors only (excluding credit portfolios) | Total trading VAR—general market risk factors only (excluding credit portfolios) | $ | 127 | | $ | 146 | | $ | 187 | | $ | 147 | | $ | 144 | | $ | 120 | |
Incremental impact of the credit portfolio(4) | Incremental impact of the credit portfolio(4) | $ | 33 | | $ | 11 | | $ | 8 | | $ | 20 | | $ | 7 | | $ | 17 | |
| Total trading and credit portfolio VAR | Total trading and credit portfolio VAR | $ | 145 | | $ | 148 | | $ | 191 | | $ | 161 | | $ | 155 | | $ | 135 | |
(1) Covariance adjustment (also known as diversification benefit) equals the difference between the total VAR and the sum of the VARs tied to each risk type. The benefit reflects the fact that the risks within individual and across risk types are not perfectly correlated and, consequently, the total VAR on a given day will be lower than the sum of the VARs relating to each risk type. The determination of the primary drivers of changes to the covariance adjustment is made by an examination of the impact of both model parameter and position changes.
(2) The total trading VAR includes mark-to-market and certain fair value option trading positions in ICG,with the exception of hedges toof the loan portfolio, fair value option loans and all CVA exposures. Available-for-sale and accrual exposures are not included.
(3) The specific risk-only component represents the level of equity and fixed income issuer-specific risk embedded in VAR.
(4) The credit portfolio is composed of mark-to-market positions associated with non-trading business units, with the CVA relating to derivative counterparties, and all associated CVA hedges and market sensitivity FVA hedges. FVA and DVA are not included. The credit portfolio also includes hedges toof the loan portfolio, fair value option loans and hedges toof the leveraged finance pipeline within capital markets origination in ICG.origination.
The table below provides the range of market factor VARs associated with Citi’s total trading VAR, inclusive of specific risk:
| | | | Second Quarter | First Quarter | Second Quarter | | First Quarter | Fourth Quarter | First Quarter |
| 2023 | 2023 | 2022 |
| 2024 | | | 2024 | 2023 |
| In millions of dollars | In millions of dollars | Low | High | Low | High | Low | High | In millions of dollars | Low | High | Low | High | Low | High |
| Interest rate | Interest rate | $ | 102 | | $ | 186 | | $ | 100 | | $ | 172 | | $ | 79 | | $ | 123 | |
| Credit spread | Credit spread | 57 | | 83 | | 67 | | 88 | | 65 | | 78 | |
| | Fully diversified interest rate and credit spread | |
| Fully diversified interest rate and credit spread | |
| Fully diversified interest rate and credit spread | Fully diversified interest rate and credit spread | $ | 116 | | $ | 211 | | $ | 123 | | $ | 197 | | $ | 105 | | $ | 147 | |
| Foreign exchange | Foreign exchange | 12 | | 24 | | 12 | | 23 | | 32 | | 40 | |
| Equity | Equity | 15 | | 32 | | 3 | | 39 | | 17 | | 40 | |
| Commodity | Commodity | 25 | | 47 | | 30 | | 45 | | 33 | | 65 | |
| | Total trading | Total trading | $ | 107 | | $ | 192 | | $ | 112 | | $ | 183 | | $ | 102 | | $ | 148 | |
| Total trading | |
| Total trading | |
| Total trading and credit portfolio | Total trading and credit portfolio | 118 | | 200 | | 125 | | 198 | | 119 | | 155 | |
Note: No covariance adjustment can be inferred from the above table as the high and low for each market factor will be from different close-of-business dates.
The following table provides the VAR for ICGMarkets, excluding the CVA relating to derivative counterparties, hedges of CVA, fair value option loans and hedges toof the loan portfolio:
| | | | | |
| In millions of dollars | June 30, 2023March 31, 2024 |
Total—all market risk factors, including
general and specific risk | |
| Average—during quarter | $ | 134154 | |
| High—during quarter | 184182 | |
| Low—during quarter | 104123 | |
Regulatory VAR Back-testingBack-Testing
In accordance with Basel III, Citi is required to perform back-testing to evaluate the effectiveness of its Regulatory VAR model. Regulatory VAR back-testing is the process in which the daily one-day VAR, at a 99% confidence interval, is compared to the buy-and-hold profit and loss (i.e., the profit and loss impact if the portfolio is held constant at the end of the day and re-priced the following day). Buy-and-hold profit and loss represents the daily mark-to-market profit and loss attributable to price movements in covered positions from the close of the previous business day. Buy-and-hold profit and loss excludes realized trading revenue, net interest, fees and commissions, intra-day trading profit and loss and changes in reserves.
Based on a 99% confidence level, Citi would expect two to three days in any one year where buy-and-hold losses exceed the Regulatory VAR. Given the conservative calibration of Citi’s VAR model (as a result of taking the greater of short- and long-term volatilities and fat-tail scaling of volatilities), Citi would expect fewer exceptions under normal and stable market conditions. Periods of unstable market conditions could increase the number of back-testing exceptions.
As of June 30, 2023,March 31, 2024, there was onewere two back-testing exceptionexceptions observed for Citi’s Regulatory VAR in the last 12 months.
OTHER RISKS
For additional information regarding other risks, including Citi’s management of other risks, see “Managing Global Risk—Other Risks” in Citi’s 2022 Form 10-K.
LIBOR Transition Risk
The USD LIBOR bank panel ended on June 30, 2023. The overnight and 12-month USD LIBOR settings have now permanently ceased, and the Financial Conduct Authority is requiring ICE Benchmark Administration to continue publishing one-, three- and six-month USD LIBOR settings using a synthetic methodology, which is based on the relevant CME Term SOFR Reference Rate plus the respective ISDA fixed spread adjustment. These synthetic settings are permanently unrepresentative of the underlying markets they previously sought to measure and are expected to cease on September 30, 2024.
As of June 30, 2023 Citi has transitioned nearly all of its USD LIBOR-referencing contracts to SOFR plus a credit spread adjustment. Remediation was accomplished through a range of methods. With respect to derivatives, most bilateral contracts were remediated through adherence to the ISDA IBOR Fallbacks Protocols or bilateral amendments, and cleared contracts were remediated through conversions completed by central counterparty clearing houses. Most loan contracts were remediated through amendments that provided for either an immediate transition to SOFR or a transition on the first interest payment date immediately following June 30, 2023. With respect to securities, contracts governed by U.S. law transitioned to SOFR by operation of law pursuant to the Adjustable Interest Rate (LIBOR) Act or pursuant to Citi’s exercise of discretion as the determining person with the authority to select a replacement rate. Securities contracts not governed by U.S. law were primarily remediated through consent solicitations or Citi’s exercise of discretion as the determining person with the authority to select a replacement rate.
As of June 30, 2023, there were a de minimis number of unremediated USD LIBOR-referencing contracts. Most of these contracts relate to non-U.S.-law-governed securities and loans that will temporarily utilize synthetic LIBOR. Citi will continue to focus on remediating its remaining unremediated contracts.
For additional information about Citi’s actions to address a transition away from and discontinuance of LIBOR, see “Managing Global Risk—Other Risks—LIBOR Transition Risk” in Citi’s First Quarter of 2023 Form 10-Q and 2022 Form 10-K. For information about Citi’s LIBOR transition risks, see “Risk Factors—Other Risks” in the 2022 Form 10-K.
Country Risk
Top 25 Country Exposures
The following table presents Citi’s top 25 exposures by country (excluding the U.S.) as of June 30, 2023.March 31, 2024. (Including the U.S., Citi’s top 25 exposures by country would represent approximately 98%99% of Citi’s exposure to all countries as of June 30, 2023.March 31, 2024.)
For purposes of the table, loan amounts are reflected in the country where the loan is booked, which is generally based on the domicile of the borrower. For example, a loan to a Chinese subsidiary of a Switzerland-based corporation will generally be categorized as a loan in China. In addition, Citi has developed regional booking centers in certain countries,
most significantly in the United Kingdom (U.K.) and Ireland, in order to more efficiently serve its corporate customers. As an example, with respect to the U.K., only 41%40% of corporate loans presented in the table below are to U.K. domiciled entities (42%(45% for unfunded commitments), with the balance of the loans predominately to European domiciled counterparties. Approximately 90% of the total U.K. funded loans and 90%87% of the total U.K. unfunded commitments were investment grade as of June 30, 2023.March 31, 2024.
Trading account assets and investment securities are generally categorized based on the domicile of the issuer of the security of the underlying reference entity. For additional information on the assets included in the table, see the footnotes to the table below.
| | In billions of dollars | In billions of dollars | ICG
loans | PBWM loans(1) | Legacy Franchises loans | Loans transferred to HFS(7) | Other funded(2) | Unfunded(3) | Net MTM on derivatives/repos(4) | Total hedges (on loans and CVA) | Investment securities(5) | Trading account assets(6) | Total as of 2Q23 | Total
as of
1Q23 | Total as of 2Q22 | Total as a % of Citi as of 2Q23 | In billions of dollars | Services, Markets and Banking
loans | Wealth loans(1) | Legacy Franchises loans | Other funded(2) | Unfunded(3) | Net MTM on derivatives/repos(4) | Total hedges (on loans and CVA) | Investment securities(5) | Trading account assets(6) | Total as of 1Q24 | Total as of 4Q23(7) | Total as of 1Q23(7) | Total as a % of Citi as of 1Q24 |
| United Kingdom | United Kingdom | $ | 33.7 | | $ | 5.1 | | $ | — | | $ | — | | $ | 1.6 | | $ | 41.5 | | $ | 13.2 | | $ | (4.6) | | $ | 2.9 | | $ | 4.2 | | $ | 97.6 | | $ | 93.9 | | $ | 95.3 | | 5.6 | % | United Kingdom | $ | 37.9 | | $ | 5.0 | | $ | — | | $ | 1.1 | | $ | 37.6 | | $ | 13.4 | | $ | (5.0) | | $ | 3.0 | | $ | 4.4 | | $ | 97.4 | | $ | 104.8 | | $ | 93.9 | | 5.5 | 5.5 | % |
| Mexico | Mexico | 9.3 | | 0.1 | | 25.9 | | — | | 0.3 | | 8.6 | | 3.3 | | (2.2) | | 21.3 | | 2.3 | | 68.9 | | 63.5 | | 57.3 | | 4.0 | |
| Ireland | Ireland | 15.5 | | — | | — | | — | | 0.1 | | 33.5 | | 0.2 | | (0.2) | | — | | 0.8 | | 49.9 | | 48.5 | | 50.4 | | 2.9 | |
| Hong Kong | Hong Kong | 8.0 | | 20.5 | | — | | — | | 0.3 | | 5.7 | | 2.1 | | (0.7) | | 10.0 | | 0.1 | | 46.0 | | 44.8 | | 49.1 | | 2.6 | |
| Singapore | Singapore | 9.1 | | 18.4 | | — | | — | | 0.5 | | 5.8 | | 1.2 | | (0.4) | | 7.5 | | 1.8 | | 43.9 | | 45.1 | | 47.6 | | 2.5 | |
| Brazil | Brazil | 12.8 | | — | | — | | — | | — | | 2.9 | | 7.4 | | (1.1) | | 8.0 | | 1.0 | | 31.0 | | 32.6 | | 28.5 | | 1.8 | |
| India | India | 7.4 | | — | | — | | — | | 0.8 | | 3.7 | | 1.8 | | (0.5) | | 8.9 | | 1.5 | | 23.6 | | 24.2 | | 27.7 | | 1.4 | |
| South Korea | South Korea | 3.8 | | — | | 6.6 | | — | | 0.1 | | 2.0 | | 1.2 | | (0.6) | | 8.7 | | 0.6 | | 22.4 | | 22.3 | | 25.5 | | 1.3 | |
| United Arab Emirates | |
| Germany | Germany | 0.4 | | — | | — | | — | | 0.1 | | 6.6 | | 6.1 | | (4.6) | | 6.3 | | 3.9 | | 18.8 | | 10.3 | | 21.9 | | 1.1 | |
| China | China | 5.5 | | — | | 0.8 | | — | | 0.6 | | 1.4 | | 1.1 | | (1.2) | | 8.9 | | 1.1 | | 18.2 | | 18.7 | | 18.8 | | 1.0 | |
| Poland | |
| Canada | Canada | 1.7 | | 1.5 | | — | | — | | 0.1 | | 7.2 | | 1.6 | | (1.5) | | 3.2 | | 2.6 | | 16.4 | | 15.1 | | 16.1 | | 0.9 | |
| United Arab Emirates | 6.3 | | 1.5 | | — | | — | | 0.3 | | 5.0 | | 0.2 | | (0.3) | | 3.1 | | 0.1 | | 16.2 | | 16.3 | | 15.9 | | 0.9 | |
| Australia | Australia | 8.8 | | 0.4 | | — | | — | | — | | 5.5 | | 0.8 | | (1.4) | | 0.3 | | 1.3 | | 15.7 | | 16.5 | | 15.2 | | 0.9 | |
| Poland | 3.0 | | — | | 1.5 | | — | | — | | 2.8 | | 1.3 | | (0.2) | | 5.5 | | 0.2 | | 14.1 | | 15.3 | | 13.3 | | 0.8 | |
| Taiwan | 3.8 | | — | | — | | 7.7 | | 0.1 | | 1.4 | | 0.4 | | (0.1) | | 0.3 | | 0.4 | | 14.0 | | 14.1 | | 14.9 | | 0.8 | |
| Japan | Japan | 1.5 | | — | | — | | — | | — | | 3.7 | | 5.3 | | (2.5) | | 4.3 | | 0.9 | | 13.2 | | 15.9 | | 12.1 | | 0.8 | |
| Jersey | Jersey | 2.2 | | 2.8 | | — | | — | | — | | 6.5 | | 0.1 | | (0.1) | | — | | — | | 11.5 | | 15.4 | | 16.8 | | 0.7 | |
| Malaysia | |
| Luxembourg | |
| Indonesia | Indonesia | 2.2 | | — | | — | | 0.6 | | — | | 1.1 | | 1.4 | | (0.1) | | 1.0 | | 0.2 | | 6.4 | | 6.3 | | 5.5 | | 0.4 | |
| Italy | 0.5 | | — | | — | | — | | — | | 2.1 | | 1.0 | | (1.8) | | — | | 3.4 | | 5.2 | | 4.3 | | 2.7 | | 0.3 | |
| Taiwan | |
| Czech Republic | |
| | Thailand | |
| Thailand | |
| Thailand | |
| South Africa | |
| | Philippines | Philippines | 0.6 | | — | | — | | — | | 0.1 | | 0.2 | | 2.3 | | (0.1) | | 2.0 | | 0.1 | | 5.2 | | 4.9 | | 5.3 | | 0.3 | |
| Luxembourg | 0.1 | | 1.1 | | — | | — | | — | | — | | 0.5 | | (0.2) | | 3.7 | | — | | 5.2 | | 4.4 | | 4.2 | | 0.3 | |
| Czech Republic | 0.8 | | — | | — | | — | | — | | 0.8 | | 2.9 | | — | | 0.6 | | 0.1 | | 5.2 | | 3.8 | | 3.6 | | 0.3 | |
| Malaysia | 1.2 | | — | | — | | — | | 0.1 | | 0.7 | | 0.2 | | (0.1) | | 2.7 | | 0.1 | | 4.9 | | 4.9 | | 8.1 | | 0.3 | |
| Spain | 0.4 | | — | | — | | — | | — | | 2.8 | | 0.2 | | (1.3) | | — | | 2.5 | | 4.6 | | 3.3 | | 3.0 | | 0.3 | |
| South Africa | 1.5 | | — | | — | | — | | — | | 0.7 | | — | | (0.2) | | 2.3 | | 0.2 | | 4.5 | | 4.6 | | 3.4 | | 0.3 | |
| Philippines | |
| Philippines | |
| Chile | |
| Total as a % of Citi’s total exposure | Total as a % of Citi’s total exposure | | 32.5 | % | Total as a % of Citi’s total exposure | | | | | | | 31.5 | % |
| Total as a % of Citi’s non-U.S. total exposure | Total as a % of Citi’s non-U.S. total exposure | | 90.5 | % | Total as a % of Citi’s non-U.S. total exposure | | | | | | | 92.2 | % |
(1)PBWM Wealth loans reflect funded loans, including those related to the Private bank,Bank, net of unearned income. As of June 30, 2023,March 31, 2024, Private bankBank loans in the table above totaled $20.2$19.3 billion, concentrated in Singapore ($5.35.0 billion), the U.K. ($5.15.0 billion) and Hong Kong ($4.54.4 billion).
(2) Other funded includes other direct exposures such as accounts receivable and investments accounted for under the equity method.
(3) Unfunded exposure includes unfunded corporate lending commitments, letters of credit and other contingencies.
(4) Net mark-to-market (MTM) counterparty risk on OTC derivatives and securities lending/borrowing transactions (repos). Exposures are shown net of collateral and inclusive of CVA. Also includes margin loans.
(5) Investment securities include debt securities AFS, recorded at fair market value, and debt securities HTM, recorded at amortized cost.
(6) Trading account assets are shown on a net basis and include issuer risk on cash products and derivative exposure where the underlying reference entity/issuer is located in that country.
(7) June 30,December 31, 2023 and March 31, 2023 include $0.3 billion and June 30, 2022 include$10.3 billion, respectively, of All Other—Legacy Franchises loans reclassified to HFS as a result of Citi’s agreement to sell its consumer banking business in each applicable country. For additional information, seeSee “All Other—Legacy Franchises”Franchises” above and Note 2.
Russia
IntroductionOverview
In Russia, Citi’s remaining wind-down operations are conducted through both its ICG Services, Markets, Bankingand All Other—Legacy Franchises segments.Franchises. Citi continues to monitor the war in Ukraine, related sanctions and economic conditions and continues to mitigate its Russia exposures and risks as appropriate.
As part of previously disclosed as of March 31, 2023,plans, Citi ended nearly all of the institutional banking services it offered in Russia, with the remaining services only those necessary to fulfill its remaining legal and regulatory obligations. In addition, Legacy FranchisesCiti significantly reduced its All Other—Legacy Franchises consumer loan portfoliosportfolio in Russia by approximately 75%(reported as part of Asia Consumer), primarily driven bylargely due to loan portfolio sales and the signing ofits entry into a credit card referral agreement. agreement with a Russian bank.
Citi has ceased soliciting any new business or new clients in Russia. Citi will continue to manage its existing legal and regulatory commitments and obligations, as well as continue to support its employees, during this period. For additional information, see “Citi’s Wind-Down of Its Russia Operations” below.
Citi continues to monitor the war in Ukraine, related sanctions and economic conditions and continues to mitigate its Russia exposures and risks as appropriate.
For additional information about Citi’s risks related to its Russia exposures, see “Forward-Looking Statements” below and “Risk Factors—Market-Related Risk,Risks,” “—Operational Risks” and “—Other Risks” in Citi’s 20222023 Form 10-K.
Impact of Russia’s Invasion of Ukraine on Citi’s Businesses
Russia-related Balance Sheet Exposures
Citi’s remaining domestic operations in Russia are conducted through a subsidiary of Citibank, AO Citibank, which uses the Russian ruble as its functional currency.
The following table summarizes Citi’s exposures related to its Russia operations:
| | In billions of U.S. dollars | In billions of U.S. dollars | June 30, 2023 | March 31, 2023 | June 30, 2022 | Change 2Q23 vs. 1Q23 | In billions of U.S. dollars | March 31, 2024 | December 31, 2023 | March 31, 2023 | Change 1Q24 vs. 4Q23 |
| Loans | Loans | $ | 0.3 | | $ | 0.4 | | $ | 2.5 | | $ | (0.1) | |
Investment securities(1) | Investment securities(1) | 0.6 | | 1.0 | | 1.5 | | (0.4) | |
Net MTM on derivatives/repos(2) | 2.0 | | 1.0 | | 1.3 | | 1.0 | |
| Net MTM on derivatives/repos | |
| Total hedges (on loans and CVA) | Total hedges (on loans and CVA) | (0.1) | | (0.1) | | (0.2) | | — | |
Unfunded(3) | — | | 0.1 | | 0.3 | | (0.1) | |
Unfunded(2) | |
| Trading accounts assets | Trading accounts assets | — | | — | | 0.1 | | — | |
| Country risk exposure | Country risk exposure | $ | 2.8 | | $ | 2.4 | | $ | 5.5 | | $ | 0.4 | |
Cash on deposit and placements(4) | 0.9 | | 0.9 | | 2.5 | | — | |
Deposit Insurance Agency(5) | 2.8 | | — | | — | | 2.8 | |
National Settlements Depository(5) | — | | 2.7 | | — | | (2.7) | |
Total third-party exposure(6) | $ | 6.5 | | $ | 6.0 | | $ | 8.0 | | $ | 0.5 | |
Cash on deposit and placements(3) | |
Deposit Insurance Agency(4) | |
National Settlements Depository(4) | |
Total third-party exposure(5) | |
Additional exposures to Russian counterparties that are not held by the Russian subsidiary | Additional exposures to Russian counterparties that are not held by the Russian subsidiary | 0.1 | | 0.1 | | 0.4 | | — | |
Total Russia exposure(7) | $ | 6.6 | | $ | 6.1 | | $ | 8.4 | | $ | 0.5 | |
Total Russia exposure(6) | |
(1) Investment securities include debt securities AFS, recorded at fair market value, primarily local government debt securities.
(2) Reverse repurchase agreements are shown gross of collateral and are included in net MTM on derivatives/repos in the table above, as netting of collateral for Russia-related reverse repurchase agreements was removed in the second quarter of 2022. This removal was due to the inability to conclude, with a well-founded basis, the enforceability of contractual rights in the Russian legal system in the event of a counterparty default, given the geopolitical uncertainty caused by the war in Ukraine.
(3) Unfunded exposure consists of unfunded corporate lending commitments, letters of credit and other contingencies.
(4)(3) Cash on deposit and placements are primarily with the Central Bank of Russia.Russia and foreign financial institutions.
(5)(4) Represents dividends received by Citi in its role as custodian for investor clients in Russia, which Citi is required by local regulation to hold at the Deposit Insurance Agency (DIA). Citi is unable to remit these funds to clients due to restrictions imposed by the Russian government. In accordance with a Central Bank of Russia regulatory requirement, all balances in the National Settlements Depository were transferred to the DIA. Citi is unable to remit these funds to clients due to restrictions imposed byDIA in the Russian government.second quarter of 2023.
(6)(5) The majority of AO Citibank’s third-party exposures was funded with the dividends under footnote 54 and domestic deposit liabilities from both corporate and personal banking clients.
(7)(6) Citigroup’s CTA loss included in its AOCI related to its indirect subsidiary, AO Citibank, is excluded from the above table, because the CTA loss is not held in AO Citibank and would be recognized in Citigroup’s earnings only upon either the substantial liquidation or a loss of control of AO Citibank. Citi has separately described these risks in “Deconsolidation Risk” below.
During the secondfirst quarter of 2023,2024, Citi’s Russia-related exposures increased by $0.5$0.4 billion, as shownpresented in the table above. The increase in exposure was driven by $1.7inflows from dividends received from Russian corporations on behalf of Citi’s clients. Approximately 73% of Citi’s $7.0 billion of total Russia exposure are corporate dividends that Citi received as custodian for investorcannot remit to its clients in Russia and is unable to remit due to restrictions imposed by the Russian regulatory restrictions (trapped dividends), partially offset by deposit outflowsgovernment, of which $4.6 billion is held with the Deposit Insurance Agency as well as a $0.6 billion depreciation of the ruble against the U.S. dollar. A portion ($1 billion, net of ruble depreciation) of these dividends were placed in reverse repurchase agreements. Roughly 65% of Citi’s remaining Russia exposures are the trapped dividends discussed above.March 31, 2024.
Citi’s continued risk mitigation efforts have included ICG borrower paydowns and limiting extensions of new credit.
Citi’s net investment in Russia was approximately $1.1$0.2 billion as of June 30, 2023 (compared to $1.2 billion at March 31, 2024 (unchanged from December 31, 2023).
Citi hedges its ruble/USD spot FX exposure in AOCI through the purchase of FX derivatives. The ongoing mark-to-market of the hedging derivatives is also reported in AOCI. When the ruble depreciates against the USD, the USD equivalent value of Citigroup’s investment in AO Citibank also declines. This change in value is offset by the change in value of the hedging instrument (FX derivative). Going forward, Citi may record devaluations on its net ruble-denominated assets in earnings, without the benefit from a change in the fair value of derivative positions used to economically hedge the exposures.
Earnings and Other Impacts on Citi’s Businesses
Citi’s ICGServices, PBWMMarkets, Banking, USPB and Legacy FranchisesAll Other segments and Corporate/Otherresults have been impacted by various macroeconomic factors and volatilities, including Russia’s invasion of Ukraine and its direct and indirect impact on the European and global economies. For a broader discussion of these factors and volatilities on Citi’s businesses, see “Executive Summary” and each business’s results of operations above.
As of June 30, 2023,March 31, 2024, Citigroup’s ACL included a $0.2$0.1 billion remaining credit reserve for Citi’s direct and indirect Russian counterparties (unchanged(largely unchanged from MarchDecember 31, 2023). This balance does not include the additional reserves for transfer risk for exposures in Russia.
Citi’s Wind-Down of Its Russia Operations
DuringIn August 2022, Citi disclosed its decision to wind down its Russia consumer, local commercial and institutional banking businesses, including actively pursuing portfolio sales. In connection with this wind-down, Citi currently expects to incurhas incurred approximately $180$65 million (compared to $210 million at March 31, 2023)to-date in total estimated charges, ($40 million in ICG and $140 million in Legacy Franchises, excluding the impactlargely from any portfolio sales), largely driven by restructuring, vendor termination fees and other related charges. Citi’s previously disclosed referral agreement with a Russian bankCiti expects to settle aincur an additional approximate $54 million in estimated charges (approximately $1 million in Banking and $53 million in All Other,excluding the impact from any portfolio sales). This estimate was revised down during the first quarter of ruble-denominated credit card loans, subject to customer consent, was signed in May 2023 and is in the execution phase. The outstanding amount with Citi is to be settled upon referral and refinancing. As a result, the credit card loans will remain held-for-investment and are not transferred to held-for-sale.2024 from $58 million at December 31, 2023. For additional information about Citi’s continued efforts to reduce its operations and exposure in Russia, see Note 2 and “Risk
Factors” and “Managing Global Risk—Other Risks—Country Risk—Russia” in Citi’s 20222023 Form 10-K.
Deconsolidation Risk
Citi’s remaining operations in Russia subject it to various risks, including, among others, foreign currency volatility, including appreciation or devaluation; restrictions arising from retaliatory Russian laws and regulations on the conduct of its business; sanctions or asset freezes; or other deconsolidation events (for additional information, see(see “Risk Factors—Other Risks” in Citi’s 20222023 Form 10-K). Examples of triggers that may result in deconsolidation of AO Citibank include voluntary or forced sale of ownership or loss of control due to actions of relevant governmental authorities, including expropriation (i.e., the entity becomes subject to the complete control of a government, court, administrator, trustee or regulator); revocation of banking license; and loss of ability to elect a board of directors or appoint members of senior management. As of June 30, 2023,March 31, 2024, Citi continued to consolidate AO Citibank because none of the deconsolidation factors were triggered.
In the event Citi deems there is a loss of control, for example, through expropriation of AO Citibank, Russia, Citi’s foreign entity in Russia, Citi would be required to (i) write off the net investment of approximately $1.1$0.2 billion (compared to $1.2 billion as of March(unchanged from December 31, 2023), (ii) recognize a CTA loss of approximately $1.6 billion (compared to $1.4 billion as of March(unchanged from December 31, 2023) through earnings and (iii) recognize a loss of $0.4$0.6 billion (unchanged from MarchDecember 31, 2023) on intercompany liabilities owed by AO Citibank to other Citi entities outside Russia. In the sole event of a substantial liquidation, as opposed to a loss of control, Citi would be required to recognize the CTA loss of approximately $1.6 billion through earnings and would evaluate its remaining net investment as circumstances evolve.
Citi as Paying Agent for Russian-relatedRussia-related Clients
Citi serves or served as paying agent on bonds issued by various entities in Russia, including Russian corporate clients. Citi’s role as paying agent is administrative. In this role, Citi acts as an agent of its client, the bond issuer, receiving interest and principal payments from the bond issuer and then making payments to international central securities depositories (e.g., Depository Trust Company, Euroclear, Clearstream). The international central securities depositories (ICSDs) make payments to those participants or account holders (e.g., broker/dealers) that have clients who are investors in the applicable bonds (i.e., bondholders). As a paying agent, Citi generally does not have information about the identity of the bondholders. As a result of sanctions or other governmental requirements and prohibitions, Citi may be exposed to risks due to its responsibilities for receiving and processing payments on behalf of its clients.clients as a result of sanctions or other governmental requirements and prohibitions. To mitigate operational and sanctions risks, Citi has established policies, procedures and controls for client relationships and payment processing to help ensure compliance with U.S., U.K., EU and other jurisdictions’ sanctions laws.
These processes may require Citi to delay or withhold the processing of payments as a result of sanctions on the bond issuer. Citi is also prevented from making payments to
accounts on behalf of bondholders should the ICSDs disclose to Citi the presence of sanctioned bondholders. In both instances, Citi is generally required to segregate, restrict or
block the funds until applicable sanctions are lifted or the payment is otherwise authorized under applicable law.
Reputational Risks
Citi has continued its efforts to enhance and protect its reputation with its colleagues, clients, customers, investors, regulators and the public. Citi’s response to the war in Ukraine, including any action or inaction, may have a negative impact on Citi’s reputation with some or all of these parties.
For example, Citi is exposed to reputational risk as a result of its currentremaining presence in Russia and association with Russian individuals or entities, whether subject to sanctions or not, including Citi’s inability to support its global clients in Russia, which could adversely affect its broader client relationships and businesses; current involvement in transactions or supporting activities involving Russian assets or interests; failure to correctly interpret and apply laws and regulations, including those related to sanctions; perceived misalignment of Citi’s actions to its stated strategy in Russia; and the reputational impact from Citi’s activity and engagement with Ukraine or with non-Russian clients exiting their Russia businesses. Citi has considered the potential for reputation risk and taken actions to mitigate such risks. Citi established a Russia Special Review Process with management’s Reputation Risk Committee with oversight for significant Russia-related reputation risks and completed a number of reputation risk reviews of matters with a Russian nexus.
While Citi announced its intention to wind down its businesses in Russia, Citi will continue to manage those operations during the wind-down process and will be required to maintain certain limited operations to fulfill its remaining legal and regulatory obligations. Also, sanctions and sanctions compliance are highly complex and may change over time and result in increased operational risk. Failure to fully comply with relevant sanctions or the application of sanctions where they should not be applied may negatively impact Citi’s reputation. In addition, Citi currently performs services for, conducts business with or deals in non-sanctioned Russian-owned businesses and Russian assets. This has attracted, and will likely continue to attract, negative attention, despite the previously disclosed plan to wind down nearly all its activities in the country, cessation of new business and client originations, and reduction of other exposures.
Citi’s continued presence or divestiture of businesses in Russia could also increase its susceptibility to cyberattacks that could negatively impact its relationships with clients and customers, harm its reputation, increase its compliance costs and adversely affect its business operations and results of operations. For additional information on operational and cyber risks, see “Risk Factors—Operational Risk”Risks” in Citi’s 20222023 Form 10-K.
Board’s Role in Overseeing Related Risks
The Citi Board of Directors (Board) and the Board’s Risk Management Committee (RMC) and its other Committees have received and continue to receive regular reports from senior management regarding the war in Ukraine and its
impact on Citi’s operations in Russia, Ukraine and elsewhere, as well as the war’s broader geopolitical, macroeconomic and reputational impacts.In addition to receiving regular briefings from management, the full Board has routinely been invited to attend portions of the RMC meetings for discussions related to the war in Ukraine, including with respect to Citi’s risk exposures and stress testing. The reports to the Board and its Committees from senior management who represent the impacted businesses and the EMEA region,international cluster, Independent Risk Management, Finance, Independent Compliance Risk Management, including those individuals responsible for sanctions compliance, and Human Resources, have included detailed information regarding financial impacts, impacts on capital, cybersecurity, strategic considerations, sanctions compliance, employee assistance and reputational risks, enabling the Board and its Committees to properly exercise their oversight responsibilities. In addition, senior management has also provided updates to Citi’s Executive Management Team and the Board, outside of formal meetings, regarding Citi’s Russia-related risks, including with respect to cybersecurity matters.
Ukraine
Citi has continued to operate in Ukraine throughout the war through its ICGServices, Markets and Banking businesses, serving the local subsidiaries of multinationals, along with local financial institutions and the public sector. Citi employs approximately 230220 people in Ukraine and their safety continues to beis Citi’s top priority. All of Citi’s domestic operations in Ukraine are conducted through a subsidiary of Citibank, which uses the Ukrainian hryvnia as its functional currency. Citi’s exposures in Ukraine are not significant enough to be included in the “Top 25 Country Exposures” table above. As of June 30, 2023,March 31, 2024, Citi had $1.3$1.4 billion of direct exposures related to Ukraine compared(compared to $1.2$1.5 billion as of Marchat December 31, 2023. The increase in exposures reflected a $0.1 billion increase in deposits.2023).
Argentina
Citi operates in Argentina through its ICGServices, Markets and Banking businesses. As of June 30, 2023,March 31, 2024, Citi’s net investment in its Argentine operations was approximately $1.9$1.6 billion (compared to $1.8$1.0 billion at MarchDecember 31, 2023). Under U.S. GAAP, Citi uses the U.S. dollar (USD) as the functional currency for its operations in countries such as Argentina that are deemed highly inflationary.inflationary in accordance with GAAP. Citi therefore records the impact of exchange rate fluctuations on its net Argentine peso (ARS)–denominated assets directly in earnings. Citi uses Argentina’s official market exchange rate to remeasure its net ARS-denominated assets into USD. As of March 31, 2024, the official ARS exchange rate was 858.00, which devalued by 6% against the USD during the first quarter of 2024.
The increase in Citi’s net investment in Argentina during the quarter was primarily due to earnings associated with increased client activity, Citi’s normal onshore operations and interest income earned on the net investment, of which a significant portion is invested at high local overnight rates in Argentina. All of these effects significantly exceeded translation losses (net of hedges) of $55 million recognized during the quarter.
The Central Bank of Argentina maintains certain capital and currency controls that generally restrict Citi’s ability to access USD in Argentina and remit earnings from its Argentine operations. To the extent that such controls remain in place, Citi’s net investment in Argentina will, as a result, continue to be exposed to additional foreign currency translation losses if it is denominated in ARS and is unable to be remitted or exchanged. Furthermore, the capital and currency controls have resulted in indirect foreign exchange mechanisms that some Argentine entities may use to obtain USD, generally at rates that are significantly higher than Argentina’s official exchange rate. Citibank Argentina is generally precluded from accessing these alternative mechanisms, and under U.S. GAAP, these exchange mechanisms cannot be used to re-measure Citi’s net monetary assets into USD. If Argentina’s official exchange rate further converges with the approximate rate implied by the indirect foreign exchange mechanisms, Citi could incur additional translation losses on its net investment in Argentina. Accordingly, Citi seeks to reduce its overall ARS exposure in Argentina while complying with local capital and currency exposure limitations. As
Of the $1.6 billion net investment in Argentina as of June 30, 2023,March 31, 2024, Citi’s net ARS exposure was approximately $1.6 billion, which decreased from$0.9 billion. The net ARS exposure was reduced as of the priorend of the quarter as a result of Citi purchasingholding approximately $300$100 million of USD-denominated loans as well as approximately $600 million of certain local government bonds during the second quarter that are indexed to the higher of the U.S. dollarUSD exchange rate or the local inflation index. Such bonds may reduce the impact toIf Citi of a potential currency devaluationhad not invested in the future, although it remains unclear how effective Citi’s strategiessuch instruments to reduce its ARS exposure, may be.
As previously disclosed,Citi would have recognized additional translation losses during the Central Bankfirst quarter of Argentina has continued to maintain certain2024. Given current economic conditions and the local capital, currency and currency controls that generally restrict Citi’s ability to access U.S. dollars in Argentina and remit earnings from its Argentine operations. As a result, Citi’s net investment in its Argentine operations is likely to continue to increase as Citi generates net income in its Argentine franchise and its earnings cannot be remitted. Due to the currency controls implemented by the Central Bank of Argentina, certain indirect foreign exchange mechanisms have developed that some Argentine entities may use to obtain U.S. dollars, generally at rates that are significantly higher than Argentina’s official exchange rate. Citibank Argentina is precluded from accessing these alternative mechanisms, and these exchange mechanisms cannot be used to remeasure Citi’s net monetary assets into the U.S. dollar under U.S. GAAP. Citibank Argentina therefore uses Argentina’s official market exchange rate to remeasure its net ARS assets into the U.S. dollar, which was 256.7 ARS to 1 U.S. dollar as of June 30, 2023. However, if Argentina’s official exchange rate converges with the approximate rate implied by the indirect foreign exchange mechanisms, Citi could incur a significant loss on its capital in Argentina. Current macroeconomic conditions in the country, along with sustained high inflation and low international reserves held by the Central Bank of Argentina, may result in an accelerated or steep depreciation of the official exchange rate in the near term.regulatory limitations, Citi cannot predict future fluctuations in Argentina’s official market exchange rateguarantee the availability or effectiveness of such mechanisms to what extent Citi may be able to access U.S. dollars at the official exchange ratereduce its ARS exposure in the future.
In addition to reducing the ARS exposure, Citi mayalso seeks to economically hedge the foreign currency risk in its net ARS-denominated assetsexposure to the extent possible and prudent using non-deliverable forward (NDF) derivative instruments that are primarily executed outside of Argentina. As of June 30, 2023,March 31, 2024, Citi was unable to hedge a substantial portion of the internationalremaining ARS exposure, given that the
offshore NDF market had very limited liquidity, resulting in Citi’s inability to economically hedge substantially all of its ARS exposure.remained illiquid. Accordingly, and to the extent that Citi does not execute additional NDF contracts for this unhedged exposure in the future, Citi would record devaluations on its net ARS-denominated assets in earnings, without any benefit from a change in the fair value of derivative positions used to economically hedge the exposure. Citi cannot predict the availability of hedging instruments in the future nor can it predict changes in foreign exchange rates and the resulting impact on earnings.
Citi continually evaluates its economic exposure to its Argentine counterparties and reserves for changes in credit risk and records mark-to-market adjustments for relevant market risks associated with its Argentine assets. Citi believes it has established an appropriate ACL on its Argentine loans, and appropriate fair value adjustments on Argentine assets and liabilities measured at fair value, for credit and sovereign risks under U.S. GAAP as of June 30, 2023. However, Citi may need to record additional reserves in the future, resulting in higher ICG cost of credit, should there be an increase in transfer risk associated with its Argentine exposures.March 31, 2024. For additional information on Citi’s emerging markets risks, including those related to its Argentine exposures, see “Risk Factors—Strategic Risks” in Citi’s 20222023 Form 10-K.
SIGNIFICANT ACCOUNTING POLICIES AND SIGNIFICANT ESTIMATES
This section contains a summary of Citi’s most significant accounting policies. Note 1 to the Consolidated Financial Statements in Citi’s 20222023 Form 10-K contains a summary of all of Citigroup’s significant accounting policies. These policies, as well as estimates made by management, are integral to the presentation of Citi’s results of operations and financial condition. While all of these policies require a certain level of management judgment and estimates, this section highlights and discusses the significant accounting policies that require management to make highly difficult, complex or subjective judgments and estimates at times regarding matters that are inherently uncertain and susceptible to change (see also “Risk Factors—Operational Risks” in Citi’s 20222023 Form 10-K). Management has discussed each of these significant accounting policies, the related estimates and its judgments with the Audit Committee of the Citigroup Board of Directors.
Valuations of Financial Instruments
Citigroup holds debt and equity securities, derivatives, retained interests in securitizations, investments in private equity and other financial instruments. A substantial portion of these assets and liabilities is reflected at fair value on Citi’s Consolidated Balance Sheet as Trading account assets, Available-for-sale securities and Trading account liabilities.
Citi purchases securities under agreements to resell (reverse repos or resale agreements) and sells securities under agreements to repurchase (repos), a substantial portion of which is carried at fair value. In addition, certain loans, short-term borrowings, long-term debt and deposits, as well as certain securities borrowed and loaned positions that are collateralized with cash, are carried at fair value. Citigroup holds its investments, trading assets and liabilities, and resale and repurchase agreements on Citi’s Consolidated Balance Sheet to meet customer needs and to manage liquidity needs, interest rate risks and private equity investing.
When available, Citi generally uses quoted market prices to determine fair value and classifies such items within Level 1 of the fair value hierarchy established under ASC 820-10, Fair Value Measurement. If quoted market prices are not available, fair value is based on internally developed valuation models that use, where possible, current market-based or independently sourced market parameters, such as interest rates, currency rates and option volatilities. Such models are often based on a discounted cash flow analysis. In addition, items valued using such internally generated valuation techniques are classified according to the lowest level input or value driver that is significant to the valuation. Thus, an item may be classified under the fair value hierarchy as Level 3 even though there may be some significant inputs that are readily observable.
Citi is required to exercise subjective judgments relating to the applicability and functionality of internal valuation models, the significance of inputs or value drivers to the valuation of an instrument and the degree of illiquidity and subsequent lack of observability in certain markets. The fair value of these instruments is reported on Citi’s Consolidated Balance Sheet with the changes in fair value recognized in either the Consolidated Statement of Income or in AOCI.
Losses on available-for-sale securities whose fair values are less than the amortized cost, where Citi intends to sell the security or could more-likely-than-not be required to sell the security prior to recovery, are recognized in earnings. Where Citi does not intend to sell the security nor could more-likely-than-not be required to sell the security, any portion of the loss that is attributable to credit is recognized as an allowance for credit losses with a corresponding provision for credit losses, and the remainder of the loss is recognized in AOCI. Such losses are capped at the difference between the fair value and amortized cost of the security.
For equity securities carried at cost or under the measurement alternative, decreases in fair value below the carrying value are recognized as impairment in the Consolidated Statement of Income. Moreover, for certain equity method investments, decreases in fair value are only recognized in earnings in the Consolidated Statement of Income if such decreases are judged to be an other-than-temporary impairment (OTTI). Assessing if the fair value impairment is temporary is also inherently judgmental.
The fair value of financial instruments incorporates the effects of Citi’s own credit risk and the market view of counterparty credit risk, the quantification of which is also complex and judgmental. For additional information on Citi’s fair value analysis, see Notes 6, 2223 and 2324 in this Form 10-Q and Note 1 to the Consolidated Financial Statements in Citi’s 20222023 Form 10-K.
Citi’s Allowance for Credit Losses (ACL)
The table below presents Citi’s allowance for credit losses on loans (ACLL) and total ACL as of the secondfirst quarter of 2023.2024. For information on the drivers of Citi’s ACL build in the secondfirst quarter of 2023,2024, see “2Q23 Changes in the ACL” below. For additional information on Citi’s accounting policy on accounting for credit losses under ASC Topic 326, Financial Instruments—Credit losses;Losses; Current Expected Credit Losses (CECL), see Note 1 to the Consolidated Financial Statements in Citi’s 20222023 Form 10-K.
| | ACL |
| ACL | |
| ACL | |
| ACL | |
| In millions of dollars | In millions of dollars | Balance Dec. 31, 2022 | 1Q23
build
(release) | 1Q23 FX/ Other(1)(4) | Balance Mar. 31, 2023 | 2Q23
build
(release) | 2Q23
FX/
Other | Balance Jun. 30, 2023 | | ACLL/EOP loans Jun. 30, 2023(2) | In millions of dollars | Balance Dec. 31, 2023 | 1Q24
build
(release) | 1Q24
FX/
Other | Balance Mar. 31, 2024 | | | | | | | ACLL/EOP loans Mar. 31, 2024(1) |
| ICG | $ | 2,715 | | $ | (75) | | $ | 3 | | $ | 2,643 | | $ | (150) | | $ | (3) | | $ | 2,490 | | | |
Legacy Franchises corporate (Mexico SBMM) | 140 | | (10) | | 7 | | 137 | | (2) | | 5 | | 140 | | | |
| Services | |
| Markets | |
| Markets | |
| Markets | |
| Banking | |
| Banking | |
| Banking | |
Legacy Franchises corporate (Mexico SBMM)(1) | |
Legacy Franchises corporate (Mexico SBMM)(1) | |
Legacy Franchises corporate (Mexico SBMM)(1) | |
| Total corporate ACLL | Total corporate ACLL | $ | 2,855 | | $ | (85) | | $ | 10 | | $ | 2,780 | | $ | (152) | | $ | 2 | | $ | 2,630 | | | 0.94 | % |
U.S. Cards(2) | $ | 11,393 | | $ | 536 | | $ | (173) | | $ | 11,756 | | $ | 276 | | $ | (1) | | $ | 12,031 | | | 7.86 | % |
| Retail banking and Global Wealth | 1,330 | | (29) | | (60) | | 1,241 | | 57 | | 1 | | 1,299 | | | |
Total PBWM | $ | 12,723 | | $ | 507 | | $ | (233) | | $ | 12,997 | | $ | 333 | | $ | — | | $ | 13,330 | | | |
Legacy Franchises consumer | 1,396 | | 13 | | (17) | | 1,392 | | 76 | | 68 | | 1,536 | | | |
| Total corporate ACLL | |
| Total corporate ACLL | | $ | 2,714 | | $ | 57 | | $ | 1 | | $ | 2,772 | | | | | | | | 0.97 | % |
U.S. cards(2) | | U.S. cards(2) | $ | 12,626 | | $ | 326 | | $ | (1) | | $ | 12,951 | | | | | | | | 8.16 | % |
| Retail Banking | |
Total USPB | |
Total USPB | |
Total USPB | |
| Wealth | |
| Wealth | |
| Wealth | |
All Other consumer—managed basis(1) | |
All Other consumer—managed basis(1) | |
All Other consumer—managed basis(1) | |
Reconciling Items(1) | |
Reconciling Items(1) | |
Reconciling Items(1) | |
| Total consumer ACLL | |
| Total consumer ACLL | |
| Total consumer ACLL | Total consumer ACLL | $ | 14,119 | | $ | 520 | | $ | (250) | | $ | 14,389 | | $ | 409 | | $ | 68 | | $ | 14,866 | | | 3.97 | % | $ | 15,431 | | $ | 62 | | $ | 31 | | $ | 15,524 | | | | | | | | 4.07 | | | | | | | 4.07 | % |
| Total ACLL | Total ACLL | $ | 16,974 | | $ | 435 | | $ | (240) | | $ | 17,169 | | $ | 257 | | $ | 70 | | $ | 17,496 | | | 2.67 | % | Total ACLL | $ | 18,145 | | $ | 119 | | $ | 32 | | $ | 18,296 | | | | | | | | 2.75 | | | | | | | 2.75 | % |
| Allowance for credit losses on unfunded lending commitments (ACLUC) | Allowance for credit losses on unfunded lending commitments (ACLUC) | $ | 2,151 | | $ | (194) | | $ | 2 | | $ | 1,959 | | $ | (96) | | $ | (1) | | $ | 1,862 | | | |
| Total ACLL and ACLUC (EOP) | |
| Total ACLL and ACLUC (EOP) | |
| Total ACLL and ACLUC (EOP) | |
Other(3) | |
Other(3) | |
Other(3) | Other(3) | 243 | | 408 | | (19) | | 632 | | 145 | | (19) | | 758 | | | |
| Total ACL | Total ACL | $ | 19,368 | | $ | 649 | | $ | (257) | | $ | 19,760 | | $ | 306 | | $ | 50 | | $ | 20,116 | | | |
| Total ACL | |
| Total ACL | |
(1) Includes reclassifications to All Other assets (managed basis) excludes divestiture-related impacts (Reconciling Items) related to (i) Citi’s agreements to sell certaindivestitures of its Asia Consumer businesses and (ii) the planned IPO of Mexico consumer banking businesses.and small business and middle-market banking within Legacy Franchises. The Reconciling Items are fully reflected in the various line items in Citi’s Consolidated Statement of Income. These items in the table above represent the 2024 quarterly ACL builds (releases) only. See Notes 2 and 14.“All Other—Divestiture-Related Impacts (Reconciling Items)” above.
(2) As of June 30, 2023,March 31, 2024, in U.S. Personal Banking,USPB, Branded cardsCards ACLL/EOP loans was 6.3%6.4% and Retail servicesServices ACLL/EOP loans was 11.2%11.9%.
(3) Includes ACL on Other assetsand Held-to-maturity debt securities. The ACL on
(4) Includes a decrease of $352 million from the adoption of ASU 2022-02Other assets includes ACL related to transfer risk associated with exposures outside the recognitionU.S. for safety and measurement of TDRssoundness considerations under the modified retrospective approach related to PBWM and Legacy Franchises consumer loans as of January 1, 2023. See Notes 1 and 14.U.S. banking law.
Citi’s reserves for expected credit losses on funded loans and for unfunded lending commitments, standby letters of credit and financial guarantees are reflected on the Consolidated Balance Sheet in the Allowance for credit losses on loans (ACLL) and Other liabilities (for Allowance for credit losses on unfunded lending commitments (ACLUC)), respectively. In addition, Citi’s reserves for expected credit losses on other financial assets carried at amortized cost, including held-to-maturity securities, reverse repurchase agreements, securities borrowed, deposits with banks and other financial receivables are reflected in Other assets. These reserves, together with the ACLL and ACLUC, are referred to as the ACL. Changes in the ACL are reflected as Provision for credit losses in the Consolidated Statement of Income for each reporting period. Citi’s ability to estimate expected credit losses over the reasonable and supportable (R&S) period is based on the ability to forecast economic activity over ana R&S
timeframe. The R&S forecast period for consumer and corporate credit exposuresloans is eight quarters.
The ACL is composed of quantitative and qualitative management adjustment components. The quantitative component uses three forward-looking macroeconomic forecast scenarios—base, upside and downside. The
qualitative management adjustment component reflects risks and currentcertain economic conditions not fully captured in the quantitative component. Both the quantitative and qualitative components are further discussed below.
Quantitative Component
Citi estimates expected credit losses for its quantitative component using (i) its comprehensive internal data on loss and default history, (ii) internal credit risk ratings, (iii) external credit bureau and rating agencies information and (iv) R&S forecasts of macroeconomic conditions.
For its consumer and corporate portfolios, Citi’s expected credit losses are determined primarily by utilizing models that consider the borrowers’ probability of default (PD), loss given default (LGD) and exposure at default (EAD). The loss likelihood and severity models used for estimating expected credit losses are sensitive to changes in macroeconomic variables, including housing prices, unemployment rate and real GDP, and cover a wide range of geographic, industry, product and business segments.
In addition, Citi’s models determine expected credit losses based on leading credit indicators, including loan delinquencies, changes in portfolio size, default frequency,
risk ratings and loss recovery rates, as well as other credit trends.
Qualitative Component
The qualitative management adjustment component includes among other things, risks that are not fully captured in the quantitative component. These may include but are not limited to portfolio characteristics, idiosyncratic events, factors not within historical loss data or the economic forecast, uncertainty in the credit environment and other factors as required by banking supervisory guidance for the ACL. The primary examples of these are:are the following:
•Expected normalization of portfolio performanceTransfer risk associated with exposures outside the U.S. for certain safety and consumer behavior from recent low losses as a result of government stimulus and market liquidity during the COVID-19 pandemicsoundness considerations under U.S. banking law
•Potential impacts on vulnerable industries and regions due to emerging macroeconomic risks and uncertainties, including those related to potential global recession, inflation, interest rates, commodity prices and geopolitical tensions
•Transfer risk associated with exposures outsideNormalization of portfolio performance and consumer behavior from low losses as a result of government stimulus and market liquidity during the U.S. for certain safety and soundness considerations under U.S. banking lawCOVID-19 pandemic
As of the first quarter of 2024, Citi’s qualitative component of the ACL continued to declinedecreased quarter-over-quarter. The declinedecrease was primarily driven by releases(i) a release of COVID-19–related uncertainty reserves, as the portfolio continuesdelinquencies and losses continue to normalize toward pre-pandemic levelsincrease and as these risks are captured in the quantitative component of the ACL. These releases were partially offset byACL, and (ii) a buildrelease related to reserves for transfer risk associated with exposures outside the U.S. driven by safetyspecific risks and soundness considerations under U.S. banking law.uncertainties impacting vulnerable industries and regions.
Macroeconomic Variables
As further discussed below, Citi considers a multitude of global macroeconomic variables for the base, upside and downside probability-weighted macroeconomic scenario forecasts it uses to estimate the quantitative component of the ACL. Citi’s forecasts of the U.S. unemployment rate and U.S. real GDP growth rate represent the key macroeconomic variables that most significantly affect its estimate of the ACL.
The tables below present Citi’s forecasted quarterly average U.S. unemployment rate and year-over-year U.S. real GDP growth rate used in determining the base macroeconomic forecast for Citi’s ACL for each quarterly reporting period from 2Q221Q23 to 2Q23:1Q24:
| | Quarterly average | |
| Quarterly average | |
| U.S. unemployment | U.S. unemployment | 3Q23 | 1Q24 | 3Q24 | 8-quarter average(1) |
| Citi forecast at 2Q22 | 3.8 | % | 3.9 | % | 3.9 | % | 3.7 | % |
| Citi forecast at 3Q22 | 4.2 | | 4.0 | | 4.0 | | 4.0 | |
| Citi forecast at 4Q22 | 4.5 | | 4.6 | | 4.5 | | 4.4 | |
| U.S. unemployment | |
| U.S. unemployment | | 2Q24 | 4Q24 | 2Q25 | 8-quarter average(1) |
| Citi forecast at 1Q23 | Citi forecast at 1Q23 | 4.0 | | 4.5 | | 4.5 | | 4.3 | | Citi forecast at 1Q23 | 4.6 | % | 4.5 | % | 4.4 | % | 4.3 | % |
| Citi forecast at 2Q23 | Citi forecast at 2Q23 | 3.8 | | 4.3 | | 4.5 | | 4.3 | |
| Citi forecast at 3Q23 | |
| Citi forecast at 4Q23 | |
| Citi forecast at 1Q24 | |
(1) Represents the average unemployment rate for the rolling, forward-looking eight quarters in the forecast horizon.
| | Year-over-year growth rate(1) |
| Full year |
| Year-over-year growth rate(1) | | | Year-over-year growth rate(1) |
| Full year | | | Full year |
| U.S. real GDP | U.S. real GDP | 2023 | 2024 | 2025 | U.S. real GDP | 2024 | 2025 | 2026 |
| Citi forecast at 2Q22 | 1.8 | % | 2.0 | % | 2.1 | % |
| Citi forecast at 3Q22 | 0.6 | | 1.9 | | 2.7 | |
| Citi forecast at 4Q22 | 0.3 | | 1.5 | | 2.2 | |
| Citi forecast at 1Q23 | Citi forecast at 1Q23 | 1.0 | | 1.0 | | 2.0 | | Citi forecast at 1Q23 | 1.0 | % | 1.0 | % | 2.0 | % |
| Citi forecast at 2Q23 | Citi forecast at 2Q23 | 1.3 | | 0.7 | | 2.0 | |
| Citi forecast at 3Q23 | |
| Citi forecast at 4Q23 | |
| Citi forecast at 1Q24 | |
(1) The year-over-year growth rate is the percentage change in the real (inflation adjusted) GDP level.
Under the base macroeconomic forecast as of 2Q23,1Q24, U.S. real GDP growth is expected to decline for the remainder of 2023,during 2024, while the unemployment rate is expected to increase modestly over the eight-quarter forecast horizon, broadly returning to pre-pandemic levels.
Scenario Weighting
Citi’s ACL is estimated using three probability-weighted macroeconomic scenarios—base, upside and downside. The macroeconomic scenario weights are estimated using a statistical model, which, among other factors, takes into consideration key macroeconomic drivers of the ACL, severity of the scenario and other macroeconomic uncertainties and risks. Citi evaluates scenario weights on a quarterly basis.
Citi’s downside scenario incorporates more adverse macroeconomic assumptions than the base scenario. For example, compared to the base scenario, Citi’s downside scenario reflects a more severe recession, including an elevated average U.S. unemployment rate of 6.8% over the eight-quarter R&S period, with a peak difference of 3.0%3.4% in the fourththird quarter of 2024.2025. The downside scenario also reflects a year-over-year U.S. real GDP contraction in 2024 of 1.9%0.8%, with a peak quarter-over-quarter difference to the base scenario of 1.0% in the fourth quarter of 2023.1.3%.
Citi’s ACL is sensitive to the various macroeconomic scenarios that drive the quantitative component of expected credit losses, due to changes in the length and severity of forecasted economic variables or events in the respective scenarios. To demonstrate this sensitivity, Citi applied 100% weight to the downside scenario as of June 30, 2023,March 31, 2024 to reflect the most severe economic deterioration forecast in the multiple macroeconomic scenarios. Citi’s downside scenario incorporates more adverse macroeconomic assumptions than the weighted scenario assumptions; therefore, applying a 100% downside scenario weight would result in a hypothetical increase in the ACL of approximately $4.5$5.4 billion related to
lending exposures, except for loans individually evaluated for credit losses.losses and other financial assets carried at amortized cost.
This analysis does not incorporate any impacts or changes to the qualitative component of the ACL. These factors could decreasechange the outcome of the sensitivity analysis based on historical experience and current conditions at the time of the assessment. Given the uncertainty inherent in macroeconomic forecasting, Citi continues to believe that its ACL estimate based on a three probability-weighted macroeconomic scenario approach combined with the qualitative component remains appropriate as of June 30, 2023.March 31, 2024.
2Q231Q24 Changes in the ACL
As further discussed below, Citi’s ending ACL balance for the secondfirst quarter of 20232024 was $20.1$21.8 billion, compared to $19.8 billion as of Marchlargely unchanged from December 31, 2023. The net build of $0.3less than $0.1 billion in the quarter was primarily driven by growth in card balances(i) a build of $0.3 billion in PBWMUSPB,reflecting the impact of macroeconomic pressures related to the higher inflationary and interest rate environment, as well as the seasonal mix shift from transactors to revolvers in U.S. cards, and (ii) a build of $0.1 billion in Markets, partiallydue to changes in macroeconomic variable assumptions related to loans in spread products. These builds were largely offset by (i) a $0.2 billion release in Wealth,driven by a change in ACL associated with the margin lending portfolio, and (ii) a release of $0.1 billion for changes in the corporate portfolios due to an improved macroeconomic outlook. Based on its latest macroeconomic forecast,portfolio composition in Banking. Citi believes its analysis of the ACL reflects the forward view of the economic environment as of June 30, 2023.March 31, 2024. See Note 1415 for additional information.
Consumer Allowance for Credit Losses on Loans
Citi’s consumer ACLL is largely driven by U.S. cards (Branded cardsCards and Retail services)Services) in U.S. Personal Banking.USPB. Citi’s total consumer ACLL build was $0.4$0.1 billion in the secondfirst quarter of 2023,2024, primarily reflecting the impact of macroeconomic pressures related to the higher inflationary and interest rate environment, as well as the seasonal mix shift from transactors to revolvers, largely offset by a release in Wealth driven by growtha change in U.S. cards balances, resultingACL associated with the margin lending portfolio. This resulted in a June 30, 2023March 31, 2024 ACLL balance of $14.9$15.5 billion, or 3.97%4.07% of total funded consumer loans.
For U.S. cards, the level of reserves relative to total funded loans decreasedincreased to 7.86%8.16% at June 30, 2023, dueMarch 31, 2024, primarily related to seasonal volume growth in lower-loss portfolios,and mix changes, as well as the impact of macroeconomic pressures related to the higher inflationary and interest rate environment, compared to 8.08%7.67% at MarchDecember 31, 2023. For the remaining consumer exposures, the level of reserves relative to total funded loans was 1.28%1.16% at June 30, 2023,March 31, 2024, compared to 1.21%1.25% at MarchDecember 31, 2023.
Corporate Allowance for Credit Losses on Loans
Citi had a corporate ACLL releasebuild of $0.2$0.1 billion in the secondfirst quarter of 2023. The release was primarily2024, largely driven by an improvedMarkets due to the changes in macroeconomic outlook. Thevariable assumptions related to loans in spread products, largely offset by changes in the portfolio composition in Banking.This resulted in a March 31, 2024 ACLL reserve balance decreased by $0.2 billion to $2.6of $2.8 billion, or 0.94%0.97% of total funded corporate loans.
ACLUC
Citi had an ACLUC release of $0.1 billion in the secondfirst quarter of 2023,2024, which reduced the ACLUC reserve balance, included in Other liabilities, to $1.9$1.6 billion. The releasedecrease was primarily driven by an improved macroeconomic outlook.a release for specific risks and uncertainties impacting vulnerable industries and regions.
ACL on Other Financial Assets
Citi’s endingCiti had an ACL balancebuild of less than $0.1 billion on other financial assets carried at amortized cost for the secondfirst quarter of 2023 was $0.82024. Including FX/Other, the ACL reserve balance decreased $0.1 billion compared to $0.6$1.8 billion as of March 31, 2023. The net build2024, compared to $1.9 billion as of $0.1 billion was primarily driven by a reserve build of $0.3 billion related to an increase in transfer risk associated with exposures outside the U.S. driven by safety and soundness considerations under U.S. banking law, partially offset by the reserve release related to the repayment of the First Republic Bank deposit.December 31, 2023. See Note 1415 for additional information.
Regulatory Capital Impact
Citi elected the modified CECL transition provision for regulatory capital purposes provided by the U.S. banking agencies’ final rule. Accordingly, the Day One regulatory capital effects resulting from the adoption of CECL, as well as the ongoing adjustments for 25% of the change in CECL-based allowances in each quarter between January 1, 2020 and December 31, 2021, started to be phased in on January 1, 2022 and will be fully reflected in Citi’s regulatory capital as of January 1, 2025.
See Notes 1 and 1415 for a further description of the ACL and related accounts.
Goodwill
Citi tests for goodwill for impairment annually as of October 1 (the annual test) and conducts interim assessments between the annual testtests if an event occurs or circumstances change that would more-likely-than-not reduce the fair value of a reporting unit below its carrying amount. These events or circumstances include, among other things, a significant adverse change in the business climate, a decision to sell or dispose of all or a significant portion of a reporting unit or a sustained decrease in Citi’s stock price.
At October 1, 2022,The impairment tests performed in the fourth quarter of 2023 resulted in the fair values of Citi’s reporting units exceeding their carrying values for all reporting units. Additionally, the tests results showed that the fair value of two reporting units (Banking and Mexico Consumer/SBMM) ranged from 102% to 106% of their carrying values. The carrying values of the Banking and Mexico Consumer/SBMM reporting units includedunit as a percentage of its carrying value was 106%, with the carrying value including approximately $1.5 billion and $1$1.1 billion of goodwill, respectively.goodwill. For each of the remaining reporting units, fair value exceeded carrying value by at least 10%.
While the inherent risk related to uncertainty is embedded in the key assumptions used in the valuations of the reporting units, the economic and business environments continue to evolve as Citi’s management implementsexecutes on its strategic refresh.transformation and strategy. If management’s future estimates of key economic and market assumptions were to differ from its current assumptions, Citi could potentially experience material goodwill impairment charges in the future. See Note 1516 for a further discussion of goodwill.
Litigation Accruals
See the discussion in Note 2627 for information regarding Citi’s policies on establishing accruals for litigation and regulatory contingencies.
INCOME TAXES
Effective Tax Rate
| | Three Months Ended June 30, | Six Months Ended June 30, |
| Three Months Ended March 31, | |
| Three Months Ended March 31, | |
| Three Months Ended March 31, | |
| In millions of dollars, except effective tax rate | |
| In millions of dollars, except effective tax rate | |
| In millions of dollars, except effective tax rate | In millions of dollars, except effective tax rate | 2023 | 2022 | 2023 | 2022 |
| Income from continuing operations before income tax expense | Income from continuing operations before income tax expense | $ | 4,042 | $ | 5,971 | $ | 10,225 | | $ | 11,237 | |
| Income from continuing operations before income tax expense | |
| Income from continuing operations before income tax expense | |
| Provision for income taxes | |
| Provision for income taxes | |
| Provision for income taxes | Provision for income taxes | 1,090 | 1,182 | 2,621 | 2,123 |
| Effective tax rate | Effective tax rate | 27 | % | 20 | % | 26 | % | 19 | % |
| Effective tax rate | |
| Effective tax rate | |
Citi’s effective tax rate was 27%25% in the secondfirst quarter of 2024 versus 25% in the first quarter of 2023, both including the impact of divestitures, versus 20% in the second quarter of 2022, largely driven by the geographic mix of earnings. For the six months ended June 30, 2023, Citi’s effective tax rate increased to 26%, including the impact of divestitures, compared to 19% in the prior-year period, largely driven by lower discrete benefits.divestitures.
Deferred Tax Assets
For additional information on Citi’s deferred tax assets (DTAs), see “Capital Resources,” “Risk Factors—Strategic Risks,” “Significant Accounting Policies and Significant Estimates—Income Taxes” and Notes 1 and 910 to the Consolidated Financial Statements in Citi’s 20222023 Form 10-K.
The table below summarizes Citi’s net DTAs balance:
| | Jurisdiction/Component | |
| Jurisdiction/Component | |
| Jurisdiction/Component | Jurisdiction/Component | DTAs balance | DTAs balance |
| In billions of dollars | In billions of dollars | June 30,
2023 | | December 31, 2022 | In billions of dollars | March 31,
2024 | | December 31, 2023 |
| Total U.S. | Total U.S. | $ | 25.4 | | | $ | 24.8 | |
| Total foreign | Total foreign | 3.1 | | | 2.9 | |
| Total | Total | $ | 28.5 | | | $ | 27.7 | |
At June 30, 2023,March 31, 2024, Citigroup had recorded net DTAs of approximately $28.5$29.9 billion, an increase of $0.9$0.3 billion from December 31, 2023 and an increase of $2.3 billion from March 31, 2023 and $0.8 billion from December 31, 2022.2023. The increase for the secondfirst quarter was from temporary differences and year to datethe year-over-year increase was primarily a result of Citi’s geographic mix of earnings. Of Citi’s $28.5$29.9 billion of net DTAs, $16.8$14.1 billion (compared to $12.8 billion at December 31, 2023) was not deducted in calculating Citi’s regulatory capital, and the remaining $15.8 billion was appropriately risk weighted under the Basel III rules. The remaining $11.7 billion (compared to $11.1 billion at March 31, 2023) was deducted in calculating Citi’s regulatory capital.
The $11.7$14.1 billion of DTADTAs deducted from regulatory capital was composed of $11.5$11.9 billion related to tax carry-forwards, and $1.8with $3.6 billion of temporary differences in excess of the 10%/15% regulatory limitations, reduced by $1.6$1.4 billion of deferred tax liabilities, primarily associated with goodwill and certain other intangible assets that were separately deducted from capital. The largest component of the increase in the DTA deducted from Citi’s regulatory capital during the quarter was related to temporary differences in excess of the 10%/15% limitations ($1.8 billion at June 30, 2023 compared to $1.1 billion at March 31, 2023), primarily attributable to higher temporary differences in DTAs subject to the limitation.
DTA Realizability
Citi believes that realization of the net DTAs of $28.5$29.9 billion at June 30, 2023March 31, 2024 is more-likely-than-not, based on management’s expectations of future taxable income generation in the jurisdictions in which the DTAs arise, as well as consideration of available tax planning strategies (as defined in ASC Topic 740, Income Taxes).
DISCLOSURE CONTROLS AND PROCEDURES
Citi’s disclosure controls and procedures are designed to ensure that information required to be disclosed under the Securities Exchange Act of 1934, as amended, is recorded, processed, summarized and reported within the time periods specified in the SEC’s rules and forms, including without limitation that information required to be disclosed by Citi in its SEC filings is accumulated and communicated to management, including the Chief Executive Officer (CEO) and Chief Financial Officer (CFO), as appropriate, to allow for timely decisions regarding required disclosure.
Citi’s Disclosure Committee assists the CEO and CFO in their responsibilities to design, establish, maintain and evaluate the effectiveness of Citi’s disclosure controls and procedures. The Disclosure Committee is responsible for, among other things, the oversight, maintenance and implementation of the disclosure controls and procedures, subject to the supervision and oversight of the CEO and CFO.
Citi’s management, with the participation of its CEO and CFO, has evaluated the effectiveness of Citigroup’s disclosure controls and procedures (as defined in Rule 13a-15(e) under the Securities Exchange Act of 1934) as of June 30, 2023.March 31, 2024. Based on that evaluation, the CEO and CFO have concluded that at that date Citigroup’s disclosure controls and procedures were effective.
DISCLOSURE PURSUANT TO SECTION 219 OF THE IRAN THREAT REDUCTION AND SYRIA HUMAN RIGHTS ACT
Pursuant to Section 219 of the Iran Threat Reduction and Syria Human Rights Act of 2012 (Section 219), which added Section 13(r) to the Securities Exchange Act of 1934, as amended, Citi is required to disclose in its annual or quarterly reports, as applicable, whether it or any of its affiliates knowingly engaged in certain activities, transactions or dealings relating to Iran or with certain individuals or entities that are the subject of sanctions under U.S. law. Disclosure is generally required even where the activities, transactions or dealings were conducted in compliance with applicable law. To the extent that transactions or dealings for its clients are permitted by U.S. law, Citi may continue to engage in such activities.
Citi, in its First QuarterDuring the first quarter of 2023 Form 10-Q,2024, Citigroup identified and reported certain activitiesone transaction that was reportable pursuant to Section 219 for219. On January 12, 2024, Citibank, N.A. processed a transaction between the fourth quarterCentral Bank of 2022. During the second quarter of 2023, Citigroup identified eight transactions pursuantIran (the CBI) and an international organization. The CBI sent funds in yen, through Citibank, N.A., Tokyo Branch, which were then converted to Section 219:
•Between April 20, 2023U.S. dollars and April 24, 2023, Citibank (Hong Kong) Limited (CHKL) processed seven transactions involving the account of a Specially Designated National, who was designated on April 19, 2023, pursuanttransferred to the Weapons of Mass Destruction Proliferators Sanctions Regulations.international organization’s U.S. dollar (USD) account at Citibank, N.A., New York Branch. The total value of the seven transactionspayment was approximately USD 605,029.05, which includes19,616,884.32. The transaction represented a nominal fee that CHKL realized in relationpayment for the Government of Iran’s membership dues to a transaction thatthe international organization and was ultimately blocked; CHKL did not realize any additional fees. Once identified, the transactions were disclosedprocessed pursuant to general licenses issued by the U.S. Department of the Treasury’s Office of Foreign Assets Control (OFAC).
•On June 7, 2023, CHKLControl. Citibank realized approximately USD 5,905.00 for incoming and Citibank, N.A., New York Branch, processedoutgoing payments fees and a foreign exchange transaction from a Specially Designated National, who was designated on June 6, 2023, pursuant to the Weapons of Mass Destruction Proliferators Sanctions Regulations, to a non-sanctioned entity in China. The total value of the transaction was USD 4,736.18 and CHKL did not realize any fees for the processing of the transaction. Once identified, the transaction was disclosed to OFAC.
FORWARD-LOOKING STATEMENTS
Certain statements in this Form 10-Q, including but not limited to statements included within the Management’s Discussion and Analysis of Financial Condition and Results of Operations, are “forward-looking statements” within the meaning of the Private Securities Litigation Reform Act of 1995. In addition, Citigroup may make forward-looking statements in its other documents filed or furnished with the SEC, and its management may make forward-looking statements orally to analysts, investors, representatives of the media and others.
Generally, forward-looking statements are not based on historical facts but instead represent Citigroup’s and its management’s beliefs regarding future events. Such statements may be identified by words such as believe, expect, anticipate, intend, estimate, may increase, may fluctuate, target, outlook, guidance and illustrative, and similar expressions or future or conditional verbs such as will, should, would and could.
Such statements are based on management’s current expectations and are subject to risks, uncertainties and changes in circumstances. Actual results of operations and financial conditions, including capital and liquidity, may differ materially from those included in these statements due to a variety of factors, including without limitation (i) the precautionary statements included within the “Executive Summary” and each business’s discussion and analysis of its results of operations above and in Citi’s First Quarter of 2023 Form 10-Q, in Citi’s 2022 Form 10-K and in Citi’s other SEC filings; (ii) the factors listed and described under “Risk Factors” in Citi’s 20222023 Form 10-K; and (iii) the risks and uncertainties summarized below:
•the potential impact to Citi from continued macroeconomic, geopolitical and other challenges, uncertainties and volatility, including, among others, governmentalgovernment fiscal and monetary actions or expected actions, including further increases insuch as maintaining high interest rates, continued reductions in central bank balance sheets, or other changes inrestrictive interest rate or other monetary policies; a resurgence of inflation; potential recessions in the U.S., Europe and other regions andor countries; a potential U.S. federal government shutdown and the resulting impacts; elevated levels of inflation and their impacts; economic and geopolitical challenges related to China, including weak economic growth and tensions related to Taiwan; other geopolitical challenges, tensions and conflicts, including those related to Russia’s war in Ukraine; impactsUkraine and persistent and/or escalating conflicts in the Middle East; economic and other geopolitical challenges related to recent bank failuresChina, including weak economic growth, challenges in its real estate sector, banking and related marketcredit markets and tensions or conflicts between China and Taiwan and/or involving China and/or China and the U.S.; significant disruptions and volatility in financial markets, including macroeconomic conditions; foreign currency volatility and devaluations; distressdevaluations and volatilitycontinued strength in emerging markets, including sovereign debt pricing;the U.S. dollar; protracted or widespread trade tensions; and election outcomes;
•the potential impact on Citi’s ability to return capital to common shareholders consistent with its capital planning efforts and targets, due to, among other things: changes in regulatory capital rules, requirements or interpretations, such as revisions to the U.S. Basel III rules, including the recently issued notice of proposed rulemaking, known as the Basel III Endgame, related to regulatory capital
requirements;things, regulatory capital requirements, including annual recalibration of the Stress Capital Buffer, (preliminarily increased effective aswhich is based on the results of October 1, 2023);the CCAR process, recalibration of the GSIB surcharge;surcharge, and
supervisory expectations and assessments, including any negative findings regarding absolute capital levels or other aspects of Citi’s operations; changes in regulatory capital rules, requirements or interpretations, such as the Basel III Endgame (capital proposal), changes to the method for calculating the GSIB surcharge and changes to aspects of the total loss-absorbing capacity (TLAC) requirements; Citi’s results of operations and financial condition;condition, including the capital impactsimpact related to Citi’s remaining consumer banking divestitures, and achievement of the expected benefits from the divestitures; Citi’s effectiveness in planning, managing and calculating its level of regulatory capital and risk-weighted assets under both the Advanced Approaches and the Standardized Approach and Supplementary Leverage ratio and GSIB surcharge;ratio; Citi’s implementation and maintenance of an effective capital planning process and management framework; forecasts of macroeconomic conditions; and Citi’s DTA utilization;
•the ongoing regulatory and legislative uncertainties and changes faced by financial institutions, including Citi, in the U.S. and globally, such as potential changes to various aspects of the U.S. regulatory capital framework and requirements applicable to Citi; potential fiscal, monetary, regulatory, tax, sanctions and other changes, including potential increased regulatory requirements and costs, such as the imposition of additional or special assessments by the FDIC, including the recently issued notice of proposed rulemaking to recover the uninsured deposit losses from recent bank failures; potential changes in regulatory requirements relating to various aspects of the regulatory capital framework; futureinterest rate risk management; rapidly evolving legislative and regulatory requirements and other government initiatives in the EU, the U.S. and globally relating to sustainabilityclimate change and climate change,other Environmental, Social and Governance (ESG) areas that vary and may conflict across jurisdictions, including any new disclosure requirements, such as those proposed and/or adopted by the SEC and the EU; increased legislative activity by U.S. states that restricts the flow of capital and investment by financial institutions to state governmental entities, including anti-ESG initiatives that are designed to push back against corporate ESG policies;requirements; and the potential impact these uncertainties and changes could have on Citi’s businesses, results of operations, financial condition, business planning and compliance risks and costs;
•the potential impact to credit card fee revenues in Branded cards and Retail services in PBWM from the Consumer Financial Protection Bureau’s proposed significant changes to the maximum amounts on credit card late fees;
•Citi’s ability to improve its risk and controls environment, modernize its data and technology infrastructure and further enhance safety and soundness, meet regulatory expectations, be sufficiently competitive, serve clients effectively, avoid operational errors and realize productivity improvements, as part of its transformation and other strategic initiatives, including as a result of factors that Citi cannot control, which could make the initiatives more costly and more challenging to implement, and limit their effectiveness;
•Citi’s ability to achieve its objectives, including expense savings and revenue growth, from its transformation, organizational simplification and other strategic refresh, including, among others, those related to its exits of remaining consumer banking businesses in Legacy Franchises, including, among others, the consumer, small business and middle-market operations in Mexico, and Citi’s wind-down of its activities in Russia, Korea and China,other initiatives, which involve significant complexities, execution complexity,challenges and uncertainties, may not be as productive effective or timelyeffective as Citi expects or at all, may impact the local businesses during the exit
process, and could result in higher than expected expenses, litigation and regulatory scrutiny, CTA and other losses charges or other negative financial or strategic impacts, which could be material;material, and depend, in part, on factors that Citi cannot control, including, among others, macroeconomic challenges and uncertainties, customer, client and competitor actions and ongoing regulatory requirements or changes;
•the potential impact to Citi from climate change due to both physical risks, including acute risks as well as the consequences of chronic changes in climate, and thetransition risks, including those arising from regulatory, market, technological, stakeholder and legal changes from a transition to a low-carbon economy, including both physical risks, such as increased frequency and/or severity of adverse weather events as consequences of chronic climate changes, and transition risks, such as those arising from changes in regulations or market preferences toward a low-carbon economy; higher regulatory, compliance, credit, reputational and other risks and costs, including those associated with the EU’s Corporate Sustainability Reporting Directive (CSRD) and data-related challenges, including as a resultthe SEC’s climate disclosures rules (currently stayed), whether due to lack of any new disclosure requirements;information and an increased focus by banking regulators and others on the issue of climate change at financial institutions directly and with respect to their clients;reliable data, interpretive uncertainties or otherwise;
•Citi’s ability to utilize its DTAs (including the foreign tax credit component of its DTAs) and thus reduce the negative impact of the DTAs on Citi’s regulatory capital, including as a result of its ability to generate U.S. taxable income in the relevant tax carry-forwardreversal periods;
•the potential impact to Citi if its interpretation or application of the complex income-based and non-income-based (such as withholding, stamp, service and other non-income taxes) tax laws to which it is subject in the U.S. and in non-U.S. jurisdictions differs from those of the relevant governmental taxing authorities, including as a result of litigation or examinations regarding non-income-based tax matters, and the resulting payment of additional taxes, penalties or interest;interest, the reduction of certain tax benefits or the requirement to make adjustments to amounts recorded;
•the potential impact from a deterioration in or failure to maintain Citi’s co-branding or private label credit card relationships, due to, among other things, increasing competition among card issuers; the general economic environment; changes in consumer sentiment, spending patterns and credit card usage behaviors; a decline in sales and revenues, partner store closures or other operational difficulties of the retailer or merchant; early termination of a particular relationship; or other factors, including bankruptcies, liquidations, restructurings, consolidations or other similar events, whether due to the impact of a challenging economicmacroeconomic environment or otherwise;
•Citi’s ability in its resolution plan submissions to address any shortcomings or deficiencies or guidance provided by the Federal Reserve BoardFRB or FDIC;FDIC on its resolution plan submissions;
•the potential impact on Citi’s performance and the performance of its individual businesses, including its competitive position and ability to effectively manage its businesses, and its ability to effectively execute its transformation and strategic and other strategic initiatives, if Citi is unable to attract,hire and retain and motivate highly qualified employees, particularly given the highly competitive environment for talent and other factors, such as potential attrition driven by Citi’s organizational simplification initiatives, low unemployment, changes in worker’sworker expectations and regulation of employee compensation in the banking industry;
•Citi’s ability to compete effectively in the U.S. and globally with both financial and non-financial services firms, including as a result of certain competitors being subject to less stringent legal and regulatory requirements;
the introduction of mobile platforms and new or emerging technologies, and mobile platforms; possible disruptions fromsuch as artificial intelligence-driven solutions; growth in digital asset markets;potential mergers and acquisitions involving traditional financial services companies such as regional banks or credit card issuers; changes in the payments space; reliance on third parties for certain product and service offerings and any impact if anya third party is unable to provide adequate support for such product and service offerings; and the increased operational, compliance and other risks resulting from the need to develop new or change or adapt existing products and services to attract and retain customers or clients or to compete more effectively with competitors;effectively;
•the potential impact to Citi from a prior or future failure or disruption of its operational processes or systems, including as a result of, among other things, operational or execution failures, or deficiencies by third parties, including third parties that provide products or services to Citi, other market participants or those that otherwise have an ongoing partnership or business relationship with Citi; deficiencies in processes or controls; inadequate management of data governance practices, data controls and monitoring mechanisms that may adversely impact internal or external reporting and decision-making; cyber or information security incidents; human error, such as manual transaction processing errors, (e.g., erroneous payments to lenders or manual errors by Citi traders that cause system and market disruptions and losses for Citi or its clients), which can be exacerbated by staffing challenges and processing backlogs; fraud or malice on the part of employees or third parties; operational or execution failures or deficiencies by third parties; insufficient (or limited) straight-through processing between legacy or bespoke systems and any failure to design and effectively operate controls that mitigate operational risks associated with those legacy or bespoke systems, leading to potential risk of errors and operating losses; accidental system or technological failure; electrical or telecommunication outages; failure of or cyber incidents involving computer servers or infrastructure; other similar losses or damage to Citi’s property or assets; failures by third parties; potential disruptions and/or malfunctions within Citi’s businesses, as well as the operations of Citi’s clients, customers or other third parties; and the increased financial and other costs and reputational, legal and compliance risks resulting from any such failure or disruption of operational processes or systems, including legal and regulatory actions or proceedings, fines and other costs;
•the increasing risk to Citi’s and third parties’ computer systems, software and networks from ongoing, continually evolving, sophisticated cybersecurity incidents that could result in, among other things, theft, loss, non-availability, misuse or disclosure of personal, confidential or proprietary Citi, client, customer or customeremployee information or assets and a disruption of computer, software or network systems; and the potential impact from such risks, including reputational damage, regulatory penalties, loss of revenues, deposit flight, additional costs (including repair, replacement, remediation and other costs), exposure to litigation and other financial losses;
•the potential impact of changes or errors in accounting assumptions, judgments or estimates, or the application of certain accounting principles, related to the preparation of Citi’s financial statements, including the estimate of Citi’s ACL, which depends on its CECL models and assumptions, forecasted macroeconomic conditions and characteristics of Citi’s loan portfolios and other applicable financial assets; reserves related to litigation, regulatory and tax matters exposures;matters; valuation of DTAs; the fair values of certain assets and liabilities; and the assessment of goodwill and other assets for impairment;
• and the financial impact from reclassification of any CTA component of AOCI, including related hedges and taxes, into Citi’s earnings due to a sale, IPO, substantial liquidation or other deconsolidation event, of any foreign operations,
such as those related to Citi’s remaining consumer banking divestitures or other legacy businesses, whether due to Citi’s strategic refresh or otherwise;businesses;
•the impact of changes to financial accounting and reporting standards or interpretations of how Citi records and reports its financial condition and results of operations;
•the potential impact to Citi’s results of operations and/or regulatory capital and capital ratios if Citi’s risk management and mitigationother processes, strategies or models, including, among others, those related to its comprehensive stress testing initiatives or ability to adequately manage, assess and aggregate data, are deficient or ineffective, orineffective; Citi’s Basel III regulatory capital models require refinement, modification or enhancement,enhancement; or any relatednegative regulatory evaluation or examination finding is issued or enforcement action is taken by Citi’s U.S. banking regulators;
•the potential impact of credit risk and concentrations of risk on Citi’s results of operations, whetherincluding due to a default ofby or deterioration involvinga significant downgrade in credit ratings of consumer, corporate or public sector borrowers or other counterparties in the U.S. or in various countries and jurisdictions globally, includingsuch as from indemnification obligations in connection with various transactions, such asincluding hedging or reinsurance arrangements related to those obligations, or Citi’s inability to liquidate or realize the fair value of its collateral, which risks can be heightened for vulnerable sectors, industries or sectorscountries impacted by the continued macroeconomic, geopolitical, market and other challenges and uncertainties and volatilities;
•the potential impact on Citi’s liquidity, and/orsources of funding and costs of funding if it does not effectively manage its liquidity or due to various other factors, including, among others, general disruptions in the financial markets; changes in fiscal and monetary policies and regulatory requirements; negative investor perceptions of Citi’s creditworthiness; deposit outflows or unfavorable changes in deposit mix, whether driven by migration to higher-yielding products or otherwise; governmental fiscal and monetary policies; regulatory changes; negative investor perceptions of Citi’s creditworthiness;mix; competition for funding, including a decrease in demand for corporate debt securities; unexpected increases in cash or collateral requirements, and the consequent inability to monetize available liquidity resources; changes in Citi’s credit spreads; higherhigh interest rates; and changes in currency exchange rates;
•the impact of a credit ratings downgrade of Citi or certain of its subsidiaries or issuing entities on Citi’s funding and liquidity as well as on the operations of certain of its businesses;
•the potential impact to Citi of significantly heightened regulatory expectations and scrutiny in the U.S. and globally and ongoing interpretation and implementation of regulatory and legislative requirements and changes, in the U.S. and globally, as well as heightened regulatory scrutiny and expectations for large financial institutions and their employees and agents, with respect to, among other things, governance, infrastructure, data, climate and risk management practices and controls, customer and client protection, market practices, anti-money laundering, and increasingly complex sanctions and disclosure
regimes and various regulatory reporting requirements, including the impact on Citi’s compliance, regulatory and other risks and costs, such as increased regulatory oversight, material restrictions, including, among others, imposition of additional capital buffers and restrictions,
limitations on capital distributions, enforcement proceedings, penalties and fines;
•the potential outcomes of the extensive legal and regulatory proceedings, examinations, investigations, consent orders and related compliance efforts and other inquiries to which Citi is or may be subject at any given time, such as the previously disclosed October 2020 FRB and OCC consent orders, particularly given the increased focus by regulators on risk and controls, such as enterprise-wide risk management, compliance, data quality management and governance and internal controls, and policies and procedures; Citi’s ability to implement extensive targeted actionsaction plans and submit quarterly progress reports on a timely and sufficient basis detailing the results and status of improvements to comply with the consent orders, on a timely and sufficient basis, which will continue to require significant investments to meet regulatory expectations; and the heightened scrutiny and expectations generally from regulators, and the severity of the remedies that may be sought by regulators, such as significantlarge civil monetary penalties, supervisory or enforcement orders, business restrictions, limitations on dividends, changes to directors and/or officers and significant collateral consequences to Citi arising from such outcomes; and
•the various risks faced by Citi as a result of its presence in the emerging markets, including, among others, limitations or unavailability of hedges on foreign investments; foreign currency volatility and devaluations; strength in the U.S. dollar; sustained elevated interest rates; sovereign debt volatility; election outcomes; regulatory changesrates and political events;quantitative tightening; elevated inflation and hyperinflation; foreign exchange controls, including the inability to access indirect foreign exchange mechanisms; macroeconomic, geopolitical and geopoliticaldomestic political challenges and uncertainties and volatility,volatility; cyberattacks; restrictions arising from retaliatory laws and regulations; sanctions or asset freezes; sovereign debt volatility; fluctuations in commodity prices; election outcomes; regulatory changes, including potential conflicts among regulations with respect to commodity prices as well as repricing of assets and resulting impacts;other jurisdictions where Citi does business; limitations on foreign investment; sociopolitical instability (including from hyperinflation);instability; civil unrest; crime, corruption and fraud; nationalization or loss of licenses; business restrictions; sanctions or asset freezes; potential criminal charges; closure of branches or subsidiaries; confiscation of assets, whether related to geopolitical conflicts or otherwise;assets; and the need to record additional reserves for expected losses for credit exposures based on the transfer risk associated with exposures outside the U.S. driven by safety and soundness considerations under U.S. banking law; and increased compliance and regulatory risks and costs.law.
Any forward-looking statements made by or on behalf of Citigroup speak only as to the date they are made, and Citi does not undertake to update forward-looking statements to reflect the impact of circumstances or events that arise after the date that the forward-looking statements were made.
This page intentionally left blank.
FINANCIAL STATEMENTS AND NOTES TABLE OF CONTENTS
| | | | | |
| CONSOLIDATED FINANCIAL STATEMENTS | |
Consolidated Statement of Income (Unaudited)—
For the Three and Six Months Ended June 30,March 31, 2024 and 2023 and 2022 | |
Consolidated Statement of Comprehensive Income (Unaudited)—For the Three and Six Months Ended June 30,March 31, 2024 and 2023 and 2022 | |
Consolidated Balance Sheet—June 30, 2023March 31, 2024 (Unaudited) and December 31, 20222023 | |
Consolidated Statement of Changes in Stockholders’ Equity (Unaudited)—For the Three and Six Months Ended June 30,March 31, 2024 and 2023 and 2022 | |
Consolidated Statement of Cash Flows (Unaudited)—
For the SixThree Months Ended June 30,March 31, 2024 and 2023 and 2022 | |
| | | | | |
| NOTES TO CONSOLIDATED FINANCIAL STATEMENTS (UNAUDITED) |
Note 1—Basis of Presentation, Updated Accounting Policies
and Accounting Changes | |
Note 2—Discontinued Operations, Significant Disposals
and Other Business Exits | |
| Note 3—Operating Segments | |
Note 4—Interest RevenueIncome and Expense | |
Note 5—Commissions and Fees; Administration and Other
Fiduciary Fees | |
| Note 6—Principal Transactions | |
| Note 7—Incentive Plans | |
| Note 8—Retirement Benefits | |
Note 9—Earnings per ShareRestructuring | |
Note 10—Securities Borrowed, Loaned and
Subject to Repurchase Agreements | |
Note 11—Brokerage Receivables and Brokerage PayablesEarnings per Share | |
Note 12—Investments11—Securities Borrowed, Loaned and Subject to
Repurchase Agreements | |
Note 13—Loans12—Brokerage Receivables and Brokerage Payables | |
| Note 13—Investments | |
| | | | | |
| |
| Note 14—Loans | |
Note 14—15—Allowance for Credit Losses | |
Note 15—16—Goodwill and Intangible Assets | |
Note 16—17—Deposits | |
Note 17—18—Debt | |
Note 18—19—Changes in Accumulated Other Comprehensive
Income (Loss) (AOCI) | |
Note 19—20—Preferred Stock | |
Note 20—21—Securitizations and Variable Interest Entities | |
Note 21—Derivatives | |
Note 22—Fair Value MeasurementDerivatives | |
Note 23—Fair Value ElectionsMeasurement | |
| Note 24—Fair Value Elections | |
| Note 25—Guarantees and Commitments | |
Note 25—Leases | |
Note 26—ContingenciesLeases | |
| Note 27—Contingencies | |
| Note 28—Subsidiary Guarantees | |
CONSOLIDATED FINANCIAL STATEMENTS
| | | | | | | | |
| CONSOLIDATED STATEMENT OF INCOME (UNAUDITED) | | Citigroup Inc. and Subsidiaries |
|
| |
| | | | Three Months Ended June 30, | Six Months Ended June 30, |
| In millions of dollars, except per share amounts | In millions of dollars, except per share amounts | 2023 | 2022 | 2023 | 2022 |
| In millions of dollars, except per share amounts | |
| In millions of dollars, except per share amounts | |
| Revenues | Revenues | | | |
| Interest revenue | $ | 32,647 | | $ | 15,630 | | $ | 62,042 | | $ | 28,781 | |
| Revenues | |
| Revenues | |
| Interest income | |
| Interest income | |
| Interest income | |
| Interest expense | |
| Interest expense | |
| Interest expense | Interest expense | 18,747 | | 3,666 | | 34,794 | | 5,946 | |
| Net interest income | Net interest income | $ | 13,900 | | $ | 11,964 | | $ | 27,248 | | $ | 22,835 | |
| Net interest income | |
| Net interest income | |
| Commissions and fees | |
| Commissions and fees | |
| Commissions and fees | Commissions and fees | $ | 2,132 | | $ | 2,452 | | $ | 4,498 | | $ | 5,020 | |
| Principal transactions | Principal transactions | 2,528 | | 4,525 | | 6,467 | | 9,115 | |
| Principal transactions | |
| Principal transactions | |
| Administration and other fiduciary fees | |
| Administration and other fiduciary fees | |
| Administration and other fiduciary fees | Administration and other fiduciary fees | 989 | | 1,023 | | 1,885 | | 1,989 | |
| Realized gains on sales of investments, net | Realized gains on sales of investments, net | 49 | | (58) | | 121 | | 22 | |
| Realized gains on sales of investments, net | |
| Realized gains on sales of investments, net | |
| Impairment losses on investments: | Impairment losses on investments: | | | |
| Impairment losses on investments and other assets | (71) | | (96) | | (157) | | (186) | |
Provision (releases) for credit losses on AFS debt securities(1) | 1 | | 2 | | — | | 2 | |
| Impairment losses on investments: | |
| Impairment losses on investments: | |
| Impairment losses on investments | |
| Impairment losses on investments | |
| Impairment losses on investments | |
(Provision) releases for credit losses on AFS debt securities(1) | |
(Provision) releases for credit losses on AFS debt securities(1) | |
(Provision) releases for credit losses on AFS debt securities(1) | |
| | Net impairment losses recognized in earnings | |
| | Net impairment losses recognized in earnings | |
| | Net impairment losses recognized in earnings | Net impairment losses recognized in earnings | $ | (70) | | $ | (94) | | $ | (157) | | $ | (184) | |
| Other revenue | Other revenue | $ | (92) | | $ | (174) | | $ | 821 | | $ | 27 | |
| Other revenue | |
| Other revenue | |
| Total non-interest revenues | |
| Total non-interest revenues | |
| Total non-interest revenues | Total non-interest revenues | $ | 5,536 | | $ | 7,674 | | $ | 13,635 | | $ | 15,989 | |
| Total revenues, net of interest expense | Total revenues, net of interest expense | $ | 19,436 | | $ | 19,638 | | $ | 40,883 | | $ | 38,824 | |
| Total revenues, net of interest expense | |
| Total revenues, net of interest expense | |
| Provisions for credit losses and for benefits and claims | |
| Provisions for credit losses and for benefits and claims | |
| Provisions for credit losses and for benefits and claims | Provisions for credit losses and for benefits and claims | | | | |
| Provision for credit losses on loans | Provision for credit losses on loans | $ | 1,761 | | $ | 1,384 | | $ | 3,498 | | $ | 1,644 | |
| Provision for credit losses on loans | |
| Provision for credit losses on loans | |
| Provision (release) for credit losses on HTM debt securities | |
| Provision (release) for credit losses on HTM debt securities | |
| Provision (release) for credit losses on HTM debt securities | Provision (release) for credit losses on HTM debt securities | (4) | | 20 | | (21) | | 18 | |
| Provision for credit losses on other assets | Provision for credit losses on other assets | 149 | | 7 | | 574 | | 3 | |
| Provision for credit losses on other assets | |
| Provision for credit losses on other assets | |
| Policyholder benefits and claims | |
| Policyholder benefits and claims | |
| Policyholder benefits and claims | Policyholder benefits and claims | 14 | | 22 | | 38 | | 49 | |
| Provision (release) for credit losses on unfunded lending commitments | Provision (release) for credit losses on unfunded lending commitments | (96) | | (159) | | (290) | | 315 | |
| Provision (release) for credit losses on unfunded lending commitments | |
| Provision (release) for credit losses on unfunded lending commitments | |
Total provisions for credit losses and for benefits and claims(2) | |
Total provisions for credit losses and for benefits and claims(2) | |
Total provisions for credit losses and for benefits and claims(2) | Total provisions for credit losses and for benefits and claims(2) | $ | 1,824 | | $ | 1,274 | | $ | 3,799 | | $ | 2,029 | |
| Operating expenses | Operating expenses | | | |
| Operating expenses | |
| Operating expenses | |
| Compensation and benefits | |
| Compensation and benefits | |
| Compensation and benefits | Compensation and benefits | $ | 7,388 | | $ | 6,472 | | $ | 14,926 | | $ | 13,292 | |
| Premises and equipment | Premises and equipment | 595 | | 619 | | 1,193 | | 1,162 | |
| Premises and equipment | |
| Premises and equipment | |
| Technology/communication | |
| Technology/communication | |
| Technology/communication | Technology/communication | 2,309 | | 2,068 | | 4,436 | | 4,084 | |
| Advertising and marketing | Advertising and marketing | 361 | | 414 | | 692 | | 725 | |
| Advertising and marketing | |
| Advertising and marketing | |
| Restructuring | |
| Restructuring | |
| Restructuring | |
| Other operating | |
| Other operating | |
| Other operating | Other operating | 2,917 | | 2,820 | | 5,612 | | 6,295 | |
| Total operating expenses | Total operating expenses | $ | 13,570 | | $ | 12,393 | | $ | 26,859 | | $ | 25,558 | |
| Total operating expenses | |
| Total operating expenses | |
| Income from continuing operations before income taxes | |
| Income from continuing operations before income taxes | |
| Income from continuing operations before income taxes | Income from continuing operations before income taxes | $ | 4,042 | | $ | 5,971 | | $ | 10,225 | | $ | 11,237 | |
| Provision for income taxes | Provision for income taxes | 1,090 | | 1,182 | | 2,621 | | 2,123 | |
| Provision for income taxes | |
| Provision for income taxes | |
| Income from continuing operations | |
| Income from continuing operations | |
| Income from continuing operations | Income from continuing operations | $ | 2,952 | | $ | 4,789 | | $ | 7,604 | | $ | 9,114 | |
| Discontinued operations | Discontinued operations | | | |
| Discontinued operations | |
| Discontinued operations | |
| Income (loss) from discontinued operations | |
| Income (loss) from discontinued operations | |
| Income (loss) from discontinued operations | Income (loss) from discontinued operations | $ | (1) | | $ | (262) | | $ | (2) | | $ | (264) | |
| | Benefit for income taxes | Benefit for income taxes | — | | (41) | | — | | (41) | |
| | Benefit for income taxes | |
| | Benefit for income taxes | |
| Income (loss) from discontinued operations, net of taxes | |
| Income (loss) from discontinued operations, net of taxes | |
| Income (loss) from discontinued operations, net of taxes | Income (loss) from discontinued operations, net of taxes | $ | (1) | | $ | (221) | | $ | (2) | | $ | (223) | |
| Net income before attribution to noncontrolling interests | Net income before attribution to noncontrolling interests | $ | 2,951 | | $ | 4,568 | | $ | 7,602 | | $ | 8,891 | |
| Net income before attribution to noncontrolling interests | |
| Net income before attribution to noncontrolling interests | |
| Noncontrolling interests | |
| Noncontrolling interests | |
| Noncontrolling interests | Noncontrolling interests | 36 | | 21 | | 81 | | 38 | |
| Citigroup’s net income | Citigroup’s net income | $ | 2,915 | | $ | 4,547 | | $ | 7,521 | | $ | 8,853 | |
| Citigroup’s net income | |
| Citigroup’s net income | |
Basic earnings per share(3) | |
Basic earnings per share(3) | |
Basic earnings per share(3) | Basic earnings per share(3) | | | |
| Income from continuing operations | Income from continuing operations | $ | 1.34 | | $ | 2.32 | | $ | 3.55 | | $ | 4.34 | |
| Income from continuing operations | |
| Income from continuing operations | |
| Income from discontinued operations, net of taxes | |
| Income from discontinued operations, net of taxes | |
| Income from discontinued operations, net of taxes | Income from discontinued operations, net of taxes | — | | (0.11) | | — | | (0.11) | |
| Net income | Net income | $ | 1.34 | | $ | 2.20 | | $ | 3.54 | | $ | 4.23 | |
Weighted average common shares outstanding (in millions) | 1,942.8 | | 1,941.5 | | 1,943.2 | | 1,956.6 | |
| Net income | |
| Net income | |
Weighted-average common shares outstanding (in millions) | |
Weighted-average common shares outstanding (in millions) | |
Weighted-average common shares outstanding (in millions) | |
Diluted earnings per share(3) | |
Diluted earnings per share(3) | |
Diluted earnings per share(3) | Diluted earnings per share(3) | | | |
| Income from continuing operations | Income from continuing operations | $ | 1.33 | | $ | 2.30 | | $ | 3.52 | | $ | 4.32 | |
| Income from continuing operations | |
| Income from continuing operations | |
| Income (loss) from discontinued operations, net of taxes | Income (loss) from discontinued operations, net of taxes | — | | (0.11) | | — | | (0.11) | |
| Net income | $ | 1.33 | | $ | 2.19 | | $ | 3.52 | | $ | 4.20 | |
Adjusted weighted average diluted common shares outstanding (in millions) | 1,968.6 | | 1,958.1 | | 1,966.3 | | 1,973.2 | |
| Income (loss) from discontinued operations, net of taxes | |
| Income (loss) from discontinued operations, net of taxes | |
| | | | | | | | | | |
| Net income | $ | 1.58 | | $ | 2.19 | | | |
Adjusted weighted-average diluted common shares outstanding (in millions) | 1,943.2 | | 1,964.1 | | | |
(1) In accordance with ASC 326, which requires the provision for credit losses on AFS debt securities to be included in revenue.
(2) This total excludes the provision for credit losses on AFS debt securities, which is disclosed separately above.
(3) Due to rounding, earnings per share on continuing operations and discontinued operations may not sum to earnings per share on net income.
The Notes to the Consolidated Financial Statements are an integral part of these Consolidated Financial Statements.
| | | | | | | | |
| CONSOLIDATED STATEMENT OF COMPREHENSIVE INCOME | | Citigroup Inc. and Subsidiaries |
| (UNAUDITED) | | |
| | | | | | | | | | | | | | |
| | Three Months Ended June 30, | Six Months Ended June 30, |
| In millions of dollars | 2023 | 2022 | 2023 | 2022 |
| Citigroup’s net income | $ | 2,915 | | $ | 4,547 | | $ | 7,521 | | $ | 8,853 | |
Add: Citigroup’s other comprehensive income(1) | | | | |
Net change in unrealized gains and losses on debt securities, net of taxes(2) | $ | 126 | | $ | (1,501) | | $ | 962 | | $ | (5,778) | |
Net change in debt valuation adjustment (DVA), net of taxes(3) | (619) | | 1,967 | | (944) | | 2,760 | |
| Net change in cash flow hedges, net of taxes | 171 | | (666) | | 532 | | (2,207) | |
Benefit plans liability adjustment, net of taxes(4) | (136) | | (89) | | (240) | | 82 | |
| Net change in CTA, net of taxes and hedges | 23 | | (1,630) | | 864 | | (1,644) | |
| Net change in excluded component of fair value hedges, net of taxes | 17 | | 9 | | (3) | | 57 | |
| Net change in long-duration insurance contracts, net of taxes | (6) | | — | | (1) | | — | |
| Citigroup’s total other comprehensive income (loss) | $ | (424) | | $ | (1,910) | | $ | 1,170 | | $ | (6,730) | |
| Citigroup’s total comprehensive income | $ | 2,491 | | $ | 2,637 | | $ | 8,691 | | $ | 2,123 | |
Add: Other comprehensive income (loss) attributable to
noncontrolling interests | 14 | | (53) | | 46 | | (82) | |
| Add: Net income (loss) attributable to noncontrolling interests | 36 | | 21 | | 81 | | 38 | |
| Total comprehensive income | $ | 2,541 | | $ | 2,605 | | $ | 8,818 | | $ | 2,079 | |
| | | | | | | | | | |
| | Three Months Ended March 31, | |
| In millions of dollars | 2024 | 2023 | | |
| Citigroup’s net income | $ | 3,371 | | $ | 4,606 | | | |
Add: Citigroup’s other comprehensive income, net change, net of taxes(1) | | | | |
Unrealized gains and losses on debt securities(2) | $ | 100 | | $ | 836 | | | |
Debt valuation adjustment (DVA)(3) | (563) | | (325) | | | |
| Cash flow hedges | 492 | | 361 | | | |
Benefit plans liability adjustment(4) | 77 | | (104) | | | |
| CTA, net of hedges | (1,054) | | 841 | | | |
| Excluded component of fair value hedges | (2) | | (20) | | | |
| Long-duration insurance contracts | 21 | | 5 | | | |
| Citigroup’s total other comprehensive income (loss) | $ | (929) | | $ | 1,594 | | | |
| Citigroup’s total comprehensive income | $ | 2,442 | | $ | 6,200 | | | |
Add: Other comprehensive income (loss) attributable to
noncontrolling interests | $ | (13) | | $ | 32 | | | |
| Add: Net income (loss) attributable to noncontrolling interests | 36 | | 45 | | | |
| Total comprehensive income | $ | 2,465 | | $ | 6,277 | | | |
(1)See Note 18.19.
(2)See Note 12.13.
(3)See Note 22.23.
(4)See Note 8.
The Notes to the Consolidated Financial Statements are an integral part of these Consolidated Financial Statements.
| | | | | | | | |
| CONSOLIDATED BALANCE SHEET | | Citigroup Inc. and Subsidiaries |
| | June 30, | |
| 2023 | December 31, |
| March 31, | |
| 2024 | |
| 2024 | |
| 2024 | | December 31, |
| In millions of dollars | In millions of dollars | (Unaudited) | 2022 | In millions of dollars | (Unaudited) | 2023 |
| Assets | Assets | | Assets | |
| Cash and due from banks (including segregated cash and other deposits) | Cash and due from banks (including segregated cash and other deposits) | $ | 25,763 | | $ | 30,577 | |
| Deposits with banks, net of allowance | Deposits with banks, net of allowance | 271,145 | | 311,448 | |
| Securities borrowed and purchased under agreements to resell (including $210,126 and $239,527 as of June 30, 2023 and December 31, 2022, respectively, at fair value), net of allowance | 337,103 | | 365,401 | |
| Securities borrowed and purchased under agreements to resell (including $193,546 and $206,059 as of March 31, 2024 and December 31, 2023, respectively, at fair value), net of allowance | |
| Brokerage receivables, net of allowance | Brokerage receivables, net of allowance | 60,850 | | 54,192 | |
| Trading account assets (including $172,535 and $133,535 pledged to creditors as of June 30, 2023 and December 31, 2022, respectively) | 423,189 | | 334,114 | |
| Trading account assets (including $228,669 and $197,156 pledged to creditors as of March 31, 2024 and December 31, 2023, respectively) | |
| Investments: | Investments: | |
| Available-for-sale debt securities (including $11,754 and $10,933 pledged to creditors as of June 30, 2023 and December 31, 2022, respectively) | 237,334 | | 249,679 | |
| Held-to-maturity debt securities, net of allowance (fair value of which is $238,021 and $243,648 as of June 30, 2023 and December 31, 2022, respectively) (includes $21 and $0 pledged to creditors as of June 30, 2023 and December 31, 2022, respectively) | 262,066 | | 268,863 | |
| Equity securities (including $729 and $895 as of June 30, 2023 and December 31, 2022, respectively, at fair value) | 7,745 | | 8,040 | |
| Available-for-sale debt securities (including $1,846 and $11,868 pledged to creditors as of March 31, 2024 and December 31, 2023, respectively) | |
| Available-for-sale debt securities (including $1,846 and $11,868 pledged to creditors as of March 31, 2024 and December 31, 2023, respectively) | |
| Available-for-sale debt securities (including $1,846 and $11,868 pledged to creditors as of March 31, 2024 and December 31, 2023, respectively) | |
| Held-to-maturity debt securities, net of allowance (fair value of which is $231,374 and $235,001 as of March 31, 2024 and December 31, 2023, respectively) (includes $33 and $71 pledged to creditors as of March 31, 2024 and December 31, 2023, respectively) | |
| Equity securities (including $802 and $766 as of March 31, 2024 and December 31, 2023, respectively, at fair value) | |
| Total investments | Total investments | $ | 507,145 | | $ | 526,582 | |
| Loans: | Loans: | |
| Consumer (including $237 and $237 as of June 30, 2023 and December 31, 2022, respectively, at fair value) | 374,591 | | 368,067 | |
| Corporate (including $5,529 and $5,123 as of June 30, 2023 and December 31, 2022, respectively, at fair value) | 286,021 | | 289,154 | |
| Consumer (including $303 and $313 as of March 31, 2024 and December 31, 2023, respectively, at fair value) | |
| Consumer (including $303 and $313 as of March 31, 2024 and December 31, 2023, respectively, at fair value) | |
| Consumer (including $303 and $313 as of March 31, 2024 and December 31, 2023, respectively, at fair value) | |
| Corporate (including $8,551 and $7,281 as of March 31, 2024 and December 31, 2023, respectively, at fair value) | |
| Loans, net of unearned income | Loans, net of unearned income | $ | 660,612 | | $ | 657,221 | |
| Allowance for credit losses on loans (ACLL) | Allowance for credit losses on loans (ACLL) | (17,496) | | (16,974) | |
| Total loans, net | Total loans, net | $ | 643,116 | | $ | 640,247 | |
| Goodwill | Goodwill | 19,998 | | 19,691 | |
| Intangible assets (including MSRs at fair value of $681 and $665 as of June 30, 2023 and December 31, 2022, respectively) | 4,576 | | 4,428 | |
| Intangible assets (including MSRs of $702 and $691 as of March 31, 2024 and December 31, 2023, respectively) | |
| Premises and equipment, net of depreciation and amortization | Premises and equipment, net of depreciation and amortization | 27,818 | | 26,253 | |
| Other assets (including $13,637 and $10,658 as of June 30, 2023 and December 31, 2022, respectively, at fair value), net of allowance | 102,972 | | 103,743 | |
| Other assets (including $12,731 and $12,290 as of March 31, 2024 and December 31, 2023, respectively, at fair value), net of allowance | |
| | Total assets | Total assets | $ | 2,423,675 | | $ | 2,416,676 | |
| Total assets | |
| Total assets | |
Statement continues on the next page.
CONSOLIDATED BALANCE SHEET Citigroup Inc. and Subsidiaries
(Continued)
| | June 30, | |
| 2023 | December 31, |
| March 31, | |
| 2024 | |
| 2024 | |
| 2024 | | December 31, |
| In millions of dollars, except shares and per share amounts | In millions of dollars, except shares and per share amounts | (Unaudited) | 2022 | In millions of dollars, except shares and per share amounts | (Unaudited) | 2023 |
| Liabilities | Liabilities | | Liabilities | |
Deposits (including $2,598 and $1,875 as of June 30, 2023 and December 31, 2022, respectively, at fair value) | $ | 1,319,867 | | $ | 1,365,954 | |
| Securities loaned and sold under agreements to repurchase (including $62,800 and $70,886 as of June 30, 2023 and December 31, 2022, respectively, at fair value) | 260,035 | | 202,444 | |
Brokerage payables (including $5,989 and $4,439 as of June 30, 2023 and December 31, 2022, respectively, at fair value) | 69,433 | | 69,218 | |
Deposits (including $2,905 and $2,440 as of March 31, 2024 and December 31, 2023, respectively, at fair value) | |
| Securities loaned and sold under agreements to repurchase (including $73,781 and $62,485 as of March 31, 2024 and December 31, 2023, respectively, at fair value) | |
Brokerage payables (including $3,997 and $4,321 as of March 31, 2024 and December 31, 2023, respectively, at fair value) | |
| Trading account liabilities | Trading account liabilities | 170,664 | | 170,647 | |
| Short-term borrowings (including $5,622 and $6,222 as of June 30, 2023 and December 31, 2022, respectively, at fair value) | 40,430 | | 47,096 | |
| Long-term debt (including $115,937 and $105,995 as of June 30, 2023 and December 31, 2022, respectively, at fair value) | 274,510 | | 271,606 | |
| Short-term borrowings (including $8,131 and $6,545 as of March 31, 2024 and December 31, 2023, respectively, at fair value) | |
| Long-term debt (including $115,317 and $116,338 as of March 31, 2024 and December 31, 2023, respectively, at fair value) | |
| Other liabilities, plus allowances | Other liabilities, plus allowances | 79,314 | | 87,873 | |
| | Total liabilities | Total liabilities | $ | 2,214,253 | | $ | 2,214,838 | |
| Total liabilities | |
| Total liabilities | |
| Stockholders’ equity | Stockholders’ equity | | Stockholders’ equity | |
Preferred stock ($1.00 par value; authorized shares: 30 million), issued shares: as of June 30, 2023—809,800 and as of December 31, 2022—759,800, at aggregate liquidation value | $ | 20,245 | | $ | 18,995 | |
Common stock ($0.01 par value; authorized shares: 6 billion), issued shares: as of June 30, 2023—3,099,691,671 and as of December 31, 2022—3,099,669,424 | 31 | | 31 | |
Preferred stock ($1.00 par value; authorized shares: 30 million), issued shares: as of March 31, 2024—704,000 and as of December 31, 2023—704,000, at aggregate liquidation value | |
Common stock ($0.01 par value; authorized shares: 6 billion), issued shares: as of March 31, 2024—3,099,718,305 and as of December 31, 2023—3,099,691,704 | |
| Additional paid-in capital | Additional paid-in capital | 108,579 | | 108,458 | |
| Retained earnings | Retained earnings | 199,976 | | 194,734 | |
Treasury stock, at cost: June 30, 2023—1,173,989,187 shares and
December 31, 2022—1,162,682,999 shares | (74,247) | | (73,967) | |
Treasury stock, at cost: March 31, 2024—1,192,278,692 shares and December 31, 2023— 1,196,577,865 shares | |
Accumulated other comprehensive income (loss) (AOCI) | Accumulated other comprehensive income (loss) (AOCI) | (45,865) | | (47,062) | |
| Total Citigroup stockholders’ equity | Total Citigroup stockholders’ equity | $ | 208,719 | | $ | 201,189 | |
| Noncontrolling interests | Noncontrolling interests | 703 | | 649 | |
| Total equity | Total equity | $ | 209,422 | | $ | 201,838 | |
| Total liabilities and equity | Total liabilities and equity | $ | 2,423,675 | | $ | 2,416,676 | |
The Notes to the Consolidated Financial Statements are an integral part of these Consolidated Financial Statements.
| | | | | | | | |
| CONSOLIDATED STATEMENT OF CHANGES IN STOCKHOLDERS’ EQUITY (UNAUDITED) | | Citigroup Inc. and Subsidiaries |
| | Three Months Ended June 30, | Six Months Ended June 30, |
| Three Months Ended March 31, | |
| Three Months Ended March 31, | |
| Three Months Ended March 31, | |
| In millions of dollars | |
| In millions of dollars | |
| In millions of dollars | In millions of dollars | 2023 | 2022 | 2023 | 2022 |
| Preferred stock at aggregate liquidation value | Preferred stock at aggregate liquidation value | | | |
| Preferred stock at aggregate liquidation value | |
| Preferred stock at aggregate liquidation value | |
| Balance, beginning of period | |
| Balance, beginning of period | |
| Balance, beginning of period | Balance, beginning of period | $ | 20,245 | | $ | 18,995 | | $ | 18,995 | | $ | 18,995 | |
| Issuance of new preferred stock | Issuance of new preferred stock | — | | — | | 1,250 | | — | |
| | Issuance of new preferred stock | |
| Issuance of new preferred stock | |
| Redemption of preferred stock | |
| Redemption of preferred stock | |
| Redemption of preferred stock | |
| Balance, end of period | |
| Balance, end of period | |
| Balance, end of period | Balance, end of period | $ | 20,245 | | $ | 18,995 | | $ | 20,245 | | $ | 18,995 | |
| Common stock and additional paid-in capital (APIC) | Common stock and additional paid-in capital (APIC) | | | | |
| Common stock and additional paid-in capital (APIC) | |
| Common stock and additional paid-in capital (APIC) | |
| Balance, beginning of period | |
| Balance, beginning of period | |
| Balance, beginning of period | Balance, beginning of period | $ | 108,400 | | $ | 108,081 | | $ | 108,489 | | $ | 108,034 | |
| Employee benefit plans | Employee benefit plans | 210 | | 160 | | 126 | | 206 | |
| | Other | — | | — | | (5) | | 1 | |
| Employee benefit plans | |
| Employee benefit plans | |
Preferred stock issuance costs (reclassifications to Retained earnings for redemptions) | |
Preferred stock issuance costs (reclassifications to Retained earnings for redemptions) | |
Preferred stock issuance costs (reclassifications to Retained earnings for redemptions) | |
| Other (primarily preferred stock issuance costs related to new issuances) | |
| Other (primarily preferred stock issuance costs related to new issuances) | |
| Other (primarily preferred stock issuance costs related to new issuances) | |
| Balance, end of period | |
| Balance, end of period | |
| Balance, end of period | Balance, end of period | $ | 108,610 | | $ | 108,241 | | $ | 108,610 | | $ | 108,241 | |
| Retained earnings | Retained earnings | | | |
| Retained earnings | |
| Retained earnings | |
| Balance, beginning of period | Balance, beginning of period | $ | 198,353 | | $ | 187,962 | | $ | 194,734 | | $ | 184,948 | |
| Balance, beginning of period | |
| Balance, beginning of period | |
Adjustment to opening balance, net of taxes(1) | |
Adjustment to opening balance, net of taxes(1) | |
Adjustment to opening balance, net of taxes(1) | Adjustment to opening balance, net of taxes(1) | | | |
| | Financial instruments—TDRs and vintage disclosures | Financial instruments—TDRs and vintage disclosures | — | | — | | 290 | | — | |
| | Financial instruments—TDRs and vintage disclosures | |
| | Financial instruments—TDRs and vintage disclosures | |
| Adjusted balance, beginning of period | |
| Adjusted balance, beginning of period | |
| Adjusted balance, beginning of period | Adjusted balance, beginning of period | $ | 198,353 | | $ | 187,962 | | $ | 195,024 | | $ | 184,948 | |
| Citigroup’s net income | Citigroup’s net income | 2,915 | | 4,547 | | 7,521 | | 8,853 | |
| Citigroup’s net income | |
| Citigroup’s net income | |
Common dividends(2) | |
Common dividends(2) | |
Common dividends(2) | Common dividends(2) | (1,004) | | (1,010) | | (2,004) | | (2,024) | |
| Preferred dividends | Preferred dividends | (288) | | (238) | | (565) | | (517) | |
| Preferred dividends | |
| Preferred dividends | |
| Other (primarily reclassifications from APIC for preferred issuance costs on redemptions) | |
| Other (primarily reclassifications from APIC for preferred issuance costs on redemptions) | |
| Other (primarily reclassifications from APIC for preferred issuance costs on redemptions) | Other (primarily reclassifications from APIC for preferred issuance costs on redemptions) | — | | — | | — | | 1 | |
| Balance, end of period | Balance, end of period | $ | 199,976 | | $ | 191,261 | | $ | 199,976 | | $ | 191,261 | |
| Balance, end of period | |
| Balance, end of period | |
| Treasury stock, at cost | |
| Treasury stock, at cost | |
| Treasury stock, at cost | Treasury stock, at cost | | | | |
| Balance, beginning of period | Balance, beginning of period | $ | (73,262) | | $ | (73,744) | | $ | (73,967) | | $ | (71,240) | |
| Balance, beginning of period | |
| Balance, beginning of period | |
Employee benefit plans(3) | |
Employee benefit plans(3) | |
Employee benefit plans(3) | Employee benefit plans(3) | 15 | | 6 | | 720 | | 502 | |
Treasury stock acquired(4) | Treasury stock acquired(4) | (1,000) | | (250) | | (1,000) | | (3,250) | |
Treasury stock acquired(4) | |
Treasury stock acquired(4) | |
| Balance, end of period | |
| Balance, end of period | |
| Balance, end of period | Balance, end of period | $ | (74,247) | | $ | (73,988) | | $ | (74,247) | | $ | (73,988) | |
| Citigroup’s accumulated other comprehensive income (loss) | Citigroup’s accumulated other comprehensive income (loss) | | | | |
| Citigroup’s accumulated other comprehensive income (loss) | |
| Citigroup’s accumulated other comprehensive income (loss) | |
| Balance, beginning of period | |
| Balance, beginning of period | |
| Balance, beginning of period | Balance, beginning of period | $ | (45,441) | | $ | (43,585) | | $ | (47,062) | | $ | (38,765) | |
Adjustment to opening balance, net of taxes(1) | Adjustment to opening balance, net of taxes(1) | — | | — | | 27 | | — | |
Adjustment to opening balance, net of taxes(1) | |
Adjustment to opening balance, net of taxes(1) | |
| Adjusted balance, beginning of period | |
| Adjusted balance, beginning of period | |
| Adjusted balance, beginning of period | Adjusted balance, beginning of period | $ | (45,441) | | $ | (43,585) | | $ | (47,035) | | $ | (38,765) | |
| Citigroup’s total other comprehensive income | Citigroup’s total other comprehensive income | (424) | | (1,910) | | 1,170 | | (6,730) | |
| Citigroup’s total other comprehensive income | |
| Citigroup’s total other comprehensive income | |
| Balance, end of period | |
| Balance, end of period | |
| Balance, end of period | Balance, end of period | $ | (45,865) | | $ | (45,495) | | $ | (45,865) | | $ | (45,495) | |
| Total Citigroup common stockholders’ equity | Total Citigroup common stockholders’ equity | $ | 188,474 | | $ | 180,019 | | $ | 188,474 | | $ | 180,019 | |
| Total Citigroup common stockholders’ equity | |
| Total Citigroup common stockholders’ equity | |
| Total Citigroup stockholders’ equity | |
| Total Citigroup stockholders’ equity | |
| Total Citigroup stockholders’ equity | Total Citigroup stockholders’ equity | $ | 208,719 | | $ | 199,014 | | $ | 208,719 | | $ | 199,014 | |
| Noncontrolling interests | Noncontrolling interests | | | | |
| Noncontrolling interests | |
| Noncontrolling interests | |
| Balance, beginning of period | |
| Balance, beginning of period | |
| Balance, beginning of period | Balance, beginning of period | $ | 724 | | $ | 644 | | $ | 649 | | $ | 700 | |
| | Transactions between Citigroup and noncontrolling-interest shareholders | 1 | | (1) | | 1 | | (34) | |
| Transactions between Citigroup and the noncontrolling-interest shareholders | |
| | Transactions between Citigroup and the noncontrolling-interest shareholders | |
| | Transactions between Citigroup and the noncontrolling-interest shareholders | |
| Net income attributable to noncontrolling-interest shareholders | |
| Net income attributable to noncontrolling-interest shareholders | |
| Net income attributable to noncontrolling-interest shareholders | Net income attributable to noncontrolling-interest shareholders | 36 | | 21 | | 81 | | 38 | |
| Distributions paid to noncontrolling-interest shareholders | Distributions paid to noncontrolling-interest shareholders | (71) | | (1) | | (82) | | (11) | |
| Distributions paid to noncontrolling-interest shareholders | |
| Distributions paid to noncontrolling-interest shareholders | |
Other comprehensive income (loss) attributable to noncontrolling-interest shareholders | |
Other comprehensive income (loss) attributable to noncontrolling-interest shareholders | |
Other comprehensive income (loss) attributable to noncontrolling-interest shareholders | Other comprehensive income (loss) attributable to noncontrolling-interest shareholders | 14 | | (53) | | 46 | | (82) | |
| Other | Other | (1) | | 2 | | 8 | | 1 | |
| Other | |
| Other | |
| Net change in noncontrolling interests | |
| Net change in noncontrolling interests | |
| Net change in noncontrolling interests | Net change in noncontrolling interests | $ | (21) | | $ | (32) | | $ | 54 | | $ | (88) | |
| Balance, end of period | Balance, end of period | $ | 703 | | $ | 612 | | $ | 703 | | $ | 612 | |
| Balance, end of period | |
| Balance, end of period | |
| Total equity | Total equity | $ | 209,422 | | $ | 199,626 | | $ | 209,422 | | $ | 199,626 | |
| Total equity | |
| Total equity | |
(1) See Note 1 for additional details.
(2) Common dividends declared were $0.53 per share for 1Q24 and $0.51 per share for each of the first and second quarters of 2023 and 2022.1Q23.
(3) Includes treasury stock related to (i) certain activity on employee stock option program exercises where the employee delivers existing shares to cover the option exercise, or (ii) under Citi’s employee restricted or deferred stock programs where shares are withheld to satisfy employees’ tax requirements.
(4) Primarily consists of open market purchases under Citi’s Board of Directors-approvedDirectors–approved common stock repurchase program.
The Notes to the Consolidated Financial Statements are an integral part of these Consolidated Financial Statements.
This page intentionally left blank.
| | | | | | | | |
| CONSOLIDATED STATEMENT OF CASH FLOWS | | Citigroup Inc. and Subsidiaries |
| (UNAUDITED) | | |
| | | | Six Months Ended June 30, | | Three Months Ended March 31, |
| In millions of dollars | In millions of dollars | 2023 | 2022 | In millions of dollars | 2024 | 2023 |
| Cash flows from operating activities of continuing operations | Cash flows from operating activities of continuing operations | | Cash flows from operating activities of continuing operations | |
| Net income before attribution of noncontrolling interests | Net income before attribution of noncontrolling interests | $ | 7,602 | | $ | 8,891 | |
| Net income attributable to noncontrolling interests | Net income attributable to noncontrolling interests | 81 | | 38 | |
| Citigroup’s net income | Citigroup’s net income | $ | 7,521 | | $ | 8,853 | |
| Income (loss) from discontinued operations, net of taxes | Income (loss) from discontinued operations, net of taxes | (2) | | (223) | |
| | Income from continuing operations—excluding noncontrolling interests | Income from continuing operations—excluding noncontrolling interests | $ | 7,523 | | $ | 9,076 | |
| Income from continuing operations—excluding noncontrolling interests | |
| Income from continuing operations—excluding noncontrolling interests | |
Adjustments to reconcile net income to net cash provided by (used in) operating activities
of continuing operations | Adjustments to reconcile net income to net cash provided by (used in) operating activities
of continuing operations | | Adjustments to reconcile net income to net cash provided by (used in) operating activities
of continuing operations | |
Net loss (gain) on sale of significant disposals(1) | Net loss (gain) on sale of significant disposals(1) | (1,059) | | — | |
| | Depreciation and amortization | Depreciation and amortization | 2,247 | | 2,089 | |
| Deferred income taxes(2) | (852) | | (228) | |
Provisions for credit losses and for benefits and claims(2) | 3,799 | | 2,029 | |
| Depreciation and amortization | |
| | Depreciation and amortization | |
| | Deferred income taxes | |
| Deferred income taxes | |
| Deferred income taxes | |
| Provisions for credit losses and for benefits and claims | |
| Realized gains from sales of investments | Realized gains from sales of investments | (121) | | (22) | |
| Impairment losses on investments and other assets | Impairment losses on investments and other assets | 157 | | 186 | |
| Goodwill impairment | — | | 535 | |
| | Change in trading account assets | |
| Change in trading account assets | |
| Change in trading account assets | Change in trading account assets | (89,164) | | (8,974) | |
| Change in trading account liabilities | Change in trading account liabilities | 17 | | 18,924 | |
| Change in brokerage receivables net of brokerage payables | Change in brokerage receivables net of brokerage payables | (6,443) | | 8,898 | |
| Change in loans held-for-sale (HFS) | Change in loans held-for-sale (HFS) | 1,405 | | 4,504 | |
| Change in other assets | Change in other assets | (4,884) | | (3,222) | |
| Change in other liabilities | (3,101) | | (2,117) | |
Other, net(2)(3) | 5,932 | | (17,434) | |
Change in other liabilities(2) | |
| Other, net | |
| Total adjustments | Total adjustments | $ | (92,067) | | $ | 5,168 | |
| Net cash provided by (used in) operating activities of continuing operations | Net cash provided by (used in) operating activities of continuing operations | $ | (84,544) | | $ | 14,244 | |
| Cash flows from investing activities of continuing operations | Cash flows from investing activities of continuing operations | | Cash flows from investing activities of continuing operations | |
| Change in securities borrowed and purchased under agreements to resell | Change in securities borrowed and purchased under agreements to resell | $ | 28,298 | | $ | (34,046) | |
| Change in loans | Change in loans | (8,750) | | (14,790) | |
Proceeds from divestitures(1) | — | | 1,940 | |
| | Proceeds from sales and securitizations of loans | |
| Proceeds from sales and securitizations of loans | |
| Proceeds from sales and securitizations of loans | Proceeds from sales and securitizations of loans | 2,154 | | 1,562 | |
Net payment due to transfer of net liabilities associated with divestitures(1) | Net payment due to transfer of net liabilities associated with divestitures(1) | (29) | | — | |
| Available-for-sale (AFS) debt securities | Available-for-sale (AFS) debt securities | |
Purchases of investments(2)(3) | (114,278) | | (123,569) | |
| Purchases of investments | |
| Purchases of investments | |
| Purchases of investments | |
| Proceeds from sales of investments | Proceeds from sales of investments | 29,897 | | 79,952 | |
Proceeds from maturities of investments(2)(3) | 105,204 | | 60,777 | |
| Proceeds from maturities of investments | |
| Held-to-maturity (HTM) debt securities | Held-to-maturity (HTM) debt securities | |
| Purchases of investments | |
| Purchases of investments | |
| Purchases of investments | Purchases of investments | (664) | | (34,317) | |
| Proceeds from maturities of investments | Proceeds from maturities of investments | 4,369 | | 5,821 | |
| | Capital expenditures on premises and equipment and capitalized software | Capital expenditures on premises and equipment and capitalized software | (3,125) | | (2,465) | |
Proceeds from sales of premises and equipment, subsidiaries and affiliates
and repossessed assets | 11 | | 31 | |
| Other, net(2)(3)(4) | (370) | | (1,710) | |
| | Capital expenditures on premises and equipment and capitalized software | |
| | Capital expenditures on premises and equipment and capitalized software | |
| Proceeds from sales of premises and equipment and repossessed assets | |
| | Other, net | |
| Other, net | |
| Other, net | |
| Net cash provided by (used in) investing activities of continuing operations | Net cash provided by (used in) investing activities of continuing operations | $ | 42,717 | | $ | (60,814) | |
| Cash flows from financing activities of continuing operations | Cash flows from financing activities of continuing operations | | | Cash flows from financing activities of continuing operations | | |
| Dividends paid | Dividends paid | $ | (2,547) | | $ | (2,514) | |
| Issuance of preferred stock | Issuance of preferred stock | 1,245 | | — | |
| Redemption of preferred stock | Redemption of preferred stock | — | | — | |
| | CONSOLIDATED STATEMENT OF CASH FLOWS | CONSOLIDATED STATEMENT OF CASH FLOWS | |
| (UNAUDITED) (Continued) | (UNAUDITED) (Continued) | |
| Six Months Ended June 30, |
| (UNAUDITED) (Continued) | |
| (UNAUDITED) (Continued) | |
| (UNAUDITED) (Continued) | |
| (UNAUDITED) (Continued) | |
| (UNAUDITED) (Continued) | |
| Three Months Ended March 31, | |
| Three Months Ended March 31, | |
| Three Months Ended March 31, | |
| Three Months Ended March 31, | |
| Three Months Ended March 31, | |
| Three Months Ended March 31, | |
| In millions of dollars | In millions of dollars | 2023 | 2022 | In millions of dollars | 2024 | 2023 |
| Treasury stock acquired | Treasury stock acquired | $ | (1,000) | | $ | (3,200) | |
| Stock tendered for payment of withholding taxes | Stock tendered for payment of withholding taxes | (322) | | (334) | |
| Change in securities loaned and sold under agreements to repurchase | Change in securities loaned and sold under agreements to repurchase | 57,591 | | 7,187 | |
| Issuance of long-term debt | Issuance of long-term debt | 32,689 | | 60,304 | |
| Payments and redemptions of long-term debt | Payments and redemptions of long-term debt | (35,984) | | (28,439) | |
| Change in deposits | Change in deposits | (46,087) | | 25,360 | |
| Change in short-term borrowings | Change in short-term borrowings | (6,666) | | 12,081 | |
| Net cash provided by (used in) financing activities of continuing operations | Net cash provided by (used in) financing activities of continuing operations | $ | (1,081) | | $ | 70,445 | |
| Effect of exchange rate changes on cash and due from banks | $ | (2,209) | | $ | (1,878) | |
| Effect of exchange rate changes on cash, due from banks and deposits with banks | |
| | | Change in cash, due from banks and deposits with banks | |
| | Change in cash, due from banks and deposits with banks | |
| | Change in cash, due from banks and deposits with banks | Change in cash, due from banks and deposits with banks | (45,117) | | 21,997 | |
| Cash, due from banks and deposits with banks at beginning of period | Cash, due from banks and deposits with banks at beginning of period | 342,025 | | 262,033 | |
| Cash, due from banks and deposits with banks at end of period | Cash, due from banks and deposits with banks at end of period | $ | 296,908 | | $ | 284,030 | |
| Cash and due from banks (including segregated cash and other deposits) | Cash and due from banks (including segregated cash and other deposits) | $ | 25,763 | | $ | 24,902 | |
| Deposits with banks, net of allowance | Deposits with banks, net of allowance | 271,145 | | 259,128 | |
| Cash, due from banks and deposits with banks at end of period | Cash, due from banks and deposits with banks at end of period | $ | 296,908 | | $ | 284,030 | |
| Supplemental disclosure of cash flow information for continuing operations | Supplemental disclosure of cash flow information for continuing operations | | Supplemental disclosure of cash flow information for continuing operations | |
| Cash paid during the period for income taxes | Cash paid during the period for income taxes | $ | 3,031 | | $ | 1,661 | |
| Cash paid during the period for interest | Cash paid during the period for interest | 31,803 | | 6,284 | |
Non-cash investing activities(1)(4)(5) | | |
Non-cash investing activities(1)(3)(4) | |
| | Transfer of investment securities from HTM to AFS | Transfer of investment securities from HTM to AFS | $ | 3,324 | | $ | — | |
| Transfer of investment securities from AFS to HTM | — | | 21,522 | |
| Decrease in net loans associated with divestitures reclassified to HFS | — | | 17,758 | |
| Decrease in goodwill associated with divestitures reclassified to HFS | — | | 873 | |
| | Transfer of investment securities from HTM to AFS | |
| | Transfer of investment securities from HTM to AFS | |
| Transfers to loans HFS (Other assets) from loans HFI | |
| Transfers to loans HFS (Other assets) from loans HFI | |
| | Transfers to loans HFS (Other assets) from loans HFI | Transfers to loans HFS (Other assets) from loans HFI | 4,730 | | 1,874 | |
Transfers from loans HFS (Other assets) to loans HFI | Transfers from loans HFS (Other assets) to loans HFI | 322 | | — | |
| Non-cash financing activities(1) | |
| Decrease in deposits associated with divestitures reclassified to HFS | $ | — | | $ | 20,741 | |
| Decrease in long-term debt associated with divestitures reclassified to HFS | — | | — | |
| |
(1) See Note 2 for further information on significant disposals.2.
(2) 2022 amounts have been revised to conformIncludes balances related to the current-period presentation.FDIC special assessment and restructuring charges. See Notes 9 and 27.
(3) Consistent with the revisions disclosed in “Statement of Cash Flows” in Note 1 to the Consolidated Financial Statements in Citi’s 2022 Form 10-K, during the six months ended June 30, 2022, $16.1 billion of cash flows related to maturities of short-term negotiable certificates of deposit (NCDs) and $41 million of cash flows related to purchases of short-term NCDs were reclassified from purchases and maturities of AFS securities within investing activities to Other, net within operating activities.
(4) In January 2023, Citi adopted ASU 2022-01. Upon adoption, Citi transferred $3.3 billion of mortgage-backed securities from HTM classification to AFS classification as allowed under the ASU. At the time of transfer, the securities were in an unrealized gain position of $0.1 billion, which was recorded in AOCI upon transfer. See Note 1.
(5)(4) Operating and finance lease right-of-use assets and lease liabilities represent non-cash investing and financing activities, respectively, and are not included in the non-cash investing activities presented here. See Note 2526 for more information and balances as of June 30, 2023.March 31, 2024.
The Notes to the Consolidated Financial Statements are an integral part of these Consolidated Financial Statements.
NOTES TO CONSOLIDATED FINANCIAL STATEMENTS (UNAUDITED)
1. BASIS OF PRESENTATION, UPDATED ACCOUNTING POLICIES AND ACCOUNTING CHANGES
Basis of Presentation
The accompanying unaudited Consolidated Financial Statements as of June 30, 2023March 31, 2024 and for the three-three months ended March 31, 2024 and six-month periods ended June 30, 2023 and 2022 include the accounts of Citigroup Inc. and its consolidated subsidiaries.
In the opinion of management, all adjustments, consisting of normal recurring adjustments, necessary for a fair presentation have been reflected. The accompanying unaudited Consolidated Financial Statements should be read in conjunction with the Consolidated Financial Statements and related notes included within Citigroup’s Annual Report on Form 10-K for the year ended December 31, 2022 (20222023 (2023 Form 10-K) and Citigroup’s Quarterly Report on Form 10-Q for the quarter ended March 31, 2023 (First Quarter of 2023 Form 10-Q).
Certain financial information that is normally included in annual financial statements prepared in accordance with U.S. generally accepted accounting principles (GAAP), but is not required for interim reporting purposes, has been condensed or omitted.
Management must make estimates and assumptions that affect the Consolidated Financial Statements and the related footnote disclosures. While management uses its best judgment, actual results could differ from those estimates.
As noted above, the Notes to these Consolidated Financial Statements are unaudited.
Throughout these Notes, “Citigroup,” “Citi” and “the Company” refer to Citigroup Inc. and its consolidated subsidiaries.
Certain reclassifications and updates have been made to the prior periods’ financial statements and notes to conform to the current period’s presentation.
Cash equivalents are defined as those amounts included in Cash and due from banks and predominately all of Deposits with banks. Cash flows from risk management activities are classified in the same category as the related assets and liabilities. Amounts included in Cash and due from banks and Deposits with banks approximate fair value.
UPDATED SIGNIFICANT ACCOUNTING POLICIESCHANGES
Fair Value Measurement of Equity Securities Subject to Contractual Sale Restrictions
In June 2022, the FASB issued ASU No. 2022-03, Fair Value Measurement (Topic 820): Fair Value Measurement of Equity Securities Subject to Contractual Sale Restrictions. The accounting policies below have been updated from those disclosedASU was issued to address diversity in Citi’s 2022 Annual Reportpractice whereby certain entities included the impact of contractual restrictions when valuing equity securities, and it clarifies that a contractual restriction on Form 10-K (2022 Form 10-K) asthe sale of an equity security should not be considered part of the unit of account of the equity security and, therefore, should not be considered in measuring fair value. The ASU also includes requirements for entities to disclose the fair value of equity securities subject to contractual sale restrictions, the nature and remaining duration of the restrictions and the circumstances that could cause a resultlapse in the restrictions.
Citi adopted the ASU on January 1, 2024, which did not impact the financial statements of accounting standards adopted during the first quarter of 2023.
See Note 1 to the Consolidated Financial Statements in Citi’s 2022 Form 10-K for a summary of all of Citigroup’s significant accounting policies.Company.
AllowancesAccounting for Investments in Tax Credit Losses (ACL)Structures
BeginningIn March 2023, the FASB issued ASU No. 2023‐02, Investments—Equity Method and Joint Ventures (Topic 323): Accounting for Investments in Tax Credit Structures Using the Proportional Amortization Method. The ASU expands the scope of tax equity investments eligible to apply the proportional amortization method of accounting. Under the proportional amortization method, the cost of an eligible investment is amortized in proportion to the income tax credits and other income tax benefits that are received by the investor, with the amortization of the investment and the income tax credits being presented net in the income statement as components of income tax expense (benefit). The ASU permits the Company to elect to use the proportional amortization method to account for an expanded range of eligible tax-incentivized investments if certain conditions are met. Citi adopted the ASU on January 1, 2023, Citi adopted Accounting Standards Update (ASU) No. 2022-02, Financial Instruments—Credit Losses (Topic 326): Troubled Debt Restructurings and Vintage Disclosures under the methodology described below. For information about Citi’s accounting for troubled debt restructurings (TDRs) prior to January 1, 2023, see Note 12024, which did not have a material impact to the Consolidated Financial Statements in Citi’s 2022 Form 10-K.financial statements of the Company.
ACCOUNTING CHANGES
TDRs and Vintage Disclosures
In March 2022, the FASB issued ASU No. 2022-02, Financial Instruments—Credit Losses (Topic 326): Troubled Debt Restructurings and Vintage Disclosures. Citi adopted the ASU on January 1, 2023. Citi adopted2023, including the guidance on the recognition and measurement of TDRs under the modified retrospective approach.
Adopting these amendments resulted in a decrease to the ACLL of $352 million and an increase in other assets related to held-for-sale businesses of $44 million, with a corresponding increase to retained earnings of $290 million and a decrease in deferred tax assets of $106 million on January 1, 2023. The ACL for corporate loans was unaffected because the measurement approach used for corporate loans is not in the scope of this ASU.
ASU 2022-02 eliminateseliminated the accounting and disclosure requirements for TDRs, including the requirement to measure the ACLL for TDRs using a discounted cash flow (DCF) approach. With the elimination of TDR accounting requirements, reasonably expected TDRs are no longer considered when determining the term over which to estimate expected credit losses. The ACLL for modified loans that are collateral dependent continues to be based on the fair value of the collateral.
Consumer Loans
Upon adoption of the ASU on January 1, 2023, Citi discontinued the use of a DCF approach for consumer loans formerly considered TDRs. Beginning January 1, 2023, Citi measures the ACLL for all consumer loans under approaches that do not incorporate discounting, primarily utilizing models that consider the borrowers’ probability of default, loss given default and exposure at default. In addition, upon adoption of the ASU, Citi collectively evaluates smaller-balance homogenoushomogeneous loans formerly considered TDRs for expected
credit losses, whereas previously those loans had been individually evaluated.
The ASU also requires disclosure of modifications of loans to borrowers experiencing financial difficulty if the modification involves principal forgiveness, an interest rate reduction, an other-than-insignificant payment delay, a term extension or a combination of those types of modifications. In addition, the ASU requires the disclosure of current-period gross write-offs by year of loan origination (vintage). The amendments related to disclosures are required to be applied prospectively beginning as of the date of adoption. See Note 13 for these new disclosures for periods beginning on and after January 1, 2023.
Long-Duration Insurance Contracts
In August 2018, the FASB issued ASU No. 2018-12, Financial Services—Insurance: Targeted Improvements to the Accounting for Long-Duration Contracts, which changes the existing recognition, measurement, presentation and disclosures for long-duration contracts issued by an insurance entity. Specifically, the guidance (i) improves the timeliness of recognizing changes in the liability for future policy benefits and prescribes the rate used to discount future cash flows for long-duration insurance contracts, (ii) simplifies and improves the accounting for certain market-based options or guarantees associated with deposit (or account balance) contracts, (iii) simplifies the amortization of deferred acquisition costs and (iv) introduces additional quantitative and qualitative disclosures. Citi has certain insurance subsidiaries, primarily in Mexico, that issue long-duration insurance contracts such as traditional life insurance policies and life-contingent annuity contracts that are impacted by the requirements of ASU 2018-12.
Citi adopted the targeted improvements in ASU 2018-12 on January 1, 2023, resulting in a $39 million decrease in Other liabilities and a $27 million increase in AOCI, after-tax.
Fair Value Hedging—Portfolio Layer Method
In March 2022, the FASB issued ASU No. 2022-01, Derivatives and Hedging (Topic 815): Fair Value Hedging—Portfolio Layer Method, intended to better align hedge accounting with an organization’s risk management strategies. Specifically, the guidance expands the current single-layer method to allow multiple hedge layers of a single closed portfolio of qualifying assets, which include both prepayable and non-prepayable assets. Upon the adoption of the guidance, entities may elect to reclassify securities held-to-maturity to the available-for-sale category provided that the reclassified securities are designated in a portfolio hedge. Coincident with the adoption of this ASU, on January 1, 2023, Citi transferred HTM mortgage-backed securities with an amortized cost and fair value of approximately $3.3 billion and $3.4 billion, respectively, into AFS as permitted under the guidance, and hedged them under the portfolio layer method.
FUTURE ACCOUNTING CHANGES
Accounting for Investments in Tax Credit Structuresand Disclosure of Crypto Assets
In MarchDecember 2023, the FASB issued ASU No. 2023‐02,2023-08, Investments—Equity MethodIntangibles—Goodwill and Joint Ventures (Topic 323)Other—Crypto Assets (Subtopic 350-60): Accounting for Investmentsand Disclosure of Crypto Assets, intended to improve the accounting for certain crypto assets by requiring an entity to measure those assets at fair value each reporting period, with changes in Tax Credit Structures Usingfair value recognized in net income. The amendments also improve the Proportional Amortization Method.information provided to investors about an entity’s crypto asset holdings by requiring disclosure about significant holdings, contractual sale restrictions and changes during the reporting period. The ASU expands the scope of tax equity investments eligible to apply the proportional amortization method of accounting. Under the proportional amortization method, the cost of an eligible investment is amortized in proportion to the income tax credits and other income tax benefits that are received by the investor, with the amortization of the investment and the income tax credits being presented net in the income statement as components of income tax expense (benefit). Prior to the issuance of this ASU, use of the proportional amortization method was limited to tax equity investments in Low‐Income Housing Tax Credit (LIHTC) structures, and all other tax equity investments were typically accounted for using the equity method of accounting, which resulted in investment income, gains and losses, and tax credits being presented gross on the income statement in their respective line items. The ASU will permit the Company to elect to use the proportional amortization method to account for all eligible tax equity investments, regardless of the tax credit program from which the income tax credits are received, if certain conditions are met. For public entities, the ASUguidance is effective for fiscal years beginning after December 15, 2023, although2024, and interim periods within those fiscal years with early adoption is permitted inpermitted. Citi does not hold any interim period. However, if an entity adoptscrypto assets within the amendments in an interim period, it shall adopt them asscope of the beginningguidance.
Income Taxes (Topic 740): Improvements to Income Tax Disclosures
In December 2023, the FASB issued ASU No. 2023-09, Income Taxes (Topic 740): Improvements to Income Tax Disclosures, intended to enhance the transparency and decision usefulness of income tax disclosures. This guidance requires that public business entities disclose on an annual basis a tabular rate reconciliation in eight specific categories disaggregated by nature and for foreign tax effects by jurisdiction that meet a 5% of pretax income multiplied by the applicable statutory tax rate or greater threshold annually. The eight categories include state and local income taxes, net of federal income tax effect; foreign tax effects; enactment of new tax laws or tax credits; effect of cross-border tax laws; valuation allowances; nontaxable items and nondeductible items; and changes in unrecognized tax benefits. Additional disclosures include qualitative description of the fiscal yearstate and local jurisdictions that includes that interim period. Adoptioncontribute to the majority (greater than 50%) of the ASU must be appliedeffect of the state and local income tax category and explanation of the nature and effect of changes in individual reconciling items. The guidance also requires entities annually to disclose income taxes paid (net of refunds received) disaggregated by federal, state and foreign taxes and
by jurisdiction identified based on either athe same 5% quantitative threshold.
The standard is effective for fiscal years beginning after December 15, 2024. The transition method is prospective with the retrospective or a modified retrospective basis.method permitted. Citi plans to adopt the ASU for the annual reporting period beginning on January 1, 2025, and is currently evaluating the impact on disclosures.
Segment Reporting (Topic 280): Improvements to Reportable Segment Disclosures
In November 2023, the FASB issued ASU No. 2023-07, Segment Reporting (Topic 280): Improvements to Reportable Segment Disclosures, intended to improve reportable segments disclosure requirements primarily through enhanced disclosures about significant segment expenses. The ASU includes a requirement to disclose significant segment expenses that are regularly provided to the chief operating decision maker (CODM) and included within each reported measure of segment profit or loss, the title and position of the CODM, an explanation of how the CODM uses the reported measure(s) of segment profit or loss in assessing segment performance and deciding how to allocate resources, and all segments’ profit or loss and assets disclosures currently required annually by Topic 280 along with those introduced by the ASU to be reported on an interim basis. The amendments also clarified that public entities are not precluded from reporting additional measures of a segment’s profit or loss that are regularly used by the CODM.
The ASU is required to be adopted on a retrospective basis and will be effective for Citi for its annual period ending December 31, 2024 and interim periods for the interim period beginning on January 1, 2025. Citi is currently evaluating the impact of the standard on tax equity investments. Citi does not expect a material impact to its resultsdisclosure of operations as a result of adopting the standard.reportable segments and related disclosures.
Fair Value Measurement of Equity Securities Subject to Contractual Sale Restrictions
In June 2022, the FASB issued ASU No. 2022-03, Fair Value Measurement (Topic 820): Fair Value Measurement of Equity Securities Subject to Contractual Sale Restrictions. The ASU was issued to address diversity in practice whereby certain entities included the impact of contractual restrictions when valuing equity securities, and it clarifies that a contractual restriction on the sale of an equity security should not be considered part of the unit of account of the equity security and, therefore, should not be considered in measuring fair value. The ASU also includes requirements for entities to disclose the fair value of equity securities subject to contractual sale restrictions, the nature and remaining duration of the restrictions and the circumstances that could cause a lapse in the restrictions.
The ASU is to be adopted on a prospective basis and will be effective for Citi on January 1, 2024, although early adoption is permitted. Adoption of the accounting standard is not expected to have an impact on Citi’s operating results or financial position, as the Company does not include such restrictions when valuing equity securities.
2. DISCONTINUED OPERATIONS, SIGNIFICANT DISPOSALS AND OTHER BUSINESS EXITS
Summary of Discontinued Operations
The Company’s results from Discontinued operations consisted of residual activities related to the sales of the Egg Banking plc credit card business in 2011 and the German retail banking business in 2008. All Discontinued operations results are recorded within Corporate/All Other.
The following table summarizes financial informationCompany’s Income (loss) from discontinued operations, net of taxes was $(1) million and $(1) million for all Discontinued operations:
| | | | | | | | | | | | | | |
| Three Months Ended June 30, | Six Months Ended June 30, |
| In millions of dollars | 2023 | 2022 | 2023 | 2022 |
| Total revenues, net of interest expense | $ | — | | $ | (262) | | $ | — | | $ | (262) | |
| Income (loss) from discontinued operations | $ | (1) | | $ | (262) | | $ | (2) | | $ | (264) | |
| | | | |
| Benefit for income taxes | — | | (41) | | — | | (41) | |
| Income (loss) from discontinued operations, net of taxes | $ | (1) | | $ | (221) | | $ | (2) | | $ | (223) | |
During the second quarter of 2022, the Company finalized the settlement of certain liabilities related to its legacy consumer operation in the U.K. (the legacy operation), including an indemnification liability related to its sale of the Egg Banking business in 2011, which led to the substantial liquidation of the legacy operation. As a result, a CTA loss (net of hedges) in AOCI of approximately $400 million pretax ($345 million after-tax) related to the legacy operation was released to earnings in the second quarter of 2022. Out of the total CTA release, a $260 million pretax loss ($221 million after-tax loss) was attributable to the Egg Banking business noted above, reported in Discontinued operations,three months ended March 31, 2024 and therefore the corresponding CTA release was also reported in Discontinued operations during the second quarter of 2022. The remaining CTA release of a $140 million pretax loss ($124 million after-tax loss) related to Legacy Holdings Assets was reported as part of Continuing operations within Legacy Franchises.
While the legacy operation was divested in multiple sales over the years, each transaction did not result in substantial liquidation given that Citi retained certain liabilities noted above, which were gradually settled over time until reaching the point of substantial liquidation during the second quarter of 2022, triggering the release of the CTA loss to earnings.
Cash flows from Discontinued operations were not material for the periods presented.
Significant Disposals
As of June 30, 2023,March 31, 2024, Citi had entered into sale agreements forclosed the sales of nine consumer banking businesses within All Other—Legacy Franchises.Franchises. Australia closed in the second quarter of 2022, the Philippines closed in the third quarter of 2022, Bahrain, Malaysia and Thailand closed in the fourth quarter of 2022, and India and Vietnam closed in the first quarter of 2023. Entry2023, Taiwan closed in the third quarter of sale agreements for the Taiwan2023 and Indonesia consumer banking businesses has resultedclosed in the reclassification to HFS on the Consolidated Balance Sheetfourth quarter of approximately $14 billion in assets within Other assets, including approximately $8 billion of loans (net of allowance of $68 million), and approximately $11 billion in liabilities within Other liabilities,including approximately $11 billion in deposits.2023. Of the nine sale agreements, the five below were identified as significant disposals asdisposals. The gains and losses included in the footnotes to the table below represent life-to-date amounts, which are periodically updated due to post-closing purchase price adjustments. As of June 30, 2023. The Taiwan sale has yetMarch 31, 2024, there were no remaining assets or liabilities included on Citi’s Consolidated Balance Sheet related to close and is subject to regulatory approvals and other closing conditions.the significant disposals:
| | | | | | | | | | | | | | | | | | | | | | | | | | | | | | | | | | | | | | |
| | | June 30, 2023 |
| In millions of dollars | | Assets | | Liabilities | |
| Consumer banking business in | Sale agreement date | Closing date | Cash and deposits with banks | Loans(1) | Goodwill | Other assets, advances to/from subsidiaries | Other assets | Total assets | Deposits | Long-term debt | Other liabilities | Total liabilities |
Australia(2) | 8/9/2021 | 6/1/2022 | $ | — | | $ | — | | $ | — | | $ | — | | $ | — | | $ | — | | $ | — | | $ | — | | $ | — | | $ | — | |
Philippines(3) | 12/23/2021 | 8/1/2022 | — | | — | | — | | — | | — | | — | | — | | — | | — | | — | |
Thailand(4) | 1/14/2022 | 11/1/2022 | $ | — | | $ | — | | $ | — | | $ | — | | $ | — | | $ | — | | $ | — | | $ | — | | $ | — | | $ | — | |
India(5) | 3/30/2022 | 3/1/2023 | — | | — | | — | | — | | — | | — | | — | | — | | — | | — | |
Taiwan(6) | 1/28/2022 | second half 2023 | $ | 96 | | $ | 7,652 | | $ | 196 | | $ | 4,441 | | $ | 185 | | $ | 12,570 | | $ | 9,657 | | $ | — | | $ | 236 | | $ | 9,893 | |
| | | | | | | | | | | | | | |
| Income (loss) before taxes(7) |
| Three Months Ended
June 30, | Six Months Ended June 30, |
| In millions of dollars | 2023 | 2022 | 2023 | 2022 |
Australia(2) | $ | — | | $ | 28 | | $ | — | | $ | 193 | |
Philippines(3) | — | | 14 | | — | | 65 | |
Thailand(4) | — | | 90 | | — | | 78 | |
India(5) | — | | 52 | | 2 | | 125 | |
Taiwan(6) | 35 | | 50 | | 91 | | 96 | |
| | | | | | | | | | | | | | | | | | | | | | | | | | |
| | | Income (loss) before taxes(6) | | | | | | | | | | | | |
| In millions of dollars | | Three Months Ended
March 31, | | | | | |
| Consumer banking business in | Sale agreement date | Closing date | 2024 | 2023 | | | | | | | | | | | | |
Australia(1) | 8/9/2021 | 6/1/2022 | $ | — | | $ | — | | | | | | | | | | | | | |
Philippines(2) | 12/23/2021 | 8/1/2022 | — | | — | | | | | | | | | | | | | |
Thailand(3) | 1/14/2022 | 11/1/2022 | — | | — | | | | | | | | | | | | | |
India(4) | 3/30/2022 | 3/1/2023 | — | | 2 | | | | | | | | | | | | | |
Taiwan(5) | 1/28/2022 | 8/12/2023 | — | | 57 | | | | | | | | | | | | | |
(1) Loans, net of allowance as of June 30, 2023 includes $31 million for Taiwan.
(2) On June 1, 2022, Citi completed the sale of its Australia consumer banking business, which was part of All Other—Legacy Franchises. The business had approximately $9.4 billion in assets, including $9.3 billion of loans (net of allowance of $140 million) and excluding goodwill. The total amount of liabilities was $7.3 billion, including $6.8 billion in deposits. The transaction generated a pretax loss on sale of approximately $760$766 million ($640643 million after-tax), subject to closing adjustments, recorded in Other revenue. The loss on sale primarily reflected the impact of an approximate pretax $620 million CTA loss (net of hedges) ($470 million after-tax) already reflected in the AOCI component of equity. The sale closed on June 1, 2022, and the CTA-related balance was removed from AOCI, resulting in a neutral CTA impact to Citi’s CET1 Capital. The income before taxes shown in the above table for Australia reflects Citi’s ownership through June 1, 2022.
(3)(2) On August 1, 2022, Citi completed the sale of its Philippines consumer banking business, which was part of All Other—Legacy Franchises. The business had approximately $1.8 billion in assets, including $1.2 billion of loans (net of allowance of $80 million) and excluding goodwill. The total amount of liabilities was $1.3 billion, including $1.2 billion in deposits. The sale resulted in a pretax gain on sale of approximately $618 million ($290 million after-tax), subject to closing adjustments, recorded in Other revenue. The income before taxes shown in the above table for the Philippines reflects Citi’s ownership through August 1, 2022.
(4)(3) On November 1, 2022, Citi completed the sale of its Thailand consumer banking business, which was part of All Other—Legacy Franchises. The business had approximately $2.7 billion in assets, including $2.4 billion of loans (net of allowance of $67 million) and excluding goodwill. The total amount of liabilities was $1.0 billion, including $0.8 billion in deposits. The sale resulted in a pretax gain on sale of approximately $209 million ($115 million after-tax), subject to closing adjustments, recorded in Other revenue. The income before taxes shown in the above table for Thailand reflects Citi’s ownership through November 1, 2022.
(5)(4) On March 1, 2023, Citi completed the sale of its India consumer banking business, which was part of All Other—Legacy Franchises. The business had approximately $5.2 billion in assets, including $3.4 billion of loans (net of allowance of $32 million) and excluding goodwill. The total amount of liabilities was $5.2 billion, including $5.1 billion in deposits. The sale resulted in a pretax gain on sale of approximately $1.1$1.0 billion ($727717 million after-tax), subject to closing adjustments, recorded in Other revenue. The income before taxes shown in the above table for India reflects Citi’s ownership through March 1, 2023.
(6) This(5) On August 12, 2023, Citi completed the sale is expectedof its Taiwan consumer banking business, which was part of All Other—Legacy Franchises. The business had approximately $11.6 billion in assets, including $7.2 billion of loans (net of allowance of $92 million) and excluding goodwill. The total amount of liabilities was $9.2 billion, including $9.0 billion in deposits. The sale resulted in a pretax gain on sale of approximately $403 million ($284 million after-tax), subject to resultclosing adjustments, recorded in an after-tax gain upon closing.Other revenue. The income before taxes in the above table for Taiwan reflects Citi’s ownership through August 12, 2023.
(7)(6) Income before taxes for the period in which the individually significant component was classified as HFS for all prior periods presented. For Australia, excludes the pretax loss on sale. For the Philippines, Thailand, India and India,Taiwan, excludes the pretax gain on sale.
Citi did not have any other significant disposals as of June 30, 2023. March 31, 2024.
As of August 4, 2023,May 3, 2024, Citi had not entered into sale agreements for the remaining All Other—Legacy Franchises businesses to be sold, specifically the Poland consumer banking business and the Mexico Consumer/SBMM businesses.
For a description of the Company’s significant disposal transactions in prior periods and financial impact, see Note 2 to the Consolidated Financial Statements in Citi’s 20222023 Form 10-K.
Other Business Exits
Wind-Down of Korea Consumer Banking Business
On October 25, 2021, Citi disclosed its decision to wind down and close its Korea consumer banking business, which is reported in the All Other—Legacy Franchises operating segment. In connection with the announcement, Citibank Korea Inc. (CKI) commenced a voluntary early termination program (Korea VERP). Due to the voluntary nature of this termination program, no liabilities for termination benefits are recorded until CKI makes formal offers to employees that are then irrevocably accepted by those employees. Related charges are recorded as Compensation and benefits.
The following table summarizes the reserve charges related to the Korea VERP and other initiatives reported in the Legacy FranchisesAll Other operating segment and Corporate/Other:segment:
| | | | | |
| In millions of dollars | Employee termination costs |
| Total Citigroup (pretax) | |
| Original charges in fourth quarter 2021 | $ | 1,052 | |
| Utilization | (1) | |
| Foreign exchange | 3 | |
| Balance at December 31, 2021 | $ | 1,054 | |
| Additional charges in first quarter 2022 | $ | 31 | |
| Utilization | (347) | |
| Foreign exchange | (24) | |
| Balance at March 31, 2022 | $ | 714 | |
| Additional charges (releases) | $ | (3) | |
| Utilization | (670) | |
| Foreign exchange | (41) | |
| Balance at June 30, 2022 | $ | — | |
Note: There were no additional charges after June 30, 2022.
The total cash charges for the wind-down were $1.1 billion through 2022, most of which were recognized in 2021. Citi does not expect to record any additional charges in connection with the Korea VERP.
See Note 8 to the Consolidated Financial Statements in Citi’s 20222023 Form 10-K for details on the pension impact of the Korea wind-down.
Wind-Down of Russia Consumer and Institutional Banking Businesses
On August 25, 2022, Citi announced its decision to wind down its consumer banking and local commercial banking operations in Russia. As part of the wind-down, Citi is also actively pursuing sales of certain Russian consumer banking portfolios.
On October 14, 2022, Citi disclosed that it will be endingwould end nearly all of the institutional banking services it offersoffered in Russia by the end of the first quarter of 2023. Going forward, Citi’s only operations in Russia will beare those necessary to fulfill its remaining legal and regulatory obligations.
On December 12, 2022, Citi completed the sale of a portfolio of ruble-denominated personal installment loans, totaling approximately $240 million in outstanding loan balances, to Uralsib, a Russian commercial bank, resulting in a pretax net loss of approximately $12 million. The net loss on sale of the loan portfolio included a $32 million adjustment to record the loans at lower of cost or fair value recognized in
Portfolio Sales
Other revenue. In addition, the sale of the loans resulted in a release in the allowance for credit losses on loans of approximately $20 million recognized in the Provision for credit losses on loans.
•During the second quarter of 2023, Citi recorded an incremental gain of $5 million related to post-closing contingency payments for the previously disclosed personal installment loan sale in Other revenue. The previously disclosed sale of a portfolio of ruble-denominated personal installment loans resulted in a pretax net loss on sale of approximately $7 million.
Citi’s•During the third and fourth quarters of 2023 and the first quarter of 2024, as part of the previously disclosed cards referral agreement with a Russian bank, to settle a portfolioapproximately $52 million of ruble-denominated credit card loans, subject to customer consents, was signed in May 2023 and is in the execution phase. The outstanding amount with Citi is to bereceivables were settled upon referral and refinancing. As a result, the portfolio will remain held-for-investment and will not be transferred to held-for-sale.refinanced.
During the second quarter of 2023, Citi recorded a pretax release of approximately $1 million and a pretax charge of approximately $2 million (approximately $29 million and $12 million program-to-date) as
Wind-Down Charges
The following tables provide details on Citi’s Russia wind-down charges:
| | | | | | | | | | | |
| Three Months Ended
March 31, 2024 |
| In millions of dollars | All Other | Services, Markets and Banking | Total |
Severance(1) | $ | 1 | | $ | 2 | | $ | 3 | |
Vendor termination and other costs(2) | — | | — | | — | |
| Total | $ | 1 | | $ | 2 | | $ | 3 | |
| | | | | | | | | | | | |
| Program-to-date
March 31, 2024 | |
| In millions of dollars | All Other | Services, Markets and Banking | Total | |
Severance(1) | $ | 36 | | $ | 10 | | $ | 46 | | |
Vendor termination and other costs(2) | 19 | | — | | 19 | | |
| Total | $ | 55 | | $ | 10 | | $ | 65 | | |
| | | | | | | | | | | |
| Estimated additional charges
as of March 31, 2024 |
| In millions of dollars | All Other | Services, Markets and Banking | Total |
Severance(1) | $ | 20 | | $ | 1 | | $ | 21 | |
Vendor termination and other costs(2) | 33 | | — | | 33 | |
| Total | $ | 53 | | $ | 1 | | $ | 54 | |
(1) Recorded in Compensation and benefits benefits.
composed of severance costs, reported(2) Recorded inLegacy Franchises and Institutional Clients Group, respectively. Citi also recorded a pretax charge of approximately $4 million (approximately $17 million program-to-date) as Other operating expenses composed of vendor termination and other costs, reported in Legacy Franchises.
In connection with this wind-down, Citi expects to incur approximately $180 million in total estimated charges ($40 million in ICG and $140 million in Legacy Franchises, excluding the impact from any portfolio sales), of which approximately $58 million has been incurred program-to-date, largely driven by restructuring, vendor termination fees and other related charges.expenses.
3. OPERATING SEGMENTS
The operating segments and reporting units reflect how the CEO, who is the chief operating decision maker (CODM), manages the Company, including allocating resources and measuring performance.
Citigroup’s activities are conducted through threeCiti is organized into five reportable operating segments: Institutional Clients Group (ICG)Services,Markets, Banking, U.S. Personal Banking and Wealth Management (PBWM) and(USPB) Legacy Franchisesand Wealth, with the remaining operations recorded in All Otherwith Corporate/Other including, which includes activities not assigned to a specific reportable operating segment, as well as discontinued operations. See operating segment details in Note 3 to the Consolidated Financial Statements in Citi’s 2023 Form 10-K.
ICG consists of Services, Markets and Banking, providing corporate, institutional and public sector clients around the world with a full range of wholesale banking products and services.
PBWM consists of U.S. Personal Banking and Global Wealth Management (Global Wealth), providing traditional banking services and credit cards to retail and small business customers primarilyBeginning in the U.S., and financial services to clients from affluent to ultra-high-net-worth through banking, lending, mortgages, investment, custody and trust product offerings in 20 countries, including the U.S., Mexico and the four wealth management centers: Singapore, Hong Kong, the UAE and London.first quarter of 2024, Citi reallocated certain customer balances between
All Other—Legacy Franchises, consistsServices, Markets and Banking in preparation for the IPO of Asia Consumer andthe Mexico Consumer/SBMM businesses that Citi intendsoperations, and made other immaterial reclassifications. These reallocations and reclassifications did not materially change segment results and prior periods were conformed to exit, and its remaining Legacy Holdings Assets.reflect these changes. Citi's consolidated results remain unchanged for all periods presented.
Corporate/Other includes activities not assigned to the operating segments, including certain unallocated costs of global functions, other corporate expenses and corporate treasury results, offsets to certain line-item reclassifications and eliminations, and unallocated taxes, as well as discontinued operations.
Revenues and expenses directly associated with each respective business segment or component are included in determining respective operating results. Other revenues and expenses that are not directly attributable to a particular business segment or component are generally allocated from Corporate/All Other based on respective net revenues, non-interest expenses or other relevant measures.
As a result of revenuesRevenues and expenses from transactions with other operating segments or components beingare treated as transactions with external parties for purposes of segment disclosures, thewhile funding charges paid by operating segments and funding credits received by Corporate Treasury within All Other are included in net interest income. The Company includes intersegment eliminations within Corporate/All Other to reconcile the businessoperating segment results to Citi’s consolidated results.
The accounting policies of these reportable operating segments are the same as those disclosed in Note 1 to the Consolidated Financial Statements in Citi’s 20222023 Form 10-K.
The following tables present certain information regarding the Company’s continuing operations by reportable operating segmentsegments and Corporate/All Other:on a managed basis that excludes divestiture-related impacts. Performance measurement is based on Income (loss) from continuing operations. These results are used by the CODM, both in evaluating the performance of, and in allocating resources to, each of the segments:
| | Three Months Ended June 30, |
| Three Months Ended March 31, | | | Three Months Ended March 31, |
| In millions of dollars, except identifiable assets, average loans and average deposits in billions | In millions of dollars, except identifiable assets, average loans and average deposits in billions | ICG | PBWM | Legacy Franchises | Corporate/Other | Total Citi | In millions of dollars, except identifiable assets, average loans
and average deposits in billions | Services | Markets | Banking | USPB |
| 2023 | 2022 | 2023 | 2022 | 2023 | 2022 | 2023 | 2022 | 2023 | 2022 | 2024 | 2023 | 2024 | 2023 | 2024 | 2023 | 2024 | 2023 |
| Net interest income | Net interest income | $ | 5,623 | | $ | 4,520 | | $ | 5,963 | | $ | 5,569 | | $ | 1,345 | | $ | 1,474 | | $ | 969 | | $ | 401 | | $ | 13,900 | | $ | 11,964 | |
| Non-interest revenue | Non-interest revenue | 4,818 | | 6,899 | | 432 | | 460 | | 578 | | 461 | | (292) | | (146) | | 5,536 | | 7,674 | |
| Total revenues, net of interest expense | Total revenues, net of interest expense | $ | 10,441 | | $ | 11,419 | | $ | 6,395 | | $ | 6,029 | | $ | 1,923 | | $ | 1,935 | | $ | 677 | | $ | 255 | | $ | 19,436 | | $ | 19,638 | |
| Operating expense | 7,286 | | 6,434 | | 4,204 | | 3,985 | | 1,778 | | 1,814 | | 302 | | 160 | | 13,570 | | 12,393 | |
| Provisions (releases) for credit losses | 58 | | (202) | | 1,579 | | 1,355 | | 300 | | 121 | | (113) | | — | | 1,824 | | 1,274 | |
| Income (loss) from continuing operations before taxes | $ | 3,097 | | $ | 5,187 | | $ | 612 | | $ | 689 | | $ | (155) | | $ | — | | $ | 488 | | $ | 95 | | $ | 4,042 | | $ | 5,971 | |
| Provisions for credit losses and for benefits and claims | |
| Provision (benefits) for income taxes | Provision (benefits) for income taxes | 878 | | 1,209 | | 118 | | 136 | | (33) | | 15 | | 127 | | (178) | | 1,090 | | 1,182 | |
| Income (loss) from continuing operations | Income (loss) from continuing operations | $ | 2,219 | | $ | 3,978 | | $ | 494 | | $ | 553 | | $ | (122) | | $ | (15) | | $ | 361 | | $ | 273 | | $ | 2,952 | | $ | 4,789 | |
| Identifiable assets (June 30, 2023 and December 31, 2022) | $ | 1,765 | | $ | 1,730 | | $ | 473 | | $ | 494 | | $ | 92 | | $ | 97 | | $ | 94 | | $ | 96 | | $ | 2,424 | | $ | 2,417 | |
Identifiable assets (March 31, 2024 and December 31, 2023) | |
| Average loans | Average loans | 278 | | 297 | | 339 | | 317 | | 37 | | 43 | | — | | — | | 654 | | 657 | |
| Average deposits | Average deposits | 837 | | 830 | | 431 | | 435 | | 51 | | 51 | | 19 | | 7 | | 1,338 | | 1,323 | |
| | Six Months Ended June 30, |
| In millions of dollars, except average loans and average deposits in billions | ICG | PBWM | Legacy Franchises | Corporate/Other | Total Citi |
| 2023 | 2022 | 2023 | 2022 | 2023 | 2022 | 2023 | 2022 | 2023 | 2022 |
| Wealth | |
| | Wealth | | | Wealth | All Other(1) | Reconciling Items(1) | Total Citi |
| 2024 | 2023 | 2024 | 2023 | 2024 | 2023 | 2024 | 2023 |
| Net interest income | Net interest income | $ | 10,651 | | $ | 8,304 | | $ | 11,897 | | $ | 10,954 | | $ | 2,635 | | $ | 2,982 | | $ | 2,065 | | $ | 595 | | $ | 27,248 | | $ | 22,835 | |
| Non-interest revenue | Non-interest revenue | 11,023 | | 14,275 | | 946 | | 980 | | 2,140 | | 884 | | (474) | | (150) | | 13,635 | | 15,989 | |
| Total revenues, net of interest expense | Total revenues, net of interest expense | $ | 21,674 | | $ | 22,579 | | $ | 12,843 | | $ | 11,934 | | $ | 4,775 | | $ | 3,866 | | $ | 1,591 | | $ | 445 | | $ | 40,883 | | $ | 38,824 | |
| Operating expense | 14,259 | | 13,157 | | 8,458 | | 7,874 | | 3,530 | | 4,107 | | 612 | | 420 | | 26,859 | | 25,558 | |
| Provisions for credit losses | (14) | | 769 | | 3,170 | | 979 | | 645 | | 281 | | (2) | | — | | 3,799 | | 2,029 | |
| Income (loss) from continuing operations before taxes | $ | 7,429 | | $ | 8,653 | | $ | 1,215 | | $ | 3,081 | | $ | 600 | | $ | (522) | | $ | 981 | | $ | 25 | | $ | 10,225 | | $ | 11,237 | |
| Provisions for credit losses and for benefits and claims | |
| Provision (benefits) for income taxes | Provision (benefits) for income taxes | 1,912 | | 2,017 | | 232 | | 668 | | 116 | | (122) | | 361 | | (440) | | 2,621 | | 2,123 | |
| Income (loss) from continuing operations | Income (loss) from continuing operations | $ | 5,517 | | $ | 6,636 | | $ | 983 | | $ | 2,413 | | $ | 484 | | $ | (400) | | $ | 620 | | $ | 465 | | $ | 7,604 | | $ | 9,114 | |
Identifiable assets (March 31, 2024 and December 31, 2023) | |
| Average loans | Average loans | $ | 281 | | $ | 293 | | $ | 336 | | $ | 315 | | $ | 37 | | $ | 45 | | $ | — | | $ | — | | $ | 654 | | $ | 653 | |
| Average deposits | Average deposits | 845 | | 828 | | 433 | | 441 | | 51 | | 53 | | 22 | | 6 | | 1,351 | | 1,328 | |
|
(1) Segment results are presented on a managed basis that excludes divestiture-related impacts related to (i) Citi’s divestitures of its Asia consumer banking businesses and (ii) the planned IPO of Mexico consumer banking and small business and middle-market banking within All Other—Legacy Franchises. Adjustments are included in Legacy Franchises within All Other and are reflected in the reconciliations above to arrive at Citi’s reported results in the Consolidated Statement of Income.
The following table presents a reconciliation of total Citigroup income from continuing operations as reported:
| | | | | | | | | | |
| Three Months Ended March 31, | |
| In millions of dollars | 2024(1) | 2023(2) | | |
Total segments and All Other—income from continuing operations(3) | $ | 3,502 | | $ | 4,004 | | | |
| Divestiture-related impact on: | | | | |
| Total revenues, net of interest expense | (12) | | 1,018 | | | |
| Total operating expenses | 110 | | 73 | | | |
| Provision (release) for credit losses | 11 | | (8) | | | |
| Provision (benefits) for income taxes | (39) | | 305 | | | |
| Income from continuing operations | $ | 3,408 | | $ | 4,652 | | | |
(1) The three months ended March 31, 2024 includes approximately $110 million in operating expenses (approximately $77 million after-tax), primarily related to separation costs in Mexico and severance costs in the Asia exit markets.
(2) The three months ended March 31, 2023 includes an approximate $1.059 billion gain on sale recorded in revenue (approximately $727 million after various taxes) related to Citi’s sale of the India consumer banking business. For additional information, see Citi’s Quarterly Report on Form 10-Q for the period ended March 31, 2023.
(3) Segment results are presented on a managed basis that excludes divestiture-related impacts related to (i) Citi’s divestitures of its Asia consumer banking businesses and (ii) the planned IPO of Mexico consumer banking and small business and middle-market banking within All Other—Legacy Franchises. Adjustments are included in Legacy Franchises within All Other and are reflected in the reconciliations above to arrive at Citi’s reported results in the Consolidated Statement of Income.
4. INTEREST REVENUEINCOME AND EXPENSE
Interest revenueincome and Interest expense consisted of the following:
| | Three Months Ended June 30, | Six Months Ended June 30, |
| Three Months Ended March 31, | |
| Three Months Ended March 31, | |
| Three Months Ended March 31, | |
| In millions of dollars | In millions of dollars | 2023 | 2022 | 2023 | 2022 |
| Interest revenue | | | |
| In millions of dollars | |
| In millions of dollars | |
| Interest income | |
| Interest income | |
| Interest income | |
| Consumer loans | |
| Consumer loans | |
| Consumer loans | Consumer loans | $ | 8,962 | | $ | 6,601 | | $ | 17,586 | | $ | 12,863 | |
| Corporate loans | Corporate loans | 5,094 | | 2,894 | | 9,753 | | 5,348 | |
| Corporate loans | |
| Corporate loans | |
| Loan interest, including fees | |
| Loan interest, including fees | |
| Loan interest, including fees | Loan interest, including fees | $ | 14,056 | | $ | 9,495 | | $ | 27,339 | | $ | 18,211 | |
| Deposits with banks | Deposits with banks | 3,049 | | 658 | | 6,080 | | 954 | |
| Deposits with banks | |
| Deposits with banks | |
| Securities borrowed and purchased under agreements to resell | |
| Securities borrowed and purchased under agreements to resell | |
| Securities borrowed and purchased under agreements to resell | Securities borrowed and purchased under agreements to resell | 6,254 | | 805 | | 11,428 | | 1,199 | |
| Investments, including dividends | Investments, including dividends | 4,451 | | 2,370 | | 8,595 | | 4,420 | |
| Investments, including dividends | |
| Investments, including dividends | |
Trading account assets(1) | |
Trading account assets(1) | |
Trading account assets(1) | Trading account assets(1) | 3,752 | | 1,659 | | 6,499 | | 2,805 | |
Other interest-earning assets(2) | Other interest-earning assets(2) | 1,085 | | 643 | | 2,101 | | 1,192 | |
| Total interest revenue | $ | 32,647 | | $ | 15,630 | | $ | 62,042 | | $ | 28,781 | |
Other interest-earning assets(2) | |
Other interest-earning assets(2) | |
| Total interest income | |
| Total interest income | |
| Total interest income | |
| Interest expense | |
| Interest expense | |
| Interest expense | Interest expense | | | |
| Deposits | Deposits | $ | 8,727 | | $ | 1,420 | | $ | 16,435 | | $ | 2,291 | |
| Deposits | |
| Deposits | |
| Securities loaned and sold under agreements to repurchase | |
| Securities loaned and sold under agreements to repurchase | |
| Securities loaned and sold under agreements to repurchase | Securities loaned and sold under agreements to repurchase | 4,953 | | 655 | | 8,519 | | 937 | |
Trading account liabilities(1) | Trading account liabilities(1) | 870 | | 137 | | 1,657 | | 284 | |
Trading account liabilities(1) | |
Trading account liabilities(1) | |
Short-term borrowings and other interest-bearing liabilities(3) | |
Short-term borrowings and other interest-bearing liabilities(3) | |
Short-term borrowings and other interest-bearing liabilities(3) | Short-term borrowings and other interest-bearing liabilities(3) | 1,777 | | 268 | | 3,426 | | 323 | |
| Long-term debt | Long-term debt | 2,420 | | 1,186 | | 4,757 | | 2,111 | |
| Long-term debt | |
| Long-term debt | |
| Total interest expense | |
| Total interest expense | |
| Total interest expense | Total interest expense | $ | 18,747 | | $ | 3,666 | | $ | 34,794 | | $ | 5,946 | |
| Net interest income | Net interest income | $ | 13,900 | | $ | 11,964 | | $ | 27,248 | | $ | 22,835 | |
| Net interest income | |
| Net interest income | |
| Provision for credit losses on loans | |
| Provision for credit losses on loans | |
| Provision for credit losses on loans | Provision for credit losses on loans | 1,761 | | 1,384 | | 3,498 | | 1,644 | |
| Net interest income after provision for credit losses on loans | Net interest income after provision for credit losses on loans | $ | 12,139 | | $ | 10,580 | | $ | 23,750 | | $ | 21,191 | |
| Net interest income after provision for credit losses on loans | |
| Net interest income after provision for credit losses on loans | |
(1)Interest expense on Trading account liabilities of ICGServices, Markets and Banking is reported as a reduction of Interest revenueincome. Interest revenueincome and Interest expense on cash collateral positions are reported in interest on Trading account assets and Trading account liabilities, respectively.
(2)Includes assets from businesses held-for-sale (see Note 2) and Brokerage receivables.
(3)Includes liabilities from businesses held-for-sale (see Note 2) and Brokerage payables.
5. COMMISSIONS AND FEES; ADMINISTRATION AND OTHER FIDUCIARY FEES
For additional information on Citi’s commissionsThe primary components of Commissions and fees revenue are investment banking fees, brokerage commissions, credit card and administrationbank card income, deposit-related fees and other fiduciary fees, seetransactional service fees. See Note 3 for segment results and Note 5 to the Consolidated Financial Statements in Citi’s 20222023 Form 10-K.10-K for additional information on Citi’s commissions and fees.
The following tables presenttable presents Commissions and fees revenue:
| | | | | | | | | | | | | | | | | | | | | | | | | | | | |
| Three Months Ended June 30, 2023 | Six Months Ended June 30, 2023 |
| In millions of dollars | ICG | PBWM | Legacy Franchises | | Total | ICG | PBWM | Legacy Franchises | | Total |
| Investment banking | $ | 598 | | $ | — | | $ | — | | | $ | 598 | | $ | 1,324 | | $ | — | | $ | — | | | $ | 1,324 | |
| Brokerage commissions | 360 | | 182 | | 34 | | | 576 | | 774 | | 359 | | 78 | | | 1,211 | |
| Credit and bank card income | | | | | | | | | | |
| Interchange fees | 361 | | 2,555 | | 164 | | | 3,080 | | 694 | | 4,902 | | 334 | | | 5,930 | |
| Card-related loan fees | 17 | | 37 | | 66 | | | 120 | | 30 | | 80 | | 128 | | | 238 | |
Card rewards and partner payments(1) | (202) | | (2,904) | | (91) | | | (3,197) | | (376) | | (5,567) | | (183) | | | (6,126) | |
Deposit-related fees(2) | 272 | | 18 | | 9 | | | 299 | | 524 | | 58 | | 17 | | | 599 | |
| Transactional service fees | 303 | | 6 | | 25 | | | 334 | | 592 | | 10 | | 50 | | | 652 | |
Corporate finance(3) | 86 | | — | | — | | | 86 | | 185 | | 3 | | — | | | 188 | |
| Insurance distribution revenue | — | | 61 | | 27 | | | 88 | | — | | 119 | | 61 | | | 180 | |
| Insurance premiums | — | | 1 | | 25 | | | 26 | | — | | 2 | | 46 | | | 48 | |
| Loan servicing | 8 | | 11 | | 4 | | | 23 | | 17 | | 26 | | 7 | | | 50 | |
| Other | 1 | | 51 | | 48 | | | 99 | | 7 | | 107 | | 89 | | | 204 | |
Total commissions and fees(4) | $ | 1,804 | | $ | 18 | | $ | 311 | | | $ | 2,132 | | $ | 3,771 | | $ | 99 | | $ | 627 | | | $ | 4,498 | |
| | | | | | | | | | | | | | | | | | | | | | | | | | | | |
| Three Months Ended June 30, 2022 | Six Months Ended June 30, 2022 |
| In millions of dollars | ICG | PBWM | Legacy Franchises | | Total | ICG | PBWM | Legacy Franchises | | Total |
| Investment banking | $ | 845 | | $ | — | | $ | — | | | $ | 845 | | $ | 1,753 | | $ | — | | $ | — | | | $ | 1,753 | |
| Brokerage commissions | 393 | | 213 | | 53 | | | 659 | | 853 | | 454 | | 121 | | | 1,428 | |
| Credit and bank card income | | | | | | | | | | |
| Interchange fees | 321 | | 2,435 | | 227 | | | 2,983 | | 561 | | 4,534 | | 448 | | | 5,543 | |
| Card-related loan fees | 11 | | 73 | | 79 | | | 163 | | 20 | | 137 | | 160 | | | 317 | |
Card rewards and partner payments(1) | (165) | | (2,871) | | (160) | | | (3,196) | | (282) | | (5,370) | | (332) | | | (5,984) | |
Deposit-related fees(2) | 279 | | 44 | | 19 | | | 342 | | 546 | | 103 | | 36 | | | 685 | |
| Transactional service fees | 267 | | 5 | | 26 | | | 298 | | 521 | | 9 | | 52 | | | 582 | |
Corporate finance(3) | 136 | | — | | — | | | 136 | | 252 | | 3 | | — | | | 255 | |
| Insurance distribution revenue | — | | 56 | | 33 | | | 89 | | — | | 108 | | 69 | | | 177 | |
| Insurance premiums | — | | 1 | | 22 | | | 23 | | — | | 2 | | 46 | | | 48 | |
| Loan servicing | 7 | | 12 | | 4 | | | 23 | | 19 | | 22 | | 7 | | | 48 | |
| Other | 3 | | 49 | | 35 | | | 87 | | 2 | | 97 | | 69 | | | 168 | |
Total commissions and fees(4) | $ | 2,097 | | $ | 17 | | $ | 338 | | | $ | 2,452 | | $ | 4,245 | | $ | 99 | | $ | 676 | | | $ | 5,020 | |
| | | | | | | | | | |
| Three Months Ended March 31, | |
| In millions of dollars | 2024 | 2023 | | |
Investment banking(1) | $ | 873 | | $ | 726 | | | |
Brokerage commissions(2) | 619 | | 637 | | | |
Credit and bank card income(3) | | | | |
| Interchange fees | 2,911 | | 2,849 | | | |
| Card-related loan fees | 130 | | 118 | | | |
Card rewards and partner payments(4) | (2,917) | | (2,928) | | | |
Deposit-related fees(5) | 340 | | 299 | | | |
Transactional service fees(6) | 340 | | 319 | | | |
Corporate finance(7) | 199 | | 102 | | | |
Insurance distribution revenue(8) | 84 | | 92 | | | |
Insurance premiums(9) | 25 | | 22 | | | |
| Loan servicing | 14 | | 28 | | | |
| Other | 106 | | 102 | | | |
Total(10) | $ | 2,724 | | $ | 2,366 | | | |
(1) Investment banking fees are earned primarily by Banking and Markets. For the periods presented, the contract liability amount was negligible.
(2) Brokerage commissions are earned primarily by Markets and Wealth. The Company recognized $108 million and $116 million of revenue related to variable consideration for the three months ended March 31, 2024 and 2023, respectively. These amounts primarily relate to performance obligations satisfied in prior periods.
(3) Credit card and bank card income is earned primarily by USPB and Services.
(4) As described above, Citi’s consumer credit card programs have certain partner sharing agreements that vary by partner. These agreements are subject to contractually based performance thresholds that, if met, would require Citi to make ongoing payments to the partner. The threshold is based on the profitability of a program and is generally calculated based on predefined program revenues less predefined program expenses. In most of Citi’s partner sharing agreements, program expenses include net credit losses and, to the extent that an increase in net credit losses reduces Citi’s liability for the partners’ share for a given program year, would generally result in lower payments to partners in total for that year and vice versa. Further, in some instances, other partner payments are based on program sales and new account acquisitions.
(2)(5) Overdraft fees are accounted for under ASC 310. Citi eliminated overdraft fees, returned item fees and overdraft protection fees beginning in June 2022. Includes overdraft
(6) Transactional service fees (prior to the elimination of overdraft fees in June 2022) of $0 and $28 million for the three months ended June 30, 2023 and 2022, respectively.are earned primarily by Services.
(3)(7) Consists primarily of fees earned from structuring and underwriting loan syndications or related financing activity. This activity is accounted for under ASC 310.
(8) Insurance distribution revenue is earned primarily by Wealth and Legacy Franchises within All Other.
(4)(9)Insurance premiums are earned primarily by Legacy Franchises within All Other.
(10) Commissions and fees include $(2,940)$(2,538) million and $(2,811)$(2,656) million not accounted for under ASC 606, Revenue from Contracts with Customers, for the three months ended June 30,March 31, 2024 and 2023, and 2022, respectively, and $(5,599) million and $(5,240) million for the six months ended June 30, 2023 and 2022, respectively. Amounts reported in Commissions and fees accounted for under other guidance primarily include card-related loan fees, card reward programs and certain partner payments, corporate finance fees, insurance premiums and loan servicing fees.
Administration and Other Fiduciary Fees
103Administration and other fiduciary fees revenue is primarily composed of custody fees and fiduciary fees. See Note 3 for segment results and Note 5 to the Consolidated Financial Statements in Citi’s 2023 Form 10-K for additional information on Citi’s administration and other fiduciary fees.
The following tables presenttable presents Administration and other fiduciary fees revenue:
| | | | | | | | | | | | | | | | | | | | | | | | | | |
| Three Months Ended June 30, 2023 | Six Months Ended June 30, 2023 |
| In millions of dollars | ICG | PBWM | Legacy Franchises | Total | ICG | PBWM | Legacy Franchises | Total |
| Custody fees | $ | 485 | | $ | 22 | | $ | 3 | | $ | 510 | | $ | 902 | | $ | 42 | | $ | 11 | | $ | 955 | |
| Fiduciary fees | 69 | | 185 | | 90 | | 344 | | 144 | | 338 | | 172 | | 654 | |
| Guarantee fees | 126 | | 7 | | 1 | | 135 | | 258 | | 15 | | 3 | | 276 | |
Total administration and other fiduciary fees(1) | $ | 680 | | $ | 214 | | $ | 94 | | $ | 989 | | $ | 1,304 | | $ | 395 | | $ | 186 | | $ | 1,885 | |
| | | | | | | | | | | | | | | | | | | | | | | | | | |
| Three Months Ended June 30, 2022 | Six Months Ended June 30, 2022 |
| In millions of dollars | ICG | PBWM | Legacy Franchises | Total | ICG | PBWM | Legacy Franchises | Total |
| Custody fees | $ | 506 | | $ | 22 | | $ | 2 | | $ | 530 | | $ | 952 | | $ | 45 | | $ | 5 | | $ | 1,002 | |
| Fiduciary fees | 68 | | 196 | | 79 | | 343 | | 133 | | 401 | | 159 | | 693 | |
| Guarantee fees | 134 | | 14 | | 2 | | 150 | | 266 | | 24 | | 4 | | 294 | |
Total administration and other fiduciary fees(1) | $ | 708 | | $ | 232 | | $ | 83 | | $ | 1,023 | | $ | 1,351 | | $ | 470 | | $ | 168 | | $ | 1,989 | |
| | | | | | | | | | |
| Three Months Ended March 31, | |
| In millions of dollars | 2024 | 2023 | | |
Custody fees(1) | $ | 514 | | $ | 444 | | | |
Fiduciary fees(2) | 392 | | 310 | | | |
| Guarantee fees | 131 | | 142 | | | |
Total administration and other fiduciary fees(3) | $ | 1,037 | | $ | 896 | | | |
(1) Custody fees are earned primarily by Services.
(2) Fiduciary fees are earned primarily by Wealth and Legacy Franchises within All Other.
(3) Administration and other fiduciary fees include $135$131 million and $150$142 million for the three months ended June 30,March 31, 2024 and 2023, and 2022, respectively, and $276 million and $294 million for the six months ended June 30, 2023 and 2022, respectively, that are not accounted for under ASC 606, Revenue from Contracts with Customers. These generally include guarantee fees.
6. PRINCIPAL TRANSACTIONS
Principal transactions revenue consists of realized and unrealized gains and losses from trading activities. Trading activities include revenues from fixed income, equities, credit and commodities products and foreign exchange transactions that are managed on a portfolio basis and characterized below based on the primary risk managed by each trading desk (as such, the trading desks can be periodically reorganized and thus the risk categories). Not included in the table below is the impact of net interest income related to trading activities, which is an integral part of the profitability of trading activities’ profitabilityactivities (see Note 4 for information about net interest income related to trading activities). Principal transactions include CVA (credit valuation adjustments) and FVA (funding valuation adjustments) on over-the-counter derivatives, and gains (losses) on certain economic hedges on loans in ICGServices, Markets and Banking. These adjustments are discussed further in Note 22.23.
In certain transactions, Citi incurs fees and presents these fees paid to third parties in operating expenses.
The following table presents Principal transactions revenue:
| | Three Months Ended June 30, | Six Months Ended June 30, |
| Three Months Ended March 31, | |
| Three Months Ended March 31, | |
| Three Months Ended March 31, | |
| In millions of dollars | |
| In millions of dollars | |
| In millions of dollars | In millions of dollars | 2023 | 2022 | 2023 | 2022 |
Interest rate risks(1) | Interest rate risks(1) | $ | 594 | | $ | 1,418 | | $ | 1,974 | | $ | 2,688 | |
Interest rate risks(1) | |
Interest rate risks(1) | |
Foreign exchange risks(2) | |
Foreign exchange risks(2) | |
Foreign exchange risks(2) | Foreign exchange risks(2) | 1,334 | | 1,672 | | 2,827 | | 3,419 | |
Equity risks(3) | Equity risks(3) | 205 | | 345 | | 839 | | 1,276 | |
Equity risks(3) | |
Equity risks(3) | |
Commodity and other risks(4) | |
Commodity and other risks(4) | |
Commodity and other risks(4) | Commodity and other risks(4) | 469 | | 612 | | 967 | | 1,063 | |
Credit products and risks(5) | Credit products and risks(5) | (74) | | 478 | | (140) | | 669 | |
Credit products and risks(5) | |
Credit products and risks(5) | |
| Total | Total | $ | 2,528 | | $ | 4,525 | | $ | 6,467 | | $ | 9,115 | |
| Total | |
| Total | |
(1) Includes revenues from government securities, and corporate debt, municipal securities, mortgage securities and other debt instruments. Also includes spot and forward trading of currencies and exchange-traded and over-the-counter (OTC) currency options, options on fixed income securities, interest rate swaps, currency swaps, swap options, caps and floors, financial futures, OTC options and forward contracts on fixed income securities.
(2) Includes revenues from foreign exchange spot, forward, option and swap contracts, as well as foreign currency translation (FX translation) gains and losses.
(3) Includes revenues from common, preferred and convertible preferred stock, convertible corporate debt, equity-linked notes and exchange-traded and OTC equity options and warrants.
(4) Primarily includes revenues from crude oil, refined oil products, natural gas and other commodities trades.
(5) Includes revenues from corporate debt, secondary trading loans, mortgage securities, single name and index credit default swaps, and structured credit products.
7. INCENTIVE PLANS
For additional information on Citi’s incentive plans, see Note 7 to the Consolidated Financial Statements in Citi’s 20222023 Form 10-K.
8. RETIREMENT BENEFITS
For additional information on Citi’s retirement benefits, see Note 8 to the Consolidated Financial Statements in Citi’s 20222023 Form 10-K.
Net Expense (Benefit) Expense
The following table summarizes the components of net expense (benefit) expense recognized in the Consolidated Statement of Income for the Company’s pension and postretirement benefit plans for Significant Plans and All Other Plans. Benefits earned during the period are reported in Compensation and benefits expenses and all other components of the net period benefit cost are reported in Other operating expenses in the Consolidated Statement of Income:
| | Three Months Ended June 30, |
| Three Months Ended March 31, | | | Three Months Ended March 31, |
| | | Pension plans | Postretirement benefit plans | | Pension plans | Postretirement benefit plans |
| | | U.S. plans | Non-U.S. plans | U.S. plans | Non-U.S. plans | | U.S. plans | Non-U.S. plans | U.S. plans | Non-U.S. plans |
| In millions of dollars | In millions of dollars | 2023 | 2022 | 2023 | 2022 | 2023 | 2022 | 2023 | 2022 | In millions of dollars | 2024 | 2023 | 2024 | 2023 | 2024 | 2023 | 2024 | 2023 |
| | Service cost | Service cost | $ | — | | $ | — | | $ | 30 | | $ | 30 | | $ | — | | $ | — | | $ | — | | $ | — | |
| Service cost | |
| Service cost | |
| Interest cost on benefit obligation | Interest cost on benefit obligation | 123 | | 105 | | 102 | | 79 | | 4 | | 4 | | 27 | | 23 | |
| Expected return on assets | Expected return on assets | (160) | | (154) | | (82) | | (66) | | (4) | | (3) | | (20) | | (18) | |
| Amortization of unrecognized: | Amortization of unrecognized: | | | | | | | | Amortization of unrecognized: | | | | | | | | |
| Prior service (benefit) | — | | — | | (1) | | (1) | | (3) | | (3) | | (2) | | (1) | |
| Prior service cost (benefit) | |
| Net actuarial loss (gain) | Net actuarial loss (gain) | 41 | | 44 | | 15 | | 14 | | (2) | | (2) | | (5) | | 1 | |
Curtailment (gain)(1) | Curtailment (gain)(1) | — | | — | | — | | (23) | | — | | — | | — | | — | |
Settlement loss (gain)(1) | — | | — | | 1 | | (10) | | — | | — | | — | | — | |
Settlement loss(1) | |
| | Total net expense (benefit) | Total net expense (benefit) | $ | 4 | | $ | (5) | | $ | 65 | | $ | 23 | | $ | (5) | | $ | (4) | | $ | — | | $ | 5 | |
| | Total net expense (benefit) | |
| | Total net expense (benefit) | |
(1) Curtailment and settlement relate to divestiture and wind-down activities.
| | | | | | | | | | | | | | | | | | | | | | | | | | |
| Six Months Ended June 30, |
| | Pension plans | Postretirement benefit plans |
| | U.S. plans | Non-U.S. plans | U.S. plans | Non-U.S. plans |
| In millions of dollars | 2023 | 2022 | 2023 | 2022 | 2023 | 2022 | 2023 | 2022 |
| | | | | | | | |
| Service cost | $ | — | | $ | — | | $ | 58 | | $ | 64 | | $ | — | | $ | — | | $ | 1 | | $ | 1 | |
| Interest cost on benefit obligation | 250 | | 191 | | 200 | | 152 | | 9 | | 7 | | 52 | | 46 | |
| Expected return on assets | (321) | | (308) | | (163) | | (132) | | (7) | | (6) | | (39) | | (38) | |
| Amortization of unrecognized: | | | | | | | | |
| Prior service cost (benefit) | 1 | | 1 | | (3) | | (3) | | (5) | | (5) | | (4) | | (4) | |
| Net actuarial loss (gain) | 79 | | 100 | | 34 | | 27 | | (5) | | (3) | | (10) | | 2 | |
Curtailment (gain)(1) | — | | — | | (8) | | (23) | | — | | — | | — | | — | |
Settlement loss (gain)(1) | — | | — | | 4 | | (10) | | — | | — | | — | | — | |
| | | | | | | | |
| | | | | | | | |
| | | | | | | | |
| | | | | | | | |
| Total net expense (benefit) | $ | 9 | | $ | (16) | | $ | 122 | | $ | 75 | | $ | (8) | | $ | (7) | | $ | — | | $ | 7 | |
(1) Curtailment and settlement relate to divestiture and wind-down activities.
Funded Status and Accumulated Other Comprehensive Income (AOCI)
The following table summarizes the funded status and amounts recognized on the Consolidated Balance Sheet for the Company’s Significant Plans:pension and postretirement benefit plans:
| | Three Months Ended March 31, 2024 | |
| Three Months Ended March 31, 2024 | |
| Three Months Ended March 31, 2024 | |
| | | | Pension plans | Postretirement benefit plans |
| In millions of dollars | | In millions of dollars | U.S. plans | Non-U.S. plans | U.S. plans | Non-U.S. plans |
| | Change in projected benefit obligation | |
| Change in projected benefit obligation | |
| Change in projected benefit obligation | | | | |
| | Projected benefit obligation at beginning of year | |
| Projected benefit obligation at beginning of year | |
| Projected benefit obligation at beginning of year | |
| Plans measured annually | |
| | | | Six Months Ended June 30, 2023 |
| | | Pension plans | Postretirement benefit plans |
| In millions of dollars | U.S. plans | Non-U.S. plans | U.S. plans | Non-U.S. plans |
| | Change in projected benefit obligation | | | |
| | Projected benefit obligation at beginning of year | $ | 9,741 | | $ | 6,375 | | $ | 375 | | $ | 1,013 | |
| Plans measured annually | (19) | | (1,774) | | — | | (193) | |
| Projected benefit obligation at beginning of year—Significant Plans | Projected benefit obligation at beginning of year—Significant Plans | $ | 9,722 | | $ | 4,601 | | $ | 375 | | $ | 820 | |
| First-quarter activity | 160 | | 241 | | (1) | | 70 | |
| | Projected benefit obligation at March 31, 2023—Significant Plans | $ | 9,882 | | $ | 4,842 | | $ | 374 | | $ | 890 | |
| | Projected benefit obligation at beginning of year—Significant Plans | |
| | Projected benefit obligation at beginning of year—Significant Plans | |
| | Service cost | Service cost | — | | 12 | | — | | — | |
| Service cost | |
| Service cost | |
| Interest cost on benefit obligation | Interest cost on benefit obligation | 122 | | 84 | | 4 | | 23 | |
| Actuarial (gain) loss | (157) | | 3 | | (20) | | 23 | |
| Actuarial (gain) | |
| Benefits paid, net of participants’ contributions | Benefits paid, net of participants’ contributions | (230) | | (83) | | (11) | | (19) | |
| | Foreign exchange impact and other | Foreign exchange impact and other | — | | 163 | | — | | 48 | |
| | | Foreign exchange impact and other | |
| | Foreign exchange impact and other | |
| | Projected benefit obligation at period end—Significant Plans | |
| | Projected benefit obligation at period end—Significant Plans | |
| | Projected benefit obligation at period end—Significant Plans | Projected benefit obligation at period end—Significant Plans | $ | 9,617 | | $ | 5,021 | | $ | 347 | | $ | 965 | |
| Change in plan assets | Change in plan assets | | | | Change in plan assets | | | |
| | Plan assets at fair value at beginning of year | Plan assets at fair value at beginning of year | $ | 10,145 | | $ | 6,086 | | $ | 253 | | $ | 855 | |
| Plan assets at fair value at beginning of year | |
| Plan assets at fair value at beginning of year | |
| Plans measured annually | Plans measured annually | — | | (1,226) | | — | | (7) | |
| Plan assets at fair value at beginning of year—Significant Plans | Plan assets at fair value at beginning of year—Significant Plans | $ | 10,145 | | $ | 4,860 | | $ | 253 | | $ | 848 | |
| First-quarter activity | 143 | | 225 | | 5 | | 73 | |
| | Plan assets at fair value at March 31, 2023—Significant Plans | $ | 10,288 | | $ | 5,085 | | $ | 258 | | $ | 921 | |
| | Actual return on plan assets | |
| | Actual return on plan assets | |
| | | Actual return on plan assets | Actual return on plan assets | 86 | | (75) | | 2 | | (4) | |
| Company contributions, net of reimbursements | Company contributions, net of reimbursements | 13 | | 9 | | 7 | | — | |
| | Benefits paid, net of participants’ contributions | |
| Benefits paid, net of participants’ contributions | |
| Benefits paid, net of participants’ contributions | Benefits paid, net of participants’ contributions | (230) | | (83) | | (11) | | (19) | |
| | Foreign exchange impact and other | Foreign exchange impact and other | — | | 143 | | — | | 47 | |
| | Foreign exchange impact and other | |
| | Foreign exchange impact and other | |
| | Plan assets at fair value at period end—Significant Plans | Plan assets at fair value at period end—Significant Plans | $ | 10,157 | | $ | 5,079 | | $ | 256 | | $ | 945 | |
| | Plan assets at fair value at period end—Significant Plans | |
| | Plan assets at fair value at period end—Significant Plans | |
| Qualified plans(1) | |
Qualified plans(1) | |
Qualified plans(1) | Qualified plans(1) | $ | 1,063 | | $ | 58 | | $ | (91) | | $ | (20) | |
Nonqualified plans(2) | Nonqualified plans(2) | (523) | | — | | — | | — | |
| Funded status of the plans at period end—Significant Plans | Funded status of the plans at period end—Significant Plans | $ | 540 | | $ | 58 | | $ | (91) | | $ | (20) | |
| Net amount recognized at period end | Net amount recognized at period end | | | | Net amount recognized at period end | | | |
| Benefit asset | Benefit asset | $ | 1,063 | | $ | 737 | | $ | — | | $ | — | |
| Benefit liability | Benefit liability | (523) | | (679) | | (91) | | (20) | |
| Net amount recognized on the balance sheet—Significant Plans | Net amount recognized on the balance sheet—Significant Plans | $ | 540 | | $ | 58 | | $ | (91) | | $ | (20) | |
Amounts recognized in AOCI at period end(3) | Amounts recognized in AOCI at period end(3) | | | | Amounts recognized in AOCI at period end(3) | | | |
| | Prior service (expense) benefit | Prior service (expense) benefit | $ | — | | $ | (2) | | $ | 78 | | $ | 36 | |
| Prior service (expense) benefit | |
| Prior service (expense) benefit | |
| Net actuarial (loss) gain | Net actuarial (loss) gain | (6,343) | | (1,561) | | 127 | | (335) | |
| Net amount recognized in equity (pretax)—Significant Plans | $ | (6,343) | | $ | (1,563) | | $ | 205 | | $ | (299) | |
Net amount recognized in AOCI (pretax)—Significant Plans | |
| Accumulated benefit obligation at period end—Significant Plans | Accumulated benefit obligation at period end—Significant Plans | $ | 9,617 | | $ | 4,839 | | $ | 347 | | $ | 965 | |
(1)The U.S. qualified pension plan is fully funded under specified Employee Retirement Income Security Act of 1974, as amended, (ERISA), funding rules as of January 1, 20232024 and no minimum required funding is expected for 2023.2024.
(2)The nonqualified plans of the Company are unfunded.
(3)The framework for the Company’s pension oversight process includes monitoring of potential settlement charges for all plans. Settlement accounting is triggered when either the sum of all settlements (including lump-sum payments) for the year is greater than service plus interest costs or if more than 10% of the plan’s projected benefit obligation will be settled. Because some of Citi’s significant plans are frozen and have no material service cost, settlement accounting may apply in the future.
The following table presents the change in AOCI related to the Company’s pension, postretirement and post employment plans:
| | In millions of dollars | In millions of dollars | Three Months Ended
June 30, 2023 | Six Months Ended June 30, 2023 | Three Months Ended June 30, 2022 | Six Months Ended June 30, 2022 | |
| In millions of dollars | |
| In millions of dollars | |
| Beginning of period balance, net of tax(1)(2) | |
| Beginning of period balance, net of tax(1)(2) | |
| Beginning of period balance, net of tax(1)(2) | Beginning of period balance, net of tax(1)(2) | $ | (5,859) | | $ | (5,755) | | $ | (5,681) | | $ | (5,852) | | |
| | Actuarial assumptions changes and plan experience | Actuarial assumptions changes and plan experience | 154 | | (115) | | 1,499 | | 3,024 | | |
| Net asset (loss) due to difference between actual and expected returns | (245) | | (62) | | (1,675) | | (3,137) | | |
| Net amortization | 45 | | 88 | | 52 | | 116 | | |
| Curtailment/settlement loss (gain)(3) | 1 | | (4) | | (32) | | (32) | | |
| Actuarial assumptions changes and plan experience | |
| | Actuarial assumptions changes and plan experience | |
| Net asset (loss) gain due to difference between actual and expected returns | |
| Net asset (loss) gain due to difference between actual and expected returns | |
| Net asset (loss) gain due to difference between actual and expected returns | |
| Net amortization | |
| Net amortization | |
| Net amortization | |
| Prior service benefit | |
| Prior service benefit | |
| Prior service benefit | |
| | Curtailment/settlement gain | |
| | Curtailment/settlement gain | |
| | Curtailment/settlement gain | |
| Foreign exchange impact and other | |
| Foreign exchange impact and other | |
| Foreign exchange impact and other | Foreign exchange impact and other | (111) | | (219) | | 83 | | 133 | | |
| Change in deferred taxes, net | Change in deferred taxes, net | 20 | | 72 | | (16) | | (22) | | |
| Change in deferred taxes, net | |
| Change in deferred taxes, net | |
| Change, net of tax | |
| Change, net of tax | |
| Change, net of tax | Change, net of tax | $ | (136) | | $ | (240) | | $ | (89) | | $ | 82 | | |
End of period balance, net of tax(1)(2) | End of period balance, net of tax(1)(2) | $ | (5,995) | | $ | (5,995) | | $ | (5,770) | | $ | (5,770) | | |
End of period balance, net of tax(1)(2) | |
End of period balance, net of tax(1)(2) | |
(1)See Note 1819 for further discussion of net AOCI balance.
(2)Includes net-of-tax amounts for certain profit-sharing plans outside the U.S.
(3)Curtailment and settlement relate to divestiture activities.
Plan Assumptions
Certain assumptions used in determining pension and postretirement benefit obligations and net benefit expense for the Company’s Significant Plans are as follows:presented in the following tables:
| | | | | | | | | | | | |
| During the period | Three Months Ended |
| Mar. 31, 2024 | | Dec. 31, 2023 | Mar. 31, 2023 |
| Discount rate | | | | |
| U.S. plans | | | | |
| Qualified pension | 5.10% | | 6.05% | 5.50% |
| Nonqualified pension | 5.15 | | 6.10 | 5.55 |
| Postretirement benefit plan | 5.20 | | 6.10 | 5.60 |
| Non-U.S. plans | | | | |
| Pension | 1.35–10.65 | | 1.85–11.55 | 2.20–10.60 |
| Weighted average | 7.57 | | 8.35 | 7.55 |
| Postretirement benefit plan | 10.70 | | 11.55 | 10.60 |
| Expected return on assets | | | |
| U.S. plans | | | | |
| Qualified pension | 5.70 | | 5.70 | 5.70 |
| Postretirement benefit plan | 5.70/3.00 | | 5.70/3.00 | 5.70/3.00 |
| Non-U.S. plans | | | | |
| Pension | 4.30–9.60 | | 4.50–9.90 | 4.50–9.90 |
| Weighted average | 6.57 | | 6.70 | 6.40 |
| Postretirement benefit plan | 9.40 | | 8.70 | 8.70 |
| | | | | | | | | | | | |
| During the period | Three Months Ended |
| Jun. 30, 2023 | | Mar. 31, 2023 | Jun. 30, 2022 |
| Discount rate | | | | |
| U.S. plans | | | | |
| Qualified pension | 5.15% | | 5.50% | 3.80% |
| Nonqualified pension | 5.20 | | 5.55 | 3.85 |
| Postretirement | 5.25 | | 5.60 | 3.85 |
| Non-U.S. plans | | | | |
| Pension | 2.05–10.65 | | 2.20–10.60 | 1.10–10.00 |
| Weighted average | 7.64 | | 7.55 | 5.55 |
| Postretirement | 10.70 | | 10.60 | 10.10 |
| Expected return on assets | | | |
| U.S. plans | | | | |
| Qualified pension | 5.70 | | 5.70 | 5.00 |
| Postretirement | 5.70/3.00 | | 5.70/3.00 | 5.00/1.50 |
| Non-U.S. plans | | | | |
| Pension | 4.10–9.90 | | 4.50–9.90 | 1.90–8.00 |
| Weighted average | 6.26 | | 6.40 | 4.15 |
| Postretirement | 8.70 | | 8.70 | 8.00 |
| | | | | | | | | | | | |
At period ended(1) | Mar. 31, 2024 | Dec. 31, 2023 | Mar. 31, 2023 | |
| Discount rate | | | | |
| U.S. plans | | | | |
| Qualified pension | 5.30% | 5.10% | 5.15% | |
| Nonqualified pension | 5.40 | 5.15 | 5.20 | |
| Postretirement benefit plan | 5.40 | 5.20 | 5.25 | |
| Non-U.S. plans | | | | |
| Pension | 1.35–11.00 | 1.35–10.65 | 2.05–10.65 | |
| Weighted average | 7.92 | 7.57 | 7.64 | |
| Postretirement benefit plan | 11.05 | 10.70 | 10.70 | |
| Expected return on assets | | | |
| U.S. plans | | | | |
| Qualified pension | 5.70 | 5.70 | 5.70 | |
| Postretirement benefit plan | 5.70/3.00 | 5.70/3.00 | 5.70/3.00 | |
| Non-U.S. plans | | | | |
| Pension | 4.20–9.60 | 4.30–9.60 | 4.10–9.90 | |
| Weighted average | 6.51 | 6.57 | 6.26 | |
| Postretirement benefit plan | 9.40 | 9.40 | 8.70 | |
(1) Discount rates and expected return on assets at the end of each quarter are utilized in the following quarter’s expense.
Sensitivities of Certain Key Assumptions
The following table summarizes the estimated effect on the Company’s Significant Plans quarterly net expense (benefit) of a one-percentage-point change in the discount rate:
| | | | | | | | | | |
| Three Months Ended March 31, 2024 |
| In millions of dollars | One-percentage-point increase | | | One-percentage-point decrease |
| Pension | | | | |
| U.S. plans | $ | 6 | | | | $ | (7) | |
| Non-U.S. plans | (2) | | | | 4 | |
| | | | |
| | | | |
| | | | |
Contributions
| | | | | | | | | | | | |
| At period ended | Jun. 30, 2023 | Mar. 31, 2023 | Jun. 30, 2022 | |
| Discount rate | | | | |
| U.S. plans | | | | |
| Qualified pension | 5.40% | 5.15% | 4.80% | |
| Nonqualified pension | 5.45 | 5.20 | 4.80 | |
| Postretirement | 5.50 | 5.25 | 4.75 | |
| Non-U.S. plans | | | | |
| Pension | 1.80–10.40 | 2.05–10.65 | 2.00–10.75 | |
| Weighted average | 7.72 | 7.64 | 6.68 | |
| Postretirement | 10.40 | 10.70 | 10.75 | |
| Expected return on assets | | | |
| U.S. plans | | | | |
| Qualified pension | 5.70 | 5.70 | 5.00 | |
| Postretirement | 5.70/3.00 | 5.70/3.00 | 5.00/1.50 | |
| Non-U.S. plans | | | | |
| Pension | 4.50–9.90 | 4.10–9.90 | 2.00–8.00 | |
| Weighted average | 6.56 | 6.26 | 4.72 | |
| Postretirement | 8.70 | 8.70 | 8.00 | |
Sensitivities of Certain Key Assumptions
The following table summarizes the estimated effect on the Company’s Significant Plans quarterly expense of a one-percentage-point change in the discount rate:
| | | | | | | | | | |
| Three Months Ended June 30, 2023 |
| In millions of dollars | One-percentage-point increase | | | One-percentage-point decrease |
| Pension | | | | |
| U.S. plans | $ | 6 | | | | $ | (7) | |
| Non-U.S. plans | (1) | | | | 3 | |
| Postretirement | | | | |
| | | | |
| Non-U.S. plans | (1) | | | | 1 | |
For the U.S. pension plans, there were no required minimum cash contributions during the first sixthree months of 2023.2024.
The following table summarizes the Company’s actual contributions for the sixthree months ended June 30,March 31, 2024 and 2023, and 2022, as well as expected Company contributions for the remainder of 20232024 and the actual contributions made in 2022:2023:
| | | |
| | | | Pension plans | Postretirement plans | Pension plans | Postretirement benefit plans |
| | | U.S. plans(1) | | Non-U.S. plans | | U.S. plans | | Non-U.S. plans | |
| In millions of dollars | In millions of dollars | 2023 | 2022 | | 2023 | 2022 | | 2023 | 2022 | | 2023 | 2022 | |
Company contributions (reimbursements)(2)(3) for the six months ended June 30 | $ | 28 | | $ | 28 | | | $ | 60 | | $ | 389 | | | $ | 20 | | $ | (1) | | | $ | 5 | | $ | 5 | | |
Company contributions made during the remainder of the year(3) | — | | 27 | | | — | | 105 | | | — | | 15 | | | — | | 4 | | |
| In millions of dollars | |
| In millions of dollars | |
Company contributions(2) for the three months ended March 31 | |
Company contributions(2) for the three months ended March 31 | |
Company contributions(2) for the three months ended March 31 | |
| Company net contributions (reimbursements) made during the remainder of the year | |
| Company net contributions (reimbursements) made during the remainder of the year | |
| Company net contributions (reimbursements) made during the remainder of the year | |
| Company contributions expected to be made during the remainder of the year | |
| Company contributions expected to be made during the remainder of the year | |
| Company contributions expected to be made during the remainder of the year | Company contributions expected to be made during the remainder of the year | 32 | | | | 52 | | | | 2 | | | | 5 | | | |
| | |
(1)The U.S. plans include benefits paid directly by the Company for the nonqualified pension plans.
(2)Company contributions are composed of cash contributions made to the plans and benefits paid directly by the Company.
(3)2022 benefit payments have increased due to the wind-down of Citi’s consumer banking business in Korea, as it is expected that employees who elected the VERP will be withdrawing their pension plan assets.
Defined Contribution Plans
The following table summarizes the Company’s contributions for the defined contribution plans:
| | Three Months Ended June 30, | Six Months Ended June 30, | |
| | Three Months Ended March 31, | |
| | Three Months Ended March 31, | |
| | Three Months Ended March 31, | |
| In millions of dollars | |
| In millions of dollars | |
| In millions of dollars | In millions of dollars | 2023 | 2022 | 2023 | 2022 | |
| U.S. plans | U.S. plans | $ | 137 | | $ | 119 | | $ | 275 | | $ | 238 | | |
| U.S. plans | |
| U.S. plans | |
| Non-U.S. plans | Non-U.S. plans | 114 | | 99 | | 228 | | 205 | | |
| Non-U.S. plans | |
| Non-U.S. plans | |
Post Employment Plans
The following table summarizes the net expense recognized in the Consolidated Statement of Income for the Company’s U.S. post employment plans:
| | | | | | | | | | | | | | | | |
| Three Months Ended June 30, | Six Months Ended June 30, | |
| In millions of dollars | 2023 | 2022 | 2023 | 2022 | | |
| Service-related expense | | | | | | |
| | | | | | |
| | | | | | |
| Amortization of unrecognized: | | | | | | |
| | | | | | |
| Net actuarial loss | $ | 1 | | $ | 1 | | $ | 1 | | $ | 1 | | | |
| | | | | | |
| Total service-related expense | $ | 1 | | $ | 1 | | $ | 1 | | $ | 1 | | | |
| Non-service-related expense | — | | 1 | | 5 | | 6 | | | |
| Total net expense | $ | 1 | | $ | 2 | | $ | 6 | | $ | 7 | | | |
| | | | | | | | | | | | |
| Three Months Ended March 31, | | |
| In millions of dollars | 2024 | 2023 | | | | |
| | | | | | |
| | | | | | |
| | | | | | |
| | | | | | |
| | | | | | |
| | | | | | |
| | | | | | |
| | | | | | |
| Non-service-related expense | $ | 5 | | $ | 5 | | | | | |
| Total net expense | $ | 5 | | $ | 5 | | | | | |
9. RESTRUCTURING
As previously disclosed, Citi is pursuing various initiatives to simplify the Company and further align its organizational structure with its business strategy. As part of its overall simplification initiatives, in the fourth quarter of 2023, Citi eliminated the previous Institutional Clients Group and Personal Banking and Wealth Management layers, exited certain institutional business lines, and consolidated its regional structure, creating one international group, while centralizing client capabilities and streamlining its global staff functions. Citi recorded approximately $781 million of restructuring charges in the fourth quarter of 2023 related to the initial implementation of its organizational simplification initiatives.
During the first quarter of 2024, Citi incurred additional net restructuring charges of approximately $225 million related to the continued implementation of its organizational simplification initiatives. Citi has recorded net restructuring charges of approximately $1.0 billion program-to-date.
Restructuring charges are recorded as a separate line item within Operating expenses in the Company’s Consolidated Statement of Income. These charges were included within All Other—Corporate/Other.
The following costs associated with these initiatives are included in restructuring charges:
•Personnel costs: severance costs associated with actual headcount reductions (as well as those that were probable and could be reasonably estimated)
•Other: costs associated with contract terminations and other direct costs associated with the restructuring, including asset write-downs (non-cash write-downs of capitalized software, which are included in Premises and equipment related to exited businesses)
The following table is a rollforward of the liability related to the restructuring charges:
| | | | | | | | | | | |
| In millions of dollars | Personnel
costs | Other | Total |
| Balance at December 31, 2022 | $ | — | | $ | — | | $ | — | |
| 4Q23 restructuring charges | 687 | | 94 | | 781 | |
| 4Q23 payments and utilization | — | | (69) | | (69) | |
| Foreign exchange | — | | — | | — | |
| Balance at December 31, 2023 | $ | 687 | | $ | 25 | | $ | 712 | |
| Restructuring charges | $ | 237 | | $ | 54 | | $ | 291 | |
Change in estimate(1) | (66) | | — | | (66) | |
| Net restructuring charges | $ | 171 | | $ | 54 | | $ | 225 | |
| Payments and utilization | $ | (127) | | $ | (46) | | $ | (173) | |
| Foreign exchange | — | | — | | — | |
| Balance at March 31, 2024 | $ | 731 | | $ | 33 | | $ | 764 | |
(1) Revisions primarily relate to higher-than-anticipated redeployments of displaced employees to other positions within the Company, job function releveling and employee attrition.
10. EARNINGS PER SHARE
The following table reconciles the income and share data used in the basic and diluted earnings per share (EPS) computations:
| | Three Months Ended June 30, | Six Months Ended June 30, |
| Three Months Ended March 31, | |
| Three Months Ended March 31, | |
| Three Months Ended March 31, | |
| In millions of dollars, except per share amounts | |
| In millions of dollars, except per share amounts | |
| In millions of dollars, except per share amounts | In millions of dollars, except per share amounts | 2023 | 2022 | 2023 | 2022 |
| Earnings per common share | Earnings per common share | | | |
| Earnings per common share | |
| Earnings per common share | |
| Income from continuing operations before attribution of noncontrolling interests | |
| Income from continuing operations before attribution of noncontrolling interests | |
| Income from continuing operations before attribution of noncontrolling interests | Income from continuing operations before attribution of noncontrolling interests | $ | 2,952 | | $ | 4,789 | | $ | 7,604 | | $ | 9,114 | |
| Less: Noncontrolling interests from continuing operations | Less: Noncontrolling interests from continuing operations | 36 | | 21 | | 81 | | 38 | |
| Less: Noncontrolling interests from continuing operations | |
| Less: Noncontrolling interests from continuing operations | |
| Net income from continuing operations (for EPS purposes) | |
| Net income from continuing operations (for EPS purposes) | |
| Net income from continuing operations (for EPS purposes) | Net income from continuing operations (for EPS purposes) | $ | 2,916 | | $ | 4,768 | | $ | 7,523 | | $ | 9,076 | |
| Income (loss) from discontinued operations, net of taxes | Income (loss) from discontinued operations, net of taxes | (1) | | (221) | | (2) | | (223) | |
| Income (loss) from discontinued operations, net of taxes | |
| Income (loss) from discontinued operations, net of taxes | |
| Citigroup’s net income | |
| Citigroup’s net income | |
| Citigroup’s net income | Citigroup’s net income | $ | 2,915 | | $ | 4,547 | | $ | 7,521 | | $ | 8,853 | |
| Less: Preferred dividends | Less: Preferred dividends | 288 | | 238 | | 565 | | 517 | |
| Less: Preferred dividends | |
| Less: Preferred dividends | |
| Net income available to common shareholders | Net income available to common shareholders | $ | 2,627 | | $ | 4,309 | | $ | 6,956 | | $ | 8,336 | |
| Less: Dividends and undistributed earnings allocated to employee restricted and deferred shares with rights to dividends, applicable to basic EPS | 33 | | 35 | | 68 | | 60 | |
| Net income available to common shareholders | |
| Net income available to common shareholders | |
Less: Dividends and undistributed earnings allocated to employee restricted and deferred shares with rights to dividends, and other relevant items(1), applicable to basic EPS | |
Less: Dividends and undistributed earnings allocated to employee restricted and deferred shares with rights to dividends, and other relevant items(1), applicable to basic EPS | |
Less: Dividends and undistributed earnings allocated to employee restricted and deferred shares with rights to dividends, and other relevant items(1), applicable to basic EPS | |
| Net income allocated to common shareholders for basic EPS | |
| Net income allocated to common shareholders for basic EPS | |
| Net income allocated to common shareholders for basic EPS | Net income allocated to common shareholders for basic EPS | $ | 2,594 | | $ | 4,274 | | $ | 6,888 | | $ | 8,276 | |
Weighted-average common shares outstanding applicable to basic EPS (in millions) | Weighted-average common shares outstanding applicable to basic EPS (in millions) | 1,942.8 | | 1,941.5 | | 1,943.2 | | 1,956.6 | |
Basic earnings per share(1) | | | |
Weighted-average common shares outstanding applicable to basic EPS (in millions) | |
Weighted-average common shares outstanding applicable to basic EPS (in millions) | |
Basic earnings per share(2) | |
Basic earnings per share(2) | |
Basic earnings per share(2) | |
| Income from continuing operations | |
| Income from continuing operations | |
| Income from continuing operations | Income from continuing operations | $ | 1.34 | | $ | 2.32 | | $ | 3.55 | | $ | 4.34 | |
| Discontinued operations | Discontinued operations | — | | (0.11) | | — | | (0.11) | |
| Net income per share—basic | $ | 1.34 | | $ | 2.20 | | $ | 3.54 | | $ | 4.23 | |
| Discontinued operations | |
| Discontinued operations | |
Net income per share—basic(4) | |
Net income per share—basic(4) | |
Net income per share—basic(4) | |
| Diluted earnings per share | |
| Diluted earnings per share | |
| Diluted earnings per share | Diluted earnings per share | | | |
| Net income allocated to common shareholders for basic EPS | Net income allocated to common shareholders for basic EPS | $ | 2,594 | | $ | 4,274 | | $ | 6,888 | | $ | 8,276 | |
| Net income allocated to common shareholders for basic EPS | |
| Net income allocated to common shareholders for basic EPS | |
| Add back: Dividends allocated to employee restricted and deferred shares with rights to dividends that are forfeitable | |
| Add back: Dividends allocated to employee restricted and deferred shares with rights to dividends that are forfeitable | |
| Add back: Dividends allocated to employee restricted and deferred shares with rights to dividends that are forfeitable | Add back: Dividends allocated to employee restricted and deferred shares with rights to dividends that are forfeitable | 15 | | 11 | | 26 | | 19 | |
| Net income allocated to common shareholders for diluted EPS | Net income allocated to common shareholders for diluted EPS | $ | 2,609 | | $ | 4,285 | | $ | 6,914 | | $ | 8,295 | |
| Net income allocated to common shareholders for diluted EPS | |
| Net income allocated to common shareholders for diluted EPS | |
Weighted-average common shares outstanding applicable to basic EPS (in millions) | Weighted-average common shares outstanding applicable to basic EPS (in millions) | 1,942.8 | | 1,941.5 | | 1,943.2 | | 1,956.6 | |
| Effect of dilutive securities | | | |
Options(2) | — | | — | | — | | — | |
Weighted-average common shares outstanding applicable to basic EPS (in millions) | |
Weighted-average common shares outstanding applicable to basic EPS (in millions) | |
Effect of dilutive securities(3) | |
Effect of dilutive securities(3) | |
Effect of dilutive securities(3) | |
| Other employee plans | Other employee plans | 25.8 | | 16.6 | | 23.1 | | 16.6 | |
Adjusted weighted-average common shares outstanding applicable to diluted EPS (in millions)(3) | 1,968.6 | | 1,958.1 | | 1,966.3 | | 1,973.2 | |
Diluted earnings per share(1) | | | | |
| Other employee plans | |
| Other employee plans | |
Adjusted weighted-average common shares outstanding applicable to diluted EPS (in millions) | |
Adjusted weighted-average common shares outstanding applicable to diluted EPS (in millions) | |
Adjusted weighted-average common shares outstanding applicable to diluted EPS (in millions) | |
Diluted earnings per share(2) | |
Diluted earnings per share(2) | |
Diluted earnings per share(2) | |
| Income from continuing operations | |
| Income from continuing operations | |
| Income from continuing operations | Income from continuing operations | $ | 1.33 | | $ | 2.30 | | $ | 3.52 | | $ | 4.32 | |
| Discontinued operations | Discontinued operations | — | | (0.11) | | — | | (0.11) | |
| Discontinued operations | |
| Discontinued operations | |
Net income per share—diluted(4) | Net income per share—diluted(4) | $ | 1.33 | | $ | 2.19 | | $ | 3.52 | | $ | 4.20 | |
Net income per share—diluted(4) | |
Net income per share—diluted(4) | |
(1)Other relevant items include issuance costs of $12 million related to the remaining redemption of preferred stock Series J. These issuance costs were reclassified from Additional paid-in capital to Retained earnings upon redemption of the preferred stock. See Note 20.
(2)Due to rounding, earnings per share on continuing operations and discontinued operations may not sum to earnings per share on net income.
(2)(3) During the secondfirst quarters of 2024 and 2023, and 2022,there were no significantweighted-average options to purchase shares of common stock were outstanding.
(3) Due to rounding, weighted-average common shares outstanding applicable to basic EPS and the effect of dilutive securities may not sum to weighted-average common shares outstanding applicable to diluted EPS.
(4) Due to rounding, income from continuing operations and discontinued operations may not sum to net income per share—diluted.
10.11. SECURITIES BORROWED, LOANED AND SUBJECT TO REPURCHASE AGREEMENTS
For additional information on the Company’s resale and repurchase agreements and securities borrowing and lending agreements, see Note 1112 to the Consolidated Financial Statements in Citi’s 20222023 Form 10-K.
Securities borrowed and purchased under agreements to resell, at their respective carrying values, consisted of the following:
| | In millions of dollars | In millions of dollars | June 30,
2023 | December 31, 2022 | In millions of dollars | March 31,
2024 | December 31, 2023 |
| Securities purchased under agreements to resell | Securities purchased under agreements to resell | $ | 266,952 | | $ | 291,272 | |
| Deposits paid for securities borrowed | Deposits paid for securities borrowed | 70,177 | | 74,165 | |
Total, net(1) | Total, net(1) | $ | 337,129 | | $ | 365,437 | |
Allowance for credit losses on securities purchased and borrowed(2) | Allowance for credit losses on securities purchased and borrowed(2) | (26) | | (36) | |
| Total, net of allowance | Total, net of allowance | $ | 337,103 | | $ | 365,401 | |
Securities loaned and sold under agreements to repurchase, at their respective carrying values, consisted of the following:
| | In millions of dollars | In millions of dollars | June 30,
2023 | December 31, 2022 | In millions of dollars | March 31,
2024 | December 31, 2023 |
| Securities sold under agreements to repurchase | Securities sold under agreements to repurchase | $ | 247,294 | | $ | 183,827 | |
| Deposits received for securities loaned | Deposits received for securities loaned | 12,741 | | 18,617 | |
Total, net(1) | Total, net(1) | $ | 260,035 | | $ | 202,444 | |
(1) The above tables do not include securities-for-securities lending transactions of $5.9$4.1 billion and $4.4$4.3 billion at June 30, 2023March 31, 2024 and December 31, 2022,2023, respectively, where the Company acts as lender and receives securities that can be sold or pledged as collateral. In these transactions, the Company recognizes the securities received at fair value within Other assets and the obligation to return those securities as a liability within Brokerage payables.
(2) See Note 14 for further information.15.
It is the Company’s policy to take possession of the underlying collateral, monitor its market value relative to the amounts due under the agreements and, when necessary, require prompt transfer of additional collateral in order to maintain contractual margin protection. For resale and repurchase agreements, when necessary, the Company posts additional collateral in order to maintain contractual margin protection.
A substantial portion of the resale and repurchase agreements is recorded at fair value as the Company elected the fair value option, as described in Notes 2223 and 23.24. The remaining portion is carried at the amount of cash initially advanced or received, plus accrued interest, as specified in the respective agreements.
A substantial portion of securities borrowing and lending agreements is recorded at the amount of cash advanced or received. The remaining portion is recorded at fair value as the Company elected the fair value option for certain securities borrowed and loaned portfolios, as described in Note 23.24. With respect to securities loaned, the Company receives cash collateral in an amount generally in excess of the market value of the securities loaned. The Company monitors the market value of securities borrowed and securities loaned on a daily basis and posts or obtains additional collateral in order to maintain contractual margin protection.
The following tables present the gross and net resale and repurchase agreements and securities borrowing and lending agreements and the related offsetting amounts permitted under ASC 210-20-45. The tables also include amounts related to financial instruments that are not permitted to be offset under ASC 210-20-45, but would be eligible for offsetting to the extent that an event of default has occurred and a legal opinion supporting enforceability of the offsetting rights has been obtained. Remaining exposures continue to be secured by financial collateral, but the Company may not have sought or been able to obtain a legal opinion evidencing enforceability of the offsetting right.
| | | | As of June 30, 2023 | | As of March 31, 2024 |
| In millions of dollars | In millions of dollars | Gross amounts
of recognized
assets | Gross amounts
offset on the
Consolidated
Balance Sheet(1) | Net amounts of
assets included on
the Consolidated
Balance Sheet | Amounts
not offset on the
Consolidated Balance
Sheet but eligible for
offsetting upon
counterparty default(2) | Net
amounts(3) | In millions of dollars | Gross amounts
of recognized
assets | Gross amounts
offset on the
Consolidated
Balance Sheet(1) | Net amounts of
assets included on
the Consolidated
Balance Sheet | Amounts not offset on the Consolidated Balance
Sheet but eligible for
offsetting upon
counterparty default(2) | Net
amounts(3) |
| Securities purchased under agreements to resell | Securities purchased under agreements to resell | $ | 485,998 | | $ | 219,046 | | $ | 266,952 | | $ | 242,215 | | $ | 24,737 | |
| Deposits paid for securities borrowed | Deposits paid for securities borrowed | 86,876 | | 16,699 | | 70,177 | | 12,418 | | 57,759 | |
| Total | Total | $ | 572,874 | | $ | 235,745 | | $ | 337,129 | | $ | 254,633 | | $ | 82,496 | |
| | In millions of dollars | In millions of dollars | Gross amounts
of recognized
liabilities | Gross amounts
offset on the
Consolidated
Balance Sheet(1) | Net amounts of
liabilities included on
the Consolidated
Balance Sheet | Amounts
not offset on the
Consolidated Balance
Sheet but eligible for
offsetting upon
counterparty default(2) | Net
amounts(3) | In millions of dollars | Gross amounts
of recognized
liabilities | Gross amounts
offset on the
Consolidated
Balance Sheet(1) | Net amounts of
liabilities included on
the Consolidated
Balance Sheet | Amounts not offset on the
Consolidated Balance
Sheet but eligible for
offsetting upon
counterparty default(2) | Net amounts(3) |
| Securities sold under agreements to repurchase | Securities sold under agreements to repurchase | $ | 466,340 | | $ | 219,046 | | $ | 247,294 | | $ | 151,953 | | $ | 95,341 | |
| Deposits received for securities loaned | Deposits received for securities loaned | 29,440 | | 16,699 | | 12,741 | | 1,893 | | 10,848 | |
| Total | Total | $ | 495,780 | | $ | 235,745 | | $ | 260,035 | | $ | 153,846 | | $ | 106,189 | |
| | | |
| | | | As of December 31, 2022 | |
| In millions of dollars | In millions of dollars | Gross amounts
of recognized
assets | Gross amounts
offset on the
Consolidated
Balance Sheet(1) | Net amounts of
assets included on
the Consolidated
Balance Sheet | Amounts
not offset on the
Consolidated Balance
Sheet but eligible for
offsetting upon
counterparty default(2) | Net
amounts(3) | |
| In millions of dollars | |
| In millions of dollars | |
| Securities purchased under agreements to resell | |
| Securities purchased under agreements to resell | |
| Securities purchased under agreements to resell | Securities purchased under agreements to resell | $ | 403,663 | | $ | 112,391 | | $ | 291,272 | | $ | 204,077 | | $ | 87,195 | | |
| Deposits paid for securities borrowed | Deposits paid for securities borrowed | 88,817 | | 14,652 | | 74,165 | | 13,844 | | 60,321 | | |
| Deposits paid for securities borrowed | |
| Deposits paid for securities borrowed | |
| Total | Total | $ | 492,480 | | $ | 127,043 | | $ | 365,437 | | $ | 217,921 | | $ | 147,516 | | |
| Total | |
| Total | |
| | In millions of dollars | In millions of dollars | Gross amounts
of recognized
liabilities | Gross amounts
offset on the
Consolidated
Balance Sheet(1) | Net amounts of
liabilities included on
the Consolidated
Balance Sheet | Amounts
not offset on the
Consolidated Balance
Sheet but eligible for
offsetting upon
counterparty default(2) | Net
amounts(3) | In millions of dollars | Gross amounts
of recognized
liabilities | Gross amounts
offset on the
Consolidated
Balance Sheet(1) | Net amounts of
liabilities included on
the Consolidated
Balance Sheet | Amounts not offset on the
Consolidated Balance
Sheet but eligible for
offsetting upon
counterparty default(2) | Net
amounts(3) |
| Securities sold under agreements to repurchase | Securities sold under agreements to repurchase | $ | 296,218 | | $ | 112,391 | | $ | 183,827 | | $ | 71,635 | | $ | 112,192 | |
| Deposits received for securities loaned | Deposits received for securities loaned | 33,269 | | 14,652 | | 18,617 | | 2,542 | | 16,075 | |
| Total | Total | $ | 329,487 | | $ | 127,043 | | $ | 202,444 | | $ | 74,177 | | $ | 128,267 | |
(1)Includes financial instruments subject to enforceable master netting agreements that are permitted to be offset under ASC 210-20-45.
(2)Includes financial instruments subject to enforceable master netting agreements that are not permitted to be offset under ASC 210-20-45, but would be eligible for offsetting to the extent that an event of default has occurred and a legal opinion supporting enforceability of the offsetting right has been obtained.
(3)Remaining exposures continue to be secured by financial collateral, but the Company may not have sought or been able to obtain a legal opinion evidencing enforceability of the offsetting right.
The following tables present the gross amounts of liabilities associated with repurchase agreements and securities lending agreements by remaining contractual maturity:
| | As of June 30, 2023 |
| As of March 31, 2024 | | | As of March 31, 2024 |
| In millions of dollars | In millions of dollars | Open and overnight | Up to 30 days | 31–90 days | Greater than 90 days | Total | In millions of dollars | Open and overnight | Up to 30 days | 31–90 days | Greater than 90 days | Total |
| Securities sold under agreements to repurchase | Securities sold under agreements to repurchase | $ | 277,705 | | $ | 107,162 | | $ | 25,550 | | $ | 55,923 | | $ | 466,340 | |
| Deposits received for securities loaned | Deposits received for securities loaned | 21,543 | | 304 | | 645 | | 6,948 | | 29,440 | |
| Total | Total | $ | 299,248 | | $ | 107,466 | | $ | 26,195 | | $ | 62,871 | | $ | 495,780 | |
| | As of December 31, 2022 |
| As of December 31, 2023 | | | As of December 31, 2023 |
| In millions of dollars | In millions of dollars | Open and overnight | Up to 30 days | 31–90 days | Greater than 90 days | Total | In millions of dollars | Open and overnight | Up to 30 days | 31–90 days | Greater than 90 days | Total |
| Securities sold under agreements to repurchase | Securities sold under agreements to repurchase | $ | 138,710 | | $ | 86,819 | | $ | 25,119 | | $ | 45,570 | | $ | 296,218 | |
| Deposits received for securities loaned | Deposits received for securities loaned | 25,388 | | 267 | | 2,121 | | 5,493 | | 33,269 | |
| Total | Total | $ | 164,098 | | $ | 87,086 | | $ | 27,240 | | $ | 51,063 | | $ | 329,487 | |
The following tables present the gross amounts of liabilities associated with repurchase agreements and securities lending agreements by class of underlying collateral:
| | As of June 30, 2023 |
| As of March 31, 2024 | | | As of March 31, 2024 |
| In millions of dollars | In millions of dollars | Repurchase agreements | Securities lending agreements | Total | In millions of dollars | Repurchase agreements | Securities lending agreements | Total |
| U.S. Treasury and federal agency securities | U.S. Treasury and federal agency securities | $ | 185,547 | | $ | 544 | | $ | 186,091 | |
| State and municipal securities | State and municipal securities | 1,465 | | — | | 1,465 | |
| Foreign government securities | Foreign government securities | 176,437 | | 593 | | 177,030 | |
| Corporate bonds | Corporate bonds | 16,729 | | 246 | | 16,975 | |
| Equity securities | Equity securities | 21,548 | | 27,561 | | 49,109 | |
| Mortgage-backed securities | Mortgage-backed securities | 54,842 | | 314 | | 55,156 | |
| Asset-backed securities | Asset-backed securities | 2,906 | | — | | 2,906 | |
| Other | Other | 6,866 | | 182 | | 7,048 | |
| Total | Total | $ | 466,340 | | $ | 29,440 | | $ | 495,780 | |
| | As of December 31, 2022 |
| As of December 31, 2023 | | | As of December 31, 2023 |
| In millions of dollars | In millions of dollars | Repurchase agreements | Securities lending agreements | Total | In millions of dollars | Repurchase agreements | Securities lending agreements | Total |
| U.S. Treasury and federal agency securities | U.S. Treasury and federal agency securities | $ | 99,979 | | $ | 106 | | $ | 100,085 | |
| State and municipal securities | State and municipal securities | 1,911 | | — | | 1,911 | |
| Foreign government securities | Foreign government securities | 123,826 | | 13 | | 123,839 | |
| Corporate bonds | Corporate bonds | 14,308 | | 45 | | 14,353 | |
| Equity securities | Equity securities | 9,749 | | 33,096 | | 42,845 | |
| Mortgage-backed securities | Mortgage-backed securities | 36,225 | | — | | 36,225 | |
| Asset-backed securities | Asset-backed securities | 1,755 | | — | | 1,755 | |
| Other | Other | 8,465 | | 9 | | 8,474 | |
| Total | Total | $ | 296,218 | | $ | 33,269 | | $ | 329,487 | |
11.12. BROKERAGE RECEIVABLES AND BROKERAGE PAYABLES
The Company has receivables and payables for financial instruments sold to and purchased from brokers, dealers and customers, which arise in the ordinary course of business.
For additional information on these receivables and payables, see Note 1213 to the Consolidated Financial Statements in Citi’s 20222023 Form 10-K.
Brokerage receivables and Brokerage payables consisted of the following:
| | In millions of dollars | In millions of dollars | June 30,
2023 | December 31, 2022 | In millions of dollars | March 31,
2024 | December 31, 2023 |
| Receivables from customers | Receivables from customers | $ | 16,305 | | $ | 15,462 | |
| Receivables from brokers, dealers and clearing organizations | Receivables from brokers, dealers and clearing organizations | 44,545 | | 38,730 | |
Total brokerage receivables(1) | Total brokerage receivables(1) | $ | 60,850 | | $ | 54,192 | |
| Payables to customers | Payables to customers | $ | 50,450 | | $ | 55,747 | |
| Payables to brokers, dealers and clearing organizations | Payables to brokers, dealers and clearing organizations | 18,983 | | 13,471 | |
Total brokerage payables(1) | Total brokerage payables(1) | $ | 69,433 | | $ | 69,218 | |
(1) Includes brokerage receivables and payables recorded by Citi broker-dealer entities that are accounted for in accordance with the AICPA Accounting Guide for Brokers and Dealers in Securities as codified in ASC 940-320.
12.13. INVESTMENTS
For additional information regarding Citi’s investment portfolios, including evaluating investments for impairment, see Note 1314 to the Consolidated Financial Statements
in Citi’s 20222023 Form 10-K.
The following table presents Citi’s investments by category:
| | In millions of dollars | In millions of dollars | June 30,
2023 | December 31, 2022 | In millions of dollars | March 31,
2024 | December 31, 2023 |
|
| | Debt securities available-for-sale (AFS) | |
| Debt securities available-for-sale (AFS) | |
| Debt securities available-for-sale (AFS) | |
| Debt securities available-for-sale (AFS) | |
| Debt securities available-for-sale (AFS) | |
| Debt securities available-for-sale (AFS) | |
| Debt securities available-for-sale (AFS) | |
| Debt securities available-for-sale (AFS) | |
| Debt securities available-for-sale (AFS) | Debt securities available-for-sale (AFS) | $ | 237,334 | | $ | 249,679 | |
Debt securities held-to-maturity (HTM)(1) | Debt securities held-to-maturity (HTM)(1) | 262,066 | | 268,863 | |
Marketable equity securities carried at fair value(2) | Marketable equity securities carried at fair value(2) | 296 | | 429 | |
Non-marketable equity securities carried at fair value(2)(5) | Non-marketable equity securities carried at fair value(2)(5) | 433 | | 466 | |
Non-marketable equity securities measured using the measurement alternative(3) | Non-marketable equity securities measured using the measurement alternative(3) | 1,618 | | 1,676 | |
Non-marketable equity securities carried at cost(4) | Non-marketable equity securities carried at cost(4) | 5,398 | | 5,469 | |
Total investments(6) | Total investments(6) | $ | 507,145 | | $ | 526,582 | |
(1)Carried at adjusted amortized cost basis, net of any ACL.
(2)Unrealized gains and losses are recognized in earnings.
(3)Impairment losses and adjustments to the carrying value as a result of observable price changes are recognized in earnings. See “Non-Marketable Equity Securities Not Carried at Fair Value” below.
(4) Represents shares issued by the Federal Reserve Bank, Federal Home Loan Banks and certain exchanges of which Citigroup is a member.
(5) Includes $24$27 million and $27$25 million of investments in funds for which the fair values are estimated using the net asset value of the Company’s ownership interest in the funds at June 30, 2023March 31, 2024 and December 31, 2022,2023, respectively.
(6) Not included in the balances above is approximately $2 billion of accrued interest receivable at June 30, 2023March 31, 2024 and December 31, 2022,2023, which is included in Other assets on the Consolidated Balance Sheet. The Company does not recognize an allowance for credit losses on accrued interest receivable for AFS and HTM debt securities, consistent with its non-accrual policy, which results in timely write-off of accrued interest. The Company did not reverse through interest income any accrued interest receivables for the quarters ended June 30, 2023March 31, 2024 and 2022.
The following table presents interest and dividend income on investments:
| | Three Months Ended June 30, | Six Months Ended June 30, |
| Three Months Ended March 31, | |
| Three Months Ended March 31, | |
| Three Months Ended March 31, | |
| In millions of dollars | |
| In millions of dollars | |
| In millions of dollars | In millions of dollars | 2023 | 2022 | 2023 | 2022 |
| Taxable interest | Taxable interest | $ | 4,284 | | $ | 2,274 | | $ | 8,284 | | $ | 4,287 | |
| Taxable interest | |
| Taxable interest | |
| Interest exempt from U.S. federal income tax | |
| Interest exempt from U.S. federal income tax | |
| Interest exempt from U.S. federal income tax | Interest exempt from U.S. federal income tax | 84 | | 38 | | 169 | | 43 | |
| Dividend income | Dividend income | 83 | | 58 | | 142 | | 90 | |
| Dividend income | |
| Dividend income | |
| Total interest and dividend income on investments | Total interest and dividend income on investments | $ | 4,451 | | $ | 2,370 | | $ | 8,595 | | $ | 4,420 | |
| Total interest and dividend income on investments | |
| Total interest and dividend income on investments | |
The following table presents realized gains and losses on the sales of investments, which exclude impairment losses:
| | Three Months Ended June 30, | Six Months Ended June 30, |
| Three Months Ended March 31, | |
| Three Months Ended March 31, | |
| Three Months Ended March 31, | |
| In millions of dollars | |
| In millions of dollars | |
| In millions of dollars | In millions of dollars | 2023 | 2022 | 2023 | 2022 |
| Gross realized investment gains | Gross realized investment gains | $ | 91 | | $ | 27 | | $ | 179 | | $ | 180 | |
| Gross realized investment gains | |
| Gross realized investment gains | |
| Gross realized investment losses | Gross realized investment losses | (42) | | (85) | | (58) | | (158) | |
| Net realized gains (losses) on sales of investments | $ | 49 | | $ | (58) | | $ | 121 | | $ | 22 | |
| Gross realized investment losses | |
| Gross realized investment losses | |
| Net realized gains on sales of investments | |
| Net realized gains on sales of investments | |
| Net realized gains on sales of investments | |
Debt Securities Available-for-Sale
The amortized cost and fair value of AFS debt securities were as follows:
| | | | June 30, 2023 | December 31, 2022 | | March 31, 2024 | December 31, 2023 |
| In millions of dollars | In millions of dollars | Amortized
cost | Gross
unrealized
gains | Gross
unrealized
losses | Allowance for credit losses | Fair
value | Amortized
cost | Gross
unrealized
gains | Gross
unrealized
losses | Allowance for credit losses | Fair
value | In millions of dollars | Amortized
cost | Gross
unrealized
gains | Gross
unrealized
losses | Allowance for credit losses | Fair
value | Amortized
cost | Gross
unrealized
gains | Gross
unrealized
losses | Allowance for credit losses | Fair
value |
| Debt securities AFS | Debt securities AFS | | | | | | | | Debt securities AFS | | | | | | | |
Mortgage-backed securities(1) | Mortgage-backed securities(1) | | | | | | | | Mortgage-backed securities(1) | | | | | | | |
U.S. government-sponsored agency guaranteed(2)(3) | U.S. government-sponsored agency guaranteed(2)(3) | $ | 15,578 | | $ | 82 | | $ | 697 | | $ | — | | $ | 14,963 | | $ | 12,009 | | $ | 8 | | $ | 755 | | $ | — | | $ | 11,262 | |
| | Residential | Residential | 340 | | — | | 3 | | — | | 337 | | 488 | | — | | 3 | | — | | 485 | |
| | Residential | |
| | Residential | |
| Commercial | Commercial | 2 | | — | | — | | — | | 2 | | 2 | | — | | — | | — | | 2 | |
| Total mortgage-backed securities | Total mortgage-backed securities | $ | 15,920 | | $ | 82 | | $ | 700 | | $ | — | | $ | 15,302 | | $ | 12,499 | | $ | 8 | | $ | 758 | | $ | — | | $ | 11,749 | |
| U.S. Treasury and federal agency securities | U.S. Treasury and federal agency securities | | | | | | | U.S. Treasury and federal agency securities | | | | | | | | | |
| U.S. Treasury | U.S. Treasury | $ | 84,250 | | $ | 23 | | $ | 2,030 | | $ | — | | $ | 82,243 | | $ | 94,732 | | $ | 50 | | $ | 2,492 | | $ | — | | $ | 92,290 | |
| Agency obligations | — | | — | | — | | — | | — | | — | | — | | — | | — | | — | |
| | Total U.S. Treasury and federal agency securities | |
| Total U.S. Treasury and federal agency securities | |
| Total U.S. Treasury and federal agency securities | Total U.S. Treasury and federal agency securities | $ | 84,250 | | $ | 23 | | $ | 2,030 | | $ | — | | $ | 82,243 | | $ | 94,732 | | $ | 50 | | $ | 2,492 | | $ | — | | $ | 92,290 | |
| State and municipal | State and municipal | $ | 2,305 | | $ | 24 | | $ | 127 | | $ | — | | $ | 2,202 | | $ | 2,363 | | $ | 19 | | $ | 159 | | $ | — | | $ | 2,223 | |
| Foreign government | Foreign government | 126,967 | | 356 | | 2,053 | | — | | 125,270 | | 135,648 | | 569 | | 2,940 | | — | | 133,277 | |
| Corporate | Corporate | 5,596 | | 13 | | 277 | | 5 | | 5,327 | | 5,146 | | 19 | | 246 | | 3 | | 4,916 | |
Asset-backed securities(1) | Asset-backed securities(1) | 842 | | 7 | | 3 | | — | | 846 | | 1,022 | | 12 | | 4 | | — | | 1,030 | |
| Other debt securities | Other debt securities | 6,145 | | 2 | | 3 | | — | | 6,144 | | 4,198 | | 1 | | 5 | | — | | 4,194 | |
| Total debt securities AFS | Total debt securities AFS | $ | 242,025 | | $ | 507 | | $ | 5,193 | | $ | 5 | | $ | 237,334 | | $ | 255,608 | | $ | 678 | | $ | 6,604 | | $ | 3 | | $ | 249,679 | |
(1)The Company invests in mortgage- and asset-backed securities, which are typically issued by VIEs through securitization transactions. The Company’s maximum exposure to loss from these VIEs is equal to the carrying amount of the securities, which is reflected in the table above. See Note 2021 for mortgage- and asset-backed securitizations in which the Company has other involvement.
(2)In January 2023, Citi adopted ASU 2022-01. Upon adoption, Citi transferred $3.3 billion of mortgage-backed securities from HTM classification to AFS classification as allowed under the ASU. At the time of transfer, the securities were in an unrealized gain position of $0.1 billion, which was recorded in AOCI upon transfer. See Note 1 to the Consolidated Financial Statements in Citi’s 20222023 Form 10-K.
(3)Amortized cost includes unallocated portfolio layer cumulative basis adjustments of $(0.2)$(0.1) billion as of June 30, 2023.March 31, 2024. Gross unrealized gains and gross unrealized losses(losses) on mortgage-backed securities excluding the effect of unallocated portfolio layer cumulative basis adjustments were $32$140 million and $848$(860) million, respectively, as of June 30, 2023.March 31, 2024.
The following table presents the fair value of AFS debt securities that have been in an unrealized loss position:
| | | | Less than 12 months | 12 months or longer | Total | | Less than 12 months | 12 months or longer | Total |
| In millions of dollars | In millions of dollars | Fair
value | Gross
unrealized
losses | Fair
value | Gross
unrealized
losses | Fair
value | Gross
unrealized
losses | In millions of dollars | Fair
value | Gross
unrealized
losses | Fair
value | Gross
unrealized
losses | Fair
value | Gross
unrealized
losses |
| June 30, 2023 | | | | | |
| March 31, 2024 | | March 31, 2024 | | | | | |
| Debt securities AFS | Debt securities AFS | | | | | | Debt securities AFS | | | | | |
| Mortgage-backed securities | Mortgage-backed securities | | | | | | Mortgage-backed securities | | | | | |
U.S. government-sponsored agency guaranteed(1) | $ | 2,276 | | $ | 73 | | $ | 9,385 | | $ | 624 | | $ | 11,661 | | $ | 697 | |
| U.S. government-sponsored agency guaranteed | |
| | Residential | Residential | 331 | | 3 | | — | | — | | 331 | | 3 | |
| Commercial | — | | — | | 2 | | — | | 2 | | — | |
| Residential | |
| Residential | |
| | Total mortgage-backed securities | |
| Total mortgage-backed securities | |
| Total mortgage-backed securities | Total mortgage-backed securities | $ | 2,607 | | $ | 76 | | $ | 9,387 | | $ | 624 | | $ | 11,994 | | $ | 700 | |
| U.S. Treasury and federal agency securities | U.S. Treasury and federal agency securities | | | | | | U.S. Treasury and federal agency securities | | | | | |
| U.S. Treasury | U.S. Treasury | $ | 20,820 | | $ | 743 | | $ | 48,429 | | $ | 1,287 | | $ | 69,249 | | $ | 2,030 | |
| | Total U.S. Treasury and federal agency securities | |
| Total U.S. Treasury and federal agency securities | |
| Total U.S. Treasury and federal agency securities | Total U.S. Treasury and federal agency securities | $ | 20,820 | | $ | 743 | | $ | 48,429 | | $ | 1,287 | | $ | 69,249 | | $ | 2,030 | |
| State and municipal | State and municipal | $ | 414 | | $ | 14 | | $ | 847 | | $ | 113 | | $ | 1,261 | | $ | 127 | |
| Foreign government | Foreign government | 63,765 | | 1,446 | | 19,543 | | 607 | | 83,308 | | 2,053 | |
| Corporate | Corporate | 2,893 | | 220 | | 1,583 | | 57 | | 4,476 | | 277 | |
| Asset-backed securities | Asset-backed securities | 640 | | 3 | | — | | — | | 640 | | 3 | |
| Other debt securities | Other debt securities | 1,491 | | 3 | | — | | — | | 1,491 | | 3 | |
| Total debt securities AFS | Total debt securities AFS | $ | 92,630 | | $ | 2,505 | | $ | 79,789 | | $ | 2,688 | | $ | 172,419 | | $ | 5,193 | |
| December 31, 2022 | | | | | |
| December 31, 2023 | | December 31, 2023 | | | | | |
| Debt securities AFS | Debt securities AFS | | | | | | Debt securities AFS | | | | | |
| Mortgage-backed securities | Mortgage-backed securities | | | | | | Mortgage-backed securities | | | | | |
| U.S. government-sponsored agency guaranteed | U.S. government-sponsored agency guaranteed | $ | 7,908 | | $ | 412 | | $ | 3,290 | | $ | 343 | | $ | 11,198 | | $ | 755 | |
| | Residential | Residential | 158 | | 3 | | 1 | | — | | 159 | | 3 | |
| Commercial | 1 | | — | | 1 | | — | | 2 | | — | |
| Residential | |
| Residential | |
| | Total mortgage-backed securities | |
| Total mortgage-backed securities | |
| Total mortgage-backed securities | Total mortgage-backed securities | $ | 8,067 | | $ | 415 | | $ | 3,292 | | $ | 343 | | $ | 11,359 | | $ | 758 | |
| U.S. Treasury and federal agency securities | U.S. Treasury and federal agency securities | | | | | | U.S. Treasury and federal agency securities | | | | | |
| U.S. Treasury | U.S. Treasury | $ | 40,701 | | $ | 1,001 | | $ | 34,692 | | $ | 1,491 | | $ | 75,393 | | $ | 2,492 | |
| Agency obligations | — | | — | | — | | — | | — | | — | |
| | Total U.S. Treasury and federal agency securities | |
| Total U.S. Treasury and federal agency securities | |
| Total U.S. Treasury and federal agency securities | Total U.S. Treasury and federal agency securities | $ | 40,701 | | $ | 1,001 | | $ | 34,692 | | $ | 1,491 | | $ | 75,393 | | $ | 2,492 | |
| State and municipal | State and municipal | $ | 896 | | $ | 31 | | $ | 707 | | $ | 128 | | $ | 1,603 | | $ | 159 | |
| Foreign government | Foreign government | 82,900 | | 2,332 | | 14,220 | | 608 | | 97,120 | | 2,940 | |
| Corporate | Corporate | 3,082 | | 209 | | 784 | | 37 | | 3,866 | | 246 | |
| Asset-backed securities | Asset-backed securities | 708 | | 4 | | — | | — | | 708 | | 4 | |
| Other debt securities | Other debt securities | 2,213 | | 5 | | — | | — | | 2,213 | | 5 | |
| Total debt securities AFS | Total debt securities AFS | $ | 138,567 | | $ | 3,997 | | $ | 53,695 | | $ | 2,607 | | $ | 192,262 | | $ | 6,604 | |
(1) Gross unrealized losses on mortgage-backed securities excluding the effect of unallocated portfolio layer cumulative basis adjustments were $82 million and $767 million for less than 12 months and 12 months or longer, respectively.
The following table presents the amortized cost and fair value of AFS debt securities by contractual maturity dates:
| | | |
| | | | | | June 30, 2023 | December 31, 2022 |
| In millions of dollars | In millions of dollars | Amortized
cost | Fair
value | Amortized
cost | Fair
value |
| In millions of dollars | |
| In millions of dollars | |
Mortgage-backed securities(1) | |
Mortgage-backed securities(1) | |
Mortgage-backed securities(1) | Mortgage-backed securities(1) | | | |
| Due within 1 year | Due within 1 year | $ | 4 | | $ | 4 | | $ | 42 | | $ | 44 | |
| Due within 1 year | |
| Due within 1 year | |
| After 1 but within 5 years | |
| After 1 but within 5 years | |
| After 1 but within 5 years | After 1 but within 5 years | 403 | | 393 | | 523 | | 513 | |
| After 5 but within 10 years | After 5 but within 10 years | 500 | | 473 | | 468 | | 440 | |
| After 5 but within 10 years | |
| After 5 but within 10 years | |
| After 10 years | |
| After 10 years | |
| After 10 years | After 10 years | 15,214 | | 14,432 | | 11,466 | | 10,752 | |
Total(2) | Total(2) | $ | 16,121 | | $ | 15,302 | | $ | 12,499 | | $ | 11,749 | |
Total(2) | |
Total(2) | |
| U.S. Treasury and federal agency securities | |
| U.S. Treasury and federal agency securities | |
| U.S. Treasury and federal agency securities | U.S. Treasury and federal agency securities | | | | |
| Due within 1 year | Due within 1 year | $ | 25,343 | | $ | 25,156 | | $ | 25,935 | | $ | 25,829 | |
| Due within 1 year | |
| Due within 1 year | |
| After 1 but within 5 years | |
| After 1 but within 5 years | |
| After 1 but within 5 years | After 1 but within 5 years | 58,339 | | 56,565 | | 68,455 | | 66,166 | |
| After 5 but within 10 years | After 5 but within 10 years | 568 | | 522 | | 342 | | 295 | |
| After 5 but within 10 years | |
| After 5 but within 10 years | |
| After 10 years | |
| After 10 years | |
| After 10 years | After 10 years | — | | — | | — | | — | |
| Total | Total | $ | 84,250 | | $ | 82,243 | | $ | 94,732 | | $ | 92,290 | |
| Total | |
| Total | |
| State and municipal | |
| State and municipal | |
| State and municipal | State and municipal | | | |
| Due within 1 year | Due within 1 year | $ | 14 | | $ | 12 | | $ | 19 | | $ | 18 | |
| Due within 1 year | |
| Due within 1 year | |
| After 1 but within 5 years | |
| After 1 but within 5 years | |
| After 1 but within 5 years | After 1 but within 5 years | 93 | | 92 | | 94 | | 92 | |
| After 5 but within 10 years | After 5 but within 10 years | 279 | | 275 | | 305 | | 302 | |
| After 5 but within 10 years | |
| After 5 but within 10 years | |
| After 10 years | |
| After 10 years | |
| After 10 years | After 10 years | 1,919 | | 1,823 | | 1,945 | | 1,811 | |
| Total | Total | $ | 2,305 | | $ | 2,202 | | $ | 2,363 | | $ | 2,223 | |
| Total | |
| Total | |
| Foreign government | |
| Foreign government | |
| Foreign government | Foreign government | | | |
| Due within 1 year | Due within 1 year | $ | 55,587 | | $ | 55,384 | | $ | 64,795 | | $ | 64,479 | |
| Due within 1 year | |
| Due within 1 year | |
| After 1 but within 5 years | |
| After 1 but within 5 years | |
| After 1 but within 5 years | After 1 but within 5 years | 66,904 | | 65,612 | | 67,935 | | 66,150 | |
| After 5 but within 10 years | After 5 but within 10 years | 3,897 | | 3,725 | | 2,491 | | 2,250 | |
| After 5 but within 10 years | |
| After 5 but within 10 years | |
| After 10 years | |
| After 10 years | |
| After 10 years | After 10 years | 579 | | 549 | | 427 | | 398 | |
| Total | Total | $ | 126,967 | | $ | 125,270 | | $ | 135,648 | | $ | 133,277 | |
| Total | |
| Total | |
All other(3) | |
All other(3) | |
All other(3) | All other(3) | | | | |
| Due within 1 year | Due within 1 year | $ | 5,763 | | $ | 5,759 | | $ | 4,452 | | $ | 4,441 | |
| Due within 1 year | |
| Due within 1 year | |
| After 1 but within 5 years | |
| After 1 but within 5 years | |
| After 1 but within 5 years | After 1 but within 5 years | 6,174 | | 5,962 | | 5,162 | | 4,988 | |
| After 5 but within 10 years | After 5 but within 10 years | 588 | | 583 | | 695 | | 693 | |
| After 5 but within 10 years | |
| After 5 but within 10 years | |
| After 10 years | |
| After 10 years | |
| After 10 years | After 10 years | 58 | | 13 | | 57 | | 18 | |
| Total | Total | $ | 12,583 | | $ | 12,317 | | $ | 10,366 | | $ | 10,140 | |
| Total | |
| Total | |
Total debt securities AFS(2) | Total debt securities AFS(2) | $ | 242,226 | | $ | 237,334 | | $ | 255,608 | | $ | 249,679 | |
Total debt securities AFS(2) | |
Total debt securities AFS(2) | |
(1)Includes mortgage-backed securities of U.S. government-sponsored agencies. The Company invests in mortgage- and asset-backed securities, which are typically issued by VIEs through securitization transactions. See Note 2021 for moreadditional information about mortgage- and asset-backed securitizations in which the Company has other involvement.
(2)Amortized cost excludes unallocated portfolio layer cumulative basis adjustments of $(0.2)$(0.1) billion as of June 30, 2023.March 31, 2024.
(3)Includes corporate, asset-backed and other debt securities.
Debt Securities Held-to-Maturity
The carrying value and fair value of debt securities HTM were as follows:
| | In millions of dollars | In millions of dollars | | Amortized cost, net(1) | Gross
unrealized
gains | Gross
unrealized
losses | Fair
value |
| June 30, 2023 | | | |
| In millions of dollars | |
| In millions of dollars | | | | Amortized cost, net(1) | Gross
unrealized
gains | Gross
unrealized
losses | Fair
value |
| March 31, 2024 | | March 31, 2024 | | | | |
| Debt securities HTM | Debt securities HTM | | | | Debt securities HTM | | | | | |
Mortgage-backed securities(2) | Mortgage-backed securities(2) | | | |
U.S. government-sponsored agency guaranteed(3) | U.S. government-sponsored agency guaranteed(3) | | $ | 83,541 | | $ | 6 | | $ | 9,708 | | $ | 73,839 | |
U.S. government-sponsored agency guaranteed(3) | |
U.S. government-sponsored agency guaranteed(3) | |
| | Non-U.S. residential | |
| Non-U.S. residential | |
| Non-U.S. residential | Non-U.S. residential | | 362 | | — | | — | | 362 | |
| Commercial | Commercial | | 1,145 | | — | | 149 | | 996 | |
| Total mortgage-backed securities | Total mortgage-backed securities | | $ | 85,048 | | $ | 6 | | $ | 9,857 | | $ | 75,197 | |
| U.S. Treasury securities | U.S. Treasury securities | | $ | 134,944 | | $ | — | | $ | 13,091 | | $ | 121,853 | |
| State and municipal | State and municipal | | 9,181 | | 35 | | 628 | | 8,588 | |
| Foreign government | Foreign government | | 2,360 | | — | | 93 | | 2,267 | |
Asset-backed securities(2) | Asset-backed securities(2) | | 30,533 | | — | | 417 | | 30,116 | |
| | Total debt securities HTM, net | Total debt securities HTM, net | | $ | 262,066 | | $ | 41 | | $ | 24,086 | | $ | 238,021 | |
| December 31, 2022 | | | |
| Total debt securities HTM, net | |
| Total debt securities HTM, net | |
| December 31, 2023 | | December 31, 2023 | | | | | |
| Debt securities HTM | Debt securities HTM | | | | | Debt securities HTM | | | | | | |
Mortgage-backed securities(2) | Mortgage-backed securities(2) | | | | Mortgage-backed securities(2) | | | | | |
| U.S. government-sponsored agency guaranteed | U.S. government-sponsored agency guaranteed | | $ | 90,063 | | $ | 58 | | $ | 10,033 | | $ | 80,088 | |
| | | Non-U.S. residential | |
| | Non-U.S. residential | |
| | Non-U.S. residential | Non-U.S. residential | | 445 | | — | | — | | 445 | |
| Commercial | Commercial | | 1,114 | | 5 | | 1 | | 1,118 | |
| Total mortgage-backed securities | Total mortgage-backed securities | | $ | 91,622 | | $ | 63 | | $ | 10,034 | | $ | 81,651 | |
| U.S. Treasury securities | U.S. Treasury securities | | $ | 134,961 | | $ | — | | $ | 13,722 | | $ | 121,239 | |
| State and municipal | State and municipal | | 9,237 | | 34 | | 764 | | 8,507 | |
| Foreign government | Foreign government | | 2,075 | | — | | 93 | | 1,982 | |
Asset-backed securities(2) | Asset-backed securities(2) | | 30,968 | | 4 | | 703 | | 30,269 | |
| Total debt securities HTM, net | Total debt securities HTM, net | | $ | 268,863 | | $ | 101 | | $ | 25,316 | | $ | 243,648 | |
(1)Amortized cost is reported net of ACL of $99$106 million and $120$95 million at June 30, 2023March 31, 2024 and December 31, 2022,2023, respectively.
(2)The Company invests in mortgage- and asset-backed securities. These securitizations are generally considered VIEs. The Company’s maximum exposure to loss from these VIEs is equal to the carrying amount of the securities, which is reflected in the table above. See Note 2021 for mortgage- and asset-backed securitizations in which the Company has other involvement.
(3)In January 2023, Citi adopted ASU 2022-01. Upon adoption, Citi transferred $3.3 billion (amortized cost) of mortgage-backed securities from HTM classification to AFS classification as allowed under the ASU. At the time of transfer, the securities were in an unrealized gain position of $0.1 billion, which was recorded in AOCI upon transfer. See Note 1 to the Consolidated Financial Statements in Citi’s 20222023 Form 10-K.
The following table presents the carrying value and fair value of HTM debt securities by contractual maturity dates:
| | | |
| | | | | | June 30, 2023 | December 31, 2022 |
| In millions of dollars | In millions of dollars | Amortized cost(1) | Fair value | | Amortized cost(1) | Fair value | |
| In millions of dollars | |
| In millions of dollars | |
| Mortgage-backed securities | |
| Mortgage-backed securities | |
| Mortgage-backed securities | Mortgage-backed securities | | | | |
| Due within 1 year | Due within 1 year | $ | 15 | | $ | 15 | | | $ | 27 | | $ | 27 | | |
| Due within 1 year | |
| Due within 1 year | |
| After 1 but within 5 years | |
| After 1 but within 5 years | |
| After 1 but within 5 years | After 1 but within 5 years | 690 | | 655 | | | 520 | | 505 | | |
| After 5 but within 10 years | After 5 but within 10 years | 1,254 | | 1,141 | | | 1,496 | | 1,374 | | |
| After 5 but within 10 years | |
| After 5 but within 10 years | |
| After 10 years | |
| After 10 years | |
| After 10 years | After 10 years | 83,089 | | 73,386 | | | 89,579 | | 79,745 | | |
| Total | Total | $ | 85,048 | | $ | 75,197 | | | $ | 91,622 | | $ | 81,651 | | |
| Total | |
| Total | |
| U.S. Treasury securities | |
| U.S. Treasury securities | |
| U.S. Treasury securities | U.S. Treasury securities | | | | |
| Due within 1 year | Due within 1 year | $ | 3,149 | | $ | 3,077 | | | $ | 3,148 | | $ | 3,017 | | |
| Due within 1 year | |
| Due within 1 year | |
| After 1 but within 5 years | |
| After 1 but within 5 years | |
| After 1 but within 5 years | After 1 but within 5 years | 120,838 | | 109,351 | | | 86,617 | | 79,104 | | |
| After 5 but within 10 years | After 5 but within 10 years | 10,957 | | 9,425 | | | 45,196 | | 39,118 | | |
| After 5 but within 10 years | |
| After 5 but within 10 years | |
| After 10 years | |
| After 10 years | |
| After 10 years | After 10 years | — | | — | | | — | | — | | |
| Total | Total | $ | 134,944 | | $ | 121,853 | | | $ | 134,961 | | $ | 121,239 | | |
| Total | |
| Total | |
| State and municipal | |
| State and municipal | |
| State and municipal | State and municipal | | | | |
| Due within 1 year | Due within 1 year | $ | 36 | | $ | 35 | | | $ | 22 | | $ | 21 | | |
| Due within 1 year | |
| Due within 1 year | |
| After 1 but within 5 years | |
| After 1 but within 5 years | |
| After 1 but within 5 years | After 1 but within 5 years | 104 | | 102 | | | 102 | | 100 | | |
| After 5 but within 10 years | After 5 but within 10 years | 1,222 | | 1,183 | | | 1,002 | | 967 | | |
| After 5 but within 10 years | |
| After 5 but within 10 years | |
| After 10 years | |
| After 10 years | |
| After 10 years | After 10 years | 7,819 | | 7,268 | | | 8,111 | | 7,419 | | |
| Total | Total | $ | 9,181 | | $ | 8,588 | | | $ | 9,237 | | $ | 8,507 | | |
| Total | |
| Total | |
| Foreign government | |
| Foreign government | |
| Foreign government | Foreign government | | | | |
| Due within 1 year | Due within 1 year | $ | 163 | | $ | 161 | | | $ | 143 | | $ | 139 | | |
| Due within 1 year | |
| Due within 1 year | |
| After 1 but within 5 years | |
| After 1 but within 5 years | |
| After 1 but within 5 years | After 1 but within 5 years | 2,197 | | 2,106 | | | 1,932 | | 1,843 | | |
| After 5 but within 10 years | After 5 but within 10 years | — | | — | | | — | | — | | |
| After 5 but within 10 years | |
| After 5 but within 10 years | |
| After 10 years | |
| After 10 years | |
| After 10 years | After 10 years | — | | — | | | — | | — | | |
| Total | Total | $ | 2,360 | | $ | 2,267 | | | $ | 2,075 | | $ | 1,982 | | |
| Total | |
| Total | |
All other(2) | |
All other(2) | |
All other(2) | All other(2) | | | | |
| Due within 1 year | Due within 1 year | $ | — | | $ | — | | | $ | — | | $ | — | | |
| Due within 1 year | |
| Due within 1 year | |
| After 1 but within 5 years | |
| After 1 but within 5 years | |
| After 1 but within 5 years | After 1 but within 5 years | — | | — | | | — | | — | | |
| After 5 but within 10 years | After 5 but within 10 years | 12,232 | | 12,141 | | | 11,751 | | 11,583 | | |
| After 5 but within 10 years | |
| After 5 but within 10 years | |
| After 10 years | |
| After 10 years | |
| After 10 years | After 10 years | 18,301 | | 17,975 | | | 19,217 | | 18,686 | | |
| Total | Total | $ | 30,533 | | $ | 30,116 | | | $ | 30,968 | | $ | 30,269 | | |
| Total | |
| Total | |
| Total debt securities HTM | Total debt securities HTM | $ | 262,066 | | $ | 238,021 | | | $ | 268,863 | | $ | 243,648 | | |
| Total debt securities HTM | |
| Total debt securities HTM | |
(1)Amortized cost is reported net of ACL of $99 million and $120$106 million at June 30, 2023 and DecemberMarch 31, 2022, respectively.2024.
(2)Includes corporate and asset-backed securities.
HTM Debt Securities Delinquency and Non-Accrual Details
Citi did not have any HTM debt securities that were delinquent or on non-accrual status at June 30, 2023March 31, 2024 orand December 31, 2022.2023.
There were no purchased credit-deteriorated HTM debt securities held by the Company as of June 30, 2023March 31, 2024 orand December 31, 2022.2023.
Evaluating Investments for Impairment—AFS Debt Securities
Overview
The Company conducts periodic reviews of all AFS debt securities with unrealized losses to evaluate whether the impairment resulted from expected credit losses or from other factors and to evaluate the Company’s intent to sell such securities.
For more information on evaluating investments for impairment, see Note 1314 to the Consolidated Financial Statements in Citi’s 20222023 Form 10-K.
Recognition and Measurement of Impairment
The following table presents total impairment on AFS investments recognized in earnings:
| | | | | | | | | | | | | | |
| Three Months Ended June 30, | Six Months Ended June 30, |
| In millions of dollars | 2023 | 2022 | 2023 | 2022 |
Impairment losses related to debt securities that the Company does not intend to sell
nor will likely be required to sell: | | | | |
| Total impairment losses recognized during the period | $ | — | | $ | — | | $ | — | | $ | — | |
Less: portion of impairment loss recognized in AOCI (before taxes) | — | | — | | — | | — | |
Net impairment losses recognized in earnings for debt securities that the Company
does not intend to sell nor will likely be required to sell | $ | — | | $ | — | | $ | — | | $ | — | |
Impairment losses recognized in earnings for debt securities that the Company
intends to sell, would more-likely-than-not be required to sell or will be subject
to an issuer call deemed probable of exercise | 43 | | 90 | | 94 | | 180 | |
| Total impairment losses recognized in earnings | $ | 43 | | $ | 90 | | $ | 94 | | $ | 180 | |
| | | | | | | | | | |
| Three Months Ended March 31, | |
| In millions of dollars | 2024 | 2023 | | |
| | | | |
| | | | |
| | | | |
| | | | |
| Impairment losses recognized in earnings for debt securities that the Company intends to sell, would more-likely-than-not be required to sell or will be subject to an issuer call deemed probable of exercise | $ | 14 | | $ | 51 | | | |
| | | | |
Allowance for Credit Losses on AFS Debt Securities
The allowance for credit losses on AFS debt securities held that the Company does not intend to sell nor will likely be required to sell was $5$9 million and $3$8 million as of June 30, 2023March 31, 2024 and December 31, 2022,2023, respectively.
Non-Marketable Equity Securities Not Carried at
Fair Value
Non-marketable equity securities are required to be measured at fair value with changes in fair value recognized in earnings unless (i) the measurement alternative is elected or (ii) the investment represents Federal Reserve Bank and Federal Home Loan Bank stock or certain exchange seats that continue to be carried at cost.
The election to measure a non-marketable equity security using the measurement alternative is made on an instrument-by-instrument basis. Under the measurement alternative, an equity security is carried at cost plus or minus changes resulting from observable prices in orderly transactions for the identical or a similar investment of the same issuer. The carrying value of the equity security is adjusted to fair value on the date of an observed transaction. Fair value may differ from the observed transaction price due to a number of factors, including marketability adjustments and differences in rights and obligations when the observed transaction is not for the identical investment held by Citi.
Equity securities under the measurement alternative are also assessed for impairment. On a quarterly basis, management qualitatively assesses whether each equity security under the measurement alternative is impaired. For details on impairment indicators that are considered, see Note 1314 to the Consolidated Financial Statements in Citi’s 20222023 Form 10-K.
When the qualitative assessment indicates that the equity security is impaired, its fair value is determined. If the fair value of the investment is less than its carrying value, the investment is written down to fair value through earnings.
Below is the carrying value of non-marketable equity securities measured using the measurement alternative at June 30, 2023March 31, 2024 and December 31, 20222023:
| | In millions of dollars | In millions of dollars | June 30, 2023 | December 31, 2022 | In millions of dollars | March 31, 2024 | December 31, 2023 |
| Measurement alternative: | Measurement alternative: | |
| Carrying value | Carrying value | $ | 1,618 | | $ | 1,676 | |
| Carrying value | |
| Carrying value | |
Below are amounts recognized in earnings and life-to-date amounts for non-marketable equity securities measured using the measurement alternative:
| | Three Months Ended June 30, | Six Months Ended June 30, |
| Three Months Ended March 31, | |
| Three Months Ended March 31, | |
| Three Months Ended March 31, | |
| In millions of dollars | |
| In millions of dollars | |
| In millions of dollars | In millions of dollars | 2023 | 2022 | 2023 | 2022 |
Measurement alternative(1): | Measurement alternative(1): | | | |
Measurement alternative(1): | |
Measurement alternative(1): | |
| Impairment losses | |
| Impairment losses | |
| Impairment losses | Impairment losses | $ | 28 | | $ | 6 | | $ | 63 | | $ | 6 | |
| Downward changes for observable prices | Downward changes for observable prices | — | | — | | 20 | | — | |
| Downward changes for observable prices | |
| Downward changes for observable prices | |
| Upward changes for observable prices | Upward changes for observable prices | 3 | | 48 | | 33 | | 134 | |
| Upward changes for observable prices | |
| Upward changes for observable prices | |
(1) See Note 2223 for additional information on these nonrecurring fair value measurements.
| | | | | |
| Life-to-date amounts on securities still held |
| In millions of dollars | June 30, 2023March 31, 2024 |
| Measurement alternative: | |
| Impairment losses | $ | 282351 | |
| Downward changes for observable prices | 2634 | |
| Upward changes for observable prices | 900999 | |
A similar impairment analysis is performed for non-marketable equity securities carried at cost. For the three months ended June 30,March 31, 2024 and 2023, and 2022, there was no impairment loss recognized in earnings for non-marketable equity securities carried at cost.
13.14. LOANS
Citigroup loans are reported in two categories: corporate and consumer. These categories are classified primarily according to the operating segment, reporting unit and component that manage the loans in addition to the nature of the obligor, with corporate loans generally made for corporate institutional and public sector clients around the world and consumer loans to retail and small business customers. For additional information regarding Citi’s corporate and consumer loans, including related accounting policies, see Note 1 above and Notes 1 and 1415 to the Consolidated Financial Statements in Citi’s 20222023 Form 10-K.
Corporate Loans
Corporate loans represent loans and leases managed by ICGServices, Markets, Banking and the Mexico SBMM component of All Other—Legacy Franchises.Franchises. The following table presents information by corporate loan type:
| | In millions of dollars | In millions of dollars | June 30,
2023 | December 31,
2022 | In millions of dollars | March 31,
2024 | December 31,
2023 |
In North America offices(1) | In North America offices(1) | | In North America offices(1) | |
| Commercial and industrial | Commercial and industrial | $ | 59,790 | | $ | 56,176 | |
| Financial institutions | Financial institutions | 36,268 | | 43,399 | |
Mortgage and real estate(2) | Mortgage and real estate(2) | 17,495 | | 17,829 | |
| Installment and other | Installment and other | 22,153 | | 23,767 | |
| Lease financing | Lease financing | 224 | | 308 | |
| Total | Total | $ | 135,930 | | $ | 141,479 | |
In offices outside North America(1) | In offices outside North America(1) | | | In offices outside North America(1) | | |
| Commercial and industrial | Commercial and industrial | $ | 95,836 | | $ | 93,967 | |
| Financial institutions | Financial institutions | 21,701 | | 21,931 | |
Mortgage and real estate(2) | Mortgage and real estate(2) | 6,076 | | 4,179 | |
| Installment and other | Installment and other | 23,395 | | 23,347 | |
| Lease financing | Lease financing | 49 | | 46 | |
| Governments and official institutions | Governments and official institutions | 3,034 | | 4,205 | |
| Total | Total | $ | 150,091 | | $ | 147,675 | |
Corporate loans, net of unearned income, excluding portfolio layer cumulative basis adjustments(3)(4)(5) | |
Unallocated portfolio layer cumulative basis adjustments(6) | |
Corporate loans, net of unearned income(3)(4)(5) | Corporate loans, net of unearned income(3)(4)(5) | $ | 286,021 | | $ | 289,154 | |
(1)North America includes the U.S., Canada and Puerto Rico. Mexico is included in offices outside North America. The classification between offices in North America and outside North America is based on the domicile of the booking unit. The difference between the domicile of the booking unit and the domicile of the managing unit is not material.
(2)Loans secured primarily by real estate.
(3)Corporate loans are net of unearned income of ($795)968) million and ($797)917) million at June 30, 2023March 31, 2024 and December 31, 2022,2023, respectively. Unearned income on corporate loans primarily represents interest received in advance, but not yet earned, on loans originated on a discounted basis.loan origination fees, net of certain direct origination costs, that are deferred and recognized as Interest income over the lives of the related loans.
(4)Not included in the balances above is approximately $2 billion of accrued interest receivable at June 30, 2023March 31, 2024 and December 31, 2022,2023, which is included in Other assets on the Consolidated Balance Sheet.
(5)Accrued interest receivable considered to be uncollectible is reversed through interest income. Amounts reversed were not material for the three months ended June 30, 2023March 31, 2024 and 2022.2023.
(6)Represents fair value hedge basis adjustments related to portfolio layer method hedges of mortgage and real estate loans, which are not allocated to individual loans in the portfolio. See Note 22.
The Company sold and/or reclassified to held-for-sale $1.3$0.9 billion and $2.9$0.9 billion of corporate loans during the three and six months ended June 30,March 31, 2024 and 2023, respectively, and $1.1 billion and $1.5 billion of corporate loans during the three and six months ended June 30, 2022, respectively. The Company did not have significant purchases of corporate loans classified as held-for-investment for the three and six months ended June 30, 2023March 31, 2024 or 2022.2023.
Corporate Loan Delinquencies and Non-Accrual Details at June 30, 2023March 31, 2024
| | In millions of dollars | In millions of dollars | 30–89 days past due and accruing(1) | ≥ 90 days past due and accruing(1) | Total past due
and accruing | Total non-accrual(2) | Total current(3) | Total loans(4) | In millions of dollars | 30–89 days past due and accruing(1) | ≥ 90 days past due and accruing(1) | Total past due
and accruing | Total non-accrual(2) | Total current(3) | Total loans(4) |
| Commercial and industrial | Commercial and industrial | $ | 500 | | $ | 197 | | $ | 697 | | $ | 856 | | $ | 151,038 | | $ | 152,591 | |
| Financial institutions | Financial institutions | 10 | | 11 | | 21 | | 93 | | 57,480 | | 57,594 | |
| Mortgage and real estate | Mortgage and real estate | 6 | | 24 | | 30 | | 291 | | 23,180 | | 23,501 | |
| Lease financing | Lease financing | — | | — | | — | | — | | 273 | | 273 | |
| Other | Other | 56 | | 35 | | 91 | | 21 | | 46,421 | | 46,533 | |
| Loans at fair value | Loans at fair value | | 5,529 | |
| | Total | $ | 572 | | $ | 267 | | $ | 839 | | $ | 1,261 | | $ | 278,392 | | $ | 286,021 | |
Total(5) | |
Total(5) | |
Total(5) | |
Corporate Loan Delinquencies and Non-Accrual Details at December 31, 20222023
| | In millions of dollars | In millions of dollars | 30–89 days past due and accruing(1) | ≥ 90 days past due and accruing(1) | Total past due
and accruing | Total non-accrual(2) | Total current(3) | Total loans(4) | In millions of dollars | 30–89 days past due and accruing(1) | ≥ 90 days past due and accruing(1) | Total past due
and accruing | Total non-accrual(2) | Total current(3) | Total loans(4) |
| Commercial and industrial | Commercial and industrial | $ | 763 | | $ | 594 | | $ | 1,357 | | $ | 860 | | $ | 145,586 | | $ | 147,803 | |
| Financial institutions | Financial institutions | 233 | | 102 | | 335 | | 152 | | 64,420 | | 64,907 | |
| Mortgage and real estate | Mortgage and real estate | 30 | | 12 | | 42 | | 33 | | 21,874 | | 21,949 | |
| Lease financing | Lease financing | — | | 1 | | 1 | | 10 | | 343 | | 354 | |
| Other | Other | 145 | | 18 | | 163 | | 67 | | 48,788 | | 49,018 | |
| Loans at fair value | Loans at fair value | | 5,123 | |
| | Total | $ | 1,171 | | $ | 727 | | $ | 1,898 | | $ | 1,122 | | $ | 281,011 | | $ | 289,154 | |
Total(5) | |
Total(5) | |
Total(5) | |
(1)Corporate loans that are 90 days past due are generally classified as non-accrual. Corporate loans are considered past due when principal or interest is contractually due but unpaid.
(2)Non-accrual loans generally include those loans that are 90 days or more past due or those loans for which Citi believes, based on actual experience and a forward-looking assessment of the collectibility of the loan in full, that the payment of interest and/or principal is doubtful.
(3)Loans less than 30 days past due are presented as current.
(4)The Total loans column includes loans at fair value, which are not included in the various delinquency columns and, therefore, the tables’ total rows will not cross-foot.
(5)Excludes $(3) million and $93 million of unallocated portfolio layer cumulative basis adjustments at March 31, 2024 and December 31, 2023, respectively.
N/A Not applicable
Corporate Loans Credit Quality Indicators
| | | | Recorded investment in loans(1) |
| | Term loans by year of origination | Revolving line of credit arrangements(2) | | June 30, 2023 | |
| | | Recorded investment in loans(1) |
| Term loans by year of origination | |
| In millions of dollars | |
| In millions of dollars | |
| In millions of dollars | In millions of dollars | 2023 | 2022 | 2021 | 2020 | 2019 | Prior | Revolving line of credit arrangements(2) | | June 30, 2023 |
Investment grade(3) | Investment grade(3) | | |
Investment grade(3) | |
Investment grade(3) | |
Commercial and industrial(4) | |
Commercial and industrial(4) | |
Commercial and industrial(4) | Commercial and industrial(4) | $ | 40,041 | | $ | 8,089 | | $ | 5,285 | | $ | 2,809 | | $ | 3,151 | | $ | 8,415 | | $ | 37,929 | | | $ | 105,719 | | |
Financial institutions(4) | Financial institutions(4) | 6,390 | | 4,490 | | 3,816 | | 572 | | 708 | | 2,087 | | 30,865 | | | 48,928 | | |
Financial institutions(4) | |
Financial institutions(4) | |
| Mortgage and real estate | |
| Mortgage and real estate | |
| Mortgage and real estate | Mortgage and real estate | 1,731 | | 4,803 | | 3,752 | | 3,639 | | 1,791 | | 2,259 | | 131 | | | 18,106 | | |
Other(5) | Other(5) | 2,174 | | 6,621 | | 1,335 | | 958 | | 734 | | 4,797 | | 26,251 | | | 42,870 | | |
Other(5) | |
Other(5) | |
| Total investment grade | |
| Total investment grade | |
| Total investment grade | Total investment grade | $ | 50,336 | | $ | 24,003 | | $ | 14,188 | | $ | 7,978 | | $ | 6,384 | | $ | 17,558 | | $ | 95,176 | | | $ | 215,623 | | |
Non-investment grade(3) | Non-investment grade(3) | | | | |
Non-investment grade(3) | |
Non-investment grade(3) | |
| Accrual | |
| Accrual | |
| Accrual | Accrual | | | | |
Commercial and industrial(4) | Commercial and industrial(4) | $ | 14,071 | | $ | 6,408 | | $ | 2,351 | | $ | 1,666 | | $ | 907 | | $ | 3,657 | | $ | 16,956 | | | $ | 46,016 | | |
Commercial and industrial(4) | |
Commercial and industrial(4) | |
Financial institutions(4) | |
Financial institutions(4) | |
Financial institutions(4) | Financial institutions(4) | 3,421 | | 1,552 | | 892 | | 23 | | 437 | | 176 | | 2,072 | | | 8,573 | | |
| Mortgage and real estate | Mortgage and real estate | 608 | | 544 | | 782 | | 510 | | 725 | | 1,419 | | 516 | | | 5,104 | | |
| Mortgage and real estate | |
| Mortgage and real estate | |
Other(5) | |
Other(5) | |
Other(5) | Other(5) | 559 | | 756 | | 478 | | 372 | | 497 | | 108 | | 1,145 | | | 3,915 | | |
| Non-accrual | Non-accrual | | | | |
| Non-accrual | |
| Non-accrual | |
Commercial and industrial(4) | |
Commercial and industrial(4) | |
Commercial and industrial(4) | Commercial and industrial(4) | 5 | | 81 | | 59 | | 9 | | 52 | | 159 | | 491 | | | 856 | | |
| Financial institutions | Financial institutions | — | | 3 | | 35 | | — | | 8 | | — | | 47 | | | 93 | | |
| Financial institutions | |
| Financial institutions | |
| Mortgage and real estate | |
| Mortgage and real estate | |
| Mortgage and real estate | Mortgage and real estate | 3 | | — | | 38 | | 8 | | 103 | | 86 | | 53 | | | 291 | | |
Other(5) | Other(5) | 1 | | 4 | | 1 | | — | | — | | 11 | | 4 | | | 21 | | |
Other(5) | |
Other(5) | |
| Total non-investment grade | |
| Total non-investment grade | |
| Total non-investment grade | Total non-investment grade | $ | 18,668 | | $ | 9,348 | | $ | 4,636 | | $ | 2,588 | | $ | 2,729 | | $ | 5,616 | | $ | 21,284 | | | $ | 64,869 | | |
Loans at fair value(6) | Loans at fair value(6) | | | $ | 5,529 | | |
| Corporate loans, net of unearned income | $ | 69,004 | | $ | 33,351 | | $ | 18,824 | | $ | 10,566 | | $ | 9,113 | | $ | 23,174 | | $ | 116,460 | | | $ | 286,021 | | |
Loans at fair value(6) | |
Loans at fair value(6) | |
Corporate loans, net of unearned income(7) | |
Corporate loans, net of unearned income(7) | |
Corporate loans, net of unearned income(7) | |
| | | | Recorded investment in loans(1) |
| | Term loans by year of origination(7) | Revolving line of credit arrangements(2) | | December 31, 2022 | |
| | | Recorded investment in loans(1) |
| Term loans by year of origination | |
| In millions of dollars | |
| In millions of dollars | |
| In millions of dollars | In millions of dollars | 2022 | 2021 | 2020 | 2019 | 2018 | Prior | Revolving line of credit arrangements(2) | | December 31, 2022 |
Investment grade(3) | Investment grade(3) | | |
Investment grade(3) | |
Investment grade(3) | |
Commercial and industrial(4) | |
Commercial and industrial(4) | |
Commercial and industrial(4) | Commercial and industrial(4) | $ | 40,639 | | $ | 6,124 | | $ | 3,620 | | $ | 3,458 | | $ | 2,617 | | $ | 7,048 | | $ | 38,358 | | | $ | 101,864 | | |
Financial institutions(4) | Financial institutions(4) | 11,850 | | 3,877 | | 835 | | 922 | | 333 | | 1,327 | | 37,462 | | | 56,606 | | |
Financial institutions(4) | |
Financial institutions(4) | |
| Mortgage and real estate | |
| Mortgage and real estate | |
| Mortgage and real estate | Mortgage and real estate | 4,436 | | 3,236 | | 4,010 | | 2,619 | | 1,127 | | 1,706 | | 152 | | | 17,286 | | |
Other(5) | Other(5) | 7,649 | | 2,687 | | 1,439 | | 643 | | 2,119 | | 3,832 | | 26,805 | | | 45,174 | | |
Other(5) | |
Other(5) | |
| Total investment grade | |
| Total investment grade | |
| Total investment grade | Total investment grade | $ | 64,574 | | $ | 15,924 | | $ | 9,904 | | $ | 7,642 | | $ | 6,196 | | $ | 13,913 | | $ | 102,777 | | | $ | 220,930 | | |
Non-investment grade(3) | Non-investment grade(3) | | | | |
Non-investment grade(3) | |
Non-investment grade(3) | |
| Accrual | |
| Accrual | |
| Accrual | Accrual | | | | |
Commercial and industrial(4) | Commercial and industrial(4) | $ | 17,278 | | $ | 3,139 | | $ | 1,973 | | $ | 1,331 | | $ | 965 | | $ | 3,546 | | $ | 16,848 | | | $ | 45,080 | | |
Commercial and industrial(4) | |
Commercial and industrial(4) | |
Financial institutions(4) | |
Financial institutions(4) | |
Financial institutions(4) | Financial institutions(4) | 4,708 | | 630 | | 197 | | 254 | | 47 | | 240 | | 2,073 | | | 8,149 | | |
| Mortgage and real estate | Mortgage and real estate | 582 | | 835 | | 429 | | 729 | | 783 | | 801 | | 472 | | | 4,631 | | |
| Mortgage and real estate | |
| Mortgage and real estate | |
Other(5) | |
Other(5) | |
Other(5) | Other(5) | 1,244 | | 559 | | 391 | | 413 | | 1 | | 219 | | 1,292 | | | 4,119 | | |
| Non-accrual | Non-accrual | | | | |
Commercial and industrial(4) | 1 | | 12 | | 99 | | 115 | | 49 | | 105 | | 479 | | | 860 | | |
| Financial institutions | 41 | | 34 | | — | | — | | — | | — | | 77 | | | 152 | | |
| Non-accrual | |
| Non-accrual | |
| Commercial and industrial | |
| Commercial and industrial | |
| Commercial and industrial | |
Financial institutions(4) | |
Financial institutions(4) | |
Financial institutions(4) | |
| Mortgage and real estate | |
| Mortgage and real estate | |
| Mortgage and real estate | Mortgage and real estate | 10 | | 4 | | — | | — | | — | | 19 | | — | | | 33 | | |
Other(5) | Other(5) | 6 | | — | | 26 | | 8 | | 10 | | 11 | | 16 | | | 77 | | |
Other(5) | |
Other(5) | |
| Total non-investment grade | |
| Total non-investment grade | |
| Total non-investment grade | Total non-investment grade | $ | 23,870 | | $ | 5,213 | | $ | 3,115 | | $ | 2,850 | | $ | 1,855 | | $ | 4,941 | | $ | 21,257 | | | $ | 63,101 | | |
Loans at fair value(6) | Loans at fair value(6) | | | $ | 5,123 | | |
Loans at fair value(6) | |
Loans at fair value(6) | |
| Corporate loans, net of unearned income | Corporate loans, net of unearned income | $ | 88,444 | | $ | 21,137 | | $ | 13,019 | | $ | 10,492 | | $ | 8,051 | | $ | 18,854 | | $ | 124,034 | | | $ | 289,154 | | |
| Corporate loans, net of unearned income | |
| Corporate loans, net of unearned income | |
(1)Recorded investment in a loan includes net deferred loan fees and costs, unamortized premium or discount, less any direct write-downs.
(2)There were no significant revolving line of credit arrangements that converted to term loans during the quarter.period.
(3)Held-for-investment loans are accounted for on an amortized cost basis.
(4)Includes certain short-term loans with less than one year in tenor.
(5)Other includes installment and other, lease financing and loans to government and official institutions.
(6)Loans at fair value include loans to commercial and industrial, financial institutions, mortgage and real estate and other.
(7)In the first quarterExcludes $(3) million and $93 million of 2023, Citi identified thatunallocated portfolio layer cumulative basis adjustments at March 31, 2024 and December 31, 2022 certain loans originated prior to 2022 were disclosed as originating in 2022. The table above has been revised to reflect the correct origination year. Citi evaluated the effect of the revision, both qualitatively and quantitatively, and concluded that the impact of the revision was not material. The impact of the revision increased (decreased) the year of origination amounts as follows: $(24.9) billion, $2.0 billion, $3.2 billion, $4.6 billion, $4.1 billion and $11.0 billion for 2022, 2021, 2020, 2019, 2018 and prior,2023, respectively.
Corporate Gross Credit Losses
The table below details gross credit losses recognized during the sixthree months ended June 30,March 31, 2024, by year of loan origination:
| | | | | | | | | | | | | | | | | | | | | | | | | | |
| | For the Three Months Ended March 31, 2024 |
| In millions of dollars | 2024 | 2023 | 2022 | 2021 | 2020 | Prior | Revolving line of credit arrangement | Total |
| Commercial and industrial | $ | — | | $ | — | | $ | — | | $ | — | | $ | — | | $ | — | | $ | 76 | | $ | 76 | |
| Financial institutions | — | | — | | — | | — | | — | | 1 | | 7 | | 8 | |
| Mortgage and real estate | 1 | | 37 | | 9 | | — | | — | | 17 | | — | | 64 | |
Other(1) | — | | — | | — | | — | | — | | 15 | | 15 | | 30 | |
| Total | $ | 1 | | $ | 37 | | $ | 9 | | $ | — | | $ | — | | $ | 33 | | $ | 98 | | $ | 178 | |
The table below details gross credit losses recognized during the three months ended March 31, 2023, by year of loan origination:
| | | | For the Six Months Ended June 30, 2023 | | For the Three Months Ended March 31, 2023 |
| In millions of dollars | In millions of dollars | 2023 | 2022 | 2021 | 2020 | 2019 | Prior | Revolving line of credit arrangement | Total | In millions of dollars | 2023 | 2022 | 2021 | 2020 | 2019 | Prior | Revolving
line of credit arrangement | Total |
| Commercial and industrial | Commercial and industrial | $ | 8 | | $ | — | | $ | — | | $ | 1 | | $ | — | | $ | 2 | | $ | 48 | | $ | 59 | |
| Financial institutions | Financial institutions | — | | — | | — | | — | | — | | — | | 33 | | 33 | |
| Mortgage and real estate | Mortgage and real estate | — | | — | | — | | 1 | | — | | 2 | | — | | 3 | |
Other(1) | Other(1) | — | | — | | — | | — | | — | | — | | 30 | | 30 | |
| Total | Total | $ | 8 | | $ | — | | $ | — | | $ | 2 | | $ | — | | $ | 4 | | $ | 111 | | $ | 125 | |
(1) Other includes installment and other, lease financing and loans to government and official institutions.
Non-Accrual Corporate Loans
| | | | June 30, 2023 | December 31, 2022 | | March 31, 2024 | December 31, 2023 |
| In millions of dollars | In millions of dollars | Recorded investment(1)(2) | Related specific
allowance | Recorded investment(1)(2) | Related specific
allowance | In millions of dollars | Recorded investment(1)(2) | Related specific
allowance | Recorded investment(1)(2) | Related specific
allowance |
| Non-accrual corporate loans with specific allowances | Non-accrual corporate loans with specific allowances | | | | Non-accrual corporate loans with specific allowances | | | |
| Commercial and industrial | Commercial and industrial | $ | 528 | | $ | 221 | | $ | 583 | | $ | 268 | |
| Financial institutions | Financial institutions | 87 | | 48 | | 149 | | 51 | |
| Mortgage and real estate | Mortgage and real estate | 153 | | 25 | | 33 | | 4 | |
| | Other | Other | 1 | | 1 | | — | | — | |
| Other | |
| Other | |
| Total non-accrual corporate loans with specific allowances | Total non-accrual corporate loans with specific allowances | $ | 769 | | $ | 295 | | $ | 765 | | $ | 323 | |
| Non-accrual corporate loans without specific allowances | Non-accrual corporate loans without specific allowances | | | | Non-accrual corporate loans without specific allowances | | | | |
| Commercial and industrial | Commercial and industrial | $ | 328 | | N/A | $ | 277 | | N/A | Commercial and industrial | $ | 235 | | N/A | N/A | $ | 210 | | N/A | N/A |
| Financial institutions | Financial institutions | 6 | | N/A | 3 | | N/A | Financial institutions | 2 | | N/A | N/A | 3 | | N/A | N/A |
| Mortgage and real estate | Mortgage and real estate | 138 | | N/A | — | | N/A | Mortgage and real estate | 434 | | N/A | N/A | 171 | | N/A | N/A |
| Lease financing | Lease financing | — | | N/A | 10 | | N/A | Lease financing | — | | N/A | N/A | — | | N/A | N/A |
| Other | Other | 20 | | N/A | 67 | | N/A | Other | 10 | | N/A | N/A | 61 | | N/A | N/A |
| Total non-accrual corporate loans without specific allowances | Total non-accrual corporate loans without specific allowances | $ | 492 | | N/A | $ | 357 | | N/A | Total non-accrual corporate loans without specific allowances | $ | 681 | | N/A | N/A | $ | 445 | | N/A | N/A |
(1)Recorded investment in a loan includes net deferred loan fees and costs, unamortized premium or discount, less any direct write-downs.
(2)Interest income recognized for the three and six months ended June 30,March 31, 2024, December 31, 2023 and March 31, 2023 was $13$18 million, $8 million and $24 million, respectively, and for the three and six months ended June 30, 2022 was $11 million and $23 million, respectively.
N/A Not applicable
Corporate Loan Modifications to Borrowers Experiencing Financial Difficulty
Citi seeks to modify certain corporate loans to borrowers experiencing financial difficulty to reduce Citi’s exposure to loss, often providing the borrower with an opportunity to work through financial difficulties. Each modification is unique to the borrower’s individual circumstances. The following table detailstables detail corporate loan modifications granted during the three and six months ended June 30,March 31, 2024 and March 31, 2023 to borrowers experiencing financial difficulty by type of modification granted and the financial effect of those modifications. Citi defines a corporate loan modification to a borrower experiencing financial difficulty as a modification of a loan classified as substandard or worse at the time of modification.
| | For the Three and Six Months Ended June 30, 2023 | |
| In millions of dollars, except for weighted average term extension | Total modifications balance at June 30, 2023(1)(2)(3) | | Term
extension | | Combination: Term extension and payment delay(5) | Weighted average term extension
(months) | |
| Three Months Ended June 30, 2023 | | | | | | |
| For the Three Months Ended March 31, 2024 | |
| For the Three Months Ended March 31, 2024 | |
| For the Three Months Ended March 31, 2024 | |
In millions of dollars, except for weighted-average
term extension | |
In millions of dollars, except for weighted-average
term extension | |
In millions of dollars, except for weighted-average
term extension | |
| Three Months Ended March 31, 2024 | |
| Three Months Ended March 31, 2024 | |
| Three Months Ended March 31, 2024 | |
| Commercial and industrial | |
| Commercial and industrial | |
| Commercial and industrial | Commercial and industrial | $ | 66 | | | $ | 65 | | | $ | 1 | | 22 | |
| Financial institutions | Financial institutions | — | | | — | | | — | | — | | |
| Mortgage and real estate | 47 | | | 46 | | | 1 | | 24 | |
Other(4) | — | | | — | | | — | | — | | |
| Total | $ | 113 | | | $ | 111 | | | $ | 2 | | | |
| Six Months Ended June 30, 2023 | | | | | | |
| Commercial and industrial | $ | 121 | | | $ | 95 | | | $ | 26 | | 21 | |
| Financial institutions | |
| Financial institutions | Financial institutions | — | | | — | | | — | | — | | |
| Mortgage and real estate | Mortgage and real estate | 49 | | | 48 | | | 1 | | 23 | |
Other(4) | — | | | — | | | — | | — | | |
| Mortgage and real estate | |
| Mortgage and real estate | |
Other(5) | |
Other(5) | |
Other(5) | |
| Total | Total | $ | 170 | | | $ | 143 | | | $ | 27 | | | |
| Total | |
| Total | |
| | | | | | | | | | | | | | | | | | |
| For the Three Months Ended March 31, 2023 | |
In millions of dollars, except for weighted-average
term extension | Total modifications balance at March 31, 2023(1)(2)(3) | | | Term
extension | | Combination: Term extension and payment delay(4) | Weighted-average term extension
(months) | |
| Three Months Ended March 31, 2023 | | | | | | | | |
| Commercial and industrial | $ | 70 | | | | $ | 40 | | | $ | 30 | | 15 | |
| Financial institutions | — | | | | — | | | — | | — | | |
| Mortgage and real estate | 6 | | | | 6 | | | — | | 4 | |
Other(5) | — | | | | — | | | — | | — | | |
| Total | $ | 76 | | | | $ | 46 | | | $ | 30 | | | |
(1)The above table reflects activity for loans outstanding as of the end of the reporting period. The balances are not significant as a percentage of the total carrying values of loans by class of receivable as of June 30, 2023.March 31, 2024 and March 31, 2023, respectively.
(2)Commitments to lend to borrowers experiencing financial difficulty that were granted modifications totaled $492$530 million and $368 million as of June 30, 2023.March 31, 2024 and March 31, 2023, respectively.
(3)The allowance for corporate loans, including modified loans, is based on the borrower’s overall financial performance. Charge-offs for amounts deemed uncollectible may be recorded at the time of the modification or may have already been recorded in prior periods such that no charge-off is required at the time of modification.
(4)Payment delays either for principal or interest payments had an immaterial financial impact.
(5)Other includes installment and other, lease financing and loans to government and official institutions.
(5)Payment delays either for principal or interest payments had an immaterial financial impact.
The following table presents the Company’s three and six months ended June 30, 2022 corporate troubled debt restructurings (TDRs), under previous GAAP, prior to the Company’s adoption of ASU No. 2022-02 on January 1, 2023:
| | | | | | | | | | | | | | | | |
| For the Three and Six Months Ended June 30, 2022 | | |
| In millions of dollars | Carrying value of TDRs modified during the period | TDRs involving changes in the amount and/or timing of principal payments(1) | TDRs involving changes in the amount and/or timing of interest payments(2) | TDRs
involving changes
in the amount
and/or timing of
both principal and
interest payments | | |
| Three Months Ended June 30, 2022 | | | | | | |
| Commercial and industrial | $ | 3 | | $ | — | | $ | — | | $ | 3 | | | |
| | | | | | |
| | | | | | |
| | | | | | |
Other(3) | 23 | | — | | — | | 23 | | | |
| Total | $ | 26 | | $ | — | | $ | — | | $ | 26 | | | |
| Six Months Ended June 30, 2022 | | | | | | |
| Commercial and industrial | $ | 15 | | $ | — | | $ | — | | $ | 15 | | | |
Other(3) | 23 | | 1 | | — | | 22 | | | |
| Total | $ | 38 | | $ | 1 | | $ | — | | $ | 37 | | | |
(1) TDRs involving changes in the amount or timing of principal payments may involve principal forgiveness or deferral of periodic and/or final principal payments. Because forgiveness of principal is rare for corporate loans, modifications typically have little to no impact on the loans’ projected cash flows and thus little to no impact on the allowance established for the loans. Charge-offs for amounts deemed uncollectible may be recorded at the time of the restructuring or may have already been recorded in prior periods such that no charge-off is required at the time of the modification.
(2) TDRs involving changes in the amount or timing of interest payments may involve a below-market interest rate.
(3) Other includes installment and other, lease financing and loans to government and official institutions.
Performance of Modified Corporate Loans
The following table presentstables present the delinquencies of modified corporate loans to borrowers experiencing financial difficulty. It includes loans that were modified during the six12 months ended June 30,March 31, 2024 and December 31, 2023:
| | | |
| | | | | As of June 30, 2023(1) | | As of March 31, 2024(1) |
| In millions of dollars | In millions of dollars | | Total | Current | 30–89 days past due | 90+ days
past due | In millions of dollars | | Total | Current | 30–89 days past due | 90+ days
past due |
| | Commercial and industrial | Commercial and industrial | | $ | 121 | | $ | 121 | | $ | — | | $ | — | |
| Commercial and industrial | |
| Commercial and industrial | |
| Financial institutions | Financial institutions | | — | | — | | — | | — | |
| Mortgage and real estate | Mortgage and real estate | | 49 | | 49 | | — | | — | |
Other(2) | Other(2) | | — | | — | | — | | — | |
| Total | Total | | $ | 170 | | $ | 170 | | $ | — | | $ | — | |
| | | | | | | | | | | | | | | |
| | | As of December 31, 2023(1) |
| In millions of dollars | | Total | Current | 30–89 days
past due | 90+ days
past due |
| | | | | |
| Commercial and industrial | | $ | 198 | | $ | 198 | | $ | — | | $ | — | |
| Financial institutions | | — | | — | | — | | — | |
| Mortgage and real estate | | 144 | | 144 | | — | | — | |
Other(2) | | — | | — | | — | | — | |
| Total | | $ | 342 | | $ | 342 | | $ | — | | $ | — | |
(1)Corporate loans are generally not modified as a result of their delinquency status; rather, they are modified because of events that have impacted the overall financial performance of the borrower. Corporate loans, if past due, are re-aged to current status upon modification.
(2)Other includes installment and other, lease financing and loans to government and official institutions.
Defaults of Modified Corporate Loans
No modified corporate loans to borrowers experiencing financial difficulty defaulted during the three and six months ended June 30,March 31, 2024 and 2023. Default is defined as 60 days past due, except for classifiably managed commercial banking loans, where default is defined as 90 days past due. For a modified corporate loan that is not collateral dependent, expected default rates are considered in the loan’s individually assessed ACL.
The following table presents the Company’s three and six months ended June 30, 2022 corporate TDRs, under previous GAAP, prior to the Company’s adoption of ASU No. 2022-02 on January 1, 2023, that defaulted for which the payment default occurred within one year of a permanent modification. Default is defined as 60 days past due:
| | | | | | | | | | | |
| | TDR loans that re-defaulted within one year of modification during the |
In millions of dollars | TDR balances at June 30, 2022 | Three Months Ended
June 30, 2022 | Six Months Ended
June 30, 2022 |
Commercial and industrial | $ | 148 | | $ | — | | $ | — | |
| | | |
Mortgage and real estate | 16 | | — | | — | |
| | | |
Other(1)
| 39 | | — | | — | |
Total(2)
| $ | 203 | | $ | — | | $ | — | |
(1) Other includes installment and other, lease financing and loans to government and official institutions.
(2) The above table reflects activity for loans outstanding that were considered TDRs as of the end of the reporting period.
Consumer Loans
Consumer loans represent loans and leases managed primarily by PBWMUSPB, Wealth and All Other—Legacy Franchises (except(except Mexico SBMM). The tables below present details about these loans, including the following loan categories:
•Residential first mortgages and Home equity loans in North America offices primarily represent secured mortgage lending to customers of Retail bankingBanking and Global Wealth (primarily Private bank and Citigold).
•Credit cards in North America offices primarily represent unsecured credit card lending to customers of Branded cardsCards and Retail services.Services.
•Personal, small business and other loans in North America are primarily composed of classifiably managed loans to customers of Global Wealth (mostly within the Private bank)Bank) who are typically high credit quality borrowers that historically experienced minimal delinquencies and credit losses. Loans to these borrowers are generally well collateralized in the form of liquid securities and other forms of collateral.
•Residential mortgage loans in offices outside North America primarily represent secured mortgage lending to customers of Global Wealth (primarily Private bank and Citigold) as well as customers of Legacy Franchises.
•Credit cards in offices outside North America primarily represent unsecured credit card lending to customers of PBWM and Legacy Franchises, primarily in Asia and Mexico.
•Personal, small business and other loans in offices outside North America are primarily composed of secured and unsecured loans to customers of PBWM and Legacy Franchises. A significant portion of PBWM loans is classifiably managed and represents loans to high credit quality Private bank customers who have historically experienced minimal delinquencies and credit losses. Loans to these borrowers are generally well collateralized in the form of liquid securities and other forms of collateral.
The following tables provide Citi’s consumer loans by type:
Consumer Loans, Delinquencies and Non-Accrual Status at June 30, 2023March 31, 2024
| | | | | | | | | | | | | | | | | | | | | | | | | | | | | |
| In millions of dollars | Total current(1)(2) | 30–89 days past due(3)(4) | ≥ 90 days past due(3)(4) | Past due government guaranteed(5) | Total loans | Non-accrual loans for which there is no ACLL | Non-accrual loans for which there is an ACLL | Total
non-accrual | 90 days
past due
and accruing |
In North America offices(6) | | | | | | | | | |
Residential first mortgages(7) | $ | 101,780 | | $ | 371 | | $ | 285 | | $ | 244 | | $ | 102,680 | | $ | 101 | | $ | 380 | | $ | 481 | | $ | 139 | |
Home equity loans(8)(9) | 3,869 | | 35 | | 96 | | — | | 4,000 | | 46 | | 139 | | 185 | | — | |
| Credit cards | 149,487 | | 1,741 | | 1,723 | | — | | 152,951 | | — | | — | | — | | 1,723 | |
Personal, small business and other(10) | 37,038 | | 89 | | 29 | | 5 | | 37,161 | | 4 | | 34 | | 38 | | 7 | |
| Total | $ | 292,174 | | $ | 2,236 | | $ | 2,133 | | $ | 249 | | $ | 296,792 | | $ | 151 | | $ | 553 | | $ | 704 | | $ | 1,869 | |
In offices outside North America(6) | | | | | | | | | |
Residential mortgages(7) | $ | 26,950 | | $ | 48 | | $ | 92 | | $ | — | | $ | 27,090 | | $ | — | | $ | 328 | | $ | 328 | | $ | 18 | |
| Credit cards | 13,344 | | 180 | | 190 | | — | | 13,714 | | — | | 172 | | 172 | | 60 | |
Personal, small business and other(10) | 36,848 | | 108 | | 39 | | — | | 36,995 | | — | | 117 | | 117 | | — | |
| Total | $ | 77,142 | | $ | 336 | | $ | 321 | | $ | — | | $ | 77,799 | | $ | — | | $ | 617 | | $ | 617 | | $ | 78 | |
Total Citigroup(11)(12) | $ | 369,316 | | $ | 2,572 | | $ | 2,454 | | $ | 249 | | $ | 374,591 | | $ | 151 | | $ | 1,170 | | $ | 1,321 | | $ | 1,947 | |
| | | | | | | | | | | | | | | | | | | | | | | | | | | | | |
| In millions of dollars | Total current(1)(2) | 30–89 days past due(3) | ≥ 90 days past due(3) | Past due government guaranteed(4) | Total loans | Non-accrual loans for which there is no ACLL | Non-accrual loans for which there is an ACLL | Total
non-accrual | 90 days
past due
and accruing |
In North America offices(5) | | | | | | | | | |
Residential first mortgages(6) | $ | 109,664 | | $ | 414 | | $ | 286 | | $ | 228 | | $ | 110,592 | | $ | 116 | | $ | 385 | | $ | 501 | | $ | 122 | |
Home equity loans(7)(8) | 3,318 | | 38 | | 83 | | — | | 3,439 | | 22 | | 146 | | 168 | | — | |
| Credit cards | 154,047 | | 2,196 | | 2,563 | | — | | 158,806 | | — | | — | | — | | 2,563 | |
Personal, small business and other(9) | 33,783 | | 128 | | 54 | | 1 | | 33,966 | | 5 | | 52 | | 57 | | 4 | |
| Total | $ | 300,812 | | $ | 2,776 | | $ | 2,986 | | $ | 229 | | $ | 306,803 | | $ | 143 | | $ | 583 | | $ | 726 | | $ | 2,689 | |
In offices outside North America(5) | | | | | | | | | |
Residential mortgages(6) | $ | 25,802 | | $ | 52 | | $ | 72 | | $ | — | | $ | 25,926 | | $ | — | | $ | 246 | | $ | 246 | | $ | — | |
| Credit cards | 13,532 | | 195 | | 215 | | — | | 13,942 | | — | | 205 | | 205 | | 71 | |
Personal, small business and other(9) | 35,016 | | 109 | | 37 | | — | | 35,162 | | — | | 104 | | 104 | | — | |
| Total | $ | 74,350 | | $ | 356 | | $ | 324 | | $ | — | | $ | 75,030 | | $ | — | | $ | 555 | | $ | 555 | | $ | 71 | |
| Total excluding portfolio layer cumulative basis adjustments | $ | 375,162 | | $ | 3,132 | | $ | 3,310 | | $ | 229 | | $ | 381,833 | | $ | 143 | | $ | 1,138 | | $ | 1,281 | | $ | 2,760 | |
Unallocated portfolio layer cumulative basis adjustments(10) | | | | | $ | (74) | | | | | |
Total Citigroup(11)(12) | | | | | $ | 381,759 | | | | | |
Consumer Loans, Delinquencies and Non-Accrual Status at December 31, 20222023
| | | | | | | | | | | | | | | | | | | | | | | | | | | | | |
| In millions of dollars | Total current(1)(2) | 30–89 days past due(3)(4) | ≥ 90 days past due(3)(4) | Past due government guaranteed(5) | Total
loans | Non-accrual loans for which there is no ACLL | Non-accrual loans for which there is an ACLL | Total
non-accrual | 90 days
past due
and accruing |
In North America offices(6) | | | | | | | | | |
Residential first mortgages(7) | $ | 95,023 | | $ | 421 | | $ | 316 | | $ | 279 | | $ | 96,039 | | $ | 86 | | $ | 434 | | $ | 520 | | $ | 163 | |
Home equity loans(8)(9) | 4,407 | | 38 | | 135 | | — | | 4,580 | | 51 | | 151 | | 202 | | — | |
| Credit cards | 147,717 | | 1,511 | | 1,415 | | — | | 150,643 | | — | | — | | — | | 1,415 | |
Personal, small business and other(10) | 37,635 | | 88 | | 22 | | 7 | | 37,752 | | 3 | | 23 | | 26 | | 11 | |
| Total | $ | 284,782 | | $ | 2,058 | | $ | 1,888 | | $ | 286 | | $ | 289,014 | | $ | 140 | | $ | 608 | | $ | 748 | | $ | 1,589 | |
In offices outside North America(6) | | | | | | | | | |
Residential mortgages(7) | $ | 27,946 | | $ | 62 | | $ | 106 | | $ | — | | $ | 28,114 | | $ | — | | $ | 305 | | $ | 305 | | $ | 13 | |
| Credit cards | 12,659 | | 147 | | 149 | | — | | 12,955 | | — | | 127 | | 127 | | 56 | |
Personal, small business and other(10) | 37,869 | | 105 | | 10 | | — | | 37,984 | | — | | 137 | | 137 | | — | |
| Total | $ | 78,474 | | $ | 314 | | $ | 265 | | $ | — | | $ | 79,053 | | $ | — | | $ | 569 | | $ | 569 | | $ | 69 | |
Total Citigroup(11)(12) | $ | 363,256 | | $ | 2,372 | | $ | 2,153 | | $ | 286 | | $ | 368,067 | | $ | 140 | | $ | 1,177 | | $ | 1,317 | | $ | 1,658 | |
| | | | | | | | | | | | | | | | | | | | | | | | | | | | | |
| In millions of dollars | Total current(1)(2) | 30–89 days past due(3) | ≥ 90 days past due(3) | Past due government guaranteed(4) | Total
loans | Non-accrual loans for which there is no ACLL | Non-accrual loans for which there is an ACLL | Total
non-accrual | 90 days
past due
and accruing |
In North America offices(5) | | | | | | | | | |
Residential first mortgages(6) | $ | 107,720 | | $ | 462 | | $ | 294 | | $ | 235 | | $ | 108,711 | | $ | 105 | | $ | 384 | | $ | 489 | | $ | 120 | |
Home equity loans(7)(8) | 3,471 | | 36 | | 85 | | — | | 3,592 | | 48 | | 126 | | 174 | | — | |
| Credit cards | 159,966 | | 2,293 | | 2,461 | | — | | 164,720 | | — | | — | | — | | 2,461 | |
Personal, small business and other(9) | 35,970 | | 104 | | 57 | | 4 | | 36,135 | | 6 | | 59 | | 65 | | 5 | |
| Total | $ | 307,127 | | $ | 2,895 | | $ | 2,897 | | $ | 239 | | $ | 313,158 | | $ | 159 | | $ | 569 | | $ | 728 | | $ | 2,586 | |
In offices outside North America(5) | | | | | | | | | |
Residential mortgages(6) | $ | 26,309 | | $ | 48 | | $ | 69 | | $ | — | | $ | 26,426 | | $ | — | | $ | 243 | | $ | 243 | | $ | — | |
| Credit cards | 13,797 | | 209 | | 227 | | — | | 14,233 | | — | | 211 | | 211 | | 88 | |
Personal, small business and other(9) | 35,233 | | 107 | | 40 | | — | | 35,380 | | — | | 133 | | 133 | | — | |
| Total | $ | 75,339 | | $ | 364 | | $ | 336 | | $ | — | | $ | 76,039 | | $ | — | | $ | 587 | | $ | 587 | | $ | 88 | |
Total Citigroup(11)(12) | $ | 382,466 | | $ | 3,259 | | $ | 3,233 | | $ | 239 | | $ | 389,197 | | $ | 159 | | $ | 1,156 | | $ | 1,315 | | $ | 2,674 | |
(1)Loans less than 30 days past due are presented as current.
(2)Includes $237$303 million and $237$313 million at June 30, 2023March 31, 2024 and December 31, 2022,2023, respectively, of residential first mortgages recorded at fair value.
(3)Excludes loans guaranteed by U.S. government-sponsored agencies. Excludes delinquencies on $30.6$27.1 billion and $17.9$17.1 billion of classifiably managed Private bankBank loans in North America and outside North America, respectively, at June 30, 2023.March 31, 2024. Excludes delinquencies on $31.5$29.2 billion and $17.8$17.0 billion of classifiably managed Private bankBank loans in North America and outside North America, respectively, at December 31, 2022.2023.
(4)Loans modified under Citi’s COVID-19 consumer relief programs continue to be reported in the same delinquency bucket they were in at the time of modification. Most modified loans in North America would not be reported as 30–89 or 90+ days past due for the duration of the programs (which have various durations, and certain of which may be renewed).
(5)Consists of loans that are guaranteed by U.S. government-sponsored agencies that are 30–89 days past due of $0.1 billion and $0.1 billion and 90 days or more past due of $0.1 billion and $0.2$0.1 billion at June 30, 2023March 31, 2024 and December 31, 2022,2023, respectively.
(6)(5)North America includes the U.S., Canada and Puerto Rico. Mexico is included in offices outside North America.
(7)(6)Includes approximately $0.2 billion and $0.0 billion of residential first mortgage loans in process of foreclosure in North America and outside North America, respectively, and $20.4 billion of residential mortgages outside North America related to the Global Wealth business at June 30, 2023. Includes approximately $0.1 billion and $0.0 billion of residential first mortgage loans in process of foreclosure in North America and outside North America, respectively, and $19.8$19.5 billion of residential mortgages outside North America related to the Global Wealth business at DecemberMarch 31, 2022.
(8)2024. Includes approximately $0.1 billion and $0.1$0.0 billion of residential first mortgage loans in process of foreclosure in North America and outside North America, respectively, and $19.9 billion of residential mortgages outside North America related to Wealth at December 31, 2023.
(7)Includes approximately $0.0 billion and $0.0 billion at June 30, 2023March 31, 2024 and December 31, 2022,2023, respectively, of home equity loans in process of foreclosure.
(9)(8)Fixed-rate home equity loans and loans extended under home equity lines of credit, which are typically in junior lien positions.
(10)(9)Includes loans related to the Global As of March 31, 2024, Wealth business: $33.1 billion in North America approximately $30.6includes $29.3 billion of loans, of which $27.1 billion are classifiably managed and as of June 30, 2023 approximately 99% werewith 89% rated investment grade;grade, and $26.0 billionWealth outside North America approximately $17.9includes $24.7 billion of loans, of which $17.1 billion are classifiably managed and as of June 30, 2023 approximately 93% werewith 67% rated investment grade. Includes loans related to the Global As of December 31, 2023, Wealth business: $34.0 billion in North America approximately $31.5includes $31.6 billion of loans, of which $29.2 billion are classifiably managed and as of December 31, 2022 approximately 98% werewith 92% rated investment grade;grade, and $26.6 billionWealth outside North America approximately $17.8includes $24.9 billion of loans, of which $17.0 billion are classifiably managed and as of December 31, 2022 approximately 94% werewith 74% rated investment grade. The classifiably managed portion of theseSuch loans is shownare presented as “current” becauseabove.
(10)Represents fair value hedge basis adjustments related to portfolio layer method hedges of mortgage and real estate loans, which are not allocated to individual loans in the delinquency status is not applicable, since these loans are primarily evaluated for credit risk based on their internal risk classification.portfolio. See Note 22.
(11)Consumer loans arewere net of unearned income of $769$828 million and $712$802 million at June 30, 2023March 31, 2024 and December 31, 2022,2023, respectively. Unearned income on consumer loans primarily represents unamortizedloan origination fees, net of certain direct origination costs, that are deferred and costs, premiums and discounts.recognized as Interest income over the lives of the related loans.
(12)Not included in the balances above areis approximately $1 billion and $1 billion of accrued interest receivable at June 30, 2023March 31, 2024 and December 31, 2022,2023, respectively, which areis included in Other assets on the Consolidated Balance Sheet, except for credit card loans (which include accrued interest and fees). When a loan becomes non-accrual or, if not subject to a non-accrual policy, is charged off per the Company’s charge-off policy, any accrued interest receivable is also reversed against the interest income.
During the three and six months ended June 30,March 31, 2024 and March 31, 2023, the Company reversed accrued interest of approximately $0.3 billion and $0.5 billion, respectively, primarily(primarily related to credit card loans. During the threecards) of approximately $0.4 billion and six months ended June 30, 2022, the Company reversed$0.2 billion, respectively. These reversals of accrued interest are reflected as a reduction to Interest income in the Consolidated Statement of approximately $0.2 billion and $0.3 billion, respectively, primarily related to credit card loans.Income.
Interest Income Recognized for Non-Accrual Consumer Loans
| | In millions of dollars | In millions of dollars | Three Months Ended June 30, 2023 | Three Months Ended June 30, 2022 | Six Months Ended June 30, 2023 | Six Months Ended June 30, 2022 |
| In millions of dollars | |
| In millions of dollars | |
In North America offices(1) | |
In North America offices(1) | |
In North America offices(1) | In North America offices(1) | | | |
| Residential first mortgages | Residential first mortgages | $ | 3 | | $ | 3 | | $ | 6 | | $ | 6 | |
| Residential first mortgages | |
| Residential first mortgages | |
| Home equity loans | |
| Home equity loans | |
| Home equity loans | Home equity loans | 1 | | 1 | | 3 | | 2 | |
| Credit cards | Credit cards | — | | — | | — | | — | |
| Credit cards | |
| Credit cards | |
| Personal, small business and other | |
| Personal, small business and other | |
| Personal, small business and other | Personal, small business and other | 1 | | 1 | | 1 | | 1 | |
| Total | Total | $ | 5 | | $ | 5 | | $ | 10 | | $ | 9 | |
| Total | |
| Total | |
In offices outside North America(1) | |
In offices outside North America(1) | |
In offices outside North America(1) | In offices outside North America(1) | | | |
| Residential mortgages | Residential mortgages | $ | 4 | | $ | — | | $ | 5 | | $ | — | |
| Residential mortgages | |
| Residential mortgages | |
| Credit cards | |
| Credit cards | |
| Credit cards | Credit cards | — | | — | | — | | — | |
| Personal, small business and other | Personal, small business and other | — | | — | | — | | — | |
| Personal, small business and other | |
| Personal, small business and other | |
| Total | |
| Total | |
| Total | Total | $ | 4 | | $ | — | | $ | 5 | | $ | — | |
| Total Citigroup | Total Citigroup | $ | 9 | | $ | 5 | | $ | 15 | | $ | 9 | |
| Total Citigroup | |
| Total Citigroup | |
(1)North America includes the U.S., Canada and Puerto Rico. Mexico is included in offices outside North America.
During the three and six months ended June 30, 2023, theThe Company sold and/or reclassified to held-for-sale $2(HFS) approximately $59 million and $1.8 billion of consumer loans, respectively. During the three and six months ended June 30, 2022, the Company sold and/or reclassified to held-for-sale $367 million and $374$1,828 million of consumer loans during the three months ended March 31, 2024 and 2023, respectively. The increasedecline was mainly due to the reclassification of a larger mortgage portfolio to HFS in the first quarter of 2023. The Company did not have significant purchases of consumer loans classified as held-for-investment for the three and six months ended June 30, 2023March 31, 2024 or 2022.2023. Loans held by a business for sale are not included in the above since they have been reclassified to Other assets. See Note 2 for additional information regarding Citigroup’s businesses held-for-sale.
Consumer Credit Scores (FICO)
The following tables provide details on the Fair Isaac Corporation (FICO) scores for Citi’s U.S. consumer loan portfolio based on end-of-period receivables by year of origination. FICO scores are updated monthly for substantially all of the portfolio or, otherwise, on a quarterly basis for the remaining portfolio. Loans that did not have FICO scores as of the prior period have been updated with FICO scores as they become available. With respect to Citi’s consumer loan
portfolio outside of the U.S. as of June 30, 2023March 31, 2024 and December 31, 20222023 ($79.376.5 billion and $80.5$77.5 billion,
respectively), various country-specific or regional credit risk metrics and acquisition and behavior scoring models are leveraged as one of the factors to evaluate the credit quality of customers (for additional information on loans outside of the U.S., see(see “Consumer Loans and Ratios Outside of North America” below). As a result, details of relevant credit quality indicators for those loans are not comparable to the below FICO score distribution for the U.S. portfolio.
| | | | | | | | | | | | | | | | | | | | |
FICO score distribution—U.S. portfolio(1)(2) | June 30, 2023 |
| In millions of dollars | Less than
680 | 680
to 760 | Greater
than 760 | Classifiably managed(3) | FICO not available(4) | Total
loans |
| Residential first mortgages | | | | | | |
| 2023 | $ | 151 | | $ | 2,704 | | $ | 5,671 | | | | |
| 2022 | 717 | | 6,659 | | 13,618 | | | | |
| 2021 | 602 | | 5,747 | | 12,540 | | | | |
| 2020 | 393 | | 4,360 | | 10,860 | | | | |
| 2019 | 312 | | 2,345 | | 5,350 | | | | |
| Prior | 2,185 | | 7,099 | | 13,907 | | | | |
| Total residential first mortgages | $ | 4,360 | | $ | 28,914 | | $ | 61,946 | | $ | — | | $ | 7,460 | | $ | 102,680 | |
| Home equity loans (pre-reset) | $ | 490 | | $ | 1,212 | | $ | 1,736 | | | | |
| Home equity loans (post-reset) | 71 | | 76 | | 45 | | | | |
| Home equity term loans | 92 | | 137 | | 108 | | | | |
| 2023 | — | | — | | — | | | | |
| 2022 | — | | — | | — | | | | |
| 2021 | — | | 1 | | 1 | | | | |
| 2020 | 1 | | 2 | | 2 | | | | |
| 2019 | 1 | | 1 | | 1 | | | | |
| Prior | 90 | | 133 | | 104 | | | | |
| Total home equity loans | $ | 653 | | $ | 1,425 | | $ | 1,889 | | $ | — | | $ | 33 | | $ | 4,000 | |
| Credit cards | $ | 29,111 | | $ | 59,069 | | $ | 60,712 | | | | |
Revolving loans converted to term loans(5) | 913 | | 357 | | 54 | | | | |
Total credit cards(6) | $ | 30,024 | | $ | 59,426 | | $ | 60,766 | | $ | — | | $ | 2,136 | | $ | 152,352 | |
| | | | | | |
| Personal, small business and other | | | | | | |
| 2023 | $ | 10 | | $ | 45 | | $ | 105 | | | | |
| 2022 | 268 | | 515 | | 712 | | | | |
| 2021 | 80 | | 129 | | 151 | | | | |
| 2020 | 11 | | 14 | | 20 | | | | |
| 2019 | 13 | | 14 | | 16 | | | | |
| Prior | 126 | | 181 | | 135 | | | | |
Total personal, small business and other(7)(8) | $ | 508 | | $ | 898 | | $ | 1,139 | | $ | 30,596 | | $ | 3,101 | | $ | 36,242 | |
| Total | $ | 35,545 | | $ | 90,663 | | $ | 125,740 | | $ | 30,596 | | $ | 12,730 | | $ | 295,274 | |
| | | | | | | | | | | | | | | | | | | | |
FICO score distribution—U.S. portfolio(1) | March 31, 2024 |
| In millions of dollars | Less than
660 | 660
to 739 | Greater
than or equal to 740 | Classifiably managed(2) | FICO not available(3) | Total
loans |
| Residential first mortgages | | | | | | |
| 2024 | $ | 20 | | $ | 402 | | $ | 2,508 | | | | |
| 2023 | 208 | | 2,980 | | 13,956 | | | | |
| 2022 | 415 | | 3,291 | | 16,685 | | | | |
| 2021 | 341 | | 2,939 | | 15,032 | | | | |
| 2020 | 236 | | 2,293 | | 12,541 | | | | |
| Prior | 1,556 | | 5,281 | | 22,071 | | | | |
| Total residential first mortgages | $ | 2,776 | | $ | 17,186 | | $ | 82,793 | | $ | — | | $ | 7,837 | | $ | 110,592 | |
| Home equity line of credit (pre-reset) | $ | 309 | | $ | 862 | | $ | 1,728 | | | | |
| Home equity line of credit (post-reset) | 67 | | 71 | | 72 | | | | |
| Home equity term loans | 55 | | 103 | | 129 | | | | |
| 2024 | — | | — | | — | | | | |
| 2023 | — | | — | | — | | | | |
| 2022 | — | | — | | — | | | | |
| 2021 | — | | — | | 1 | | | | |
| 2020 | — | | 1 | | 2 | | | | |
| Prior | 55 | | 102 | | 126 | | | | |
| Total home equity loans | $ | 431 | | $ | 1,036 | | $ | 1,929 | | $ | — | | $ | 43 | | $ | 3,439 | |
| Credit cards | $ | 22,007 | | $ | 56,522 | | $ | 75,979 | | | | |
Revolving loans converted to term loans(4) | 1,156 | | 534 | | 111 | | | | |
Total credit cards(5) | $ | 23,163 | | $ | 57,056 | | $ | 76,090 | | $ | — | | $ | 1,929 | | $ | 158,238 | |
| | | | | | |
| Personal, small business and other | | | | | | |
| 2024 | $ | 5 | | $ | 41 | | $ | 158 | | | | |
| 2023 | 122 | | 404 | | 1,051 | | | | |
| 2022 | 190 | | 305 | | 481 | | | | |
| 2021 | 47 | | 71 | | 104 | | | | |
| 2020 | 5 | | 7 | | 11 | | | | |
| Prior | 100 | | 164 | | 158 | | | | |
Total personal, small business and other(6)(7) | $ | 469 | | $ | 992 | | $ | 1,963 | | $ | 27,135 | | $ | 2,536 | | $ | 33,095 | |
Total(8) | $ | 26,839 | | $ | 76,270 | | $ | 162,775 | | $ | 27,135 | | $ | 12,345 | | $ | 305,364 | |
| FICO score distribution—U.S. portfolio(1)(2) | December 31, 2022 |
FICO score distribution—U.S. portfolio(1) | | FICO score distribution—U.S. portfolio(1) | December 31, 2023 |
| In millions of dollars | In millions of dollars | Less than
680 | 680
to 760 | Greater
than 760 | Classifiably managed(3) | FICO not available(4) | Total
loans | In millions of dollars | Less than
660 | 660
to 739 | Greater
than or equal to 740 | Classifiably managed(2) | FICO not available(3) | Total
loans |
| Residential first mortgages | Residential first mortgages | |
| 2023 | |
| 2023 | |
| 2023 | |
| 2022 | |
| 2022 | |
| 2022 | 2022 | $ | 691 | | $ | 7,530 | | $ | 12,928 | | |
| 2021 | 2021 | 639 | 5,933 | 12,672 | |
| 2021 | |
| 2021 | |
| 2020 | |
| 2020 | |
| 2020 | 2020 | 431 | 4,621 | 10,936 | |
| 2019 | 2019 | 321 | 2,505 | 5,445 | |
| 2018 | 302 | 1,072 | 1,899 | |
| 2019 | |
| 2019 | |
| Prior | Prior | 2,020 | 6,551 | 12,649 | |
| Prior | |
| Prior | |
| Total residential first mortgages | |
| Total residential first mortgages | |
| Total residential first mortgages | Total residential first mortgages | $ | 4,404 | | $ | 28,212 | | $ | 56,529 | | | $ | 6,894�� | | $ | 96,039 | |
| Home equity line of credit (pre-reset) | Home equity line of credit (pre-reset) | $ | 552 | | $ | 1,536 | | $ | 1,876 | | |
| Home equity line of credit (post-reset) | Home equity line of credit (post-reset) | 62 | | 65 | | 40 | | |
| Home equity line of credit (post-reset) | |
| Home equity line of credit (post-reset) | |
| Home equity term loans | Home equity term loans | 106 | | 151 | | 117 | | |
| Home equity term loans | |
| Home equity term loans | |
| 2023 | |
| 2023 | |
| 2023 | |
| 2022 | |
| 2022 | |
| 2022 | 2022 | — | | — | | — | | |
| 2021 | 2021 | — | | 1 | | 1 | | |
| 2021 | |
| 2021 | |
| 2020 | |
| 2020 | |
| 2020 | 2020 | 1 | | 2 | | 2 | | |
| 2019 | 2019 | 1 | | 2 | | 2 | | |
| 2018 | 1 | | 2 | | 1 | | |
| 2019 | |
| 2019 | |
| Prior | |
| Prior | |
| Prior | Prior | 103 | | 144 | | 111 | | |
| Total home equity loans | Total home equity loans | $ | 720 | | $ | 1,752 | | $ | 2,033 | | | $ | 75 | | $ | 4,580 | |
| Total home equity loans | |
| Total home equity loans | |
| Credit cards | Credit cards | $ | 27,901 | | $ | 58,213 | | $ | 60,896 | | |
Revolving loans converted to term loans(5) | 766 | | 354 | | 54 | | |
Total credit cards(6) | $ | 28,667 | | $ | 58,567 | | $ | 60,950 | | | $ | 1,914 | | $ | 150,098 | |
Revolving loans converted to term loans(4) | |
Revolving loans converted to term loans(4) | |
Revolving loans converted to term loans(4) | |
Total credit cards(5) | |
Total credit cards(5) | |
Total credit cards(5) | |
| Personal, small business and other | Personal, small business and other | |
| 2023 | |
| 2023 | |
| 2023 | |
| 2022 | |
| 2022 | |
| 2022 | 2022 | $ | 247 | | $ | 546 | | $ | 800 | | |
| 2021 | 2021 | 96 | | 170 | | 210 | | |
| 2021 | |
| 2021 | |
| 2020 | |
| 2020 | |
| 2020 | 2020 | 15 | | 20 | | 30 | | |
| 2019 | 2019 | 21 | | 23 | | 28 | | |
| 2018 | 10 | | 10 | | 9 | | |
| 2019 | |
| 2019 | |
| Prior | Prior | 126 | | 190 | | 144 | | |
Total personal, small business and other(7)(8) | $ | 515 | | $ | 959 | | $ | 1,221 | | $ | 31,478 | | $ | 2,639 | | $ | 36,812 | |
| Prior | |
| Prior | |
Total personal, small business and other(6)(7) | |
Total personal, small business and other(6)(7) | |
Total personal, small business and other(6)(7) | |
| Total | Total | $ | 34,306 | | $ | 89,490 | | $ | 120,733 | | $ | 31,478 | | $ | 11,522 | | $ | 287,529 | |
(1) The FICO bands in the tables are consistent with general industry peer presentations.
(2) FICO scores are updated on either a monthly or quarterly basis. For updates that are made only quarterly, certain current-period loans by year of origination are greater than those disclosed in the prior periods. Loans that did not have FICO scores as of the prior period have been updated with FICO scores as they become available.
(3) These personal, small business and other loans without a FICO score available include $30.6$27.1 billion and $31.5$29.2 billion of Private bankBank loans as of June 30, 2023March 31, 2024 and December 31, 2022,2023, respectively, which are classifiably managed within Global Wealth and are primarily evaluated for credit risk based on their internal risk ratings. As of June 30, 2023March 31, 2024 and December 31, 2022,2023, approximately 99%89% and 98%92% of these loans, respectively, were rated investment grade.
(4)(3) FICO scores not available related to loans guaranteed by government-sponsored enterprises for which FICO scores are generally not utilized.
(5)(4) Not included in the tables above are $63$34 million and $75$51 million of revolving credit card loans outside of the U.S. that were converted to term loans as of June 30, 2023March 31, 2024 and December 31, 2022,2023, respectively.
(6)(5) Excludes $599$568 million and $545$610 million of balances related to Canada for June 30, 2023March 31, 2024 and December 31, 2022,2023, respectively.
(7)(6) Excludes $919$871 million and $940$877 million of balances related to Canada for June 30, 2023March 31, 2024 and December 31, 2022,2023, respectively.
(8)(7) Includes approximately $49$32 million and $67$37 million of personal revolving loans that were converted to term loans for June 30, 2023March 31, 2024 and December 31, 2022,2023, respectively.
(8) Excludes $(74) million of unallocated portfolio layer cumulative basis adjustments at March 31, 2024.
Consumer Gross Credit Losses
The following table providestables provide details on gross credit losses recognized during the sixthree months ended June 30,March 31, 2024 and 2023, by year of loan origination:
| | In millions of dollars | In millions of dollars | Six Months Ended June 30, 2023 |
| In millions of dollars | |
| In millions of dollars | |
| Residential first mortgages | Residential first mortgages | |
| Residential first mortgages | |
| Residential first mortgages | |
| 2024 | |
| 2024 | |
| 2024 | |
| 2023 | |
| 2023 | |
| 2023 | 2023 | $ | — | |
| 2022 | 2022 | 1 | |
| 2022 | |
| 2022 | |
| 2021 | |
| 2021 | |
| 2021 | 2021 | — | |
| 2020 | 2020 | 1 | |
| 2019 | 3 | |
| 2020 | |
| 2020 | |
| Prior | |
| Prior | |
| Prior | Prior | 20 | |
| Total residential first mortgages | Total residential first mortgages | $ | 25 | |
| Total residential first mortgages | |
| Total residential first mortgages | |
| Home equity line of credit (pre-reset) | |
| Home equity line of credit (pre-reset) | |
| Home equity line of credit (pre-reset) | Home equity line of credit (pre-reset) | $ | 2 | |
| Home equity line of credit (post-reset) | Home equity line of credit (post-reset) | — | |
| Home equity line of credit (post-reset) | |
| Home equity line of credit (post-reset) | |
| Home equity term loans | |
| Home equity term loans | |
| Home equity term loans | Home equity term loans | 1 | |
| | Total home equity loans | Total home equity loans | $ | 3 | |
| | Total home equity loans | |
| | Total home equity loans | |
| Credit cards | |
| Credit cards | |
| Credit cards | Credit cards | $ | 2,925 | |
| Revolving loans converted to term loans | Revolving loans converted to term loans | 87 | |
| Revolving loans converted to term loans | |
| Revolving loans converted to term loans | |
| Total credit cards | |
| Total credit cards | |
| Total credit cards | Total credit cards | $ | 3,012 | |
| | Personal, small business and other | Personal, small business and other | |
| | Personal, small business and other | |
| | Personal, small business and other | |
| 2024 | |
| 2024 | |
| 2024 | |
| 2023 | |
| 2023 | |
| 2023 | 2023 | $ | 69 | |
| 2022 | 2022 | 89 | |
| 2022 | |
| 2022 | |
| 2021 | |
| 2021 | |
| 2021 | 2021 | 56 | |
| 2020 | 2020 | 23 | |
| 2019 | 27 | |
| 2020 | |
| 2020 | |
| Prior | |
| Prior | |
| Prior | Prior | 84 | |
| Total personal, small business and other | Total personal, small business and other | $ | 348 | |
| Total personal, small business and other | |
| Total personal, small business and other | |
| Total Citigroup | Total Citigroup | $ | 3,388 | |
| Total Citigroup | |
| Total Citigroup | |
| | | | | |
| In millions of dollars | Three Months Ended
March 31, 2023 |
| Residential first mortgages | |
| 2023 | $ | — | |
| 2022 | — | |
| 2021 | — | |
| 2020 | 1 | |
| 2019 | 1 | |
| Prior | 12 | |
| Total residential first mortgages | $ | 14 | |
| Home equity line of credit (pre-reset) | $ | — | |
| Home equity line of credit (post-reset) | — | |
| Home equity term loans | 1 | |
| |
| |
| |
| |
| |
| |
| Total home equity loans | $ | 1 | |
| Credit cards | $ | 1,366 | |
| Revolving loans converted to term loans | 42 | |
| Total credit cards | $ | 1,408 | |
| |
| Personal, small business and other | |
| 2023 | $ | 38 | |
| 2022 | 37 | |
| 2021 | 29 | |
| 2020 | 13 | |
| 2019 | 13 | |
| Prior | 42 | |
| Total personal, small business and other | $ | 172 | |
| Total Citigroup | $ | 1,595 | |
Loan-to-Value (LTV) Ratios—U.S. Consumer Mortgages
LTV ratios (loan balance divided by appraised value) are calculated at origination and updated by applying market price data.
The following tables provide details on the LTV ratios for Citi’s U.S. consumer mortgage portfolios by year of origination. LTV ratios are updated monthly using the most recent Core Logic Home Price Index data available for substantially all of the portfolio, applied at the Metropolitan Statistical Area level, if available, or the state level if not. The remainder of the portfolio is updated in a similar manner using the Federal Housing Finance Agency indices.
| LTV distribution—U.S. portfolio | LTV distribution—U.S. portfolio | June 30, 2023 | |
| In millions of dollars | In millions of dollars | Less than
or equal
to 80% | > 80% but less
than or equal to 100% | Greater
than
100% | LTV not available(1) | Total |
| In millions of dollars | |
| In millions of dollars | | Less than
or equal
to 80% | > 80% but less
than or equal to 100% | Greater
than
100% | LTV not available(1) | Total |
| Residential first mortgages | Residential first mortgages | |
| 2024 | |
| 2024 | |
| 2024 | |
| 2023 | |
| 2023 | |
| 2023 | 2023 | $ | 6,634 | | $ | 1,975 | | $ | 6 | | |
| 2022 | 2022 | 16,146 | | 5,916 | | 43 | | |
| 2022 | |
| 2022 | |
| 2021 | |
| 2021 | |
| 2021 | 2021 | 18,846 | | 1,096 | | 33 | | |
| 2020 | 2020 | 16,451 | | 362 | | 1 | | |
| 2019 | 8,395 | | 226 | | 26 | | |
| 2020 | |
| 2020 | |
| Prior | Prior | 25,029 | | 318 | | 78 | | |
| Prior | |
| Prior | |
| Total residential first mortgages | |
| Total residential first mortgages | |
| Total residential first mortgages | Total residential first mortgages | $ | 91,501 | | $ | 9,893 | | $ | 187 | | $ | 1,099 | | $ | 102,680 | |
| Home equity loans (pre-reset) | Home equity loans (pre-reset) | $ | 3,167 | | $ | 28 | | $ | 9 | | |
| Home equity loans (post-reset) | Home equity loans (post-reset) | 491 | | 8 | | 13 | | |
| Home equity loans (post-reset) | |
| Home equity loans (post-reset) | |
| Total home equity loans | Total home equity loans | $ | 3,658 | | $ | 36 | | $ | 22 | | $ | 284 | | $ | 4,000 | |
| Total | $ | 95,159 | | $ | 9,929 | | $ | 209 | | $ | 1,383 | | $ | 106,680 | |
| Total home equity loans | |
| Total home equity loans | |
Total(2) | |
| LTV distribution—U.S. portfolio | LTV distribution—U.S. portfolio | December 31, 2022 | |
| In millions of dollars | In millions of dollars | Less than
or equal
to 80% | > 80% but less
than or equal to 100% | Greater
than
100% | LTV not available(1) | Total |
| In millions of dollars | |
| In millions of dollars | | Less than
or equal
to 80% | > 80% but less
than or equal to 100% | Greater
than
100% | LTV not available(1) | Total |
| Residential first mortgages | Residential first mortgages | |
| 2023 | |
| 2023 | |
| 2023 | |
| 2022 | |
| 2022 | |
| 2022 | 2022 | $ | 15,644 | | $ | 6,497 | | $ | 40 | | |
| 2021 | 2021 | 19,104 | | 1,227 | | 33 | | |
| 2021 | |
| 2021 | |
| 2020 | |
| 2020 | |
| 2020 | 2020 | 16,935 | | 267 | | 1 | | |
| 2019 | 2019 | 8,789 | | 140 | | 23 | | |
| 2018 | 3,598 | | 74 | | 9 | | |
| 2019 | |
| 2019 | |
| Prior | Prior | 22,367 | | 132 | | 74 | | |
| Prior | |
| Prior | |
| Total residential first mortgages | |
| Total residential first mortgages | |
| Total residential first mortgages | Total residential first mortgages | $ | 86,437 | | $ | 8,337 | | $ | 180 | | $ | 1,085 | | $ | 96,039 | |
| Home equity loans (pre-reset) | Home equity loans (pre-reset) | $ | 3,677 | | $ | 36 | | $ | 56 | | |
| Home equity loans (post-reset) | Home equity loans (post-reset) | 627 | | 12 | | 27 | | |
| Home equity loans (post-reset) | |
| Home equity loans (post-reset) | |
| Total home equity loans | |
| Total home equity loans | |
| Total home equity loans | Total home equity loans | $ | 4,304 | | $ | 48 | | $ | 83 | | $ | 145 | | $ | 4,580 | |
| Total | Total | $ | 90,741 | | $ | 8,385 | | $ | 263 | | $ | 1,230 | | $ | 100,619 | |
(1)Residential first mortgages with no LTV information available includesinclude government-guaranteed loans that do not require LTV information for credit risk assessment and fair value loans.
(2)Excludes $(74) million of unallocated portfolio layer cumulative basis adjustments at March 31, 2024.
Loan-to-Value (LTV) Ratios—Outside of U.S. Consumer Mortgages
The following tables provide details on the LTV ratios for Citi’s consumer mortgage portfolio outside of the U.S. by year of origination:
| LTV distribution—outside of U.S. portfolio(1) | LTV distribution—outside of U.S. portfolio(1) | June 30, 2023 | |
| In millions of dollars | In millions of dollars | Less than
or equal
to 80% | > 80% but less
than or equal to 100% | Greater
than
100% | LTV not available | Total |
| In millions of dollars | |
| In millions of dollars | | Less than
or equal
to 80% | > 80% but less
than or equal to 100% | Greater
than
100% | LTV not available | Total |
| Residential mortgages | Residential mortgages | |
| 2024 | |
| 2024 | |
| 2024 | |
| 2023 | |
| 2023 | |
| 2023 | 2023 | $ | 1,847 | | $ | 620 | | $ | — | | |
| 2022 | 2022 | 3,356 | | 1,102 | | 33 | | |
| 2022 | |
| 2022 | |
| 2021 | |
| 2021 | |
| 2021 | 2021 | 3,713 | | 1,069 | | 44 | | |
| 2020 | 2020 | 2,845 | | 385 | | — | | |
| 2019 | 2,775 | | 63 | | 1 | | |
| 2020 | |
| 2020 | |
| Prior | |
| Prior | |
| Prior | Prior | 8,942 | | 44 | | 8 | | |
| Total | Total | $ | 23,478 | | $ | 3,283 | | $ | 86 | | $ | 243 | | $ | 27,090 | |
| Total | |
| Total | |
| LTV distribution—outside of U.S. portfolio(1) | LTV distribution—outside of U.S. portfolio(1) | December 31, 2022 | |
| In millions of dollars | In millions of dollars | Less than
or equal
to 80% | > 80% but less
than or equal to 100% | Greater
than
100% | LTV not available | Total |
| In millions of dollars | |
| In millions of dollars | | Less than
or equal
to 80% | > 80% but less
than or equal to 100% | Greater
than
100% | LTV not available | Total |
| Residential mortgages | Residential mortgages | |
| 2023 | |
| 2023 | |
| 2023 | |
| 2022 | |
| 2022 | |
| 2022 | 2022 | $ | 3,106 | | $ | 975 | | $ | 294 | | |
| 2021 | 2021 | 4,144 | | 964 | | 273 | | |
| 2021 | |
| 2021 | |
| 2020 | |
| 2020 | |
| 2020 | 2020 | 3,293 | | 502 | | 25 | | |
| 2019 | 2019 | 3,048 | | 92 | | 1 | | |
| 2018 | 2,074 | | 48 | | — | | |
| 2019 | |
| 2019 | |
| Prior | |
| Prior | |
| Prior | Prior | 9,201 | | 36 | | 7 | | |
| Total | Total | $ | 24,866 | | $ | 2,617 | | $ | 600 | | $ | 31 | | $ | 28,114 | |
| Total | |
| Total | |
(1)Mortgage portfolios outside of the U.S. are primarily in Global Wealth.Wealth. As of June 30, 2023March 31, 2024 and December 31, 2022,2023, mortgage portfolios outside of the U.S. had an average LTV of approximately 52%56% and 51%55%, respectively.
Consumer Loans and Ratios Outside of North America
| | | | Delinquency-managed loans and ratios |
| In millions of dollars at June 30, 2023 | | Total loans outside of North America(1) | Classifiably managed loans(2) | Delinquency-managed loans | 30–89
days past
due ratio | ≥ 90 days past due ratio | 2Q23 NCL ratio | 2Q22 NCL ratio |
| | | | | Delinquency-managed loans and ratios | |
| | | | | Delinquency-managed loans and ratios | |
| | | | | Delinquency-managed loans and ratios | |
| In millions of dollars at March 31, 2024 | | In millions of dollars at March 31, 2024 | | | Total loans outside of North America(1) | Classifiably managed loans(2) | Delinquency-managed loans | 30–89
days past
due ratio | ≥ 90 days past due ratio | 1Q24 NCL ratio | 1Q23 NCL ratio |
Residential mortgages(3) | Residential mortgages(3) | | $ | 27,090 | | $ | — | | $ | 27,090 | | 0.18 | % | 0.34 | % | (0.01) | % | 0.04 | % | Residential mortgages(3) | | | $ | 25,926 | | $ | — | | $ | 25,926 | | 0.20 | 0.20 | % | 0.28 | % | 0.07 | % | 0.11 | % |
| Credit cards | Credit cards | | 13,714 | | — | | 13,714 | | 1.31 | | 1.39 | | 3.98 | | 3.08 | |
Personal, small business and other(4) | Personal, small business and other(4) | | 36,995 | | 17,902 | | 19,093 | | 0.57 | | 0.20 | | 0.91 | | 0.55 | |
| Total | Total | | $ | 77,799 | | $ | 17,902 | | $ | 59,897 | | 0.56 | % | 0.54 | % | 1.12 | % | 0.72 | % | Total | | | $ | 75,030 | | $ | 17,128 | | $ | 57,902 | | 0.61 | 0.61 | % | 0.56 | % | 1.47 | % | 1.09 | % |
| | | | Delinquency-managed loans and ratios | |
| In millions of dollars at December 31, 2022 | | Total loans outside of North America(1) | Classifiably managed loans(2) | Delinquency-managed loans | 30–89
days past
due ratio | ≥ 90 days past due ratio | |
| | | | | Delinquency-managed loans and ratios | |
| | | | | Delinquency-managed loans and ratios | |
| | | | | Delinquency-managed loans and ratios | |
| In millions of dollars at December 31, 2023 | |
| In millions of dollars at December 31, 2023 | |
| In millions of dollars at December 31, 2023 | |
Residential mortgages(3) | |
Residential mortgages(3) | |
Residential mortgages(3) | Residential mortgages(3) | | $ | 28,114 | | $ | — | | $ | 28,114 | | 0.22 | % | 0.38 | % | |
| Credit cards | Credit cards | | 12,955 | | — | | 12,955 | | 1.13 | | 1.15 | | |
| Credit cards | |
| Credit cards | |
Personal, small business and other(4) | |
Personal, small business and other(4) | |
Personal, small business and other(4) | Personal, small business and other(4) | | 37,984 | | 17,762 | | 20,222 | | 0.52 | | 0.05 | | |
| Total | Total | | $ | 79,053 | | $ | 17,762 | | $ | 61,291 | | 0.51 | % | 0.43 | % | |
| Total | |
| Total | |
(1) Mexico is included in offices outside of North America.
(2) Classifiably managed loans are primarily evaluated for credit risk based on their internal risk classification. As of June 30, 2023March 31, 2024 and December 31, 2022,2023, approximately 93%67% and 94%74% of these loans, respectively, were rated investment grade.
(3) Includes $20.4$19.5 billion and $19.8$19.9 billion as of June 30, 2023March 31, 2024 and December 31, 2022,2023, respectively, of residential mortgages related to the Global Wealth business..
(4) Includes $26.0$24.7 billion and $26.6$24.9 billion as of June 30, 2023March 31, 2024 and December 31, 2022,2023, respectively, of loans related to the Global Wealth business..
Consumer Loan Modifications to Borrowers Experiencing Financial Difficulty
Citi seeks to modify consumer loans to borrowers experiencing financial difficulty to minimize losses, avoid foreclosure or repossession of collateral and ultimately maximize payments received from the borrowers. Citi uses various metrics to identify consumer borrowers experiencing financial difficulty, with the primary indicator being delinquency at the time of modification. Citi’s significant consumer modification programs are described below.
Credit Cards
Citi seeks to assist credit card borrowers who are experiencing financial difficulty by offering long-term loan modification programs. These modifications generally involve reducing the interest rate on the credit card, placing the customer on a fixed payment plan not to exceed 60 months and canceling the customer’s available line of credit. Citi also grants modifications to credit card borrowers working with third-party renegotiation agencies that seek to restructure customers’ entire unsecured debt. In both circumstances, if the cardholder does not comply with the modified payment terms, the credit card loan continues to age and will ultimately be charged off in accordance with Citi’s standard charge-off policy. In certain situations, Citi may forgive a portion of an outstanding balance if the borrower pays a required amount.
Residential Mortgages
Citi utilizes a third-party subservicer for the servicing of its residential mortgage loans. Through this third-party subservicer, Citi seeks to assist residential mortgage borrowers who are experiencing financial difficulty primarily by offering interest rate reductions, principal and/or interest forbearance, term extensions or combinations thereof. Borrowers enrolled in forbearance programs typically have payments suspended until the end of the forbearance period. In the U.S., before permanently modifying the contractual payment terms of a mortgage loan, Citi enters into a trial modification with the borrower. Trial modifications generally represent a three-month period during which the borrower makes monthly payments under the anticipated modified payment terms. These loans continue to age and accrue interest in accordance with their original contractual terms. Upon successful completion of the trial period, and the borrower’s formal acceptance of the modified terms, Citi and the borrower enter into a permanent modification. Citi expects the majority of loans entering trial modifications to ultimately be enrolled in a permanent modification. During the three and six months ended June 30,March 31, 2024 and 2023, $15$11 million and $26$25 million respectively, of mortgage loans were enrolled in trial programs.programs, respectively. Mortgage loans of $1$2 million and $2$1 million had gone through Chapter 7 bankruptcy during the three and six months ended June 30,March 31, 2024 and 2023, respectively.
Types of Consumer Loan Modifications and Their Financial Effect
The following tables provide details on permanent consumer loan modifications granted during the three and six months ended June 30,March 31, 2024 and 2023 to borrowers experiencing financial difficulty by type of modification granted and the financial effect of those modifications:
| | | |
| | | | | | | For the Three Months Ended June 30, 2023 | | | | | For the Three Months Ended March 31, 2024 |
| In millions of dollars, except weighted averages | In millions of dollars, except weighted averages | | Modifications as % of loans | Total modifications balance at June 30, 2023(1)(2)(3) | | Interest rate reduction | Term extension | Payment delay | Combination: interest rate reduction and term extension | Combination: term extension and payment delay(4) | | Weighted average interest rate reduction % | Weighted average term extension (months) | Weighted average delay in payments (months) | In millions of dollars, except weighted averages | | Modifications as % of loans | Total modifications balance at March 31, 2024(1)(2)(3) | | Interest rate reduction | Term extension | Payment delay | Combination: interest rate reduction and term extension | Combination: term extension and payment delay | Combination: interest rate reduction, term extension and payment delay | Weighted-average interest rate reduction % | Weighted-average term extension (months) | Weighted-average delay in payments (months) |
In North America offices(5) | | | | | | | | | |
Residential first mortgages(6) | | 0.05 | % | $ | 47 | | | $ | 1 | | $ | 15 | | $ | 29 | | $ | 2 | | $ | — | | | 1 | % | 191 | 6 |
In North America offices(4) | | In North America offices(4) | | | | | | | | | |
Residential first mortgages(5) | | Residential first mortgages(5) | | 0.03 | % | $ | 31 | | | $ | — | | $ | 24 | | $ | 6 | | $ | 1 | | $ | — | | $ | — | | 1 | % | 189 | 10 |
| Home equity loans | Home equity loans | | 0.23 | | 9 | | | — | | — | | 1 | | 8 | | — | | | 2 | | 119 | 6 |
| Credit cards | Credit cards | | 0.18 | | 275 | | | 275 | | — | | — | | — | | — | | | 22 | | — | | — | |
| Personal, small business and other | Personal, small business and other | | 0.01 | | 4 | | | — | | 1 | | — | | 3 | | — | | | 6 | | 13 | — | | Personal, small business and other | | 0.02 | | 8 | 8 | | | 1 | | 1 | | — | — | | 1 | 1 | | 6 | 6 | | — | — | | — | — | | 7 | 7 | | 18 | 18 | 5 |
| Total | Total | | 0.11 | % | $ | 335 | | | $ | 276 | | $ | 16 | | $ | 30 | | $ | 13 | | $ | — | | | | |
In offices outside North America(5) | | | | | | | |
In offices outside North America(4) | |
In offices outside North America(4) | |
In offices outside North America(4) | |
| Residential mortgages | |
| Residential mortgages | |
| Residential mortgages | Residential mortgages | | 1.03 | % | $ | 278 | | | $ | 3 | | $ | — | | $ | — | | $ | — | | $ | 275 | | | — | % | 1 | | 0.06 | % | $ | 15 | | | $ | | $ | — | | $ | — | | $ | 14 | | $ | 1 | | $ | — | | $ | — | | 2 | 2 | % | 183 | 12 |
| Credit cards | Credit cards | | 0.09 | | 12 | | | 12 | | — | | — | | — | | — | | | 18 | | — | | — | |
| Personal, small business and other | Personal, small business and other | | 0.02 | | 7 | | | 1 | | 2 | | — | | 4 | | — | | | 9 | | 20 | — | |
| Total | Total | | 0.38 | % | $ | 297 | | | $ | 16 | | $ | 2 | | $ | — | | $ | 4 | | $ | 275 | | | | |
| | | |
| | | | | | | For the Six Months Ended June 30, 2023 | | | | | For the Three Months Ended March 31, 2023 |
| In millions of dollars, except weighted averages | In millions of dollars, except weighted averages | | Modifications as % of loans | Total modifications balance at June 30, 2023(1)(2)(3) | | Interest rate reduction | Term extension | Payment delay | Combination: interest rate reduction and term extension | Combination: term extension and payment delay(4) | | Weighted average interest rate reduction % | Weighted average term extension (months) | Weighted average delay in payments (months) | In millions of dollars, except weighted averages | | Modifications as % of loans | Total modifications balance at March 31, 2023(1)(2)(3) | | Interest rate reduction | Term extension | Payment delay | Combination: interest rate reduction and term extension | Combination: term extension and payment delay | Combination: interest rate reduction, term extension and payment delay | Weighted-average interest rate reduction % | Weighted-average term extension (months) | Weighted-average delay in payments (months) |
In North America offices(5) | | | | | | | | | |
Residential first mortgages(6) | | 0.10 | % | $ | 100 | | | $ | 1 | | $ | 30 | | $ | 64 | | $ | 5 | | $ | — | | | 1 | % | 187 | 6 |
In North America offices(4) | | In North America offices(4) | | | | | | | | | |
Residential first mortgages(5) | | Residential first mortgages(5) | | 0.05 | % | $ | 52 | | | $ | — | | $ | 15 | | $ | 34 | | $ | 3 | | $ | — | | $ | — | | 2 | % | 183 | 6 |
| Home equity loans | Home equity loans | | 0.48 | | 19 | | | — | | — | | 6 | | 13 | | — | | | 2 | | 120 | 6 | Home equity loans | | 0.19 | | 8 | 8 | | | — | | — | | — | — | | 3 | 3 | | 5 | 5 | | — | — | | — | — | | 3 | 3 | | 120 | 120 | 5 |
| Credit cards | Credit cards | | 0.33 | | 499 | | | 499 | | — | | — | | — | | — | | | 22 | | — | | — | |
| Personal, small business and other | Personal, small business and other | | 0.02 | | 6 | | | 1 | | 1 | | — | | 4 | | — | | | 6 | | 14 | — | |
| Total | Total | | 0.21 | % | $ | 624 | | | $ | 501 | | $ | 31 | | $ | 70 | | $ | 22 | | $ | — | | | | |
In offices outside North America(5) | | | | | | | |
In offices outside North America(4) | |
In offices outside North America(4) | |
In offices outside North America(4) | |
| Residential mortgages | |
| Residential mortgages | |
| Residential mortgages | Residential mortgages | | 1.09 | % | $ | 296 | | | $ | 5 | | $ | — | | $ | — | | $ | 1 | | $ | 290 | | | — | % | 2 | | 0.97 | % | $ | 260 | | | $ | | $ | — | | $ | — | | $ | 17 | | $ | — | | $ | 242 | | $ | 1 | | — | — | % | 1 |
| Credit cards | Credit cards | | 0.17 | | 23 | | | 23 | | — | | — | | — | | — | | | 18 | | — | | — | |
| Personal, small business and other | Personal, small business and other | | 0.04 | | 16 | | | 3 | | 4 | | — | | 9 | | — | | | 8 | | 21 | — | | Personal, small business and other | | 0.02 | | 7 | 7 | | | 1 | | 1 | | 2 | 2 | | — | — | | 4 | 4 | | — | — | | — | — | | 6 | 6 | | 20 | 20 | 6 |
| Total | Total | | 0.43 | % | $ | 335 | | | $ | 31 | | $ | 4 | | $ | — | | $ | 10 | | $ | 290 | | | | |
(1) The above tables reflect activity for loans outstanding as of the end of the reporting period. During the three and six months ended June 30,March 31, 2024 and 2023, Citi granted forgiveness of $16$25 million and $26$9 million, respectively, in credit card loans and $1$3 million and $1 million, respectively, in personal, small business and other loans that hadloans. As a result, there were no outstanding balance at June 30,balances as of March 31, 2024 and 2023.
(2) Commitments to lend to borrowers experiencing financial difficulty that were granted modifications included in the tables above were immaterial at June 30,March 31, 2024 and 2023.
(3) For major consumer portfolios, the ACLL is based on macroeconomic-sensitive models that rely on historical performance and macroeconomic scenarios to forecast expected credit losses. Modifications of consumer loans impact expected credit losses by affecting the likelihood of default.
(4) Residential mortgages in offices outside North America were granted four months of payment deferrals during the six months ended December 31, 2022.
(5) North America includes the U.S., Canada and Puerto Rico. Mexico is included in offices outside North America.
(6)(5) Excludes residential first mortgages discharged in Chapter 7 bankruptcy in the three and six months ended June 30,March 31, 2024 and 2023.
The following tables present the Company’s three and six months ended June 30, 2022 consumer TDRs, under previous GAAP, prior to the Company’s adoption of ASU No. 2022-02 on January 1, 2023:
Consumer Troubled Debt Restructurings(1)
| | | | | | | | | | | | | | | | | | | | |
| | For the Three Months Ended June 30, 2022 |
| In millions of dollars, except number of loans modified | Number of
loans modified | Post-
modification
recorded
investment(2)(3) | Deferred
principal(4) | Contingent
principal
forgiveness(5) | Principal
forgiveness(6) | Average
interest rate
reduction |
| North America | | | | | | |
| Residential first mortgages | 279 | | $ | 56 | | $ | — | | $ | — | | $ | — | | — | % |
| Home equity loans | 103 | | 7 | | — | | — | | — | | — | |
| Credit cards | 36,820 | | 157 | | — | | — | | — | | 18 | |
| Personal, small business and other | 105 | | 1 | | — | | — | | — | | 5 | |
Total(7) | 37,307 | | $ | 221 | | $ | — | | $ | — | | $ | — | | |
| International | | | | | | |
| Residential mortgages | 110 | | $ | 4 | | $ | — | | $ | — | | $ | — | | — | % |
| Credit cards | 3,462 | | 13 | | — | | — | | — | | 27 | |
| Personal, small business and other | 595 | | 7 | | — | | — | | — | | 8 | |
Total(7) | 4,167 | | $ | 24 | | $ | — | | $ | — | | $ | — | | |
| | | | | | |
| | For the Six Months Ended June 30, 2022 |
| In millions of dollars, except number of loans modified | Number of
loans modified | Post-
modification
recorded
investment(2)(8) | Deferred
principal(4) | Contingent
principal
forgiveness(5) | Principal
forgiveness(6) | Average
interest rate
reduction |
| North America | | | | | | |
| Residential first mortgages | 625 | | $ | 137 | | $ | — | | $ | — | | $ | — | | — | % |
| Home equity loans | 207 | | 16 | | — | | — | | — | | — | |
| Credit cards | 77,560 | | 330 | | — | | — | | — | | 17 | |
| Personal, small business and other | 251 | | 2 | | — | | — | | — | | 5 | |
Total(7) | 78,643 | | $ | 485 | | $ | — | | $ | — | | $ | — | | |
| International | | | | | | |
| Residential first mortgages | 293 | | $ | 10 | | $ | — | | $ | — | | $ | — | | — | % |
| Credit cards | 8,462 | | 35 | | — | | — | | 1 | | 23 | |
| Personal, small business and other | 1,267 | | 16 | | — | | — | | — | | 8 | |
Total(7) | 10,022 | | $ | 61 | | $ | — | | $ | — | | $ | 1 | | |
(1)The above tables do not include loan modifications that meet the TDR relief criteria in the Coronavirus Aid, Relief, and Economic Security Act (CARES Act) or the interagency guidance.
(2)Post-modification balances include past-due amounts that are capitalized at the modification date.
(3)Post-modification balances in North America include $0.4 million of residential first mortgages to borrowers who have gone through Chapter 7 bankruptcy in the three months ended June 30, 2022. These amounts include $0.4 million of residential first mortgages that were newly classified as TDRs in the three months ended June 30, 2022, based on previously received OCC guidance.
(4)Represents portion of contractual loan principal that is non-interest bearing, but still due from the borrower. Such deferred principal is charged off at the time of permanent modification to the extent that the related loan balance exceeds the underlying collateral value.
(5)Represents portion of contractual loan principal that is non-interest bearing and, depending upon borrower performance, eligible for forgiveness.
(6)Represents portion of contractual loan principal that was forgiven at the time of permanent modification.
(7) The above tables reflect activity for restructured loans that were considered TDRs during the reporting period.
(8) Post-modification balances in North America include $2 million of residential first mortgages to borrowers who have gone through Chapter 7 bankruptcy in the six months ended June 30, 2022. These amounts include $2 million of residential first mortgages that were newly classified as TDRs in the six months ended June 30, 2022, based on previously received OCC guidance.
Performance of Modified Consumer Loans
The following table presentstables present the delinquencies and gross credit losses of permanently modified consumer loans to borrowers experiencing financial difficulty. It includes loans that were modified during the six12 months ended June 30,March 31, 2024 and the year ended December 31, 2023:
| | As of June 30, 2023 |
| As of March 31, 2024 | | | As of March 31, 2024 |
| In millions of dollars | In millions of dollars | Total | Current | 30–89 days past due | 90+ days
past due | Gross
credit losses | In millions of dollars | Total | Current | 30–89 days past due | 90+ days
past due | Gross
credit losses |
In North America offices(1) | In North America offices(1) | | | | |
| Residential first mortgages | |
| Residential first mortgages | |
| Residential first mortgages | Residential first mortgages | $ | 100 | | $ | 36 | | $ | 20 | | $ | 44 | | $ | — | |
| Home equity loans | Home equity loans | 19 | | 14 | | 1 | | 4 | | — | |
| Credit cards | Credit cards | 499 | | 319 | | 102 | | 78 | | 57 | |
| Personal, small business and other | Personal, small business and other | 6 | | 6 | | — | | — | | — | |
Total(2)(3) | Total(2)(3) | $ | 624 | | $ | 375 | | $ | 123 | | $ | 126 | | $ | 57 | |
In offices outside North America(1) | In offices outside North America(1) | | | | |
| Residential mortgages | Residential mortgages | $ | 296 | | $ | 295 | | $ | 1 | | $ | — | | $ | — | |
| Residential mortgages | |
| Residential mortgages | |
| | Credit cards | |
| Credit cards | |
| Credit cards | Credit cards | 23 | | 20 | | 2 | | 1 | | — | |
| Personal, small business and other | Personal, small business and other | 16 | | 14 | | 1 | | 1 | | 1 | |
Total(2)(3) | Total(2)(3) | $ | 335 | | $ | 329 | | $ | 4 | | $ | 2 | | $ | 1 | |
| | | | | | | | | | | | | | | | | |
| As of December 31, 2023 |
| In millions of dollars | Total | Current | 30–89 days past due | 90+ days
past due | Gross
credit losses |
In North America offices(1) | | | | | |
| Residential first mortgages | $ | 164 | | $ | 70 | | $ | 22 | | $ | 72 | | $ | — | |
| Home equity loans | 21 | | 14 | | 1 | | 6 | | — | |
| Credit cards | 1,039 | | 740 | | 179 | | 120 | | 204 | |
| Personal, small business and other | 14 | | 12 | | 1 | | 1 | | 1 | |
Total(2)(3) | $ | 1,238 | | $ | 836 | | $ | 203 | | $ | 199 | | $ | 205 | |
In offices outside North America(1) | | | | | |
| Residential mortgages | $ | 334 | | $ | 331 | | $ | 2 | | $ | 1 | | $ | — | |
| | | | | |
| Credit cards | 43 | | 37 | | 3 | | 3 | | 4 | |
| Personal, small business and other | 27 | | 24 | | 3 | | — | | 1 | |
Total(2)(3) | $ | 404 | | $ | 392 | | $ | 8 | | $ | 4 | | $ | 5 | |
(1) North America includes the U.S., Canada and Puerto Rico. Mexico is included in offices outside North America.
(2) Typically, upon modification a loan re-ages to current. However, FFIEC guidelines for re-aging certain loans require that at least three consecutive minimum monthly payments, or the equivalent amount, be received. In these cases, the loan will remain delinquent until the payment criteria for re-aging have been satisfied.
(3) Loans modified under Citi’s COVID-19 consumer relief programs continue to be reported in the same delinquency bucket they were in at the time of modification.
Defaults of Modified Consumer Loans
The following tables present default activity for permanently modified consumer loans to borrowers experiencing financial difficulty by type of modification granted, including loans that were modified and subsequently defaulted during the three and six months ended June 30,March 31, 2024 and 2023. Default is defined as 60 days past due:
| | | |
| | | | | | For the Three Months Ended June 30, 2023 | | | For the Three Months Ended March 31, 2024 |
| In millions of dollars | In millions of dollars | Total(1)(2) | | Interest rate reduction | Term
extension | Payment
delay | Combination: interest rate reduction and term extension | Combination: term extension and payment delay | Combination: interest rate reduction, term extension and payment delay | In millions of dollars | Total(1)(2) | | Interest rate reduction | Term
extension | Payment
delay | Combination: interest rate reduction and term extension | Combination: term extension and payment delay | Combination: interest rate reduction, term extension and payment delay |
In North America offices(3) | In North America offices(3) | | | | |
| Residential first mortgages | |
| Residential first mortgages | |
| Residential first mortgages | Residential first mortgages | $ | 1 | | | $ | 1 | | $ | — | | $ | — | | $ | — | | $ | — | | $ | — | |
| Home equity loans | Home equity loans | — | | | — | | — | | — | | — | | — | | — | |
Credit cards(4) | Credit cards(4) | 50 | | | 50 | | — | | — | | — | | — | | — | |
| Personal, small business and other | Personal, small business and other | — | | | — | | — | | — | | — | | — | | — | |
| Total | Total | $ | 51 | | | $ | 51 | | $ | — | | $ | — | | $ | — | | $ | — | | $ | — | |
In offices outside North America(3) | In offices outside North America(3) | | | |
| Residential mortgages | |
| Residential mortgages | |
| Residential mortgages | Residential mortgages | $ | — | | | $ | — | | $ | — | | $ | — | | $ | — | | $ | — | | $ | — | |
Credit cards(4) | Credit cards(4) | 1 | | | 1 | | — | | — | | — | | — | | — | |
| Personal, small business and other | Personal, small business and other | — | | | — | | — | | — | | — | | — | | — | |
| Total | Total | $ | 1 | | | $ | 1 | | $ | — | | $ | — | | $ | — | | $ | — | | $ | — | |
| |
| | | |
| | | | | | For the Six Months Ended June 30, 2023 | | | For the Three Months Ended March 31, 2023 |
| In millions of dollars | In millions of dollars | Total(1)(2) | | Interest rate reduction | Term
extension | Payment
delay | Combination: interest rate reduction and term extension | Combination: term extension and payment delay | Combination: interest rate reduction, term extension and payment delay | In millions of dollars | Total(1)(2) | | Interest rate reduction | Term
extension | Payment
delay | Combination: interest rate reduction and term extension | Combination: term extension and payment delay | Combination: interest rate reduction, term extension and payment delay |
In North America offices(3) | In North America offices(3) | | | | |
| Residential first mortgages | |
| Residential first mortgages | |
| Residential first mortgages | Residential first mortgages | $ | 1 | | | $ | 1 | | $ | — | | $ | — | | $ | — | | $ | — | | $ | — | |
| Home equity loans | Home equity loans | — | | | — | | — | | — | | — | | — | | — | |
Credit cards(4) | Credit cards(4) | 55 | | | 55 | | — | | — | | — | | — | | — | |
| Personal, small business and other | Personal, small business and other | — | | | — | | — | | — | | — | | — | | — | |
| Total | Total | $ | 56 | | | $ | 56 | | $ | — | | $ | — | | $ | — | | $ | — | | $ | — | |
In offices outside North America(3) | In offices outside North America(3) | | | |
| Residential mortgages | |
| Residential mortgages | |
| Residential mortgages | Residential mortgages | $ | — | | | $ | — | | $ | — | | $ | — | | $ | — | | $ | — | | $ | — | |
Credit cards(4) | Credit cards(4) | 1 | | | 1 | | — | | — | | — | | — | | — | |
| Personal, small business and other | Personal, small business and other | 1 | | | — | | — | | — | | 1 | | — | | — | |
| Total | Total | $ | 2 | | | $ | 1 | | $ | — | | $ | — | | $ | 1 | | $ | — | | $ | — | |
| |
(1) The above table reflects activity for loans outstanding as of the end of the reporting period.
(2) Modified residential first mortgages that default are typically liquidated through foreclosure or a similar type of liquidation.
(3) North America includes the U.S., Canada and Puerto Rico. Mexico is included in offices outside North America.
(4) Modified credit card loans that default continue to be charged off in accordance with Citi’s consumer charge-off policy.
The following table presents the Company’s three and six months ended June 30, 2022 consumer TDRs, under previous GAAP, prior to the Company’s adoption of ASU No. 2022-02 on January 1, 2023, that defaulted for which the payment default occurred within one year of a permanent modification. Default is defined as 60 days past due:
| | | | | | | | | | |
| Three Months Ended June 30, | | Six Months Ended June 30, | |
| In millions of dollars | 2022 | | 2022 | |
| North America | | | | |
| Residential first mortgages | $ | 13 | | | $ | 17 | | |
| Home equity loans | 2 | | | 2 | | |
| Credit cards | 59 | | | 116 | | |
| Personal, small business and other | — | | | — | | |
| Total | $ | 74 | | | $ | 135 | | |
| International | | | | |
| Residential mortgages | $ | 3 | | | $ | 7 | | |
| Credit cards | 3 | | | 7 | | |
| Personal, small business and other | 1 | | | 2 | | |
| Total | $ | 7 | | | $ | 16 | | |
14.15. ALLOWANCE FOR CREDIT LOSSES
| | Three Months Ended June 30, | Six Months Ended June 30, |
| Three Months Ended March 31, | |
| Three Months Ended March 31, | |
| Three Months Ended March 31, | |
| In millions of dollars | |
| In millions of dollars | |
| In millions of dollars | In millions of dollars | 2023 | 2022 | 2023 | 2022 |
| Allowance for credit losses on loans (ACLL) at beginning of period | Allowance for credit losses on loans (ACLL) at beginning of period | $ | 17,169 | | $ | 15,393 | | $ | 16,974 | | $ | 16,455 | |
| Allowance for credit losses on loans (ACLL) at beginning of period | |
| Allowance for credit losses on loans (ACLL) at beginning of period | |
Adjustments to opening balance(1) | Adjustments to opening balance(1) | | | |
Adjustments to opening balance(1) | |
Adjustments to opening balance(1) | |
Financial instruments—TDRs and vintage disclosures(1) | |
Financial instruments—TDRs and vintage disclosures(1) | |
Financial instruments—TDRs and vintage disclosures(1) | Financial instruments—TDRs and vintage disclosures(1) | $ | — | | $ | — | | $ | (352) | | $ | — | |
| | Adjusted ACLL at beginning of period | Adjusted ACLL at beginning of period | $ | 17,169 | | $ | 15,393 | | $ | 16,622 | | $ | 16,455 | |
| | Adjusted ACLL at beginning of period | |
| | Adjusted ACLL at beginning of period | |
| Gross credit losses on loans | |
| Gross credit losses on loans | |
| Gross credit losses on loans | Gross credit losses on loans | $ | (1,879) | | $ | (1,212) | | $ | (3,513) | | $ | (2,452) | |
| Gross recoveries on loans | Gross recoveries on loans | 375 | | 362 | | 707 | | 730 | |
| Gross recoveries on loans | |
| Gross recoveries on loans | |
| Net credit losses on loans (NCLs) | |
| Net credit losses on loans (NCLs) | |
| Net credit losses on loans (NCLs) | Net credit losses on loans (NCLs) | $ | (1,504) | | $ | (850) | | $ | (2,806) | | $ | (1,722) | |
| Replenishment of NCLs | Replenishment of NCLs | $ | 1,504 | | $ | 850 | | $ | 2,806 | | $ | 1,722 | |
| Replenishment of NCLs | |
| Replenishment of NCLs | |
| Net reserve builds (releases) for loans | |
| Net reserve builds (releases) for loans | |
| Net reserve builds (releases) for loans | Net reserve builds (releases) for loans | 290 | | 520 | | 687 | | (260) | |
| Net specific reserve builds (releases) for loans | Net specific reserve builds (releases) for loans | (33) | | 14 | | 5 | | 182 | |
| Net specific reserve builds (releases) for loans | |
| Net specific reserve builds (releases) for loans | |
| Total provision for credit losses on loans (PCLL) | |
| Total provision for credit losses on loans (PCLL) | |
| Total provision for credit losses on loans (PCLL) | Total provision for credit losses on loans (PCLL) | $ | 1,761 | | $ | 1,384 | | $ | 3,498 | | $ | 1,644 | |
| | Other, net (see table below) | Other, net (see table below) | 70 | | 25 | | 182 | | (425) | |
| | Other, net (see table below) | |
| | Other, net (see table below) | |
| ACLL at end of period | ACLL at end of period | $ | 17,496 | | $ | 15,952 | | $ | 17,496 | | $ | 15,952 | |
| ACLL at end of period | |
| ACLL at end of period | |
Allowance for credit losses on unfunded lending commitments (ACLUC) at beginning of period(2) | |
Allowance for credit losses on unfunded lending commitments (ACLUC) at beginning of period(2) | |
Allowance for credit losses on unfunded lending commitments (ACLUC) at beginning of period(2) | Allowance for credit losses on unfunded lending commitments (ACLUC) at beginning of period(2) | $ | 1,959 | | $ | 2,343 | | $ | 2,151 | | $ | 1,871 | |
| | Provision (release) for credit losses on unfunded lending commitments | Provision (release) for credit losses on unfunded lending commitments | (96) | | (159) | | (290) | | 315 | |
| | Provision (release) for credit losses on unfunded lending commitments | |
| | Provision (release) for credit losses on unfunded lending commitments | |
| Other, net | |
| Other, net | |
| Other, net | Other, net | (1) | | 9 | | 1 | | 7 | |
ACLUC at end of period(2) | ACLUC at end of period(2) | $ | 1,862 | | $ | 2,193 | | $ | 1,862 | | $ | 2,193 | |
Total allowance for credit losses on loans, leases and unfunded lending commitments(3) | $ | 19,358 | | $ | 18,145 | | $ | 19,358 | | $ | 18,145 | |
ACLUC at end of period(2) | |
ACLUC at end of period(2) | |
| Total allowance for credit losses on loans, leases and unfunded lending commitments | |
| Total allowance for credit losses on loans, leases and unfunded lending commitments | |
| Total allowance for credit losses on loans, leases and unfunded lending commitments | |
| | Other, net details | Other, net details | Three Months Ended June 30, | Six Months Ended June 30, |
| Other, net details | |
| Other, net details | |
| In millions of dollars | |
| In millions of dollars | |
| In millions of dollars | In millions of dollars | 2023 | 2022 | 2023 | 2022 |
| Reclasses of consumer ACLL to HFS(4) | $ | — | | $ | — | | $ | — | | $ | (350) | |
| | FX translation and other | |
| | FX translation and other | |
| | FX translation and other | FX translation and other | 70 | | 25 | | 182 | | (75) | |
| Other, net | Other, net | $ | 70 | | $ | 25 | | $ | 182 | | $ | (425) | |
| Other, net | |
| Other, net | |
(1)See “Accounting Changes” in Note 1 in Citi’s First Quarter of 2023 Form 10-Q for a description of the impact of adopting ASU 2022-02 on the ACL.1.
(2)Represents additional credit loss reserves for unfunded lending commitments and letters of credit recorded inOther liabilities on the Consolidated Balance Sheet.
(3) See below for ACL on
HTM debt securities and Other assets.
(4) See Note 2.
Allowance for Credit Losses on Loans and End-of-Period Loans
| | Three Months Ended |
| June 30, 2023 | June 30, 2022 |
| Three Months Ended | | | Three Months Ended |
| March 31, 2024 | | | March 31, 2024 | March 31, 2023 |
| In millions of dollars | In millions of dollars | Corporate | Consumer | Total | Corporate | Consumer | Total | In millions of dollars | Corporate | Consumer | Total | Corporate | Consumer | Total |
| ACLL at beginning of period | ACLL at beginning of period | $ | 2,780 | | $ | 14,389 | | $ | 17,169 | | $ | 3,025 | | $ | 12,368 | | $ | 15,393 | |
| | Charge-offs | (86) | | (1,793) | | (1,879) | | (57) | | (1,155) | | (1,212) | |
| Recoveries | 11 | | 364 | | 375 | | 34 | | 328 | | 362 | |
| Replenishment of NCLs | 75 | | 1,429 | | 1,504 | | 23 | | 827 | | 850 | |
| Net reserve builds (releases) | (119) | | 409 | | 290 | | (128) | | 648 | | 520 | |
| Net specific reserve builds (releases) | (33) | | — | | (33) | | 49 | | (35) | | 14 | |
| | Other | 2 | | 68 | | 70 | | 23 | | 2 | | 25 | |
| Ending balance | $ | 2,630 | | $ | 14,866 | | $ | 17,496 | | $ | 2,969 | | $ | 12,983 | | $ | 15,952 | |
| Six Months Ended |
| June 30, 2023 | June 30, 2022 |
| In millions of dollars | Corporate | Consumer | Total | Corporate | Consumer | Total |
| ACLL at beginning of period | $ | 2,855 | | $ | 14,119 | | $ | 16,974 | | $ | 2,415 | | $ | 14,040 | | $ | 16,455 | |
| Adjustments to opening balance: | | | | | |
Adjustment to opening balance(1) | |
Financial instruments—TDRs and vintage disclosures(1) | |
Financial instruments—TDRs and vintage disclosures(1) | |
Financial instruments—TDRs and vintage disclosures(1) | Financial instruments—TDRs and vintage disclosures(1) | — | | (352) | | (352) | | — | | — | | — | |
| | Adjusted ACLL at beginning of period | |
| Adjusted ACLL at beginning of period | |
| Adjusted ACLL at beginning of period | Adjusted ACLL at beginning of period | $ | 2,855 | | $ | 13,767 | | $ | 16,622 | | $ | 2,415 | | $ | 14,040 | | $ | 16,455 | |
| Charge-offs | Charge-offs | $ | (125) | | $ | (3,388) | | $ | (3,513) | | $ | (105) | | $ | (2,347) | | $ | (2,452) | |
| Recoveries | Recoveries | 28 | | 679 | | 707 | | 51 | | 679 | | 730 | |
| Replenishment of NCLs | Replenishment of NCLs | 97 | | 2,709 | | 2,806 | | 54 | | 1,668 | | 1,722 | |
| Net reserve builds (releases) | Net reserve builds (releases) | (209) | | 896 | | 687 | | 249 | | (509) | | (260) | |
| Net specific reserve builds (releases) | Net specific reserve builds (releases) | (28) | | 33 | | 5 | | 273 | | (91) | | 182 | |
| | Other | Other | 12 | | 170 | | 182 | | 32 | | (457) | | (425) | |
| Other | |
| Other | |
| Ending balance | Ending balance | $ | 2,630 | | $ | 14,866 | | $ | 17,496 | | $ | 2,969 | | $ | 12,983 | | $ | 15,952 | |
|
| | June 30, 2023 | December 31, 2022 |
| March 31, 2024 | | | March 31, 2024 | December 31, 2023 |
| In millions of dollars | In millions of dollars | Corporate | Consumer | Total | Corporate | Consumer | Total | In millions of dollars | Corporate | Consumer | Total | Corporate | Consumer | Total |
| ACLL | ACLL | | | | | |
Collectively evaluated(1) | |
Collectively evaluated(1) | |
Collectively evaluated(1) | Collectively evaluated(1) | $ | 2,335 | | $ | 14,827 | | $ | 17,162 | | $ | 2,532 | | $ | 13,521 | | $ | 16,053 | |
| Individually evaluated | Individually evaluated | 295 | | 39 | | 334 | | 323 | | 596 | | 919 | |
| Purchased credit deteriorated | Purchased credit deteriorated | — | | — | | — | | — | | 2 | | 2 | |
| Total ACLL | Total ACLL | $ | 2,630 | | $ | 14,866 | | $ | 17,496 | | $ | 2,855 | | $ | 14,119 | | $ | 16,974 | |
| Loans, net of unearned income | Loans, net of unearned income | | | | | |
Collectively evaluated(1) | Collectively evaluated(1) | $ | 279,231 | | $ | 374,201 | | $ | 653,432 | | $ | 282,909 | | $ | 364,795 | | $ | 647,704 | |
Collectively evaluated(1) | |
Collectively evaluated(1) | |
| Individually evaluated | Individually evaluated | 1,261 | | 39 | | 1,300 | | 1,122 | | 2,921 | | 4,043 | |
| Purchased credit deteriorated | Purchased credit deteriorated | — | | 114 | | 114 | | — | | 114 | | 114 | |
| Held at fair value | Held at fair value | 5,529 | | 237 | | 5,766 | | 5,123 | | 237 | | 5,360 | |
| Total loans, net of unearned income | Total loans, net of unearned income | $ | 286,021 | | $ | 374,591 | | $ | 660,612 | | $ | 289,154 | | $ | 368,067 | | $ | 657,221 | |
(1) See Note 1 in Citi’s First Quarter of 2023 Form 10-Q for a description of the effect of adopting ASU 2022-02 on the ACL and for Citi’s updated accounting policy for collectively evaluating the ACL for consumer loans formerly considered TDRs.
2Q231Q24 Changes in the ACL
The total allowance for credit losses on loans, leases and unfunded lending commitments as of June 30, 2023March 31, 2024 was $19,358$19,925 million, a slightan increase from $19,125$19,873 million at December 31, 2022.2023. The increase in the ACLL was primarily driven by growthmacroeconomic pressures related to the higher inflationary and interest rate environment impacting both card portfolios and changes in macroeconomic assumptions impacting loan spread products, as well as the seasonal mix shift from transactors to revolvers, partially offset by lower card balances in Branded cardsCards and Retail servicesServices and an increasea change in transfer riskACL associated with exposures outside the U.S. driven by safety and soundness considerations under U.S. banking law, partially offset by a decrease in the ACLL of $352 million from the adoption of ASU 2022-02 for the recognition and measurement of TDRs (see Note 1) and an improved macroeconomic outlook.margin lending portfolio.
Consumer ACLL
Citi’s total consumer allowance for credit losses on loans (ACLL) as of June 30, 2023March 31, 2024 was $14,866$15,524 million, an increase from $14,119$15,431 million at December 31, 2022.2023. The increase was primarily driven by growth in U.S. cards balances,macroeconomic pressures related to the higher inflationary and interest rate environment impacting both card portfolios, as well as the seasonal mix shift from transactors to revolvers, partially offset by a decrease to the ACLL of $352 million from the adoption of ASU 2022-02 for the recognition and measurement of TDRs.lower U.S. card volumes.
Corporate ACLL
Citi’s total corporate ACLL as of June 30, 2023March 31, 2024 was $2,630$2,772 million, a decreasean increase from $2,855$2,714 million at December 31, 2022.2023. The decreaseincrease was primarily driven by an improvedchanges in macroeconomic outlook.assumptions impacting loans in spread products, partially offset by changes in portfolio composition in Banking.
ACLUC
As of June 30, 2023,March 31, 2024, Citi’s total ACLUC, included in Other liabilities, was $1,862$1,629 million, a decrease from $2,151$1,728 million at December 31, 2022.2023. The decrease was primarily driven by an improved macroeconomic outlook.a release related to reserves for specific risks and uncertainties impacting vulnerable industries.
Allowance for Credit Losses on HTM Debt Securities
The allowance for credit losses on HTM debt securities, which the Company has the intent and ability to hold, was $106 million and $95 million as of March 31, 2024 and December 31, 2023, respectively.
| | | | | | | | | | | | | | | | | | | | |
| Three Months Ended June 30, 2023 |
| In millions of dollars | Mortgage-backed | | State and municipal | Foreign government | | Asset-
backed | | Total HTM |
Allowance for credit losses on HTM debt securities
at beginning of quarter | $ | 2 | | | $ | 98 | | $ | 3 | | | $ | 1 | | | $ | 104 | |
| Gross credit losses | — | | | — | | — | | | — | | | — | |
| Gross recoveries | — | | | — | | — | | | — | | | — | |
| Net credit losses (NCLs) | $ | — | | | $ | — | | $ | — | | | $ | — | | | $ | — | |
| Replenishment of NCLs | $ | — | | | $ | — | | $ | — | | | $ | — | | | $ | — | |
| Net reserve builds (releases) | 3 | | | (6) | | (1) | | | — | | | (4) | |
| Net specific reserve builds (releases) | — | | | — | | — | | | — | | | — | |
| Total provision for credit losses on HTM debt securities | $ | 3 | | | $ | (6) | | $ | (1) | | | $ | — | | | $ | (4) | |
| Other, net | $ | — | | | $ | — | | $ | — | | | $ | (1) | | | $ | (1) | |
| | | | | | | | |
Allowance for credit losses on HTM debt securities
at end of quarter | $ | 5 | | | $ | 92 | | $ | 2 | | | $ | — | | | $ | 99 | |
| Six Months Ended June 30, 2023 |
| In millions of dollars | Mortgage-backed | | State and municipal | Foreign government | | Asset-
backed | | Total HTM |
Allowance for credit losses on HTM debt securities
at beginning of year | $ | 1 | | | $ | 113 | | $ | 3 | | | $ | 3 | | | $ | 120 | |
| Gross credit losses | — | | | — | | — | | | — | | | — | |
| Gross recoveries | — | | | — | | — | | | — | | | — | |
| Net credit losses (NCLs) | $ | — | | | $ | — | | $ | — | | | $ | — | | | $ | — | |
| Replenishment of NCLs | $ | — | | | $ | — | | $ | — | | | $ | — | | | $ | — | |
| Net reserve builds (releases) | 5 | | | (21) | | (1) | | | (4) | | | (21) | |
| Net specific reserve builds (releases) | — | | | — | | — | | | — | | | — | |
| Total provision for credit losses on HTM debt securities | $ | 5 | | | $ | (21) | | $ | (1) | | | $ | (4) | | | $ | (21) | |
| Other, net | $ | (1) | | | $ | — | | $ | — | | | $ | 1 | | | $ | — | |
| | | | | | | | |
Allowance for credit losses on HTM debt securities
at end of quarter | $ | 5 | | | $ | 92 | | $ | 2 | | | $ | — | | | $ | 99 | |
| | | | | | | | | | | | | | | | | | | | |
| Three Months Ended June 30, 2022 |
| In millions of dollars | Mortgage-backed | | State and municipal | Foreign government | | Asset-
backed | | Total HTM |
Allowance for credit losses on HTM debt securities
at beginning of quarter | $ | 4 | | | $ | 79 | | $ | 2 | | | $ | — | | | $ | 85 | |
| | | | | | | | |
| Gross credit losses | — | | | — | | — | | | — | | | — | |
| Gross recoveries | — | | | — | | — | | | — | | | — | |
| Net credit losses (NCLs) | $ | — | | | $ | — | | $ | — | | | $ | — | | | $ | — | |
| Replenishment of NCLs | $ | — | | | $ | — | | $ | — | | | $ | — | | | $ | — | |
| Net reserve builds (releases) | (2) | | | 14 | | 1 | | | 7 | | | 20 | |
| Net specific reserve builds (releases) | — | | | — | | — | | | — | | | — | |
| Total provision for credit losses on HTM debt securities | $ | (2) | | | $ | 14 | | $ | 1 | | | $ | 7 | | | $ | 20 | |
| | | | | | | | |
| | | | | | | | |
Allowance for credit losses on HTM debt securities
at end of quarter | $ | 2 | | | $ | 93 | | $ | 3 | | | $ | 7 | | | $ | 105 | |
| | | | | | | | |
| Six Months Ended June 30, 2022 |
| In millions of dollars | Mortgage-backed | | State and municipal | Foreign government | | Asset-
backed | | Total HTM |
Allowance for credit losses on HTM debt securities
at beginning of year | $ | 6 | | | $ | 75 | | $ | 4 | | | $ | 2 | | | $ | 87 | |
| | | | | | | | |
| Gross credit losses | — | | | — | | — | | | — | | | — | |
| Gross recoveries | — | | | — | | — | | | — | | | — | |
| Net credit losses (NCLs) | $ | — | | | $ | — | | $ | — | | | $ | — | | | $ | — | |
| Replenishment of NCLs | $ | — | | | $ | — | | $ | — | | | $ | — | | | $ | — | |
| Net reserve builds | (4) | | | 18 | | (1) | | | 5 | | | 18 | |
| Net specific reserve builds (releases) | — | | | — | | — | | | — | | | — | |
| Total provision for credit losses on HTM debt securities | $ | (4) | | | $ | 18 | | $ | (1) | | | $ | 5 | | | $ | 18 | |
| | | | | | | | |
| | | | | | | | |
Allowance for credit losses on HTM debt securities
at end of quarter | $ | 2 | | | $ | 93 | | $ | 3 | | | $ | 7 | | | $ | 105 | |
Allowance for Credit Losses on Other Assets
| | | Three Months Ended June 30, 2023 |
| | Three Months Ended March 31, 2024 | |
| | Three Months Ended March 31, 2024 | |
| | Three Months Ended March 31, 2024 | |
| In millions of dollars | In millions of dollars | | Deposits with banks | Securities borrowed and purchased under agreements
to resell | | All other assets(1) | Total | In millions of dollars | | Deposits with banks | Securities borrowed and purchased under agreements
to resell | | All other assets(1) | Total |
Allowance for credit losses on other assets
at beginning of quarter | Allowance for credit losses on other assets
at beginning of quarter | | $ | 135 | | $ | 30 | | | $ | 363 | | $ | 528 | |
| | Gross credit losses | |
| Gross credit losses | |
| Gross credit losses | Gross credit losses | | — | | — | | | (24) | | (24) | |
| Gross recoveries | Gross recoveries | | — | | — | | | 5 | | 5 | |
| Net credit losses (NCLs) | Net credit losses (NCLs) | | $ | — | | $ | — | | | $ | (19) | | $ | (19) | |
| Replenishment of NCLs | Replenishment of NCLs | | $ | — | | $ | — | | | $ | 19 | | $ | 19 | |
| Net reserve builds (releases) | Net reserve builds (releases) | | (114) | | — | | | 244 | | 130 | |
| Total provision for credit losses | Total provision for credit losses | | $ | (114) | | $ | — | | | $ | 263 | | $ | 149 | |
| Other, net | Other, net | | $ | — | | $ | (4) | | | $ | 5 | | $ | 1 | |
Allowance for credit losses on other assets
at end of quarter | Allowance for credit losses on other assets
at end of quarter | | $ | 21 | | $ | 26 | | | $ | 612 | | $ | 659 | |
| | | Six Months Ended June 30, 2023 |
| In millions of dollars | | Deposits with banks | Securities borrowed and purchased under agreements
to resell | | All other assets(1) | Total |
Allowance for credit losses on other assets
at beginning of year | | $ | 51 | | $ | 36 | | | $ | 36 | | $ | 123 | |
| | Gross credit losses | | — | | — | | | (35) | | (35) | |
| Gross recoveries | | — | | — | | | 5 | | 5 | |
| Net credit losses (NCLs) | | $ | — | | $ | — | | | $ | (30) | | $ | (30) | |
| Replenishment of NCLs | | $ | — | | $ | — | | | $ | 30 | | $ | 30 | |
| Net reserve builds (releases) | | (29) | | (3) | | | 576 | | 544 | |
| Total provision for credit losses | | $ | (29) | | $ | (3) | | | $ | 606 | | $ | 574 | |
| Other, net | | $ | (1) | | $ | (7) | | | $ | — | | $ | (8) | |
Allowance for credit losses on other assets
at end of quarter | | $ | 21 | | $ | 26 | | | $ | 612 | | $ | 659 | |
|
(1)Primarily an increaseACL related to transfer risk associated with exposures outside of the U.S. driven by safety and soundness considerations under U.S. banking law.
| | | Three Months Ended June 30, 2022 |
| | Three Months Ended March 31, 2023 | |
| | Three Months Ended March 31, 2023 | |
| | Three Months Ended March 31, 2023 | |
| In millions of dollars | In millions of dollars | | Deposits with banks | Securities borrowed and purchased under agreements
to resell | Brokerage receivables | All other assets(1) | Total | In millions of dollars | | Deposits with banks | Securities borrowed and purchased under agreements
to resell | | All other assets(1) | Total |
Allowance for credit losses on other assets
at beginning of quarter | Allowance for credit losses on other assets
at beginning of quarter | | $ | 15 | | $ | 4 | | $ | — | | $ | 24 | | $ | 43 | |
| | Gross credit losses | |
| Gross credit losses | |
| Gross credit losses | Gross credit losses | | — | | — | | — | | (8) | | (8) | |
| Gross recoveries | Gross recoveries | | — | | — | | — | | 2 | | 2 | |
| Net credit losses (NCLs) | Net credit losses (NCLs) | | $ | — | | $ | — | | $ | — | | $ | (6) | | $ | (6) | |
| Replenishment of NCLs | Replenishment of NCLs | | $ | — | | $ | — | | $ | — | | $ | 6 | | $ | 6 | |
| Net reserve builds (releases) | Net reserve builds (releases) | | 2 | | (8) | | — | | 7 | | 1 | |
| Total provision for credit losses | Total provision for credit losses | | $ | 2 | | $ | (8) | | $ | — | | $ | 13 | | $ | 7 | |
| Other, net | Other, net | | $ | — | | $ | 31 | | $ | — | | $ | (1) | | $ | 30 | |
Allowance for credit losses on other assets
at end of quarter | Allowance for credit losses on other assets
at end of quarter | | $ | 17 | | $ | 27 | | $ | — | | $ | 30 | | $ | 74 | |
| | | Six Months Ended June 30, 2022 |
| In millions of dollars | | Deposits with banks | Securities borrowed and purchased under agreements
to resell | Brokerage receivables | All other assets(1) | Total |
Allowance for credit losses on other assets
at beginning of year | | $ | 21 | | $ | 6 | | $ | — | | $ | 26 | | $ | 53 | |
| | Gross credit losses | | — | | — | | — | | (15) | | (15) | |
| Gross recoveries | | — | | — | | — | | 2 | | 2 | |
| Net credit losses (NCLs) | | $ | — | | $ | — | | $ | — | | $ | (13) | | $ | (13) | |
| Replenishment of NCLs | | $ | — | | $ | — | | $ | — | | $ | 13 | | $ | 13 | |
| Net reserve builds (releases) | | (4) | | (10) | | — | | 4 | | (10) | |
| Total provision for credit losses | | $ | (4) | | $ | (10) | | $ | — | | $ | 17 | | $ | 3 | |
| Other, net | | $ | — | | $ | 31 | | $ | — | | $ | — | | $ | 31 | |
Allowance for credit losses on other assets
at end of quarter | | $ | 17 | | $ | 27 | | $ | — | | $ | 30 | | $ | 74 | |
|
(1) Primarily accounts receivable.
For ACL on AFS debt securities, see Note 12.13.
15.16. GOODWILL AND INTANGIBLE ASSETS
Goodwill
The changes in Goodwill were as follows:
| | In millions of dollars | In millions of dollars | Institutional Clients Group | Personal Banking and Wealth Management | Legacy Franchises | Total |
| In millions of dollars | |
| In millions of dollars | | Services | Markets(1) | Banking(1) | USPB | Wealth | All Other | | | Total |
| Balance at December 31, 2023 | |
| Foreign currency translation | |
| | Balance at March 31, 2024 | |
| | Balance at March 31, 2024 | |
| | Balance at December 31, 2022 | $ | 8,986 | | $ | 9,741 | | $ | 964 | | $ | 19,691 | |
| | Foreign currency translation | 42 | | 69 | | 80 | | 191 | |
| Balance at March 31, 2023 | $ | 9,028 | | $ | 9,810 | | $ | 1,044 | | $ | 19,882 | |
| | Foreign currency translation | 13 | | 48 | | 55 | | 116 | |
| Balance at June 30, 2023 | $ | 9,041 | | $ | 9,858 | | $ | 1,099 | | $ | 19,998 | |
| Balance at March 31, 2024 | |
| |
(1) In 2023, goodwill of approximately $537 million was transferred from Banking to Markets related to business realignment. Prior-period amounts have been
revised to conform with the current presentation. See Note 3.
Citi tests for goodwill impairment annually as of October 1 (the annual test) and conducts interim assessments between the annual test if an event occurs or circumstances change that would more-likely-than-not reduce the fair value of a reporting unit below its carrying amount. No such events or circumstances were identified as part of the qualitative assessment performed as of June 30, 2023.March 31, 2024. For additional information regarding Citi’s goodwill impairment testing process, see Notes 1 and 1617 to the Consolidated Financial Statements in Citi’s 20222023 Form 10-K.
While the inherent risk related toof uncertainty is embedded in the key assumptions used in the valuations of the reporting units,unit valuations, the economic and business environments continue to evolve as Citi’s management implementsexecutes on its strategic refresh.transformation and strategy. If management’s future estimates of key economic and market assumptions were to differ from its current assumptions, Citi could potentially experience material goodwill impairment charges in the future.
Intangible Assets
The components of intangible assets were as follows:
| | | | June 30, 2023 | December 31, 2022 | | March 31, 2024 | December 31, 2023 |
| In millions of dollars | In millions of dollars | Gross
carrying
amount | Accumulated
amortization | Net
carrying
amount | Gross
carrying
amount | Accumulated
amortization | Net
carrying
amount | In millions of dollars | Gross
carrying
amount | Accumulated
amortization | Net
carrying
amount | Gross
carrying
amount | Accumulated
amortization | Net
carrying
amount |
Purchased credit card relationships(1) | Purchased credit card relationships(1) | $ | 5,302 | | $ | 4,290 | | $ | 1,012 | | $ | 5,513 | | $ | 4,426 | | $ | 1,087 | |
Credit card contract-related intangibles(2) | Credit card contract-related intangibles(2) | 4,193 | | 1,612 | | 2,581 | | 3,903 | | 1,518 | | 2,385 | |
| Other customer relationships | Other customer relationships | 355 | | 271 | | 84 | | 373 | | 283 | | 90 | |
| Present value of future profits | Present value of future profits | 37 | | 36 | | 1 | | 32 | | 31 | | 1 | |
| Indefinite-lived intangible assets | Indefinite-lived intangible assets | 217 | | — | | 217 | | 192 | | — | | 192 | |
| Other | — | | — | | — | | 65 | | 57 | | 8 | |
| | Intangible assets (excluding MSRs) | |
| Intangible assets (excluding MSRs) | |
| Intangible assets (excluding MSRs) | Intangible assets (excluding MSRs) | $ | 10,104 | | $ | 6,209 | | $ | 3,895 | | $ | 10,078 | | $ | 6,315 | | $ | 3,763 | |
Mortgage servicing rights (MSRs)(3) | Mortgage servicing rights (MSRs)(3) | 681 | | — | | 681 | | 665 | | — | | 665 | |
| Total intangible assets | Total intangible assets | $ | 10,785 | | $ | 6,209 | | $ | 4,576 | | $ | 10,743 | | $ | 6,315 | | $ | 4,428 | |
The changes in intangible assets were as follows:
| | In millions of dollars | In millions of dollars | Net carrying amount at December 31, 2022 | Acquisitions/renewals/
divestitures | Amortization | Impairments | FX translation and other | Net carrying amount at June 30, 2023 | In millions of dollars | Net carrying amount at December 31, 2023 | Acquisitions/renewals/
divestitures | Amortization | Impairments | FX translation and other | Net carrying amount at March 31, 2024 |
Purchased credit card relationships(1) | Purchased credit card relationships(1) | $ | 1,087 | | $ | — | | $ | (75) | | $ | — | | $ | — | | $ | 1,012 | |
Credit card contract-related intangibles(2) | Credit card contract-related intangibles(2) | 2,385 | | 290 | | (94) | | — | | — | | 2,581 | |
| Other customer relationships | Other customer relationships | 90 | | 11 | | (12) | | — | | (5) | | 84 | |
| Present value of future profits | Present value of future profits | 1 | | — | | — | | — | | — | | 1 | |
| Indefinite-lived intangible assets | Indefinite-lived intangible assets | 192 | | — | | — | | — | | 25 | | 217 | |
| Other | 8 | | — | | (8) | | — | | — | | — | |
| | Intangible assets (excluding MSRs) | |
| Intangible assets (excluding MSRs) | |
| Intangible assets (excluding MSRs) | Intangible assets (excluding MSRs) | $ | 3,763 | | $ | 301 | | $ | (189) | | $ | — | | $ | 20 | | $ | 3,895 | |
Mortgage servicing rights (MSRs)(3) | Mortgage servicing rights (MSRs)(3) | 665 | | | 681 | |
| Total intangible assets | Total intangible assets | $ | 4,428 | | | $ | 4,576 | |
(1)Reflects intangibles for the value of purchased cardholder relationships, which are discrete from contract-related intangibles.
(2)Reflects contract-related intangibles associated with the extension or renewal of existing credit card program agreements with card partners. For the credit card program agreement extended during 2023, the remaining term is over 10 years.
(3)See Note 20 for additional information on Citi’s MSRs, including the rollforward for the three months ended June 30, 2023.21.
16.17. DEPOSITS
Deposits consisted of the following:
| | June 30, | December 31, |
| March 31, | | | March 31, | December 31, |
| In millions of dollars | In millions of dollars | 2023(1) | 2022 | In millions of dollars | 2024(1) | 2023 |
| Non-interest-bearing deposits in U.S. offices | Non-interest-bearing deposits in U.S. offices | $ | 109,844 | | $ | 122,655 | |
| Interest-bearing deposits in U.S. offices (including $998 and $903 as of June 30, 2023 and December 31, 2022, respectively, at fair value) | 590,700 | | 607,470 | |
| Interest-bearing deposits in U.S. offices (including $1,243 and $1,309 as of March 31, 2024 and December 31, 2023, respectively, at fair value) | |
Total deposits in U.S. offices(1) | |
| Non-interest-bearing deposits in offices outside the U.S. | Non-interest-bearing deposits in offices outside the U.S. | 91,899 | | 95,182 | |
| Interest-bearing deposits in offices outside the U.S. (including $1,600 and $972 as of June 30, 2023 and December 31, 2022, respectively, at fair value) | 527,424 | | 540,647 | |
| Interest-bearing deposits in offices outside the U.S. (including $1,662 and $1,131 as of March 31, 2024 and December 31, 2023, respectively, at fair value) | |
Total deposits in offices outside the U.S.(1) | |
| Total deposits | Total deposits | $ | 1,319,867 | | $ | 1,365,954 | |
(1) For information on time deposits that met or exceeded the insured limit at December 31, 2022,2023, see Note 1718 to the Consolidated Financial Statements in Citi’s 20222023 Form 10-K.
For additional information on Citi’s deposits, see Citi’s 20222023 Form 10-K.
17.18. DEBT
For additional information regarding Citi’s short-term borrowings and long-term debt, see Note 1819 to the Consolidated Financial Statements in Citi’s 20222023 Form 10-K.
Short-Term Borrowings
| | In millions of dollars | In millions of dollars | June 30,
2023 | December 31,
2022 | In millions of dollars | March 31,
2024 | December 31,
2023 |
| Commercial paper | Commercial paper | |
Bank(1) | |
Bank(1) | |
Bank(1) | Bank(1) | $ | 11,108 | | $ | 11,185 | |
Broker-dealer and other(2) | Broker-dealer and other(2) | 9,814 | | 14,345 | |
| Total commercial paper | Total commercial paper | $ | 20,922 | | $ | 25,530 | |
Other borrowings(3) | Other borrowings(3) | 19,508 | | 21,566 | |
| Total | Total | $ | 40,430 | | $ | 47,096 | |
(1)Represents Citibank entities as well as other bank entities.
(2)Represents broker-dealer and other non-bank subsidiaries that are consolidated into Citigroup Inc., the parent holding company.
(3)Includes borrowings from Federal Home Loan Banks and other market participants. At June 30, 2023March 31, 2024 and December 31, 2022,2023, collateralized short-term advances from Federal Home Loan Banks were $10.0$4.0 billion and $12.0$8.0 billion, respectively.
Long-Term Debt
| | In millions of dollars | In millions of dollars | June 30,
2023 | December 31, 2022 | In millions of dollars | March 31,
2024 | December 31, 2023 |
Citigroup Inc.(1) | Citigroup Inc.(1) | $ | 163,043 | | $ | 166,257 | |
Bank(2) | Bank(2) | 19,101 | | 21,113 | |
Broker-dealer and other(3) | Broker-dealer and other(3) | 92,366 | | 84,236 | |
| Total | Total | $ | 274,510 | | $ | 271,606 | |
(1)Represents the parent holding company.
(2)Represents Citibank entities as well as other bank entities. At June 30, 2023March 31, 2024 and December 31, 2022,2023, collateralized long-term advances from the Federal Home Loan Banks were $7.5$11.5 billion and $7.3$11.5 billion, respectively.
(3)Represents broker-dealer and other non-bank subsidiaries that are consolidated into Citigroup Inc., the parent holding company. Certain Citigroup consolidated hedging activities are also included in this line.
Long-term debt outstanding includes trust preferred securities with a balance sheet carrying value of $1.6 billion at June 30, 2023March 31, 2024 and December 31, 2022.2023.
The following table summarizes Citi’s outstanding trust preferred securities at June 30, 2023:March 31, 2024:
| | | | | Junior subordinated debentures owned by trust | | | Junior subordinated debentures owned by trust |
| Trust | Trust | Issuance
date | Securities
issued | Liquidation value(1) | Coupon rate(2) | Common
shares
issued
to parent | Notional amount | Maturity | Redeemable
by issuer
beginning | Trust | Issuance
date | Securities
issued | Liquidation value(1) | Coupon rate(2) | Common
shares
issued
to parent | Notional amount | Maturity | Redeemable
by issuer
beginning |
| In millions of dollars, except securities and share amounts | In millions of dollars, except securities and share amounts | |
| Citigroup Capital III | Citigroup Capital III | Dec. 1996 | 194,053 | | $ | 194 | | 7.625 | % | 6,003 | | $ | 200 | | Dec. 1, 2036 | Not redeemable |
| Citigroup Capital III | |
| Citigroup Capital III | | Dec. 1996 | 194,053 | | $ | 194 | | 7.625 | % | 6,003 | | $ | 200 | | Dec. 1, 2036 | Not redeemable |
| Citigroup Capital XIII | Citigroup Capital XIII | Oct. 2010 | 89,840,000 | | 2,246 | | 3 mo. LIBOR(3) + 637 bps | 1,000 | | 2,246 | | Oct. 30, 2040 | Oct. 30, 2015 | Citigroup Capital XIII | Oct. 2010 | 89,840,000 | | 2,246 | 2,246 | | 3 mo. SOFR +663.161 bps(3) | 3 mo. SOFR +663.161 bps(3) | 1,000 | | 2,246 | 2,246 | | Oct. 30, 2040 | Oct. 30, 2040 | Oct. 30, 2015 |
| | Total obligated | Total obligated | | $ | 2,440 | | | | $ | 2,446 | | | Total obligated | | $ | 2,440 | | | | | $ | 2,446 | | | |
Note: Distributions on the trust preferred securities and interest on the subordinated debentures are payable semiannually for Citigroup Capital III and quarterly for Citigroup Capital XIII.
(1)Represents the notional value received by outside investors from the trusts at the time of issuance. This differs from Citi’s balance sheet carrying value due primarily to unamortized discount and issuance costs.
(2)In each case, the coupon rate on the subordinated debentures is the same as that on the trust preferred securities.
(3)The coupon rate will transition to 3-month term SOFR +26.161spread incorporates the original contractual spread and a 26.161 bps +637 bps at the start of the next distribution period.tenor spread adjustment.
18.19. CHANGES IN ACCUMULATED OTHER COMPREHENSIVE INCOME (LOSS) (AOCI)
Changes in each component of Citigroup’s Accumulated other comprehensive income (loss) were as follows:
| | | | | | | | | | | | | | | | | | | | | | | | | | |
| In millions of dollars | Net
unrealized
gains (losses)
on debt securities | Debt valuation adjustment (DVA)(1) | Cash flow hedges(2) | Benefit plans(3) | CTA, net of hedges(4) | Excluded component of fair value hedges | Long-duration insurance contracts(5) | Accumulated
other
comprehensive income (loss) |
Three Months Ended
June 30, 2023 | | | | | | | | |
| Balance, March 31, 2023 | $ | (5,162) | | $ | 517 | | $ | (2,161) | | $ | (5,859) | | $ | (32,796) | | $ | (12) | | $ | 32 | | $ | (45,441) | |
| | | | | | | | |
| | | | | | | | |
| | | | | | | | |
| Other comprehensive income before reclassifications | 133 | | (613) | | (206) | | (170) | | 23 | | 27 | | (6) | | (812) | |
Increase (decrease) due to amounts reclassified from AOCI | (7) | | (6) | | 377 | | 34 | | — | | (10) | | — | | 388 | |
Change, net of taxes | $ | 126 | | $ | (619) | | $ | 171 | | $ | (136) | | $ | 23 | | $ | 17 | | $ | (6) | | $ | (424) | |
| Balance at June 30, 2023 | $ | (5,036) | | $ | (102) | | $ | (1,990) | | $ | (5,995) | | $ | (32,773) | | $ | 5 | | $ | 26 | | $ | (45,865) | |
| Six Months Ended June 30, 2023 | | | | | | | | |
| Balance, December 31, 2022 | $ | (5,998) | | $ | 842 | | $ | (2,522) | | $ | (5,755) | | $ | (33,637) | | $ | 8 | | $ | — | | $ | (47,062) | |
Adjustment to opening balance, net of taxes(6) | — | | — | | — | | — | | — | | — | | 27 | | 27 | |
| Adjusted balance, beginning of period | $ | (5,998) | | $ | 842 | | $ | (2,522) | | $ | (5,755) | | $ | (33,637) | | $ | 8 | | $ | 27 | | $ | (47,035) | |
| | | | | | | | |
| Other comprehensive income before reclassifications | 988 | | (940) | | (200) | | (302) | | 864 | | 11 | | (1) | | 420 | |
Increase (decrease) due to amounts reclassified from AOCI | (26) | | (4) | | 732 | | 62 | | — | | (14) | | — | | 750 | |
| Change, net of taxes | $ | 962 | | $ | (944) | | $ | 532 | | $ | (240) | | $ | 864 | | $ | (3) | | $ | (1) | | $ | 1,170 | |
| Balance at June 30, 2023 | $ | (5,036) | | $ | (102) | | $ | (1,990) | | $ | (5,995) | | $ | (32,773) | | $ | 5 | | $ | 26 | | $ | (45,865) | |
| | | | | | | | | | | | | | | | | | | | | | | | | | |
| In millions of dollars | Net
unrealized
gains (losses)
on debt securities | Debt valuation adjustment (DVA)(1) | Cash flow hedges(2) | Benefit plans(3) | CTA, net of hedges(4) | Excluded component of fair value hedges | Long-duration insurance contracts(5) | Accumulated
other
comprehensive income (loss) |
Three Months Ended
March 31, 2024 | | | | | | | | |
| Balance, December 31, 2023 | $ | (3,744) | | $ | (709) | | $ | (1,406) | | $ | (6,050) | | $ | (32,885) | | $ | (40) | | $ | 34 | | $ | (44,800) | |
| | | | | | | | |
| | | | | | | | |
| | | | | | | | |
| Other comprehensive income before reclassifications | 176 | | (573) | | 232 | | 30 | | (1,054) | | 8 | | 21 | | (1,160) | |
Increase (decrease) due to amounts reclassified from AOCI | (76) | | 10 | | 260 | | 47 | | — | | (10) | | — | | 231 | |
Change, net of taxes | $ | 100 | | $ | (563) | | $ | 492 | | $ | 77 | | $ | (1,054) | | $ | (2) | | $ | 21 | | $ | (929) | |
| Balance at March 31, 2024 | $ | (3,644) | | $ | (1,272) | | $ | (914) | | $ | (5,973) | | $ | (33,939) | | $ | (42) | | $ | 55 | | $ | (45,729) | |
| | | | | | | | |
| | | | | | | | |
| | | | | | | | |
| | | | | | | | |
| | | | | | | | |
| | | | | | | | |
| | | | | | | | |
| | | | | | | | |
| | | | | | | | |
| | In millions of dollars | In millions of dollars | Net
unrealized
gains (losses)
on debt securities | Debt valuation adjustment (DVA)(1) | Cash flow hedges(2) | Benefit plans(3) | CTA, net of hedges(4) | Excluded component of fair value hedges | Long-duration insurance contracts | Accumulated
other
comprehensive income (loss) | In millions of dollars | Net
unrealized
gains (losses)
on debt securities | Debt valuation adjustment (DVA)(1) | Cash flow hedges(2) | Benefit plans(3) | CTA, net of hedges(4) | Excluded component of fair value hedges | Long-duration insurance contracts(5) | Accumulated
other
comprehensive income (loss) |
| Three Months Ended June 30, 2022 | | |
| Balance, March 31, 2022 | $ | (4,891) | | $ | (394) | | $ | (1,440) | | $ | (5,681) | | $ | (31,180) | | $ | 1 | | $ | — | | $ | (43,585) | |
Three Months Ended
March 31, 2023 | |
| Balance, December 31, 2022 | |
| Balance, December 31, 2022 | |
| Balance, December 31, 2022 | |
Adjustment to opening balance, net of taxes(6) | |
| Adjusted balance, beginning of period | |
| | Other comprehensive income before reclassifications | |
| Other comprehensive income before reclassifications | |
| Other comprehensive income before reclassifications | |
Increase (decrease) due to amounts reclassified from AOCI | |
Change, net of taxes | |
| Balance at March 31, 2023 | |
| | Other comprehensive income before reclassifications | (1,612) | | 1,968 | | (515) | | (271) | | (1,975) | | 4 | | — | | (2,401) | |
Increase (decrease) due to amounts reclassified from AOCI | 111 | | (1) | | (151) | | 182 | | 345 | | 5 | | — | | 491 | |
Change, net of taxes | $ | (1,501) | | $ | 1,967 | | $ | (666) | | $ | (89) | | $ | (1,630) | | $ | 9 | | $ | — | | $ | (1,910) | |
| Balance at June 30, 2022 | $ | (6,392) | | $ | 1,573 | | $ | (2,106) | | $ | (5,770) | | $ | (32,810) | | $ | 10 | | $ | — | | $ | (45,495) | |
| Six Months Ended June 30, 2022 | | |
| Balance, December 31, 2021 | $ | (614) | | $ | (1,187) | | $ | 101 | | $ | (5,852) | | $ | (31,166) | | $ | (47) | | $ | — | | $ | (38,765) | |
| | Other comprehensive income before reclassifications | (5,895) | | 2,761 | | (1,839) | | 21 | | (1,989) | | 50 | | — | | (6,891) | |
Increase (decrease) due to amounts reclassified from AOCI | 117 | | (1) | | (368) | | 61 | | 345 | | 7 | | — | | 161 | |
| Change, net of taxes | $ | (5,778) | | $ | 2,760 | | $ | (2,207) | | $ | 82 | | $ | (1,644) | | $ | 57 | | $ | — | | $ | (6,730) | |
| Balance at June 30, 2022 | $ | (6,392) | | $ | 1,573 | | $ | (2,106) | | $ | (5,770) | | $ | (32,810) | | $ | 10 | | $ | — | | $ | (45,495) | |
|
(1)Reflects the after-tax valuation of Citi’s fair value option liabilities. See “Market Valuation Adjustments” in Note 22.23.
(2)Primarily driven by Citi’s pay floating/receive fixed interest rate swap programs that hedge certain floating rates on assets.
(3)Primarily reflects adjustments based on the quarterly actuarial valuations of the Company’s significant pension and postretirement plans, annual actuarial valuations of all other plans and amortization of amounts previously recognized in other comprehensive income.
(4)Primarily reflects the movements in (by order of impact) the MexicanEgyptian pound, Chilean peso, Brazilian real, Russian rubleEuro and Japanese yen against the U.S. dollar and changes in related tax effects and hedges for the three months ended June 30, 2023.March 31, 2024. Primarily reflects the movements in (by order of impact) the Mexican peso, Brazilian real, Polish zloty, Chilean peso, Euro, Russian ruble, Japanese yen and South Korean won against the U.S. dollar and changes in related tax effects and hedges for the six months ended June 30, 2023. Primarily reflects the movements in (by order of impact) the South Korean won, Euro, Chilean peso, Mexican peso, Japanese yen and Brazilian realRussian ruble against the U.S. dollar and changes in related tax effects and hedges for the three months ended June 30, 2022. Primarily reflects the movements in (by order of impact) the South Korean won, Euro, Japanese yen, Indian rupee, British pound sterling and Chilean peso against the U.S. dollar and changes in related tax effects and hedges for the six months ended June 30, 2022.March 31, 2023. Amounts recorded in the CTA component of AOCI remain in AOCI until the sale or substantial liquidation of the foreign entity, at which point such amounts related to the foreign entity are reclassified into earnings.
(5)Reflects the change in the liability for future policyholder benefits for certain long-duration life-contingent annuity contracts that are issued by a regulated Citi insurance subsidiary in Mexico and reported within Legacy Franchises.Franchises. The amount reflects the change in the liability after discounting using an upper-medium gradeupper-medium-grade fixed income instrument yield that reflects the duration characteristics of the liability. As of June 30, 2023, theThe balance of the liability for future policyholder benefits, which is recorded within Other Liabilities, for this insurance subsidiary was approximately $560 million.$546 million and $525 million at March 31, 2024 and March 31, 2023, respectively.
(6)See Note 1.
The pretax and after-tax changes in each component of Accumulated other comprehensive income (loss) were as follows:
| | In millions of dollars | In millions of dollars | Pretax | Tax effect(1) | After-tax | In millions of dollars | Pretax | Tax effect(1) | After-tax |
| Three Months Ended June 30, 2023 | | |
| Balance, March 31, 2023 | $ | (53,443) | | $ | 8,002 | | $ | (45,441) | |
| Three Months Ended March 31, 2024 | |
| Balance, December 31, 2023 | |
| Balance, December 31, 2023 | |
| Balance, December 31, 2023 | |
| | | Change in net unrealized gains (losses) on debt securities | |
| | Change in net unrealized gains (losses) on debt securities | |
| | Change in net unrealized gains (losses) on debt securities | Change in net unrealized gains (losses) on debt securities | 210 | | (84) | | 126 | |
| Debt valuation adjustment (DVA) | Debt valuation adjustment (DVA) | (837) | | 218 | | (619) | |
| Cash flow hedges | Cash flow hedges | 233 | | (62) | | 171 | |
| Benefit plans | Benefit plans | (156) | | 20 | | (136) | |
| Foreign currency translation adjustment (CTA) | Foreign currency translation adjustment (CTA) | 15 | | 8 | | 23 | |
| Excluded component of fair value hedges | Excluded component of fair value hedges | 22 | | (5) | | 17 | |
| Long-duration insurance contracts | Long-duration insurance contracts | (8) | | 2 | | (6) | |
| Change | Change | $ | (521) | | $ | 97 | | $ | (424) | |
| Balance at June 30, 2023 | $ | (53,964) | | $ | 8,099 | | $ | (45,865) | |
| Six Months Ended June 30, 2023 | | |
| Balance, December 31, 2022 | $ | (55,253) | | $ | 8,191 | | $ | (47,062) | |
Adjustment to opening balance(2) | 39 | | (12) | | 27 | |
| Adjusted balance, beginning of period | $ | (55,214) | | $ | 8,179 | | $ | (47,035) | |
| Change in net unrealized gains (losses) on debt securities | 1,323 | | (361) | | 962 | |
| DVA | (1,270) | | 326 | | (944) | |
| Cash flow hedges | 712 | | (180) | | 532 | |
| Benefit plans | (312) | | 72 | | (240) | |
| CTA | 803 | | 61 | | 864 | |
| Excluded component of fair value hedges | (4) | | 1 | | (3) | |
| Long-duration insurance contracts | (2) | | 1 | | (1) | |
| Change | $ | 1,250 | | $ | (80) | | $ | 1,170 | |
| Balance at June 30, 2023 | $ | (53,964) | | $ | 8,099 | | $ | (45,865) | |
| Balance at March 31, 2024 | |
|
| | In millions of dollars | In millions of dollars | Pretax | Tax effect(1) | After-tax | In millions of dollars | Pretax | Tax effect(1) | After-tax |
| Three Months Ended June 30, 2022 | | |
| Balance, March 31, 2022 | $ | (51,807) | | $ | 8,222 | | $ | (43,585) | |
| | Three Months Ended March 31, 2023 | |
| Balance, December 31, 2022 | |
| Balance, December 31, 2022 | |
| Balance, December 31, 2022 | |
Adjustment to opening balance(2) | |
| Adjusted balance, beginning of period | |
| Change in net unrealized gains (losses) on debt securities | Change in net unrealized gains (losses) on debt securities | (1,990) | | 489 | | (1,501) | |
| DVA | DVA | 2,592 | | (625) | | 1,967 | |
| Cash flow hedges | Cash flow hedges | (886) | | 220 | | (666) | |
| Benefit plans | Benefit plans | (73) | | (16) | | (89) | |
| CTA | CTA | (1,414) | | (216) | | (1,630) | |
| Excluded component of fair value hedges | Excluded component of fair value hedges | 12 | | (3) | | 9 | |
| Long-duration insurance contracts | Long-duration insurance contracts | — | | — | | — | |
| Change | Change | $ | (1,759) | | $ | (151) | | $ | (1,910) | |
| Balance, June 30, 2022 | $ | (53,566) | | $ | 8,071 | | $ | (45,495) | |
| Six Months Ended June 30, 2022 | | |
| Balance, December 31, 2021 | $ | (45,383) | | $ | 6,618 | | $ | (38,765) | |
| Balance, March 31, 2023 | |
| | Change in net unrealized gains (losses) on debt securities | (7,614) | | 1,836 | | (5,778) | |
| DVA | 3,642 | | (882) | | 2,760 | |
| Cash flow hedges | (2,908) | | 701 | | (2,207) | |
| Benefit plans | 104 | | (22) | | 82 | |
| CTA | (1,483) | | (161) | | (1,644) | |
| Excluded component of fair value hedges | 76 | | (19) | | 57 | |
| Long-duration insurance contracts | — | | — | | — | |
| Change | $ | (8,183) | | $ | 1,453 | | $ | (6,730) | |
| Balance, June 30, 2022 | $ | (53,566) | | $ | 8,071 | | $ | (45,495) | |
|
(1) Income tax effects of these items are released from AOCI contemporaneously with the related gross pretax amount.
(2) See Note 1.
The Company recognized pretax (gains) losses related to amounts in AOCI reclassified to the Consolidated Statement of Income as follows:
| | Increase (decrease) in AOCI due to
amounts reclassified to
Consolidated Statement of Income |
| Three Months Ended June 30, | Six Months Ended June 30, |
| Increase (decrease) in AOCI due to amounts reclassified to
Consolidated Statement of Income | |
| Increase (decrease) in AOCI due to amounts reclassified to
Consolidated Statement of Income | |
| Increase (decrease) in AOCI due to amounts reclassified to
Consolidated Statement of Income | |
| Three Months Ended March 31, | |
| Three Months Ended March 31, | |
| Three Months Ended March 31, | |
| In millions of dollars | |
| In millions of dollars | |
| In millions of dollars | In millions of dollars | 2023 | 2022 | 2023 | 2022 |
| Realized (gains) losses on sales of investments | Realized (gains) losses on sales of investments | $ | (49) | | $ | 58 | | $ | (121) | | $ | (22) | |
| Realized (gains) losses on sales of investments | |
| Realized (gains) losses on sales of investments | |
| Gross impairment losses | |
| Gross impairment losses | |
| Gross impairment losses | Gross impairment losses | 43 | | 90 | | 94 | | 180 | |
| Subtotal, pretax | Subtotal, pretax | $ | (6) | | $ | 148 | | $ | (27) | | $ | 158 | |
| Subtotal, pretax | |
| Subtotal, pretax | |
| Tax effect | |
| Tax effect | |
| Tax effect | Tax effect | (1) | | (37) | | 1 | | (41) | |
Net realized (gains) losses on investments, after-tax(1) | Net realized (gains) losses on investments, after-tax(1) | $ | (7) | | $ | 111 | | $ | (26) | | $ | 117 | |
Net realized (gains) losses on investments, after-tax(1) | |
Net realized (gains) losses on investments, after-tax(1) | |
| Realized DVA (gains) losses on fair value option liabilities, pretax | |
| Realized DVA (gains) losses on fair value option liabilities, pretax | |
| Realized DVA (gains) losses on fair value option liabilities, pretax | Realized DVA (gains) losses on fair value option liabilities, pretax | $ | (7) | | $ | (1) | | $ | (4) | | $ | (1) | |
| Tax effect | Tax effect | 1 | | — | | — | | — | |
| Tax effect | |
| Tax effect | |
| Net realized DVA, after-tax | |
| Net realized DVA, after-tax | |
| Net realized DVA, after-tax | Net realized DVA, after-tax | $ | (6) | | $ | (1) | | $ | (4) | | $ | (1) | |
| Interest rate contracts | Interest rate contracts | $ | 495 | | $ | (199) | | $ | 964 | | $ | (485) | |
| Interest rate contracts | |
| Interest rate contracts | |
| Foreign exchange contracts | |
| Foreign exchange contracts | |
| Foreign exchange contracts | Foreign exchange contracts | 1 | | 1 | | 2 | | 2 | |
| Subtotal, pretax | Subtotal, pretax | $ | 496 | | $ | (198) | | $ | 966 | | $ | (483) | |
| Subtotal, pretax | |
| Subtotal, pretax | |
| Tax effect | |
| Tax effect | |
| Tax effect | Tax effect | (119) | | 47 | | (234) | | 115 | |
Amortization of cash flow hedges, after-tax(2) | Amortization of cash flow hedges, after-tax(2) | $ | 377 | | $ | (151) | | $ | 732 | | $ | (368) | |
Amortization of cash flow hedges, after-tax(2) | |
Amortization of cash flow hedges, after-tax(2) | |
| Amortization of unrecognized: | |
| Amortization of unrecognized: | |
| Amortization of unrecognized: | Amortization of unrecognized: | | | |
| Prior service cost (benefit) | Prior service cost (benefit) | $ | (5) | | $ | (5) | | $ | (11) | | $ | (11) | |
| Prior service cost (benefit) | |
| Prior service cost (benefit) | |
| Net actuarial loss | |
| Net actuarial loss | |
| Net actuarial loss | Net actuarial loss | 51 | | 58 | | 100 | | 128 | |
| Curtailment/settlement impact(3) | Curtailment/settlement impact(3) | 1 | | 183 | | (4) | | (33) | |
| Curtailment/settlement impact(3) | |
| Curtailment/settlement impact(3) | |
| Subtotal, pretax | |
| Subtotal, pretax | |
| Subtotal, pretax | Subtotal, pretax | $ | 47 | | $ | 236 | | $ | 85 | | $ | 84 | |
| Tax effect | Tax effect | (13) | | (54) | | (23) | | (23) | |
| Tax effect | |
| Tax effect | |
Amortization of benefit plans, after-tax(3) | |
Amortization of benefit plans, after-tax(3) | |
Amortization of benefit plans, after-tax(3) | Amortization of benefit plans, after-tax(3) | $ | 34 | | $ | 182 | | $ | 62 | | $ | 61 | |
| Excluded component of fair value hedges, pretax | Excluded component of fair value hedges, pretax | $ | (13) | | $ | 7 | | $ | (19) | | $ | 10 | |
| Excluded component of fair value hedges, pretax | |
| Excluded component of fair value hedges, pretax | |
| Tax effect | |
| Tax effect | |
| Tax effect | Tax effect | 3 | | (2) | | 5 | | (3) | |
| Excluded component of fair value hedges, after-tax | Excluded component of fair value hedges, after-tax | $ | (10) | | $ | 5 | | $ | (14) | | $ | 7 | |
| Long-duration insurance contracts, pretax | $ | — | | $ | — | | $ | — | | $ | — | |
| Excluded component of fair value hedges, after-tax | |
| Excluded component of fair value hedges, after-tax | |
| Long-duration contracts, pretax | |
| Long-duration contracts, pretax | |
| Long-duration contracts, pretax | |
| Tax effect | Tax effect | — | | — | | — | | — | |
| Long-duration insurance contracts, after-tax | $ | — | | $ | — | | $ | — | | $ | — | |
| Tax effect | |
| Tax effect | |
| Long-duration contracts, after-tax | |
| Long-duration contracts, after-tax | |
| Long-duration contracts, after-tax | |
| CTA, pretax | |
| CTA, pretax | |
| CTA, pretax | CTA, pretax | $ | — | | $ | 397 | | $ | — | | $ | 397 | |
| Tax effect | Tax effect | — | | (52) | | — | | (52) | |
CTA, after-tax(4) | $ | — | | $ | 345 | | $ | — | | $ | 345 | |
| Tax effect | |
| Tax effect | |
| CTA, after-tax | |
| CTA, after-tax | |
| CTA, after-tax | |
Total amounts reclassified out of AOCI, pretax | |
Total amounts reclassified out of AOCI, pretax | |
Total amounts reclassified out of AOCI, pretax | Total amounts reclassified out of AOCI, pretax | $ | 517 | | $ | 589 | | $ | 1,001 | | $ | 165 | |
| Total tax effect | Total tax effect | (129) | | (98) | | (251) | | (4) | |
| Total tax effect | |
| Total tax effect | |
Total amounts reclassified out of AOCI, after-tax | Total amounts reclassified out of AOCI, after-tax | $ | 388 | | $ | 491 | | $ | 750 | | $ | 161 | |
Total amounts reclassified out of AOCI, after-tax | |
Total amounts reclassified out of AOCI, after-tax | |
(1)The pretax amount is reclassified to Realized gains (losses) on sales of investments, net and Gross impairment losses in the Consolidated Statement of Income. See Note 12 for additional details.13.
(2)See Note 21 for additional details.22.
(3)See Note 8 for additional details.8.
(4)The pretax amount is reclassified to Discontinued operations and Other revenue in the Consolidated Statement of Income, and results from the substantial liquidation of a legacy U.K. consumer operation. See Note 2 for additional details.
19.20. PREFERRED STOCK
The following table summarizes the Company’s preferred stock outstanding:
| | | | | | | | | | | | | | | | | | | | | | | |
| | | | | Redemption
price per depositary
share/preference share | | Carrying value (in millions of dollars) |
| | Issuance date | Redeemable by issuer beginning | Dividend
rate | Number
of depositary
shares | June 30,
2023 | December 31,
2022 |
Series A(1) | October 29, 2012 | January 30, 2023 | 3-month LIBOR+ 4.068% | $ | 1,000 | | 1,500,000 | | $ | 1,500 | | $ | 1,500 | |
Series B(2) | December 13, 2012 | February 15, 2023 | 3-month LIBOR+ 4.230% | 1,000 | | 750,000 | | 750 | | 750 | |
Series D(3) | April 30, 2013 | May 15, 2023 | 3-month LIBOR+ 3.466% | 1,000 | | 1,250,000 | | 1,250 | | 1,250 | |
Series J(4) | September 19, 2013 | September 30, 2023 | 7.125 | | 25 | | 38,000,000 | | 950 | | 950 | |
Series K(5) | October 31, 2013 | November 15, 2023 | 6.875 | | 25 | | 59,800,000 | | 1,495 | | 1,495 | |
Series M(6) | April 30, 2014 | May 15, 2024 | 6.300 | | 1,000 | | 1,750,000 | | 1,750 | | 1,750 | |
Series P(7) | April 24, 2015 | May 15, 2025 | 5.950 | | 1,000 | | 2,000,000 | | 2,000 | | 2,000 | |
Series T(8) | April 25, 2016 | August 15, 2026 | 6.250 | | 1,000 | | 1,500,000 | | 1,500 | | 1,500 | |
Series U(9) | September 12, 2019 | September 12, 2024 | 5.000 | | 1,000 | | 1,500,000 | | 1,500 | | 1,500 | |
Series V(10) | January 23, 2020 | January 30, 2025 | 4.700 | | 1,000 | | 1,500,000 | | 1,500 | | 1,500 | |
Series W(11) | December 10, 2020 | December 10, 2025 | 4.000 | | 1,000 | | 1,500,000 | | 1,500 | | 1,500 | |
Series X(12) | February 18, 2021 | February 18, 2026 | 3.875 | | 1,000 | | 2,300,000 | | 2,300 | | 2,300 | |
Series Y(13) | October 27, 2021 | November 15, 2026 | 4.150 | | 1,000 | | 1,000,000 | | 1,000 | | 1,000 | |
Series Z(14) | March 7, 2023 | May 15, 2028 | 7.375 | | 1,000 | | 1,250,000 | | 1,250 | | — | |
| | | | | | $ | 20,245 | | $ | 18,995 | |
| | | | | | | | | | | | | | | | | | | | | | | |
| | | | Dividend rate as of March 31, 2024 | Redemption
price per depositary share/preference share | | Carrying value (in millions of dollars) |
| | Issuance date | Redeemable by issuer beginning | Number
of depositary
shares | March 31,
2024 | December 31,
2023 |
Series D(1) | April 30, 2013 | May 15, 2023 | 3-mo. SOFR+ 3.72761 | $ | 1,000 | | 1,250,000 | | $ | 1,250 | | $ | 1,250 | |
Series J(2) | September 19, 2013 | September 30, 2023 | N/A | 25 | | 22,000,000 | | — | | 550 | |
Series M(3) | April 30, 2014 | May 15, 2024 | 6.300 | % | 1,000 | | 1,750,000 | | 1,750 | | 1,750 | |
Series P(4) | April 24, 2015 | May 15, 2025 | 5.950 | | 1,000 | | 2,000,000 | | 2,000 | | 2,000 | |
Series T(5) | April 25, 2016 | August 15, 2026 | 6.250 | | 1,000 | | 1,500,000 | | 1,500 | | 1,500 | |
Series U(6) | September 12, 2019 | September 12, 2024 | 5.000 | | 1,000 | | 1,500,000 | | 1,500 | | 1,500 | |
Series V(7) | January 23, 2020 | January 30, 2025 | 4.700 | | 1,000 | | 1,500,000 | | 1,500 | | 1,500 | |
Series W(8) | December 10, 2020 | December 10, 2025 | 4.000 | | 1,000 | | 1,500,000 | | 1,500 | | 1,500 | |
Series X(9) | February 18, 2021 | February 18, 2026 | 3.875 | | 1,000 | | 2,300,000 | | 2,300 | | 2,300 | |
Series Y(10) | October 27, 2021 | November 15, 2026 | 4.150 | | 1,000 | | 1,000,000 | | 1,000 | | 1,000 | |
Series Z(11) | March 7, 2023 | May 15, 2028 | 7.375 | | 1,000 | | 1,250,000 | | 1,250 | | 1,250 | |
Series AA(12) | September 21, 2023 | November 15, 2028 | 7.625 | | 1,000 | | 1,500,000 | | 1,500 | | 1,500 | |
Series BB(13) | March 6, 2024 | May 15, 2029 | 7.200 | | 1,000 | | 550,000 | | 550 | | — | |
| | | | | | $ | 17,600 | | $ | 17,600 | |
(1)Issued as depositary shares, each representing a 1/25th interest in a share of the corresponding series of non-cumulative perpetual preferred stock. Beginning in the second quarter of 2023, dividends are payable quarterly on January 30, April 30, July 30 and October 30 at a floating rate, in each case when, as and if declared by the Citi Board of Directors. The dividend rate will transition to 3-month term SOFR plus 0.26161% + 4.068% at the start of the next dividend period.
(2)Issued as depositary shares, each representing a 1/25th interest in a share of the corresponding series of non-cumulative perpetual preferred stock. Beginning in the second quarter of 2023, dividends are payable quarterly on February 15, May 15, August 15 and November 15 at a floating rate, in each case when, as and if declared by the Citi Board of Directors. As previously announced, Citi will be redeeming Series B in its entirety on August 15, 2023.
(3)Issued as depositary shares, each representing a 1/25th interest in a share of the corresponding series of non-cumulative perpetual preferred stock. Dividends are payable semiannually on May 15 and November 15 at a fixed rate until, but excluding, May 15, 2023, thereafter payable quarterly on February 15, May 15, August 15 and November 15 at a floating rate, in each case when, as and if declared by the Citi Board of Directors. Beginning in the third quarter of 2023, dividends are payable quarterly on February 15, May 15, August 15 and November 15 at a floating rate, in each case when, as and if declared by the Citi Board of Directors. The dividend ratespread incorporates the original contractual spread and a 0.26161% tenor spread adjustment. As previously announced, Citi will transition to 3-month term SOFR plus 0.26161% + 3.466% at the start of the next dividend period.be redeeming Series D in its entirety on May 15, 2024.
(4)(2)Issued as depositary shares, each representing a 1/1,000th interestCiti redeemed the remaining Series J in a share of the corresponding series of non-cumulative perpetual preferred stock. Dividends are payable quarterlyits entirety on March 30, June 30, September 30 and December 30 at a fixed rate until, but excluding, September 30, 2023, thereafter payable quarterly on the same dates at a floating rate, in each case when, as and if declared by the Citi Board of Directors. Beginning in the fourth quarter of 2023, dividends are payable quarterly on March 30, June 30, September 30 and December 30 at a floating rate, in each case when, as and if declared by the Citi Board of Directors. The dividend rate will transition to 3-month term SOFR plus 0.26161% + 4.040% at the start of the next dividend period.29, 2024.
(5)Issued as depositary shares, each representing a 1/1,000th interest in a share of the corresponding series of non-cumulative perpetual preferred stock. Dividends are payable quarterly on February 15, May 15, August 15 and November 15 at a fixed rate until, but excluding, November 15, 2023, thereafter payable quarterly on the same dates at a floating rate, in each case when, as and if declared by the Citi Board of Directors.
(6)(3)Issued as depositary shares, each representing a 1/25th interest in a share of the corresponding series of non-cumulative perpetual preferred stock. Dividends are payable semiannually on May 15 and November 15 at a fixed rate until, but excluding, May 15, 2024, thereafter payable quarterly on February 15, May 15, August 15 and November 15 at a floating rate, in each case when, as and if declared by the Citi Board of Directors.
(7)(4)Issued as depositary shares, each representing a 1/25th interest in a share of the corresponding series of non-cumulative perpetual preferred stock. Dividends are payable semiannually on May 15 and November 15 at a fixed rate until, but excluding, May 15, 2025, and thereafter payable quarterly on February 15, May 15, August 15 and November 15 at a floating rate, in each case when, as and if declared by the Citi Board of Directors.
(8)(5)Issued as depositary shares, each representing a 1/25th interest in a share of the corresponding series of non-cumulative perpetual preferred stock. Dividends are payable semiannually on February 15 and August 15 at a fixed rate until, but excluding, August 15, 2026, thereafter payable quarterly on February 15, May 15, August 15 and November 15 at a floating rate, in each case when, as and if declared by the Citi Board of Directors.
(9)(6)Issued as depositary shares, each representing a 1/25th interest in a share of the corresponding series of non-cumulative perpetual preferred stock. Dividends are payable semiannually on March 12 and September 12 at a fixed rate until, but excluding, September 12, 2024, thereafter payable quarterly on March 12, June 12, September 12 and December 12 at a floating rate, in each case when, as and if declared by the Citi Board of Directors.
(10)(7)Issued as depositary shares, each representing a 1/25th interest in a share of the corresponding series of non-cumulative perpetual preferred stock. Dividends are payable semiannually on January 30 and July 30 at a fixed rate until, but excluding, January 30, 2025, thereafter payable quarterly on January 30, April 30, July 30 and October 30 at a floating rate, in each case when, as and if declared by the Citi Board of Directors.
(11)(8)Issued as depositary shares, each representing a 1/25th interest in a share of the corresponding series of non-cumulative perpetual preferred stock. Dividends are payable quarterly on March 10, June 10, September 10 and December 10 at a fixed rate until, but excluding, December 10, 2025, thereafter payable quarterly on the same dates at a floating rate, in each case when, as and if declared by the Citi Board of Directors.
(12)(9)Issued as depositary shares, each representing a 1/25th interest in a share of the corresponding series of non-cumulative perpetual preferred stock. Dividends are payable quarterly on February 18, May 18, August 18 and November 18 at a fixed rate until, but excluding, February 18, 2026, thereafter payable quarterly on the same dates at a floating rate, in each case when, as and if declared by the Citi Board of Directors.
(13)(10)Issued as depositary shares, each representing a 1/25th interest in a share of the corresponding series of non-cumulative perpetual preferred stock. Dividends are payable quarterly on February 15, May 15, August 15 and November 15 at a fixed rate until, but excluding, November 15, 2026, thereafter payable quarterly on the same dates at a floating rate, in each case when, as and if declared by the Citi Board of Directors.
(14)(11)Issued as depositary shares, each representing a 1/25th interest in a share of the corresponding series of non-cumulative perpetual preferred stock. Dividends are payable quarterly on February 15, May 15, August 15 and November 15 at a fixed rate until, but excluding, May 15, 2028, thereafter payable quarterly on the same dates at a floating rate, in each case when, as and if declared by the Citi Board of Directors.
(12)Issued as depositary shares, each representing a 1/25th interest in a share of the corresponding series of non-cumulative perpetual preferred stock. Dividends are payable quarterly on February 15, May 15, August 15 and November 15 at a fixed rate until, but excluding, November 15, 2028, thereafter payable quarterly on the same dates at a floating rate, in each case when, as and if declared by the Citi Board of Directors.
(13)Issued as depositary shares, each representing a 1/25th interest in a share of the corresponding series of non-cumulative perpetual preferred stock. Dividends are payable quarterly on February 15, May 15, August 15 and November 15 at a fixed rate until, but excluding, May 15, 2029, thereafter payable quarterly on the same dates at a floating rate, in each case when, as and if declared by the Citi Board of Directors.
N/A Not applicable, as the series has been redeemed.
20.21. SECURITIZATIONS AND VARIABLE INTEREST ENTITIES
For additional information regarding Citi’s use of special purpose entities (SPEs) and variable interest entities (VIEs), see Note 23 to the Consolidated Financial Statements in Citi’s 20222023 Form 10-K.
Citigroup’s involvement with consolidated and unconsolidated VIEs with which the Company holds significant variable interests or has continuing involvement through servicing a majority of the assets in a VIE is presented below:
| | As of June 30, 2023 |
| | Maximum exposure to loss in significant unconsolidated VIEs(1) |
| Funded exposures(2) | Unfunded exposures | |
| As of March 31, 2024 | | | As of March 31, 2024 |
| | | | Maximum exposure to loss in significant unconsolidated VIEs(1) | | | | | | Maximum exposure to loss in significant unconsolidated VIEs(1) |
| | | | Funded exposures(2) | |
| In millions of dollars | |
| In millions of dollars | |
| In millions of dollars | In millions of dollars | Total
involvement
with SPE
assets | Consolidated
VIE/SPE assets | Significant unconsolidated VIE assets(3) | Debt
investments | Equity
investments | Funding
commitments | Guarantees
and
derivatives | Total | Total
involvement
with SPE
assets | Consolidated
VIE/SPE assets | Significant unconsolidated VIE assets(3) | Debt
investments | Equity
investments | Funding
commitments | Guarantees
and
derivatives | Total |
| Credit card securitizations | Credit card securitizations | $ | 31,666 | | $ | 31,666 | | $ | — | | $ | — | | $ | — | | $ | — | | $ | — | | $ | — | |
Mortgage securitizations(4) | Mortgage securitizations(4) | | | | | | | | |
| U.S. agency-sponsored | |
| U.S. agency-sponsored | |
| U.S. agency-sponsored | U.S. agency-sponsored | 125,515 | | — | | 125,515 | | 2,093 | | — | | — | | 138 | | 2,231 | |
| Non-agency-sponsored | Non-agency-sponsored | 66,721 | | — | | 66,721 | | 3,191 | | — | | — | | — | | 3,191 | |
| Citi-administered asset-backed commercial paper conduits | Citi-administered asset-backed commercial paper conduits | 18,600 | | 18,600 | | — | | — | | — | | — | | — | | — | |
| Collateralized loan obligations (CLOs) | Collateralized loan obligations (CLOs) | 5,916 | | — | | 5,916 | | 2,525 | | — | | — | | — | | 2,525 | |
Asset-based financing(5) | Asset-based financing(5) | 180,279 | | 10,931 | | 169,348 | | 39,875 | | 955 | | 11,636 | | — | | 52,466 | |
| Municipal securities tender option bond trusts (TOBs) | Municipal securities tender option bond trusts (TOBs) | 1,527 | | 596 | | 931 | | 16 | | — | | 681 | | — | | 697 | |
| Municipal investments | Municipal investments | 21,653 | | 3 | | 21,650 | | 2,463 | | 3,031 | | 2,941 | | — | | 8,435 | |
| Client intermediation | Client intermediation | 487 | | 97 | | 390 | | 75 | | — | | — | | — | | 75 | |
| Investment funds | Investment funds | 490 | | 103 | | 387 | | 4 | | 7 | | 78 | | 1 | | 90 | |
| | Total | Total | $ | 452,854 | | $ | 61,996 | | $ | 390,858 | | $ | 50,242 | | $ | 3,993 | | $ | 15,336 | | $ | 139 | | $ | 69,710 | |
| Total | |
| Total | |
| | As of December 31, 2022 |
| | Maximum exposure to loss in significant unconsolidated VIEs(1) |
| Funded exposures(2) | Unfunded exposures | |
| As of December 31, 2023 | | | As of December 31, 2023 |
| | | | Maximum exposure to loss in significant unconsolidated VIEs(1) | | | | | | Maximum exposure to loss in significant unconsolidated VIEs(1) |
| | | | Funded exposures(2) | |
| In millions of dollars | |
| In millions of dollars | |
| In millions of dollars | In millions of dollars | Total
involvement
with SPE
assets | Consolidated
VIE/SPE assets | Significant unconsolidated VIE assets(3) | Debt
investments | Equity
investments | Funding
commitments | Guarantees
and
derivatives | Total | Total
involvement
with SPE
assets | Consolidated
VIE/SPE assets | Significant unconsolidated VIE assets(3) | Debt
investments | Equity
investments | Funding
commitments | Guarantees
and
derivatives | Total |
| Credit card securitizations | Credit card securitizations | $ | 32,021 | | $ | 32,021 | | $ | — | | $ | — | | $ | — | | $ | — | | $ | — | | $ | — | |
Mortgage securitizations(4) | Mortgage securitizations(4) | | | | | | | | |
| U.S. agency-sponsored | |
| U.S. agency-sponsored | |
| U.S. agency-sponsored | U.S. agency-sponsored | 117,358 | | — | | 117,358 | | 2,052 | | — | | — | | 48 | | 2,100 | |
| Non-agency-sponsored | Non-agency-sponsored | 67,704 | | — | | 67,704 | | 3,294 | | — | | — | | — | | 3,294 | |
| Citi-administered asset-backed commercial paper conduits | Citi-administered asset-backed commercial paper conduits | 19,621 | | 19,621 | | — | | — | | — | | — | | — | | — | |
| Collateralized loan obligations (CLOs) | Collateralized loan obligations (CLOs) | 7,600 | | — | | 7,600 | | 2,601 | | — | | — | | — | | 2,601 | |
Asset-based financing(5) | Asset-based financing(5) | 242,348 | | 9,672 | | 232,676 | | 40,121 | | 1,022 | | 10,726 | | — | | 51,869 | |
| Municipal securities tender option bond trusts (TOBs) | Municipal securities tender option bond trusts (TOBs) | 2,155 | | 672 | | 1,483 | | 2 | | — | | 1,108 | | — | | 1,110 | |
| Municipal investments | Municipal investments | 22,167 | | 3 | | 22,164 | | 2,731 | | 3,143 | | 3,420 | | — | | 9,294 | |
| Client intermediation | Client intermediation | 482 | | 121 | | 361 | | 58 | | — | | — | | 13 | | 71 | |
| Investment funds | Investment funds | 534 | | 91 | | 443 | | 2 | | 5 | | 68 | | — | | 75 | |
| Other | — | | — | | — | | — | | — | | — | | — | | — | |
| | Total | Total | $ | 511,990 | | $ | 62,201 | | $ | 449,789 | | $ | 50,861 | | $ | 4,170 | | $ | 15,322 | | $ | 61 | | $ | 70,414 | |
| Total | |
| Total | |
(1) The definition of maximum exposure to loss is included in the text that follows this table.
(2) Included on Citigroup’s June 30, 2023March 31, 2024 and December 31, 20222023 Consolidated Balance Sheet.
(3) A significant unconsolidated VIE is an entity in which the Company has any variable interest or continuing involvement considered to be significant, regardless of the likelihood of loss.
(4) Citigroup mortgage securitizations also include agency and non-agency (private label) re-securitization activities. These SPEs are not consolidated. See “Re-securitizations” below for further discussion.
(5) Included within this line are loans to third-party-sponsored private equity funds, which represent $11$6 billion and $69$6 billion in unconsolidated VIE assets and $534$281 million and $498$282 million in maximum exposure to loss as of June 30, 2023March 31, 2024 and December 31, 2022,2023, respectively.
The previous tables do not include:
•certain investment funds for which the Company provides investment management services and personal estate trusts for which the Company provides administrative, trustee and/or investment management services;
•certain third-party-sponsored private equity funds to which the Company provides secured credit facilities. The Company has no decision-making power and does not consolidate these funds, some of which may meet the definition of a VIE. The Company’s maximum exposure to loss is generally limited to a loan or lending-related commitment. As of June 30, 2023March 31, 2024 and December 31, 2022,2023, the Company’s maximum exposure to loss related to these transactions was $16.8$8.1 billion and $33.6$8.5 billion, respectively (for more information on these positions, see(see Note 1314 and Note 2728 to the Consolidated Financial Statements in Citi’s 20222023 Form 10-K);
•certain VIEs structured by third parties in which the Company holds securities in inventory, as these investments are made on arm’s-length terms;
•certain positions in mortgage- and asset-backed securities held by the Company, which are classified as Trading account assets or Investments, in which the Company has no other involvement with the related securitization entity deemed to be significant (see Notes 1213 and 2122 for more information on these positions);
•certain representations and warranties exposures in Citigroup residential mortgage securitizations, in which the original mortgage loan balances are no longer outstanding; and
•VIEs such as preferred securities trusts used in connection with the Company’s funding activities. The Company does not have a variable interest in these trusts.
The asset balances for consolidated VIEs represent the carrying amounts of the assets consolidated by the Company. The carrying amount may represent the amortized cost or the current fair value of the assets depending on the classification of the asset (e.g., loan or security) and the associated accounting model ascribed to that classification.
The asset balances for unconsolidated VIEs in which the Company has significant involvement represent the most current information available to the Company. In most cases, the asset balances represent an amortized cost basis without regard to impairments, unless fair value information is readily available to the Company.
The maximum funded exposure represents the balance sheet carrying amount of the Company’s investment in the VIE. It reflects the initial amount of cash invested in the VIE, adjusted for any accrued interest and cash principal payments received. The carrying amount may also be adjusted for increases or declines in fair value or any impairment in value recognized in earnings. The maximum exposure of unfunded positions represents the remaining undrawn committed amount, including liquidity and credit facilities provided by the Company or the notional amount of a derivative instrument considered to be a variable interest. In certain transactions, the Company has entered into derivative instruments or other arrangements that are not considered variable interests in the VIE (e.g., interest rate swaps, cross-currency swaps or where the Company is the purchaser of credit protection under a credit default swap or total return swap where the Company pays the total return on certain assets to the SPE). Receivables under such arrangements are not included in the maximum exposure amounts.
The following tables present certain assets and liabilities of consolidated variable interest entities (VIEs), which are included on Citi’s Consolidated Balance Sheet. The assets in the table below include those assets that can only be used to settle obligations of consolidated VIEs and are in excess of those obligations. In addition, the assets in the table below include third-party assets of consolidated VIEs only and exclude intercompany balances that eliminate in consolidation. The liabilities in the table below include third-party liabilities of consolidated VIEs only and exclude intercompany balances that eliminate in consolidation. The liabilities also exclude amounts where creditors or beneficial interest holders have recourse to the general credit of Citigroup.
| | June 30, | |
| 2023 | December 31, |
| March 31, | |
| 2024 | |
| 2024 | |
| 2024 | | December 31, |
| In millions of dollars | In millions of dollars | (Unaudited) | 2022 | In millions of dollars | (Unaudited) | 2023 |
| Assets of consolidated VIEs to be used to settle obligations of consolidated VIEs | Assets of consolidated VIEs to be used to settle obligations of consolidated VIEs | | Assets of consolidated VIEs to be used to settle obligations of consolidated VIEs | |
| Cash and due from banks | Cash and due from banks | $ | 69 | | $ | 61 | |
| Trading account assets | Trading account assets | 10,417 | | 9,153 | |
| Investments | Investments | 496 | | 594 | |
| Loans, net of unearned income | Loans, net of unearned income | | | Loans, net of unearned income | | |
| Consumer | Consumer | 34,786 | | 35,026 | |
| Corporate | Corporate | 18,731 | | 19,782 | |
| Loans, net of unearned income | Loans, net of unearned income | $ | 53,517 | | $ | 54,808 | |
| Allowance for credit losses on loans (ACLL) | Allowance for credit losses on loans (ACLL) | (2,623) | | (2,520) | |
| Total loans, net | Total loans, net | $ | 50,894 | | $ | 52,288 | |
| Other assets | Other assets | 120 | | 105 | |
| Total assets of consolidated VIEs to be used to settle obligations of consolidated VIEs | Total assets of consolidated VIEs to be used to settle obligations of consolidated VIEs | $ | 61,996 | | $ | 62,201 | |
| | June 30, | |
| 2023 | December 31, |
| March 31, | |
| 2024 | |
| 2024 | |
| 2024 | | December 31, |
| In millions of dollars | In millions of dollars | (Unaudited) | 2022 | In millions of dollars | (Unaudited) | 2023 |
Liabilities of consolidated VIEs for which creditors or beneficial interest holders
do not have recourse to the general credit of Citigroup | Liabilities of consolidated VIEs for which creditors or beneficial interest holders
do not have recourse to the general credit of Citigroup | | Liabilities of consolidated VIEs for which creditors or beneficial interest holders
do not have recourse to the general credit of Citigroup | |
| Short-term borrowings | Short-term borrowings | $ | 9,652 | | $ | 9,807 | |
| Long-term debt | Long-term debt | 7,930 | | 10,324 | |
| Other liabilities | Other liabilities | 853 | | 622 | |
Total liabilities of consolidated VIEs for which creditors or beneficial interest holders
do not have recourse to the general credit of Citigroup | Total liabilities of consolidated VIEs for which creditors or beneficial interest holders
do not have recourse to the general credit of Citigroup | $ | 18,435 | | $ | 20,753 | |
Funding Commitments for Significant Unconsolidated VIEs—Liquidity Facilities and Loan Commitments
The following table presents the notional amount of liquidity facilities and loan commitments that are classified as funding commitments in the VIE tables above:
| | June 30, 2023 | December 31, 2022 |
| March 31, 2024 | | | March 31, 2024 | December 31, 2023 |
| In millions of dollars | In millions of dollars | Liquidity
facilities | Loan/equity
commitments | Liquidity
facilities | Loan/equity
commitments | In millions of dollars | Liquidity
facilities | Loan/equity
commitments | Liquidity
facilities | Loan/equity
commitments |
| Non-agency-sponsored mortgage securitizations | Non-agency-sponsored mortgage securitizations | $ | — | | $ | — | | $ | — | | $ | — | |
| Asset-based financing | Asset-based financing | — | | 11,636 | | — | | 10,726 | |
| Municipal securities tender option bond trusts (TOBs) | Municipal securities tender option bond trusts (TOBs) | 681 | | — | | 1,108 | | — | |
| Municipal investments | Municipal investments | — | | 2,941 | | — | | 3,420 | |
| Investment funds | Investment funds | — | | 78 | | — | | 68 | |
| Other | Other | — | | — | | — | | — | |
| Total funding commitments | Total funding commitments | $ | 681 | | $ | 14,655 | | $ | 1,108 | | $ | 14,214 | |
Significant Interests in Unconsolidated VIEs—Balance Sheet Classification
The following table presents the carrying amounts and classification of significant variable interests in unconsolidated VIEs:
| | In billions of dollars | In billions of dollars | June 30, 2023 | December 31, 2022 | In billions of dollars | March 31, 2024 | December 31, 2023 |
| Cash | Cash | $ | — | | $ | — | |
| Trading account assets | Trading account assets | 1.6 | | 1.6 | |
| Investments | Investments | 8.5 | | 8.6 | |
| Total loans, net of allowance | Total loans, net of allowance | 43.5 | | 44.2 | |
| Other | Other | 0.6 | | 0.6 | |
| Total assets | Total assets | $ | 54.2 | | $ | 55.0 | |
Credit Card Securitizations
The Company’s primary credit card securitization activity is through two trusts—Citibank Credit Card Master Trust and Citibank Omni Trust. These trusts are consolidated entities given Citi’s continuing involvement. For additional information, see Note 2223 to the Consolidated Financial Statements in Citi’s 20222023 Form 10-K. There were no material cash flows arising from either proceeds from new securitizations or paydowns of maturing notes during the sixthree months ended June 30, 2023March 31, 2024 and 2022.2023.
The following tables summarize selected cash flow information and retained interests related to Citigroup mortgage securitizations:
| | Three Months Ended June 30, |
| 2023 | 2022 |
| Three Months Ended March 31, | | | Three Months Ended March 31, |
| 2024 | | | 2024 | 2023 |
| In billions of dollars | In billions of dollars | U.S. agency-
sponsored
mortgages | Non-agency-
sponsored
mortgages | U.S. agency-
sponsored
mortgages | Non-agency-
sponsored
mortgages | In billions of dollars | U.S. agency-
sponsored
mortgages | Non-agency-
sponsored
mortgages | U.S. agency-
sponsored
mortgages | Non-agency-
sponsored
mortgages |
| Principal securitized | Principal securitized | $ | 1.6 | | $ | 1.0 | | $ | 1.9 | | $ | 8.6 | |
| Proceeds from new securitizations | Proceeds from new securitizations | 1.6 | | 0.9 | | 1.8 | | 8.4 | |
| Contractual servicing fees received | Contractual servicing fees received | — | | — | | — | | — | |
| Cash flows received on retained interests and other net cash flows | Cash flows received on retained interests and other net cash flows | — | | 0.1 | | — | | — | |
| Purchases of previously transferred financial assets | Purchases of previously transferred financial assets | — | | — | | — | | — | |
| | | Six Months Ended June 30, |
| | 2023 | 2022 |
| In billions of dollars | U.S. agency-
sponsored
mortgages | Non-agency-
sponsored
mortgages | U.S. agency-
sponsored
mortgages | Non-agency-
sponsored
mortgages |
| Principal securitized | $ | 2.3 | | $ | 2.3 | | $ | 4.0 | | $ | 10.2 | |
| Proceeds from new securitizations | 2.4 | | 2.0 | | 3.9 | | 10.0 | |
| Contractual servicing fees received | 0.1 | | — | | — | | — | |
| Cash flows received on retained interests and other net cash flows | — | | 0.1 | | — | | — | |
| Purchases of previously transferred financial assets | — | | — | | — | | — | |
|
Note: Excludes broker-dealer re-securitization transactions.
Gains recognized on the securitization of U.S. agency-sponsored mortgages were $0.2 million and $0.3less than $1 million for the three and six months ended June 30, 2023, respectively.March 31, 2024. Gains recognized on the securitization of non-agency-sponsored mortgages were $11.3 million and $13.7$36.5 million for the three and six months ended June 30, 2023, respectively.March 31, 2024.
Gains recognized on the securitization of U.S. agency-sponsored mortgages were $0.3 million and $0.6less than $1 million for the three and six months ended June 30, 2022, respectively.March 31, 2023. Gains recognized on the securitization of non-agency-sponsored mortgages were $35 million and $73.7$2.4 million for the three and six months ended June 30, 2022, respectively.March 31, 2023.
| | June 30, 2023 | December 31, 2022 |
| | Non-agency-sponsored mortgages(1) | | Non-agency-sponsored mortgages(1) |
| March 31, 2024 | | | March 31, 2024 | December 31, 2023 |
| | Non-agency-sponsored mortgages(1) | | | | Non-agency-sponsored mortgages(1) | | Non-agency-sponsored mortgages(1) |
| In millions of dollars | In millions of dollars | U.S. agency-
sponsored mortgages | Senior
interests(2) | Subordinated
interests | U.S. agency-
sponsored mortgages | Senior
interests | Subordinated
interests | In millions of dollars | U.S. agency-
sponsored mortgages | Senior
interests(2) | Subordinated
interests | U.S. agency-
sponsored mortgages | Senior
interests | Subordinated
interests |
Carrying value of retained interests(3) | Carrying value of retained interests(3) | $ | 684 | | $ | 1,043 | | $ | 959 | | $ | 659 | | $ | 1,119 | | $ | 943 | |
(1) Disclosure of non-agency-sponsored mortgages as senior and subordinated interests is indicative of the interests’ position in the capital structure of the securitization.
(2) Senior interests in non-agency-sponsored mortgages include $1.7$0.6 million related to personal loan securitizations at June 30, 2023.March 31, 2024.
(3) Retained interests consist of Level 2 and Level 3 assets depending on the observability of significant inputs. See Note 2223 for more information about fair value measurements.
The following table includes information about loan delinquencies and liquidation losses for assets held in non-consolidated, non-agency-sponsored securitization entities:
| | Liquidation losses |
| Securitized assets | 90 days past due | Three Months Ended June 30, | Six Months Ended June 30, |
| | | | | Liquidation (gains) losses | |
| | | | | Liquidation (gains) losses | |
| | | | | Liquidation (gains) losses | |
| Securitized assets | |
| In billions of dollars, except liquidation losses in millions | |
| In billions of dollars, except liquidation losses in millions | |
| In billions of dollars, except liquidation losses in millions | In billions of dollars, except liquidation losses in millions | Jun. 30, 2023 | Dec. 31, 2022 | Jun. 30, 2023 | Dec. 31, 2022 | 2023 | 2022 | 2023 | 2022 |
| Securitized assets | Securitized assets | | | | | | | |
| Securitized assets | |
| Securitized assets | |
Residential mortgages(1) | |
Residential mortgages(1) | |
Residential mortgages(1) | Residential mortgages(1) | $ | 30 | | $ | 30.8 | | $ | 0.5 | | $ | 0.5 | | $ | — | | $ | (0.3) | | $ | 2.3 | | $ | 1.2 | |
| Commercial and other | Commercial and other | 28.7 | | 28.8 | | — | | — | | — | | — | | — | | — | |
| Commercial and other | |
| Commercial and other | |
| Total | Total | $ | 58.7 | | $ | 59.6 | | $ | 0.5 | | $ | 0.5 | | $ | — | | $ | (0.3) | | $ | 2.3 | | $ | 1.2 | |
| Total | |
| Total | |
(1) Securitized assets include $0.1 billion of personal loan securitizations as of June 30, 2023.March 31, 2024.
Mortgage Servicing Rights (MSRs)
The fair value of Citi’s capitalized MSRs was $681$702 million and $600$658 million at June 30,March 31, 2024 and 2023, and 2022, respectively. The MSRs correspond to principal loan balances of $51$52 billion and $49$50 billion as of June 30,March 31, 2024 and 2023, and 2022, respectively. The following table summarizes the changes in capitalized MSRs:
| | Three Months Ended June 30, | Six Months Ended June 30, |
| Three Months Ended March 31, | |
| Three Months Ended March 31, | |
| Three Months Ended March 31, | |
| In millions of dollars | |
| In millions of dollars | |
| In millions of dollars | In millions of dollars | 2023 | 2022 | 2023 | 2022 |
| Balance, beginning of period | Balance, beginning of period | $ | 658 | | $ | 520 | | $ | 665 | | $ | 404 | |
| Balance, beginning of period | |
| Balance, beginning of period | |
| Originations | |
| Originations | |
| Originations | Originations | 19 | | 35 | | 31 | | 69 | |
| Changes in fair value of MSRs due to changes in inputs and assumptions | Changes in fair value of MSRs due to changes in inputs and assumptions | 22 | | 59 | | 19 | | 158 | |
| Changes in fair value of MSRs due to changes in inputs and assumptions | |
| Changes in fair value of MSRs due to changes in inputs and assumptions | |
Other changes(1) | Other changes(1) | (18) | | (14) | | (34) | | (31) | |
| Sales of MSRs | — | | — | | — | | — | |
| Balance, as of June 30 | $ | 681 | | $ | 600 | | $ | 681 | | $ | 600 | |
Other changes(1) | |
Other changes(1) | |
| | Balance, as of March 31 | |
| | Balance, as of March 31 | |
| | Balance, as of March 31 | |
(1) Represents changes due to customer payments and passage of time.payments.
The fair value of the MSRs is primarily affected by changes in prepayments of mortgages that result from shifts in mortgage interest rates. Specifically, higher interest rates tend to lead to declining prepayments, which causes the fair value of the MSRs to increase. In managing this risk, Citigroup economically hedges a significant portion of the value of its MSRs through the use of interest rate derivative contracts, forward purchase and sale commitments of mortgage-backed securities and purchased securities, all classified as Trading account assets.
The Company receives fees during the course of servicing previously securitized mortgages. The amounts of these fees were as follows:
| | Three Months Ended June 30, | Six Months Ended June 30, |
| Three Months Ended March 31, | |
| Three Months Ended March 31, | |
| Three Months Ended March 31, | |
| In millions of dollars | |
| In millions of dollars | |
| In millions of dollars | In millions of dollars | 2023 | 2022 | 2023 | 2022 |
| Servicing fees | Servicing fees | $ | 32 | | $ | 30 | | $ | 65 | | $ | 59 | |
| Servicing fees | |
| Servicing fees | |
| Late fees | |
| Late fees | |
| Late fees | Late fees | 1 | | 1 | | 2 | | 2 |
| | Total MSR fees | Total MSR fees | $ | 33 | | $ | 31 | | $ | 67 | | $ | 61 | |
| | Total MSR fees | |
| | Total MSR fees | |
In the Consolidated Statement of Income these fees are primarily classified as Commissions and fees, and changes in MSR fair values are classified as Other revenue.
Re-securitizations
The Company engages in re-securitization transactions in which debt securities are transferred to a VIE in exchange for new beneficial interests. Citi did not transfer non-agency (private label) securities to re-securitization entities during the three months ended June 30, 2023March 31, 2024 and 2022.2023. These securities are backed by either residential or commercial mortgages and are often structured on behalf of clients.
As of June 30, 2023March 31, 2024 and December 31, 2022,2023, Citi held no retained interests in private label re-securitization transactions structured by Citi.
The Company also re-securitizes U.S. government-agency-guaranteed mortgage-backed (agency) securities. During the three and six months ended June 30, 2023,March 31, 2024, Citi transferred agency securities with a fair value of approximately $3.3$4.4 billion and $8.6 billion, respectively, to re-securitization entities, compared to approximately $5.6 billion and $14.9$5.3 billion for the three and six months ended June 30, 2022, respectively.March 31, 2023.
As of June 30, 2023,March 31, 2024, the fair value of Citi-retained interests in agency re-securitization transactions structured by Citi totaled approximately $1.4$1.8 billion (including $402 millionrelated to re-securitization transactions executed in 2023), compared to $1.4 billion as of December 31, 2022 (including
$801$732 million related to re-securitization transactions executed in 2022)2024), compared to $1.7 billion as of December 31, 2023 (including $930 million related to re-securitization transactions executed in 2023), which is recorded in Trading account assets. The original fair values of agency re-securitization transactions in which Citi holds a retained interest as of June 30, 2023March 31, 2024 and December 31, 20222023 were approximately $86.8$69 billion and $79.4$84.1 billion, respectively.
As of June 30, 2023March 31, 2024 and December 31, 2022,2023, the Company did not consolidate any private label or agency re-securitization entities.
Citi-Administered Asset-Backed Commercial Paper Conduits
At June 30, 2023March 31, 2024 and December 31, 2022,2023, the commercial paper conduits administered by Citi had approximately $18.6$19.1 billion and $19.6$21.1 billion of purchased assets outstanding, respectively, and had incremental fundingunfunded commitments with clients of approximately $16.1$17.8 billion and $13.9$16.7 billion, respectively.
Substantially all of the funding of the conduits is in the form of short-term commercial paper. At June 30, 2023March 31, 2024 and
December 31, 2022,2023, the weighted averageweighted-average remaining livesmaturities of the commercial paper issued by the conduits were approximately 6671 and 6468 days, respectively.
Each asset purchased by the conduit is structured with transaction-specific credit enhancement, features provided by the third-party client seller, including over-collateralization, cash and excess spread collateral accounts, direct recourse or third-party guarantees. These credit enhancements areCredit enhancement is sized with the objective of approximating aan investment-grade credit rating, of A or above, based on Citi’s internal risk ratings. In addition to the transaction-specific credit enhancements,enhancement, the conduits other than the government-guaranteed loan conduit, have obtained letters of credit from the Company whichthat equal at least 8% to 10% of the conduit’s assets with a minimum of $200 million to $350 million. The letters of credit provided by the Company to the conduits
total approximately $1.9 billion and $1.9$2.1 billion as of June 30, 2023March 31, 2024 and December 31, 2022,2023, respectively. The net result across multisellermulti-seller conduits administered by the Company is that, in the event that defaulted assets exceed the transaction-specific credit enhancementsenhancement described above, any losses in each conduit are allocated first to the Company and then to the commercial paper investors.
At June 30, 2023March 31, 2024 and December 31, 2022,2023, the Company owned $7.7$8.0 billion and $8.6$10.1 billion, respectively, of the commercial paper issued by its administered conduits. The Company’s investments were not driven by market illiquidity and the Company is not obligated under any agreement to purchase the commercial paper issued by the conduits.
Municipal Securities Tender Option Bond (TOB) Trusts
At June 30, 2023March 31, 2024 and December 31, 2022,2023, none of the municipal bonds owned by non-customer TOB trusts were subject to a credit guarantee provided by the Company.
At June 30, 2023 and December 31, 2022, liquidity agreements provided with respect to customer TOB trusts totaled $0.7 billion and $1.1 billion, respectively, of which $0.5 billion and $0.7 billion, respectively, were offset by reimbursement agreements. For the remaining exposure related to TOB transactions, where the residual owned by the customer was at least 25% of the bond value at the inception of the transaction, no reimbursement agreement was executed.
The Company also provides other liquidity agreements or letters of credit to customer-sponsored municipal investment funds, which are not variable interest entities, and municipality-related issuers that totaled $1.4$1.2 billion and $1.4$1.2 billion as of June 30, 2023March 31, 2024 and December 31, 2022,2023, respectively. These liquidity agreements and letters of credit are offset by reimbursement agreements with various term-out provisions.
Asset-Based Financing
The primary types of Citi’s asset-based financings, total assets of the unconsolidated VIEs with significant involvement and Citi’s maximum exposure to loss are presented below. For Citi to realize the maximum loss, the VIE (borrower) would have to default with no recovery from the assets held by the VIE.
| | June 30, 2023 | December 31, 2022 |
| March 31, 2024 | | | March 31, 2024 | December 31, 2023 |
| In millions of dollars | In millions of dollars | Total
unconsolidated
VIE assets | Maximum
exposure to
unconsolidated VIEs | Total
unconsolidated
VIE assets | Maximum
exposure to
unconsolidated VIEs | In millions of dollars | Total
unconsolidated
VIE assets | Maximum
exposure to
unconsolidated VIEs | Total
unconsolidated
VIE assets | Maximum
exposure to
unconsolidated VIEs |
| Type | Type | | | |
| Commercial and other real estate | |
| Commercial and other real estate | |
| Commercial and other real estate | Commercial and other real estate | $ | 43,836 | | $ | 9,100 | | $ | 43,236 | | $ | 8,806 | |
| Corporate loans | Corporate loans | 21,396 | | 14,535 | | 23,120 | | 15,077 | |
| Other (including investment funds, airlines and shipping) | Other (including investment funds, airlines and shipping) | 104,116 | | 28,831 | | 166,320 | | 27,986 | |
| Total | Total | $ | 169,348 | | $ | 52,466 | | $ | 232,676 | | $ | 51,869 | |
21.22. DERIVATIVES
In the ordinary course of business, Citigroup enters into various types of derivative transactions. All derivatives are recorded in Trading account assets/Trading account liabilities on the Consolidated Balance Sheet. For additional information regarding Citi’s use of and accounting for derivatives, see Note 2324 to the Consolidated Financial Statements in Citi’s 20222023 Form 10-K.
Information pertaining to Citigroup’s derivatives activities, based on notional amounts, is presented in the table below. Derivative notional amounts are reference amounts from which contractual payments are derived and do not represent a complete measure of Citi’s exposure to derivative transactions. Citi’s derivative exposure arises primarily from
market fluctuations (i.e., market risk), counterparty failure (i.e., credit risk) and/or periods of high volatility or financial stress (i.e., liquidity risk), as well as any market valuation adjustments that may be required on the transactions. Moreover, notional amounts presented below do not reflect the netting of offsetting trades. For example, if Citi enters into a receive-fixed interest rate swap with $100 million notional, and offsets this risk with an identical but opposite pay-fixed position with a different counterparty, $200 million in derivative notionals is reported, although these offsetting positions may result in de minimis overall market risk.
In addition, aggregate derivative notional amounts can fluctuate from period to period in the normal course of business based on Citi’s market share, levels of client activity and other factors.
Derivative Notionals
| | | |
| | | | Hedging instruments under ASC 815 | Trading derivative instruments | Hedging instruments under ASC 815 | Trading derivative instruments |
| In millions of dollars | In millions of dollars | June 30,
2023 | December 31,
2022 | June 30,
2023 | December 31,
2022 | |
| Interest rate contracts | Interest rate contracts | | | | |
| Interest rate contracts | |
| Interest rate contracts | |
| Swaps | |
| Swaps | |
| Swaps | Swaps | $ | 256,131 | | $ | 255,280 | | $ | 26,965,401 | | $ | 23,780,711 | | |
| Futures and forwards | Futures and forwards | — | | — | | 3,494,099 | | 2,966,025 | | |
| Futures and forwards | |
| Futures and forwards | |
| Written options | |
| Written options | |
| Written options | Written options | — | | — | | 2,598,919 | | 1,937,025 | | |
| Purchased options | Purchased options | — | | — | | 2,425,954 | | 1,881,291 | | |
| Purchased options | |
| Purchased options | |
| Total interest rate contracts | |
| Total interest rate contracts | |
| Total interest rate contracts | Total interest rate contracts | $ | 256,131 | | $ | 255,280 | | $ | 35,484,373 | | $ | 30,565,052 | | |
| Foreign exchange contracts | Foreign exchange contracts | | | | | |
| Foreign exchange contracts | |
| Foreign exchange contracts | |
| Swaps | |
| Swaps | |
| Swaps | Swaps | $ | 42,117 | | $ | 48,678 | | $ | 7,613,604 | | $ | 6,746,070 | | |
| Futures, forwards and spot | Futures, forwards and spot | 47,752 | | 43,666 | | 3,869,688 | | 3,350,341 | | |
| Futures, forwards and spot | |
| Futures, forwards and spot | |
| Written options | |
| Written options | |
| Written options | Written options | — | | — | | 838,598 | | 789,077 | | |
| Purchased options | Purchased options | — | | — | | 829,662 | | 783,591 | | |
| Purchased options | |
| Purchased options | |
| Total foreign exchange contracts | |
| Total foreign exchange contracts | |
| Total foreign exchange contracts | Total foreign exchange contracts | $ | 89,869 | | $ | 92,344 | | $ | 13,151,552 | | $ | 11,669,079 | | |
| Equity contracts | Equity contracts | | | | | |
| Equity contracts | |
| Equity contracts | |
| Swaps | |
| Swaps | |
| Swaps | Swaps | $ | — | | $ | — | | $ | 273,483 | | $ | 266,115 | | |
| Futures and forwards | Futures and forwards | — | | — | | 87,637 | | 76,935 | | |
| Futures and forwards | |
| Futures and forwards | |
| Written options | |
| Written options | |
| Written options | Written options | — | | — | | 558,215 | | 482,266 | | |
| Purchased options | Purchased options | — | | — | | 444,663 | | 387,766 | | |
| Purchased options | |
| Purchased options | |
| Total equity contracts | |
| Total equity contracts | |
| Total equity contracts | Total equity contracts | $ | — | | $ | — | | $ | 1,363,998 | | $ | 1,213,082 | | |
| Commodity and other contracts | Commodity and other contracts | | | | | |
| Commodity and other contracts | |
| Commodity and other contracts | |
| Swaps | |
| Swaps | |
| Swaps | Swaps | $ | — | | $ | — | | $ | 82,002 | | $ | 90,884 | | |
| Futures and forwards | Futures and forwards | 1,586 | | 1,571 | | 177,615 | | 165,314 | | |
| Futures and forwards | |
| Futures and forwards | |
| Written options | |
| Written options | |
| Written options | Written options | — | | — | | 50,931 | | 45,862 | | |
| Purchased options | Purchased options | — | | — | | 51,882 | | 48,197 | | |
| Purchased options | |
| Purchased options | |
| Total commodity and other contracts | |
| Total commodity and other contracts | |
| Total commodity and other contracts | Total commodity and other contracts | $ | 1,586 | | $ | 1,571 | | $ | 362,430 | | $ | 350,257 | | |
Credit derivatives(1) | Credit derivatives(1) | | | | | |
Credit derivatives(1) | |
Credit derivatives(1) | |
| Protection sold | |
| Protection sold | |
| Protection sold | Protection sold | $ | — | | $ | — | | $ | 725,634 | | $ | 593,136 | | |
| Protection purchased | Protection purchased | — | | — | | 789,558 | | 641,639 | | |
| Protection purchased | |
| Protection purchased | |
| Total credit derivatives | |
| Total credit derivatives | |
| Total credit derivatives | Total credit derivatives | $ | — | | $ | — | | $ | 1,515,192 | | $ | 1,234,775 | | |
| Total derivative notionals | Total derivative notionals | $ | 347,586 | | $ | 349,195 | | $ | 51,877,545 | | $ | 45,032,245 | | |
| Total derivative notionals | |
| Total derivative notionals | |
(1)Credit derivatives are arrangements designed to allow one party (protection purchaser) to transfer the credit risk of a “reference asset” to another party (protection seller). These arrangements allow a protection seller to assume the credit risk associated with the reference asset without directly purchasing that asset. The Company enters into credit derivative positions for purposes such as risk management, yield enhancement, reduction of credit concentrations and diversification of overall risk.
The following tables present the gross and net fair values of the Company’s derivative transactions and the related offsetting amounts as of June 30, 2023March 31, 2024 and December 31, 2022.2023. Gross positive fair values are offset against gross negative fair values by counterparty, pursuant to enforceable master netting agreements. Under ASC 815-10-45, payables and receivables in respect of cash collateral received from or paid to a given counterparty pursuant to a credit support annex are included in the offsetting amount if a legal opinion supporting the enforceability of netting and collateral rights has been obtained. GAAP does not permit similar offsetting for security collateral.
In addition, the following tables reflect rule changes adopted by clearing organizations that require or allow entities to treat certain derivative assets, liabilities and the related variation margin as settlement of the related derivative fair values for legal and accounting purposes, as opposed to presenting gross derivative assets and liabilities that are subject to collateral, whereby the counterparties would also record a related collateral payable or receivable. The tables also present amounts that are not permitted to be offset in the Company’s balance sheet presentation, such as security collateral or cash collateral posted at third-party custodians, but which would be eligible for offsetting to the extent that an event of default has occurred and a legal opinion supporting enforceability of the netting and collateral rights has been obtained.
Derivative Mark-to-Market (MTM) Receivables/Payables
| | Derivatives classified in
Trading account assets/liabilities(1)(2) |
| In millions of dollars at June 30, 2023 | Assets | Liabilities |
| Derivatives classified in
Trading account assets/liabilities(1)(2) | | | Derivatives classified in
Trading account assets/liabilities(1)(2) |
| In millions of dollars at March 31, 2024 | | In millions of dollars at March 31, 2024 | Assets | Liabilities |
| Derivatives instruments designated as ASC 815 hedges | Derivatives instruments designated as ASC 815 hedges | |
| Over-the-counter | |
| Over-the-counter | |
| Over-the-counter | Over-the-counter | $ | 414 | | $ | 18 | |
| Cleared | Cleared | 126 | | 18 | |
| | Interest rate contracts | Interest rate contracts | $ | 540 | | $ | 36 | |
| Interest rate contracts | |
| Interest rate contracts | |
| Over-the-counter | Over-the-counter | $ | 1,620 | | $ | 1,306 | |
| Cleared | Cleared | 1 | | — | |
| | Foreign exchange contracts | |
| Foreign exchange contracts | |
| Foreign exchange contracts | Foreign exchange contracts | $ | 1,621 | | $ | 1,306 | |
| | Total derivatives instruments designated as ASC 815 hedges | Total derivatives instruments designated as ASC 815 hedges | $ | 2,161 | | $ | 1,342 | |
| | Total derivatives instruments designated as ASC 815 hedges | |
| | Total derivatives instruments designated as ASC 815 hedges | |
| Derivatives instruments not designated as ASC 815 hedges | Derivatives instruments not designated as ASC 815 hedges | |
| Over-the-counter | |
| Over-the-counter | |
| Over-the-counter | Over-the-counter | $ | 120,857 | | $ | 114,712 | |
| Cleared | Cleared | 47,014 | | 49,212 | |
| Exchange traded | Exchange traded | 283 | | 251 | |
| Interest rate contracts | Interest rate contracts | $ | 168,154 | | $ | 164,175 | |
| Over-the-counter | Over-the-counter | $ | 157,724 | | $ | 150,913 | |
| Cleared | Cleared | 511 | | 601 | |
| Exchange traded | Exchange traded | — | | 5 | |
| Foreign exchange contracts | Foreign exchange contracts | $ | 158,235 | | $ | 151,519 | |
| Over-the-counter | Over-the-counter | $ | 22,029 | | $ | 27,163 | |
| Cleared | Cleared | 36 | | 6 | |
| Exchange traded | Exchange traded | 25,020 | | 24,412 | |
| Equity contracts | Equity contracts | $ | 47,085 | | $ | 51,581 | |
| Over-the-counter | Over-the-counter | $ | 15,640 | | $ | 16,678 | |
| | Exchange traded | Exchange traded | 886 | | 992 | |
| Exchange traded | |
| Exchange traded | |
| Commodity and other contracts | Commodity and other contracts | $ | 16,526 | | $ | 17,670 | |
| Over-the-counter | Over-the-counter | $ | 6,566 | | $ | 6,607 | |
| Cleared | Cleared | 4,273 | | 4,121 | |
| | Credit derivatives | Credit derivatives | $ | 10,839 | | $ | 10,728 | |
| Credit derivatives | |
| Credit derivatives | |
| Total derivatives instruments not designated as ASC 815 hedges | Total derivatives instruments not designated as ASC 815 hedges | $ | 400,839 | | $ | 395,673 | |
| Total derivatives | Total derivatives | $ | 403,000 | | $ | 397,015 | |
| Less: Netting agreements(3) | |
Less: Netting agreements(3) | |
Less: Netting agreements(3) | Less: Netting agreements(3) | $ | (312,754) | | $ | (312,754) | |
Less: Netting cash collateral received/paid(4) | Less: Netting cash collateral received/paid(4) | (18,645) | | (28,221) | |
Net receivables/payables included on the Consolidated Balance Sheet(5) | Net receivables/payables included on the Consolidated Balance Sheet(5) | $ | 71,601 | | $ | 56,040 | |
Additional amounts subject to an enforceable master netting agreement,
but not offset on the Consolidated Balance Sheet | Additional amounts subject to an enforceable master netting agreement,
but not offset on the Consolidated Balance Sheet | |
| | Less: Cash collateral received/paid | Less: Cash collateral received/paid | $ | (723) | | $ | (2,793) | |
| | Less: Cash collateral received/paid | |
| | Less: Cash collateral received/paid | |
| Less: Non-cash collateral received/paid | Less: Non-cash collateral received/paid | (3,841) | | (10,406) | |
Total net receivables/payables(5) | Total net receivables/payables(5) | $ | 67,037 | | $ | 42,841 | |
(1)The derivativederivatives fair values are also presented in Note 22.23.
(2)Over-the-counter (OTC) derivatives are derivatives executed and settled bilaterally with counterparties without the use of an organized exchange or central clearing house. Cleared derivatives include derivatives executed bilaterally with a counterparty in the OTC market, but then novated to a central clearing house, whereby the central clearing house becomes the counterparty to both of the original counterparties. Exchange-traded derivatives include derivatives executed directly on an organized exchange that provides pre-trade price transparency.
(3)Represents the netting of balances with the same counterparty under enforceable netting agreements. Approximately $241$208 billion, $48$43 billion and $24$35 billion of the netting against trading account asset/liability balances is attributable to each of the OTC, cleared and exchange-traded derivatives, respectively.
(4)Represents the netting of cash collateral paid and received by counterparties under enforceable credit support agreements.agreements with appropriate legal opinion supporting enforceability of netting. Substantially all netting of cash collateral received and paid is against OTC derivative assets and liabilities, respectively.
(5)The net receivables/payables include approximately $14$4 billion of derivative asset and $9$10 billion of derivative liability fair values not subject to enforceable master netting agreements, respectively.
| | Derivatives classified in
Trading account assets/liabilities(1)(2) |
| In millions of dollars at December 31, 2022 | Assets | Liabilities |
| Derivatives classified in
Trading account assets/liabilities(1)(2) | | | Derivatives classified in
Trading account assets/liabilities(1)(2) |
| In millions of dollars at December 31, 2023 | | In millions of dollars at December 31, 2023 | Assets | Liabilities |
| Derivatives instruments designated as ASC 815 hedges | Derivatives instruments designated as ASC 815 hedges | |
| Over-the-counter | |
| Over-the-counter | |
| Over-the-counter | Over-the-counter | $ | 468 | | $ | 1 | |
| Cleared | Cleared | 129 | | 101 | |
| | Interest rate contracts | Interest rate contracts | $ | 597 | | $ | 102 | |
| Interest rate contracts | |
| Interest rate contracts | |
| Over-the-counter | Over-the-counter | $ | 2,288 | | $ | 1,766 | |
| Cleared | Cleared | 3 | | 3 | |
| | Foreign exchange contracts | |
| Foreign exchange contracts | |
| Foreign exchange contracts | Foreign exchange contracts | $ | 2,291 | | $ | 1,769 | |
| | Total derivatives instruments designated as ASC 815 hedges | Total derivatives instruments designated as ASC 815 hedges | $ | 2,888 | | $ | 1,871 | |
| | Total derivatives instruments designated as ASC 815 hedges | |
| | Total derivatives instruments designated as ASC 815 hedges | |
| Derivatives instruments not designated as ASC 815 hedges | Derivatives instruments not designated as ASC 815 hedges | |
| Over-the-counter | |
| Over-the-counter | |
| Over-the-counter | Over-the-counter | $ | 126,844 | | $ | 119,854 | |
| Cleared | Cleared | 50,515 | | 52,566 | |
| Exchange traded | Exchange traded | 248 | | 98 | |
| Interest rate contracts | Interest rate contracts | $ | 177,607 | | $ | 172,518 | |
| Over-the-counter | Over-the-counter | $ | 184,869 | | $ | 183,578 | |
| Cleared | Cleared | 502 | | 643 | |
| Exchange traded | Exchange traded | 1 | | 5 | |
| Foreign exchange contracts | Foreign exchange contracts | $ | 185,372 | | $ | 184,226 | |
| Over-the-counter | Over-the-counter | $ | 19,674 | | $ | 21,871 | |
| Cleared | Cleared | 1 | | 4 | |
| Exchange traded | Exchange traded | 22,732 | | 21,908 | |
| Equity contracts | Equity contracts | $ | 42,407 | | $ | 43,783 | |
| Over-the-counter | Over-the-counter | $ | 27,285 | | $ | 24,912 | |
| | Exchange traded | Exchange traded | 1,039 | | 1,406 | |
| Exchange traded | |
| Exchange traded | |
| Commodity and other contracts | Commodity and other contracts | $ | 28,324 | | $ | 26,318 | |
| Over-the-counter | Over-the-counter | $ | 6,836 | | $ | 5,807 | |
| Cleared | Cleared | 1,553 | | 1,970 | |
| | Credit derivatives | Credit derivatives | $ | 8,389 | | $ | 7,777 | |
| Credit derivatives | |
| Credit derivatives | |
| Total derivatives instruments not designated as ASC 815 hedges | Total derivatives instruments not designated as ASC 815 hedges | $ | 442,099 | | $ | 434,622 | |
| Total derivatives | Total derivatives | $ | 444,987 | | $ | 436,493 | |
| Less: Netting agreements(3) | |
Less: Netting agreements(3) | |
Less: Netting agreements(3) | Less: Netting agreements(3) | $ | (346,545) | | $ | (346,545) | |
Less: Netting cash collateral received/paid(4) | Less: Netting cash collateral received/paid(4) | (23,136) | | (30,032) | |
Net receivables/payables included on the Consolidated Balance Sheet(5) | Net receivables/payables included on the Consolidated Balance Sheet(5) | $ | 75,306 | | $ | 59,916 | |
Additional amounts subject to an enforceable master netting agreement,
but not offset on the Consolidated Balance Sheet | Additional amounts subject to an enforceable master netting agreement,
but not offset on the Consolidated Balance Sheet | |
| | Less: Cash collateral received/paid | Less: Cash collateral received/paid | $ | (1,455) | | $ | (2,272) | |
| | Less: Cash collateral received/paid | |
| | Less: Cash collateral received/paid | |
| Less: Non-cash collateral received/paid | Less: Non-cash collateral received/paid | (5,923) | | (13,475) | |
Total net receivables/payables(5) | Total net receivables/payables(5) | $ | 67,928 | | $ | 44,169 | |
(1)The derivativederivatives fair values are also presented in Note 22.23.
(2)Over-the-counter (OTC)OTC derivatives are derivatives executed and settled bilaterally with counterparties without the use of an organized exchange or central clearing house. Cleared derivatives include derivatives executed bilaterally with a counterparty in the OTC market, but then novated to a central clearing house, whereby the central clearing house becomes the counterparty to both of the original counterparties. Exchange-traded derivatives include derivatives executed directly on an organized exchange that provides pre-trade price transparency.
(3)Represents the netting of balances with the same counterparty under enforceable netting agreements. Approximately $276$242 billion, $49$44 billion and $22 billion of the netting against trading account asset/liability balances is attributable to each of the OTC, cleared and exchange-traded derivatives, respectively.
(4)Represents the netting of cash collateral paid and received by counterparties under enforceable credit support agreements.agreements with appropriate legal opinion supporting enforceability of netting. Substantially all netting of cash collateral received and paid is against OTC derivative assets and liabilities, respectively.
(5)The net receivables/payables include approximately $14$4 billion of derivative asset and $11$10 billion of derivative liability fair values not subject to enforceable master netting agreements, respectively.
For the three and six months ended June 30,March 31, 2024 and 2023, and 2022, amounts recognized in Principal transactions in the Consolidated Statement of Income include certain derivatives not designated in a qualifying hedging relationship. Citigroup presents this disclosure by business classification, showing derivative gains and losses related to its trading activities together with gains and losses related to non-derivative instruments within the same trading portfolios, as this represents how these portfolios are risk managed. See Note 6 for further information.
The amounts recognized in Other revenue in the Consolidated Statement of Income related to derivatives not designated in a qualifying hedging relationship are presented below. The table below does not include any offsetting gains (losses) on the economically hedged items to the extent that such amounts are also recorded in Other revenue.items:
| | | | Gains (losses) included in
Other revenue |
| | Three Months Ended June 30, | Six Months Ended June 30, |
| | | Gains (losses) included in
Other revenue |
| Three Months Ended March 31, | |
| In millions of dollars | |
| In millions of dollars | |
| In millions of dollars | In millions of dollars | 2023 | 2022 | 2023 | 2022 |
| Interest rate contracts | Interest rate contracts | $ | (22) | | $ | 72 | | $ | (34) | | $ | 144 | |
| Interest rate contracts | |
| Interest rate contracts | |
| Foreign exchange | |
| Foreign exchange | |
| Foreign exchange | Foreign exchange | (6) | | (4) | | (64) | | (81) | |
| Total | Total | $ | (28) | | $ | 68 | | $ | (98) | | $ | 63 | |
| Total | |
| Total | |
Fair Value Hedges
For additional information regarding Citi’s fair value hedges, see Note 2324 to the Consolidated Financial Statements in Citi’s 20222023 Form 10-K.
The following table summarizes the gains (losses) on the Company’s fair value hedges:
| | | | Gains (losses) on fair value hedges(1) |
| | Three Months Ended June 30, | Six Months Ended June 30, |
| | 2023 | 2022 | 2023 | 2022 | Gains (losses) on fair value hedges(1) |
| Three Months Ended March 31, | |
| 2024 | |
| 2024 | |
| 2024 | |
| In millions of dollars | |
| In millions of dollars | |
| In millions of dollars | In millions of dollars | Other revenue | Net interest income | Other revenue | Net interest income | Other
revenue | Net interest income | Other revenue | Net interest income |
| Gain (loss) on the hedging derivatives included in assessment of the effectiveness of fair value hedges | Gain (loss) on the hedging derivatives included in assessment of the effectiveness of fair value hedges | | | | | | | |
Gain (loss) on the hedging derivatives included in assessment
of the effectiveness of fair value hedges | |
Gain (loss) on the hedging derivatives included in assessment
of the effectiveness of fair value hedges | |
| Interest rate hedges | |
| Interest rate hedges | |
| Interest rate hedges | Interest rate hedges | $ | — | | $ | (491) | | $ | — | | $ | (1,717) | | $ | — | | $ | (492) | | $ | — | | $ | (6,383) | |
| Foreign exchange hedges | Foreign exchange hedges | 738 | | — | | (1,234) | | — | | 1,286 | | — | | (1,659) | | — | |
Commodity hedges(4) | 183 | | — | | (257) | | — | | (325) | | — | | 615 | | — | |
| Foreign exchange hedges | |
| Foreign exchange hedges | |
Commodity hedges(2) | |
Commodity hedges(2) | |
Commodity hedges(2) | |
| Total gain (loss) on the hedging derivatives included in assessment of the effectiveness of fair value hedges | |
| Total gain (loss) on the hedging derivatives included in assessment of the effectiveness of fair value hedges | |
| Total gain (loss) on the hedging derivatives included in assessment of the effectiveness of fair value hedges | Total gain (loss) on the hedging derivatives included in assessment of the effectiveness of fair value hedges | $ | 921 | | $ | (491) | | $ | (1,491) | | $ | (1,717) | | $ | 961 | | $ | (492) | | $ | (1,044) | | $ | (6,383) | |
| Gain (loss) on the hedged item in designated and qualifying fair value hedges | Gain (loss) on the hedged item in designated and qualifying fair value hedges | | | | | | | |
Gain (loss) on the hedged item in designated and qualifying
fair value hedges | |
Gain (loss) on the hedged item in designated and qualifying
fair value hedges | |
| Interest rate hedges | |
| Interest rate hedges | |
| Interest rate hedges | Interest rate hedges | $ | — | | $ | 488 | | $ | — | | $ | 1,646 | | $ | — | | $ | 481 | | $ | — | | $ | 6,243 | |
| Foreign exchange hedges | Foreign exchange hedges | (738) | | — | | 1,233 | | — | | (1,286) | | — | | 1,657 | | — | |
Commodity hedges(4) | (183) | | — | | 257 | | — | | 325 | | — | | (615) | | — | |
| Foreign exchange hedges | |
| Foreign exchange hedges | |
Commodity hedges(2) | |
Commodity hedges(2) | |
Commodity hedges(2) | |
| Total gain (loss) on the hedged item in designated and qualifying fair value hedges | |
| Total gain (loss) on the hedged item in designated and qualifying fair value hedges | |
| Total gain (loss) on the hedged item in designated and qualifying fair value hedges | Total gain (loss) on the hedged item in designated and qualifying fair value hedges | $ | (921) | | $ | 488 | | $ | 1,490 | | $ | 1,646 | | $ | (961) | | $ | 481 | | $ | 1,042 | | $ | 6,243 | |
| Net gain (loss) on the hedging derivatives excluded from assessment of the effectiveness of fair value hedges | Net gain (loss) on the hedging derivatives excluded from assessment of the effectiveness of fair value hedges | | | | | | | |
| Net gain (loss) on the hedging derivatives excluded from assessment of the effectiveness of fair value hedges | |
| Net gain (loss) on the hedging derivatives excluded from assessment of the effectiveness of fair value hedges | |
| Interest rate hedges | Interest rate hedges | $ | — | | $ | — | | $ | — | | $ | (5) | | $ | — | | $ | — | | $ | — | | $ | (11) | |
Foreign exchange hedges(2) | 2 | | — | | 73 | | — | | 24 | | — | | 104 | | — | |
Commodity hedges(3)(4) | 52 | | — | | (26) | | — | | 101 | | — | | 23 | | — | |
| Interest rate hedges | |
| Interest rate hedges | |
Foreign exchange hedges(3) | |
Foreign exchange hedges(3) | |
Foreign exchange hedges(3) | |
Commodity hedges(2)(4) | |
Commodity hedges(2)(4) | |
Commodity hedges(2)(4) | |
| Total net gain (loss) on the hedging derivatives excluded from assessment of the effectiveness of fair value hedges | Total net gain (loss) on the hedging derivatives excluded from assessment of the effectiveness of fair value hedges | $ | 54 | | $ | — | | $ | 47 | | $ | (5) | | $ | 125 | | $ | — | | $ | 127 | | $ | (11) | |
| Total net gain (loss) on the hedging derivatives excluded from assessment of the effectiveness of fair value hedges | |
| Total net gain (loss) on the hedging derivatives excluded from assessment of the effectiveness of fair value hedges | |
(1)Gain (loss) amounts for interest rate risk hedges are included in Interest income/Interest expense. The accrued interest income on fair value hedges is recorded in Net interest income and is excluded from this table. Amounts included both hedges of AFS securities and long-term debt on a net basis, which largely offset in the current period.
(2)The gain (loss) amounts for commodity hedges are included in Principal transactions.
(3)Amounts related to the forward points (i.e., the spot-forward difference) that are excluded from the assessment of hedge effectiveness and are generally reflected directly in earnings under the mark-to-market approach. Amounts related to cross-currency basis, which are recognized in AOCI, are not reflected in the table above. The amount of cross-currency basis included in AOCI was $22$(4) million and $(4)$(26) million for the three and six months ended June 30,March 31, 2024 and 2023, and $12 million and $76 million for the three and six months ended June 30, 2022, respectively.
(3)(4)Amounts related to the forward points (i.e., the spot-forward difference) that are excluded from the assessment of hedge effectiveness reflected directly in earnings under the mark-to-market approach or recorded in AOCI under the amortization approach. The quarter ended June 30, 2023March 31, 2024 includes gain (loss) of approximately $41$93 million and $11$5 million under the mark-to-market approach and amortization approach, respectively. The quarter ended June 30, 2022March 31, 2023 includes gain (loss) of approximately $(28)$45 million and $2$4 million under the mark-to-market approach and amortization approach, respectively.
(4)The gain (loss) amounts for commodity hedges are included in Principal transactions for periods beginning 2023.
Cumulative Basis Adjustment
Upon electing to apply ASC 815 fair value hedge accounting, the carrying value of the hedged item is adjusted to reflect the cumulative changes in the hedged risk. This cumulative basis adjustment becomes part of the carrying amount of the hedged item until the hedged item is derecognized from the balance sheet. The table below presents the carrying amount of Citi’s hedged assets and liabilities under qualifying fair value hedges at June 30, 2023March 31, 2024 and December 31, 2022,2023, along with the cumulative basis adjustments included in the carrying value of those hedged assets and liabilities that would reverse through earnings in future periods.
| | | | | | | | | | | |
| In millions of dollars |
| Balance sheet line item in which hedged item is recorded | Carrying amount of hedged asset/ liability(1) | Cumulative basis adjustment increasing (decreasing) the carrying amount |
| Active | De-designated |
| As of June 30, 2023 | | |
Debt securities AFS(2)(4) | $ | 87,804 | | $ | (2,936) | | $ | (360) | |
| | | |
| Long-term debt | 130,665 | | (3,522) | | (4,816) | |
| As of December 31, 2022 | | |
Debt securities AFS(3)(4) | $ | 98,837 | | $ | (2,976) | | $ | (333) | |
| | | |
| Long-term debt | 144,549 | | (5,040) | | (3,399) | |
| | | | | | | | | | | |
| In millions of dollars |
| Balance sheet line item in which hedged item is recorded | Carrying amount of hedged asset/ liability(1) | Cumulative basis adjustment increasing (decreasing) the carrying amount |
| Active | De-designated |
| As of March 31, 2024 | | |
Debt securities AFS(2)(6) | $ | 103,809 | | $ | (1,135) | | $ | (293) | |
Consumer loans(3) | 33,872 | | (74) | | — | |
Corporate loans(4) | 5,702 | | (3) | | (22) | |
| Long-term debt | 142,275 | | (1,697) | | (5,228) | |
| As of December 31, 2023 | | |
Debt securities AFS(5)(6) | $ | 111,886 | | $ | (925) | | $ | (282) | |
| | | |
Corporate loans(7) | 4,968 | | 93 | | (3) | |
| Long-term debt | 141,449 | | (908) | | (5,160) | |
(1)Excludes physical commodities inventories with a carrying value of approximately $5 billion and $8 billion as of June 30,March 31, 2024 and December 31, 2023, respectively, which includes cumulative basis adjustments of approximately $540 million$(0.4) billion and $1.2 billion, respectively, for active hedges.
(2)These amounts include a cumulative basis adjustment of $(201)$(113) million for active hedges and $(283)$(27) million for de-designated hedges as of June 30, 2023,March 31, 2024, related to certain prepayable financial assets previously designated as the hedged item in a fair value hedge using the portfolio layer approach. The Company designated approximately $7$21 billion as the hedged amount (from a closed portfolio of financial assets with a carrying value of $13$31 billion as of June 30, 2023)March 31, 2024) in a portfolio layerhedging relationship.
(3)All hedged consumer loans are designated in a fair value hedge using the portfolio layer approach. The Company designated approximately $10.0 billion as the hedged amount (from a closed portfolio of financial assets with a carrying value of $34 billion as of March 31, 2024).
(4)All hedged corporate loans are designated in a fair value hedge using the portfolio layer approach. The Company designated approximately $3.7 billion as the hedged amount (from a closed portfolio of financial assets with a carrying value of $5.7 billion as of March 31, 2024).
(5)These amounts include a cumulative basis adjustment of $(91)$248 million for active hedges and $(309)$(51) million for de-designated hedges as of December 31, 2022,2023, related to certain prepayable financial assets previously designated as the hedged item in a fair value hedge using the last-of-layer approach. The Company designated approximately $3$14 billion as the hedged amount (from a closed portfolio of prepayable financial assets with a carrying value of $11$28 billion as of December 31, 2022)2023) in a last-of-layer hedging relationship.
(4)(6)Carrying amount represents the amortized cost.
(7)All hedged corporate loans are designated in a fair value hedge using the portfolio layer approach. The Company designated approximately $3.6 billion as the hedged amount (from a closed portfolio of financial assets with a carrying value of $5.0 billion as of December 31, 2023).
Cash Flow Hedges
Citigroup hedges the variability of forecasted cash flows due to changes in contractually specified interest rates associated with floating-rate assets/liabilities and other forecasted transactions. These cash flow hedging relationships use either regression analysis or dollar-offset ratio analysis to assess whether the hedging relationships are highly effective at inception and on an ongoing basis.
For cash flow hedges, the entire change in the fair value of the hedging derivative is recognized in AOCI and then reclassified to earnings in the same period that the forecasted hedged cash flows impact earnings. The net gain (loss) associated with cash flow hedges expected to be reclassified from AOCI within 12 months of June 30, 2023 is approximately $(1.3) billion. The maximum length of time over which forecasted cash flows are hedged is 13 years.
The pretax change in AOCI from cash flow hedges is presented below. The after-tax impact of cash flow hedges on below:
AOCI is shown in Note 18.
| | | |
| | | | Three Months Ended June 30, | Six Months Ended June 30, |
| In millions of dollars | In millions of dollars | 2023 | 2022 | 2023 | 2022 |
| In millions of dollars | |
| In millions of dollars | |
Amount of gain (loss) recognized in AOCI on derivatives | |
Amount of gain (loss) recognized in AOCI on derivatives | |
Amount of gain (loss) recognized in AOCI on derivatives | Amount of gain (loss) recognized in AOCI on derivatives | | | | |
| Interest rate contracts | Interest rate contracts | $ | (280) | | $ | (681) | | $ | (259) | | $ | (2,441) | |
| Interest rate contracts | |
| Interest rate contracts | |
| Interest rate contracts | |
| Interest rate contracts | |
| Interest rate contracts | |
| Foreign exchange contracts | |
| Foreign exchange contracts | |
| Foreign exchange contracts | Foreign exchange contracts | 17 | | (7) | | 5 | | 16 | |
Total gain (loss) recognized in AOCI | Total gain (loss) recognized in AOCI | $ | (263) | | $ | (688) | | $ | (254) | | $ | (2,425) | |
Total gain (loss) recognized in AOCI | |
Total gain (loss) recognized in AOCI | |
| |
| |
|
| Other
revenue | Net
interest
income | Other
revenue |
Net
interest
income | Other
revenue | Net interest
income | Other
revenue | Net
interest
income |
Amount of gain (loss) reclassified from AOCI to earnings(1) | Amount of gain (loss) reclassified from AOCI to earnings(1) | | | | | | | |
Amount of gain (loss) reclassified from AOCI to earnings(1) | |
Amount of gain (loss) reclassified from AOCI to earnings(1) | |
| Interest rate contracts | |
| Interest rate contracts | |
| Interest rate contracts | Interest rate contracts | $ | — | | $ | (495) | | $ | — | | $ | 199 | | $ | — | | $ | (964) | | $ | — | | $ | 485 | |
| Foreign exchange contracts | Foreign exchange contracts | (1) | | — | | (1) | | — | | (2) | | — | | (2) | | — | |
| Foreign exchange contracts | |
| Foreign exchange contracts | |
Total gain (loss) reclassified from AOCI into earnings | |
Total gain (loss) reclassified from AOCI into earnings | |
Total gain (loss) reclassified from AOCI into earnings | Total gain (loss) reclassified from AOCI into earnings | $ | (1) | | $ | (495) | | $ | (1) | | $ | 199 | | $ | (2) | | $ | (964) | | $ | (2) | | $ | 485 | |
Net pretax change in cash flow hedges included within AOCI | Net pretax change in cash flow hedges included within AOCI | | $ | 233 | | | $ | (886) | | | $ | 712 | | | $ | (2,908) | |
Net pretax change in cash flow hedges included within AOCI | |
Net pretax change in cash flow hedges included within AOCI | |
(1)All amounts reclassified into earnings for interest rate contracts are included in Interest income/Interest expense (Net interest income). For all other hedges, the amounts reclassified to earnings are included primarily in Other revenue and Net interest income in the Consolidated Statement of Income.
The net gain (loss) associated with cash flow hedges expected to be reclassified from AOCI within 12 months of March 31, 2024 is approximately $(0.6) billion. The maximum length of time over which forecasted cash flows are hedged is 14 years.
The after-tax impact of cash flow hedges on AOCI is presented in Note 19.
Net Investment Hedges
Citigroup uses foreign currency forwards, cross-currency swaps, options and foreign currency-denominated debt instruments to manage the foreign exchange risk associated with Citigroup’s equity investments in several non-U.S.-dollar-functional-currency foreign subsidiaries. Citi records the change in the fair value of these hedging instruments and the translation adjustment for the investments in these foreign
subsidiaries in Foreign currency translation adjustment (CTA) within AOCI.
The pretax gain (loss) recorded in CTA within AOCI, related to net investment hedges, was $(272)$192 million and $(948)$(676) million for the three and six months ended June 30,March 31, 2024 and 2023, and $836 million and $641 million for the three and six months ended June 30, 2022, respectively. June 30, 2022 includes a $47 million pretax loss related to net investment hedges that was reclassified from AOCI into earnings (recorded in Other revenue).
Credit Derivatives
The following tables summarize the key characteristics of Citi’s credit derivatives portfolio by counterparty and derivative form:
| | Fair values | Notionals |
| In millions of dollars at June 30, 2023 | Receivable(1) | Payable(2) | Protection
purchased | Protection
sold |
| Fair values | | | Fair values | Notionals |
| In millions of dollars at March 31, 2024 | | In millions of dollars at March 31, 2024 | Receivable(1) | Payable(2) | Protection
purchased | Protection
sold |
| By instrument | By instrument | | | |
| Credit default swaps and options | |
| Credit default swaps and options | |
| Credit default swaps and options | Credit default swaps and options | $ | 10,015 | | $ | 10,352 | | $ | 768,300 | | $ | 721,289 | |
| Total return swaps and other | Total return swaps and other | 824 | | 376 | | 21,258 | | 4,345 | |
| Total by instrument | Total by instrument | $ | 10,839 | | $ | 10,728 | | $ | 789,558 | | $ | 725,634 | |
| By rating of reference entity | By rating of reference entity | | | |
| Investment grade | Investment grade | $ | 5,491 | | $ | 4,977 | | $ | 619,717 | | $ | 574,059 | |
| Investment grade | |
| Investment grade | |
| Non-investment grade | Non-investment grade | 5,348 | | 5,751 | | 169,841 | | 151,575 | |
| Total by rating of reference entity | Total by rating of reference entity | $ | 10,839 | | $ | 10,728 | | $ | 789,558 | | $ | 725,634 | |
| By maturity | By maturity | | | |
| Within 1 year | Within 1 year | $ | 1,242 | | $ | 1,642 | | $ | 164,261 | | $ | 146,723 | |
| Within 1 year | |
| Within 1 year | |
| From 1 to 5 years | From 1 to 5 years | 7,503 | | 7,102 | | 570,605 | | 538,159 | |
| After 5 years | After 5 years | 2,094 | | 1,984 | | 54,692 | | 40,752 | |
| Total by maturity | Total by maturity | $ | 10,839 | | $ | 10,728 | | $ | 789,558 | | $ | 725,634 | |
(1)The fair value amount receivable is composed of $4,249$2,735 million under protection purchased and $6,590$6,057 million under protection sold.
(2)The fair value amount payable is composed of $7,011$6,684 million under protection purchased and $3,717$1,888 million under protection sold.
| | | | Fair values | Notionals | | Fair values | Notionals |
| In millions of dollars at December 31, 2022 | Receivable(1) | Payable(2) | Protection
purchased | Protection
sold |
| In millions of dollars at December 31, 2023 | | In millions of dollars at December 31, 2023 | Receivable(1) | Payable(2) | Protection
purchased | Protection
sold |
| By instrument | By instrument | | | |
| Credit default swaps and options | |
| Credit default swaps and options | |
| Credit default swaps and options | Credit default swaps and options | $ | 6,867 | | $ | 7,360 | | $ | 623,981 | | $ | 586,504 | |
| Total return swaps and other | Total return swaps and other | 1,522 | | 417 | | 17,658 | | 6,632 | |
| Total by instrument | Total by instrument | $ | 8,389 | | $ | 7,777 | | $ | 641,639 | | $ | 593,136 | |
| By rating of reference entity | By rating of reference entity | | | |
| Investment grade | Investment grade | $ | 3,796 | | $ | 2,970 | | $ | 499,339 | | $ | 462,873 | |
| Investment grade | |
| Investment grade | |
| Non-investment grade | Non-investment grade | 4,593 | | 4,807 | | 142,300 | | 130,263 | |
| Total by rating of reference entity | Total by rating of reference entity | $ | 8,389 | | $ | 7,777 | | $ | 641,639 | | $ | 593,136 | |
| By maturity | By maturity | | | |
| Within 1 year | Within 1 year | $ | 1,753 | | $ | 1,801 | | $ | 147,031 | | $ | 148,721 | |
| Within 1 year | |
| Within 1 year | |
| From 1 to 5 years | From 1 to 5 years | 4,577 | | 4,134 | | 443,113 | | 407,293 | |
| After 5 years | After 5 years | 2,059 | | 1,842 | | 51,495 | | 37,122 | |
| Total by maturity | Total by maturity | $ | 8,389 | | $ | 7,777 | | $ | 641,639 | | $ | 593,136 | |
(1) The fair value amount receivable is composed of $5,094$2,770 million under protection purchased and $3,295$5,569 million under protection sold.
(2) The fair value amount payable is composed of $3,573$6,097 million under protection purchased and $4,204$1,985 million under protection sold.
Credit Risk-Related Contingent Features in Derivatives
Certain derivative instruments contain provisions that require the Company to either post additional collateral or immediately settle any outstanding liability balances upon the occurrence of a specified event related to the credit risk of the Company. These events, which are defined by the existing derivative contracts, are primarily downgrades in the credit ratings of the Company and its affiliates.
The fair value (excluding CVA) of all derivative instruments with credit risk-related contingent features that were in a net liability position at June 30, 2023March 31, 2024 and December 31, 20222023 was $16$13 billion and $18$15 billion, respectively. The Company posted $14$11 billion and $15$12 billion as collateral for this exposure in the normal course of business as of June 30, 2023March 31, 2024 and December 31, 2022,2023, respectively.
A downgrade could trigger additional collateral or cash settlement requirements for the Company and certain affiliates. In the event that Citigroup and Citibank were downgraded a single notch by all three major rating agencies as of June 30, 2023,March 31, 2024, the Company could be required to post an additional $0.8$0.5 billion as either collateral or settlement of the derivative transactions. In addition, the Company could be required to segregate with third-party custodians collateral previously received from existing derivative counterparties in the amount of $16$34 million upon the single notch downgrade, resulting in aggregate cash obligations and collateral requirements of approximately $0.8$0.6 billion.
Derivatives Accompanied by Financial Asset Transfers
For transfers of financial assets accounted for as a sale by the Company, and for which the Company has retained substantially all of the economic exposure to the transferred asset through a total return swap executed with the same counterparty in contemplation of the initial sale (and still outstanding), the asset amounts derecognized and the gross cash proceeds received as of the date of derecognition were $2.7$5.1 billion and $1.4$4.3 billion as of June 30, 2023March 31, 2024 and December 31, 2022,2023, respectively.
At June 30, 2023,March 31, 2024, the fair value of these previously derecognized assets was $2.7$4.9 billion. The fair value of the total return swaps as of June 30, 2023March 31, 2024 was $39$104 million recorded as gross derivative assets and $24$40 million recorded as gross derivative liabilities. At December 31, 2022,2023, the fair value of these previously derecognized assets was $1.4$4.3 billion, and the fair value of the total return swaps was $27$121 million recorded as gross derivative assets and $32$29 million recorded as gross derivative liabilities.
The balances for the total return swaps are on a gross basis, before the application of counterparty and cash collateral netting, and are included primarily as equity derivatives in the tabular disclosures in this Note.
22.23. FAIR VALUE MEASUREMENT
For additional information regarding fair value measurement at Citi, see Note 2526 to the Consolidated Financial Statements in Citi’s 20222023 Form 10-K.
Fair Value Hierarchy
ASC 820-10 specifies a hierarchy of inputs based on whether the inputs are observable or unobservable. Observable inputs are developed using market data and reflect market participant assumptions, while unobservable inputs reflect the Company’s market assumptions. These two types of inputs have created the following fair value hierarchy:
•Level 1: Quoted prices for identical instruments in active markets.
•Level 2: Quoted prices for similar instruments in active markets, quoted prices for identical or similar instruments in markets that are not active and model-derived valuations in which all significant inputs and significant value drivers are observable in the market.
•Level 3: Valuations derived from valuation techniques in which one or more significant inputs or significant value drivers are unobservable.
As required under the fair value hierarchy, the Company considers relevant and observable market inputs in its valuations where possible.
The fair value hierarchy classification approach typically utilizes rules-based and data-driven selection criteria to determine whether an instrument is classified as Level 1, Level 2 or Level 3:
•The determination of whether an instrument is quoted in an active market and therefore considered a Level 1 instrument is based uponon the frequency of observed transactions and the quality of independent market data available on the measurement date.
•A Level 2 classification is assigned where there is observability of prices/market inputs to models, or where any unobservable inputs are not significant to the valuation. The determination of whether an input is considered observable is based on the availability of independent market data and its corroboration, for example through observed transactions in the market.
•Otherwise, an instrument is classified as Level 3.
Market Valuation Adjustments
The table below summarizes the credit valuation adjustments (CVA) and funding valuation adjustments (FVA) applied to the fair value of derivative instruments at June 30, 2023March 31, 2024 and December 31, 2022:2023:
| | | | Credit and funding
valuation adjustments
contra-liability (contra-asset) | | Credit and funding
valuation adjustments
contra-liability (contra-asset) |
| In millions of dollars | In millions of dollars | June 30,
2023 | December 31,
2022 | In millions of dollars | March 31,
2024 | December 31,
2023 |
| Counterparty CVA | Counterparty CVA | $ | (651) | | $ | (816) | |
| Asset FVA | Asset FVA | (502) | | (622) | |
| Citigroup (own credit) CVA | Citigroup (own credit) CVA | 456 | | 607 | |
| Liability FVA | Liability FVA | 219 | | 263 | |
| Total CVA and FVA—derivative instruments | Total CVA and FVA—derivative instruments | $ | (478) | | $ | (568) | |
The table below summarizes pretax gains (losses) related to changes in CVA on derivative instruments, net of hedges, FVA on derivatives and debt valuation adjustments (DVA) on Citi’s own fair value option (FVO) liabilities for the periods indicated:
| | | | Credit/funding/debt valuation
adjustments gain (loss) |
| | Three Months Ended June 30, | Six Months Ended June 30, |
| | | Credit/funding/debt valuation
adjustments gain (loss) |
| Three Months Ended March 31, | |
| In millions of dollars | |
| In millions of dollars | |
| In millions of dollars | In millions of dollars | 2023 | 2022 | 2023 | 2022 |
| Counterparty CVA | Counterparty CVA | $ | 4 | | $ | (94) | | $ | (30) | | $ | (201) | |
| Counterparty CVA | |
| Counterparty CVA | |
| Asset FVA | |
| Asset FVA | |
| Asset FVA | Asset FVA | 100 | | (46) | | 94 | | (151) | |
| Own credit CVA | Own credit CVA | (114) | | 182 | | (149) | | 298 | |
| Own credit CVA | |
| Own credit CVA | |
| Liability FVA | |
| Liability FVA | |
| Liability FVA | Liability FVA | (17) | | 68 | | (44) | | 90 | |
| Total CVA and FVA—derivative instruments | Total CVA and FVA—derivative instruments | $ | (27) | | $ | 110 | | $ | (129) | | $ | 36 | |
| Total CVA and FVA—derivative instruments | |
| Total CVA and FVA—derivative instruments | |
DVA related to own FVO liabilities(1) | |
DVA related to own FVO liabilities(1) | |
DVA related to own FVO liabilities(1) | DVA related to own FVO liabilities(1) | $ | (837) | | $ | 2,592 | | $ | (1,270) | | $ | 3,642 | |
| Total CVA, DVA and FVA | Total CVA, DVA and FVA | $ | (864) | | $ | 2,702 | | $ | (1,399) | | $ | 3,678 | |
| Total CVA, DVA and FVA | |
| Total CVA, DVA and FVA | |
(1) See Note 2021 to the Consolidated Financial Statements in Citi’s 20222023 Form 10-K.
Items Measured at Fair Value on a Recurring Basis
The following tables present for each of the fair value hierarchy levels the Company’s assets and liabilities that are measured at fair value on a recurring basis at June 30, 2023March 31, 2024 and December 31, 2022.2023. The Company may hedge positions
that have been classified in the Level 3 category with other financial instruments (hedging instruments) that may be classified as Level 3, but also with financial instruments classified as Level 1 or Level 2. The effects of these hedges are presented gross in the following tables:
Fair Value Levels
| | In millions of dollars at June 30, 2023 | Level 1 | Level 2 | Level 3 | Gross
inventory | Netting(1) | Net
balance |
| In millions of dollars at March 31, 2024 | | In millions of dollars at March 31, 2024 | Level 1 | Level 2 | Level 3 | Gross
inventory | Netting(1) | Net
balance |
| Assets | Assets | | | Assets | | | | |
| Securities borrowed and purchased under agreements to resell | Securities borrowed and purchased under agreements to resell | $ | — | | $ | 428,174 | | $ | 140 | | $ | 428,314 | | $ | (218,188) | | $ | 210,126 | |
| Trading non-derivative assets | Trading non-derivative assets | | |
| Trading mortgage-backed securities | Trading mortgage-backed securities | | |
| Trading mortgage-backed securities | |
| Trading mortgage-backed securities | |
| U.S. government-sponsored agency guaranteed | |
| U.S. government-sponsored agency guaranteed | |
| U.S. government-sponsored agency guaranteed | U.S. government-sponsored agency guaranteed | — | | 55,299 | | 659 | | 55,958 | | — | | 55,958 | |
| Residential | Residential | 1 | | 2,936 | | 145 | | 3,082 | | — | | 3,082 | |
| Commercial | Commercial | — | | 784 | | 182 | | 966 | | — | | 966 | |
| Total trading mortgage-backed securities | Total trading mortgage-backed securities | $ | 1 | | $ | 59,019 | | $ | 986 | | $ | 60,006 | | $ | — | | $ | 60,006 | |
| U.S. Treasury and federal agency securities | U.S. Treasury and federal agency securities | $ | 88,273 | | $ | 2,321 | | $ | — | | $ | 90,594 | | $ | — | | $ | 90,594 | |
| State and municipal | State and municipal | — | | 2,092 | | 3 | | 2,095 | | — | | 2,095 | |
| Foreign government | Foreign government | 56,090 | | 36,045 | | 81 | | 92,216 | | — | | 92,216 | |
| Corporate | Corporate | 1,695 | | 16,623 | | 581 | | 18,899 | | — | | 18,899 | |
| Equity securities | Equity securities | 55,898 | | 11,400 | | 285 | | 67,583 | | — | | 67,583 | |
| Asset-backed securities | Asset-backed securities | — | | 1,560 | | 539 | | 2,099 | | — | | 2,099 | |
Other trading assets(2) | Other trading assets(2) | 5 | | 16,613 | | 1,478 | | 18,096 | | — | | 18,096 | |
| Total trading non-derivative assets | Total trading non-derivative assets | $ | 201,962 | | $ | 145,673 | | $ | 3,953 | | $ | 351,588 | | $ | — | | $ | 351,588 | |
| Trading derivatives | Trading derivatives | | |
| Interest rate contracts | Interest rate contracts | $ | 21 | | $ | 166,402 | | $ | 2,271 | | $ | 168,694 | | | |
| Interest rate contracts | |
| Interest rate contracts | |
| Foreign exchange contracts | |
| Foreign exchange contracts | |
| Foreign exchange contracts | Foreign exchange contracts | — | | 158,360 | | 1,496 | | 159,856 | | | |
| Equity contracts | Equity contracts | 31 | | 45,762 | | 1,292 | | 47,085 | | | |
| Equity contracts | |
| Equity contracts | |
| Commodity contracts | |
| Commodity contracts | |
| Commodity contracts | Commodity contracts | — | | 15,418 | | 1,108 | | 16,526 | | | |
| Credit derivatives | Credit derivatives | — | | 9,984 | | 855 | | 10,839 | | | |
| Credit derivatives | |
| Credit derivatives | |
| Total trading derivatives—before netting and collateral | |
| Total trading derivatives—before netting and collateral | |
| Total trading derivatives—before netting and collateral | Total trading derivatives—before netting and collateral | $ | 52 | | $ | 395,926 | | $ | 7,022 | | $ | 403,000 | | | |
| Netting agreements | Netting agreements | | $ | (312,754) | | |
| Netting agreements | |
| Netting agreements | |
| Netting of cash collateral received | Netting of cash collateral received | | (18,645) | | |
| Netting of cash collateral received | |
| Netting of cash collateral received | |
| Total trading derivatives—after netting and collateral | |
| Total trading derivatives—after netting and collateral | |
| Total trading derivatives—after netting and collateral | Total trading derivatives—after netting and collateral | $ | 52 | | $ | 395,926 | | $ | 7,022 | | $ | 403,000 | | $ | (331,399) | | $ | 71,601 | |
| Investments | Investments | | |
| Mortgage-backed securities | Mortgage-backed securities | | |
| Mortgage-backed securities | |
| Mortgage-backed securities | |
| U.S. government-sponsored agency guaranteed | |
| U.S. government-sponsored agency guaranteed | |
| U.S. government-sponsored agency guaranteed | U.S. government-sponsored agency guaranteed | $ | — | | $ | 14,931 | | $ | 32 | | $ | 14,963 | | $ | — | | $ | 14,963 | |
| Residential | Residential | — | | 312 | | 25 | | 337 | | — | | 337 | |
| Commercial | Commercial | — | | 2 | | — | | 2 | | — | | 2 | |
| Total investment mortgage-backed securities | Total investment mortgage-backed securities | $ | — | | $ | 15,245 | | $ | 57 | | $ | 15,302 | | $ | — | | $ | 15,302 | |
| U.S. Treasury and federal agency securities | U.S. Treasury and federal agency securities | $ | 81,878 | | $ | 344 | | $ | 21 | | $ | 82,243 | | $ | — | | $ | 82,243 | |
| State and municipal | State and municipal | — | | 1,695 | | 507 | | 2,202 | | — | | 2,202 | |
| Foreign government | Foreign government | 50,928 | | 73,928 | | 414 | | 125,270 | | — | | 125,270 | |
| Corporate | Corporate | 2,590 | | 2,447 | | 290 | | 5,327 | | — | | 5,327 | |
| Marketable equity securities | Marketable equity securities | 164 | | 119 | | 13 | | 296 | | — | | 296 | |
| Asset-backed securities | Asset-backed securities | — | | 845 | | 1 | | 846 | | — | | 846 | |
| Other debt securities | Other debt securities | — | | 6,087 | | 57 | | 6,144 | | — | | 6,144 | |
Non-marketable equity securities(3) | — | | 5 | | 404 | | 409 | | — | | 409 | |
| Non-marketable equity securities | |
| Total investments | Total investments | $ | 135,560 | | $ | 100,715 | | $ | 1,764 | | $ | 238,039 | | $ | — | | $ | 238,039 | |
Table continues on the next page.
| | In millions of dollars at June 30, 2023 | Level 1 | Level 2 | Level 3 | Gross
inventory | Netting(1) | Net
balance |
| In millions of dollars at March 31, 2024 | | In millions of dollars at March 31, 2024 | Level 1 | Level 2 | Level 3 | Gross
inventory | Netting(1) | Net
balance |
| Loans | Loans | $ | — | $ | 5,525 | $ | 241 | $ | 5,766 | | $ | — | | $ | 5,766 | |
| Mortgage servicing rights | Mortgage servicing rights | — | 681 | 681 | | — | | 681 | |
| | Non-trading derivatives and other financial assets measured on a recurring basis | Non-trading derivatives and other financial assets measured on a recurring basis | $ | 5,793 | $ | 7,771 | $ | 73 | $ | 13,637 | | $ | — | | $ | 13,637 | |
| | Non-trading derivatives and other financial assets measured on a recurring basis | |
| | Non-trading derivatives and other financial assets measured on a recurring basis | |
| Total assets | Total assets | $ | 343,367 | $ | 1,083,784 | $ | 13,874 | $ | 1,441,025 | | $ | (549,587) | | $ | 891,438 | |
Total as a percentage of gross assets(4) | 23.8% | 75.2% | 1.0% | | |
Total as a percentage of gross assets(3) | |
| Liabilities | Liabilities | | | |
| Liabilities | |
| Liabilities | |
| Interest-bearing deposits | |
| Interest-bearing deposits | |
| Interest-bearing deposits | Interest-bearing deposits | $ | — | $ | 2,572 | $ | 26 | $ | 2,598 | | $ | — | | $ | 2,598 | |
| Securities loaned and sold under agreements to repurchase | Securities loaned and sold under agreements to repurchase | — | 213,804 | 627 | 214,431 | | (151,631) | | 62,800 | |
| Trading account liabilities | Trading account liabilities | | | |
| Securities sold, not yet purchased | |
| Securities sold, not yet purchased | |
| Securities sold, not yet purchased | Securities sold, not yet purchased | 98,359 | 16,195 | 62 | 114,616 | | — | | 114,616 | |
| Other trading liabilities | Other trading liabilities | — | 4 | 8 | | — | | 8 | |
| Total trading account liabilities | Total trading account liabilities | $ | 98,359 | $ | 16,199 | $ | 66 | $ | 114,624 | | $ | — | | $ | 114,624 | |
| Trading derivatives | Trading derivatives | | | |
| Interest rate contracts | Interest rate contracts | $ | 19 | $ | 159,959 | $ | 4,233 | $ | 164,211 | | | |
| Interest rate contracts | |
| Interest rate contracts | |
| Foreign exchange contracts | |
| Foreign exchange contracts | |
| Foreign exchange contracts | Foreign exchange contracts | — | 152,029 | 796 | 152,825 | | | |
| Equity contracts | Equity contracts | 27 | 48,699 | 2,855 | 51,581 | | | |
| Equity contracts | |
| Equity contracts | |
| Commodity contracts | |
| Commodity contracts | |
| Commodity contracts | Commodity contracts | — | 16,892 | 778 | 17,670 | | | |
| Credit derivatives | Credit derivatives | — | 9,718 | 1,010 | 10,728 | | | |
| Credit derivatives | |
| Credit derivatives | |
| Total trading derivatives—before netting and collateral | |
| Total trading derivatives—before netting and collateral | |
| Total trading derivatives—before netting and collateral | Total trading derivatives—before netting and collateral | $ | 46 | $ | 387,297 | $ | 9,672 | $ | 397,015 | | | |
| Netting agreements | Netting agreements | | | $ | (312,754) | | |
| Netting agreements | |
| Netting agreements | |
| Netting of cash collateral paid | Netting of cash collateral paid | | | (28,221) | | |
| Netting of cash collateral paid | |
| Netting of cash collateral paid | |
| Total trading derivatives—after netting and collateral | |
| Total trading derivatives—after netting and collateral | |
| Total trading derivatives—after netting and collateral | Total trading derivatives—after netting and collateral | $ | 46 | $ | 387,297 | $ | 9,672 | $ | 397,015 | | $ | (340,975) | | $ | 56,040 | |
| Short-term borrowings | Short-term borrowings | $ | — | $ | 5,326 | $ | 296 | $ | 5,622 | | $ | — | | $ | 5,622 | |
| Long-term debt | Long-term debt | — | 78,733 | 37,204 | 115,937 | | — | | 115,937 | |
| | Total non-trading derivatives and other financial liabilities measured on a recurring basis | Total non-trading derivatives and other financial liabilities measured on a recurring basis | $ | 5,793 | $ | 173 | $ | 23 | $ | 5,989 | | $ | — | | $ | 5,989 | |
| | Total non-trading derivatives and other financial liabilities measured on a recurring basis | |
| | Total non-trading derivatives and other financial liabilities measured on a recurring basis | |
| Total liabilities | Total liabilities | $ | 104,198 | $ | 704,104 | $ | 47,914 | $ | 856,216 | | $ | (492,606) | | $ | 363,610 | |
Total as a percentage of gross liabilities(4) | 12.2 | % | 82.2 | % | 5.6 | % | | |
Total as a percentage of gross liabilities(3) | |
(1)Represents netting of (i) the amounts due under securities purchased under agreements to resell and the amounts owed under securities sold under agreements to repurchase and (ii) derivative exposures covered by a qualifying master netting agreement and cash collateral offsetting.
(2)Includes positions related to investments in unallocated precious metals, as discussed in Note 23. Also includes physical commodities accounted for at the lower of cost or fair value and unfunded credit products.
(3)Amounts exclude $24$27 million of investments measured at net asset value (NAV) in accordance with ASU 2015-07, Fair Value Measurement (Topic 820): Disclosures for Investments in Certain Entities That Calculate Net Asset Value per Share (or Its Equivalent).
(4)(3)Because the amount of the cash collateral paid/received has not been allocated to the Level 1, 2 and 3 subtotals, these percentages are calculated based on total assets and liabilities measured at fair value on a recurring basis, excluding the cash collateral paid/received on derivatives.
Fair Value Levels
| | | | | | | | | | | | | | | | | | | | |
| In millions of dollars at December 31, 2023 | Level 1 | Level 2 | Level 3 | Gross
inventory | Netting(1) | Net
balance |
| Assets | | | | | | |
| Securities borrowed and purchased under agreements to resell | $ | — | | $ | 453,715 | | $ | 139 | | $ | 453,854 | | $ | (247,795) | | $ | 206,059 | |
| Trading non-derivative assets | | | | | | |
| Trading mortgage-backed securities | | | | | | |
| U.S. government-sponsored agency guaranteed | — | | 79,795 | | 581 | | 80,376 | | — | | 80,376 | |
| Residential | 1 | | 597 | | 116 | | 714 | | — | | 714 | |
| Commercial | — | | 464 | | 202 | | 666 | | — | | 666 | |
| Total trading mortgage-backed securities | $ | 1 | | $ | 80,856 | | $ | 899 | | $ | 81,756 | | $ | — | | $ | 81,756 | |
| U.S. Treasury and federal agency securities | $ | 112,851 | | $ | 2,398 | | $ | 7 | | $ | 115,256 | | $ | — | | $ | 115,256 | |
| State and municipal | — | | 594 | | 3 | | 597 | | — | | 597 | |
| Foreign government | 44,203 | | 28,238 | | 54 | | 72,495 | | — | | 72,495 | |
| Corporate | 1,858 | | 16,716 | | 500 | | 19,074 | | — | | 19,074 | |
| Equity securities | 32,966 | | 12,135 | | 292 | | 45,393 | | — | | 45,393 | |
| Asset-backed securities | — | | 1,223 | | 531 | | 1,754 | | — | | 1,754 | |
Other trading assets(2) | 97 | | 16,784 | | 833 | | 17,714 | | — | | 17,714 | |
| Total trading non-derivative assets | $ | 191,976 | | $ | 158,944 | | $ | 3,119 | | $ | 354,039 | | $ | — | | $ | 354,039 | |
| Trading derivatives | | | | | | |
| Interest rate contracts | $ | 49 | | $ | 156,307 | | $ | 2,138 | | $ | 158,494 | | | |
| Foreign exchange contracts | — | | 158,672 | | 1,022 | | 159,694 | | | |
| Equity contracts | 8 | | 41,870 | | 1,400 | | 43,278 | | | |
| Commodity contracts | 2 | | 16,456 | | 1,111 | | 17,569 | | | |
| Credit derivatives | — | | 7,564 | | 775 | | 8,339 | | | |
| Total trading derivatives—before netting and collateral | $ | 59 | | $ | 380,869 | | $ | 6,446 | | $ | 387,374 | | | |
| Netting agreements | | | | | $ | (308,431) | | |
| Netting of cash collateral received | | | | | (21,226) | | |
| Total trading derivatives—after netting and collateral | $ | 59 | | $ | 380,869 | | $ | 6,446 | | $ | 387,374 | | $ | (329,657) | | $ | 57,717 | |
| Investments | | | | | | |
| Mortgage-backed securities | | | | | | |
| U.S. government-sponsored agency guaranteed | $ | — | | $ | 29,640 | | $ | 75 | | $ | 29,715 | | $ | — | | $ | 29,715 | |
| Residential | — | | 307 | | 116 | | 423 | | — | | 423 | |
| Commercial | — | | 1 | | — | | 1 | | — | | 1 | |
| Total investment mortgage-backed securities | $ | — | | $ | 29,948 | | $ | 191 | | $ | 30,139 | | $ | — | | $ | 30,139 | |
| U.S. Treasury and federal agency securities | $ | 80,062 | | $ | 299 | | $ | — | | $ | 80,361 | | $ | — | | $ | 80,361 | |
| State and municipal | — | | 1,589 | | 542 | | 2,131 | | — | | 2,131 | |
| Foreign government | 60,133 | | 70,871 | | 194 | | 131,198 | | — | | 131,198 | |
| Corporate | 2,680 | | 2,370 | | 362 | | 5,412 | | — | | 5,412 | |
| Marketable equity securities | 159 | | 72 | | 27 | | 258 | | — | | 258 | |
| Asset-backed securities | — | | 938 | | — | | 938 | | — | | 938 | |
| Other debt securities | — | | 6,757 | | — | | 6,757 | | — | | 6,757 | |
Non-marketable equity securities(3) | — | | — | | 483 | | 483 | | — | | 483 | |
| Total investments | $ | 143,034 | | $ | 112,844 | | $ | 1,799 | | $ | 257,677 | | $ | — | | $ | 257,677 | |
Table continues on the next page.
| | | | | | | | | | | | | | | | | | | | |
| In millions of dollars at December 31, 2023 | Level 1 | Level 2 | Level 3 | Gross
inventory | Netting(1) | Net
balance |
| Loans | $ | — | $ | 7,167 | $ | 427 | $ | 7,594 | | $ | — | | $ | 7,594 | |
| Mortgage servicing rights | — | — | 691 | 691 | | — | | 691 | |
| | | | | | |
| | | | | | |
| | | | | | |
| Non-trading derivatives and other financial assets measured on a recurring basis | $ | 4,677 | $ | 8,321 | $ | 30 | $ | 13,028 | | $ | — | | $ | 13,028 | |
| Total assets | $ | 339,746 | $ | 1,121,860 | $ | 12,651 | $ | 1,474,257 | | $ | (577,452) | | $ | 896,805 | |
Total as a percentage of gross assets(3) | 23.0% | 76.1% | 0.9% | | | |
| Liabilities | | | | | | |
| Interest-bearing deposits | $ | — | $ | 2,411 | $ | 29 | $ | 2,440 | | $ | — | | $ | 2,440 | |
| Securities loaned and sold under agreements to repurchase | — | 228,048 | 390 | 228,438 | | (165,953) | | 62,485 | |
| Trading account liabilities | | | | | | |
| Securities sold, not yet purchased | 91,163 | 13,460 | 35 | 104,658 | | — | | 104,658 | |
| Other trading liabilities | — | 8 | — | 8 | | — | | 8 | |
| Total trading account liabilities | $ | 91,163 | $ | 13,468 | $ | 35 | $ | 104,666 | | $ | — | | $ | 104,666 | |
| Trading derivatives | | | | | | |
| Interest rate contracts | $ | 49 | $ | 149,914 | $ | 3,223 | $ | 153,186 | | | |
| Foreign exchange contracts | — | 156,474 | 727 | 157,201 | | | |
| Equity contracts | 18 | 44,894 | 3,034 | 47,946 | | | |
| Commodity contracts | — | 17,964 | 832 | 18,796 | | | |
| Credit derivatives | — | 7,234 | 848 | 8,082 | | | |
| Total trading derivatives—before netting and collateral | $ | 67 | $ | 376,480 | $ | 8,664 | $ | 385,211 | | | |
| Netting agreements | | | | | $ | (308,431) | | |
| Netting of cash collateral paid | | | | | (26,101) | | |
| Total trading derivatives—after netting and collateral | $ | 67 | $ | 376,480 | $ | 8,664 | $ | 385,211 | | $ | (334,532) | | $ | 50,679 | |
| Short-term borrowings | $ | — | $ | 6,064 | $ | 481 | $ | 6,545 | | $ | — | | $ | 6,545 | |
| Long-term debt | — | 77,958 | 38,380 | 116,338 | | — | | 116,338 | |
| | | | | | |
| | | | | | |
| | | | | | |
| Total non-trading derivatives and other financial liabilities measured on a recurring basis | $ | 4,298 | $ | 130 | $ | 6 | $ | 4,434 | | $ | — | | $ | 4,434 | |
| Total liabilities | $ | 95,528 | $ | 704,559 | $ | 47,985 | $ | 848,072 | | $ | (500,485) | | $ | 347,587 | |
Total as a percentage of gross liabilities(3) | 11.3 | % | 83.0 | % | 5.7 | % | | | |
(1)Represents netting of (i) the amounts due under securities purchased under agreements to resell and the amounts owed under securities sold under agreements to repurchase and (ii) derivative exposures covered by a qualifying master netting agreement and cash collateral offsetting.
(2)Amounts exclude $25 million of investments measured at NAV in accordance with ASU 2015-07, Fair Value Measurement (Topic 820): Disclosures for Investments in Certain Entities That Calculate Net Asset Value per Share (or Its Equivalent).
(3)Because the amount of the cash collateral paid/received has not been allocated to the Level 1, 2 and 3 subtotals, these percentages are calculated based on total assets and liabilities measured at fair value on a recurring basis, excluding the cash collateral paid/received on derivatives.
Fair Value Levels
| | | | | | | | | | | | | | | | | | | | |
| In millions of dollars at December 31, 2022 | Level 1 | Level 2 | Level 3 | Gross
inventory | Netting(1) | Net
balance |
| Assets | | | | | | |
| Securities borrowed and purchased under agreements to resell | $ | — | | $ | 350,145 | | $ | 149 | | $ | 350,294 | | $ | (110,767) | | $ | 239,527 | |
| Trading non-derivative assets | | | | | | |
| Trading mortgage-backed securities | | | | | | |
| U.S. government-sponsored agency guaranteed | — | | 34,878 | | 600 | | 35,478 | | — | | 35,478 | |
| Residential | 1 | | 1,821 | | 166 | | 1,988 | | — | | 1,988 | |
| Commercial | — | | 798 | | 145 | | 943 | | — | | 943 | |
| Total trading mortgage-backed securities | $ | 1 | | $ | 37,497 | | $ | 911 | | $ | 38,409 | | $ | — | | $ | 38,409 | |
| U.S. Treasury and federal agency securities | $ | 63,067 | | $ | 4,513 | | $ | 1 | | $ | 67,581 | | $ | — | | $ | 67,581 | |
| State and municipal | — | | 2,256 | | 7 | | 2,263 | | — | | 2,263 | |
| Foreign government | 38,383 | | 25,850 | | 119 | | 64,352 | | — | | 64,352 | |
| Corporate | 1,593 | | 11,955 | | 394 | | 13,942 | | — | | 13,942 | |
| Equity securities | 43,990 | | 10,179 | | 192 | | 54,361 | | — | | 54,361 | |
| Asset-backed securities | — | | 1,597 | | 668 | | 2,265 | | — | | 2,265 | |
Other trading assets(2) | 24 | | 14,963 | | 648 | | 15,635 | | — | | 15,635 | |
| Total trading non-derivative assets | $ | 147,058 | | $ | 108,810 | | $ | 2,940 | | $ | 258,808 | | $ | — | | $ | 258,808 | |
| Trading derivatives | | | | | | |
| Interest rate contracts | $ | 297 | | $ | 174,156 | | $ | 3,751 | | $ | 178,204 | | | |
| Foreign exchange contracts | — | | 186,897 | | 766 | | 187,663 | | | |
| Equity contracts | 20 | | 40,683 | | 1,704 | | 42,407 | | | |
| Commodity contracts | — | | 26,823 | | 1,501 | | 28,324 | | | |
| Credit derivatives | — | | 7,484 | | 905 | | 8,389 | | | |
| Total trading derivatives—before netting and collateral | $ | 317 | | $ | 436,043 | | $ | 8,627 | | $ | 444,987 | | | |
| Netting agreements | | | | | $ | (346,545) | | |
Netting of cash collateral received(3) | | | | | (23,136) | | |
| Total trading derivatives—after netting and collateral | $ | 317 | | $ | 436,043 | | $ | 8,627 | | $ | 444,987 | | $ | (369,681) | | $ | 75,306 | |
| Investments | | | | | | |
| Mortgage-backed securities | | | | | | |
| U.S. government-sponsored agency guaranteed | $ | — | | $ | 11,232 | | $ | 30 | | $ | 11,262 | | $ | — | | $ | 11,262 | |
| Residential | — | | 444 | | 41 | | 485 | | — | | 485 | |
| Commercial | — | | 2 | | — | | 2 | | — | | 2 | |
| Total investment mortgage-backed securities | $ | — | | $ | 11,678 | | $ | 71 | | $ | 11,749 | | $ | — | | $ | 11,749 | |
| U.S. Treasury and federal agency securities | $ | 91,851 | | $ | 439 | | $ | — | | $ | 92,290 | | $ | — | | $ | 92,290 | |
| State and municipal | — | | 1,637 | | 586 | | 2,223 | | — | | 2,223 | |
| Foreign government | 58,419 | | 74,250 | | 608 | | 133,277 | | — | | 133,277 | |
| Corporate | 2,230 | | 2,343 | | 343 | | 4,916 | | — | | 4,916 | |
| Marketable equity securities | 254 | | 165 | | 10 | | 429 | | — | | 429 | |
| Asset-backed securities | — | | 1,029 | | 1 | | 1,030 | | — | | 1,030 | |
| Other debt securities | — | | 4,194 | | — | | 4,194 | | — | | 4,194 | |
Non-marketable equity securities(4) | — | | 9 | | 430 | | 439 | | — | | 439 | |
| Total investments | $ | 152,754 | | $ | 95,744 | | $ | 2,049 | | $ | 250,547 | | $ | — | | $ | 250,547 | |
Table continues on the next page.
| | | | | | | | | | | | | | | | | | | | |
| In millions of dollars at December 31, 2022 | Level 1 | Level 2 | Level 3 | Gross
inventory | Netting(1) | Net
balance |
| Loans | $ | — | $ | 3,999 | $ | 1,361 | $ | 5,360 | | $ | — | | $ | 5,360 | |
| Mortgage servicing rights | — | — | 665 | 665 | | — | | 665 | |
| | | | | | |
| | | | | | |
| | | | | | |
| Non-trading derivatives and other financial assets measured on a recurring basis | $ | 4,310 | $ | 6,291 | $ | 57 | $ | 10,658 | | $ | — | | $ | 10,658 | |
| Total assets | $ | 304,439 | $ | 1,001,032 | $ | 15,848 | $ | 1,321,319 | | $ | (480,448) | | $ | 840,871 | |
Total as a percentage of gross assets(5) | 23.0% | 75.8% | 1.2% | | | |
| Liabilities | | | | | | |
| Interest-bearing deposits | $ | — | $ | 1,860 | $ | 15 | $ | 1,875 | | $ | — | | $ | 1,875 | |
| Securities loaned and sold under agreements to repurchase | — | 155,822 | 1,031 | 156,853 | | (85,967) | | 70,886 | |
| Trading account liabilities | | | | | | |
| Securities sold, not yet purchased | 97,559 | 13,111 | 50 | 110,720 | | — | | 110,720 | |
| Other trading liabilities | — | 8 | 3 | 11 | | — | | 11 | |
| Total trading account liabilities | $ | 97,559 | $ | 13,119 | $ | 53 | $ | 110,731 | | $ | — | | $ | 110,731 | |
| Trading derivatives | | | | | | |
| Interest rate contracts | $ | 175 | $ | 169,049 | $ | 3,396 | $ | 172,620 | | | |
| Foreign exchange contracts | — | 185,279 | 716 | 185,995 | | | |
| Equity contracts | 70 | 40,905 | 2,808 | 43,783 | | | |
| Commodity contracts | 2 | 25,093 | 1,223 | 26,318 | | | |
| Credit derivatives | — | 6,715 | 1,062 | 7,777 | | | |
| Total trading derivatives—before netting and collateral | $ | 247 | $ | 427,041 | $ | 9,205 | $ | 436,493 | | | |
| Netting agreements | | | | | $ | (346,545) | | |
Netting of cash collateral paid(3) | | | | | (30,032) | | |
| Total trading derivatives—after netting and collateral | $ | 247 | $ | 427,041 | $ | 9,205 | $ | 436,493 | | $ | (376,577) | | $ | 59,916 | |
| Short-term borrowings | $ | — | $ | 6,184 | $ | 38 | $ | 6,222 | | $ | — | | $ | 6,222 | |
| Long-term debt | — | 69,878 | 36,117 | 105,995 | | — | | 105,995 | |
| | | | | | |
| | | | | | |
| | | | | | |
| Total non-trading derivatives and other financial liabilities measured on a recurring basis | $ | 4,197 | $ | 240 | $ | 2 | $ | 4,439 | | $ | — | | $ | 4,439 | |
| Total liabilities | $ | 102,003 | $ | 674,144 | $ | 46,461 | $ | 822,608 | | $ | (462,544) | | $ | 360,064 | |
Total as a percentage of gross liabilities(5) | 12.4 | % | 82.0 | % | 5.6 | % | | | |
(1)Represents netting of (i) the amounts due under securities purchased under agreements to resell and the amounts owed under securities sold under agreements to repurchase and (ii) derivative exposures covered by a qualifying master netting agreement and cash collateral offsetting.
(2)Includes positions related to investments in unallocated precious metals, as discussed in Note 23. Also includes physical commodities accounted for at the lower of cost or fair value and unfunded credit products.
(3)Represents the netting of cash collateral paid and received by counterparties under enforceable credit support agreements. Substantially all netting of cash collateral received and paid is against OTC derivative assets and liabilities, respectively.
(4)Amounts exclude $27 million of investments measured at NAV in accordance with ASU 2015-07, Fair Value Measurement (Topic 820): Disclosures for Investments in Certain Entities That Calculate Net Asset Value per Share (or Its Equivalent).
(5)Because the amount of the cash collateral paid/received has not been allocated to the Level 1, 2 and 3 subtotals, these percentages are calculated based on total assets and liabilities measured at fair value on a recurring basis, excluding the cash collateral paid/received on derivatives.
Changes in Level 3 Fair Value Category
The following tables present the changes in the Level 3 fair value category for the three and six months ended June 30, 2023March 31, 2024 and 2022.2023. The gains and losses presented below include changes in the fair value related to both observable and unobservable inputs.
The Company often hedges positions with offsetting positions that are classified in a different level. For example,
the gains and losses for assets and liabilities in the Level 3 category presented in the tables below do not reflect the effect of offsetting losses and gains on hedging instruments that may be classified in the Level 1 or Level 2 categories. In addition, the Company hedges items classified in the Level 3 category with instruments also classified in Level 3 of the fair value hierarchy. The hedged items and related hedges are presented gross in the following tables:
Level 3 Fair Value Rollforward
| | | | | Net realized/unrealized gains (losses) incl. in(1) | Transfers | | | Unrealized
gains (losses)
still held(3) | | | Net realized/unrealized gains (losses) incl. in(1) | Transfers | | | | Unrealized
gains (losses)
still held(3) |
| In millions of dollars | In millions of dollars | Mar. 31, 2023 | Principal
transactions | Other(1)(2) | into
Level 3 | out of
Level 3 | Purchases | Issuances | Sales | Settlements | Jun. 30, 2023 | In millions of dollars | Dec. 31, 2023 | Principal
transactions | Other(1)(2) | into
Level 3 | out of
Level 3 | Purchases | Issuances | Sales | Settlements | Mar. 31, 2024 |
| Assets | Assets | | | |
| Securities borrowed and purchased under agreements to resell | Securities borrowed and purchased under agreements to resell | $ | 153 | | $ | (10) | | $ | — | | $ | — | | $ | (2) | | $ | — | | $ | — | | $ | — | | $ | (1) | | $ | 140 | | $ | (8) | |
| Securities borrowed and purchased under agreements to resell | |
| Securities borrowed and purchased under agreements to resell | |
| Trading non-derivative assets | Trading non-derivative assets | | | |
| Trading mortgage-backed securities | Trading mortgage-backed securities | | | |
| Trading mortgage-backed securities | |
| Trading mortgage-backed securities | |
| U.S. government-sponsored agency guaranteed | |
| U.S. government-sponsored agency guaranteed | |
| U.S. government-sponsored agency guaranteed | U.S. government-sponsored agency guaranteed | 658 | | (32) | | — | | 93 | | (124) | | 147 | | — | | (83) | | — | | 659 | | (24) | |
| Residential | Residential | 162 | | (2) | | — | | 35 | | (43) | | 39 | | — | | (46) | | — | | 145 | | (3) | |
| Commercial | Commercial | 163 | | (10) | | — | | 48 | | (18) | | 31 | | — | | (32) | | — | | 182 | | (7) | |
| Total trading mortgage-backed securities | Total trading mortgage-backed securities | $ | 983 | | $ | (44) | | $ | — | | $ | 176 | | $ | (185) | | $ | 217 | | $ | — | | $ | (161) | | $ | — | | $ | 986 | | $ | (34) | |
| U.S. Treasury and federal agency securities | U.S. Treasury and federal agency securities | $ | 1 | | $ | (1) | | $ | — | | $ | — | | $ | — | | $ | — | | $ | — | | $ | — | | $ | — | | $ | — | | $ | — | |
| State and municipal | State and municipal | 23 | | (1) | | — | | — | | — | | — | | — | | (19) | | — | | 3 | | — | |
| Foreign government | Foreign government | 53 | | (1) | | — | | 8 | | (2) | | 49 | | — | | (26) | | — | | 81 | | (1) | |
| Corporate | Corporate | 296 | | 46 | | — | | 196 | | (51) | | 256 | | — | | (162) | | — | | 581 | | 88 | |
| Marketable equity securities | Marketable equity securities | 225 | | 6 | | — | | 14 | | (2) | | 66 | | — | | (24) | | — | | 285 | | 5 | |
| Asset-backed securities | Asset-backed securities | 567 | | (1) | | — | | 74 | | (18) | | 197 | | — | | (280) | | — | | 539 | | (5) | |
| Other trading assets | Other trading assets | 1,094 | | 373 | | — | | 16 | | (74) | | 178 | | — | | (109) | | — | | 1,478 | | 378 | |
| Total trading non-derivative assets | Total trading non-derivative assets | $ | 3,242 | | $ | 377 | | $ | — | | $ | 484 | | $ | (332) | | $ | 963 | | $ | — | | $ | (781) | | $ | — | | $ | 3,953 | | $ | 431 | |
Trading derivatives, net(4) | Trading derivatives, net(4) | | | |
| Interest rate contracts | Interest rate contracts | $ | 260 | | $ | (1,550) | | $ | — | | $ | (167) | | $ | (669) | | $ | (17) | | $ | — | | $ | 13 | | $ | 168 | | $ | (1,962) | | $ | (1,486) | |
| Interest rate contracts | |
| Interest rate contracts | |
| Foreign exchange contracts | Foreign exchange contracts | 76 | | 503 | | — | | 121 | | 50 | | 27 | | — | | (42) | | (35) | | 700 | | 438 | |
| Equity contracts | Equity contracts | (1,582) | | (486) | | — | | (16) | | 572 | | (7) | | — | | (21) | | (23) | | (1,563) | | (494) | |
| Commodity contracts | Commodity contracts | 230 | | 188 | | — | | 74 | | (83) | | 9 | | — | | (9) | | (79) | | 330 | | 18 | |
| Credit derivatives | Credit derivatives | (21) | | (154) | | — | | (20) | | 36 | | — | | — | | — | | 4 | | (155) | | (215) | |
Total trading derivatives, net(4) | Total trading derivatives, net(4) | $ | (1,037) | | $ | (1,499) | | $ | — | | $ | (8) | | $ | (94) | | $ | 12 | | $ | — | | $ | (59) | | $ | 35 | | $ | (2,650) | | $ | (1,739) | |
Table continues on the next page.
| | | |
| | | | | Net realized/unrealized gains (losses) incl. in(1) | Transfers | | Unrealized
gains (losses)
still held(3) |
| In millions of dollars | In millions of dollars | Mar. 31, 2023 | Principal
transactions | Other(1)(2) | into
Level 3 | out of
Level 3 | Purchases | Issuances | Sales | Settlements | Jun. 30, 2023 |
| In millions of dollars | |
| In millions of dollars | |
| Investments | |
| Investments | |
| Investments | Investments | | | |
| Mortgage-backed securities | Mortgage-backed securities | | | |
| Mortgage-backed securities | |
| Mortgage-backed securities | |
| U.S. government-sponsored agency guaranteed | |
| U.S. government-sponsored agency guaranteed | |
| U.S. government-sponsored agency guaranteed | U.S. government-sponsored agency guaranteed | $ | 28 | | $ | — | | $ | 1 | | $ | — | | $ | — | | $ | 4 | | $ | — | | $ | (1) | | $ | — | | $ | 32 | | $ | (1) | |
| Residential | Residential | 25 | | — | | — | | — | | — | | — | | — | | — | | — | | 25 | | — | |
| Residential | |
| Residential | |
| Commercial | |
| Commercial | |
| Commercial | Commercial | — | | — | | — | | — | | — | | — | | — | | — | | — | | — | | — | |
| Total investment mortgage-backed securities | Total investment mortgage-backed securities | $ | 53 | | $ | — | | $ | 1 | | $ | — | | $ | — | | $ | 4 | | $ | — | | $ | (1) | | $ | — | | $ | 57 | | $ | (1) | |
| Total investment mortgage-backed securities | |
| Total investment mortgage-backed securities | |
| U.S. Treasury and federal agency securities | |
| U.S. Treasury and federal agency securities | |
| U.S. Treasury and federal agency securities | U.S. Treasury and federal agency securities | $ | 51 | | $ | — | | $ | — | | $ | — | | $ | — | | $ | — | | $ | — | | $ | (30) | | $ | — | | $ | 21 | | $ | — | |
| State and municipal | State and municipal | 521 | | — | | (8) | | — | | (2) | | — | | — | | (4) | | — | | 507 | | (8) | |
| State and municipal | |
| State and municipal | |
| Foreign government | |
| Foreign government | |
| Foreign government | Foreign government | 551 | | — | | 7 | | 15 | | (17) | | 363 | | — | | (505) | | — | | 414 | | 7 | |
| Corporate | Corporate | 291 | | — | | (4) | | — | | — | | 23 | | — | | (20) | | — | | 290 | | (4) | |
| Corporate | |
| Corporate | |
| Marketable equity securities | |
| Marketable equity securities | |
| Marketable equity securities | Marketable equity securities | 12 | | — | | 1 | | — | | — | | — | | — | | — | | — | | 13 | | (7) | |
| Asset-backed securities | Asset-backed securities | 1 | | — | | — | | — | | — | | — | | — | | — | | — | | 1 | | — | |
| Asset-backed securities | |
| Asset-backed securities | |
| Other debt securities | |
| Other debt securities | |
| Other debt securities | Other debt securities | 4 | | — | | 1 | | — | | (5) | | 57 | | — | | — | | — | | 57 | | — | |
| Non-marketable equity securities | Non-marketable equity securities | 409 | | — | | (14) | | — | | — | | 10 | | — | | (1) | | — | | 404 | | 5 | |
| Non-marketable equity securities | |
| Non-marketable equity securities | |
| Total investments | |
| Total investments | |
| Total investments | Total investments | $ | 1,893 | | $ | — | | $ | (16) | | $ | 15 | | $ | (24) | | $ | 457 | | $ | — | | $ | (561) | | $ | — | | $ | 1,764 | | $ | (8) | |
| Loans | Loans | $ | 640 | | $ | — | | $ | (281) | | $ | 2 | | $ | (119) | | $ | — | | $ | — | | $ | — | | $ | (1) | | $ | 241 | | $ | (146) | |
| Loans | |
| Loans | |
| Mortgage servicing rights | |
| Mortgage servicing rights | |
| Mortgage servicing rights | Mortgage servicing rights | 658 | | — | | 21 | | — | | — | | — | | 19 | | — | | (17) | | 681 | | 22 | |
| Other financial assets measured at fair value on a recurring basis | Other financial assets measured at fair value on a recurring basis | 52 | | — | | 1 | | — | | (1) | | 21 | | — | | — | | — | | 73 | | — | |
| Other financial assets measured at fair value on a recurring basis | |
| Other financial assets measured at fair value on a recurring basis | |
| Liabilities | |
| Liabilities | |
| Liabilities | Liabilities | | | |
| Interest-bearing deposits | Interest-bearing deposits | $ | 16 | | $ | (7) | | $ | — | | $ | — | | $ | — | | $ | — | | $ | 13 | | $ | — | | $ | (10) | | $ | 26 | | $ | (7) | |
| Interest-bearing deposits | |
| Interest-bearing deposits | |
| Securities loaned and sold under agreements to repurchase | |
| Securities loaned and sold under agreements to repurchase | |
| Securities loaned and sold under agreements to repurchase | Securities loaned and sold under agreements to repurchase | 809 | | 1 | | — | | — | | (24) | | 511 | | — | | — | | (668) | | 627 | | 1 | |
| Trading account liabilities | Trading account liabilities | | | |
| Trading account liabilities | |
| Trading account liabilities | |
| Securities sold, not yet purchased | |
| Securities sold, not yet purchased | |
| Securities sold, not yet purchased | Securities sold, not yet purchased | 72 | | 2 | | — | | 5 | | (15) | | 33 | | — | | — | | (31) | | 62 | | 4 | |
| Other trading liabilities | Other trading liabilities | 1 | | — | | — | | 3 | | — | | — | | — | | — | | — | | 4 | | (1) | |
| Other trading liabilities | |
| Other trading liabilities | |
| Short-term borrowings | |
| Short-term borrowings | |
| Short-term borrowings | Short-term borrowings | 281 | | 13 | | — | | 19 | | (11) | | — | | 21 | | — | | (1) | | 296 | | (4) | |
| Long-term debt | Long-term debt | 36,581 | | 893 | | — | | 2,130 | | (1,263) | | — | | 808 | | — | | (159) | | 37,204 | | 591 | |
| Long-term debt | |
| Long-term debt | |
| Other financial liabilities measured on a recurring basis | Other financial liabilities measured on a recurring basis | 20 | | — | | (1) | | — | | (1) | | — | | 3 | | — | | — | | 23 | | (1) | |
| Other financial liabilities measured on a recurring basis | |
| Other financial liabilities measured on a recurring basis | |
(1)Net realized/unrealized gains (losses) are presented as increase (decrease) to Level 3 assets, and as (increase) decrease to Level 3 liabilities. Changes in fair value of available-for-sale debt securities are recorded in AOCI, unless related to credit impairment, while gains and losses from sales are recorded in Realized gains (losses) from sales of investments in the Consolidated Statement of Income.
(2)Unrealized gains (losses) on MSRs are recorded in Other revenue in the Consolidated Statement of Income.
(3)Represents the amount of total gains or losses for the period, included in earnings (and AOCI for changes in fair value of available-for-sale debt securities and DVA on fair value option liabilities), attributable to the change in fair value relating to assets and liabilities classified as Level 3 that are still held at June 30, 2023.March 31, 2024.
(4)Total Level 3 trading derivative assets and liabilities have been netted in these tables for presentation purposes only.
| | | | | Net realized/unrealized gains (losses) incl. in(1) | Transfers | | | Unrealized
gains (losses)
still held(3) | | | Net realized/unrealized gains (losses) incl. in(1) | Transfers | | | | Unrealized
gains (losses)
still held(3) |
| In millions of dollars | In millions of dollars | Dec. 31, 2022 | Principal
transactions | Other(1)(2) | into
Level 3 | out of
Level 3 | Purchases | Issuances | Sales | Settlements | Jun. 30, 2023 | In millions of dollars | Dec. 31, 2022 | Principal
transactions | Other(1)(2) | into
Level 3 | out of
Level 3 | Purchases | Issuances | Sales | Settlements | Mar. 31, 2023 |
| Assets | Assets | | | |
| Securities borrowed and purchased under agreements to resell | Securities borrowed and purchased under agreements to resell | $ | 149 | | $ | 3 | | $ | — | | $ | — | | $ | (2) | | $ | 137 | | $ | — | | $ | — | | $ | (147) | | $ | 140 | | $ | 5 | |
| Securities borrowed and purchased under agreements to resell | |
| Securities borrowed and purchased under agreements to resell | |
| Trading non-derivative assets | Trading non-derivative assets | | | |
| Trading mortgage-backed securities | Trading mortgage-backed securities | | | |
| Trading mortgage-backed securities | |
| Trading mortgage-backed securities | |
| U.S. government-sponsored agency guaranteed | |
| U.S. government-sponsored agency guaranteed | |
| U.S. government-sponsored agency guaranteed | U.S. government-sponsored agency guaranteed | 600 | | (10) | | — | | 185 | | (266) | | 370 | | — | | (220) | | — | | 659 | | (35) | |
| Residential | Residential | 166 | | (1) | | — | | 61 | | (62) | | 100 | | — | | (119) | | — | | 145 | | (13) | |
| Commercial | Commercial | 145 | | (15) | | — | | 104 | | (31) | | 50 | | — | | (71) | | — | | 182 | | (13) | |
| Total trading mortgage-backed securities | Total trading mortgage-backed securities | $ | 911 | | $ | (26) | | $ | — | | $ | 350 | | $ | (359) | | $ | 520 | | $ | — | | $ | (410) | | $ | — | | $ | 986 | | $ | (61) | |
| U.S. Treasury and federal agency securities | U.S. Treasury and federal agency securities | $ | 1 | | $ | (1) | | $ | — | | $ | — | | $ | — | | $ | — | | $ | — | | $ | — | | $ | — | | $ | — | | $ | — | |
| State and municipal | State and municipal | 7 | | (3) | | — | | 19 | | — | | — | | — | | (20) | | — | | 3 | | — | |
| Foreign government | Foreign government | 119 | | 6 | | — | | 8 | | (27) | | 61 | | — | | (86) | | — | | 81 | | 5 | |
| Corporate | Corporate | 394 | | 76 | | — | | 210 | | (178) | | 352 | | — | | (273) | | — | | 581 | | 153 | |
| Marketable equity securities | Marketable equity securities | 192 | | 9 | | — | | 26 | | (8) | | 97 | | — | | (31) | | — | | 285 | | 10 | |
| Asset-backed securities | Asset-backed securities | 668 | | 14 | | — | | 79 | | (81) | | 318 | | — | | (459) | | — | | 539 | | — | |
| Other trading assets | Other trading assets | 648 | | 401 | | — | | 261 | | (76) | | 468 | | — | | (224) | | — | | 1,478 | | 411 | |
| Total trading non-derivative assets | Total trading non-derivative assets | $ | 2,940 | | $ | 476 | | $ | — | | $ | 953 | | $ | (729) | | $ | 1,816 | | $ | — | | $ | (1,503) | | $ | — | | $ | 3,953 | | $ | 518 | |
Trading derivatives, net(4) | Trading derivatives, net(4) | | | |
| Interest rate contracts | Interest rate contracts | $ | 355 | | $ | (1,689) | | $ | — | | $ | (202) | | $ | (659) | | $ | (13) | | $ | — | | $ | 13 | | $ | 233 | | $ | (1,962) | | $ | (1,713) | |
| Interest rate contracts | |
| Interest rate contracts | |
| Foreign exchange contracts | Foreign exchange contracts | 50 | | 546 | | — | | 104 | | 48 | | 102 | | — | | (81) | | (69) | | 700 | | 497 | |
| Equity contracts | Equity contracts | (1,104) | | (878) | | — | | (67) | | 806 | | (253) | | — | | (44) | | (23) | | (1,563) | | (624) | |
| Commodity contracts | Commodity contracts | 278 | | (137) | | — | | 174 | | 240 | | (58) | | — | | (12) | | (155) | | 330 | | (148) | |
| Credit derivatives | Credit derivatives | (157) | | (146) | | — | | (3) | | 136 | | 2 | | — | | — | | 13 | | (155) | | (203) | |
Total trading derivatives, net(4) | Total trading derivatives, net(4) | $ | (578) | | $ | (2,304) | | $ | — | | $ | 6 | | $ | 571 | | $ | (220) | | $ | — | | $ | (124) | | $ | (1) | | $ | (2,650) | | $ | (2,191) | |
Table continues on the next page.
| | | | | Net realized/unrealized gains (losses) incl. in(1) | Transfers | | Unrealized
gains (losses)
still held(3) | | | Net realized/unrealized gains (losses) incl. in(1) | Transfers | | Unrealized
gains (losses)
still held(3) |
| In millions of dollars | In millions of dollars | Dec. 31, 2022 | Principal
transactions | Other(1)(2) | into
Level 3 | out of
Level 3 | Purchases | Issuances | Sales | Settlements | Jun. 30, 2023 | In millions of dollars | Dec. 31, 2022 | Principal
transactions | Other(1)(2) | into
Level 3 | out of
Level 3 | Purchases | Issuances | Sales | Settlements | Mar. 31, 2023 |
| Investments | Investments | | | |
| Mortgage-backed securities | Mortgage-backed securities | | | |
| Mortgage-backed securities | |
| Mortgage-backed securities | |
| U.S. government-sponsored agency guaranteed | |
| U.S. government-sponsored agency guaranteed | |
| U.S. government-sponsored agency guaranteed | U.S. government-sponsored agency guaranteed | $ | 30 | | $ | — | | $ | (1) | | $ | — | | $ | — | | $ | 4 | | $ | — | | $ | (1) | | $ | — | | $ | 32 | | $ | (4) | |
| Residential | Residential | 41 | | — | | — | | — | | — | | — | | — | | (16) | | — | | 25 | | — | |
| Commercial | — | | — | | — | | — | | — | | — | | — | | — | | — | | — | | — | |
| | Total investment mortgage-backed securities | |
| Total investment mortgage-backed securities | |
| Total investment mortgage-backed securities | Total investment mortgage-backed securities | $ | 71 | | $ | — | | $ | (1) | | $ | — | | $ | — | | $ | 4 | | $ | — | | $ | (17) | | $ | — | | $ | 57 | | $ | (4) | |
| U.S. Treasury and federal agency securities | U.S. Treasury and federal agency securities | $ | — | | $ | — | | $ | — | | $ | — | | $ | — | | $ | 51 | | $ | — | | $ | (30) | | $ | — | | $ | 21 | | $ | — | |
| State and municipal | State and municipal | 586 | | — | | 9 | | 1 | | (77) | | 1 | | — | | (13) | | — | | 507 | | 5 | |
| Foreign government | Foreign government | 608 | | — | | 5 | | 25 | | (18) | | 523 | | — | | (729) | | — | | 414 | | 8 | |
| Corporate | Corporate | 343 | | — | | (1) | | — | | (61) | | 81 | | — | | (72) | | — | | 290 | | (4) | |
| Marketable equity securities | Marketable equity securities | 10 | | — | | 3 | | — | | — | | — | | — | | — | | — | | 13 | | — | |
| Asset-backed securities | Asset-backed securities | 1 | | — | | — | | — | | — | | — | | — | | — | | — | | 1 | | — | |
| | Other debt securities | |
| Other debt securities | |
| Other debt securities | Other debt securities | — | | — | | — | | — | | (5) | | 62 | | — | | — | | — | | 57 | | — | |
| Non-marketable equity securities | Non-marketable equity securities | 430 | | — | | (18) | | 2 | | — | | 16 | | — | | (26) | | — | | 404 | | 5 | |
| Total investments | Total investments | $ | 2,049 | | $ | — | | $ | (3) | | $ | 28 | | $ | (161) | | $ | 738 | | $ | — | | $ | (887) | | $ | — | | $ | 1,764 | | $ | 10 | |
| Loans | Loans | $ | 1,361 | | $ | — | | $ | (264) | | $ | 2 | | $ | (309) | | $ | — | | $ | 106 | | $ | — | | $ | (655) | | $ | 241 | | $ | (133) | |
| Mortgage servicing rights | Mortgage servicing rights | 665 | | — | | 18 | | — | | — | | — | | 31 | | — | | (33) | | 681 | | 20 | |
| Other financial assets measured at fair value on a recurring basis | Other financial assets measured at fair value on a recurring basis | 57 | | — | | (2) | | — | | (2) | | 22 | | — | | (2) | | — | | 73 | | — | |
| Liabilities | Liabilities | | | |
| Interest-bearing deposits | Interest-bearing deposits | $ | 15 | | $ | (7) | | $ | (2) | | $ | — | | $ | (1) | | $ | — | | $ | 13 | | $ | — | | $ | (10) | | $ | 26 | | $ | (7) | |
| Interest-bearing deposits | |
| Interest-bearing deposits | |
| Securities loaned and sold under agreements to repurchase | Securities loaned and sold under agreements to repurchase | 1,031 | | (6) | | — | | — | | (24) | | 1,335 | | — | | — | | (1,721) | | 627 | | — | |
| Trading account liabilities | Trading account liabilities | | | |
| Securities sold, not yet purchased | |
| Securities sold, not yet purchased | |
| Securities sold, not yet purchased | Securities sold, not yet purchased | 50 | | (13) | | — | | 11 | | (31) | | 64 | | — | | — | | (45) | | 62 | | 6 | |
| Other trading liabilities | Other trading liabilities | 3 | | 2 | | — | | 3 | | — | | — | | — | | — | | — | | 4 | | — | |
| Short-term borrowings | Short-term borrowings | 38 | | 40 | | — | | 19 | | (16) | | — | | 297 | | — | | (2) | | 296 | | (9) | |
| Long-term debt | Long-term debt | 36,117 | | (227) | | — | | 3,228 | | (6,106) | | — | | 4,344 | | — | | (606) | | 37,204 | | 964 | |
| Other financial liabilities measured on a recurring basis | Other financial liabilities measured on a recurring basis | 2 | | — | | 1 | | — | | (1) | | — | | 23 | | — | | — | | 23 | | (1) | |
|
(1)Net realized/unrealized gains (losses) are presented as increase (decrease) to Level 3 assets, and as (increase) decrease to Level 3 liabilities. Changes in fair value of available-for-sale debt securities are recorded in AOCI, unless related to credit impairment, while gains and losses from sales are recorded in Realized gains (losses) from sales of investments in the Consolidated Statement of Income.
(2)Unrealized gains (losses) on MSRs are recorded in Other revenue in the Consolidated Statement of Income.
(3)Represents the amount of total gains or losses for the period, included in earnings (and AOCI for changes in fair value of available-for-sale debt securities and DVA on fair value option liabilities), attributable to the change in fair value relating to assets and liabilities classified as Level 3 that are still held at June 30,March 31, 2023.
(4)Total Level 3 trading derivative assets and liabilities have been netted in these tables for presentation purposes only.
| | | | | | | | | | | | | | | | | | | | | | | | | | | | | | | | | | | |
| | | Net realized/unrealized gains (losses) incl. in(1) | Transfers | | | | | | Unrealized
gains (losses)
still held(3) |
| In millions of dollars | Mar. 31, 2022 | Principal
transactions | Other(1)(2) | into
Level 3 | out of
Level 3 | Purchases | Issuances | Sales | Settlements | Jun. 30, 2022 |
| Assets | | | | | | | | | | | |
| Securities borrowed and purchased under agreements to resell | $ | 202 | | $ | (12) | | $ | — | | $ | — | | $ | — | | $ | 36 | | $ | — | | $ | — | | $ | (43) | | $ | 183 | | $ | (10) | |
| Trading non-derivative assets | | | | | | | | | | | |
| Trading mortgage-backed securities | | | | | | | | | | | |
| U.S. government-sponsored agency guaranteed | 498 | | (15) | | — | | 80 | | (89) | | 318 | | — | | (84) | | — | | 708 | | (19) | |
| Residential | 118 | | — | | — | | 28 | | (11) | | 47 | | — | | (29) | | — | | 153 | | (4) | |
| Commercial | 52 | | (3) | | — | | 96 | | (8) | | 4 | | — | | (3) | | — | | 138 | | (3) | |
| Total trading mortgage-backed securities | $ | 668 | | $ | (18) | | $ | — | | $ | 204 | | $ | (108) | | $ | 369 | | $ | — | | $ | (116) | | $ | — | | $ | 999 | | $ | (26) | |
| U.S. Treasury and federal agency securities | $ | 2 | | $ | — | | $ | — | | $ | — | | $ | (1) | | $ | — | | $ | — | | $ | — | | $ | — | | $ | 1 | | $ | — | |
| State and municipal | 6 | | 4 | | — | | 71 | | — | | — | | — | | (1) | | — | | 80 | | (3) | |
| Foreign government | 94 | | (27) | | — | | 249 | | (1) | | 57 | | — | | (8) | | — | | 364 | | (12) | |
| Corporate | 1,013 | | 59 | | — | | 120 | | (244) | | 181 | | — | | (592) | | — | | 537 | | 38 | |
| Marketable equity securities | 199 | | (9) | | — | | 14 | | (61) | | 58 | | — | | (68) | | — | | 133 | | (23) | |
| Asset-backed securities | 466 | | (24) | | — | | 82 | | (100) | | 262 | | — | | (132) | | — | | 554 | | (26) | |
| Other trading assets | 492 | | 79 | | — | | 305 | | (30) | | 117 | | 6 | | (149) | | (4) | | 816 | | 54 | |
| Total trading non-derivative assets | $ | 2,940 | | $ | 64 | | $ | — | | $ | 1,045 | | $ | (545) | | $ | 1,044 | | $ | 6 | | $ | (1,066) | | $ | (4) | | $ | 3,484 | | $ | 2 | |
Trading derivatives, net(4) | | | | | | | | | | | |
| Interest rate contracts | $ | 779 | | $ | 434 | | $ | — | | $ | 141 | | $ | (272) | | $ | 7 | | $ | 6 | | $ | (6) | | $ | (208) | | $ | 881 | | $ | 473 | |
| Foreign exchange contracts | (131) | | 769 | | — | | 34 | | (50) | | 73 | | 20 | | (547) | | (12) | | 156 | | 126 | |
| Equity contracts | (1,564) | | 1,189 | | — | | (60) | | 232 | | 220 | | — | | (91) | | (27) | | (101) | | 1,182 | |
| Commodity contracts | 217 | | 208 | | — | | (74) | | 84 | | 67 | | — | | (98) | | (149) | | 255 | | 246 | |
| Credit derivatives | (4) | | 6 | | — | | (97) | | (164) | | — | | — | | — | | (90) | | (349) | | (26) | |
Total trading derivatives, net(4) | $ | (703) | | $ | 2,606 | | $ | — | | $ | (56) | | $ | (170) | | $ | 367 | | $ | 26 | | $ | (742) | | $ | (486) | | $ | 842 | | $ | 2,001 | |
Table continues on the next page.
| | | | | | | | | | | | | | | | | | | | | | | | | | | | | | | | | | | |
| | | Net realized/unrealized gains (losses) incl. in(1) | Transfers | | | | | | Unrealized
gains (losses)
still held(3) |
| In millions of dollars | Mar. 31, 2022 | Principal
transactions | Other(1)(2) | into
Level 3 | out of
Level 3 | Purchases | Issuances | Sales | Settlements | Jun. 30, 2022 |
| Investments | | | | | | | | | | | |
| Mortgage-backed securities | | | | | | | | | | | |
| U.S. government-sponsored agency guaranteed | $ | 46 | | $ | — | | $ | (2) | | $ | — | | $ | (10) | | $ | — | | $ | — | | $ | (6) | | $ | — | | $ | 28 | | $ | (2) | |
| Residential | 44 | | — | | (4) | | — | | — | | — | | — | | — | | — | | 40 | | (4) | |
| | | | | | | | | | | |
| Total investment mortgage-backed securities | $ | 90 | | $ | — | | $ | (6) | | $ | — | | $ | (10) | | $ | — | | $ | — | | $ | (6) | | $ | — | | $ | 68 | | $ | (6) | |
| U.S. Treasury and federal agency securities | $ | 1 | | $ | — | | $ | (1) | | $ | — | | $ | — | | $ | — | | $ | — | | $ | — | | $ | — | | $ | — | | $ | — | |
| State and municipal | 705 | | — | | (34) | | — | | (131) | | 1 | | — | | (2) | | — | | 539 | | (14) | |
| Foreign government | 1,029 | | — | | (15) | | — | | (54) | | 202 | | — | | (161) | | — | | 1,001 | | (16) | |
| Corporate | 237 | | — | | (3) | | 100 | | — | | — | | — | | — | | — | | 334 | | (1) | |
| Marketable equity securities | 16 | | — | | (6) | | — | | — | | — | | — | | — | | — | | 10 | | (7) | |
| Asset-backed securities | 2 | | — | | (1) | | — | | — | | — | | — | | — | | — | | 1 | | — | |
| | | | | | | | | | | |
| Non-marketable equity securities | 298 | | — | | 2 | | — | | — | | 20 | | — | | (10) | | — | | 310 | | (1) | |
| Total investments | $ | 2,378 | | $ | — | | $ | (64) | | $ | 100 | | $ | (195) | | $ | 223 | | $ | — | | $ | (179) | | $ | — | | $ | 2,263 | | $ | (45) | |
| Loans | $ | 622 | | $ | — | | $ | (105) | | $ | 1 | | $ | (193) | | $ | — | | $ | 1 | | $ | — | | $ | (1) | | $ | 325 | | $ | (7) | |
| Mortgage servicing rights | 520 | | — | | 59 | | — | | — | | — | | 35 | | — | | (14) | | 600 | | 59 | |
| Other financial assets measured at fair value on a recurring basis | 68 | | — | | 4 | | 7 | | (12) | | 13 | | 15 | | — | | (32) | | 63 | | 7 | |
| Liabilities | | | | | | | | | | | |
| Interest-bearing deposits | $ | 191 | | $ | — | | $ | 7 | | $ | — | | $ | (122) | | $ | — | | $ | 17 | | $ | — | | $ | (61) | | $ | 18 | | $ | — | |
| Securities loaned and sold under agreements to repurchase | 612 | | 24 | | — | | — | | (3) | | 16 | | — | | — | | (8) | | 593 | | 10 | |
| Trading account liabilities | | | | | | | | | | | |
| Securities sold, not yet purchased | 38 | | (8) | | — | | 10 | | (4) | | 30 | | — | | 1 | | (11) | | 72 | | (12) | |
| | | | | | | | | | | |
| Short-term borrowings | 36 | | 1 | | — | | 12 | | (12) | | — | | 69 | | — | | (23) | | 81 | | 2 | |
| Long-term debt | 27,432 | | 4,719 | | — | | 3,335 | | (2,634) | | — | | 6,527 | | — | | (163) | | 29,778 | | 4,232 | |
| | | | | | | | | | | |
| | | | | | | | | | | |
(1)Net realized/unrealized gains (losses) are presented as increase (decrease) to Level 3 assets, and as (increase) decrease to Level 3 liabilities. Changes in fair value of available-for-sale debt securities are recorded in AOCI, unless related to credit impairment, while gains and losses from sales are recorded in Realized gains (losses) from sales of investments in the Consolidated Statement of Income.
(2)Unrealized gains (losses) on MSRs are recorded in Other revenue in the Consolidated Statement of Income.
(3)Represents the amount of total gains or losses for the period, included in earnings (and AOCI for changes in fair value of available-for-sale debt securities and DVA on fair value option liabilities), attributable to the change in fair value relating to assets and liabilities classified as Level 3 that are still held at June 30, 2022.
(4)Total Level 3 derivative assets and liabilities have been netted in these tables for presentation purposes only.
| | | | | | | | | | | | | | | | | | | | | | | | | | | | | | | | | | | |
| | | Net realized/unrealized gains (losses) incl. in(1) | Transfers | | | | | | Unrealized
gains (losses)
still held(3) |
| In millions of dollars | Dec. 31, 2021 | Principal
transactions | Other(1)(2) | into
Level 3 | out of
Level 3 | Purchases | Issuances | Sales | Settlements | Jun. 30, 2022 |
| Assets | | | | | | | | | | | |
| Securities borrowed and purchased under agreements to resell | $ | 231 | | $ | (1) | | $ | — | | $ | — | | $ | — | | $ | 124 | | $ | — | | $ | — | | $ | (171) | | $ | 183 | | $ | (7) | |
| Trading non-derivative assets | | | | | | | | | | | |
| Trading mortgage-backed securities | | | | | | | | | | | |
| U.S. government-sponsored agency guaranteed | 496 | | (13) | | — | | 127 | | (158) | | 484 | | — | | (228) | | — | | 708 | | (21) | |
| Residential | 104 | | — | | — | | 61 | | (32) | | 85 | | — | | (65) | | — | | 153 | | (5) | |
| Commercial | 81 | | (5) | | — | | 97 | | (34) | | 9 | | — | | (10) | | — | | 138 | | (2) | |
| Total trading mortgage-backed securities | $ | 681 | | $ | (18) | | $ | — | | $ | 285 | | $ | (224) | | $ | 578 | | $ | — | | $ | (303) | | $ | — | | $ | 999 | | $ | (28) | |
| U.S. Treasury and federal agency securities | $ | 4 | | $ | (4) | | $ | — | | $ | 2 | | $ | (1) | | $ | — | | $ | — | | $ | — | | $ | — | | $ | 1 | | $ | — | |
| State and municipal | 37 | | 5 | | — | | 71 | | (20) | | 1 | | — | | (14) | | — | | 80 | | (5) | |
| Foreign government | 23 | | (26) | | — | | 299 | | (1) | | 87 | | — | | (18) | | — | | 364 | | (18) | |
| Corporate | 412 | | 68 | | — | | 262 | | (278) | | 828 | | — | | (755) | | — | | 537 | | 18 | |
| Marketable equity securities | 174 | | (14) | | — | | 63 | | (87) | | 108 | | — | | (111) | | — | | 133 | | (40) | |
| Asset-backed securities | 613 | | (19) | | — | | 140 | | (167) | | 393 | | — | | (406) | | — | | 554 | | (45) | |
| Other trading assets | 576 | | 126 | | — | | 333 | | (92) | | 366 | | 16 | | (501) | | (8) | | 816 | | 75 | |
| Total trading non-derivative assets | $ | 2,520 | | $ | 118 | | $ | — | | $ | 1,455 | | $ | (870) | | $ | 2,361 | | $ | 16 | | $ | (2,108) | | $ | (8) | | $ | 3,484 | | $ | (43) | |
Trading derivatives, net(4) | | | | | | | | | | | |
| Interest rate contracts | $ | 1,726 | | $ | 600 | | $ | — | | $ | 73 | | $ | (803) | | $ | 9 | | $ | 6 | | $ | (6) | | $ | (724) | | $ | 881 | | $ | 650 | |
| Foreign exchange contracts | (89) | | 1,164 | | — | | (475) | | (6) | | 175 | | 20 | | (611) | | (22) | | 156 | | 235 | |
| Equity contracts | (2,140) | | 1,997 | | — | | (73) | | 207 | | 405 | | — | | (316) | | (181) | | (101) | | 1,634 | |
| Commodity contracts | 422 | | 622 | | — | | (45) | | (409) | | 120 | | — | | (142) | | (313) | | 255 | | 410 | |
| Credit derivatives | (31) | | (57) | | — | | (65) | | (151) | | — | | — | | (1) | | (44) | | (349) | | (95) | |
Total trading derivatives, net(4) | $ | (112) | | $ | 4,326 | | $ | — | | $ | (585) | | $ | (1,162) | | $ | 709 | | $ | 26 | | $ | (1,076) | | $ | (1,284) | | $ | 842 | | $ | 2,834 | |
Table continues on the next page.
| | | | | | | | | | | | | | | | | | | | | | | | | | | | | | | | | | | |
| | | Net realized/unrealized gains (losses) incl. in(1) | Transfers | | | | | | Unrealized
gains (losses)
still held(3) |
| In millions of dollars | Dec. 31, 2021 | Principal
transactions | Other(1)(2) | into
Level 3 | out of
Level 3 | Purchases | Issuances | Sales | Settlements | Jun. 30, 2022 |
| Investments | | | | | | | | | | | |
| Mortgage-backed securities | | | | | | | | | | | |
| U.S. government-sponsored agency guaranteed | $ | 51 | | $ | — | | $ | (9) | | $ | 1 | | $ | (10) | | $ | 4 | | $ | — | | $ | (9) | | $ | — | | $ | 28 | | $ | (4) | |
| Residential | 94 | | — | | (6) | | — | | (39) | | — | | — | | (9) | | — | | 40 | | (5) | |
| | | | | | | | | | | |
| Total investment mortgage-backed securities | $ | 145 | | $ | — | | $ | (15) | | $ | 1 | | $ | (49) | | $ | 4 | | $ | — | | $ | (18) | | $ | — | | $ | 68 | | $ | (9) | |
| U.S. Treasury and federal agency securities | $ | 1 | | $ | — | | $ | (1) | | $ | — | | $ | — | | $ | — | | $ | — | | $ | — | | $ | — | | $ | — | | $ | — | |
| State and municipal | 772 | | — | | (78) | | — | | (142) | | 1 | | — | | (14) | | — | | 539 | | (47) | |
| Foreign government | 786 | | — | | (39) | | 250 | | (113) | | 385 | | — | | (268) | | — | | 1,001 | | (19) | |
| Corporate | 188 | | — | | (7) | | 153 | | — | | — | | — | | — | | — | | 334 | | (2) | |
| Marketable equity securities | 16 | | — | | (6) | | — | | — | | — | | — | | — | | — | | 10 | | (7) | |
| Asset-backed securities | 3 | | — | | 11 | | — | | — | | — | | — | | (13) | | — | | 1 | | — | |
| | | | | | | | | | | |
| Non-marketable equity securities | 316 | | — | | (12) | | 11 | | — | | 20 | | — | | (25) | | — | | 310 | | (1) | |
| Total investments | $ | 2,227 | | $ | — | | $ | (147) | | $ | 415 | | $ | (304) | | $ | 410 | | $ | — | | $ | (338) | | $ | — | | $ | 2,263 | | $ | (85) | |
| Loans | $ | 711 | | $ | — | | $ | (190) | | $ | 1 | | $ | (195) | | $ | — | | $ | 1 | | $ | — | | $ | (3) | | $ | 325 | | $ | 166 | |
| Mortgage servicing rights | 404 | | — | | 158 | | — | | — | | — | | 69 | | — | | (31) | | 600 | | 157 | |
| Other financial assets measured at fair value on a recurring basis | 73 | | — | | 7 | | 7 | | (16) | | 14 | | 40 | | (1) | | (61) | | 63 | | 48 | |
| Liabilities | | | | | | | | | | | |
| Interest-bearing deposits | $ | 183 | | $ | — | | $ | 3 | | $ | 7 | | $ | (122) | | $ | — | | $ | 18 | | $ | — | | $ | (65) | | $ | 18 | | $ | — | |
| Securities loaned and sold under agreements to repurchase | 643 | | 50 | | — | | — | | (3) | | 16 | | — | | — | | (13) | | 593 | | 28 | |
| Trading account liabilities | | | | | | | | | | | |
| Securities sold, not yet purchased | 65 | | 21 | | — | | 35 | | (19) | | 83 | | — | | 1 | | (72) | | 72 | | (2) | |
| | | | | | | | | | | |
| Short-term borrowings | 105 | | 89 | | — | | 40 | | (21) | | — | | 76 | | — | | (30) | | 81 | | 1 | |
| Long-term debt | 25,509 | | 8,245 | | — | | 6,743 | | (3,507) | | — | | 9,699 | | — | | (421) | | 29,778 | | (4,197) | |
| Other financial liabilities measured on a recurring basis | 1 | | — | | 1 | | — | | — | | — | | — | | — | | — | | — | | — | |
| | | | | | | | | | | |
(1)Net realized/unrealized gains (losses) are presented as increase (decrease) to Level 3 assets, and as (increase) decrease to Level 3 liabilities. Changes in fair value of available-for-sale debt securities are recorded in AOCI, unless related to credit impairment, while gains and losses from sales are recorded in Realized gains (losses) from sales of investments in the Consolidated Statement of Income.
(2)Unrealized gains (losses) on MSRs are recorded in Other revenue in the Consolidated Statement of Income.
(3)Represents the amount of total gains or losses for the period, included in earnings (and AOCI for changes in fair value of available-for-sale debt securities and DVA on fair value option liabilities), attributable to the change in fair value relating to assets and liabilities classified as Level 3 that are still held at June 30, 2022.
(4)Total Level 3 derivative assets and liabilities have been netted in these tables for presentation purposes only.
Level 3 Fair Value Transfers
The following were the significant Level 3 transfers for the period December 31, 20222023 to June 30, 2023:March 31, 2024:
•During the three and six months ended June 30, 2023, transfersTransfers of Long-term debt were $2.1 billion and $3.2$1.4 billion from Level 2 to Level 3, respectively.3. Of the $3.2$1.4 billion transfer, approximately $2.9$0.9 billion related to interest rate option volatility inputs becoming unobservable and/or significant relative to their overall valuation, and $0.3$0.4 billion related to equity and credit derivative inputs (in addition to other volatility inputs, e.g., interest rate volatility inputs) becoming unobservable and/or significant to their overall valuation. In other instances, market changes have resulted in some inputs becoming more observable, and some unobservable inputs becoming less significant to the overall valuation of the instruments (e.g., when an option becomes deep-in or deep-out of the money). This has primarily resulted in $1.3 billion and $6.1$0.8 billion of certain structured long-term debt products being transferred from Level 3 to Level 2 during the three and six months ended June 30, 2023, respectively.March 31, 2024.
The following were the significant Level 3 transfers for the period December 31, 20212022 to June 30, 2022:March 31, 2023:
•During the three and six months ended June 30, 2022, transfersTransfers of Long-term debt were $3.3$1.1 billion and $6.7 billion, respectively, from Level 2 to Level 3. Of the $6.7$1.1 billion transfer, in the six months ended June 30, 2022, approximately $4.5$1.0 billion related to interest rate option volatility inputs becoming unobservable and/or significant relative to their overall valuation, and $2.2$0.1 billion related to equity and credit derivative inputs (in addition to other volatility inputs, e.g., interest rate volatility inputs) becoming unobservable and/or significant to their overall valuation. In other instances, market changes have resulted in some inputs becoming more observable, and some unobservable inputs becoming less significant to the overall valuation of the instruments (e.g., when an option becomes deep-in or deep-out of the money). This has primarily resulted in $2.6 billion and $3.5$4.8 billion of certain structured long-term debt products being transferred from Level 3 to Level 2 during the three and six months ended June 30, 2022, respectively.March 31, 2023.
Valuation Techniques and Inputs for Level 3 Fair Value Measurements
The following tables present the valuation techniques covering the majority of Level 3 inventory and the most significant unobservable inputs used in Level 3 fair value measurements.
Differences between this table and amounts presented in the Level 3 Fair Value Rollforward table represent individually immaterial items that have been measured using a variety of valuation techniques other than those listed.
| | As of June 30, 2023 | Fair value(1) (in millions) | Methodology | Input | Low(2)(3) | High(2)(3) | Weighted average(4) |
| As of March 31, 2024 | | As of March 31, 2024 | Fair value(1) (in millions) | Methodology | Input | Low(2)(3) | High(2)(3) | Weighted average(4) |
| Assets | Assets | | |
| Securities borrowed and purchased under agreements to resell | Securities borrowed and purchased under agreements to resell | $ | 140 | | Model-based | Interest rate | 1.23 | % | 1.23 | % | 1.23 | % |
| Credit spread | 15 bps |
| Securities borrowed and purchased under agreements to resell | |
| Securities borrowed and purchased under agreements to resell | | $ | 132 | | Model-based | Credit spread | 15 bps |
| | | Interest rate | | | | | Interest rate | 4.34 | % | 4.34 | % | 4.34 | % |
| Mortgage-backed securities | Mortgage-backed securities | $ | 726 | | Yield analysis | Yield | 4.46 | % | 19.42 | % | 9.45 | % |
| 310 | | Price-based | Price | $ | 1.11 | | $ | 102.74 | | $ | 53.57 | |
| 245 | | | 245 | | Yield analysis | Yield | 5.34 | % | 23.45 | % | 8.99 | % |
| State and municipal, foreign government, corporate and other debt securities | State and municipal, foreign government, corporate and other debt securities | $ | 2,349 | | Price-based | Price | $ | 0.01 | $ | 114.74 | $ | 83.15 | State and municipal, foreign government, corporate and other debt securities | $ | 1,500 | | Price-based | Price-based | Price | $ | — | $ | 101.08 | $ | 91.08 |
| | 678 | |
| 678 | |
| 678 | | | Model-based | Credit spread | 35 bps | 550 bps | 242 bps |
Marketable equity securities(5) | | Marketable equity securities(5) | $ | 193 | | Price-based | Price | $ | — | $ | 13,600.22 | $ | 536.39 |
| | 40 | |
| 40 | |
| 40 | |
| | | WAL | | | | | WAL | 2 years |
| | | Recovery (in millions) | |
| Asset-backed securities | | Asset-backed securities | $ | 287 | | Price-based | Price | $ | 3.50 | $ | 139.18 | $ | 64.87 |
| 84 | | | 84 | | Yield analysis | Yield | 5.77 | % | 10.79 | % | 8.07 | % |
| Non-marketable equities | | Non-marketable equities | $ | 308 | | Comparables analysis | Illiquidity discount | 4.30 | % | 18.20 | % | 10.14 | % |
| | | Revenue multiple | | | | | Revenue multiple | 4.20x | 19.08x | 12.51x |
| | | PE ratio | | | | | PE ratio | 9.70x |
| | | EBITDA multiples | | | | | EBITDA multiples | 19.20x |
| 109 | |
| 57 | | | 57 | | Cash flow | Discount rate | 9.25 | % | 9.25 | % | 9.25 | % |
Derivatives—gross(6) | |
| Interest rate contracts (gross) | |
| Interest rate contracts (gross) | |
| Interest rate contracts (gross) | | $ | 5,390 | | Model-based | IR normal volatility | 0.32 | % | 20.00 | % | 1.83 | % |
| | | Interest rate | | | | | Interest rate | 2.99 | % | 5.32 | % | 3.51 | % |
| Foreign exchange contracts (gross) | | Foreign exchange contracts (gross) | $ | 1,763 | | Model-based | IR normal volatility | 0.39 | % | 1.27 | % | 0.78 | % |
| | | IR basis | | | | | IR basis | (39.03) | % | 96.15 | % | 4.14 | % |
| | | FX volatility | | | | | FX volatility | 0.03 | % | 111.73 | % | 11.78 | % |
Equity contracts (gross)(7) | | Equity contracts (gross)(7) | $ | 4,056 | | Model-based | Equity volatility | — | % | 220.66 | % | 30.31 | % |
| | | Equity forward | | | | | Equity forward | 62.33 | % | 206.42 | % | 106.57 | % |
| | | Equity-Equity correlation | | | | | Equity-Equity correlation | (36.22) | % | 99.25 | % | 70.73 | % |
| | | WAL | | | | | WAL | 1.99 years |
| | 973 | | Model-based | Credit spread | 35 bps | 508 bps | 275 bps |
| | Forward price | 17.46 | % | 218.96 | % | 102.59 | % |
| | | Recovery (in millions) | |
| | Commodity volatility | 8.79 | % | 166.93 | % | 27.52 | % |
| | | Recovery (in millions) | |
| | Commodity correlation | (21.00) | % | 95.73 | % | 43.10 | % |
Marketable equity securities(5) | $ | 241 | | Price-based | Price | $ | — | $ | 10,165.30 | $ | 171.81 |
| | 34 | | Model-based | WAL | 3 years |
| Recovery (in millions) | $ | 7,148 | | $ | 7,148 | | $ | 7,148 | |
| Asset-backed securities | $ | 463 | | Price-based | Price | $ | 5.45 | $ | 140.00 | $ | 70.87 |
| 77 | | Yield analysis | Yield | 6.12 | % | 11.91 | % | 8.58 | % |
| Non-marketable equities | $ | 298 | | Comparables analysis | Illiquidity discount | 10.00 | % | 12.00 | % | 10.08 | % |
| 57 | | Cash flow | PE ratio | 13.80x | 15.40x | 14.23x |
| Discount to price | 8.50 | % | 33.00 | % | 17.28 | % |
| Revenue multiple | 3.70x | 13.77x | 10.94x |
Derivatives—gross(6) | |
| Interest rate contracts (gross) | $ | 6,435 | | Model-based | IR normal volatility | 0.28 | % | 15.00 | % | 1.20 | % |
| Interest rate | 2.57 | % | 5.24 | % | 3.13 | % |
| Foreign exchange contracts (gross) | $ | 1,916 | | Model-based | IR normal volatility | 0.28 | % | 44.99 | % | 1.71 | % |
Equity contracts (gross)(7) | $ | 4,062 | | Model-based | Equity volatility | — | % | 279.49 | % | 33.30 | % |
| Equity forward | 72.62 | % | 265.04 | % | 105.44 | % |
| Equity-FX correlation | (90.00) | % | 70.00 | % | (11.24) | % |
| WAL | 3 years |
| | Recovery (in millions) | $ | 7,148 | | $ | 7,148 | | $ | 7,148 | |
| Equity-IR correlation | (22.00) | % | 60.00 | % | 30.04 | % |
| | | Recovery (in millions) | |
| | | FX volatility | | | | | FX volatility | 0.03 | % | 111.73 | % | 9.01 | % |
| Commodity and other contracts (gross) | Commodity and other contracts (gross) | $ | 1,772 | | Model-based | Commodity correlation | (21.00) | % | 95.73 | % | 43.10 | % | Commodity and other contracts (gross) | $ | 1,890 | | Model-based | Model-based | Forward price | 29.19 | % | 569.30 | % | 193.11 | % |
| Commodity volatility | 8.79 | % | 166.93 | % | 27.52 | % |
| | | Commodity volatility | | | | | Commodity volatility | 9.40 | % | 122.96 | % | 31.21 | % |
| | Forward price | 17.46 | % | 463.41 | % | 104.70 | % |
| Credit derivatives (gross) | Credit derivatives (gross) | $ | 1,307 | | Model-based | Credit spread | 7 bps | 520 bps | 95 bps |
| Credit derivatives (gross) | |
| Credit derivatives (gross) | | $ | 1,081 | | Model-based | Credit spread | 7 bps | 2000 bps | 204 bps |
| | | Recovery rate | | | | | Recovery rate | 25.00 | % | 40.00 | % | 39.24 | % |
| | | Upfront points | | | | | Upfront points | 2.47 | % | 115.16 | % | 50.39 | % |
| | | Credit correlation | | | | | Credit correlation | $ | 25.00 | $ | 75.00 | $ | 52.70 |
| | 510 | | Price-based | Recovery rate | 6.00 | % | 75.00 | % | 37.52 | % |
| Credit correlation | 30.00 | % | 90.00 | % | 50.34 | % |
| Price | $ | 3.66 | $ | 99.49 | $ | 36.20 |
| Upfront points | (0.64) | % | 99.00 | % | 54.49 | % |
| | Nontrading derivatives and other financial assets and liabilities measured on a recurring basis (gross) | $ | 95 | | Price-based | Price | $ | 0.01 | $ | 106.50 | $ | 87.76 |
| 403 | |
| 403 | |
| 403 | | | Price-based | Price | $ | 40.00 | $ | 99.00 | $ | 84.45 |
| | As of June 30, 2023 | Fair value(1) (in millions) | Methodology | Input | Low(2)(3) | High(2)(3) | Weighted average(4) |
| As of March 31, 2024 | | As of March 31, 2024 | Fair value(1) (in millions) | Methodology | Input | Low(2)(3) | High(2)(3) | Weighted average(4) |
| Nontrading derivatives and other financial assets and liabilities measured on a recurring basis (gross) | | Nontrading derivatives and other financial assets and liabilities measured on a recurring basis (gross) | $ | 31 | | Price-based | Price | $ | 0.11 | $ | 104.19 | $ | 88.92 |
| Loans and leases | Loans and leases | $ | 234 | | Price-based | Price | $ | 69.49 | $ | 106.96 | $ | 72.06 | Loans and leases | $ | 752 | | Model-based | Model-based | Equity forward | 62.33 | % | 206.42 | % | 106.92 | % |
| | | | Equity volatility | |
| | Forward price | 17.46 | % | 383.18 | % | 109.86 | % |
| | Commodity volatility | 8.79 | % | 166.93 | % | 27.52 | % |
| | | Equity volatility | |
| | Commodity correlation | (21.00) | % | 95.73 | % | 43.10 | % |
| | | | Equity volatility | | — | % | 220.66 | % | 19.04 | % |
| | | Equity-FX correlation | | | | | Equity-FX correlation | (95.00) | % | 70.00 | % | (15.44) | % |
| | | FX volatility | | | | | FX volatility | 0.03 | % | 111.73 | % | 9.03 | % |
| 307 | | | 307 | | Price-based | Price | $ | 74.86 | $ | 106.43 | $ | 101.81 |
| Mortgage servicing rights | Mortgage servicing rights | $ | 597 | | Cash flow | Yield | — | % | 12.00 | % | 5.12 | % | Mortgage servicing rights | $ | 605 | | Cash flow | Cash flow | Yield | (0.50) | % | 12.00 | % | 5.87 | % |
| 85 | | Model-based | WAL | 3.84 years | 9.17 years | 7.71 years |
| 64 | | | 64 | | Model-based | WAL | 3.71 years | 8.64 years | 7.49 years |
| Liabilities | Liabilities | |
| Interest-bearing deposits | Interest-bearing deposits | $ | 26 | | Model-based | Forward price | 100.00 | % | 100.00 | % | 100.00 | % |
| Interest-bearing deposits | |
| Interest-bearing deposits | | $ | 72 | | Model-based | Equity volatility | 5.65 | % | 17.15 | % | 7.53 | % |
| | | | Forward price | |
| | | Forward price | |
| | | Forward price | | 100 | % | 100 | % | 100 | % |
| | Securities loaned and sold under agreements to repurchase | Securities loaned and sold under agreements to repurchase | $ | 627 | | Model-based | Interest rate | 3.96 | % | 5.53 | % | 4.24 | % |
| Securities loaned and sold under agreements to repurchase | |
| Securities loaned and sold under agreements to repurchase | | $ | 326 | | Model-based | Interest rate | 4.24 | % | 5.30 | % | 4.33 | % |
| Trading account liabilities | Trading account liabilities | |
| Securities sold, not yet purchased and other trading liabilities | |
| Securities sold, not yet purchased and other trading liabilities | |
| Securities sold, not yet purchased and other trading liabilities | Securities sold, not yet purchased and other trading liabilities | $ | 60 | | Price-based | Price | $ | — | $ | 10,616 | $ | 72 | $ | 104 | | Price-based | Price-based | Price | $ | — | $ | 8,962.00 | $ | 83.27 |
| | Short-term borrowings and long-term debt | Short-term borrowings and long-term debt | $ | 37,378 | | Model-based | IR normal volatility | 0.28 | % | 13.00 | % | 1.07 | % |
| Short-term borrowings and
long-term debt | |
| Short-term borrowings and
long-term debt | | $ | 40,974 | | Model-based | IR normal volatility | 0.32 | % | 20.00 | % | 1.12 | % |
| | As of December 31, 2022 | Fair value(1) (in millions) | Methodology | Input | Low(2)(3) | High(2)(3) | Weighted average(4) |
| As of December 31, 2023 | | As of December 31, 2023 | Fair value(1) (in millions) | Methodology | Input | Low(2)(3) | High(2)(3) | Weighted average(4) |
| Assets | Assets | | Assets | |
| Securities borrowed and purchased under agreements to resell | Securities borrowed and purchased under agreements to resell | $ | 146 | | Model-based | Credit spread | 15 bps | Securities borrowed and purchased under agreements to resell | $ | 139 | | Model-based | Model-based | Credit spread | 15 bps |
| Interest rate | 2.61 | % | 2.61 | % | 2.61 | % |
| | | Interest rate | | | | | Interest rate | 4.00 | % | 4.00 | % | 4.00 | % |
| Mortgage-backed securities | Mortgage-backed securities | $ | 228 | | Price-based | Price | $ | 1.04 | | $ | 99.71 | | $ | 51.51 | |
| 732 | | Yield analysis | Yield | 4.41 | % | 20.30 | % | 9.74 | % |
| 401 | | | 401 | | Yield analysis | Yield | 4.63 | % | 19.08 | % | 8.93 | % |
| State and municipal, foreign government, corporate and other debt securities | State and municipal, foreign government, corporate and other debt securities | $ | 2,360 | | Price-based | Price | $ | 0.01 | | $ | 994.68 | | $ | 245.85 | |
| 778 | | | 778 | | Model-based | Credit spread | 35 bps | 550 bps | 304 bps |
Marketable equity securities(5) | Marketable equity securities(5) | $ | 147 | | Price-based | Price | $ | — | | $ | 9,087.76 | | $ | 114.29 | |
| 31 | | Model-based | WAL | 2.24 years |
| Recovery (in millions) | $ | 7,148 | | $ | 7,148 | | $ | 7,148 | |
| 38 | | | 38 | | Model-based | WAL | 2.24 years |
| | | Recovery (in millions) | |
| Asset-backed securities | Asset-backed securities | $ | 304 | | Price-based | Price | $ | 10.50 | | $ | 145.00 | | $ | 74.97 | |
| 308 | | Yield analysis | Yield | 5.76 | % | 18.58 | % | 9.34 | % |
| 57 | | | 57 | | Yield analysis | Yield | 5.93 | % | 18.86 | % | 8.57 | % |
| Non-marketable equities | Non-marketable equities | $ | 287 | | Comparables analysis | Illiquidity discount | 8.60 | % | 17.00 | % | 10.16 | % | Non-marketable equities | $ | 366 | | Comparables analysis | Comparables analysis | Illiquidity discount | 8.00 | % | 10.00 | % | 8.82 | % |
| 101 | | Price-based | PE ratio | 14.00x | 15.70x | 15.16x |
| Cost of capital | 8.10 | % | 17.50 | % | 10.44 | % |
| Revenue multiple | 3.60x | 13.90x | 12.40x |
| | | PE ratio | | | | | PE ratio | 9.30x | 16.50x | 11.37x |
| | | Revenue multiple | | | | | Revenue multiple | 2.80x | 13.40x | 12.28x |
| | | EBITDA multiples | | | | | EBITDA multiples | 15.80x |
| 56 | | | 56 | | Cash flow | Discount to price | 8.50 | % | 8.50 | % | 8.50 | % |
| 50 | |
Derivatives—gross(6) | Derivatives—gross(6) | |
| Interest rate contracts (gross) | Interest rate contracts (gross) | $ | 7,108 | | Model-based | IR normal volatility | 0.33 | % | 1.82 | % | 0.96 | % |
| Interest rate contracts (gross) | |
| Interest rate contracts (gross) | | $ | 5,237 | | Model-based | IR normal volatility | (0.07) | % | 15.00 | % | 1.44 | % |
| | | Interest rate | | | | | Interest rate | 2.70 | % | 5.40 | % | 3.20 | % |
| Foreign exchange contracts (gross) | Foreign exchange contracts (gross) | $ | 1,437 | | Model-based | IR normal volatility | 0.33 | % | 1.47 | % | 0.67 | % | Foreign exchange contracts (gross) | $ | 1,652 | | Model-based | Model-based | IR normal volatility | (0.07) | % | 12.05 | % | 1.50 | % |
| IR basis | (4.23) | % | 9.68 | % | (0.03) | % |
| Equity volatility | 0.05 | % | 300.72 | % | 33.91 | % |
| Credit spread | 116 bps | 626 bps | 594 bps |
| | | IR basis | | | | | IR basis | (1.45) | % | 147.79 | % | 7.11 | % |
Equity contracts (gross)(7) | Equity contracts (gross)(7) | $ | 4,430 | | Model-based | Equity volatility | 0.05 | % | 300.72 | % | 41.47 | % | Equity contracts (gross)(7) | $ | 4,239 | | Model-based | Model-based | Equity volatility | 0.10 | % | 334.35 | % | 38.35 | % |
| Equity forward | 68.34 | % | 271.61 | % | 103.50 | % |
| Equity-FX correlation | (95.00) | % | 50.00 | % | (16.33) | % |
| Equity-Equity correlation | (3.98) | % | 98.68 | % | 85.63 | % |
| WAL | 2.24 years |
| Recovery (in millions) | $ | 7,148 | | $ | 7,148 | | $ | 7,148 | |
| Equity-IR correlation | (18.83) | % | 60.00 | % | 32.37 | % |
| | As of December 31, 2023 | | As of December 31, 2023 | Fair value(1) (in millions) | Methodology | Input | Low(2)(3) | High(2)(3) | Weighted average(4) |
| | | Equity forward | | | | | Equity forward | 54.14 | % | 273.54 | % | 101.44 | % |
| | | Equity-FX correlation | | | | | Equity-FX correlation | (79.00) | % | 70.00 | % | (7.66) | % |
| | | Equity-Equity correlation | | | | | Equity-Equity correlation | (6.49) | % | 97.44 | % | 80.42 | % |
| | | WAL | | | | | WAL | 2.24 years |
| | | Recovery (in millions) | |
| Commodity and other contracts (gross) | Commodity and other contracts (gross) | $ | 2,724 | | Model-based | Forward price | 14.27 | % | 385.50 | % | 106.08 | % | Commodity and other contracts (gross) | $ | 1,943 | | Model-based | Model-based | Forward price | 31.70 | % | 425.51 | % | 134.65 | % |
| Commodity volatility | 10.43 | % | 151.50 | % | 33.55 | % |
| Commodity correlation | (32.00) | % | 91.94 | % | 36.70 | % |
| | | Commodity volatility | | | | | Commodity volatility | 14.72 | % | 149.99 | % | 37.03 | % |
| | | Commodity correlation | | | | | Commodity correlation | (45.33) | % | 93.02 | % | 45.03 | % |
| Credit derivatives (gross) | Credit derivatives (gross) | $ | 1,520 | | Model-based | Credit spread | 2.50 bps | 955.10 bps | 101.27 bps | Credit derivatives (gross) | $ | 1,135 | | Model-based | Model-based | Credit spread | 11.43 bps | 1,519 bps | 140.34 bps |
| 439 | | Price-based | Recovery rate | 25.00 | % | 75.00 | % | 42.27 | % |
| Credit correlation | 25.00 | % | 80.00 | % | 42.38 | % |
| Price | $ | 31.71 | | $ | 99.00 | | $ | 78.75 | |
| Credit spread volatility | 35.58 | % | 64.79 | % | 40.47 | % |
| | | Credit spread volatility | | | | | Credit spread volatility | 23.94 | % | 115.66 | % | 42.76 | % |
| | | Recovery rate | | | | | Recovery rate | 15.00 | % | 75.00 | % | 36.56 | % |
| 378 | | | 378 | | Price-based | Upfront points | 1.25 | % | 117.31 | % | 58.10 | % |
| | | Price | |
| | Non-trading derivatives and other financial assets and liabilities measured on a recurring basis (gross) | Non-trading derivatives and other financial assets and liabilities measured on a recurring basis (gross) | $ | 57 | | Price-based | Price | $ | 80.16 | | $ | 105.32 | | $ | 92.65 | |
| Loans and leases | $ | 1,059 | | Model-based | Equity volatility | 0.05 | % | 300.72 | % | 42.62 | % |
| | 304 | | Price-based | Forward price | 14.27 | % | 324.85 | % | 105.07 | % |
| | Price | $ | 0.01 | | $ | 100.53 | | $ | 84.77 | |
| | Equity forward | 68.34 | % | 271.61 | % | 103.49 | % |
| Non-trading derivatives and other financial assets and liabilities measured on a recurring basis (gross) | |
| | Non-trading derivatives and other financial assets and liabilities measured on a recurring basis (gross) | |
| Loans and leases | |
| 111 | | | 111 | | Model-based | Forward price | 33.48 | % | 348.43 | % | 115.47 | % |
| | | Commodity volatility | | | | | Commodity volatility | 26.51 | % | 66.80 | % | 31.79 | % |
| | | Commodity correlation | | | | | Commodity correlation | (45.33) | % | 93.02 | % | (7.28) | % |
| | | Equity volatility | | | | | Equity volatility | 41.61 | % | 45.40 | % | 43.17 | % |
| Mortgage servicing rights | Mortgage servicing rights | $ | 580 | | Cash flow | Yield | (0.40) | % | 13.20 | % | 5.36 | % | Mortgage servicing rights | $ | 595 | | Cash flow | Cash flow | WAL | 1.00 years | 8.76 years | 1.29 years |
| 84 | | Model-based | WAL | 3.92 years | 9.33 years | 7.71 years |
| 66 | | | 66 | | Model-based | Yield | — | % | 12.00 | % | 8.06 | % |
| Liabilities | Liabilities | |
| Interest-bearing deposits | |
| Interest-bearing deposits | |
| Interest-bearing deposits | Interest-bearing deposits | $ | 15 | | Model-based | Forward price | 100.00 | % | 101.30 | % | 100.07 | % | $ | 29 | | Model-based | Model-based | Forward price | 100.00 | % | 100.00 | % | 100.00 | % |
| Securities loaned and sold under agreements to repurchase | Securities loaned and sold under agreements to repurchase | $ | 970 | | Model-based | Interest rate | 4.01 | % | 4.97 | % | 4.07 | % | Securities loaned and sold under agreements to repurchase | $ | 390 | | Model-based | Model-based | Interest rate | 3.92 | % | 5.27 | % | 3.96 | % |
| Trading account liabilities | Trading account liabilities | |
| Securities sold, not yet purchased and other trading liabilities | Securities sold, not yet purchased and other trading liabilities | $ | 47 | | Price-based | Price | $ | — | | $ | 9,087.76 | | $ | 41.22 | |
| 6 | Model-based | FX volatility | 2.00 | % | 40.00 | % | 12.85 | % |
| Securities sold, not yet purchased and other trading liabilities | |
| Securities sold, not yet purchased and other trading liabilities | |
| 7 | | | 7 | Yield analysis | Yield | 7.46 | % | 7.46 | % | 7.46 | % |
| 5 | | | 5 | Model-based | FX volatility | 3.56 | % | 28.13 | % | 13.17 | % |
| Short-term borrowings and long-term debt | Short-term borrowings and long-term debt | $ | 36,155 | | Model-based | IR normal volatility | 0.33 | % | 1.82 | % | 0.89 | % | Short-term borrowings and
long-term debt | $ | 38,794 | | Model-based | Model-based | IR normal volatility | 0.32 | % | 20.00 | % | 1.25 | % |
(1)The tables above include the fair values for the items listed and may not foot to the total population for each category.
(2)Some inputs are shown as zero due to rounding.
(3)When the low and high inputs are the same, there is either a constant input applied to all positions, or the methodology involving the input applies to only one large position.
(4)Weighted averages are calculated based on the fair values of the instruments.
(5)For equity securities, the price inputs are expressed on an absolute basis, not as a percentage of the notional amount.
(6)Both trading and non-trading account derivatives—assets and liabilities—are presented on a gross absolute value basis.
(7)Includes hybrid products.
Items Measured at Fair Value on a Nonrecurring Basis
Certain assets and liabilities are measured at fair value on a nonrecurring basis and, therefore, are not included in the tables above. These include assets measured at cost that have been written down to fair value during the periods as a result of an impairment. These also include non-marketable equity securities that have been measured using the measurement alternative and are either (i) written down to fair value during the periods as a result of an impairment or (ii) adjusted upward or downward to fair value as a result of a transaction observed during the periods for an identical or similar investment in the same issuer. In addition, these assets include loans held-for-sale and other real estate owned that are measured at the lower of cost or market value.
The following tables present the carrying amounts of all assets that were still held for which a nonrecurring fair value measurement was recorded:
| | In millions of dollars | In millions of dollars | Fair value | Level 2 | Level 3 | In millions of dollars | Fair value | Level 2 | Level 3 |
| June 30, 2023 | | | |
| March 31, 2024 | | March 31, 2024 | | | |
Loans HFS(1) | Loans HFS(1) | $ | 2,325 | | $ | 761 | | $ | 1,564 | |
| Other real estate owned | Other real estate owned | 3 | | — | | 3 | |
Loans(2) | Loans(2) | 170 | | — | | 170 | |
| | Non-marketable equity securities measured using the measurement alternative | Non-marketable equity securities measured using the measurement alternative | 48 | | — | | 48 | |
| Non-marketable equity securities measured using the measurement alternative | |
| Non-marketable equity securities measured using the measurement alternative | |
| Total assets at fair value on a nonrecurring basis | Total assets at fair value on a nonrecurring basis | $ | 2,546 | | $ | 761 | | $ | 1,785 | |
| | In millions of dollars | In millions of dollars | Fair value | Level 2 | Level 3 | In millions of dollars | Fair value | Level 2 | Level 3 |
| December 31, 2022 | | | |
| December 31, 2023 | | December 31, 2023 | | | |
Loans HFS(1) | Loans HFS(1) | $ | 2,336 | | $ | 457 | | $ | 1,879 | |
| Other real estate owned | Other real estate owned | 1 | | — | | 1 | |
Loans(2) | Loans(2) | 69 | | — | | 69 | |
| Non-marketable equity securities measured using the measurement alternative | Non-marketable equity securities measured using the measurement alternative | 597 | | — | | 597 | |
| Total assets at fair value on a nonrecurring basis | Total assets at fair value on a nonrecurring basis | $ | 3,003 | | $ | 457 | | $ | 2,546 | |
(1)Net of mark-to-market amounts on the unfunded portion of loans HFS recognized as Other liabilities on the Consolidated Balance Sheet.
(2)Represents impaired loans held for investment whose carrying amount is based on the fair value of the underlying collateral less costs to sell, primarily real estate.
Valuation Techniques and Inputs for Level 3 Nonrecurring Fair Value Measurements
The following tables present the valuation techniques covering the majority of Level 3 nonrecurring fair value measurements and the most significant unobservable inputs used in those measurements:
| | As of June 30, 2023 | Fair value(1) (in millions) | Methodology | Input | Low(2) | High | Weighted average(3) |
| As of March 31, 2024 | | As of March 31, 2024 | Fair value(1) (in millions) | Methodology | Input | Low(2) | High | Weighted average(3) |
| Loans HFS | Loans HFS | $ | 1,558 | | Price-based | Price | $ | 75.00 | | $ | 100.00 | | $ | 89.85 | |
| Other real estate owned | $ | 2 | | Price-based | Appraised value(4) | $ | 24,300 | | $ | 666,000 | | $ | 404,791 | |
| Loans(5) | |
Loans(5) | |
Loans(5) | Loans(5) | $ | 86 | | Recovery analysis | Appraised value(4) | $ | 12,000 | | $ | 77,400,786 | | $ | 42,187,539 | |
| | 83 | | Price-based | |
| Non-marketable equity securities measured using the measurement alternative | Non-marketable equity securities measured using the measurement alternative | $ | 35 | | Price-based | Price | $ | 0.10 | | $ | 3.30 | | $ | 2.25 | |
| 13 | | Comparable analysis | Revenue multiple | 1.20x | 10.20x | 9.19x |
| Non-marketable equity securities measured using the measurement alternative | |
| Non-marketable equity securities measured using the measurement alternative | |
| 11 | | | 11 | | Comparable analysis | Revenue multiple | —x | 46.30x | 18.66x |
| Other real estate owned | |
| | As of December 31, 2022 | Fair value(1) (in millions) | Methodology | Input | Low(2) | High | Weighted average(3) |
| As of December 31, 2023 | | As of December 31, 2023 | Fair value(1) (in millions) | Methodology | Input | Low(2) | High | Weighted average(3) |
| Loans HFS | Loans HFS | $ | 1,830 | | Price-based | Price | $ | 0.88 | | $ | 100.23 | | $ | 65.91 | |
Loans(5) | |
| Non-marketable equity securities measured using the measurement alternative | |
| 109 | | | 109 | | Comparable analysis | Revenue multiple | 2.30x | 35.70x | 11.69x |
| | Other real estate owned | Other real estate owned | $ | 1 | | Price-based | Appraised value(4) | $ | 30,000 | | $ | 441,750 | | $ | 310,552 | |
Loans(5) | $ | 45 | | Recovery analysis | Appraised value(4) | $ | 12,000 | | $ | 14,022,820 | | $ | 3,714,342 | |
| Other real estate owned | |
| Other real estate owned | |
| | 24 | | Appraised value | |
| | Non-marketable equity securities measured using the measurement alternative | $ | 234 | | Comparable analysis | Revenue multiple | 4.95x | 73.10x | 19.68x |
| 363 | | Price-based | Price | $ | 0.46 | | $ | 2,416.43 | | $ | 557.86 | |
|
(1)The tables above include the fair values for the items listed and may not foot to the total population for each category.
(2)Some inputs are shown as zero due to rounding.
(3)Weighted averages are calculated based on the fair values of the instruments.
(4)Appraised values are disclosed in whole dollars.
(5)Represents impaired loans held for investment whose carrying amount is based on the fair value of the underlying collateral less costs to sell, primarily real estate.
Nonrecurring Fair Value Changes
The following table presents total nonrecurring fair value measurements for the period, included in earnings, attributable to the change in fair value relating to assets that were still held:
| | | | | | | | | | | | | | |
| Three Months Ended June 30, | Six Months Ended June 30, |
| In millions of dollars | 2023 | 2022 | 2023 | 2022 |
| Loans HFS | $ | (15) | | $ | (86) | | $ | (26) | | $ | (223) | |
| Other real estate owned | — | | — | | — | | — | |
Loans(1) | (16) | | 4 | | (18) | | 9 | |
| Non-marketable equity securities measured using the measurement alternative | (27) | | 43 | | (54) | | 128 | |
| | | | |
| Total nonrecurring fair value gains (losses) | $ | (58) | | $ | (39) | | $ | (98) | | $ | (86) | |
| | | | | | | | | | |
| Three Months Ended
March 31, | |
| In millions of dollars | 2024 | 2023 | | |
| Loans HFS | $ | (82) | | $ | (56) | | | |
| Other real estate owned | — | | — | | | |
Loans(1) | (34) | | (2) | | | |
| Non-marketable equity securities measured using the measurement alternative | 32 | | (25) | | | |
| | | | |
| Total nonrecurring fair value gains (losses) | $ | (84) | | $ | (83) | | | |
(1)Represents loans held for investment whose carrying amount is based on the fair value of the underlying collateral less costs to sell, primarily real estate.
Estimated Fair Value of Financial Instruments Not Carried at Fair Value
The following tables present the carrying value and fair value of Citigroup’s financial instruments that are not carried at fair value. The tables below therefore exclude items measured at fair value on a recurring basis presented in the tables above.
| | | | June 30, 2023 | Estimated fair value | | March 31, 2024 | Estimated fair value |
| | | Carrying
value | Estimated
fair value | |
| In billions of dollars | In billions of dollars | Level 1 | Level 2 | Level 3 |
| In billions of dollars | |
| In billions of dollars | | Level 1 | Level 2 | Level 3 |
| Assets | Assets | | | | | Assets | | | | | |
| Investments, net of allowance | $ | 267.5 | | $ | 243.6 | | $ | 124.1 | | $ | 117.2 | | $ | 2.3 | |
HTM debt securities, net of allowance(1) | |
| Securities borrowed and purchased under agreements to resell | Securities borrowed and purchased under agreements to resell | 127.0 | | 127.0 | | — | | 127.0 | | — | |
Loans(1)(2) | 637.1 | | 646.9 | | — | | — | | 646.9 | |
Other financial assets(2)(3) | 389.0 | | 389.0 | | 279.2 | | 17.7 | | 92.1 | |
Loans(2)(3) | |
Other financial assets(3)(4) | |
| Liabilities | Liabilities | | | |
| Deposits | Deposits | $ | 1,317.3 | | $ | 1,316.3 | | $ | — | | $ | 1,124.6 | | $ | 191.7 | |
| Deposits | |
| Deposits | |
| Securities loaned and sold under agreements to repurchase | Securities loaned and sold under agreements to repurchase | 197.2 | | 197.2 | | — | | 197.2 | | — | |
Long-term debt(4) | 158.6 | | 160.7 | | — | | 148.9 | | 11.8 | |
Other financial liabilities(5) | 136.7 | | 136.7 | | — | | 31.6 | | 105.1 | |
Long-term debt(5) | |
Other financial liabilities(6) | |
| | | | December 31, 2022 | Estimated fair value | | December 31, 2023 | Estimated fair value |
| | | Carrying
value | Estimated
fair value | |
| In billions of dollars | In billions of dollars | Level 1 | Level 2 | Level 3 |
| In billions of dollars | |
| In billions of dollars | | Level 1 | Level 2 | Level 3 |
| Assets | Assets | | | | Assets | | | |
| Investments, net of allowance | $ | 274.3 | | $ | 249.2 | | $ | 123.2 | | $ | 123.1 | | $ | 2.9 | |
HTM debt securities, net of allowance(1) | |
| Securities borrowed and purchased under agreements to resell | Securities borrowed and purchased under agreements to resell | 125.9 | | 125.9 | | — | | 125.9 | | — | |
Loans(1)(2) | 634.5 | | 634.9 | | — | | — | | 634.9 | |
Other financial assets(2)(3) | 427.1 | | 427.1 | | 320.0 | | 22.0 | | 85.1 | |
Loans(2)(3) | |
Other financial assets(3)(4) | |
| Liabilities | Liabilities | | | | Liabilities | | | |
| Deposits | Deposits | $ | 1,364.1 | | $ | 1,345.4 | | $ | — | | $ | 1,159.4 | | $ | 186.0 | |
| Securities loaned and sold under agreements to repurchase | Securities loaned and sold under agreements to repurchase | 131.6 | | 131.6 | | — | | 131.6 | | — | |
Long-term debt(4) | 165.6 | | 160.5 | | — | | 151.1 | | 9.4 | |
Other financial liabilities(5) | 142.4 | | 142.4 | | — | | 26.5 | | 115.9 | |
Long-term debt(5) | |
Other financial liabilities(6) | |
(1)Includes $5.3 billion and $5.5 billion of non-marketable equity securities carried at cost at March 31, 2024 and December 31, 2023, respectively.
(2)The carrying value of loans is net of the allowance for credit losses on loans of $17.5$18.3 billion for June 30, 2023March 31, 2024 and $17.0$18.1 billion for December 31, 2022.2023. In addition, the carrying values exclude $0.3 billion and $0.4$0.3 billion of lease finance receivables at June 30, 2023March 31, 2024 and December 31, 2022,2023, respectively.
(2)(3)Includes items measured at fair value on a nonrecurring basis.
(3)(4)Includes cash and due from banks, deposits with banks, brokerage receivables, reinsurance recoverables and other financial instruments included in Other assets on the Consolidated Balance Sheet, for all of which the carrying value is a reasonable estimate of fair value.
(4)(5)The carrying value includes long-term debt balances under qualifying fair value hedges.
(5)(6)Includes brokerage payables, separate and variable accounts, short-term borrowings (carried at cost) and other financial instruments included in Other liabilities on the Consolidated Balance Sheet, for all of which the carrying value is a reasonable estimate of fair value.
The estimated fair values of the Company’s corporate unfunded lending commitments at June 30, 2023March 31, 2024 and December 31, 20222023 were off-balance sheet liabilities of $8.1$12.9 billion and $13.7$14.2 billion, respectively, substantially all of which are classified as Level 3. The Company does not estimate the fair values of consumer unfunded lending commitments, which are generally cancelable by providing notice to the borrower.
23.24. FAIR VALUE ELECTIONS
The Company may elect to report most financial instruments and certain other items at fair value on an instrument-by-instrument basis with changes in fair value reported in earnings, other than DVA (see below). The election is made upon the initial recognition of an eligible financial asset, financial liability or firm commitment or when certain specified reconsideration events occur. The fair value election
may not otherwise be revoked once an election is made. The changes in fair value are recorded in current earnings. Movements in DVA are reported as a component of AOCI.
The Company has elected fair value accounting for its mortgage servicing rights (MSRs). See Note 2021 for additional details on Citi’s MSRs.
Additional discussion regarding other applicable areas in which fair value elections were made is presented in Note 22.
The following table presents the changes in fair value of those items for which the fair value option has been elected:
| | Changes in fair value—gains (losses) | |
| Changes in fair value—gains (losses) | |
| Changes in fair value—gains (losses) | |
| | | Changes in fair value—gains (losses) |
| | | Three Months Ended June 30, | Six Months Ended June 30, |
| In millions of dollars | In millions of dollars | 2023 | 2022 | 2023 | 2022 |
| In millions of dollars | |
| In millions of dollars | |
| Assets | |
| Assets | |
| Assets | Assets | | | |
| Securities borrowed and purchased under agreements to resell | Securities borrowed and purchased under agreements to resell | $ | (95) | | $ | (21) | | $ | (10) | | $ | (83) | |
| Securities borrowed and purchased under agreements to resell | |
| Securities borrowed and purchased under agreements to resell | |
| Trading account assets | |
| Trading account assets | |
| Trading account assets | Trading account assets | 18 | | (177) | | 79 | | (238) | |
| | Loans | Loans | | | |
| | Loans | |
| | Loans | |
| Certain corporate loans | |
| Certain corporate loans | |
| Certain corporate loans | Certain corporate loans | 635 | | (1,523) | | 326 | | (1,855) | |
| Certain consumer loans | Certain consumer loans | (4) | | — | | 1 | | (1) | |
| Certain consumer loans | |
| Certain consumer loans | |
| Total loans | |
| Total loans | |
| Total loans | Total loans | $ | 631 | | $ | (1,523) | | $ | 327 | | $ | (1,856) | |
| Other assets | Other assets | | | | |
| Other assets | |
| Other assets | |
| MSRs | |
| MSRs | |
| MSRs | MSRs | $ | 22 | | $ | 60 | | $ | 19 | | $ | 158 | |
Certain mortgage loans HFS(1) | Certain mortgage loans HFS(1) | (18) | | (144) | | (10) | | (330) | |
Certain mortgage loans HFS(1) | |
Certain mortgage loans HFS(1) | |
| Total other assets | |
| Total other assets | |
| Total other assets | Total other assets | $ | 4 | | $ | (84) | | $ | 9 | | $ | (172) | |
| Total assets | Total assets | $ | 558 | | $ | (1,805) | | $ | 405 | | $ | (2,349) | |
| Total assets | |
| Total assets | |
| Liabilities | |
| Liabilities | |
| Liabilities | Liabilities | | | | |
| Interest-bearing deposits | Interest-bearing deposits | $ | 82 | | $ | (168) | | $ | (52) | | $ | (123) | |
| Interest-bearing deposits | |
| Interest-bearing deposits | |
| Securities loaned and sold under agreements to repurchase | |
| Securities loaned and sold under agreements to repurchase | |
| Securities loaned and sold under agreements to repurchase | Securities loaned and sold under agreements to repurchase | 49 | | 19 | | (19) | | 96 | |
| Trading account liabilities | Trading account liabilities | 77 | | 191 | | 152 | | (449) | |
| Trading account liabilities | |
| Trading account liabilities | |
Short-term borrowings(2) | |
Short-term borrowings(2) | |
Short-term borrowings(2) | Short-term borrowings(2) | 230 | | 1,064 | | 88 | | 1,196 | |
Long-term debt(2) | Long-term debt(2) | (2,147) | | 9,642 | | (6,496) | | 15,713 | |
Long-term debt(2) | |
Long-term debt(2) | |
| Total liabilities | Total liabilities | $ | (1,709) | | $ | 10,748 | | $ | (6,327) | | $ | 16,433 | |
| Total liabilities | |
| Total liabilities | |
(1)Includes gains (losses) associated with interest rate lock commitments for originated loans for which the Company has elected the fair value option.
(2)Includes DVA that is included in AOCI. See Notes 1819 and 22.23.
Own Debt Valuation Adjustments (DVA)
Own debt valuation adjustments are recognized on Citi’s liabilities for which the fair value option has been elected using Citi’s credit spreads observed in the bond market. Changes in fair value of fair value option liabilities related to changes in Citigroup’s own credit spreads (DVA) are reflected as a component of AOCI. See Note 1819 for additional information.
Among other variables, the fair value of liabilities for which the fair value option has been elected (other than non-recourse debt and similar liabilities) is impacted by the narrowing or widening of the Company’s credit spreads.
The estimated changes in the fair value of these non-derivative liabilities due to such changes in the Company’s own credit spread (or instrument-specific credit risk) were a loss of $(837)$(750) million and gain of $2,592$(433) million for the three months ended June 30,March 31, 2024 and 2023, and 2022, respectively, and a loss of $(1,270) million and gain of $3,642 million for the six months ended June 30, 2023 and 2022, respectively. Changes in fair value resulting from changes in instrument-specific credit risk were estimated by incorporating the Company’s current credit spreads observable in the bond market into the relevant valuation technique used to value each liability as described above.
The Fair Value Option for Financial Assets and Financial Liabilities
Selected Portfolios of Securities Purchased Under Agreements to Resell, Securities Borrowed, Securities Sold Under Agreements to Repurchase, Securities Loaned and Certain Uncollateralized Short-Term Borrowings
The Company elected the fair value option for certain portfolios of fixed income securities purchased under agreements to resell and fixed income securities sold under
agreements to repurchase, securities borrowed, securities loaned and certain uncollateralized short-term borrowings held primarily by broker-dealer entities in the United States, the United Kingdom and Japan. In each case, the election was made because the related interest rate risk is managed on a portfolio basis, primarily with offsetting derivative instruments that are accounted for at fair value through earnings.
Changes in fair value for transactions in these portfolios are recorded in Principal transactions. The related interest revenueincome and interest expense are measured based on the contractual rates specified in the transactions and are reported as Interest revenueincome and Interest expense in the Consolidated Statement of Income.
Certain Loans and Other Credit Products
Citigroup has also elected the fair value option for certain other originated and purchased loans, including certain unfunded loan products, such as guarantees and letters of credit, executed by Citigroup’s lending and trading businesses. None of these credit products are highly leveraged financing commitments. Significant groups of transactions include loans and unfunded loan products that are expected to be either sold or securitized in the near term, or transactions where the economic risks are hedged with derivative instruments, such as purchased credit default swaps or total return swaps where the Company pays the total return on the underlying loans to a third party. Citigroup has elected the fair value option to mitigate accounting mismatches in cases where hedge accounting is complex and to achieve operational simplifications. Fair value was not elected for most lending transactions across the Company.
The following table provides information about certain credit products carried at fair value:
| | | | June 30, 2023 | December 31, 2022 | | March 31, 2024 | December 31, 2023 |
| In millions of dollars | In millions of dollars | Trading assets | Loans | Trading assets | Loans | In millions of dollars | Trading assets | Loans | Trading assets | Loans |
| Carrying amount reported on the Consolidated Balance Sheet | Carrying amount reported on the Consolidated Balance Sheet | $ | 4,482 | | $ | 5,766 | | $ | 6,011 | | $ | 5,360 | |
| Aggregate unpaid principal balance in excess of (less than) fair value | Aggregate unpaid principal balance in excess of (less than) fair value | 161 | | 156 | | 167 | | 51 | |
| Balance of non-accrual loans or loans more than 90 days past due | Balance of non-accrual loans or loans more than 90 days past due | — | | 2 | | — | | 2 | |
| Aggregate unpaid principal balance in excess of (less than) fair value for non-accrual loans or loans more than 90 days past due | Aggregate unpaid principal balance in excess of (less than) fair value for non-accrual loans or loans more than 90 days past due | — | | 1 | | — | | — | |
In addition to the amounts reported above, $651$375 million and $729$391 million of unfunded commitments related to certain credit products selected for fair value accounting were outstanding as of June 30, 2023March 31, 2024 and December 31, 2022,2023, respectively.
Changes in the fair value of funded and unfunded credit products are classified in Principal transactions in Citi’s Consolidated Statement of Income. Related interest revenueincome is measured based on the contractual interest rates and reported as Interest revenueincome on Trading account assets or loan interest depending on the balance sheet classifications of the credit products. The changes in fair value for the three months ended June 30,March 31, 2024 and 2023 and 2022 due to instrument-specific credit risk totaled to a loss of $25$(16) million and $(47)a gain of $9 million, respectively. Changes in fair value due to instrument-specific credit risk are estimated based on changes in borrower-specific credit spreads and recovery assumptions.
Certain Investments in Unallocated Precious Metals
Citigroup invests in unallocated precious metals accounts (e.g., gold, silver, platinum and palladium) as part of its commodity trading activities. Under ASC 815, the investment is bifurcated into a debt host contract and a commodity derivative instrument. Citigroup elects the fair value option for the debt host contract, and reports the contract within Trading account assets on the Company’s Consolidated Balance Sheet.
The total carrying amount of debt host contracts across unallocated precious metals accounts was approximately $0.6 billion and $0.3 billion at June 30, 2023 and December 31, 2022, respectively.
As part of its commodity trading activities, Citi trades unallocated precious metals investments and executes forward purchase and forward sale derivative contracts with trading counterparties. When Citi sells an unallocated precious metals investment, Citi’s receivable from its depository bank is repaid and Citi derecognizes its investment in the unallocated precious metal. The forward purchase or sale contract with the trading counterparty indexed to unallocated precious metals is accounted for as a derivative, at fair value through earnings.
Certain Mortgage Loans Held-for-Sale (HFS)
Citigroup has elected the fair value option for certain purchased and originated prime fixed-rate and conforming adjustable-rate first mortgage loans HFS. These loans are intended for sale or securitization and are economically hedged with derivative instruments. The Company has elected the fair value option to mitigate accounting mismatches in cases where hedge accounting is complex and to achieve operational simplifications.
The following table provides information about certain mortgage loans HFS carried at fair value:
| | In millions of dollars | In millions of dollars | June 30,
2023 | December 31, 2022 | In millions of dollars | March 31,
2024 | December 31, 2023 |
| Carrying amount reported on the Consolidated Balance Sheet | Carrying amount reported on the Consolidated Balance Sheet | $ | 1,069 | | $ | 793 | |
| Aggregate fair value in excess of (less than) unpaid principal balance | Aggregate fair value in excess of (less than) unpaid principal balance | (7) | | (10) | |
| Balance of non-accrual loans or loans more than 90 days past due | Balance of non-accrual loans or loans more than 90 days past due | 3 | | 1 | |
Aggregate unpaid principal balance in excess of fair value for non-accrual loans
or loans more than 90 days past due | Aggregate unpaid principal balance in excess of fair value for non-accrual loans
or loans more than 90 days past due | — | | — | |
The changes in the fair values of these mortgage loans are reported in Other revenue in the Company’s Consolidated Statement of Income. There was no net change in fair value during the sixthree months ended June 30,March 31, 2024 and 2023 and 2022 due to instrument-specific credit risk. Changes in fair value due to instrument-specific credit risk are estimated based on changes in the borrower default, prepayment and recovery forecasts in addition to instrument-specific credit spread. Related interest income continues to be measured based on the contractual interest rates and reported as Interest revenueincome in the Consolidated Statement of Income.
Certain Debt Liabilities
The Company has elected the fair value option for certain debt liabilities, because these exposures are considered to be trading-related positions and, therefore, are managed on a fair value basis. These positions are classified as Long-term debt or Short-term borrowings on the Company’s Consolidated Balance Sheet.
The following table provides information about the carrying value of notes carried at fair value, disaggregated by type of risk:
| | In billions of dollars | In billions of dollars | June 30, 2023 | December 31, 2022 | In billions of dollars | March 31, 2024 | December 31, 2023 |
| Interest rate linked | Interest rate linked | $ | 57.3 | | $ | 53.4 | |
| Foreign exchange linked | 0.1 | | 0.1 | |
| | Equity linked | |
| Equity linked | |
| Equity linked | Equity linked | 48.9 | | 42.5 | |
| Commodity linked | Commodity linked | 4.8 | | 5.0 | |
| Credit linked | Credit linked | 4.8 | | 5.0 | |
| Total | Total | $ | 115.9 | | $ | 106.0 | |
The portion of the changes in fair value attributable to changes in Citigroup’s own credit spreads (DVA) is reflected as a component of AOCI while all other changes in fair value are reported in Principal transactions. Changes in the fair value of these liabilities include accrued interest, which is also included in the change in fair value reported in Principal transactions.
The following table provides information about long-term debt carried at fair value:
| | In millions of dollars | In millions of dollars | June 30, 2023 | December 31, 2022 | In millions of dollars | March 31, 2024 | December 31, 2023 |
| Carrying amount reported on the Consolidated Balance Sheet | Carrying amount reported on the Consolidated Balance Sheet | $ | 115,937 | | $ | 105,995 | |
| Aggregate unpaid principal balance in excess of (less than) fair value | Aggregate unpaid principal balance in excess of (less than) fair value | (1,922) | | (2,944) | |
The following table provides information about short-term borrowings carried at fair value:
| | In millions of dollars | In millions of dollars | June 30, 2023 | December 31, 2022 | In millions of dollars | March 31, 2024 | December 31, 2023 |
| Carrying amount reported on the Consolidated Balance Sheet | Carrying amount reported on the Consolidated Balance Sheet | $ | 5,622 | | $ | 6,222 | |
| Aggregate unpaid principal balance in excess of (less than) fair value | Aggregate unpaid principal balance in excess of (less than) fair value | (14) | | (9) | |
24.25. GUARANTEES AND COMMITMENTS
Citi provides a variety ofThe following tables present information about Citi’s guarantees at March 31, 2024 and indemnifications to its customers to enhance their credit standing and enable them to complete a wide range of business transactions. For certain contracts meeting the definition of a guarantee, the guarantor must recognize, at inception, a liability for the fair value of the obligation undertaken in issuing the guarantee.
In addition, the guarantor must disclose the maximum potential amount of future payments that the guarantor could be required to make under the guarantee, if there were a total default by the guaranteed parties. The determination of the maximum potential future payments is based on the notional
amount of the guarantees without consideration of possible recoveries under recourse provisions or from collateral held or pledged. As such, Citi believes such amounts bear no relationship to the anticipated losses, if any, on these guarantees.December 31, 2023.
For additional information regardingon Citi’s guarantees and indemnifications included in the tables below, as well as its other guarantees and indemnifications excluded from these tables, see Note 2728 to the Consolidated Financial Statements in Citi’s 20222023 Form 10-K.
The following tables present information about Citi’s guarantees at June 30, 2023 and December 31, 2022:
| | | | | | | | | | | | | | |
| Maximum potential amount of future payments | |
| In billions of dollars at June 30, 2023 | Expire within
1 year | Expire after
1 year | Total amount
outstanding | Carrying value (in millions of dollars) |
| Financial standby letters of credit | $ | 21.5 | | $ | 63.1 | | $ | 84.6 | | $ | 780 | |
| Performance guarantees | 4.7 | | 5.9 | | 10.6 | | 48 | |
| Derivative instruments considered to be guarantees | 14.8 | | 31.4 | | 46.2 | | 338 | |
| Loans sold with recourse | 0.6 | | 1.2 | | 1.8 | | 13 | |
Securities lending indemnifications(1) | 108.6 | | — | | 108.6 | | — | |
Credit card merchant processing(2) | 128.3 | | — | | 128.3 | | 1 | |
| Credit card arrangements with partners | 0.1 | | 0.4 | | 0.5 | | 6 | |
| Other | 1.2 | | 8.4 | | 9.6 | | 41 | |
| Total | $ | 279.8 | | $ | 110.4 | | $ | 390.2 | | $ | 1,227 | |
| | | | | | | | | | | | | | |
| | Maximum potential amount of future payments | |
| In billions of dollars at December 31, 2022 | Expire within
1 year | Expire after
1 year | Total amount
outstanding | Carrying value (in millions of dollars) |
| Financial standby letters of credit | $ | 31.3 | | $ | 58.3 | | $ | 89.6 | | $ | 905 | |
| Performance guarantees | 6.1 | | 5.6 | | 11.7 | | 65 | |
| Derivative instruments considered to be guarantees | 18.5 | | 30.0 | | 48.5 | | 353 | |
| Loans sold with recourse | — | | 1.7 | | 1.7 | | 13 | |
Securities lending indemnifications(1) | 95.9 | | — | | 95.9 | | — | |
Credit card merchant processing(2) | 129.6 | | — | | 129.6 | | 1 | |
| Credit card arrangements with partners | — | | 0.6 | | 0.6 | | 7 | |
| Other | 0.1 | | 8.4 | | 8.5 | | 32 | |
| Total | $ | 281.5 | | $ | 104.6 | | $ | 386.1 | | $ | 1,376 | |
| | | | | | | | | | | | | | |
| Maximum potential amount of future payments | |
| In billions of dollars at March 31, 2024 | Expire within
1 year | Expire after
1 year | Total amount
outstanding | Carrying value (in millions of dollars) |
| Financial standby letters of credit | $ | 17.6 | | $ | 63.9 | | $ | 81.5 | | $ | 571 | |
| Performance guarantees | 4.5 | | 5.6 | | 10.1 | | 44 | |
| Derivative instruments considered to be guarantees | 22.4 | | 16.2 | | 38.6 | | 234 | |
| Loans sold with recourse | 0.6 | | 1.2 | | 1.8 | | 16 | |
Securities lending indemnifications(1) | 110.5 | | — | | 110.5 | | — | |
Card merchant processing(2) | 121.1 | | — | | 121.1 | | — | |
| Credit card arrangements with partners | 0.2 | | 0.2 | | 0.4 | | 4 | |
Other(3) | 50.4 | | 7.7 | | 58.1 | | 48 | |
| Total | $ | 327.3 | | $ | 94.8 | | $ | 422.1 | | $ | 917 | |
| | | | | | | | | | | | | | |
| | Maximum potential amount of future payments | |
| In billions of dollars at December 31, 2023 | Expire within
1 year | Expire after
1 year | Total amount
outstanding | Carrying value (in millions of dollars) |
| Financial standby letters of credit | $ | 17.8 | | $ | 63.5 | | $ | 81.3 | | $ | 674 | |
| Performance guarantees | 4.8 | | 5.8 | | 10.6 | | 49 | |
| Derivative instruments considered to be guarantees | 24.2 | | 16.3 | | 40.5 | | 362 | |
| Loans sold with recourse | 0.6 | | 1.2 | | 1.8 | | 16 | |
Securities lending indemnifications(1) | 104.1 | | — | | 104.1 | | — | |
Card merchant processing(2) | 138.0 | | — | | 138.0 | | — | |
| Credit card arrangements with partners | 0.2 | | 0.2 | | 0.4 | | 5 | |
Other(3) | 27.7 | | 7.7 | | 35.4 | | 50 | |
| Total | $ | 317.4 | | $ | 94.7 | | $ | 412.1 | | $ | 1,156 | |
(1)The carrying values of securities lending indemnifications were not material for either period presented, as the probability of potential liabilities arising from these guarantees is minimal.
(2)At June 30, 2023March 31, 2024 and December 31, 2022,2023, this maximum potential exposure was estimated to be approximately $128$121 billion and $130$138 billion, respectively. However, Citi believes that the maximum exposure is not representative of the actual potential loss exposure based on its historical experience. This contingent liability is unlikely to arise, as most products and services are delivered when purchased and amounts are refunded when items are returned to merchants.
(3)Includes guarantees to the Fixed Income Clearing Corporation under the sponsored member repo program.
Loans Sold with Recourse
Loans sold with recourse represent Citi’s obligations to reimburse the buyers for loan losses under certain circumstances. Recourse refers to the clause in a sales agreement under which a seller/lender will fully reimburse the buyer/investor for any losses resulting from the purchased loans. This may be accomplished by the sellers taking back any loans that become delinquent.
In addition to the amounts presented in the tables above, Citi has recorded a repurchase reserve for its potential repurchases or make-whole liability regarding residential mortgage representation and warranty claims related to its whole loan sales to U.S. government-sponsored agencies and, to a lesser extent, private investors. Thethe repurchase reserve was approximately $10$11 million and $10$11 million at June 30, 2023March 31, 2024 and December 31, 2022,2023, respectively, and these amounts are included in Other liabilities on the Consolidated Balance Sheet.
Credit Card Arrangements with Partners
Citi, in one of its credit card partner arrangements, provides guarantees to the partner regarding the volume of certain customer originations during the term of the agreement. To the extent that such origination targets are not met, the guarantees serve to compensate the partner for certain payments that otherwise would have been generated in connection with such originations.
Other Guarantees and Indemnifications
Credit Card Protection Programs
Citi, through its credit card businesses, provides various cardholder protection programs on several of its card products, including programs that provide insurance coverage for rental cars, coverage for certain losses associated with purchased products, price protection for certain purchases and protection for lost luggage. These guarantees are not included in the table, since the total outstanding amount of the guarantees and Citi’s maximum exposure to loss cannot be quantified. The protection is limited to certain types of purchases and losses, and it is not possible to quantify the purchases that would qualify for these benefits at any given time. Citi assesses the probability and amount of its potential liability related to these programs based on the extent and nature of its historical loss experience. At June 30, 2023 and December 31, 2022, the actual and estimated losses incurred and the carrying value of Citi’s obligations related to these programs were immaterial.
Value-Transfer Networks (Including Exchanges and Clearing Houses) (VTNs)
Citi is a member of, or shareholder in, hundreds of value-transfer networks (VTNs) (payment, clearing and settlement systems as well as exchanges) around the world. As a condition of membership, many of these VTNs require that members stand ready to pay a pro rata share of the losses incurred by the organization due to another member’s default on its obligations. Citi’s potential obligations may be limited to its membership interests in the VTNs, contributions to the VTN’s funds, or, in certain narrow cases, to the full pro rata share. The maximum exposure is difficult to estimate as this
would require an assessment of claims that have not yet occurred; however, Citi believes the risk of loss is remote given historical experience with the VTNs. Accordingly, Citi’s participation in VTNs is not reported in the guarantees tables above, and there are no amounts reflected on the Consolidated Balance Sheet as of June 30, 2023 or December 31, 2022 for potential obligations that could arise from Citi’s involvement with VTN associations.
Long-Term Care (LTC) Insurance Indemnification
Citi has an indemnification contingency to Brighthouse Financial in connection with Citi’s sale of an insurance subsidiary. A liability under this indemnification agreement is currently remote because Brighthouse Financial would become responsible for LTC policyholder claims only when both the reinsurance provided by other parties ceases and trust assets set aside to meet these claims are not adequate. However, should events occur causing both the reinsurance protection and trust collateral to become insufficient to cover Brighthouse Financial’s LTC policyholder claims, Citi will be required to either estimate and disclose a reasonably possible loss or range of loss to the extent that such an estimate can be made, or to accrue for such liability if the event becomes probable and estimable. Citi continues to closely monitor its potential exposure under this indemnification obligation. For additional information, see Note 27 to the Consolidated Financial Statements in Citi’s 2022 Form 10-K.
Futures and Over-the-Counter Derivatives Clearing
Citi provides clearing services on central clearing parties (CCP) for clients that need to clear exchange-traded and over-the-counter (OTC) derivatives contracts with CCPs. Based on all relevant facts and circumstances, Citi has concluded that it acts as an agent for accounting purposes in its role as clearing member for these client transactions. As such, Citi does not reflect the underlying exchange-traded or OTC derivatives contracts in its Consolidated Financial Statements. See Note 21 for a discussion of Citi’s derivatives activities that are reflected in its Consolidated Financial Statements.
As a clearing member, Citi collects and remits cash and securities collateral (margin) between its clients and the respective CCP. In certain circumstances, Citi collects a higher amount of cash (or securities) from its clients than it needs to remit to the CCPs. This excess cash is then held at depository institutions such as banks or carry brokers.
There are two types of margin: initial and variation. Where Citi obtains benefits from or controls cash initial margin (e.g., retains an interest spread), cash initial margin collected from clients and remitted to the CCP or depository institutions is reflected within Brokerage payables (payables to customers) and Brokerage receivables (receivables from brokers, dealers and clearing organizations) or Cash and due from banks, respectively.
However, for exchange-traded and OTC-cleared derivatives contracts where Citi does not obtain benefits from or control the client cash balances, the client cash initial margin collected from clients and remitted to the CCP or depository institutions is not reflected on Citi’s Consolidated Balance Sheet. These conditions are met when Citi has contractually agreed with the client that (i) Citi will pass
through to the client all interest paid by the CCP or depository institutions on the cash initial margin, (ii) Citi will not utilize its right as a clearing member to transform cash margin into other assets, (iii) Citi does not guarantee and is not liable to the client for the performance of the CCP or the depository institution and (iv) the client cash balances are legally isolated from Citi’s bankruptcy estate. The total amount of cash initial margin collected and remitted in this manner was approximately $18.3$17.1 billion and $18.0$17.8 billion as of June 30, 2023March 31, 2024 and December 31, 2022,2023, respectively.
Variation margin due from clients to the respective CCP, or from the CCP to clients, reflects changes in the value of the client’s derivative contracts for each trading day. As a clearing member, Citi is exposed to the risk of non-performance by clients (e.g., failure of a client to post variation margin to the CCP for negative changes in the value of the client’s derivative contracts). In the event of non-performance by a client, Citi would move to close out the client’s positions. The CCP would typically utilize initial margin posted by the client and held by the CCP, with any remaining shortfalls required to be paid by Citi as clearing member. Citi generally holds incremental cash or securities margin posted by the client, which would typically be expected to be sufficient to mitigate Citi’s credit risk in the event the client fails to perform.
As required by ASC 860-30-25-5, securities collateral posted by clients is not recognized on Citi’s Consolidated Balance Sheet.
Carrying Value—Guarantees and Indemnifications
At June 30, 2023March 31, 2024 and December 31, 2022,2023, the total carrying amounts of the liabilities related to the guarantees and indemnifications included in the tables above amounted to approximately $1.2$0.9 billion and $1.4$1.2 billion, respectively. The carrying value of financial and performance guarantees is included in Other liabilities. For loans sold with recourse, the carrying value of the liability is included in Other liabilities.
Collateral
Cash collateral available to Citi to reimburse losses realized under these guarantees and indemnifications amounted to $51.5$55.1 billion and $51.8$52.5 billion at June 30, 2023March 31, 2024 and December 31, 2022,2023, respectively. Securities and other marketable assets held as collateral amounted to $73.4$74.3 billion and $63.7$67.7 billion at June 30, 2023March 31, 2024 and December 31, 2022,2023, respectively. The majority of collateral is held to reimburse losses realized under securities lending indemnifications. In addition, letters of credit in favor of Citi held as collateral amounted to $3.0 billion and $3.7$3.1 billion at June 30, 2023March 31, 2024 and December 31, 2022,2023, respectively. Other property may also be available to Citi to cover losses under certain guarantees and indemnifications; however, the value of such property has not been determined.
Performance Risk
Presented in the tables below are the maximum potential amounts of future payments that are classified based on internal and external credit ratings. The determination of the maximum potential future payments is based on the notional amount of the guarantees without consideration of possible recoveries under recourse provisions or from collateral held or pledged. As such, Citi believes such amounts bear no relationship to the anticipated losses, if any, on these guarantees.
| | | | | | | | | | | | | | |
| | Maximum potential amount of future payments |
| In billions of dollars at March 31, 2024 | Investment
grade | Non-investment
grade | Not
rated | Total |
| Financial standby letters of credit | $ | 69.4 | | $ | 12.1 | | $ | — | | $ | 81.5 | |
| Loans sold with recourse | — | | — | | 1.8 | | 1.8 | |
| Other | — | | 7.7 | | — | | 7.7 | |
| Total | $ | 69.4 | | $ | 19.8 | | $ | 1.8 | | $ | 91.0 | |
| | | | | | | | | | | | | | |
| | Maximum potential amount of future payments |
| In billions of dollars at June 30, 2023 | Investment
grade | Non-investment
grade | Not
rated | Total |
| Financial standby letters of credit | $ | 73.0 | | $ | 10.1 | | $ | 1.5 | | $ | 84.6 | |
| Loans sold with recourse | — | | — | | 1.8 | | 1.8 | |
| Other | 1.1 | | 8.5 | | — | | 9.6 | |
| Total | $ | 74.1 | | $ | 18.6 | | $ | 3.3 | | $ | 96.0 | |
| | | | Maximum potential amount of future payments | | Maximum potential amount of future payments |
| In billions of dollars at December 31, 2022 | Investment
grade | Non-investment
grade | Not
rated | Total |
| In billions of dollars at December 31, 2023 | | In billions of dollars at December 31, 2023 | Investment
grade | Non-investment
grade | Not
rated | Total |
| Financial standby letters of credit | Financial standby letters of credit | $ | 77.9 | | $ | 10.4 | | $ | 1.3 | | $ | 89.6 | |
| Loans sold with recourse | Loans sold with recourse | — | | — | | 1.7 | | 1.7 | |
| Other | Other | — | | 8.5 | | — | | 8.5 | |
| Total | Total | $ | 77.9 | | $ | 18.9 | | $ | 3.0 | | $ | 99.8 | |
Credit Commitments and Lines of Credit
The table below summarizes Citigroup’s credit commitments:
| | | | | | | | | | | | | | |
| In millions of dollars | U.S. | Outside of U.S.(1) | June 30,
2023 | December 31, 2022 |
| Commercial and similar letters of credit | $ | 457 | | $ | 4,412 | | $ | 4,869 | | $ | 5,316 | |
| One- to four-family residential mortgages | 1,728 | | 849 | | 2,577 | | 2,394 | |
| Revolving open-end loans secured by one- to four-family residential properties | 5,656 | | 668 | | 6,324 | | 6,380 | |
| Commercial real estate, construction and land development | 13,399 | | 1,596 | | 14,995 | | 15,170 | |
| Credit card lines | 612,136 | | 76,513 | | 688,649 | | 683,232 | |
| Commercial and other consumer loan commitments | 199,231 | | 108,309 | | 307,540 | | 297,399 | |
| Other commitments and contingencies | 5,333 | | 272 | | 5,605 | | 5,673 | |
| Total | $ | 837,940 | | $ | 192,619 | | $ | 1,030,559 | | $ | 1,015,564 | |
(1)Consumer commitments related to the business HFS countries under sales agreements are reflected in their original categories until the respective sales are completed.
The majority of unused commitments are contingent upon customers maintaining specific credit standards. Commercial commitments generally have floating interest rates and fixed expiration dates and may require payment of fees. Such fees (net of certain direct costs) are deferred and, upon exercise of the commitment, amortized over the life of the loan or, if exercise is deemed remote, amortized over the commitment period.
The table below summarizes Citigroup’s credit commitments:
Other Commitments and Contingencies | | | | | | | | | | | | | | |
| In millions of dollars | U.S. | Outside of U.S.(1) | March 31,
2024 | December 31, 2023 |
| Commercial and similar letters of credit | $ | 691 | | $ | 4,038 | | $ | 4,729 | | $ | 5,345 | |
| One- to four-family residential mortgages | 859 | | 726 | | 1,585 | | 1,245 | |
| Revolving open-end loans secured by one- to four-family residential properties | 5,415 | | 23 | | 5,438 | | 5,495 | |
| Commercial real estate, construction and land development | 13,524 | | 1,392 | | 14,916 | | 15,266 | |
| Credit card lines | 618,246 | | 65,104 | | 683,350 | | 677,005 | |
| Commercial and other consumer loan commitments | 212,591 | | 104,467 | | 317,058 | | 312,300 | |
Other commitments and contingencies(2) | 4,918 | | 223 | | 5,141 | | 5,146 | |
| Total | $ | 856,244 | | $ | 175,973 | | $ | 1,032,217 | | $ | 1,021,802 | |
(1)Consumer commitments related to the business HFS countries under sales agreements are reflected in their original categories until the respective sales are completed.
(2)Other commitments and contingencies include all other transactions relatedcommitments to commitmentspurchase certain debt and contingencies not reported on the lines above.equity securities.
Unsettled Reverse Repurchase
Other Commitments
As a Federal Reserve member bank, Citi is required to subscribe to half of a certain amount of shares issued by its Federal Reserve District Bank. As of March 31, 2024 and Securities Borrowing Agreements and Unsettled Repurchase and Securities Lending AgreementsDecember 31, 2023, Citi holds shares with a carrying value of $4.5 billion, with the remaining half subject to call by the Federal Reserve District Bank Board.
In addition, in the normal course of business, Citigroup enters into reverse repurchase and securities borrowing agreements, as well as repurchase and securities lending agreements, which settle at a future date. At June 30, 2023March 31, 2024 and December 31, 2022, Citigroup2023, Citi had approximately $150.4$178.1 billion and $111.6$120.9 billion of unsettled reverse repurchase and securities borrowing agreements, and approximately $117.5$165.3 billion and $37.3$96.4 billion of unsettled repurchase and securities lending agreements, respectively. See Note 1011 for a further discussion of securities purchased under agreements to resell and securities borrowed, and securities sold under agreements to repurchase and securities loaned, including the Company’s policy for offsetting repurchase and reverse repurchase agreements.
Restricted Cash
Citigroup defines restricted cash (as cash subject to withdrawal restrictions) to include cash deposited with central banks that must be maintained to meet minimum regulatory requirements, and cash set aside for the benefit of customers or for other purposes such as compensating balance arrangements or debt retirement. Restricted cash may include minimum reserve requirements at certain central banks and cash segregated to satisfy rules regarding the protection of customer assets as required by Citigroup broker-dealers’ primary regulators, including the SEC, the Commodity Futures Trading Commission and the United Kingdom’s Prudential Regulation Authority.
Restricted cash is included on the Consolidated Balance Sheet within the following balance sheet lines:
| | In millions of dollars | In millions of dollars | June 30,
2023 | December 31, 2022 | In millions of dollars | March 31,
2024 | December 31, 2023 |
| Cash and due from banks | Cash and due from banks | $ | 3,860 | | $ | 4,820 | |
| Deposits with banks, net of allowance | Deposits with banks, net of allowance | 12,262 | | 12,156 | |
| Total | Total | $ | 16,122 | | $ | 16,976 | |
In addition to the restricted cash amounts presented above, at June 30, 2023March 31, 2024 and December 31, 2022,2023, approximately $2.8$4.6 billion and $1.8$3.9 billion, respectively, was held at the Deposit Insurance Agency and Russia National Settlements Depository(DIA) and was subject to restrictions imposed by the Russian government. These restricted amounts are reported within Other assets on the Consolidated Balance Sheet.
25.26. LEASES
The Company’s operating leases, where Citi is a lessee, include real estate, such as office space and branches, and various types of equipment. These leases may contain renewal and extension options and early termination features; however, these options do not impact the lease term unless the Company is reasonably certain that it will exercise options. These leases have a weighted-average remaining lease term of approximately six years as of June 30, 2023.March 31, 2024.
For additional information regarding Citi’s leases, see Notes 1 and 2829 to the Consolidated Financial Statements in Citi’s 20222023 Form 10-K.
The following table presents information on the right-of-use (ROU) asset and lease liabilities included in Premises and equipment and Other liabilities, respectively:
| | In millions of dollars | In millions of dollars | June 30,
2023 | December 31,
2022 | In millions of dollars | March 31,
2024 | December 31,
2023 |
| ROU asset | ROU asset | $ | 2,827 | | $ | 2,892 | |
| Lease liability | Lease liability | 3,016 | | 3,076 | |
The Company recognizes fixed lease costs on a straight-line basis throughout the lease term in the Consolidated Statement of Income. In addition, variable lease costs are recognized in the period in which the obligation for those payments is incurred.
26.27. CONTINGENCIES
The following information supplements and amends, as applicable, the disclosure in Note 2530 to the Consolidated Financial Statements in Citi’s First Quarter 2023 Form 10-Q and in Note 29 to the Consolidated Financial Statements in Citi’s 2022 Form 10-K. For purposes of this Note, Citigroup, its affiliates and subsidiaries and current and former officers, directors, and employees, are sometimes collectively referred to as Citigroup and Related Parties.
In accordance with ASC 450, Citigroup establishes accruals for contingencies, including any litigation, regulatory, or tax matters disclosed herein, when Citigroup believes it is probable that a loss has been incurred and the amount of the loss can be reasonably estimated. Once established, accruals are adjusted from time to time, as appropriate, in light of additional information. The amount of loss ultimately incurred in relation to those matters may be substantially higher or lower than the amounts accrued for those matters. With respect to previously incurred loss contingencies for which recovery is expected, Citi applies loss recovery accounting when disputes and uncertainties affecting recognition are resolved.
If Citigroup has not accrued for a matter because the matter does not meet the criteria for accrual (as set forth above), or Citigroup believes an exposure to loss exists in excess of the amount accrued for a particular matter, in each case assuming a material loss is reasonably possible but not probable, Citigroup discloses the matter. In addition, for such matters, Citigroup discloses an estimate of the aggregate reasonably possible loss or range of loss in excess of the amounts accrued for those matters for which an estimate can be made. At June 30, 2023,March 31, 2024, Citigroup estimates that the reasonably possible unaccrued loss for these matters ranges up to approximately $1.3$1.2 billion in the aggregate.
As available information changes, the matters for which Citigroup is able to estimate will change, and the estimates themselves will change. In addition, while many estimates presented in financial statements and other financial disclosures involve significant judgment and may be subject to significant uncertainty, estimates of the range of reasonably possible loss arising from litigation, regulatory, tax, or other matters are subject to particular uncertainties. For example, at the time of making an estimate, Citigroup may only have preliminary or incomplete information about the facts underlying the claim; its assumptions about the future rulings of the court or other tribunal on significant issues, or the behavior and incentives of adverse parties, regulators, or tax authorities may prove to be wrong; and the outcomes it is attempting to predict are often not amenable to the use of statistical or other quantitative analytical tools. In addition, from time to time an outcome may occur that Citigroup had not accounted for in its estimates because it had deemed such an outcome to be remote. For all these reasons, the amount of loss in excess of amounts accrued in relation to matters for which an estimate has been made could be substantially higher or lower than the range of loss included in the estimate.
Subject to the foregoing, it is the opinion of Citigroup’s management, based on current knowledge and after taking into account its current accruals, that the eventual outcome of all
matters described in this Note would not be likely to have a
material adverse effect on the consolidated financial condition of Citigroup. Nonetheless, given the substantial or indeterminate amounts sought in certain of these matters and the inherent unpredictability of such matters, an adverse outcome in certain of these matters could, from time to time, have a material adverse effect on Citigroup’s consolidated results of operations or cash flows in particular quarterly or annual periods.
For further information on ASC 450 and Citigroup’s accounting and disclosure framework for contingencies, including for any litigation, regulatory, and tax matters disclosed herein, see Note 2930 to the Consolidated Financial Statements in Citi’s 20222023 Form 10-K.
Equities Trading Incident Matters
Government and regulatory agencies in the U.K. and Europe are conducting investigations or making inquiries regarding an equity desk trading error that occurred on May 2, 2022. Citigroup is cooperating with these investigations and inquiries.
FDIC Special Assessment
On May 11,November 29, 2023, the FDIC issuedpublished a notice of proposed rulemaking that would implementfinal rule implementing a special assessment—primarily upon large banks—assessment to recover the uninsured deposit losses from the failures of Silicon Valley Bank and Signature Bank.Bank, estimated to be approximately $16.3 billion. In the first quarter of 2024, Citi received notification from the FDIC that the estimate increased to $20.4 billion, which may be further adjusted by subsequent recoveries. The FDIC estimated that of the cost of the failures of Silicon Valley Bank and Signature Bank, approximately $15.8 billion was attributableplans to the protection of uninsured depositors, an estimate that will be periodically adjusted. The FDIC has proposed collectingprovide institutions subject to the special assessment atwith an annual rateupdated estimate of approximately 12.5 basis pointseach institution’s quarterly and total special assessment expense with its first-quarter 2024 special assessment invoice. In the first quarter of uninsured deposits over eight quarterly assessment periods beginning2024, Citi increased its total accrued estimated liability to $2.0 billion within Other liabilities and reported the corresponding incremental expense of $251 million in 2024. There is sufficient uncertainty aroundOther operating expenses in the final FDIC regulation that would impact both the timing and amount. If the final ruleConsolidated Statement of Income (and within Corporate/Other in All Other) for the FDIC special assessment is enacted as proposed, which is expected before the end of 2023, Citi estimates that the impact would be significant, potentially a pretax charge of up to $1.5 billion. This amount is not included in the reasonably possible loss estimate above.assessment.
Foreign Exchange MattersLitigation
Antitrust and Other Litigation:On May 23, 2023,February 8, 2024, in ALLIANZ GLOBAL INVESTORS GMBH AND OTHERSMICHAEL O’HIGGINS FX CLASS REPRESENTATIVE LIMITED v. BARCLAYS BANK PLC AND OTHERS, Michael O’Higgins FX Class Representative Limited withdrew its application requesting permission to commence collective proceedings against the High Court of Justice in London formally discontinued the case in light of a March 29, 2023 settlement agreement.defendants. Additional information concerning this action is publicly available in court filings under the case number CL-2018-0008401329/7/7/19 in the HighU.K. Competition Appeal Tribunal and CA-2022-002002 in the Court of Appeal.
Interchange Fee Litigation
On February 22, 2024, the district court issued decisions on several summary judgment motions, including denials of both plaintiffs’ and defendants’ motions. On March 26, 2024, Visa, MasterCard and the injunctive relief class plaintiffs filed a motion seeking preliminary approval of the parties’ agreement to settle, and the court scheduled a preliminary approval hearing for June 13, 2024. On April 2, 2024, the district court entered rulings on the last outstanding motions for summary judgment, granting some and denying others. Additional
information concerning these consolidated actions is publicly available in court filings under the casedocket number 1430/5/7/22 (T) in the Competition Appeal Tribunal.MDL 05-1720 (E.D.N.Y.) (Brodie, J.).
Madoff-Related Litigation
On May 18, 2023,March 14, 2024, in ALLIANZ GLOBAL INVESTORS, ET AL.PICARD v. BANK OF AMERICA CORP.CITIBANK, N.A., ET AL., the United States District Court for the Southern District of New York approveddenied the Citi defendants leave to file an interlocutory appeal of the bankruptcy court’s decision denying their motion to dismiss the amended complaint. Additional information concerning this action is publicly available in court filings under the docket numbers 10-5345 (Bankr. S.D.N.Y.) (Beckerman, J.) and 22-9597 (S.D.N.Y.) (Gardephe, J.).
Variable Rate Demand Obligation Litigation
On February 5, 2024, the United States Court of Appeals for the Second Circuit granted defendants’ Rule 23(f) petition to appeal the district court’s order granting class certification. Additional information concerning this action is publicly available in court filings under the docket numbers 19-CV-1608 (S.D.N.Y.) (Furman, J.), 23-7328 (2d Cir.), and 24-297 (2d Cir.).
In ILLINOIS EX REL. EDELWEISS FUND, LLC v. JP MORGAN CHASE & CO., ET AL., the parties entered into a stipulation dismissing all remaining claims in the case with prejudice.settlement agreement effective February 1, 2024. Additional information concerning this action is publicly available in court filings under the docket number 18-CV-10364 (S.D.N.Y.2017 L 000289 (Ill. Cir. Ct.) (Schofield,(Donnelly, J.).
On July 25, 2023, the English Court of Appeal issued its judgment in MICHAEL O’HIGGINS FX CLASS REPRESENTATIVE LIMITED v. BARCLAYS BANK PLC AND OTHERS and PHILLIP EVANS v. BARCLAYS BANK PLC AND OTHERS on the claimants’ appeal from the Competition Appeal Tribunal’s March 31, 2022 judgment on certification and directed that the case proceed upon an opt-out basis with Phillip Evans having carriage of the claims.
Additional information concerning these actions is publicly available in court filings under the case numbers 1329/7/7/19 and 1336/7/7/19 in the Competition Appeal Tribunal and CA-2022-002002 and CA-2022-002003 in the Court of Appeal.
On April 13, 2023, in NYPL v. JPMORGAN CHASE & CO., ET AL., plaintiffs filed an appeal from the dismissal of the case by the district court to the United States Court of Appeals for the Second Circuit. Additional information concerning this action is publicly available in court filings under the docket numbers 15-CV-2290 (N.D. Cal.) (Chhabria, J.), 15-CV-9300 (S.D.N.Y.) (Schofield, J.), 22-698 (2d Cir.), and 23-619 (2d Cir.).
Madoff-Related Litigation
On May 5, 2023, in FAIRFIELD SENTRY LTD., ET AL. v. ZURICH CAPITAL MARKETS COMPANY, ET AL, the British Virgin Islands liquidators of Fairfield Sentry Limited voluntarily dismissed the pending claims against Citi (Switzerland) AG and Citivic Nominees Ltd. without prejudice. The claims previously dismissed against Citi (Switzerland) AG and Citivic Nominees Ltd. remain subject to the pending consolidated direct appeal in the United States Court of Appeals for the Second Circuit and are unaffected by the liquidators’ voluntary dismissal. Additional information is publicly available in court filings under the docket number 10-3634 (Bankr. S.D.N.Y.) (Mastando, J.).
On July 5, 2023, in FAIRFIELD SENTRY LTD., ET AL. v. CITIGROUP GLOBAL MARKETS LTD., ET AL.; FAIRFIELD SENTRY LTD., ET AL. v. ZURICH CAPITAL MARKETS COMPANY, ET AL.; and FAIRFIELD SENTRY LTD., ET AL. v. CITIBANK NA LONDON, ET AL. the United States Court of Appeals for the Second Circuit granted CGML, Citibank (Switzerland) AG, Citivic Nominees Ltd., and Citibank, NA London leave to appeal the district court’s decision permitting a single claim to proceed against them and consolidated the interlocutory appeals with the liquidators’ pending consolidated direct appeal. Additional information is publicly available in court filings under the docket numbers 22-2101 (consolidated lead appeal), 23-549, 23-572, 23-573, 23-975, 23-982, and 23-987 (2d Cir.).
Sovereign Securities Matters
Regulatory Actions: On May 24, 2023, the UK Competition & Markets Authority (CMA) announced that it has provisionally found that Citigroup, CGML and four other banks unlawfully shared information related to the buying and selling of British pound sterling-denominated government bonds issued by the United Kingdom. The CMA further announced that Citigroup and CGML applied for leniency and had entered into a settlement agreement with the CMA.
Antitrust and Other Litigation:On June 16, 2023, purchasers of British pound sterling-denominated government bonds issued by the United Kingdom filed a proposed class action against CGMI, CGML and others, captioned OKLAHOMA FIREFIGHTERS PENSION AND RETIREMENT SYSTEM v. DEUTSCHE BANK AKTIENGESELLSCHAFT (F/K/A DEUTSCHE BANK AG), ET AL., in the United States District Court for the Southern District of New York. Plaintiffs allege that defendants engaged in a conspiracy to inflate prices of United Kingdom government bonds in secondary markets. Plaintiffs assert a claim under the Sherman Act and seek treble damages and attorneys’ fees. Additional information relating to this action is publicly available in court filings under the docket number 1:23-cv-05095 (JGK).
Settlement Payments
Payments required in any settlement agreements described above have been made or are covered by existing litigation or other accruals.
27.28. SUBSIDIARY GUARANTEES
Citigroup Inc. has fully and unconditionally guaranteed the payments due on debt securities issued by Citigroup Global Markets Holdings Inc. (CGMHI), a wholly owned subsidiary, under the Senior Debt Indenture dated as of March 8, 2016, between CGMHI, Citigroup Inc. and The Bank of New York Mellon, as trustee. In addition, Citigroup Capital III and Citigroup Capital XIII (collectively, the Capital Trusts), each of which is a wholly owned finance subsidiary of Citigroup Inc., have issued trust preferred securities. Citigroup Inc. has guaranteed the payments due on the trust preferred securities
to the extent that the Capital Trusts have insufficient available
funds to make payments on the trust preferred securities. The guarantee, together with Citigroup Inc.’s other obligations with respect to the trust preferred securities, effectively provides a full and unconditional guarantee of amounts due on the trust preferred securities (see Note 17 for additional information)18). No other subsidiary of Citigroup Inc. guarantees the debt securities issued by CGMHI or the trust preferred securities issued by the Capital Trusts.
Summarized financial information for Citigroup Inc. and CGMHI is presented in the tables below:
SUMMARIZED INCOME STATEMENT
| | Six Months Ended |
| June 30, 2023 | |
| Three Months Ended | |
| Three Months Ended | |
| Three Months Ended | |
| March 31, 2024 | |
| In millions of dollars | |
| In millions of dollars | |
| In millions of dollars | In millions of dollars | Citigroup parent company | CGMHI | |
| Total revenues, net of interest expense | Total revenues, net of interest expense | $ | 6,584 | | $ | 5,960 | | |
| Total revenues, net of interest expense | |
| Total revenues, net of interest expense | |
| Total operating expenses | |
| Total operating expenses | |
| Total operating expenses | Total operating expenses | 99 | | 5,911 | | |
| Provision for credit losses | Provision for credit losses | — | | 23 | | |
| Provision for credit losses | |
| Provision for credit losses | |
| Equity in undistributed income of subsidiaries | |
| Equity in undistributed income of subsidiaries | |
| Equity in undistributed income of subsidiaries | Equity in undistributed income of subsidiaries | 581 | | — | | |
| Income (loss) from continuing operations before income taxes | Income (loss) from continuing operations before income taxes | $ | 7,066 | | $ | 26 | | |
| Income (loss) from continuing operations before income taxes | |
| Income (loss) from continuing operations before income taxes | |
| Provision (benefit) for income taxes | |
| Provision (benefit) for income taxes | |
| Provision (benefit) for income taxes | Provision (benefit) for income taxes | (455) | | 54 | | |
| Net income | Net income | $ | 7,521 | | $ | (28) | | |
| Net income | |
| Net income | |
SUMMARIZED BALANCE SHEET
| | June 30, 2023 | December 31, 2022 |
| March 31, 2024 | | | March 31, 2024 | December 31, 2023 |
| In millions of dollars | In millions of dollars | Citigroup parent company | CGMHI | Citigroup parent company | CGMHI | In millions of dollars | Citigroup parent company | CGMHI | Citigroup parent company | CGMHI |
| Cash and deposits with banks | Cash and deposits with banks | $ | 3,016 | | $ | 21,506 | | $ | 3,015 | | $ | 27,122 | |
| Securities borrowed and purchased under resale agreements | Securities borrowed and purchased under resale agreements | — | | 276,820 | | — | | 306,273 | |
| Trading account assets | Trading account assets | 262 | | 271,512 | | 306 | | 209,957 | |
| Advances to subsidiaries | Advances to subsidiaries | 152,188 | | — | | 146,843 | | — | |
| Investments in subsidiary bank holding company | Investments in subsidiary bank holding company | 175,277 | | — | | 172,721 | | — | |
| Investments in non-bank subsidiaries | Investments in non-bank subsidiaries | 48,010 | | — | | 48,295 | | — | |
| Other assets | Other assets | 15,896 | | 171,046 | | 13,788 | | 163,819 | |
| Total assets | Total assets | $ | 394,649 | | $ | 740,884 | | $ | 384,968 | | $ | 707,171 | |
| Securities loaned and sold under agreements to repurchase | Securities loaned and sold under agreements to repurchase | $ | — | | $ | 292,491 | | $ | — | | $ | 245,916 | |
| Trading account liabilities | Trading account liabilities | 578 | | 114,874 | | 604 | | 115,929 | |
| Short-term borrowings | Short-term borrowings | — | | 26,731 | | — | | 43,850 | |
| Long-term debt | Long-term debt | 163,043 | | 186,966 | | 166,257 | | 172,068 | |
| Advances from subsidiaries | Advances from subsidiaries | 19,579 | | — | | 14,562 | | — | |
| Other liabilities | Other liabilities | 2,730 | | 81,446 | | 2,356 | | 90,570 | |
| Stockholders’ equity | Stockholders’ equity | 208,719 | | 38,376 | | 201,189 | | 38,838 | |
| Total liabilities and equity | Total liabilities and equity | $ | 394,649 | | $ | 740,884 | | $ | 384,968 | | $ | 707,171 | |
UNREGISTERED SALES OF EQUITY SECURITIES, REPURCHASES OF EQUITY SECURITIES AND DIVIDENDS
Unregistered Sales of Equity Securities
None.
Equity Security Repurchases
All large banks, including Citi, are subject to limitations on capital distributions in the event of a breach of any regulatory capital buffers, including the Stress Capital Buffer, with the degree of such restrictions based on the extent to which the buffers are breached. For additional information, see “Capital Resources—Regulatory Capital Buffers” and “Risk Factors—Strategic Risks,” “—Operational Risks” and “—Compliance Risks” in Citi’s 20222023 Form 10-K.
The following table summarizes Citi’s common share repurchases for the secondfirst quarter of 2023:2024:
| | In millions, except per share amounts | Total shares purchased | Average
price paid
per share | |
| April 2023 | | |
| In thousands, except per share amounts | |
| In thousands, except per share amounts | |
| In thousands, except per share amounts | |
| January 2024 | |
| January 2024 | |
| January 2024 | |
Open market repurchases(1) | |
Open market repurchases(1) | |
Open market repurchases(1) | Open market repurchases(1) | — | | $ | — | | |
Employee transactions(2) | Employee transactions(2) | — | | — | | |
| May 2023 | | |
Employee transactions(2) | |
Employee transactions(2) | |
| February 2024 | |
| February 2024 | |
| February 2024 | |
Open market repurchases(1) | |
Open market repurchases(1) | |
Open market repurchases(1) | Open market repurchases(1) | 1.1 | | 44.05 | | |
Employee transactions(2) | Employee transactions(2) | — | | — | | |
| June 2023 | | |
Employee transactions(2) | |
Employee transactions(2) | |
| March 2024 | |
| March 2024 | |
| March 2024 | |
Open market repurchases(1) | |
Open market repurchases(1) | |
Open market repurchases(1) | Open market repurchases(1) | 20.1 | | 47.24 | | |
Employee transactions(2) | Employee transactions(2) | — | | — | | |
| Total for 2Q23 | 21.2 | | $ | 47.07 | | |
Employee transactions(2) | |
Employee transactions(2) | |
| Total for 1Q24 | |
| Total for 1Q24 | |
| Total for 1Q24 | |
(1) Repurchases not made pursuant to any publicly announced plan or program.
(2) During the secondfirst quarter, pursuant to Citigroup’s Board of Directors’ authorization, Citi withheld an insignificant number of shares of common stock, added to treasury stock, related to activity on employee stock programs to satisfy the employee tax requirements.
As previously announced, Citi will continue to assess common share repurchases on a quarter-by-quarter basis given uncertainty regarding regulatory capital requirements.
Dividends
Citi paid common dividends of $0.51$0.53 per share for the secondfirst quarter of 2023,2024, and on July 20, 2023,April 3, 2024, declared common dividends of $0.53 per share for the thirdsecond quarter of 2023.2024. Citi intends to maintain a quarterly common dividend of at least $0.53 per share, subject to financial and macroeconomic conditions as well asand its Board of Directors’ approval.
As discussed above, Citi’s ability to pay common stock dividends is subject to limitations on capital distributions in the event of a breach of any regulatory capital buffers, including the Stress Capital Buffer, with the degree of such restrictions based on the extent to which the buffers are breached. For additional information, see “Capital Resources—Regulatory Capital Buffers” and “Risk Factors—Strategic Risks,” “—Operational Risks” and “—Compliance Risks” in Citi’s 20222023 Form 10-K.
Any dividend on Citi’s outstanding common stock would also need to be in compliance with Citi’s obligations on its outstanding preferred stock.
On July 20, 2023,April 3, 2024, Citi declared preferred dividends of approximately $333$242 million for the thirdsecond quarter of 2023.2024.
For information on the ability of Citigroup’s subsidiary depository institutions to pay dividends, see Note 1920 to the Consolidated Financial Statements in Citi’s 20222023 Form 10-K.
OTHER INFORMATION
Insider Trading Arrangements
During the secondfirst quarter of 2023,2024, no director or executive officer of Citi adopted or terminated any Rule 10b5-1 or non-Rule 10b5-1 trading arrangement (each, as defined in Item 408 of Regulation S-K).
SIGNATURES
Pursuant to the requirements of the Securities Exchange Act of 1934, the Registrant has duly caused this report to be signed on its behalf by the undersigned, thereunto duly authorized, on the 4th3rd day of August, 2023.May, 2024.
CITIGROUP INC.
(Registrant)
By /s/ Mark A. L. Mason
Mark A. L. Mason
Chief Financial Officer
(Principal Financial Officer)
By /s/ Johnbull E. Okpara
Johnbull E. Okpara
Controller and Chief Accounting Officer
(Principal Accounting Officer)
GLOSSARY OF TERMS AND ACRONYMS
The following is a list of terms and acronyms that are used in this Quarterly Report on Form 10-Qreport and certain other Citigroup SEC filings and presentations.
* Denotes a Citi metric
20222023 Form 10-K: Annual Report on Form 10-K for the year ended December 31, 2022,2023, filed with the SEC.
90+ days past due delinquency rate*: Represents consumer loans that are past due by 90 or more days, divided by that period’s total EOP loans.
ABS: Asset-backed securities
ACL: Allowance for credit losses, which is composed of the allowance for credit losses on loans (ACLL), allowance for credit losses on unfunded lending commitments (ACLUC), allowance for credit losses on HTM securities and allowance for credit losses on other assets.
ACLL: Allowance for credit losses on loans
ACLUC: Allowance for credit losses on unfunded lending commitments
Advanced Approaches: The Advanced Approaches capital framework, established through Basel III rules by the FRB, requires certain banking organizations to use an internal ratings-based approach and other methodologies to calculate risk-based capital requirements for credit risk and advanced measurement approaches to calculate risk-based capital requirements for operational risk.
AFS: Available-for-sale
ALCO: Asset Liability Committee
Amortized cost: Amount at which a financing receivable or investment is originated or acquired, adjusted for accretion or amortization of premium, discount, and net deferred fees or costs, collection of cash, charge-offs, foreign exchange, and fair value hedge accounting adjustments. For AFS securities, amortized cost is also reduced by any impairment losses recognized in earnings. Amortized cost is not reduced by the allowance for credit losses, except where explicitly presented net.
AOCI: Accumulated other comprehensive income (loss)
ARM: Adjustable rate mortgage(s)
ASC: Accounting Standards Codification under GAAP issued by the FASB.
Asia Consumer: Asia Consumer Banking
ASU: Accounting Standards Update under GAAP issued by the FASB.
AUA: Assets under administration
AUC: Assets under custody
AUM: Assets under management. Represent assets managed on behalf of Citi’s clients.
Available liquidity resources*: Resources available at the balance sheet date to support Citi’s client and business needs, including HQLA assets; additional unencumbered securities,
including excess liquidity held at bank entities that is non-transferable to other entities within Citigroup; and available assets not already accounted for within Citi’s HQLA to
support Federal Home Loan Bank (FHLB) and Federal Reserve Bank discount window borrowing capacity.
Basel III: Liquidity and capital rules adopted by the FRB based on an internationally agreed set of measures developed by the Basel Committee on Banking Supervision.
Beneficial interests issued by consolidated VIEs: Represents the interest of third-party holders of debt, equity securities or other obligations, issued by VIEs that Citi consolidates.
Benefit obligation: Refers to the projected benefit obligation for pension plans and the accumulated postretirement benefit obligation for OPEB plans.
BHC: Bank holding company
Board: Citigroup’s Board of Directors
Book value per share*: EOP common equity divided by EOP common shares outstanding.
Bps: Basis points. One basis point equals 1/100th of one percent.
Branded cards:Cards: Citi’s branded cards business with a portfolio of proprietary cards (Double Cash, Custom Cash, ThankYou(Value, Rewards and Value cards)Cash) and co-branded cards (including among others,Costco and American Airlines and Costco)Airlines).
Build: A net increase in ACL through the provision for credit losses.
Cards: Citi’s credit cards’ businesses or activities.
CCAR: Comprehensive Capital Analysis and Review
CCO: Chief Compliance Officer
CDS: Credit default swaps
CECL: Current expected credit losses
CEO: Chief Executive Officer
CET1 Capital: Common Equity Tier 1 Capital. See “Capital Resources—Components of Citigroup Capital” above within MD&A for the components of CET1.
CET1 Capital ratio*: Common Equity Tier 1 Capital ratio. A primary regulatory capital ratio representing end-of-period CET1 Capital divided by total risk-weighted assets.
CFO: Chief Financial Officer
CFTC: Commodity Futures Trading Commission
CGMHI: Citigroup Global Markets Holdings Inc.
CGMI: Citigroup Global Markets Inc.
CGML: Citigroup Global Markets Limited
Citi: Citigroup Inc.
Citibank or CBNA: Citibank, N.A. (National Association)
Classifiably managed: Loans primarily evaluated for credit risk based on internal risk rating classification.
Client investment assets: Represent assets under management, as well astrust and custody brokerage, administration and deposit accounts.assets.
CLO:CODM: Collateralized loan obligationsChief operating decision maker
Coincident NCL coverage ratio: A credit metric, representing the ACLL at period end divided by (the most recent quarter’s NCLs divided by 3). This ratio is expressed in months of coverage.
Collateral dependent: A loan is considered collateral dependent when repayment of the loan is expected to be provided substantially through the operation or sale of the collateral when the borrower is experiencing financial difficulty, including when foreclosure is deemed probable based on borrower delinquency.
Commercial cards: Provides a wide range of payment services to corporate and public sector clients worldwide through commercial card products. Services include procurement, corporate travel and entertainment, expense management services and business-to-business payment solutions.
Consent orders: In October 2020, Citigroup and Citibank entered into consent orders with the Federal Reserve and OCC that require Citigroup and Citibank to make improvements in various aspects of enterprise-wide risk management, compliance, data quality management and governance and internal controls.
CRE: Commercial real estate
Credit card spend volume*: Dollar amount of card customers’ gross purchases. Also known as purchase sales.
Credit cycle: A period of time over which credit quality improves, deteriorates and then improves again (or vice versa). The duration of a credit cycle can vary from a couple of years to several years.
Credit derivatives: Financial instruments whose value is derived from the credit risk associated with the debt of a third-party issuer (the reference entity), which allow one party (the protection purchaser) to transfer that risk to another party (the protection seller).
Critical Audit Matters: Audit matters communicated by KPMG to Citi’s Audit Committee of the Board of Directors, relating to accounts or disclosures that are material to the Consolidated Financial Statements and involved especially challenging, subjective or complex judgments. See “Report of Independent Registered Public Accounting Firm” in Citi’s annual reports on Form 10-K.
Criticized: Criticized loans, lending-related commitments and derivative receivables that are classified as special mention, substandard and doubtful categories for regulatory purposes.
CRO: Chief Risk Officer
CTA: Cumulative translation adjustment (also known as currency translation adjustment). A separate component of equity within AOCI reported net of tax. For Citi, represents the impact of translating non-USD balance sheet items into USD
each period. The CTA amount in EOP AOCI is a cumulative balance, net of tax.
CVA: Credit valuation adjustment
DCM: Debt Capital Markets
Delinquency managed: Loans primarily evaluated for credit risk based on delinquencies, FICO scores and the value of underlying collateral.
Divestiture-related impacts: Citi’s results excluding divestiture-related impacts represent as reported, or GAAP, financial results adjusted for items that are incurred and recognized, which are wholly and necessarily a consequence of actions taken to sell (including through a public offering), dispose of or wind down business activities associated with Citi’s announced 14 exit markets.
Dividend payout ratio*: Represents dividends declared per common share as a percentage of net income per diluted share.
Dodd-Frank Act: Wall Street Reform and Consumer Protection Act
DPD: Days past due
DSA: Deferred stock awards
DTA: Deferred tax asset
DVA: Debt valuation adjustment
EC:ECM: European CommissionEquity Capital Markets
Efficiency ratio*: A ratio signifying how much of a dollar in expenses (as a percentage) it takes to generate one dollar in revenue. Represents total operating expenses divided by total revenues, net.
EMEA: Europe, Middle East and Africa
EOP: End-of-period
EPS*: Earnings per share
ERISA: Employee Retirement Income Security Act of 1974
ESG: Environmental, Social and Governance
ETR: Effective tax rate
EU: European Union
Fannie Mae: Federal National Mortgage Association
FASB: Financial Accounting Standards Board
FCA: Financial Conduct Authority
FDIC: Federal Deposit Insurance Corporation
Federal Reserve:Reserve Board: The Board of the Governors of the Federal Reserve System
FFIEC: Federal Financial Institutions Examination Council
FHA: Federal Housing Administration
FHLB: Federal Home Loan Bank
FICO: Fair Issac Corporation
FICO score: A measure of consumer credit risk provided by credit bureaus, typically produced from statistical models by Fair Isaac Corporation utilizing data collected by the credit bureaus.
FINRA: Financial Industry Regulatory Authority
Firm: Citigroup Inc.
FRB: Federal Reserve Board
FRBNY: Federal Reserve Bank of New York
Freddie Mac: Federal Home Loan Mortgage Corporation
FTCs: Foreign tax credit carry-forwards
FVA: Funding valuation adjustment
FX: Foreign exchange
FX translation: The impact of converting non-U.S.-dollar currencies into U.S. dollars.
G7: Group of Seven nations. Countries in the G7 are Canada, France, Germany, Italy, Japan, the U.K. and the U.S.
GAAP or U.S. GAAP: Generally accepted accounting principles in the United States of America.
Ginnie Mae: Government National Mortgage Association
Global Wealth: Global Wealth Management
GSIB: Global systemically important banks
HELOC: Home equity line of creditSystemically Important Bank
HFI loans: Loans that are held-for-investment (i.e., excludes loans held-for-sale).
HFS: Held-for-sale
HQLA: High-quality liquid assets. Consist of cash and certain high-quality liquid securities as defined in the LCR rule.
HTM: Held-to-maturity
Hyperinflation: Extreme economic inflation with prices rising at a very high rate in a very short time. Under U.S. GAAP, entities operating in a hyperinflationary economy need
to change their functional currency to the U.S. dollar. Once the change is made, the CTA balance is frozen.
Interchange revenue: Fees earned from merchants based on Citi’s credit and debit card customers’ sales transactions.
IBOR:International: Interbank Offered Rate
ICG: Institutional Clients Group
ICRM: Independent Compliance Risk ManagementThe region representing all countries other than the U.S. and Canada.
IPO: Initial public offering
ISDA:KPMG: International Swaps and Derivatives Association
KM: Key financial and non-financial metric used by management when evaluating consolidated and/or individual business results.
KPMG LLP:LLP, Citi’s Independent Registered Public Accounting Firm.
LATAM: Latin America, which for Citi, includes Mexico.
LCR: Liquidity coverageCoverage ratio. Represents HQLA divided by net outflows in the period.
LDA: Loss Distribution Approach
LF: Legacy Franchises
LGD: Loss given default
LIBOR: London Interbank Offered Rate
LLC: Limited Liability Company
LTD: Long-term debt
LTV: Loan-to-value. For residential real estate loans, the relationship, expressed as a percentage, between the principal amount of a loan and the appraisedestimated value of the collateral (i.e., residential real estate) securing the loan.
Managed basis: Results reflected on a managed basis exclude divestiture-related impacts.
Master netting agreement: A single agreement with a counterparty that permits multiple transactions governed by that agreement to be terminated or accelerated and settled through a single payment in a single currency in the event of a default (e.g., bankruptcy, failure to make a required payment or securities transfer or deliver collateral or margin when due).
MBS: Mortgage-backed securities
MCA: Manager’s control assessment
MD&A: Management’s discussionDiscussion and analysisAnalysis, a section within an SEC Form 10-Q or 10-K.
Measurement alternative: Measures equity securities without readily determinable fair values at cost less impairment (if any), plus or minus observable price changes from an identical or similar investment of the same issuer.
Mexico Consumer: Mexico Consumer Banking
Mexico Consumer/SBMM: Mexico Consumer Banking and Small Business and Middle-Market Banking
Mexico SBMM: Mexico Small Business and Middle-Market Banking
Moody’s: Moody’s Investors Service
MSRs: Mortgage servicing rights
N/A: Data is not applicable or available for the period presented.
NAA: Non-accrual assets. Consists of non-accrual loans and OREO.
NAL: Non-accrual loans. Loans for which interest income is not recognized on an accrual basis. Loans (other than credit card loans and certain consumer loans insured by U.S. government-sponsored agencies) are placed on non-accrual status when full payment of principal and interest is not
expected, regardless of delinquency status, or when principal and interest have been in default for a period of 90 days or more unless the loan is both well secured and in the process of collection. Collateral-dependent loans are typically maintained on non-accrual status.
NAV: Net asset value
NCL(s): Net credit losses. Represents gross credit losses, less gross credit recoveries.
NCL ratio*: Represents net credit losses (recoveries) (annualized), divided by average loans for the reporting period.
Net capital rule: Rule 15c3-1 under the Securities Exchange Act of 1934.
Net interchange income: Includes the following components:
• Interchange revenue: Fees earned from merchants based on Citi’s credit and debit card customers’ sales transactions.
• Reward costs: The cost to Citi for points earned by cardholders enrolled in credit card rewards programs generally tied to sales transactions.
• Partner payments: Payments to co-brand credit card partners based on the cost of loyalty program rewards earned by cardholders on credit card transactions.
NII: Net interest income. Represents total interest revenue less total interest expenses.
NIM*: Net interest margin expressed as a yield percentage, calculated as annualized net interest income divided by average interest-earning assets for the period.
NIR: Non-interest revenues
NM: Not meaningful
Noncontrolling interests: The portion of an investment that has been consolidated by Citi that is not 100% owned by Citi.
Non-GAAP financial measure: Management uses these financial measures because it believes they provide information to enable investors to understand the underlying operational performance and trends of Citi and its businesses.
NSFR: Net stable funding ratio
O/S: Outstanding
OCC: Office of the Comptroller of the Currency
OCI: Other comprehensive income (loss)
OREO: Other real estate owned
OTTI: Other-than-temporary impairment
Over-the-counter cleared (OTC-cleared) derivatives: Derivative contracts that are negotiated and executed bilaterally, but subsequently settled via a central clearing house, such that each derivative counterparty is only exposed to the default of that clearing house.
Over-the-counter (OTC) derivatives: Derivative contracts that are negotiated, executed and settled bilaterally between two derivative counterparties, where one or both counterparties is a derivatives dealer.
Parent company: Citigroup Inc.
Participating securities:Partner payments: Represents unvested share-based compensation awards containing nonforfeitable rightsPayments made to dividends or dividend equivalents (collectively, “dividends”), which are included in the earnings per share calculation using the two-class method. Citi grants RSUs to certain employees under its share-based compensation programs, which entitle the recipients to receive non-forfeitable dividends during the vesting period on a basis equivalent to the dividends paid to holders of common stock. These unvested awards meet the definition of participating securities. Under the two-class method for calculating EPS, all earnings (distributed and undistributed) are allocated to each class of common stock and participating securities,credit card partners primarily based on their respective rights to receive dividends.
PBWM: Personal Bankingprogram sales, profitability and Wealth Managementcustomer acquisitions.
PD: Probability of default
Principal transactions revenue: Primarily trading-related revenues predominantly generated by the ICGServices, Markets and Banking businesses. See Note 6.
Provision for credit losses: Composed of the provision for credit losses on loans, provision for credit losses on HTM investments, provision for credit losses on other assets and provision for credit losses on unfunded lending commitments.
Provisions: Provisions for credit losses and for benefits and claims.
PSUs: Performance share units
Purchased credit-deteriorated: Purchased credit-deteriorated assets are financial assets that as of the date of acquisition have experienced a more-than-insignificant deterioration in credit quality since origination, as determined by the Company.
R&S forecast period: Reasonable and supportable period over which Citi forecasts future macroeconomic conditions for CECL purposes.
Real GDP: Real gross domestic product is the inflation-adjusted value of the goods and services produced by labor and property located in a country.
Reconciling Items: Divestiture-related impacts excluded from the results of All Other, as well as All Other—Legacy Franchises on a managed basis. The Reconciling Items are fully reflected in Citi’s Consolidated Statement of Income for each respective line item.
Regulatory VAR: Daily aggregated VAR calculated in accordance with regulatory rules.
REITs: Real estate investment trusts
Release: A net decrease in ACL through the provision for credit losses.
Reported basis: Financial statements prepared under U.S. GAAP.
Results of operations that exclude certain impacts from gains or losses on sale, or one-time charges*: Represents GAAP items, excluding the impact of gains or losses on sales, or one-time charges (e.g., the loss on sale related to the sale of Citi’s consumer banking business in Australia).
Results of operations that exclude the impact of FX translation*: Represents GAAP items, excluding the impact of FX translation, whereby the prior periods’ foreign currency balances are translated into U.S. dollars at the current period’s conversion rates (also known as constant dollar). GAAP measures excluding the impact of FX translation are non-GAAP financial measures.
Retail services:Services: Citi’s U.S. retail services cards business with a portfolio of co-brand and private label relationships (including, among others, Best Buy, The Home Depot, Best Buy, SearsMacy’s and Macy’s)Sears).
RMI: A non-partisan, non-profit organization that works to transform global energy systems across the real economy. Citi joined the RMI Center for Climate-Aligned Finance in 2021.
ROA*: Return on assets. Represents net income (annualized), divided by average assets for the period.
ROCE*: Return on Common Equity. Represents net income less preferred dividends (both annualized), divided by average common equity for the period.
ROE: Return on equity. Represents net income less preferred dividends (both annualized), divided by average Citigroup equity for the period.
RoTCE*: Return on tangible common equity. Represents net income less preferred dividends (both annualized), divided by average tangible common equity for the period.
RSU(s): Restricted stock units
RWA: Risk-weighted assets. Basel III establishes two comprehensive approaches for calculating RWA (the Standardized Approach and the Advanced Approaches), which include capital requirements for credit risk, market risk and operational risk for Advanced Approaches. Key differences in the calculation of credit risk RWA between the Standardized and Advanced Approaches are that for Advanced, credit risk RWA is based on risk-sensitive approaches that largely rely on the use of internal credit models and parameters, whereas for Standardized, credit risk RWA is generally based on supervisory risk-weightings,risk weightings, which vary primarily by counterparty type and asset class. Market risk RWA is
calculated on a generally consistent basis between Basel III Standardized Approach and Basel III Advanced Approaches.
S&P: Standard and Poor’s Global Ratings
SCB: Stress Capital Buffer
SCF: Subscription credit facility. SCFs are revolving credit facilities provided to private equity funds that are secured against the fund’s investors’ capital commitments.
SEC: The U.S. Securities and Exchange Commission
Securities financing agreements: Include resale, repurchase, securities borrowed and securities loaned agreements.
SLR: Supplementary Leverage ratio. Represents Tier 1 Capital divided by total leverage exposure.Total Leverage Exposure.
SOFR: Secured Overnight Financing Rate
SPEs: Special purpose entities
Standardized Approach: Established through Basel III, the Standardized Approach aligns regulatory capital requirements more closely with the key elements of banking risk by introducing a wider differentiation of risk weights and a wider recognition of credit risk mitigation techniques, while avoiding excessive complexity. Accordingly, the Standardized Approach produces capital ratios more in line with the actual economic risks that banks are facing.
Structured notes: Financial instruments whose cash flows are linked to the movement in one or more indexes, interest rates, foreign exchange rates, commodities prices, prepayment rates or other market variables. The notes typically contain embedded (but not separable or detachable) derivatives. Contractual cash flows for principal, interest or both can vary in amount and timing throughout the life of the note based on non-traditional indexes or non-traditional uses of traditional interest rates or indexes.
Tangible book value per share (TBVPS)*: Represents tangible common equity divided by EOP common shares outstanding.
Tangible common equity (TCE): Represents common stockholders’ equity less goodwill and identifiable intangible assets, other than MSRs.
Taxable equivalent basis: Represents the total revenue, net of interest expense for the business, adjusted for revenue from investments that receive tax credits and the impact of tax-exempt securities. This metric presents results on a level comparable to taxable investments and securities. GAAP measures on taxable equivalent basis, including the metrics derived from these measures, are non-GAAP financial measures.
TDR: Troubled debt restructuring. Prior to January 1, 2023, a TDR was deemed to occur when the Company modified the original terms of a loan agreement by granting a concession to a borrower that was experiencing financial difficulty. Loans with short-term and other insignificant modifications that are not considered concessions were not TDRs. The accounting guidance for TDRs was eliminated with the adoption of ASU 2022-02. See Note 1 for more information.1.
TLAC: Total loss-absorbing capacity
Total ACL: Allowance for credit losses, which comprises the allowance for credit losses on loans (ACLL), allowance for credit losses on unfunded lending commitments (ACLUC), allowance for credit losses on HTM securities and allowance for credit losses on other assets.
Total payout ratio*: Represents total common dividends declared plus common share repurchases as a percentage of net income available to common shareholders.
Transformation: Citi has embarked on a multiyear transformation, with the target outcome to change Citi’s business and operating models such that they simultaneously strengthen risk and controls and improve Citi’s value to customers, clients and shareholders.
Unaudited: Financial statements and information that have not been subjected to auditing procedures sufficient to permit an independent certified public accountant to express an opinion.
U.S. government agencies: U.S. government agencies include, but are not limited to, agencies such as Ginnie Mae and FHA, and do not include Fannie Mae and Freddie Mac, which are U.S. government-sponsored enterprises (U.S. GSEs). In general, obligations of U.S. government agencies are fully and explicitly guaranteed as to the timely payment of principal and interest by the full faith and credit of the U.S. government in the event of a default.
U.S. Treasury: U.S. Department of the Treasury
VAR: Value at risk. A measure of the dollar amount of potential loss from adverse market moves in an ordinary market environment.
VIEs: Variable interest entities
Wallet: Proportion of fee revenue based on estimates of investment banking fees generated across the industry (i.e., the revenue wallet) from investment banking transactions in M&A, equity and debt underwriting, and loan syndications.
EXHIBIT INDEX
| | | | | | | | |
| Exhibit | | |
| Number | | Description of Exhibit |
| | |
| | |
| | |
| | |
| | |
| | |
| | |
| | |
| | |
| | |
| | |
| | |
| | |
| | |
| | |
| | |
| | |
| | |
| | |
| | |
| | |
| | |
| | |
| | | |
| 101.01+ | | Financial statements from the Quarterly Report on Form 10-Q of Citigroup for the quarterly period ended June 30, 2023,March 31, 2024, filed on August 4, 2023,May 3, 2024, formatted in Inline XBRL: (i) the Consolidated Statement of Income, (ii) the Consolidated Balance Sheet, (iii) the Consolidated Statement of Changes in Stockholders’ Equity, (iv) the Consolidated Statement of Cash Flows and (v) the Notes to the Consolidated Financial Statements. |
| | |
| 104 | | See the cover page of this Quarterly Report on Form 10-Q, formatted in Inline XBRL. |
The total amount of securities authorized pursuant to any instrument defining rights of holders of long-term debt of the Company does not exceed 10% of the total assets of the Company and its consolidated subsidiaries. The Company will furnish copies of any such instrument to the SEC upon request.
+ Filed herewith.
* Denotes a management contract or compensatory plan or arrangement.
** Amended to change references from Chairman to Chair and Chairmen to Chairs.
NOTES